Plandome Heights, NY Map & Demographics
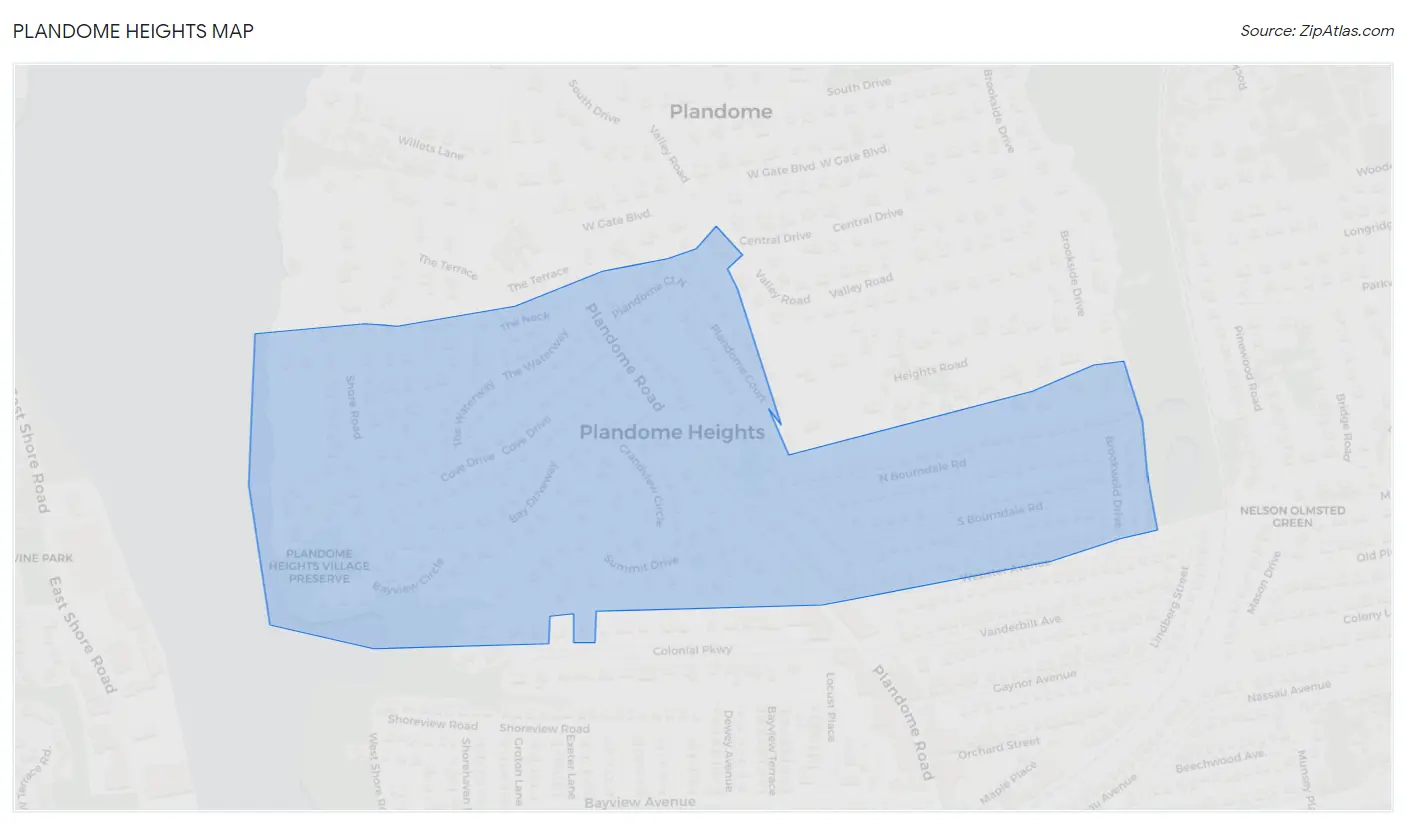
Plandome Heights Map
Plandome Heights Overview
$136,246
PER CAPITA INCOME
$250,001
AVG FAMILY INCOME
$250,001
AVG HOUSEHOLD INCOME
54.1%
WAGE / INCOME GAP [ % ]
45.9¢/ $1
WAGE / INCOME GAP [ $ ]
0.43
INEQUALITY / GINI INDEX
938
TOTAL POPULATION
465
MALE POPULATION
473
FEMALE POPULATION
98.31
MALES / 100 FEMALES
101.72
FEMALES / 100 MALES
42.8
MEDIAN AGE
3.2
AVG FAMILY SIZE
3.0
AVG HOUSEHOLD SIZE
520
LABOR FORCE [ PEOPLE ]
72.1%
PERCENT IN LABOR FORCE
1.7%
UNEMPLOYMENT RATE
Income in Plandome Heights
Income Overview in Plandome Heights
Per Capita Income in Plandome Heights is $136,246, while median incomes of families and households are $250,001 and $250,001 respectively.
| Characteristic | Number | Measure |
| Per Capita Income | 938 | $136,246 |
| Median Family Income | 285 | $250,001 |
| Mean Family Income | 285 | $426,208 |
| Median Household Income | 309 | $250,001 |
| Mean Household Income | 309 | $403,039 |
| Income Deficit | 285 | $0 |
| Wage / Income Gap (%) | 938 | 54.09% |
| Wage / Income Gap ($) | 938 | 45.91¢ per $1 |
| Gini / Inequality Index | 938 | 0.43 |
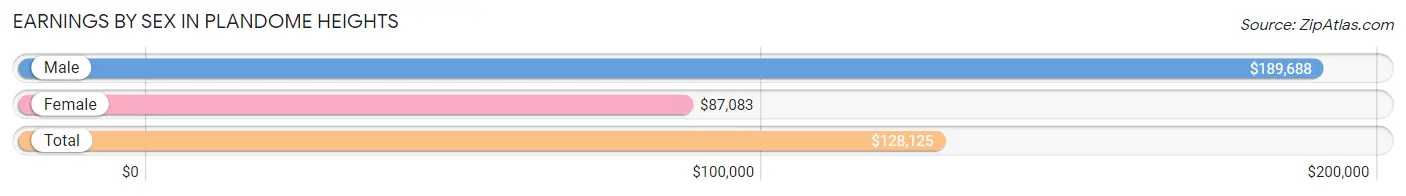
Earnings by Sex in Plandome Heights
Average Earnings in Plandome Heights are $128,125, $189,688 for men and $87,083 for women, a difference of 54.1%.
| Sex | Number | Average Earnings |
| Male | 295 (54.9%) | $189,688 |
| Female | 242 (45.1%) | $87,083 |
| Total | 537 (100.0%) | $128,125 |
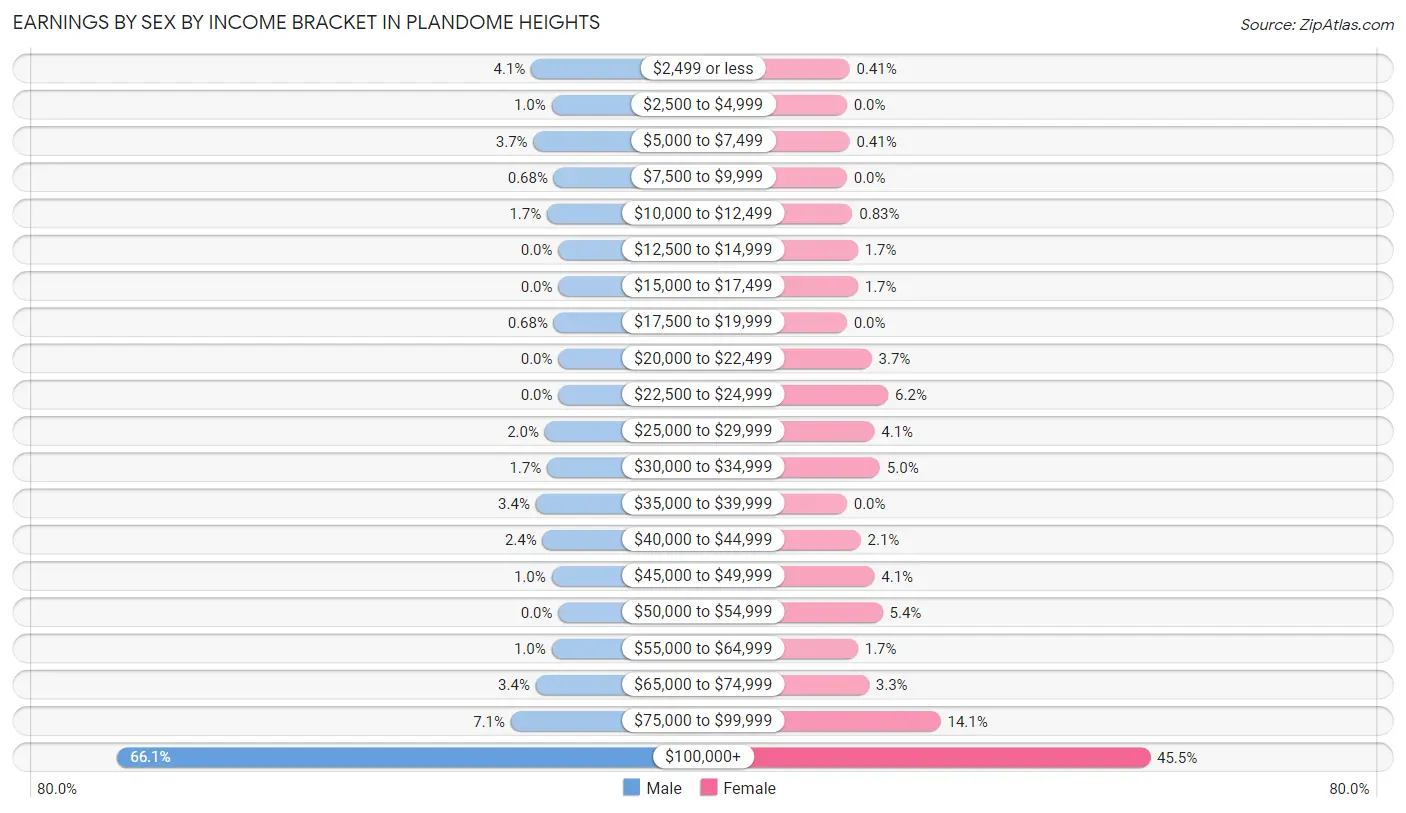
Earnings by Sex by Income Bracket in Plandome Heights
The most common earnings brackets in Plandome Heights are $100,000+ for men (195 | 66.1%) and $100,000+ for women (110 | 45.5%).
| Income | Male | Female |
| $2,499 or less | 12 (4.1%) | 1 (0.4%) |
| $2,500 to $4,999 | 3 (1.0%) | 0 (0.0%) |
| $5,000 to $7,499 | 11 (3.7%) | 1 (0.4%) |
| $7,500 to $9,999 | 2 (0.7%) | 0 (0.0%) |
| $10,000 to $12,499 | 5 (1.7%) | 2 (0.8%) |
| $12,500 to $14,999 | 0 (0.0%) | 4 (1.7%) |
| $15,000 to $17,499 | 0 (0.0%) | 4 (1.7%) |
| $17,500 to $19,999 | 2 (0.7%) | 0 (0.0%) |
| $20,000 to $22,499 | 0 (0.0%) | 9 (3.7%) |
| $22,500 to $24,999 | 0 (0.0%) | 15 (6.2%) |
| $25,000 to $29,999 | 6 (2.0%) | 10 (4.1%) |
| $30,000 to $34,999 | 5 (1.7%) | 12 (5.0%) |
| $35,000 to $39,999 | 10 (3.4%) | 0 (0.0%) |
| $40,000 to $44,999 | 7 (2.4%) | 5 (2.1%) |
| $45,000 to $49,999 | 3 (1.0%) | 10 (4.1%) |
| $50,000 to $54,999 | 0 (0.0%) | 13 (5.4%) |
| $55,000 to $64,999 | 3 (1.0%) | 4 (1.7%) |
| $65,000 to $74,999 | 10 (3.4%) | 8 (3.3%) |
| $75,000 to $99,999 | 21 (7.1%) | 34 (14.1%) |
| $100,000+ | 195 (66.1%) | 110 (45.5%) |
| Total | 295 (100.0%) | 242 (100.0%) |
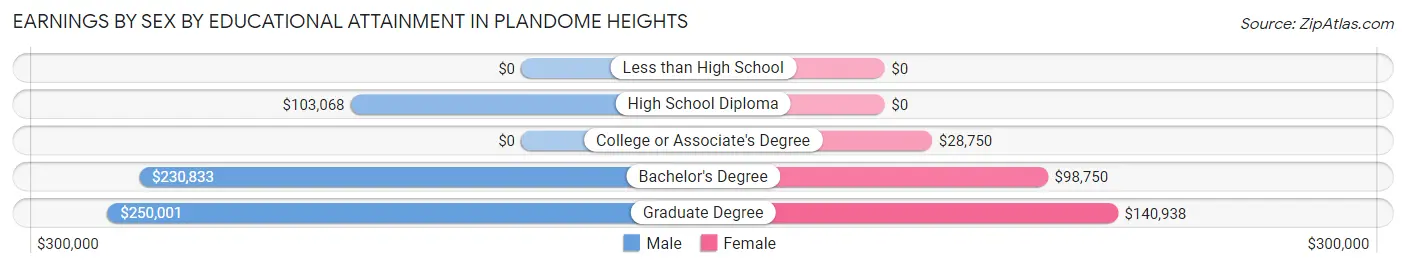
Earnings by Sex by Educational Attainment in Plandome Heights
Average earnings in Plandome Heights are $225,781 for men and $106,875 for women, a difference of 52.7%. Men with an educational attainment of graduate degree enjoy the highest average annual earnings of $250,001, while those with high school diploma education earn the least with $103,068. Women with an educational attainment of graduate degree earn the most with the average annual earnings of $140,938, while those with college or associate's degree education have the smallest earnings of $28,750.
| Educational Attainment | Male Income | Female Income |
| Less than High School | - | - |
| High School Diploma | $103,068 | $0 |
| College or Associate's Degree | - | - |
| Bachelor's Degree | $230,833 | $98,750 |
| Graduate Degree | $250,001 | $140,938 |
| Total | $225,781 | $106,875 |
Family Income in Plandome Heights
Family Income Brackets in Plandome Heights
According to the Plandome Heights family income data, there are 229 families falling into the $200,000+ income range, which is the most common income bracket and makes up 80.3% of all families.
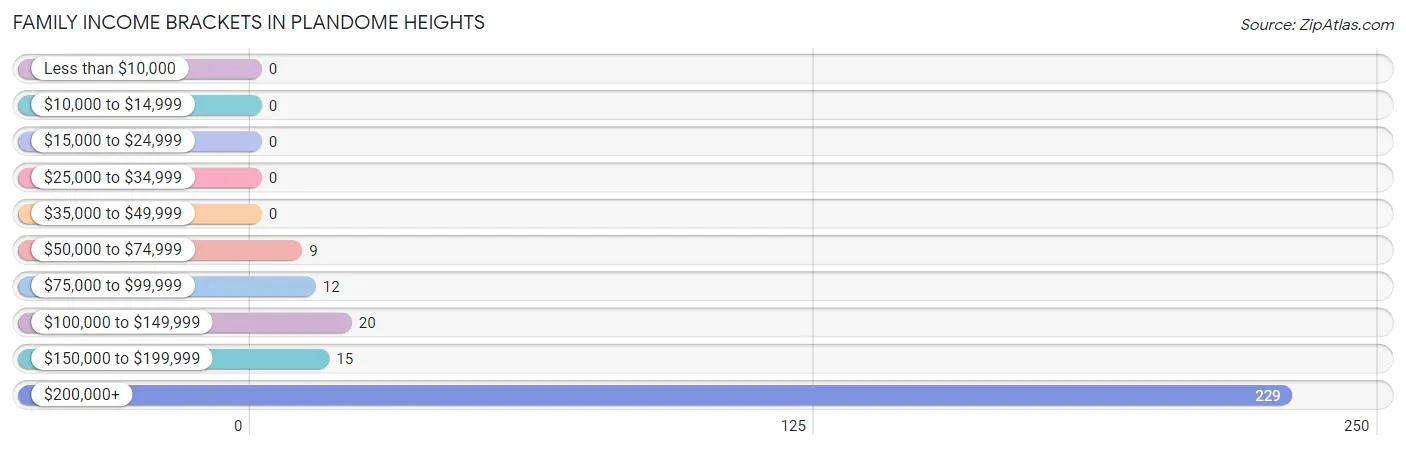
| Income Bracket | # Families | % Families |
| Less than $10,000 | 0 | 0.0% |
| $10,000 to $14,999 | 0 | 0.0% |
| $15,000 to $24,999 | 0 | 0.0% |
| $25,000 to $34,999 | 0 | 0.0% |
| $35,000 to $49,999 | 0 | 0.0% |
| $50,000 to $74,999 | 9 | 3.2% |
| $75,000 to $99,999 | 12 | 4.2% |
| $100,000 to $149,999 | 20 | 7.0% |
| $150,000 to $199,999 | 15 | 5.3% |
| $200,000+ | 229 | 80.4% |
Family Income by Famaliy Size in Plandome Heights
3-person families (77 | 27.0%) account for the highest median family income in Plandome Heights with $250,001 per family, while 2-person families (101 | 35.4%) have the highest median income of $104,375 per family member.
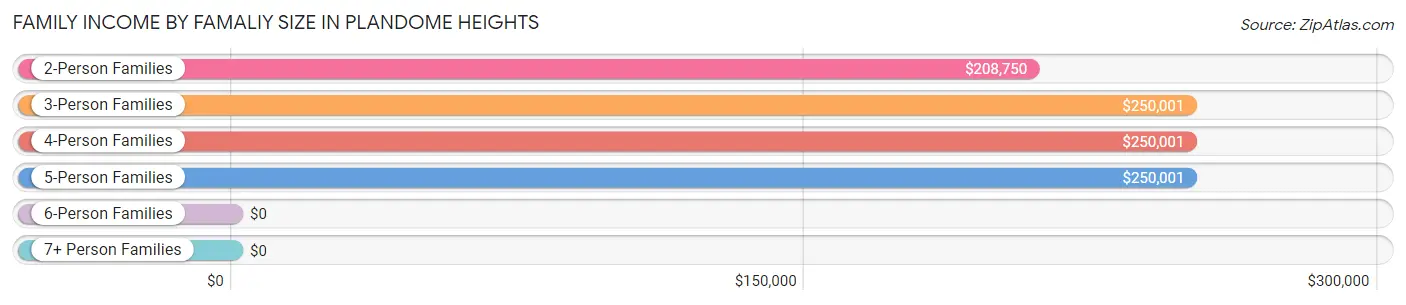
| Income Bracket | # Families | Median Income |
| 2-Person Families | 101 (35.4%) | $208,750 |
| 3-Person Families | 77 (27.0%) | $250,001 |
| 4-Person Families | 81 (28.4%) | $250,001 |
| 5-Person Families | 23 (8.1%) | $250,001 |
| 6-Person Families | 3 (1.1%) | $0 |
| 7+ Person Families | 0 (0.0%) | $0 |
| Total | 285 (100.0%) | $250,001 |
Family Income by Number of Earners in Plandome Heights
The median family income in Plandome Heights is $250,001, with families comprising 1 earner (72) having the highest median family income of $250,001, while families with no earners (27) have the lowest median family income of $108,125, accounting for 25.3% and 9.5% of families, respectively.
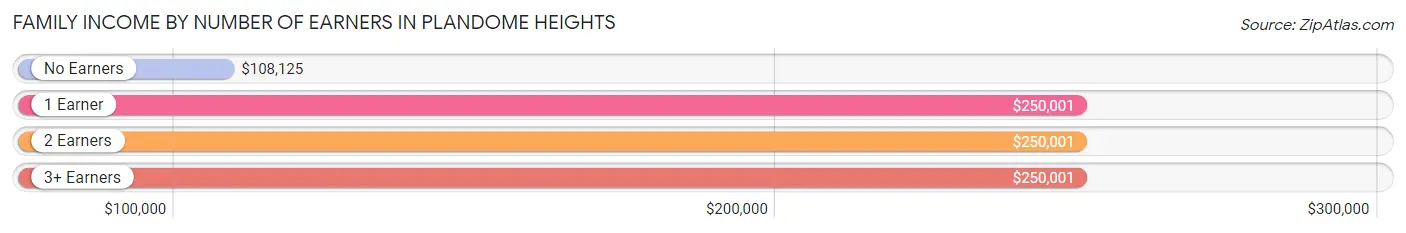
| Number of Earners | # Families | Median Income |
| No Earners | 27 (9.5%) | $108,125 |
| 1 Earner | 72 (25.3%) | $250,001 |
| 2 Earners | 141 (49.5%) | $250,001 |
| 3+ Earners | 45 (15.8%) | $250,001 |
| Total | 285 (100.0%) | $250,001 |
Household Income in Plandome Heights
Household Income Brackets in Plandome Heights
With 233 households falling in the category, the $200,000+ income range is the most frequent in Plandome Heights, accounting for 75.4% of all households.
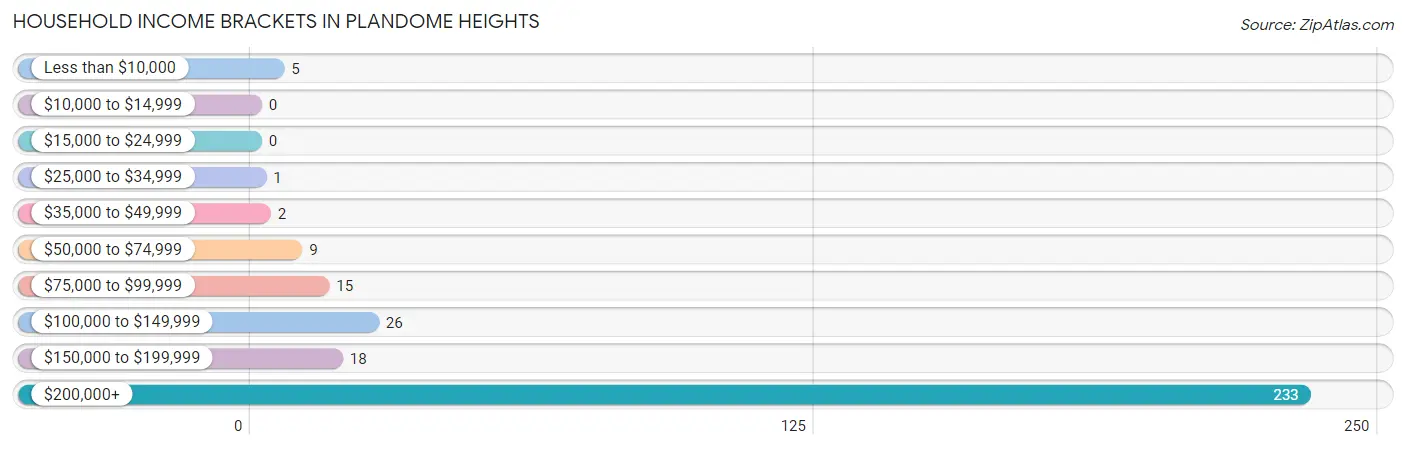
| Income Bracket | # Households | % Households |
| Less than $10,000 | 5 | 1.6% |
| $10,000 to $14,999 | 0 | 0.0% |
| $15,000 to $24,999 | 0 | 0.0% |
| $25,000 to $34,999 | 1 | 0.3% |
| $35,000 to $49,999 | 2 | 0.6% |
| $50,000 to $74,999 | 9 | 2.9% |
| $75,000 to $99,999 | 15 | 4.9% |
| $100,000 to $149,999 | 26 | 8.4% |
| $150,000 to $199,999 | 18 | 5.8% |
| $200,000+ | 233 | 75.4% |
Household Income by Householder Age in Plandome Heights
The median household income in Plandome Heights is $250,001, with the highest median household income of $250,001 found in the 25 to 44 years age bracket for the primary householder. A total of 69 households (22.3%) fall into this category.
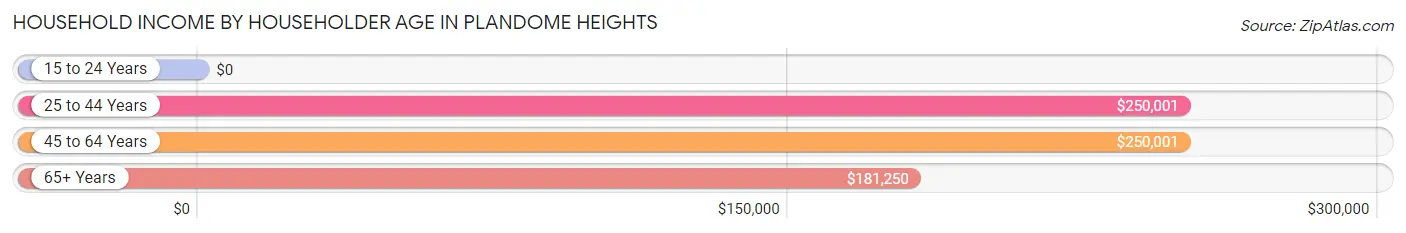
| Income Bracket | # Households | Median Income |
| 15 to 24 Years | 0 (0.0%) | $0 |
| 25 to 44 Years | 69 (22.3%) | $250,001 |
| 45 to 64 Years | 172 (55.7%) | $250,001 |
| 65+ Years | 68 (22.0%) | $181,250 |
| Total | 309 (100.0%) | $250,001 |
Poverty in Plandome Heights
Income Below Poverty by Sex and Age in Plandome Heights
With 0.6% poverty level for males and 0.9% for females among the residents of Plandome Heights, 45 to 54 year old males and 75 year old and over females are the most vulnerable to poverty, with 3 males (3.1%) and 2 females (7.1%) in their respective age groups living below the poverty level.
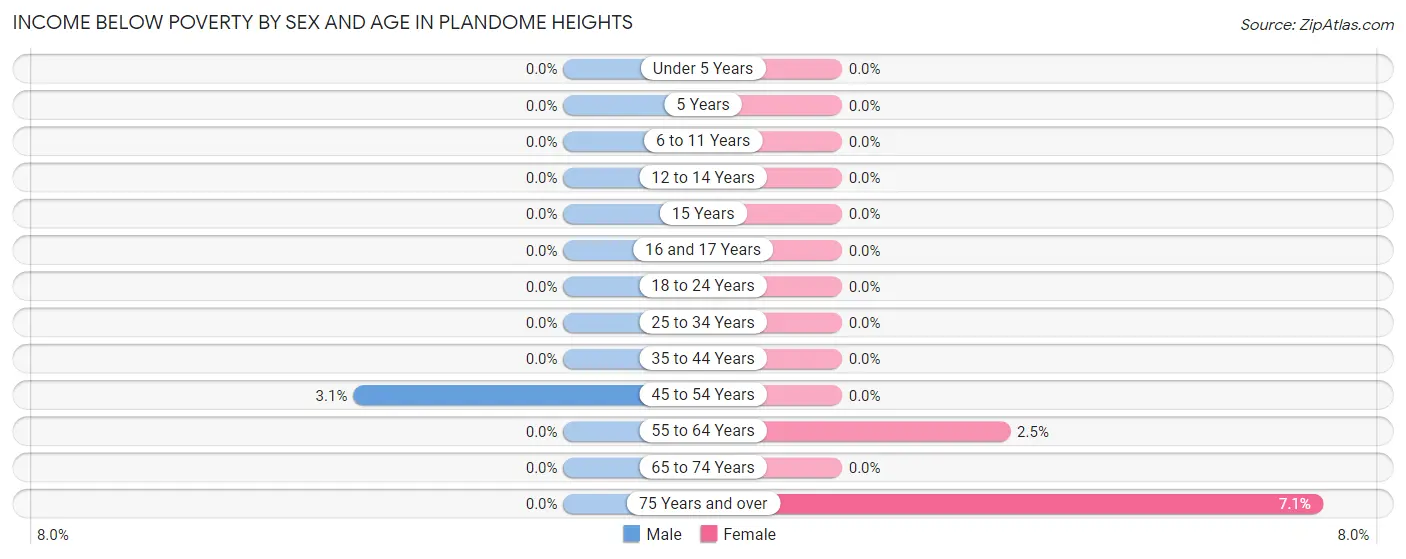
| Age Bracket | Male | Female |
| Under 5 Years | 0 (0.0%) | 0 (0.0%) |
| 5 Years | 0 (0.0%) | 0 (0.0%) |
| 6 to 11 Years | 0 (0.0%) | 0 (0.0%) |
| 12 to 14 Years | 0 (0.0%) | 0 (0.0%) |
| 15 Years | 0 (0.0%) | 0 (0.0%) |
| 16 and 17 Years | 0 (0.0%) | 0 (0.0%) |
| 18 to 24 Years | 0 (0.0%) | 0 (0.0%) |
| 25 to 34 Years | 0 (0.0%) | 0 (0.0%) |
| 35 to 44 Years | 0 (0.0%) | 0 (0.0%) |
| 45 to 54 Years | 3 (3.1%) | 0 (0.0%) |
| 55 to 64 Years | 0 (0.0%) | 2 (2.5%) |
| 65 to 74 Years | 0 (0.0%) | 0 (0.0%) |
| 75 Years and over | 0 (0.0%) | 2 (7.1%) |
| Total | 3 (0.6%) | 4 (0.9%) |
Income Above Poverty by Sex and Age in Plandome Heights
According to the poverty statistics in Plandome Heights, males aged under 5 years and females aged under 5 years are the age groups that are most secure financially, with 100.0% of males and 100.0% of females in these age groups living above the poverty line.
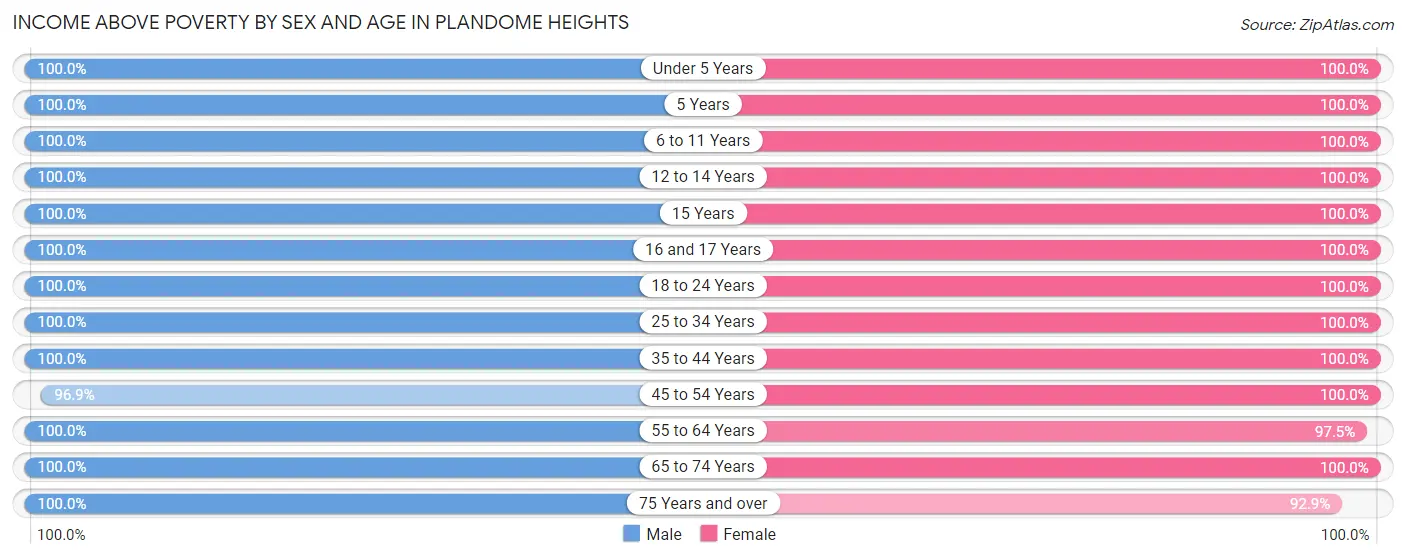
| Age Bracket | Male | Female |
| Under 5 Years | 23 (100.0%) | 30 (100.0%) |
| 5 Years | 3 (100.0%) | 13 (100.0%) |
| 6 to 11 Years | 41 (100.0%) | 57 (100.0%) |
| 12 to 14 Years | 34 (100.0%) | 9 (100.0%) |
| 15 Years | 5 (100.0%) | 2 (100.0%) |
| 16 and 17 Years | 12 (100.0%) | 13 (100.0%) |
| 18 to 24 Years | 40 (100.0%) | 34 (100.0%) |
| 25 to 34 Years | 20 (100.0%) | 30 (100.0%) |
| 35 to 44 Years | 62 (100.0%) | 60 (100.0%) |
| 45 to 54 Years | 93 (96.9%) | 88 (100.0%) |
| 55 to 64 Years | 66 (100.0%) | 78 (97.5%) |
| 65 to 74 Years | 42 (100.0%) | 29 (100.0%) |
| 75 Years and over | 21 (100.0%) | 26 (92.9%) |
| Total | 462 (99.4%) | 469 (99.2%) |
Income Below Poverty Among Married-Couple Families in Plandome Heights
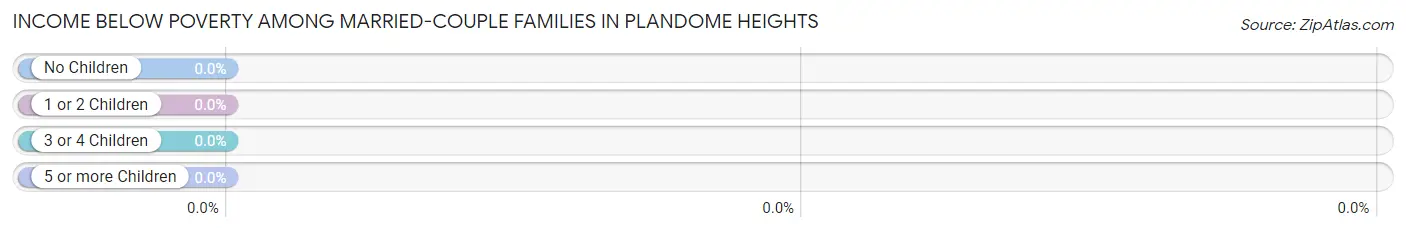
| Children | Above Poverty | Below Poverty |
| No Children | 135 (100.0%) | 0 (0.0%) |
| 1 or 2 Children | 109 (100.0%) | 0 (0.0%) |
| 3 or 4 Children | 18 (100.0%) | 0 (0.0%) |
| 5 or more Children | 0 (0.0%) | 0 (0.0%) |
| Total | 262 (100.0%) | 0 (0.0%) |
Income Below Poverty Among Single-Parent Households in Plandome Heights
| Children | Single Father | Single Mother |
| No Children | 0 (0.0%) | 0 (0.0%) |
| 1 or 2 Children | 0 (0.0%) | 0 (0.0%) |
| 3 or 4 Children | 0 (0.0%) | 0 (0.0%) |
| 5 or more Children | 0 (0.0%) | 0 (0.0%) |
| Total | 0 (0.0%) | 0 (0.0%) |
Income Below Poverty Among Married-Couple vs Single-Parent Households in Plandome Heights
| Children | Married-Couple Families | Single-Parent Households |
| No Children | 0 (0.0%) | 0 (0.0%) |
| 1 or 2 Children | 0 (0.0%) | 0 (0.0%) |
| 3 or 4 Children | 0 (0.0%) | 0 (0.0%) |
| 5 or more Children | 0 (0.0%) | 0 (0.0%) |
| Total | 0 (0.0%) | 0 (0.0%) |
Race in Plandome Heights
The most populous races in Plandome Heights are White / Caucasian (697 | 74.3%), Asian (168 | 17.9%), and Two or more Races (60 | 6.4%).
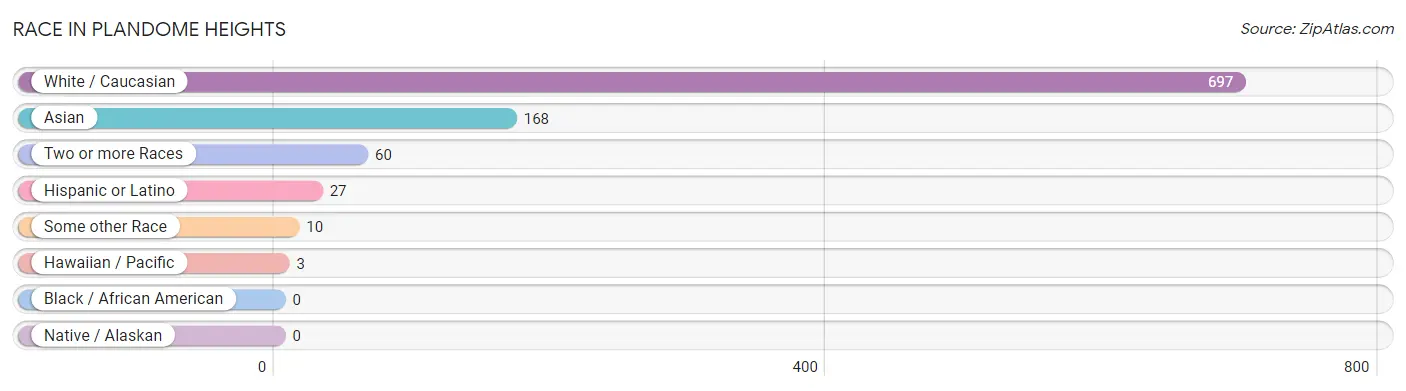
| Race | # Population | % Population |
| Asian | 168 | 17.9% |
| Black / African American | 0 | 0.0% |
| Hawaiian / Pacific | 3 | 0.3% |
| Hispanic or Latino | 27 | 2.9% |
| Native / Alaskan | 0 | 0.0% |
| White / Caucasian | 697 | 74.3% |
| Two or more Races | 60 | 6.4% |
| Some other Race | 10 | 1.1% |
| Total | 938 | 100.0% |
Ancestry in Plandome Heights
The most populous ancestries reported in Plandome Heights are Italian (195 | 20.8%), Indian (Asian) (121 | 12.9%), Greek (117 | 12.5%), Irish (115 | 12.3%), and German (54 | 5.8%), together accounting for 64.2% of all Plandome Heights residents.
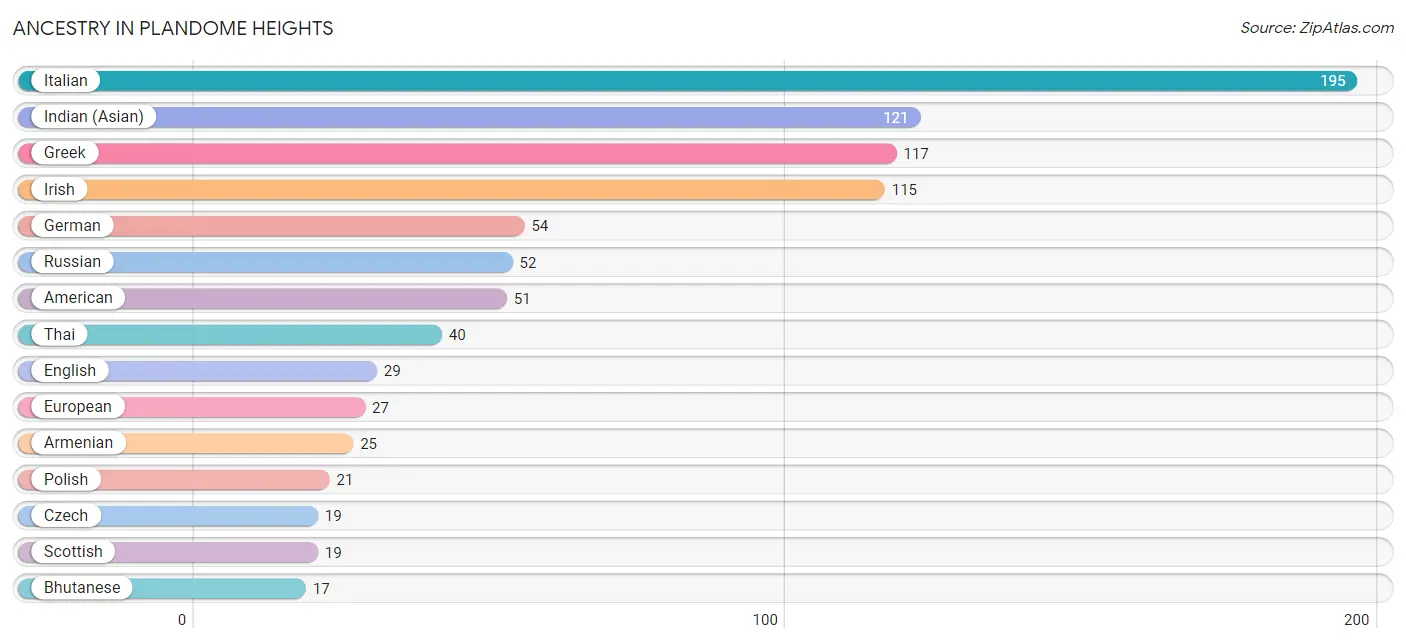
| Ancestry | # Population | % Population |
| American | 51 | 5.4% |
| Arab | 4 | 0.4% |
| Armenian | 25 | 2.7% |
| Austrian | 2 | 0.2% |
| Bhutanese | 17 | 1.8% |
| British | 5 | 0.5% |
| Burmese | 9 | 1.0% |
| Carpatho Rusyn | 2 | 0.2% |
| Colombian | 8 | 0.9% |
| Cypriot | 3 | 0.3% |
| Czech | 19 | 2.0% |
| Danish | 2 | 0.2% |
| Dutch | 4 | 0.4% |
| English | 29 | 3.1% |
| European | 27 | 2.9% |
| Filipino | 13 | 1.4% |
| French | 12 | 1.3% |
| German | 54 | 5.8% |
| Greek | 117 | 12.5% |
| Indian (Asian) | 121 | 12.9% |
| Irish | 115 | 12.3% |
| Italian | 195 | 20.8% |
| Korean | 8 | 0.9% |
| Lebanese | 4 | 0.4% |
| Native Hawaiian | 3 | 0.3% |
| Polish | 21 | 2.2% |
| Portuguese | 2 | 0.2% |
| Puerto Rican | 8 | 0.9% |
| Russian | 52 | 5.5% |
| Samoan | 3 | 0.3% |
| Scottish | 19 | 2.0% |
| Slovak | 2 | 0.2% |
| South American | 8 | 0.9% |
| Spaniard | 2 | 0.2% |
| Spanish | 9 | 1.0% |
| Sri Lankan | 4 | 0.4% |
| Swiss | 4 | 0.4% |
| Thai | 40 | 4.3% |
| Ukrainian | 2 | 0.2% | View All 39 Rows |
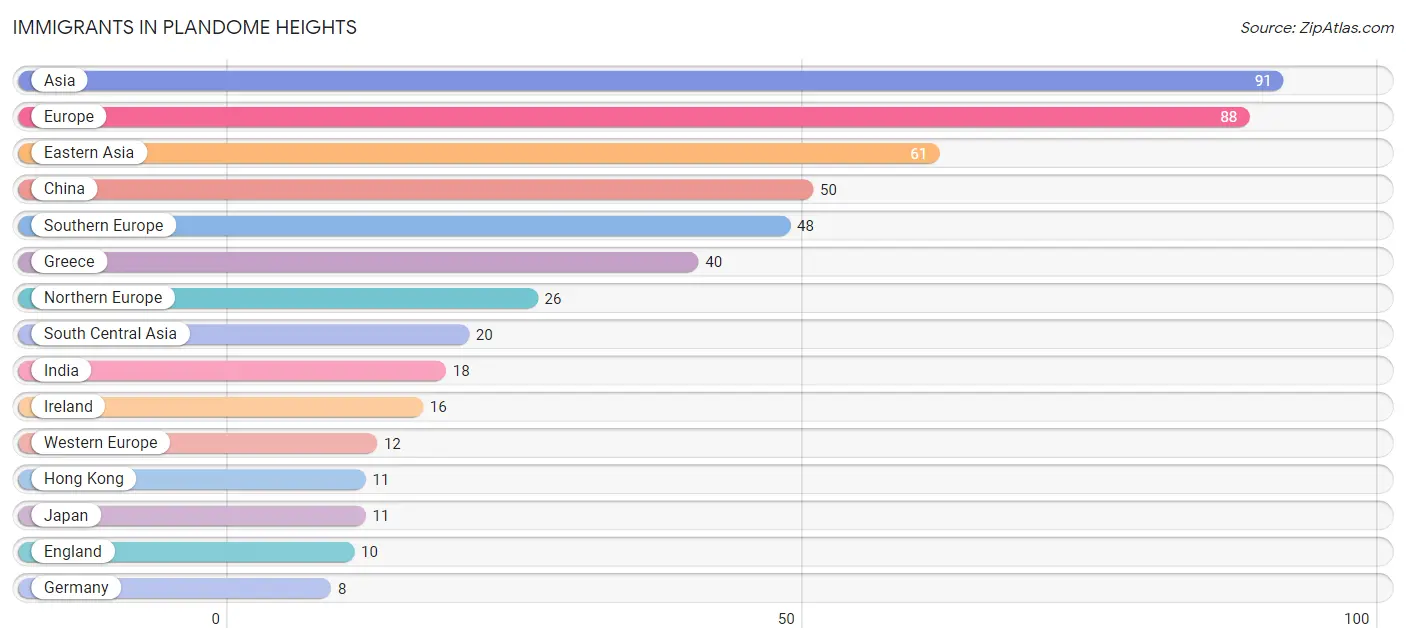
Immigrants in Plandome Heights
The most numerous immigrant groups reported in Plandome Heights came from Asia (91 | 9.7%), Europe (88 | 9.4%), Eastern Asia (61 | 6.5%), China (50 | 5.3%), and Southern Europe (48 | 5.1%), together accounting for 36.0% of all Plandome Heights residents.
| Immigration Origin | # Population | % Population |
| Africa | 3 | 0.3% |
| Argentina | 3 | 0.3% |
| Asia | 91 | 9.7% |
| China | 50 | 5.3% |
| Colombia | 5 | 0.5% |
| Eastern Africa | 3 | 0.3% |
| Eastern Asia | 61 | 6.5% |
| Eastern Europe | 2 | 0.2% |
| England | 10 | 1.1% |
| Europe | 88 | 9.4% |
| Germany | 8 | 0.9% |
| Greece | 40 | 4.3% |
| Hong Kong | 11 | 1.2% |
| India | 18 | 1.9% |
| Ireland | 16 | 1.7% |
| Italy | 8 | 0.9% |
| Japan | 11 | 1.2% |
| Kenya | 3 | 0.3% |
| Latin America | 8 | 0.9% |
| Northern Europe | 26 | 2.8% |
| Pakistan | 2 | 0.2% |
| Russia | 2 | 0.2% |
| South America | 8 | 0.9% |
| South Central Asia | 20 | 2.1% |
| South Eastern Asia | 2 | 0.2% |
| Southern Europe | 48 | 5.1% |
| Switzerland | 4 | 0.4% |
| Taiwan | 7 | 0.7% |
| Turkey | 2 | 0.2% |
| Vietnam | 2 | 0.2% |
| Western Asia | 8 | 0.9% |
| Western Europe | 12 | 1.3% | View All 32 Rows |
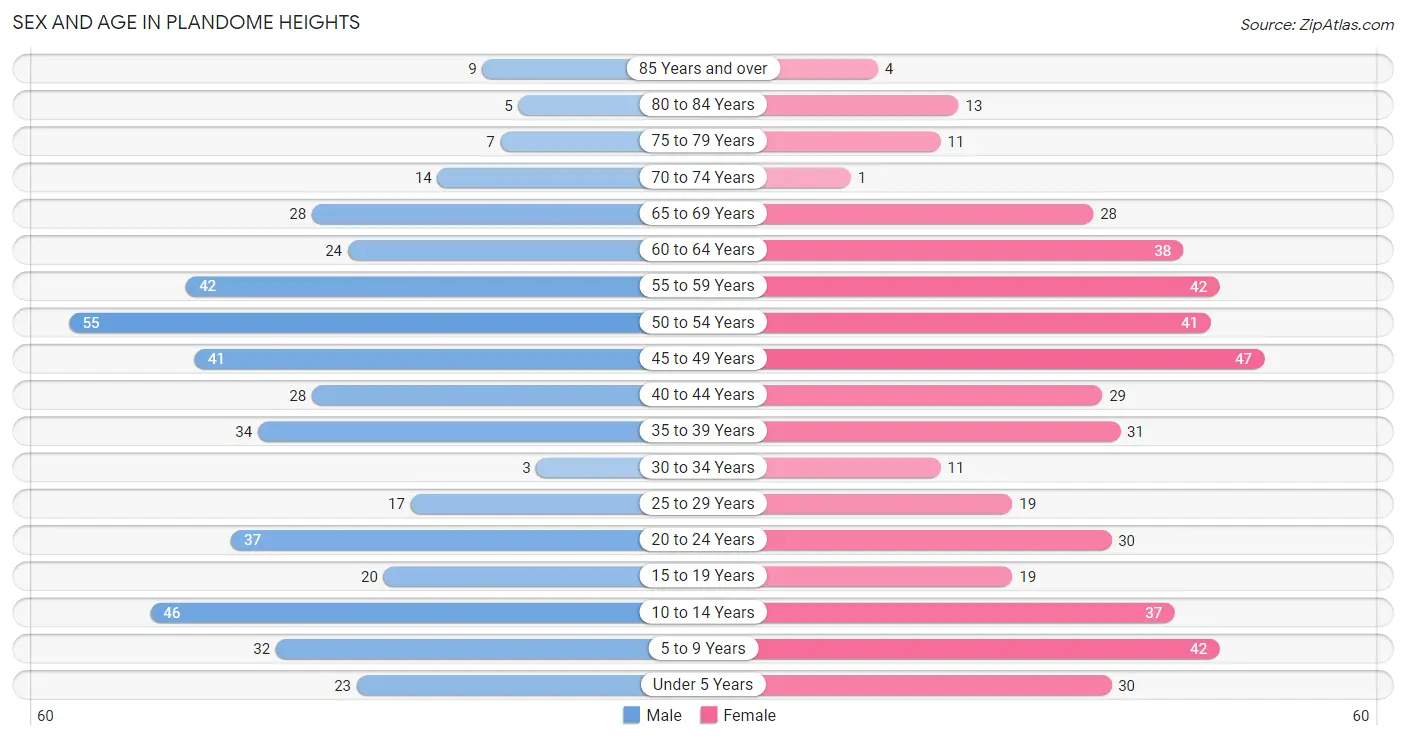
Sex and Age in Plandome Heights
Sex and Age in Plandome Heights
The most populous age groups in Plandome Heights are 50 to 54 Years (55 | 11.8%) for men and 45 to 49 Years (47 | 9.9%) for women.
| Age Bracket | Male | Female |
| Under 5 Years | 23 (5.0%) | 30 (6.3%) |
| 5 to 9 Years | 32 (6.9%) | 42 (8.9%) |
| 10 to 14 Years | 46 (9.9%) | 37 (7.8%) |
| 15 to 19 Years | 20 (4.3%) | 19 (4.0%) |
| 20 to 24 Years | 37 (8.0%) | 30 (6.3%) |
| 25 to 29 Years | 17 (3.7%) | 19 (4.0%) |
| 30 to 34 Years | 3 (0.6%) | 11 (2.3%) |
| 35 to 39 Years | 34 (7.3%) | 31 (6.6%) |
| 40 to 44 Years | 28 (6.0%) | 29 (6.1%) |
| 45 to 49 Years | 41 (8.8%) | 47 (9.9%) |
| 50 to 54 Years | 55 (11.8%) | 41 (8.7%) |
| 55 to 59 Years | 42 (9.0%) | 42 (8.9%) |
| 60 to 64 Years | 24 (5.2%) | 38 (8.0%) |
| 65 to 69 Years | 28 (6.0%) | 28 (5.9%) |
| 70 to 74 Years | 14 (3.0%) | 1 (0.2%) |
| 75 to 79 Years | 7 (1.5%) | 11 (2.3%) |
| 80 to 84 Years | 5 (1.1%) | 13 (2.8%) |
| 85 Years and over | 9 (1.9%) | 4 (0.9%) |
| Total | 465 (100.0%) | 473 (100.0%) |
Families and Households in Plandome Heights
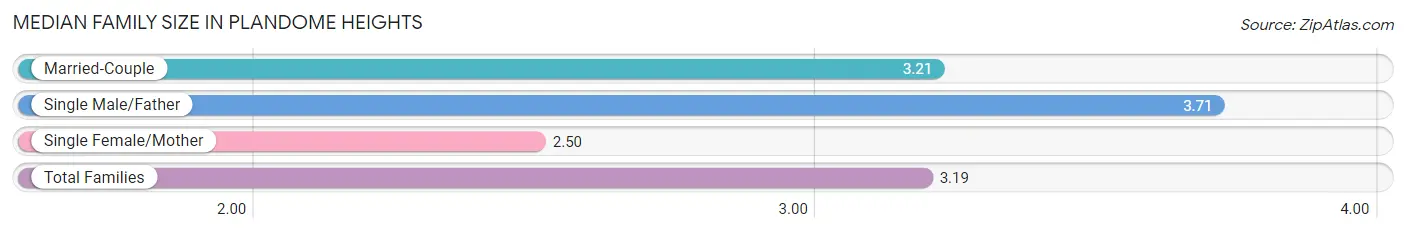
Median Family Size in Plandome Heights
The median family size in Plandome Heights is 3.19 persons per family, with single male/father families (7 | 2.5%) accounting for the largest median family size of 3.71 persons per family. On the other hand, single female/mother families (16 | 5.6%) represent the smallest median family size with 2.50 persons per family.
| Family Type | # Families | Family Size |
| Married-Couple | 262 (91.9%) | 3.21 |
| Single Male/Father | 7 (2.5%) | 3.71 |
| Single Female/Mother | 16 (5.6%) | 2.50 |
| Total Families | 285 (100.0%) | 3.19 |
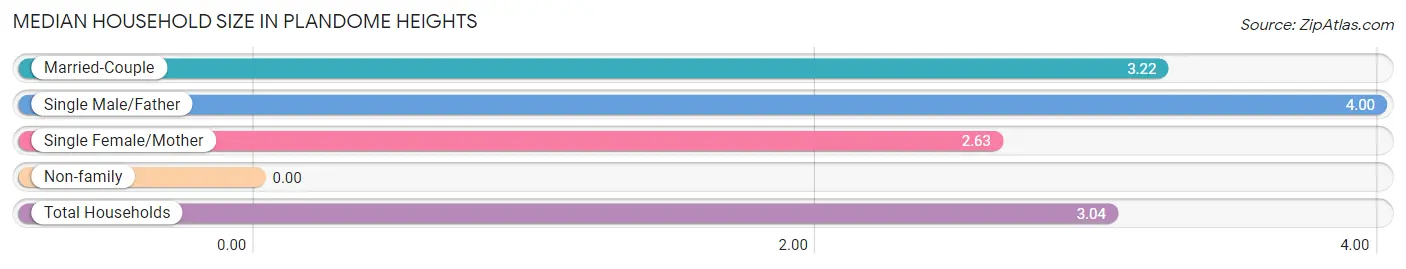
Median Household Size in Plandome Heights
| Household Type | # Households | Household Size |
| Married-Couple | 262 (84.8%) | 3.22 |
| Single Male/Father | 7 (2.3%) | 4.00 |
| Single Female/Mother | 16 (5.2%) | 2.63 |
| Non-family | 24 (7.8%) | - |
| Total Households | 309 (100.0%) | 3.04 |
Household Size by Marriage Status in Plandome Heights
Out of a total of 309 households in Plandome Heights, 285 (92.2%) are family households, while 24 (7.8%) are nonfamily households. The most numerous type of family households are 2-person households, comprising 99, and the most common type of nonfamily households are 1-person households, comprising 24.
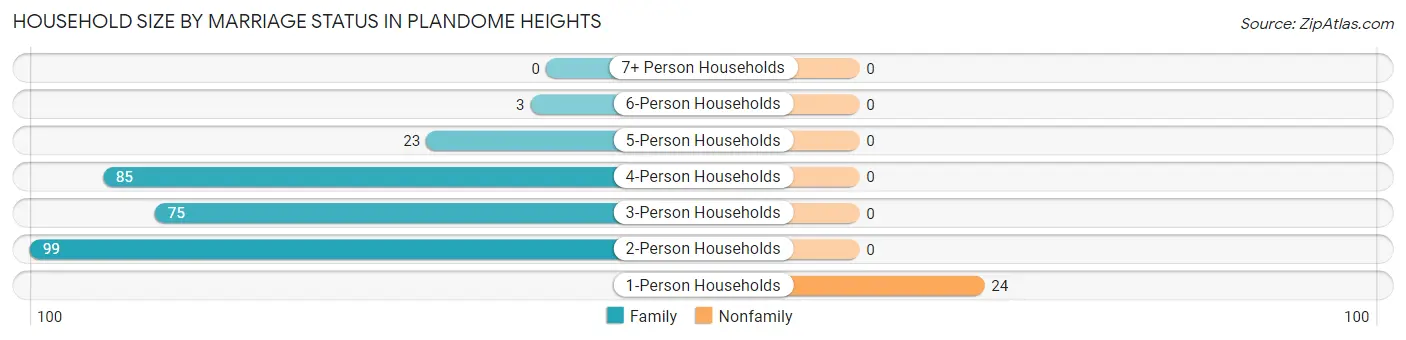
| Household Size | Family Households | Nonfamily Households |
| 1-Person Households | - | 24 (7.8%) |
| 2-Person Households | 99 (32.0%) | 0 (0.0%) |
| 3-Person Households | 75 (24.3%) | 0 (0.0%) |
| 4-Person Households | 85 (27.5%) | 0 (0.0%) |
| 5-Person Households | 23 (7.4%) | 0 (0.0%) |
| 6-Person Households | 3 (1.0%) | 0 (0.0%) |
| 7+ Person Households | 0 (0.0%) | 0 (0.0%) |
| Total | 285 (92.2%) | 24 (7.8%) |
Female Fertility in Plandome Heights
Fertility by Age in Plandome Heights
Average fertility rate in Plandome Heights is 36.0 births per 1,000 women. Women in the age bracket of 20 to 34 years have the highest fertility rate with 67.0 births per 1,000 women. Women in the age bracket of 20 to 34 years acount for 57.1% of all women with births.
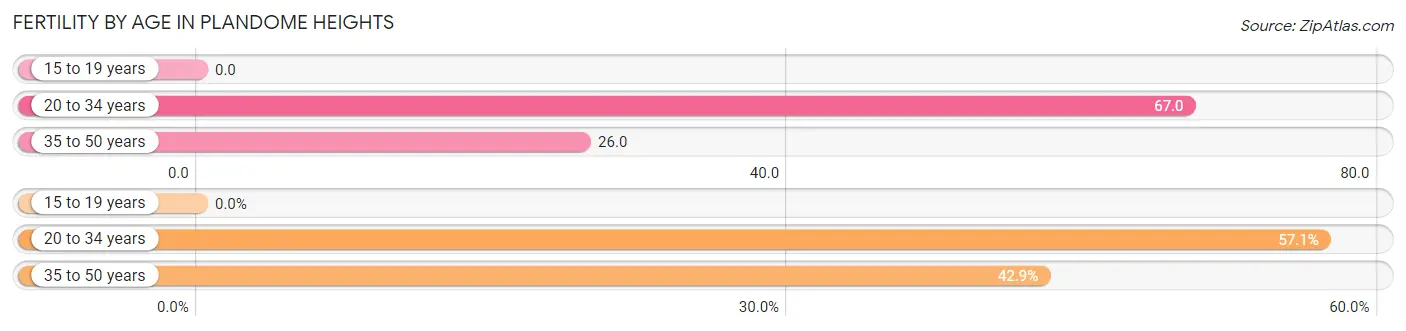
| Age Bracket | Women with Births | Births / 1,000 Women |
| 15 to 19 years | 0 (0.0%) | 0.0 |
| 20 to 34 years | 4 (57.1%) | 67.0 |
| 35 to 50 years | 3 (42.9%) | 26.0 |
| Total | 7 (100.0%) | 36.0 |
Fertility by Age by Marriage Status in Plandome Heights
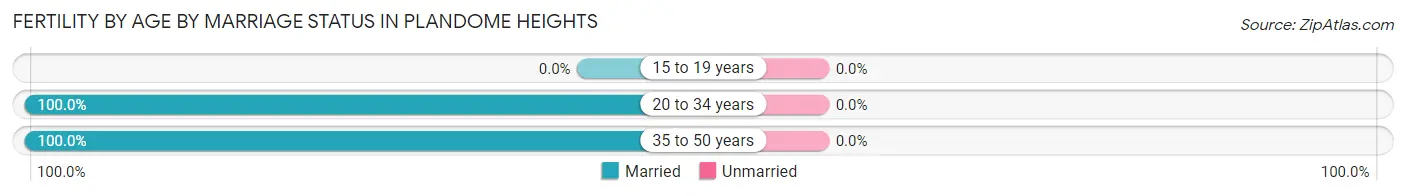
| Age Bracket | Married | Unmarried |
| 15 to 19 years | 0 (0.0%) | 0 (0.0%) |
| 20 to 34 years | 4 (100.0%) | 0 (0.0%) |
| 35 to 50 years | 3 (100.0%) | 0 (0.0%) |
| Total | 7 (100.0%) | 0 (0.0%) |
Fertility by Education in Plandome Heights
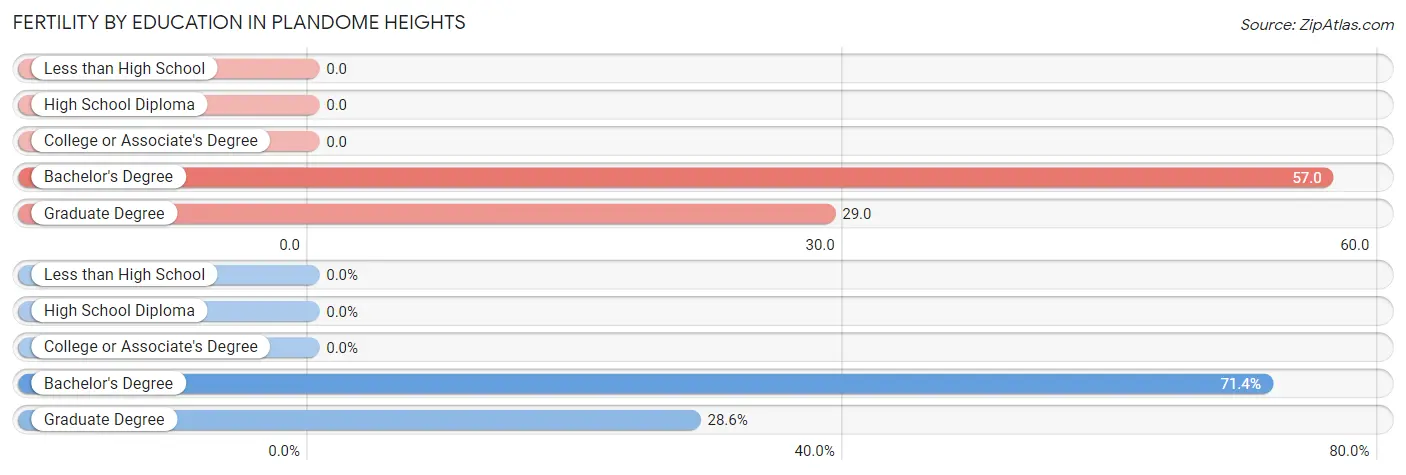
| Educational Attainment | Women with Births | Births / 1,000 Women |
| Less than High School | 0 (0.0%) | 0.0 |
| High School Diploma | 0 (0.0%) | 0.0 |
| College or Associate's Degree | 0 (0.0%) | 0.0 |
| Bachelor's Degree | 5 (71.4%) | 57.0 |
| Graduate Degree | 2 (28.6%) | 29.0 |
| Total | 7 (100.0%) | 36.0 |
Fertility by Education by Marriage Status in Plandome Heights
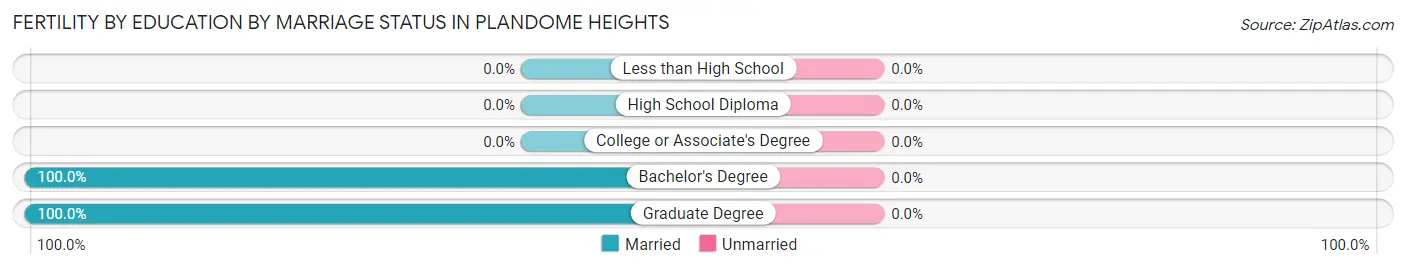
| Educational Attainment | Married | Unmarried |
| Less than High School | 0 (0.0%) | 0 (0.0%) |
| High School Diploma | 0 (0.0%) | 0 (0.0%) |
| College or Associate's Degree | 0 (0.0%) | 0 (0.0%) |
| Bachelor's Degree | 5 (100.0%) | 0 (0.0%) |
| Graduate Degree | 2 (100.0%) | 0 (0.0%) |
| Total | 7 (100.0%) | 0 (0.0%) |
Employment Characteristics in Plandome Heights
Employment by Class of Employer in Plandome Heights
Among the 502 employed individuals in Plandome Heights, private company employees (361 | 71.9%), not-for-profit organizations (46 | 9.2%), and self-employed (incorporated) (29 | 5.8%) make up the most common classes of employment.
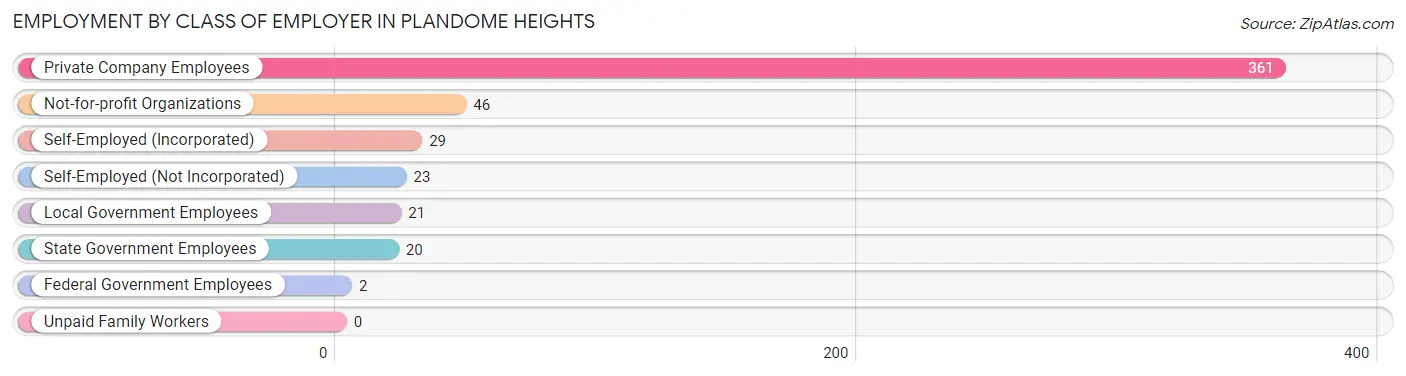
| Employer Class | # Employees | % Employees |
| Private Company Employees | 361 | 71.9% |
| Self-Employed (Incorporated) | 29 | 5.8% |
| Self-Employed (Not Incorporated) | 23 | 4.6% |
| Not-for-profit Organizations | 46 | 9.2% |
| Local Government Employees | 21 | 4.2% |
| State Government Employees | 20 | 4.0% |
| Federal Government Employees | 2 | 0.4% |
| Unpaid Family Workers | 0 | 0.0% |
| Total | 502 | 100.0% |
Employment Status by Age in Plandome Heights
According to the labor force statistics for Plandome Heights, out of the total population over 16 years of age (721), 72.1% or 520 individuals are in the labor force, with 1.7% or 9 of them unemployed. The age group with the highest labor force participation rate is 25 to 29 years, with 100.0% or 36 individuals in the labor force. Within the labor force, the 30 to 34 years age range has the highest percentage of unemployed individuals, with 8.3% or 1 of them being unemployed.
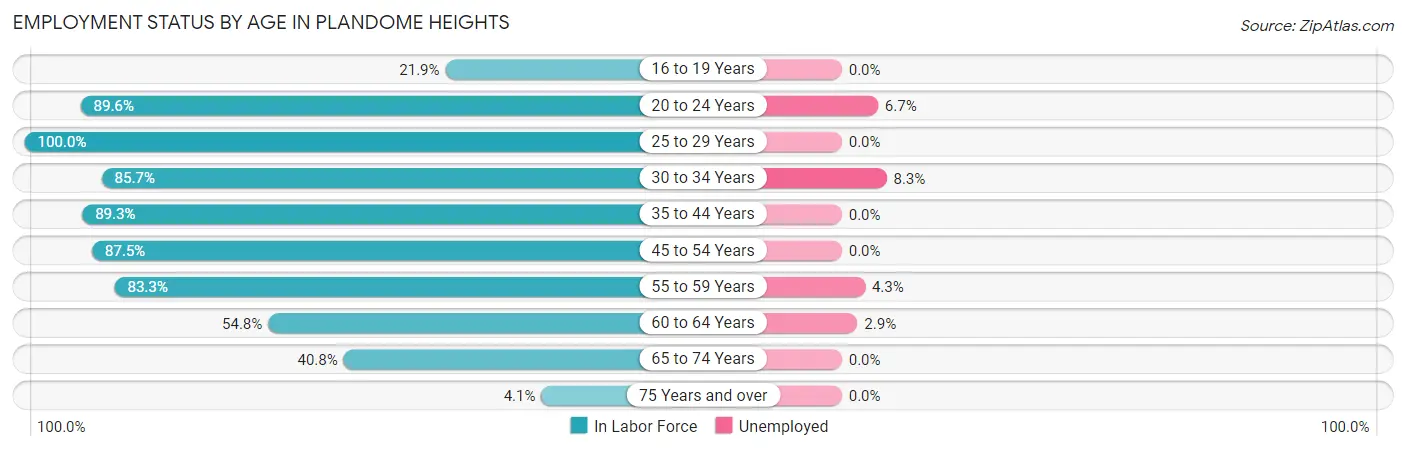
| Age Bracket | In Labor Force | Unemployed |
| 16 to 19 Years | 7 (21.9%) | 0 (0.0%) |
| 20 to 24 Years | 60 (89.6%) | 4 (6.7%) |
| 25 to 29 Years | 36 (100.0%) | 0 (0.0%) |
| 30 to 34 Years | 12 (85.7%) | 1 (8.3%) |
| 35 to 44 Years | 109 (89.3%) | 0 (0.0%) |
| 45 to 54 Years | 161 (87.5%) | 0 (0.0%) |
| 55 to 59 Years | 70 (83.3%) | 3 (4.3%) |
| 60 to 64 Years | 34 (54.8%) | 1 (2.9%) |
| 65 to 74 Years | 29 (40.8%) | 0 (0.0%) |
| 75 Years and over | 2 (4.1%) | 0 (0.0%) |
| Total | 520 (72.1%) | 9 (1.7%) |
Employment Status by Educational Attainment in Plandome Heights
According to labor force statistics for Plandome Heights, 84.1% of individuals (422) out of the total population between 25 and 64 years of age (502) are in the labor force, with 1.2% or 5 of them being unemployed. The group with the highest labor force participation rate are those with the educational attainment of high school diploma, with 93.9% or 31 individuals in the labor force. Within the labor force, individuals with bachelor's degree or higher education have the highest percentage of unemployment, with 1.4% or 5 of them being unemployed.
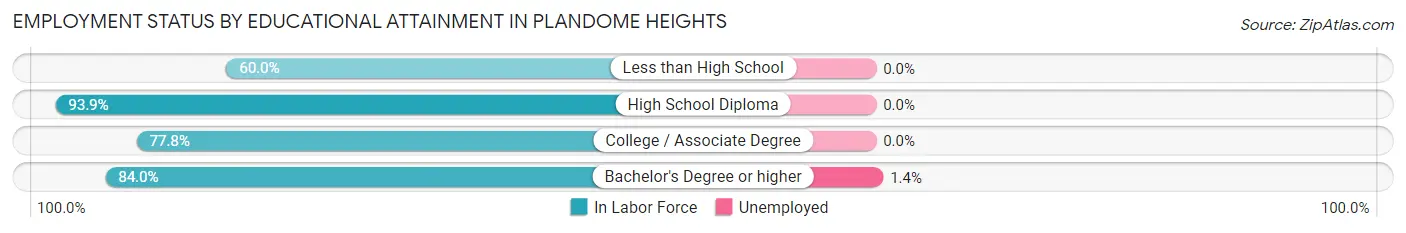
| Educational Attainment | In Labor Force | Unemployed |
| Less than High School | 3 (60.0%) | 0 (0.0%) |
| High School Diploma | 31 (93.9%) | 0 (0.0%) |
| College / Associate Degree | 21 (77.8%) | 0 (0.0%) |
| Bachelor's Degree or higher | 367 (84.0%) | 6 (1.4%) |
| Total | 422 (84.1%) | 6 (1.2%) |
Employment Occupations by Sex in Plandome Heights
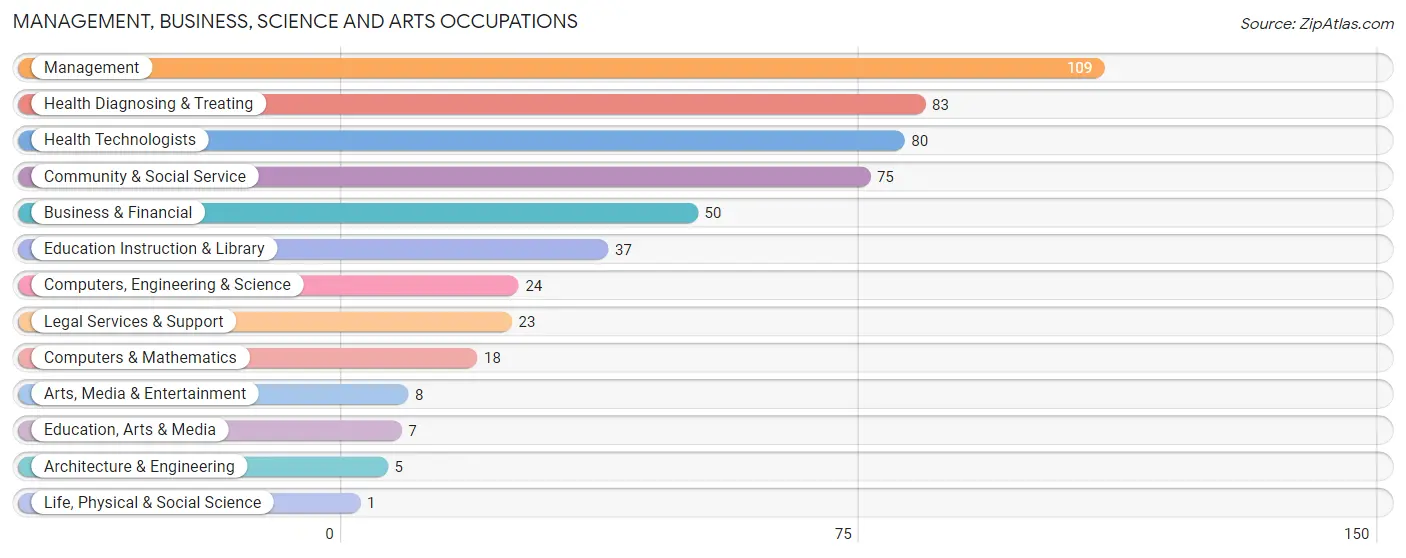
Management, Business, Science and Arts Occupations
The most common Management, Business, Science and Arts occupations in Plandome Heights are Management (109 | 21.3%), Health Diagnosing & Treating (83 | 16.2%), Health Technologists (80 | 15.7%), Community & Social Service (75 | 14.7%), and Business & Financial (50 | 9.8%).
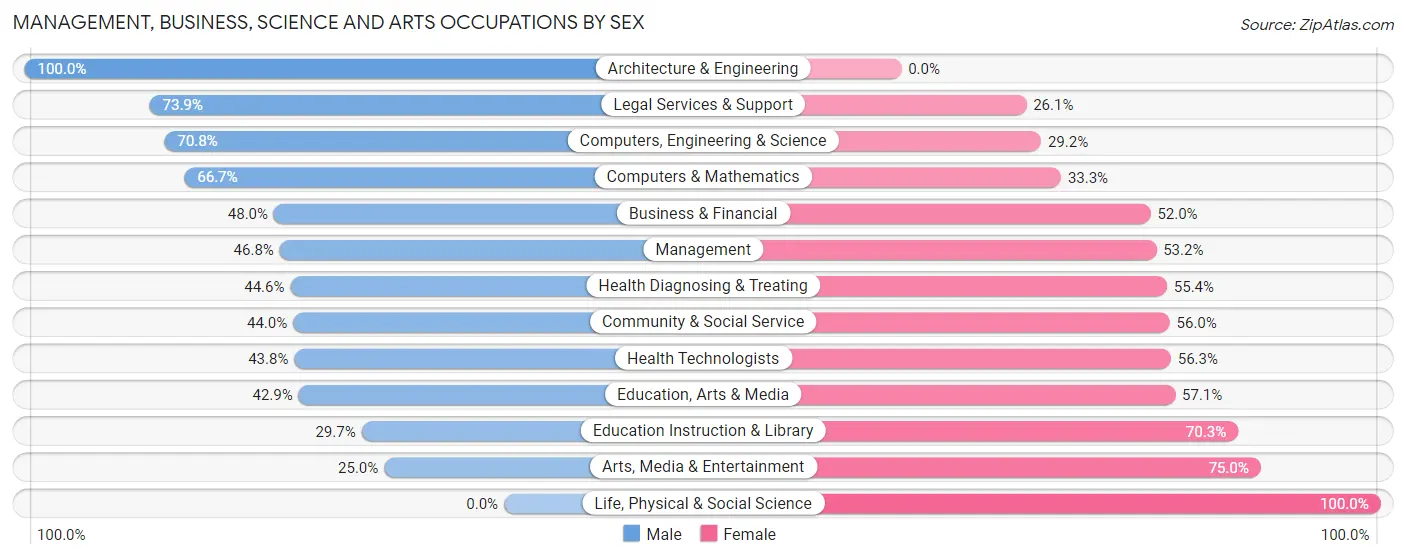
Management, Business, Science and Arts Occupations by Sex
Within the Management, Business, Science and Arts occupations in Plandome Heights, the most male-oriented occupations are Architecture & Engineering (100.0%), Legal Services & Support (73.9%), and Computers, Engineering & Science (70.8%), while the most female-oriented occupations are Life, Physical & Social Science (100.0%), Arts, Media & Entertainment (75.0%), and Education Instruction & Library (70.3%).
| Occupation | Male | Female |
| Management | 51 (46.8%) | 58 (53.2%) |
| Business & Financial | 24 (48.0%) | 26 (52.0%) |
| Computers, Engineering & Science | 17 (70.8%) | 7 (29.2%) |
| Computers & Mathematics | 12 (66.7%) | 6 (33.3%) |
| Architecture & Engineering | 5 (100.0%) | 0 (0.0%) |
| Life, Physical & Social Science | 0 (0.0%) | 1 (100.0%) |
| Community & Social Service | 33 (44.0%) | 42 (56.0%) |
| Education, Arts & Media | 3 (42.9%) | 4 (57.1%) |
| Legal Services & Support | 17 (73.9%) | 6 (26.1%) |
| Education Instruction & Library | 11 (29.7%) | 26 (70.3%) |
| Arts, Media & Entertainment | 2 (25.0%) | 6 (75.0%) |
| Health Diagnosing & Treating | 37 (44.6%) | 46 (55.4%) |
| Health Technologists | 35 (43.8%) | 45 (56.2%) |
| Total (Category) | 162 (47.5%) | 179 (52.5%) |
| Total (Overall) | 275 (53.8%) | 236 (46.2%) |
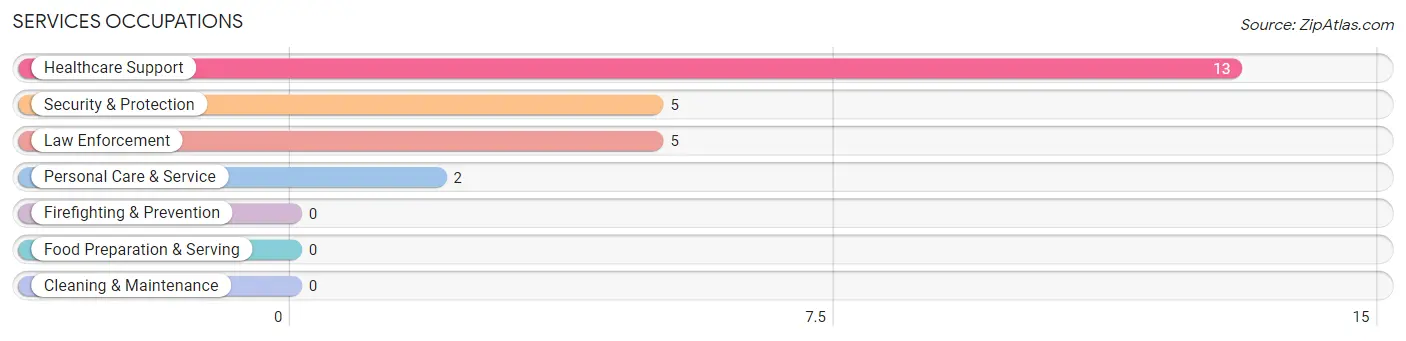
Services Occupations
The most common Services occupations in Plandome Heights are Healthcare Support (13 | 2.5%), Security & Protection (5 | 1.0%), Law Enforcement (5 | 1.0%), and Personal Care & Service (2 | 0.4%).
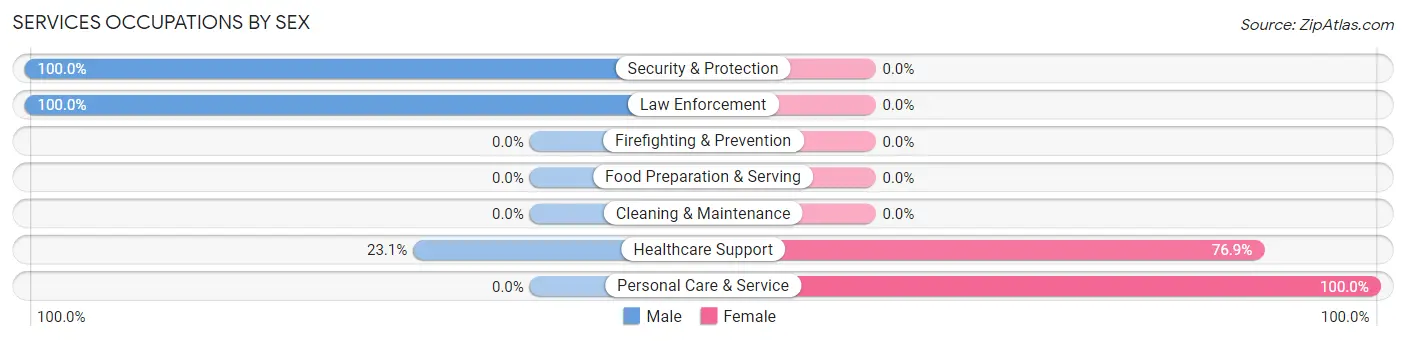
Services Occupations by Sex
Within the Services occupations in Plandome Heights, the most male-oriented occupations are Security & Protection (100.0%), Law Enforcement (100.0%), and Healthcare Support (23.1%), while the most female-oriented occupations are Personal Care & Service (100.0%), and Healthcare Support (76.9%).
| Occupation | Male | Female |
| Healthcare Support | 3 (23.1%) | 10 (76.9%) |
| Security & Protection | 5 (100.0%) | 0 (0.0%) |
| Firefighting & Prevention | 0 (0.0%) | 0 (0.0%) |
| Law Enforcement | 5 (100.0%) | 0 (0.0%) |
| Food Preparation & Serving | 0 (0.0%) | 0 (0.0%) |
| Cleaning & Maintenance | 0 (0.0%) | 0 (0.0%) |
| Personal Care & Service | 0 (0.0%) | 2 (100.0%) |
| Total (Category) | 8 (40.0%) | 12 (60.0%) |
| Total (Overall) | 275 (53.8%) | 236 (46.2%) |
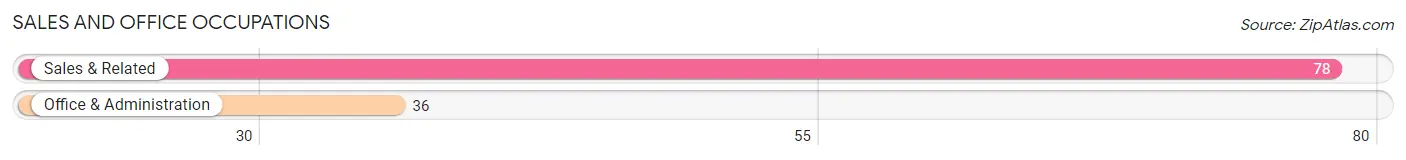
Sales and Office Occupations
The most common Sales and Office occupations in Plandome Heights are Sales & Related (78 | 15.3%), and Office & Administration (36 | 7.0%).
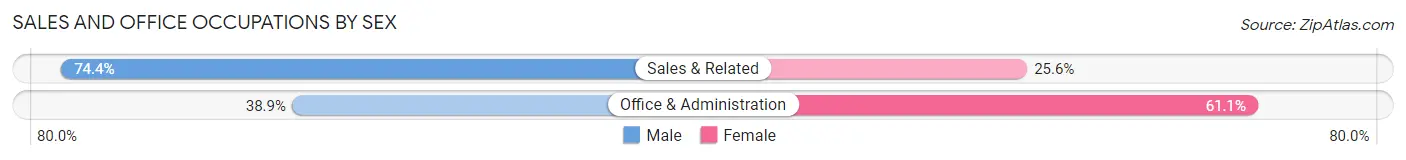
Sales and Office Occupations by Sex
| Occupation | Male | Female |
| Sales & Related | 58 (74.4%) | 20 (25.6%) |
| Office & Administration | 14 (38.9%) | 22 (61.1%) |
| Total (Category) | 72 (63.2%) | 42 (36.8%) |
| Total (Overall) | 275 (53.8%) | 236 (46.2%) |
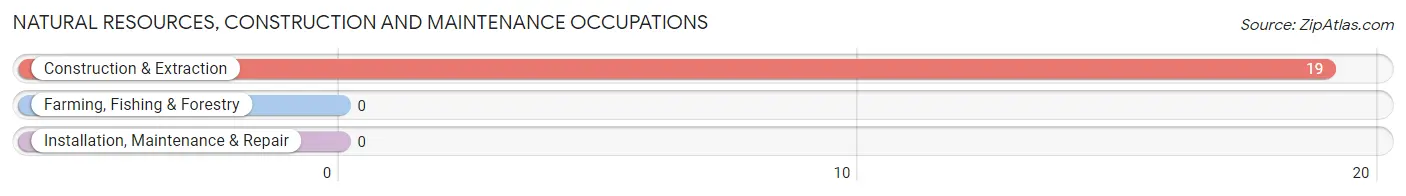
Natural Resources, Construction and Maintenance Occupations
The most common Natural Resources, Construction and Maintenance occupations in Plandome Heights are , and Construction & Extraction (19 | 3.7%).
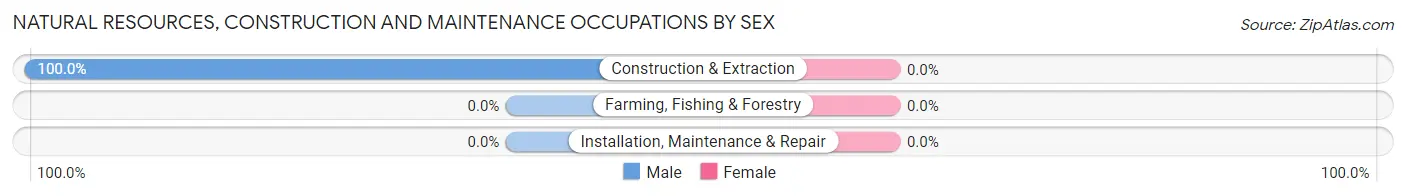
Natural Resources, Construction and Maintenance Occupations by Sex
| Occupation | Male | Female |
| Farming, Fishing & Forestry | 0 (0.0%) | 0 (0.0%) |
| Construction & Extraction | 19 (100.0%) | 0 (0.0%) |
| Installation, Maintenance & Repair | 0 (0.0%) | 0 (0.0%) |
| Total (Category) | 19 (100.0%) | 0 (0.0%) |
| Total (Overall) | 275 (53.8%) | 236 (46.2%) |
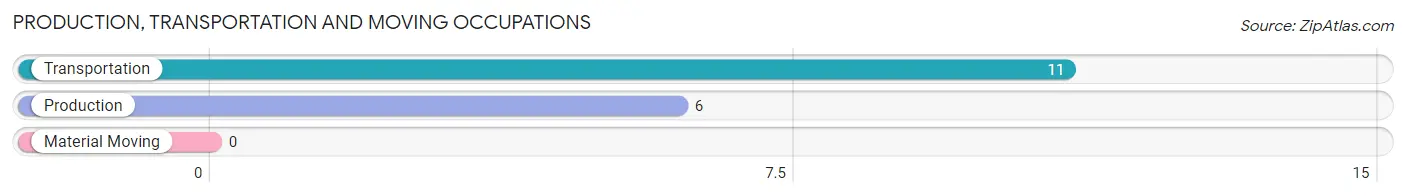
Production, Transportation and Moving Occupations
The most common Production, Transportation and Moving occupations in Plandome Heights are Transportation (11 | 2.1%), and Production (6 | 1.2%).
Production, Transportation and Moving Occupations by Sex
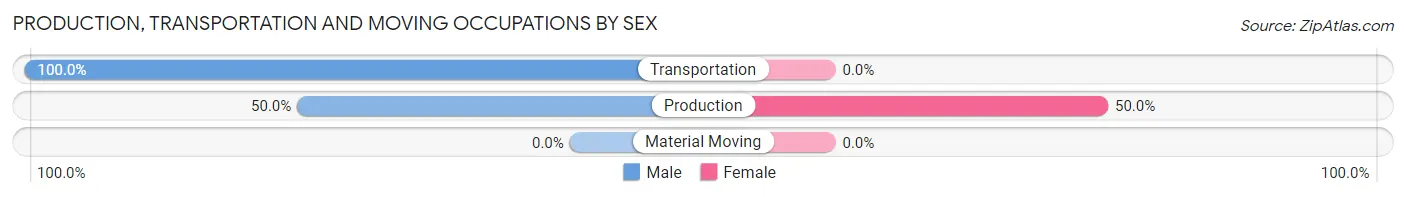
| Occupation | Male | Female |
| Production | 3 (50.0%) | 3 (50.0%) |
| Transportation | 11 (100.0%) | 0 (0.0%) |
| Material Moving | 0 (0.0%) | 0 (0.0%) |
| Total (Category) | 14 (82.4%) | 3 (17.6%) |
| Total (Overall) | 275 (53.8%) | 236 (46.2%) |
Employment Industries by Sex in Plandome Heights
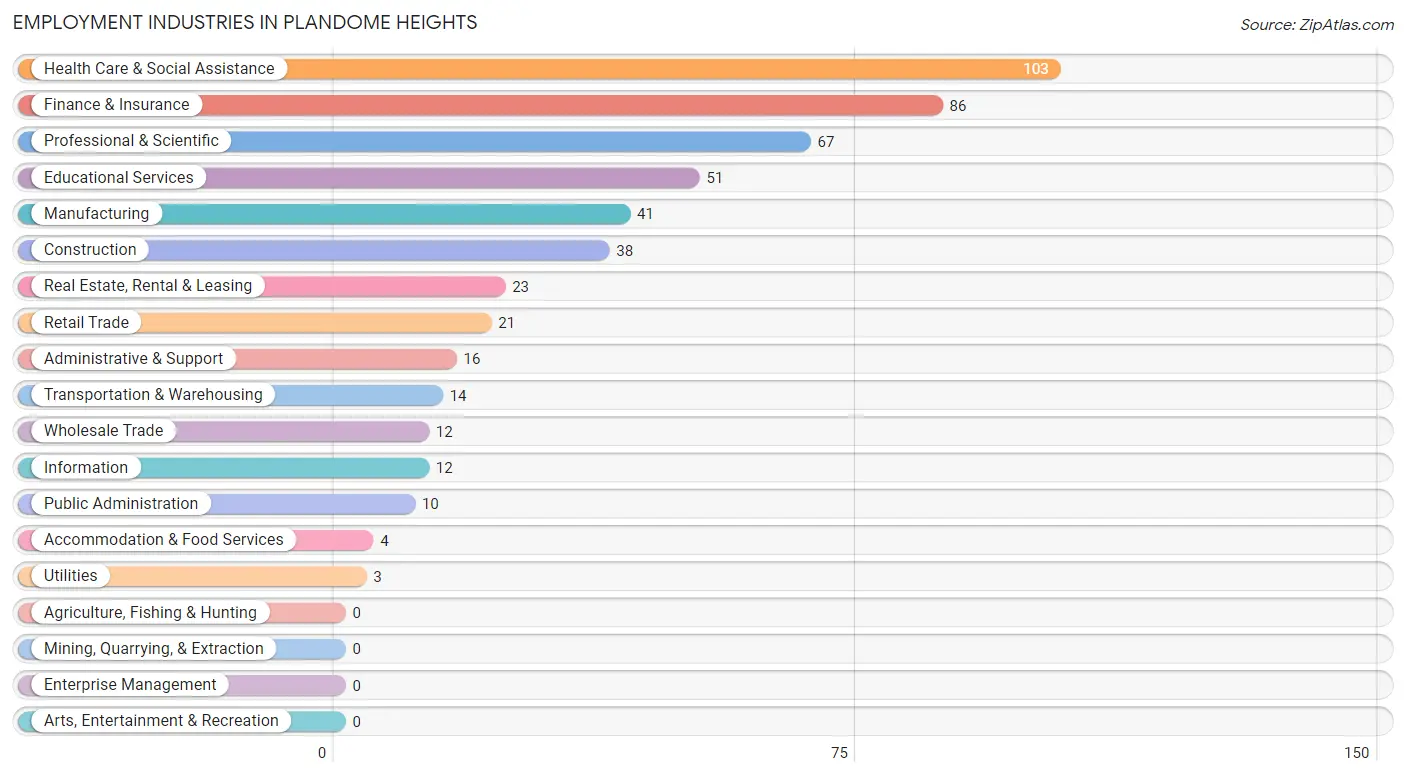
Employment Industries in Plandome Heights
The major employment industries in Plandome Heights include Health Care & Social Assistance (103 | 20.2%), Finance & Insurance (86 | 16.8%), Professional & Scientific (67 | 13.1%), Educational Services (51 | 10.0%), and Manufacturing (41 | 8.0%).
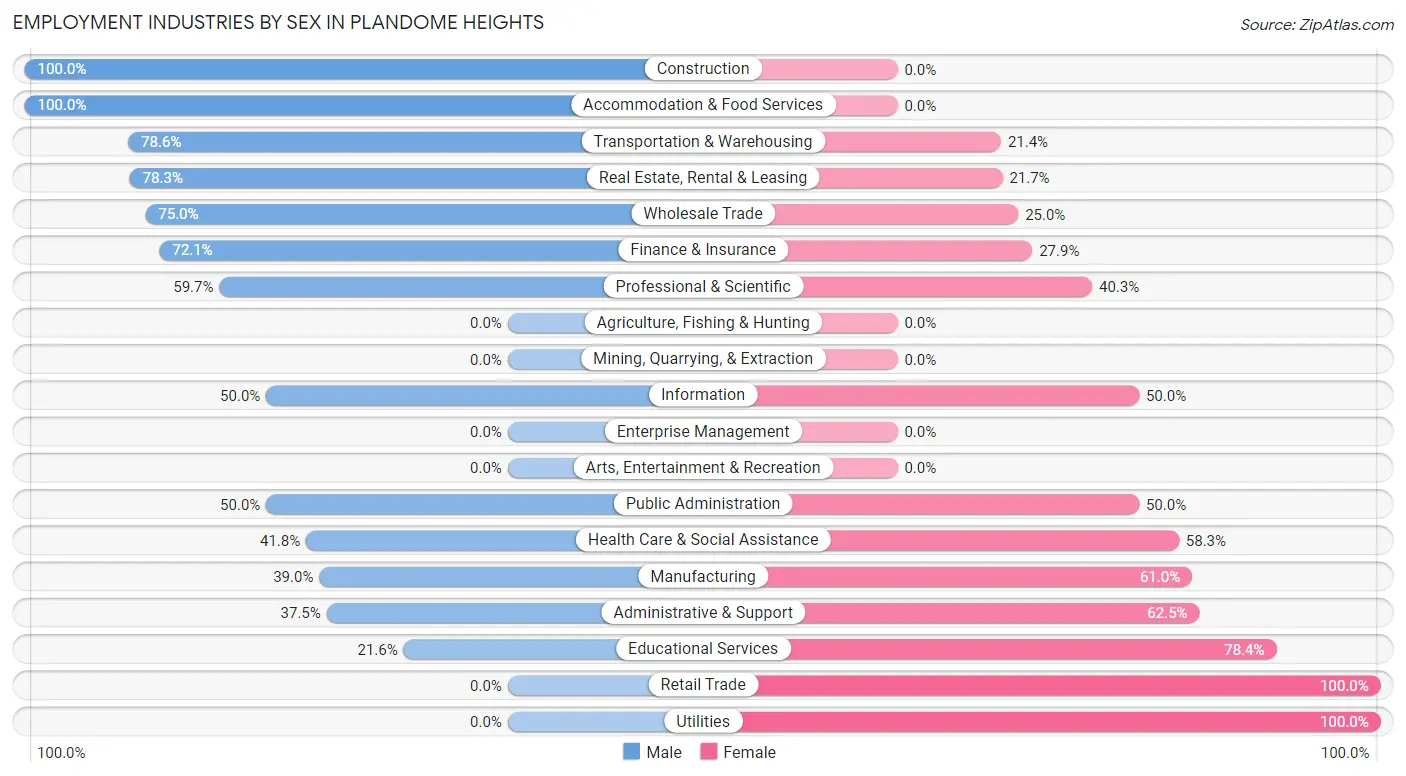
Employment Industries by Sex in Plandome Heights
The Plandome Heights industries that see more men than women are Construction (100.0%), Accommodation & Food Services (100.0%), and Transportation & Warehousing (78.6%), whereas the industries that tend to have a higher number of women are Retail Trade (100.0%), Utilities (100.0%), and Educational Services (78.4%).
| Industry | Male | Female |
| Agriculture, Fishing & Hunting | 0 (0.0%) | 0 (0.0%) |
| Mining, Quarrying, & Extraction | 0 (0.0%) | 0 (0.0%) |
| Construction | 38 (100.0%) | 0 (0.0%) |
| Manufacturing | 16 (39.0%) | 25 (61.0%) |
| Wholesale Trade | 9 (75.0%) | 3 (25.0%) |
| Retail Trade | 0 (0.0%) | 21 (100.0%) |
| Transportation & Warehousing | 11 (78.6%) | 3 (21.4%) |
| Utilities | 0 (0.0%) | 3 (100.0%) |
| Information | 6 (50.0%) | 6 (50.0%) |
| Finance & Insurance | 62 (72.1%) | 24 (27.9%) |
| Real Estate, Rental & Leasing | 18 (78.3%) | 5 (21.7%) |
| Professional & Scientific | 40 (59.7%) | 27 (40.3%) |
| Enterprise Management | 0 (0.0%) | 0 (0.0%) |
| Administrative & Support | 6 (37.5%) | 10 (62.5%) |
| Educational Services | 11 (21.6%) | 40 (78.4%) |
| Health Care & Social Assistance | 43 (41.7%) | 60 (58.3%) |
| Arts, Entertainment & Recreation | 0 (0.0%) | 0 (0.0%) |
| Accommodation & Food Services | 4 (100.0%) | 0 (0.0%) |
| Public Administration | 5 (50.0%) | 5 (50.0%) |
| Total | 275 (53.8%) | 236 (46.2%) |
Education in Plandome Heights
School Enrollment in Plandome Heights
The most common levels of schooling among the 254 students in Plandome Heights are middle school (68 | 26.8%), elementary school (58 | 22.8%), and high school (50 | 19.7%).
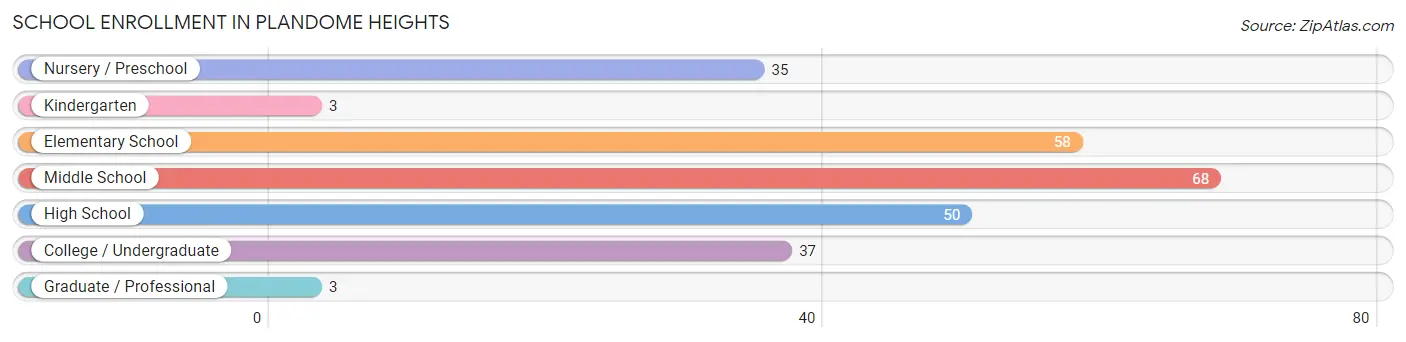
| School Level | # Students | % Students |
| Nursery / Preschool | 35 | 13.8% |
| Kindergarten | 3 | 1.2% |
| Elementary School | 58 | 22.8% |
| Middle School | 68 | 26.8% |
| High School | 50 | 19.7% |
| College / Undergraduate | 37 | 14.6% |
| Graduate / Professional | 3 | 1.2% |
| Total | 254 | 100.0% |
School Enrollment by Age by Funding Source in Plandome Heights
Out of a total of 254 students who are enrolled in schools in Plandome Heights, 47 (18.5%) attend a private institution, while the remaining 207 (81.5%) are enrolled in public schools. The age group of 25 to 34 year olds has the highest likelihood of being enrolled in private schools, with 3 (100.0% in the age bracket) enrolled. Conversely, the age group of 10 to 14 year olds has the lowest likelihood of being enrolled in a private school, with 83 (100.0% in the age bracket) attending a public institution.
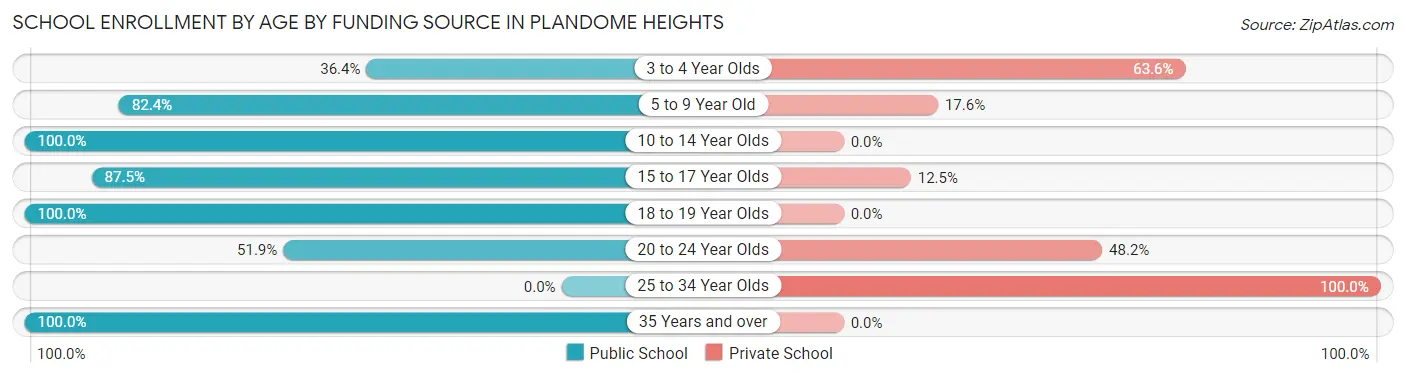
| Age Bracket | Public School | Private School |
| 3 to 4 Year Olds | 8 (36.4%) | 14 (63.6%) |
| 5 to 9 Year Old | 61 (82.4%) | 13 (17.6%) |
| 10 to 14 Year Olds | 83 (100.0%) | 0 (0.0%) |
| 15 to 17 Year Olds | 28 (87.5%) | 4 (12.5%) |
| 18 to 19 Year Olds | 7 (100.0%) | 0 (0.0%) |
| 20 to 24 Year Olds | 14 (51.8%) | 13 (48.1%) |
| 25 to 34 Year Olds | 0 (0.0%) | 3 (100.0%) |
| 35 Years and over | 6 (100.0%) | 0 (0.0%) |
| Total | 207 (81.5%) | 47 (18.5%) |
Educational Attainment by Field of Study in Plandome Heights
Business (188 | 35.4%), bio, nature & agricultural (59 | 11.1%), social sciences (44 | 8.3%), computers & mathematics (41 | 7.7%), and science & technology (37 | 7.0%) are the most common fields of study among 531 individuals in Plandome Heights who have obtained a bachelor's degree or higher.
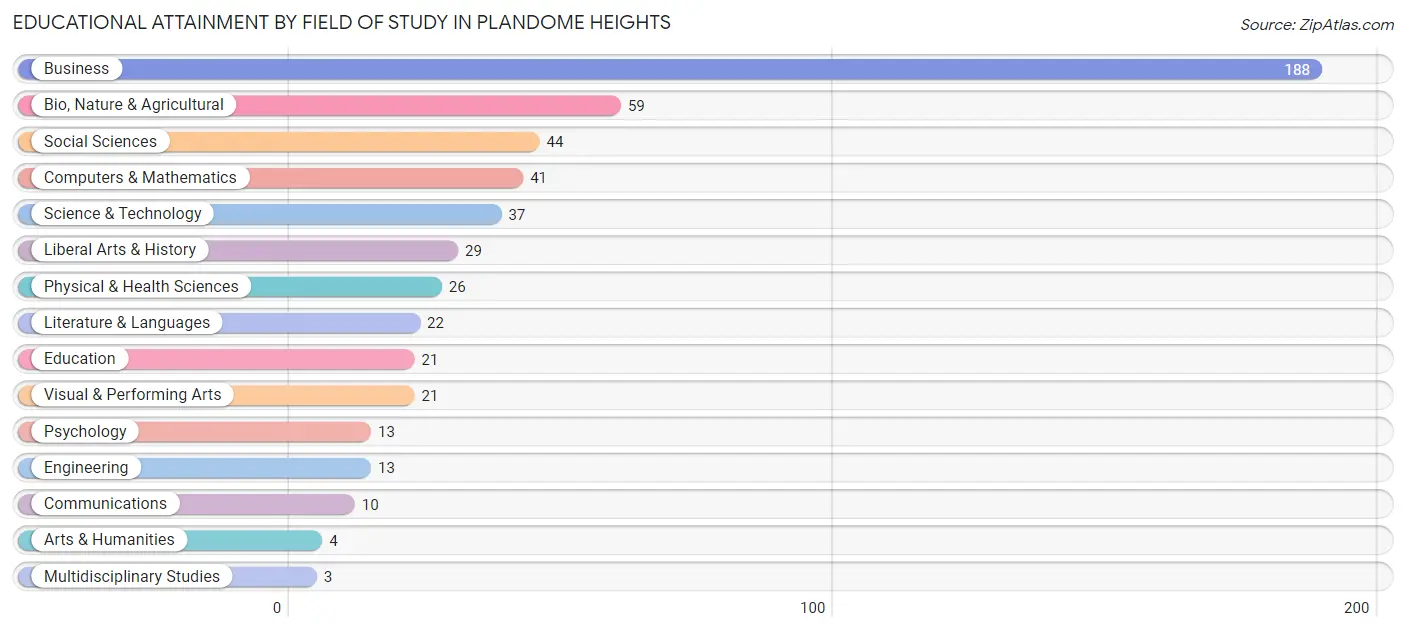
| Field of Study | # Graduates | % Graduates |
| Computers & Mathematics | 41 | 7.7% |
| Bio, Nature & Agricultural | 59 | 11.1% |
| Physical & Health Sciences | 26 | 4.9% |
| Psychology | 13 | 2.5% |
| Social Sciences | 44 | 8.3% |
| Engineering | 13 | 2.5% |
| Multidisciplinary Studies | 3 | 0.6% |
| Science & Technology | 37 | 7.0% |
| Business | 188 | 35.4% |
| Education | 21 | 4.0% |
| Literature & Languages | 22 | 4.1% |
| Liberal Arts & History | 29 | 5.5% |
| Visual & Performing Arts | 21 | 4.0% |
| Communications | 10 | 1.9% |
| Arts & Humanities | 4 | 0.7% |
| Total | 531 | 100.0% |
Transportation & Commute in Plandome Heights
Vehicle Availability by Sex in Plandome Heights
The most prevalent vehicle ownership categories in Plandome Heights are males with 2 vehicles (148, accounting for 55.0%) and females with 2 vehicles (153, making up 63.5%).
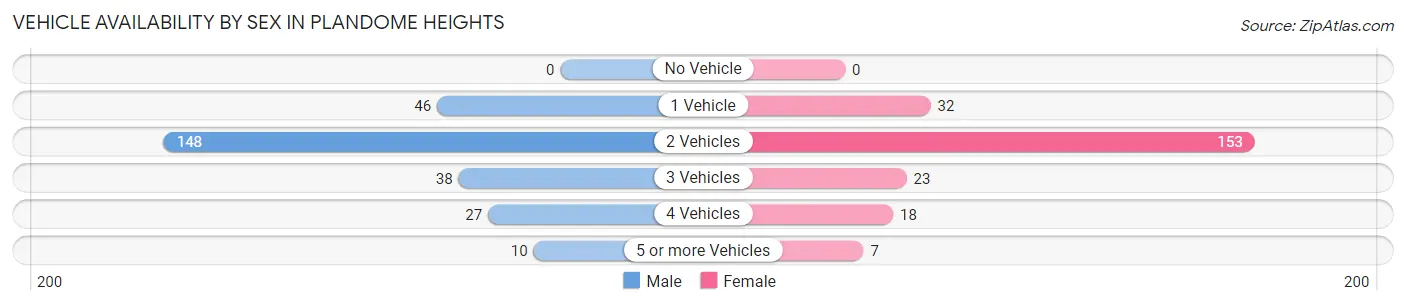
| Vehicles Available | Male | Female |
| No Vehicle | 0 (0.0%) | 0 (0.0%) |
| 1 Vehicle | 46 (17.1%) | 32 (13.7%) |
| 2 Vehicles | 148 (55.0%) | 153 (65.7%) |
| 3 Vehicles | 38 (14.1%) | 23 (9.9%) |
| 4 Vehicles | 27 (10.0%) | 18 (7.7%) |
| 5 or more Vehicles | 10 (3.7%) | 7 (3.0%) |
| Total | 269 (100.0%) | 233 (100.0%) |
Commute Time in Plandome Heights
The most frequently occuring commute durations in Plandome Heights are 60 to 89 minutes (139 commuters, 32.2%), 45 to 59 minutes (109 commuters, 25.2%), and 30 to 34 minutes (51 commuters, 11.8%).
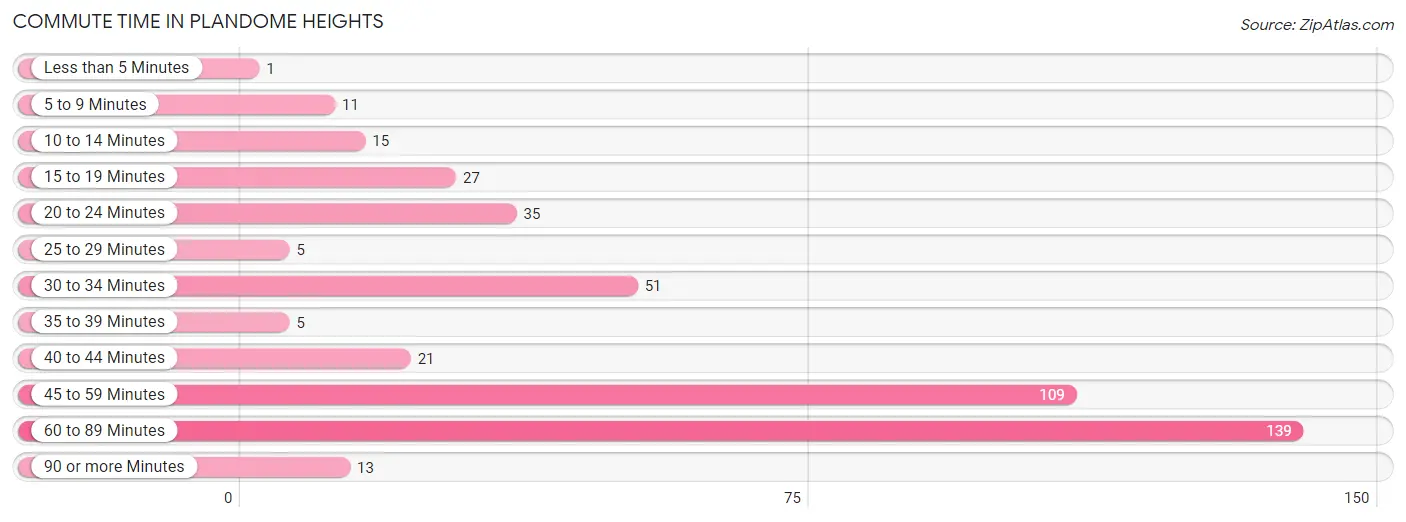
| Commute Time | # Commuters | % Commuters |
| Less than 5 Minutes | 1 | 0.2% |
| 5 to 9 Minutes | 11 | 2.5% |
| 10 to 14 Minutes | 15 | 3.5% |
| 15 to 19 Minutes | 27 | 6.2% |
| 20 to 24 Minutes | 35 | 8.1% |
| 25 to 29 Minutes | 5 | 1.2% |
| 30 to 34 Minutes | 51 | 11.8% |
| 35 to 39 Minutes | 5 | 1.2% |
| 40 to 44 Minutes | 21 | 4.9% |
| 45 to 59 Minutes | 109 | 25.2% |
| 60 to 89 Minutes | 139 | 32.2% |
| 90 or more Minutes | 13 | 3.0% |
Commute Time by Sex in Plandome Heights
The most common commute times in Plandome Heights are 60 to 89 minutes (85 commuters, 36.5%) for males and 45 to 59 minutes (64 commuters, 32.2%) for females.
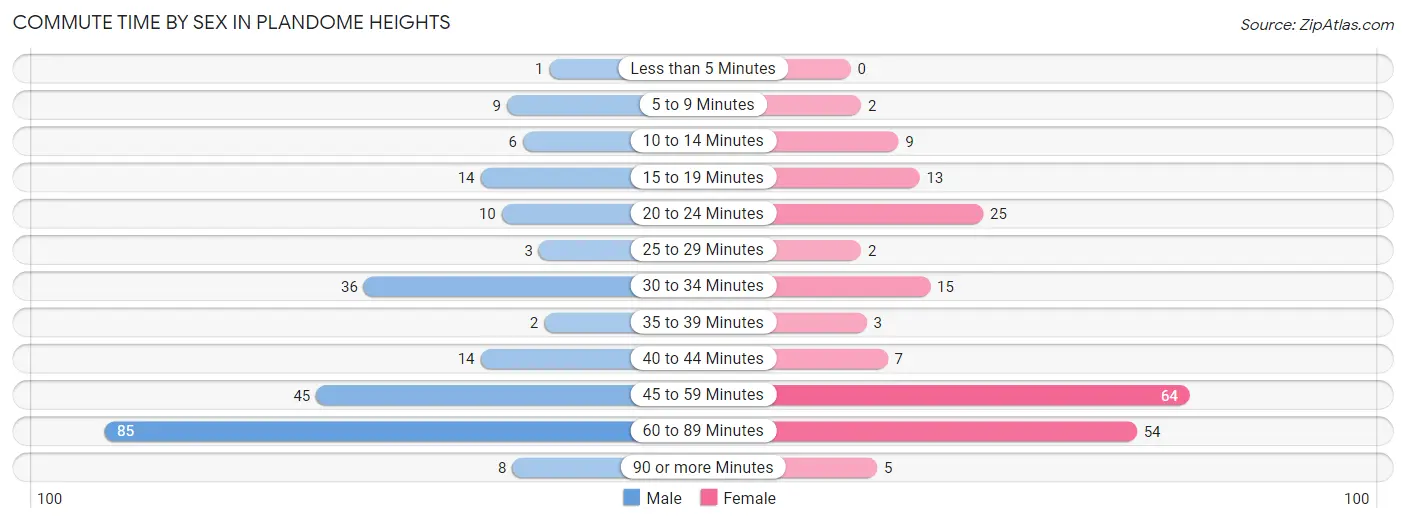
| Commute Time | Male | Female |
| Less than 5 Minutes | 1 (0.4%) | 0 (0.0%) |
| 5 to 9 Minutes | 9 (3.9%) | 2 (1.0%) |
| 10 to 14 Minutes | 6 (2.6%) | 9 (4.5%) |
| 15 to 19 Minutes | 14 (6.0%) | 13 (6.5%) |
| 20 to 24 Minutes | 10 (4.3%) | 25 (12.6%) |
| 25 to 29 Minutes | 3 (1.3%) | 2 (1.0%) |
| 30 to 34 Minutes | 36 (15.4%) | 15 (7.5%) |
| 35 to 39 Minutes | 2 (0.9%) | 3 (1.5%) |
| 40 to 44 Minutes | 14 (6.0%) | 7 (3.5%) |
| 45 to 59 Minutes | 45 (19.3%) | 64 (32.2%) |
| 60 to 89 Minutes | 85 (36.5%) | 54 (27.1%) |
| 90 or more Minutes | 8 (3.4%) | 5 (2.5%) |
Time of Departure to Work by Sex in Plandome Heights
The most frequent times of departure to work in Plandome Heights are 7:30 AM to 7:59 AM (39, 16.7%) for males and 8:00 AM to 8:29 AM (31, 15.6%) for females.
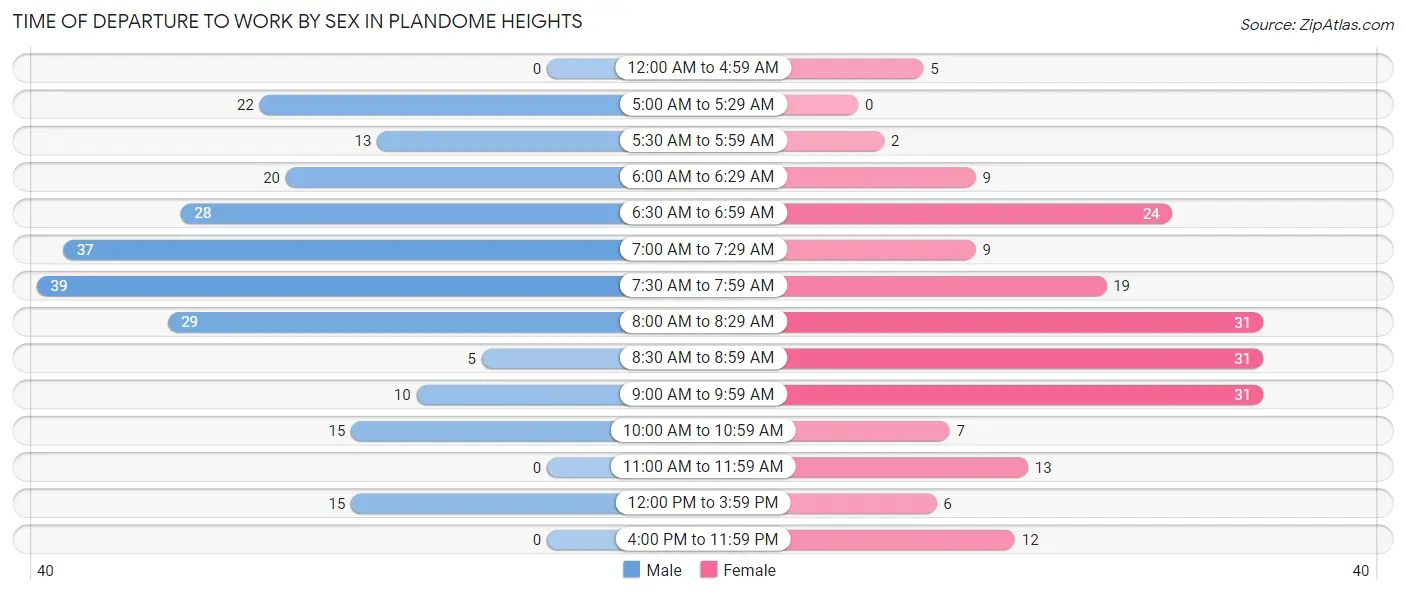
| Time of Departure | Male | Female |
| 12:00 AM to 4:59 AM | 0 (0.0%) | 5 (2.5%) |
| 5:00 AM to 5:29 AM | 22 (9.4%) | 0 (0.0%) |
| 5:30 AM to 5:59 AM | 13 (5.6%) | 2 (1.0%) |
| 6:00 AM to 6:29 AM | 20 (8.6%) | 9 (4.5%) |
| 6:30 AM to 6:59 AM | 28 (12.0%) | 24 (12.1%) |
| 7:00 AM to 7:29 AM | 37 (15.9%) | 9 (4.5%) |
| 7:30 AM to 7:59 AM | 39 (16.7%) | 19 (9.6%) |
| 8:00 AM to 8:29 AM | 29 (12.4%) | 31 (15.6%) |
| 8:30 AM to 8:59 AM | 5 (2.1%) | 31 (15.6%) |
| 9:00 AM to 9:59 AM | 10 (4.3%) | 31 (15.6%) |
| 10:00 AM to 10:59 AM | 15 (6.4%) | 7 (3.5%) |
| 11:00 AM to 11:59 AM | 0 (0.0%) | 13 (6.5%) |
| 12:00 PM to 3:59 PM | 15 (6.4%) | 6 (3.0%) |
| 4:00 PM to 11:59 PM | 0 (0.0%) | 12 (6.0%) |
| Total | 233 (100.0%) | 199 (100.0%) |
Housing Occupancy in Plandome Heights
Occupancy by Ownership in Plandome Heights
Of the total 309 dwellings in Plandome Heights, owner-occupied units account for 293 (94.8%), while renter-occupied units make up 16 (5.2%).
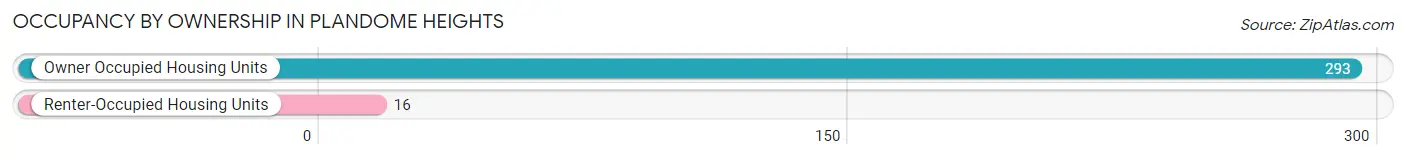
| Occupancy | # Housing Units | % Housing Units |
| Owner Occupied Housing Units | 293 | 94.8% |
| Renter-Occupied Housing Units | 16 | 5.2% |
| Total Occupied Housing Units | 309 | 100.0% |
Occupancy by Household Size in Plandome Heights
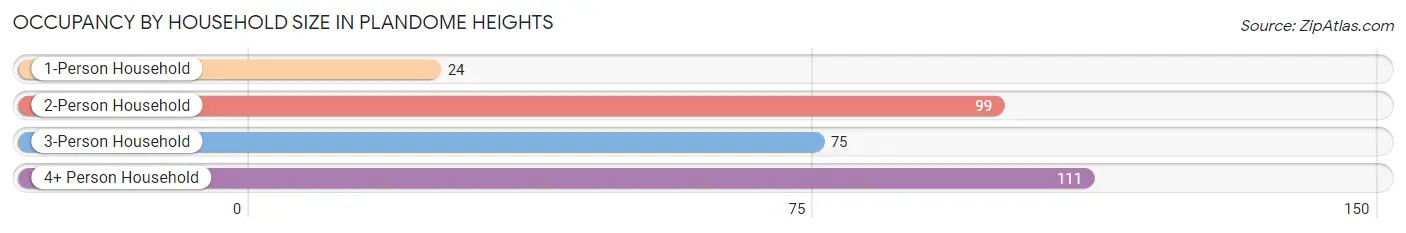
| Household Size | # Housing Units | % Housing Units |
| 1-Person Household | 24 | 7.8% |
| 2-Person Household | 99 | 32.0% |
| 3-Person Household | 75 | 24.3% |
| 4+ Person Household | 111 | 35.9% |
| Total Housing Units | 309 | 100.0% |
Occupancy by Ownership by Household Size in Plandome Heights
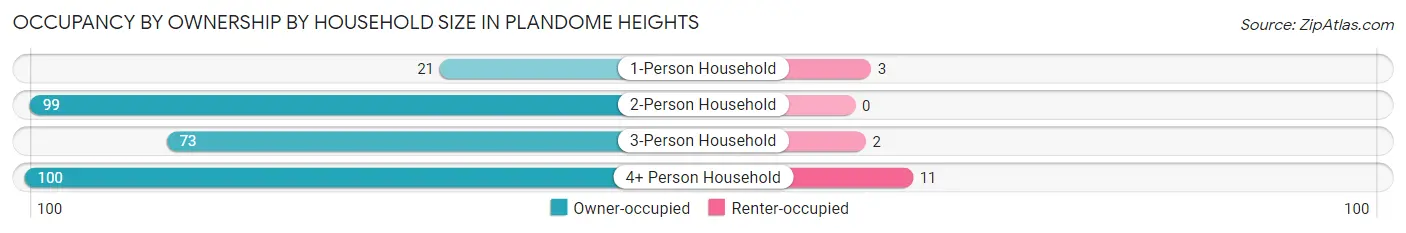
| Household Size | Owner-occupied | Renter-occupied |
| 1-Person Household | 21 (87.5%) | 3 (12.5%) |
| 2-Person Household | 99 (100.0%) | 0 (0.0%) |
| 3-Person Household | 73 (97.3%) | 2 (2.7%) |
| 4+ Person Household | 100 (90.1%) | 11 (9.9%) |
| Total Housing Units | 293 (94.8%) | 16 (5.2%) |
Occupancy by Educational Attainment in Plandome Heights
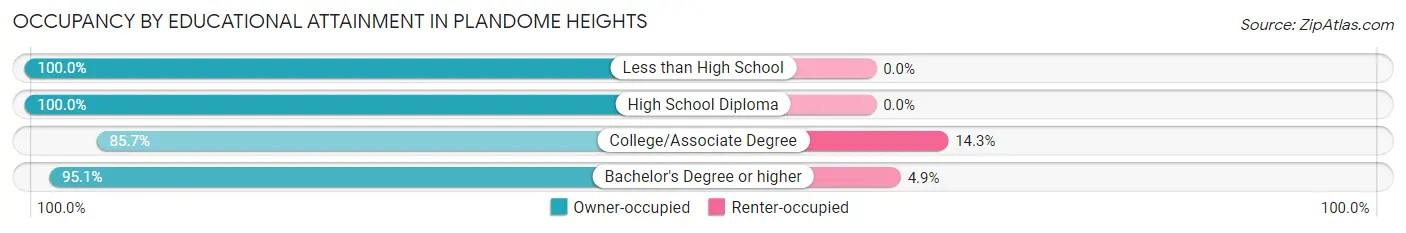
| Household Size | Owner-occupied | Renter-occupied |
| Less than High School | 6 (100.0%) | 0 (0.0%) |
| High School Diploma | 15 (100.0%) | 0 (0.0%) |
| College/Associate Degree | 18 (85.7%) | 3 (14.3%) |
| Bachelor's Degree or higher | 254 (95.1%) | 13 (4.9%) |
Occupancy by Age of Householder in Plandome Heights
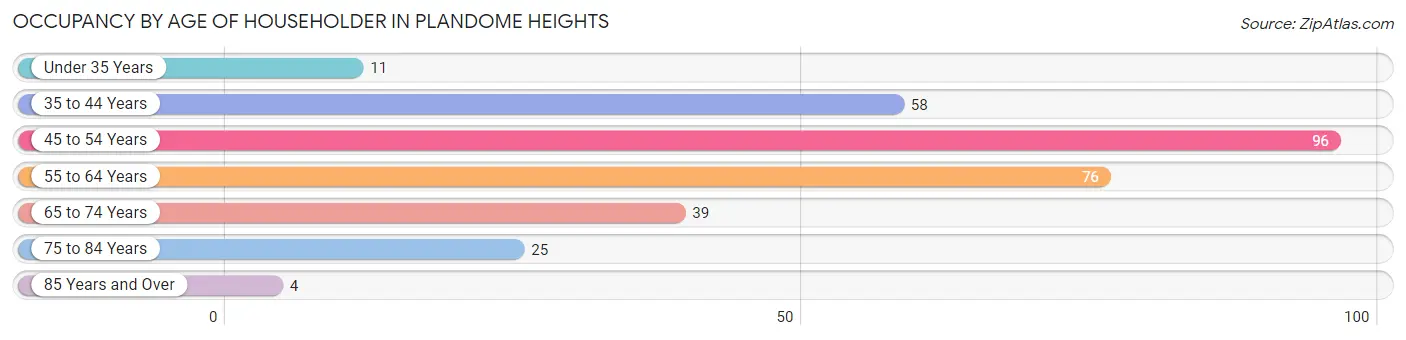
| Age Bracket | # Households | % Households |
| Under 35 Years | 11 | 3.6% |
| 35 to 44 Years | 58 | 18.8% |
| 45 to 54 Years | 96 | 31.1% |
| 55 to 64 Years | 76 | 24.6% |
| 65 to 74 Years | 39 | 12.6% |
| 75 to 84 Years | 25 | 8.1% |
| 85 Years and Over | 4 | 1.3% |
| Total | 309 | 100.0% |
Housing Finances in Plandome Heights
Median Income by Occupancy in Plandome Heights
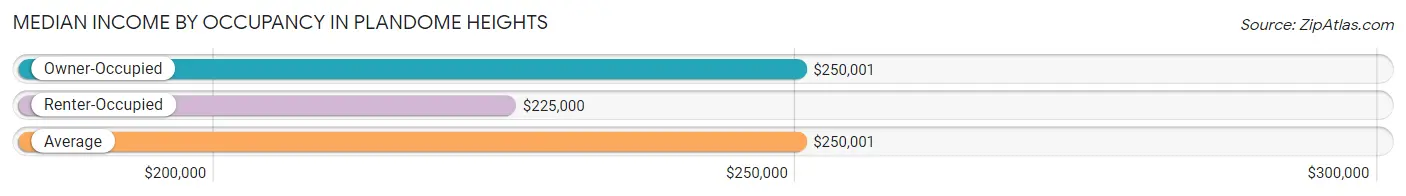
| Occupancy Type | # Households | Median Income |
| Owner-Occupied | 293 (94.8%) | $250,001 |
| Renter-Occupied | 16 (5.2%) | $225,000 |
| Average | 309 (100.0%) | $250,001 |
Occupancy by Householder Income Bracket in Plandome Heights
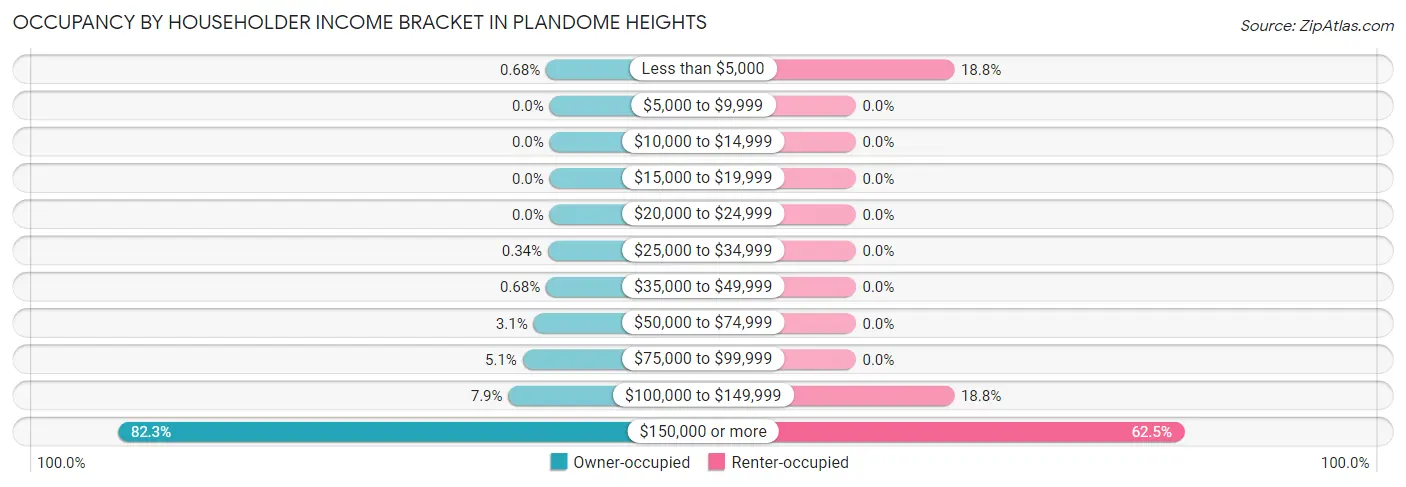
| Income Bracket | Owner-occupied | Renter-occupied |
| Less than $5,000 | 2 (0.7%) | 3 (18.8%) |
| $5,000 to $9,999 | 0 (0.0%) | 0 (0.0%) |
| $10,000 to $14,999 | 0 (0.0%) | 0 (0.0%) |
| $15,000 to $19,999 | 0 (0.0%) | 0 (0.0%) |
| $20,000 to $24,999 | 0 (0.0%) | 0 (0.0%) |
| $25,000 to $34,999 | 1 (0.3%) | 0 (0.0%) |
| $35,000 to $49,999 | 2 (0.7%) | 0 (0.0%) |
| $50,000 to $74,999 | 9 (3.1%) | 0 (0.0%) |
| $75,000 to $99,999 | 15 (5.1%) | 0 (0.0%) |
| $100,000 to $149,999 | 23 (7.9%) | 3 (18.8%) |
| $150,000 or more | 241 (82.3%) | 10 (62.5%) |
| Total | 293 (100.0%) | 16 (100.0%) |
Monthly Housing Cost Tiers in Plandome Heights
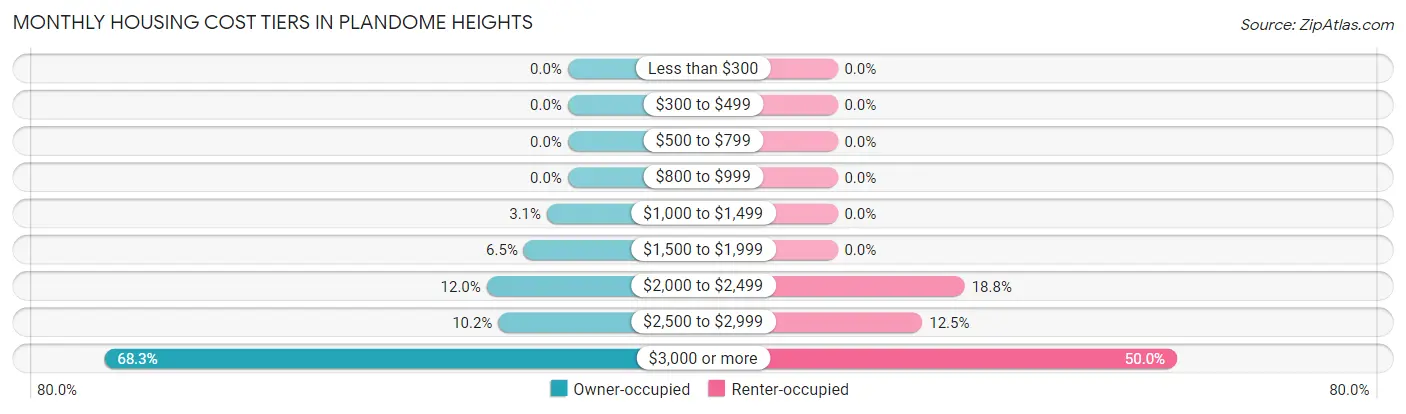
| Monthly Cost | Owner-occupied | Renter-occupied |
| Less than $300 | 0 (0.0%) | 0 (0.0%) |
| $300 to $499 | 0 (0.0%) | 0 (0.0%) |
| $500 to $799 | 0 (0.0%) | 0 (0.0%) |
| $800 to $999 | 0 (0.0%) | 0 (0.0%) |
| $1,000 to $1,499 | 9 (3.1%) | 0 (0.0%) |
| $1,500 to $1,999 | 19 (6.5%) | 0 (0.0%) |
| $2,000 to $2,499 | 35 (11.9%) | 3 (18.8%) |
| $2,500 to $2,999 | 30 (10.2%) | 2 (12.5%) |
| $3,000 or more | 200 (68.3%) | 8 (50.0%) |
| Total | 293 (100.0%) | 16 (100.0%) |
Physical Housing Characteristics in Plandome Heights
Housing Structures in Plandome Heights
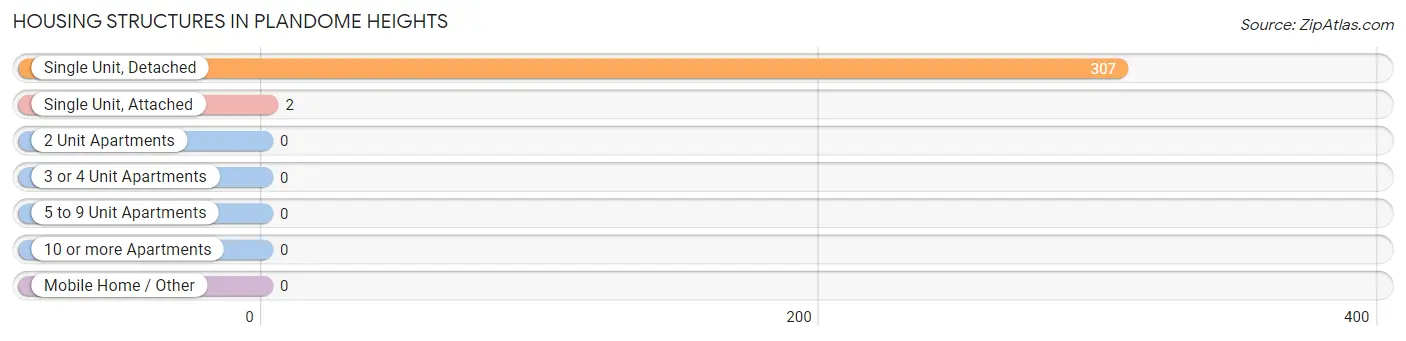
| Structure Type | # Housing Units | % Housing Units |
| Single Unit, Detached | 307 | 99.4% |
| Single Unit, Attached | 2 | 0.6% |
| 2 Unit Apartments | 0 | 0.0% |
| 3 or 4 Unit Apartments | 0 | 0.0% |
| 5 to 9 Unit Apartments | 0 | 0.0% |
| 10 or more Apartments | 0 | 0.0% |
| Mobile Home / Other | 0 | 0.0% |
| Total | 309 | 100.0% |
Housing Structures by Occupancy in Plandome Heights
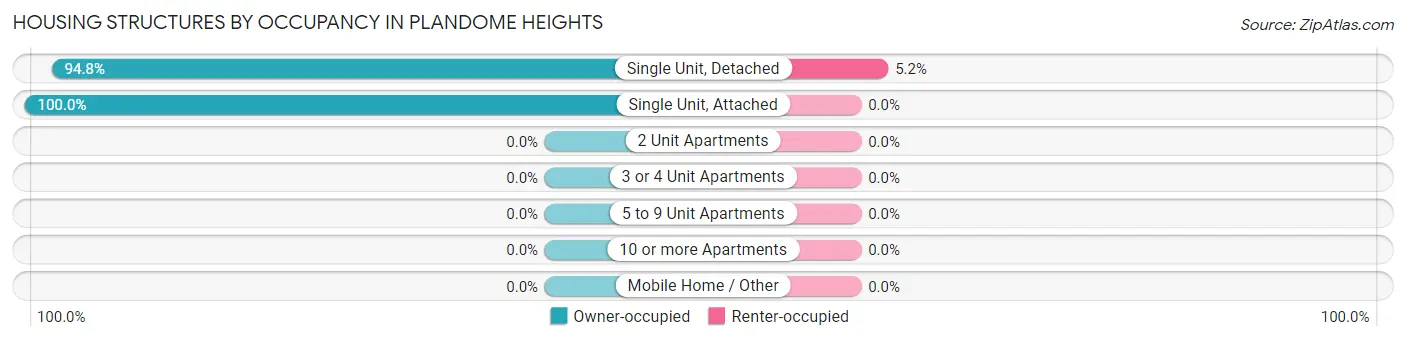
| Structure Type | Owner-occupied | Renter-occupied |
| Single Unit, Detached | 291 (94.8%) | 16 (5.2%) |
| Single Unit, Attached | 2 (100.0%) | 0 (0.0%) |
| 2 Unit Apartments | 0 (0.0%) | 0 (0.0%) |
| 3 or 4 Unit Apartments | 0 (0.0%) | 0 (0.0%) |
| 5 to 9 Unit Apartments | 0 (0.0%) | 0 (0.0%) |
| 10 or more Apartments | 0 (0.0%) | 0 (0.0%) |
| Mobile Home / Other | 0 (0.0%) | 0 (0.0%) |
| Total | 293 (94.8%) | 16 (5.2%) |
Housing Structures by Number of Rooms in Plandome Heights
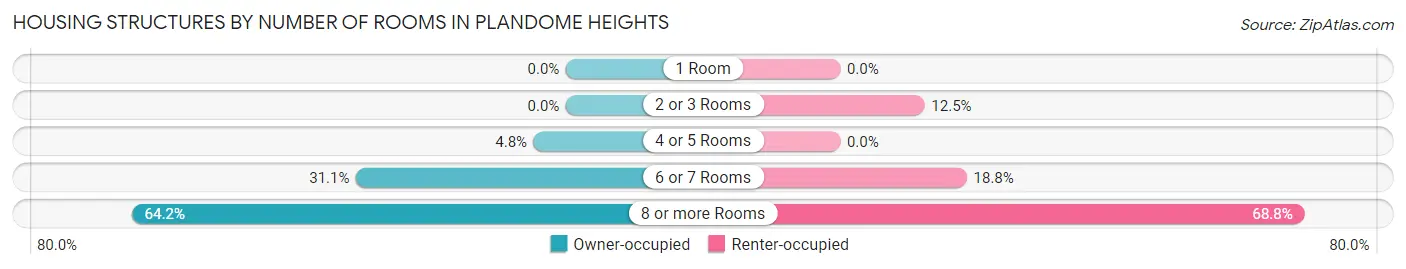
| Number of Rooms | Owner-occupied | Renter-occupied |
| 1 Room | 0 (0.0%) | 0 (0.0%) |
| 2 or 3 Rooms | 0 (0.0%) | 2 (12.5%) |
| 4 or 5 Rooms | 14 (4.8%) | 0 (0.0%) |
| 6 or 7 Rooms | 91 (31.1%) | 3 (18.8%) |
| 8 or more Rooms | 188 (64.2%) | 11 (68.8%) |
| Total | 293 (100.0%) | 16 (100.0%) |
Housing Structure by Heating Type in Plandome Heights
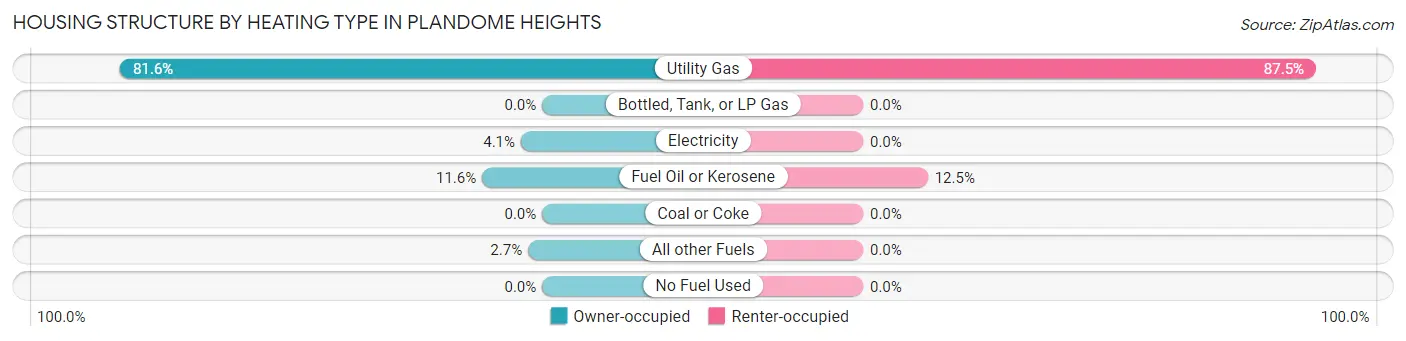
| Heating Type | Owner-occupied | Renter-occupied |
| Utility Gas | 239 (81.6%) | 14 (87.5%) |
| Bottled, Tank, or LP Gas | 0 (0.0%) | 0 (0.0%) |
| Electricity | 12 (4.1%) | 0 (0.0%) |
| Fuel Oil or Kerosene | 34 (11.6%) | 2 (12.5%) |
| Coal or Coke | 0 (0.0%) | 0 (0.0%) |
| All other Fuels | 8 (2.7%) | 0 (0.0%) |
| No Fuel Used | 0 (0.0%) | 0 (0.0%) |
| Total | 293 (100.0%) | 16 (100.0%) |
Household Vehicle Usage in Plandome Heights
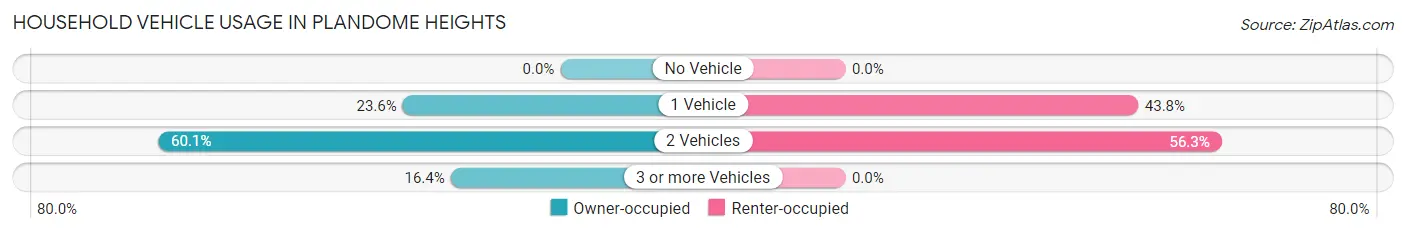
| Vehicles per Household | Owner-occupied | Renter-occupied |
| No Vehicle | 0 (0.0%) | 0 (0.0%) |
| 1 Vehicle | 69 (23.5%) | 7 (43.8%) |
| 2 Vehicles | 176 (60.1%) | 9 (56.2%) |
| 3 or more Vehicles | 48 (16.4%) | 0 (0.0%) |
| Total | 293 (100.0%) | 16 (100.0%) |
Real Estate & Mortgages in Plandome Heights
Real Estate and Mortgage Overview in Plandome Heights
| Characteristic | Without Mortgage | With Mortgage |
| Housing Units | 106 | 187 |
| Median Property Value | $1,312,500 | $1,619,700 |
| Median Household Income | $233,333 | $162 |
| Monthly Housing Costs | $1,501 | $179 |
| Real Estate Taxes | $10,001 | $0 |
Property Value by Mortgage Status in Plandome Heights
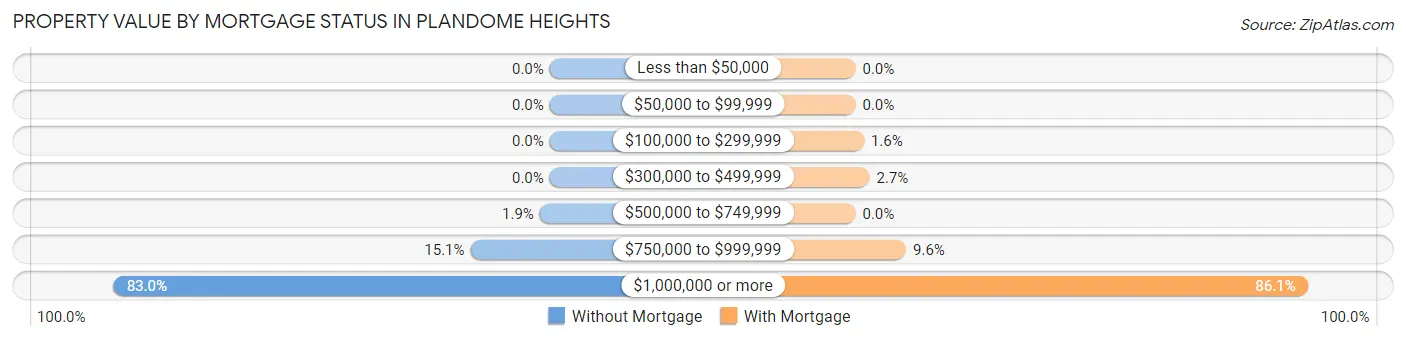
| Property Value | Without Mortgage | With Mortgage |
| Less than $50,000 | 0 (0.0%) | 0 (0.0%) |
| $50,000 to $99,999 | 0 (0.0%) | 0 (0.0%) |
| $100,000 to $299,999 | 0 (0.0%) | 3 (1.6%) |
| $300,000 to $499,999 | 0 (0.0%) | 5 (2.7%) |
| $500,000 to $749,999 | 2 (1.9%) | 0 (0.0%) |
| $750,000 to $999,999 | 16 (15.1%) | 18 (9.6%) |
| $1,000,000 or more | 88 (83.0%) | 161 (86.1%) |
| Total | 106 (100.0%) | 187 (100.0%) |
Household Income by Mortgage Status in Plandome Heights
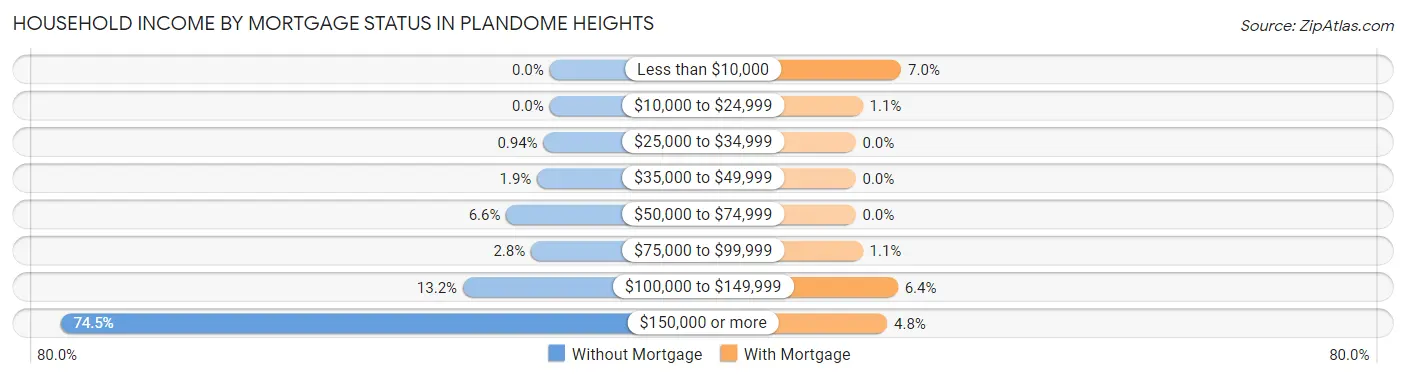
| Household Income | Without Mortgage | With Mortgage |
| Less than $10,000 | 0 (0.0%) | 13 (7.0%) |
| $10,000 to $24,999 | 0 (0.0%) | 2 (1.1%) |
| $25,000 to $34,999 | 1 (0.9%) | 0 (0.0%) |
| $35,000 to $49,999 | 2 (1.9%) | 0 (0.0%) |
| $50,000 to $74,999 | 7 (6.6%) | 0 (0.0%) |
| $75,000 to $99,999 | 3 (2.8%) | 2 (1.1%) |
| $100,000 to $149,999 | 14 (13.2%) | 12 (6.4%) |
| $150,000 or more | 79 (74.5%) | 9 (4.8%) |
| Total | 106 (100.0%) | 187 (100.0%) |
Property Value to Household Income Ratio in Plandome Heights
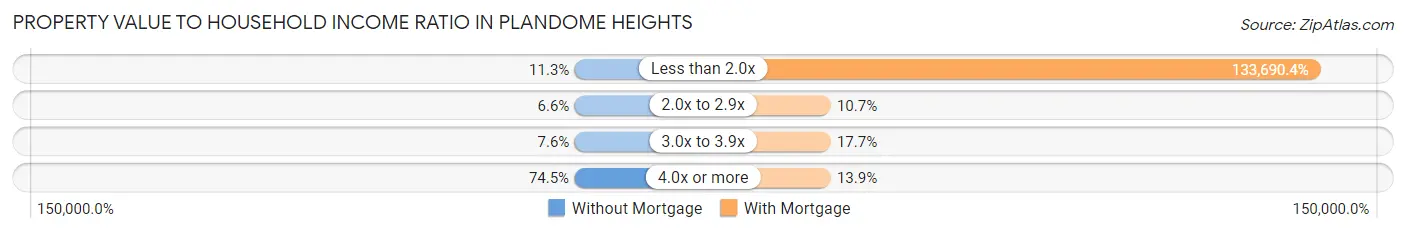
| Value-to-Income Ratio | Without Mortgage | With Mortgage |
| Less than 2.0x | 12 (11.3%) | 250,001 (133,690.4%) |
| 2.0x to 2.9x | 7 (6.6%) | 20 (10.7%) |
| 3.0x to 3.9x | 8 (7.5%) | 33 (17.6%) |
| 4.0x or more | 79 (74.5%) | 26 (13.9%) |
| Total | 106 (100.0%) | 187 (100.0%) |
Real Estate Taxes by Mortgage Status in Plandome Heights
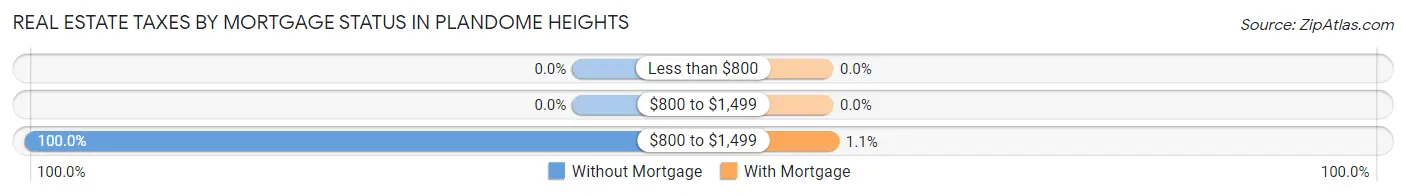
| Property Taxes | Without Mortgage | With Mortgage |
| Less than $800 | 0 (0.0%) | 0 (0.0%) |
| $800 to $1,499 | 0 (0.0%) | 0 (0.0%) |
| $800 to $1,499 | 106 (100.0%) | 2 (1.1%) |
| Total | 106 (100.0%) | 187 (100.0%) |
Health & Disability in Plandome Heights
Health Insurance Coverage by Age in Plandome Heights
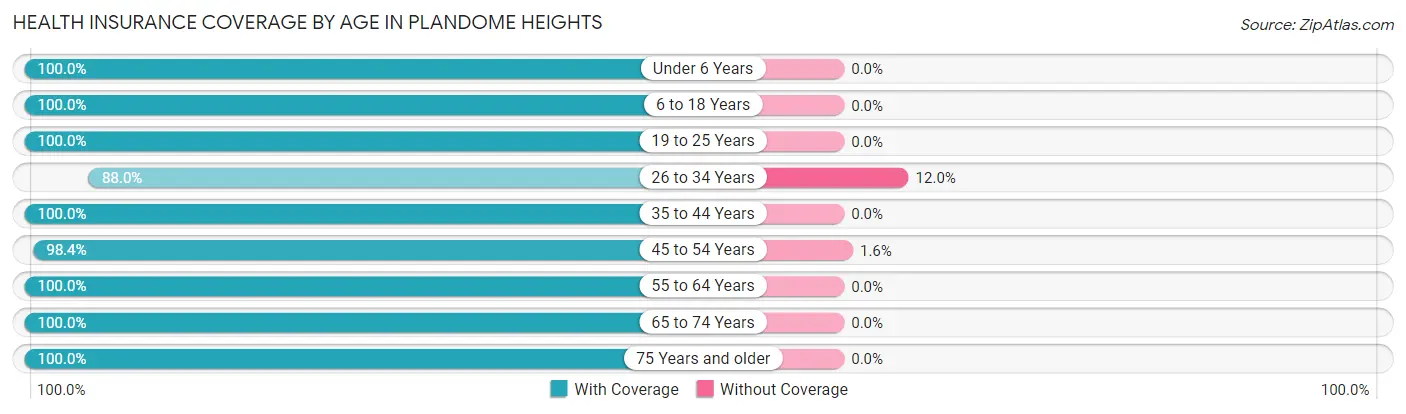
| Age Bracket | With Coverage | Without Coverage |
| Under 6 Years | 69 (100.0%) | 0 (0.0%) |
| 6 to 18 Years | 180 (100.0%) | 0 (0.0%) |
| 19 to 25 Years | 67 (100.0%) | 0 (0.0%) |
| 26 to 34 Years | 44 (88.0%) | 6 (12.0%) |
| 35 to 44 Years | 122 (100.0%) | 0 (0.0%) |
| 45 to 54 Years | 181 (98.4%) | 3 (1.6%) |
| 55 to 64 Years | 146 (100.0%) | 0 (0.0%) |
| 65 to 74 Years | 71 (100.0%) | 0 (0.0%) |
| 75 Years and older | 49 (100.0%) | 0 (0.0%) |
| Total | 929 (99.0%) | 9 (1.0%) |
Health Insurance Coverage by Citizenship Status in Plandome Heights
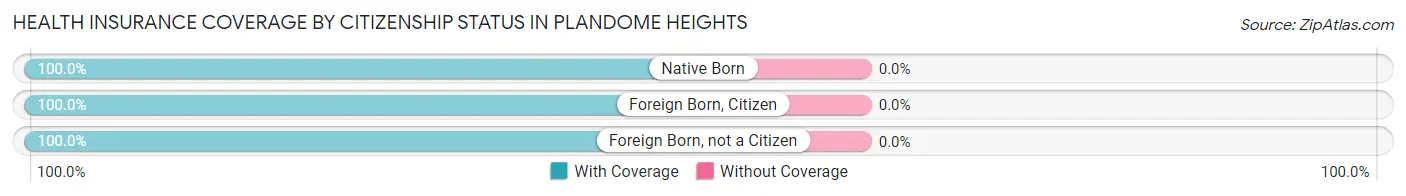
| Citizenship Status | With Coverage | Without Coverage |
| Native Born | 69 (100.0%) | 0 (0.0%) |
| Foreign Born, Citizen | 180 (100.0%) | 0 (0.0%) |
| Foreign Born, not a Citizen | 67 (100.0%) | 0 (0.0%) |
Health Insurance Coverage by Household Income in Plandome Heights
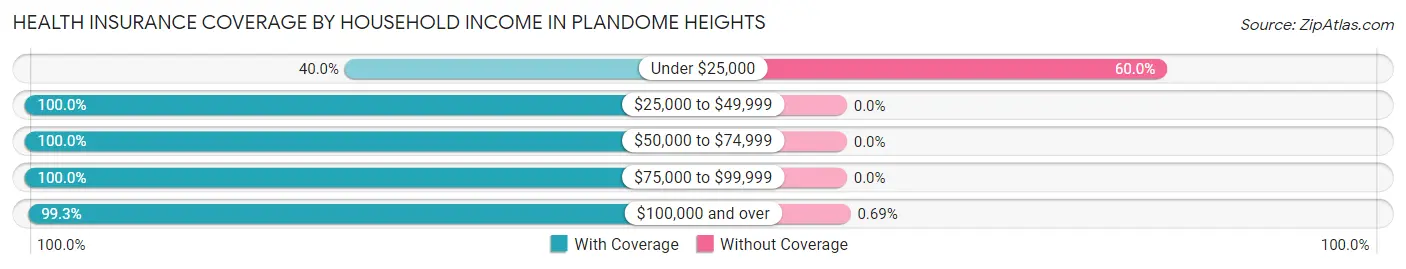
| Household Income | With Coverage | Without Coverage |
| Under $25,000 | 2 (40.0%) | 3 (60.0%) |
| $25,000 to $49,999 | 3 (100.0%) | 0 (0.0%) |
| $50,000 to $74,999 | 26 (100.0%) | 0 (0.0%) |
| $75,000 to $99,999 | 29 (100.0%) | 0 (0.0%) |
| $100,000 and over | 869 (99.3%) | 6 (0.7%) |
Public vs Private Health Insurance Coverage by Age in Plandome Heights
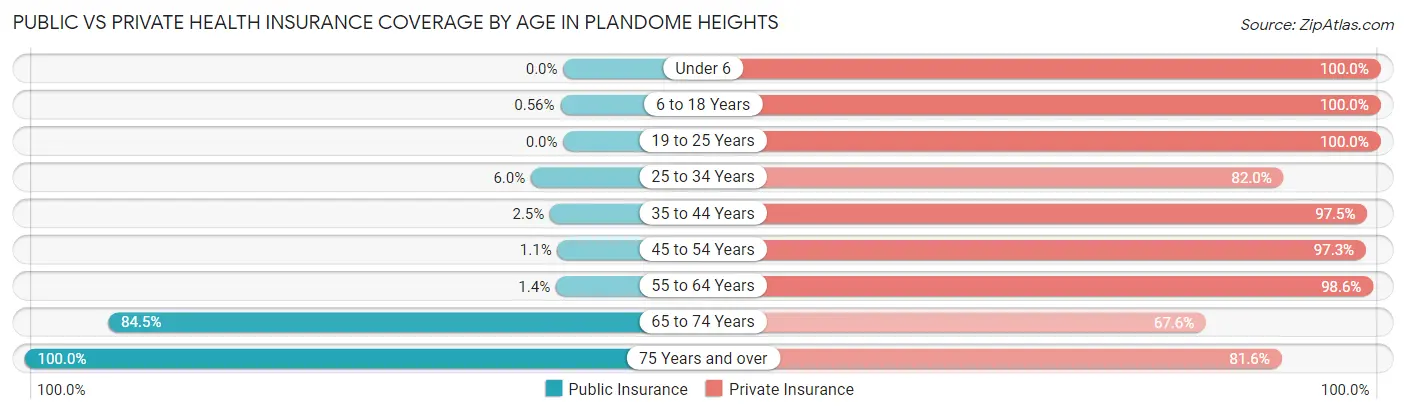
| Age Bracket | Public Insurance | Private Insurance |
| Under 6 | 0 (0.0%) | 69 (100.0%) |
| 6 to 18 Years | 1 (0.6%) | 180 (100.0%) |
| 19 to 25 Years | 0 (0.0%) | 67 (100.0%) |
| 25 to 34 Years | 3 (6.0%) | 41 (82.0%) |
| 35 to 44 Years | 3 (2.5%) | 119 (97.5%) |
| 45 to 54 Years | 2 (1.1%) | 179 (97.3%) |
| 55 to 64 Years | 2 (1.4%) | 144 (98.6%) |
| 65 to 74 Years | 60 (84.5%) | 48 (67.6%) |
| 75 Years and over | 49 (100.0%) | 40 (81.6%) |
| Total | 120 (12.8%) | 887 (94.6%) |
Disability Status by Sex by Age in Plandome Heights
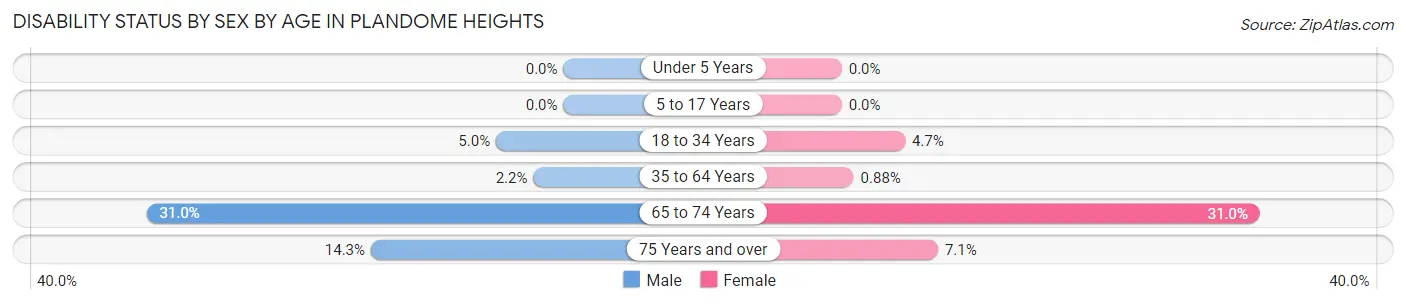
| Age Bracket | Male | Female |
| Under 5 Years | 0 (0.0%) | 0 (0.0%) |
| 5 to 17 Years | 0 (0.0%) | 0 (0.0%) |
| 18 to 34 Years | 3 (5.0%) | 3 (4.7%) |
| 35 to 64 Years | 5 (2.2%) | 2 (0.9%) |
| 65 to 74 Years | 13 (30.9%) | 9 (31.0%) |
| 75 Years and over | 3 (14.3%) | 2 (7.1%) |
Disability Class by Sex by Age in Plandome Heights
Disability Class: Hearing Difficulty
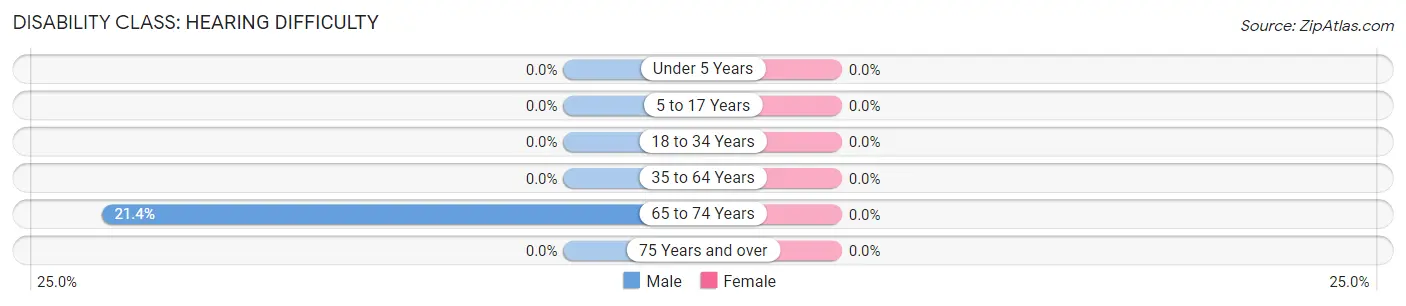
| Age Bracket | Male | Female |
| Under 5 Years | 0 (0.0%) | 0 (0.0%) |
| 5 to 17 Years | 0 (0.0%) | 0 (0.0%) |
| 18 to 34 Years | 0 (0.0%) | 0 (0.0%) |
| 35 to 64 Years | 0 (0.0%) | 0 (0.0%) |
| 65 to 74 Years | 9 (21.4%) | 0 (0.0%) |
| 75 Years and over | 0 (0.0%) | 0 (0.0%) |
Disability Class: Vision Difficulty
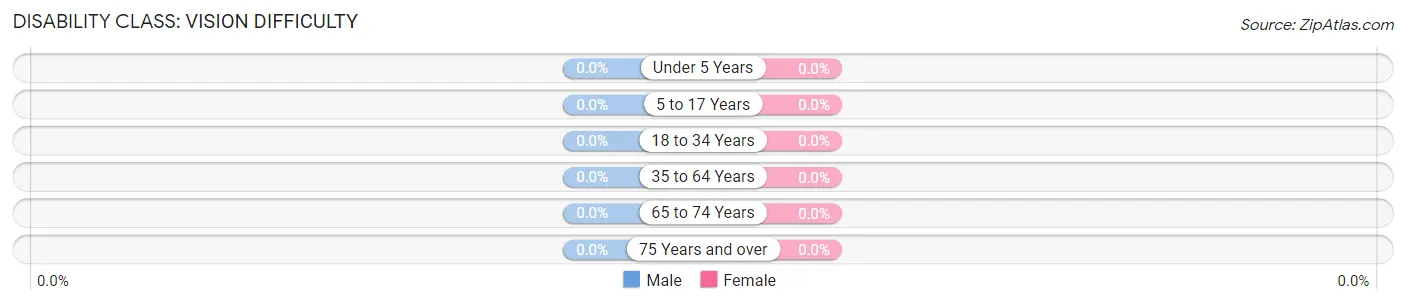
| Age Bracket | Male | Female |
| Under 5 Years | 0 (0.0%) | 0 (0.0%) |
| 5 to 17 Years | 0 (0.0%) | 0 (0.0%) |
| 18 to 34 Years | 0 (0.0%) | 0 (0.0%) |
| 35 to 64 Years | 0 (0.0%) | 0 (0.0%) |
| 65 to 74 Years | 0 (0.0%) | 0 (0.0%) |
| 75 Years and over | 0 (0.0%) | 0 (0.0%) |
Disability Class: Cognitive Difficulty
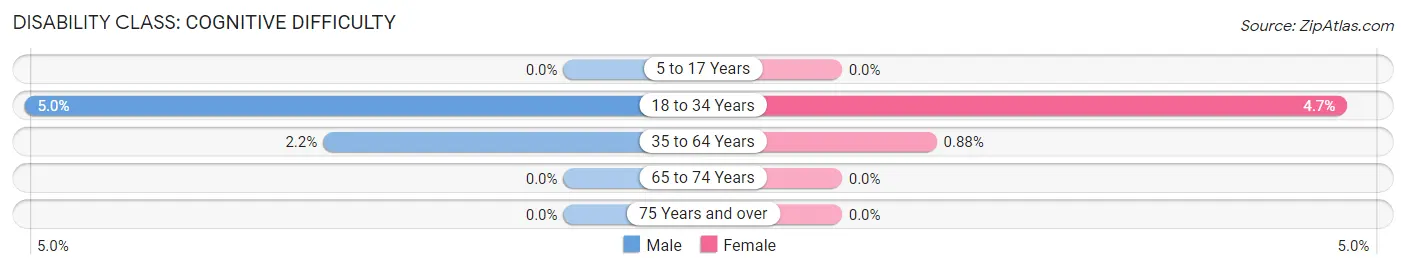
| Age Bracket | Male | Female |
| 5 to 17 Years | 0 (0.0%) | 0 (0.0%) |
| 18 to 34 Years | 3 (5.0%) | 3 (4.7%) |
| 35 to 64 Years | 5 (2.2%) | 2 (0.9%) |
| 65 to 74 Years | 0 (0.0%) | 0 (0.0%) |
| 75 Years and over | 0 (0.0%) | 0 (0.0%) |
Disability Class: Ambulatory Difficulty
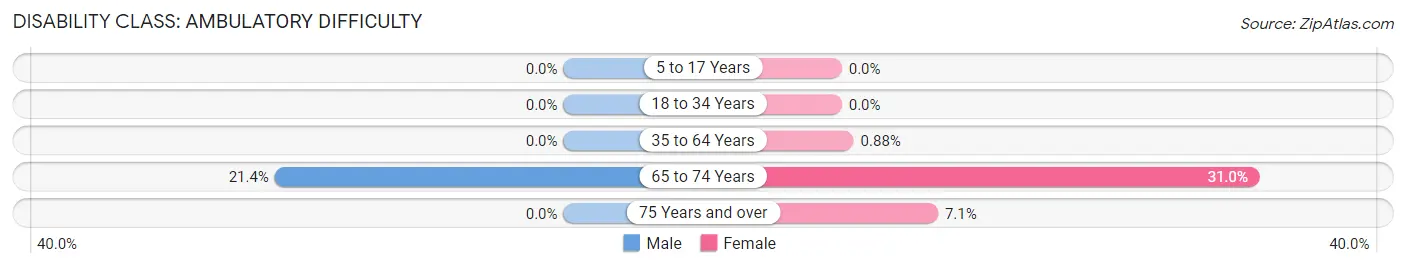
| Age Bracket | Male | Female |
| 5 to 17 Years | 0 (0.0%) | 0 (0.0%) |
| 18 to 34 Years | 0 (0.0%) | 0 (0.0%) |
| 35 to 64 Years | 0 (0.0%) | 2 (0.9%) |
| 65 to 74 Years | 9 (21.4%) | 9 (31.0%) |
| 75 Years and over | 0 (0.0%) | 2 (7.1%) |
Disability Class: Self-Care Difficulty
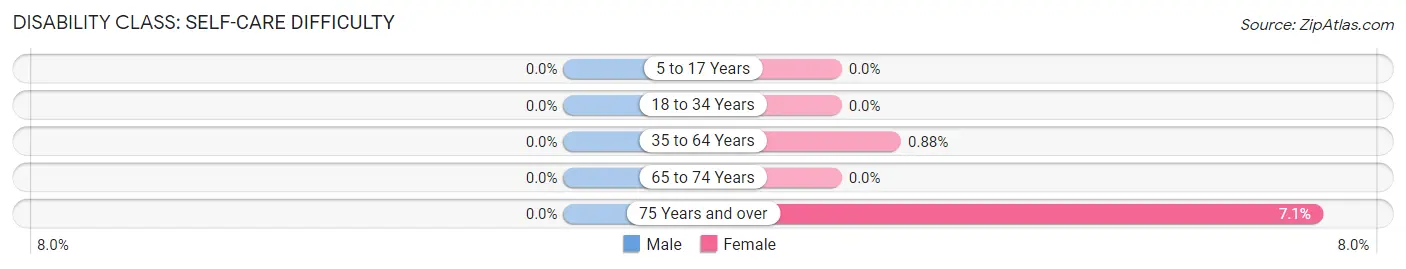
| Age Bracket | Male | Female |
| 5 to 17 Years | 0 (0.0%) | 0 (0.0%) |
| 18 to 34 Years | 0 (0.0%) | 0 (0.0%) |
| 35 to 64 Years | 0 (0.0%) | 2 (0.9%) |
| 65 to 74 Years | 0 (0.0%) | 0 (0.0%) |
| 75 Years and over | 0 (0.0%) | 2 (7.1%) |
Technology Access in Plandome Heights
Computing Device Access in Plandome Heights
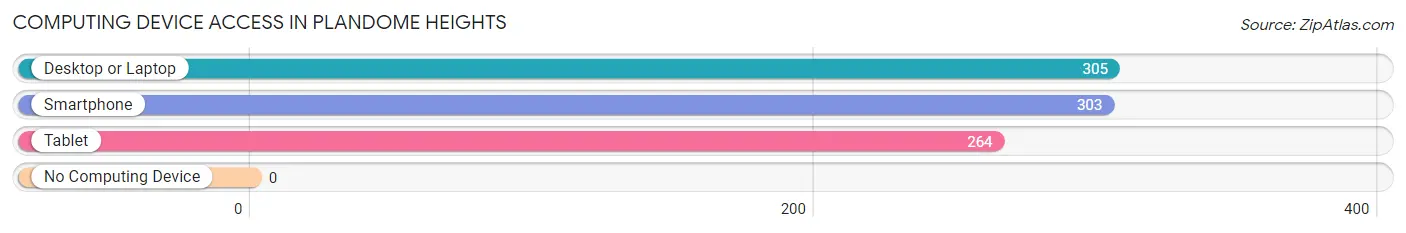
| Device Type | # Households | % Households |
| Desktop or Laptop | 305 | 98.7% |
| Smartphone | 303 | 98.1% |
| Tablet | 264 | 85.4% |
| No Computing Device | 0 | 0.0% |
| Total | 309 | 100.0% |
Internet Access in Plandome Heights
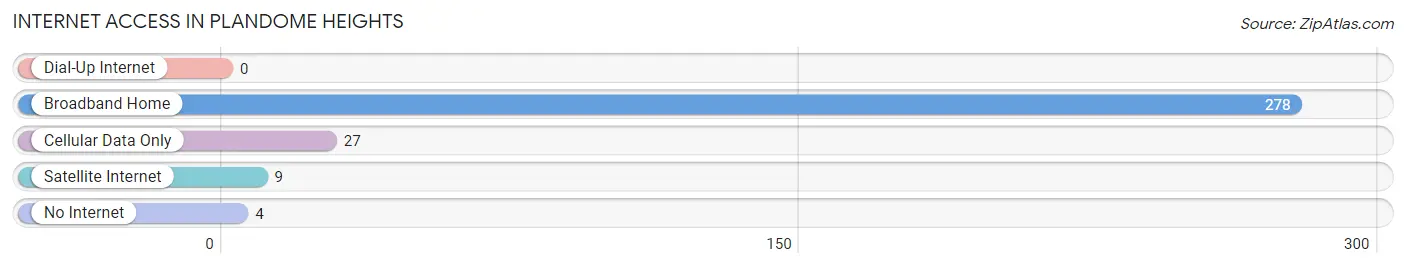
| Internet Type | # Households | % Households |
| Dial-Up Internet | 0 | 0.0% |
| Broadband Home | 278 | 90.0% |
| Cellular Data Only | 27 | 8.7% |
| Satellite Internet | 9 | 2.9% |
| No Internet | 4 | 1.3% |
| Total | 309 | 100.0% |
Plandome Heights Summary
Plandome Heights is a village located in Nassau County, New York, United States. The village is located within the Town of North Hempstead and is part of the Greater New York City metropolitan area. As of the 2010 census, the village had a population of 1,845.
Geography
Plandome Heights is located at 40°50'25" North, 73°41'17" West (40.840278, -73.688056). The village is situated on the north shore of Long Island, approximately 25 miles east of Manhattan. It is bordered by the villages of Plandome Manor and Munsey Park to the east, and the hamlet of Manhasset to the west.
The village is located on a ridge of glacial moraine, which rises to a height of approximately 100 feet above sea level. The terrain is generally hilly, with steep slopes on the east and west sides of the village. The highest point in the village is located at the intersection of Plandome Road and Plandome Heights Road, which is approximately 120 feet above sea level.
The village is located within the Town of North Hempstead, which is part of Nassau County. The village is served by the Port Washington Branch of the Long Island Rail Road, which provides service to Manhattan and other points in Nassau County.
History
The area that is now Plandome Heights was originally inhabited by the Matinecock Native American tribe. The first European settlers arrived in the area in the late 17th century, and the area was part of the Town of North Hempstead.
In 1873, the village of Plandome Heights was incorporated. The village was named after the nearby hamlet of Plandome, which was named after the Dutch word for “plain”.
The village grew slowly in the late 19th and early 20th centuries, and by the 1950s, the population had reached 1,000. The village experienced a period of rapid growth in the 1960s and 1970s, and by the 1980s, the population had reached 1,800.
Economy
The economy of Plandome Heights is largely based on the service sector. The village is home to a number of small businesses, including restaurants, retail stores, and professional services. The village is also home to a number of corporate offices, including those of the North Shore-Long Island Jewish Health System and the North Shore-LIJ Medical Group.
Demographics
As of the 2010 census, the village had a population of 1,845. The racial makeup of the village was 87.3% White, 4.2% Asian, 3.2% African American, 0.7% Native American, and 4.6% from other races. Hispanic or Latino of any race were 8.2% of the population.
The median household income in the village was $125,000, and the median family income was $150,000. The per capita income was $60,000. About 4.2% of families and 5.2% of the population were below the poverty line.
The village is served by the Port Washington Union Free School District. The village is also home to the Plandome Heights Public Library, which is part of the Nassau Library System.
Common Questions
What is Per Capita Income in Plandome Heights?
Per Capita income in Plandome Heights is $136,246.
What is the Median Family Income in Plandome Heights?
Median Family Income in Plandome Heights is $250,001.
What is the Median Household income in Plandome Heights?
Median Household Income in Plandome Heights is $250,001.
What is Income or Wage Gap in Plandome Heights?
Income or Wage Gap in Plandome Heights is 54.1%.
Women in Plandome Heights earn 45.9 cents for every dollar earned by a man.
What is Inequality or Gini Index in Plandome Heights?
Inequality or Gini Index in Plandome Heights is 0.43.
What is the Total Population of Plandome Heights?
Total Population of Plandome Heights is 938.
What is the Total Male Population of Plandome Heights?
Total Male Population of Plandome Heights is 465.
What is the Total Female Population of Plandome Heights?
Total Female Population of Plandome Heights is 473.
What is the Ratio of Males per 100 Females in Plandome Heights?
There are 98.31 Males per 100 Females in Plandome Heights.
What is the Ratio of Females per 100 Males in Plandome Heights?
There are 101.72 Females per 100 Males in Plandome Heights.
What is the Median Population Age in Plandome Heights?
Median Population Age in Plandome Heights is 42.8 Years.
What is the Average Family Size in Plandome Heights
Average Family Size in Plandome Heights is 3.2 People.
What is the Average Household Size in Plandome Heights
Average Household Size in Plandome Heights is 3.0 People.
How Large is the Labor Force in Plandome Heights?
There are 520 People in the Labor Forcein in Plandome Heights.
What is the Percentage of People in the Labor Force in Plandome Heights?
72.1% of People are in the Labor Force in Plandome Heights.
What is the Unemployment Rate in Plandome Heights?
Unemployment Rate in Plandome Heights is 1.7%.