Tuxedo Park, NY Map & Demographics
Tuxedo Park Map
Tuxedo Park Overview
$340,699
PER CAPITA INCOME
$250,001
AVG FAMILY INCOME
$250,001
AVG HOUSEHOLD INCOME
69.4%
WAGE / INCOME GAP [ % ]
30.6¢/ $1
WAGE / INCOME GAP [ $ ]
0.47
INEQUALITY / GINI INDEX
700
TOTAL POPULATION
421
MALE POPULATION
279
FEMALE POPULATION
150.90
MALES / 100 FEMALES
66.27
FEMALES / 100 MALES
52.0
MEDIAN AGE
2.0
AVG FAMILY SIZE
1.8
AVG HOUSEHOLD SIZE
400
LABOR FORCE [ PEOPLE ]
63.5%
PERCENT IN LABOR FORCE
1.8%
UNEMPLOYMENT RATE
Tuxedo Park Zip Codes
Tuxedo Park Area Codes
Income in Tuxedo Park
Income Overview in Tuxedo Park
Per Capita Income in Tuxedo Park is $340,699, while median incomes of families and households are $250,001 and $250,001 respectively.
| Characteristic | Number | Measure |
| Per Capita Income | 700 | $340,699 |
| Median Family Income | 282 | $250,001 |
| Mean Family Income | 282 | $714,539 |
| Median Household Income | 395 | $250,001 |
| Mean Household Income | 395 | $600,705 |
| Income Deficit | 282 | $0 |
| Wage / Income Gap (%) | 700 | 69.43% |
| Wage / Income Gap ($) | 700 | 30.57¢ per $1 |
| Gini / Inequality Index | 700 | 0.47 |
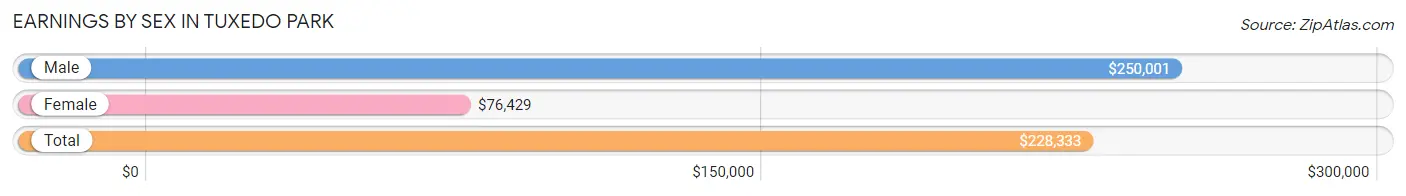
Earnings by Sex in Tuxedo Park
Average Earnings in Tuxedo Park are $228,333, $250,001 for men and $76,429 for women, a difference of 69.4%.
| Sex | Number | Average Earnings |
| Male | 318 (76.1%) | $250,001 |
| Female | 100 (23.9%) | $76,429 |
| Total | 418 (100.0%) | $228,333 |
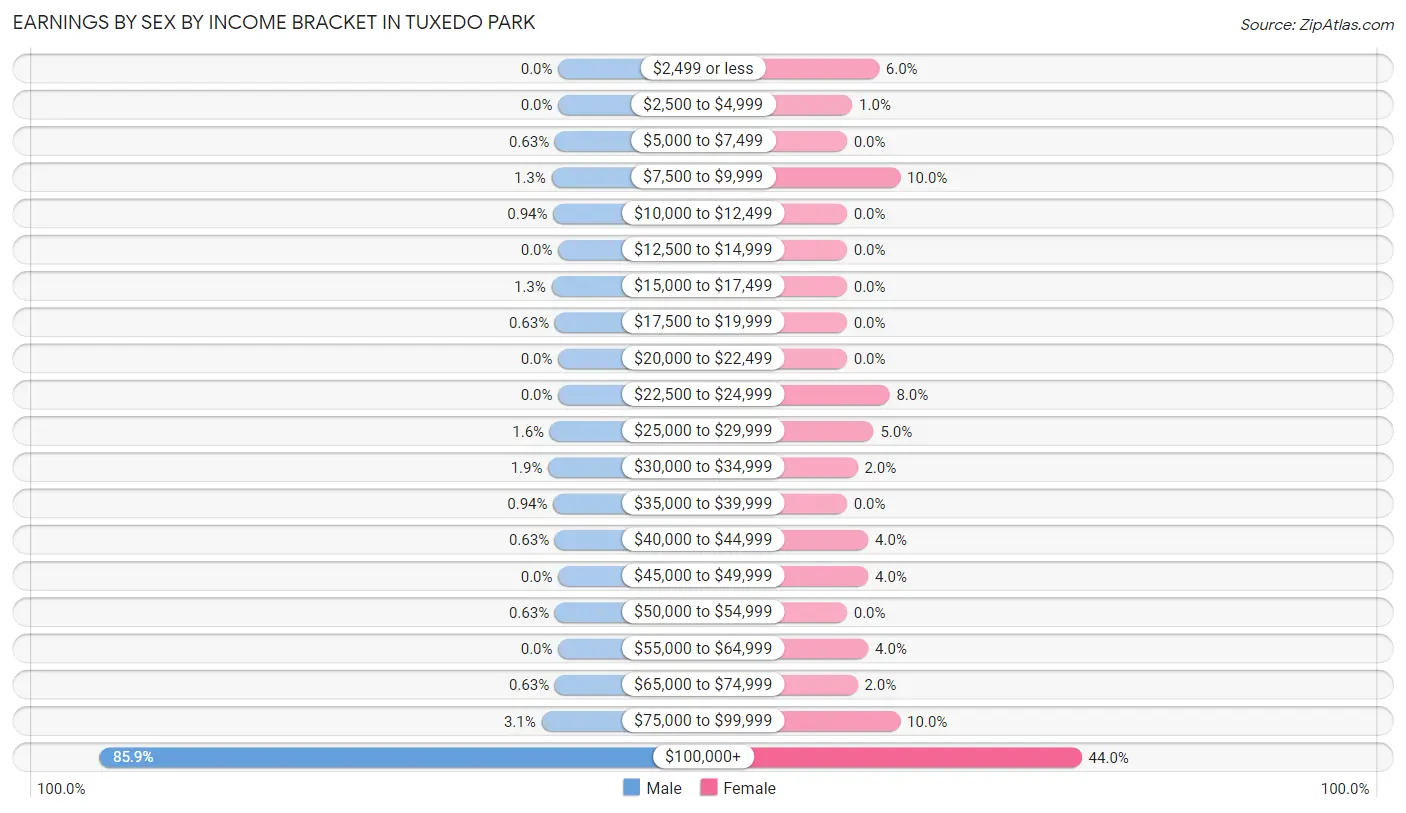
Earnings by Sex by Income Bracket in Tuxedo Park
The most common earnings brackets in Tuxedo Park are $100,000+ for men (273 | 85.9%) and $100,000+ for women (44 | 44.0%).
| Income | Male | Female |
| $2,499 or less | 0 (0.0%) | 6 (6.0%) |
| $2,500 to $4,999 | 0 (0.0%) | 1 (1.0%) |
| $5,000 to $7,499 | 2 (0.6%) | 0 (0.0%) |
| $7,500 to $9,999 | 4 (1.3%) | 10 (10.0%) |
| $10,000 to $12,499 | 3 (0.9%) | 0 (0.0%) |
| $12,500 to $14,999 | 0 (0.0%) | 0 (0.0%) |
| $15,000 to $17,499 | 4 (1.3%) | 0 (0.0%) |
| $17,500 to $19,999 | 2 (0.6%) | 0 (0.0%) |
| $20,000 to $22,499 | 0 (0.0%) | 0 (0.0%) |
| $22,500 to $24,999 | 0 (0.0%) | 8 (8.0%) |
| $25,000 to $29,999 | 5 (1.6%) | 5 (5.0%) |
| $30,000 to $34,999 | 6 (1.9%) | 2 (2.0%) |
| $35,000 to $39,999 | 3 (0.9%) | 0 (0.0%) |
| $40,000 to $44,999 | 2 (0.6%) | 4 (4.0%) |
| $45,000 to $49,999 | 0 (0.0%) | 4 (4.0%) |
| $50,000 to $54,999 | 2 (0.6%) | 0 (0.0%) |
| $55,000 to $64,999 | 0 (0.0%) | 4 (4.0%) |
| $65,000 to $74,999 | 2 (0.6%) | 2 (2.0%) |
| $75,000 to $99,999 | 10 (3.1%) | 10 (10.0%) |
| $100,000+ | 273 (85.9%) | 44 (44.0%) |
| Total | 318 (100.0%) | 100 (100.0%) |
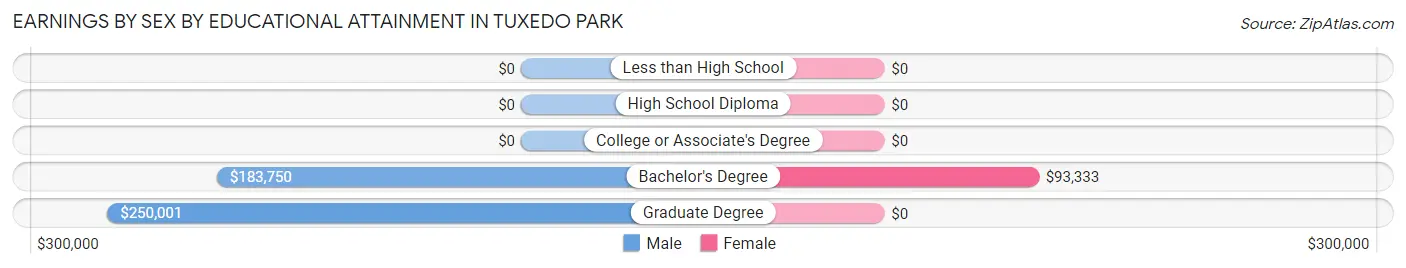
Earnings by Sex by Educational Attainment in Tuxedo Park
Average earnings in Tuxedo Park are $250,001 for men and $77,143 for women, a difference of 69.1%. Men with an educational attainment of graduate degree enjoy the highest average annual earnings of $250,001, while those with bachelor's degree education earn the least with $183,750. Women with an educational attainment of bachelor's degree earn the most with the average annual earnings of $93,333, while those with bachelor's degree education have the smallest earnings of $93,333.
| Educational Attainment | Male Income | Female Income |
| Less than High School | - | - |
| High School Diploma | - | - |
| College or Associate's Degree | - | - |
| Bachelor's Degree | $183,750 | $93,333 |
| Graduate Degree | $250,001 | $0 |
| Total | $250,001 | $77,143 |
Family Income in Tuxedo Park
Family Income Brackets in Tuxedo Park
According to the Tuxedo Park family income data, there are 217 families falling into the $200,000+ income range, which is the most common income bracket and makes up 76.9% of all families.
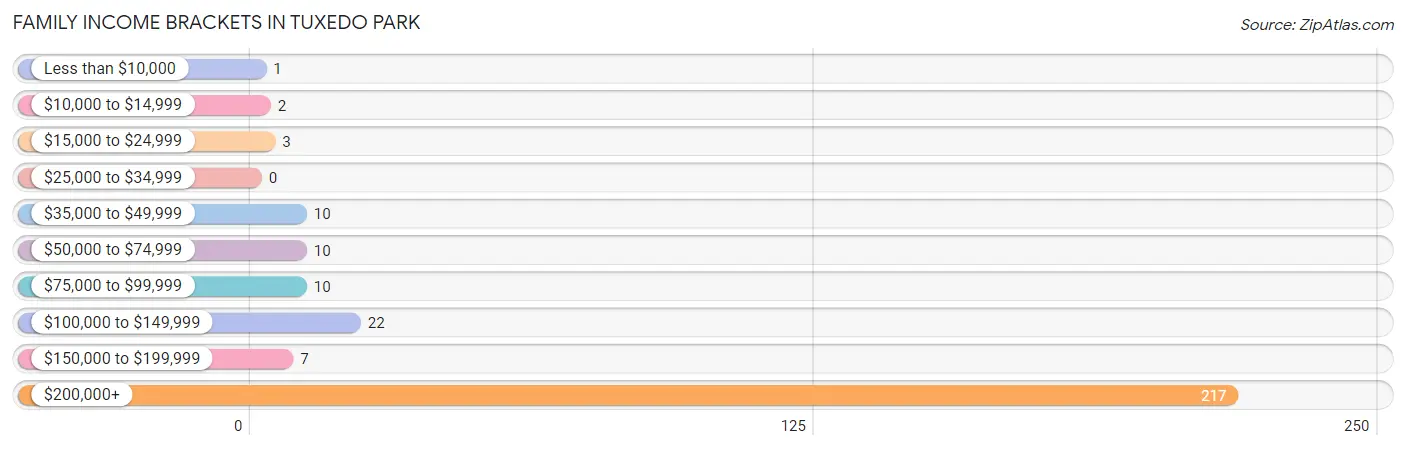
| Income Bracket | # Families | % Families |
| Less than $10,000 | 1 | 0.4% |
| $10,000 to $14,999 | 2 | 0.7% |
| $15,000 to $24,999 | 3 | 1.1% |
| $25,000 to $34,999 | 0 | 0.0% |
| $35,000 to $49,999 | 10 | 3.5% |
| $50,000 to $74,999 | 10 | 3.5% |
| $75,000 to $99,999 | 10 | 3.5% |
| $100,000 to $149,999 | 22 | 7.8% |
| $150,000 to $199,999 | 7 | 2.5% |
| $200,000+ | 217 | 77.0% |
Family Income by Famaliy Size in Tuxedo Park
2-person families (212 | 75.2%) account for the highest median family income in Tuxedo Park with $250,001 per family, while 2-person families (212 | 75.2%) have the highest median income of $125,000 per family member.
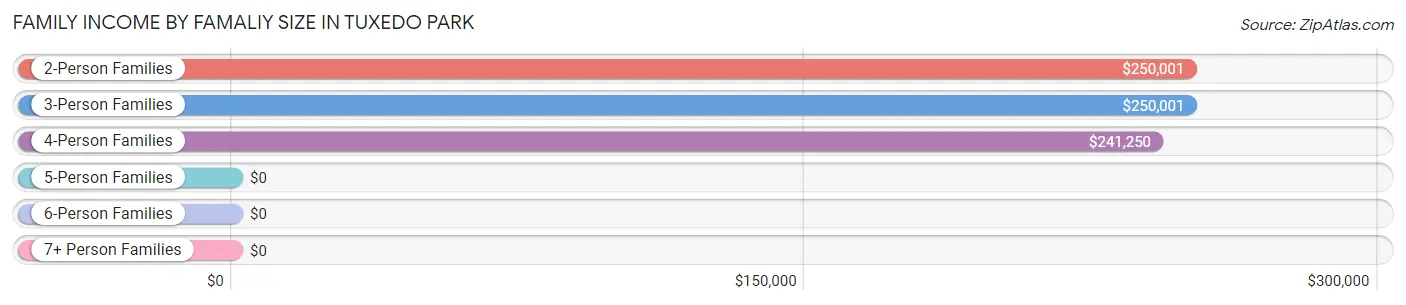
| Income Bracket | # Families | Median Income |
| 2-Person Families | 212 (75.2%) | $250,001 |
| 3-Person Families | 51 (18.1%) | $250,001 |
| 4-Person Families | 18 (6.4%) | $241,250 |
| 5-Person Families | 1 (0.4%) | $0 |
| 6-Person Families | 0 (0.0%) | $0 |
| 7+ Person Families | 0 (0.0%) | $0 |
| Total | 282 (100.0%) | $250,001 |
Family Income by Number of Earners in Tuxedo Park
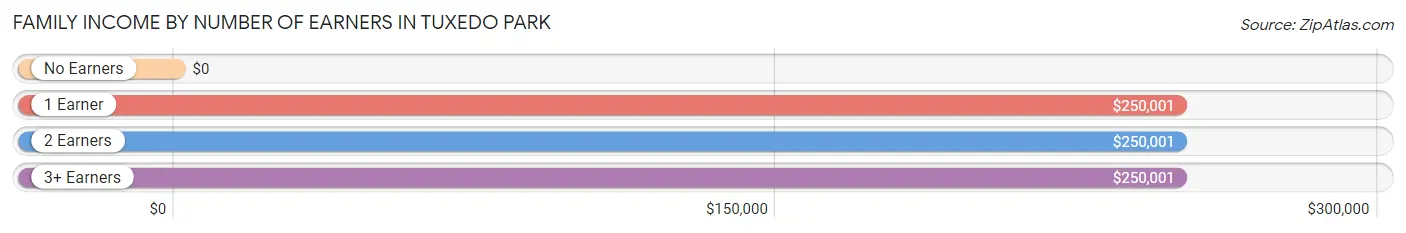
| Number of Earners | # Families | Median Income |
| No Earners | 37 (13.1%) | $0 |
| 1 Earner | 187 (66.3%) | $250,001 |
| 2 Earners | 52 (18.4%) | $250,001 |
| 3+ Earners | 6 (2.1%) | $250,001 |
| Total | 282 (100.0%) | $250,001 |
Household Income in Tuxedo Park
Household Income Brackets in Tuxedo Park
With 249 households falling in the category, the $200,000+ income range is the most frequent in Tuxedo Park, accounting for 63.0% of all households.
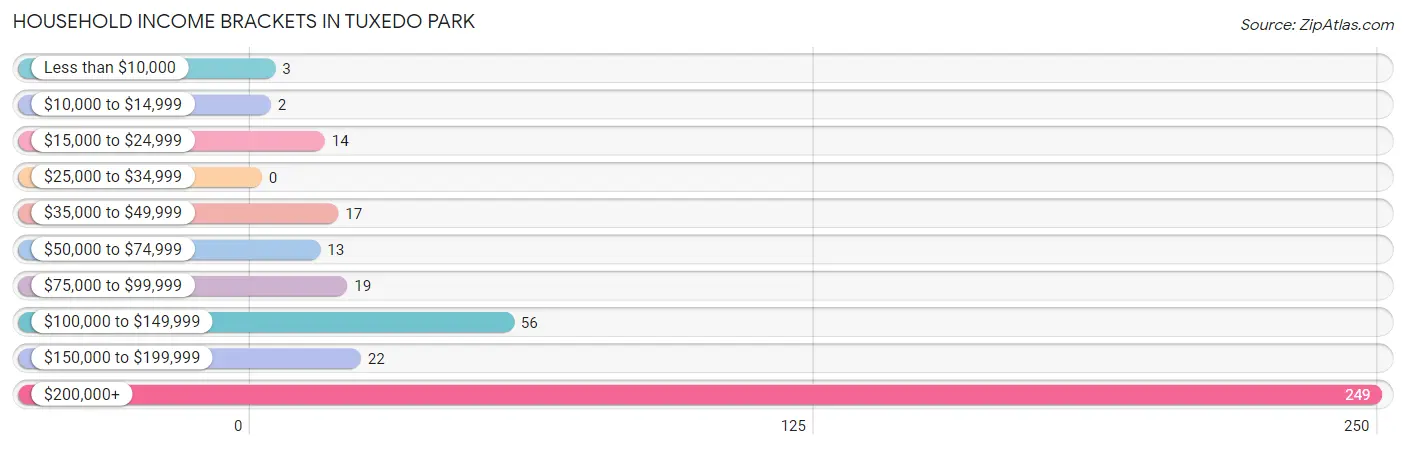
| Income Bracket | # Households | % Households |
| Less than $10,000 | 3 | 0.8% |
| $10,000 to $14,999 | 2 | 0.5% |
| $15,000 to $24,999 | 14 | 3.5% |
| $25,000 to $34,999 | 0 | 0.0% |
| $35,000 to $49,999 | 17 | 4.3% |
| $50,000 to $74,999 | 13 | 3.3% |
| $75,000 to $99,999 | 19 | 4.8% |
| $100,000 to $149,999 | 56 | 14.2% |
| $150,000 to $199,999 | 22 | 5.6% |
| $200,000+ | 249 | 63.0% |
Household Income by Householder Age in Tuxedo Park
The median household income in Tuxedo Park is $250,001, with the highest median household income of $250,001 found in the 45 to 64 years age bracket for the primary householder. A total of 231 households (58.5%) fall into this category.
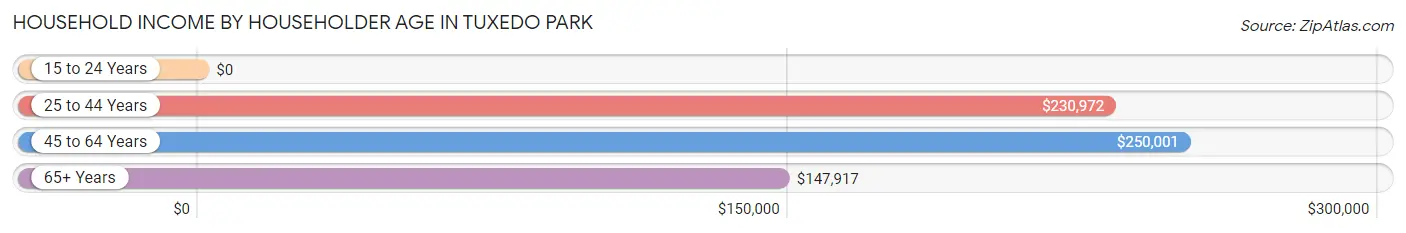
| Income Bracket | # Households | Median Income |
| 15 to 24 Years | 0 (0.0%) | $0 |
| 25 to 44 Years | 35 (8.9%) | $230,972 |
| 45 to 64 Years | 231 (58.5%) | $250,001 |
| 65+ Years | 129 (32.7%) | $147,917 |
| Total | 395 (100.0%) | $250,001 |
Poverty in Tuxedo Park
Income Below Poverty by Sex and Age in Tuxedo Park
With 2.1% poverty level for males and 1.4% for females among the residents of Tuxedo Park, 25 to 34 year old males and 15 year old females are the most vulnerable to poverty, with 3 males (27.3%) and 1 females (20.0%) in their respective age groups living below the poverty level.
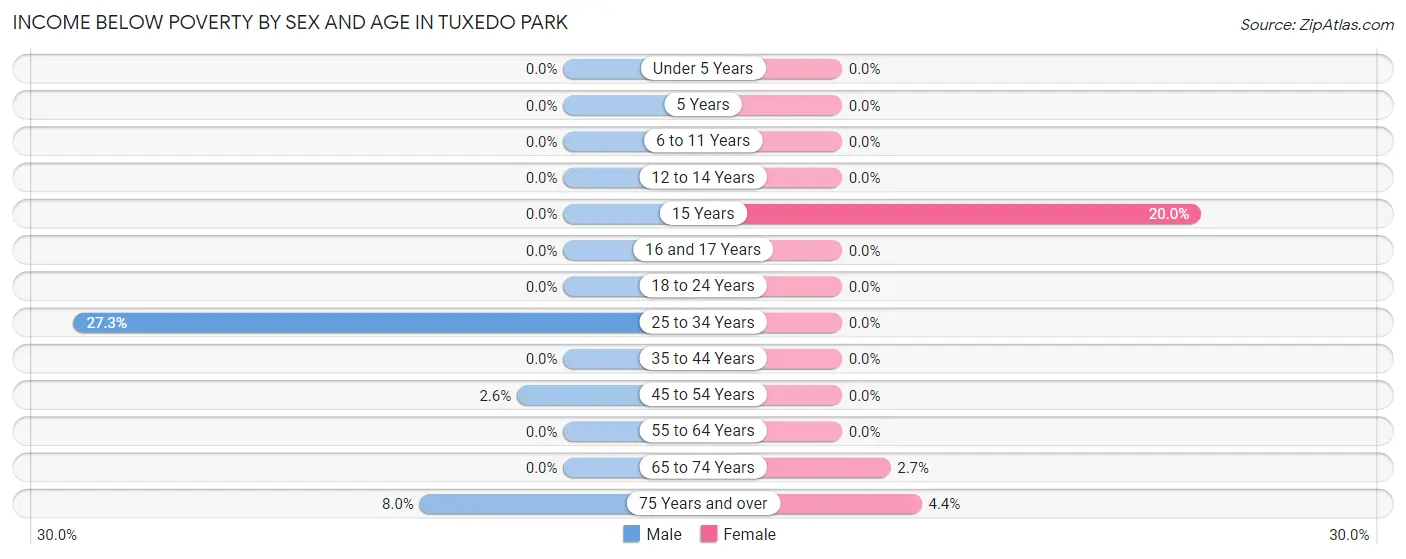
| Age Bracket | Male | Female |
| Under 5 Years | 0 (0.0%) | 0 (0.0%) |
| 5 Years | 0 (0.0%) | 0 (0.0%) |
| 6 to 11 Years | 0 (0.0%) | 0 (0.0%) |
| 12 to 14 Years | 0 (0.0%) | 0 (0.0%) |
| 15 Years | 0 (0.0%) | 1 (20.0%) |
| 16 and 17 Years | 0 (0.0%) | 0 (0.0%) |
| 18 to 24 Years | 0 (0.0%) | 0 (0.0%) |
| 25 to 34 Years | 3 (27.3%) | 0 (0.0%) |
| 35 to 44 Years | 0 (0.0%) | 0 (0.0%) |
| 45 to 54 Years | 4 (2.6%) | 0 (0.0%) |
| 55 to 64 Years | 0 (0.0%) | 0 (0.0%) |
| 65 to 74 Years | 0 (0.0%) | 1 (2.7%) |
| 75 Years and over | 2 (8.0%) | 2 (4.4%) |
| Total | 9 (2.1%) | 4 (1.4%) |
Income Above Poverty by Sex and Age in Tuxedo Park
According to the poverty statistics in Tuxedo Park, males aged under 5 years and females aged under 5 years are the age groups that are most secure financially, with 100.0% of males and 100.0% of females in these age groups living above the poverty line.
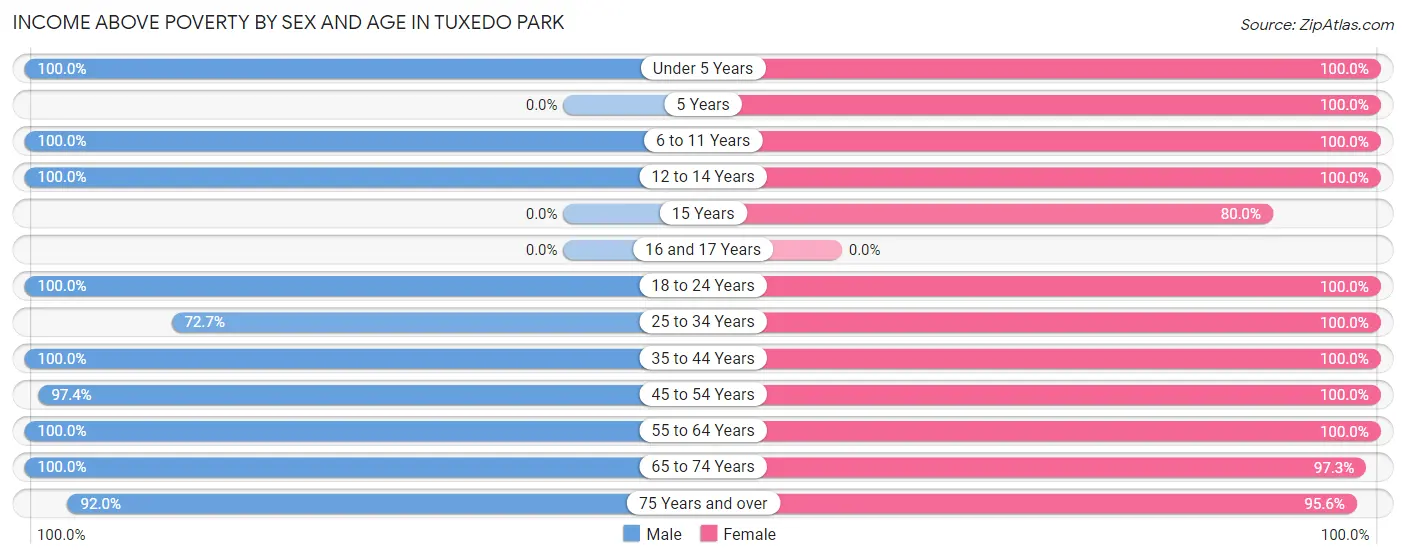
| Age Bracket | Male | Female |
| Under 5 Years | 17 (100.0%) | 11 (100.0%) |
| 5 Years | 0 (0.0%) | 2 (100.0%) |
| 6 to 11 Years | 25 (100.0%) | 4 (100.0%) |
| 12 to 14 Years | 4 (100.0%) | 2 (100.0%) |
| 15 Years | 0 (0.0%) | 4 (80.0%) |
| 16 and 17 Years | 0 (0.0%) | 0 (0.0%) |
| 18 to 24 Years | 5 (100.0%) | 23 (100.0%) |
| 25 to 34 Years | 8 (72.7%) | 22 (100.0%) |
| 35 to 44 Years | 30 (100.0%) | 24 (100.0%) |
| 45 to 54 Years | 151 (97.4%) | 39 (100.0%) |
| 55 to 64 Years | 72 (100.0%) | 65 (100.0%) |
| 65 to 74 Years | 77 (100.0%) | 36 (97.3%) |
| 75 Years and over | 23 (92.0%) | 43 (95.6%) |
| Total | 412 (97.9%) | 275 (98.6%) |
Income Below Poverty Among Married-Couple Families in Tuxedo Park
The poverty statistics for married-couple families in Tuxedo Park show that 0.7% or 2 of the total 279 families live below the poverty line. Families with no children have the highest poverty rate of 0.9%, comprising of 2 families. On the other hand, families with 1 or 2 children have the lowest poverty rate of 0.0%, which includes 0 families.
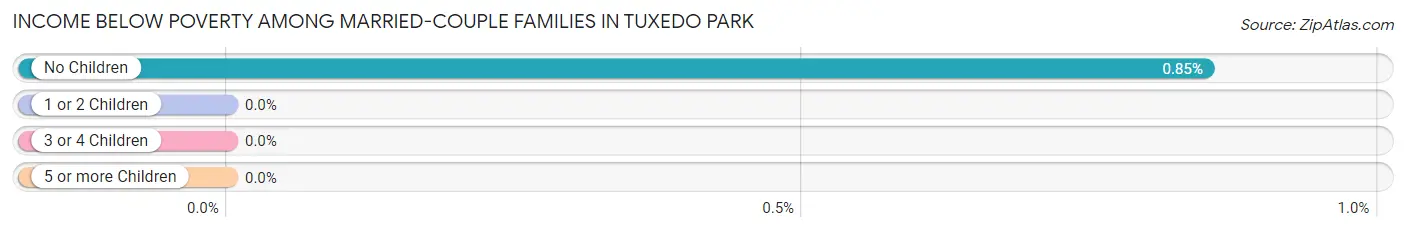
| Children | Above Poverty | Below Poverty |
| No Children | 233 (99.2%) | 2 (0.9%) |
| 1 or 2 Children | 43 (100.0%) | 0 (0.0%) |
| 3 or 4 Children | 1 (100.0%) | 0 (0.0%) |
| 5 or more Children | 0 (0.0%) | 0 (0.0%) |
| Total | 277 (99.3%) | 2 (0.7%) |
Income Below Poverty Among Single-Parent Households in Tuxedo Park
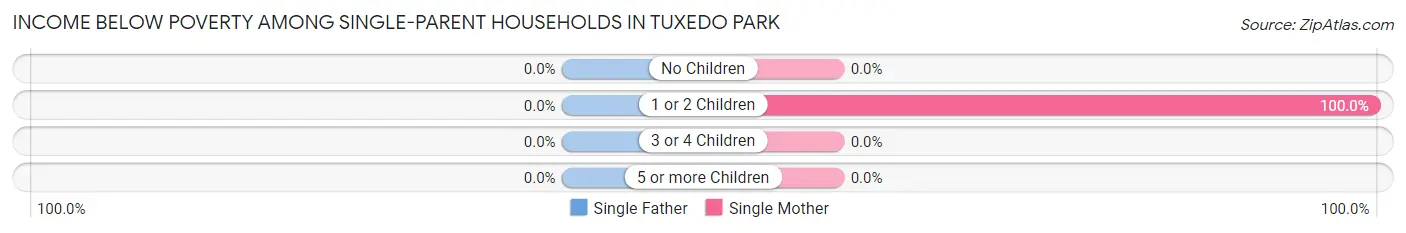
| Children | Single Father | Single Mother |
| No Children | 0 (0.0%) | 0 (0.0%) |
| 1 or 2 Children | 0 (0.0%) | 1 (100.0%) |
| 3 or 4 Children | 0 (0.0%) | 0 (0.0%) |
| 5 or more Children | 0 (0.0%) | 0 (0.0%) |
| Total | 0 (0.0%) | 1 (33.3%) |
Income Below Poverty Among Married-Couple vs Single-Parent Households in Tuxedo Park
The poverty data for Tuxedo Park shows that 2 of the married-couple family households (0.7%) and 1 of the single-parent households (33.3%) are living below the poverty level. Within the married-couple family households, those with no children have the highest poverty rate, with 2 households (0.9%) falling below the poverty line. Among the single-parent households, those with 1 or 2 children have the highest poverty rate, with 1 household (100.0%) living below poverty.
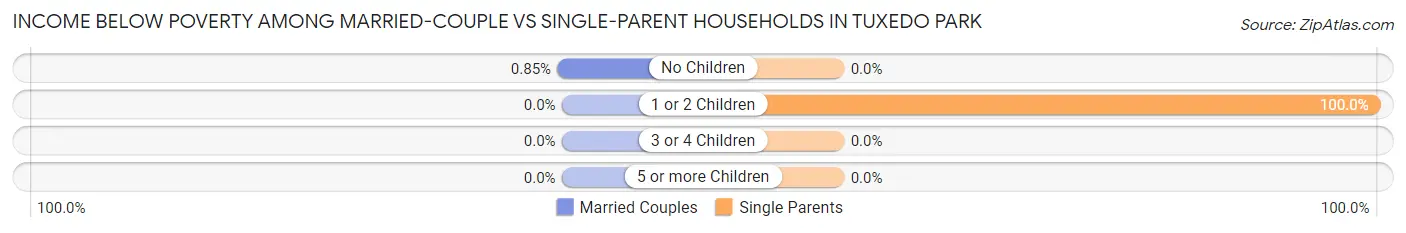
| Children | Married-Couple Families | Single-Parent Households |
| No Children | 2 (0.9%) | 0 (0.0%) |
| 1 or 2 Children | 0 (0.0%) | 1 (100.0%) |
| 3 or 4 Children | 0 (0.0%) | 0 (0.0%) |
| 5 or more Children | 0 (0.0%) | 0 (0.0%) |
| Total | 2 (0.7%) | 1 (33.3%) |
Race in Tuxedo Park
The most populous races in Tuxedo Park are White / Caucasian (535 | 76.4%), Two or more Races (157 | 22.4%), and Hispanic or Latino (45 | 6.4%).
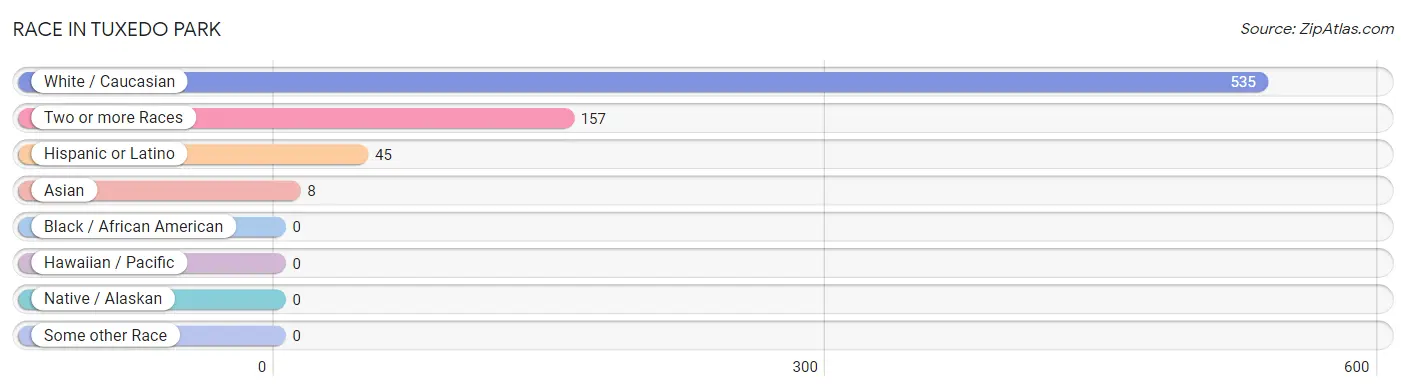
| Race | # Population | % Population |
| Asian | 8 | 1.1% |
| Black / African American | 0 | 0.0% |
| Hawaiian / Pacific | 0 | 0.0% |
| Hispanic or Latino | 45 | 6.4% |
| Native / Alaskan | 0 | 0.0% |
| White / Caucasian | 535 | 76.4% |
| Two or more Races | 157 | 22.4% |
| Some other Race | 0 | 0.0% |
| Total | 700 | 100.0% |
Ancestry in Tuxedo Park
The most populous ancestries reported in Tuxedo Park are Indian (Asian) (128 | 18.3%), American (124 | 17.7%), Armenian (123 | 17.6%), English (66 | 9.4%), and Italian (63 | 9.0%), together accounting for 72.0% of all Tuxedo Park residents.
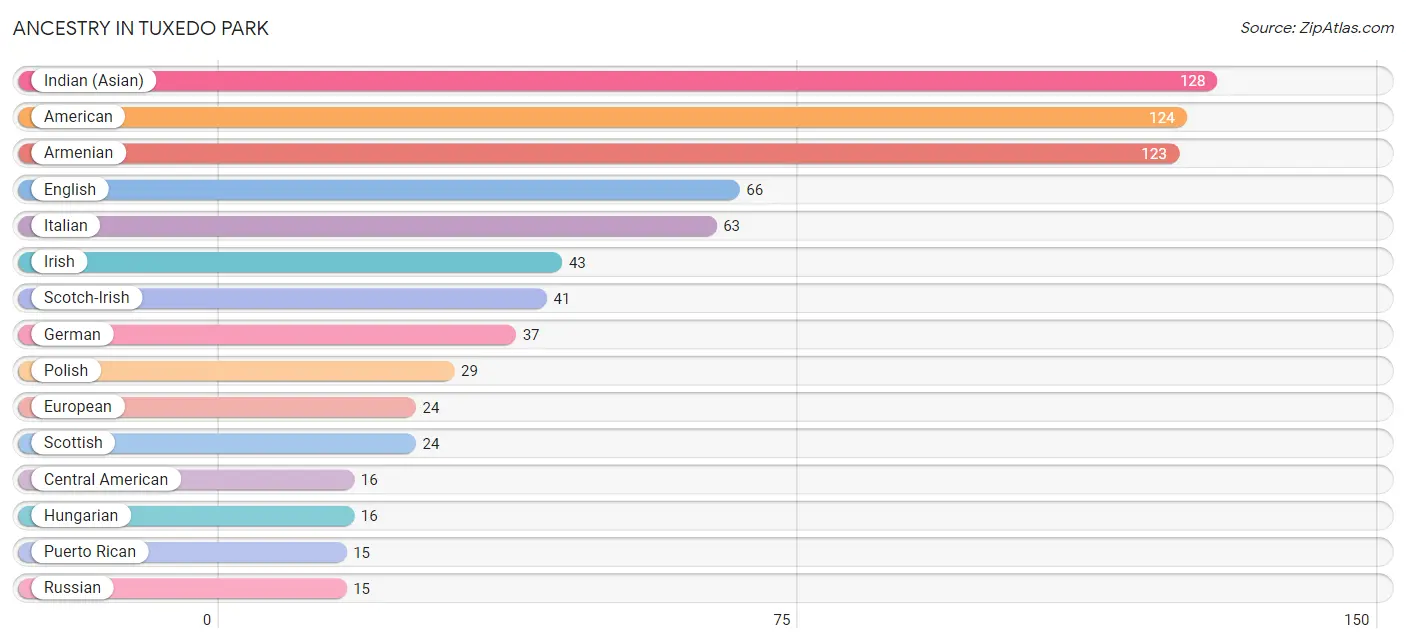
| Ancestry | # Population | % Population |
| American | 124 | 17.7% |
| Armenian | 123 | 17.6% |
| Austrian | 7 | 1.0% |
| Brazilian | 2 | 0.3% |
| British | 4 | 0.6% |
| Canadian | 12 | 1.7% |
| Central American | 16 | 2.3% |
| Colombian | 6 | 0.9% |
| Danish | 3 | 0.4% |
| Delaware | 1 | 0.1% |
| English | 66 | 9.4% |
| European | 24 | 3.4% |
| French | 11 | 1.6% |
| French Canadian | 1 | 0.1% |
| German | 37 | 5.3% |
| Greek | 2 | 0.3% |
| Hungarian | 16 | 2.3% |
| Indian (Asian) | 128 | 18.3% |
| Indonesian | 3 | 0.4% |
| Iranian | 4 | 0.6% |
| Irish | 43 | 6.1% |
| Italian | 63 | 9.0% |
| Korean | 1 | 0.1% |
| Latvian | 3 | 0.4% |
| Lithuanian | 2 | 0.3% |
| Norwegian | 3 | 0.4% |
| Panamanian | 6 | 0.9% |
| Paraguayan | 2 | 0.3% |
| Polish | 29 | 4.1% |
| Puerto Rican | 15 | 2.1% |
| Russian | 15 | 2.1% |
| Salvadoran | 10 | 1.4% |
| Scandinavian | 2 | 0.3% |
| Scotch-Irish | 41 | 5.9% |
| Scottish | 24 | 3.4% |
| South American | 8 | 1.1% |
| Spanish | 6 | 0.9% |
| Swedish | 8 | 1.1% |
| Ukrainian | 9 | 1.3% | View All 39 Rows |
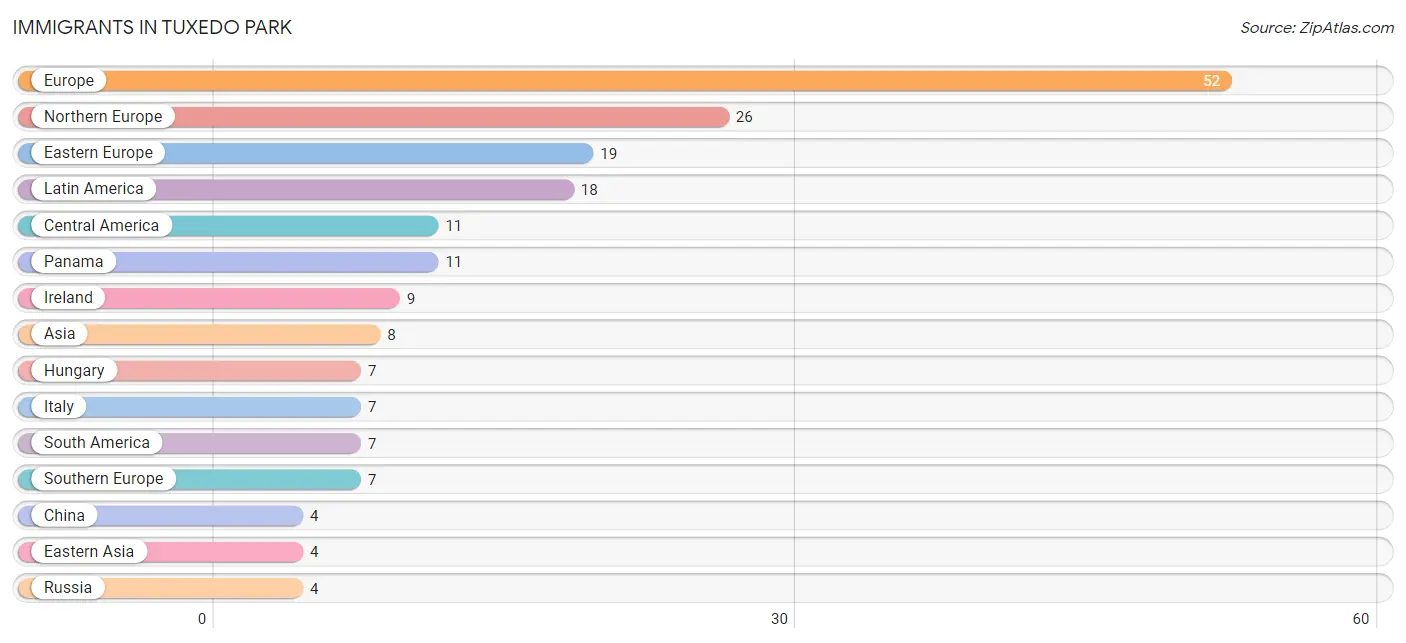
Immigrants in Tuxedo Park
The most numerous immigrant groups reported in Tuxedo Park came from Europe (52 | 7.4%), Northern Europe (26 | 3.7%), Eastern Europe (19 | 2.7%), Latin America (18 | 2.6%), and Central America (11 | 1.6%), together accounting for 18.0% of all Tuxedo Park residents.
| Immigration Origin | # Population | % Population |
| Asia | 8 | 1.1% |
| Australia | 3 | 0.4% |
| Brazil | 2 | 0.3% |
| Canada | 3 | 0.4% |
| Central America | 11 | 1.6% |
| China | 4 | 0.6% |
| Colombia | 2 | 0.3% |
| Denmark | 3 | 0.4% |
| Eastern Asia | 4 | 0.6% |
| Eastern Europe | 19 | 2.7% |
| Europe | 52 | 7.4% |
| Hungary | 7 | 1.0% |
| Ireland | 9 | 1.3% |
| Italy | 7 | 1.0% |
| Latin America | 18 | 2.6% |
| Lithuania | 2 | 0.3% |
| Northern Europe | 26 | 3.7% |
| Oceania | 3 | 0.4% |
| Panama | 11 | 1.6% |
| Peru | 3 | 0.4% |
| Philippines | 1 | 0.1% |
| Poland | 3 | 0.4% |
| Russia | 4 | 0.6% |
| South America | 7 | 1.0% |
| South Eastern Asia | 4 | 0.6% |
| Southern Europe | 7 | 1.0% |
| Ukraine | 3 | 0.4% | View All 27 Rows |
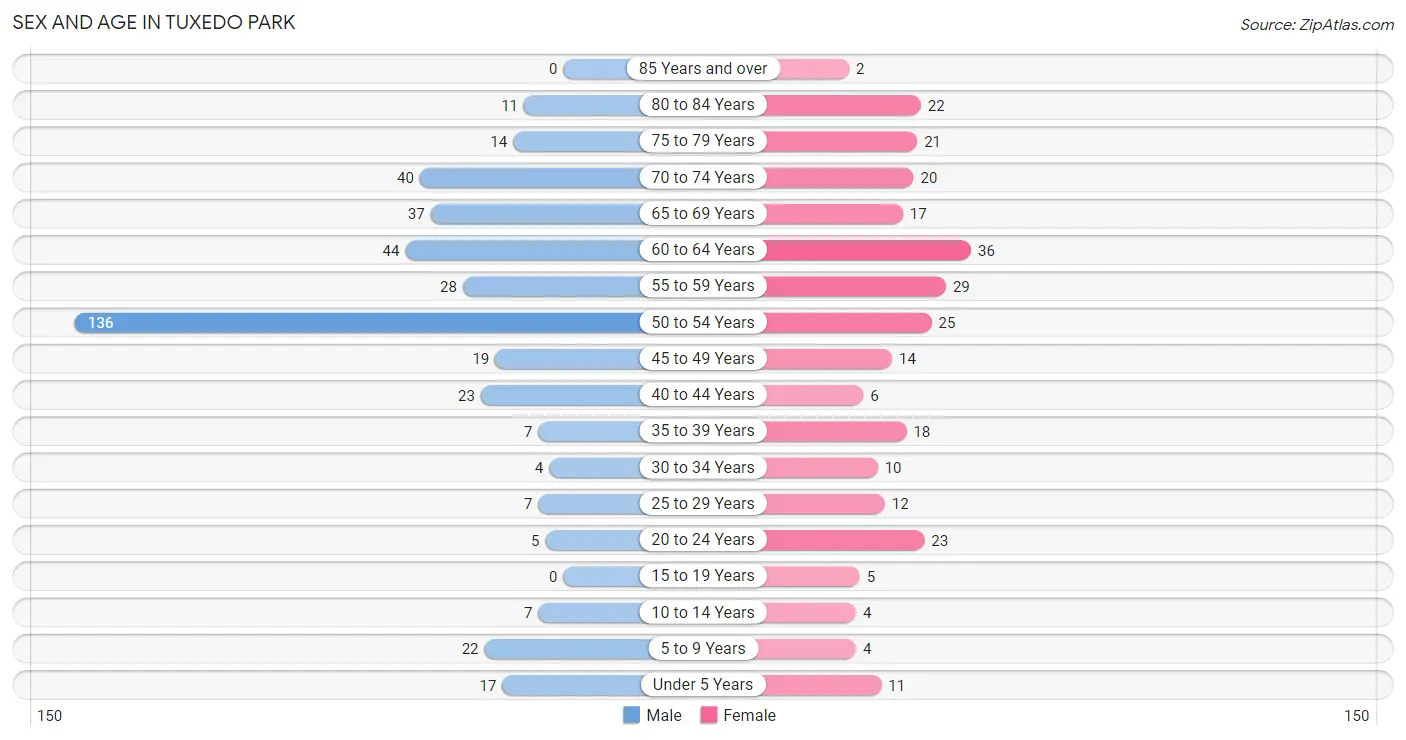
Sex and Age in Tuxedo Park
Sex and Age in Tuxedo Park
The most populous age groups in Tuxedo Park are 50 to 54 Years (136 | 32.3%) for men and 60 to 64 Years (36 | 12.9%) for women.
| Age Bracket | Male | Female |
| Under 5 Years | 17 (4.0%) | 11 (3.9%) |
| 5 to 9 Years | 22 (5.2%) | 4 (1.4%) |
| 10 to 14 Years | 7 (1.7%) | 4 (1.4%) |
| 15 to 19 Years | 0 (0.0%) | 5 (1.8%) |
| 20 to 24 Years | 5 (1.2%) | 23 (8.2%) |
| 25 to 29 Years | 7 (1.7%) | 12 (4.3%) |
| 30 to 34 Years | 4 (0.9%) | 10 (3.6%) |
| 35 to 39 Years | 7 (1.7%) | 18 (6.5%) |
| 40 to 44 Years | 23 (5.5%) | 6 (2.1%) |
| 45 to 49 Years | 19 (4.5%) | 14 (5.0%) |
| 50 to 54 Years | 136 (32.3%) | 25 (9.0%) |
| 55 to 59 Years | 28 (6.7%) | 29 (10.4%) |
| 60 to 64 Years | 44 (10.4%) | 36 (12.9%) |
| 65 to 69 Years | 37 (8.8%) | 17 (6.1%) |
| 70 to 74 Years | 40 (9.5%) | 20 (7.2%) |
| 75 to 79 Years | 14 (3.3%) | 21 (7.5%) |
| 80 to 84 Years | 11 (2.6%) | 22 (7.9%) |
| 85 Years and over | 0 (0.0%) | 2 (0.7%) |
| Total | 421 (100.0%) | 279 (100.0%) |
Families and Households in Tuxedo Park
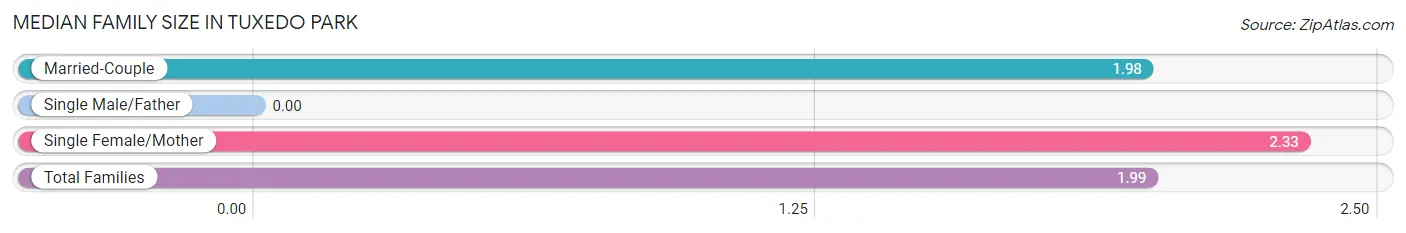
Median Family Size in Tuxedo Park
| Family Type | # Families | Family Size |
| Married-Couple | 279 (98.9%) | 1.98 |
| Single Male/Father | 0 (0.0%) | - |
| Single Female/Mother | 3 (1.1%) | 2.33 |
| Total Families | 282 (100.0%) | 1.99 |
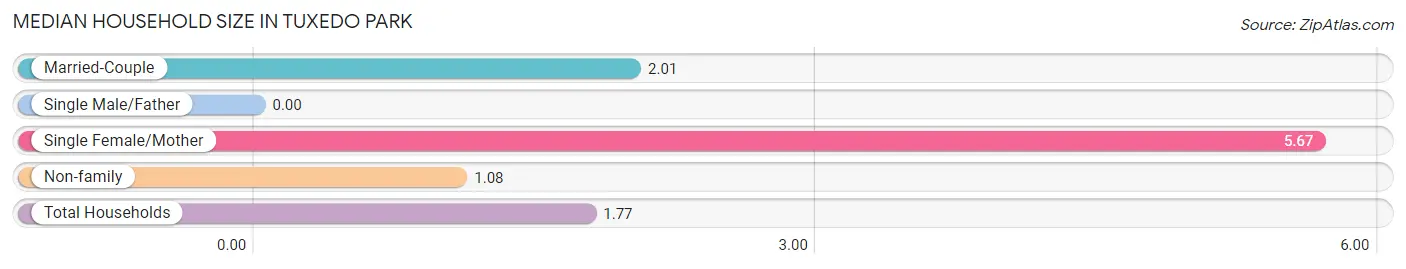
Median Household Size in Tuxedo Park
| Household Type | # Households | Household Size |
| Married-Couple | 279 (70.6%) | 2.01 |
| Single Male/Father | 0 (0.0%) | - |
| Single Female/Mother | 3 (0.8%) | 5.67 |
| Non-family | 113 (28.6%) | 1.08 |
| Total Households | 395 (100.0%) | 1.77 |
Household Size by Marriage Status in Tuxedo Park
Out of a total of 395 households in Tuxedo Park, 282 (71.4%) are family households, while 113 (28.6%) are nonfamily households. The most numerous type of family households are 2-person households, comprising 205, and the most common type of nonfamily households are 1-person households, comprising 105.
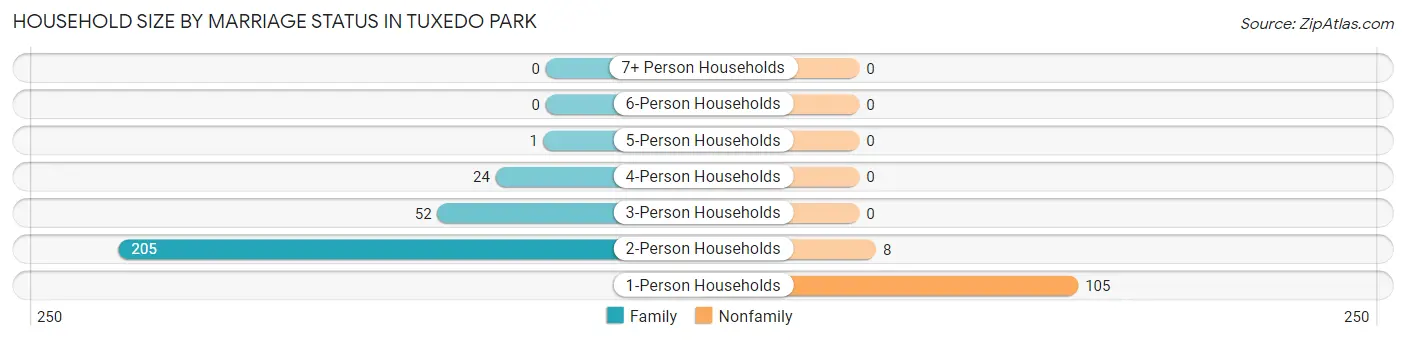
| Household Size | Family Households | Nonfamily Households |
| 1-Person Households | - | 105 (26.6%) |
| 2-Person Households | 205 (51.9%) | 8 (2.0%) |
| 3-Person Households | 52 (13.2%) | 0 (0.0%) |
| 4-Person Households | 24 (6.1%) | 0 (0.0%) |
| 5-Person Households | 1 (0.3%) | 0 (0.0%) |
| 6-Person Households | 0 (0.0%) | 0 (0.0%) |
| 7+ Person Households | 0 (0.0%) | 0 (0.0%) |
| Total | 282 (71.4%) | 113 (28.6%) |
Female Fertility in Tuxedo Park
Fertility by Age in Tuxedo Park
Average fertility rate in Tuxedo Park is 163.0 births per 1,000 women. Women in the age bracket of 35 to 50 years have the highest fertility rate with 357.0 births per 1,000 women. Women in the age bracket of 35 to 50 years acount for 100.0% of all women with births.
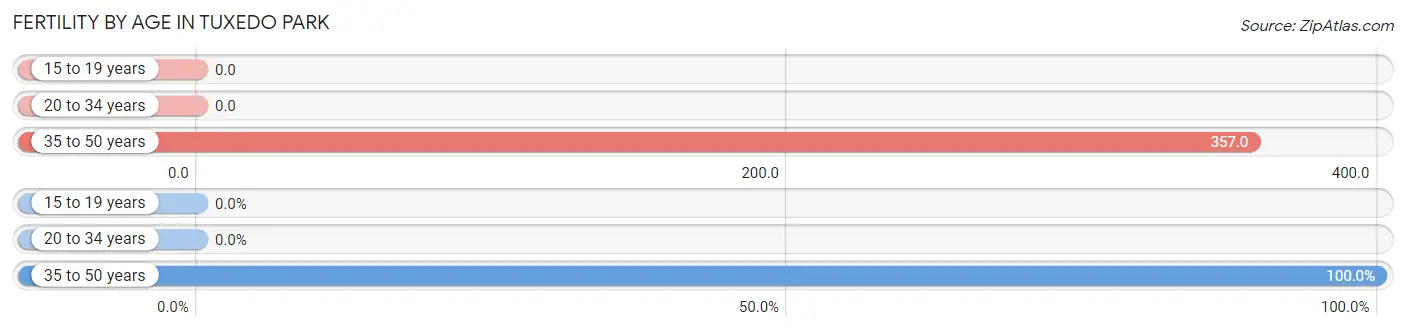
| Age Bracket | Women with Births | Births / 1,000 Women |
| 15 to 19 years | 0 (0.0%) | 0.0 |
| 20 to 34 years | 0 (0.0%) | 0.0 |
| 35 to 50 years | 15 (100.0%) | 357.0 |
| Total | 15 (100.0%) | 163.0 |
Fertility by Age by Marriage Status in Tuxedo Park
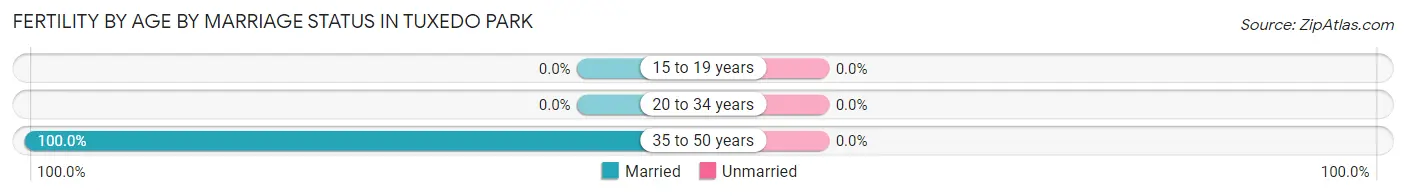
| Age Bracket | Married | Unmarried |
| 15 to 19 years | 0 (0.0%) | 0 (0.0%) |
| 20 to 34 years | 0 (0.0%) | 0 (0.0%) |
| 35 to 50 years | 15 (100.0%) | 0 (0.0%) |
| Total | 15 (100.0%) | 0 (0.0%) |
Fertility by Education in Tuxedo Park
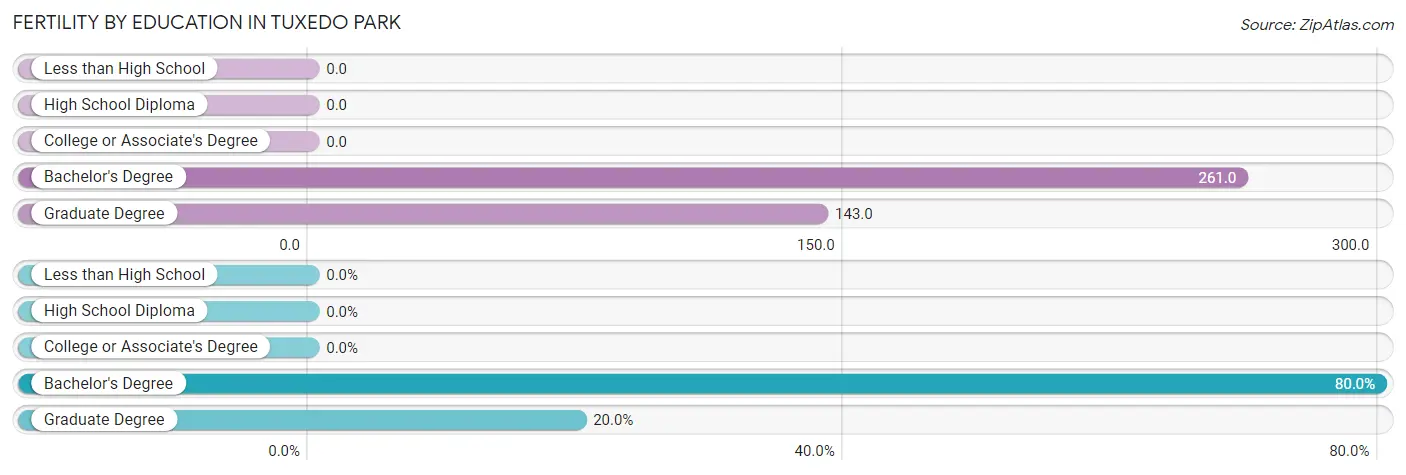
| Educational Attainment | Women with Births | Births / 1,000 Women |
| Less than High School | 0 (0.0%) | 0.0 |
| High School Diploma | 0 (0.0%) | 0.0 |
| College or Associate's Degree | 0 (0.0%) | 0.0 |
| Bachelor's Degree | 12 (80.0%) | 261.0 |
| Graduate Degree | 3 (20.0%) | 143.0 |
| Total | 15 (100.0%) | 163.0 |
Fertility by Education by Marriage Status in Tuxedo Park
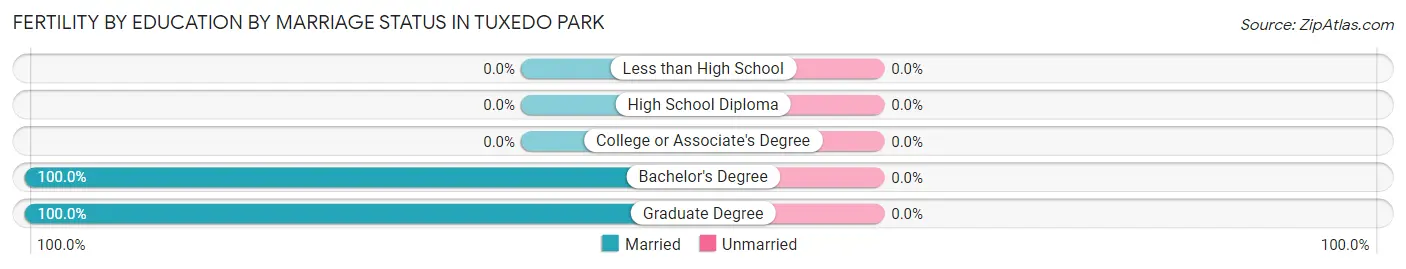
| Educational Attainment | Married | Unmarried |
| Less than High School | 0 (0.0%) | 0 (0.0%) |
| High School Diploma | 0 (0.0%) | 0 (0.0%) |
| College or Associate's Degree | 0 (0.0%) | 0 (0.0%) |
| Bachelor's Degree | 12 (100.0%) | 0 (0.0%) |
| Graduate Degree | 3 (100.0%) | 0 (0.0%) |
| Total | 15 (100.0%) | 0 (0.0%) |
Employment Characteristics in Tuxedo Park
Employment by Class of Employer in Tuxedo Park
Among the 391 employed individuals in Tuxedo Park, private company employees (307 | 78.5%), self-employed (not incorporated) (30 | 7.7%), and not-for-profit organizations (22 | 5.6%) make up the most common classes of employment.
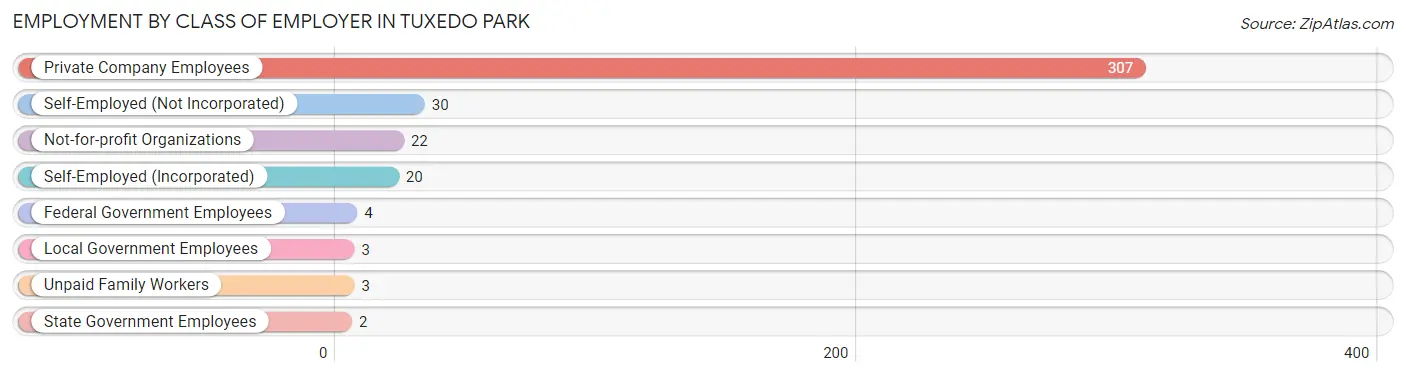
| Employer Class | # Employees | % Employees |
| Private Company Employees | 307 | 78.5% |
| Self-Employed (Incorporated) | 20 | 5.1% |
| Self-Employed (Not Incorporated) | 30 | 7.7% |
| Not-for-profit Organizations | 22 | 5.6% |
| Local Government Employees | 3 | 0.8% |
| State Government Employees | 2 | 0.5% |
| Federal Government Employees | 4 | 1.0% |
| Unpaid Family Workers | 3 | 0.8% |
| Total | 391 | 100.0% |
Employment Status by Age in Tuxedo Park
According to the labor force statistics for Tuxedo Park, out of the total population over 16 years of age (630), 63.5% or 400 individuals are in the labor force, with 1.8% or 7 of them unemployed. The age group with the highest labor force participation rate is 60 to 64 years, with 92.5% or 74 individuals in the labor force. Within the labor force, the 25 to 29 years age range has the highest percentage of unemployed individuals, with 33.3% or 2 of them being unemployed.
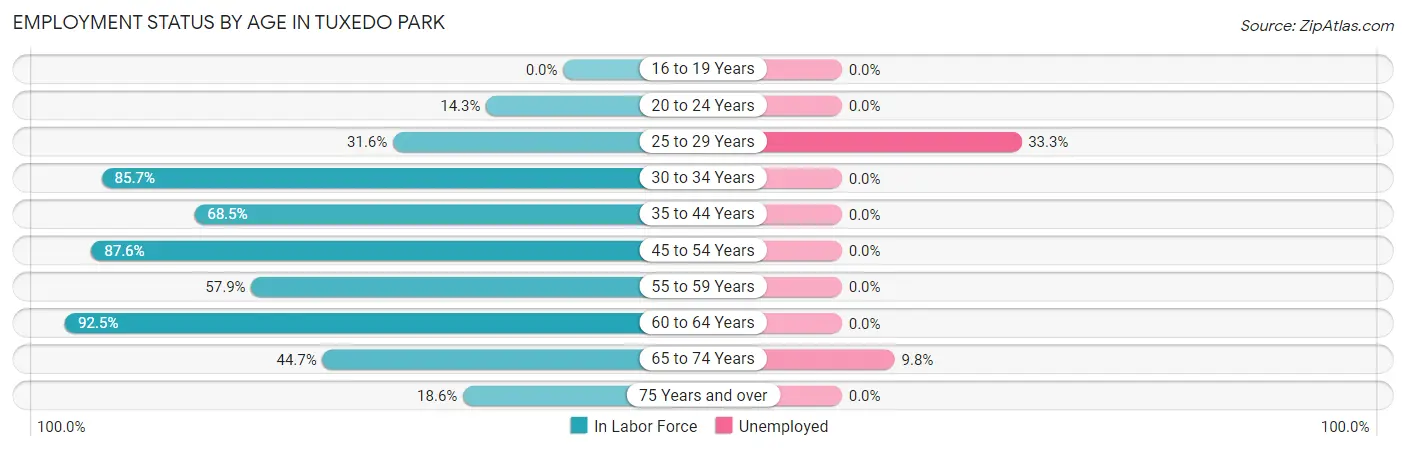
| Age Bracket | In Labor Force | Unemployed |
| 16 to 19 Years | 0 (0.0%) | 0 (0.0%) |
| 20 to 24 Years | 4 (14.3%) | 0 (0.0%) |
| 25 to 29 Years | 6 (31.6%) | 2 (33.3%) |
| 30 to 34 Years | 12 (85.7%) | 0 (0.0%) |
| 35 to 44 Years | 37 (68.5%) | 0 (0.0%) |
| 45 to 54 Years | 170 (87.6%) | 0 (0.0%) |
| 55 to 59 Years | 33 (57.9%) | 0 (0.0%) |
| 60 to 64 Years | 74 (92.5%) | 0 (0.0%) |
| 65 to 74 Years | 51 (44.7%) | 5 (9.8%) |
| 75 Years and over | 13 (18.6%) | 0 (0.0%) |
| Total | 400 (63.5%) | 7 (1.8%) |
Employment Status by Educational Attainment in Tuxedo Park
According to labor force statistics for Tuxedo Park, 79.4% of individuals (332) out of the total population between 25 and 64 years of age (418) are in the labor force, with 0.6% or 2 of them being unemployed. The group with the highest labor force participation rate are those with the educational attainment of less than high school, with 100.0% or 5 individuals in the labor force. Within the labor force, individuals with bachelor's degree or higher education have the highest percentage of unemployment, with 0.6% or 2 of them being unemployed.
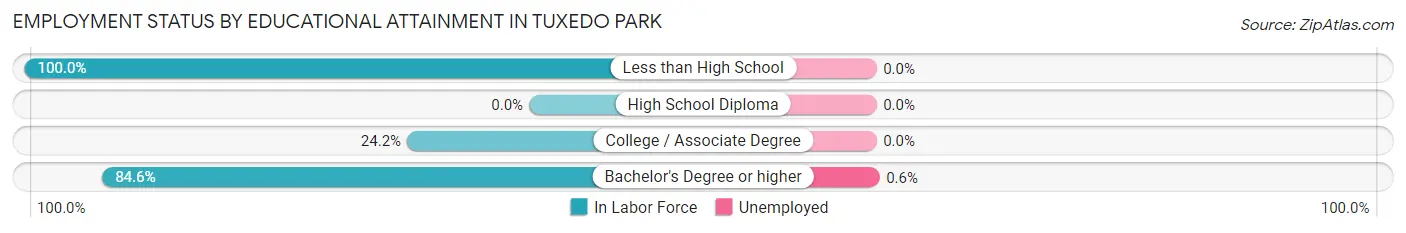
| Educational Attainment | In Labor Force | Unemployed |
| Less than High School | 5 (100.0%) | 0 (0.0%) |
| High School Diploma | 0 (0.0%) | 0 (0.0%) |
| College / Associate Degree | 8 (24.2%) | 0 (0.0%) |
| Bachelor's Degree or higher | 319 (84.6%) | 2 (0.6%) |
| Total | 332 (79.4%) | 3 (0.6%) |
Employment Occupations by Sex in Tuxedo Park
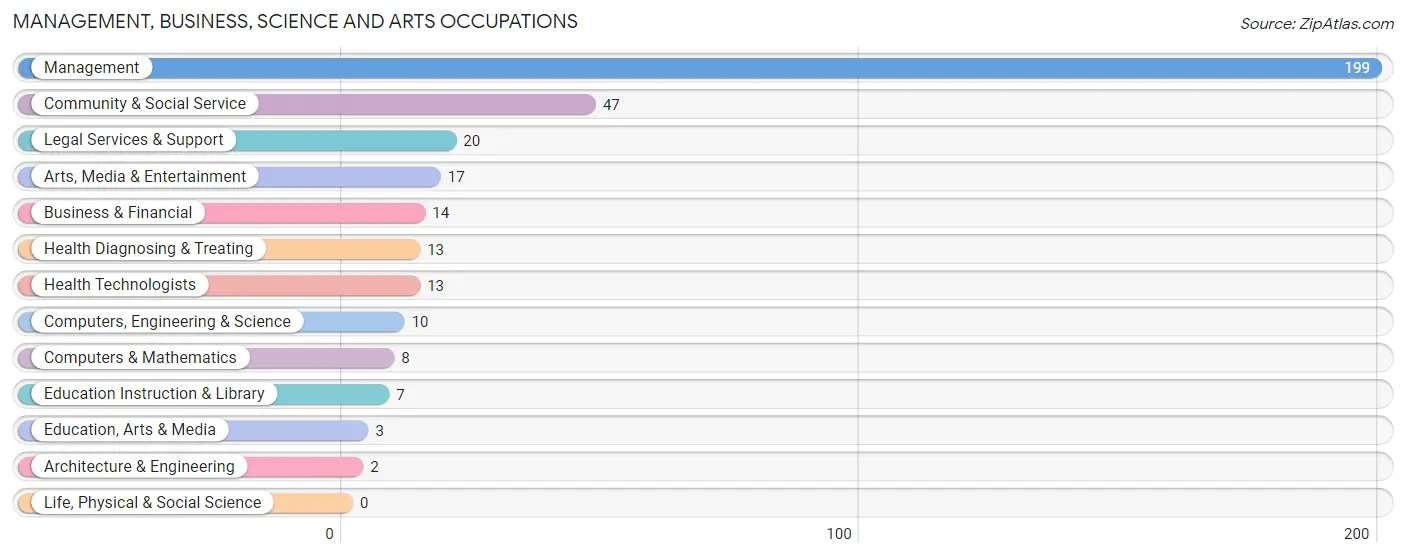
Management, Business, Science and Arts Occupations
The most common Management, Business, Science and Arts occupations in Tuxedo Park are Management (199 | 50.9%), Community & Social Service (47 | 12.0%), Legal Services & Support (20 | 5.1%), Arts, Media & Entertainment (17 | 4.3%), and Business & Financial (14 | 3.6%).
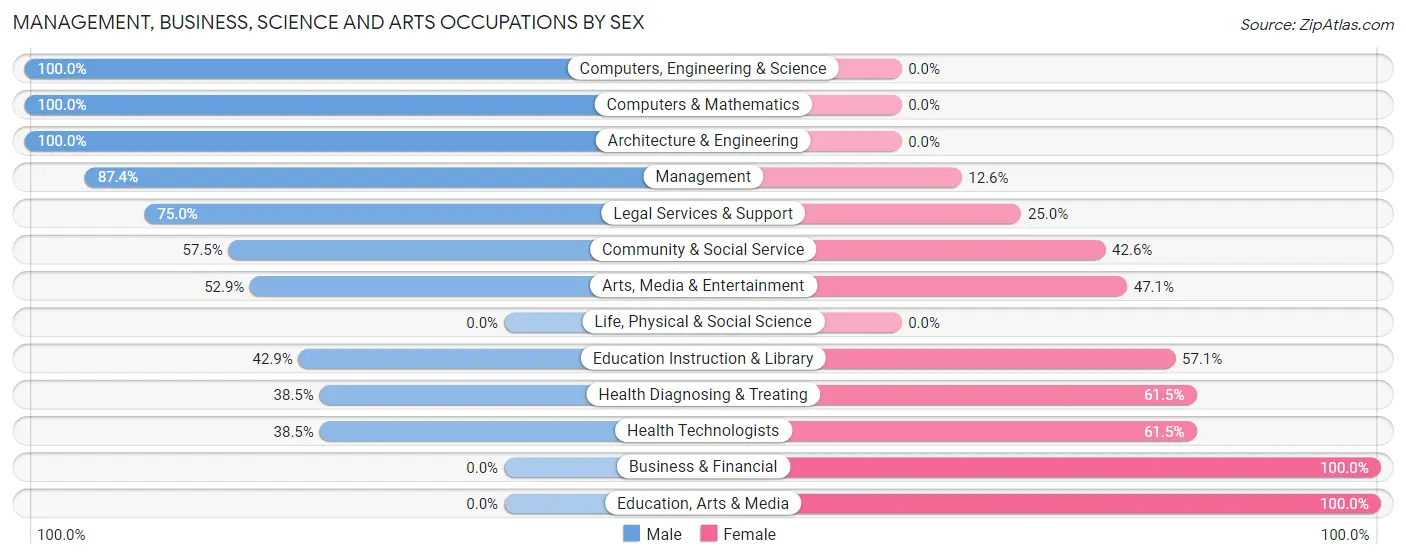
Management, Business, Science and Arts Occupations by Sex
Within the Management, Business, Science and Arts occupations in Tuxedo Park, the most male-oriented occupations are Computers, Engineering & Science (100.0%), Computers & Mathematics (100.0%), and Architecture & Engineering (100.0%), while the most female-oriented occupations are Business & Financial (100.0%), Education, Arts & Media (100.0%), and Health Diagnosing & Treating (61.5%).
| Occupation | Male | Female |
| Management | 174 (87.4%) | 25 (12.6%) |
| Business & Financial | 0 (0.0%) | 14 (100.0%) |
| Computers, Engineering & Science | 10 (100.0%) | 0 (0.0%) |
| Computers & Mathematics | 8 (100.0%) | 0 (0.0%) |
| Architecture & Engineering | 2 (100.0%) | 0 (0.0%) |
| Life, Physical & Social Science | 0 (0.0%) | 0 (0.0%) |
| Community & Social Service | 27 (57.5%) | 20 (42.5%) |
| Education, Arts & Media | 0 (0.0%) | 3 (100.0%) |
| Legal Services & Support | 15 (75.0%) | 5 (25.0%) |
| Education Instruction & Library | 3 (42.9%) | 4 (57.1%) |
| Arts, Media & Entertainment | 9 (52.9%) | 8 (47.1%) |
| Health Diagnosing & Treating | 5 (38.5%) | 8 (61.5%) |
| Health Technologists | 5 (38.5%) | 8 (61.5%) |
| Total (Category) | 216 (76.3%) | 67 (23.7%) |
| Total (Overall) | 296 (75.7%) | 95 (24.3%) |
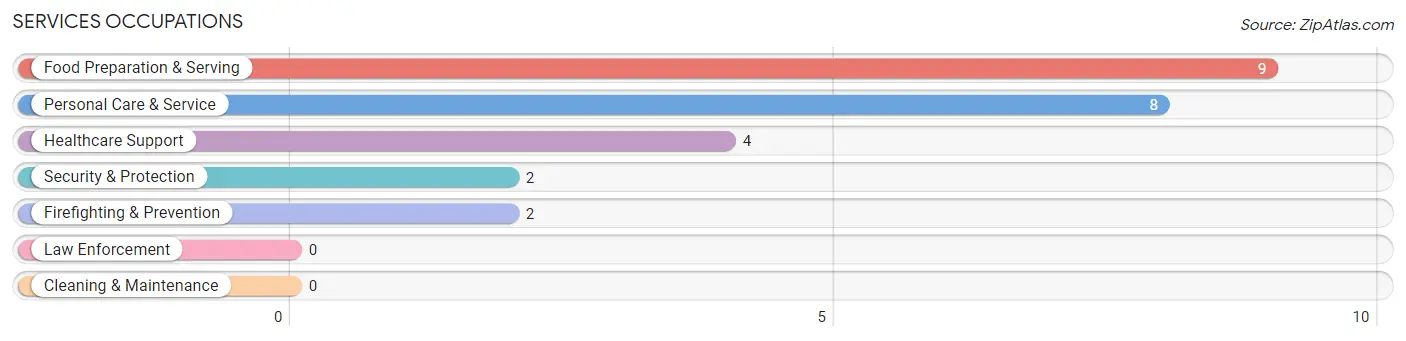
Services Occupations
The most common Services occupations in Tuxedo Park are Food Preparation & Serving (9 | 2.3%), Personal Care & Service (8 | 2.1%), Healthcare Support (4 | 1.0%), Security & Protection (2 | 0.5%), and Firefighting & Prevention (2 | 0.5%).
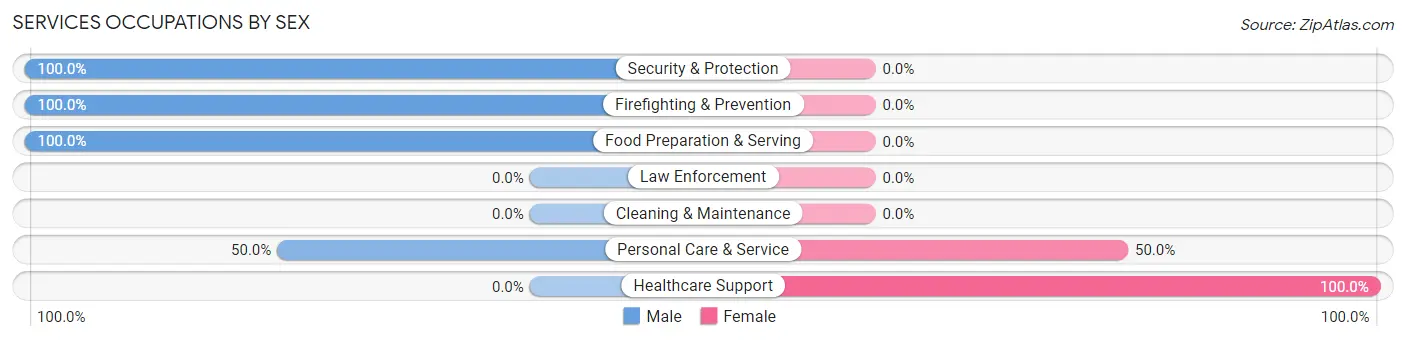
Services Occupations by Sex
Within the Services occupations in Tuxedo Park, the most male-oriented occupations are Security & Protection (100.0%), Firefighting & Prevention (100.0%), and Food Preparation & Serving (100.0%), while the most female-oriented occupations are Healthcare Support (100.0%), and Personal Care & Service (50.0%).
| Occupation | Male | Female |
| Healthcare Support | 0 (0.0%) | 4 (100.0%) |
| Security & Protection | 2 (100.0%) | 0 (0.0%) |
| Firefighting & Prevention | 2 (100.0%) | 0 (0.0%) |
| Law Enforcement | 0 (0.0%) | 0 (0.0%) |
| Food Preparation & Serving | 9 (100.0%) | 0 (0.0%) |
| Cleaning & Maintenance | 0 (0.0%) | 0 (0.0%) |
| Personal Care & Service | 4 (50.0%) | 4 (50.0%) |
| Total (Category) | 15 (65.2%) | 8 (34.8%) |
| Total (Overall) | 296 (75.7%) | 95 (24.3%) |
Sales and Office Occupations
The most common Sales and Office occupations in Tuxedo Park are Sales & Related (61 | 15.6%), and Office & Administration (16 | 4.1%).
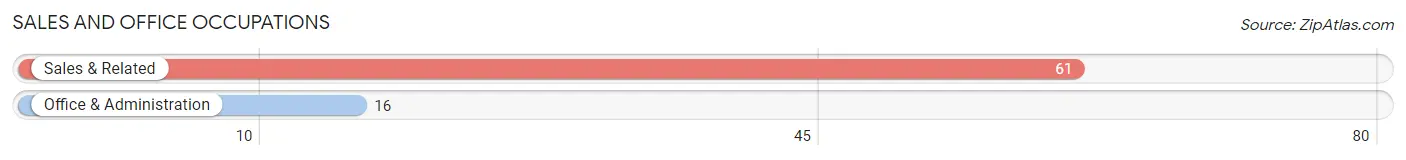
Sales and Office Occupations by Sex
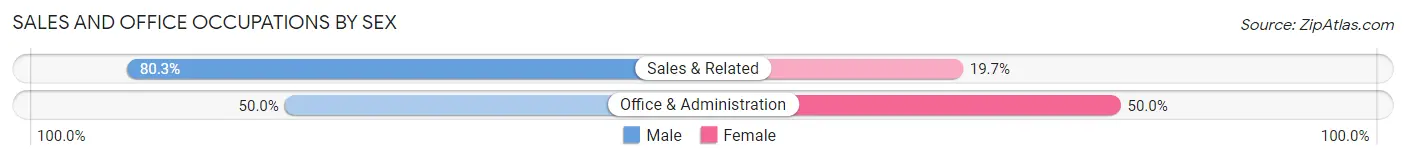
| Occupation | Male | Female |
| Sales & Related | 49 (80.3%) | 12 (19.7%) |
| Office & Administration | 8 (50.0%) | 8 (50.0%) |
| Total (Category) | 57 (74.0%) | 20 (26.0%) |
| Total (Overall) | 296 (75.7%) | 95 (24.3%) |
Natural Resources, Construction and Maintenance Occupations
The most common Natural Resources, Construction and Maintenance occupations in Tuxedo Park are , and Construction & Extraction (2 | 0.5%).
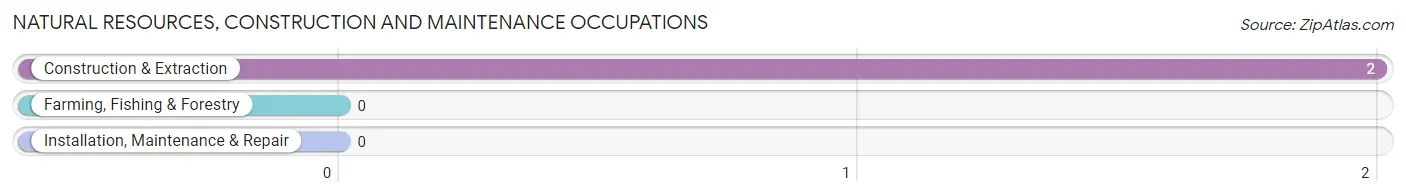
Natural Resources, Construction and Maintenance Occupations by Sex
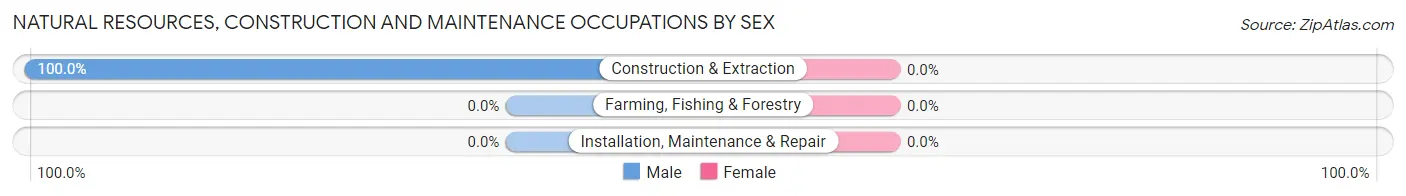
| Occupation | Male | Female |
| Farming, Fishing & Forestry | 0 (0.0%) | 0 (0.0%) |
| Construction & Extraction | 2 (100.0%) | 0 (0.0%) |
| Installation, Maintenance & Repair | 0 (0.0%) | 0 (0.0%) |
| Total (Category) | 2 (100.0%) | 0 (0.0%) |
| Total (Overall) | 296 (75.7%) | 95 (24.3%) |
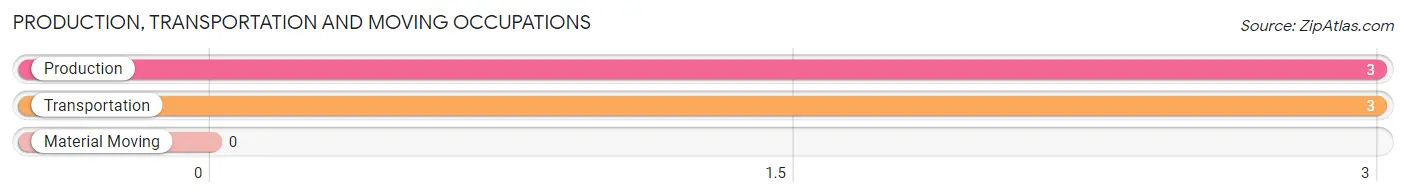
Production, Transportation and Moving Occupations
The most common Production, Transportation and Moving occupations in Tuxedo Park are Production (3 | 0.8%), and Transportation (3 | 0.8%).
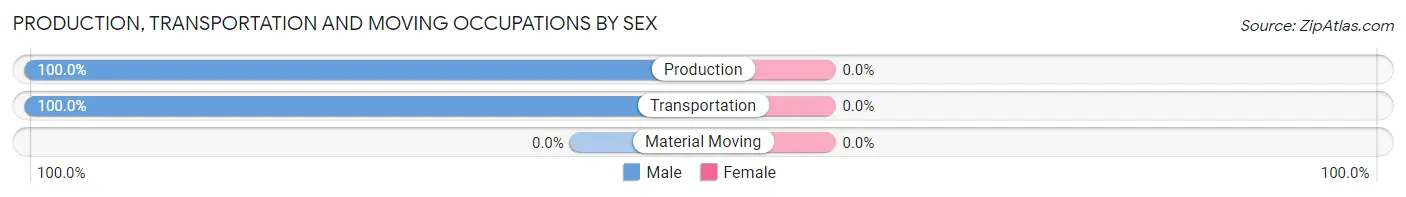
Production, Transportation and Moving Occupations by Sex
| Occupation | Male | Female |
| Production | 3 (100.0%) | 0 (0.0%) |
| Transportation | 3 (100.0%) | 0 (0.0%) |
| Material Moving | 0 (0.0%) | 0 (0.0%) |
| Total (Category) | 6 (100.0%) | 0 (0.0%) |
| Total (Overall) | 296 (75.7%) | 95 (24.3%) |
Employment Industries by Sex in Tuxedo Park
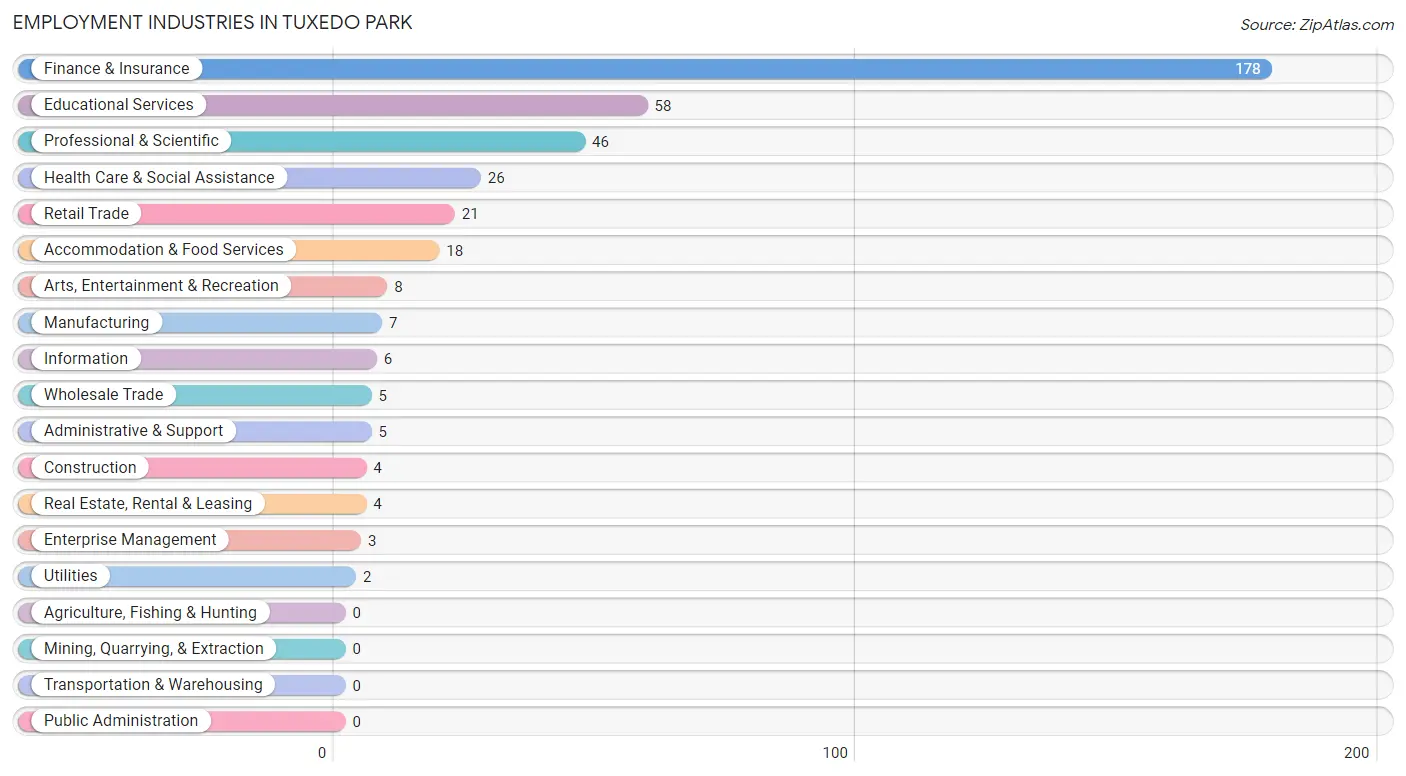
Employment Industries in Tuxedo Park
The major employment industries in Tuxedo Park include Finance & Insurance (178 | 45.5%), Educational Services (58 | 14.8%), Professional & Scientific (46 | 11.8%), Health Care & Social Assistance (26 | 6.7%), and Retail Trade (21 | 5.4%).
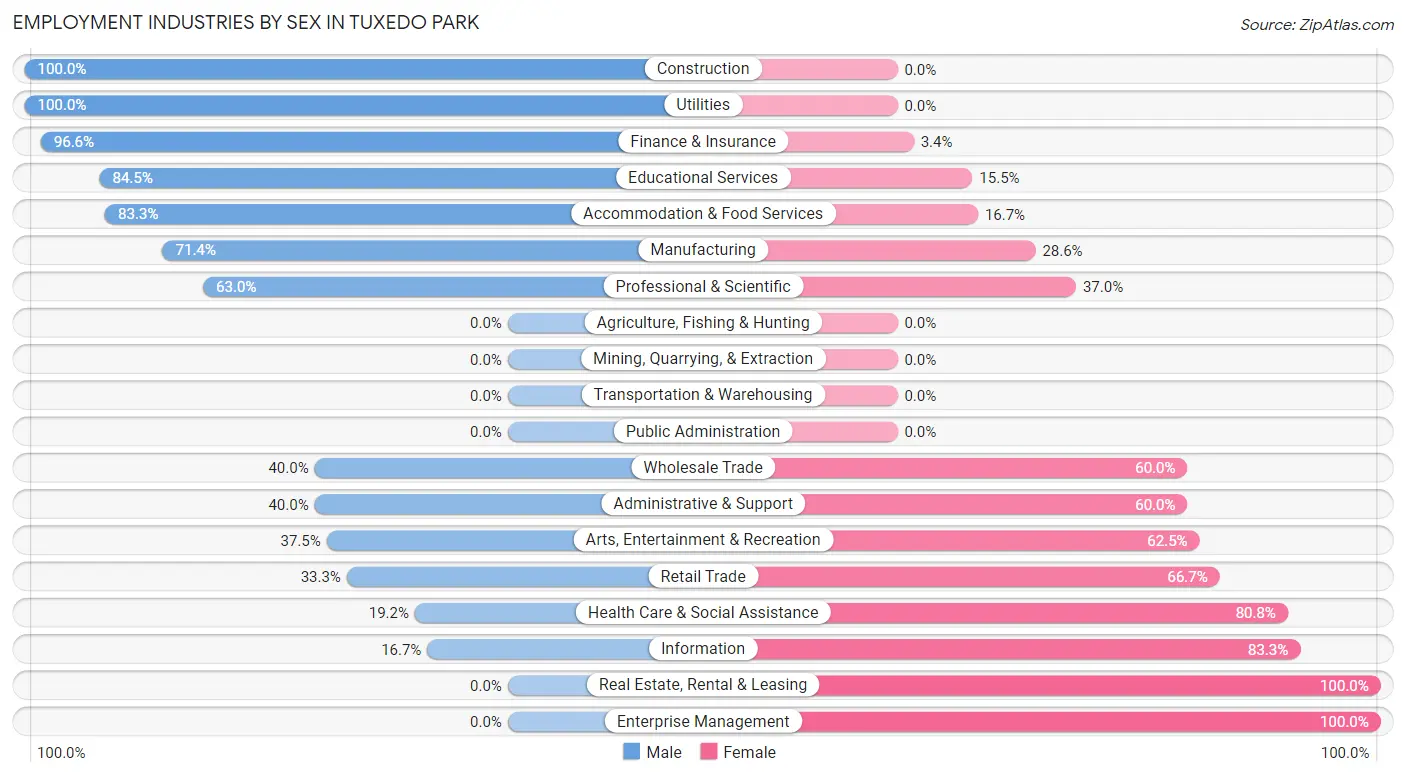
Employment Industries by Sex in Tuxedo Park
The Tuxedo Park industries that see more men than women are Construction (100.0%), Utilities (100.0%), and Finance & Insurance (96.6%), whereas the industries that tend to have a higher number of women are Real Estate, Rental & Leasing (100.0%), Enterprise Management (100.0%), and Information (83.3%).
| Industry | Male | Female |
| Agriculture, Fishing & Hunting | 0 (0.0%) | 0 (0.0%) |
| Mining, Quarrying, & Extraction | 0 (0.0%) | 0 (0.0%) |
| Construction | 4 (100.0%) | 0 (0.0%) |
| Manufacturing | 5 (71.4%) | 2 (28.6%) |
| Wholesale Trade | 2 (40.0%) | 3 (60.0%) |
| Retail Trade | 7 (33.3%) | 14 (66.7%) |
| Transportation & Warehousing | 0 (0.0%) | 0 (0.0%) |
| Utilities | 2 (100.0%) | 0 (0.0%) |
| Information | 1 (16.7%) | 5 (83.3%) |
| Finance & Insurance | 172 (96.6%) | 6 (3.4%) |
| Real Estate, Rental & Leasing | 0 (0.0%) | 4 (100.0%) |
| Professional & Scientific | 29 (63.0%) | 17 (37.0%) |
| Enterprise Management | 0 (0.0%) | 3 (100.0%) |
| Administrative & Support | 2 (40.0%) | 3 (60.0%) |
| Educational Services | 49 (84.5%) | 9 (15.5%) |
| Health Care & Social Assistance | 5 (19.2%) | 21 (80.8%) |
| Arts, Entertainment & Recreation | 3 (37.5%) | 5 (62.5%) |
| Accommodation & Food Services | 15 (83.3%) | 3 (16.7%) |
| Public Administration | 0 (0.0%) | 0 (0.0%) |
| Total | 296 (75.7%) | 95 (24.3%) |
Education in Tuxedo Park
School Enrollment in Tuxedo Park
The most common levels of schooling among the 93 students in Tuxedo Park are college / undergraduate (36 | 38.7%), elementary school (24 | 25.8%), and graduate / professional (11 | 11.8%).
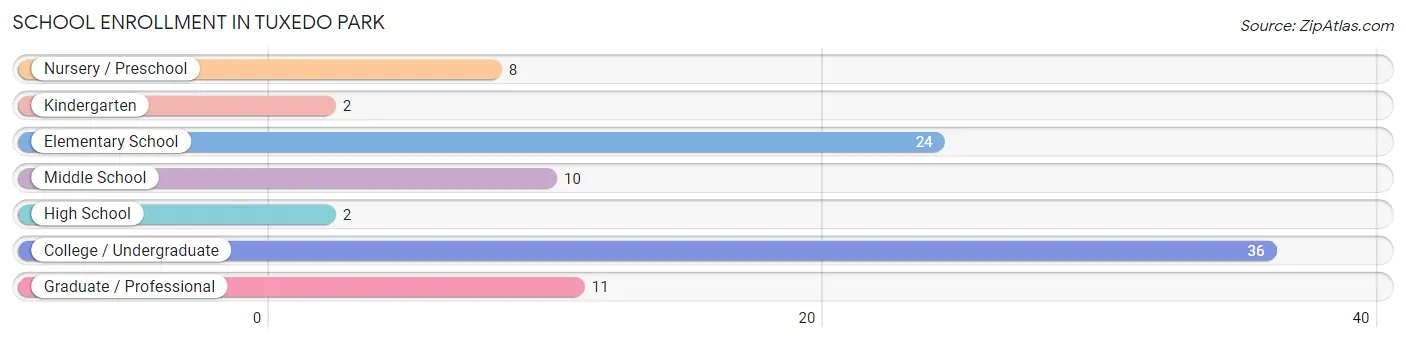
| School Level | # Students | % Students |
| Nursery / Preschool | 8 | 8.6% |
| Kindergarten | 2 | 2.1% |
| Elementary School | 24 | 25.8% |
| Middle School | 10 | 10.7% |
| High School | 2 | 2.1% |
| College / Undergraduate | 36 | 38.7% |
| Graduate / Professional | 11 | 11.8% |
| Total | 93 | 100.0% |
School Enrollment by Age by Funding Source in Tuxedo Park
Out of a total of 93 students who are enrolled in schools in Tuxedo Park, 73 (78.5%) attend a private institution, while the remaining 20 (21.5%) are enrolled in public schools. The age group of 3 to 4 year olds has the highest likelihood of being enrolled in private schools, with 8 (100.0% in the age bracket) enrolled. Conversely, the age group of 10 to 14 year olds has the lowest likelihood of being enrolled in a private school, with 6 (54.5% in the age bracket) attending a public institution.
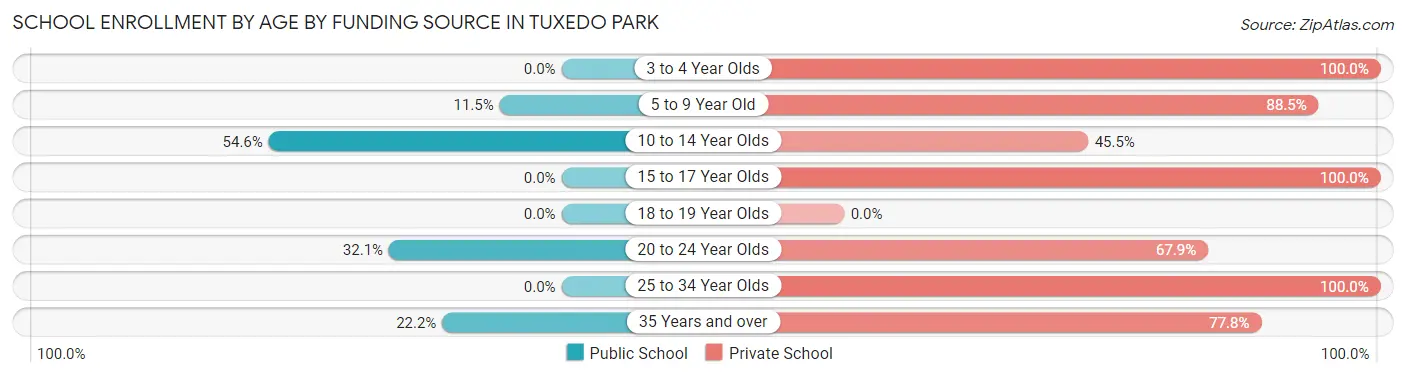
| Age Bracket | Public School | Private School |
| 3 to 4 Year Olds | 0 (0.0%) | 8 (100.0%) |
| 5 to 9 Year Old | 3 (11.5%) | 23 (88.5%) |
| 10 to 14 Year Olds | 6 (54.5%) | 5 (45.5%) |
| 15 to 17 Year Olds | 0 (0.0%) | 1 (100.0%) |
| 18 to 19 Year Olds | 0 (0.0%) | 0 (0.0%) |
| 20 to 24 Year Olds | 9 (32.1%) | 19 (67.9%) |
| 25 to 34 Year Olds | 0 (0.0%) | 10 (100.0%) |
| 35 Years and over | 2 (22.2%) | 7 (77.8%) |
| Total | 20 (21.5%) | 73 (78.5%) |
Educational Attainment by Field of Study in Tuxedo Park
Literature & languages (144 | 26.0%), visual & performing arts (81 | 14.6%), social sciences (69 | 12.4%), business (51 | 9.2%), and liberal arts & history (46 | 8.3%) are the most common fields of study among 554 individuals in Tuxedo Park who have obtained a bachelor's degree or higher.
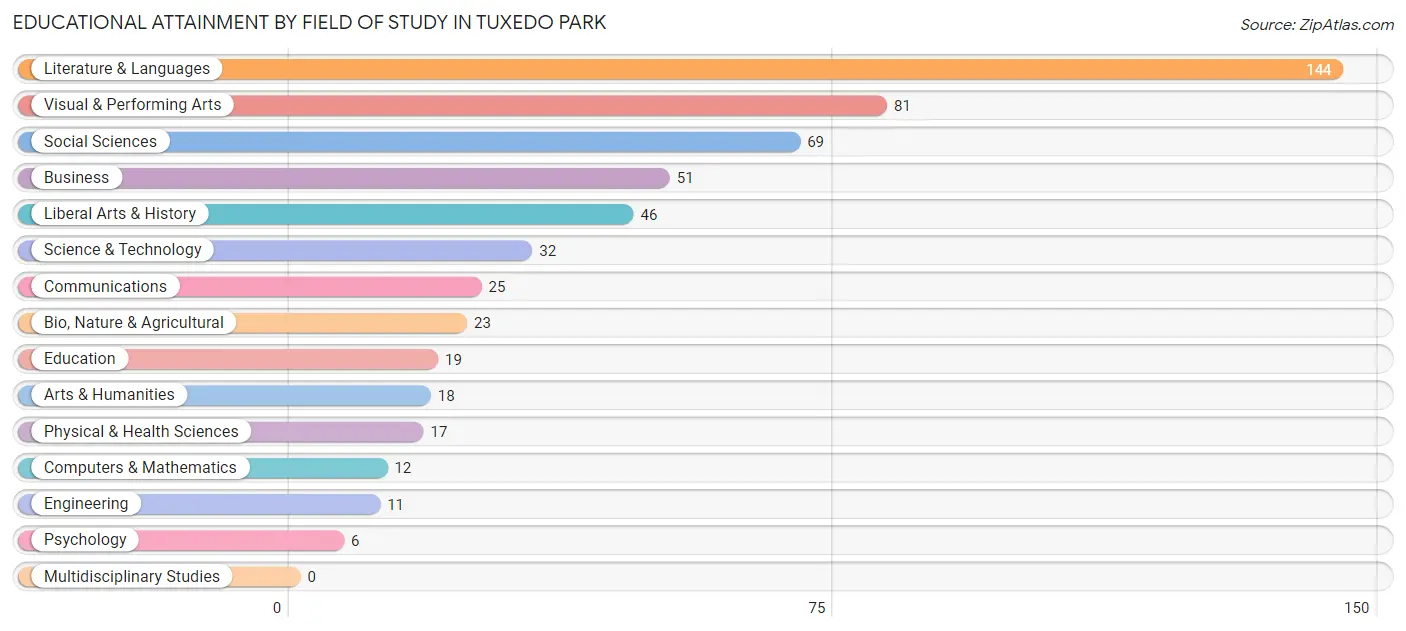
| Field of Study | # Graduates | % Graduates |
| Computers & Mathematics | 12 | 2.2% |
| Bio, Nature & Agricultural | 23 | 4.2% |
| Physical & Health Sciences | 17 | 3.1% |
| Psychology | 6 | 1.1% |
| Social Sciences | 69 | 12.4% |
| Engineering | 11 | 2.0% |
| Multidisciplinary Studies | 0 | 0.0% |
| Science & Technology | 32 | 5.8% |
| Business | 51 | 9.2% |
| Education | 19 | 3.4% |
| Literature & Languages | 144 | 26.0% |
| Liberal Arts & History | 46 | 8.3% |
| Visual & Performing Arts | 81 | 14.6% |
| Communications | 25 | 4.5% |
| Arts & Humanities | 18 | 3.3% |
| Total | 554 | 100.0% |
Transportation & Commute in Tuxedo Park
Vehicle Availability by Sex in Tuxedo Park
The most prevalent vehicle ownership categories in Tuxedo Park are males with 5 or more vehicles (130, accounting for 44.2%) and females with 5 or more vehicles (4, making up 134.0%).
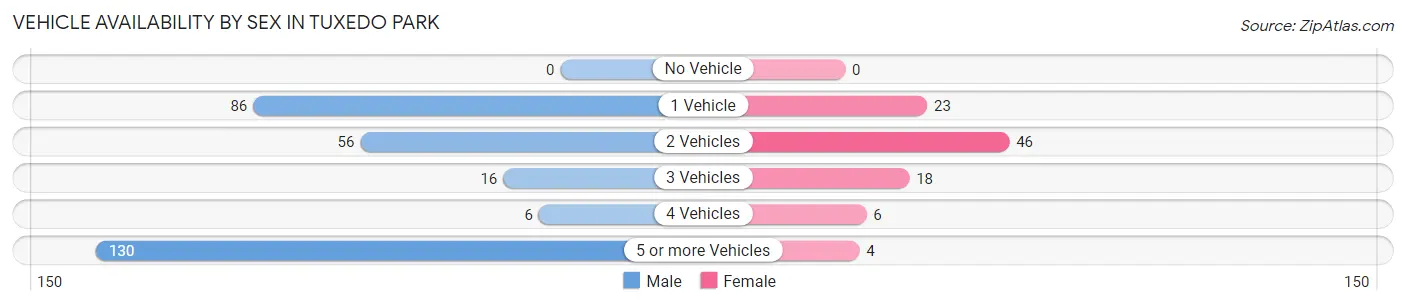
| Vehicles Available | Male | Female |
| No Vehicle | 0 (0.0%) | 0 (0.0%) |
| 1 Vehicle | 86 (29.2%) | 23 (23.7%) |
| 2 Vehicles | 56 (19.1%) | 46 (47.4%) |
| 3 Vehicles | 16 (5.4%) | 18 (18.6%) |
| 4 Vehicles | 6 (2.0%) | 6 (6.2%) |
| 5 or more Vehicles | 130 (44.2%) | 4 (4.1%) |
| Total | 294 (100.0%) | 97 (100.0%) |
Commute Time in Tuxedo Park
The most frequently occuring commute durations in Tuxedo Park are 25 to 29 minutes (34 commuters, 16.2%), 60 to 89 minutes (33 commuters, 15.7%), and 90 or more minutes (30 commuters, 14.3%).
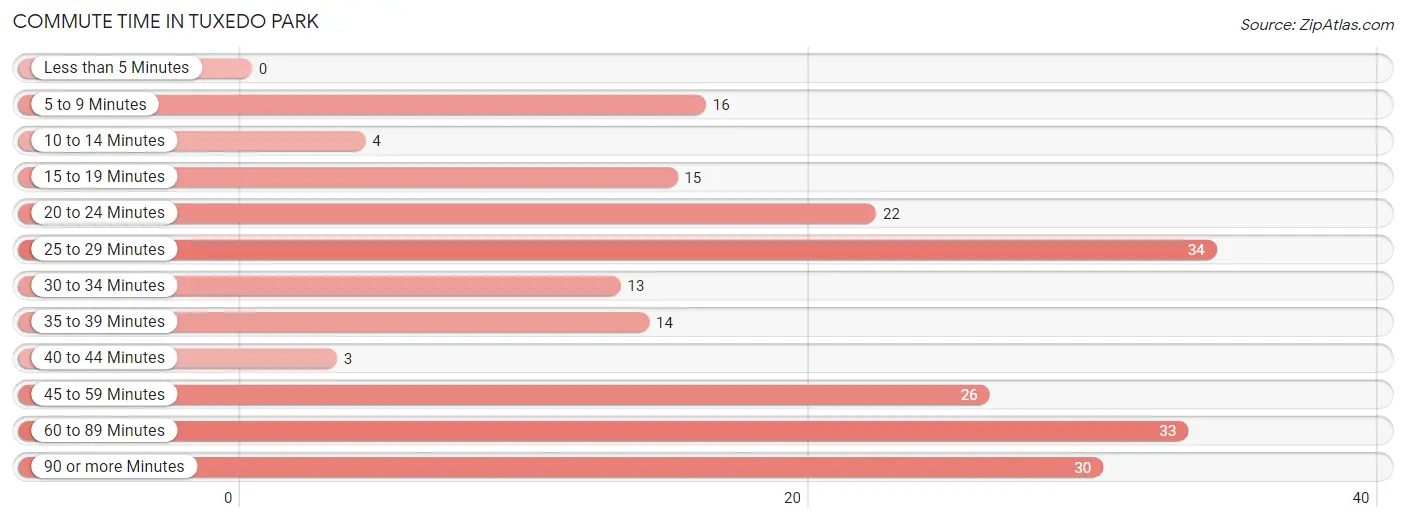
| Commute Time | # Commuters | % Commuters |
| Less than 5 Minutes | 0 | 0.0% |
| 5 to 9 Minutes | 16 | 7.6% |
| 10 to 14 Minutes | 4 | 1.9% |
| 15 to 19 Minutes | 15 | 7.1% |
| 20 to 24 Minutes | 22 | 10.5% |
| 25 to 29 Minutes | 34 | 16.2% |
| 30 to 34 Minutes | 13 | 6.2% |
| 35 to 39 Minutes | 14 | 6.7% |
| 40 to 44 Minutes | 3 | 1.4% |
| 45 to 59 Minutes | 26 | 12.4% |
| 60 to 89 Minutes | 33 | 15.7% |
| 90 or more Minutes | 30 | 14.3% |
Commute Time by Sex in Tuxedo Park
The most common commute times in Tuxedo Park are 25 to 29 minutes (31 commuters, 22.8%) for males and 90 or more minutes (15 commuters, 20.3%) for females.
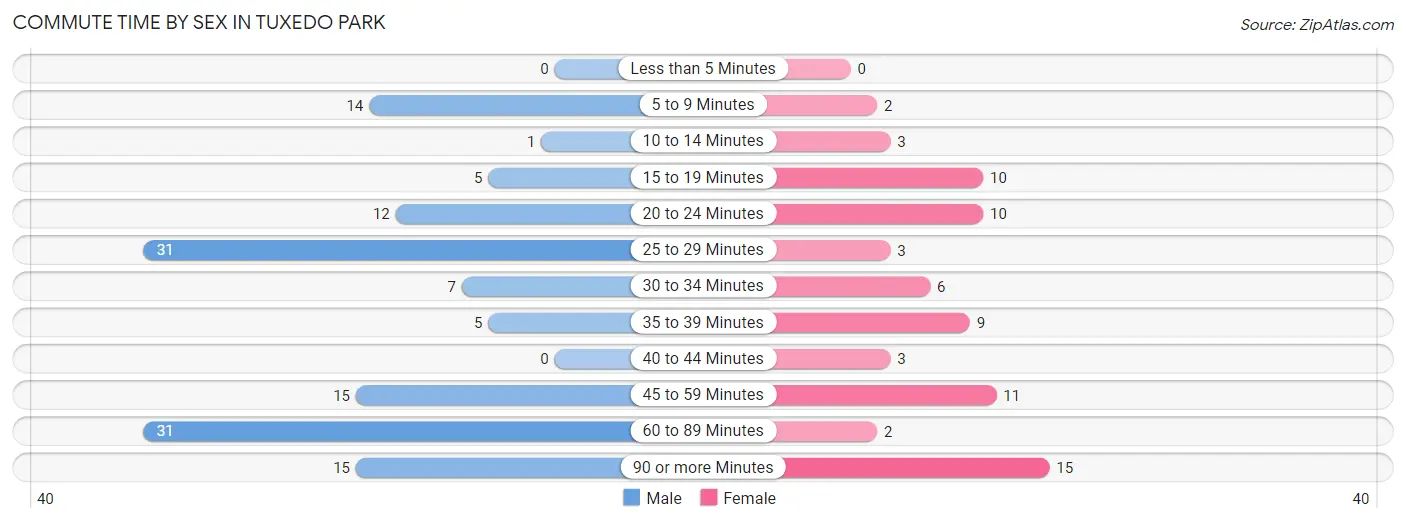
| Commute Time | Male | Female |
| Less than 5 Minutes | 0 (0.0%) | 0 (0.0%) |
| 5 to 9 Minutes | 14 (10.3%) | 2 (2.7%) |
| 10 to 14 Minutes | 1 (0.7%) | 3 (4.1%) |
| 15 to 19 Minutes | 5 (3.7%) | 10 (13.5%) |
| 20 to 24 Minutes | 12 (8.8%) | 10 (13.5%) |
| 25 to 29 Minutes | 31 (22.8%) | 3 (4.1%) |
| 30 to 34 Minutes | 7 (5.1%) | 6 (8.1%) |
| 35 to 39 Minutes | 5 (3.7%) | 9 (12.2%) |
| 40 to 44 Minutes | 0 (0.0%) | 3 (4.1%) |
| 45 to 59 Minutes | 15 (11.0%) | 11 (14.9%) |
| 60 to 89 Minutes | 31 (22.8%) | 2 (2.7%) |
| 90 or more Minutes | 15 (11.0%) | 15 (20.3%) |
Time of Departure to Work by Sex in Tuxedo Park
The most frequent times of departure to work in Tuxedo Park are 11:00 AM to 11:59 AM (29, 21.3%) for males and 7:00 AM to 7:29 AM (13, 17.6%) for females.
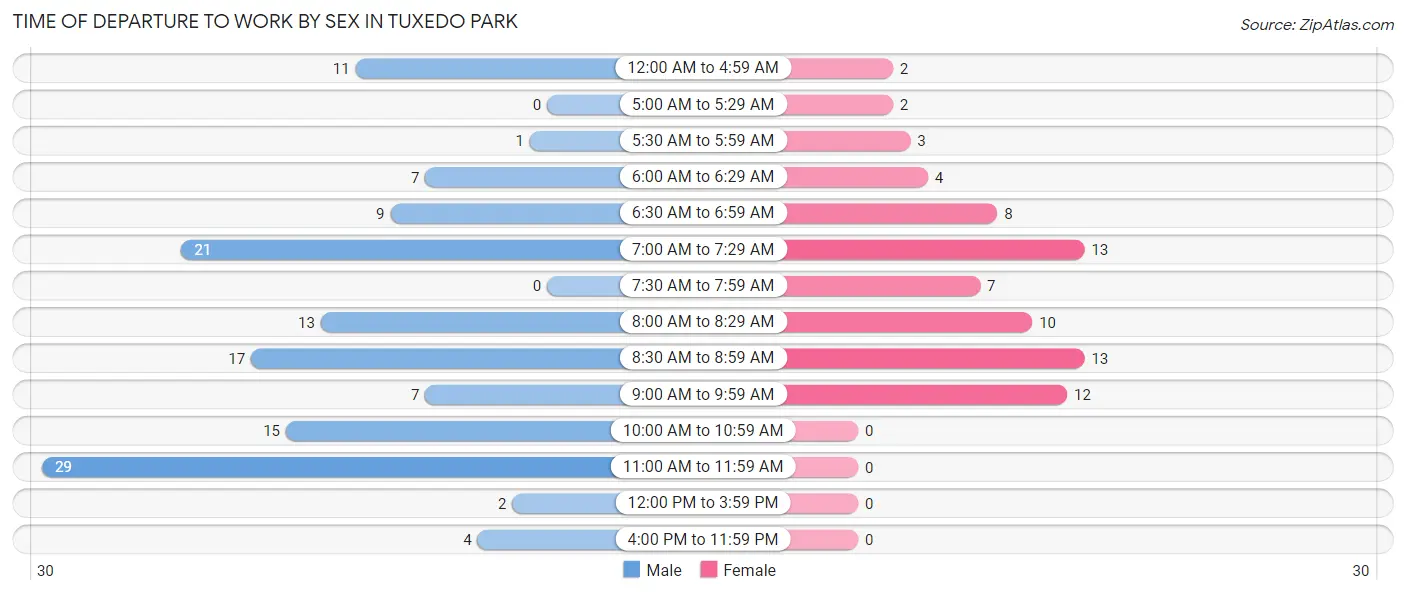
| Time of Departure | Male | Female |
| 12:00 AM to 4:59 AM | 11 (8.1%) | 2 (2.7%) |
| 5:00 AM to 5:29 AM | 0 (0.0%) | 2 (2.7%) |
| 5:30 AM to 5:59 AM | 1 (0.7%) | 3 (4.1%) |
| 6:00 AM to 6:29 AM | 7 (5.1%) | 4 (5.4%) |
| 6:30 AM to 6:59 AM | 9 (6.6%) | 8 (10.8%) |
| 7:00 AM to 7:29 AM | 21 (15.4%) | 13 (17.6%) |
| 7:30 AM to 7:59 AM | 0 (0.0%) | 7 (9.5%) |
| 8:00 AM to 8:29 AM | 13 (9.6%) | 10 (13.5%) |
| 8:30 AM to 8:59 AM | 17 (12.5%) | 13 (17.6%) |
| 9:00 AM to 9:59 AM | 7 (5.1%) | 12 (16.2%) |
| 10:00 AM to 10:59 AM | 15 (11.0%) | 0 (0.0%) |
| 11:00 AM to 11:59 AM | 29 (21.3%) | 0 (0.0%) |
| 12:00 PM to 3:59 PM | 2 (1.5%) | 0 (0.0%) |
| 4:00 PM to 11:59 PM | 4 (2.9%) | 0 (0.0%) |
| Total | 136 (100.0%) | 74 (100.0%) |
Housing Occupancy in Tuxedo Park
Occupancy by Ownership in Tuxedo Park
Of the total 395 dwellings in Tuxedo Park, owner-occupied units account for 348 (88.1%), while renter-occupied units make up 47 (11.9%).
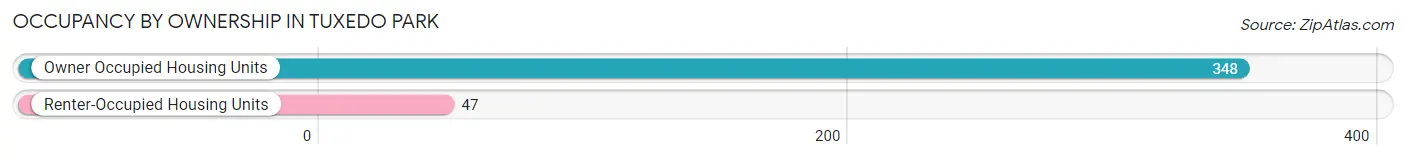
| Occupancy | # Housing Units | % Housing Units |
| Owner Occupied Housing Units | 348 | 88.1% |
| Renter-Occupied Housing Units | 47 | 11.9% |
| Total Occupied Housing Units | 395 | 100.0% |
Occupancy by Household Size in Tuxedo Park
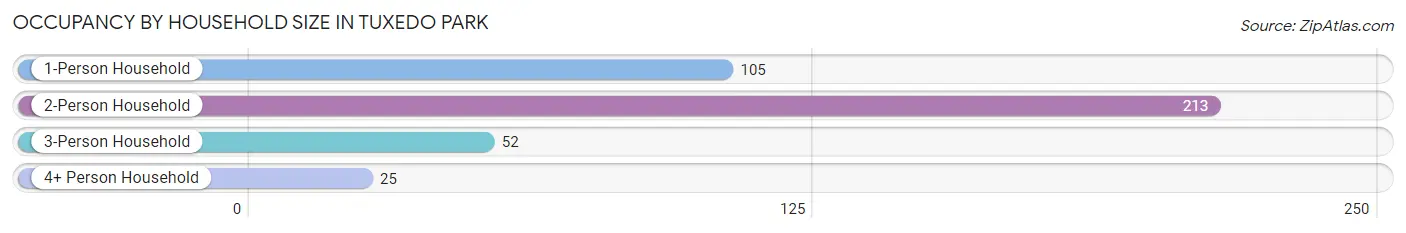
| Household Size | # Housing Units | % Housing Units |
| 1-Person Household | 105 | 26.6% |
| 2-Person Household | 213 | 53.9% |
| 3-Person Household | 52 | 13.2% |
| 4+ Person Household | 25 | 6.3% |
| Total Housing Units | 395 | 100.0% |
Occupancy by Ownership by Household Size in Tuxedo Park
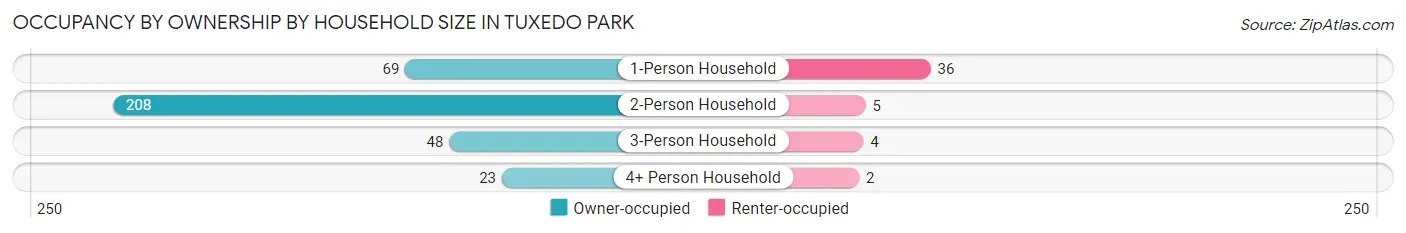
| Household Size | Owner-occupied | Renter-occupied |
| 1-Person Household | 69 (65.7%) | 36 (34.3%) |
| 2-Person Household | 208 (97.7%) | 5 (2.4%) |
| 3-Person Household | 48 (92.3%) | 4 (7.7%) |
| 4+ Person Household | 23 (92.0%) | 2 (8.0%) |
| Total Housing Units | 348 (88.1%) | 47 (11.9%) |
Occupancy by Educational Attainment in Tuxedo Park
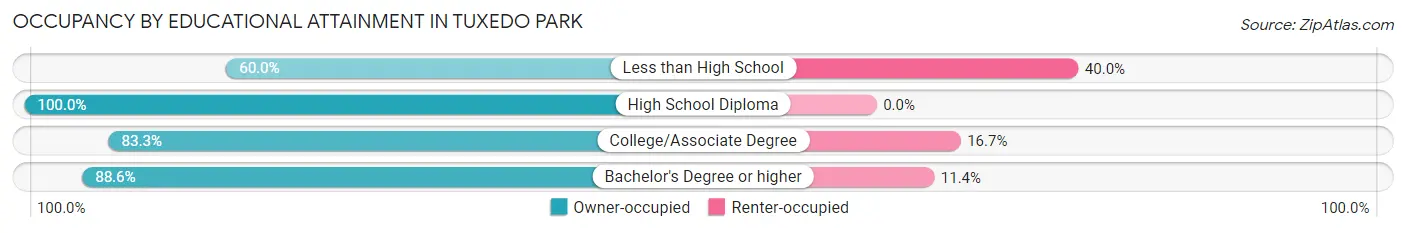
| Household Size | Owner-occupied | Renter-occupied |
| Less than High School | 3 (60.0%) | 2 (40.0%) |
| High School Diploma | 2 (100.0%) | 0 (0.0%) |
| College/Associate Degree | 10 (83.3%) | 2 (16.7%) |
| Bachelor's Degree or higher | 333 (88.6%) | 43 (11.4%) |
Occupancy by Age of Householder in Tuxedo Park
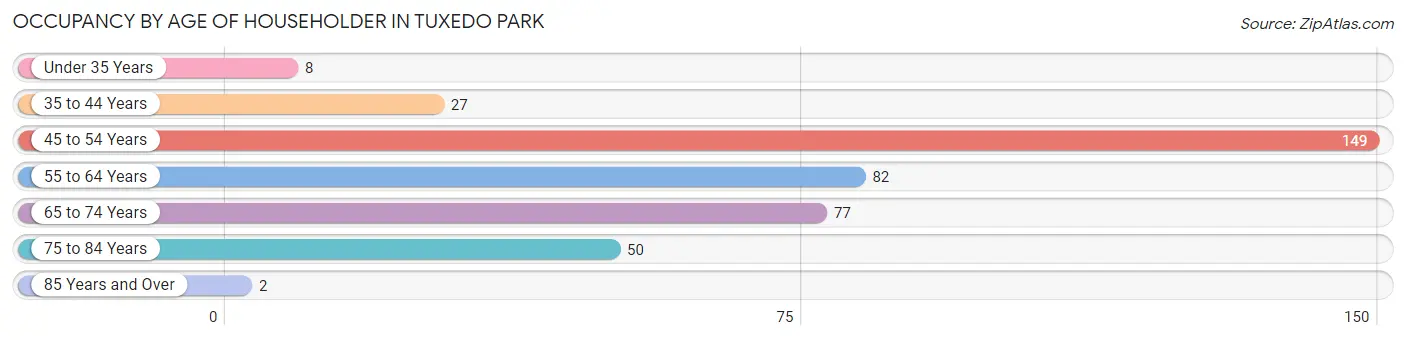
| Age Bracket | # Households | % Households |
| Under 35 Years | 8 | 2.0% |
| 35 to 44 Years | 27 | 6.8% |
| 45 to 54 Years | 149 | 37.7% |
| 55 to 64 Years | 82 | 20.8% |
| 65 to 74 Years | 77 | 19.5% |
| 75 to 84 Years | 50 | 12.7% |
| 85 Years and Over | 2 | 0.5% |
| Total | 395 | 100.0% |
Housing Finances in Tuxedo Park
Median Income by Occupancy in Tuxedo Park
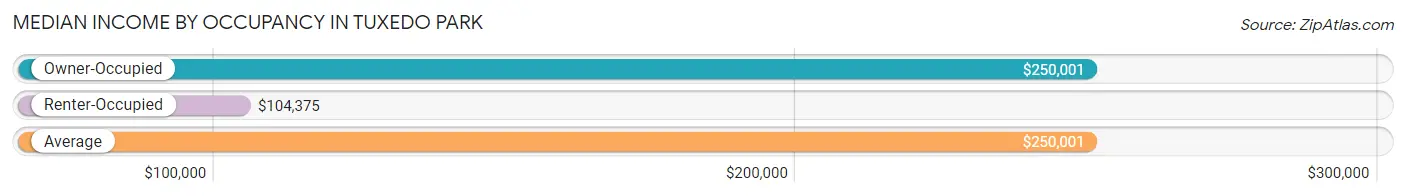
| Occupancy Type | # Households | Median Income |
| Owner-Occupied | 348 (88.1%) | $250,001 |
| Renter-Occupied | 47 (11.9%) | $104,375 |
| Average | 395 (100.0%) | $250,001 |
Occupancy by Householder Income Bracket in Tuxedo Park
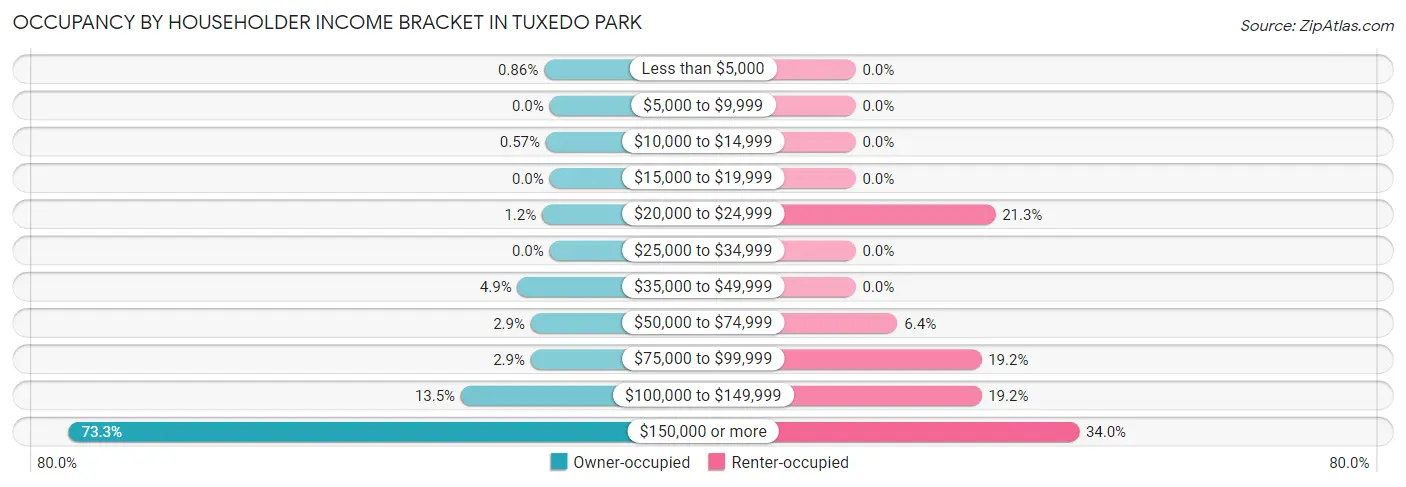
| Income Bracket | Owner-occupied | Renter-occupied |
| Less than $5,000 | 3 (0.9%) | 0 (0.0%) |
| $5,000 to $9,999 | 0 (0.0%) | 0 (0.0%) |
| $10,000 to $14,999 | 2 (0.6%) | 0 (0.0%) |
| $15,000 to $19,999 | 0 (0.0%) | 0 (0.0%) |
| $20,000 to $24,999 | 4 (1.1%) | 10 (21.3%) |
| $25,000 to $34,999 | 0 (0.0%) | 0 (0.0%) |
| $35,000 to $49,999 | 17 (4.9%) | 0 (0.0%) |
| $50,000 to $74,999 | 10 (2.9%) | 3 (6.4%) |
| $75,000 to $99,999 | 10 (2.9%) | 9 (19.2%) |
| $100,000 to $149,999 | 47 (13.5%) | 9 (19.2%) |
| $150,000 or more | 255 (73.3%) | 16 (34.0%) |
| Total | 348 (100.0%) | 47 (100.0%) |
Monthly Housing Cost Tiers in Tuxedo Park
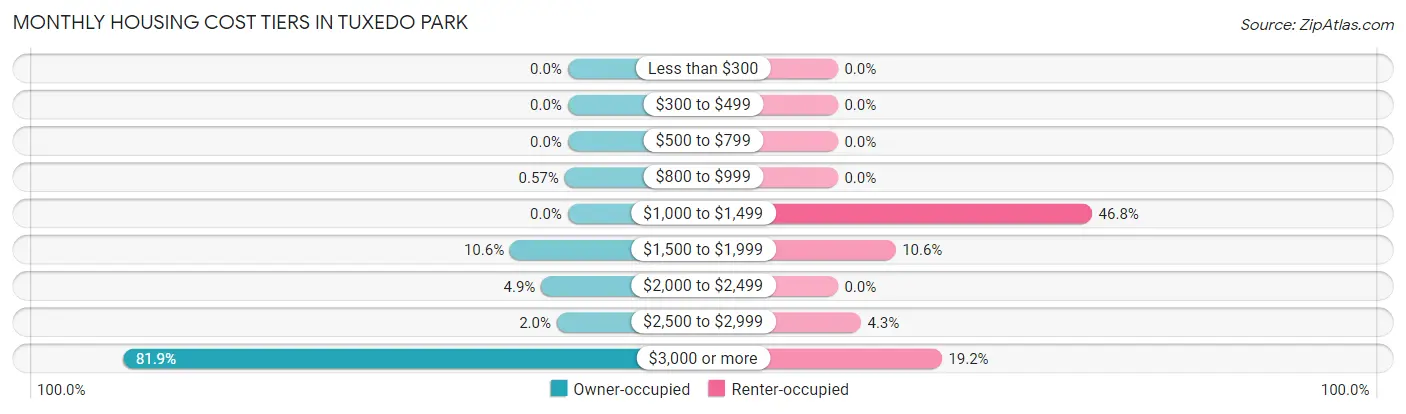
| Monthly Cost | Owner-occupied | Renter-occupied |
| Less than $300 | 0 (0.0%) | 0 (0.0%) |
| $300 to $499 | 0 (0.0%) | 0 (0.0%) |
| $500 to $799 | 0 (0.0%) | 0 (0.0%) |
| $800 to $999 | 2 (0.6%) | 0 (0.0%) |
| $1,000 to $1,499 | 0 (0.0%) | 22 (46.8%) |
| $1,500 to $1,999 | 37 (10.6%) | 5 (10.6%) |
| $2,000 to $2,499 | 17 (4.9%) | 0 (0.0%) |
| $2,500 to $2,999 | 7 (2.0%) | 2 (4.3%) |
| $3,000 or more | 285 (81.9%) | 9 (19.2%) |
| Total | 348 (100.0%) | 47 (100.0%) |
Physical Housing Characteristics in Tuxedo Park
Housing Structures in Tuxedo Park
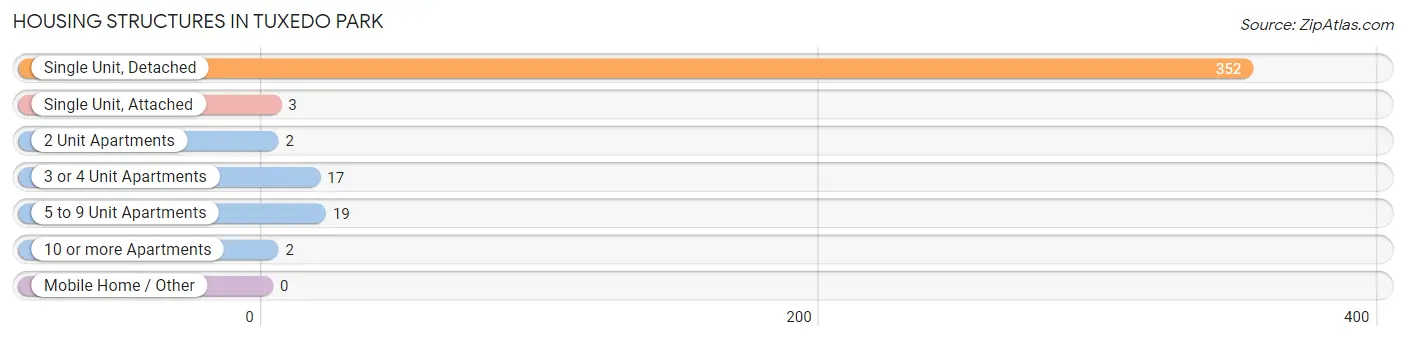
| Structure Type | # Housing Units | % Housing Units |
| Single Unit, Detached | 352 | 89.1% |
| Single Unit, Attached | 3 | 0.8% |
| 2 Unit Apartments | 2 | 0.5% |
| 3 or 4 Unit Apartments | 17 | 4.3% |
| 5 to 9 Unit Apartments | 19 | 4.8% |
| 10 or more Apartments | 2 | 0.5% |
| Mobile Home / Other | 0 | 0.0% |
| Total | 395 | 100.0% |
Housing Structures by Occupancy in Tuxedo Park
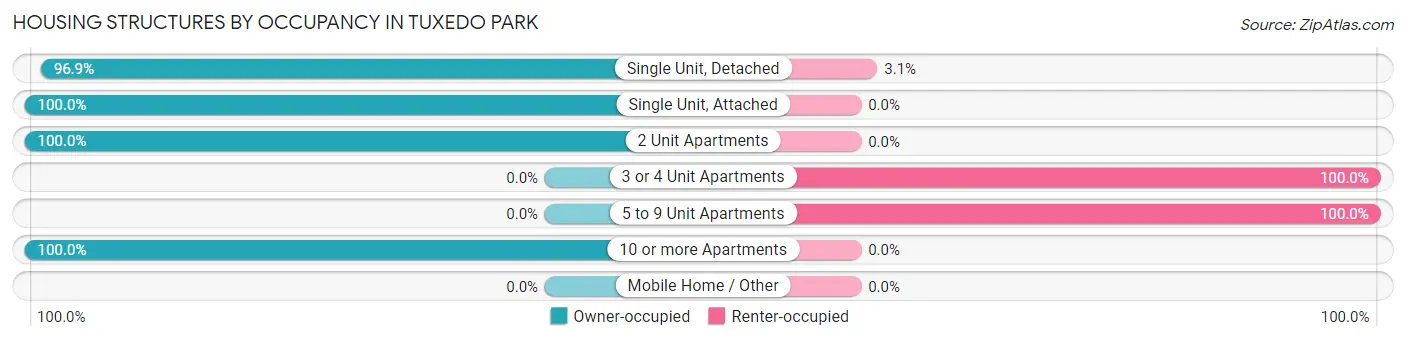
| Structure Type | Owner-occupied | Renter-occupied |
| Single Unit, Detached | 341 (96.9%) | 11 (3.1%) |
| Single Unit, Attached | 3 (100.0%) | 0 (0.0%) |
| 2 Unit Apartments | 2 (100.0%) | 0 (0.0%) |
| 3 or 4 Unit Apartments | 0 (0.0%) | 17 (100.0%) |
| 5 to 9 Unit Apartments | 0 (0.0%) | 19 (100.0%) |
| 10 or more Apartments | 2 (100.0%) | 0 (0.0%) |
| Mobile Home / Other | 0 (0.0%) | 0 (0.0%) |
| Total | 348 (88.1%) | 47 (11.9%) |
Housing Structures by Number of Rooms in Tuxedo Park
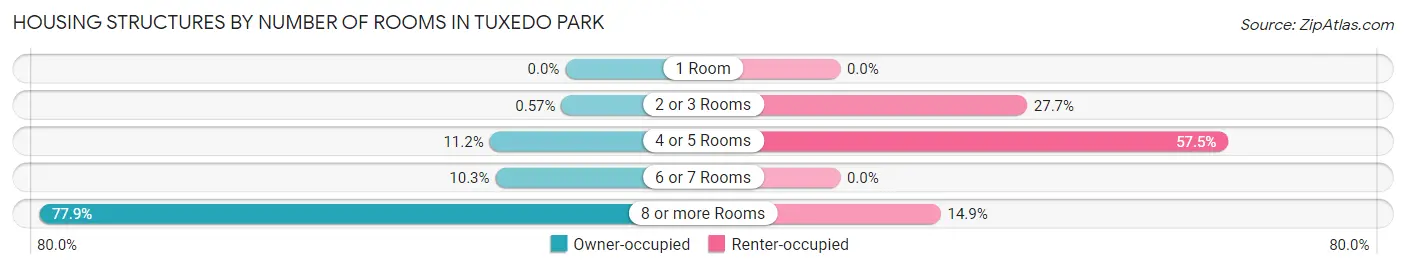
| Number of Rooms | Owner-occupied | Renter-occupied |
| 1 Room | 0 (0.0%) | 0 (0.0%) |
| 2 or 3 Rooms | 2 (0.6%) | 13 (27.7%) |
| 4 or 5 Rooms | 39 (11.2%) | 27 (57.5%) |
| 6 or 7 Rooms | 36 (10.3%) | 0 (0.0%) |
| 8 or more Rooms | 271 (77.9%) | 7 (14.9%) |
| Total | 348 (100.0%) | 47 (100.0%) |
Housing Structure by Heating Type in Tuxedo Park
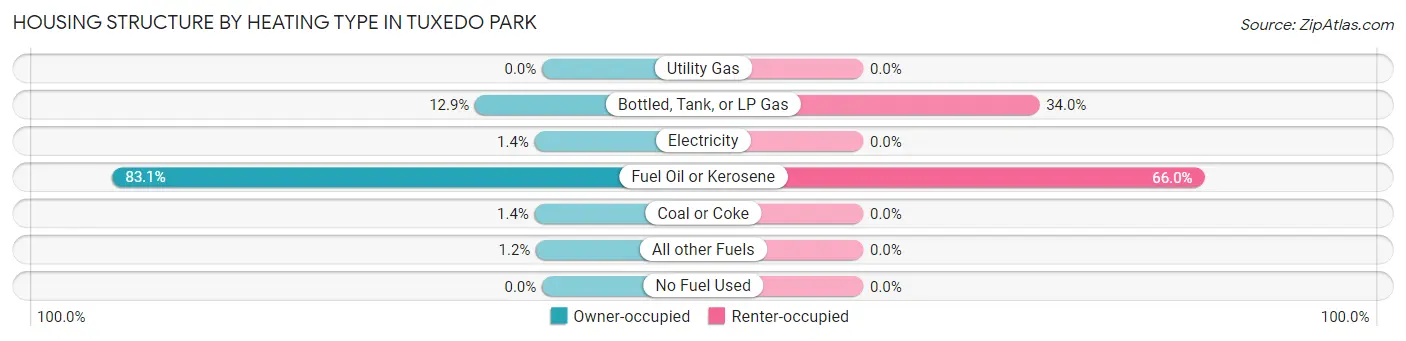
| Heating Type | Owner-occupied | Renter-occupied |
| Utility Gas | 0 (0.0%) | 0 (0.0%) |
| Bottled, Tank, or LP Gas | 45 (12.9%) | 16 (34.0%) |
| Electricity | 5 (1.4%) | 0 (0.0%) |
| Fuel Oil or Kerosene | 289 (83.1%) | 31 (66.0%) |
| Coal or Coke | 5 (1.4%) | 0 (0.0%) |
| All other Fuels | 4 (1.1%) | 0 (0.0%) |
| No Fuel Used | 0 (0.0%) | 0 (0.0%) |
| Total | 348 (100.0%) | 47 (100.0%) |
Household Vehicle Usage in Tuxedo Park
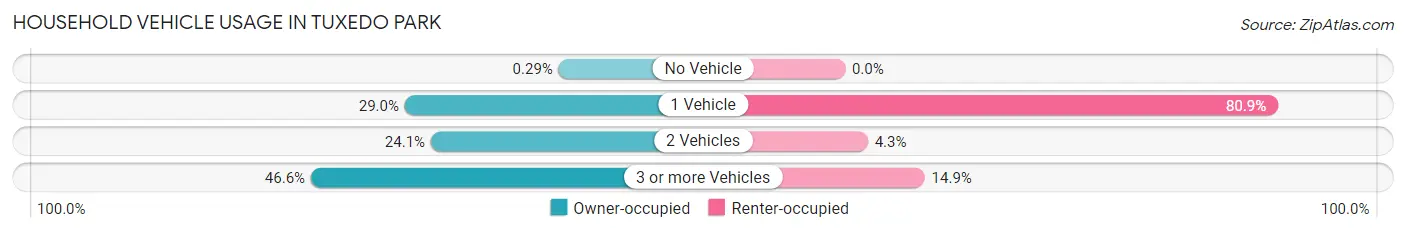
| Vehicles per Household | Owner-occupied | Renter-occupied |
| No Vehicle | 1 (0.3%) | 0 (0.0%) |
| 1 Vehicle | 101 (29.0%) | 38 (80.8%) |
| 2 Vehicles | 84 (24.1%) | 2 (4.3%) |
| 3 or more Vehicles | 162 (46.6%) | 7 (14.9%) |
| Total | 348 (100.0%) | 47 (100.0%) |
Real Estate & Mortgages in Tuxedo Park
Real Estate and Mortgage Overview in Tuxedo Park
| Characteristic | Without Mortgage | With Mortgage |
| Housing Units | 215 | 133 |
| Median Property Value | $2,000,001 | $892,400 |
| Median Household Income | $250,001 | $71 |
| Monthly Housing Costs | $1,501 | $94 |
| Real Estate Taxes | $10,001 | $0 |
Property Value by Mortgage Status in Tuxedo Park
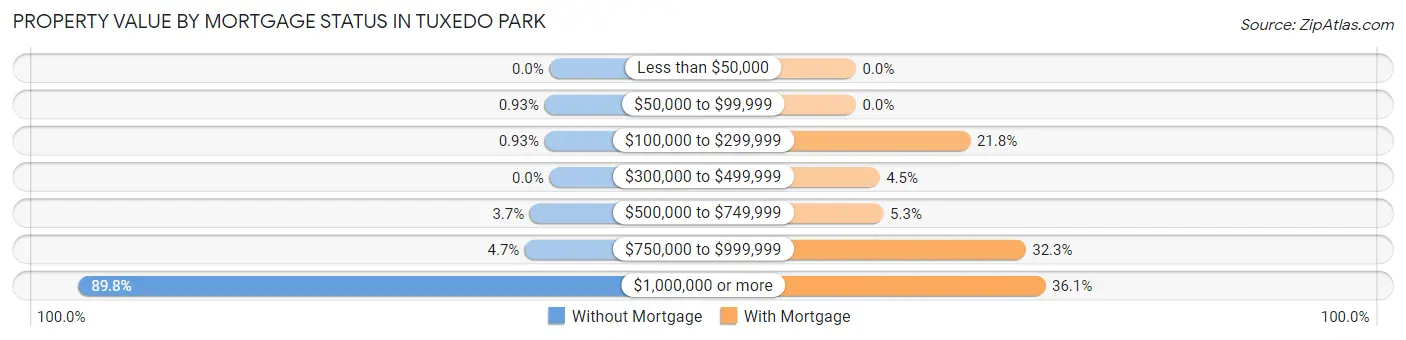
| Property Value | Without Mortgage | With Mortgage |
| Less than $50,000 | 0 (0.0%) | 0 (0.0%) |
| $50,000 to $99,999 | 2 (0.9%) | 0 (0.0%) |
| $100,000 to $299,999 | 2 (0.9%) | 29 (21.8%) |
| $300,000 to $499,999 | 0 (0.0%) | 6 (4.5%) |
| $500,000 to $749,999 | 8 (3.7%) | 7 (5.3%) |
| $750,000 to $999,999 | 10 (4.6%) | 43 (32.3%) |
| $1,000,000 or more | 193 (89.8%) | 48 (36.1%) |
| Total | 215 (100.0%) | 133 (100.0%) |
Household Income by Mortgage Status in Tuxedo Park
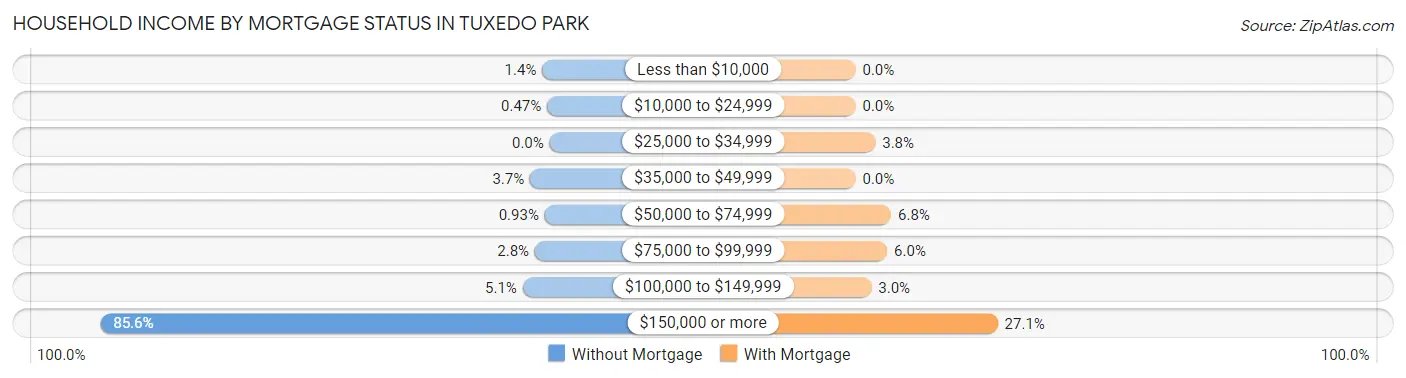
| Household Income | Without Mortgage | With Mortgage |
| Less than $10,000 | 3 (1.4%) | 0 (0.0%) |
| $10,000 to $24,999 | 1 (0.5%) | 0 (0.0%) |
| $25,000 to $34,999 | 0 (0.0%) | 5 (3.8%) |
| $35,000 to $49,999 | 8 (3.7%) | 0 (0.0%) |
| $50,000 to $74,999 | 2 (0.9%) | 9 (6.8%) |
| $75,000 to $99,999 | 6 (2.8%) | 8 (6.0%) |
| $100,000 to $149,999 | 11 (5.1%) | 4 (3.0%) |
| $150,000 or more | 184 (85.6%) | 36 (27.1%) |
| Total | 215 (100.0%) | 133 (100.0%) |
Property Value to Household Income Ratio in Tuxedo Park
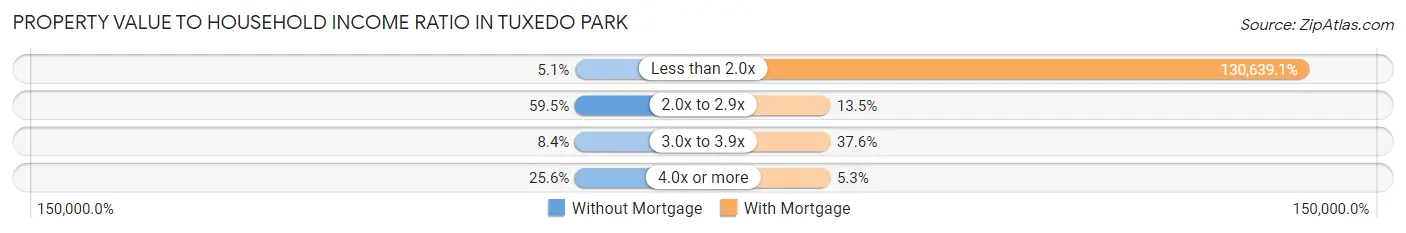
| Value-to-Income Ratio | Without Mortgage | With Mortgage |
| Less than 2.0x | 11 (5.1%) | 173,750 (130,639.1%) |
| 2.0x to 2.9x | 128 (59.5%) | 18 (13.5%) |
| 3.0x to 3.9x | 18 (8.4%) | 50 (37.6%) |
| 4.0x or more | 55 (25.6%) | 7 (5.3%) |
| Total | 215 (100.0%) | 133 (100.0%) |
Real Estate Taxes by Mortgage Status in Tuxedo Park
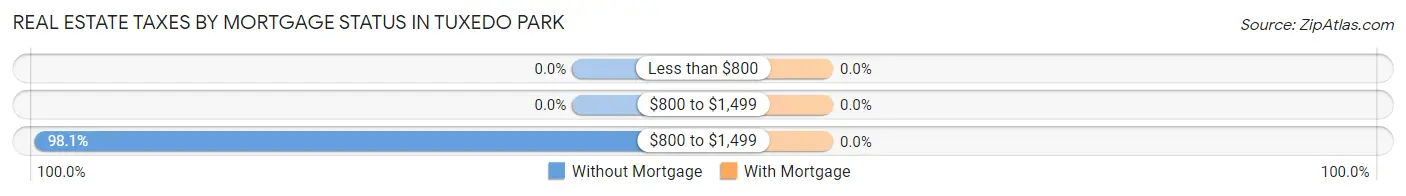
| Property Taxes | Without Mortgage | With Mortgage |
| Less than $800 | 0 (0.0%) | 0 (0.0%) |
| $800 to $1,499 | 0 (0.0%) | 0 (0.0%) |
| $800 to $1,499 | 211 (98.1%) | 0 (0.0%) |
| Total | 215 (100.0%) | 133 (100.0%) |
Health & Disability in Tuxedo Park
Health Insurance Coverage by Age in Tuxedo Park
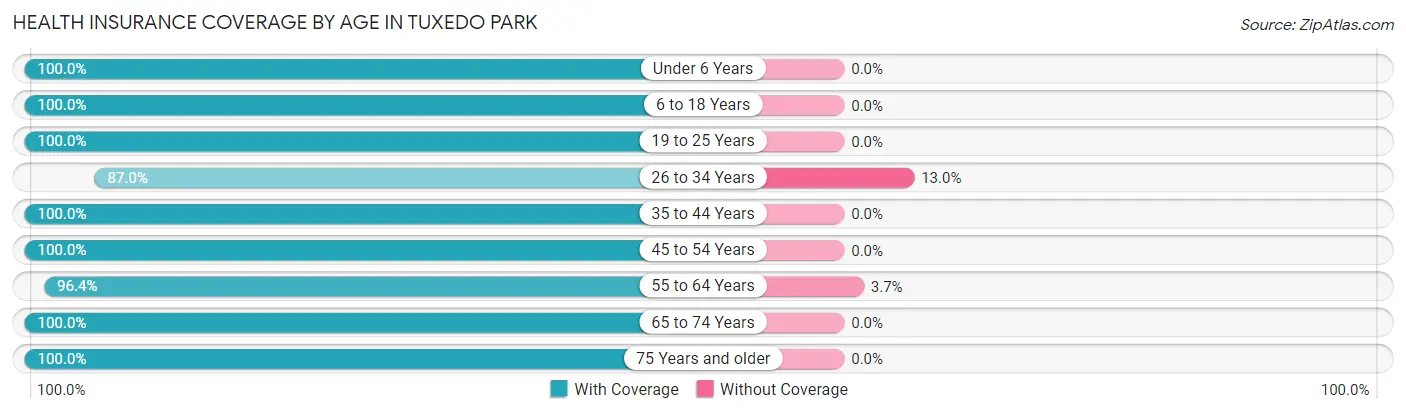
| Age Bracket | With Coverage | Without Coverage |
| Under 6 Years | 30 (100.0%) | 0 (0.0%) |
| 6 to 18 Years | 40 (100.0%) | 0 (0.0%) |
| 19 to 25 Years | 38 (100.0%) | 0 (0.0%) |
| 26 to 34 Years | 20 (87.0%) | 3 (13.0%) |
| 35 to 44 Years | 52 (100.0%) | 0 (0.0%) |
| 45 to 54 Years | 194 (100.0%) | 0 (0.0%) |
| 55 to 64 Years | 132 (96.4%) | 5 (3.6%) |
| 65 to 74 Years | 114 (100.0%) | 0 (0.0%) |
| 75 Years and older | 70 (100.0%) | 0 (0.0%) |
| Total | 690 (98.9%) | 8 (1.1%) |
Health Insurance Coverage by Citizenship Status in Tuxedo Park
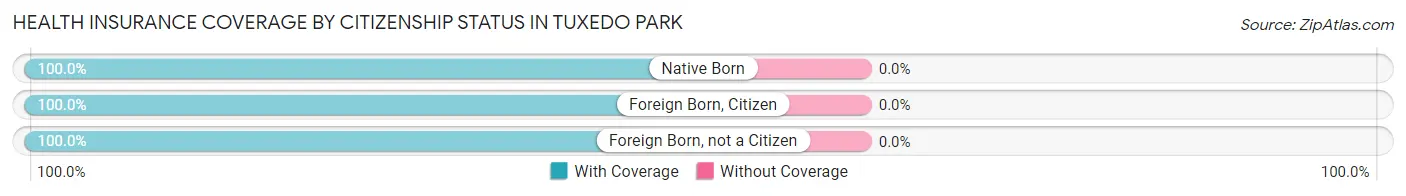
| Citizenship Status | With Coverage | Without Coverage |
| Native Born | 30 (100.0%) | 0 (0.0%) |
| Foreign Born, Citizen | 40 (100.0%) | 0 (0.0%) |
| Foreign Born, not a Citizen | 38 (100.0%) | 0 (0.0%) |
Health Insurance Coverage by Household Income in Tuxedo Park
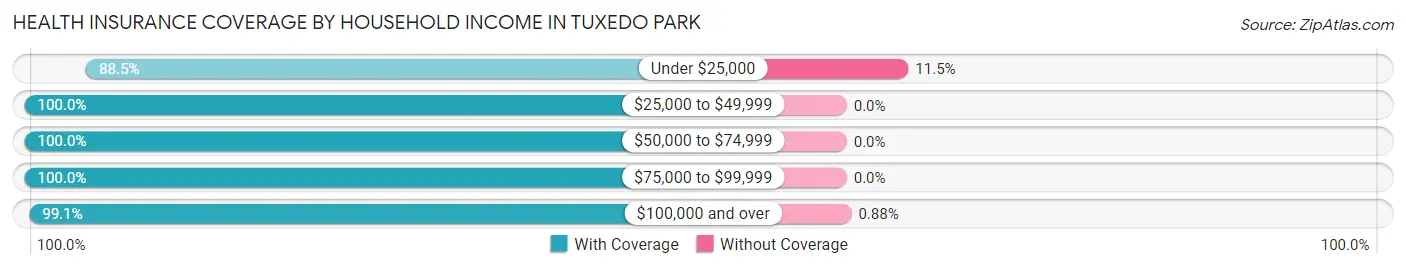
| Household Income | With Coverage | Without Coverage |
| Under $25,000 | 23 (88.5%) | 3 (11.5%) |
| $25,000 to $49,999 | 46 (100.0%) | 0 (0.0%) |
| $50,000 to $74,999 | 21 (100.0%) | 0 (0.0%) |
| $75,000 to $99,999 | 36 (100.0%) | 0 (0.0%) |
| $100,000 and over | 564 (99.1%) | 5 (0.9%) |
Public vs Private Health Insurance Coverage by Age in Tuxedo Park
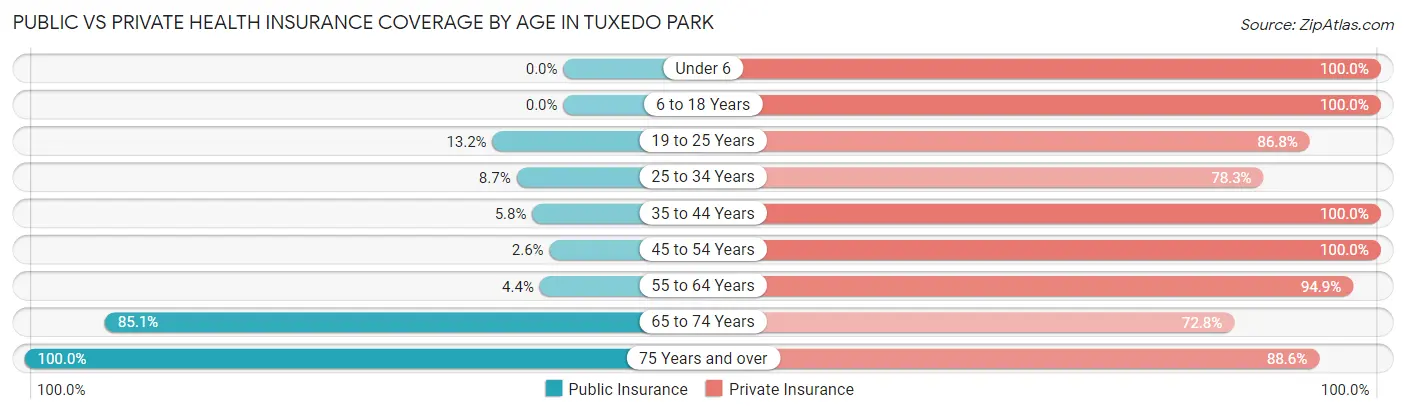
| Age Bracket | Public Insurance | Private Insurance |
| Under 6 | 0 (0.0%) | 30 (100.0%) |
| 6 to 18 Years | 0 (0.0%) | 40 (100.0%) |
| 19 to 25 Years | 5 (13.2%) | 33 (86.8%) |
| 25 to 34 Years | 2 (8.7%) | 18 (78.3%) |
| 35 to 44 Years | 3 (5.8%) | 52 (100.0%) |
| 45 to 54 Years | 5 (2.6%) | 194 (100.0%) |
| 55 to 64 Years | 6 (4.4%) | 130 (94.9%) |
| 65 to 74 Years | 97 (85.1%) | 83 (72.8%) |
| 75 Years and over | 70 (100.0%) | 62 (88.6%) |
| Total | 188 (26.9%) | 642 (92.0%) |
Disability Status by Sex by Age in Tuxedo Park
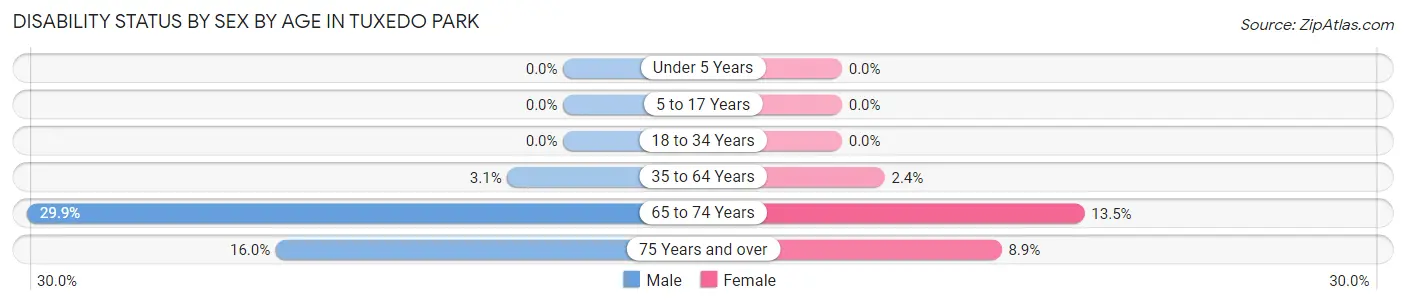
| Age Bracket | Male | Female |
| Under 5 Years | 0 (0.0%) | 0 (0.0%) |
| 5 to 17 Years | 0 (0.0%) | 0 (0.0%) |
| 18 to 34 Years | 0 (0.0%) | 0 (0.0%) |
| 35 to 64 Years | 8 (3.1%) | 3 (2.4%) |
| 65 to 74 Years | 23 (29.9%) | 5 (13.5%) |
| 75 Years and over | 4 (16.0%) | 4 (8.9%) |
Disability Class by Sex by Age in Tuxedo Park
Disability Class: Hearing Difficulty
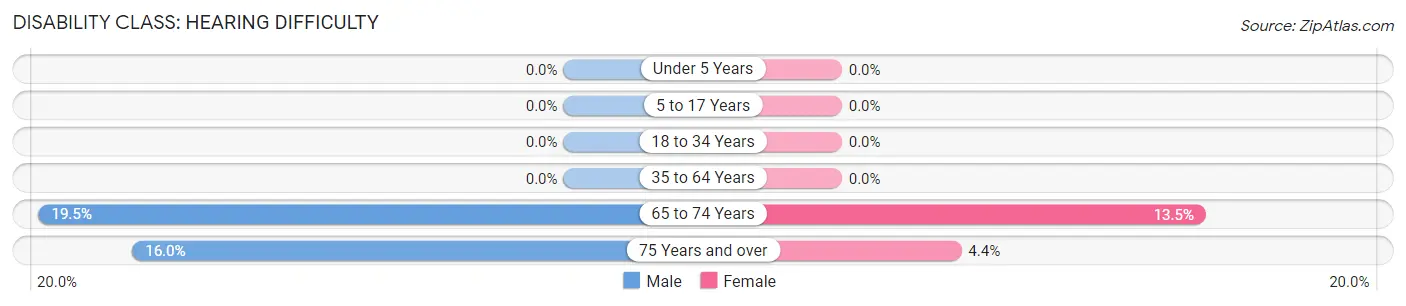
| Age Bracket | Male | Female |
| Under 5 Years | 0 (0.0%) | 0 (0.0%) |
| 5 to 17 Years | 0 (0.0%) | 0 (0.0%) |
| 18 to 34 Years | 0 (0.0%) | 0 (0.0%) |
| 35 to 64 Years | 0 (0.0%) | 0 (0.0%) |
| 65 to 74 Years | 15 (19.5%) | 5 (13.5%) |
| 75 Years and over | 4 (16.0%) | 2 (4.4%) |
Disability Class: Vision Difficulty
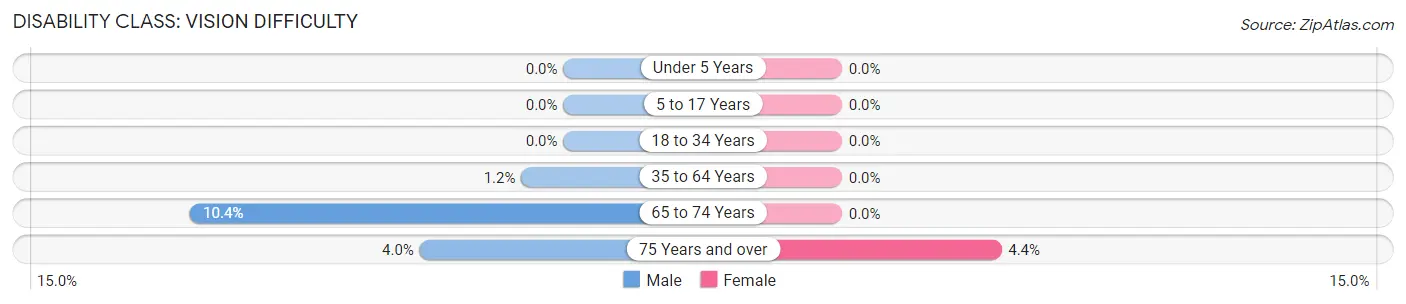
| Age Bracket | Male | Female |
| Under 5 Years | 0 (0.0%) | 0 (0.0%) |
| 5 to 17 Years | 0 (0.0%) | 0 (0.0%) |
| 18 to 34 Years | 0 (0.0%) | 0 (0.0%) |
| 35 to 64 Years | 3 (1.2%) | 0 (0.0%) |
| 65 to 74 Years | 8 (10.4%) | 0 (0.0%) |
| 75 Years and over | 1 (4.0%) | 2 (4.4%) |
Disability Class: Cognitive Difficulty
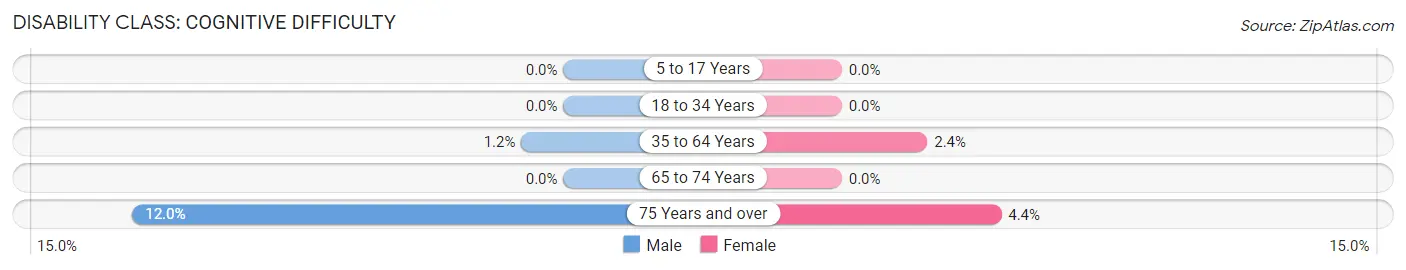
| Age Bracket | Male | Female |
| 5 to 17 Years | 0 (0.0%) | 0 (0.0%) |
| 18 to 34 Years | 0 (0.0%) | 0 (0.0%) |
| 35 to 64 Years | 3 (1.2%) | 3 (2.4%) |
| 65 to 74 Years | 0 (0.0%) | 0 (0.0%) |
| 75 Years and over | 3 (12.0%) | 2 (4.4%) |
Disability Class: Ambulatory Difficulty
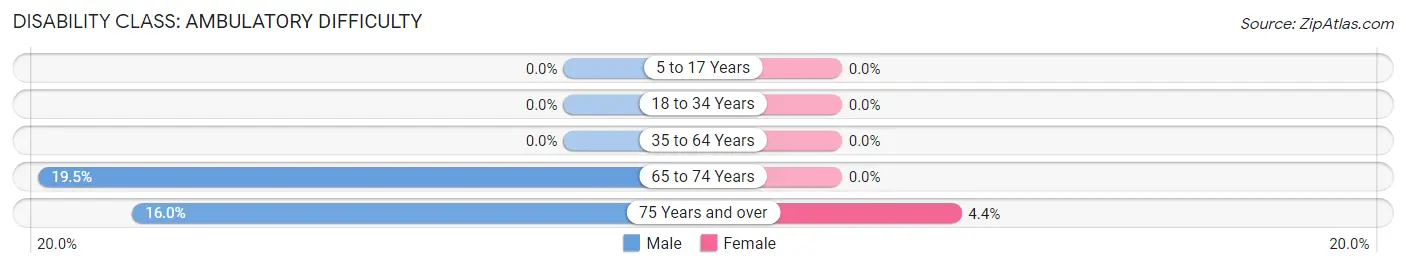
| Age Bracket | Male | Female |
| 5 to 17 Years | 0 (0.0%) | 0 (0.0%) |
| 18 to 34 Years | 0 (0.0%) | 0 (0.0%) |
| 35 to 64 Years | 0 (0.0%) | 0 (0.0%) |
| 65 to 74 Years | 15 (19.5%) | 0 (0.0%) |
| 75 Years and over | 4 (16.0%) | 2 (4.4%) |
Disability Class: Self-Care Difficulty
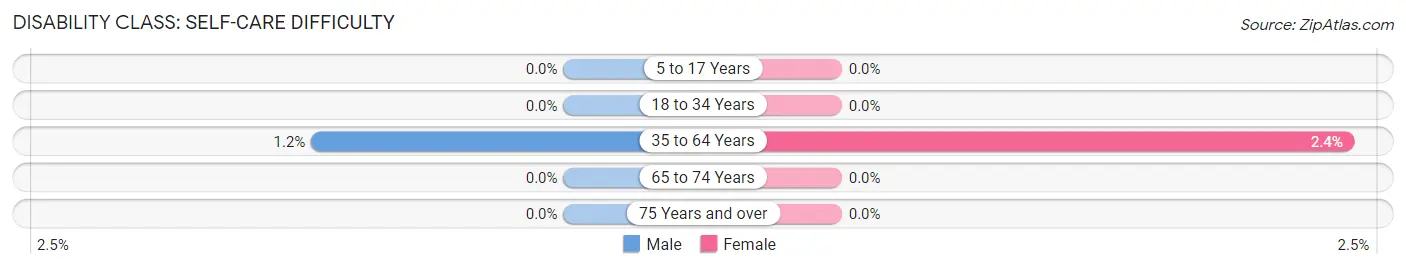
| Age Bracket | Male | Female |
| 5 to 17 Years | 0 (0.0%) | 0 (0.0%) |
| 18 to 34 Years | 0 (0.0%) | 0 (0.0%) |
| 35 to 64 Years | 3 (1.2%) | 3 (2.4%) |
| 65 to 74 Years | 0 (0.0%) | 0 (0.0%) |
| 75 Years and over | 0 (0.0%) | 0 (0.0%) |
Technology Access in Tuxedo Park
Computing Device Access in Tuxedo Park
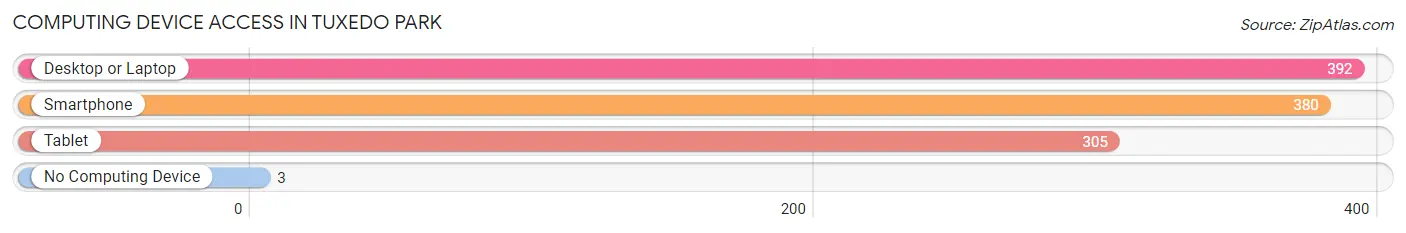
| Device Type | # Households | % Households |
| Desktop or Laptop | 392 | 99.2% |
| Smartphone | 380 | 96.2% |
| Tablet | 305 | 77.2% |
| No Computing Device | 3 | 0.8% |
| Total | 395 | 100.0% |
Internet Access in Tuxedo Park
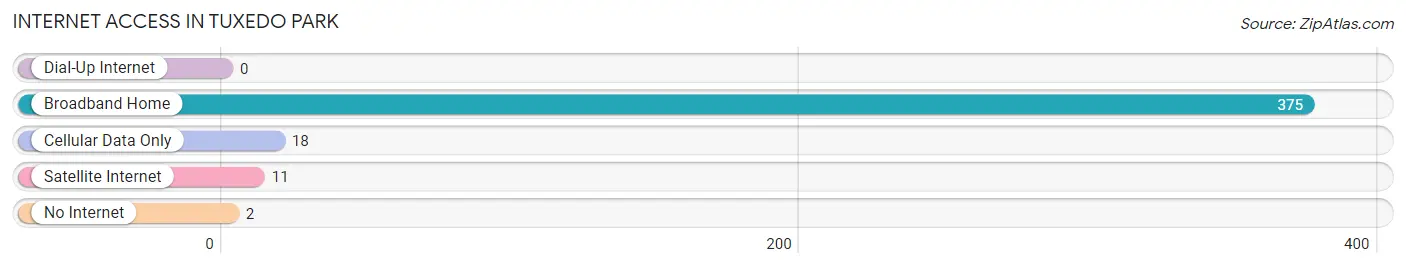
| Internet Type | # Households | % Households |
| Dial-Up Internet | 0 | 0.0% |
| Broadband Home | 375 | 94.9% |
| Cellular Data Only | 18 | 4.6% |
| Satellite Internet | 11 | 2.8% |
| No Internet | 2 | 0.5% |
| Total | 395 | 100.0% |
Tuxedo Park Summary
Tuxedo Park is a small village located in Orange County, New York, United States. It is situated in the Ramapo Mountains, about 40 miles northwest of New York City. The village is known for its wealthy residents, its historic architecture, and its picturesque setting.
History
Tuxedo Park was founded in 1886 by Pierre Lorillard IV, a tobacco magnate. He purchased the land from the Ramapo Indians and named it after the tuxedo, a formal suit he had recently introduced to the United States. Lorillard envisioned Tuxedo Park as a luxurious retreat for the wealthy and powerful. He built a grand hotel, a casino, and a private club, and he invited prominent guests to stay in the village.
In the early 1900s, Tuxedo Park became a popular destination for the wealthy and powerful. It was home to many prominent families, including the Vanderbilts, the Astors, and the Rockefellers. The village was also home to a number of prominent architects, including Stanford White and Richard Morris Hunt.
Geography
Tuxedo Park is located in the Ramapo Mountains, about 40 miles northwest of New York City. The village is situated on a plateau, surrounded by hills and forests. The village is bordered by the Ramapo River to the north and the Tuxedo Lake to the south.
The village covers an area of 1.2 square miles and has a population of about 1,000 people. The village is located in the Town of Tuxedo, which covers an area of 33.2 square miles and has a population of about 11,000 people.
Economy
Tuxedo Park is a wealthy village, with a median household income of $150,000. The village is home to many wealthy residents, including celebrities, business executives, and financiers.
The village is home to a number of businesses, including restaurants, boutiques, and art galleries. The village is also home to a number of historic sites, including the Tuxedo Park Library and the Tuxedo Park Club.
Demographics
Tuxedo Park has a population of about 1,000 people. The village is predominantly white, with about 95% of the population identifying as white. The village is also home to a small number of African Americans, Hispanics, and Asians.
The village has a median age of 45. About 75% of the population is married, and about 25% of the population is divorced. The village has a median household income of $150,000.
Conclusion
Tuxedo Park is a small village located in Orange County, New York. It is known for its wealthy residents, its historic architecture, and its picturesque setting. The village has a population of about 1,000 people and a median household income of $150,000. The village is predominantly white, with a small number of African Americans, Hispanics, and Asians. Tuxedo Park is home to a number of businesses, including restaurants, boutiques, and art galleries. The village is also home to a number of historic sites, including the Tuxedo Park Library and the Tuxedo Park Club.
Common Questions
What is Per Capita Income in Tuxedo Park?
Per Capita income in Tuxedo Park is $340,699.
What is the Median Family Income in Tuxedo Park?
Median Family Income in Tuxedo Park is $250,001.
What is the Median Household income in Tuxedo Park?
Median Household Income in Tuxedo Park is $250,001.
What is Income or Wage Gap in Tuxedo Park?
Income or Wage Gap in Tuxedo Park is 69.4%.
Women in Tuxedo Park earn 30.6 cents for every dollar earned by a man.
What is Inequality or Gini Index in Tuxedo Park?
Inequality or Gini Index in Tuxedo Park is 0.47.
What is the Total Population of Tuxedo Park?
Total Population of Tuxedo Park is 700.
What is the Total Male Population of Tuxedo Park?
Total Male Population of Tuxedo Park is 421.
What is the Total Female Population of Tuxedo Park?
Total Female Population of Tuxedo Park is 279.
What is the Ratio of Males per 100 Females in Tuxedo Park?
There are 150.90 Males per 100 Females in Tuxedo Park.
What is the Ratio of Females per 100 Males in Tuxedo Park?
There are 66.27 Females per 100 Males in Tuxedo Park.
What is the Median Population Age in Tuxedo Park?
Median Population Age in Tuxedo Park is 52.0 Years.
What is the Average Family Size in Tuxedo Park
Average Family Size in Tuxedo Park is 2.0 People.
What is the Average Household Size in Tuxedo Park
Average Household Size in Tuxedo Park is 1.8 People.
How Large is the Labor Force in Tuxedo Park?
There are 400 People in the Labor Forcein in Tuxedo Park.
What is the Percentage of People in the Labor Force in Tuxedo Park?
63.5% of People are in the Labor Force in Tuxedo Park.
What is the Unemployment Rate in Tuxedo Park?
Unemployment Rate in Tuxedo Park is 1.8%.