Zip Codes with the Highest Percentage of Families with Income Above $200,000 in Long Island City, NY
RELATED REPORTS & OPTIONS
Family Income | $200k+
Long Island City
Compare Zip Codes
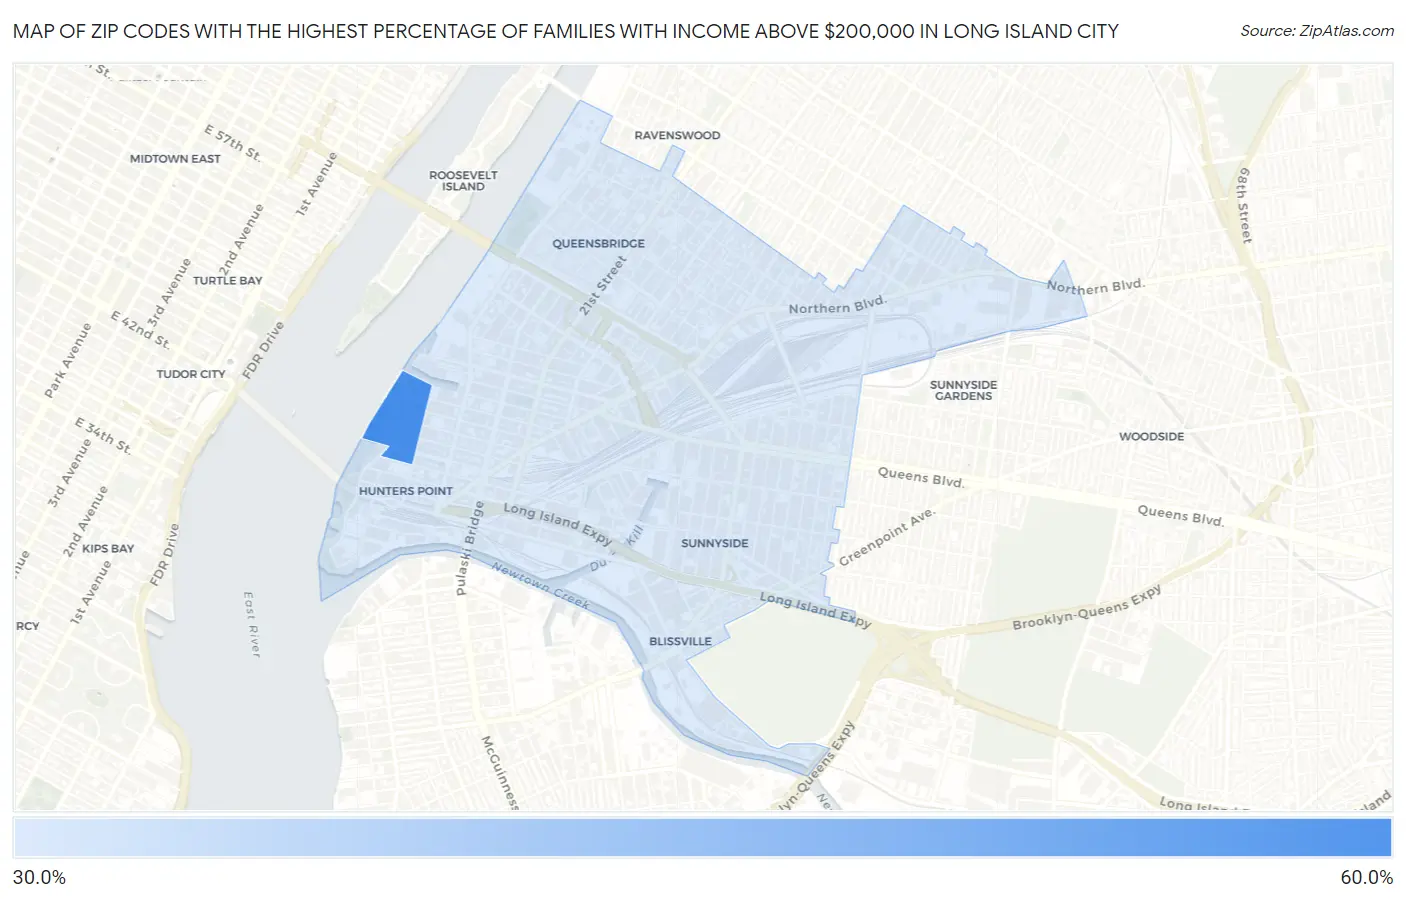
Map of Zip Codes with the Highest Percentage of Families with Income Above $200,000 in Long Island City
33.7%
55.9%
Zip Codes with the Highest Percentage of Families with Income Above $200,000 in Long Island City, NY
| Zip Code | Families with Income > $200k | vs State | vs National | |
| 1. | 11109 | 55.9% | 19.2%(+36.7)#59 | 14.8%(+41.1)#418 |
| 2. | 11101 | 33.7% | 19.2%(+14.5)#229 | 14.8%(+18.9)#1,997 |
1
Common Questions
What are the Top Zip Codes with the Highest Percentage of Families with Income Above $200,000 in Long Island City, NY?
Top Zip Codes with the Highest Percentage of Families with Income Above $200,000 in Long Island City, NY are:
What zip code has the Highest Percentage of Families with Income Above $200,000 in Long Island City, NY?
11109 has the Highest Percentage of Families with Income Above $200,000 in Long Island City, NY with 55.9%.
What is the Percentage of Families with Income Above $200,000 in New York?
Percentage of Families with Income Above $200,000 in New York is 19.2%.
What is the Percentage of Families with Income Above $200,000 in the United States?
Percentage of Families with Income Above $200,000 in the United States is 14.8%.