Area Code 442 Map & Demographics
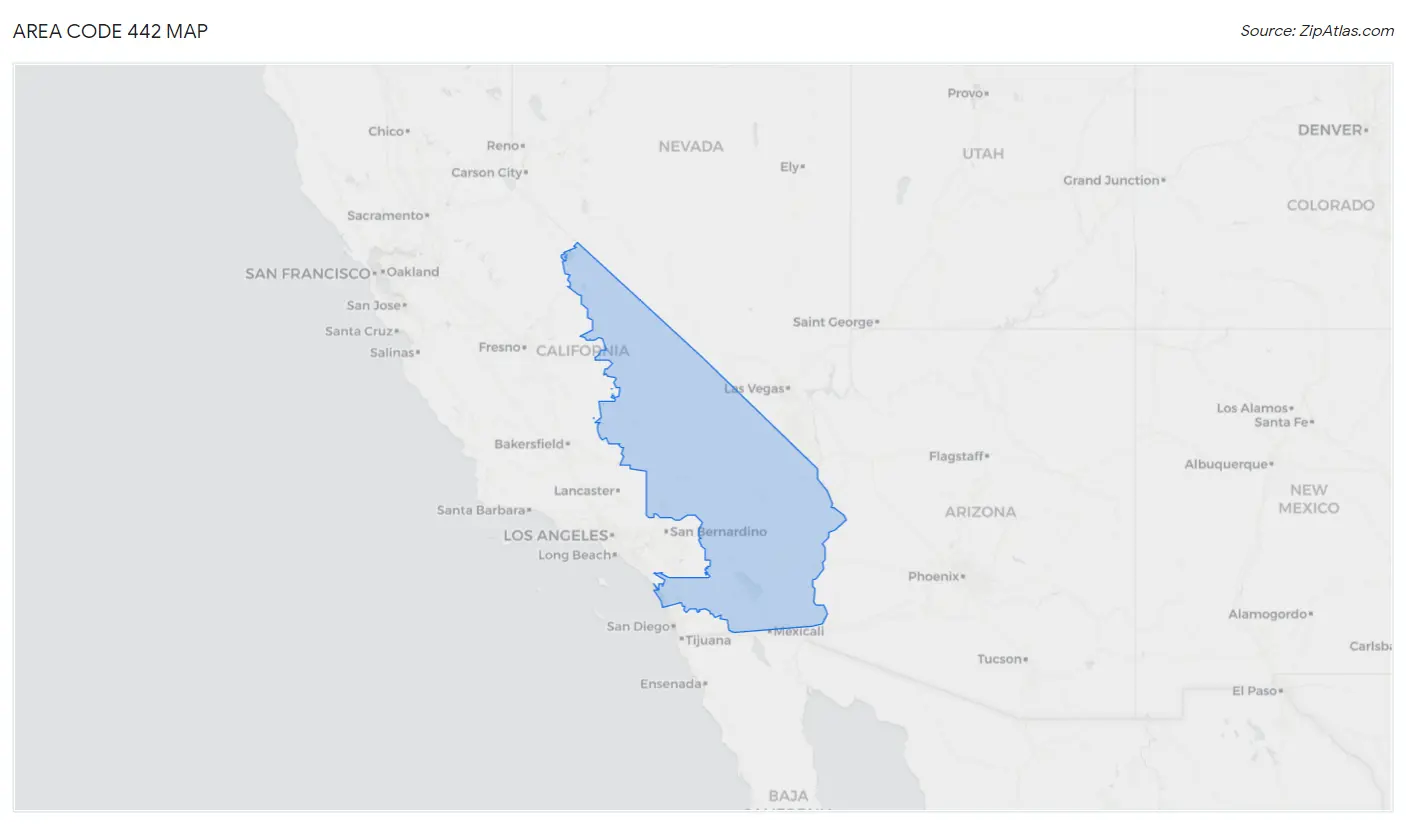
Area Code 442 Map
Area Code 442 Overview
$38,080
PER CAPITA INCOME
$90,663
AVG FAMILY INCOME
$81,134
AVG HOUSEHOLD INCOME
31.4%
WAGE / INCOME GAP [ % ]
68.6¢/ $1
WAGE / INCOME GAP [ $ ]
$11,038
FAMILY INCOME DEFICIT
13.06
INEQUALITY / GINI INDEX
1,036,506
TOTAL POPULATION
527,401
MALE POPULATION
509,105
FEMALE POPULATION
103.59
MALES / 100 FEMALES
96.53
FEMALES / 100 MALES
38.8
MEDIAN AGE
3.4
AVG FAMILY SIZE
2.9
AVG HOUSEHOLD SIZE
479,242
LABOR FORCE [ PEOPLE ]
59.3%
PERCENT IN LABOR FORCE
10.3%
UNEMPLOYMENT RATE
Nearby Area Codes
Income in Area Code 442
Income Overview in Area Code 442
Per Capita Income in Area Code 442 is $38,080, while median incomes of families and households are $90,663 and $81,134 respectively.
| Characteristic | Number | Measure |
| Per Capita Income | 1,036,506 | $38,080 |
| Median Family Income | 240,047 | $90,663 |
| Mean Family Income | 240,047 | $3,237,538 |
| Median Household Income | 342,506 | $81,134 |
| Mean Household Income | 342,506 | $2,865,090 |
| Income Deficit | 240,047 | $11,038 |
| Wage / Income Gap (%) | 1,036,506 | 31.36% |
| Wage / Income Gap ($) | 1,036,506 | 68.64¢ per $1 |
| Gini / Inequality Index | 1,036,506 | 13.06 |
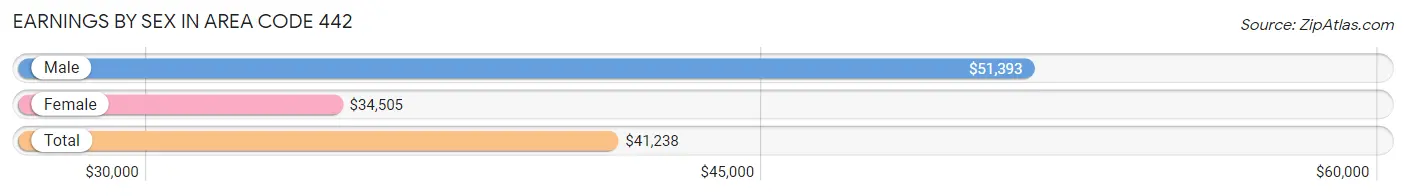
Earnings by Sex in Area Code 442
Average Earnings in Area Code 442 are $41,238, $51,393 for men and $34,505 for women, a difference of 32.9%.
| Sex | Number | Average Earnings |
| Male | 280,089 (55.9%) | $51,393 |
| Female | 221,273 (44.1%) | $34,505 |
| Total | 501,362 (100.0%) | $41,238 |
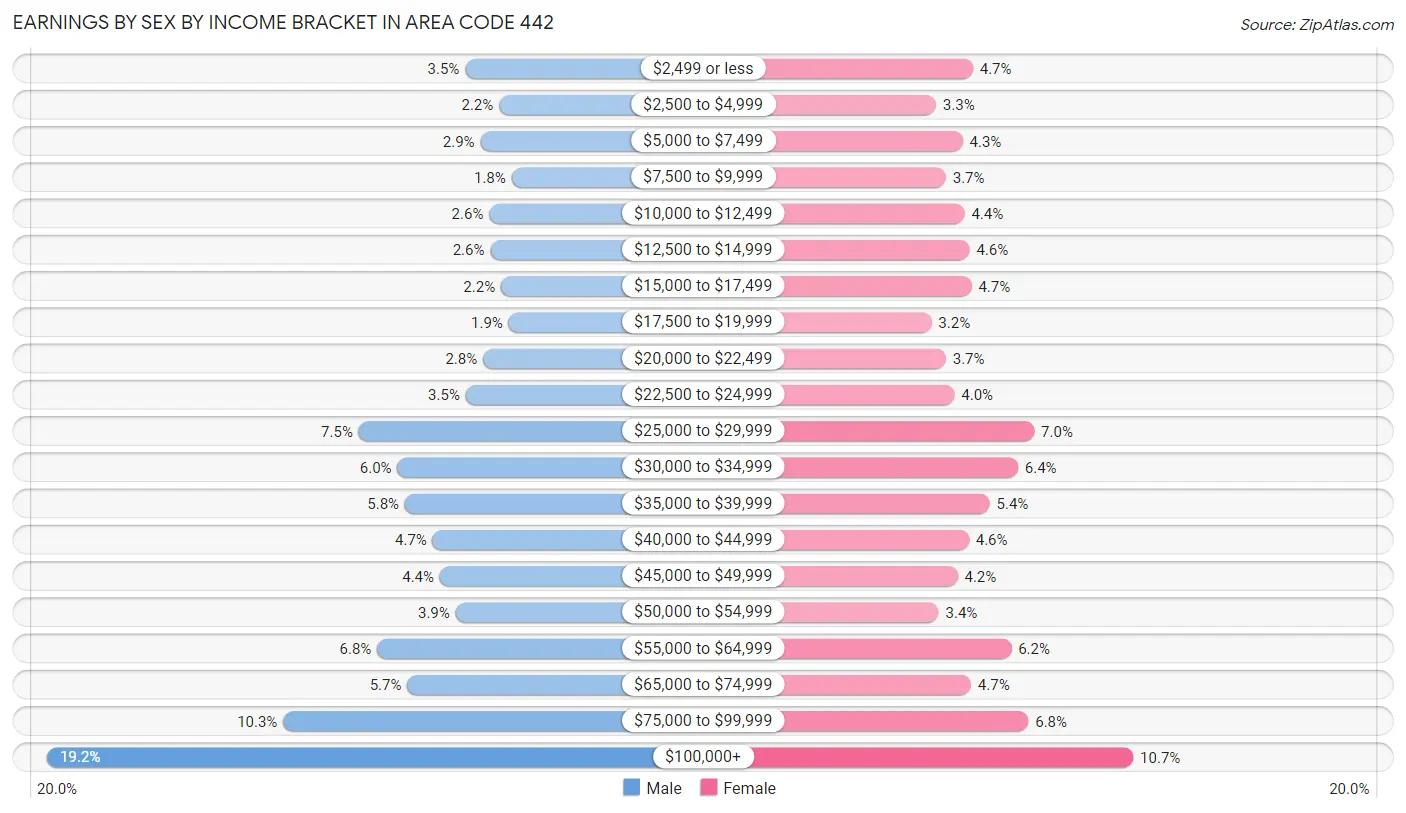
Earnings by Sex by Income Bracket in Area Code 442
The most common earnings brackets in Area Code 442 are $100,000+ for men (53,655 | 19.2%) and $100,000+ for women (23,744 | 10.7%).
| Income | Male | Female |
| $2,499 or less | 9,787 (3.5%) | 10,447 (4.7%) |
| $2,500 to $4,999 | 6,212 (2.2%) | 7,399 (3.3%) |
| $5,000 to $7,499 | 8,168 (2.9%) | 9,607 (4.3%) |
| $7,500 to $9,999 | 4,914 (1.8%) | 8,203 (3.7%) |
| $10,000 to $12,499 | 7,265 (2.6%) | 9,760 (4.4%) |
| $12,500 to $14,999 | 7,141 (2.5%) | 10,187 (4.6%) |
| $15,000 to $17,499 | 6,029 (2.1%) | 10,330 (4.7%) |
| $17,500 to $19,999 | 5,219 (1.9%) | 7,017 (3.2%) |
| $20,000 to $22,499 | 7,900 (2.8%) | 8,219 (3.7%) |
| $22,500 to $24,999 | 9,713 (3.5%) | 8,924 (4.0%) |
| $25,000 to $29,999 | 20,955 (7.5%) | 15,540 (7.0%) |
| $30,000 to $34,999 | 16,891 (6.0%) | 14,187 (6.4%) |
| $35,000 to $39,999 | 16,095 (5.8%) | 11,844 (5.3%) |
| $40,000 to $44,999 | 13,193 (4.7%) | 10,102 (4.6%) |
| $45,000 to $49,999 | 12,430 (4.4%) | 9,189 (4.2%) |
| $50,000 to $54,999 | 10,781 (3.8%) | 7,619 (3.4%) |
| $55,000 to $64,999 | 19,007 (6.8%) | 13,623 (6.2%) |
| $65,000 to $74,999 | 15,866 (5.7%) | 10,291 (4.6%) |
| $75,000 to $99,999 | 28,868 (10.3%) | 15,041 (6.8%) |
| $100,000+ | 53,655 (19.2%) | 23,744 (10.7%) |
| Total | 280,089 (100.0%) | 221,273 (100.0%) |
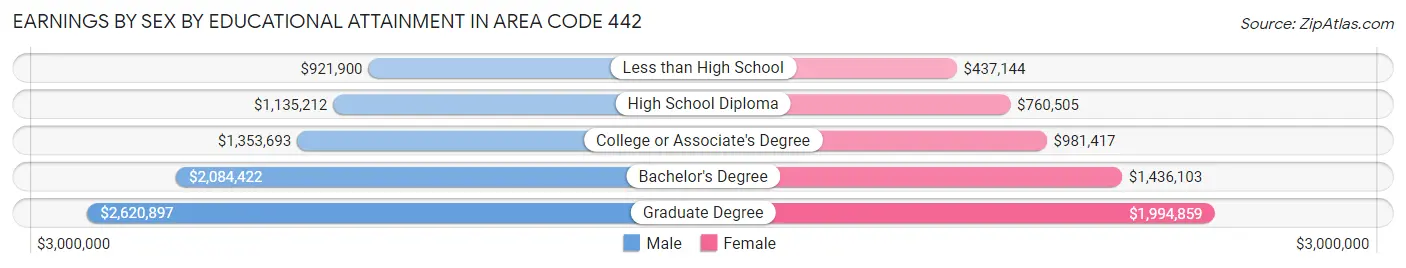
Earnings by Sex by Educational Attainment in Area Code 442
Average earnings in Area Code 442 are $1,548,627 for men and $1,029,801 for women, a difference of 33.5%. Men with an educational attainment of graduate degree enjoy the highest average annual earnings of $2,620,897, while those with less than high school education earn the least with $921,900. Women with an educational attainment of graduate degree earn the most with the average annual earnings of $1,994,859, while those with less than high school education have the smallest earnings of $437,144.
| Educational Attainment | Male Income | Female Income |
| Less than High School | $921,900 | $437,144 |
| High School Diploma | $1,135,212 | $760,505 |
| College or Associate's Degree | $1,353,693 | $981,417 |
| Bachelor's Degree | $2,084,422 | $1,436,103 |
| Graduate Degree | $2,620,897 | $1,994,859 |
| Total | $1,548,627 | $1,029,801 |
Family Income in Area Code 442
Family Income Brackets in Area Code 442
According to the Area Code 442 family income data, there are 1,203,596 families falling into the $100,000 to $149,999 income range, which is the most common income bracket and makes up 501.4% of all families. Conversely, the $10,000 to $14,999 income bracket is the least frequent group with only 112,822 families (47.0%) belonging to this category.
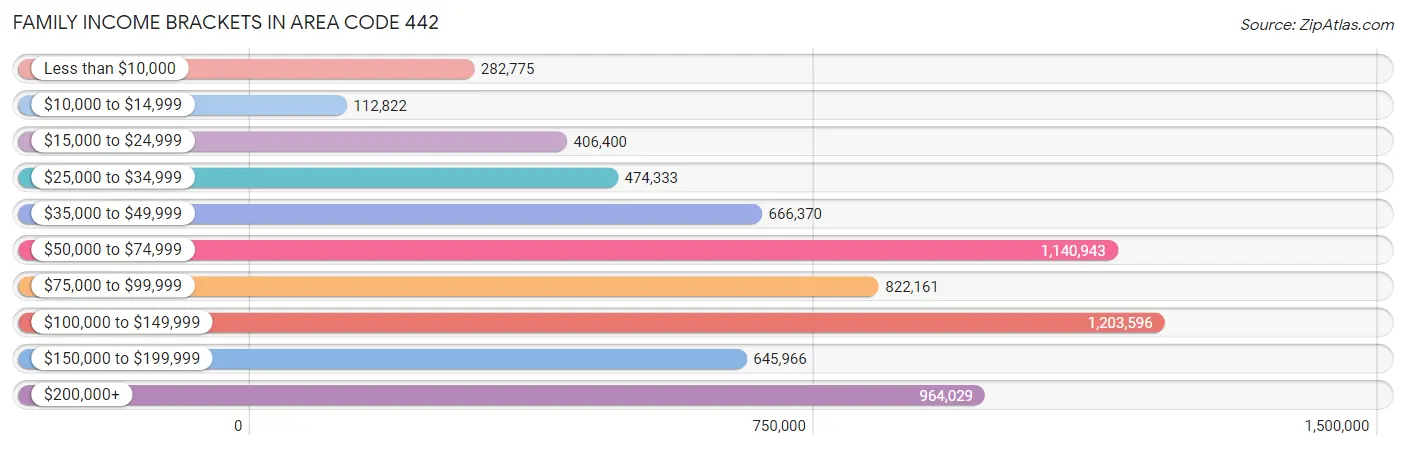
| Income Bracket | # Families | % Families |
| Less than $10,000 | 282,775 | 117.8% |
| $10,000 to $14,999 | 112,822 | 47.0% |
| $15,000 to $24,999 | 406,400 | 169.3% |
| $25,000 to $34,999 | 474,333 | 197.6% |
| $35,000 to $49,999 | 666,370 | 277.6% |
| $50,000 to $74,999 | 1,140,943 | 475.3% |
| $75,000 to $99,999 | 822,161 | 342.5% |
| $100,000 to $149,999 | 1,203,596 | 501.4% |
| $150,000 to $199,999 | 645,966 | 269.1% |
| $200,000+ | 964,029 | 401.6% |
Family Income by Famaliy Size in Area Code 442
7+ person families (7,706 | 3.2%) account for the highest median family income in Area Code 442 with $126,008 per family, while 2-person families (97,128 | 40.5%) have the highest median income of $42,089 per family member.
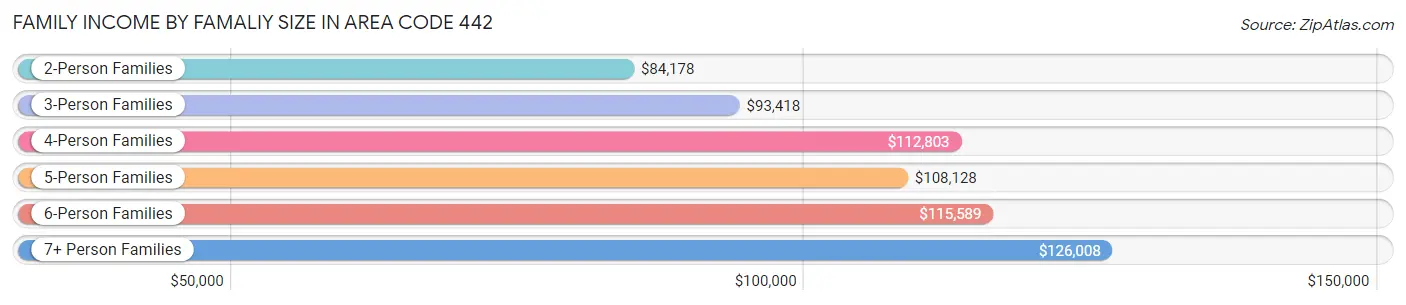
| Income Bracket | # Families | Median Income |
| 2-Person Families | 97,128 (40.5%) | $84,178 |
| 3-Person Families | 50,940 (21.2%) | $93,418 |
| 4-Person Families | 46,425 (19.3%) | $112,803 |
| 5-Person Families | 26,086 (10.9%) | $108,128 |
| 6-Person Families | 11,762 (4.9%) | $115,589 |
| 7+ Person Families | 7,706 (3.2%) | $126,008 |
| Total | 240,047 (100.0%) | $90,663 |
Family Income by Number of Earners in Area Code 442
The median family income in Area Code 442 is $90,663, with families comprising 3+ earners (31,722) having the highest median family income of $142,961, while families with no earners (37,156) have the lowest median family income of $53,695, accounting for 13.2% and 15.5% of families, respectively.
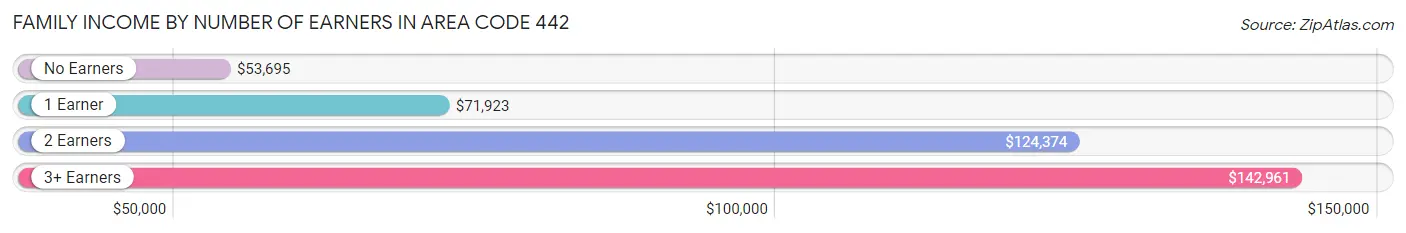
| Number of Earners | # Families | Median Income |
| No Earners | 37,156 (15.5%) | $53,695 |
| 1 Earner | 78,046 (32.5%) | $71,923 |
| 2 Earners | 93,123 (38.8%) | $124,374 |
| 3+ Earners | 31,722 (13.2%) | $142,961 |
| Total | 240,047 (100.0%) | $90,663 |
Household Income in Area Code 442
Household Income Brackets in Area Code 442
With 1,582,720 households falling in the category, the $50,000 to $74,999 income range is the most frequent in Area Code 442, accounting for 462.1% of all households. In contrast, only 397,649 households (116.1%) fall into the $10,000 to $14,999 income bracket, making it the least populous group.
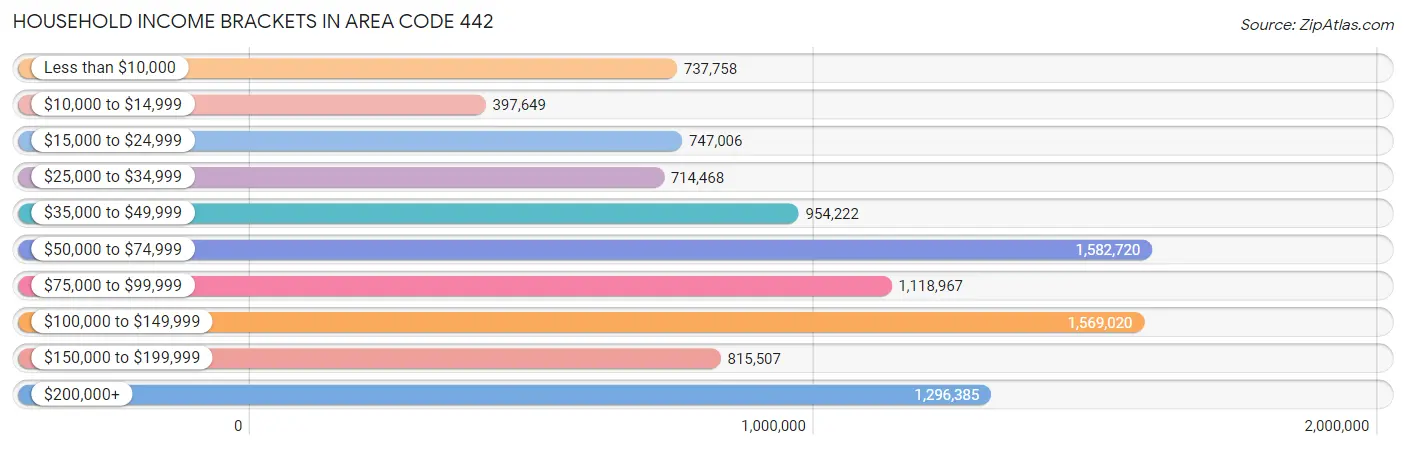
| Income Bracket | # Households | % Households |
| Less than $10,000 | 737,758 | 215.4% |
| $10,000 to $14,999 | 397,649 | 116.1% |
| $15,000 to $24,999 | 747,006 | 218.1% |
| $25,000 to $34,999 | 714,468 | 208.6% |
| $35,000 to $49,999 | 954,222 | 278.6% |
| $50,000 to $74,999 | 1,582,720 | 462.1% |
| $75,000 to $99,999 | 1,118,967 | 326.7% |
| $100,000 to $149,999 | 1,569,020 | 458.1% |
| $150,000 to $199,999 | 815,507 | 238.1% |
| $200,000+ | 1,296,385 | 378.5% |
Household Income by Householder Age in Area Code 442
The median household income in Area Code 442 is $81,134, with the highest median household income of $90,668 found in the 45 to 64 years age bracket for the primary householder. A total of 126,285 households (36.9%) fall into this category. Meanwhile, the 15 to 24 years age bracket for the primary householder has the lowest median household income of $57,779, with 10,165 households (3.0%) in this group.
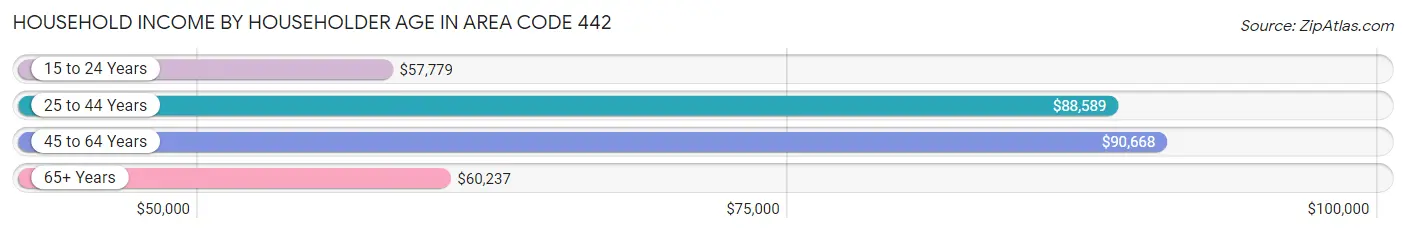
| Income Bracket | # Households | Median Income |
| 15 to 24 Years | 10,165 (3.0%) | $57,779 |
| 25 to 44 Years | 114,997 (33.6%) | $88,589 |
| 45 to 64 Years | 126,285 (36.9%) | $90,668 |
| 65+ Years | 91,059 (26.6%) | $60,237 |
| Total | 342,506 (100.0%) | $81,134 |
Poverty in Area Code 442
Income Below Poverty by Sex and Age in Area Code 442
With 12.6% poverty level for males and 15.4% for females among the residents of Area Code 442, 6 to 11 year old males and 15 year old females are the most vulnerable to poverty, with 8,518 males (20.5%) and 1,800 females (24.1%) in their respective age groups living below the poverty level.
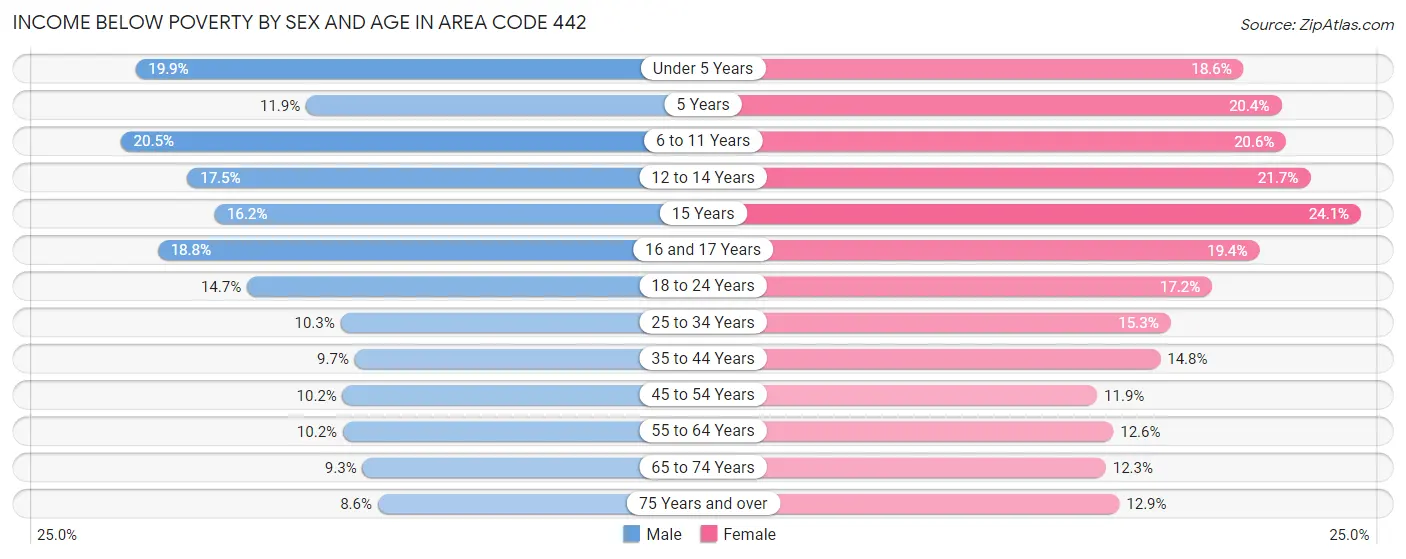
| Age Bracket | Male | Female |
| Under 5 Years | 6,501 (19.9%) | 5,892 (18.6%) |
| 5 Years | 844 (11.9%) | 1,335 (20.4%) |
| 6 to 11 Years | 8,518 (20.5%) | 8,636 (20.6%) |
| 12 to 14 Years | 4,162 (17.4%) | 4,770 (21.7%) |
| 15 Years | 1,289 (16.2%) | 1,800 (24.1%) |
| 16 and 17 Years | 2,739 (18.8%) | 2,581 (19.4%) |
| 18 to 24 Years | 7,198 (14.7%) | 7,707 (17.2%) |
| 25 to 34 Years | 7,572 (10.3%) | 10,782 (15.2%) |
| 35 to 44 Years | 6,683 (9.7%) | 9,423 (14.8%) |
| 45 to 54 Years | 6,144 (10.2%) | 7,093 (11.8%) |
| 55 to 64 Years | 6,239 (10.2%) | 7,653 (12.6%) |
| 65 to 74 Years | 4,145 (9.3%) | 5,552 (12.2%) |
| 75 Years and over | 2,416 (8.6%) | 4,646 (12.9%) |
| Total | 64,450 (12.6%) | 77,870 (15.4%) |
Income Above Poverty by Sex and Age in Area Code 442
According to the poverty statistics in Area Code 442, males aged 75 years and over and females aged 45 to 54 years are the age groups that are most secure financially, with 91.4% of males and 88.1% of females in these age groups living above the poverty line.
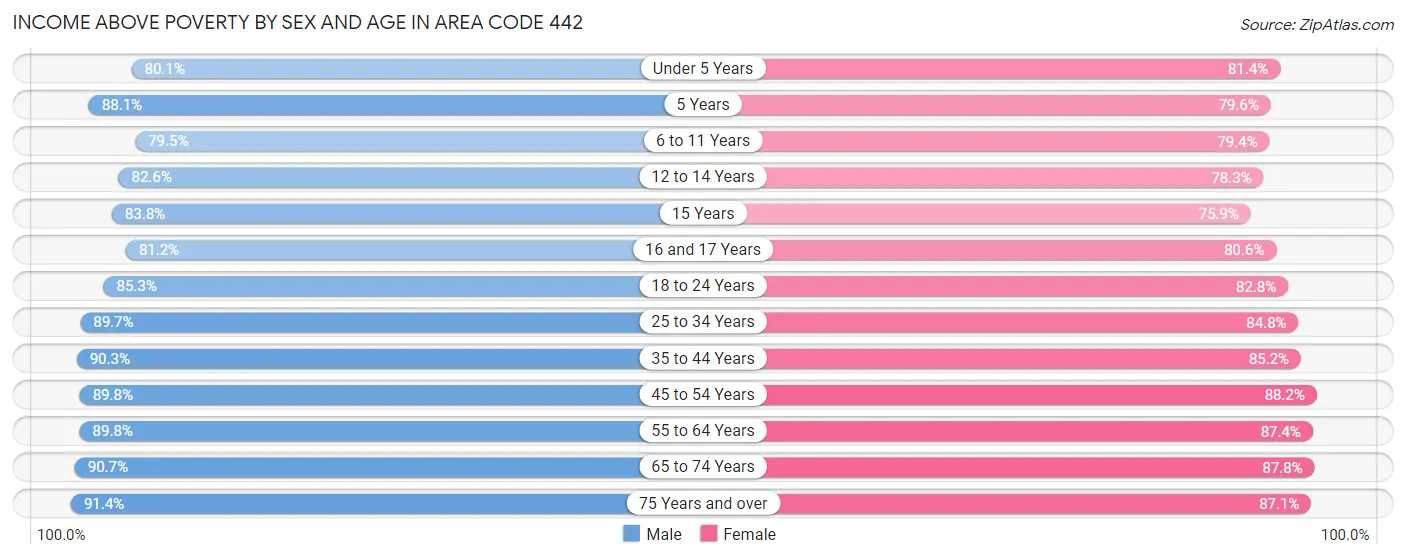
| Age Bracket | Male | Female |
| Under 5 Years | 26,236 (80.1%) | 25,722 (81.4%) |
| 5 Years | 6,222 (88.1%) | 5,211 (79.6%) |
| 6 to 11 Years | 32,950 (79.5%) | 33,244 (79.4%) |
| 12 to 14 Years | 19,688 (82.6%) | 17,180 (78.3%) |
| 15 Years | 6,664 (83.8%) | 5,672 (75.9%) |
| 16 and 17 Years | 11,813 (81.2%) | 10,742 (80.6%) |
| 18 to 24 Years | 41,836 (85.3%) | 37,161 (82.8%) |
| 25 to 34 Years | 65,684 (89.7%) | 59,906 (84.8%) |
| 35 to 44 Years | 62,339 (90.3%) | 54,339 (85.2%) |
| 45 to 54 Years | 53,841 (89.8%) | 52,768 (88.1%) |
| 55 to 64 Years | 54,737 (89.8%) | 53,066 (87.4%) |
| 65 to 74 Years | 40,317 (90.7%) | 39,786 (87.7%) |
| 75 Years and over | 25,644 (91.4%) | 31,419 (87.1%) |
| Total | 447,971 (87.4%) | 426,216 (84.6%) |
Income Below Poverty Among Married-Couple Families in Area Code 442
The poverty statistics for married-couple families in Area Code 442 show that 5.8% or 10,005 of the total 173,872 families live below the poverty line. Families with 5 or more children have the highest poverty rate of 35.8%, comprising of 518 families. On the other hand, families with no children have the lowest poverty rate of 3.3%, which includes 3,185 families.
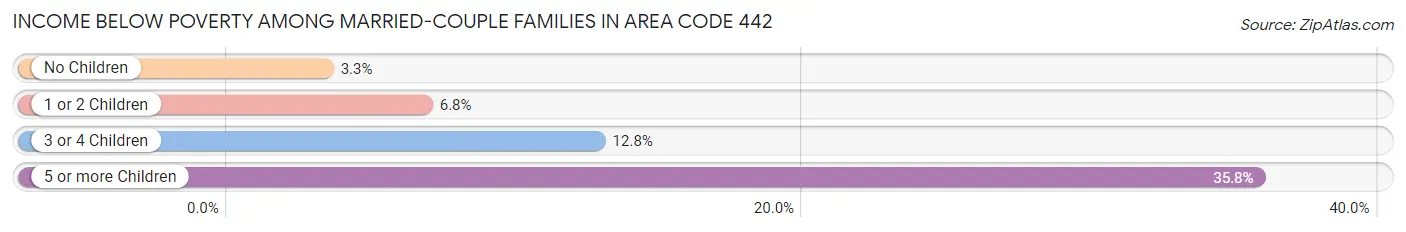
| Children | Above Poverty | Below Poverty |
| No Children | 92,417 (96.7%) | 3,185 (3.3%) |
| 1 or 2 Children | 54,699 (93.2%) | 3,979 (6.8%) |
| 3 or 4 Children | 15,821 (87.2%) | 2,323 (12.8%) |
| 5 or more Children | 930 (64.2%) | 518 (35.8%) |
| Total | 163,867 (94.3%) | 10,005 (5.8%) |
Income Below Poverty Among Single-Parent Households in Area Code 442
According to the poverty data in Area Code 442, 11.1% or 2,363 single-father households and 27.0% or 12,133 single-mother households are living below the poverty line. Among single-father households, those with 5 or more children have the highest poverty rate, with 90 households (34.0%) experiencing poverty. Likewise, among single-mother households, those with 5 or more children have the highest poverty rate, with 489 households (77.9%) falling below the poverty line.
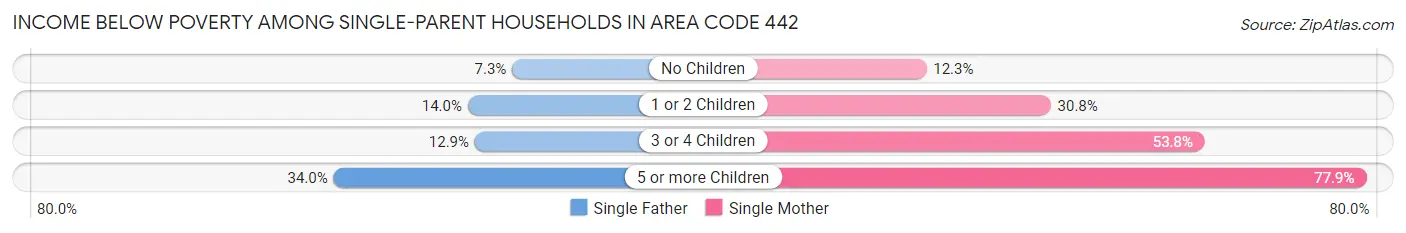
| Children | Single Father | Single Mother |
| No Children | 700 (7.3%) | 2,233 (12.3%) |
| 1 or 2 Children | 1,325 (14.0%) | 6,283 (30.8%) |
| 3 or 4 Children | 248 (12.9%) | 3,128 (53.8%) |
| 5 or more Children | 90 (34.0%) | 489 (77.9%) |
| Total | 2,363 (11.1%) | 12,133 (27.0%) |
Income Below Poverty Among Married-Couple vs Single-Parent Households in Area Code 442
The poverty data for Area Code 442 shows that 10,005 of the married-couple family households (5.8%) and 14,496 of the single-parent households (21.9%) are living below the poverty level. Within the married-couple family households, those with 5 or more children have the highest poverty rate, with 518 households (35.8%) falling below the poverty line. Among the single-parent households, those with 5 or more children have the highest poverty rate, with 579 household (64.8%) living below poverty.
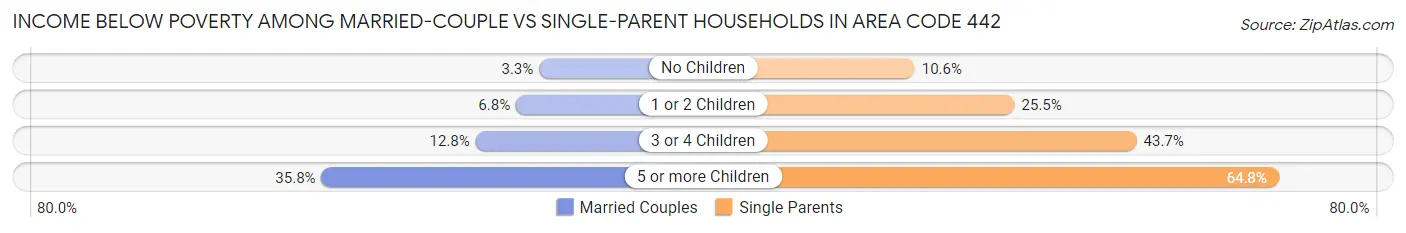
| Children | Married-Couple Families | Single-Parent Households |
| No Children | 3,185 (3.3%) | 2,933 (10.6%) |
| 1 or 2 Children | 3,979 (6.8%) | 7,608 (25.5%) |
| 3 or 4 Children | 2,323 (12.8%) | 3,376 (43.6%) |
| 5 or more Children | 518 (35.8%) | 579 (64.8%) |
| Total | 10,005 (5.8%) | 14,496 (21.9%) |
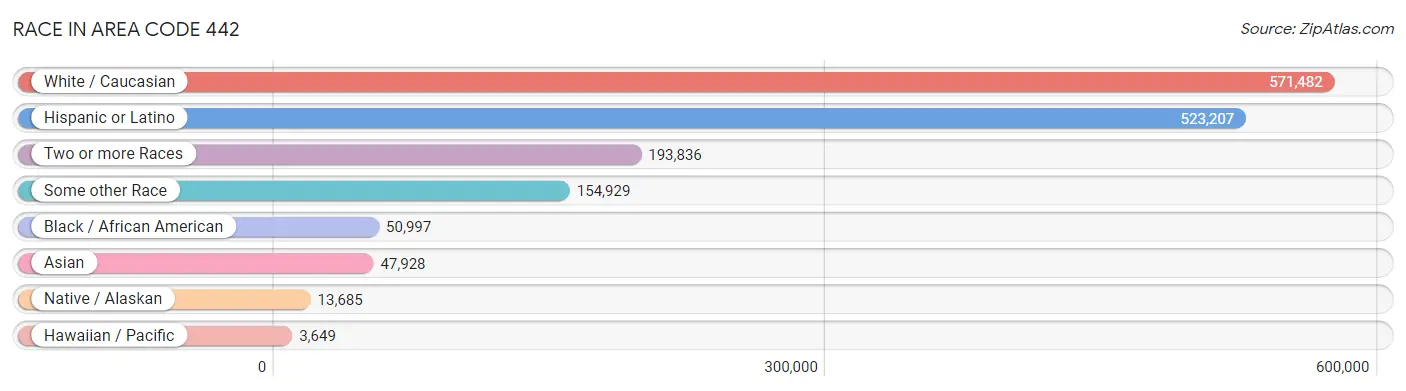
Race in Area Code 442
The most populous races in Area Code 442 are White / Caucasian (571,482 | 55.1%), Hispanic or Latino (523,207 | 50.5%), and Two or more Races (193,836 | 18.7%).
| Race | # Population | % Population |
| Asian | 47,928 | 4.6% |
| Black / African American | 50,997 | 4.9% |
| Hawaiian / Pacific | 3,649 | 0.4% |
| Hispanic or Latino | 523,207 | 50.5% |
| Native / Alaskan | 13,685 | 1.3% |
| White / Caucasian | 571,482 | 55.1% |
| Two or more Races | 193,836 | 18.7% |
| Some other Race | 154,929 | 14.9% |
| Total | 1,036,506 | 100.0% |
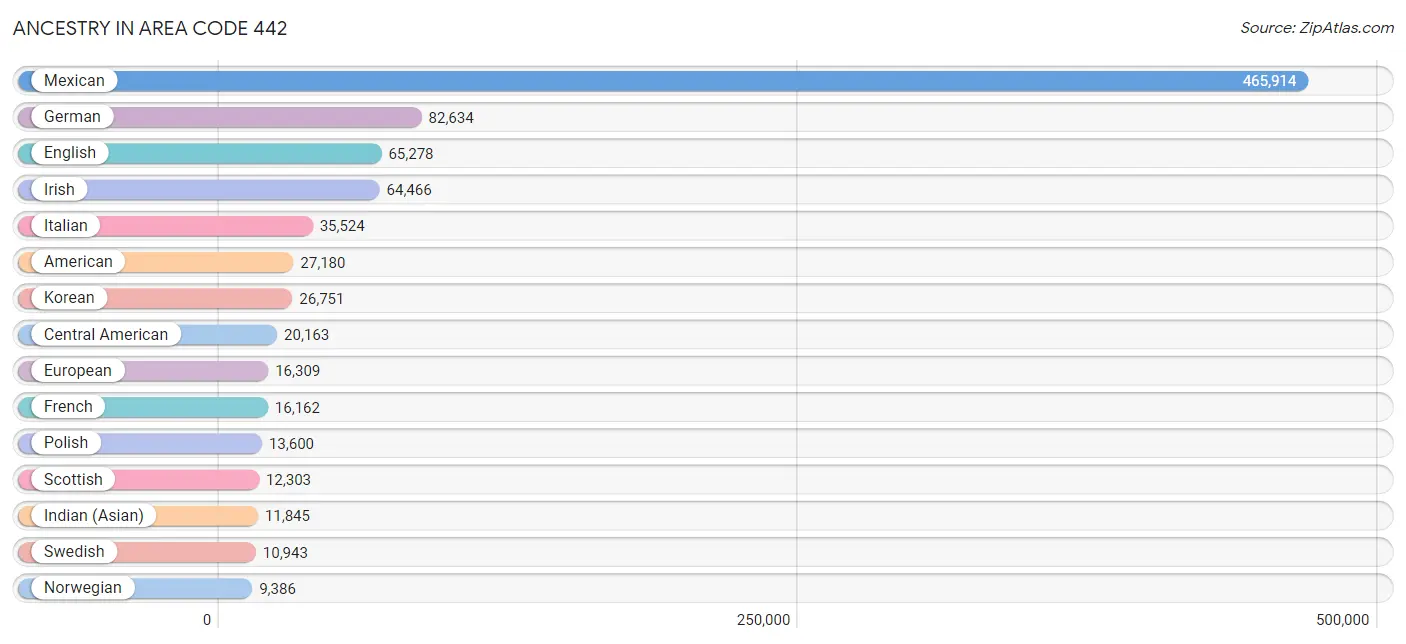
Ancestry in Area Code 442
The most populous ancestries reported in Area Code 442 are Mexican (465,914 | 45.0%), German (82,634 | 8.0%), English (65,278 | 6.3%), Irish (64,466 | 6.2%), and Italian (35,524 | 3.4%), together accounting for 68.9% of all Area Code 442 residents.
| Ancestry | # Population | % Population |
| Afghan | 489 | 0.1% |
| African | 4,940 | 0.5% |
| Alaskan Athabascan | 12 | 0.0% |
| Albanian | 222 | 0.0% |
| Aleut | 11 | 0.0% |
| Alsatian | 37 | 0.0% |
| American | 27,180 | 2.6% |
| Apache | 583 | 0.1% |
| Arab | 4,733 | 0.5% |
| Arapaho | 8 | 0.0% |
| Argentinean | 900 | 0.1% |
| Armenian | 1,528 | 0.2% |
| Assyrian / Chaldean / Syriac | 224 | 0.0% |
| Australian | 284 | 0.0% |
| Austrian | 1,419 | 0.1% |
| Bangladeshi | 264 | 0.0% |
| Barbadian | 42 | 0.0% |
| Basque | 403 | 0.0% |
| Belgian | 925 | 0.1% |
| Belizean | 50 | 0.0% |
| Bhutanese | 7,303 | 0.7% |
| Blackfeet | 673 | 0.1% |
| Bolivian | 309 | 0.0% |
| Brazilian | 675 | 0.1% |
| British | 5,423 | 0.5% |
| British West Indian | 16 | 0.0% |
| Bulgarian | 329 | 0.0% |
| Burmese | 4,972 | 0.5% |
| Cajun | 30 | 0.0% |
| Cambodian | 17 | 0.0% |
| Canadian | 1,777 | 0.2% |
| Cape Verdean | 30 | 0.0% |
| Carpatho Rusyn | 5 | 0.0% |
| Celtic | 106 | 0.0% |
| Central American | 20,163 | 1.9% |
| Central American Indian | 1,865 | 0.2% |
| Cherokee | 3,446 | 0.3% |
| Cheyenne | 34 | 0.0% |
| Chickasaw | 105 | 0.0% |
| Chilean | 574 | 0.1% |
| Chinese | 104 | 0.0% |
| Chippewa | 147 | 0.0% |
| Choctaw | 673 | 0.1% |
| Colombian | 1,628 | 0.2% |
| Colville | 48 | 0.0% |
| Comanche | 43 | 0.0% |
| Costa Rican | 579 | 0.1% |
| Cree | 1 | 0.0% |
| Creek | 126 | 0.0% |
| Croatian | 1,015 | 0.1% |
| Crow | 48 | 0.0% |
| Cuban | 2,992 | 0.3% |
| Cypriot | 101 | 0.0% |
| Czech | 1,463 | 0.1% |
| Czechoslovakian | 635 | 0.1% |
| Danish | 4,667 | 0.4% |
| Delaware | 33 | 0.0% |
| Dominican | 673 | 0.1% |
| Dutch | 8,107 | 0.8% |
| Dutch West Indian | 22 | 0.0% |
| Eastern European | 2,199 | 0.2% |
| Ecuadorian | 1,435 | 0.1% |
| Egyptian | 661 | 0.1% |
| English | 65,278 | 6.3% |
| Estonian | 95 | 0.0% |
| Ethiopian | 131 | 0.0% |
| European | 16,309 | 1.6% |
| Fijian | 61 | 0.0% |
| Filipino | 747 | 0.1% |
| Finnish | 1,190 | 0.1% |
| French | 16,162 | 1.6% |
| French American Indian | 31 | 0.0% |
| French Canadian | 2,693 | 0.3% |
| German | 82,634 | 8.0% |
| German Russian | 35 | 0.0% |
| Ghanaian | 171 | 0.0% |
| Greek | 2,834 | 0.3% |
| Guamanian / Chamorro | 1,212 | 0.1% |
| Guatemalan | 7,220 | 0.7% |
| Guyanese | 292 | 0.0% |
| Haitian | 314 | 0.0% |
| Honduran | 1,567 | 0.2% |
| Hopi | 21 | 0.0% |
| Houma | 17 | 0.0% |
| Hungarian | 2,855 | 0.3% |
| Icelander | 329 | 0.0% |
| Indian (Asian) | 11,845 | 1.1% |
| Indonesian | 172 | 0.0% |
| Inupiat | 96 | 0.0% |
| Iranian | 1,996 | 0.2% |
| Iraqi | 149 | 0.0% |
| Irish | 64,466 | 6.2% |
| Iroquois | 149 | 0.0% |
| Israeli | 362 | 0.0% |
| Italian | 35,524 | 3.4% |
| Jamaican | 1,538 | 0.2% |
| Japanese | 1,108 | 0.1% |
| Jordanian | 61 | 0.0% |
| Kenyan | 22 | 0.0% |
| Kiowa | 11 | 0.0% |
| Korean | 26,751 | 2.6% |
| Laotian | 391 | 0.0% |
| Latvian | 203 | 0.0% |
| Lebanese | 1,435 | 0.1% |
| Liberian | 17 | 0.0% |
| Lithuanian | 1,550 | 0.2% |
| Lumbee | 7 | 0.0% |
| Luxembourger | 16 | 0.0% |
| Macedonian | 60 | 0.0% |
| Malaysian | 827 | 0.1% |
| Maltese | 65 | 0.0% |
| Menominee | 2 | 0.0% |
| Mexican | 465,914 | 45.0% |
| Mexican American Indian | 5,135 | 0.5% |
| Mongolian | 71 | 0.0% |
| Moroccan | 229 | 0.0% |
| Native Hawaiian | 3,265 | 0.3% |
| Navajo | 1,133 | 0.1% |
| New Zealander | 104 | 0.0% |
| Nicaraguan | 1,325 | 0.1% |
| Nigerian | 809 | 0.1% |
| Northern European | 2,036 | 0.2% |
| Norwegian | 9,386 | 0.9% |
| Osage | 78 | 0.0% |
| Ottawa | 27 | 0.0% |
| Paiute | 697 | 0.1% |
| Pakistani | 1,341 | 0.1% |
| Palestinian | 39 | 0.0% |
| Panamanian | 744 | 0.1% |
| Paraguayan | 26 | 0.0% |
| Pennsylvania German | 118 | 0.0% |
| Peruvian | 2,143 | 0.2% |
| Pima | 53 | 0.0% |
| Polish | 13,600 | 1.3% |
| Portuguese | 3,544 | 0.3% |
| Potawatomi | 45 | 0.0% |
| Pueblo | 154 | 0.0% |
| Puerto Rican | 6,522 | 0.6% |
| Puget Sound Salish | 18 | 0.0% |
| Romanian | 967 | 0.1% |
| Russian | 5,876 | 0.6% |
| Salvadoran | 8,564 | 0.8% |
| Samoan | 2,913 | 0.3% |
| Scandinavian | 3,270 | 0.3% |
| Scotch-Irish | 5,331 | 0.5% |
| Scottish | 12,303 | 1.2% |
| Seminole | 116 | 0.0% |
| Senegalese | 6 | 0.0% |
| Serbian | 1,123 | 0.1% |
| Shoshone | 181 | 0.0% |
| Sioux | 364 | 0.0% |
| Slavic | 294 | 0.0% |
| Slovak | 705 | 0.1% |
| Slovene | 115 | 0.0% |
| Somali | 103 | 0.0% |
| South African | 424 | 0.0% |
| South American | 7,479 | 0.7% |
| South American Indian | 104 | 0.0% |
| Soviet Union | 19 | 0.0% |
| Spaniard | 5,106 | 0.5% |
| Spanish | 4,316 | 0.4% |
| Spanish American | 45 | 0.0% |
| Sri Lankan | 6,906 | 0.7% |
| Subsaharan African | 7,076 | 0.7% |
| Sudanese | 31 | 0.0% |
| Swedish | 10,943 | 1.1% |
| Swiss | 2,233 | 0.2% |
| Syrian | 858 | 0.1% |
| Taiwanese | 29 | 0.0% |
| Thai | 6,415 | 0.6% |
| Tlingit-Haida | 143 | 0.0% |
| Tohono O'Odham | 69 | 0.0% |
| Tongan | 117 | 0.0% |
| Trinidadian and Tobagonian | 211 | 0.0% |
| Turkish | 299 | 0.0% |
| U.S. Virgin Islander | 48 | 0.0% |
| Ugandan | 11 | 0.0% |
| Ukrainian | 2,413 | 0.2% |
| Uruguayan | 19 | 0.0% |
| Ute | 7 | 0.0% |
| Venezuelan | 344 | 0.0% |
| Welsh | 3,928 | 0.4% |
| West Indian | 220 | 0.0% |
| Yaqui | 816 | 0.1% |
| Yugoslavian | 739 | 0.1% |
| Yuman | 175 | 0.0% |
| Yup'ik | 1 | 0.0% | View All 187 Rows |
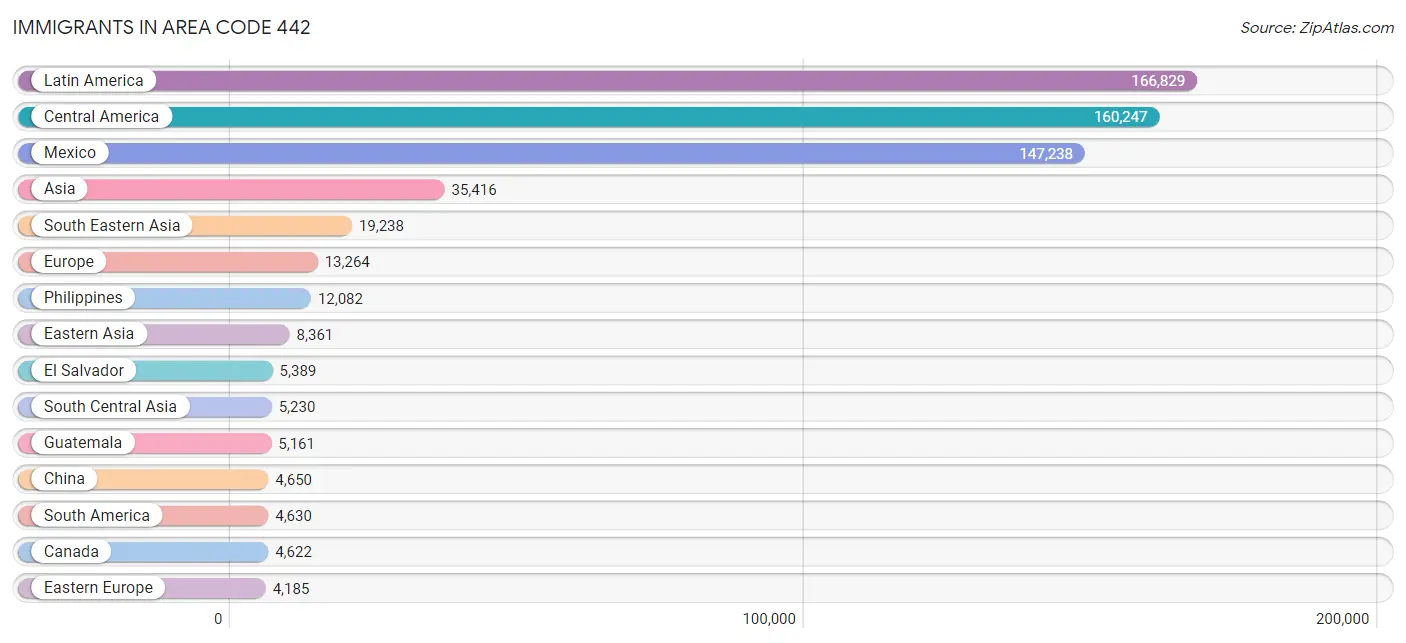
Immigrants in Area Code 442
The most numerous immigrant groups reported in Area Code 442 came from Latin America (166,829 | 16.1%), Central America (160,247 | 15.5%), Mexico (147,238 | 14.2%), Asia (35,416 | 3.4%), and South Eastern Asia (19,238 | 1.9%), together accounting for 51.0% of all Area Code 442 residents.
| Immigration Origin | # Population | % Population |
| Afghanistan | 530 | 0.1% |
| Africa | 2,549 | 0.3% |
| Albania | 142 | 0.0% |
| Argentina | 451 | 0.0% |
| Armenia | 34 | 0.0% |
| Asia | 35,416 | 3.4% |
| Australia | 324 | 0.0% |
| Austria | 189 | 0.0% |
| Azores | 23 | 0.0% |
| Bahamas | 14 | 0.0% |
| Barbados | 11 | 0.0% |
| Belarus | 167 | 0.0% |
| Belgium | 130 | 0.0% |
| Belize | 55 | 0.0% |
| Bolivia | 135 | 0.0% |
| Bosnia and Herzegovina | 118 | 0.0% |
| Brazil | 732 | 0.1% |
| Bulgaria | 331 | 0.0% |
| Cambodia | 495 | 0.1% |
| Cameroon | 29 | 0.0% |
| Canada | 4,622 | 0.4% |
| Caribbean | 1,952 | 0.2% |
| Central America | 160,247 | 15.5% |
| Chile | 356 | 0.0% |
| China | 4,650 | 0.4% |
| Colombia | 820 | 0.1% |
| Congo | 121 | 0.0% |
| Costa Rica | 257 | 0.0% |
| Croatia | 138 | 0.0% |
| Cuba | 547 | 0.1% |
| Czechoslovakia | 96 | 0.0% |
| Denmark | 446 | 0.0% |
| Dominican Republic | 183 | 0.0% |
| Eastern Africa | 436 | 0.0% |
| Eastern Asia | 8,361 | 0.8% |
| Eastern Europe | 4,185 | 0.4% |
| Ecuador | 481 | 0.1% |
| Egypt | 431 | 0.0% |
| El Salvador | 5,389 | 0.5% |
| England | 1,687 | 0.2% |
| Eritrea | 26 | 0.0% |
| Ethiopia | 30 | 0.0% |
| Europe | 13,264 | 1.3% |
| Fiji | 90 | 0.0% |
| France | 698 | 0.1% |
| Germany | 2,145 | 0.2% |
| Ghana | 106 | 0.0% |
| Greece | 90 | 0.0% |
| Guatemala | 5,161 | 0.5% |
| Guyana | 306 | 0.0% |
| Haiti | 167 | 0.0% |
| Honduras | 1,158 | 0.1% |
| Hong Kong | 444 | 0.0% |
| Hungary | 277 | 0.0% |
| India | 2,629 | 0.3% |
| Indonesia | 468 | 0.1% |
| Iran | 1,477 | 0.1% |
| Iraq | 495 | 0.1% |
| Ireland | 187 | 0.0% |
| Israel | 321 | 0.0% |
| Italy | 721 | 0.1% |
| Jamaica | 660 | 0.1% |
| Japan | 1,521 | 0.2% |
| Jordan | 138 | 0.0% |
| Kazakhstan | 359 | 0.0% |
| Kenya | 98 | 0.0% |
| Korea | 2,190 | 0.2% |
| Laos | 547 | 0.1% |
| Latin America | 166,829 | 16.1% |
| Latvia | 67 | 0.0% |
| Lebanon | 371 | 0.0% |
| Liberia | 37 | 0.0% |
| Lithuania | 180 | 0.0% |
| Malaysia | 534 | 0.1% |
| Mexico | 147,238 | 14.2% |
| Micronesia | 1 | 0.0% |
| Middle Africa | 287 | 0.0% |
| Moldova | 40 | 0.0% |
| Morocco | 232 | 0.0% |
| Nepal | 53 | 0.0% |
| Netherlands | 413 | 0.0% |
| Nicaragua | 691 | 0.1% |
| Nigeria | 298 | 0.0% |
| North Macedonia | 63 | 0.0% |
| Northern Africa | 721 | 0.1% |
| Northern Europe | 4,169 | 0.4% |
| Norway | 123 | 0.0% |
| Oceania | 1,162 | 0.1% |
| Pakistan | 31 | 0.0% |
| Panama | 273 | 0.0% |
| Peru | 1,120 | 0.1% |
| Philippines | 12,082 | 1.2% |
| Poland | 427 | 0.0% |
| Portugal | 61 | 0.0% |
| Romania | 369 | 0.0% |
| Russia | 565 | 0.1% |
| Saudi Arabia | 83 | 0.0% |
| Scotland | 205 | 0.0% |
| Serbia | 332 | 0.0% |
| Singapore | 49 | 0.0% |
| Somalia | 8 | 0.0% |
| South Africa | 552 | 0.1% |
| South America | 4,630 | 0.4% |
| South Central Asia | 5,230 | 0.5% |
| South Eastern Asia | 19,238 | 1.9% |
| Southern Europe | 1,078 | 0.1% |
| Spain | 194 | 0.0% |
| Sri Lanka | 109 | 0.0% |
| Sudan | 19 | 0.0% |
| Sweden | 347 | 0.0% |
| Switzerland | 201 | 0.0% |
| Syria | 706 | 0.1% |
| Taiwan | 989 | 0.1% |
| Thailand | 1,207 | 0.1% |
| Trinidad and Tobago | 258 | 0.0% |
| Turkey | 202 | 0.0% |
| Uganda | 67 | 0.0% |
| Ukraine | 489 | 0.1% |
| Uruguay | 5 | 0.0% |
| Uzbekistan | 42 | 0.0% |
| Venezuela | 191 | 0.0% |
| Vietnam | 3,741 | 0.4% |
| West Indies | 14 | 0.0% |
| Western Africa | 441 | 0.0% |
| Western Asia | 2,587 | 0.3% |
| Western Europe | 3,776 | 0.4% |
| Zaire | 82 | 0.0% |
| Zimbabwe | 31 | 0.0% | View All 128 Rows |
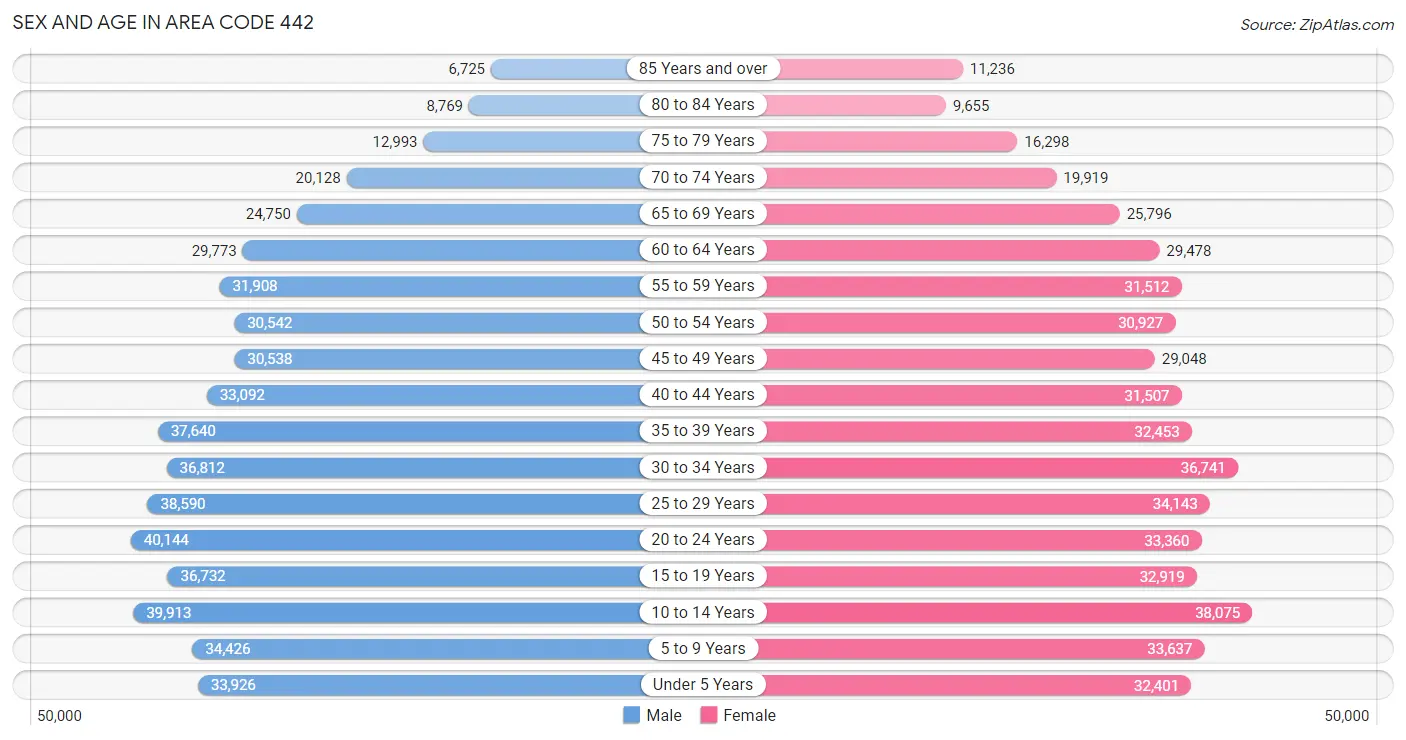
Sex and Age in Area Code 442
Sex and Age in Area Code 442
The most populous age groups in Area Code 442 are 20 to 24 Years (40,144 | 7.6%) for men and 10 to 14 Years (38,075 | 7.5%) for women.
| Age Bracket | Male | Female |
| Under 5 Years | 33,926 (6.4%) | 32,401 (6.4%) |
| 5 to 9 Years | 34,426 (6.5%) | 33,637 (6.6%) |
| 10 to 14 Years | 39,913 (7.6%) | 38,075 (7.5%) |
| 15 to 19 Years | 36,732 (7.0%) | 32,919 (6.5%) |
| 20 to 24 Years | 40,144 (7.6%) | 33,360 (6.6%) |
| 25 to 29 Years | 38,590 (7.3%) | 34,143 (6.7%) |
| 30 to 34 Years | 36,812 (7.0%) | 36,741 (7.2%) |
| 35 to 39 Years | 37,640 (7.1%) | 32,453 (6.4%) |
| 40 to 44 Years | 33,092 (6.3%) | 31,507 (6.2%) |
| 45 to 49 Years | 30,538 (5.8%) | 29,048 (5.7%) |
| 50 to 54 Years | 30,542 (5.8%) | 30,927 (6.1%) |
| 55 to 59 Years | 31,908 (6.0%) | 31,512 (6.2%) |
| 60 to 64 Years | 29,773 (5.7%) | 29,478 (5.8%) |
| 65 to 69 Years | 24,750 (4.7%) | 25,796 (5.1%) |
| 70 to 74 Years | 20,128 (3.8%) | 19,919 (3.9%) |
| 75 to 79 Years | 12,993 (2.5%) | 16,298 (3.2%) |
| 80 to 84 Years | 8,769 (1.7%) | 9,655 (1.9%) |
| 85 Years and over | 6,725 (1.3%) | 11,236 (2.2%) |
| Total | 527,401 (100.0%) | 509,105 (100.0%) |
Families and Households in Area Code 442
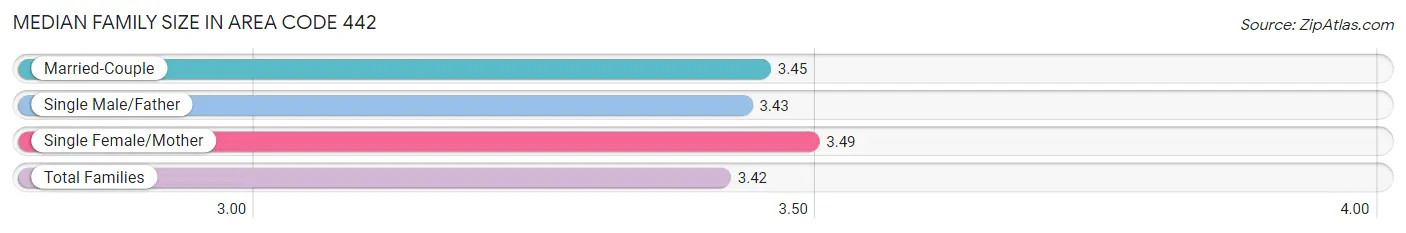
Median Family Size in Area Code 442
The median family size in Area Code 442 is 3.42 persons per family, with single female/mother families (44,956 | 18.7%) accounting for the largest median family size of 3.49392 persons per family. On the other hand, single male/father families (21,219 | 8.8%) represent the smallest median family size with 3.43 persons per family.
| Family Type | # Families | Family Size |
| Married-Couple | 173,872 (72.4%) | 3.45 |
| Single Male/Father | 21,219 (8.8%) | 3.43 |
| Single Female/Mother | 44,956 (18.7%) | 3.49 |
| Total Families | 240,047 (100.0%) | 3.42 |
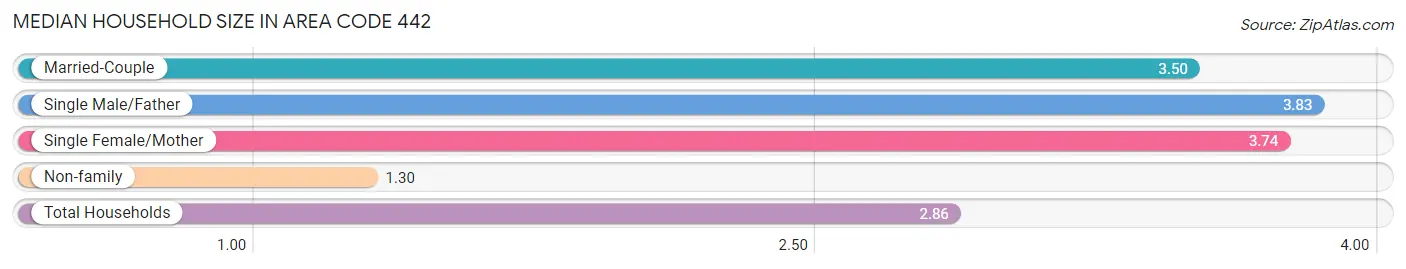
Median Household Size in Area Code 442
The median household size in Area Code 442 is 2.86 persons per household, with single male/father households (21,219 | 6.2%) accounting for the largest median household size of 3.83178 persons per household. non-family households (102,459 | 29.9%) represent the smallest median household size with 1.30 persons per household.
| Household Type | # Households | Household Size |
| Married-Couple | 173,872 (50.8%) | 3.50 |
| Single Male/Father | 21,219 (6.2%) | 3.83 |
| Single Female/Mother | 44,956 (13.1%) | 3.74 |
| Non-family | 102,459 (29.9%) | 1.30 |
| Total Households | 342,506 (100.0%) | 2.86 |
Household Size by Marriage Status in Area Code 442
Out of a total of 342,506 households in Area Code 442, 240,047 (70.1%) are family households, while 102,459 (29.9%) are nonfamily households. The most numerous type of family households are 2-person households, comprising 89,209, and the most common type of nonfamily households are 1-person households, comprising 80,895.
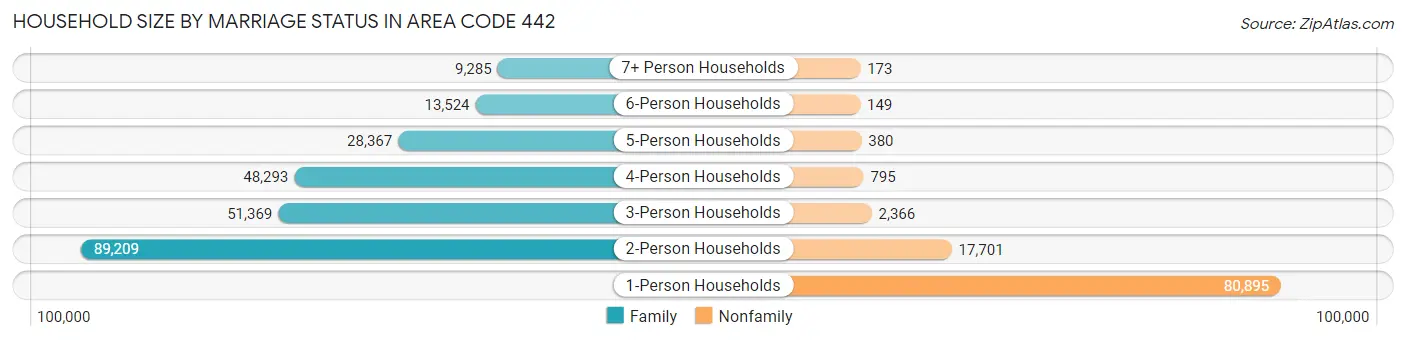
| Household Size | Family Households | Nonfamily Households |
| 1-Person Households | - | 80,895 (23.6%) |
| 2-Person Households | 89,209 (26.1%) | 17,701 (5.2%) |
| 3-Person Households | 51,369 (15.0%) | 2,366 (0.7%) |
| 4-Person Households | 48,293 (14.1%) | 795 (0.2%) |
| 5-Person Households | 28,367 (8.3%) | 380 (0.1%) |
| 6-Person Households | 13,524 (4.0%) | 149 (0.0%) |
| 7+ Person Households | 9,285 (2.7%) | 173 (0.1%) |
| Total | 240,047 (70.1%) | 102,459 (29.9%) |
Female Fertility in Area Code 442
Fertility by Age in Area Code 442
Average fertility rate in Area Code 442 is 56.1 births per 1,000 women. Women in the age bracket of 20 to 34 years have the highest fertility rate with 87.7 births per 1,000 women. Women in the age bracket of 20 to 34 years acount for 69.9% of all women with births.
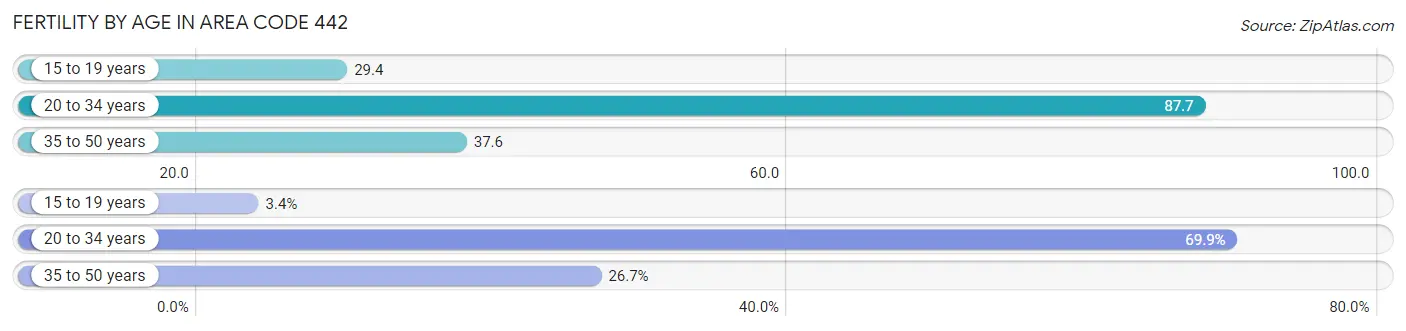
| Age Bracket | Women with Births | Births / 1,000 Women |
| 15 to 19 years | 482 (3.4%) | 29.4 |
| 20 to 34 years | 9,806 (69.9%) | 87.7 |
| 35 to 50 years | 3,748 (26.7%) | 37.6 |
| Total | 14,036 (100.0%) | 56.1 |
Fertility by Age by Marriage Status in Area Code 442
66.4% of women with births (14,036) in Area Code 442 are married. The highest percentage of unmarried women with births falls into 15 to 19 years age bracket with 94.8% of them unmarried at the time of birth, while the lowest percentage of unmarried women with births belong to 35 to 50 years age bracket with 28.6% of them unmarried.
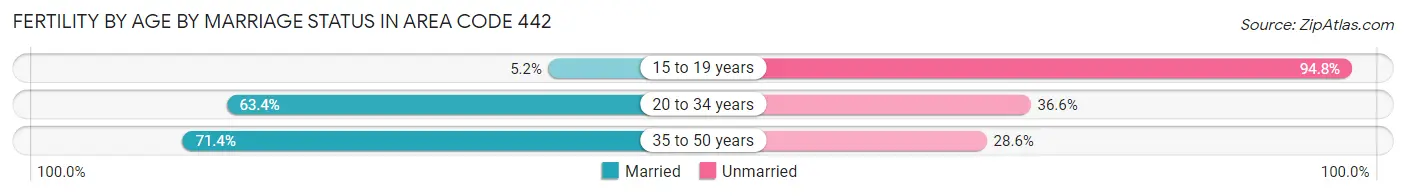
| Age Bracket | Married | Unmarried |
| 15 to 19 years | 25 (5.2%) | 457 (94.8%) |
| 20 to 34 years | 6,219 (63.4%) | 3,587 (36.6%) |
| 35 to 50 years | 2,675 (71.4%) | 1,073 (28.6%) |
| Total | 9,317 (66.4%) | 4,719 (33.6%) |
Fertility by Education in Area Code 442
Average fertility rate in Area Code 442 is 56.1 births per 1,000 women. Women with the education attainment of graduate degree have the highest fertility rate of 74.4 births per 1,000 women, while women with the education attainment of less than high school have the lowest fertility at 37.0 births per 1,000 women. Women with the education attainment of college or associate's degree represent 39.7% of all women with births.
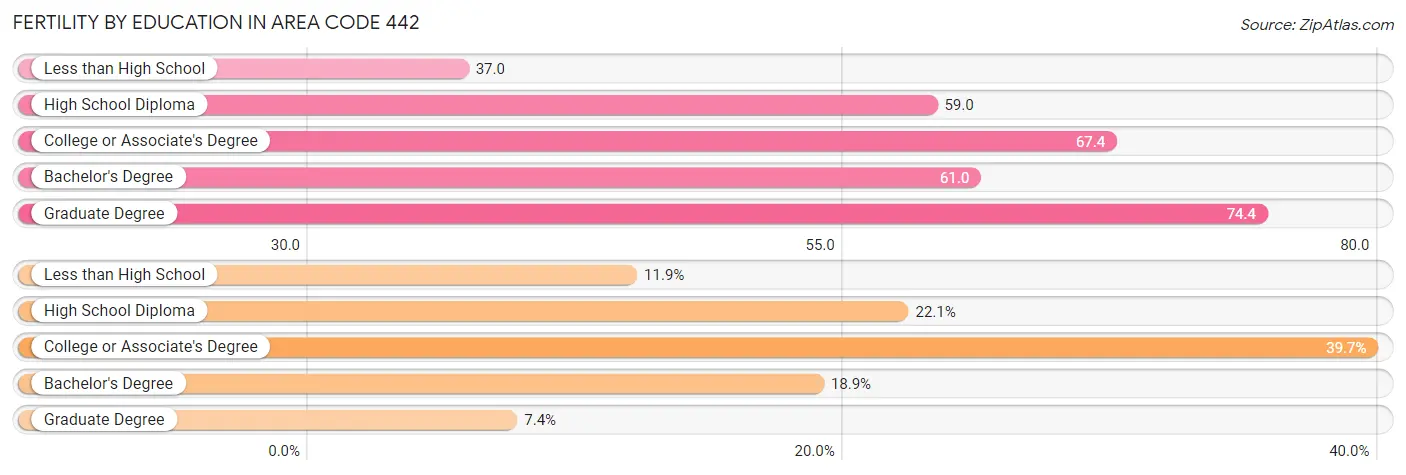
| Educational Attainment | Women with Births | Births / 1,000 Women |
| Less than High School | 1,671 (11.9%) | 37.0 |
| High School Diploma | 3,099 (22.1%) | 59.0 |
| College or Associate's Degree | 5,570 (39.7%) | 67.4 |
| Bachelor's Degree | 2,654 (18.9%) | 61.0 |
| Graduate Degree | 1,042 (7.4%) | 74.4 |
| Total | 14,036 (100.0%) | 56.1 |
Fertility by Education by Marriage Status in Area Code 442
33.6% of women with births in Area Code 442 are unmarried. Women with the educational attainment of college or associate's degree are most likely to be married with 62.5% of them married at childbirth, while women with the educational attainment of less than high school are least likely to be married with 67.0% of them unmarried at childbirth.
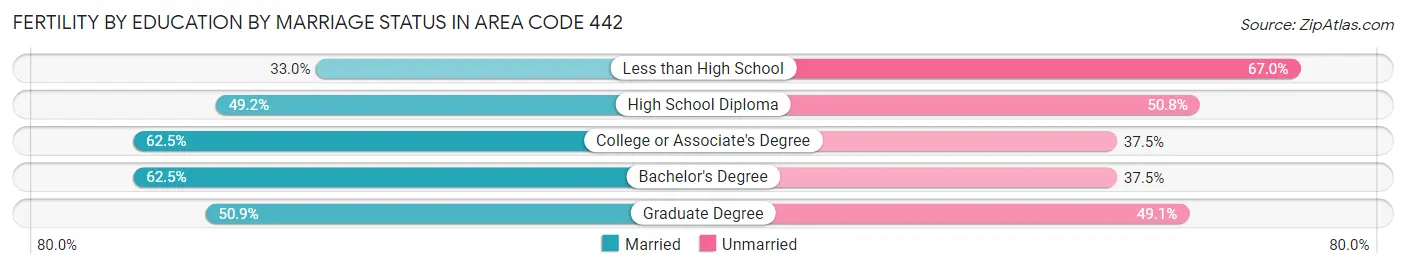
| Educational Attainment | Married | Unmarried |
| Less than High School | 551 (33.0%) | 1,120 (67.0%) |
| High School Diploma | 1,524 (49.2%) | 1,575 (50.8%) |
| College or Associate's Degree | 3,481 (62.5%) | 2,089 (37.5%) |
| Bachelor's Degree | 1,658 (62.5%) | 996 (37.5%) |
| Graduate Degree | 530 (50.9%) | 512 (49.1%) |
| Total | 9,317 (66.4%) | 4,719 (33.6%) |
Employment Characteristics in Area Code 442
Employment by Class of Employer in Area Code 442
Among the 446,895 employed individuals in Area Code 442, private company employees (294,316 | 65.9%), local government employees (35,264 | 7.9%), and self-employed (not incorporated) (34,364 | 7.7%) make up the most common classes of employment.
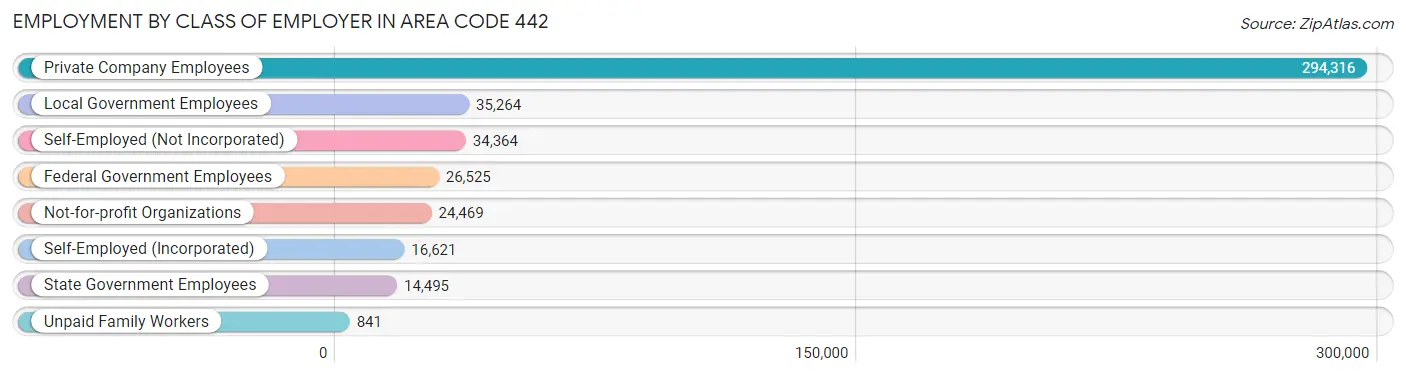
| Employer Class | # Employees | % Employees |
| Private Company Employees | 294,316 | 65.9% |
| Self-Employed (Incorporated) | 16,621 | 3.7% |
| Self-Employed (Not Incorporated) | 34,364 | 7.7% |
| Not-for-profit Organizations | 24,469 | 5.5% |
| Local Government Employees | 35,264 | 7.9% |
| State Government Employees | 14,495 | 3.2% |
| Federal Government Employees | 26,525 | 5.9% |
| Unpaid Family Workers | 841 | 0.2% |
| Total | 446,895 | 100.0% |
Employment Status by Age in Area Code 442
According to the labor force statistics for Area Code 442, out of the total population over 16 years of age (808,682), 59.3% or 479,225 individuals are in the labor force, with 10.3% or 49,264 of them unemployed. The age group with the highest labor force participation rate is 30 to 34 years, with 83.1% or 61,152 individuals in the labor force. Within the labor force, the 16 to 19 years age range has the highest percentage of unemployed individuals, with 649.3% or 116,777 of them being unemployed.
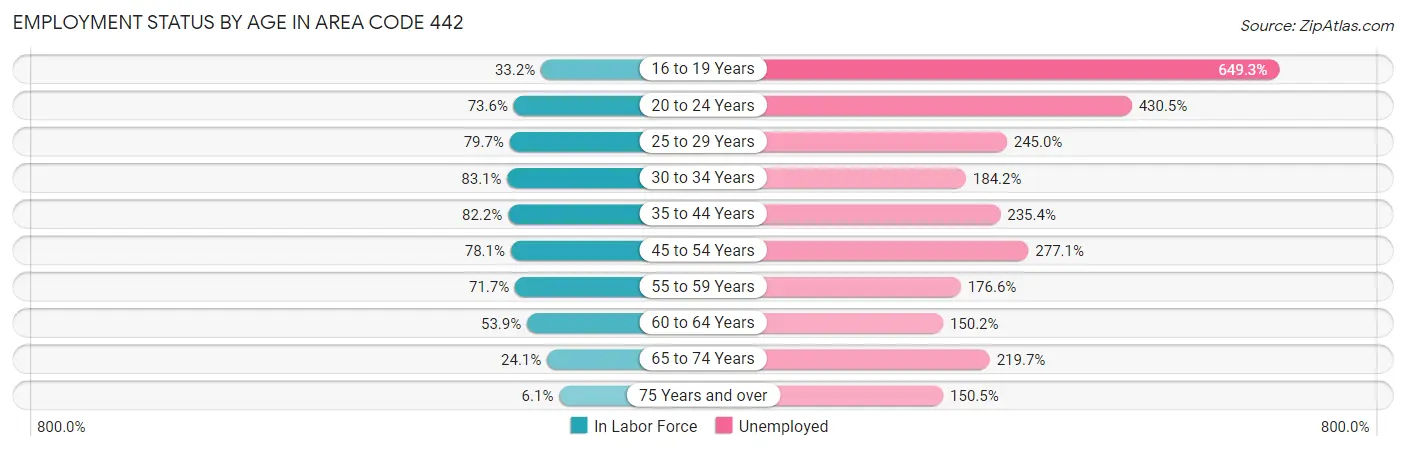
| Age Bracket | In Labor Force | Unemployed |
| 16 to 19 Years | 17,984 (33.2%) | 116,777 (649.3%) |
| 20 to 24 Years | 54,129 (73.6%) | 233,021 (430.5%) |
| 25 to 29 Years | 57,960 (79.7%) | 142,004 (245.0%) |
| 30 to 34 Years | 61,151 (83.1%) | 112,642 (184.2%) |
| 35 to 44 Years | 110,664 (82.2%) | 260,501 (235.4%) |
| 45 to 54 Years | 94,509 (78.1%) | 261,882 (277.1%) |
| 55 to 59 Years | 45,474 (71.7%) | 80,304 (176.6%) |
| 60 to 64 Years | 31,921 (53.9%) | 47,942 (150.2%) |
| 65 to 74 Years | 21,866 (24.1%) | 48,046 (219.7%) |
| 75 Years and over | 3,991 (6.1%) | 6,009 (150.5%) |
| Total | 479,242 (59.3%) | 49,240 (10.3%) |
Employment Status by Educational Attainment in Area Code 442
According to labor force statistics for Area Code 442, 74.5% of individuals (390,747) out of the total population between 25 and 64 years of age (524,704) are in the labor force, with 240.4% or 939,356 of them being unemployed. The group with the highest labor force participation rate are those with the educational attainment of bachelor's degree or higher, with 83.0% or 118,696 individuals in the labor force. Within the labor force, individuals with less than high school education have the highest percentage of unemployment, with 258.7% or 140,704 of them being unemployed.
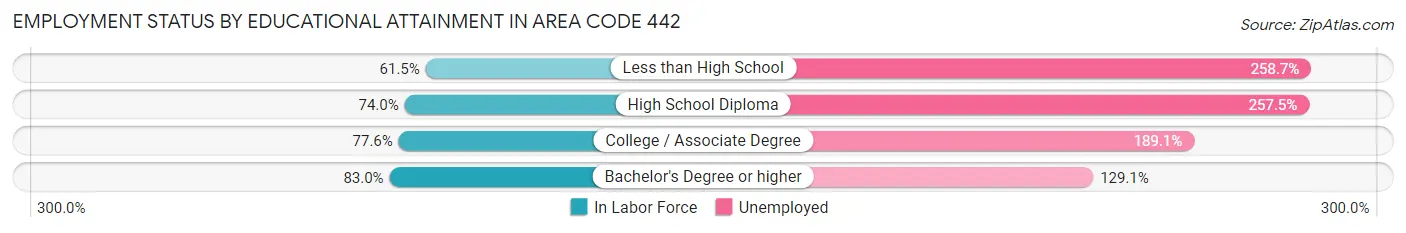
| Educational Attainment | In Labor Force | Unemployed |
| Less than High School | 54,390 (61.5%) | 228,900 (258.7%) |
| High School Diploma | 94,026 (74.0%) | 327,154 (257.5%) |
| College / Associate Degree | 128,843 (77.5%) | 314,188 (189.1%) |
| Bachelor's Degree or higher | 118,700 (83.0%) | 184,644 (129.1%) |
| Total | 390,742 (74.5%) | 1,261,388 (240.4%) |
Employment Occupations by Sex in Area Code 442
Management, Business, Science and Arts Occupations
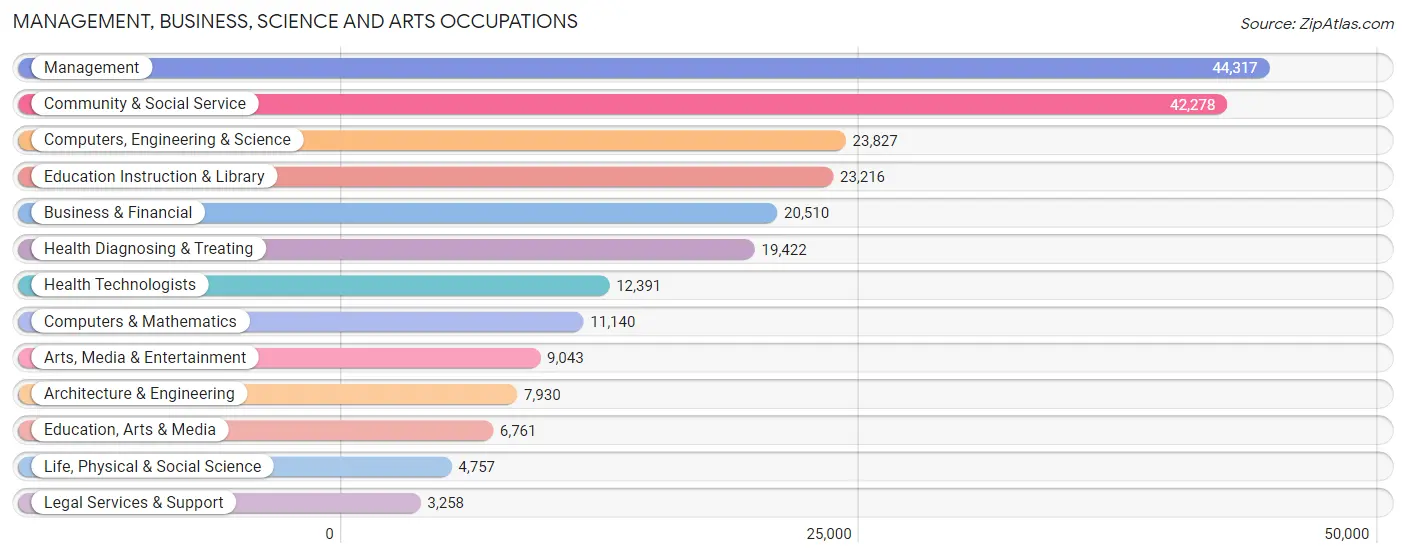
The most common Management, Business, Science and Arts occupations in Area Code 442 are Management (44,317 | 10.1%), Community & Social Service (42,278 | 9.6%), Computers, Engineering & Science (23,827 | 5.4%), Education Instruction & Library (23,216 | 5.3%), and Business & Financial (20,510 | 4.6%).
Management, Business, Science and Arts Occupations by Sex
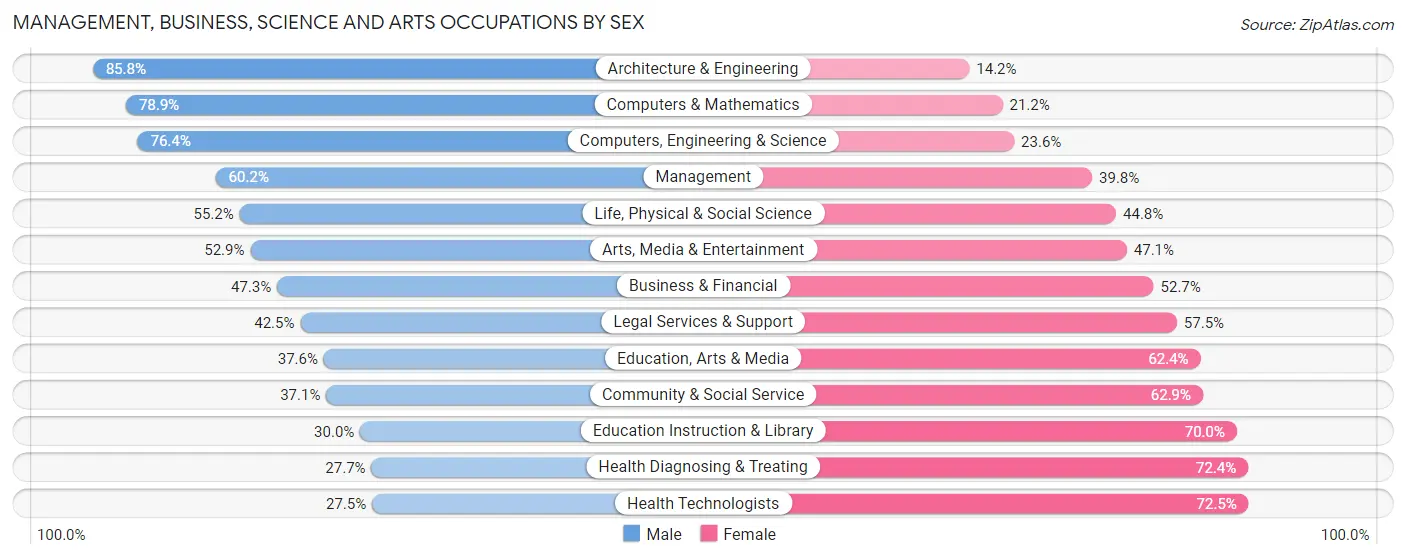
Within the Management, Business, Science and Arts occupations in Area Code 442, the most male-oriented occupations are Architecture & Engineering (85.8%), Computers & Mathematics (78.8%), and Computers, Engineering & Science (76.4%), while the most female-oriented occupations are Health Technologists (72.5%), Health Diagnosing & Treating (72.4%), and Education Instruction & Library (70.0%).
| Occupation | Male | Female |
| Management | 26,667 (60.2%) | 17,650 (39.8%) |
| Business & Financial | 9,710 (47.3%) | 10,800 (52.7%) |
| Computers, Engineering & Science | 18,210 (76.4%) | 5,617 (23.6%) |
| Computers & Mathematics | 8,784 (78.8%) | 2,356 (21.1%) |
| Architecture & Engineering | 6,802 (85.8%) | 1,128 (14.2%) |
| Life, Physical & Social Science | 2,624 (55.2%) | 2,133 (44.8%) |
| Community & Social Service | 15,675 (37.1%) | 26,603 (62.9%) |
| Education, Arts & Media | 2,541 (37.6%) | 4,220 (62.4%) |
| Legal Services & Support | 1,384 (42.5%) | 1,874 (57.5%) |
| Education Instruction & Library | 6,964 (30.0%) | 16,252 (70.0%) |
| Arts, Media & Entertainment | 4,786 (52.9%) | 4,257 (47.1%) |
| Health Diagnosing & Treating | 5,370 (27.7%) | 14,052 (72.4%) |
| Health Technologists | 3,410 (27.5%) | 8,981 (72.5%) |
| Total (Category) | 75,632 (50.3%) | 74,722 (49.7%) |
| Total (Overall) | 242,617 (55.1%) | 197,996 (44.9%) |
Services Occupations
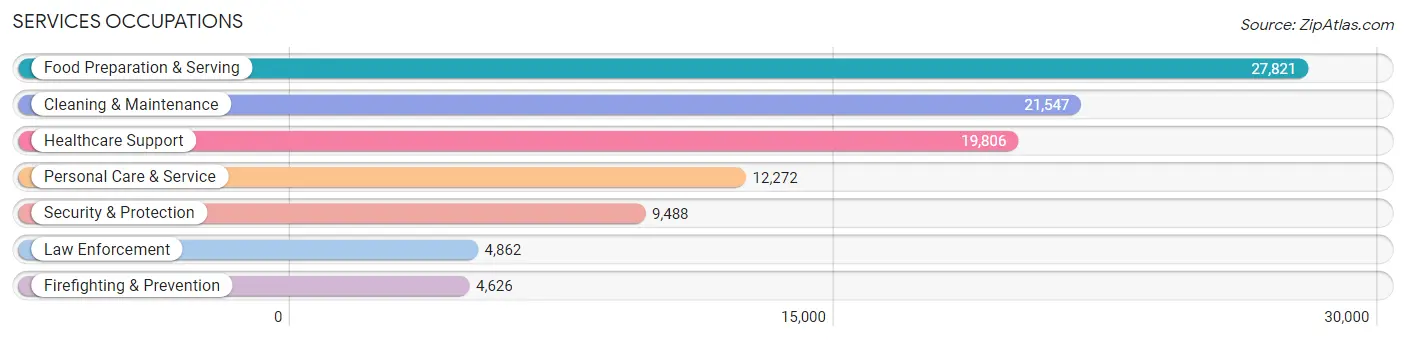
The most common Services occupations in Area Code 442 are Food Preparation & Serving (27,821 | 6.3%), Cleaning & Maintenance (21,547 | 4.9%), Healthcare Support (19,806 | 4.5%), Personal Care & Service (12,272 | 2.8%), and Security & Protection (9,488 | 2.1%).
Services Occupations by Sex
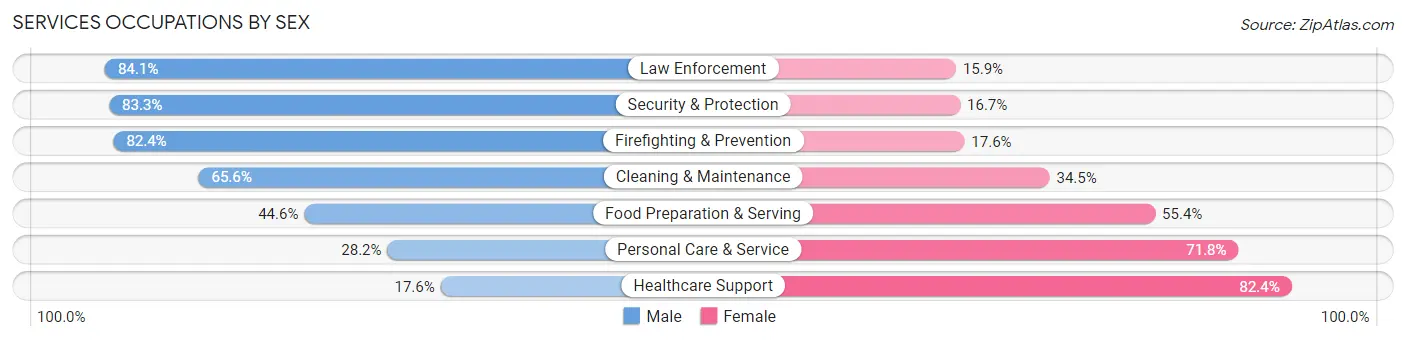
Within the Services occupations in Area Code 442, the most male-oriented occupations are Law Enforcement (84.1%), Security & Protection (83.3%), and Firefighting & Prevention (82.4%), while the most female-oriented occupations are Healthcare Support (82.4%), Personal Care & Service (71.8%), and Food Preparation & Serving (55.4%).
| Occupation | Male | Female |
| Healthcare Support | 3,492 (17.6%) | 16,314 (82.4%) |
| Security & Protection | 7,900 (83.3%) | 1,588 (16.7%) |
| Firefighting & Prevention | 3,812 (82.4%) | 814 (17.6%) |
| Law Enforcement | 4,088 (84.1%) | 774 (15.9%) |
| Food Preparation & Serving | 12,416 (44.6%) | 15,405 (55.4%) |
| Cleaning & Maintenance | 14,124 (65.5%) | 7,423 (34.4%) |
| Personal Care & Service | 3,456 (28.2%) | 8,816 (71.8%) |
| Total (Category) | 41,388 (45.5%) | 49,546 (54.5%) |
| Total (Overall) | 242,617 (55.1%) | 197,996 (44.9%) |
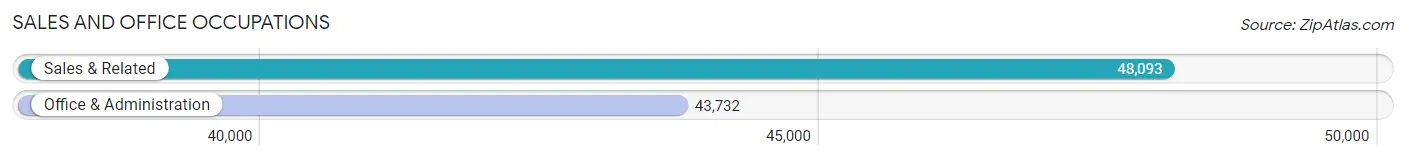
Sales and Office Occupations
The most common Sales and Office occupations in Area Code 442 are Sales & Related (48,093 | 10.9%), and Office & Administration (43,732 | 9.9%).
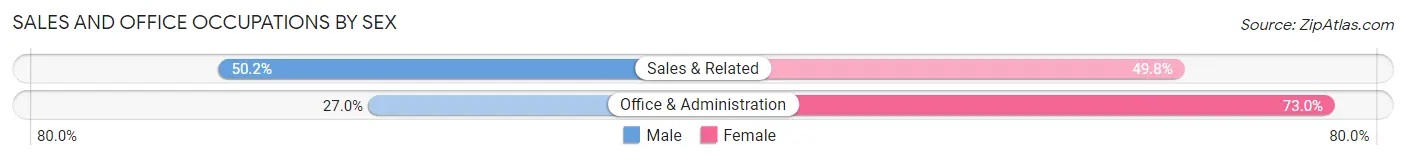
Sales and Office Occupations by Sex
| Occupation | Male | Female |
| Sales & Related | 24,123 (50.2%) | 23,970 (49.8%) |
| Office & Administration | 11,819 (27.0%) | 31,913 (73.0%) |
| Total (Category) | 35,942 (39.1%) | 55,883 (60.9%) |
| Total (Overall) | 242,617 (55.1%) | 197,996 (44.9%) |
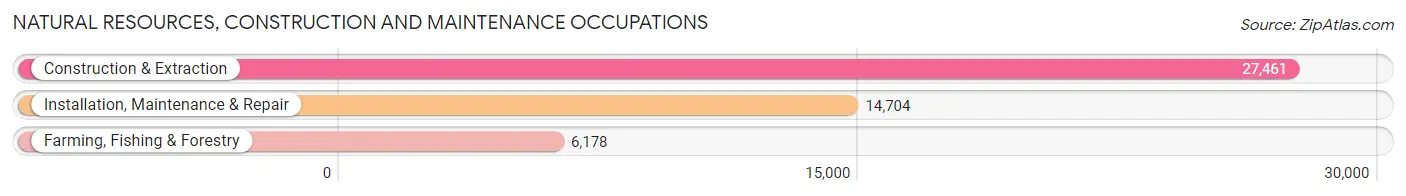
Natural Resources, Construction and Maintenance Occupations
The most common Natural Resources, Construction and Maintenance occupations in Area Code 442 are Construction & Extraction (27,461 | 6.2%), Installation, Maintenance & Repair (14,704 | 3.3%), and Farming, Fishing & Forestry (6,178 | 1.4%).
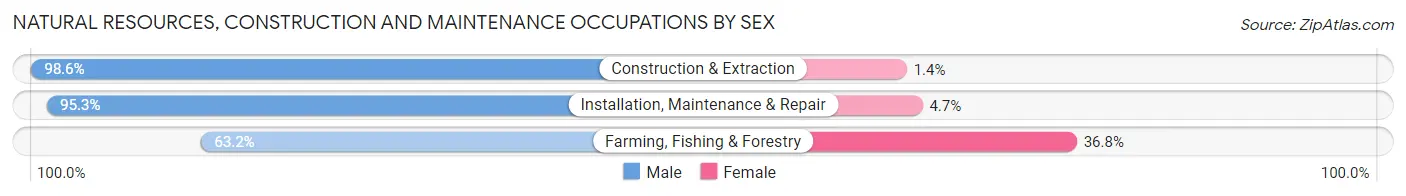
Natural Resources, Construction and Maintenance Occupations by Sex
| Occupation | Male | Female |
| Farming, Fishing & Forestry | 3,905 (63.2%) | 2,273 (36.8%) |
| Construction & Extraction | 27,075 (98.6%) | 386 (1.4%) |
| Installation, Maintenance & Repair | 14,015 (95.3%) | 689 (4.7%) |
| Total (Category) | 44,995 (93.1%) | 3,348 (6.9%) |
| Total (Overall) | 242,617 (55.1%) | 197,996 (44.9%) |
Production, Transportation and Moving Occupations
The most common Production, Transportation and Moving occupations in Area Code 442 are Material Moving (20,905 | 4.7%), Production (20,004 | 4.5%), and Transportation (18,248 | 4.1%).
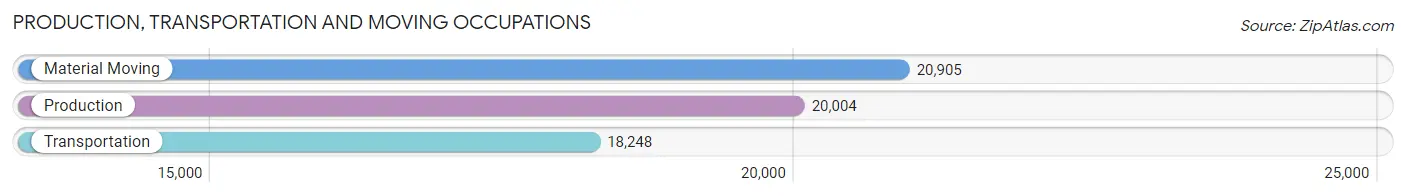
Production, Transportation and Moving Occupations by Sex
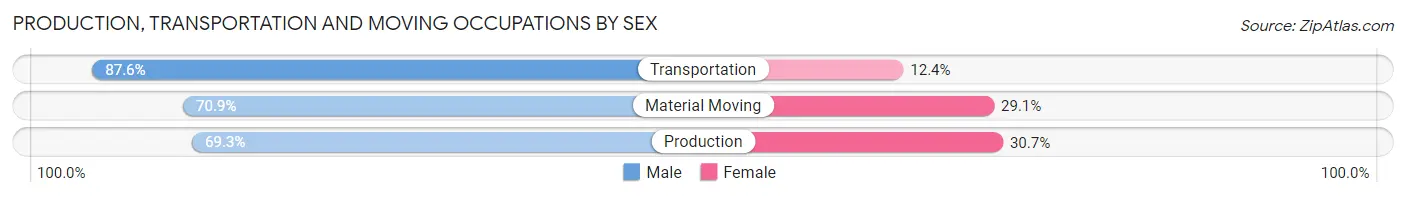
| Occupation | Male | Female |
| Production | 13,858 (69.3%) | 6,146 (30.7%) |
| Transportation | 15,978 (87.6%) | 2,270 (12.4%) |
| Material Moving | 14,824 (70.9%) | 6,081 (29.1%) |
| Total (Category) | 44,660 (75.5%) | 14,497 (24.5%) |
| Total (Overall) | 242,617 (55.1%) | 197,996 (44.9%) |
Employment Industries by Sex in Area Code 442
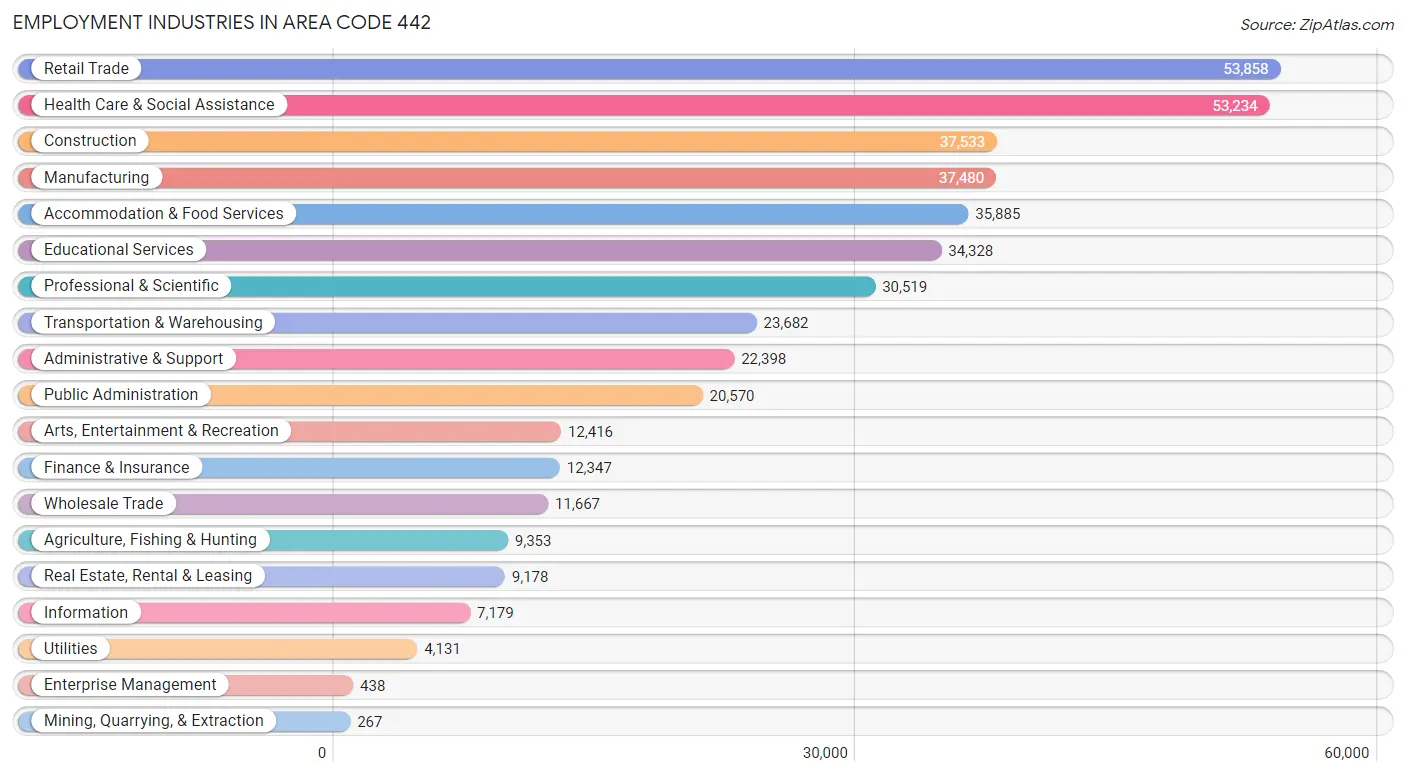
Employment Industries in Area Code 442
The major employment industries in Area Code 442 include Retail Trade (53,858 | 12.2%), Health Care & Social Assistance (53,234 | 12.1%), Construction (37,533 | 8.5%), Manufacturing (37,480 | 8.5%), and Accommodation & Food Services (35,885 | 8.1%).
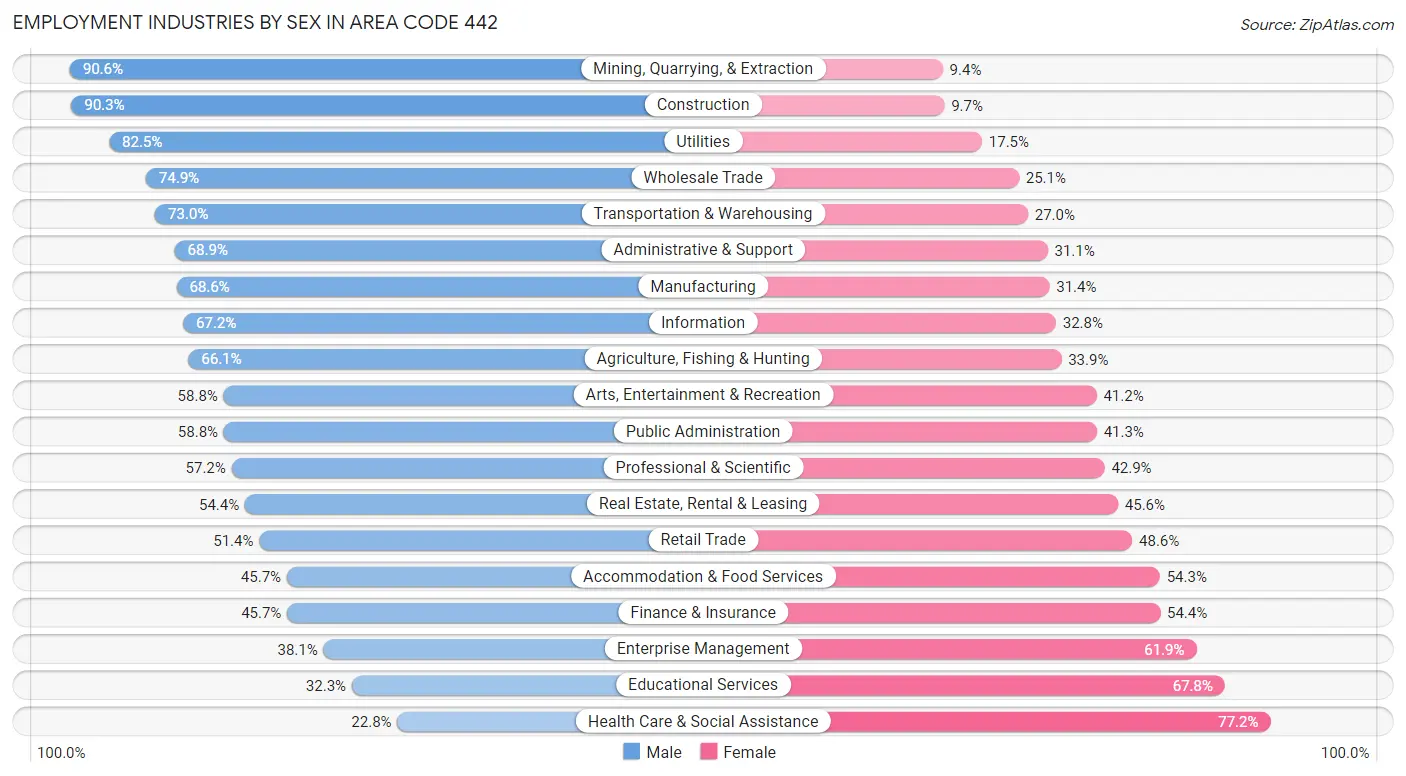
Employment Industries by Sex in Area Code 442
The Area Code 442 industries that see more men than women are Mining, Quarrying, & Extraction (90.6%), Construction (90.3%), and Utilities (82.5%), whereas the industries that tend to have a higher number of women are Health Care & Social Assistance (77.2%), Educational Services (67.7%), and Enterprise Management (61.9%).
| Industry | Male | Female |
| Agriculture, Fishing & Hunting | 6,181 (66.1%) | 3,172 (33.9%) |
| Mining, Quarrying, & Extraction | 242 (90.6%) | 25 (9.4%) |
| Construction | 33,901 (90.3%) | 3,632 (9.7%) |
| Manufacturing | 25,698 (68.6%) | 11,782 (31.4%) |
| Wholesale Trade | 8,736 (74.9%) | 2,931 (25.1%) |
| Retail Trade | 27,693 (51.4%) | 26,165 (48.6%) |
| Transportation & Warehousing | 17,291 (73.0%) | 6,391 (27.0%) |
| Utilities | 3,409 (82.5%) | 722 (17.5%) |
| Information | 4,825 (67.2%) | 2,354 (32.8%) |
| Finance & Insurance | 5,637 (45.7%) | 6,710 (54.3%) |
| Real Estate, Rental & Leasing | 4,990 (54.4%) | 4,188 (45.6%) |
| Professional & Scientific | 17,441 (57.2%) | 13,078 (42.8%) |
| Enterprise Management | 167 (38.1%) | 271 (61.9%) |
| Administrative & Support | 15,439 (68.9%) | 6,959 (31.1%) |
| Educational Services | 11,070 (32.3%) | 23,258 (67.7%) |
| Health Care & Social Assistance | 12,152 (22.8%) | 41,082 (77.2%) |
| Arts, Entertainment & Recreation | 7,300 (58.8%) | 5,116 (41.2%) |
| Accommodation & Food Services | 16,402 (45.7%) | 19,483 (54.3%) |
| Public Administration | 12,084 (58.8%) | 8,486 (41.2%) |
| Total | 242,617 (55.1%) | 197,996 (44.9%) |
Education in Area Code 442
School Enrollment in Area Code 442
The most common levels of schooling among the 266,826 students in Area Code 442 are high school (60,469 | 22.7%), middle school (60,467 | 22.7%), and college / undergraduate (57,360 | 21.5%).
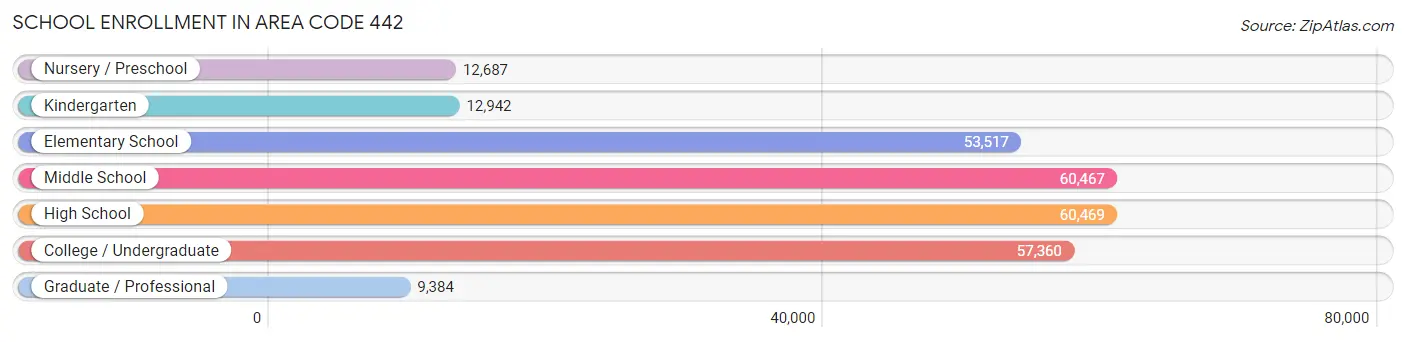
| School Level | # Students | % Students |
| Nursery / Preschool | 12,687 | 4.8% |
| Kindergarten | 12,942 | 4.9% |
| Elementary School | 53,517 | 20.1% |
| Middle School | 60,467 | 22.7% |
| High School | 60,469 | 22.7% |
| College / Undergraduate | 57,360 | 21.5% |
| Graduate / Professional | 9,384 | 3.5% |
| Total | 266,826 | 100.0% |
School Enrollment by Age by Funding Source in Area Code 442
Out of a total of 266,826 students who are enrolled in schools in Area Code 442, 27,173 (10.2%) attend a private institution, while the remaining 239,653 (89.8%) are enrolled in public schools. The age group of 3 to 4 year olds has the highest likelihood of being enrolled in private schools, with 3,248 (33.9% in the age bracket) enrolled. Conversely, the age group of 15 to 17 year olds has the lowest likelihood of being enrolled in a private school, with 39,428 (94.4% in the age bracket) attending a public institution.
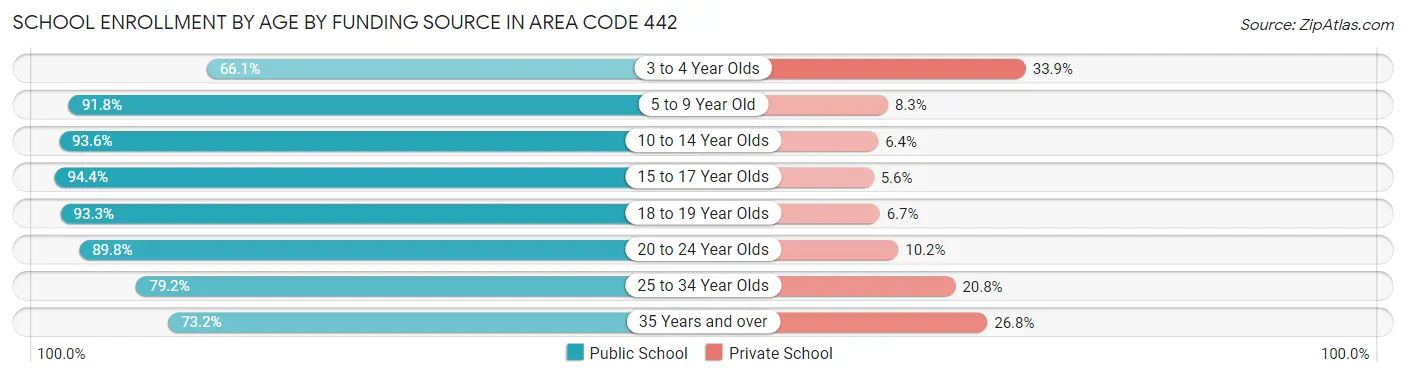
| Age Bracket | Public School | Private School |
| 3 to 4 Year Olds | 6,325 (66.1%) | 3,248 (33.9%) |
| 5 to 9 Year Old | 58,349 (91.7%) | 5,249 (8.3%) |
| 10 to 14 Year Olds | 71,427 (93.6%) | 4,915 (6.4%) |
| 15 to 17 Year Olds | 39,428 (94.4%) | 2,333 (5.6%) |
| 18 to 19 Year Olds | 16,206 (93.3%) | 1,168 (6.7%) |
| 20 to 24 Year Olds | 23,288 (89.8%) | 2,638 (10.2%) |
| 25 to 34 Year Olds | 13,738 (79.2%) | 3,612 (20.8%) |
| 35 Years and over | 10,914 (73.2%) | 3,988 (26.8%) |
| Total | 239,653 (89.8%) | 27,173 (10.2%) |
Educational Attainment by Field of Study in Area Code 442
Business (38,139 | 18.8%), social sciences (18,732 | 9.2%), education (17,163 | 8.5%), science & technology (16,408 | 8.1%), and engineering (16,016 | 7.9%) are the most common fields of study among 202,886 individuals in Area Code 442 who have obtained a bachelor's degree or higher.
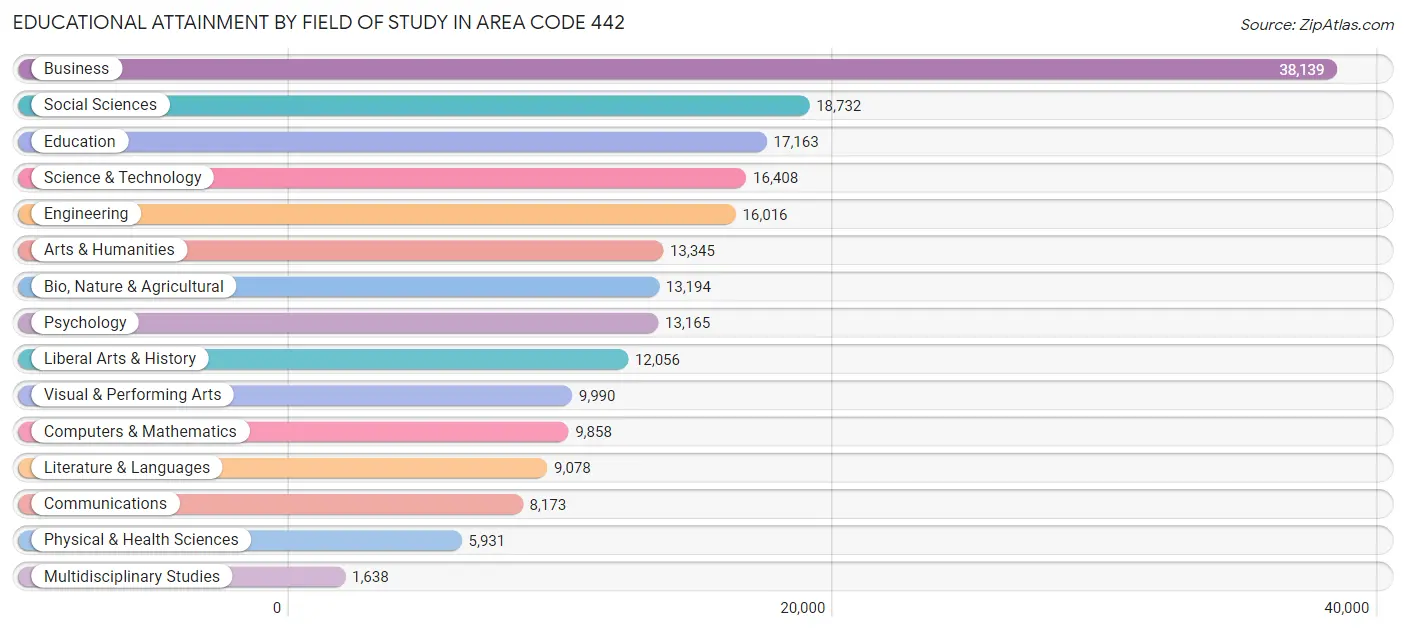
| Field of Study | # Graduates | % Graduates |
| Computers & Mathematics | 9,858 | 4.9% |
| Bio, Nature & Agricultural | 13,194 | 6.5% |
| Physical & Health Sciences | 5,931 | 2.9% |
| Psychology | 13,165 | 6.5% |
| Social Sciences | 18,732 | 9.2% |
| Engineering | 16,016 | 7.9% |
| Multidisciplinary Studies | 1,638 | 0.8% |
| Science & Technology | 16,408 | 8.1% |
| Business | 38,139 | 18.8% |
| Education | 17,163 | 8.5% |
| Literature & Languages | 9,078 | 4.5% |
| Liberal Arts & History | 12,056 | 5.9% |
| Visual & Performing Arts | 9,990 | 4.9% |
| Communications | 8,173 | 4.0% |
| Arts & Humanities | 13,345 | 6.6% |
| Total | 202,886 | 100.0% |
Transportation & Commute in Area Code 442
Vehicle Availability by Sex in Area Code 442
The most prevalent vehicle ownership categories in Area Code 442 are males with 2 vehicles (99,264, accounting for 40.1%) and females with 2 vehicles (74,727, making up 51.6%).
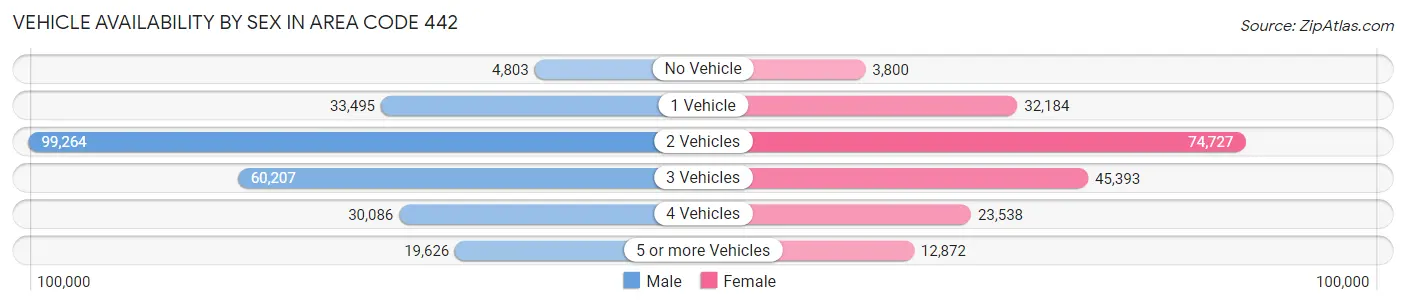
| Vehicles Available | Male | Female |
| No Vehicle | 4,803 (1.9%) | 3,800 (2.0%) |
| 1 Vehicle | 33,495 (13.5%) | 32,184 (16.7%) |
| 2 Vehicles | 99,264 (40.1%) | 74,727 (38.8%) |
| 3 Vehicles | 60,207 (24.3%) | 45,393 (23.6%) |
| 4 Vehicles | 30,086 (12.2%) | 23,538 (12.2%) |
| 5 or more Vehicles | 19,626 (7.9%) | 12,872 (6.7%) |
| Total | 247,481 (100.0%) | 192,514 (100.0%) |
Commute Time in Area Code 442
The most frequently occuring commute durations in Area Code 442 are 15 to 19 minutes (60,612 commuters, 15.4%), 30 to 34 minutes (56,808 commuters, 14.4%), and 20 to 24 minutes (54,566 commuters, 13.9%).
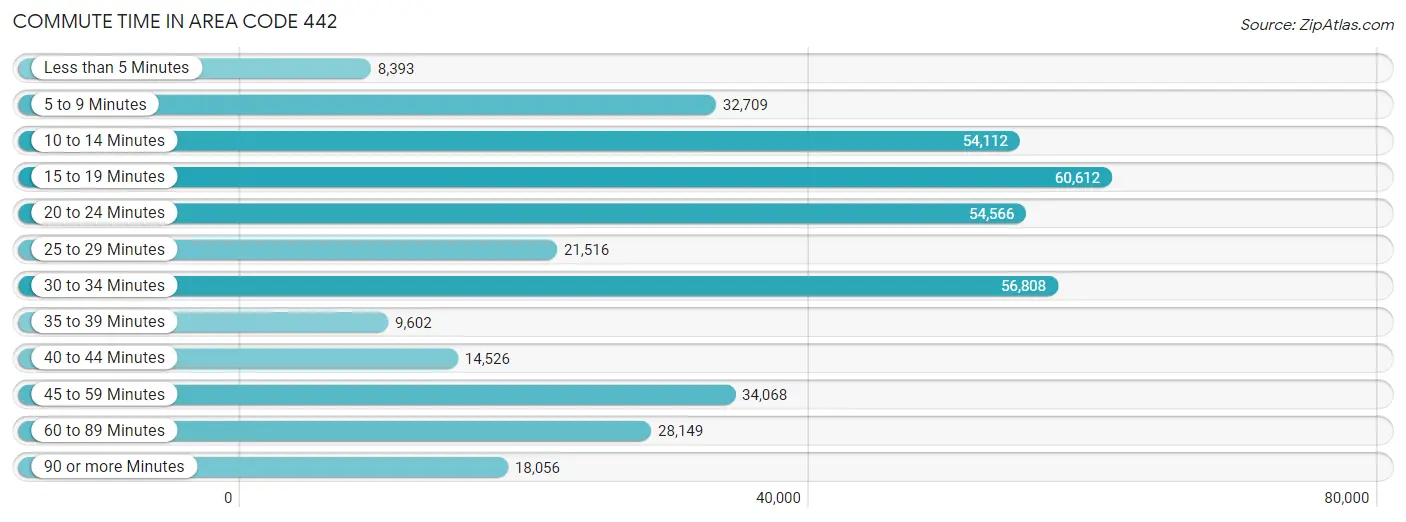
| Commute Time | # Commuters | % Commuters |
| Less than 5 Minutes | 8,393 | 2.1% |
| 5 to 9 Minutes | 32,709 | 8.3% |
| 10 to 14 Minutes | 54,112 | 13.8% |
| 15 to 19 Minutes | 60,612 | 15.4% |
| 20 to 24 Minutes | 54,566 | 13.9% |
| 25 to 29 Minutes | 21,516 | 5.5% |
| 30 to 34 Minutes | 56,808 | 14.4% |
| 35 to 39 Minutes | 9,602 | 2.4% |
| 40 to 44 Minutes | 14,526 | 3.7% |
| 45 to 59 Minutes | 34,068 | 8.7% |
| 60 to 89 Minutes | 28,149 | 7.2% |
| 90 or more Minutes | 18,056 | 4.6% |
Commute Time by Sex in Area Code 442
The most common commute times in Area Code 442 are 30 to 34 minutes (35,026 commuters, 15.5%) for males and 15 to 19 minutes (28,759 commuters, 17.3%) for females.
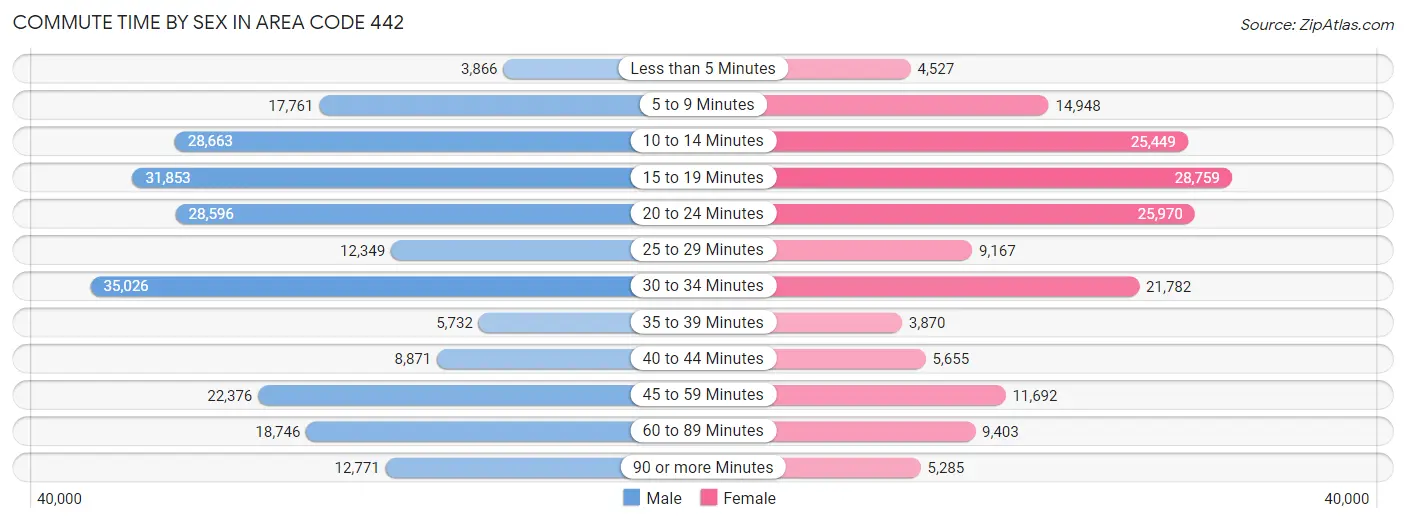
| Commute Time | Male | Female |
| Less than 5 Minutes | 3,866 (1.7%) | 4,527 (2.7%) |
| 5 to 9 Minutes | 17,761 (7.8%) | 14,948 (9.0%) |
| 10 to 14 Minutes | 28,663 (12.7%) | 25,449 (15.3%) |
| 15 to 19 Minutes | 31,853 (14.1%) | 28,759 (17.3%) |
| 20 to 24 Minutes | 28,596 (12.6%) | 25,970 (15.6%) |
| 25 to 29 Minutes | 12,349 (5.4%) | 9,167 (5.5%) |
| 30 to 34 Minutes | 35,026 (15.5%) | 21,782 (13.1%) |
| 35 to 39 Minutes | 5,732 (2.5%) | 3,870 (2.3%) |
| 40 to 44 Minutes | 8,871 (3.9%) | 5,655 (3.4%) |
| 45 to 59 Minutes | 22,376 (9.9%) | 11,692 (7.0%) |
| 60 to 89 Minutes | 18,746 (8.3%) | 9,403 (5.7%) |
| 90 or more Minutes | 12,771 (5.6%) | 5,285 (3.2%) |
Time of Departure to Work by Sex in Area Code 442
The most frequent times of departure to work in Area Code 442 are 7:00 AM to 7:29 AM (30,319, 13.4%) for males and 7:00 AM to 7:29 AM (24,594, 14.8%) for females.
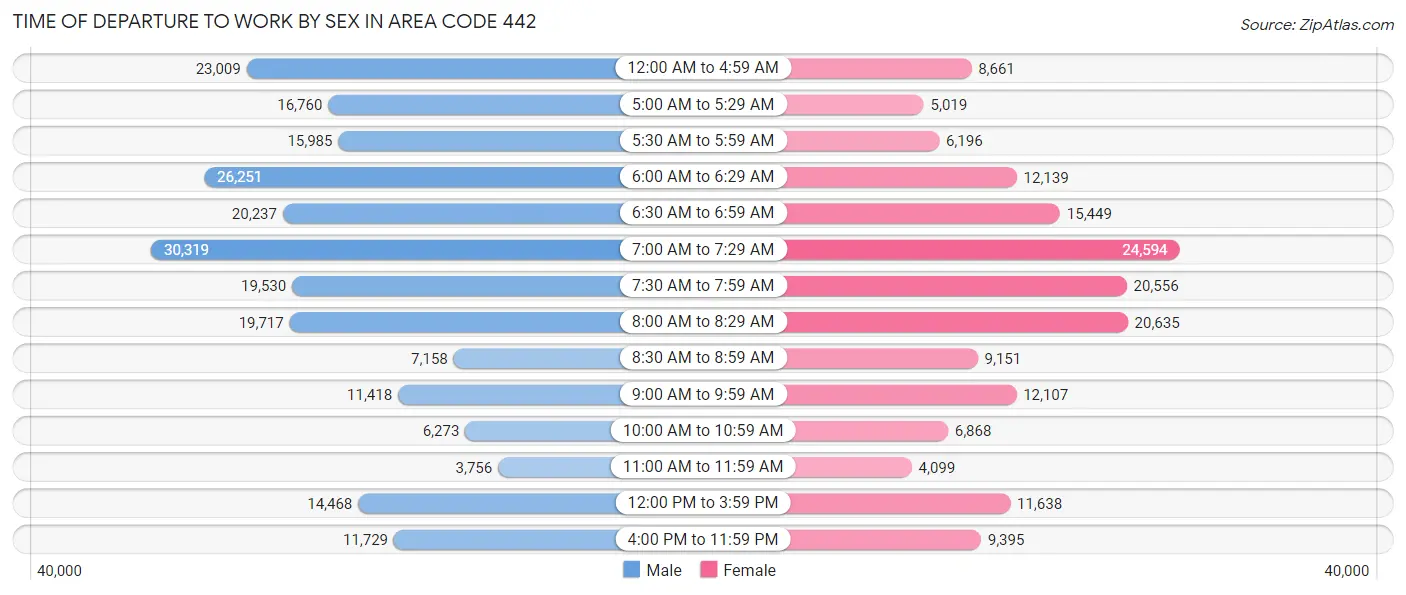
| Time of Departure | Male | Female |
| 12:00 AM to 4:59 AM | 23,009 (10.2%) | 8,661 (5.2%) |
| 5:00 AM to 5:29 AM | 16,760 (7.4%) | 5,019 (3.0%) |
| 5:30 AM to 5:59 AM | 15,985 (7.0%) | 6,196 (3.7%) |
| 6:00 AM to 6:29 AM | 26,251 (11.6%) | 12,139 (7.3%) |
| 6:30 AM to 6:59 AM | 20,237 (8.9%) | 15,449 (9.3%) |
| 7:00 AM to 7:29 AM | 30,319 (13.4%) | 24,594 (14.8%) |
| 7:30 AM to 7:59 AM | 19,530 (8.6%) | 20,556 (12.3%) |
| 8:00 AM to 8:29 AM | 19,717 (8.7%) | 20,635 (12.4%) |
| 8:30 AM to 8:59 AM | 7,158 (3.2%) | 9,151 (5.5%) |
| 9:00 AM to 9:59 AM | 11,418 (5.0%) | 12,107 (7.3%) |
| 10:00 AM to 10:59 AM | 6,273 (2.8%) | 6,868 (4.1%) |
| 11:00 AM to 11:59 AM | 3,756 (1.7%) | 4,099 (2.5%) |
| 12:00 PM to 3:59 PM | 14,468 (6.4%) | 11,638 (7.0%) |
| 4:00 PM to 11:59 PM | 11,729 (5.2%) | 9,395 (5.6%) |
| Total | 226,610 (100.0%) | 166,507 (100.0%) |
Housing Occupancy in Area Code 442
Occupancy by Ownership in Area Code 442
Of the total 342,506 dwellings in Area Code 442, owner-occupied units account for 202,460 (59.1%), while renter-occupied units make up 140,046 (40.9%).
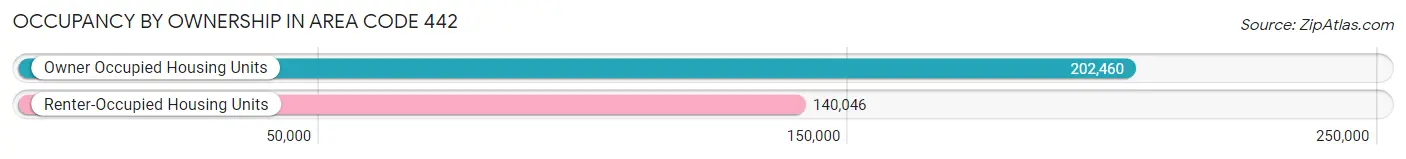
| Occupancy | # Housing Units | % Housing Units |
| Owner Occupied Housing Units | 202,460 | 59.1% |
| Renter-Occupied Housing Units | 140,046 | 40.9% |
| Total Occupied Housing Units | 342,506 | 100.0% |
Occupancy by Household Size in Area Code 442
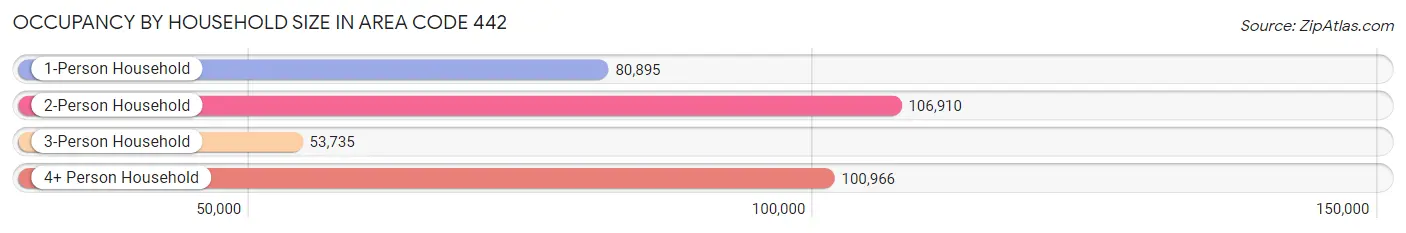
| Household Size | # Housing Units | % Housing Units |
| 1-Person Household | 80,895 | 23.6% |
| 2-Person Household | 106,910 | 31.2% |
| 3-Person Household | 53,735 | 15.7% |
| 4+ Person Household | 100,966 | 29.5% |
| Total Housing Units | 342,506 | 100.0% |
Occupancy by Ownership by Household Size in Area Code 442
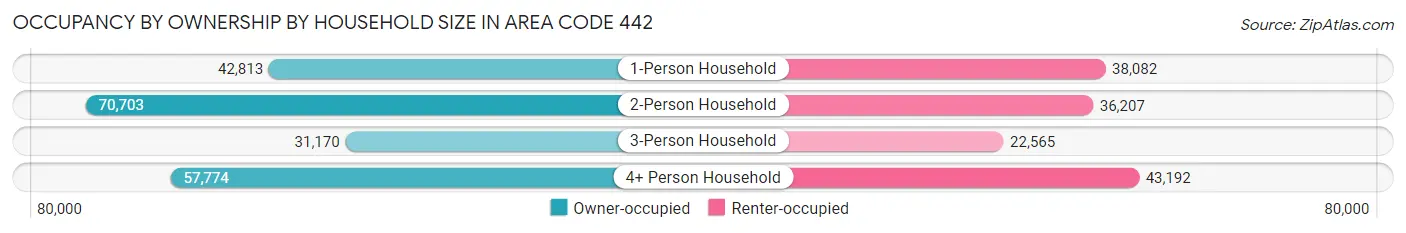
| Household Size | Owner-occupied | Renter-occupied |
| 1-Person Household | 42,813 (52.9%) | 38,082 (47.1%) |
| 2-Person Household | 70,703 (66.1%) | 36,207 (33.9%) |
| 3-Person Household | 31,170 (58.0%) | 22,565 (42.0%) |
| 4+ Person Household | 57,774 (57.2%) | 43,192 (42.8%) |
| Total Housing Units | 202,460 (59.1%) | 140,046 (40.9%) |
Occupancy by Educational Attainment in Area Code 442
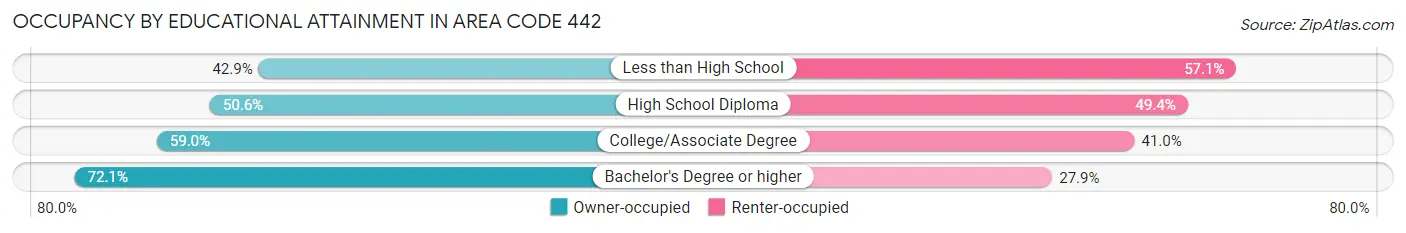
| Household Size | Owner-occupied | Renter-occupied |
| Less than High School | 21,615 (42.9%) | 28,769 (57.1%) |
| High School Diploma | 35,163 (50.6%) | 34,333 (49.4%) |
| College/Associate Degree | 66,724 (59.0%) | 46,323 (41.0%) |
| Bachelor's Degree or higher | 78,958 (72.1%) | 30,621 (27.9%) |
Occupancy by Age of Householder in Area Code 442
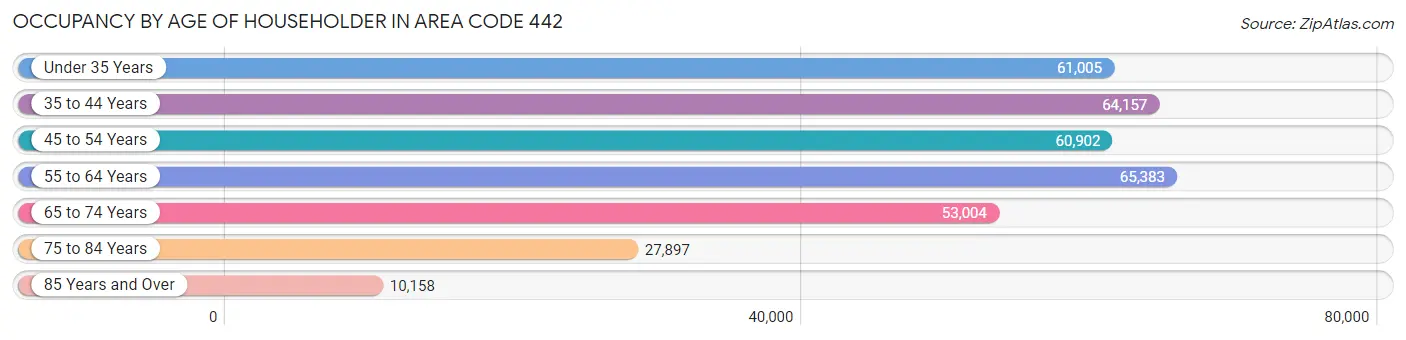
| Age Bracket | # Households | % Households |
| Under 35 Years | 61,005 | 17.8% |
| 35 to 44 Years | 64,157 | 18.7% |
| 45 to 54 Years | 60,902 | 17.8% |
| 55 to 64 Years | 65,383 | 19.1% |
| 65 to 74 Years | 53,004 | 15.5% |
| 75 to 84 Years | 27,897 | 8.1% |
| 85 Years and Over | 10,158 | 3.0% |
| Total | 342,506 | 100.0% |
Housing Finances in Area Code 442
Median Income by Occupancy in Area Code 442
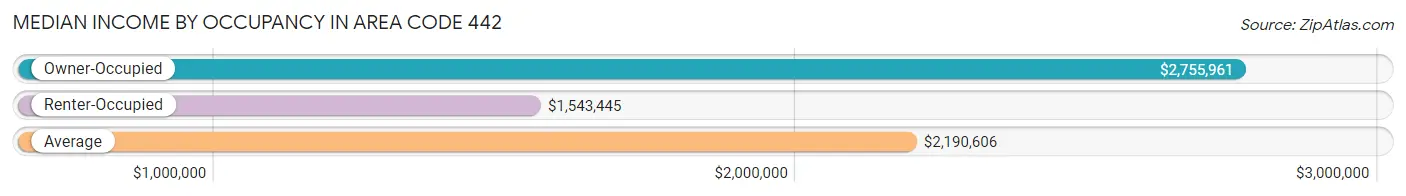
| Occupancy Type | # Households | Median Income |
| Owner-Occupied | 202,460 (59.1%) | $2,755,961 |
| Renter-Occupied | 140,046 (40.9%) | $1,543,445 |
| Average | 342,506 (100.0%) | $2,190,606 |
Occupancy by Householder Income Bracket in Area Code 442
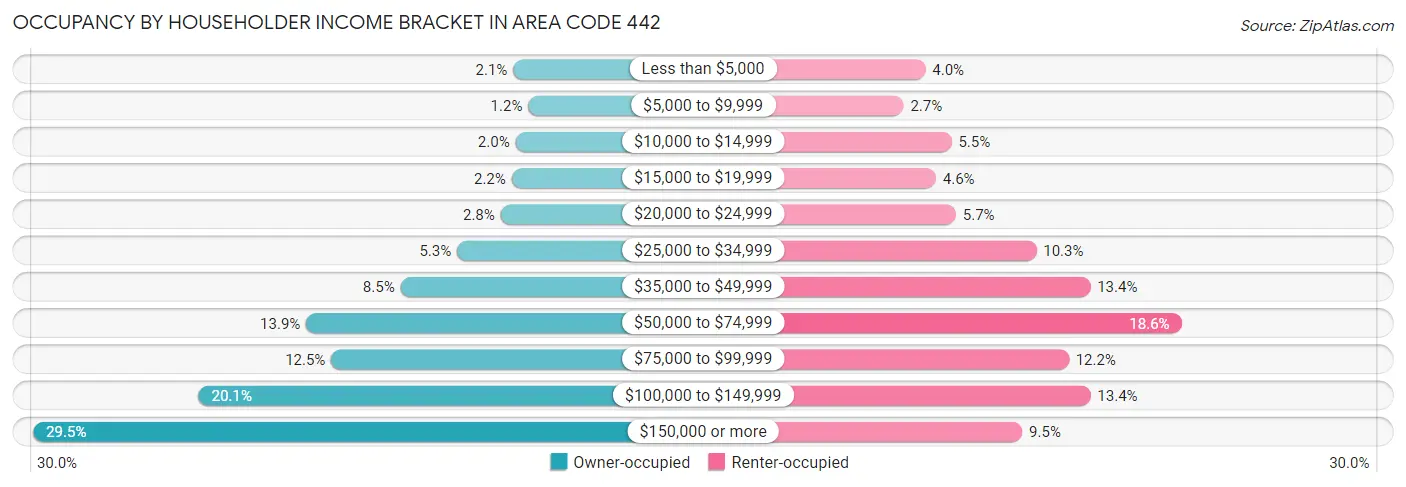
| Income Bracket | Owner-occupied | Renter-occupied |
| Less than $5,000 | 4,206 (2.1%) | 5,586 (4.0%) |
| $5,000 to $9,999 | 2,473 (1.2%) | 3,834 (2.7%) |
| $10,000 to $14,999 | 3,938 (1.9%) | 7,677 (5.5%) |
| $15,000 to $19,999 | 4,394 (2.2%) | 6,427 (4.6%) |
| $20,000 to $24,999 | 5,670 (2.8%) | 8,020 (5.7%) |
| $25,000 to $34,999 | 10,715 (5.3%) | 14,460 (10.3%) |
| $35,000 to $49,999 | 17,250 (8.5%) | 18,782 (13.4%) |
| $50,000 to $74,999 | 28,162 (13.9%) | 26,076 (18.6%) |
| $75,000 to $99,999 | 25,263 (12.5%) | 17,053 (12.2%) |
| $100,000 to $149,999 | 40,615 (20.1%) | 18,795 (13.4%) |
| $150,000 or more | 59,774 (29.5%) | 13,336 (9.5%) |
| Total | 202,460 (100.0%) | 140,046 (100.0%) |
Monthly Housing Cost Tiers in Area Code 442
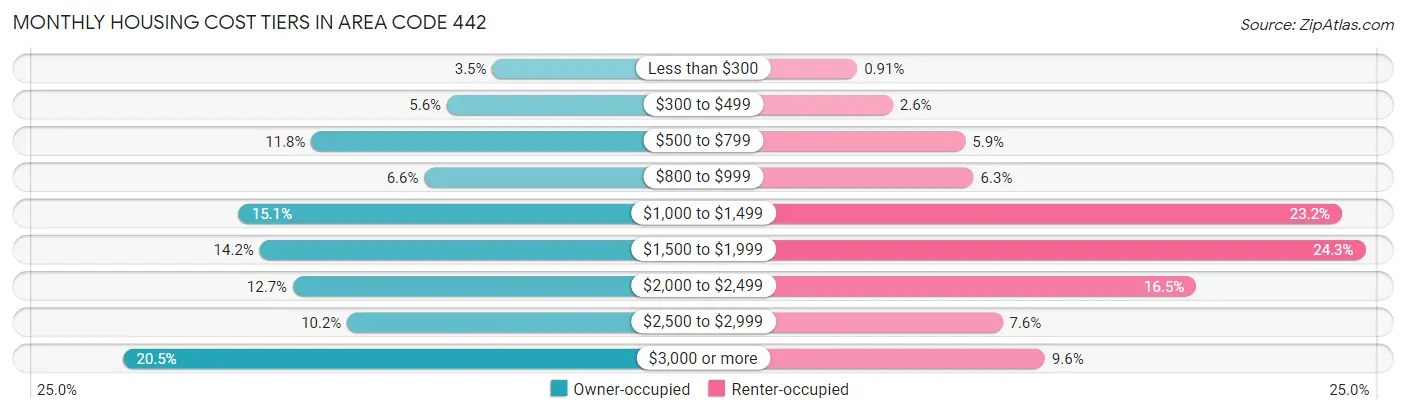
| Monthly Cost | Owner-occupied | Renter-occupied |
| Less than $300 | 7,021 (3.5%) | 1,275 (0.9%) |
| $300 to $499 | 11,249 (5.6%) | 3,575 (2.5%) |
| $500 to $799 | 23,896 (11.8%) | 8,253 (5.9%) |
| $800 to $999 | 13,361 (6.6%) | 8,784 (6.3%) |
| $1,000 to $1,499 | 30,658 (15.1%) | 32,519 (23.2%) |
| $1,500 to $1,999 | 28,715 (14.2%) | 34,029 (24.3%) |
| $2,000 to $2,499 | 25,608 (12.7%) | 23,120 (16.5%) |
| $2,500 to $2,999 | 20,550 (10.2%) | 10,650 (7.6%) |
| $3,000 or more | 41,402 (20.4%) | 13,374 (9.6%) |
| Total | 202,460 (100.0%) | 140,046 (100.0%) |
Physical Housing Characteristics in Area Code 442
Housing Structures in Area Code 442
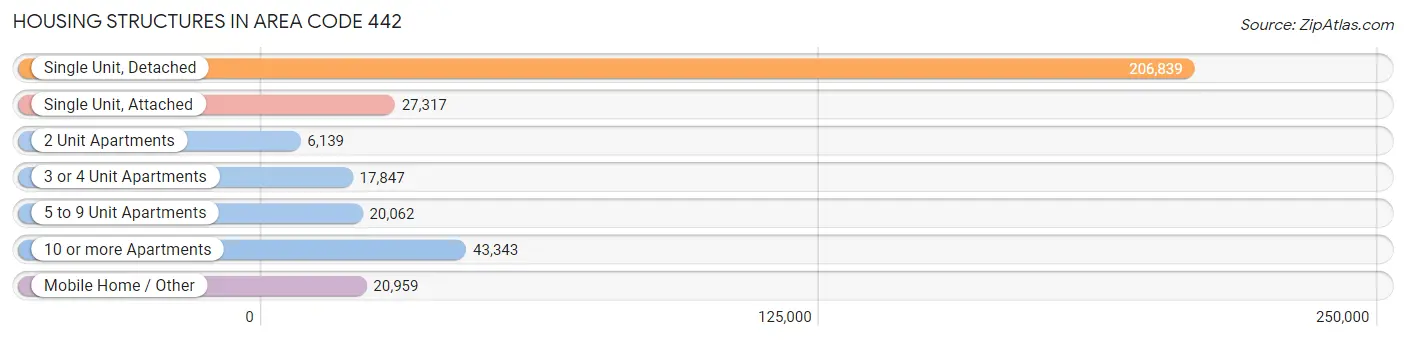
| Structure Type | # Housing Units | % Housing Units |
| Single Unit, Detached | 206,839 | 60.4% |
| Single Unit, Attached | 27,317 | 8.0% |
| 2 Unit Apartments | 6,139 | 1.8% |
| 3 or 4 Unit Apartments | 17,847 | 5.2% |
| 5 to 9 Unit Apartments | 20,062 | 5.9% |
| 10 or more Apartments | 43,343 | 12.7% |
| Mobile Home / Other | 20,959 | 6.1% |
| Total | 342,506 | 100.0% |
Housing Structures by Occupancy in Area Code 442
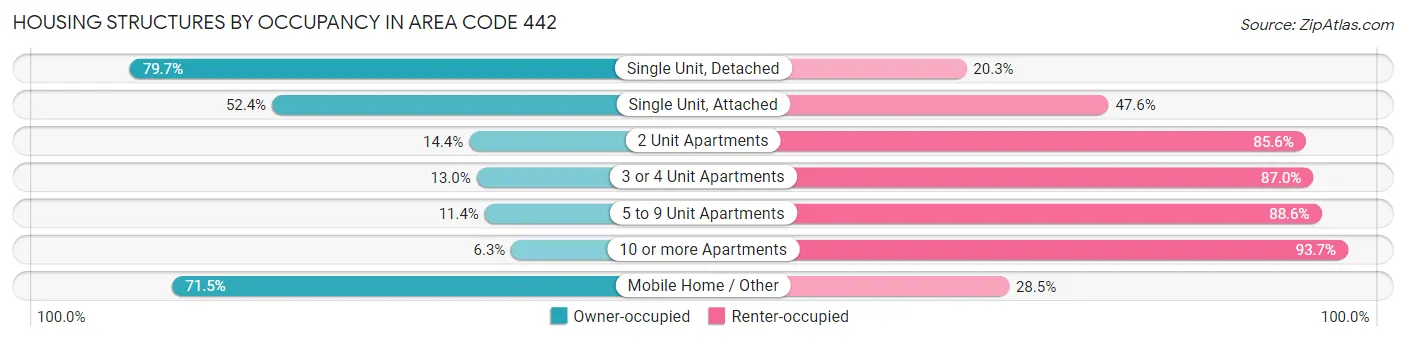
| Structure Type | Owner-occupied | Renter-occupied |
| Single Unit, Detached | 164,932 (79.7%) | 41,907 (20.3%) |
| Single Unit, Attached | 14,309 (52.4%) | 13,008 (47.6%) |
| 2 Unit Apartments | 886 (14.4%) | 5,253 (85.6%) |
| 3 or 4 Unit Apartments | 2,317 (13.0%) | 15,530 (87.0%) |
| 5 to 9 Unit Apartments | 2,289 (11.4%) | 17,773 (88.6%) |
| 10 or more Apartments | 2,733 (6.3%) | 40,610 (93.7%) |
| Mobile Home / Other | 14,994 (71.5%) | 5,965 (28.5%) |
| Total | 202,460 (59.1%) | 140,046 (40.9%) |
Housing Structures by Number of Rooms in Area Code 442
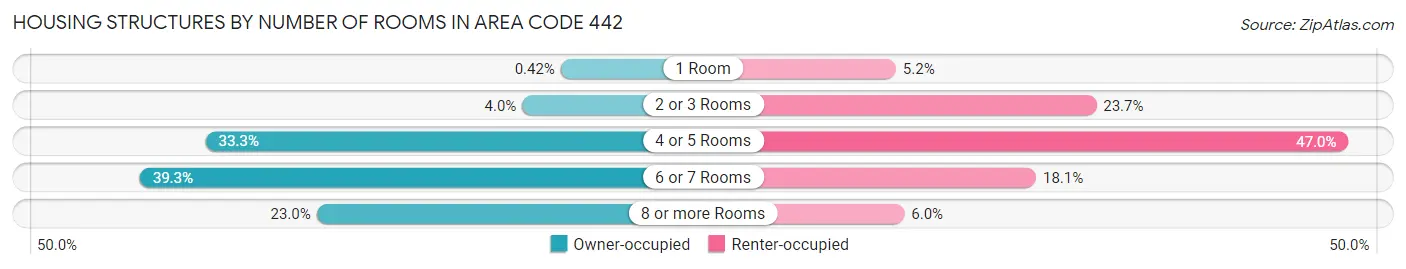
| Number of Rooms | Owner-occupied | Renter-occupied |
| 1 Room | 858 (0.4%) | 7,250 (5.2%) |
| 2 or 3 Rooms | 8,053 (4.0%) | 33,199 (23.7%) |
| 4 or 5 Rooms | 67,336 (33.3%) | 65,853 (47.0%) |
| 6 or 7 Rooms | 79,655 (39.3%) | 25,400 (18.1%) |
| 8 or more Rooms | 46,558 (23.0%) | 8,344 (6.0%) |
| Total | 202,460 (100.0%) | 140,046 (100.0%) |
Housing Structure by Heating Type in Area Code 442
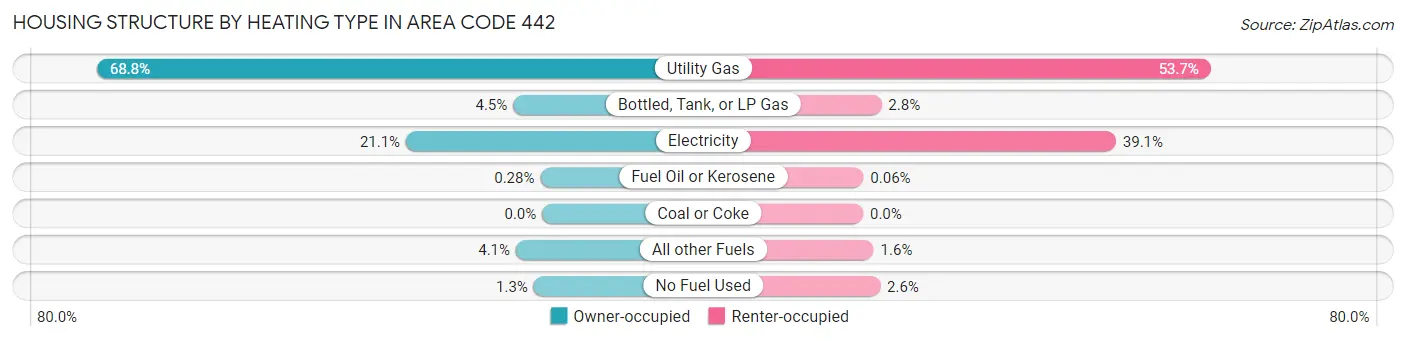
| Heating Type | Owner-occupied | Renter-occupied |
| Utility Gas | 139,356 (68.8%) | 75,265 (53.7%) |
| Bottled, Tank, or LP Gas | 9,067 (4.5%) | 3,980 (2.8%) |
| Electricity | 42,619 (21.0%) | 54,724 (39.1%) |
| Fuel Oil or Kerosene | 558 (0.3%) | 91 (0.1%) |
| Coal or Coke | 10 (0.0%) | 4 (0.0%) |
| All other Fuels | 8,220 (4.1%) | 2,292 (1.6%) |
| No Fuel Used | 2,630 (1.3%) | 3,690 (2.6%) |
| Total | 202,460 (100.0%) | 140,046 (100.0%) |
Household Vehicle Usage in Area Code 442
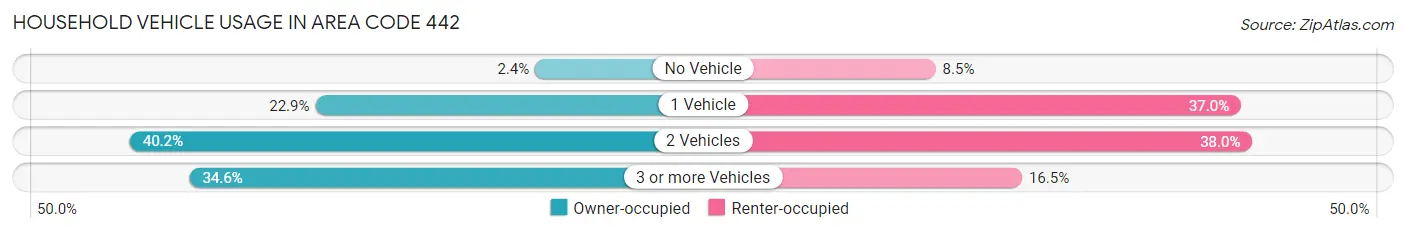
| Vehicles per Household | Owner-occupied | Renter-occupied |
| No Vehicle | 4,751 (2.4%) | 11,864 (8.5%) |
| 1 Vehicle | 46,282 (22.9%) | 51,782 (37.0%) |
| 2 Vehicles | 81,358 (40.2%) | 53,247 (38.0%) |
| 3 or more Vehicles | 70,069 (34.6%) | 23,153 (16.5%) |
| Total | 202,460 (100.0%) | 140,046 (100.0%) |
Real Estate & Mortgages in Area Code 442
Real Estate and Mortgage Overview in Area Code 442
| Characteristic | Without Mortgage | With Mortgage |
| Housing Units | 66,004 | 136,456 |
| Median Property Value | $12,773,800 | $15,306,200 |
| Median Household Income | $1,873,173 | $47,802 |
| Monthly Housing Costs | $19,195 | $41,116 |
| Real Estate Taxes | $83,708 | $2,685 |
Property Value by Mortgage Status in Area Code 442
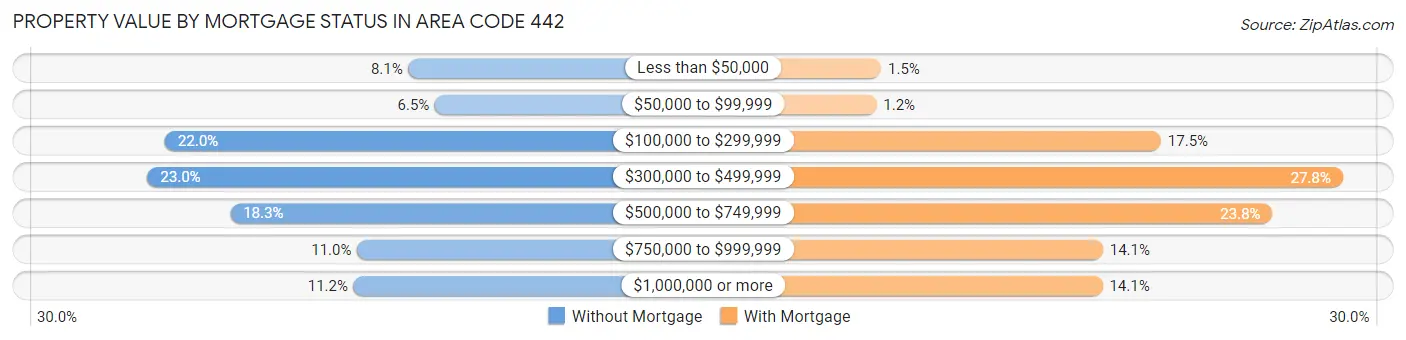
| Property Value | Without Mortgage | With Mortgage |
| Less than $50,000 | 5,321 (8.1%) | 1,986 (1.5%) |
| $50,000 to $99,999 | 4,319 (6.5%) | 1,620 (1.2%) |
| $100,000 to $299,999 | 14,508 (22.0%) | 23,810 (17.4%) |
| $300,000 to $499,999 | 15,165 (23.0%) | 37,994 (27.8%) |
| $500,000 to $749,999 | 12,049 (18.2%) | 32,503 (23.8%) |
| $750,000 to $999,999 | 7,256 (11.0%) | 19,283 (14.1%) |
| $1,000,000 or more | 7,386 (11.2%) | 19,260 (14.1%) |
| Total | 66,004 (100.0%) | 136,456 (100.0%) |
Household Income by Mortgage Status in Area Code 442
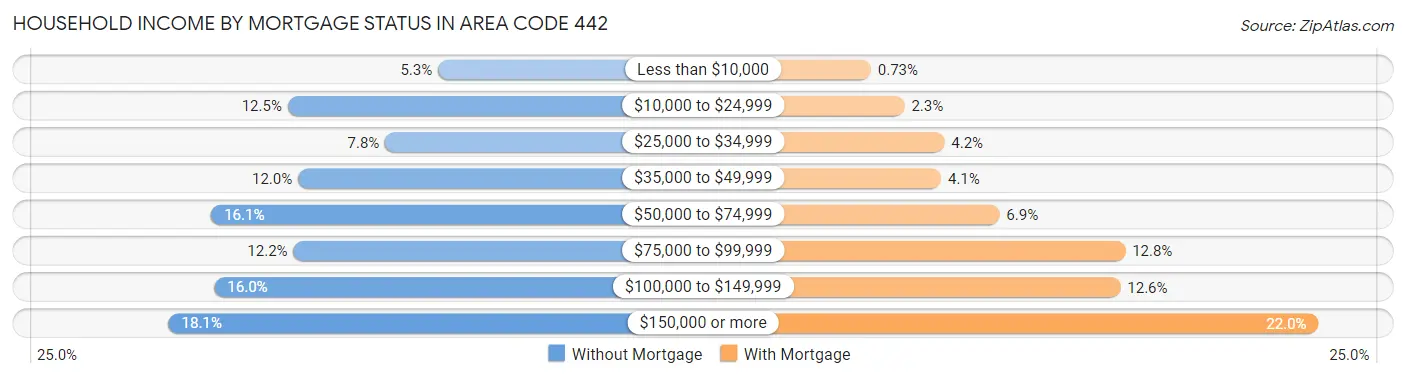
| Household Income | Without Mortgage | With Mortgage |
| Less than $10,000 | 3,502 (5.3%) | 995 (0.7%) |
| $10,000 to $24,999 | 8,232 (12.5%) | 3,177 (2.3%) |
| $25,000 to $34,999 | 5,166 (7.8%) | 5,770 (4.2%) |
| $35,000 to $49,999 | 7,907 (12.0%) | 5,549 (4.1%) |
| $50,000 to $74,999 | 10,636 (16.1%) | 9,343 (6.9%) |
| $75,000 to $99,999 | 8,053 (12.2%) | 17,526 (12.8%) |
| $100,000 to $149,999 | 10,536 (16.0%) | 17,210 (12.6%) |
| $150,000 or more | 11,972 (18.1%) | 30,079 (22.0%) |
| Total | 66,004 (100.0%) | 136,456 (100.0%) |
Property Value to Household Income Ratio in Area Code 442
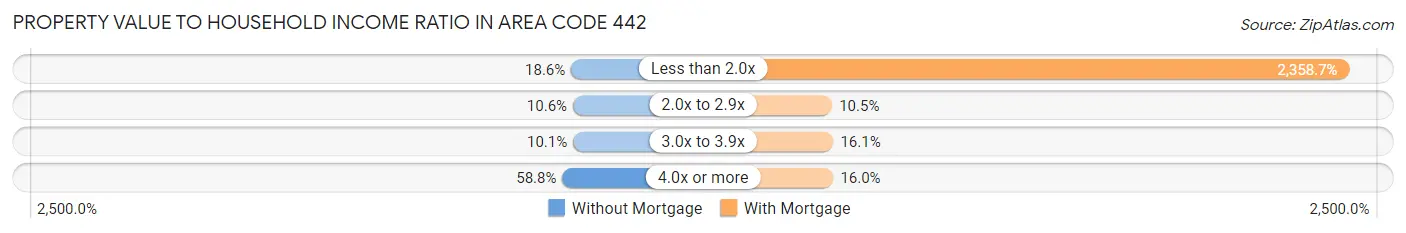
| Value-to-Income Ratio | Without Mortgage | With Mortgage |
| Less than 2.0x | 12,280 (18.6%) | 3,218,587 (2,358.7%) |
| 2.0x to 2.9x | 6,967 (10.6%) | 14,368 (10.5%) |
| 3.0x to 3.9x | 6,631 (10.1%) | 22,025 (16.1%) |
| 4.0x or more | 38,781 (58.8%) | 21,872 (16.0%) |
| Total | 66,004 (100.0%) | 136,456 (100.0%) |
Real Estate Taxes by Mortgage Status in Area Code 442
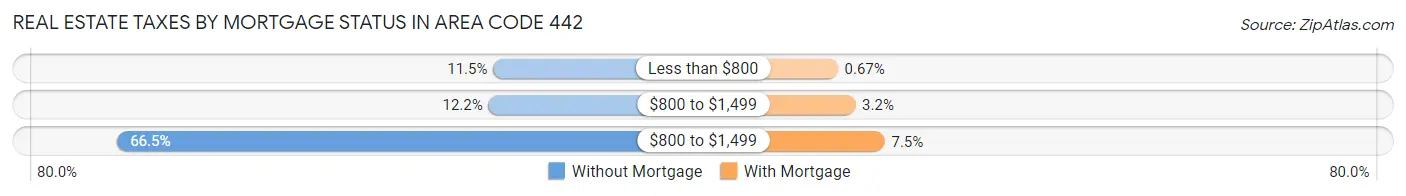
| Property Taxes | Without Mortgage | With Mortgage |
| Less than $800 | 7,594 (11.5%) | 912 (0.7%) |
| $800 to $1,499 | 8,062 (12.2%) | 4,404 (3.2%) |
| $800 to $1,499 | 43,865 (66.5%) | 10,257 (7.5%) |
| Total | 66,004 (100.0%) | 136,456 (100.0%) |
Health & Disability in Area Code 442
Health Insurance Coverage by Age in Area Code 442
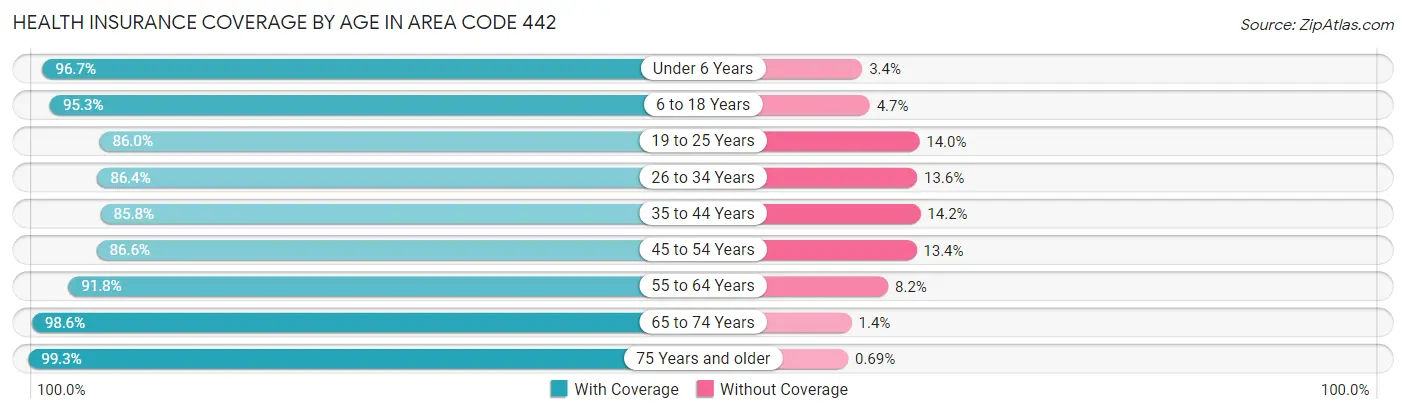
| Age Bracket | With Coverage | Without Coverage |
| Under 6 Years | 77,377 (96.7%) | 2,679 (3.4%) |
| 6 to 18 Years | 180,377 (95.3%) | 8,968 (4.7%) |
| 19 to 25 Years | 77,537 (86.0%) | 12,602 (14.0%) |
| 26 to 34 Years | 108,469 (86.4%) | 17,012 (13.6%) |
| 35 to 44 Years | 112,096 (85.8%) | 18,539 (14.2%) |
| 45 to 54 Years | 103,212 (86.6%) | 16,025 (13.4%) |
| 55 to 64 Years | 111,743 (91.8%) | 9,942 (8.2%) |
| 65 to 74 Years | 88,575 (98.6%) | 1,225 (1.4%) |
| 75 Years and older | 63,683 (99.3%) | 442 (0.7%) |
| Total | 923,069 (91.3%) | 87,434 (8.6%) |
Health Insurance Coverage by Citizenship Status in Area Code 442
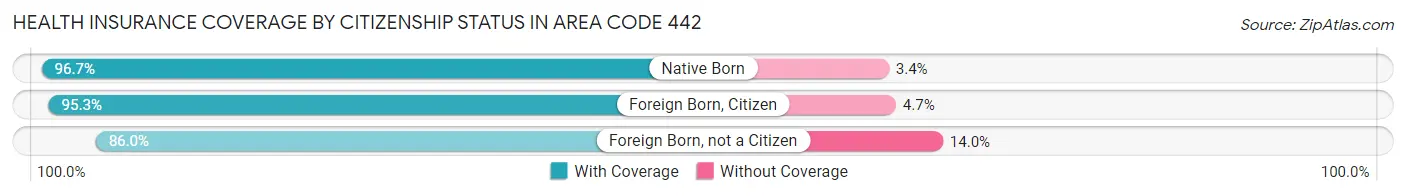
| Citizenship Status | With Coverage | Without Coverage |
| Native Born | 77,377 (96.7%) | 2,679 (3.4%) |
| Foreign Born, Citizen | 180,377 (95.3%) | 8,968 (4.7%) |
| Foreign Born, not a Citizen | 77,537 (86.0%) | 12,602 (14.0%) |
Health Insurance Coverage by Household Income in Area Code 442
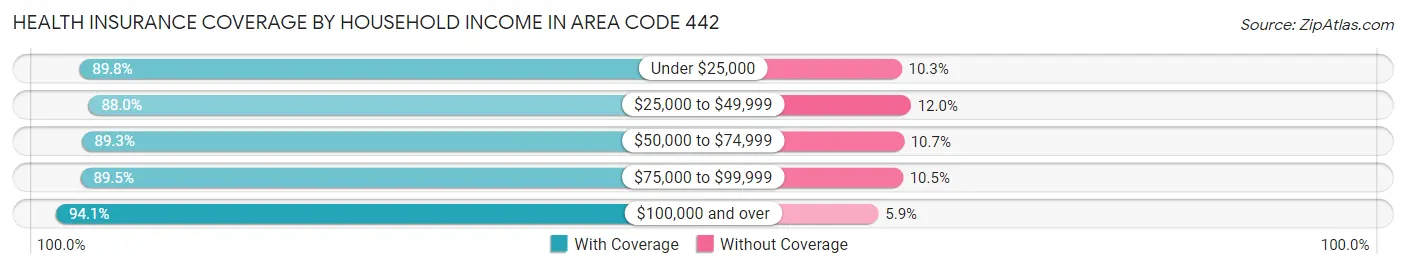
| Household Income | With Coverage | Without Coverage |
| Under $25,000 | 94,026 (89.7%) | 10,735 (10.2%) |
| $25,000 to $49,999 | 142,880 (88.0%) | 19,446 (12.0%) |
| $50,000 to $74,999 | 138,304 (89.3%) | 16,519 (10.7%) |
| $75,000 to $99,999 | 116,993 (89.5%) | 13,697 (10.5%) |
| $100,000 and over | 424,846 (94.1%) | 26,674 (5.9%) |
Public vs Private Health Insurance Coverage by Age in Area Code 442
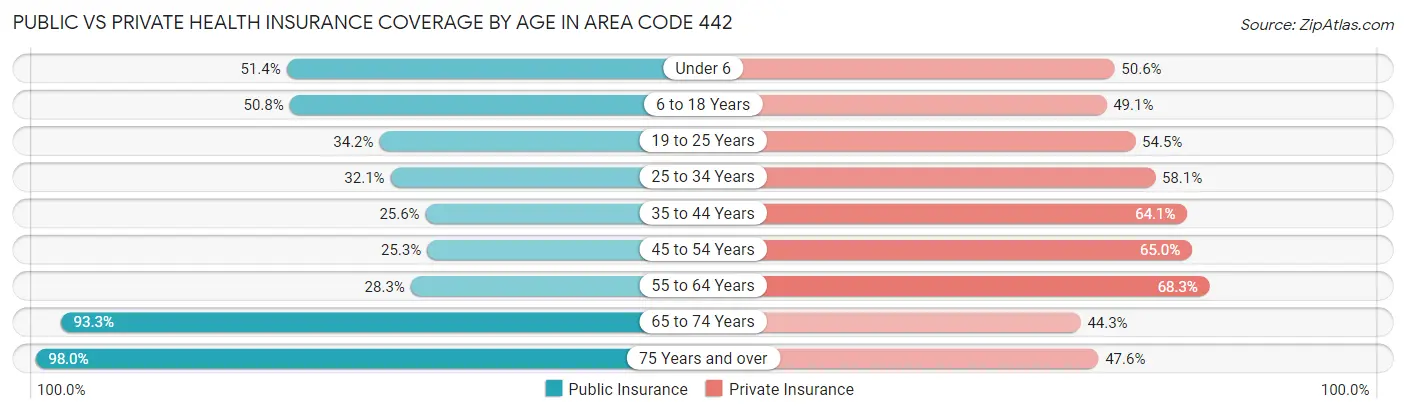
| Age Bracket | Public Insurance | Private Insurance |
| Under 6 | 41,141 (51.4%) | 40,506 (50.6%) |
| 6 to 18 Years | 96,253 (50.8%) | 92,925 (49.1%) |
| 19 to 25 Years | 30,786 (34.2%) | 49,085 (54.4%) |
| 25 to 34 Years | 40,280 (32.1%) | 72,948 (58.1%) |
| 35 to 44 Years | 33,440 (25.6%) | 83,771 (64.1%) |
| 45 to 54 Years | 30,161 (25.3%) | 77,517 (65.0%) |
| 55 to 64 Years | 34,484 (28.3%) | 83,087 (68.3%) |
| 65 to 74 Years | 83,786 (93.3%) | 39,780 (44.3%) |
| 75 Years and over | 62,847 (98.0%) | 30,525 (47.6%) |
| Total | 453,178 (44.9%) | 570,144 (56.4%) |
Disability Status by Sex by Age in Area Code 442
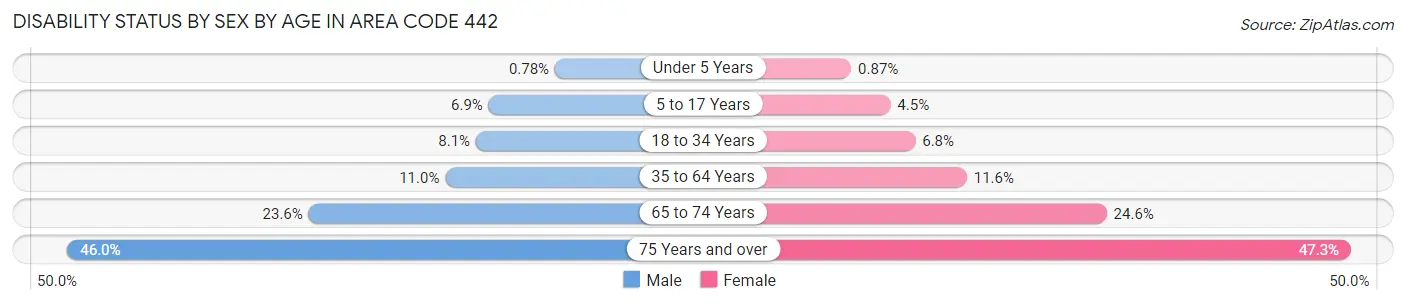
| Age Bracket | Male | Female |
| Under 5 Years | 263 (0.8%) | 283 (0.9%) |
| 5 to 17 Years | 6,711 (6.9%) | 4,173 (4.5%) |
| 18 to 34 Years | 9,308 (8.1%) | 7,823 (6.8%) |
| 35 to 64 Years | 20,543 (11.0%) | 21,352 (11.6%) |
| 65 to 74 Years | 10,513 (23.6%) | 11,143 (24.6%) |
| 75 Years and over | 12,917 (46.0%) | 17,039 (47.2%) |
Disability Class by Sex by Age in Area Code 442
Disability Class: Hearing Difficulty
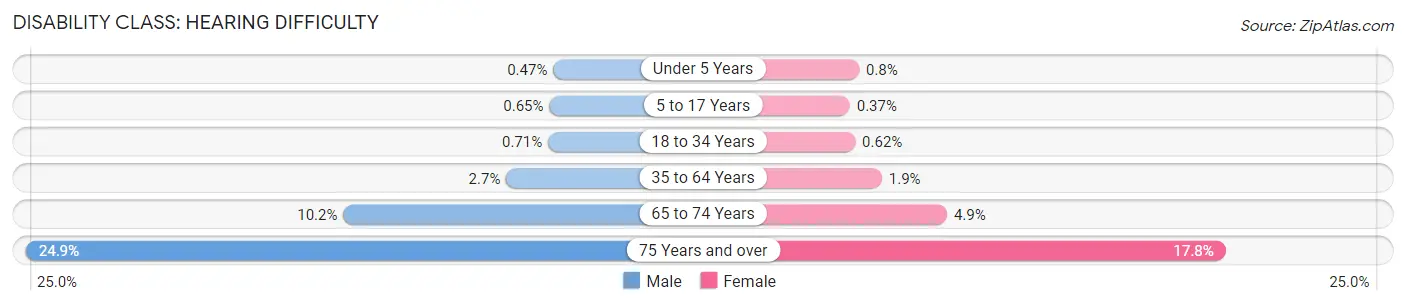
| Age Bracket | Male | Female |
| Under 5 Years | 159 (0.5%) | 258 (0.8%) |
| 5 to 17 Years | 628 (0.6%) | 346 (0.4%) |
| 18 to 34 Years | 814 (0.7%) | 715 (0.6%) |
| 35 to 64 Years | 4,963 (2.6%) | 3,426 (1.9%) |
| 65 to 74 Years | 4,538 (10.2%) | 2,211 (4.9%) |
| 75 Years and over | 6,998 (24.9%) | 6,424 (17.8%) |
Disability Class: Vision Difficulty
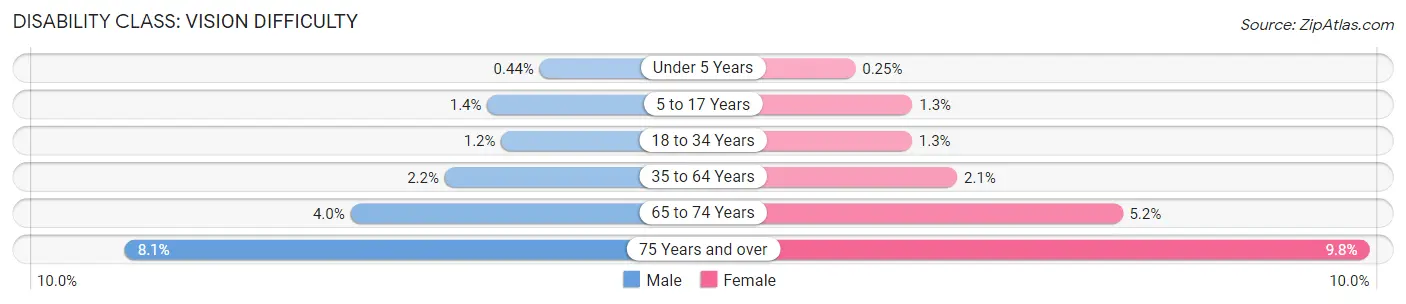
| Age Bracket | Male | Female |
| Under 5 Years | 150 (0.4%) | 80 (0.3%) |
| 5 to 17 Years | 1,360 (1.4%) | 1,214 (1.3%) |
| 18 to 34 Years | 1,324 (1.1%) | 1,487 (1.3%) |
| 35 to 64 Years | 4,130 (2.2%) | 3,947 (2.1%) |
| 65 to 74 Years | 1,756 (4.0%) | 2,362 (5.2%) |
| 75 Years and over | 2,284 (8.1%) | 3,530 (9.8%) |
Disability Class: Cognitive Difficulty
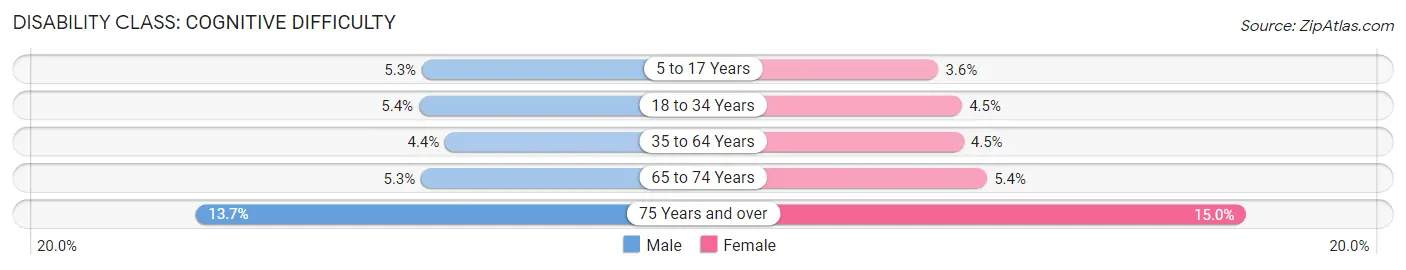
| Age Bracket | Male | Female |
| 5 to 17 Years | 5,078 (5.2%) | 3,320 (3.6%) |
| 18 to 34 Years | 6,152 (5.4%) | 5,119 (4.5%) |
| 35 to 64 Years | 8,236 (4.4%) | 8,336 (4.5%) |
| 65 to 74 Years | 2,346 (5.3%) | 2,450 (5.4%) |
| 75 Years and over | 3,832 (13.7%) | 5,413 (15.0%) |
Disability Class: Ambulatory Difficulty
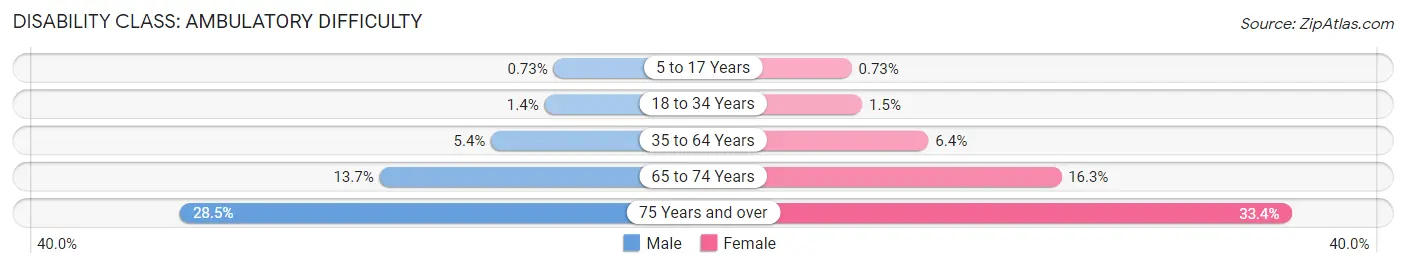
| Age Bracket | Male | Female |
| 5 to 17 Years | 710 (0.7%) | 677 (0.7%) |
| 18 to 34 Years | 1,605 (1.4%) | 1,730 (1.5%) |
| 35 to 64 Years | 10,041 (5.4%) | 11,846 (6.4%) |
| 65 to 74 Years | 6,071 (13.7%) | 7,385 (16.3%) |
| 75 Years and over | 7,986 (28.5%) | 12,034 (33.4%) |
Disability Class: Self-Care Difficulty
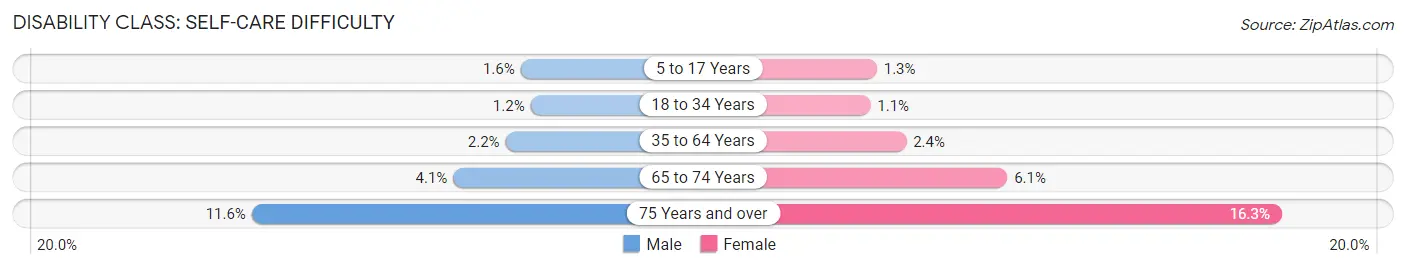
| Age Bracket | Male | Female |
| 5 to 17 Years | 1,541 (1.6%) | 1,204 (1.3%) |
| 18 to 34 Years | 1,398 (1.2%) | 1,217 (1.1%) |
| 35 to 64 Years | 4,021 (2.1%) | 4,406 (2.4%) |
| 65 to 74 Years | 1,818 (4.1%) | 2,786 (6.1%) |
| 75 Years and over | 3,247 (11.6%) | 5,888 (16.3%) |
Technology Access in Area Code 442
Computing Device Access in Area Code 442
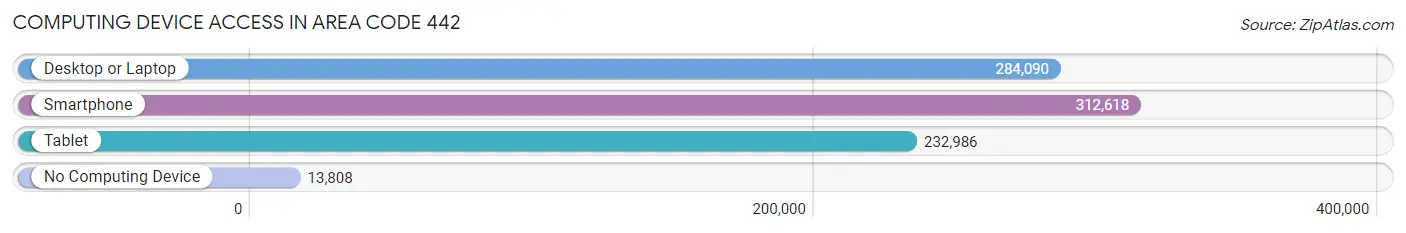
| Device Type | # Households | % Households |
| Desktop or Laptop | 284,090 | 82.9% |
| Smartphone | 312,618 | 91.3% |
| Tablet | 232,986 | 68.0% |
| No Computing Device | 13,808 | 4.0% |
| Total | 342,506 | 100.0% |
Internet Access in Area Code 442
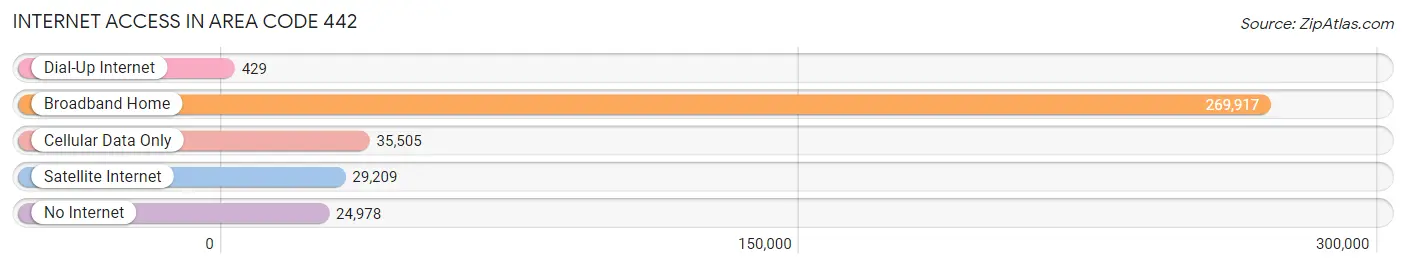
| Internet Type | # Households | % Households |
| Dial-Up Internet | 429 | 0.1% |
| Broadband Home | 269,917 | 78.8% |
| Cellular Data Only | 35,505 | 10.4% |
| Satellite Internet | 29,209 | 8.5% |
| No Internet | 24,978 | 7.3% |
| Total | 342,506 | 100.0% |
Area Code 442 Summary
Geography
Area code 442 is located in the state of California. It covers the Imperial County, which is located in the southeastern corner of the state. It is bordered by Arizona to the east, Mexico to the south, and the Pacific Ocean to the west.
Social
Area code 442 is home to a diverse population of people. The area is known for its rich cultural heritage, with many people of Mexican, Native American, and Spanish descent. The area is also home to a large number of military personnel, due to its proximity to the US-Mexico border.
Economics
Area code 442 is an economically diverse area. The area is home to a number of agricultural and manufacturing businesses, as well as a growing tourism industry. The area is also home to a number of military bases, which provide jobs and economic stability to the region.
Demographics
Area code 442 is home to a population of over 200,000 people. The majority of the population is Hispanic, with a large percentage of Native Americans and other minority groups. The median household income is slightly below the national average, and the unemployment rate is higher than the national average.
Common Questions
What is Per Capita Income in Area Code 442?
Per Capita income in Area Code 442 is $38,080.
What is the Median Family Income in Area Code 442?
Median Family Income in Area Code 442 is $90,663.
What is the Median Household income in Area Code 442?
Median Household Income in Area Code 442 is $81,134.
What is Income or Wage Gap in Area Code 442?
Income or Wage Gap in Area Code 442 is 31.4%.
Women in Area Code 442 earn 68.6 cents for every dollar earned by a man.
What is Family Income Deficit in Area Code 442?
Family Income Deficit in Area Code 442 is $11,038.
Families that are below poverty line in Area Code 442 earn $11,038 less on average than the poverty threshold level.
What is Inequality or Gini Index in Area Code 442?
Inequality or Gini Index in Area Code 442 is 13.06.
What is the Total Population of Area Code 442?
Total Population of Area Code 442 is 1,036,506.
What is the Total Male Population of Area Code 442?
Total Male Population of Area Code 442 is 527,401.
What is the Total Female Population of Area Code 442?
Total Female Population of Area Code 442 is 509,105.
What is the Ratio of Males per 100 Females in Area Code 442?
There are 103.59 Males per 100 Females in Area Code 442.
What is the Ratio of Females per 100 Males in Area Code 442?
There are 96.53 Females per 100 Males in Area Code 442.
What is the Median Population Age in Area Code 442?
Median Population Age in Area Code 442 is 38.8 Years.
What is the Average Family Size in Area Code 442
Average Family Size in Area Code 442 is 3.4 People.
What is the Average Household Size in Area Code 442
Average Household Size in Area Code 442 is 2.9 People.
How Large is the Labor Force in Area Code 442?
There are 479,242 People in the Labor Forcein in Area Code 442.
What is the Percentage of People in the Labor Force in Area Code 442?
59.3% of People are in the Labor Force in Area Code 442.
What is the Unemployment Rate in Area Code 442?
Unemployment Rate in Area Code 442 is 10.3%.