Ventura County, CA Map & Demographics
Ventura County Map
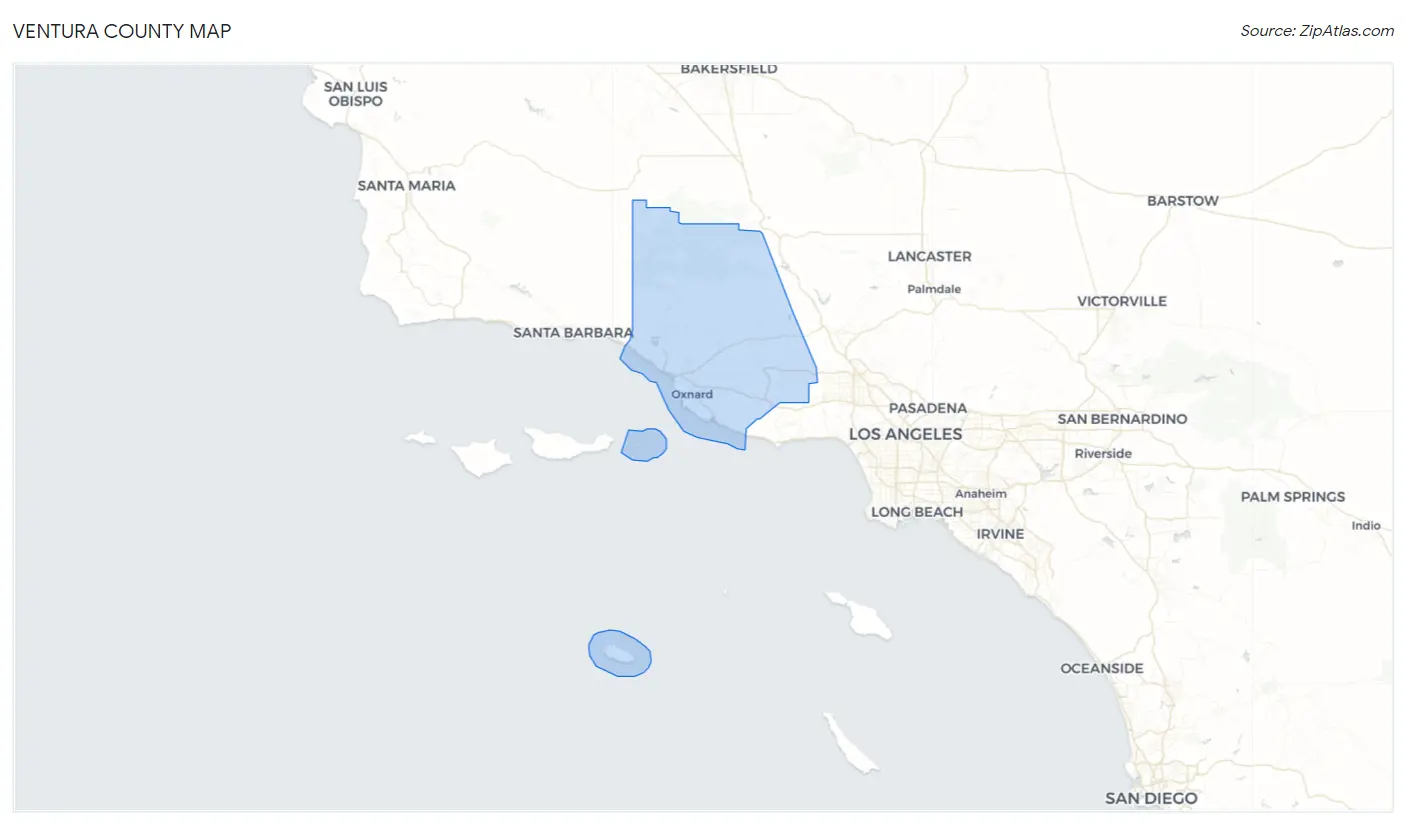
Ventura County Overview
$45,846
PER CAPITA INCOME
$116,726
AVG FAMILY INCOME
$102,141
AVG HOUSEHOLD INCOME
28.1%
WAGE / INCOME GAP [ % ]
71.9¢/ $1
WAGE / INCOME GAP [ $ ]
$11,580
FAMILY INCOME DEFICIT
0.45
INEQUALITY / GINI INDEX
842,009
TOTAL POPULATION
419,805
MALE POPULATION
422,204
FEMALE POPULATION
99.43
MALES / 100 FEMALES
100.57
FEMALES / 100 MALES
39.0
MEDIAN AGE
3.5
AVG FAMILY SIZE
3.0
AVG HOUSEHOLD SIZE
436,660
LABOR FORCE [ PEOPLE ]
64.5%
PERCENT IN LABOR FORCE
5.3%
UNEMPLOYMENT RATE
Income in Ventura County
Income Overview in Ventura County
Per Capita Income in Ventura County is $45,846, while median incomes of families and households are $116,726 and $102,141 respectively.
| Characteristic | Number | Measure |
| Per Capita Income | 842,009 | $45,846 |
| Median Family Income | 198,049 | $116,726 |
| Mean Family Income | 198,049 | $150,878 |
| Median Household Income | 275,653 | $102,141 |
| Mean Household Income | 275,653 | $135,094 |
| Income Deficit | 198,049 | $11,580 |
| Wage / Income Gap (%) | 842,009 | 28.09% |
| Wage / Income Gap ($) | 842,009 | 71.91¢ per $1 |
| Gini / Inequality Index | 842,009 | 0.45 |
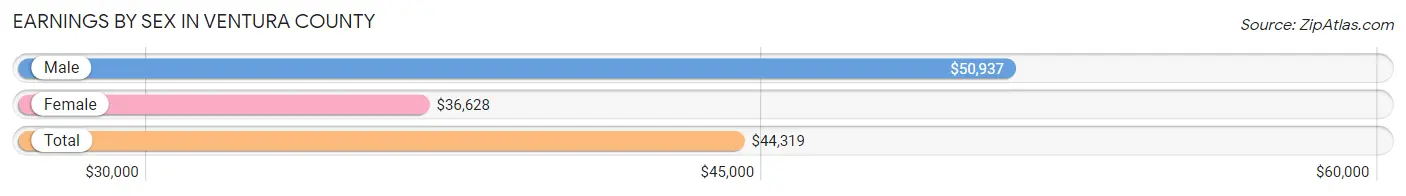
Earnings by Sex in Ventura County
Average Earnings in Ventura County are $44,319, $50,937 for men and $36,628 for women, a difference of 28.1%.
| Sex | Number | Average Earnings |
| Male | 244,159 (54.5%) | $50,937 |
| Female | 203,993 (45.5%) | $36,628 |
| Total | 448,152 (100.0%) | $44,319 |
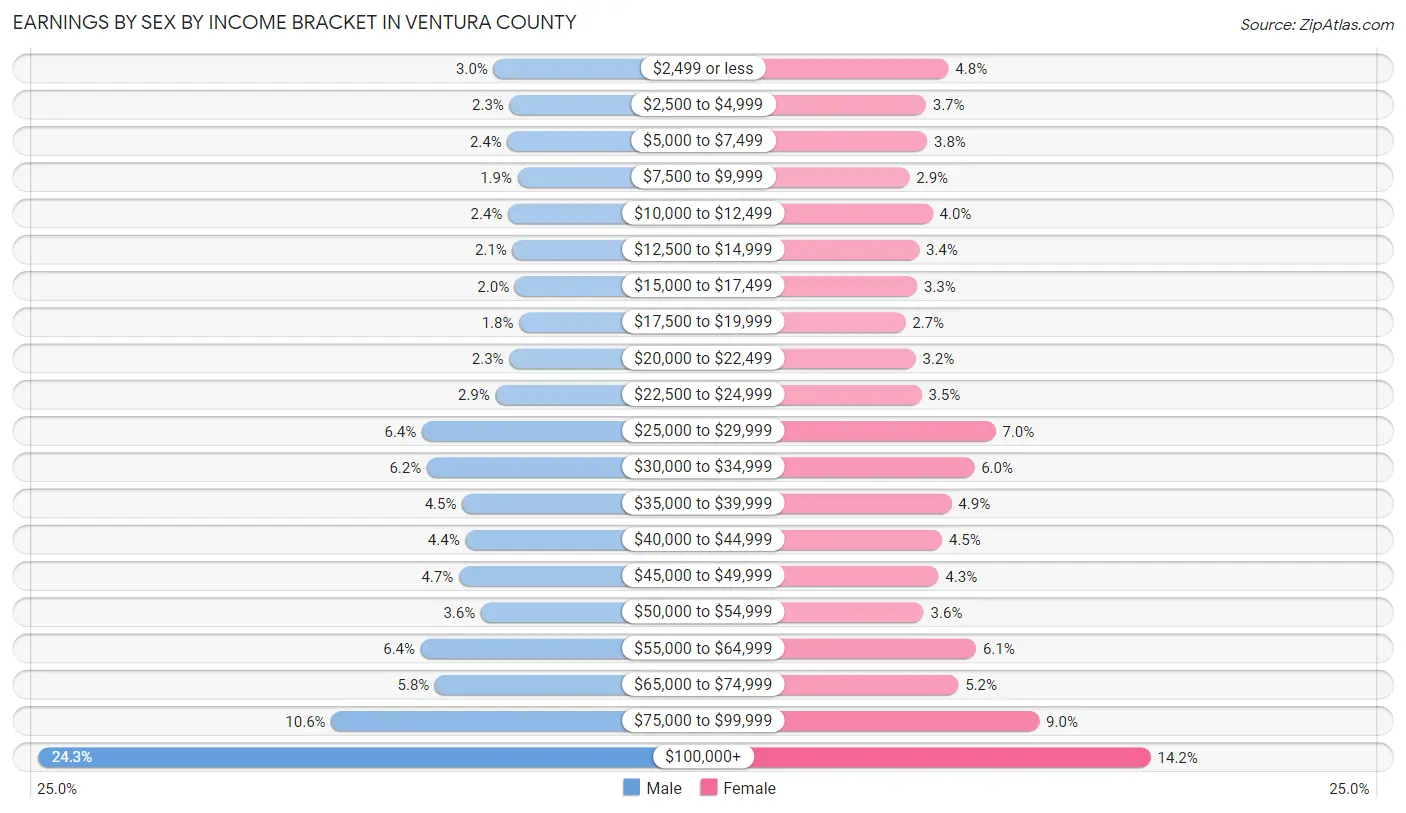
Earnings by Sex by Income Bracket in Ventura County
The most common earnings brackets in Ventura County are $100,000+ for men (59,406 | 24.3%) and $100,000+ for women (29,035 | 14.2%).
| Income | Male | Female |
| $2,499 or less | 7,396 (3.0%) | 9,716 (4.8%) |
| $2,500 to $4,999 | 5,561 (2.3%) | 7,539 (3.7%) |
| $5,000 to $7,499 | 5,799 (2.4%) | 7,671 (3.8%) |
| $7,500 to $9,999 | 4,646 (1.9%) | 5,987 (2.9%) |
| $10,000 to $12,499 | 5,748 (2.4%) | 8,194 (4.0%) |
| $12,500 to $14,999 | 5,235 (2.1%) | 6,895 (3.4%) |
| $15,000 to $17,499 | 4,950 (2.0%) | 6,718 (3.3%) |
| $17,500 to $19,999 | 4,471 (1.8%) | 5,586 (2.7%) |
| $20,000 to $22,499 | 5,590 (2.3%) | 6,574 (3.2%) |
| $22,500 to $24,999 | 7,178 (2.9%) | 7,133 (3.5%) |
| $25,000 to $29,999 | 15,585 (6.4%) | 14,192 (7.0%) |
| $30,000 to $34,999 | 15,027 (6.1%) | 12,188 (6.0%) |
| $35,000 to $39,999 | 10,986 (4.5%) | 9,990 (4.9%) |
| $40,000 to $44,999 | 10,631 (4.3%) | 9,090 (4.5%) |
| $45,000 to $49,999 | 11,346 (4.6%) | 8,754 (4.3%) |
| $50,000 to $54,999 | 8,838 (3.6%) | 7,345 (3.6%) |
| $55,000 to $64,999 | 15,724 (6.4%) | 12,349 (6.0%) |
| $65,000 to $74,999 | 14,091 (5.8%) | 10,657 (5.2%) |
| $75,000 to $99,999 | 25,951 (10.6%) | 18,380 (9.0%) |
| $100,000+ | 59,406 (24.3%) | 29,035 (14.2%) |
| Total | 244,159 (100.0%) | 203,993 (100.0%) |
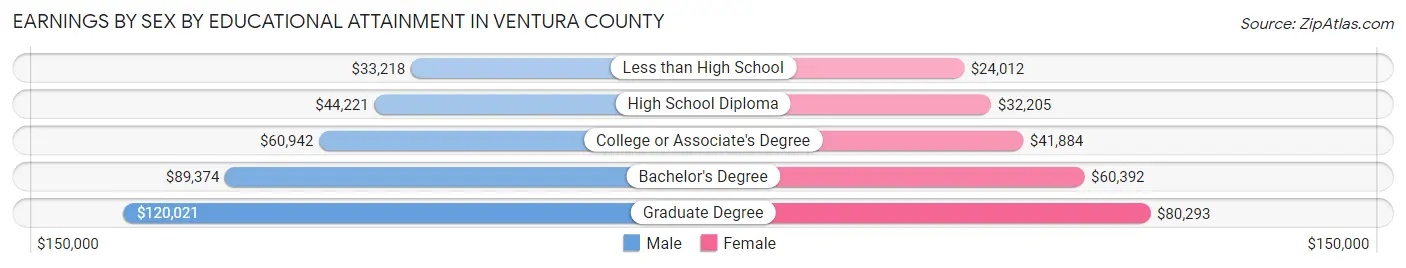
Earnings by Sex by Educational Attainment in Ventura County
Average earnings in Ventura County are $59,220 for men and $43,441 for women, a difference of 26.6%. Men with an educational attainment of graduate degree enjoy the highest average annual earnings of $120,021, while those with less than high school education earn the least with $33,218. Women with an educational attainment of graduate degree earn the most with the average annual earnings of $80,293, while those with less than high school education have the smallest earnings of $24,012.
| Educational Attainment | Male Income | Female Income |
| Less than High School | $33,218 | $24,012 |
| High School Diploma | $44,221 | $32,205 |
| College or Associate's Degree | $60,942 | $41,884 |
| Bachelor's Degree | $89,374 | $60,392 |
| Graduate Degree | $120,021 | $80,293 |
| Total | $59,220 | $43,441 |
Family Income in Ventura County
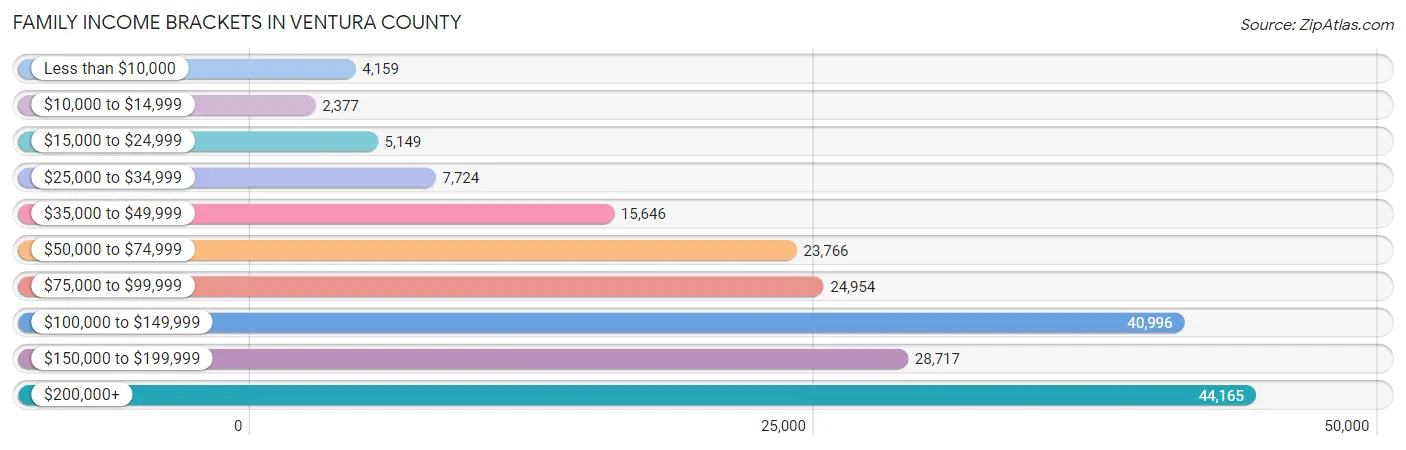
Family Income Brackets in Ventura County
According to the Ventura County family income data, there are 44,165 families falling into the $200,000+ income range, which is the most common income bracket and makes up 22.3% of all families. Conversely, the $10,000 to $14,999 income bracket is the least frequent group with only 2,377 families (1.2%) belonging to this category.
| Income Bracket | # Families | % Families |
| Less than $10,000 | 4,159 | 2.1% |
| $10,000 to $14,999 | 2,377 | 1.2% |
| $15,000 to $24,999 | 5,149 | 2.6% |
| $25,000 to $34,999 | 7,724 | 3.9% |
| $35,000 to $49,999 | 15,646 | 7.9% |
| $50,000 to $74,999 | 23,766 | 12.0% |
| $75,000 to $99,999 | 24,954 | 12.6% |
| $100,000 to $149,999 | 40,996 | 20.7% |
| $150,000 to $199,999 | 28,717 | 14.5% |
| $200,000+ | 44,165 | 22.3% |
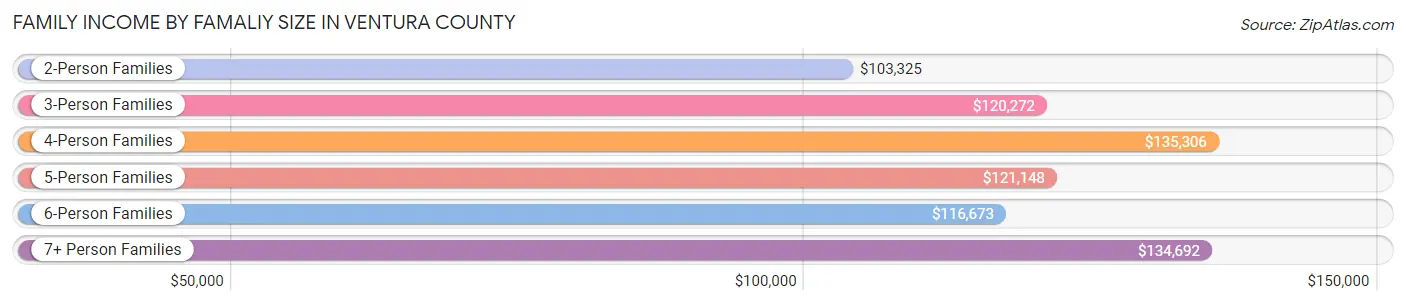
Family Income by Famaliy Size in Ventura County
4-person families (41,222 | 20.8%) account for the highest median family income in Ventura County with $135,306 per family, while 2-person families (79,729 | 40.3%) have the highest median income of $51,662 per family member.
| Income Bracket | # Families | Median Income |
| 2-Person Families | 79,729 (40.3%) | $103,325 |
| 3-Person Families | 44,091 (22.3%) | $120,272 |
| 4-Person Families | 41,222 (20.8%) | $135,306 |
| 5-Person Families | 19,627 (9.9%) | $121,148 |
| 6-Person Families | 7,512 (3.8%) | $116,673 |
| 7+ Person Families | 5,868 (3.0%) | $134,692 |
| Total | 198,049 (100.0%) | $116,726 |
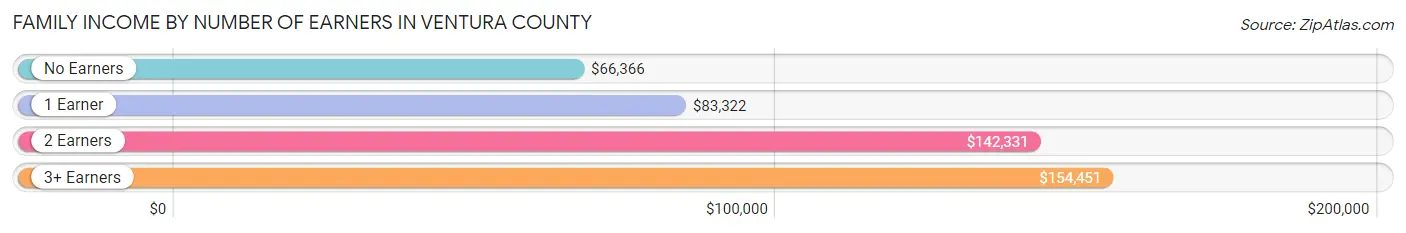
Family Income by Number of Earners in Ventura County
The median family income in Ventura County is $116,726, with families comprising 3+ earners (32,591) having the highest median family income of $154,451, while families with no earners (25,123) have the lowest median family income of $66,366, accounting for 16.5% and 12.7% of families, respectively.
| Number of Earners | # Families | Median Income |
| No Earners | 25,123 (12.7%) | $66,366 |
| 1 Earner | 59,721 (30.1%) | $83,322 |
| 2 Earners | 80,614 (40.7%) | $142,331 |
| 3+ Earners | 32,591 (16.5%) | $154,451 |
| Total | 198,049 (100.0%) | $116,726 |
Household Income in Ventura County
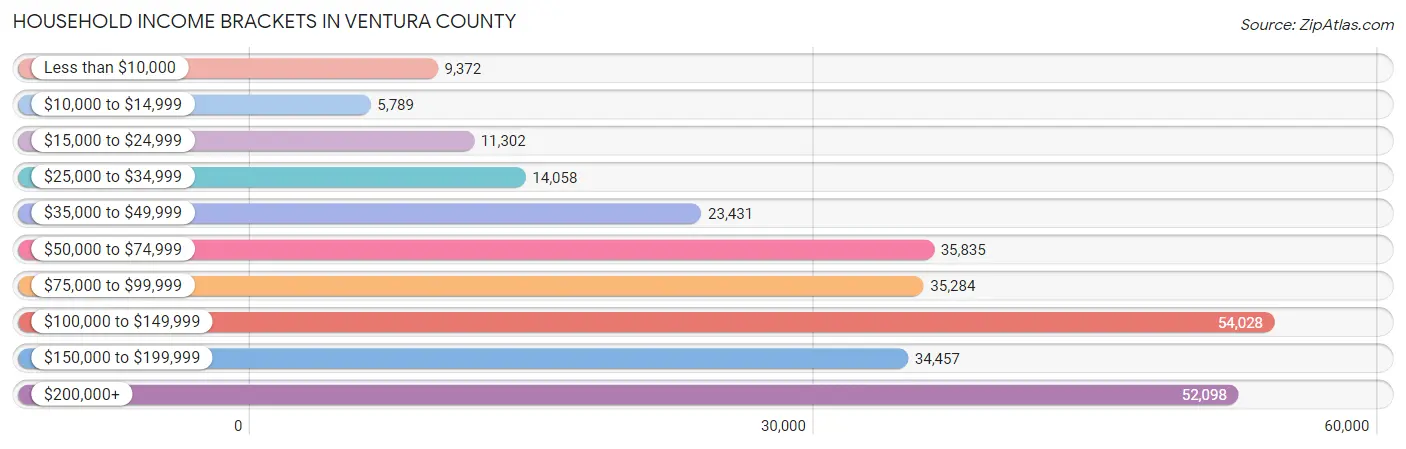
Household Income Brackets in Ventura County
With 54,028 households falling in the category, the $100,000 to $149,999 income range is the most frequent in Ventura County, accounting for 19.6% of all households. In contrast, only 5,789 households (2.1%) fall into the $10,000 to $14,999 income bracket, making it the least populous group.
| Income Bracket | # Households | % Households |
| Less than $10,000 | 9,372 | 3.4% |
| $10,000 to $14,999 | 5,789 | 2.1% |
| $15,000 to $24,999 | 11,302 | 4.1% |
| $25,000 to $34,999 | 14,058 | 5.1% |
| $35,000 to $49,999 | 23,431 | 8.5% |
| $50,000 to $74,999 | 35,835 | 13.0% |
| $75,000 to $99,999 | 35,284 | 12.8% |
| $100,000 to $149,999 | 54,028 | 19.6% |
| $150,000 to $199,999 | 34,457 | 12.5% |
| $200,000+ | 52,098 | 18.9% |
Household Income by Householder Age in Ventura County
The median household income in Ventura County is $102,141, with the highest median household income of $122,132 found in the 45 to 64 years age bracket for the primary householder. A total of 112,985 households (41.0%) fall into this category. Meanwhile, the 15 to 24 years age bracket for the primary householder has the lowest median household income of $56,944, with 4,342 households (1.6%) in this group.
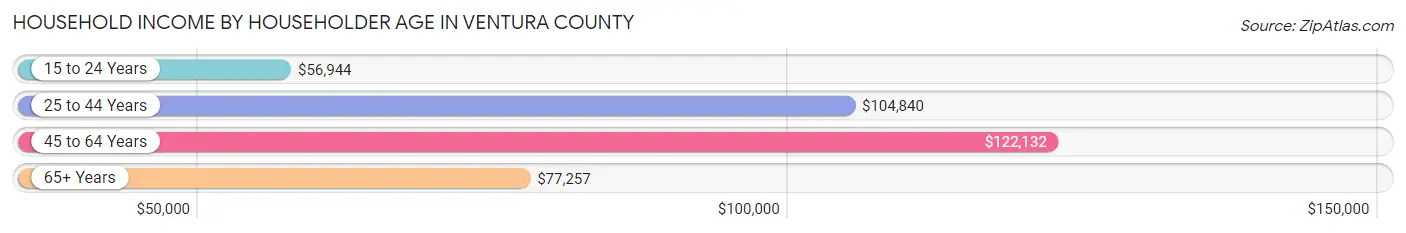
| Income Bracket | # Households | Median Income |
| 15 to 24 Years | 4,342 (1.6%) | $56,944 |
| 25 to 44 Years | 78,319 (28.4%) | $104,840 |
| 45 to 64 Years | 112,985 (41.0%) | $122,132 |
| 65+ Years | 80,007 (29.0%) | $77,257 |
| Total | 275,653 (100.0%) | $102,141 |
Poverty in Ventura County
Income Below Poverty by Sex and Age in Ventura County
With 8.3% poverty level for males and 9.6% for females among the residents of Ventura County, 6 to 11 year old males and 5 year old females are the most vulnerable to poverty, with 4,346 males (13.9%) and 831 females (16.7%) in their respective age groups living below the poverty level.
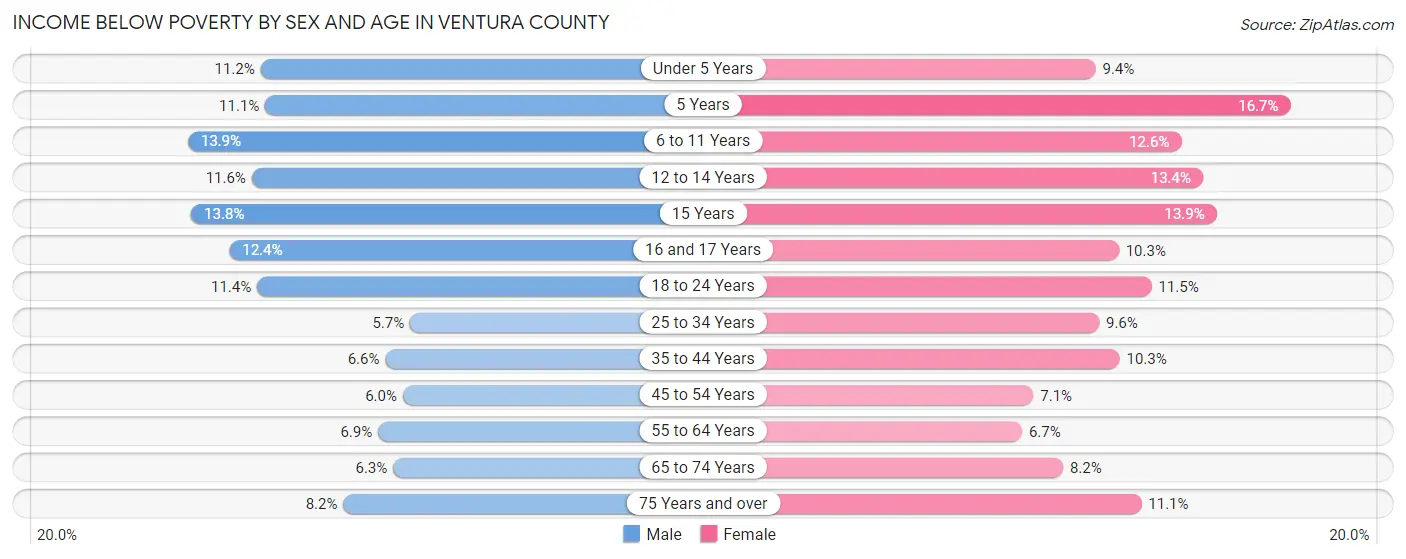
| Age Bracket | Male | Female |
| Under 5 Years | 2,560 (11.2%) | 2,046 (9.4%) |
| 5 Years | 563 (11.1%) | 831 (16.7%) |
| 6 to 11 Years | 4,346 (13.9%) | 3,742 (12.6%) |
| 12 to 14 Years | 2,003 (11.6%) | 2,247 (13.4%) |
| 15 Years | 791 (13.8%) | 847 (13.9%) |
| 16 and 17 Years | 1,444 (12.4%) | 1,118 (10.3%) |
| 18 to 24 Years | 4,235 (11.4%) | 4,181 (11.5%) |
| 25 to 34 Years | 3,242 (5.7%) | 5,141 (9.6%) |
| 35 to 44 Years | 3,574 (6.6%) | 5,392 (10.3%) |
| 45 to 54 Years | 3,238 (6.0%) | 3,846 (7.1%) |
| 55 to 64 Years | 3,797 (6.9%) | 3,754 (6.7%) |
| 65 to 74 Years | 2,395 (6.3%) | 3,421 (8.2%) |
| 75 Years and over | 1,934 (8.2%) | 3,627 (11.1%) |
| Total | 34,122 (8.3%) | 40,193 (9.6%) |
Income Above Poverty by Sex and Age in Ventura County
According to the poverty statistics in Ventura County, males aged 25 to 34 years and females aged 55 to 64 years are the age groups that are most secure financially, with 94.3% of males and 93.3% of females in these age groups living above the poverty line.
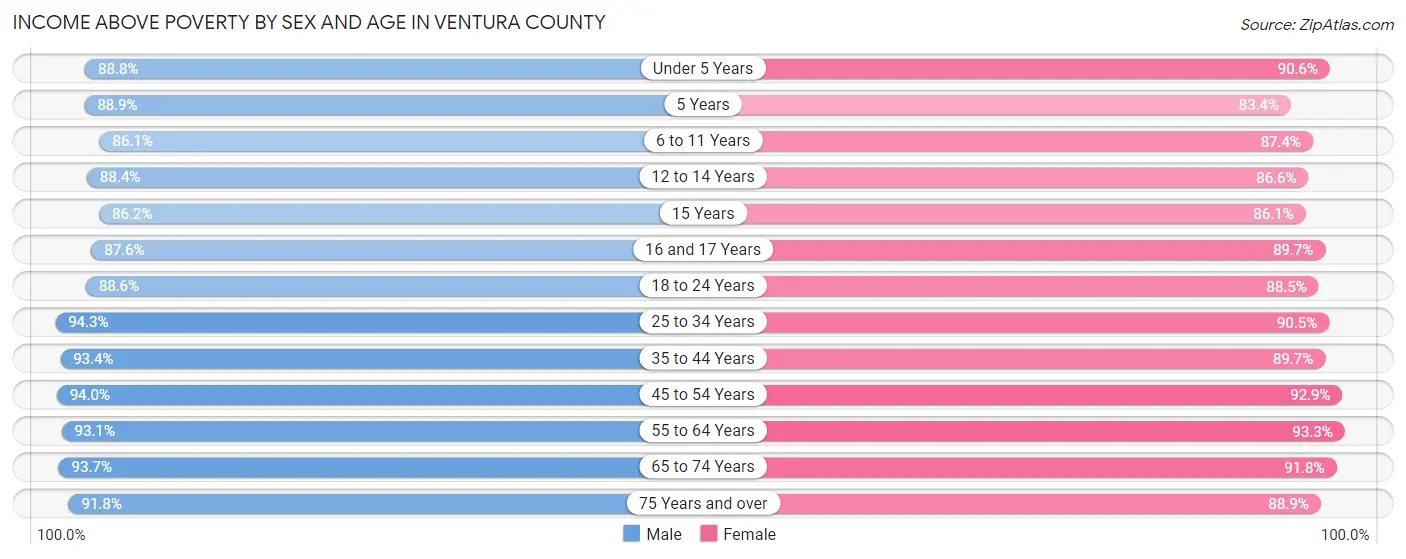
| Age Bracket | Male | Female |
| Under 5 Years | 20,225 (88.8%) | 19,663 (90.6%) |
| 5 Years | 4,522 (88.9%) | 4,160 (83.4%) |
| 6 to 11 Years | 26,834 (86.1%) | 25,950 (87.4%) |
| 12 to 14 Years | 15,309 (88.4%) | 14,517 (86.6%) |
| 15 Years | 4,931 (86.2%) | 5,241 (86.1%) |
| 16 and 17 Years | 10,200 (87.6%) | 9,759 (89.7%) |
| 18 to 24 Years | 33,028 (88.6%) | 32,181 (88.5%) |
| 25 to 34 Years | 53,694 (94.3%) | 48,680 (90.4%) |
| 35 to 44 Years | 50,498 (93.4%) | 46,900 (89.7%) |
| 45 to 54 Years | 51,091 (94.0%) | 50,232 (92.9%) |
| 55 to 64 Years | 51,416 (93.1%) | 52,371 (93.3%) |
| 65 to 74 Years | 35,526 (93.7%) | 38,269 (91.8%) |
| 75 Years and over | 21,744 (91.8%) | 28,981 (88.9%) |
| Total | 379,018 (91.7%) | 376,904 (90.4%) |
Income Below Poverty Among Married-Couple Families in Ventura County
The poverty statistics for married-couple families in Ventura County show that 3.7% or 5,480 of the total 149,772 families live below the poverty line. Families with 5 or more children have the highest poverty rate of 23.7%, comprising of 212 families. On the other hand, families with no children have the lowest poverty rate of 2.7%, which includes 2,304 families.
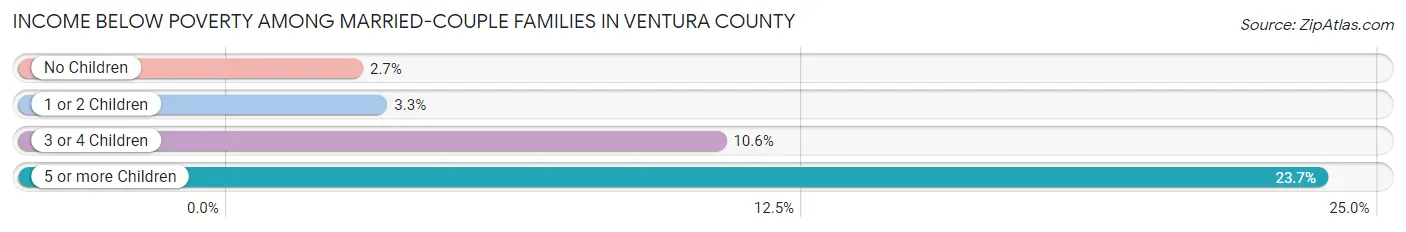
| Children | Above Poverty | Below Poverty |
| No Children | 82,456 (97.3%) | 2,304 (2.7%) |
| 1 or 2 Children | 50,508 (96.8%) | 1,698 (3.3%) |
| 3 or 4 Children | 10,646 (89.4%) | 1,266 (10.6%) |
| 5 or more Children | 682 (76.3%) | 212 (23.7%) |
| Total | 144,292 (96.3%) | 5,480 (3.7%) |
Income Below Poverty Among Single-Parent Households in Ventura County
According to the poverty data in Ventura County, 7.0% or 1,084 single-father households and 16.3% or 5,324 single-mother households are living below the poverty line. Among single-father households, those with 3 or 4 children have the highest poverty rate, with 195 households (18.9%) experiencing poverty. Likewise, among single-mother households, those with 3 or 4 children have the highest poverty rate, with 1,447 households (46.2%) falling below the poverty line.
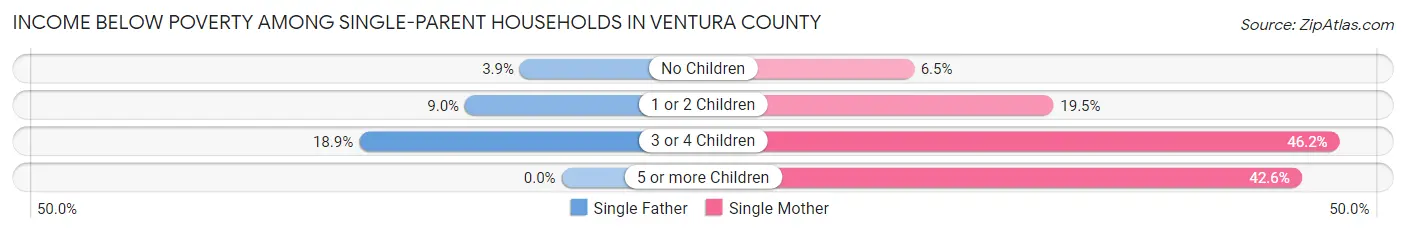
| Children | Single Father | Single Mother |
| No Children | 310 (3.9%) | 994 (6.5%) |
| 1 or 2 Children | 579 (9.0%) | 2,741 (19.5%) |
| 3 or 4 Children | 195 (18.9%) | 1,447 (46.2%) |
| 5 or more Children | 0 (0.0%) | 142 (42.6%) |
| Total | 1,084 (7.0%) | 5,324 (16.3%) |
Income Below Poverty Among Married-Couple vs Single-Parent Households in Ventura County
The poverty data for Ventura County shows that 5,480 of the married-couple family households (3.7%) and 6,408 of the single-parent households (13.3%) are living below the poverty level. Within the married-couple family households, those with 5 or more children have the highest poverty rate, with 212 households (23.7%) falling below the poverty line. Among the single-parent households, those with 3 or 4 children have the highest poverty rate, with 1,642 household (39.4%) living below poverty.
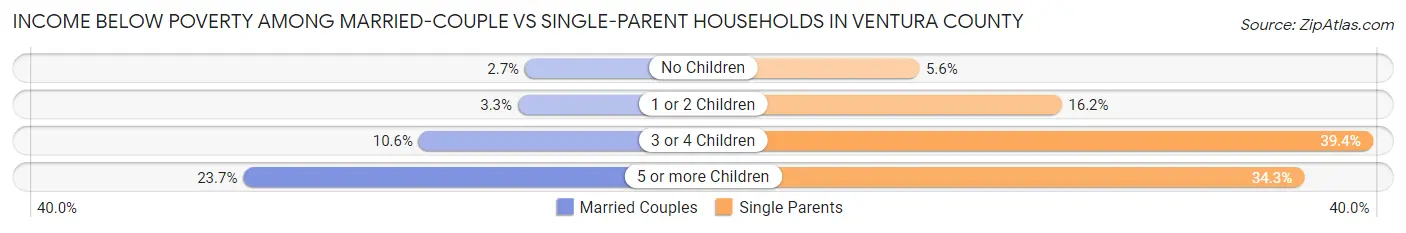
| Children | Married-Couple Families | Single-Parent Households |
| No Children | 2,304 (2.7%) | 1,304 (5.6%) |
| 1 or 2 Children | 1,698 (3.3%) | 3,320 (16.2%) |
| 3 or 4 Children | 1,266 (10.6%) | 1,642 (39.4%) |
| 5 or more Children | 212 (23.7%) | 142 (34.3%) |
| Total | 5,480 (3.7%) | 6,408 (13.3%) |
Race in Ventura County
The most populous races in Ventura County are White / Caucasian (544,398 | 64.6%), Hispanic or Latino (367,039 | 43.6%), and Two or more Races (138,883 | 16.5%).
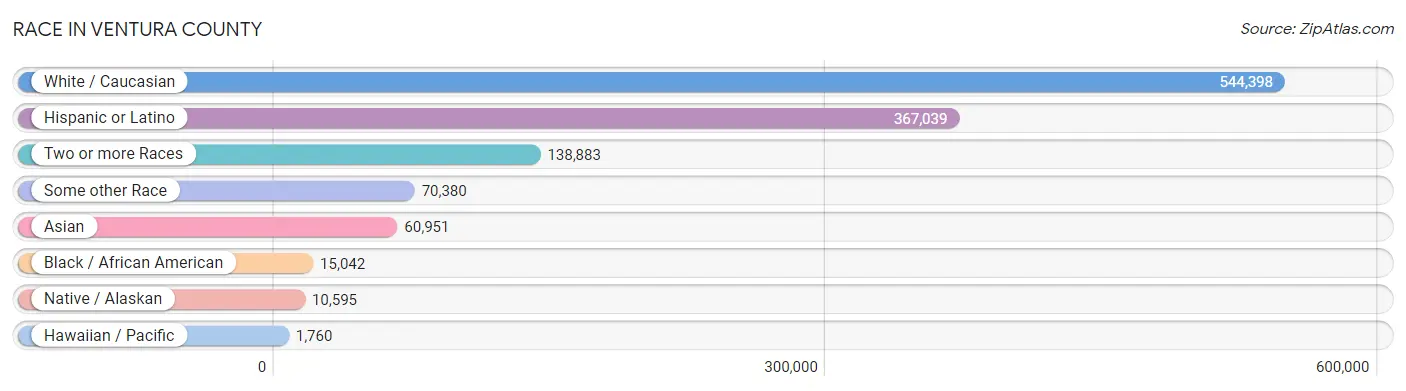
| Race | # Population | % Population |
| Asian | 60,951 | 7.2% |
| Black / African American | 15,042 | 1.8% |
| Hawaiian / Pacific | 1,760 | 0.2% |
| Hispanic or Latino | 367,039 | 43.6% |
| Native / Alaskan | 10,595 | 1.3% |
| White / Caucasian | 544,398 | 64.6% |
| Two or more Races | 138,883 | 16.5% |
| Some other Race | 70,380 | 8.4% |
| Total | 842,009 | 100.0% |
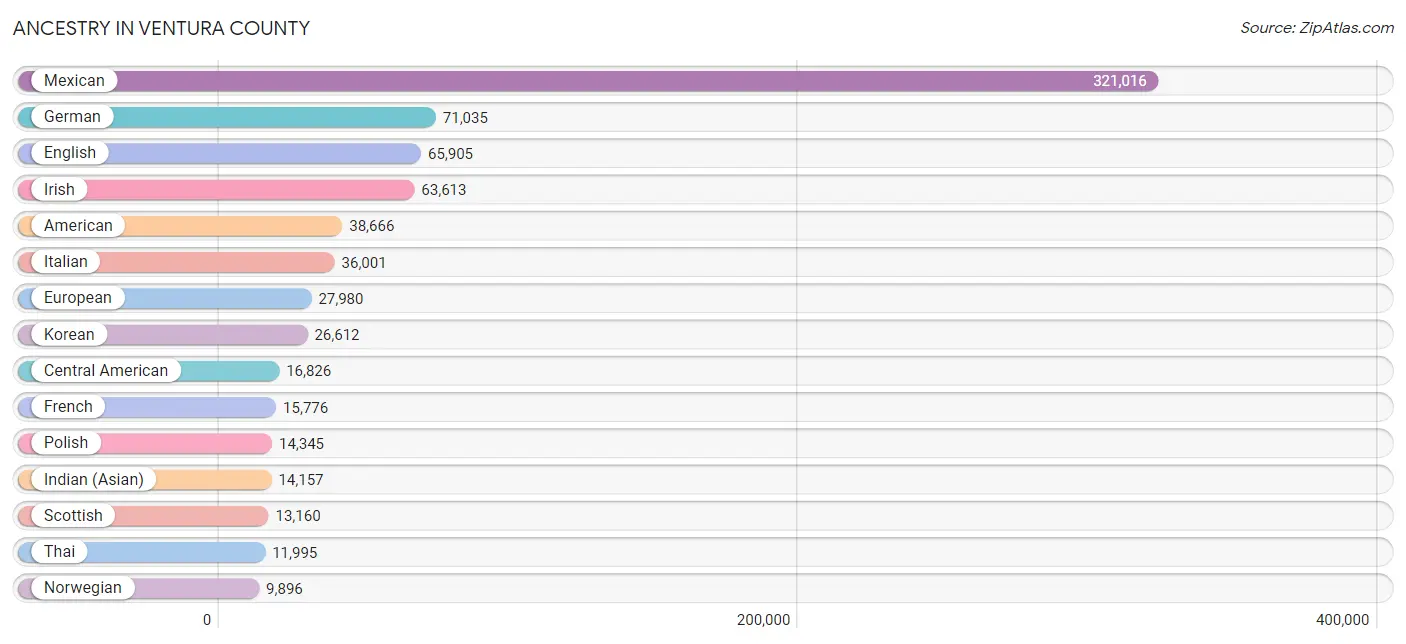
Ancestry in Ventura County
The most populous ancestries reported in Ventura County are Mexican (321,016 | 38.1%), German (71,035 | 8.4%), English (65,905 | 7.8%), Irish (63,613 | 7.5%), and American (38,666 | 4.6%), together accounting for 66.5% of all Ventura County residents.
| Ancestry | # Population | % Population |
| Afghan | 470 | 0.1% |
| African | 883 | 0.1% |
| Alaska Native | 6 | 0.0% |
| Albanian | 225 | 0.0% |
| Aleut | 9 | 0.0% |
| Alsatian | 45 | 0.0% |
| American | 38,666 | 4.6% |
| Apache | 827 | 0.1% |
| Arab | 4,816 | 0.6% |
| Argentinean | 1,283 | 0.2% |
| Armenian | 1,947 | 0.2% |
| Assyrian / Chaldean / Syriac | 117 | 0.0% |
| Australian | 497 | 0.1% |
| Austrian | 2,053 | 0.2% |
| Bangladeshi | 165 | 0.0% |
| Barbadian | 118 | 0.0% |
| Basque | 379 | 0.1% |
| Belgian | 738 | 0.1% |
| Belizean | 198 | 0.0% |
| Bhutanese | 8,955 | 1.1% |
| Blackfeet | 514 | 0.1% |
| Bolivian | 113 | 0.0% |
| Brazilian | 416 | 0.1% |
| British | 5,100 | 0.6% |
| British West Indian | 61 | 0.0% |
| Bulgarian | 87 | 0.0% |
| Burmese | 6,684 | 0.8% |
| Cajun | 18 | 0.0% |
| Cambodian | 93 | 0.0% |
| Canadian | 2,181 | 0.3% |
| Carpatho Rusyn | 11 | 0.0% |
| Celtic | 143 | 0.0% |
| Central American | 16,826 | 2.0% |
| Central American Indian | 1,453 | 0.2% |
| Cherokee | 2,604 | 0.3% |
| Chickasaw | 166 | 0.0% |
| Chilean | 752 | 0.1% |
| Chinese | 53 | 0.0% |
| Chippewa | 101 | 0.0% |
| Choctaw | 859 | 0.1% |
| Colombian | 2,253 | 0.3% |
| Comanche | 106 | 0.0% |
| Costa Rican | 1,181 | 0.1% |
| Cree | 15 | 0.0% |
| Creek | 34 | 0.0% |
| Croatian | 801 | 0.1% |
| Cuban | 2,132 | 0.3% |
| Cypriot | 5 | 0.0% |
| Czech | 2,822 | 0.3% |
| Czechoslovakian | 500 | 0.1% |
| Danish | 3,744 | 0.4% |
| Dominican | 176 | 0.0% |
| Dutch | 8,040 | 0.9% |
| Dutch West Indian | 35 | 0.0% |
| Eastern European | 3,345 | 0.4% |
| Ecuadorian | 1,248 | 0.2% |
| Egyptian | 1,040 | 0.1% |
| English | 65,905 | 7.8% |
| Estonian | 75 | 0.0% |
| Ethiopian | 123 | 0.0% |
| European | 27,980 | 3.3% |
| Filipino | 1,268 | 0.2% |
| Finnish | 1,691 | 0.2% |
| French | 15,776 | 1.9% |
| French American Indian | 59 | 0.0% |
| French Canadian | 2,568 | 0.3% |
| German | 71,035 | 8.4% |
| German Russian | 62 | 0.0% |
| Ghanaian | 14 | 0.0% |
| Greek | 3,757 | 0.4% |
| Guamanian / Chamorro | 520 | 0.1% |
| Guatemalan | 4,021 | 0.5% |
| Guyanese | 35 | 0.0% |
| Haitian | 216 | 0.0% |
| Honduran | 520 | 0.1% |
| Hopi | 24 | 0.0% |
| Houma | 46 | 0.0% |
| Hungarian | 3,545 | 0.4% |
| Icelander | 211 | 0.0% |
| Indian (Asian) | 14,157 | 1.7% |
| Indonesian | 51 | 0.0% |
| Inupiat | 80 | 0.0% |
| Iranian | 4,359 | 0.5% |
| Iraqi | 10 | 0.0% |
| Irish | 63,613 | 7.5% |
| Iroquois | 94 | 0.0% |
| Israeli | 586 | 0.1% |
| Italian | 36,001 | 4.3% |
| Jamaican | 470 | 0.1% |
| Japanese | 1,165 | 0.1% |
| Jordanian | 58 | 0.0% |
| Kenyan | 26 | 0.0% |
| Korean | 26,612 | 3.2% |
| Laotian | 1,034 | 0.1% |
| Latvian | 381 | 0.1% |
| Lebanese | 1,024 | 0.1% |
| Lithuanian | 1,692 | 0.2% |
| Luxembourger | 20 | 0.0% |
| Macedonian | 60 | 0.0% |
| Malaysian | 183 | 0.0% |
| Maltese | 68 | 0.0% |
| Mexican | 321,016 | 38.1% |
| Mexican American Indian | 7,648 | 0.9% |
| Mongolian | 47 | 0.0% |
| Moroccan | 292 | 0.0% |
| Native Hawaiian | 2,480 | 0.3% |
| Navajo | 298 | 0.0% |
| Nepalese | 94 | 0.0% |
| New Zealander | 43 | 0.0% |
| Nicaraguan | 1,934 | 0.2% |
| Nigerian | 857 | 0.1% |
| Northern European | 1,644 | 0.2% |
| Norwegian | 9,896 | 1.2% |
| Okinawan | 12 | 0.0% |
| Osage | 130 | 0.0% |
| Paiute | 30 | 0.0% |
| Pakistani | 841 | 0.1% |
| Palestinian | 616 | 0.1% |
| Panamanian | 597 | 0.1% |
| Paraguayan | 7 | 0.0% |
| Pennsylvania German | 223 | 0.0% |
| Peruvian | 2,601 | 0.3% |
| Pima | 71 | 0.0% |
| Polish | 14,345 | 1.7% |
| Portuguese | 3,433 | 0.4% |
| Potawatomi | 284 | 0.0% |
| Pueblo | 150 | 0.0% |
| Puerto Rican | 3,770 | 0.4% |
| Puget Sound Salish | 5 | 0.0% |
| Romanian | 1,044 | 0.1% |
| Russian | 9,385 | 1.1% |
| Salvadoran | 8,545 | 1.0% |
| Samoan | 681 | 0.1% |
| Scandinavian | 4,333 | 0.5% |
| Scotch-Irish | 5,545 | 0.7% |
| Scottish | 13,160 | 1.6% |
| Seminole | 48 | 0.0% |
| Serbian | 176 | 0.0% |
| Shoshone | 6 | 0.0% |
| Sioux | 216 | 0.0% |
| Slavic | 366 | 0.0% |
| Slovak | 470 | 0.1% |
| Slovene | 159 | 0.0% |
| South African | 328 | 0.0% |
| South American | 8,568 | 1.0% |
| South American Indian | 45 | 0.0% |
| Spaniard | 4,217 | 0.5% |
| Spanish | 3,752 | 0.4% |
| Spanish American | 86 | 0.0% |
| Spanish American Indian | 179 | 0.0% |
| Sri Lankan | 5,992 | 0.7% |
| Subsaharan African | 2,665 | 0.3% |
| Sudanese | 103 | 0.0% |
| Swedish | 9,006 | 1.1% |
| Swiss | 2,078 | 0.3% |
| Syrian | 695 | 0.1% |
| Thai | 11,995 | 1.4% |
| Tlingit-Haida | 50 | 0.0% |
| Tohono O'Odham | 301 | 0.0% |
| Tongan | 357 | 0.0% |
| Trinidadian and Tobagonian | 110 | 0.0% |
| Turkish | 608 | 0.1% |
| Ugandan | 8 | 0.0% |
| Ukrainian | 2,506 | 0.3% |
| Uruguayan | 52 | 0.0% |
| Ute | 6 | 0.0% |
| Venezuelan | 251 | 0.0% |
| Vietnamese | 45 | 0.0% |
| Welsh | 4,199 | 0.5% |
| West Indian | 108 | 0.0% |
| Yaqui | 447 | 0.1% |
| Yugoslavian | 369 | 0.0% | View All 172 Rows |
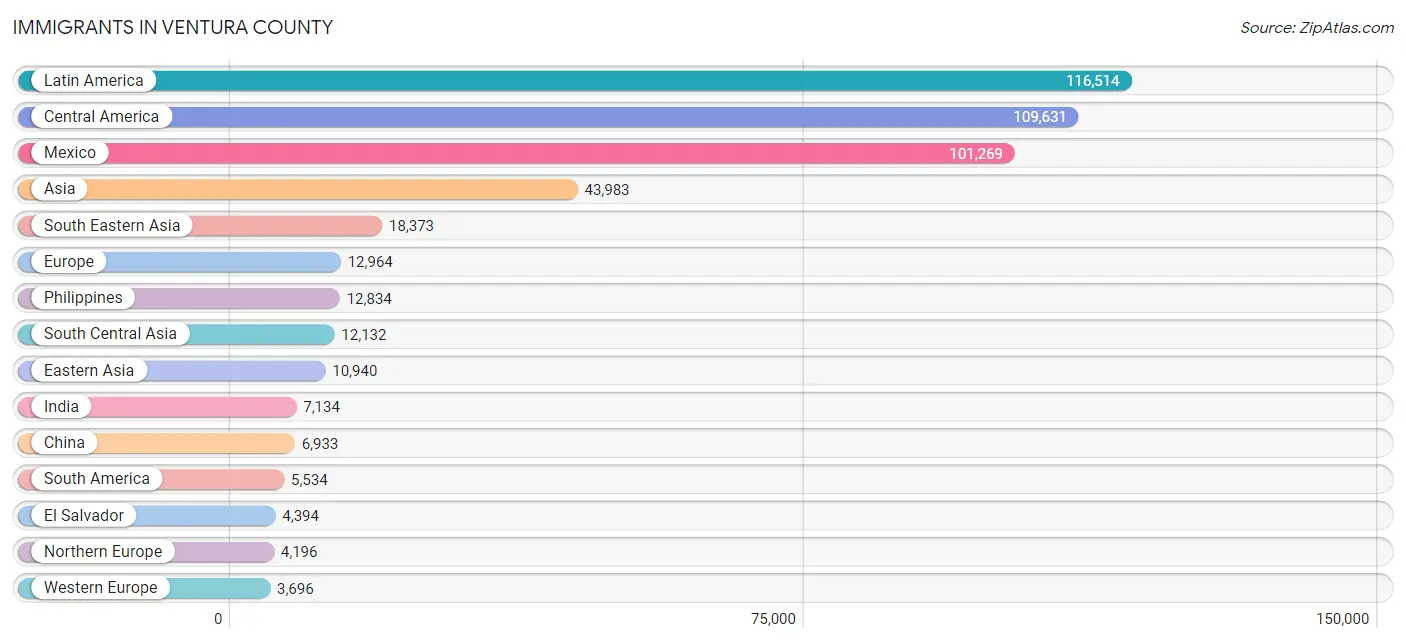
Immigrants in Ventura County
The most numerous immigrant groups reported in Ventura County came from Latin America (116,514 | 13.8%), Central America (109,631 | 13.0%), Mexico (101,269 | 12.0%), Asia (43,983 | 5.2%), and South Eastern Asia (18,373 | 2.2%), together accounting for 46.3% of all Ventura County residents.
| Immigration Origin | # Population | % Population |
| Afghanistan | 557 | 0.1% |
| Africa | 2,399 | 0.3% |
| Albania | 102 | 0.0% |
| Argentina | 868 | 0.1% |
| Armenia | 123 | 0.0% |
| Asia | 43,983 | 5.2% |
| Australia | 463 | 0.1% |
| Austria | 126 | 0.0% |
| Bangladesh | 44 | 0.0% |
| Barbados | 53 | 0.0% |
| Belarus | 95 | 0.0% |
| Belgium | 257 | 0.0% |
| Belize | 80 | 0.0% |
| Bolivia | 93 | 0.0% |
| Brazil | 579 | 0.1% |
| Bulgaria | 37 | 0.0% |
| Cambodia | 756 | 0.1% |
| Canada | 3,617 | 0.4% |
| Caribbean | 1,349 | 0.2% |
| Central America | 109,631 | 13.0% |
| Chile | 369 | 0.0% |
| China | 6,933 | 0.8% |
| Colombia | 1,172 | 0.1% |
| Congo | 20 | 0.0% |
| Costa Rica | 283 | 0.0% |
| Croatia | 5 | 0.0% |
| Cuba | 587 | 0.1% |
| Czechoslovakia | 283 | 0.0% |
| Denmark | 122 | 0.0% |
| Dominican Republic | 55 | 0.0% |
| Eastern Africa | 313 | 0.0% |
| Eastern Asia | 10,940 | 1.3% |
| Eastern Europe | 3,472 | 0.4% |
| Ecuador | 630 | 0.1% |
| Egypt | 840 | 0.1% |
| El Salvador | 4,394 | 0.5% |
| England | 1,647 | 0.2% |
| Eritrea | 11 | 0.0% |
| Ethiopia | 77 | 0.0% |
| Europe | 12,964 | 1.5% |
| Fiji | 189 | 0.0% |
| France | 485 | 0.1% |
| Germany | 2,120 | 0.3% |
| Ghana | 35 | 0.0% |
| Greece | 398 | 0.1% |
| Grenada | 6 | 0.0% |
| Guatemala | 2,236 | 0.3% |
| Guyana | 103 | 0.0% |
| Haiti | 122 | 0.0% |
| Honduras | 307 | 0.0% |
| Hong Kong | 700 | 0.1% |
| Hungary | 382 | 0.1% |
| India | 7,134 | 0.9% |
| Indonesia | 437 | 0.1% |
| Iran | 2,866 | 0.3% |
| Iraq | 16 | 0.0% |
| Ireland | 343 | 0.0% |
| Israel | 578 | 0.1% |
| Italy | 639 | 0.1% |
| Jamaica | 298 | 0.0% |
| Japan | 1,269 | 0.2% |
| Jordan | 86 | 0.0% |
| Kazakhstan | 45 | 0.0% |
| Kenya | 89 | 0.0% |
| Korea | 2,700 | 0.3% |
| Kuwait | 40 | 0.0% |
| Laos | 185 | 0.0% |
| Latin America | 116,514 | 13.8% |
| Latvia | 105 | 0.0% |
| Lebanon | 432 | 0.1% |
| Liberia | 52 | 0.0% |
| Lithuania | 127 | 0.0% |
| Malaysia | 69 | 0.0% |
| Mexico | 101,269 | 12.0% |
| Micronesia | 91 | 0.0% |
| Middle Africa | 51 | 0.0% |
| Moldova | 33 | 0.0% |
| Morocco | 150 | 0.0% |
| Nepal | 101 | 0.0% |
| Netherlands | 532 | 0.1% |
| Nicaragua | 918 | 0.1% |
| Nigeria | 284 | 0.0% |
| Northern Africa | 1,103 | 0.1% |
| Northern Europe | 4,196 | 0.5% |
| Norway | 27 | 0.0% |
| Oceania | 1,013 | 0.1% |
| Pakistan | 801 | 0.1% |
| Panama | 133 | 0.0% |
| Peru | 1,445 | 0.2% |
| Philippines | 12,834 | 1.5% |
| Poland | 484 | 0.1% |
| Portugal | 332 | 0.0% |
| Romania | 310 | 0.0% |
| Russia | 808 | 0.1% |
| Saudi Arabia | 80 | 0.0% |
| Scotland | 353 | 0.0% |
| Serbia | 36 | 0.0% |
| Sierra Leone | 39 | 0.0% |
| Singapore | 32 | 0.0% |
| South Africa | 313 | 0.0% |
| South America | 5,534 | 0.7% |
| South Central Asia | 12,132 | 1.4% |
| South Eastern Asia | 18,373 | 2.2% |
| Southern Europe | 1,585 | 0.2% |
| Spain | 182 | 0.0% |
| Sri Lanka | 503 | 0.1% |
| Sudan | 53 | 0.0% |
| Sweden | 326 | 0.0% |
| Switzerland | 168 | 0.0% |
| Syria | 634 | 0.1% |
| Taiwan | 1,539 | 0.2% |
| Thailand | 599 | 0.1% |
| Trinidad and Tobago | 130 | 0.0% |
| Turkey | 248 | 0.0% |
| Uganda | 75 | 0.0% |
| Ukraine | 402 | 0.1% |
| Uruguay | 15 | 0.0% |
| Uzbekistan | 38 | 0.0% |
| Venezuela | 237 | 0.0% |
| Vietnam | 3,215 | 0.4% |
| West Indies | 28 | 0.0% |
| Western Africa | 618 | 0.1% |
| Western Asia | 2,473 | 0.3% |
| Western Europe | 3,696 | 0.4% |
| Zimbabwe | 21 | 0.0% | View All 125 Rows |
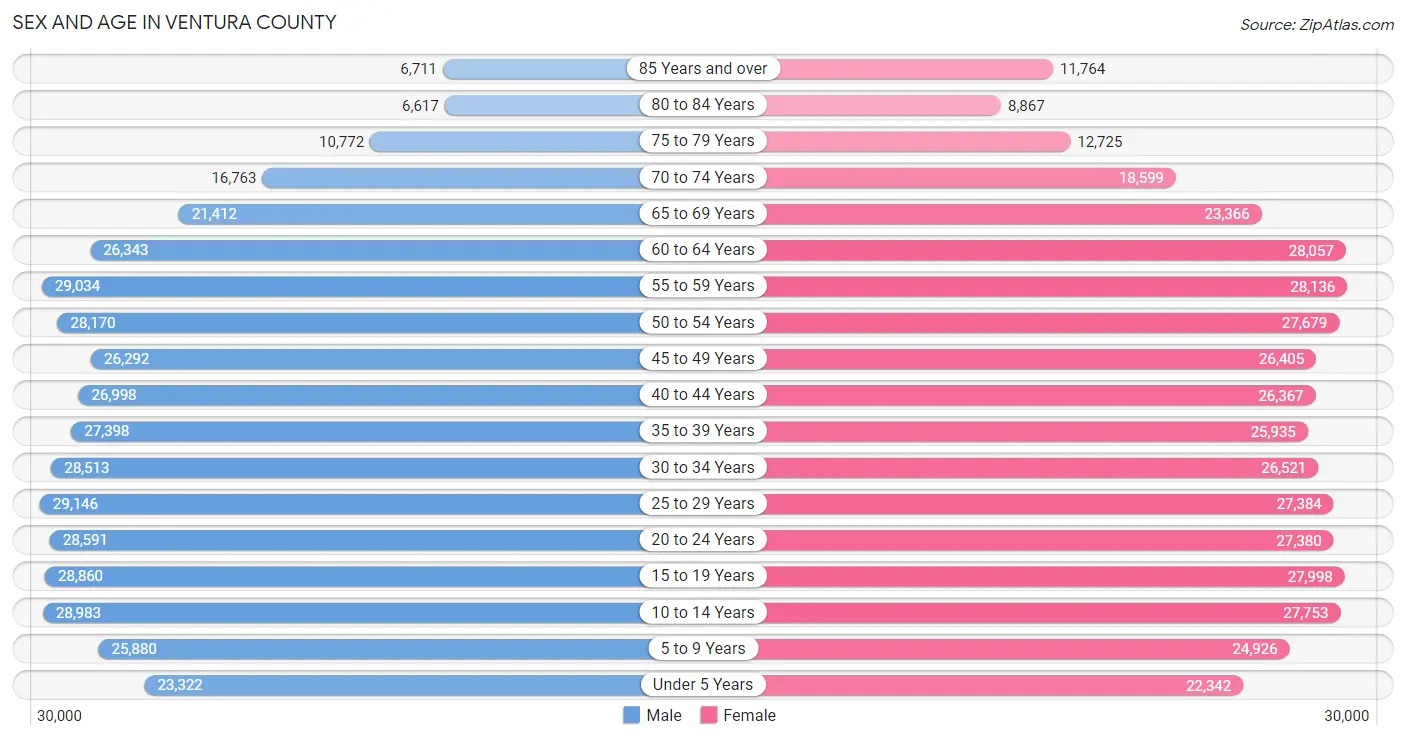
Sex and Age in Ventura County
Sex and Age in Ventura County
The most populous age groups in Ventura County are 25 to 29 Years (29,146 | 6.9%) for men and 55 to 59 Years (28,136 | 6.7%) for women.
| Age Bracket | Male | Female |
| Under 5 Years | 23,322 (5.6%) | 22,342 (5.3%) |
| 5 to 9 Years | 25,880 (6.2%) | 24,926 (5.9%) |
| 10 to 14 Years | 28,983 (6.9%) | 27,753 (6.6%) |
| 15 to 19 Years | 28,860 (6.9%) | 27,998 (6.6%) |
| 20 to 24 Years | 28,591 (6.8%) | 27,380 (6.5%) |
| 25 to 29 Years | 29,146 (6.9%) | 27,384 (6.5%) |
| 30 to 34 Years | 28,513 (6.8%) | 26,521 (6.3%) |
| 35 to 39 Years | 27,398 (6.5%) | 25,935 (6.1%) |
| 40 to 44 Years | 26,998 (6.4%) | 26,367 (6.2%) |
| 45 to 49 Years | 26,292 (6.3%) | 26,405 (6.2%) |
| 50 to 54 Years | 28,170 (6.7%) | 27,679 (6.6%) |
| 55 to 59 Years | 29,034 (6.9%) | 28,136 (6.7%) |
| 60 to 64 Years | 26,343 (6.3%) | 28,057 (6.7%) |
| 65 to 69 Years | 21,412 (5.1%) | 23,366 (5.5%) |
| 70 to 74 Years | 16,763 (4.0%) | 18,599 (4.4%) |
| 75 to 79 Years | 10,772 (2.6%) | 12,725 (3.0%) |
| 80 to 84 Years | 6,617 (1.6%) | 8,867 (2.1%) |
| 85 Years and over | 6,711 (1.6%) | 11,764 (2.8%) |
| Total | 419,805 (100.0%) | 422,204 (100.0%) |
Families and Households in Ventura County
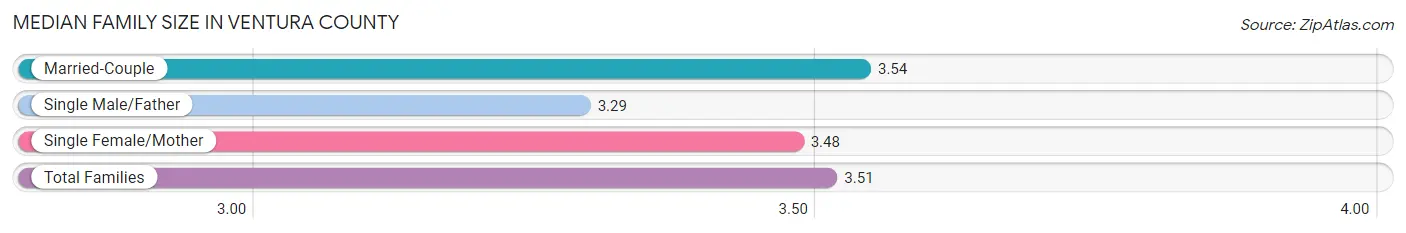
Median Family Size in Ventura County
The median family size in Ventura County is 3.51 persons per family, with married-couple families (149,772 | 75.6%) accounting for the largest median family size of 3.54 persons per family. On the other hand, single male/father families (15,536 | 7.8%) represent the smallest median family size with 3.29 persons per family.
| Family Type | # Families | Family Size |
| Married-Couple | 149,772 (75.6%) | 3.54 |
| Single Male/Father | 15,536 (7.8%) | 3.29 |
| Single Female/Mother | 32,741 (16.5%) | 3.48 |
| Total Families | 198,049 (100.0%) | 3.51 |
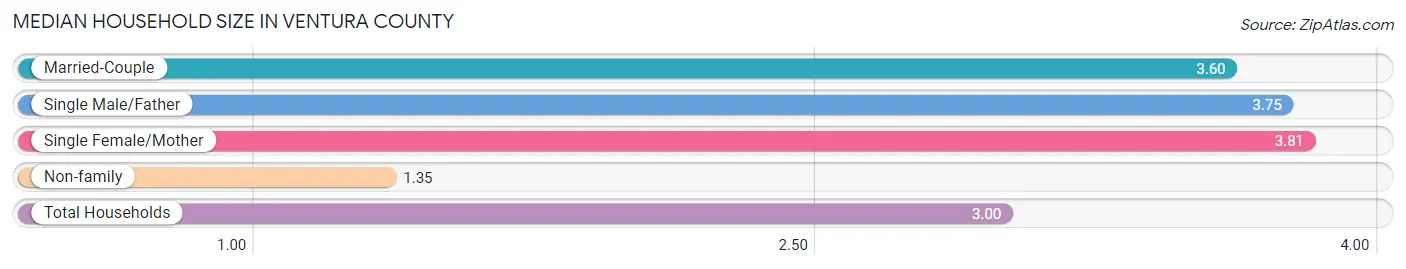
Median Household Size in Ventura County
The median household size in Ventura County is 3.00 persons per household, with single female/mother households (32,741 | 11.9%) accounting for the largest median household size of 3.81 persons per household. non-family households (77,604 | 28.1%) represent the smallest median household size with 1.35 persons per household.
| Household Type | # Households | Household Size |
| Married-Couple | 149,772 (54.3%) | 3.60 |
| Single Male/Father | 15,536 (5.6%) | 3.75 |
| Single Female/Mother | 32,741 (11.9%) | 3.81 |
| Non-family | 77,604 (28.1%) | 1.35 |
| Total Households | 275,653 (100.0%) | 3.00 |
Household Size by Marriage Status in Ventura County
Out of a total of 275,653 households in Ventura County, 198,049 (71.9%) are family households, while 77,604 (28.1%) are nonfamily households. The most numerous type of family households are 2-person households, comprising 74,323, and the most common type of nonfamily households are 1-person households, comprising 59,893.
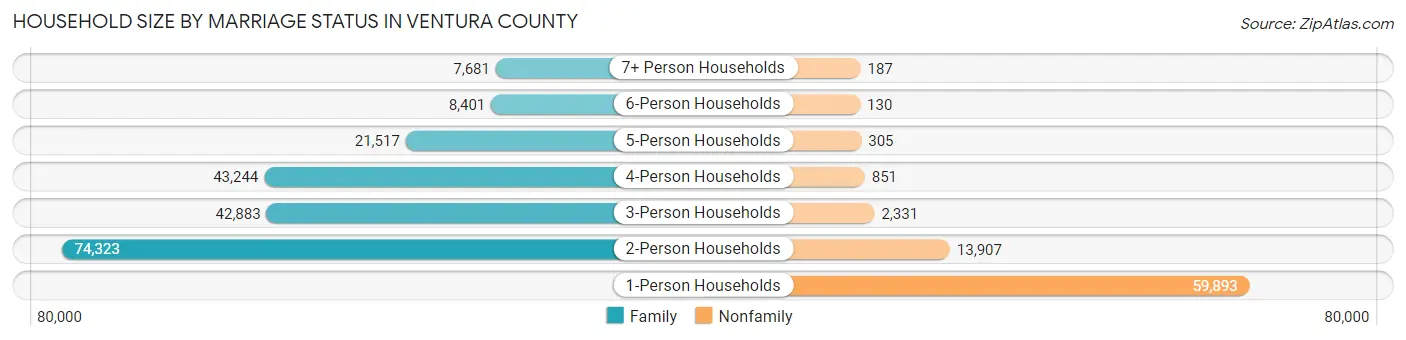
| Household Size | Family Households | Nonfamily Households |
| 1-Person Households | - | 59,893 (21.7%) |
| 2-Person Households | 74,323 (27.0%) | 13,907 (5.1%) |
| 3-Person Households | 42,883 (15.6%) | 2,331 (0.9%) |
| 4-Person Households | 43,244 (15.7%) | 851 (0.3%) |
| 5-Person Households | 21,517 (7.8%) | 305 (0.1%) |
| 6-Person Households | 8,401 (3.0%) | 130 (0.1%) |
| 7+ Person Households | 7,681 (2.8%) | 187 (0.1%) |
| Total | 198,049 (71.9%) | 77,604 (28.1%) |
Female Fertility in Ventura County
Fertility by Age in Ventura County
Average fertility rate in Ventura County is 50.0 births per 1,000 women. Women in the age bracket of 20 to 34 years have the highest fertility rate with 76.0 births per 1,000 women. Women in the age bracket of 20 to 34 years acount for 64.4% of all women with births.
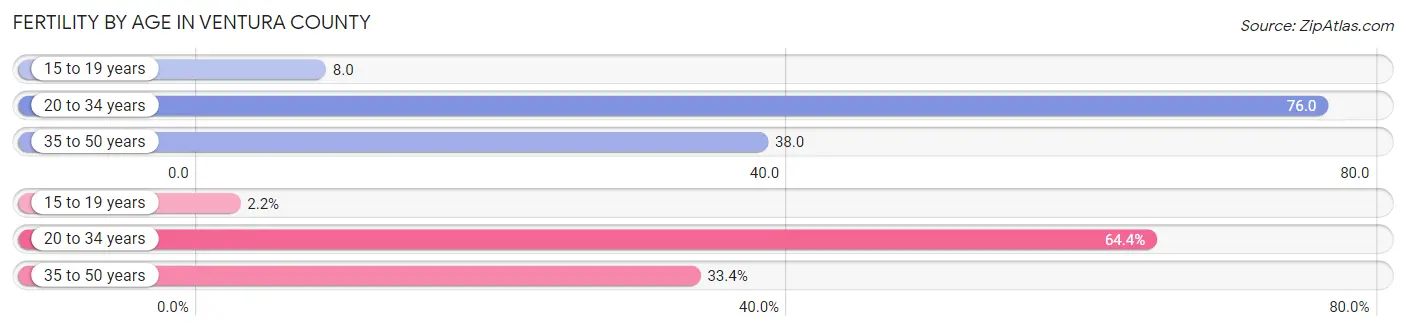
| Age Bracket | Women with Births | Births / 1,000 Women |
| 15 to 19 years | 211 (2.2%) | 8.0 |
| 20 to 34 years | 6,211 (64.4%) | 76.0 |
| 35 to 50 years | 3,223 (33.4%) | 38.0 |
| Total | 9,645 (100.0%) | 50.0 |
Fertility by Age by Marriage Status in Ventura County
73.0% of women with births (9,645) in Ventura County are married. The highest percentage of unmarried women with births falls into 15 to 19 years age bracket with 51.2% of them unmarried at the time of birth, while the lowest percentage of unmarried women with births belong to 35 to 50 years age bracket with 15.4% of them unmarried.
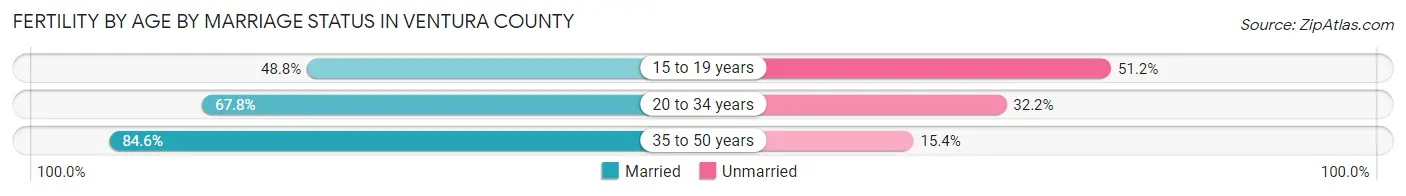
| Age Bracket | Married | Unmarried |
| 15 to 19 years | 103 (48.8%) | 108 (51.2%) |
| 20 to 34 years | 4,211 (67.8%) | 2,000 (32.2%) |
| 35 to 50 years | 2,727 (84.6%) | 496 (15.4%) |
| Total | 7,041 (73.0%) | 2,604 (27.0%) |
Fertility by Education in Ventura County
Average fertility rate in Ventura County is 50.0 births per 1,000 women. Women with the education attainment of bachelor's degree have the highest fertility rate of 65.0 births per 1,000 women, while women with the education attainment of less than high school have the lowest fertility at 27.0 births per 1,000 women. Women with the education attainment of college or associate's degree represent 28.2% of all women with births.
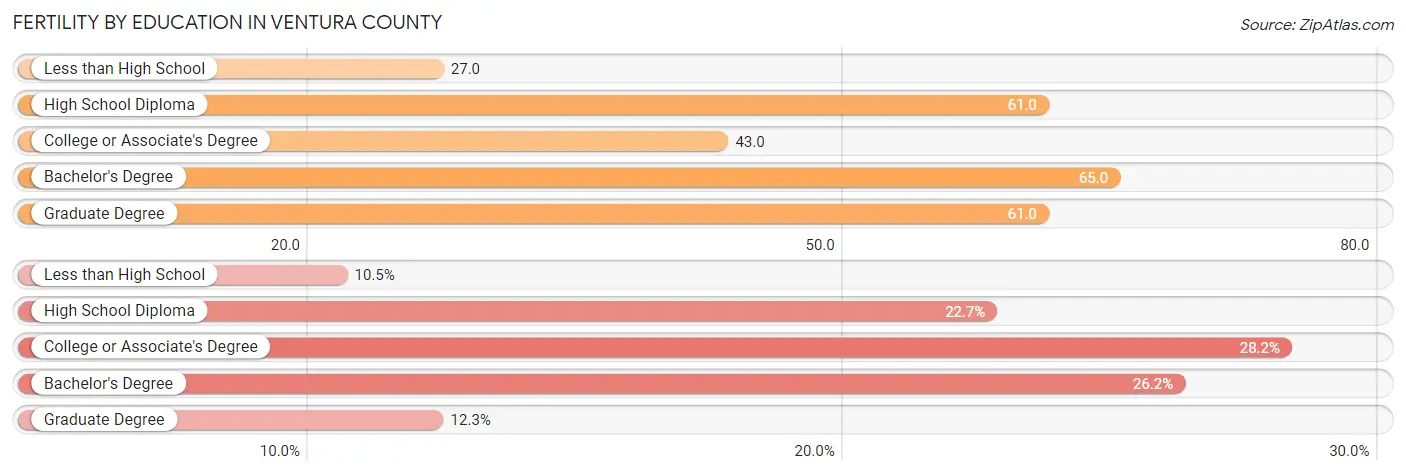
| Educational Attainment | Women with Births | Births / 1,000 Women |
| Less than High School | 1,016 (10.5%) | 27.0 |
| High School Diploma | 2,189 (22.7%) | 61.0 |
| College or Associate's Degree | 2,722 (28.2%) | 43.0 |
| Bachelor's Degree | 2,529 (26.2%) | 65.0 |
| Graduate Degree | 1,189 (12.3%) | 61.0 |
| Total | 9,645 (100.0%) | 50.0 |
Fertility by Education by Marriage Status in Ventura County
27.0% of women with births in Ventura County are unmarried. Women with the educational attainment of graduate degree are most likely to be married with 93.9% of them married at childbirth, while women with the educational attainment of less than high school are least likely to be married with 42.4% of them unmarried at childbirth.
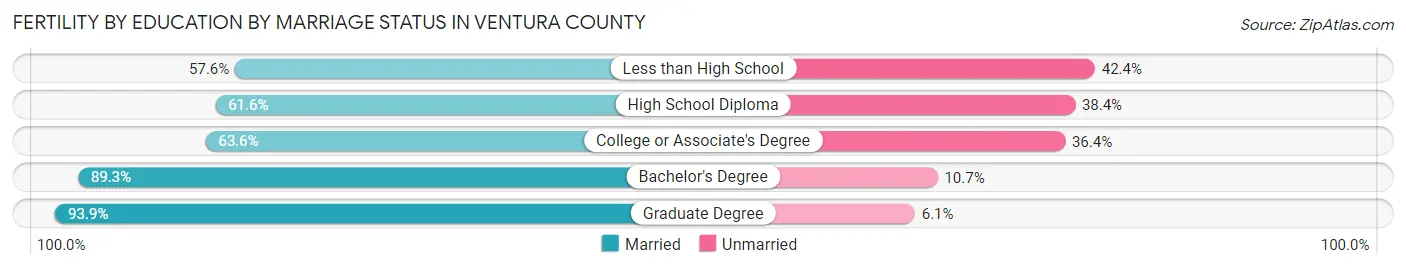
| Educational Attainment | Married | Unmarried |
| Less than High School | 585 (57.6%) | 431 (42.4%) |
| High School Diploma | 1,348 (61.6%) | 841 (38.4%) |
| College or Associate's Degree | 1,731 (63.6%) | 991 (36.4%) |
| Bachelor's Degree | 2,258 (89.3%) | 271 (10.7%) |
| Graduate Degree | 1,116 (93.9%) | 73 (6.1%) |
| Total | 7,041 (73.0%) | 2,604 (27.0%) |
Employment Characteristics in Ventura County
Employment by Class of Employer in Ventura County
Among the 402,639 employed individuals in Ventura County, private company employees (273,183 | 67.8%), local government employees (34,840 | 8.6%), and self-employed (not incorporated) (29,509 | 7.3%) make up the most common classes of employment.
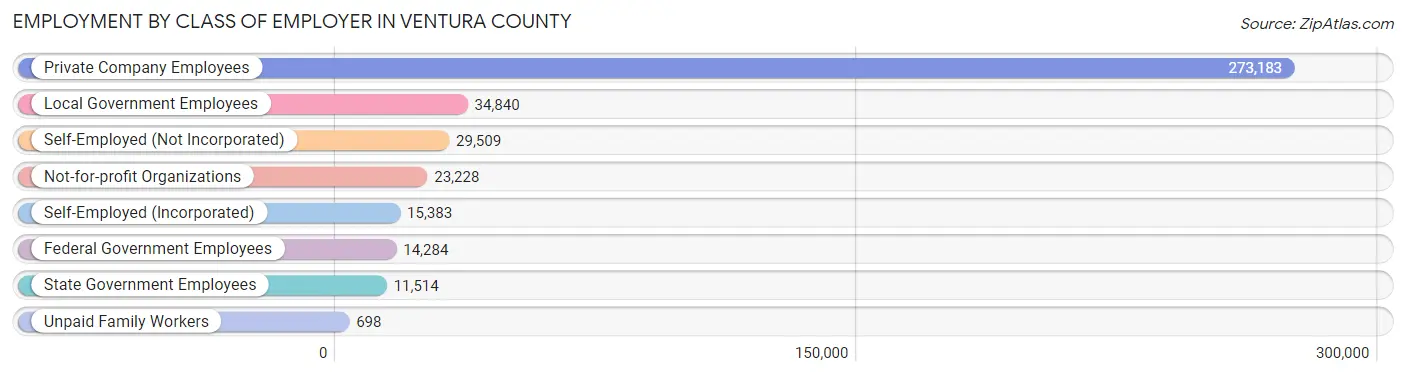
| Employer Class | # Employees | % Employees |
| Private Company Employees | 273,183 | 67.8% |
| Self-Employed (Incorporated) | 15,383 | 3.8% |
| Self-Employed (Not Incorporated) | 29,509 | 7.3% |
| Not-for-profit Organizations | 23,228 | 5.8% |
| Local Government Employees | 34,840 | 8.6% |
| State Government Employees | 11,514 | 2.9% |
| Federal Government Employees | 14,284 | 3.5% |
| Unpaid Family Workers | 698 | 0.2% |
| Total | 402,639 | 100.0% |
Employment Status by Age in Ventura County
According to the labor force statistics for Ventura County, out of the total population over 16 years of age (676,993), 64.5% or 436,660 individuals are in the labor force, with 5.3% or 23,143 of them unemployed. The age group with the highest labor force participation rate is 30 to 34 years, with 85.4% or 46,999 individuals in the labor force. Within the labor force, the 16 to 19 years age range has the highest percentage of unemployed individuals, with 12.3% or 1,884 of them being unemployed.
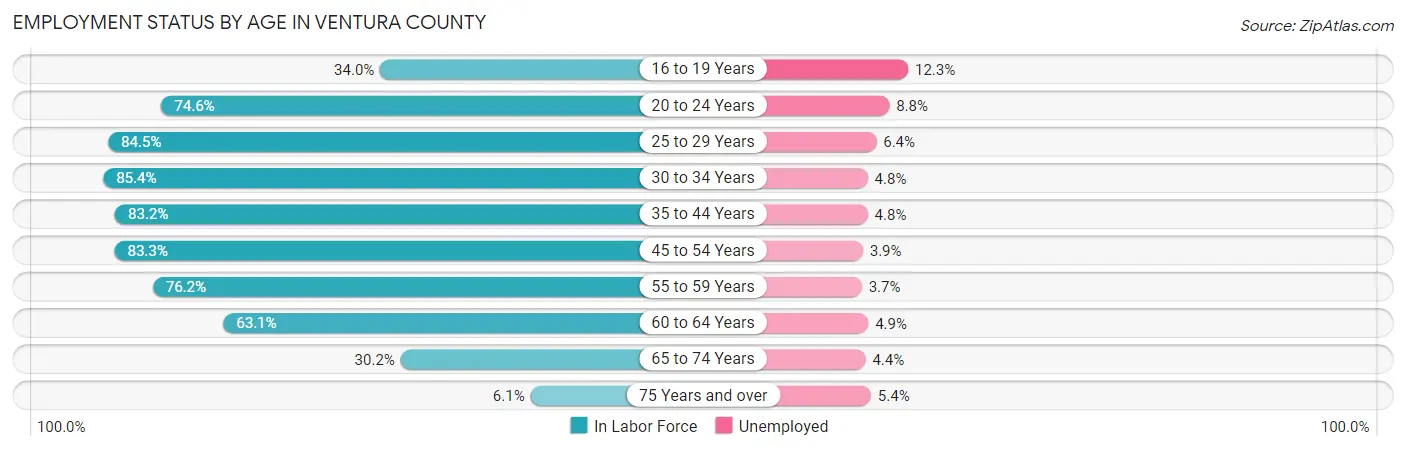
| Age Bracket | In Labor Force | Unemployed |
| 16 to 19 Years | 15,316 (34.0%) | 1,884 (12.3%) |
| 20 to 24 Years | 41,754 (74.6%) | 3,674 (8.8%) |
| 25 to 29 Years | 47,768 (84.5%) | 3,057 (6.4%) |
| 30 to 34 Years | 46,999 (85.4%) | 2,256 (4.8%) |
| 35 to 44 Years | 88,773 (83.2%) | 4,261 (4.8%) |
| 45 to 54 Years | 90,419 (83.3%) | 3,526 (3.9%) |
| 55 to 59 Years | 43,564 (76.2%) | 1,612 (3.7%) |
| 60 to 64 Years | 34,326 (63.1%) | 1,682 (4.9%) |
| 65 to 74 Years | 24,202 (30.2%) | 1,065 (4.4%) |
| 75 Years and over | 3,505 (6.1%) | 189 (5.4%) |
| Total | 436,660 (64.5%) | 23,143 (5.3%) |
Employment Status by Educational Attainment in Ventura County
According to labor force statistics for Ventura County, 80.3% of individuals (352,018) out of the total population between 25 and 64 years of age (438,378) are in the labor force, with 4.7% or 16,545 of them being unemployed. The group with the highest labor force participation rate are those with the educational attainment of bachelor's degree or higher, with 85.8% or 129,962 individuals in the labor force. Within the labor force, individuals with less than high school education have the highest percentage of unemployment, with 6.7% or 3,146 of them being unemployed.
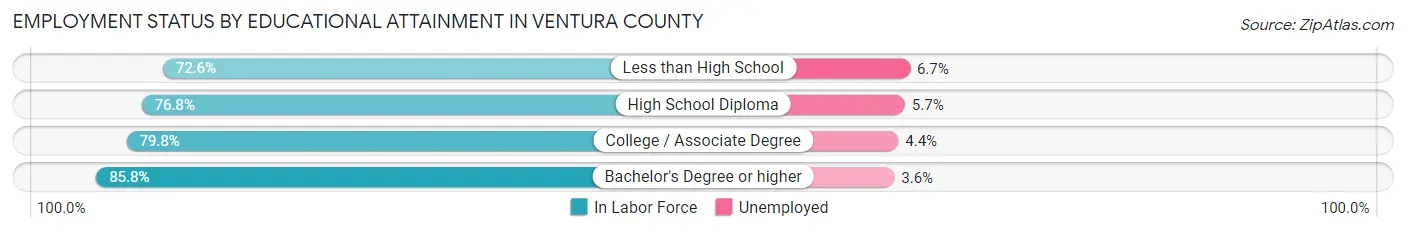
| Educational Attainment | In Labor Force | Unemployed |
| Less than High School | 46,950 (72.6%) | 4,333 (6.7%) |
| High School Diploma | 66,109 (76.8%) | 4,907 (5.7%) |
| College / Associate Degree | 108,654 (79.8%) | 5,991 (4.4%) |
| Bachelor's Degree or higher | 129,962 (85.8%) | 5,453 (3.6%) |
| Total | 352,018 (80.3%) | 20,604 (4.7%) |
Employment Occupations by Sex in Ventura County
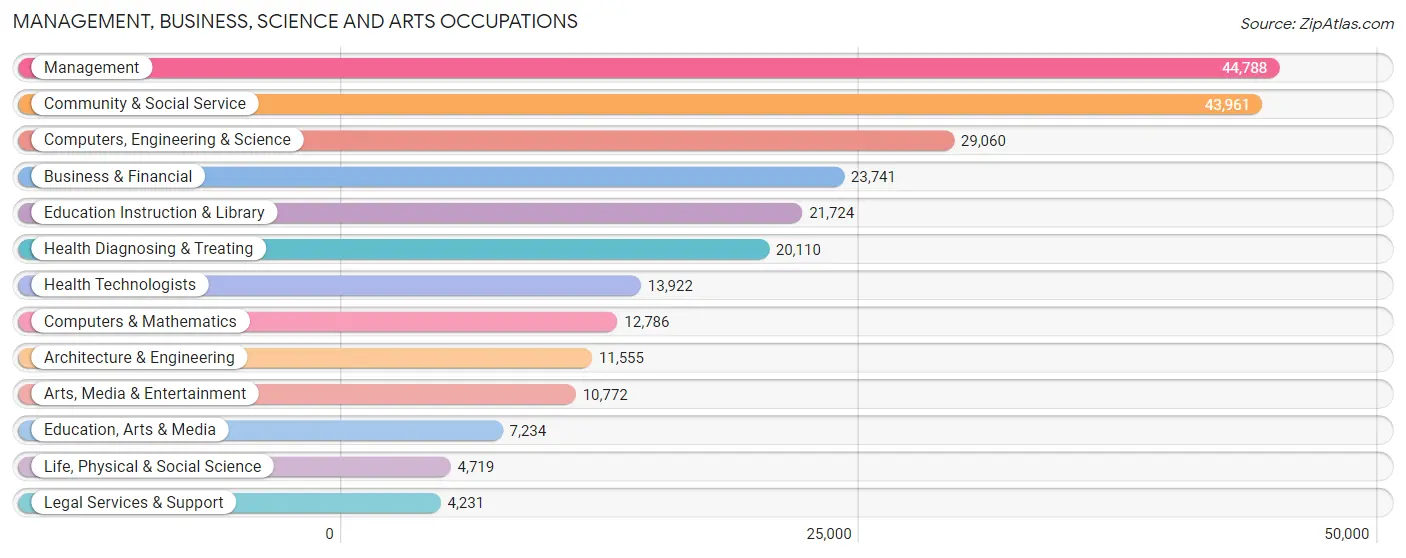
Management, Business, Science and Arts Occupations
The most common Management, Business, Science and Arts occupations in Ventura County are Management (44,788 | 10.9%), Community & Social Service (43,961 | 10.7%), Computers, Engineering & Science (29,060 | 7.1%), Business & Financial (23,741 | 5.8%), and Education Instruction & Library (21,724 | 5.3%).
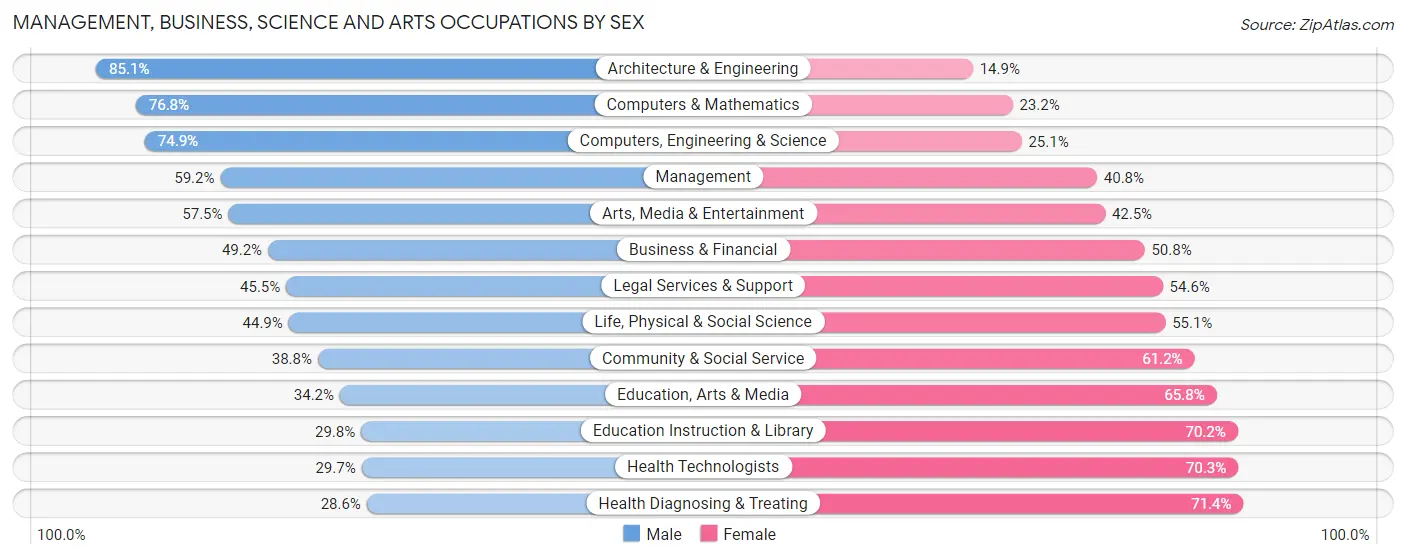
Management, Business, Science and Arts Occupations by Sex
Within the Management, Business, Science and Arts occupations in Ventura County, the most male-oriented occupations are Architecture & Engineering (85.1%), Computers & Mathematics (76.8%), and Computers, Engineering & Science (74.9%), while the most female-oriented occupations are Health Diagnosing & Treating (71.4%), Health Technologists (70.3%), and Education Instruction & Library (70.2%).
| Occupation | Male | Female |
| Management | 26,506 (59.2%) | 18,282 (40.8%) |
| Business & Financial | 11,691 (49.2%) | 12,050 (50.8%) |
| Computers, Engineering & Science | 21,767 (74.9%) | 7,293 (25.1%) |
| Computers & Mathematics | 9,817 (76.8%) | 2,969 (23.2%) |
| Architecture & Engineering | 9,830 (85.1%) | 1,725 (14.9%) |
| Life, Physical & Social Science | 2,120 (44.9%) | 2,599 (55.1%) |
| Community & Social Service | 17,070 (38.8%) | 26,891 (61.2%) |
| Education, Arts & Media | 2,476 (34.2%) | 4,758 (65.8%) |
| Legal Services & Support | 1,923 (45.5%) | 2,308 (54.5%) |
| Education Instruction & Library | 6,478 (29.8%) | 15,246 (70.2%) |
| Arts, Media & Entertainment | 6,193 (57.5%) | 4,579 (42.5%) |
| Health Diagnosing & Treating | 5,759 (28.6%) | 14,351 (71.4%) |
| Health Technologists | 4,138 (29.7%) | 9,784 (70.3%) |
| Total (Category) | 82,793 (51.2%) | 78,867 (48.8%) |
| Total (Overall) | 223,399 (54.6%) | 185,988 (45.4%) |
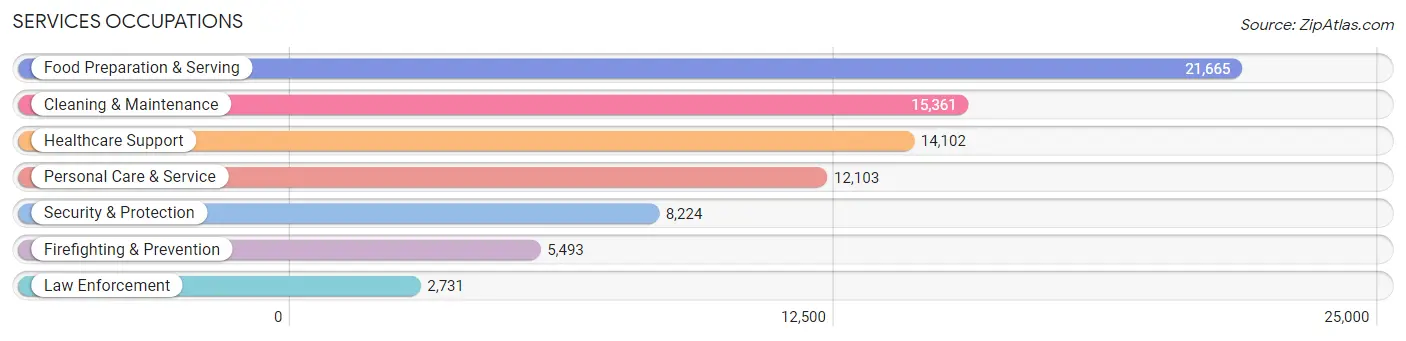
Services Occupations
The most common Services occupations in Ventura County are Food Preparation & Serving (21,665 | 5.3%), Cleaning & Maintenance (15,361 | 3.7%), Healthcare Support (14,102 | 3.4%), Personal Care & Service (12,103 | 3.0%), and Security & Protection (8,224 | 2.0%).
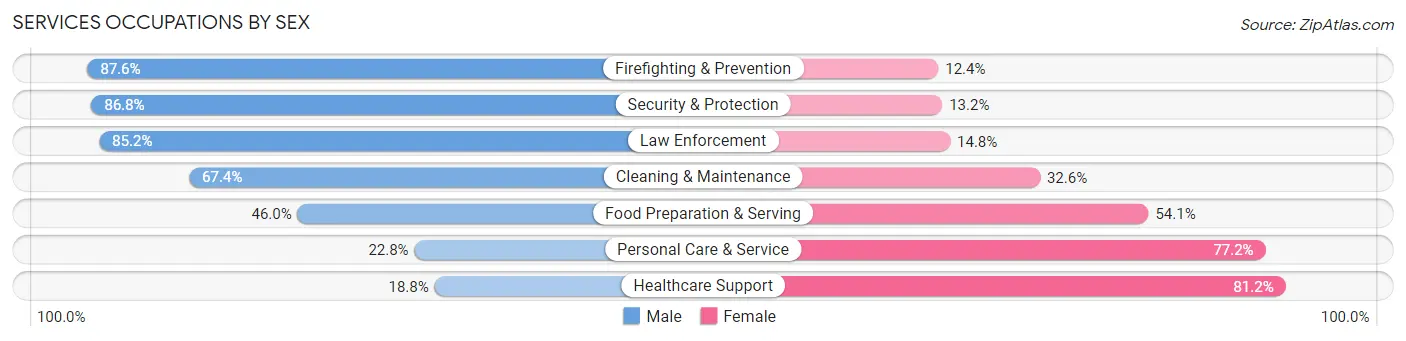
Services Occupations by Sex
Within the Services occupations in Ventura County, the most male-oriented occupations are Firefighting & Prevention (87.6%), Security & Protection (86.8%), and Law Enforcement (85.2%), while the most female-oriented occupations are Healthcare Support (81.2%), Personal Care & Service (77.2%), and Food Preparation & Serving (54.0%).
| Occupation | Male | Female |
| Healthcare Support | 2,656 (18.8%) | 11,446 (81.2%) |
| Security & Protection | 7,138 (86.8%) | 1,086 (13.2%) |
| Firefighting & Prevention | 4,810 (87.6%) | 683 (12.4%) |
| Law Enforcement | 2,328 (85.2%) | 403 (14.8%) |
| Food Preparation & Serving | 9,956 (46.0%) | 11,709 (54.0%) |
| Cleaning & Maintenance | 10,359 (67.4%) | 5,002 (32.6%) |
| Personal Care & Service | 2,760 (22.8%) | 9,343 (77.2%) |
| Total (Category) | 32,869 (46.0%) | 38,586 (54.0%) |
| Total (Overall) | 223,399 (54.6%) | 185,988 (45.4%) |
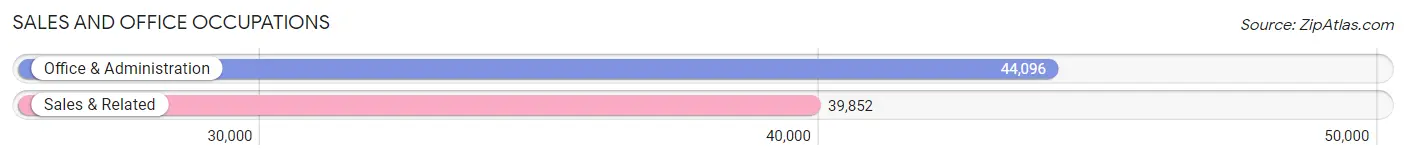
Sales and Office Occupations
The most common Sales and Office occupations in Ventura County are Office & Administration (44,096 | 10.8%), and Sales & Related (39,852 | 9.7%).
Sales and Office Occupations by Sex
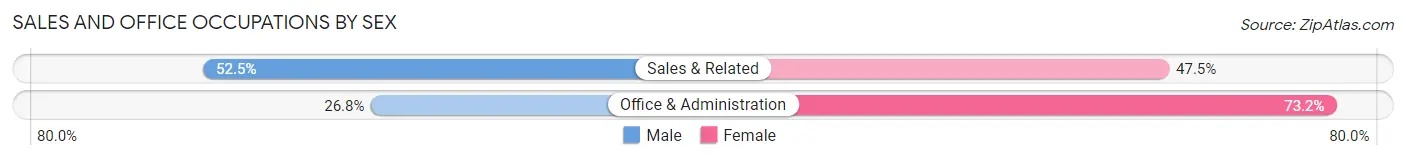
| Occupation | Male | Female |
| Sales & Related | 20,936 (52.5%) | 18,916 (47.5%) |
| Office & Administration | 11,821 (26.8%) | 32,275 (73.2%) |
| Total (Category) | 32,757 (39.0%) | 51,191 (61.0%) |
| Total (Overall) | 223,399 (54.6%) | 185,988 (45.4%) |
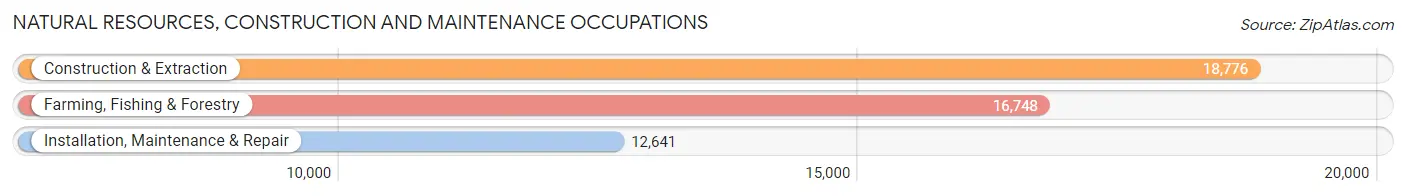
Natural Resources, Construction and Maintenance Occupations
The most common Natural Resources, Construction and Maintenance occupations in Ventura County are Construction & Extraction (18,776 | 4.6%), Farming, Fishing & Forestry (16,748 | 4.1%), and Installation, Maintenance & Repair (12,641 | 3.1%).
Natural Resources, Construction and Maintenance Occupations by Sex
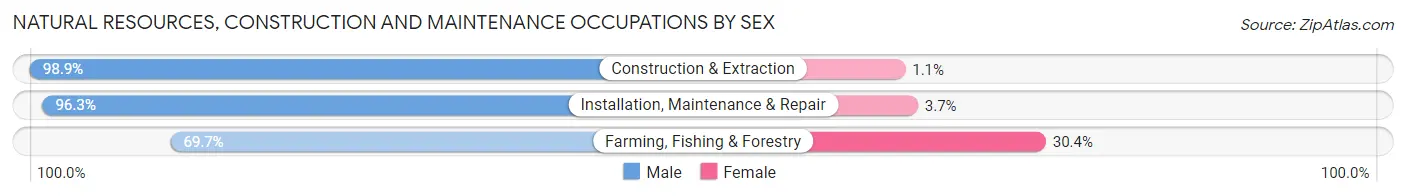
| Occupation | Male | Female |
| Farming, Fishing & Forestry | 11,665 (69.7%) | 5,083 (30.3%) |
| Construction & Extraction | 18,568 (98.9%) | 208 (1.1%) |
| Installation, Maintenance & Repair | 12,169 (96.3%) | 472 (3.7%) |
| Total (Category) | 42,402 (88.0%) | 5,763 (12.0%) |
| Total (Overall) | 223,399 (54.6%) | 185,988 (45.4%) |
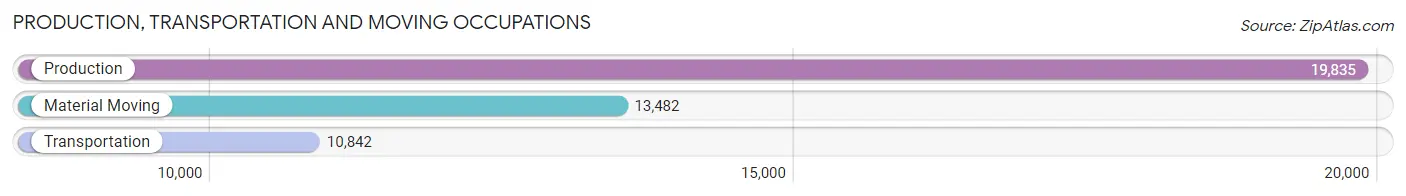
Production, Transportation and Moving Occupations
The most common Production, Transportation and Moving occupations in Ventura County are Production (19,835 | 4.9%), Material Moving (13,482 | 3.3%), and Transportation (10,842 | 2.6%).
Production, Transportation and Moving Occupations by Sex
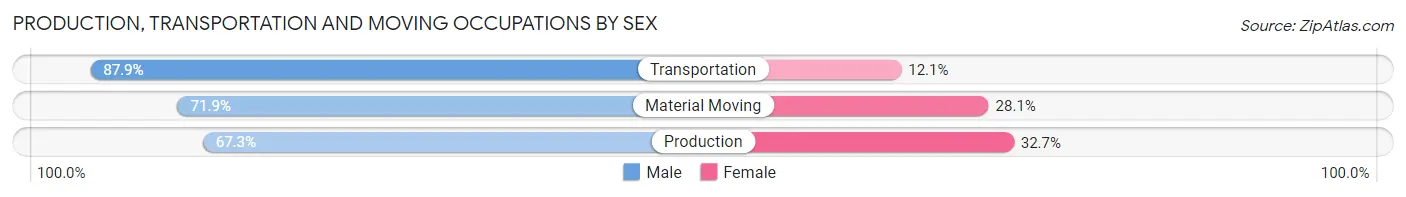
| Occupation | Male | Female |
| Production | 13,349 (67.3%) | 6,486 (32.7%) |
| Transportation | 9,534 (87.9%) | 1,308 (12.1%) |
| Material Moving | 9,695 (71.9%) | 3,787 (28.1%) |
| Total (Category) | 32,578 (73.8%) | 11,581 (26.2%) |
| Total (Overall) | 223,399 (54.6%) | 185,988 (45.4%) |
Employment Industries by Sex in Ventura County
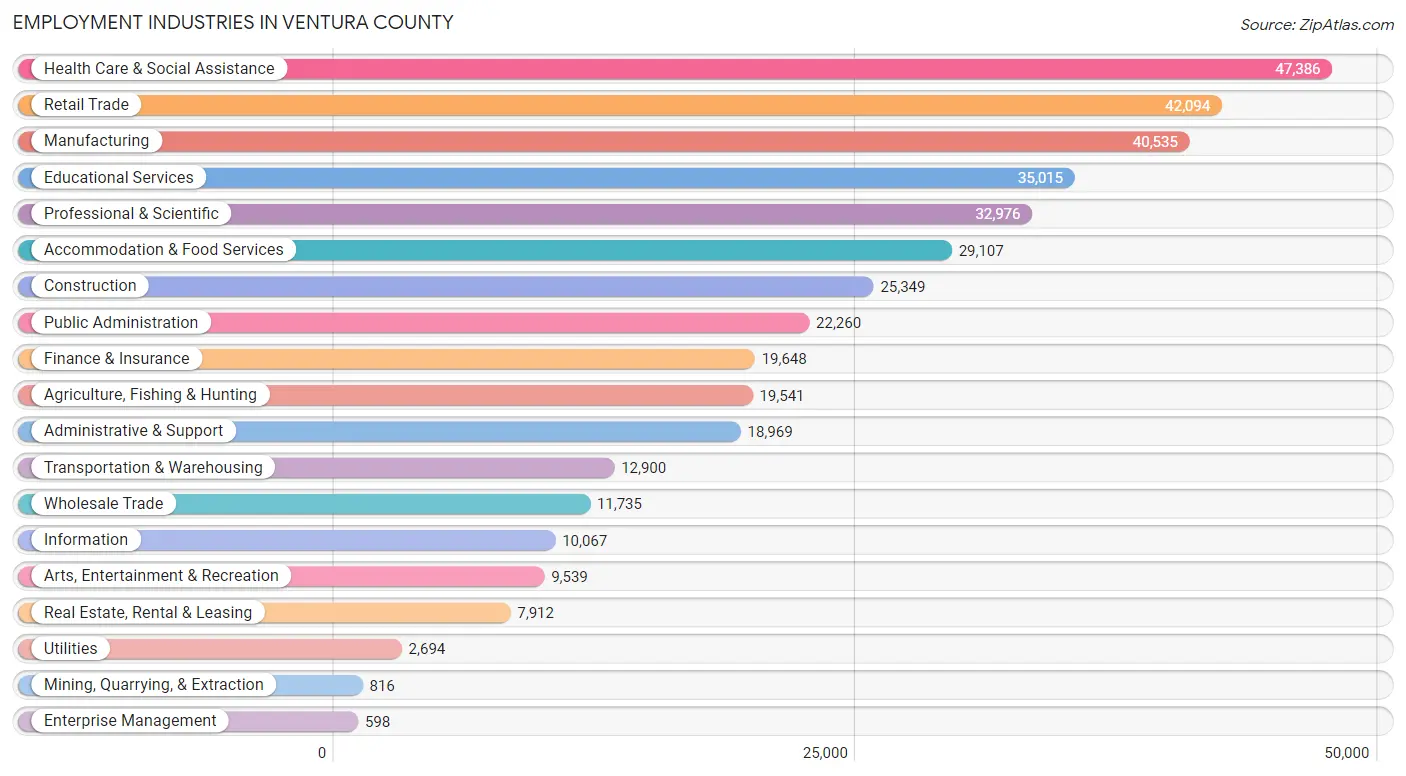
Employment Industries in Ventura County
The major employment industries in Ventura County include Health Care & Social Assistance (47,386 | 11.6%), Retail Trade (42,094 | 10.3%), Manufacturing (40,535 | 9.9%), Educational Services (35,015 | 8.6%), and Professional & Scientific (32,976 | 8.1%).
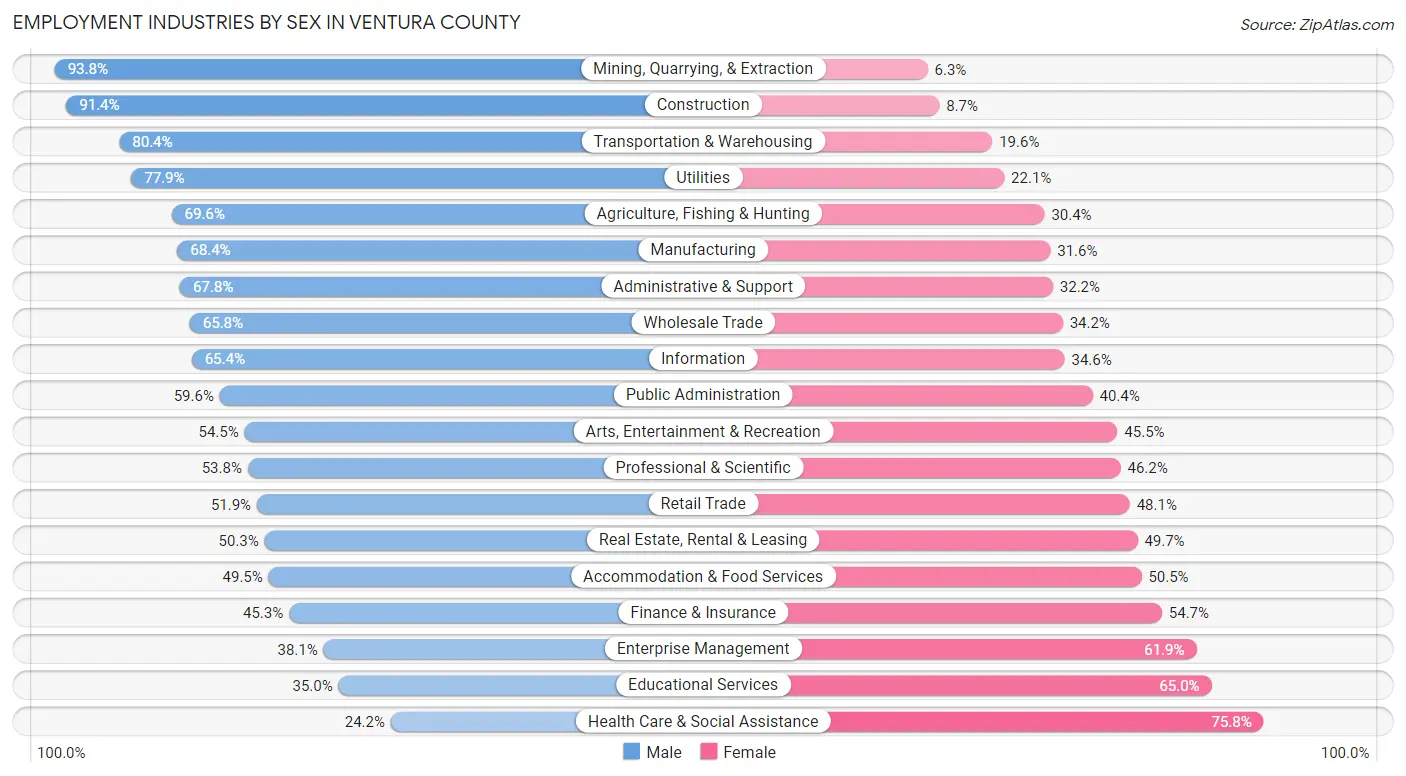
Employment Industries by Sex in Ventura County
The Ventura County industries that see more men than women are Mining, Quarrying, & Extraction (93.8%), Construction (91.3%), and Transportation & Warehousing (80.4%), whereas the industries that tend to have a higher number of women are Health Care & Social Assistance (75.8%), Educational Services (65.0%), and Enterprise Management (61.9%).
| Industry | Male | Female |
| Agriculture, Fishing & Hunting | 13,595 (69.6%) | 5,946 (30.4%) |
| Mining, Quarrying, & Extraction | 765 (93.8%) | 51 (6.2%) |
| Construction | 23,156 (91.3%) | 2,193 (8.6%) |
| Manufacturing | 27,710 (68.4%) | 12,825 (31.6%) |
| Wholesale Trade | 7,720 (65.8%) | 4,015 (34.2%) |
| Retail Trade | 21,852 (51.9%) | 20,242 (48.1%) |
| Transportation & Warehousing | 10,369 (80.4%) | 2,531 (19.6%) |
| Utilities | 2,099 (77.9%) | 595 (22.1%) |
| Information | 6,584 (65.4%) | 3,483 (34.6%) |
| Finance & Insurance | 8,892 (45.3%) | 10,756 (54.7%) |
| Real Estate, Rental & Leasing | 3,981 (50.3%) | 3,931 (49.7%) |
| Professional & Scientific | 17,745 (53.8%) | 15,231 (46.2%) |
| Enterprise Management | 228 (38.1%) | 370 (61.9%) |
| Administrative & Support | 12,867 (67.8%) | 6,102 (32.2%) |
| Educational Services | 12,260 (35.0%) | 22,755 (65.0%) |
| Health Care & Social Assistance | 11,474 (24.2%) | 35,912 (75.8%) |
| Arts, Entertainment & Recreation | 5,196 (54.5%) | 4,343 (45.5%) |
| Accommodation & Food Services | 14,406 (49.5%) | 14,701 (50.5%) |
| Public Administration | 13,270 (59.6%) | 8,990 (40.4%) |
| Total | 223,399 (54.6%) | 185,988 (45.4%) |
Education in Ventura County
School Enrollment in Ventura County
The most common levels of schooling among the 212,822 students in Ventura County are college / undergraduate (52,124 | 24.5%), high school (48,106 | 22.6%), and middle school (43,536 | 20.5%).
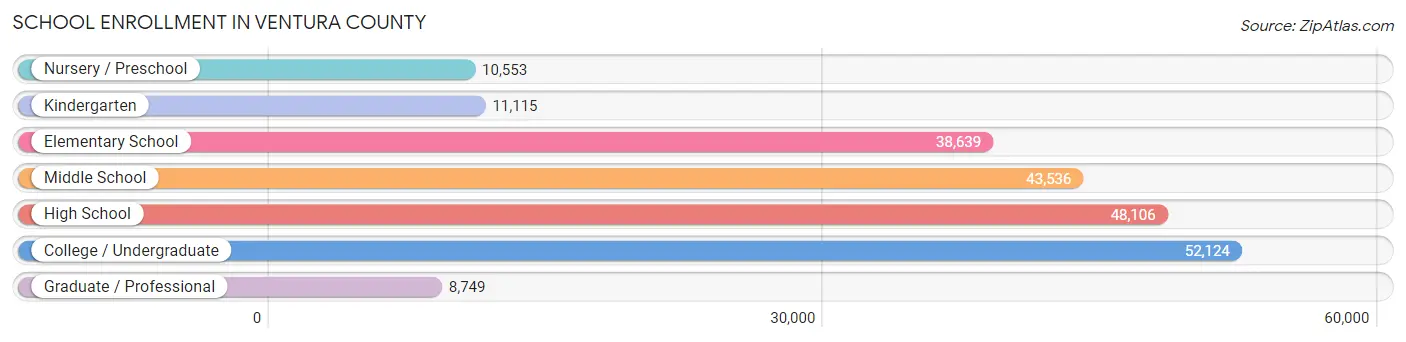
| School Level | # Students | % Students |
| Nursery / Preschool | 10,553 | 5.0% |
| Kindergarten | 11,115 | 5.2% |
| Elementary School | 38,639 | 18.2% |
| Middle School | 43,536 | 20.5% |
| High School | 48,106 | 22.6% |
| College / Undergraduate | 52,124 | 24.5% |
| Graduate / Professional | 8,749 | 4.1% |
| Total | 212,822 | 100.0% |
School Enrollment by Age by Funding Source in Ventura County
Out of a total of 212,822 students who are enrolled in schools in Ventura County, 30,646 (14.4%) attend a private institution, while the remaining 182,176 (85.6%) are enrolled in public schools. The age group of 3 to 4 year olds has the highest likelihood of being enrolled in private schools, with 4,101 (50.3% in the age bracket) enrolled. Conversely, the age group of 15 to 17 year olds has the lowest likelihood of being enrolled in a private school, with 31,082 (92.3% in the age bracket) attending a public institution.
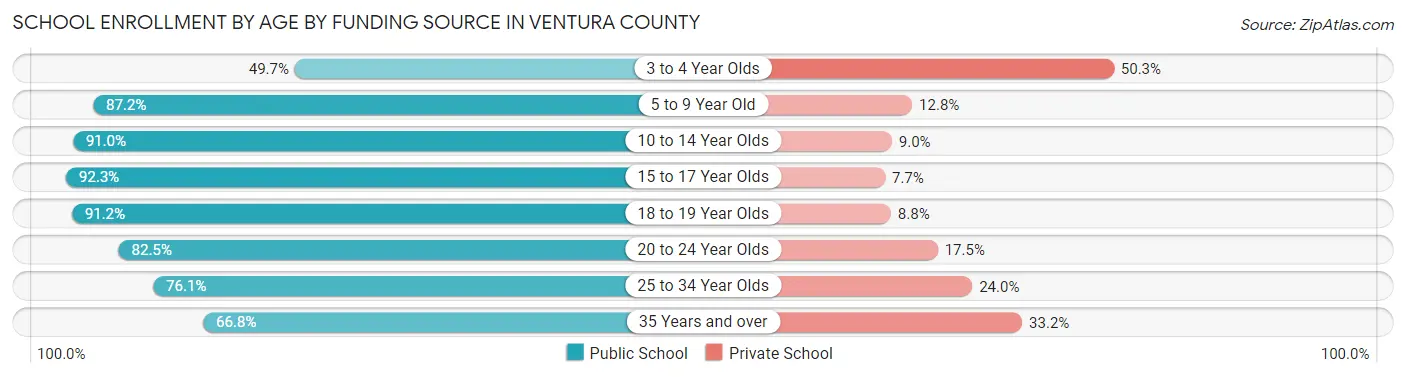
| Age Bracket | Public School | Private School |
| 3 to 4 Year Olds | 4,047 (49.7%) | 4,101 (50.3%) |
| 5 to 9 Year Old | 41,784 (87.2%) | 6,114 (12.8%) |
| 10 to 14 Year Olds | 50,864 (91.0%) | 5,011 (9.0%) |
| 15 to 17 Year Olds | 31,082 (92.3%) | 2,594 (7.7%) |
| 18 to 19 Year Olds | 15,509 (91.2%) | 1,496 (8.8%) |
| 20 to 24 Year Olds | 21,743 (82.5%) | 4,618 (17.5%) |
| 25 to 34 Year Olds | 10,404 (76.0%) | 3,276 (23.9%) |
| 35 Years and over | 6,796 (66.8%) | 3,383 (33.2%) |
| Total | 182,176 (85.6%) | 30,646 (14.4%) |
Educational Attainment by Field of Study in Ventura County
Business (37,752 | 17.7%), social sciences (21,327 | 10.0%), engineering (19,592 | 9.2%), science & technology (18,062 | 8.5%), and education (14,993 | 7.0%) are the most common fields of study among 213,342 individuals in Ventura County who have obtained a bachelor's degree or higher.
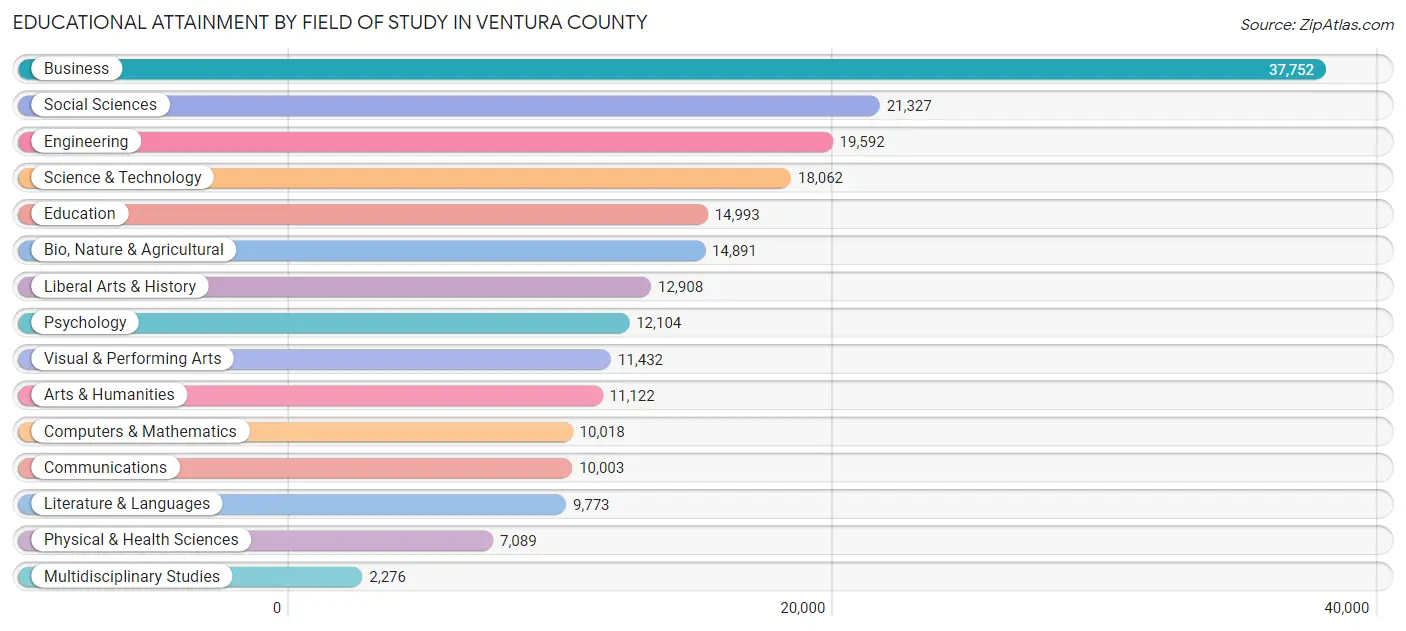
| Field of Study | # Graduates | % Graduates |
| Computers & Mathematics | 10,018 | 4.7% |
| Bio, Nature & Agricultural | 14,891 | 7.0% |
| Physical & Health Sciences | 7,089 | 3.3% |
| Psychology | 12,104 | 5.7% |
| Social Sciences | 21,327 | 10.0% |
| Engineering | 19,592 | 9.2% |
| Multidisciplinary Studies | 2,276 | 1.1% |
| Science & Technology | 18,062 | 8.5% |
| Business | 37,752 | 17.7% |
| Education | 14,993 | 7.0% |
| Literature & Languages | 9,773 | 4.6% |
| Liberal Arts & History | 12,908 | 6.0% |
| Visual & Performing Arts | 11,432 | 5.4% |
| Communications | 10,003 | 4.7% |
| Arts & Humanities | 11,122 | 5.2% |
| Total | 213,342 | 100.0% |
Transportation & Commute in Ventura County
Vehicle Availability by Sex in Ventura County
The most prevalent vehicle ownership categories in Ventura County are males with 2 vehicles (80,212, accounting for 36.7%) and females with 2 vehicles (63,850, making up 44.8%).
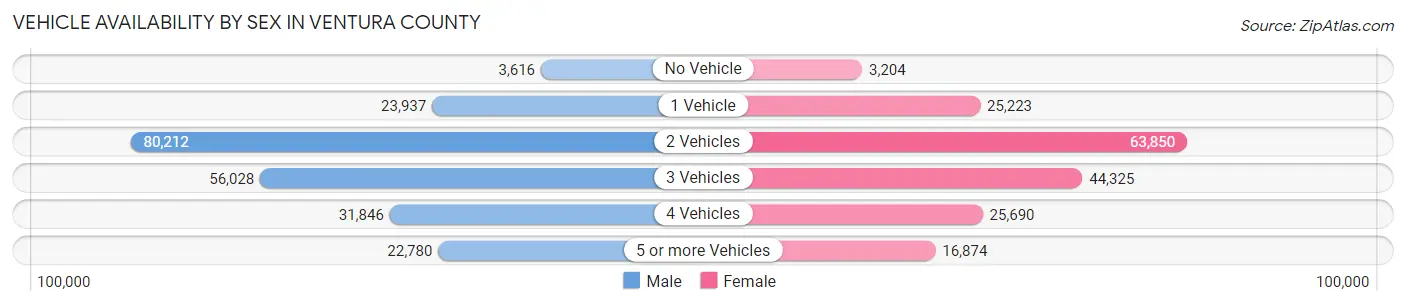
| Vehicles Available | Male | Female |
| No Vehicle | 3,616 (1.7%) | 3,204 (1.8%) |
| 1 Vehicle | 23,937 (11.0%) | 25,223 (14.1%) |
| 2 Vehicles | 80,212 (36.7%) | 63,850 (35.6%) |
| 3 Vehicles | 56,028 (25.7%) | 44,325 (24.7%) |
| 4 Vehicles | 31,846 (14.6%) | 25,690 (14.3%) |
| 5 or more Vehicles | 22,780 (10.4%) | 16,874 (9.4%) |
| Total | 218,419 (100.0%) | 179,166 (100.0%) |
Commute Time in Ventura County
The most frequently occuring commute durations in Ventura County are 25 to 29 minutes (60,652 commuters, 17.2%), 15 to 19 minutes (49,477 commuters, 14.0%), and 10 to 14 minutes (48,481 commuters, 13.8%).
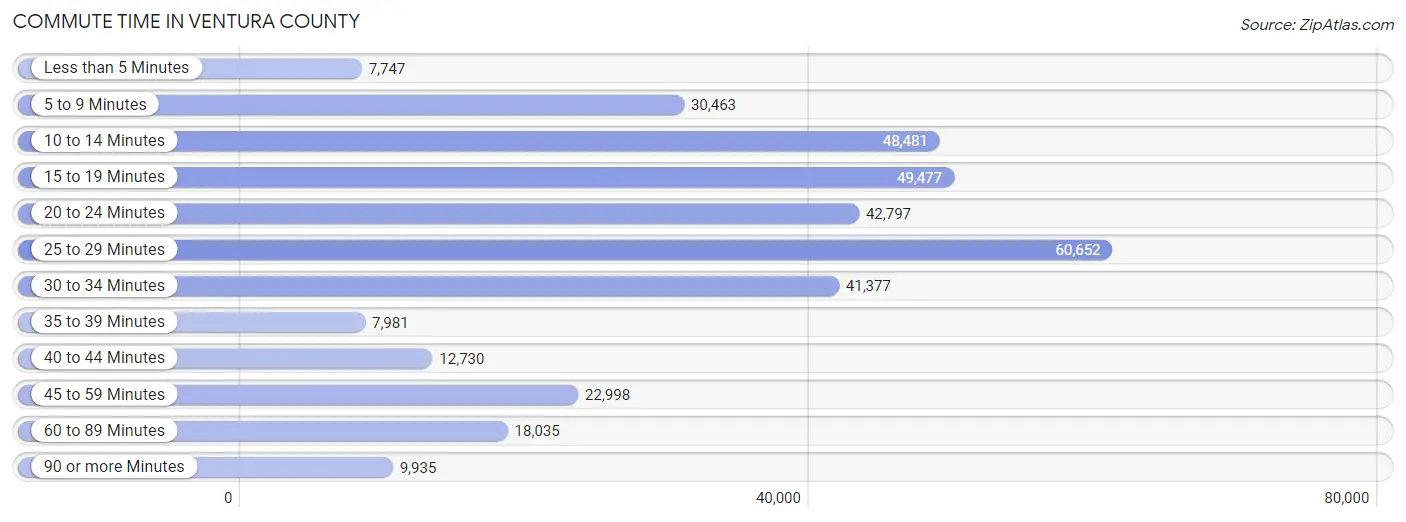
| Commute Time | # Commuters | % Commuters |
| Less than 5 Minutes | 7,747 | 2.2% |
| 5 to 9 Minutes | 30,463 | 8.6% |
| 10 to 14 Minutes | 48,481 | 13.8% |
| 15 to 19 Minutes | 49,477 | 14.0% |
| 20 to 24 Minutes | 42,797 | 12.1% |
| 25 to 29 Minutes | 60,652 | 17.2% |
| 30 to 34 Minutes | 41,377 | 11.7% |
| 35 to 39 Minutes | 7,981 | 2.3% |
| 40 to 44 Minutes | 12,730 | 3.6% |
| 45 to 59 Minutes | 22,998 | 6.5% |
| 60 to 89 Minutes | 18,035 | 5.1% |
| 90 or more Minutes | 9,935 | 2.8% |
Commute Time by Sex in Ventura County
The most common commute times in Ventura County are 25 to 29 minutes (37,221 commuters, 18.8%) for males and 10 to 14 minutes (24,286 commuters, 15.7%) for females.
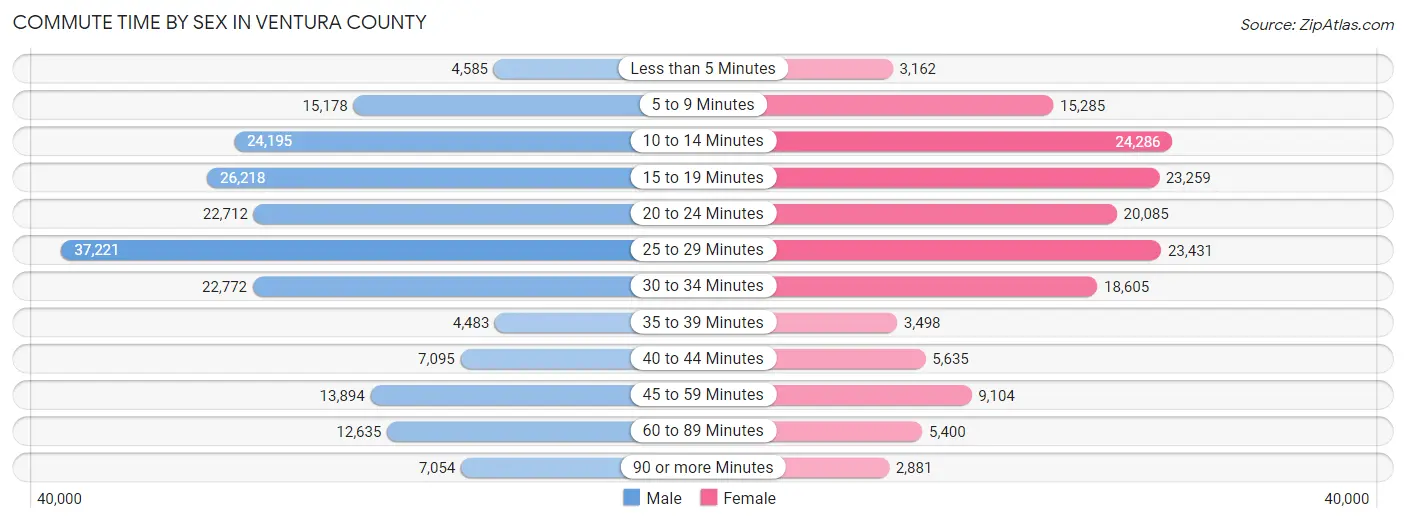
| Commute Time | Male | Female |
| Less than 5 Minutes | 4,585 (2.3%) | 3,162 (2.0%) |
| 5 to 9 Minutes | 15,178 (7.7%) | 15,285 (9.9%) |
| 10 to 14 Minutes | 24,195 (12.2%) | 24,286 (15.7%) |
| 15 to 19 Minutes | 26,218 (13.2%) | 23,259 (15.0%) |
| 20 to 24 Minutes | 22,712 (11.5%) | 20,085 (13.0%) |
| 25 to 29 Minutes | 37,221 (18.8%) | 23,431 (15.1%) |
| 30 to 34 Minutes | 22,772 (11.5%) | 18,605 (12.0%) |
| 35 to 39 Minutes | 4,483 (2.3%) | 3,498 (2.3%) |
| 40 to 44 Minutes | 7,095 (3.6%) | 5,635 (3.6%) |
| 45 to 59 Minutes | 13,894 (7.0%) | 9,104 (5.9%) |
| 60 to 89 Minutes | 12,635 (6.4%) | 5,400 (3.5%) |
| 90 or more Minutes | 7,054 (3.6%) | 2,881 (1.9%) |
Time of Departure to Work by Sex in Ventura County
The most frequent times of departure to work in Ventura County are 7:00 AM to 7:29 AM (24,890, 12.6%) for males and 7:30 AM to 7:59 AM (21,936, 14.2%) for females.
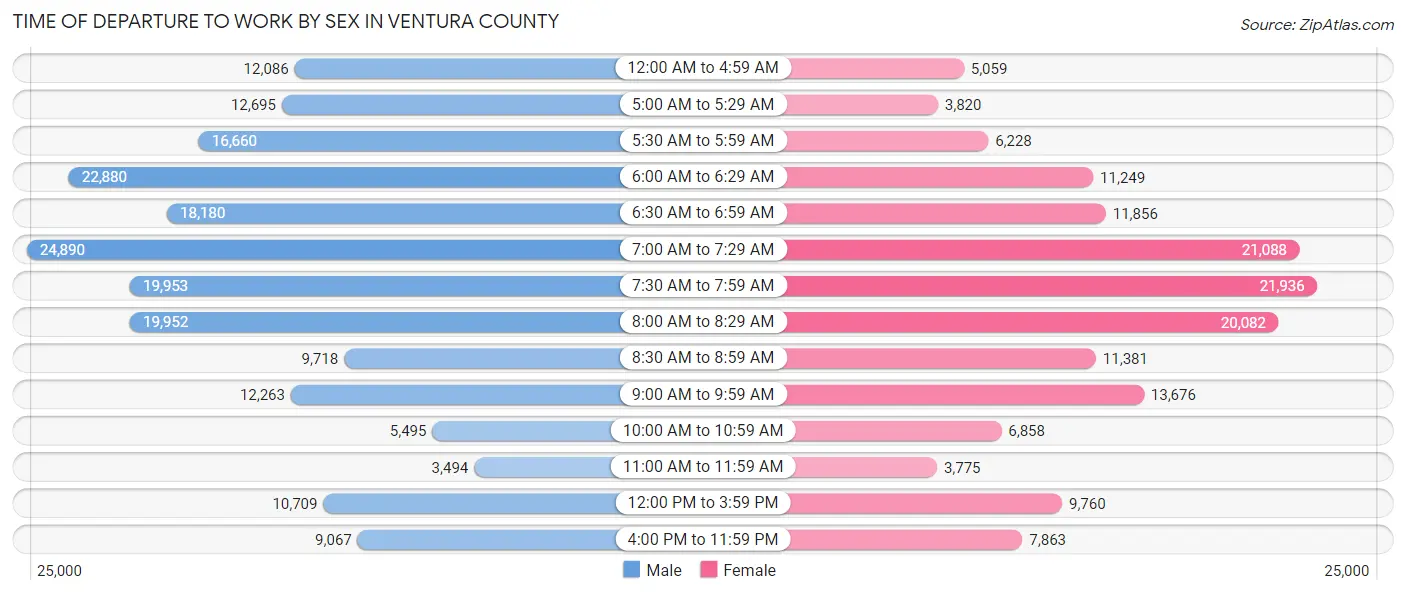
| Time of Departure | Male | Female |
| 12:00 AM to 4:59 AM | 12,086 (6.1%) | 5,059 (3.3%) |
| 5:00 AM to 5:29 AM | 12,695 (6.4%) | 3,820 (2.5%) |
| 5:30 AM to 5:59 AM | 16,660 (8.4%) | 6,228 (4.0%) |
| 6:00 AM to 6:29 AM | 22,880 (11.6%) | 11,249 (7.3%) |
| 6:30 AM to 6:59 AM | 18,180 (9.2%) | 11,856 (7.7%) |
| 7:00 AM to 7:29 AM | 24,890 (12.6%) | 21,088 (13.6%) |
| 7:30 AM to 7:59 AM | 19,953 (10.1%) | 21,936 (14.2%) |
| 8:00 AM to 8:29 AM | 19,952 (10.1%) | 20,082 (13.0%) |
| 8:30 AM to 8:59 AM | 9,718 (4.9%) | 11,381 (7.4%) |
| 9:00 AM to 9:59 AM | 12,263 (6.2%) | 13,676 (8.8%) |
| 10:00 AM to 10:59 AM | 5,495 (2.8%) | 6,858 (4.4%) |
| 11:00 AM to 11:59 AM | 3,494 (1.8%) | 3,775 (2.4%) |
| 12:00 PM to 3:59 PM | 10,709 (5.4%) | 9,760 (6.3%) |
| 4:00 PM to 11:59 PM | 9,067 (4.6%) | 7,863 (5.1%) |
| Total | 198,042 (100.0%) | 154,631 (100.0%) |
Housing Occupancy in Ventura County
Occupancy by Ownership in Ventura County
Of the total 275,653 dwellings in Ventura County, owner-occupied units account for 176,575 (64.1%), while renter-occupied units make up 99,078 (35.9%).
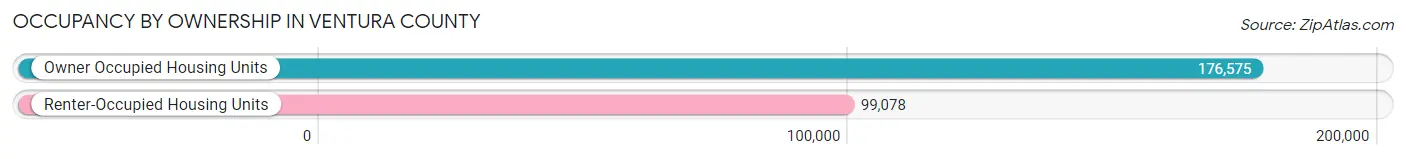
| Occupancy | # Housing Units | % Housing Units |
| Owner Occupied Housing Units | 176,575 | 64.1% |
| Renter-Occupied Housing Units | 99,078 | 35.9% |
| Total Occupied Housing Units | 275,653 | 100.0% |
Occupancy by Household Size in Ventura County
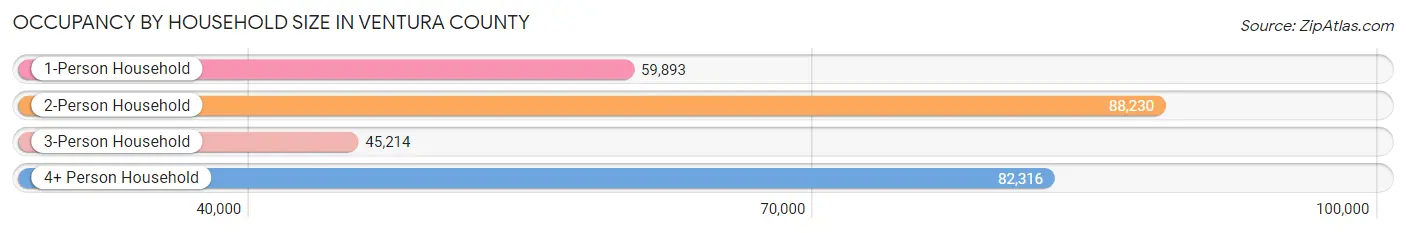
| Household Size | # Housing Units | % Housing Units |
| 1-Person Household | 59,893 | 21.7% |
| 2-Person Household | 88,230 | 32.0% |
| 3-Person Household | 45,214 | 16.4% |
| 4+ Person Household | 82,316 | 29.9% |
| Total Housing Units | 275,653 | 100.0% |
Occupancy by Ownership by Household Size in Ventura County
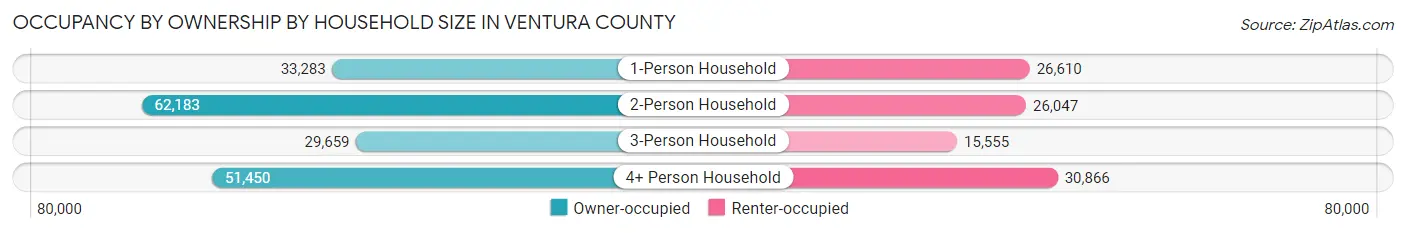
| Household Size | Owner-occupied | Renter-occupied |
| 1-Person Household | 33,283 (55.6%) | 26,610 (44.4%) |
| 2-Person Household | 62,183 (70.5%) | 26,047 (29.5%) |
| 3-Person Household | 29,659 (65.6%) | 15,555 (34.4%) |
| 4+ Person Household | 51,450 (62.5%) | 30,866 (37.5%) |
| Total Housing Units | 176,575 (64.1%) | 99,078 (35.9%) |
Occupancy by Educational Attainment in Ventura County
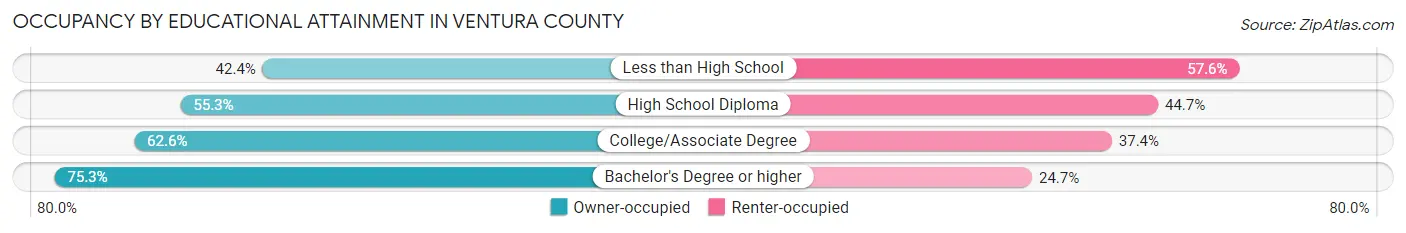
| Household Size | Owner-occupied | Renter-occupied |
| Less than High School | 13,444 (42.4%) | 18,263 (57.6%) |
| High School Diploma | 24,785 (55.3%) | 20,046 (44.7%) |
| College/Associate Degree | 57,054 (62.6%) | 34,063 (37.4%) |
| Bachelor's Degree or higher | 81,292 (75.3%) | 26,706 (24.7%) |
Occupancy by Age of Householder in Ventura County
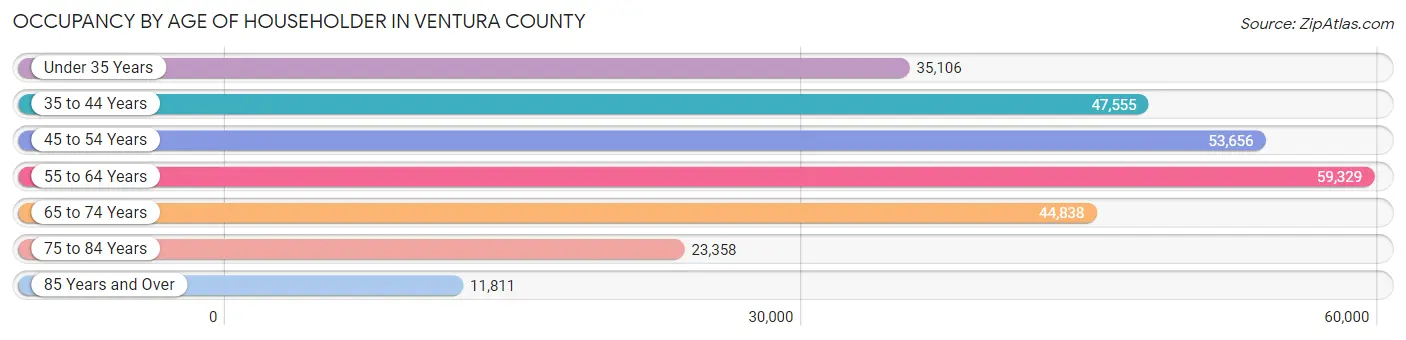
| Age Bracket | # Households | % Households |
| Under 35 Years | 35,106 | 12.7% |
| 35 to 44 Years | 47,555 | 17.2% |
| 45 to 54 Years | 53,656 | 19.5% |
| 55 to 64 Years | 59,329 | 21.5% |
| 65 to 74 Years | 44,838 | 16.3% |
| 75 to 84 Years | 23,358 | 8.5% |
| 85 Years and Over | 11,811 | 4.3% |
| Total | 275,653 | 100.0% |
Housing Finances in Ventura County
Median Income by Occupancy in Ventura County
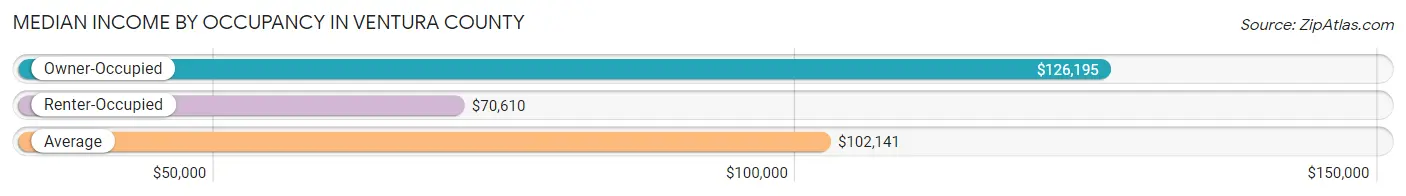
| Occupancy Type | # Households | Median Income |
| Owner-Occupied | 176,575 (64.1%) | $126,195 |
| Renter-Occupied | 99,078 (35.9%) | $70,610 |
| Average | 275,653 (100.0%) | $102,141 |
Occupancy by Householder Income Bracket in Ventura County
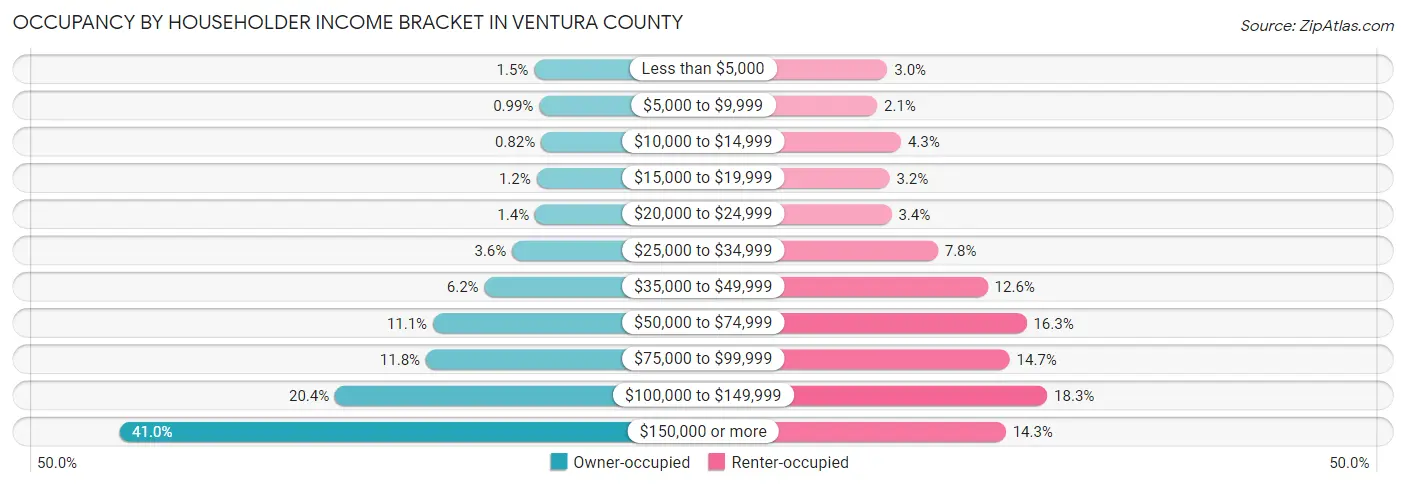
| Income Bracket | Owner-occupied | Renter-occupied |
| Less than $5,000 | 2,597 (1.5%) | 3,003 (3.0%) |
| $5,000 to $9,999 | 1,752 (1.0%) | 2,035 (2.1%) |
| $10,000 to $14,999 | 1,440 (0.8%) | 4,293 (4.3%) |
| $15,000 to $19,999 | 2,181 (1.2%) | 3,215 (3.2%) |
| $20,000 to $24,999 | 2,446 (1.4%) | 3,386 (3.4%) |
| $25,000 to $34,999 | 6,297 (3.6%) | 7,762 (7.8%) |
| $35,000 to $49,999 | 10,971 (6.2%) | 12,467 (12.6%) |
| $50,000 to $74,999 | 19,618 (11.1%) | 16,131 (16.3%) |
| $75,000 to $99,999 | 20,793 (11.8%) | 14,542 (14.7%) |
| $100,000 to $149,999 | 36,076 (20.4%) | 18,079 (18.2%) |
| $150,000 or more | 72,404 (41.0%) | 14,165 (14.3%) |
| Total | 176,575 (100.0%) | 99,078 (100.0%) |
Monthly Housing Cost Tiers in Ventura County
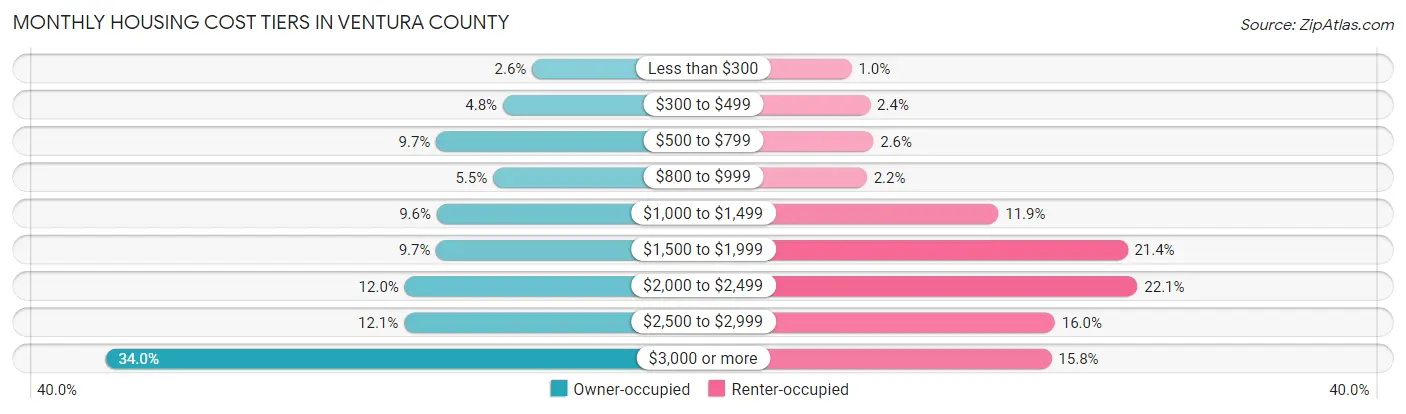
| Monthly Cost | Owner-occupied | Renter-occupied |
| Less than $300 | 4,621 (2.6%) | 1,034 (1.0%) |
| $300 to $499 | 8,425 (4.8%) | 2,388 (2.4%) |
| $500 to $799 | 17,114 (9.7%) | 2,617 (2.6%) |
| $800 to $999 | 9,706 (5.5%) | 2,137 (2.2%) |
| $1,000 to $1,499 | 17,021 (9.6%) | 11,739 (11.8%) |
| $1,500 to $1,999 | 17,101 (9.7%) | 21,166 (21.4%) |
| $2,000 to $2,499 | 21,214 (12.0%) | 21,883 (22.1%) |
| $2,500 to $2,999 | 21,269 (12.0%) | 15,865 (16.0%) |
| $3,000 or more | 60,104 (34.0%) | 15,615 (15.8%) |
| Total | 176,575 (100.0%) | 99,078 (100.0%) |
Physical Housing Characteristics in Ventura County
Housing Structures in Ventura County
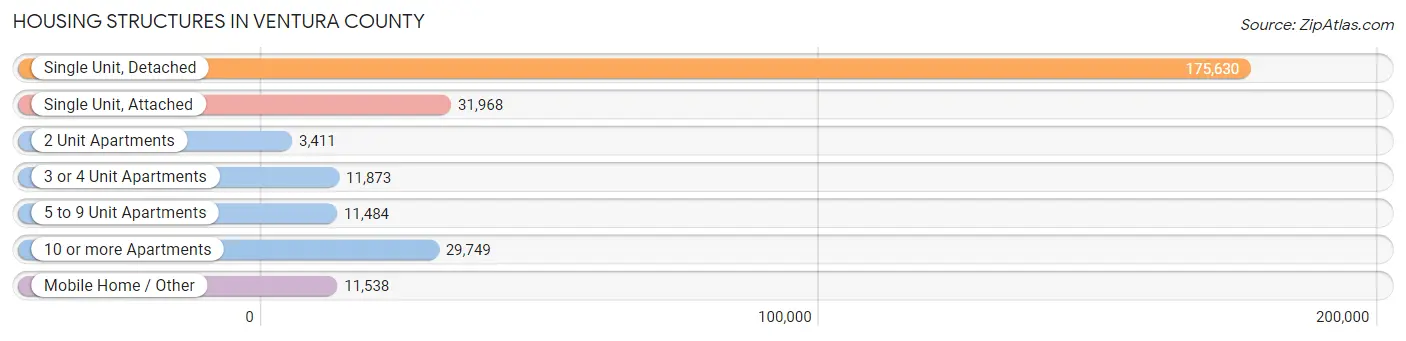
| Structure Type | # Housing Units | % Housing Units |
| Single Unit, Detached | 175,630 | 63.7% |
| Single Unit, Attached | 31,968 | 11.6% |
| 2 Unit Apartments | 3,411 | 1.2% |
| 3 or 4 Unit Apartments | 11,873 | 4.3% |
| 5 to 9 Unit Apartments | 11,484 | 4.2% |
| 10 or more Apartments | 29,749 | 10.8% |
| Mobile Home / Other | 11,538 | 4.2% |
| Total | 275,653 | 100.0% |
Housing Structures by Occupancy in Ventura County
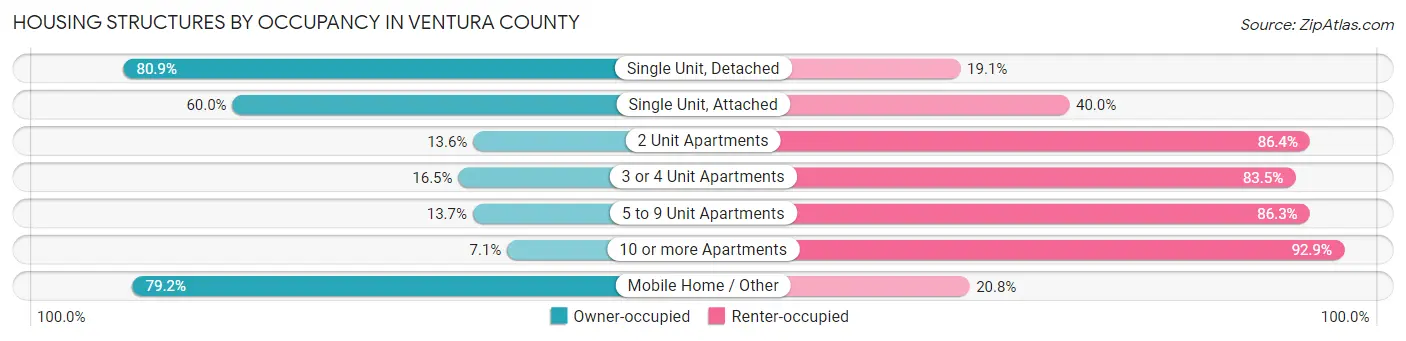
| Structure Type | Owner-occupied | Renter-occupied |
| Single Unit, Detached | 142,158 (80.9%) | 33,472 (19.1%) |
| Single Unit, Attached | 19,176 (60.0%) | 12,792 (40.0%) |
| 2 Unit Apartments | 465 (13.6%) | 2,946 (86.4%) |
| 3 or 4 Unit Apartments | 1,957 (16.5%) | 9,916 (83.5%) |
| 5 to 9 Unit Apartments | 1,573 (13.7%) | 9,911 (86.3%) |
| 10 or more Apartments | 2,108 (7.1%) | 27,641 (92.9%) |
| Mobile Home / Other | 9,138 (79.2%) | 2,400 (20.8%) |
| Total | 176,575 (64.1%) | 99,078 (35.9%) |
Housing Structures by Number of Rooms in Ventura County
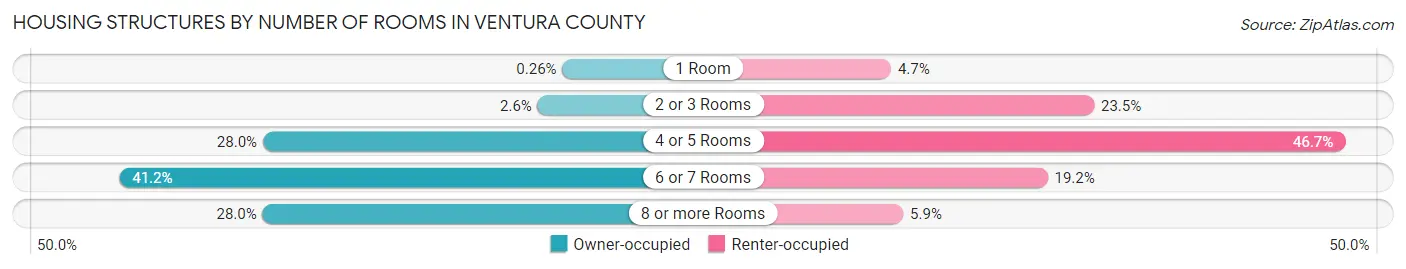
| Number of Rooms | Owner-occupied | Renter-occupied |
| 1 Room | 464 (0.3%) | 4,680 (4.7%) |
| 2 or 3 Rooms | 4,504 (2.5%) | 23,286 (23.5%) |
| 4 or 5 Rooms | 49,362 (28.0%) | 46,289 (46.7%) |
| 6 or 7 Rooms | 72,820 (41.2%) | 19,025 (19.2%) |
| 8 or more Rooms | 49,425 (28.0%) | 5,798 (5.9%) |
| Total | 176,575 (100.0%) | 99,078 (100.0%) |
Housing Structure by Heating Type in Ventura County
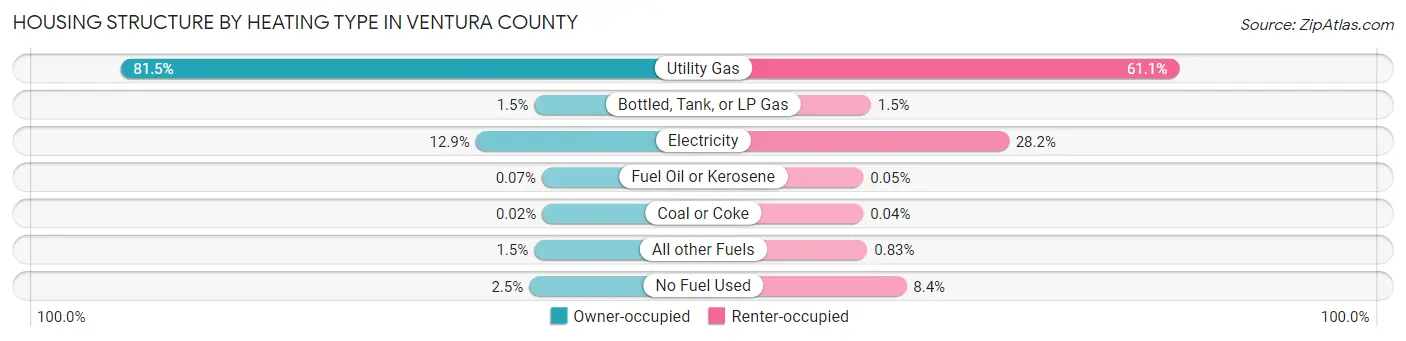
| Heating Type | Owner-occupied | Renter-occupied |
| Utility Gas | 143,896 (81.5%) | 60,486 (61.1%) |
| Bottled, Tank, or LP Gas | 2,648 (1.5%) | 1,497 (1.5%) |
| Electricity | 22,713 (12.9%) | 27,894 (28.1%) |
| Fuel Oil or Kerosene | 129 (0.1%) | 47 (0.1%) |
| Coal or Coke | 31 (0.0%) | 35 (0.0%) |
| All other Fuels | 2,713 (1.5%) | 822 (0.8%) |
| No Fuel Used | 4,445 (2.5%) | 8,297 (8.4%) |
| Total | 176,575 (100.0%) | 99,078 (100.0%) |
Household Vehicle Usage in Ventura County
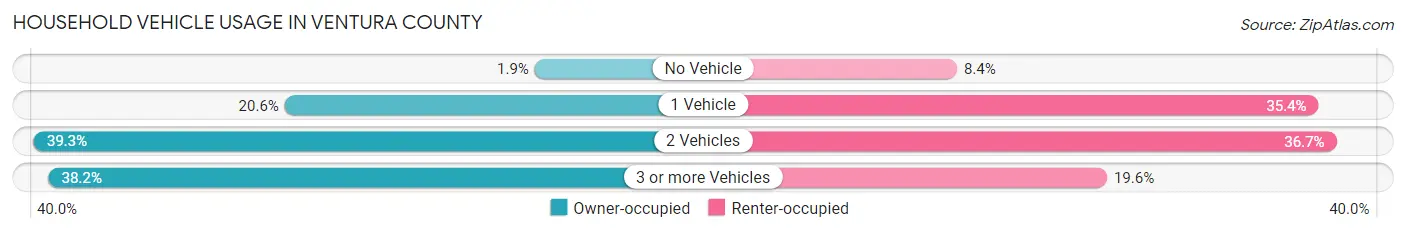
| Vehicles per Household | Owner-occupied | Renter-occupied |
| No Vehicle | 3,371 (1.9%) | 8,297 (8.4%) |
| 1 Vehicle | 36,338 (20.6%) | 35,032 (35.4%) |
| 2 Vehicles | 69,405 (39.3%) | 36,364 (36.7%) |
| 3 or more Vehicles | 67,461 (38.2%) | 19,385 (19.6%) |
| Total | 176,575 (100.0%) | 99,078 (100.0%) |
Real Estate & Mortgages in Ventura County
Real Estate and Mortgage Overview in Ventura County
| Characteristic | Without Mortgage | With Mortgage |
| Housing Units | 52,877 | 123,698 |
| Median Property Value | $666,500 | $738,700 |
| Median Household Income | $87,880 | $58,115 |
| Monthly Housing Costs | $755 | $59,324 |
| Real Estate Taxes | $3,631 | $1,881 |
Property Value by Mortgage Status in Ventura County
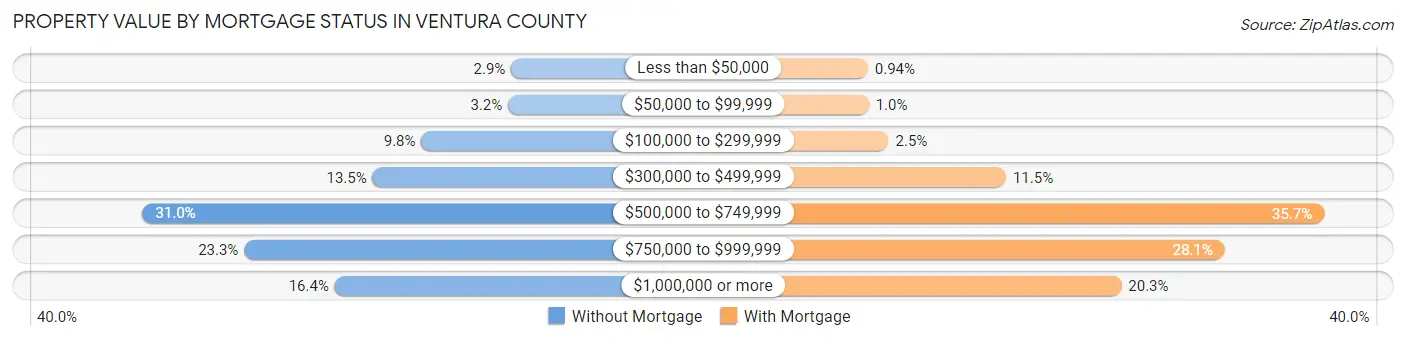
| Property Value | Without Mortgage | With Mortgage |
| Less than $50,000 | 1,548 (2.9%) | 1,158 (0.9%) |
| $50,000 to $99,999 | 1,670 (3.2%) | 1,243 (1.0%) |
| $100,000 to $299,999 | 5,165 (9.8%) | 3,113 (2.5%) |
| $300,000 to $499,999 | 7,131 (13.5%) | 14,181 (11.5%) |
| $500,000 to $749,999 | 16,402 (31.0%) | 44,158 (35.7%) |
| $750,000 to $999,999 | 12,305 (23.3%) | 34,796 (28.1%) |
| $1,000,000 or more | 8,656 (16.4%) | 25,049 (20.3%) |
| Total | 52,877 (100.0%) | 123,698 (100.0%) |
Household Income by Mortgage Status in Ventura County
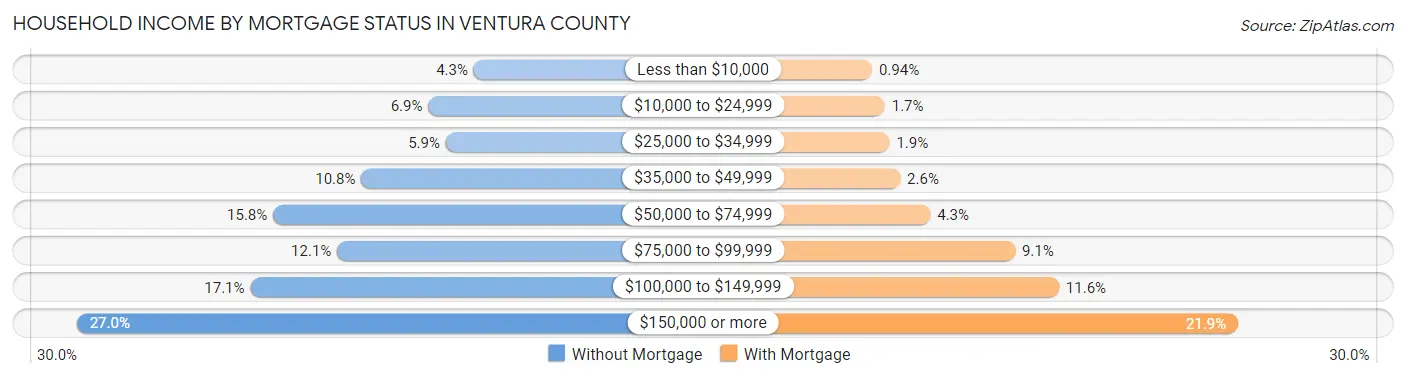
| Household Income | Without Mortgage | With Mortgage |
| Less than $10,000 | 2,288 (4.3%) | 1,161 (0.9%) |
| $10,000 to $24,999 | 3,663 (6.9%) | 2,061 (1.7%) |
| $25,000 to $34,999 | 3,137 (5.9%) | 2,404 (1.9%) |
| $35,000 to $49,999 | 5,688 (10.8%) | 3,160 (2.5%) |
| $50,000 to $74,999 | 8,354 (15.8%) | 5,283 (4.3%) |
| $75,000 to $99,999 | 6,417 (12.1%) | 11,264 (9.1%) |
| $100,000 to $149,999 | 9,041 (17.1%) | 14,376 (11.6%) |
| $150,000 or more | 14,289 (27.0%) | 27,035 (21.9%) |
| Total | 52,877 (100.0%) | 123,698 (100.0%) |
Property Value to Household Income Ratio in Ventura County
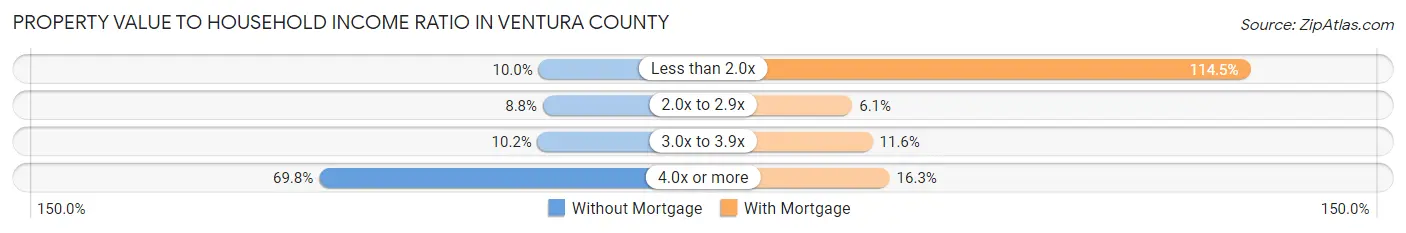
| Value-to-Income Ratio | Without Mortgage | With Mortgage |
| Less than 2.0x | 5,282 (10.0%) | 141,661 (114.5%) |
| 2.0x to 2.9x | 4,660 (8.8%) | 7,535 (6.1%) |
| 3.0x to 3.9x | 5,412 (10.2%) | 14,392 (11.6%) |
| 4.0x or more | 36,897 (69.8%) | 20,141 (16.3%) |
| Total | 52,877 (100.0%) | 123,698 (100.0%) |
Real Estate Taxes by Mortgage Status in Ventura County
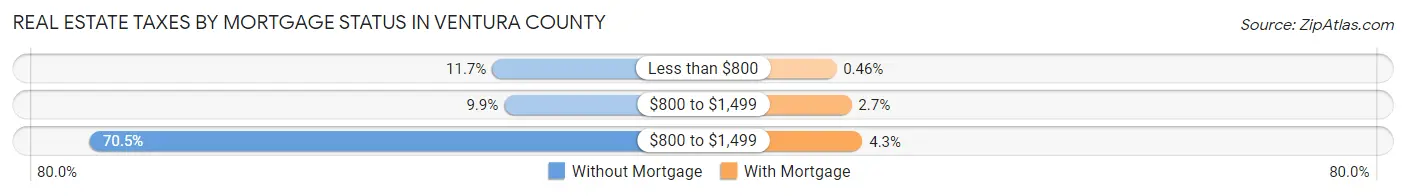
| Property Taxes | Without Mortgage | With Mortgage |
| Less than $800 | 6,183 (11.7%) | 569 (0.5%) |
| $800 to $1,499 | 5,258 (9.9%) | 3,318 (2.7%) |
| $800 to $1,499 | 37,254 (70.5%) | 5,288 (4.3%) |
| Total | 52,877 (100.0%) | 123,698 (100.0%) |
Health & Disability in Ventura County
Health Insurance Coverage by Age in Ventura County
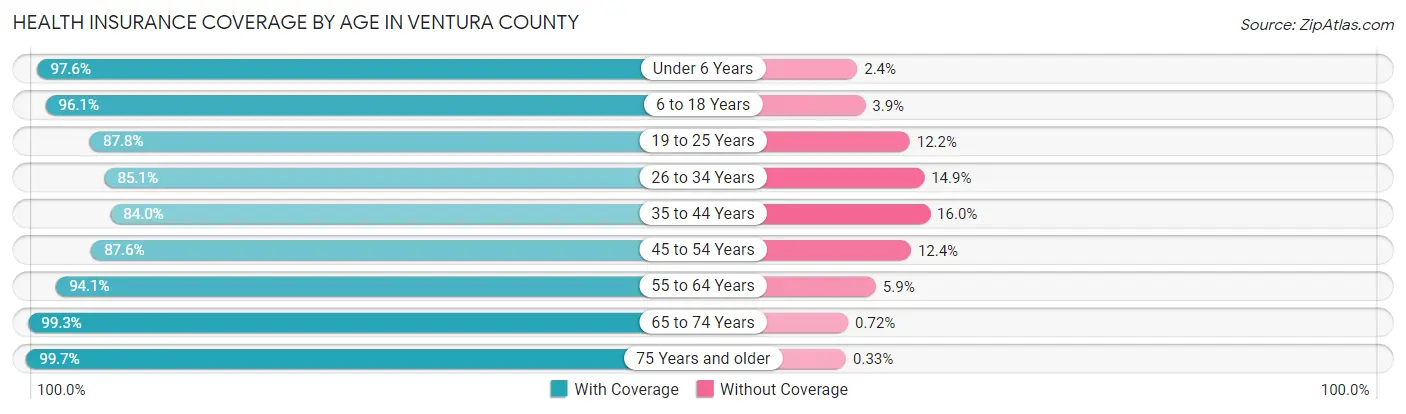
| Age Bracket | With Coverage | Without Coverage |
| Under 6 Years | 54,712 (97.6%) | 1,357 (2.4%) |
| 6 to 18 Years | 137,545 (96.1%) | 5,610 (3.9%) |
| 19 to 25 Years | 66,547 (87.8%) | 9,253 (12.2%) |
| 26 to 34 Years | 83,772 (85.1%) | 14,683 (14.9%) |
| 35 to 44 Years | 88,710 (84.0%) | 16,914 (16.0%) |
| 45 to 54 Years | 94,647 (87.6%) | 13,433 (12.4%) |
| 55 to 64 Years | 104,737 (94.1%) | 6,566 (5.9%) |
| 65 to 74 Years | 79,039 (99.3%) | 572 (0.7%) |
| 75 Years and older | 56,100 (99.7%) | 186 (0.3%) |
| Total | 765,809 (91.8%) | 68,574 (8.2%) |
Health Insurance Coverage by Citizenship Status in Ventura County
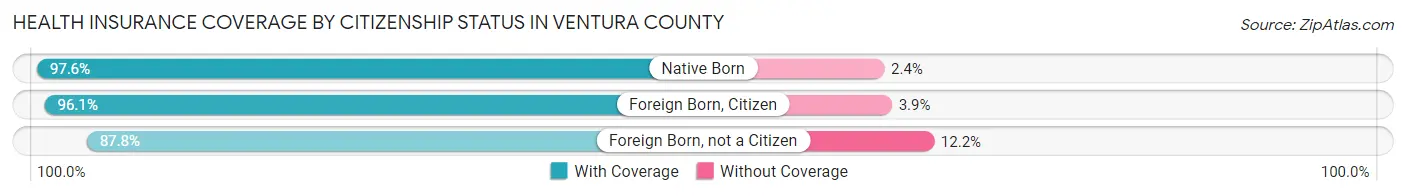
| Citizenship Status | With Coverage | Without Coverage |
| Native Born | 54,712 (97.6%) | 1,357 (2.4%) |
| Foreign Born, Citizen | 137,545 (96.1%) | 5,610 (3.9%) |
| Foreign Born, not a Citizen | 66,547 (87.8%) | 9,253 (12.2%) |
Health Insurance Coverage by Household Income in Ventura County
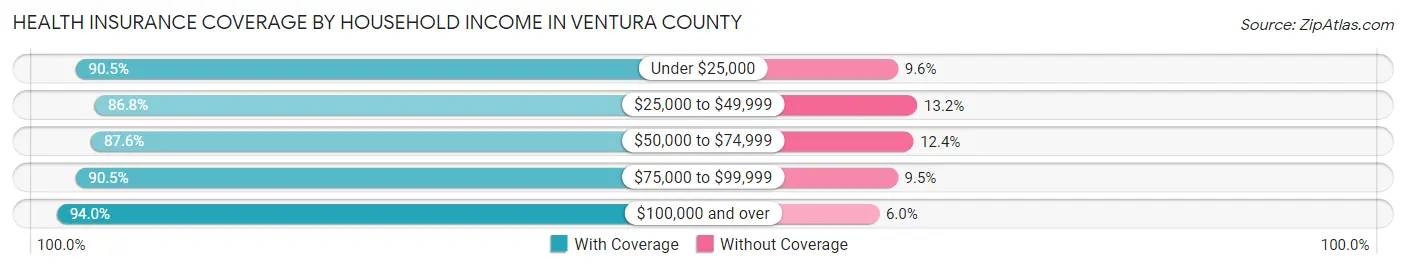
| Household Income | With Coverage | Without Coverage |
| Under $25,000 | 44,638 (90.4%) | 4,711 (9.6%) |
| $25,000 to $49,999 | 79,190 (86.8%) | 12,015 (13.2%) |
| $50,000 to $74,999 | 84,228 (87.6%) | 11,962 (12.4%) |
| $75,000 to $99,999 | 93,752 (90.5%) | 9,868 (9.5%) |
| $100,000 and over | 455,290 (94.0%) | 29,141 (6.0%) |
Public vs Private Health Insurance Coverage by Age in Ventura County
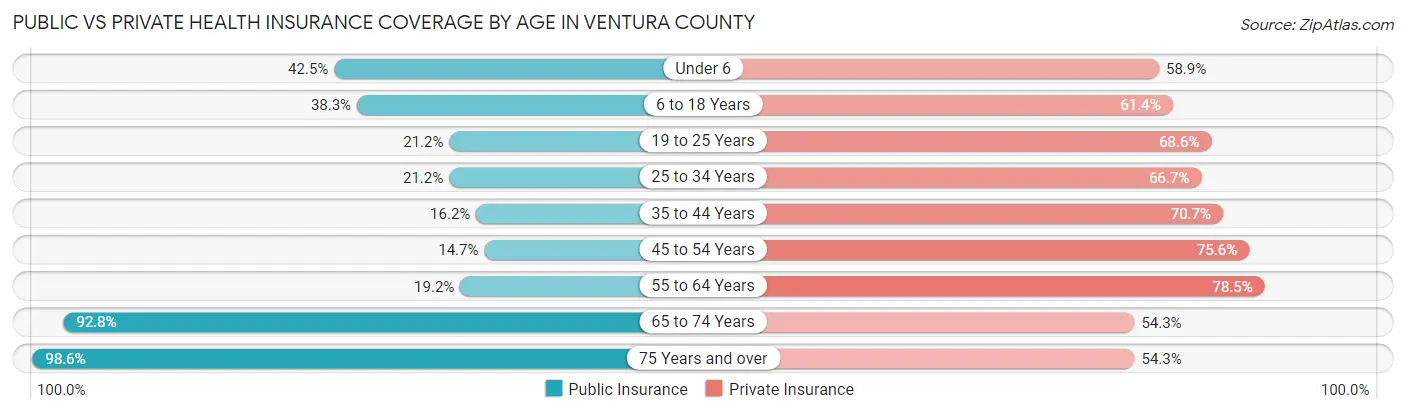
| Age Bracket | Public Insurance | Private Insurance |
| Under 6 | 23,853 (42.5%) | 33,013 (58.9%) |
| 6 to 18 Years | 54,837 (38.3%) | 87,855 (61.4%) |
| 19 to 25 Years | 16,050 (21.2%) | 51,979 (68.6%) |
| 25 to 34 Years | 20,882 (21.2%) | 65,677 (66.7%) |
| 35 to 44 Years | 17,085 (16.2%) | 74,687 (70.7%) |
| 45 to 54 Years | 15,866 (14.7%) | 81,679 (75.6%) |
| 55 to 64 Years | 21,309 (19.2%) | 87,338 (78.5%) |
| 65 to 74 Years | 73,890 (92.8%) | 43,247 (54.3%) |
| 75 Years and over | 55,470 (98.6%) | 30,583 (54.3%) |
| Total | 299,242 (35.9%) | 556,058 (66.6%) |
Disability Status by Sex by Age in Ventura County
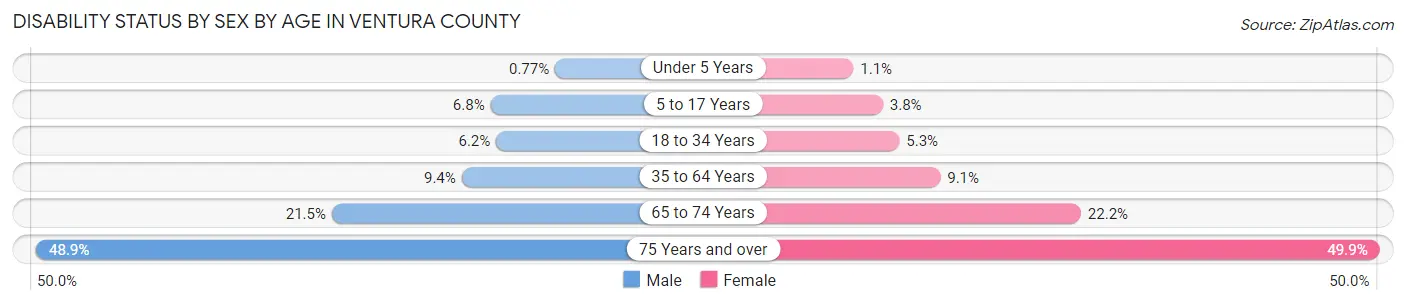
| Age Bracket | Male | Female |
| Under 5 Years | 179 (0.8%) | 240 (1.1%) |
| 5 to 17 Years | 4,884 (6.8%) | 2,656 (3.8%) |
| 18 to 34 Years | 5,888 (6.2%) | 4,891 (5.3%) |
| 35 to 64 Years | 15,350 (9.4%) | 14,836 (9.1%) |
| 65 to 74 Years | 8,149 (21.5%) | 9,249 (22.2%) |
| 75 Years and over | 11,585 (48.9%) | 16,272 (49.9%) |
Disability Class by Sex by Age in Ventura County
Disability Class: Hearing Difficulty
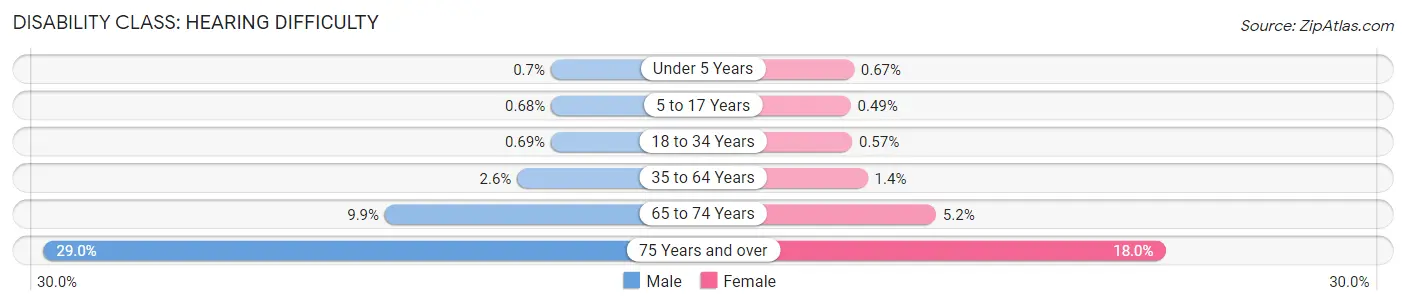
| Age Bracket | Male | Female |
| Under 5 Years | 163 (0.7%) | 149 (0.7%) |
| 5 to 17 Years | 494 (0.7%) | 343 (0.5%) |
| 18 to 34 Years | 647 (0.7%) | 519 (0.6%) |
| 35 to 64 Years | 4,182 (2.6%) | 2,332 (1.4%) |
| 65 to 74 Years | 3,770 (9.9%) | 2,185 (5.2%) |
| 75 Years and over | 6,855 (28.9%) | 5,874 (18.0%) |
Disability Class: Vision Difficulty
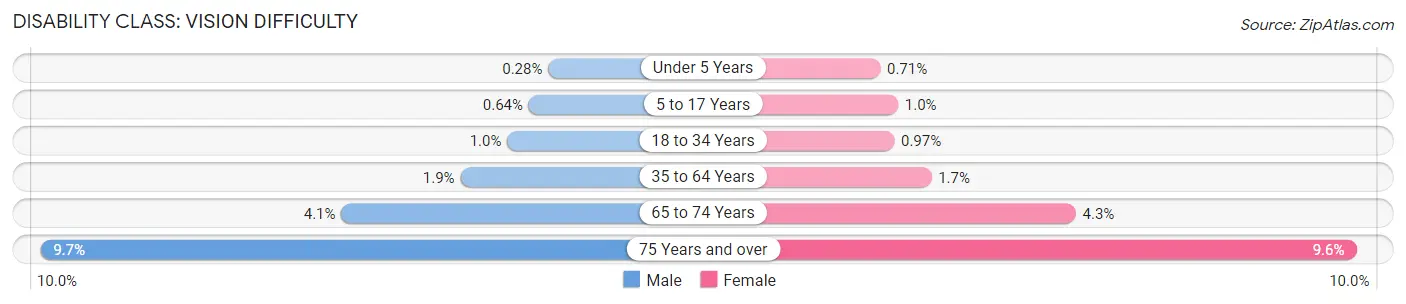
| Age Bracket | Male | Female |
| Under 5 Years | 65 (0.3%) | 158 (0.7%) |
| 5 to 17 Years | 463 (0.6%) | 724 (1.0%) |
| 18 to 34 Years | 985 (1.0%) | 885 (1.0%) |
| 35 to 64 Years | 3,108 (1.9%) | 2,689 (1.7%) |
| 65 to 74 Years | 1,562 (4.1%) | 1,811 (4.3%) |
| 75 Years and over | 2,300 (9.7%) | 3,113 (9.6%) |
Disability Class: Cognitive Difficulty
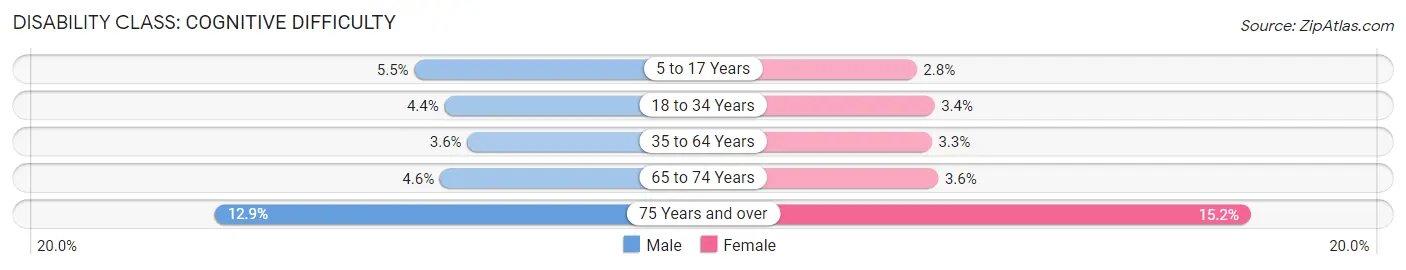
| Age Bracket | Male | Female |
| 5 to 17 Years | 3,995 (5.5%) | 1,930 (2.8%) |
| 18 to 34 Years | 4,167 (4.4%) | 3,144 (3.4%) |
| 35 to 64 Years | 5,796 (3.6%) | 5,406 (3.3%) |
| 65 to 74 Years | 1,738 (4.6%) | 1,490 (3.6%) |
| 75 Years and over | 3,064 (12.9%) | 4,949 (15.2%) |
Disability Class: Ambulatory Difficulty
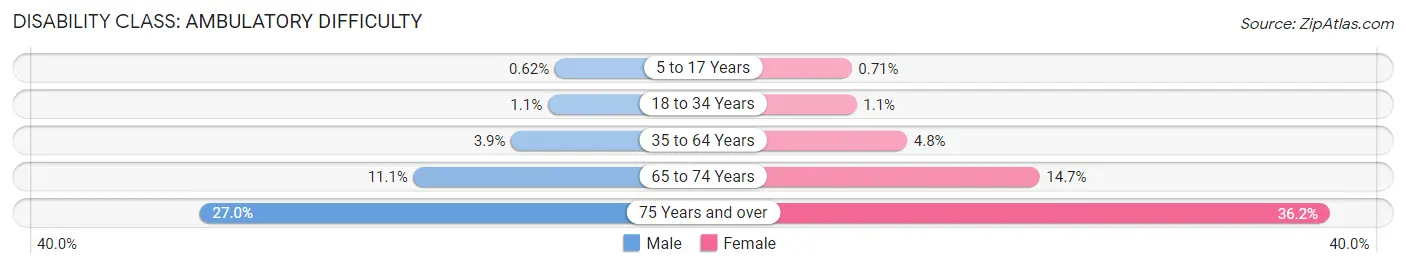
| Age Bracket | Male | Female |
| 5 to 17 Years | 445 (0.6%) | 494 (0.7%) |
| 18 to 34 Years | 1,079 (1.1%) | 989 (1.1%) |
| 35 to 64 Years | 6,284 (3.9%) | 7,843 (4.8%) |
| 65 to 74 Years | 4,213 (11.1%) | 6,114 (14.7%) |
| 75 Years and over | 6,393 (27.0%) | 11,818 (36.2%) |
Disability Class: Self-Care Difficulty
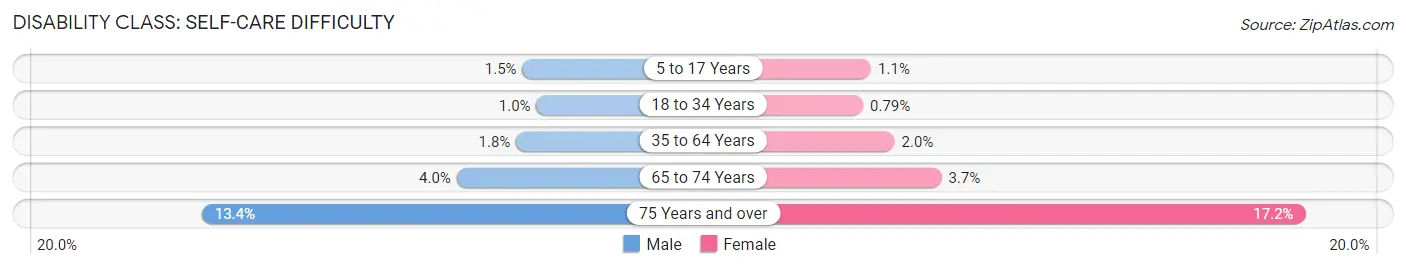
| Age Bracket | Male | Female |
| 5 to 17 Years | 1,101 (1.5%) | 762 (1.1%) |
| 18 to 34 Years | 945 (1.0%) | 724 (0.8%) |
| 35 to 64 Years | 2,840 (1.8%) | 3,188 (2.0%) |
| 65 to 74 Years | 1,500 (4.0%) | 1,542 (3.7%) |
| 75 Years and over | 3,177 (13.4%) | 5,612 (17.2%) |
Technology Access in Ventura County
Computing Device Access in Ventura County
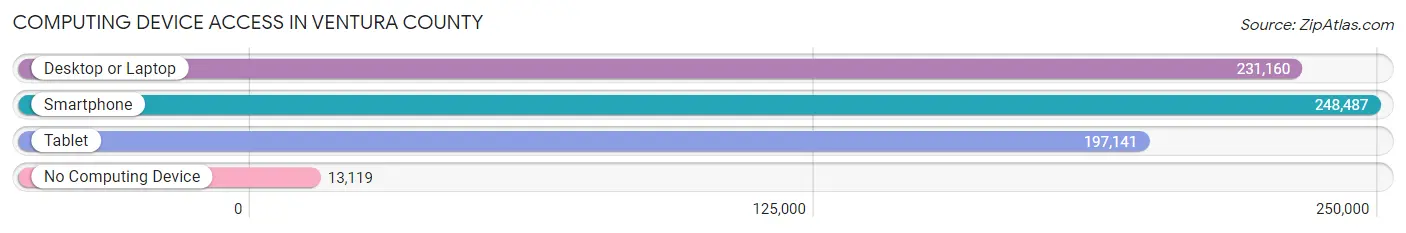
| Device Type | # Households | % Households |
| Desktop or Laptop | 231,160 | 83.9% |
| Smartphone | 248,487 | 90.1% |
| Tablet | 197,141 | 71.5% |
| No Computing Device | 13,119 | 4.8% |
| Total | 275,653 | 100.0% |
Internet Access in Ventura County
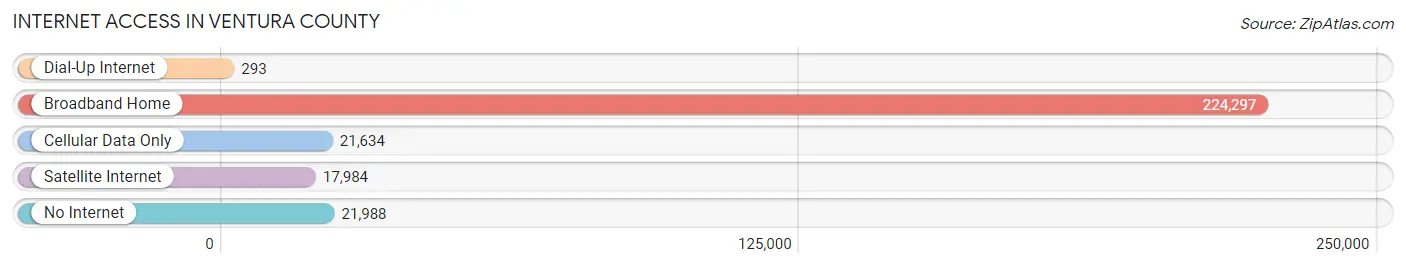
| Internet Type | # Households | % Households |
| Dial-Up Internet | 293 | 0.1% |
| Broadband Home | 224,297 | 81.4% |
| Cellular Data Only | 21,634 | 7.9% |
| Satellite Internet | 17,984 | 6.5% |
| No Internet | 21,988 | 8.0% |
| Total | 275,653 | 100.0% |
Ventura County Summary
Ventura County is a county located in the southern part of the U.S. state of California. It is located along the Pacific Ocean and is part of the Greater Los Angeles Area. The county has a population of 848,363 as of the 2010 census, making it the 23rd most populous county in California. Ventura County is home to numerous cities, including the cities of Oxnard, Ventura, Thousand Oaks, Simi Valley, and Santa Paula.
History
Ventura County was originally inhabited by the Chumash people, who were hunter-gatherers and fishermen. The area was first explored by Europeans in 1542, when Spanish explorer Juan Rodriguez Cabrillo sailed along the coast. The area was later colonized by the Spanish in 1782, when Mission San Buenaventura was established. The mission was the ninth of the 21 missions established by the Spanish in California.
In 1822, Mexico gained independence from Spain and the area became part of Mexico. In 1848, the area was ceded to the United States as part of the Treaty of Guadalupe Hidalgo, which ended the Mexican-American War. The area was then organized as part of Santa Barbara County. In 1873, Ventura County was officially established as its own county.
Geography
Ventura County is located in the southern part of California, along the Pacific Ocean. It is bordered by Los Angeles County to the east, Santa Barbara County to the west, and Kern County to the north. The county covers an area of 1,845 square miles and has a population density of 463 people per square mile.
The county is divided into two distinct regions: the coastal plain and the inland valleys. The coastal plain is characterized by rolling hills and valleys, while the inland valleys are characterized by flat plains and rolling hills. The highest point in the county is Mount Pinos, which has an elevation of 8,831 feet.
Economy
Ventura County has a diverse economy, with a mix of agriculture, manufacturing, and services. Agriculture is the largest sector of the economy, accounting for about 25% of the county’s total economic output. The county is home to numerous farms, which produce a variety of crops, including strawberries, avocados, oranges, and lemons.
Manufacturing is the second largest sector of the economy, accounting for about 20% of the county’s total economic output. The county is home to numerous manufacturing companies, which produce a variety of products, including electronics, medical devices, and aerospace components.
The service sector is the third largest sector of the economy, accounting for about 55% of the county’s total economic output. The county is home to numerous service-based businesses, including healthcare, education, finance, and tourism.
Demographics
As of the 2010 census, Ventura County had a population of 848,363. The population is composed of a variety of ethnic and racial groups, including White (63.2%), Hispanic or Latino (30.2%), Asian (4.2%), African American (2.2%), and Native American (0.7%).
The median household income in the county is $71,837, and the median family income is $83,945. The poverty rate in the county is 11.2%. The largest employers in the county are the County of Ventura, the City of Oxnard, and the City of Ventura.
Common Questions
What is Per Capita Income in Ventura County?
Per Capita income in Ventura County is $45,846.
What is the Median Family Income in Ventura County?
Median Family Income in Ventura County is $116,726.
What is the Median Household income in Ventura County?
Median Household Income in Ventura County is $102,141.
What is Income or Wage Gap in Ventura County?
Income or Wage Gap in Ventura County is 28.1%.
Women in Ventura County earn 71.9 cents for every dollar earned by a man.
What is Family Income Deficit in Ventura County?
Family Income Deficit in Ventura County is $11,580.
Families that are below poverty line in Ventura County earn $11,580 less on average than the poverty threshold level.
What is Inequality or Gini Index in Ventura County?
Inequality or Gini Index in Ventura County is 0.45.
What is the Total Population of Ventura County?
Total Population of Ventura County is 842,009.
What is the Total Male Population of Ventura County?
Total Male Population of Ventura County is 419,805.
What is the Total Female Population of Ventura County?
Total Female Population of Ventura County is 422,204.
What is the Ratio of Males per 100 Females in Ventura County?
There are 99.43 Males per 100 Females in Ventura County.
What is the Ratio of Females per 100 Males in Ventura County?
There are 100.57 Females per 100 Males in Ventura County.
What is the Median Population Age in Ventura County?
Median Population Age in Ventura County is 39.0 Years.
What is the Average Family Size in Ventura County
Average Family Size in Ventura County is 3.5 People.
What is the Average Household Size in Ventura County
Average Household Size in Ventura County is 3.0 People.
How Large is the Labor Force in Ventura County?
There are 436,660 People in the Labor Forcein in Ventura County.
What is the Percentage of People in the Labor Force in Ventura County?
64.5% of People are in the Labor Force in Ventura County.
What is the Unemployment Rate in Ventura County?
Unemployment Rate in Ventura County is 5.3%.