Tuolumne County, CA Map & Demographics
Tuolumne County Map
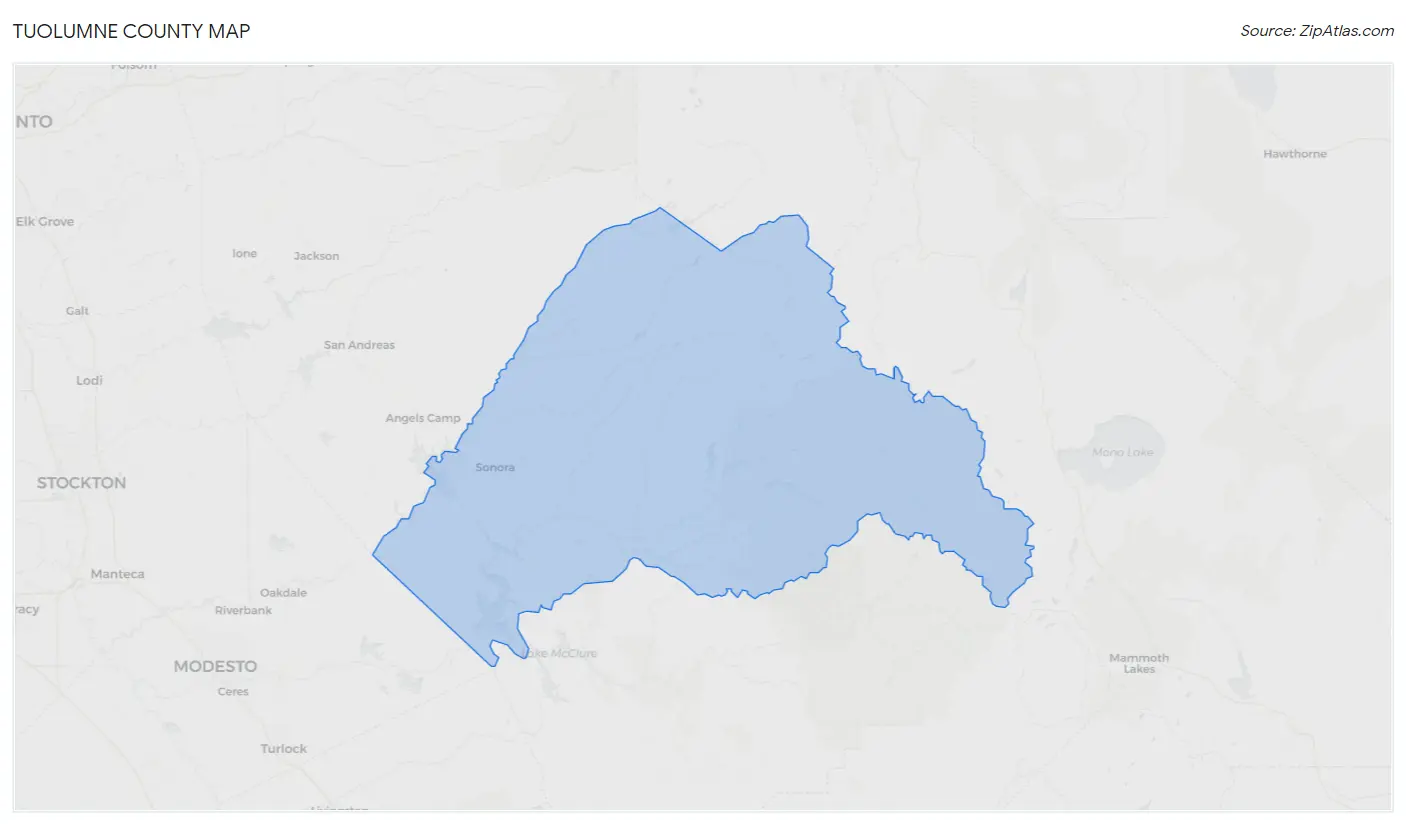
Tuolumne County Overview
$40,095
PER CAPITA INCOME
$91,287
AVG FAMILY INCOME
$70,432
AVG HOUSEHOLD INCOME
26.0%
WAGE / INCOME GAP [ % ]
74.0¢/ $1
WAGE / INCOME GAP [ $ ]
$8,882
FAMILY INCOME DEFICIT
0.45
INEQUALITY / GINI INDEX
54,993
TOTAL POPULATION
28,367
MALE POPULATION
26,626
FEMALE POPULATION
106.54
MALES / 100 FEMALES
93.86
FEMALES / 100 MALES
48.7
MEDIAN AGE
2.9
AVG FAMILY SIZE
2.3
AVG HOUSEHOLD SIZE
22,715
LABOR FORCE [ PEOPLE ]
48.8%
PERCENT IN LABOR FORCE
8.3%
UNEMPLOYMENT RATE
Tuolumne County Area Codes
Income in Tuolumne County
Income Overview in Tuolumne County
Per Capita Income in Tuolumne County is $40,095, while median incomes of families and households are $91,287 and $70,432 respectively.
| Characteristic | Number | Measure |
| Per Capita Income | 54,993 | $40,095 |
| Median Family Income | 13,386 | $91,287 |
| Mean Family Income | 13,386 | $112,347 |
| Median Household Income | 22,831 | $70,432 |
| Mean Household Income | 22,831 | $94,641 |
| Income Deficit | 13,386 | $8,882 |
| Wage / Income Gap (%) | 54,993 | 26.00% |
| Wage / Income Gap ($) | 54,993 | 74.00¢ per $1 |
| Gini / Inequality Index | 54,993 | 0.45 |
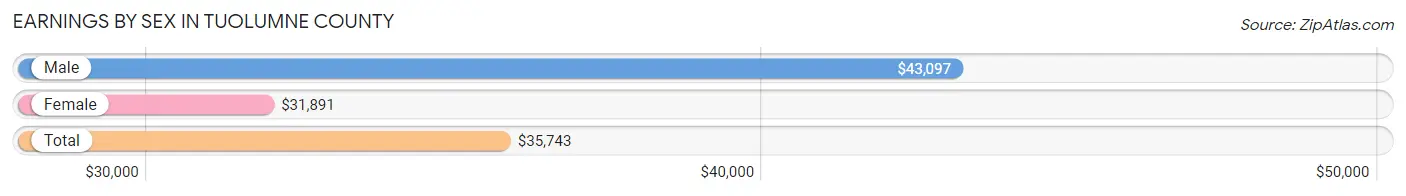
Earnings by Sex in Tuolumne County
Average Earnings in Tuolumne County are $35,743, $43,097 for men and $31,891 for women, a difference of 26.0%.
| Sex | Number | Average Earnings |
| Male | 12,674 (51.5%) | $43,097 |
| Female | 11,952 (48.5%) | $31,891 |
| Total | 24,626 (100.0%) | $35,743 |
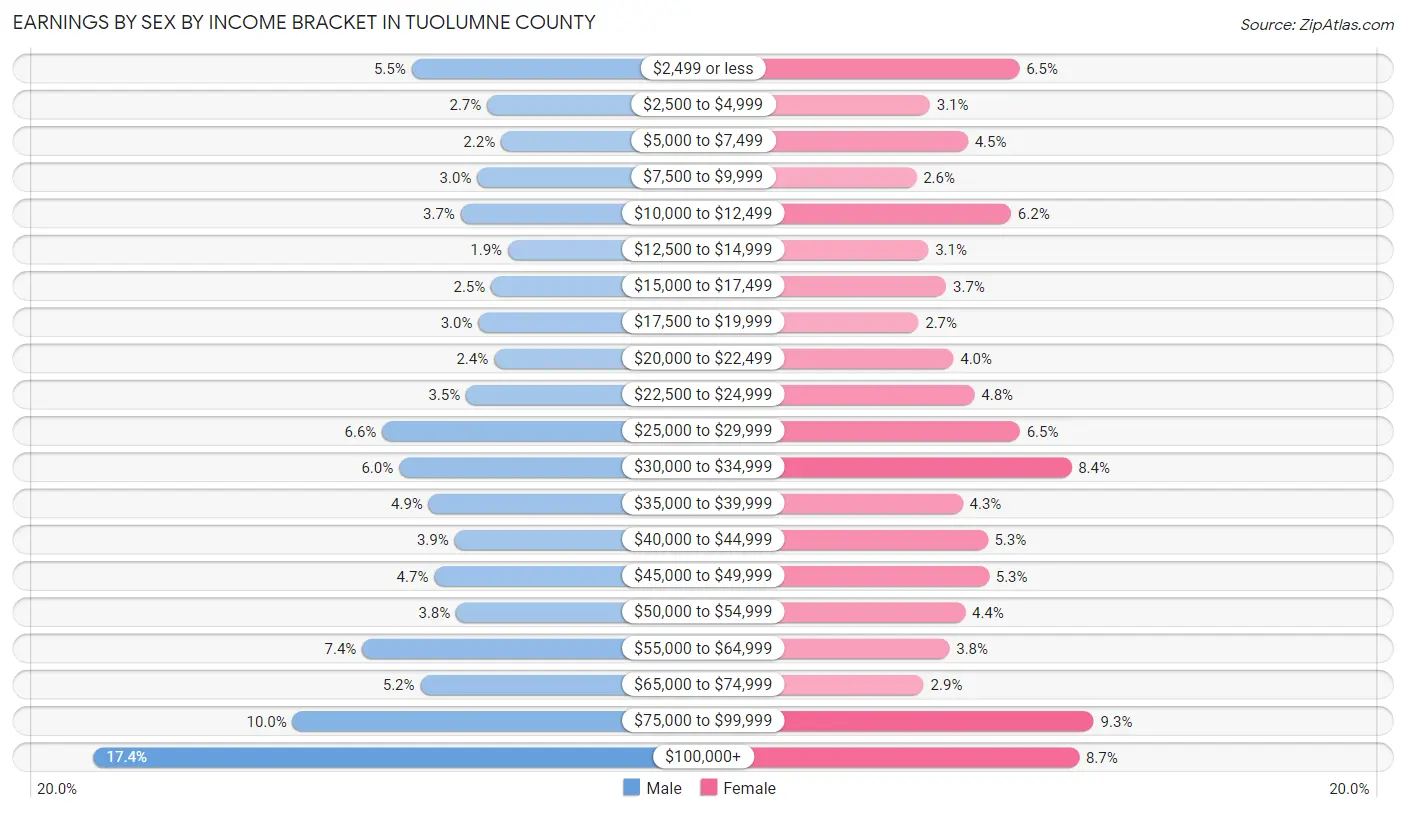
Earnings by Sex by Income Bracket in Tuolumne County
The most common earnings brackets in Tuolumne County are $100,000+ for men (2,207 | 17.4%) and $75,000 to $99,999 for women (1,106 | 9.2%).
| Income | Male | Female |
| $2,499 or less | 697 (5.5%) | 772 (6.5%) |
| $2,500 to $4,999 | 339 (2.7%) | 372 (3.1%) |
| $5,000 to $7,499 | 273 (2.1%) | 541 (4.5%) |
| $7,500 to $9,999 | 385 (3.0%) | 311 (2.6%) |
| $10,000 to $12,499 | 464 (3.7%) | 735 (6.1%) |
| $12,500 to $14,999 | 240 (1.9%) | 365 (3.0%) |
| $15,000 to $17,499 | 320 (2.5%) | 445 (3.7%) |
| $17,500 to $19,999 | 380 (3.0%) | 320 (2.7%) |
| $20,000 to $22,499 | 305 (2.4%) | 477 (4.0%) |
| $22,500 to $24,999 | 439 (3.5%) | 571 (4.8%) |
| $25,000 to $29,999 | 836 (6.6%) | 775 (6.5%) |
| $30,000 to $34,999 | 757 (6.0%) | 1,005 (8.4%) |
| $35,000 to $39,999 | 616 (4.9%) | 519 (4.3%) |
| $40,000 to $44,999 | 493 (3.9%) | 630 (5.3%) |
| $45,000 to $49,999 | 589 (4.6%) | 636 (5.3%) |
| $50,000 to $54,999 | 485 (3.8%) | 529 (4.4%) |
| $55,000 to $64,999 | 932 (7.3%) | 459 (3.8%) |
| $65,000 to $74,999 | 655 (5.2%) | 344 (2.9%) |
| $75,000 to $99,999 | 1,262 (10.0%) | 1,106 (9.2%) |
| $100,000+ | 2,207 (17.4%) | 1,040 (8.7%) |
| Total | 12,674 (100.0%) | 11,952 (100.0%) |
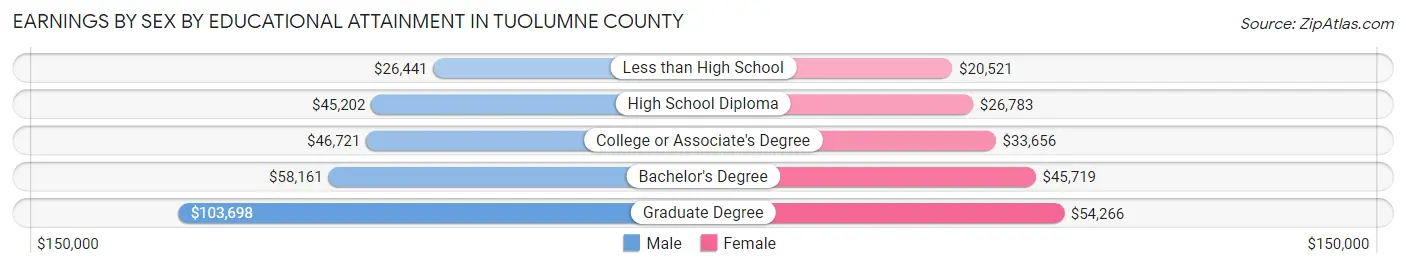
Earnings by Sex by Educational Attainment in Tuolumne County
Average earnings in Tuolumne County are $46,462 for men and $34,569 for women, a difference of 25.6%. Men with an educational attainment of graduate degree enjoy the highest average annual earnings of $103,698, while those with less than high school education earn the least with $26,441. Women with an educational attainment of graduate degree earn the most with the average annual earnings of $54,266, while those with less than high school education have the smallest earnings of $20,521.
| Educational Attainment | Male Income | Female Income |
| Less than High School | $26,441 | $20,521 |
| High School Diploma | $45,202 | $26,783 |
| College or Associate's Degree | $46,721 | $33,656 |
| Bachelor's Degree | $58,161 | $45,719 |
| Graduate Degree | $103,698 | $54,266 |
| Total | $46,462 | $34,569 |
Family Income in Tuolumne County
Family Income Brackets in Tuolumne County
According to the Tuolumne County family income data, there are 2,918 families falling into the $100,000 to $149,999 income range, which is the most common income bracket and makes up 21.8% of all families. Conversely, the less than $10,000 income bracket is the least frequent group with only 254 families (1.9%) belonging to this category.
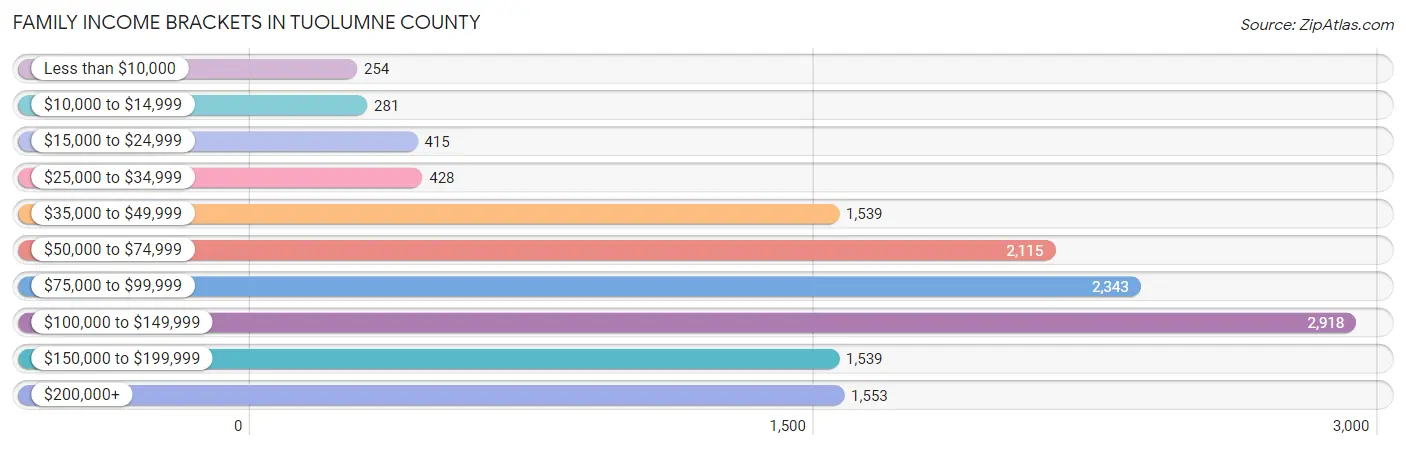
| Income Bracket | # Families | % Families |
| Less than $10,000 | 254 | 1.9% |
| $10,000 to $14,999 | 281 | 2.1% |
| $15,000 to $24,999 | 415 | 3.1% |
| $25,000 to $34,999 | 428 | 3.2% |
| $35,000 to $49,999 | 1,539 | 11.5% |
| $50,000 to $74,999 | 2,115 | 15.8% |
| $75,000 to $99,999 | 2,343 | 17.5% |
| $100,000 to $149,999 | 2,918 | 21.8% |
| $150,000 to $199,999 | 1,539 | 11.5% |
| $200,000+ | 1,553 | 11.6% |
Family Income by Famaliy Size in Tuolumne County
7+ person families (77 | 0.6%) account for the highest median family income in Tuolumne County with $144,940 per family, while 2-person families (8,088 | 60.4%) have the highest median income of $42,550 per family member.
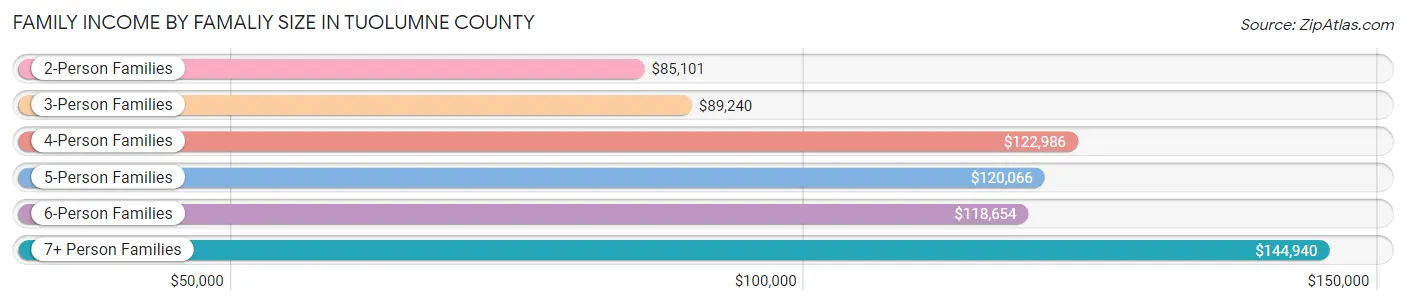
| Income Bracket | # Families | Median Income |
| 2-Person Families | 8,088 (60.4%) | $85,101 |
| 3-Person Families | 2,265 (16.9%) | $89,240 |
| 4-Person Families | 1,755 (13.1%) | $122,986 |
| 5-Person Families | 991 (7.4%) | $120,066 |
| 6-Person Families | 210 (1.6%) | $118,654 |
| 7+ Person Families | 77 (0.6%) | $144,940 |
| Total | 13,386 (100.0%) | $91,287 |
Family Income by Number of Earners in Tuolumne County
The median family income in Tuolumne County is $91,287, with families comprising 3+ earners (895) having the highest median family income of $138,114, while families with no earners (3,409) have the lowest median family income of $70,016, accounting for 6.7% and 25.5% of families, respectively.
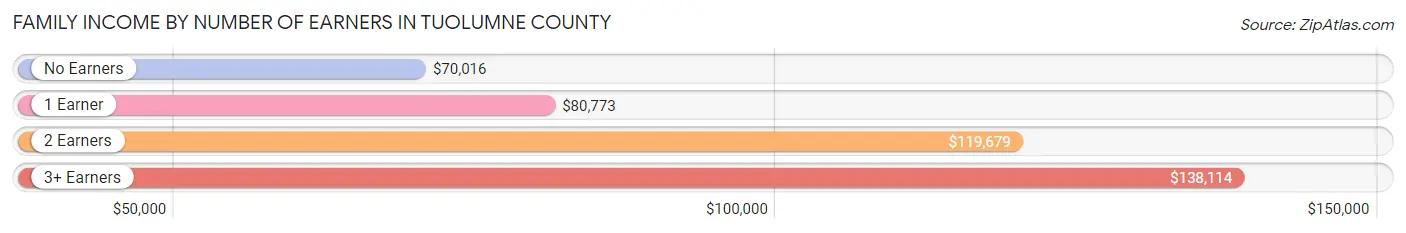
| Number of Earners | # Families | Median Income |
| No Earners | 3,409 (25.5%) | $70,016 |
| 1 Earner | 4,615 (34.5%) | $80,773 |
| 2 Earners | 4,467 (33.4%) | $119,679 |
| 3+ Earners | 895 (6.7%) | $138,114 |
| Total | 13,386 (100.0%) | $91,287 |
Household Income in Tuolumne County
Household Income Brackets in Tuolumne County
With 4,224 households falling in the category, the $100,000 to $149,999 income range is the most frequent in Tuolumne County, accounting for 18.5% of all households. In contrast, only 639 households (2.8%) fall into the less than $10,000 income bracket, making it the least populous group.
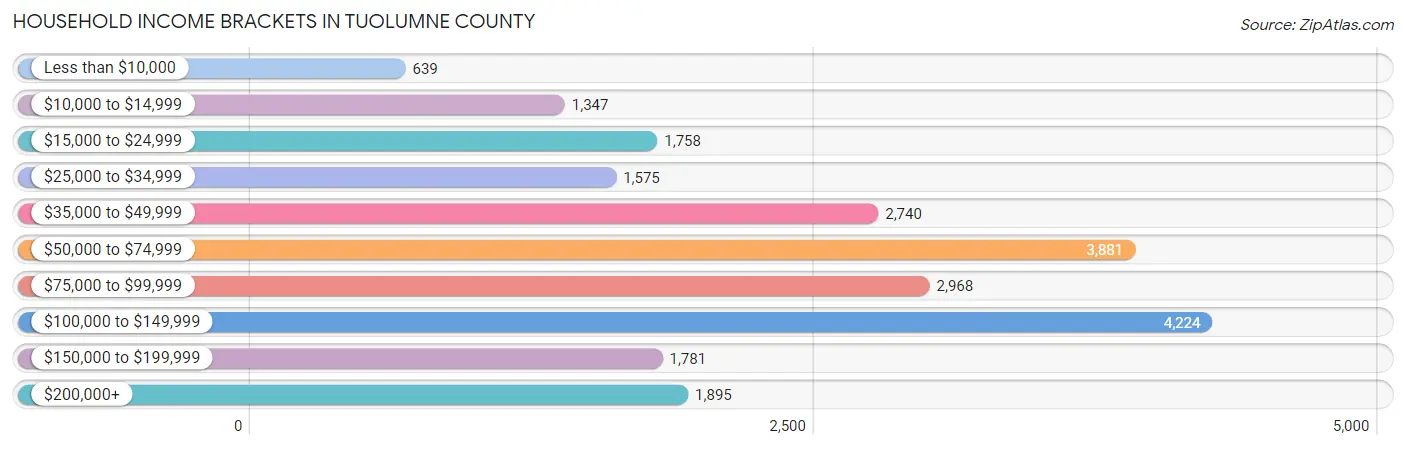
| Income Bracket | # Households | % Households |
| Less than $10,000 | 639 | 2.8% |
| $10,000 to $14,999 | 1,347 | 5.9% |
| $15,000 to $24,999 | 1,758 | 7.7% |
| $25,000 to $34,999 | 1,575 | 6.9% |
| $35,000 to $49,999 | 2,740 | 12.0% |
| $50,000 to $74,999 | 3,881 | 17.0% |
| $75,000 to $99,999 | 2,968 | 13.0% |
| $100,000 to $149,999 | 4,224 | 18.5% |
| $150,000 to $199,999 | 1,781 | 7.8% |
| $200,000+ | 1,895 | 8.3% |
Household Income by Householder Age in Tuolumne County
The median household income in Tuolumne County is $70,432, with the highest median household income of $85,625 found in the 45 to 64 years age bracket for the primary householder. A total of 8,179 households (35.8%) fall into this category. Meanwhile, the 15 to 24 years age bracket for the primary householder has the lowest median household income of $50,147, with 438 households (1.9%) in this group.
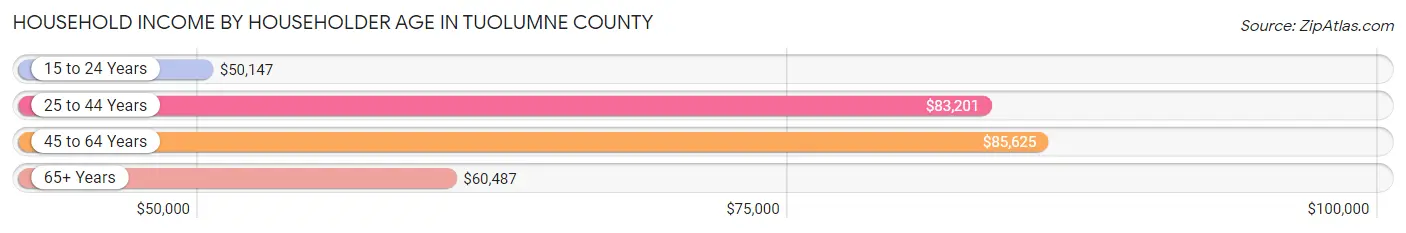
| Income Bracket | # Households | Median Income |
| 15 to 24 Years | 438 (1.9%) | $50,147 |
| 25 to 44 Years | 4,991 (21.9%) | $83,201 |
| 45 to 64 Years | 8,179 (35.8%) | $85,625 |
| 65+ Years | 9,223 (40.4%) | $60,487 |
| Total | 22,831 (100.0%) | $70,432 |
Poverty in Tuolumne County
Income Below Poverty by Sex and Age in Tuolumne County
With 10.4% poverty level for males and 12.3% for females among the residents of Tuolumne County, 16 and 17 year old males and 15 year old females are the most vulnerable to poverty, with 73 males (28.6%) and 78 females (27.9%) in their respective age groups living below the poverty level.
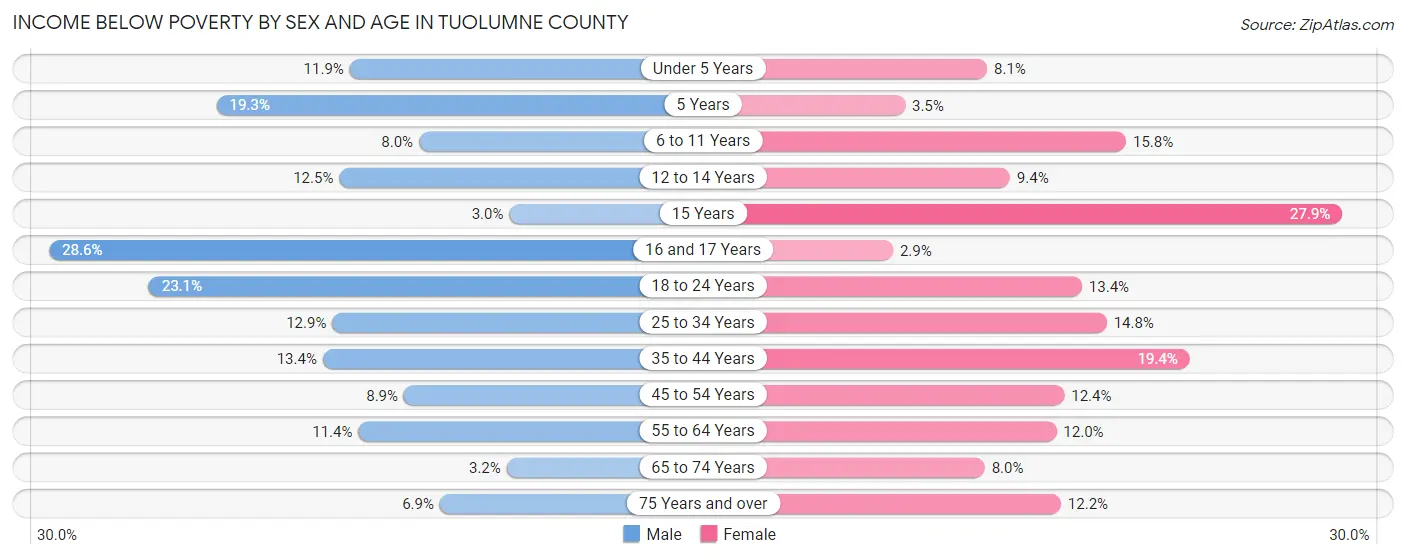
| Age Bracket | Male | Female |
| Under 5 Years | 145 (11.9%) | 91 (8.1%) |
| 5 Years | 89 (19.3%) | 9 (3.5%) |
| 6 to 11 Years | 122 (8.0%) | 228 (15.8%) |
| 12 to 14 Years | 69 (12.5%) | 63 (9.4%) |
| 15 Years | 15 (3.0%) | 78 (27.9%) |
| 16 and 17 Years | 73 (28.6%) | 18 (2.9%) |
| 18 to 24 Years | 385 (23.1%) | 187 (13.4%) |
| 25 to 34 Years | 363 (12.9%) | 430 (14.7%) |
| 35 to 44 Years | 383 (13.4%) | 505 (19.4%) |
| 45 to 54 Years | 254 (8.9%) | 354 (12.4%) |
| 55 to 64 Years | 451 (11.4%) | 504 (11.9%) |
| 65 to 74 Years | 139 (3.2%) | 348 (8.0%) |
| 75 Years and over | 183 (6.9%) | 401 (12.2%) |
| Total | 2,671 (10.4%) | 3,216 (12.3%) |
Income Above Poverty by Sex and Age in Tuolumne County
According to the poverty statistics in Tuolumne County, males aged 15 years and females aged 16 and 17 years are the age groups that are most secure financially, with 97.0% of males and 97.2% of females in these age groups living above the poverty line.
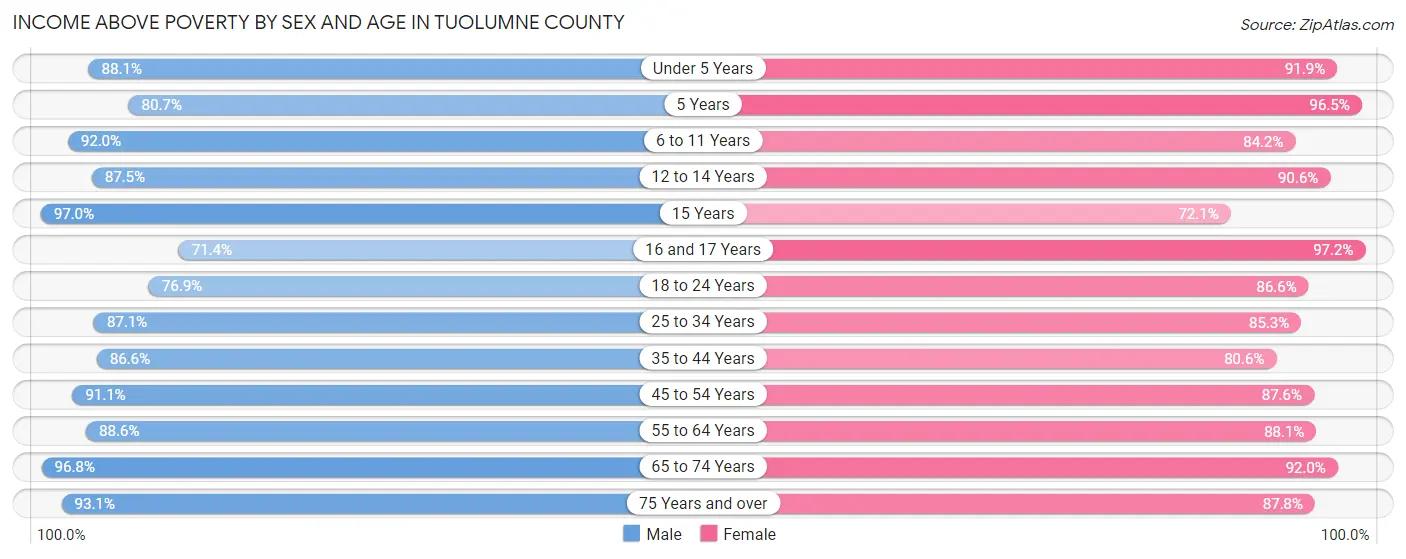
| Age Bracket | Male | Female |
| Under 5 Years | 1,073 (88.1%) | 1,034 (91.9%) |
| 5 Years | 372 (80.7%) | 247 (96.5%) |
| 6 to 11 Years | 1,396 (92.0%) | 1,212 (84.2%) |
| 12 to 14 Years | 484 (87.5%) | 610 (90.6%) |
| 15 Years | 483 (97.0%) | 202 (72.1%) |
| 16 and 17 Years | 182 (71.4%) | 613 (97.2%) |
| 18 to 24 Years | 1,283 (76.9%) | 1,212 (86.6%) |
| 25 to 34 Years | 2,457 (87.1%) | 2,485 (85.3%) |
| 35 to 44 Years | 2,475 (86.6%) | 2,102 (80.6%) |
| 45 to 54 Years | 2,607 (91.1%) | 2,503 (87.6%) |
| 55 to 64 Years | 3,498 (88.6%) | 3,714 (88.0%) |
| 65 to 74 Years | 4,262 (96.8%) | 4,024 (92.0%) |
| 75 Years and over | 2,476 (93.1%) | 2,886 (87.8%) |
| Total | 23,048 (89.6%) | 22,844 (87.7%) |
Income Below Poverty Among Married-Couple Families in Tuolumne County
The poverty statistics for married-couple families in Tuolumne County show that 3.8% or 396 of the total 10,510 families live below the poverty line. Families with 5 or more children have the highest poverty rate of 23.5%, comprising of 4 families. On the other hand, families with 1 or 2 children have the lowest poverty rate of 3.3%, which includes 79 families.
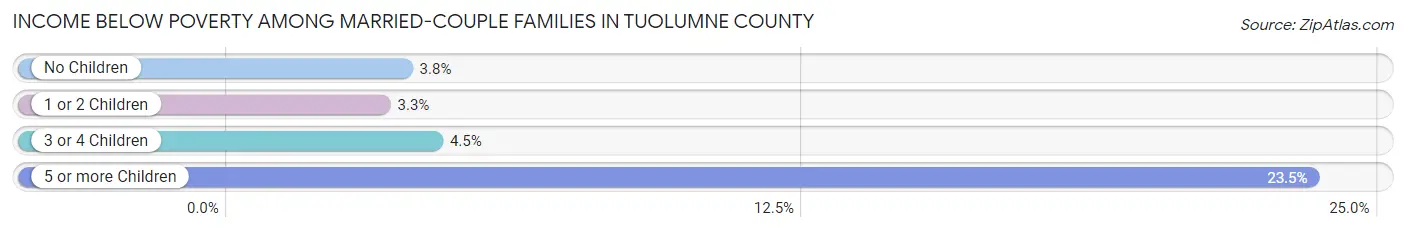
| Children | Above Poverty | Below Poverty |
| No Children | 7,134 (96.2%) | 282 (3.8%) |
| 1 or 2 Children | 2,303 (96.7%) | 79 (3.3%) |
| 3 or 4 Children | 664 (95.5%) | 31 (4.5%) |
| 5 or more Children | 13 (76.5%) | 4 (23.5%) |
| Total | 10,114 (96.2%) | 396 (3.8%) |
Income Below Poverty Among Single-Parent Households in Tuolumne County
According to the poverty data in Tuolumne County, 3.0% or 33 single-father households and 26.3% or 466 single-mother households are living below the poverty line. Among single-father households, those with 5 or more children have the highest poverty rate, with 1 households (100.0%) experiencing poverty. Likewise, among single-mother households, those with 1 or 2 children have the highest poverty rate, with 311 households (34.0%) falling below the poverty line.
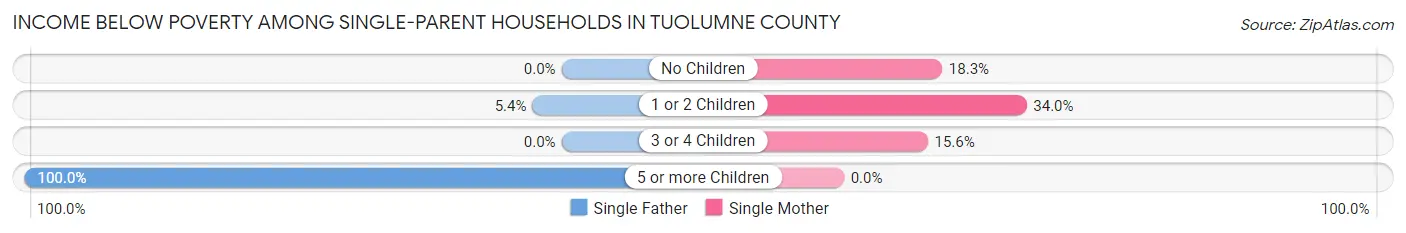
| Children | Single Father | Single Mother |
| No Children | 0 (0.0%) | 140 (18.3%) |
| 1 or 2 Children | 32 (5.4%) | 311 (34.0%) |
| 3 or 4 Children | 0 (0.0%) | 15 (15.6%) |
| 5 or more Children | 1 (100.0%) | 0 (0.0%) |
| Total | 33 (3.0%) | 466 (26.3%) |
Income Below Poverty Among Married-Couple vs Single-Parent Households in Tuolumne County
The poverty data for Tuolumne County shows that 396 of the married-couple family households (3.8%) and 499 of the single-parent households (17.3%) are living below the poverty level. Within the married-couple family households, those with 5 or more children have the highest poverty rate, with 4 households (23.5%) falling below the poverty line. Among the single-parent households, those with 5 or more children have the highest poverty rate, with 1 household (100.0%) living below poverty.
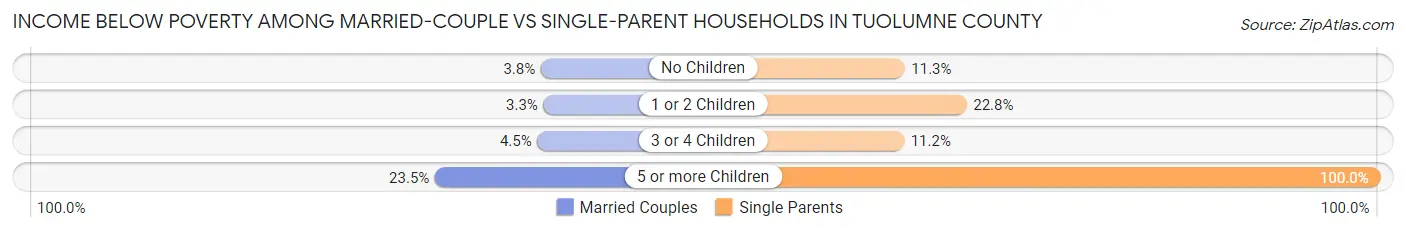
| Children | Married-Couple Families | Single-Parent Households |
| No Children | 282 (3.8%) | 140 (11.3%) |
| 1 or 2 Children | 79 (3.3%) | 343 (22.8%) |
| 3 or 4 Children | 31 (4.5%) | 15 (11.2%) |
| 5 or more Children | 4 (23.5%) | 1 (100.0%) |
| Total | 396 (3.8%) | 499 (17.3%) |
Race in Tuolumne County
The most populous races in Tuolumne County are White / Caucasian (46,316 | 84.2%), Hispanic or Latino (7,079 | 12.9%), and Two or more Races (4,078 | 7.4%).
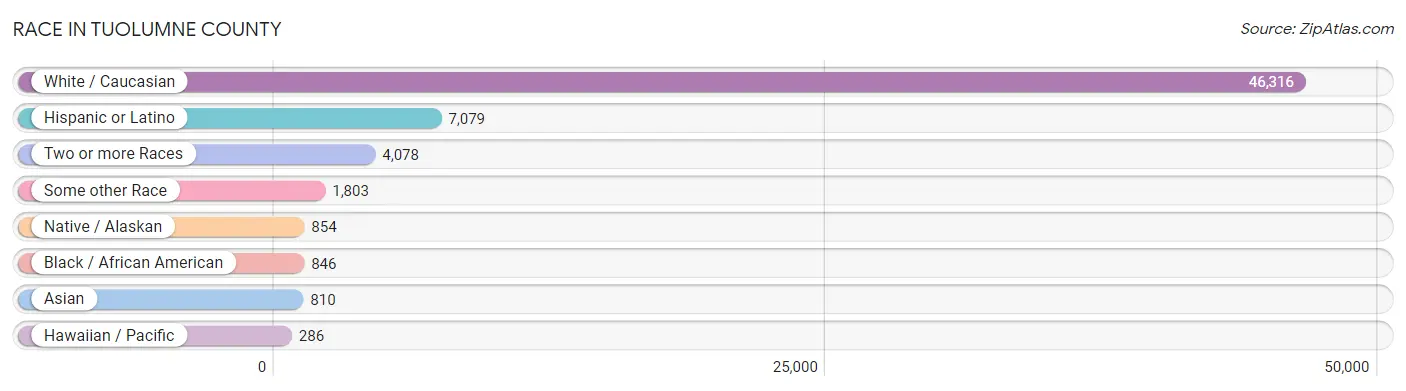
| Race | # Population | % Population |
| Asian | 810 | 1.5% |
| Black / African American | 846 | 1.5% |
| Hawaiian / Pacific | 286 | 0.5% |
| Hispanic or Latino | 7,079 | 12.9% |
| Native / Alaskan | 854 | 1.5% |
| White / Caucasian | 46,316 | 84.2% |
| Two or more Races | 4,078 | 7.4% |
| Some other Race | 1,803 | 3.3% |
| Total | 54,993 | 100.0% |
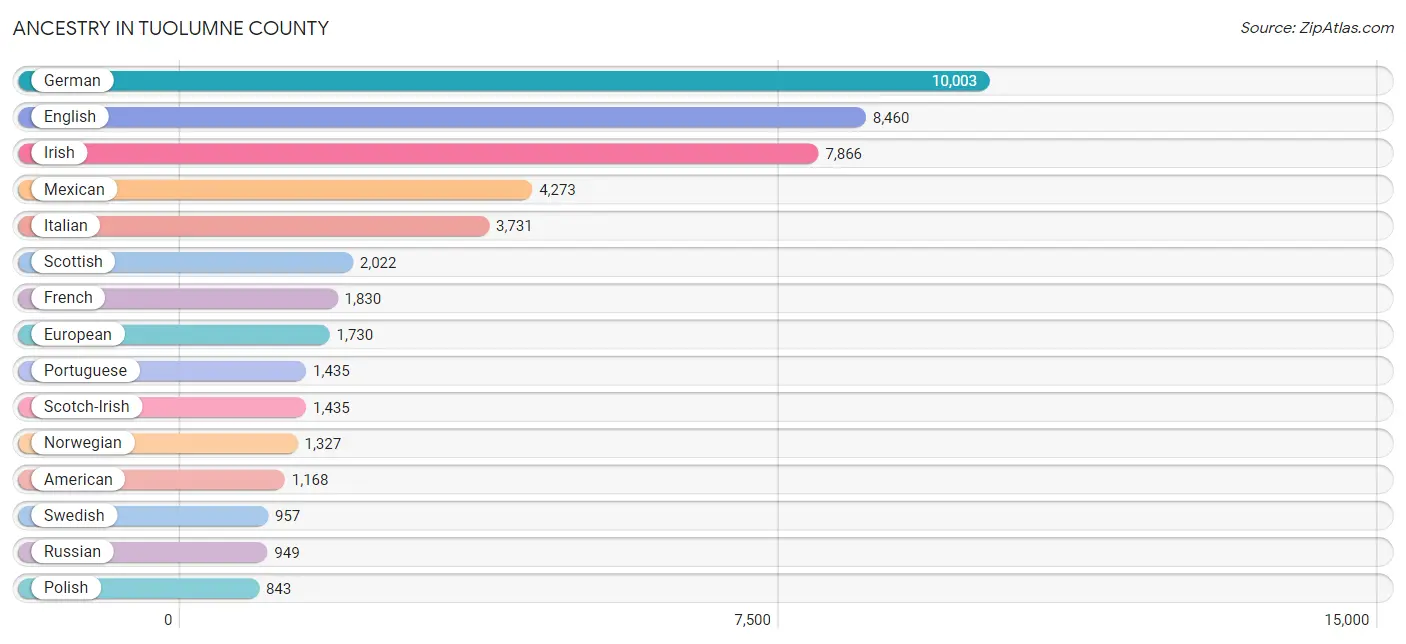
Ancestry in Tuolumne County
The most populous ancestries reported in Tuolumne County are German (10,003 | 18.2%), English (8,460 | 15.4%), Irish (7,866 | 14.3%), Mexican (4,273 | 7.8%), and Italian (3,731 | 6.8%), together accounting for 62.4% of all Tuolumne County residents.
| Ancestry | # Population | % Population |
| Afghan | 16 | 0.0% |
| African | 22 | 0.0% |
| Aleut | 7 | 0.0% |
| American | 1,168 | 2.1% |
| Apache | 76 | 0.1% |
| Arab | 202 | 0.4% |
| Arapaho | 6 | 0.0% |
| Argentinean | 45 | 0.1% |
| Armenian | 72 | 0.1% |
| Assyrian / Chaldean / Syriac | 7 | 0.0% |
| Australian | 33 | 0.1% |
| Austrian | 104 | 0.2% |
| Bangladeshi | 67 | 0.1% |
| Basque | 58 | 0.1% |
| Belgian | 116 | 0.2% |
| Belizean | 17 | 0.0% |
| Bhutanese | 378 | 0.7% |
| Blackfeet | 87 | 0.2% |
| British | 480 | 0.9% |
| Burmese | 88 | 0.2% |
| Canadian | 133 | 0.2% |
| Cape Verdean | 5 | 0.0% |
| Celtic | 30 | 0.1% |
| Central American | 512 | 0.9% |
| Cherokee | 593 | 1.1% |
| Chickasaw | 77 | 0.1% |
| Chilean | 267 | 0.5% |
| Chippewa | 6 | 0.0% |
| Choctaw | 76 | 0.1% |
| Colombian | 52 | 0.1% |
| Comanche | 13 | 0.0% |
| Creek | 23 | 0.0% |
| Croatian | 121 | 0.2% |
| Cuban | 19 | 0.0% |
| Czech | 146 | 0.3% |
| Czechoslovakian | 102 | 0.2% |
| Danish | 632 | 1.1% |
| Dutch | 540 | 1.0% |
| Eastern European | 180 | 0.3% |
| Ecuadorian | 187 | 0.3% |
| English | 8,460 | 15.4% |
| European | 1,730 | 3.2% |
| Filipino | 11 | 0.0% |
| Finnish | 201 | 0.4% |
| French | 1,830 | 3.3% |
| French American Indian | 29 | 0.1% |
| French Canadian | 576 | 1.1% |
| German | 10,003 | 18.2% |
| Greek | 179 | 0.3% |
| Guamanian / Chamorro | 140 | 0.3% |
| Guatemalan | 64 | 0.1% |
| Honduran | 14 | 0.0% |
| Hungarian | 293 | 0.5% |
| Icelander | 29 | 0.1% |
| Indian (Asian) | 235 | 0.4% |
| Inupiat | 13 | 0.0% |
| Iranian | 65 | 0.1% |
| Irish | 7,866 | 14.3% |
| Iroquois | 39 | 0.1% |
| Italian | 3,731 | 6.8% |
| Jamaican | 7 | 0.0% |
| Japanese | 4 | 0.0% |
| Kenyan | 39 | 0.1% |
| Kiowa | 3 | 0.0% |
| Korean | 690 | 1.3% |
| Laotian | 11 | 0.0% |
| Latvian | 54 | 0.1% |
| Lebanese | 202 | 0.4% |
| Lithuanian | 20 | 0.0% |
| Malaysian | 7 | 0.0% |
| Maltese | 7 | 0.0% |
| Mexican | 4,273 | 7.8% |
| Mexican American Indian | 123 | 0.2% |
| Native Hawaiian | 269 | 0.5% |
| Navajo | 22 | 0.0% |
| Nepalese | 6 | 0.0% |
| Nicaraguan | 19 | 0.0% |
| Nigerian | 5 | 0.0% |
| Northern European | 221 | 0.4% |
| Norwegian | 1,327 | 2.4% |
| Paiute | 2 | 0.0% |
| Pakistani | 4 | 0.0% |
| Panamanian | 77 | 0.1% |
| Pennsylvania German | 54 | 0.1% |
| Peruvian | 22 | 0.0% |
| Pima | 19 | 0.0% |
| Polish | 843 | 1.5% |
| Portuguese | 1,435 | 2.6% |
| Potawatomi | 9 | 0.0% |
| Puerto Rican | 438 | 0.8% |
| Romanian | 59 | 0.1% |
| Russian | 949 | 1.7% |
| Salvadoran | 338 | 0.6% |
| Samoan | 106 | 0.2% |
| Scandinavian | 286 | 0.5% |
| Scotch-Irish | 1,435 | 2.6% |
| Scottish | 2,022 | 3.7% |
| Serbian | 18 | 0.0% |
| Shoshone | 36 | 0.1% |
| Sioux | 102 | 0.2% |
| Slavic | 34 | 0.1% |
| Slovak | 54 | 0.1% |
| Slovene | 17 | 0.0% |
| South African | 52 | 0.1% |
| South American | 621 | 1.1% |
| Spaniard | 706 | 1.3% |
| Spanish | 318 | 0.6% |
| Spanish American Indian | 12 | 0.0% |
| Sri Lankan | 65 | 0.1% |
| Subsaharan African | 123 | 0.2% |
| Swedish | 957 | 1.7% |
| Swiss | 253 | 0.5% |
| Thai | 52 | 0.1% |
| Tongan | 38 | 0.1% |
| Turkish | 24 | 0.0% |
| U.S. Virgin Islander | 46 | 0.1% |
| Ukrainian | 63 | 0.1% |
| Uruguayan | 8 | 0.0% |
| Venezuelan | 40 | 0.1% |
| Welsh | 707 | 1.3% |
| West Indian | 52 | 0.1% |
| Yaqui | 29 | 0.1% |
| Yugoslavian | 59 | 0.1% | View All 123 Rows |
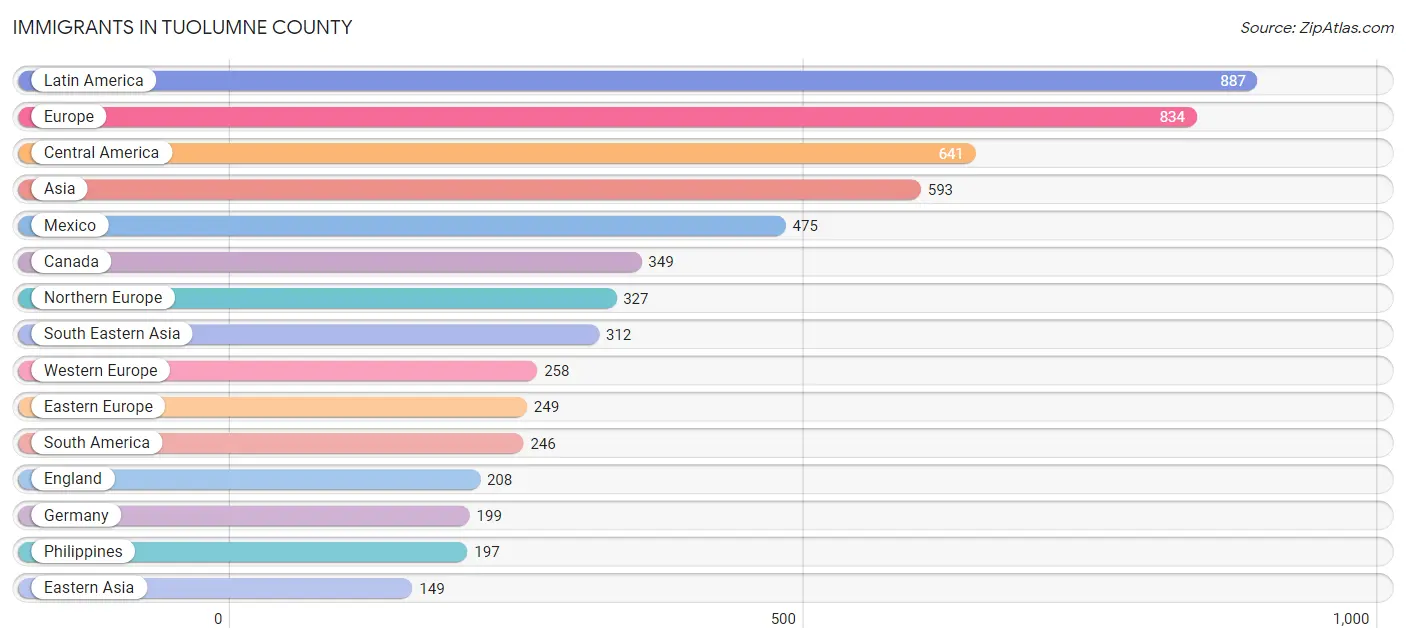
Immigrants in Tuolumne County
The most numerous immigrant groups reported in Tuolumne County came from Latin America (887 | 1.6%), Europe (834 | 1.5%), Central America (641 | 1.2%), Asia (593 | 1.1%), and Mexico (475 | 0.9%), together accounting for 6.2% of all Tuolumne County residents.
| Immigration Origin | # Population | % Population |
| Afghanistan | 9 | 0.0% |
| Africa | 69 | 0.1% |
| Argentina | 37 | 0.1% |
| Asia | 593 | 1.1% |
| Canada | 349 | 0.6% |
| Central America | 641 | 1.2% |
| Chile | 87 | 0.2% |
| China | 47 | 0.1% |
| Colombia | 21 | 0.0% |
| Czechoslovakia | 10 | 0.0% |
| Denmark | 3 | 0.0% |
| Eastern Africa | 39 | 0.1% |
| Eastern Asia | 149 | 0.3% |
| Eastern Europe | 249 | 0.4% |
| El Salvador | 106 | 0.2% |
| England | 208 | 0.4% |
| Europe | 834 | 1.5% |
| Fiji | 1 | 0.0% |
| France | 21 | 0.0% |
| Germany | 199 | 0.4% |
| Guatemala | 38 | 0.1% |
| Honduras | 3 | 0.0% |
| Hong Kong | 22 | 0.0% |
| India | 102 | 0.2% |
| Indonesia | 44 | 0.1% |
| Iran | 21 | 0.0% |
| Ireland | 12 | 0.0% |
| Japan | 45 | 0.1% |
| Kenya | 39 | 0.1% |
| Korea | 57 | 0.1% |
| Laos | 7 | 0.0% |
| Latin America | 887 | 1.6% |
| Latvia | 16 | 0.0% |
| Mexico | 475 | 0.9% |
| Netherlands | 23 | 0.0% |
| Nicaragua | 19 | 0.0% |
| Northern Europe | 327 | 0.6% |
| Norway | 16 | 0.0% |
| Oceania | 2 | 0.0% |
| Peru | 15 | 0.0% |
| Philippines | 197 | 0.4% |
| Poland | 17 | 0.0% |
| Romania | 5 | 0.0% |
| Russia | 148 | 0.3% |
| Scotland | 18 | 0.0% |
| South Africa | 30 | 0.1% |
| South America | 246 | 0.4% |
| South Central Asia | 132 | 0.2% |
| South Eastern Asia | 312 | 0.6% |
| Sweden | 46 | 0.1% |
| Switzerland | 15 | 0.0% |
| Taiwan | 10 | 0.0% |
| Thailand | 4 | 0.0% |
| Uruguay | 56 | 0.1% |
| Venezuela | 30 | 0.1% |
| Vietnam | 57 | 0.1% |
| Western Europe | 258 | 0.5% | View All 57 Rows |
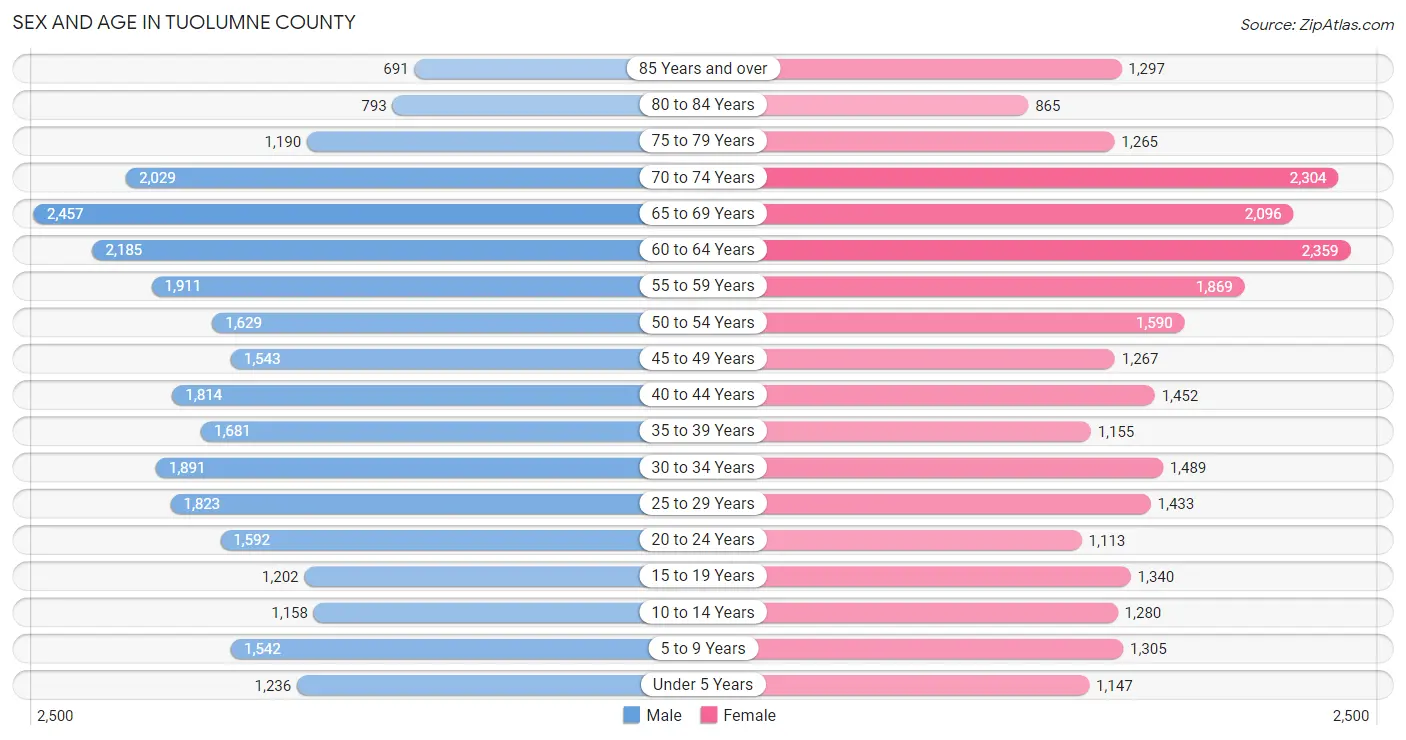
Sex and Age in Tuolumne County
Sex and Age in Tuolumne County
The most populous age groups in Tuolumne County are 65 to 69 Years (2,457 | 8.7%) for men and 60 to 64 Years (2,359 | 8.9%) for women.
| Age Bracket | Male | Female |
| Under 5 Years | 1,236 (4.4%) | 1,147 (4.3%) |
| 5 to 9 Years | 1,542 (5.4%) | 1,305 (4.9%) |
| 10 to 14 Years | 1,158 (4.1%) | 1,280 (4.8%) |
| 15 to 19 Years | 1,202 (4.2%) | 1,340 (5.0%) |
| 20 to 24 Years | 1,592 (5.6%) | 1,113 (4.2%) |
| 25 to 29 Years | 1,823 (6.4%) | 1,433 (5.4%) |
| 30 to 34 Years | 1,891 (6.7%) | 1,489 (5.6%) |
| 35 to 39 Years | 1,681 (5.9%) | 1,155 (4.3%) |
| 40 to 44 Years | 1,814 (6.4%) | 1,452 (5.4%) |
| 45 to 49 Years | 1,543 (5.4%) | 1,267 (4.8%) |
| 50 to 54 Years | 1,629 (5.7%) | 1,590 (6.0%) |
| 55 to 59 Years | 1,911 (6.7%) | 1,869 (7.0%) |
| 60 to 64 Years | 2,185 (7.7%) | 2,359 (8.9%) |
| 65 to 69 Years | 2,457 (8.7%) | 2,096 (7.9%) |
| 70 to 74 Years | 2,029 (7.1%) | 2,304 (8.6%) |
| 75 to 79 Years | 1,190 (4.2%) | 1,265 (4.8%) |
| 80 to 84 Years | 793 (2.8%) | 865 (3.3%) |
| 85 Years and over | 691 (2.4%) | 1,297 (4.9%) |
| Total | 28,367 (100.0%) | 26,626 (100.0%) |
Families and Households in Tuolumne County
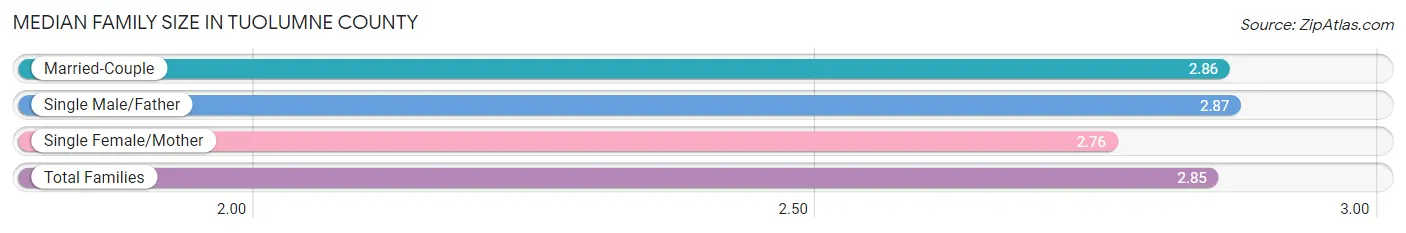
Median Family Size in Tuolumne County
The median family size in Tuolumne County is 2.85 persons per family, with single male/father families (1,101 | 8.2%) accounting for the largest median family size of 2.87 persons per family. On the other hand, single female/mother families (1,775 | 13.3%) represent the smallest median family size with 2.76 persons per family.
| Family Type | # Families | Family Size |
| Married-Couple | 10,510 (78.5%) | 2.86 |
| Single Male/Father | 1,101 (8.2%) | 2.87 |
| Single Female/Mother | 1,775 (13.3%) | 2.76 |
| Total Families | 13,386 (100.0%) | 2.85 |
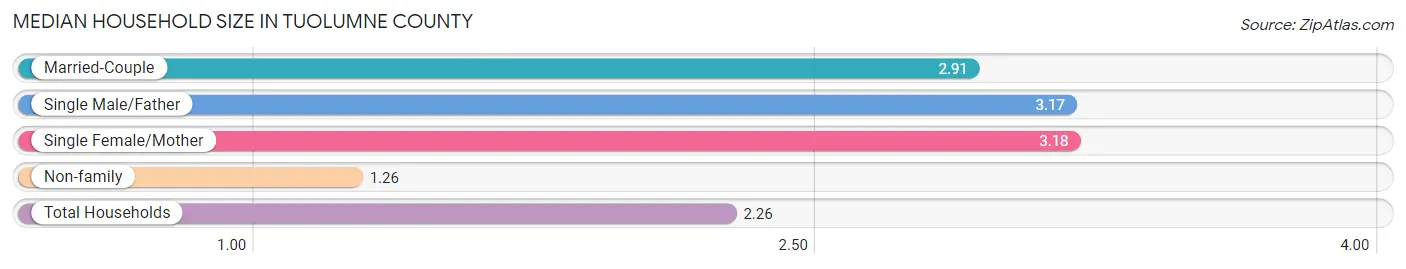
Median Household Size in Tuolumne County
The median household size in Tuolumne County is 2.26 persons per household, with single female/mother households (1,775 | 7.8%) accounting for the largest median household size of 3.18 persons per household. non-family households (9,445 | 41.4%) represent the smallest median household size with 1.26 persons per household.
| Household Type | # Households | Household Size |
| Married-Couple | 10,510 (46.0%) | 2.91 |
| Single Male/Father | 1,101 (4.8%) | 3.17 |
| Single Female/Mother | 1,775 (7.8%) | 3.18 |
| Non-family | 9,445 (41.4%) | 1.26 |
| Total Households | 22,831 (100.0%) | 2.26 |
Household Size by Marriage Status in Tuolumne County
Out of a total of 22,831 households in Tuolumne County, 13,386 (58.6%) are family households, while 9,445 (41.4%) are nonfamily households. The most numerous type of family households are 2-person households, comprising 7,655, and the most common type of nonfamily households are 1-person households, comprising 7,795.
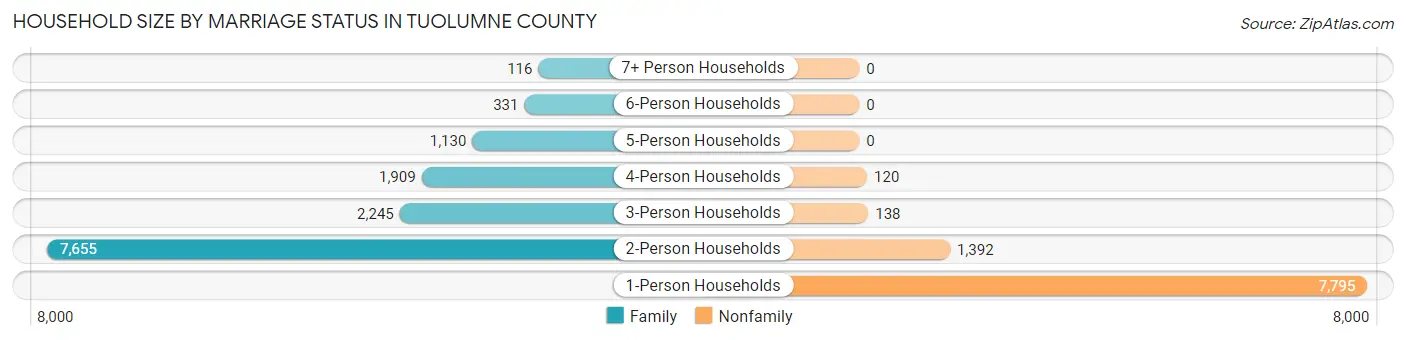
| Household Size | Family Households | Nonfamily Households |
| 1-Person Households | - | 7,795 (34.1%) |
| 2-Person Households | 7,655 (33.5%) | 1,392 (6.1%) |
| 3-Person Households | 2,245 (9.8%) | 138 (0.6%) |
| 4-Person Households | 1,909 (8.4%) | 120 (0.5%) |
| 5-Person Households | 1,130 (5.0%) | 0 (0.0%) |
| 6-Person Households | 331 (1.5%) | 0 (0.0%) |
| 7+ Person Households | 116 (0.5%) | 0 (0.0%) |
| Total | 13,386 (58.6%) | 9,445 (41.4%) |
Female Fertility in Tuolumne County
Fertility by Age in Tuolumne County
Average fertility rate in Tuolumne County is 59.0 births per 1,000 women. Women in the age bracket of 20 to 34 years have the highest fertility rate with 118.0 births per 1,000 women. Women in the age bracket of 20 to 34 years acount for 83.8% of all women with births.
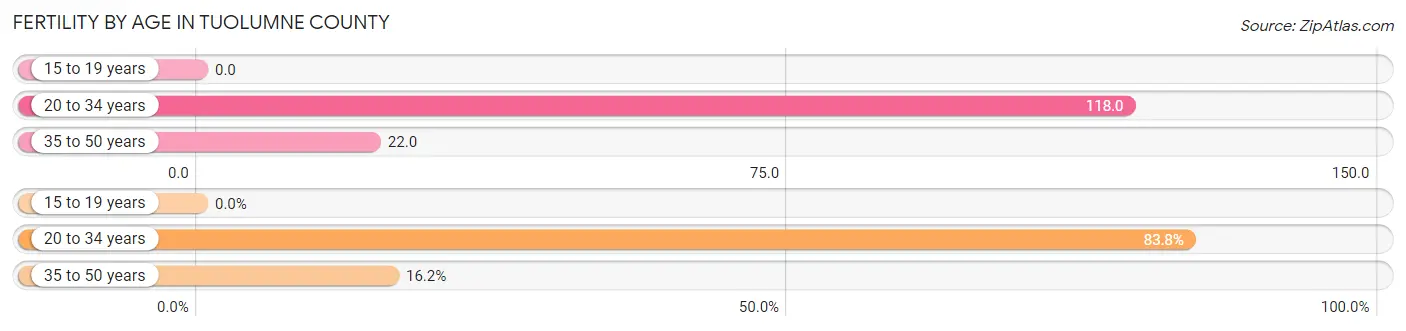
| Age Bracket | Women with Births | Births / 1,000 Women |
| 15 to 19 years | 0 (0.0%) | 0.0 |
| 20 to 34 years | 476 (83.8%) | 118.0 |
| 35 to 50 years | 92 (16.2%) | 22.0 |
| Total | 568 (100.0%) | 59.0 |
Fertility by Age by Marriage Status in Tuolumne County
71.0% of women with births (568) in Tuolumne County are married. The highest percentage of unmarried women with births falls into 20 to 34 years age bracket with 30.9% of them unmarried at the time of birth, while the lowest percentage of unmarried women with births belong to 35 to 50 years age bracket with 19.6% of them unmarried.
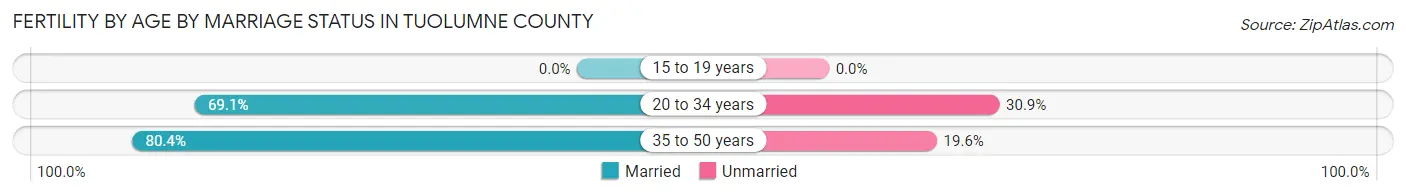
| Age Bracket | Married | Unmarried |
| 15 to 19 years | 0 (0.0%) | 0 (0.0%) |
| 20 to 34 years | 329 (69.1%) | 147 (30.9%) |
| 35 to 50 years | 74 (80.4%) | 18 (19.6%) |
| Total | 403 (71.0%) | 165 (29.0%) |
Fertility by Education in Tuolumne County
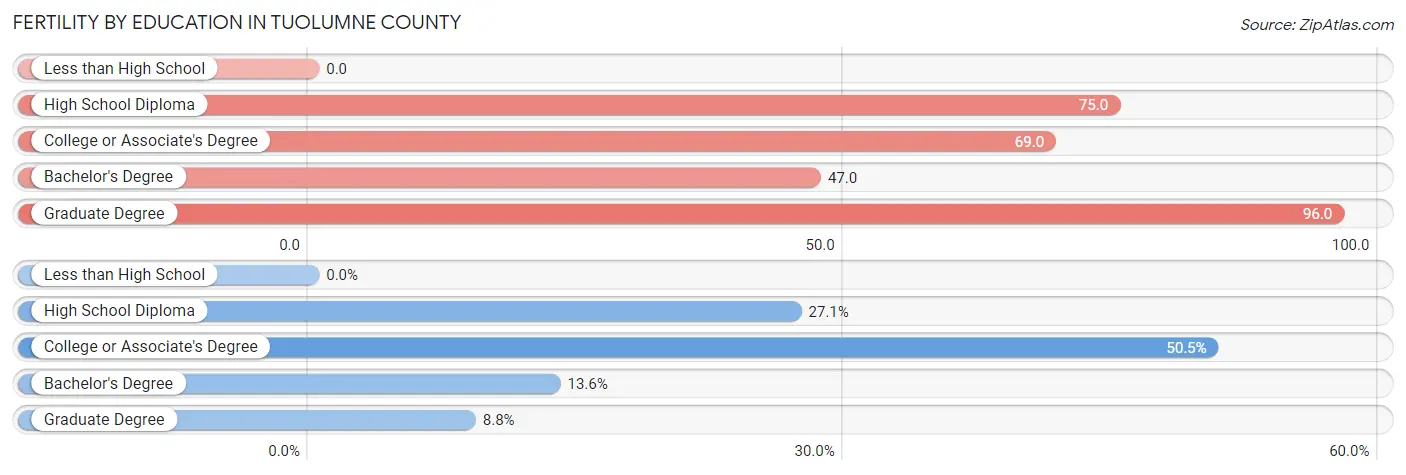
| Educational Attainment | Women with Births | Births / 1,000 Women |
| Less than High School | 0 (0.0%) | 0.0 |
| High School Diploma | 154 (27.1%) | 75.0 |
| College or Associate's Degree | 287 (50.5%) | 69.0 |
| Bachelor's Degree | 77 (13.6%) | 47.0 |
| Graduate Degree | 50 (8.8%) | 96.0 |
| Total | 568 (100.0%) | 59.0 |
Fertility by Education by Marriage Status in Tuolumne County
29.0% of women with births in Tuolumne County are unmarried. Women with the educational attainment of graduate degree are most likely to be married with 100.0% of them married at childbirth, while women with the educational attainment of bachelor's degree are least likely to be married with 55.8% of them unmarried at childbirth.
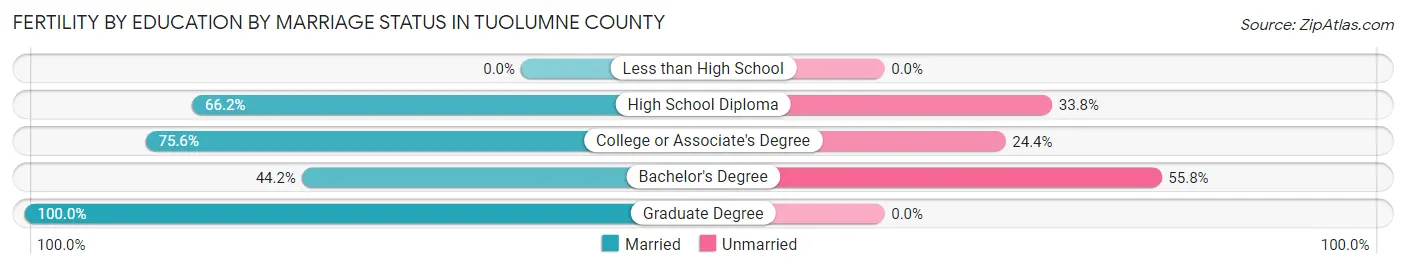
| Educational Attainment | Married | Unmarried |
| Less than High School | 0 (0.0%) | 0 (0.0%) |
| High School Diploma | 102 (66.2%) | 52 (33.8%) |
| College or Associate's Degree | 217 (75.6%) | 70 (24.4%) |
| Bachelor's Degree | 34 (44.2%) | 43 (55.8%) |
| Graduate Degree | 50 (100.0%) | 0 (0.0%) |
| Total | 403 (71.0%) | 165 (29.0%) |
Employment Characteristics in Tuolumne County
Employment by Class of Employer in Tuolumne County
Among the 19,951 employed individuals in Tuolumne County, private company employees (10,734 | 53.8%), local government employees (2,219 | 11.1%), and self-employed (not incorporated) (2,175 | 10.9%) make up the most common classes of employment.
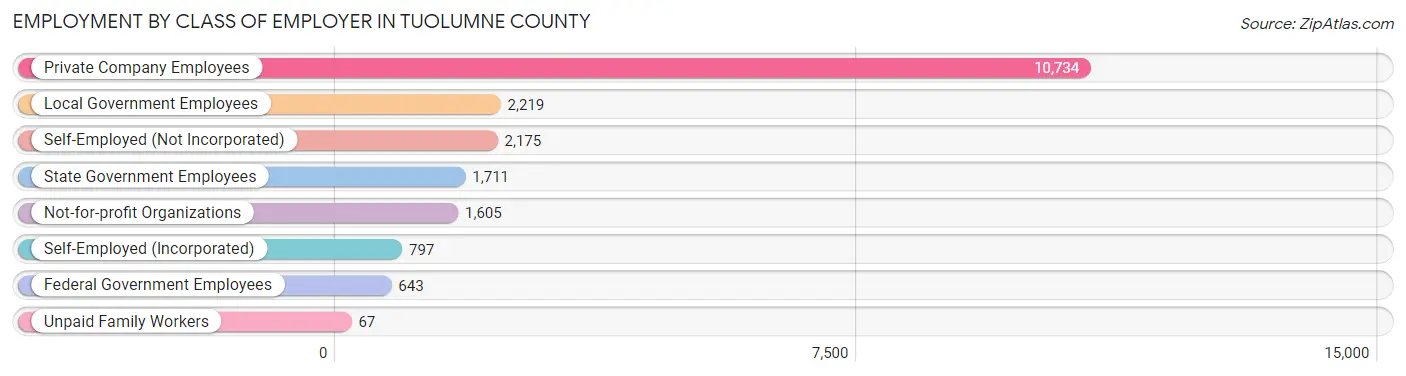
| Employer Class | # Employees | % Employees |
| Private Company Employees | 10,734 | 53.8% |
| Self-Employed (Incorporated) | 797 | 4.0% |
| Self-Employed (Not Incorporated) | 2,175 | 10.9% |
| Not-for-profit Organizations | 1,605 | 8.0% |
| Local Government Employees | 2,219 | 11.1% |
| State Government Employees | 1,711 | 8.6% |
| Federal Government Employees | 643 | 3.2% |
| Unpaid Family Workers | 67 | 0.3% |
| Total | 19,951 | 100.0% |
Employment Status by Age in Tuolumne County
According to the labor force statistics for Tuolumne County, out of the total population over 16 years of age (46,547), 48.8% or 22,715 individuals are in the labor force, with 8.3% or 1,885 of them unemployed. The age group with the highest labor force participation rate is 30 to 34 years, with 72.5% or 2,450 individuals in the labor force. Within the labor force, the 16 to 19 years age range has the highest percentage of unemployed individuals, with 33.2% or 268 of them being unemployed.
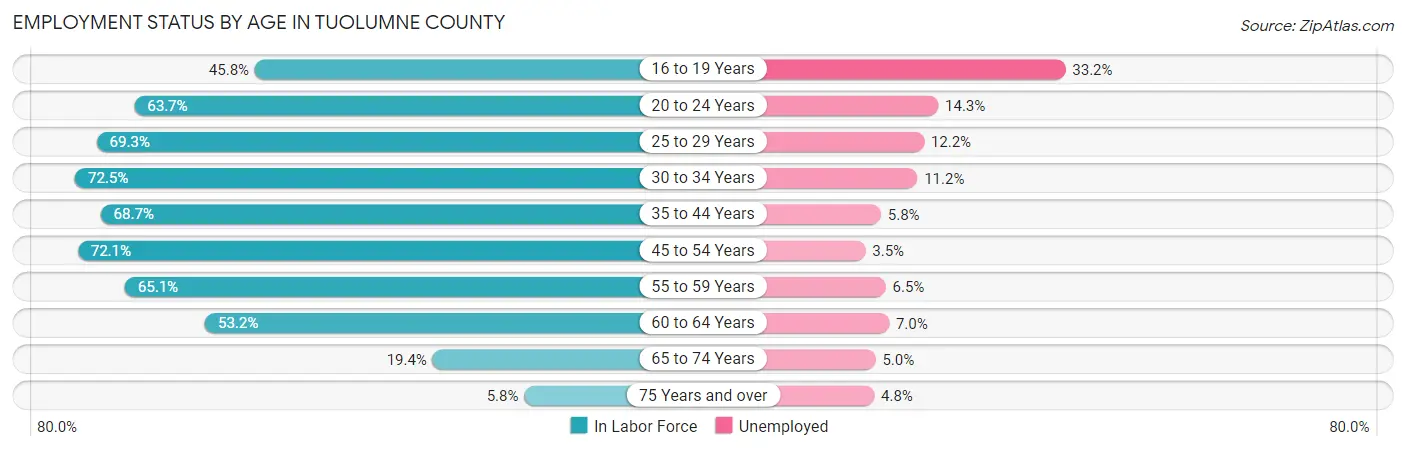
| Age Bracket | In Labor Force | Unemployed |
| 16 to 19 Years | 808 (45.8%) | 268 (33.2%) |
| 20 to 24 Years | 1,723 (63.7%) | 246 (14.3%) |
| 25 to 29 Years | 2,256 (69.3%) | 275 (12.2%) |
| 30 to 34 Years | 2,450 (72.5%) | 274 (11.2%) |
| 35 to 44 Years | 4,192 (68.7%) | 243 (5.8%) |
| 45 to 54 Years | 4,347 (72.1%) | 152 (3.5%) |
| 55 to 59 Years | 2,461 (65.1%) | 160 (6.5%) |
| 60 to 64 Years | 2,417 (53.2%) | 169 (7.0%) |
| 65 to 74 Years | 1,724 (19.4%) | 86 (5.0%) |
| 75 Years and over | 354 (5.8%) | 17 (4.8%) |
| Total | 22,715 (48.8%) | 1,885 (8.3%) |
Employment Status by Educational Attainment in Tuolumne County
According to labor force statistics for Tuolumne County, 66.9% of individuals (18,124) out of the total population between 25 and 64 years of age (27,091) are in the labor force, with 7.0% or 1,269 of them being unemployed. The group with the highest labor force participation rate are those with the educational attainment of bachelor's degree or higher, with 80.8% or 4,858 individuals in the labor force. Within the labor force, individuals with less than high school education have the highest percentage of unemployment, with 21.1% or 175 of them being unemployed.
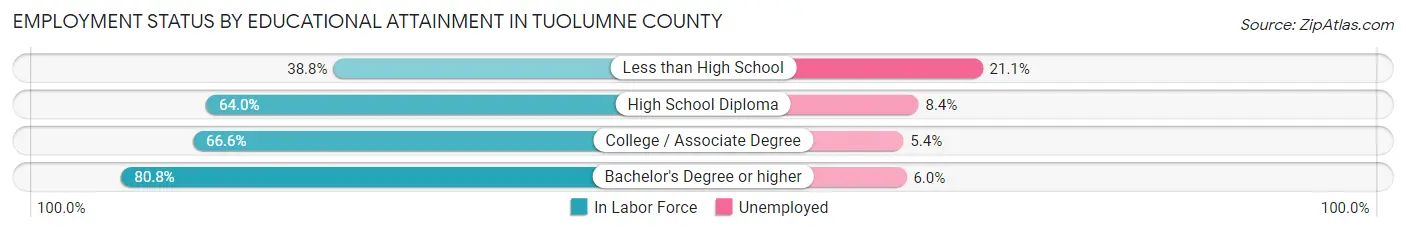
| Educational Attainment | In Labor Force | Unemployed |
| Less than High School | 828 (38.8%) | 450 (21.1%) |
| High School Diploma | 4,541 (64.0%) | 596 (8.4%) |
| College / Associate Degree | 7,893 (66.6%) | 640 (5.4%) |
| Bachelor's Degree or higher | 4,858 (80.8%) | 361 (6.0%) |
| Total | 18,124 (66.9%) | 1,896 (7.0%) |
Employment Occupations by Sex in Tuolumne County
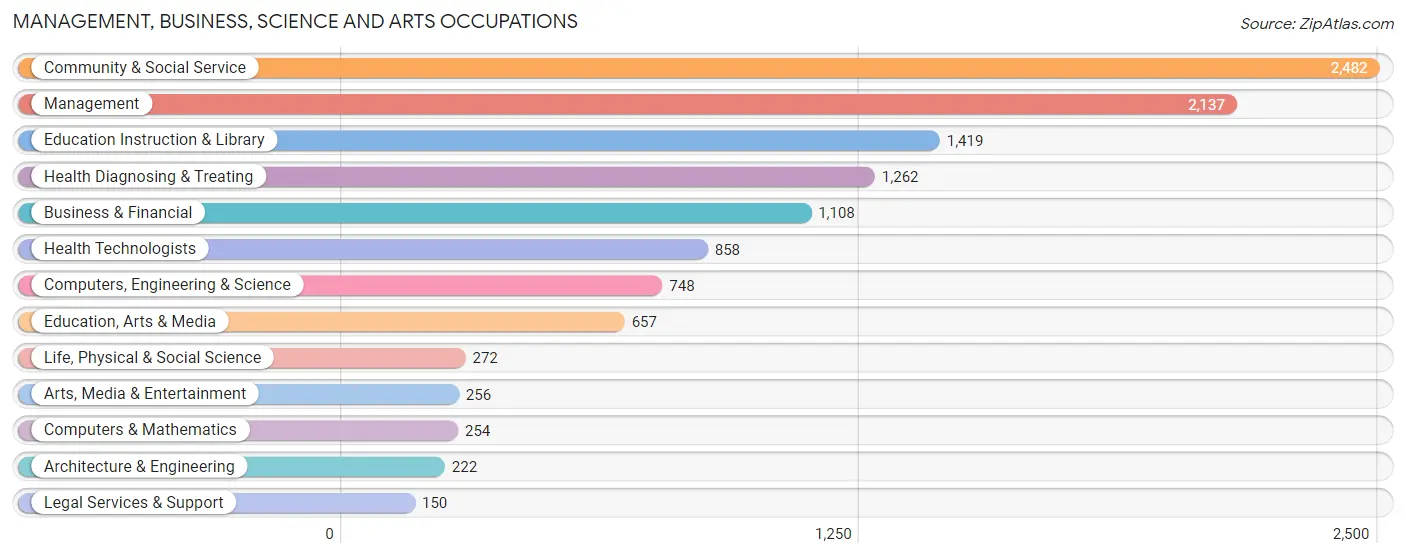
Management, Business, Science and Arts Occupations
The most common Management, Business, Science and Arts occupations in Tuolumne County are Community & Social Service (2,482 | 11.9%), Management (2,137 | 10.3%), Education Instruction & Library (1,419 | 6.8%), Health Diagnosing & Treating (1,262 | 6.1%), and Business & Financial (1,108 | 5.3%).
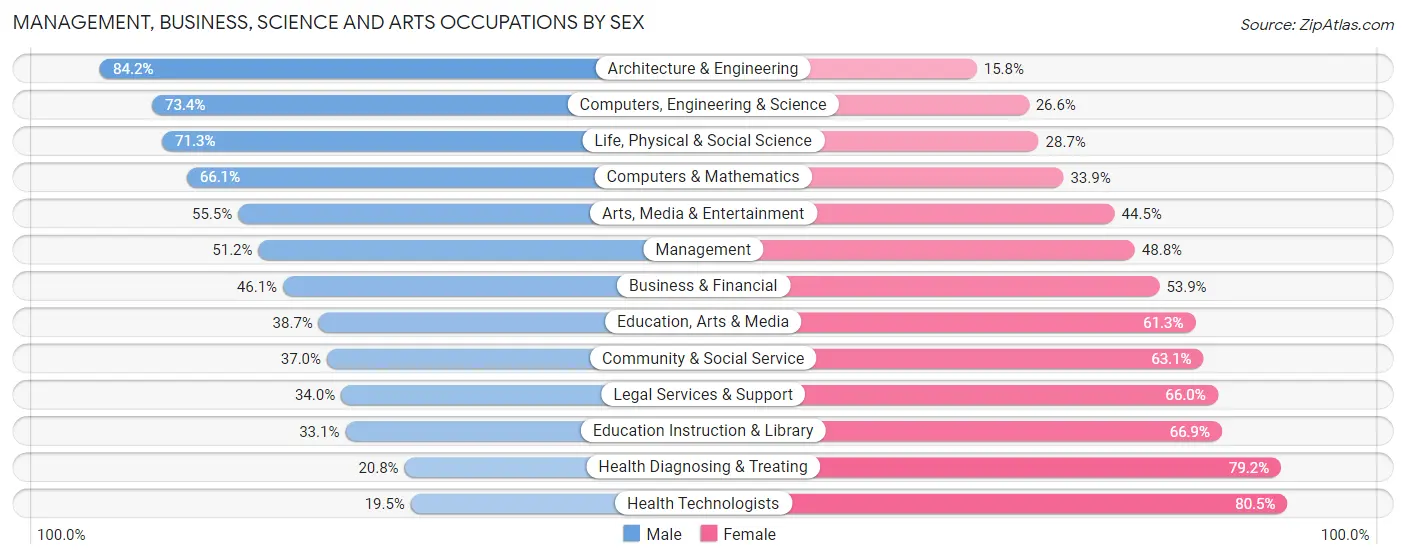
Management, Business, Science and Arts Occupations by Sex
Within the Management, Business, Science and Arts occupations in Tuolumne County, the most male-oriented occupations are Architecture & Engineering (84.2%), Computers, Engineering & Science (73.4%), and Life, Physical & Social Science (71.3%), while the most female-oriented occupations are Health Technologists (80.5%), Health Diagnosing & Treating (79.2%), and Education Instruction & Library (66.9%).
| Occupation | Male | Female |
| Management | 1,095 (51.2%) | 1,042 (48.8%) |
| Business & Financial | 511 (46.1%) | 597 (53.9%) |
| Computers, Engineering & Science | 549 (73.4%) | 199 (26.6%) |
| Computers & Mathematics | 168 (66.1%) | 86 (33.9%) |
| Architecture & Engineering | 187 (84.2%) | 35 (15.8%) |
| Life, Physical & Social Science | 194 (71.3%) | 78 (28.7%) |
| Community & Social Service | 917 (36.9%) | 1,565 (63.0%) |
| Education, Arts & Media | 254 (38.7%) | 403 (61.3%) |
| Legal Services & Support | 51 (34.0%) | 99 (66.0%) |
| Education Instruction & Library | 470 (33.1%) | 949 (66.9%) |
| Arts, Media & Entertainment | 142 (55.5%) | 114 (44.5%) |
| Health Diagnosing & Treating | 262 (20.8%) | 1,000 (79.2%) |
| Health Technologists | 167 (19.5%) | 691 (80.5%) |
| Total (Category) | 3,334 (43.1%) | 4,403 (56.9%) |
| Total (Overall) | 10,552 (50.7%) | 10,277 (49.3%) |
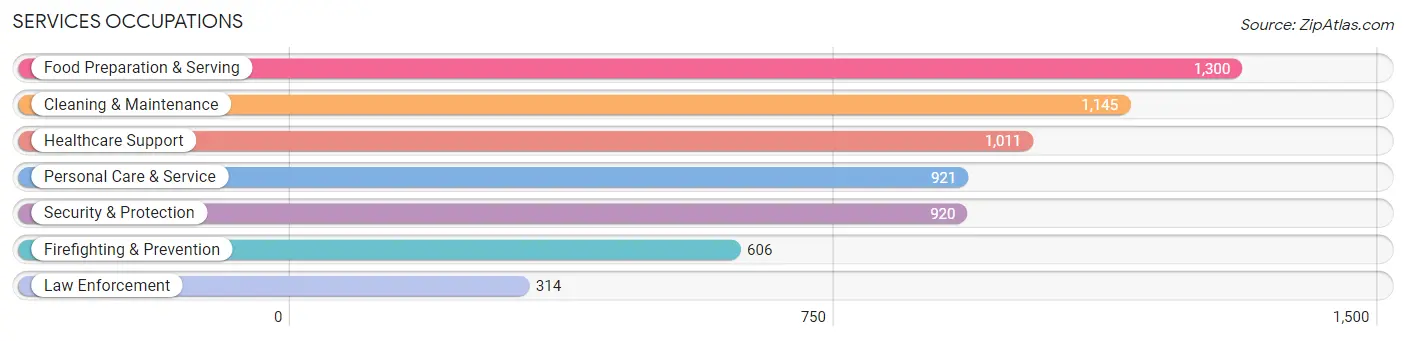
Services Occupations
The most common Services occupations in Tuolumne County are Food Preparation & Serving (1,300 | 6.2%), Cleaning & Maintenance (1,145 | 5.5%), Healthcare Support (1,011 | 4.9%), Personal Care & Service (921 | 4.4%), and Security & Protection (920 | 4.4%).
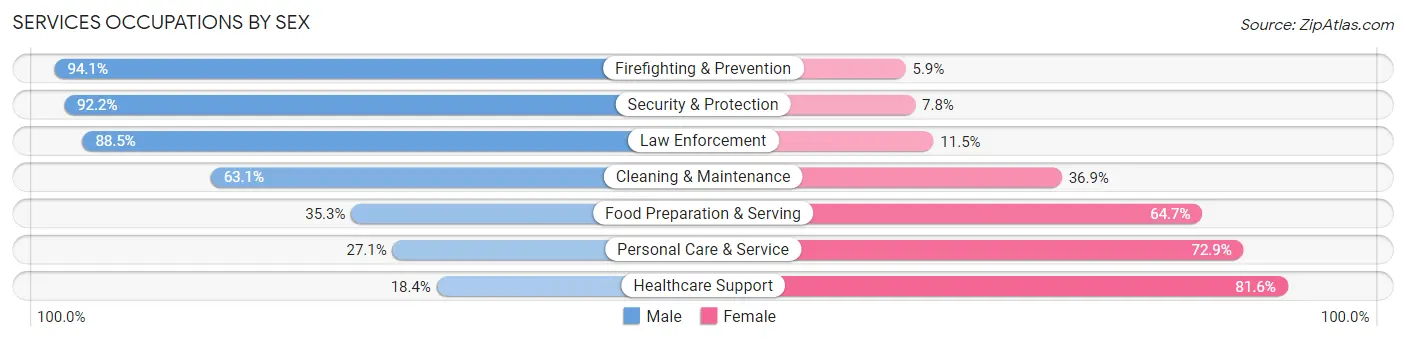
Services Occupations by Sex
Within the Services occupations in Tuolumne County, the most male-oriented occupations are Firefighting & Prevention (94.1%), Security & Protection (92.2%), and Law Enforcement (88.5%), while the most female-oriented occupations are Healthcare Support (81.6%), Personal Care & Service (72.9%), and Food Preparation & Serving (64.7%).
| Occupation | Male | Female |
| Healthcare Support | 186 (18.4%) | 825 (81.6%) |
| Security & Protection | 848 (92.2%) | 72 (7.8%) |
| Firefighting & Prevention | 570 (94.1%) | 36 (5.9%) |
| Law Enforcement | 278 (88.5%) | 36 (11.5%) |
| Food Preparation & Serving | 459 (35.3%) | 841 (64.7%) |
| Cleaning & Maintenance | 723 (63.1%) | 422 (36.9%) |
| Personal Care & Service | 250 (27.1%) | 671 (72.9%) |
| Total (Category) | 2,466 (46.6%) | 2,831 (53.4%) |
| Total (Overall) | 10,552 (50.7%) | 10,277 (49.3%) |
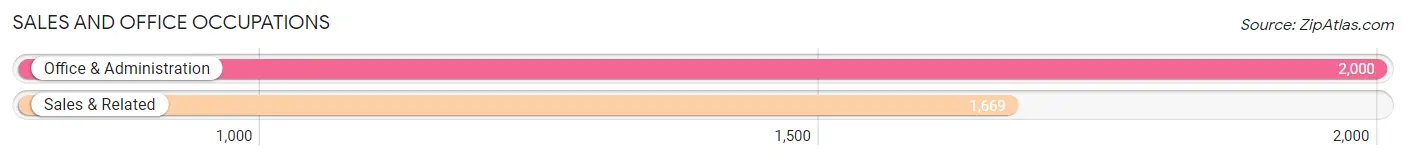
Sales and Office Occupations
The most common Sales and Office occupations in Tuolumne County are Office & Administration (2,000 | 9.6%), and Sales & Related (1,669 | 8.0%).
Sales and Office Occupations by Sex

| Occupation | Male | Female |
| Sales & Related | 861 (51.6%) | 808 (48.4%) |
| Office & Administration | 346 (17.3%) | 1,654 (82.7%) |
| Total (Category) | 1,207 (32.9%) | 2,462 (67.1%) |
| Total (Overall) | 10,552 (50.7%) | 10,277 (49.3%) |
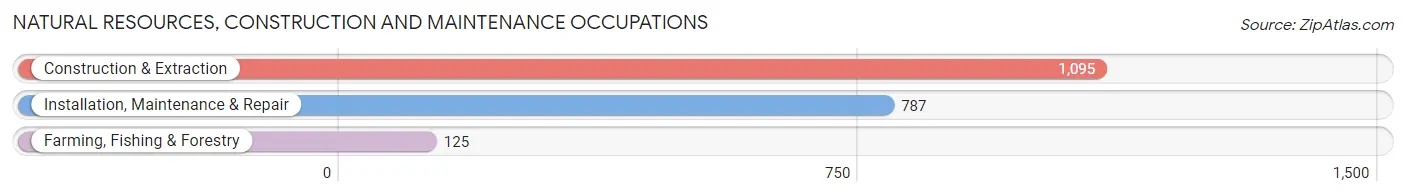
Natural Resources, Construction and Maintenance Occupations
The most common Natural Resources, Construction and Maintenance occupations in Tuolumne County are Construction & Extraction (1,095 | 5.3%), Installation, Maintenance & Repair (787 | 3.8%), and Farming, Fishing & Forestry (125 | 0.6%).
Natural Resources, Construction and Maintenance Occupations by Sex
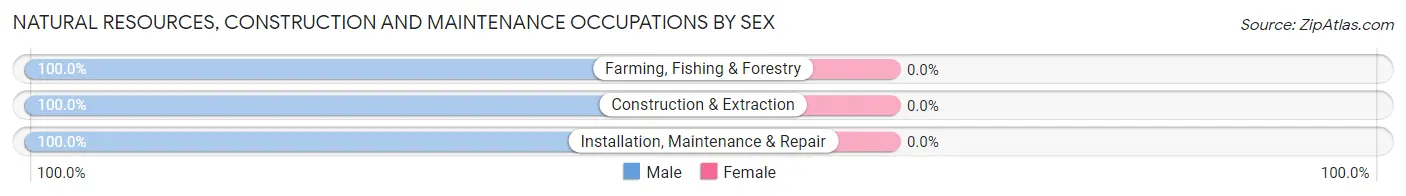
| Occupation | Male | Female |
| Farming, Fishing & Forestry | 125 (100.0%) | 0 (0.0%) |
| Construction & Extraction | 1,095 (100.0%) | 0 (0.0%) |
| Installation, Maintenance & Repair | 787 (100.0%) | 0 (0.0%) |
| Total (Category) | 2,007 (100.0%) | 0 (0.0%) |
| Total (Overall) | 10,552 (50.7%) | 10,277 (49.3%) |
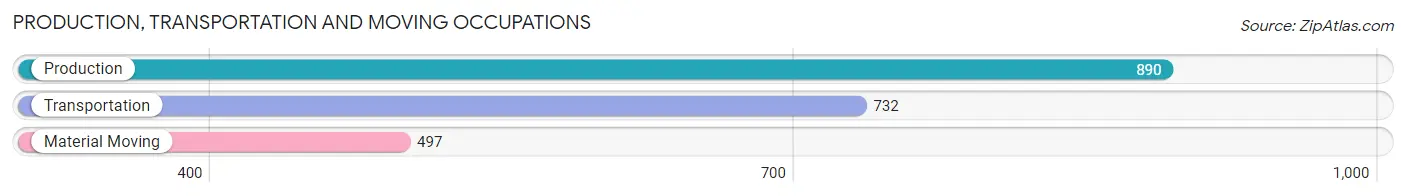
Production, Transportation and Moving Occupations
The most common Production, Transportation and Moving occupations in Tuolumne County are Production (890 | 4.3%), Transportation (732 | 3.5%), and Material Moving (497 | 2.4%).
Production, Transportation and Moving Occupations by Sex
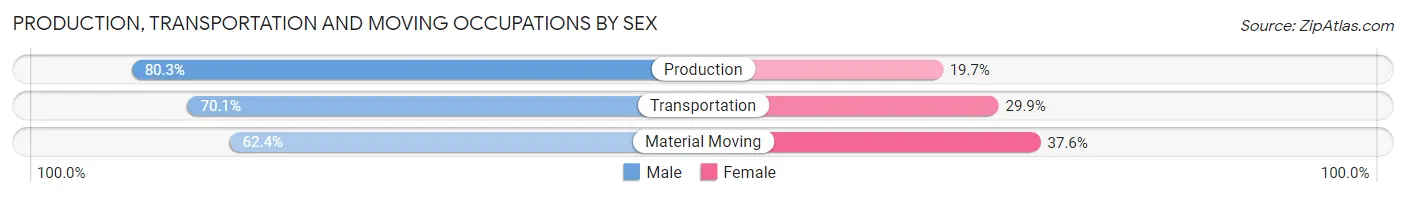
| Occupation | Male | Female |
| Production | 715 (80.3%) | 175 (19.7%) |
| Transportation | 513 (70.1%) | 219 (29.9%) |
| Material Moving | 310 (62.4%) | 187 (37.6%) |
| Total (Category) | 1,538 (72.6%) | 581 (27.4%) |
| Total (Overall) | 10,552 (50.7%) | 10,277 (49.3%) |
Employment Industries by Sex in Tuolumne County
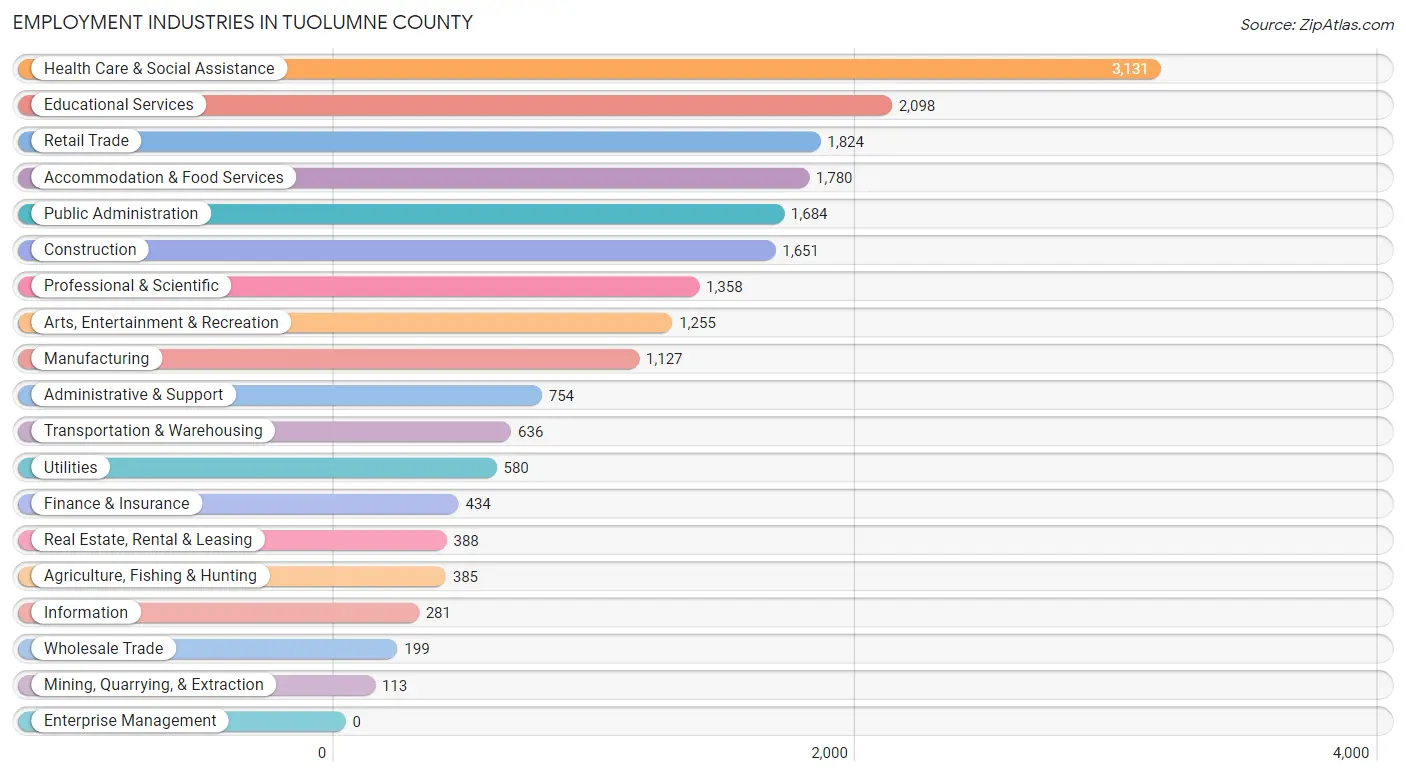
Employment Industries in Tuolumne County
The major employment industries in Tuolumne County include Health Care & Social Assistance (3,131 | 15.0%), Educational Services (2,098 | 10.1%), Retail Trade (1,824 | 8.8%), Accommodation & Food Services (1,780 | 8.6%), and Public Administration (1,684 | 8.1%).
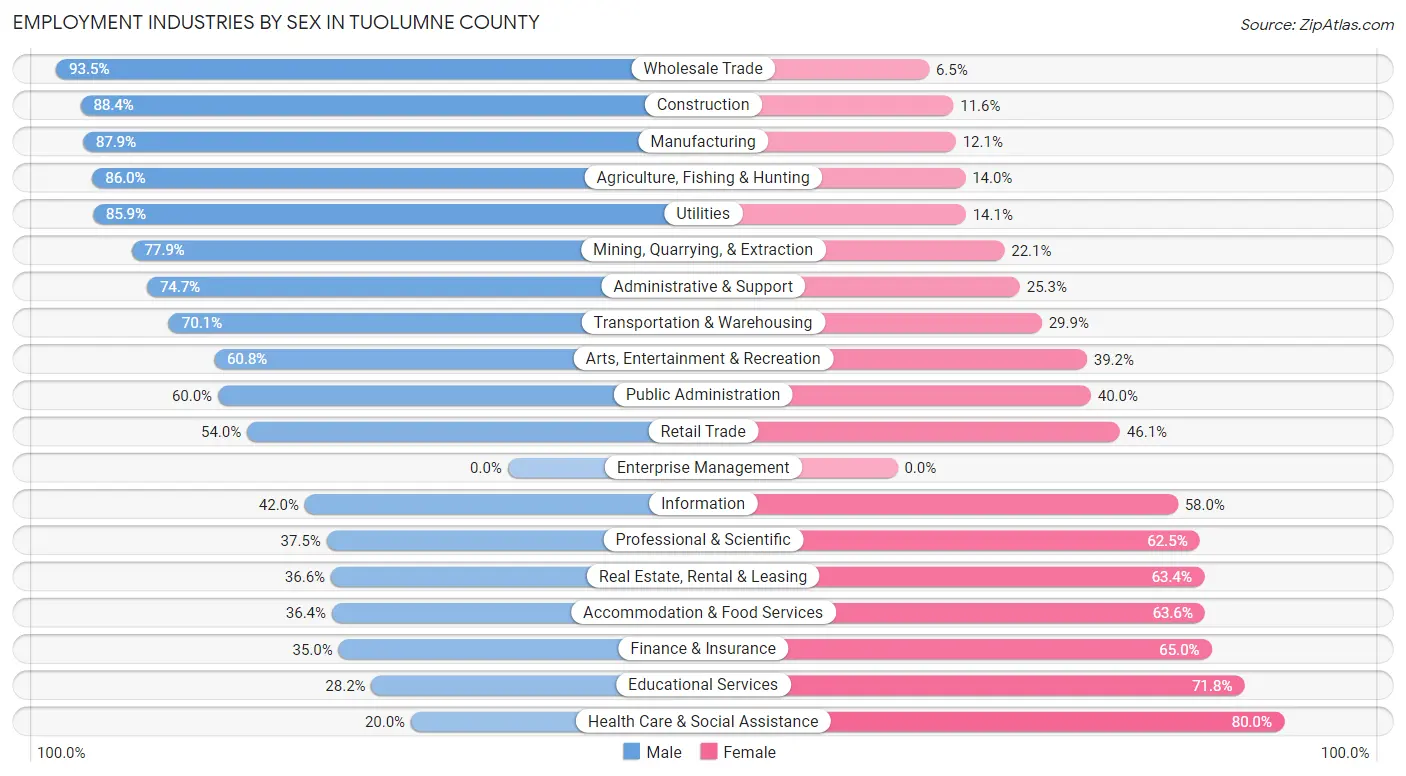
Employment Industries by Sex in Tuolumne County
The Tuolumne County industries that see more men than women are Wholesale Trade (93.5%), Construction (88.4%), and Manufacturing (87.9%), whereas the industries that tend to have a higher number of women are Health Care & Social Assistance (80.0%), Educational Services (71.8%), and Finance & Insurance (65.0%).
| Industry | Male | Female |
| Agriculture, Fishing & Hunting | 331 (86.0%) | 54 (14.0%) |
| Mining, Quarrying, & Extraction | 88 (77.9%) | 25 (22.1%) |
| Construction | 1,460 (88.4%) | 191 (11.6%) |
| Manufacturing | 991 (87.9%) | 136 (12.1%) |
| Wholesale Trade | 186 (93.5%) | 13 (6.5%) |
| Retail Trade | 984 (53.9%) | 840 (46.1%) |
| Transportation & Warehousing | 446 (70.1%) | 190 (29.9%) |
| Utilities | 498 (85.9%) | 82 (14.1%) |
| Information | 118 (42.0%) | 163 (58.0%) |
| Finance & Insurance | 152 (35.0%) | 282 (65.0%) |
| Real Estate, Rental & Leasing | 142 (36.6%) | 246 (63.4%) |
| Professional & Scientific | 509 (37.5%) | 849 (62.5%) |
| Enterprise Management | 0 (0.0%) | 0 (0.0%) |
| Administrative & Support | 563 (74.7%) | 191 (25.3%) |
| Educational Services | 592 (28.2%) | 1,506 (71.8%) |
| Health Care & Social Assistance | 627 (20.0%) | 2,504 (80.0%) |
| Arts, Entertainment & Recreation | 763 (60.8%) | 492 (39.2%) |
| Accommodation & Food Services | 648 (36.4%) | 1,132 (63.6%) |
| Public Administration | 1,010 (60.0%) | 674 (40.0%) |
| Total | 10,552 (50.7%) | 10,277 (49.3%) |
Education in Tuolumne County
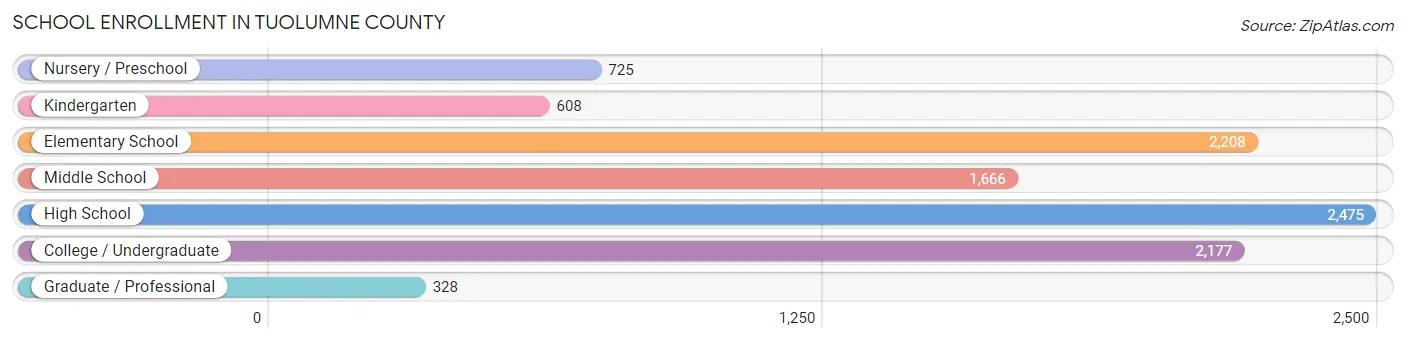
School Enrollment in Tuolumne County
The most common levels of schooling among the 10,187 students in Tuolumne County are high school (2,475 | 24.3%), elementary school (2,208 | 21.7%), and college / undergraduate (2,177 | 21.4%).
| School Level | # Students | % Students |
| Nursery / Preschool | 725 | 7.1% |
| Kindergarten | 608 | 6.0% |
| Elementary School | 2,208 | 21.7% |
| Middle School | 1,666 | 16.4% |
| High School | 2,475 | 24.3% |
| College / Undergraduate | 2,177 | 21.4% |
| Graduate / Professional | 328 | 3.2% |
| Total | 10,187 | 100.0% |
School Enrollment by Age by Funding Source in Tuolumne County
Out of a total of 10,187 students who are enrolled in schools in Tuolumne County, 2,526 (24.8%) attend a private institution, while the remaining 7,661 (75.2%) are enrolled in public schools. The age group of 3 to 4 year olds has the highest likelihood of being enrolled in private schools, with 291 (60.1% in the age bracket) enrolled. Conversely, the age group of 15 to 17 year olds has the lowest likelihood of being enrolled in a private school, with 1,427 (89.9% in the age bracket) attending a public institution.
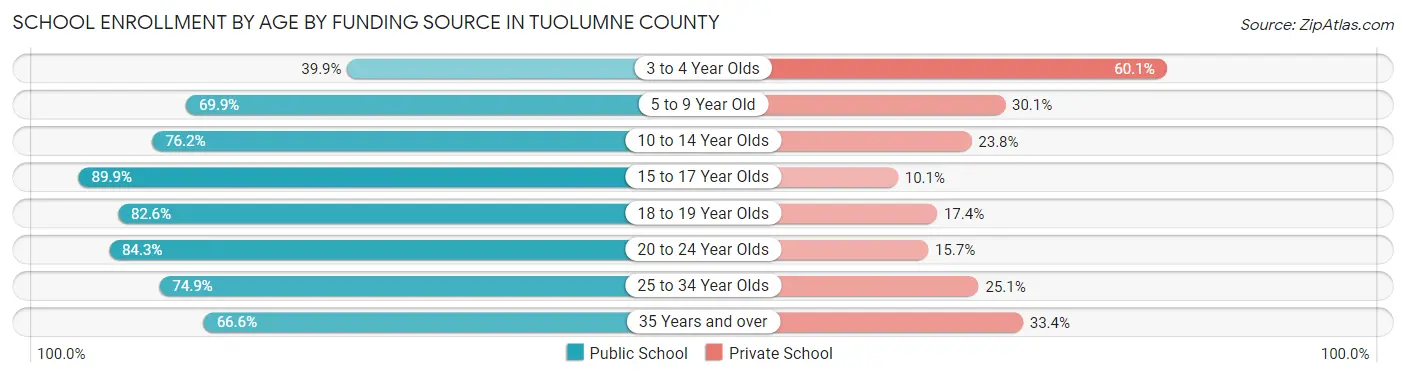
| Age Bracket | Public School | Private School |
| 3 to 4 Year Olds | 193 (39.9%) | 291 (60.1%) |
| 5 to 9 Year Old | 1,838 (69.9%) | 790 (30.1%) |
| 10 to 14 Year Olds | 1,837 (76.2%) | 573 (23.8%) |
| 15 to 17 Year Olds | 1,427 (89.9%) | 160 (10.1%) |
| 18 to 19 Year Olds | 542 (82.6%) | 114 (17.4%) |
| 20 to 24 Year Olds | 670 (84.3%) | 125 (15.7%) |
| 25 to 34 Year Olds | 599 (74.9%) | 201 (25.1%) |
| 35 Years and over | 551 (66.6%) | 276 (33.4%) |
| Total | 7,661 (75.2%) | 2,526 (24.8%) |
Educational Attainment by Field of Study in Tuolumne County
Business (1,839 | 16.2%), science & technology (1,145 | 10.1%), education (1,142 | 10.1%), arts & humanities (989 | 8.7%), and bio, nature & agricultural (909 | 8.0%) are the most common fields of study among 11,357 individuals in Tuolumne County who have obtained a bachelor's degree or higher.
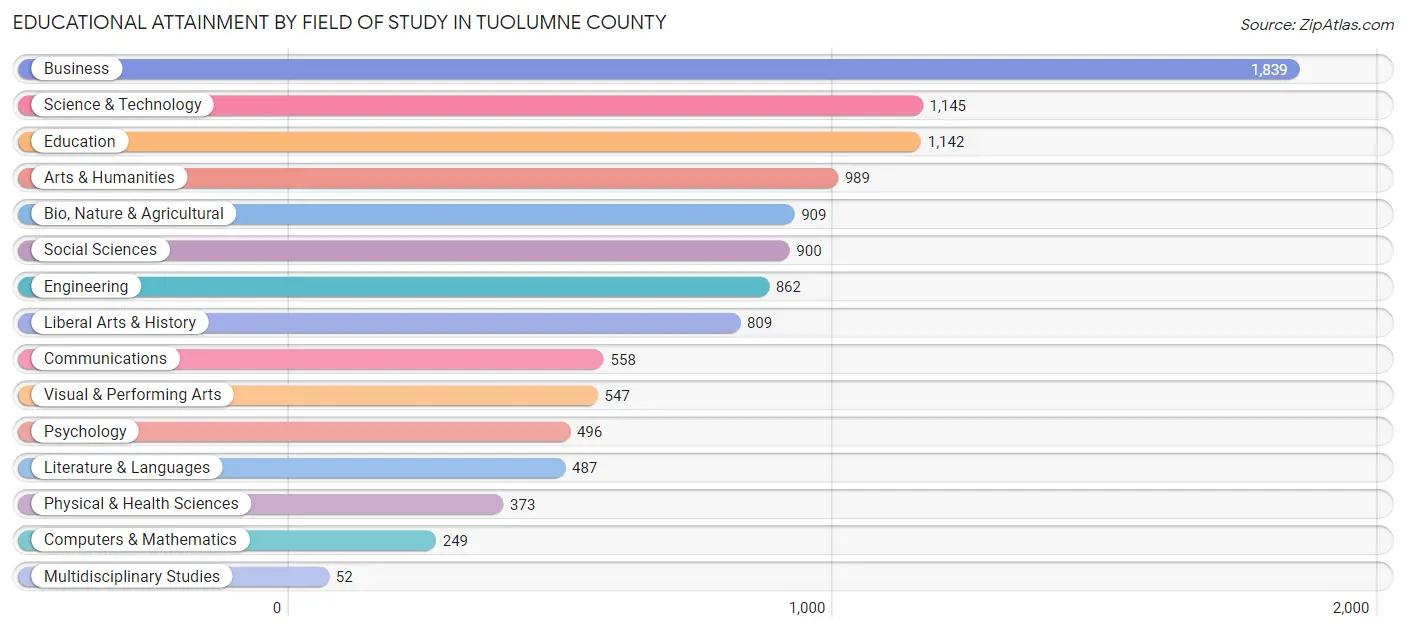
| Field of Study | # Graduates | % Graduates |
| Computers & Mathematics | 249 | 2.2% |
| Bio, Nature & Agricultural | 909 | 8.0% |
| Physical & Health Sciences | 373 | 3.3% |
| Psychology | 496 | 4.4% |
| Social Sciences | 900 | 7.9% |
| Engineering | 862 | 7.6% |
| Multidisciplinary Studies | 52 | 0.5% |
| Science & Technology | 1,145 | 10.1% |
| Business | 1,839 | 16.2% |
| Education | 1,142 | 10.1% |
| Literature & Languages | 487 | 4.3% |
| Liberal Arts & History | 809 | 7.1% |
| Visual & Performing Arts | 547 | 4.8% |
| Communications | 558 | 4.9% |
| Arts & Humanities | 989 | 8.7% |
| Total | 11,357 | 100.0% |
Transportation & Commute in Tuolumne County
Vehicle Availability by Sex in Tuolumne County
The most prevalent vehicle ownership categories in Tuolumne County are males with 2 vehicles (3,543, accounting for 35.5%) and females with 2 vehicles (3,349, making up 36.7%).
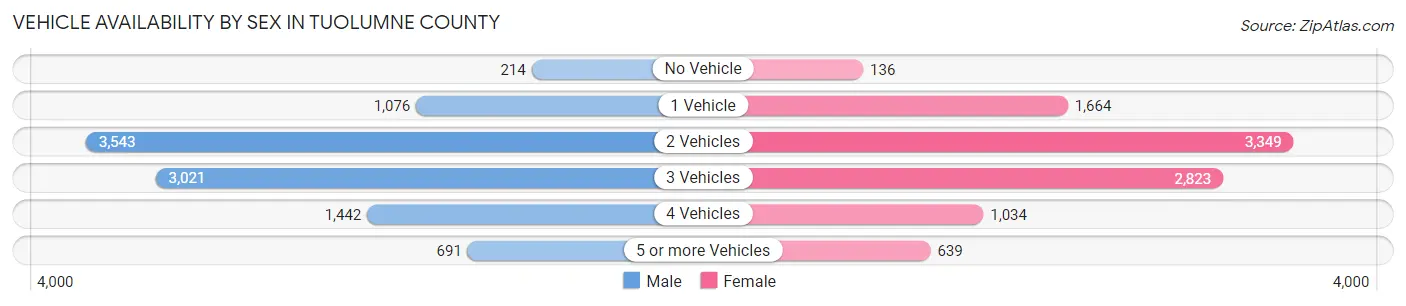
| Vehicles Available | Male | Female |
| No Vehicle | 214 (2.1%) | 136 (1.4%) |
| 1 Vehicle | 1,076 (10.8%) | 1,664 (17.2%) |
| 2 Vehicles | 3,543 (35.5%) | 3,349 (34.7%) |
| 3 Vehicles | 3,021 (30.2%) | 2,823 (29.3%) |
| 4 Vehicles | 1,442 (14.4%) | 1,034 (10.7%) |
| 5 or more Vehicles | 691 (6.9%) | 639 (6.6%) |
| Total | 9,987 (100.0%) | 9,645 (100.0%) |
Commute Time in Tuolumne County
The most frequently occuring commute durations in Tuolumne County are 15 to 19 minutes (3,060 commuters, 17.2%), 10 to 14 minutes (2,772 commuters, 15.6%), and 5 to 9 minutes (2,534 commuters, 14.3%).
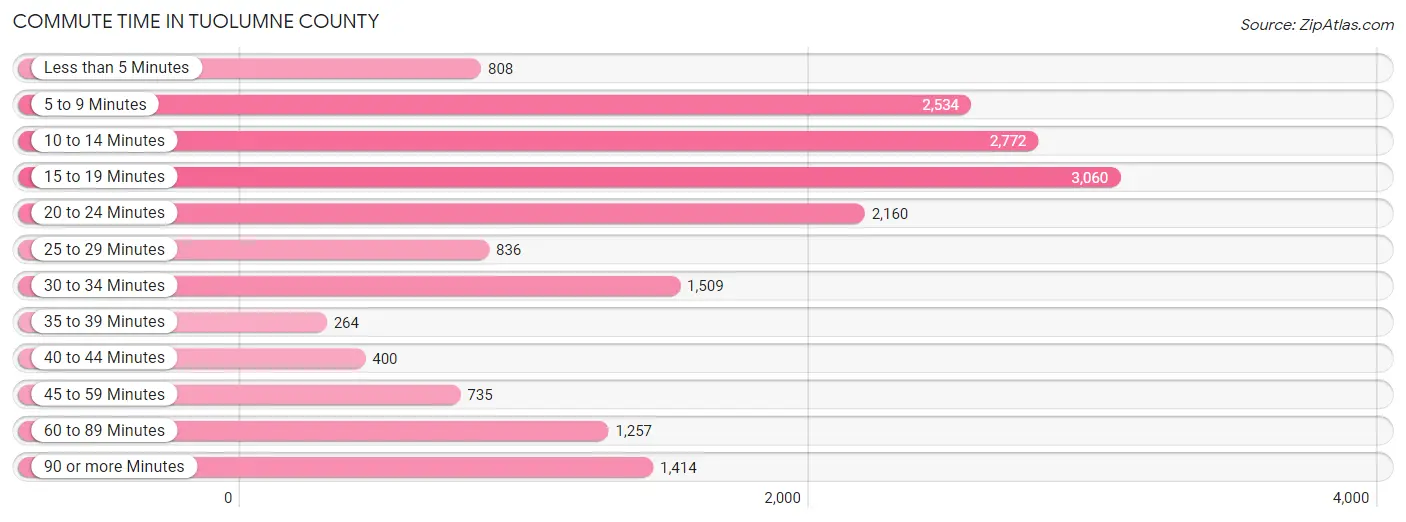
| Commute Time | # Commuters | % Commuters |
| Less than 5 Minutes | 808 | 4.5% |
| 5 to 9 Minutes | 2,534 | 14.3% |
| 10 to 14 Minutes | 2,772 | 15.6% |
| 15 to 19 Minutes | 3,060 | 17.2% |
| 20 to 24 Minutes | 2,160 | 12.2% |
| 25 to 29 Minutes | 836 | 4.7% |
| 30 to 34 Minutes | 1,509 | 8.5% |
| 35 to 39 Minutes | 264 | 1.5% |
| 40 to 44 Minutes | 400 | 2.2% |
| 45 to 59 Minutes | 735 | 4.1% |
| 60 to 89 Minutes | 1,257 | 7.1% |
| 90 or more Minutes | 1,414 | 8.0% |
Commute Time by Sex in Tuolumne County
The most common commute times in Tuolumne County are 15 to 19 minutes (1,468 commuters, 15.8%) for males and 15 to 19 minutes (1,592 commuters, 18.9%) for females.
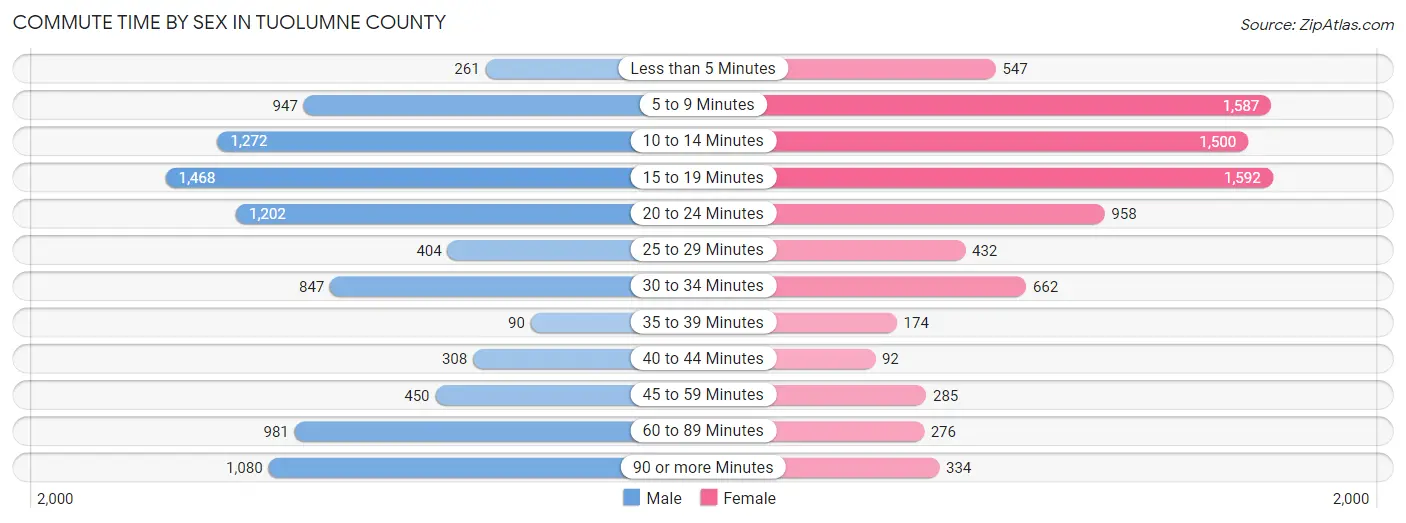
| Commute Time | Male | Female |
| Less than 5 Minutes | 261 (2.8%) | 547 (6.5%) |
| 5 to 9 Minutes | 947 (10.2%) | 1,587 (18.8%) |
| 10 to 14 Minutes | 1,272 (13.7%) | 1,500 (17.8%) |
| 15 to 19 Minutes | 1,468 (15.8%) | 1,592 (18.9%) |
| 20 to 24 Minutes | 1,202 (12.9%) | 958 (11.4%) |
| 25 to 29 Minutes | 404 (4.3%) | 432 (5.1%) |
| 30 to 34 Minutes | 847 (9.1%) | 662 (7.8%) |
| 35 to 39 Minutes | 90 (1.0%) | 174 (2.1%) |
| 40 to 44 Minutes | 308 (3.3%) | 92 (1.1%) |
| 45 to 59 Minutes | 450 (4.8%) | 285 (3.4%) |
| 60 to 89 Minutes | 981 (10.5%) | 276 (3.3%) |
| 90 or more Minutes | 1,080 (11.6%) | 334 (4.0%) |
Time of Departure to Work by Sex in Tuolumne County
The most frequent times of departure to work in Tuolumne County are 6:00 AM to 6:29 AM (1,241, 13.3%) for males and 7:30 AM to 7:59 AM (1,586, 18.8%) for females.
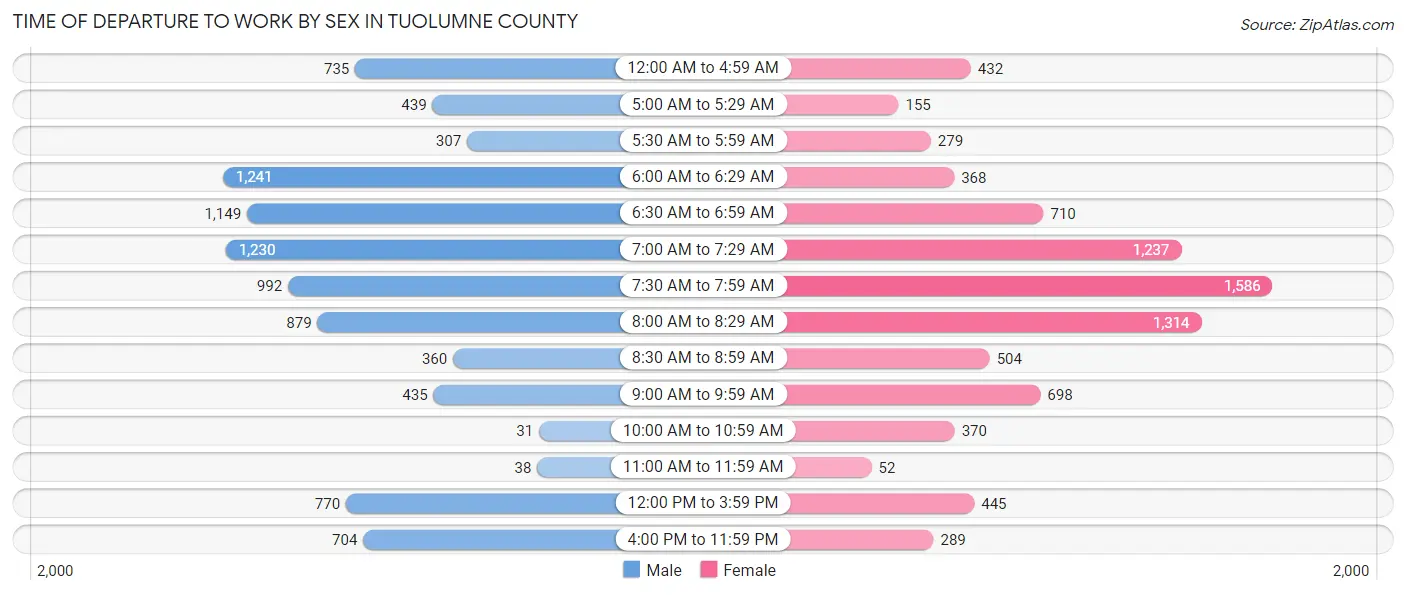
| Time of Departure | Male | Female |
| 12:00 AM to 4:59 AM | 735 (7.9%) | 432 (5.1%) |
| 5:00 AM to 5:29 AM | 439 (4.7%) | 155 (1.8%) |
| 5:30 AM to 5:59 AM | 307 (3.3%) | 279 (3.3%) |
| 6:00 AM to 6:29 AM | 1,241 (13.3%) | 368 (4.4%) |
| 6:30 AM to 6:59 AM | 1,149 (12.3%) | 710 (8.4%) |
| 7:00 AM to 7:29 AM | 1,230 (13.2%) | 1,237 (14.7%) |
| 7:30 AM to 7:59 AM | 992 (10.7%) | 1,586 (18.8%) |
| 8:00 AM to 8:29 AM | 879 (9.4%) | 1,314 (15.6%) |
| 8:30 AM to 8:59 AM | 360 (3.9%) | 504 (6.0%) |
| 9:00 AM to 9:59 AM | 435 (4.7%) | 698 (8.3%) |
| 10:00 AM to 10:59 AM | 31 (0.3%) | 370 (4.4%) |
| 11:00 AM to 11:59 AM | 38 (0.4%) | 52 (0.6%) |
| 12:00 PM to 3:59 PM | 770 (8.3%) | 445 (5.3%) |
| 4:00 PM to 11:59 PM | 704 (7.6%) | 289 (3.4%) |
| Total | 9,310 (100.0%) | 8,439 (100.0%) |
Housing Occupancy in Tuolumne County
Occupancy by Ownership in Tuolumne County
Of the total 22,831 dwellings in Tuolumne County, owner-occupied units account for 16,991 (74.4%), while renter-occupied units make up 5,840 (25.6%).
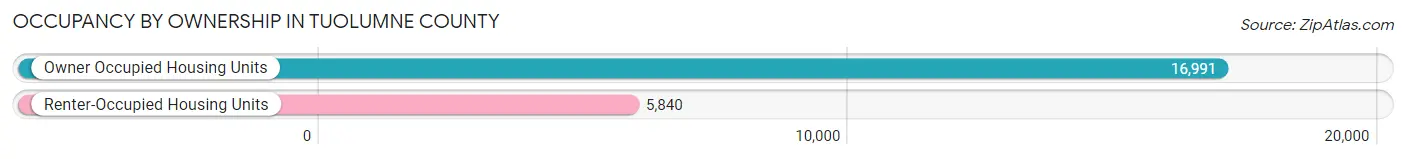
| Occupancy | # Housing Units | % Housing Units |
| Owner Occupied Housing Units | 16,991 | 74.4% |
| Renter-Occupied Housing Units | 5,840 | 25.6% |
| Total Occupied Housing Units | 22,831 | 100.0% |
Occupancy by Household Size in Tuolumne County
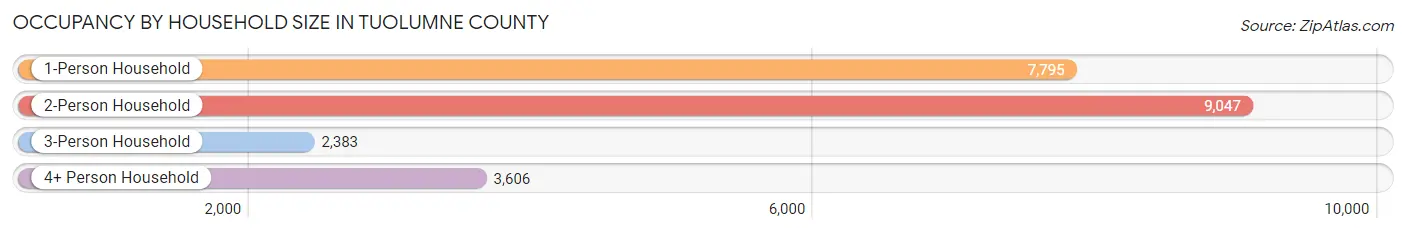
| Household Size | # Housing Units | % Housing Units |
| 1-Person Household | 7,795 | 34.1% |
| 2-Person Household | 9,047 | 39.6% |
| 3-Person Household | 2,383 | 10.4% |
| 4+ Person Household | 3,606 | 15.8% |
| Total Housing Units | 22,831 | 100.0% |
Occupancy by Ownership by Household Size in Tuolumne County
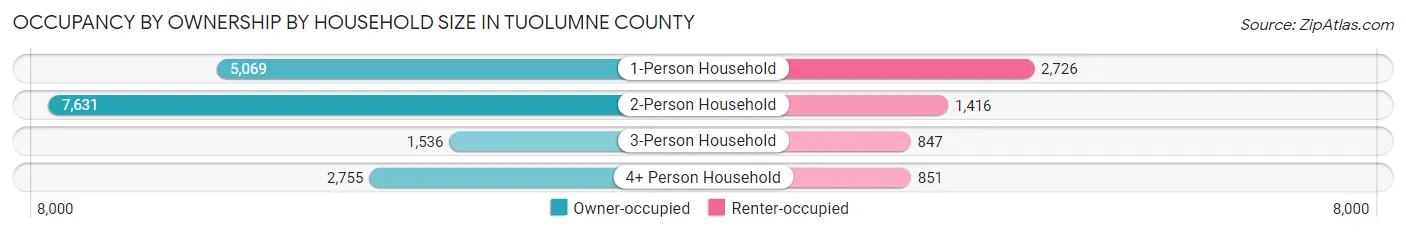
| Household Size | Owner-occupied | Renter-occupied |
| 1-Person Household | 5,069 (65.0%) | 2,726 (35.0%) |
| 2-Person Household | 7,631 (84.4%) | 1,416 (15.7%) |
| 3-Person Household | 1,536 (64.5%) | 847 (35.5%) |
| 4+ Person Household | 2,755 (76.4%) | 851 (23.6%) |
| Total Housing Units | 16,991 (74.4%) | 5,840 (25.6%) |
Occupancy by Educational Attainment in Tuolumne County
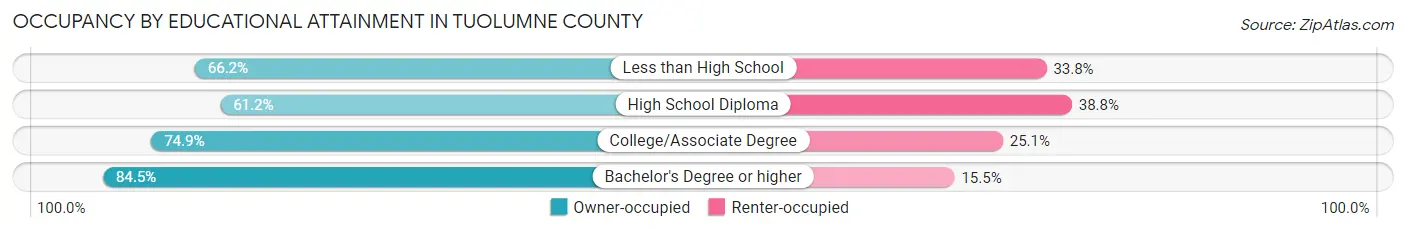
| Household Size | Owner-occupied | Renter-occupied |
| Less than High School | 671 (66.2%) | 342 (33.8%) |
| High School Diploma | 2,862 (61.2%) | 1,814 (38.8%) |
| College/Associate Degree | 7,982 (74.9%) | 2,677 (25.1%) |
| Bachelor's Degree or higher | 5,476 (84.5%) | 1,007 (15.5%) |
Occupancy by Age of Householder in Tuolumne County
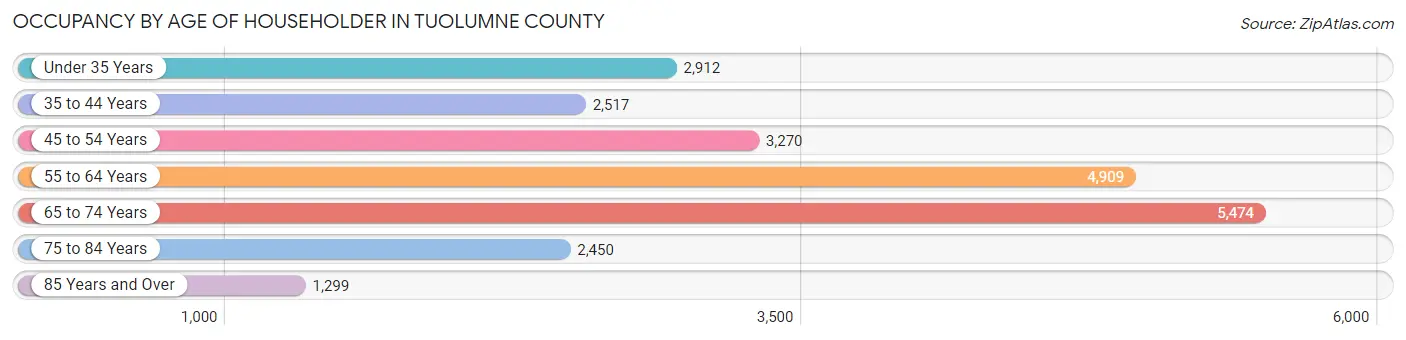
| Age Bracket | # Households | % Households |
| Under 35 Years | 2,912 | 12.8% |
| 35 to 44 Years | 2,517 | 11.0% |
| 45 to 54 Years | 3,270 | 14.3% |
| 55 to 64 Years | 4,909 | 21.5% |
| 65 to 74 Years | 5,474 | 24.0% |
| 75 to 84 Years | 2,450 | 10.7% |
| 85 Years and Over | 1,299 | 5.7% |
| Total | 22,831 | 100.0% |
Housing Finances in Tuolumne County
Median Income by Occupancy in Tuolumne County
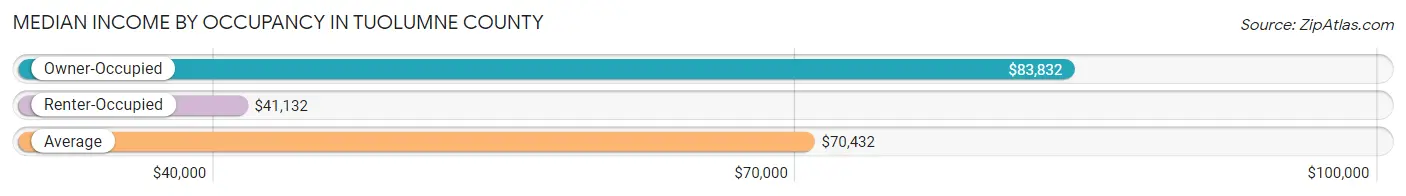
| Occupancy Type | # Households | Median Income |
| Owner-Occupied | 16,991 (74.4%) | $83,832 |
| Renter-Occupied | 5,840 (25.6%) | $41,132 |
| Average | 22,831 (100.0%) | $70,432 |
Occupancy by Householder Income Bracket in Tuolumne County
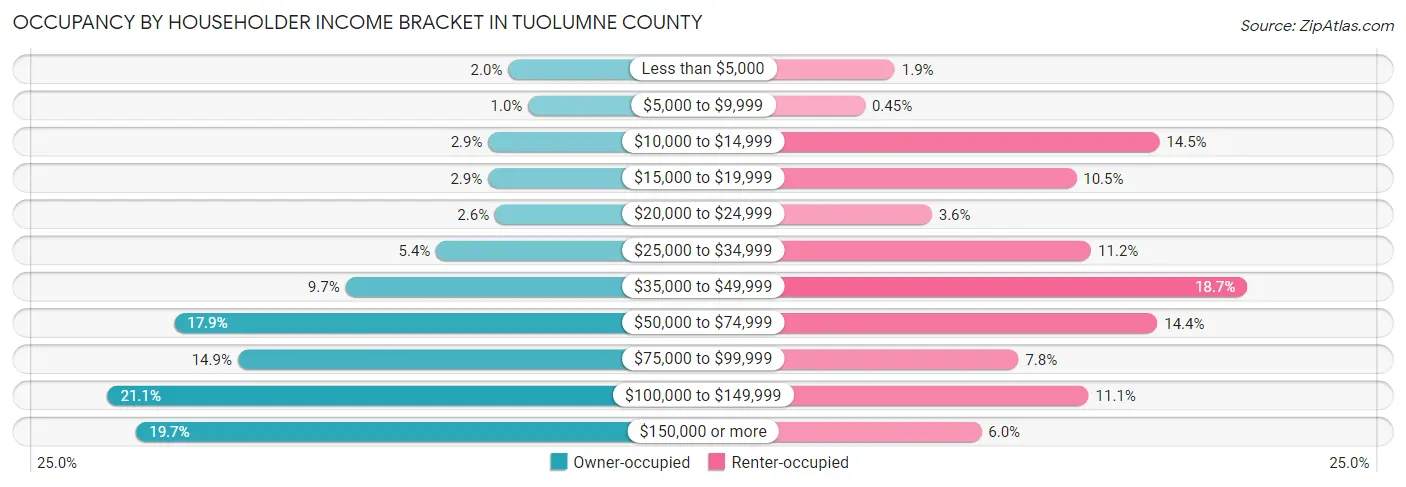
| Income Bracket | Owner-occupied | Renter-occupied |
| Less than $5,000 | 335 (2.0%) | 109 (1.9%) |
| $5,000 to $9,999 | 174 (1.0%) | 26 (0.4%) |
| $10,000 to $14,999 | 496 (2.9%) | 845 (14.5%) |
| $15,000 to $19,999 | 498 (2.9%) | 614 (10.5%) |
| $20,000 to $24,999 | 441 (2.6%) | 212 (3.6%) |
| $25,000 to $34,999 | 917 (5.4%) | 655 (11.2%) |
| $35,000 to $49,999 | 1,651 (9.7%) | 1,089 (18.6%) |
| $50,000 to $74,999 | 3,037 (17.9%) | 839 (14.4%) |
| $75,000 to $99,999 | 2,523 (14.8%) | 453 (7.8%) |
| $100,000 to $149,999 | 3,576 (21.0%) | 648 (11.1%) |
| $150,000 or more | 3,343 (19.7%) | 350 (6.0%) |
| Total | 16,991 (100.0%) | 5,840 (100.0%) |
Monthly Housing Cost Tiers in Tuolumne County
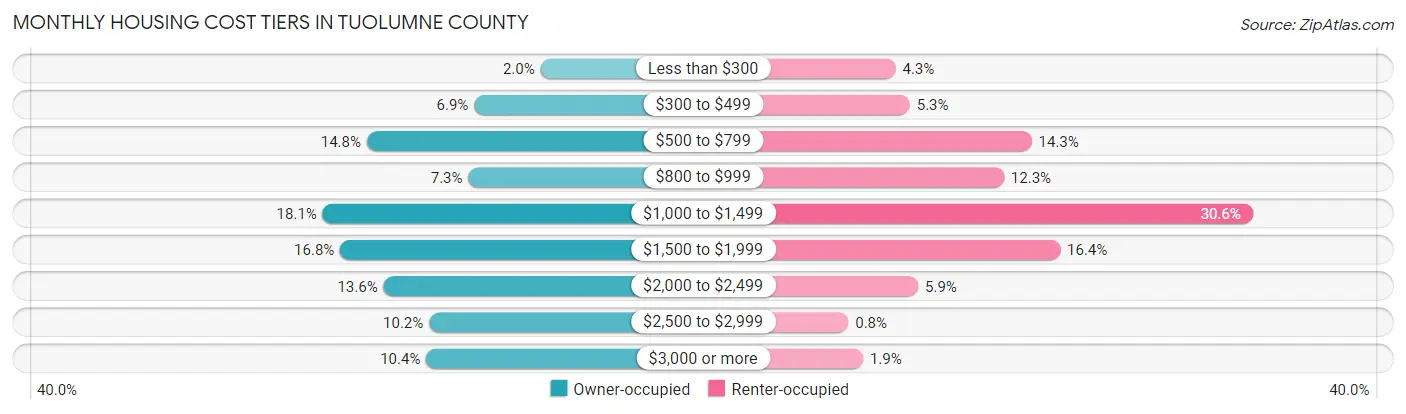
| Monthly Cost | Owner-occupied | Renter-occupied |
| Less than $300 | 339 (2.0%) | 250 (4.3%) |
| $300 to $499 | 1,171 (6.9%) | 311 (5.3%) |
| $500 to $799 | 2,514 (14.8%) | 835 (14.3%) |
| $800 to $999 | 1,243 (7.3%) | 716 (12.3%) |
| $1,000 to $1,499 | 3,067 (18.0%) | 1,786 (30.6%) |
| $1,500 to $1,999 | 2,847 (16.8%) | 958 (16.4%) |
| $2,000 to $2,499 | 2,305 (13.6%) | 347 (5.9%) |
| $2,500 to $2,999 | 1,734 (10.2%) | 47 (0.8%) |
| $3,000 or more | 1,771 (10.4%) | 110 (1.9%) |
| Total | 16,991 (100.0%) | 5,840 (100.0%) |
Physical Housing Characteristics in Tuolumne County
Housing Structures in Tuolumne County
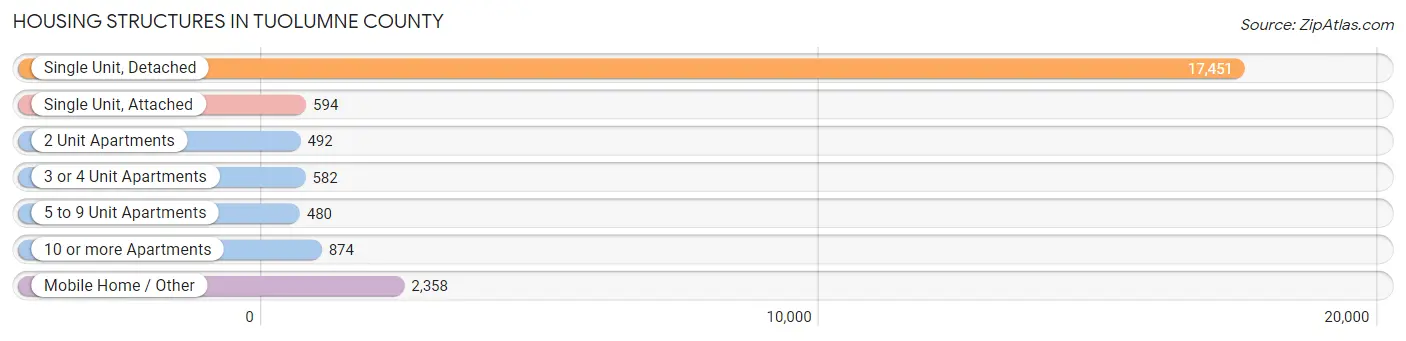
| Structure Type | # Housing Units | % Housing Units |
| Single Unit, Detached | 17,451 | 76.4% |
| Single Unit, Attached | 594 | 2.6% |
| 2 Unit Apartments | 492 | 2.1% |
| 3 or 4 Unit Apartments | 582 | 2.5% |
| 5 to 9 Unit Apartments | 480 | 2.1% |
| 10 or more Apartments | 874 | 3.8% |
| Mobile Home / Other | 2,358 | 10.3% |
| Total | 22,831 | 100.0% |
Housing Structures by Occupancy in Tuolumne County
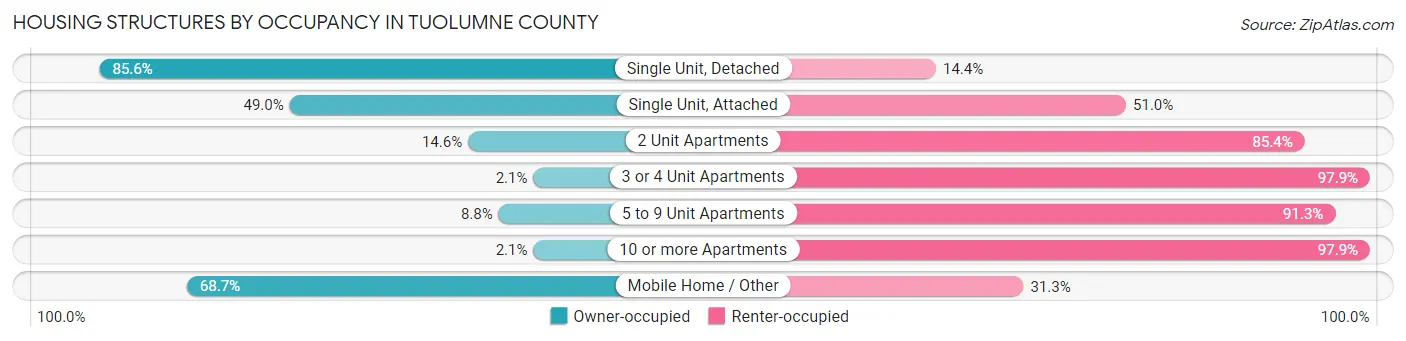
| Structure Type | Owner-occupied | Renter-occupied |
| Single Unit, Detached | 14,935 (85.6%) | 2,516 (14.4%) |
| Single Unit, Attached | 291 (49.0%) | 303 (51.0%) |
| 2 Unit Apartments | 72 (14.6%) | 420 (85.4%) |
| 3 or 4 Unit Apartments | 12 (2.1%) | 570 (97.9%) |
| 5 to 9 Unit Apartments | 42 (8.7%) | 438 (91.2%) |
| 10 or more Apartments | 18 (2.1%) | 856 (97.9%) |
| Mobile Home / Other | 1,621 (68.7%) | 737 (31.3%) |
| Total | 16,991 (74.4%) | 5,840 (25.6%) |
Housing Structures by Number of Rooms in Tuolumne County
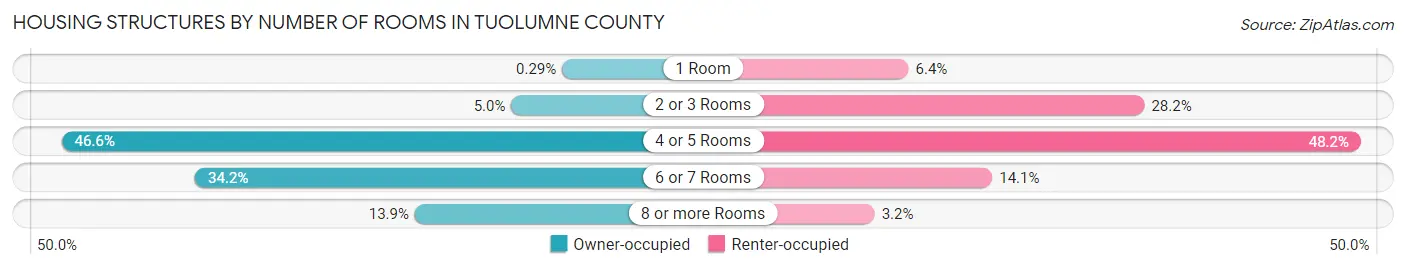
| Number of Rooms | Owner-occupied | Renter-occupied |
| 1 Room | 49 (0.3%) | 371 (6.4%) |
| 2 or 3 Rooms | 848 (5.0%) | 1,645 (28.2%) |
| 4 or 5 Rooms | 7,915 (46.6%) | 2,813 (48.2%) |
| 6 or 7 Rooms | 5,816 (34.2%) | 823 (14.1%) |
| 8 or more Rooms | 2,363 (13.9%) | 188 (3.2%) |
| Total | 16,991 (100.0%) | 5,840 (100.0%) |
Housing Structure by Heating Type in Tuolumne County
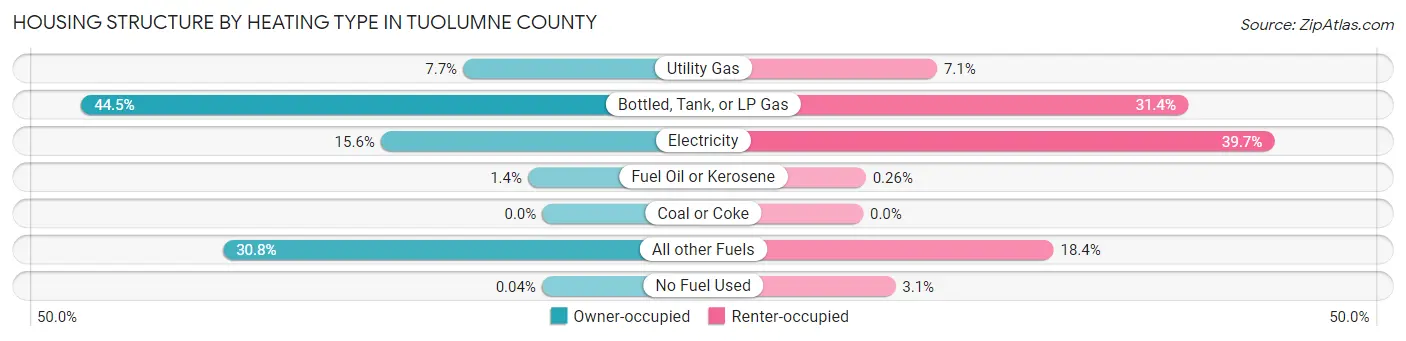
| Heating Type | Owner-occupied | Renter-occupied |
| Utility Gas | 1,300 (7.6%) | 417 (7.1%) |
| Bottled, Tank, or LP Gas | 7,564 (44.5%) | 1,832 (31.4%) |
| Electricity | 2,651 (15.6%) | 2,319 (39.7%) |
| Fuel Oil or Kerosene | 234 (1.4%) | 15 (0.3%) |
| Coal or Coke | 0 (0.0%) | 0 (0.0%) |
| All other Fuels | 5,235 (30.8%) | 1,075 (18.4%) |
| No Fuel Used | 7 (0.0%) | 182 (3.1%) |
| Total | 16,991 (100.0%) | 5,840 (100.0%) |
Household Vehicle Usage in Tuolumne County
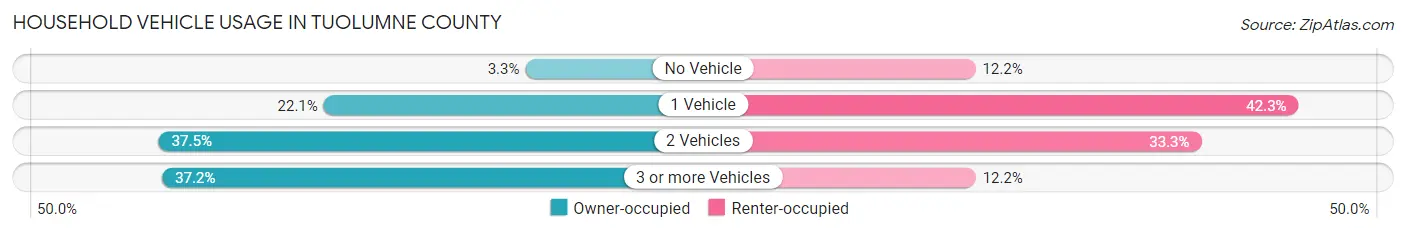
| Vehicles per Household | Owner-occupied | Renter-occupied |
| No Vehicle | 554 (3.3%) | 712 (12.2%) |
| 1 Vehicle | 3,754 (22.1%) | 2,472 (42.3%) |
| 2 Vehicles | 6,369 (37.5%) | 1,943 (33.3%) |
| 3 or more Vehicles | 6,314 (37.2%) | 713 (12.2%) |
| Total | 16,991 (100.0%) | 5,840 (100.0%) |
Real Estate & Mortgages in Tuolumne County
Real Estate and Mortgage Overview in Tuolumne County
| Characteristic | Without Mortgage | With Mortgage |
| Housing Units | 6,902 | 10,089 |
| Median Property Value | $355,600 | $387,900 |
| Median Household Income | $59,375 | $2,570 |
| Monthly Housing Costs | $752 | $1,771 |
| Real Estate Taxes | $2,241 | $295 |
Property Value by Mortgage Status in Tuolumne County
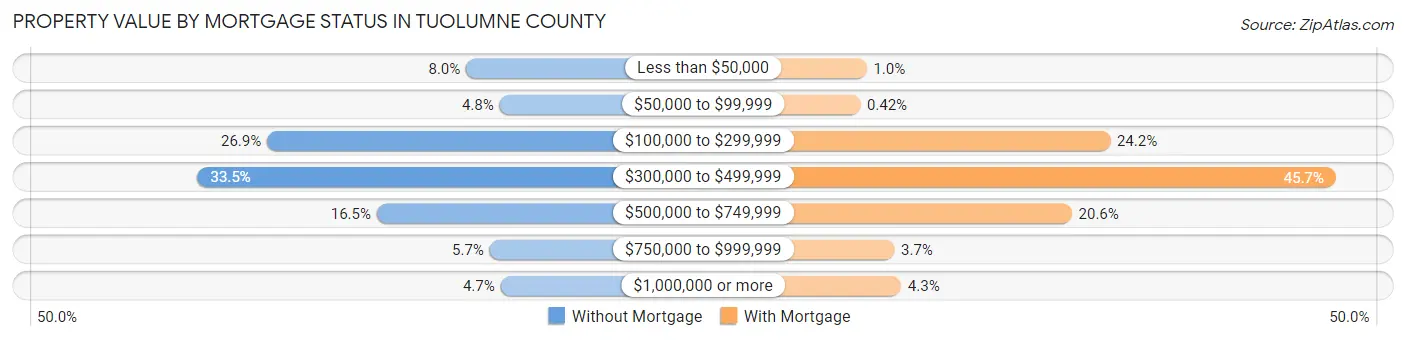
| Property Value | Without Mortgage | With Mortgage |
| Less than $50,000 | 549 (8.0%) | 105 (1.0%) |
| $50,000 to $99,999 | 329 (4.8%) | 42 (0.4%) |
| $100,000 to $299,999 | 1,857 (26.9%) | 2,445 (24.2%) |
| $300,000 to $499,999 | 2,315 (33.5%) | 4,615 (45.7%) |
| $500,000 to $749,999 | 1,136 (16.5%) | 2,076 (20.6%) |
| $750,000 to $999,999 | 394 (5.7%) | 370 (3.7%) |
| $1,000,000 or more | 322 (4.7%) | 436 (4.3%) |
| Total | 6,902 (100.0%) | 10,089 (100.0%) |
Household Income by Mortgage Status in Tuolumne County
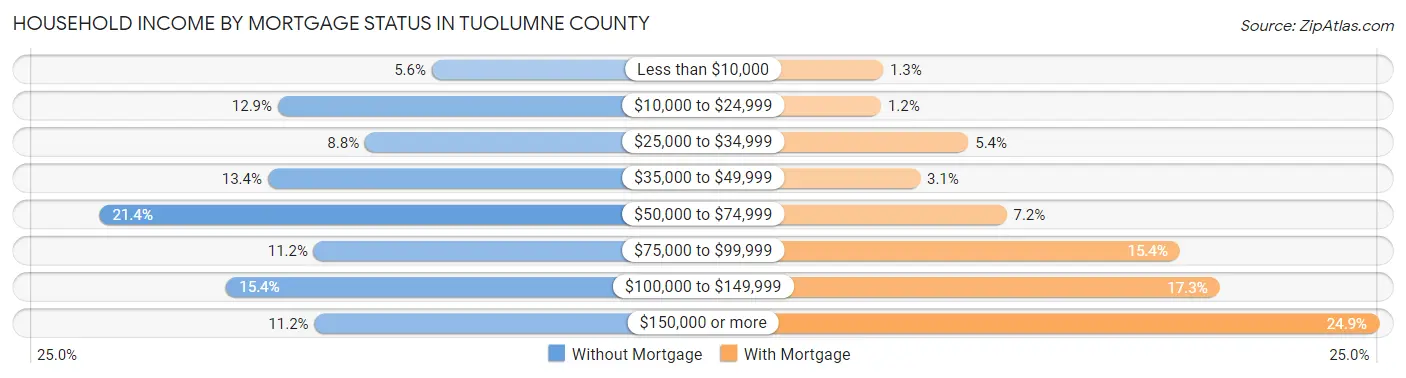
| Household Income | Without Mortgage | With Mortgage |
| Less than $10,000 | 387 (5.6%) | 132 (1.3%) |
| $10,000 to $24,999 | 893 (12.9%) | 122 (1.2%) |
| $25,000 to $34,999 | 607 (8.8%) | 542 (5.4%) |
| $35,000 to $49,999 | 926 (13.4%) | 310 (3.1%) |
| $50,000 to $74,999 | 1,479 (21.4%) | 725 (7.2%) |
| $75,000 to $99,999 | 775 (11.2%) | 1,558 (15.4%) |
| $100,000 to $149,999 | 1,062 (15.4%) | 1,748 (17.3%) |
| $150,000 or more | 773 (11.2%) | 2,514 (24.9%) |
| Total | 6,902 (100.0%) | 10,089 (100.0%) |
Property Value to Household Income Ratio in Tuolumne County
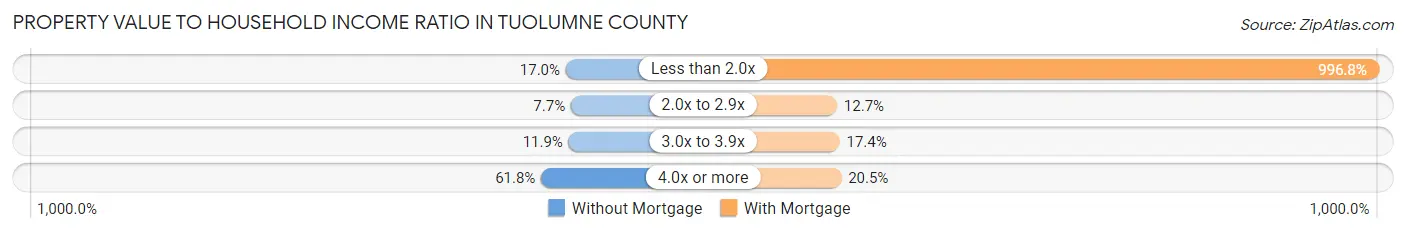
| Value-to-Income Ratio | Without Mortgage | With Mortgage |
| Less than 2.0x | 1,172 (17.0%) | 100,564 (996.8%) |
| 2.0x to 2.9x | 532 (7.7%) | 1,281 (12.7%) |
| 3.0x to 3.9x | 819 (11.9%) | 1,757 (17.4%) |
| 4.0x or more | 4,264 (61.8%) | 2,063 (20.4%) |
| Total | 6,902 (100.0%) | 10,089 (100.0%) |
Real Estate Taxes by Mortgage Status in Tuolumne County
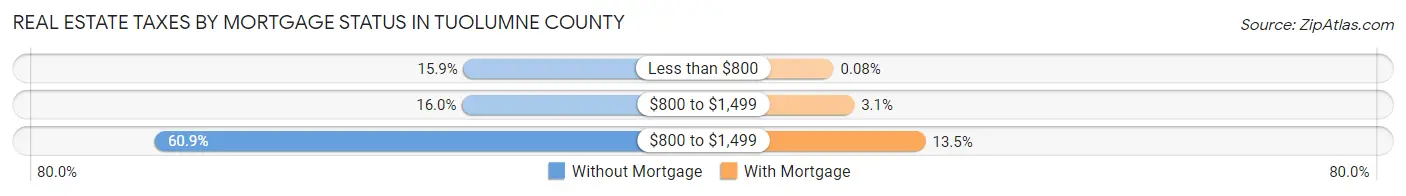
| Property Taxes | Without Mortgage | With Mortgage |
| Less than $800 | 1,094 (15.9%) | 8 (0.1%) |
| $800 to $1,499 | 1,107 (16.0%) | 312 (3.1%) |
| $800 to $1,499 | 4,206 (60.9%) | 1,364 (13.5%) |
| Total | 6,902 (100.0%) | 10,089 (100.0%) |
Health & Disability in Tuolumne County
Health Insurance Coverage by Age in Tuolumne County
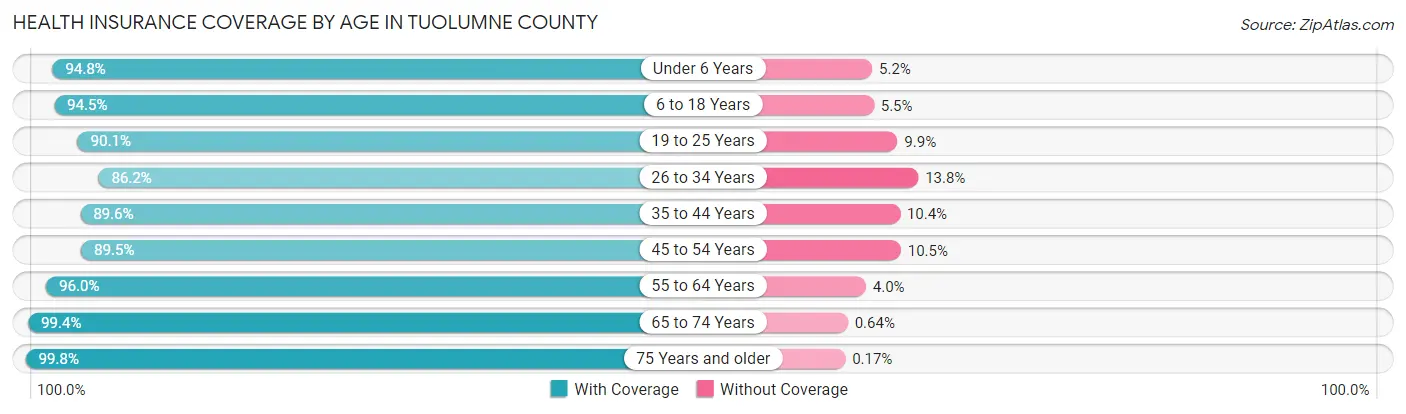
| Age Bracket | With Coverage | Without Coverage |
| Under 6 Years | 2,939 (94.8%) | 161 (5.2%) |
| 6 to 18 Years | 6,286 (94.5%) | 366 (5.5%) |
| 19 to 25 Years | 3,002 (90.1%) | 330 (9.9%) |
| 26 to 34 Years | 4,543 (86.2%) | 726 (13.8%) |
| 35 to 44 Years | 4,895 (89.6%) | 567 (10.4%) |
| 45 to 54 Years | 5,116 (89.5%) | 602 (10.5%) |
| 55 to 64 Years | 7,839 (96.0%) | 328 (4.0%) |
| 65 to 74 Years | 8,717 (99.4%) | 56 (0.6%) |
| 75 Years and older | 5,936 (99.8%) | 10 (0.2%) |
| Total | 49,273 (94.0%) | 3,146 (6.0%) |
Health Insurance Coverage by Citizenship Status in Tuolumne County
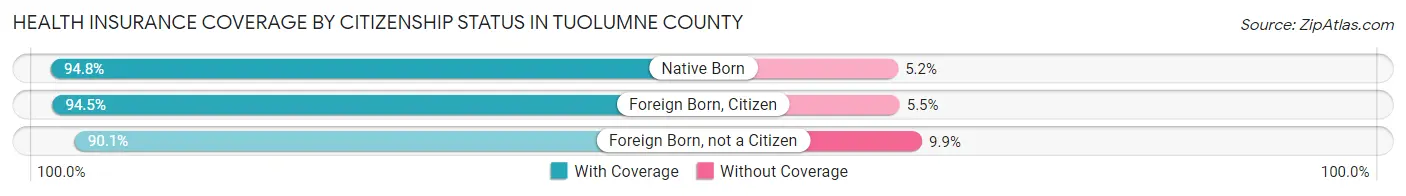
| Citizenship Status | With Coverage | Without Coverage |
| Native Born | 2,939 (94.8%) | 161 (5.2%) |
| Foreign Born, Citizen | 6,286 (94.5%) | 366 (5.5%) |
| Foreign Born, not a Citizen | 3,002 (90.1%) | 330 (9.9%) |
Health Insurance Coverage by Household Income in Tuolumne County
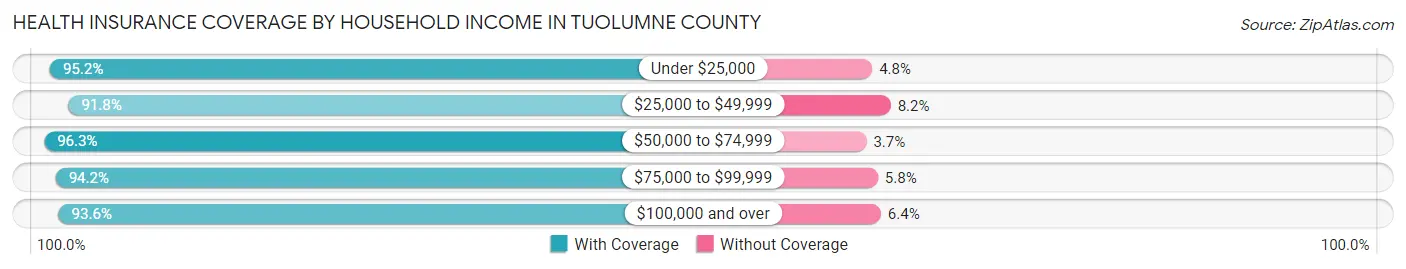
| Household Income | With Coverage | Without Coverage |
| Under $25,000 | 5,037 (95.2%) | 252 (4.8%) |
| $25,000 to $49,999 | 7,526 (91.8%) | 675 (8.2%) |
| $50,000 to $74,999 | 7,352 (96.3%) | 281 (3.7%) |
| $75,000 to $99,999 | 6,851 (94.2%) | 424 (5.8%) |
| $100,000 and over | 21,777 (93.6%) | 1,486 (6.4%) |
Public vs Private Health Insurance Coverage by Age in Tuolumne County
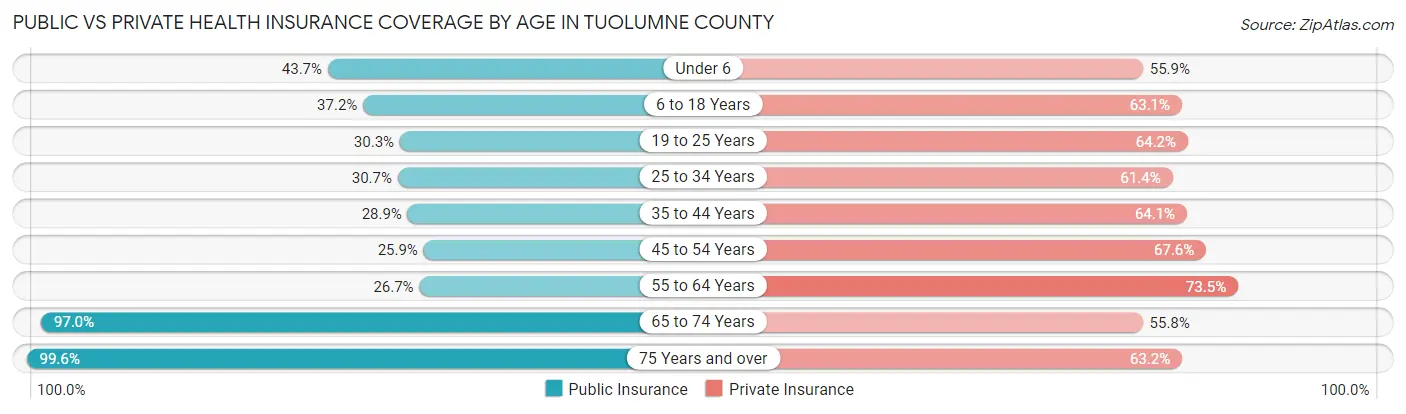
| Age Bracket | Public Insurance | Private Insurance |
| Under 6 | 1,355 (43.7%) | 1,732 (55.9%) |
| 6 to 18 Years | 2,472 (37.2%) | 4,198 (63.1%) |
| 19 to 25 Years | 1,011 (30.3%) | 2,140 (64.2%) |
| 25 to 34 Years | 1,619 (30.7%) | 3,234 (61.4%) |
| 35 to 44 Years | 1,578 (28.9%) | 3,499 (64.1%) |
| 45 to 54 Years | 1,482 (25.9%) | 3,866 (67.6%) |
| 55 to 64 Years | 2,181 (26.7%) | 6,005 (73.5%) |
| 65 to 74 Years | 8,507 (97.0%) | 4,898 (55.8%) |
| 75 Years and over | 5,924 (99.6%) | 3,755 (63.1%) |
| Total | 26,129 (49.8%) | 33,327 (63.6%) |
Disability Status by Sex by Age in Tuolumne County
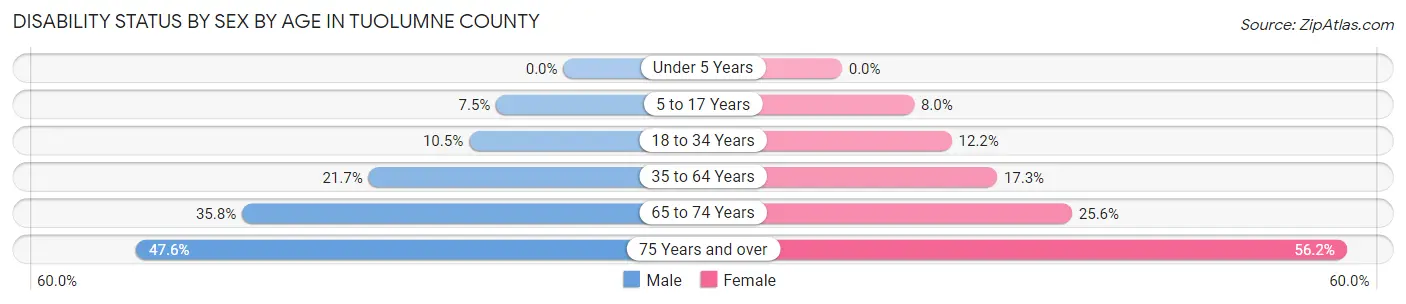
| Age Bracket | Male | Female |
| Under 5 Years | 0 (0.0%) | 0 (0.0%) |
| 5 to 17 Years | 258 (7.5%) | 281 (8.0%) |
| 18 to 34 Years | 479 (10.5%) | 546 (12.2%) |
| 35 to 64 Years | 2,097 (21.7%) | 1,673 (17.3%) |
| 65 to 74 Years | 1,575 (35.8%) | 1,120 (25.6%) |
| 75 Years and over | 1,265 (47.6%) | 1,848 (56.2%) |
Disability Class by Sex by Age in Tuolumne County
Disability Class: Hearing Difficulty
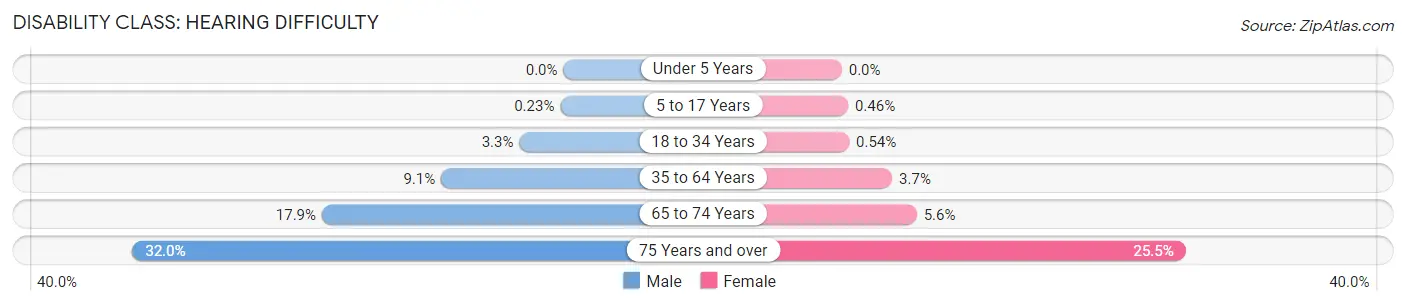
| Age Bracket | Male | Female |
| Under 5 Years | 0 (0.0%) | 0 (0.0%) |
| 5 to 17 Years | 8 (0.2%) | 16 (0.5%) |
| 18 to 34 Years | 149 (3.3%) | 24 (0.5%) |
| 35 to 64 Years | 878 (9.1%) | 362 (3.7%) |
| 65 to 74 Years | 789 (17.9%) | 243 (5.6%) |
| 75 Years and over | 851 (32.0%) | 839 (25.5%) |
Disability Class: Vision Difficulty
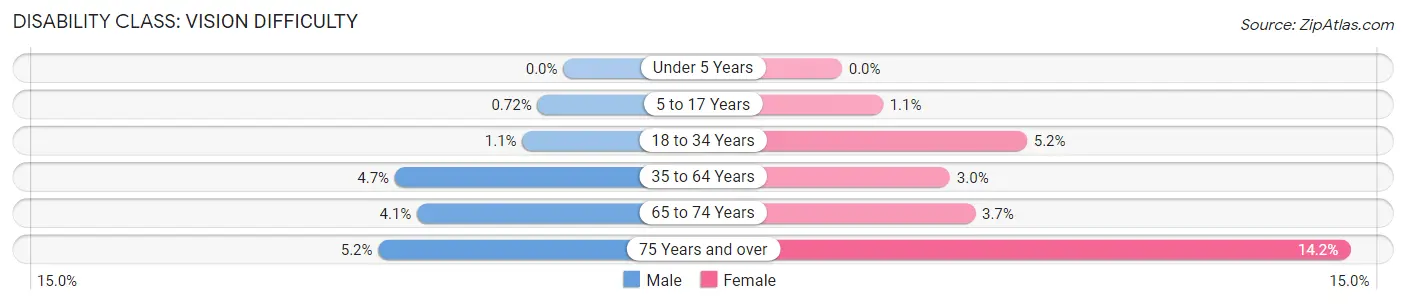
| Age Bracket | Male | Female |
| Under 5 Years | 0 (0.0%) | 0 (0.0%) |
| 5 to 17 Years | 25 (0.7%) | 40 (1.1%) |
| 18 to 34 Years | 52 (1.1%) | 230 (5.1%) |
| 35 to 64 Years | 453 (4.7%) | 291 (3.0%) |
| 65 to 74 Years | 179 (4.1%) | 162 (3.7%) |
| 75 Years and over | 137 (5.1%) | 465 (14.1%) |
Disability Class: Cognitive Difficulty
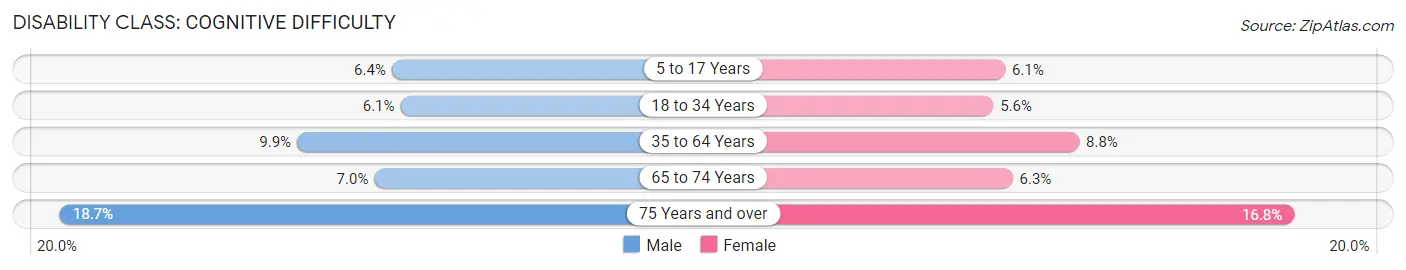
| Age Bracket | Male | Female |
| 5 to 17 Years | 220 (6.4%) | 212 (6.1%) |
| 18 to 34 Years | 276 (6.0%) | 251 (5.6%) |
| 35 to 64 Years | 956 (9.9%) | 853 (8.8%) |
| 65 to 74 Years | 309 (7.0%) | 277 (6.3%) |
| 75 Years and over | 497 (18.7%) | 552 (16.8%) |
Disability Class: Ambulatory Difficulty
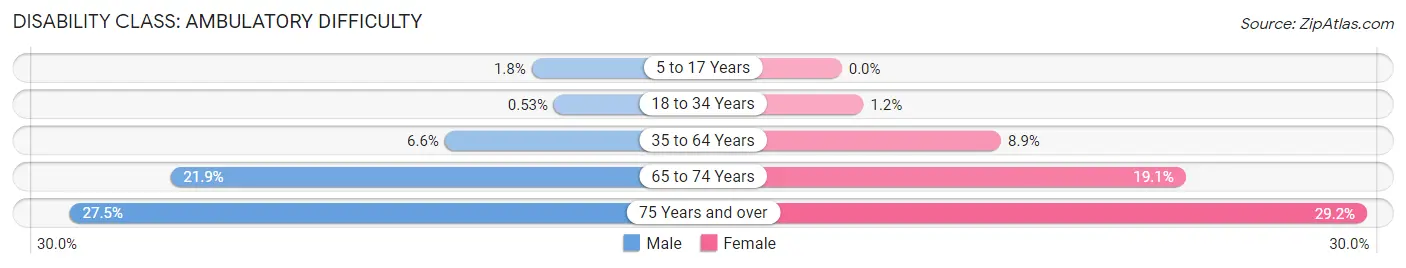
| Age Bracket | Male | Female |
| 5 to 17 Years | 61 (1.8%) | 0 (0.0%) |
| 18 to 34 Years | 24 (0.5%) | 54 (1.2%) |
| 35 to 64 Years | 639 (6.6%) | 859 (8.9%) |
| 65 to 74 Years | 963 (21.9%) | 837 (19.1%) |
| 75 Years and over | 731 (27.5%) | 961 (29.2%) |
Disability Class: Self-Care Difficulty
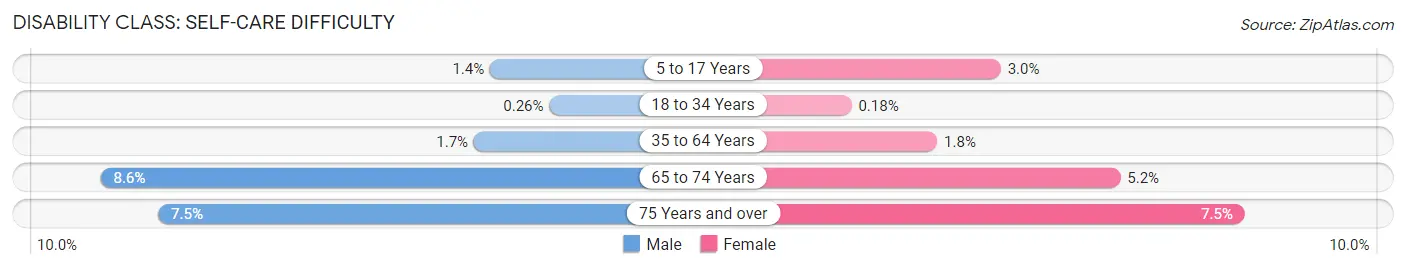
| Age Bracket | Male | Female |
| 5 to 17 Years | 47 (1.4%) | 103 (2.9%) |
| 18 to 34 Years | 12 (0.3%) | 8 (0.2%) |
| 35 to 64 Years | 160 (1.7%) | 171 (1.8%) |
| 65 to 74 Years | 378 (8.6%) | 226 (5.2%) |
| 75 Years and over | 200 (7.5%) | 246 (7.5%) |
Technology Access in Tuolumne County
Computing Device Access in Tuolumne County
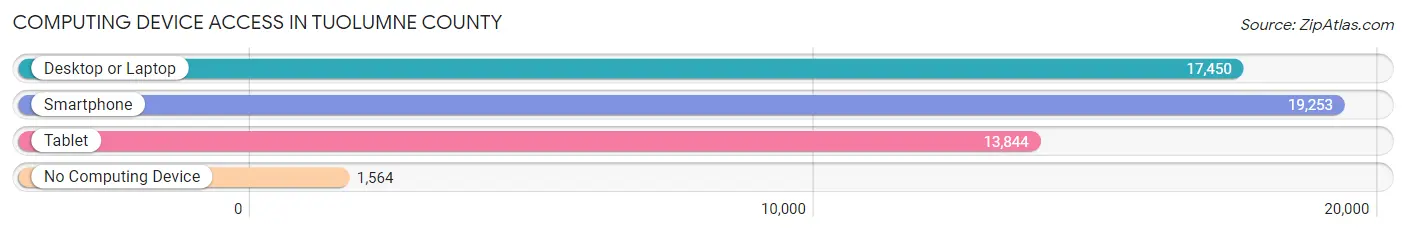
| Device Type | # Households | % Households |
| Desktop or Laptop | 17,450 | 76.4% |
| Smartphone | 19,253 | 84.3% |
| Tablet | 13,844 | 60.6% |
| No Computing Device | 1,564 | 6.9% |
| Total | 22,831 | 100.0% |
Internet Access in Tuolumne County
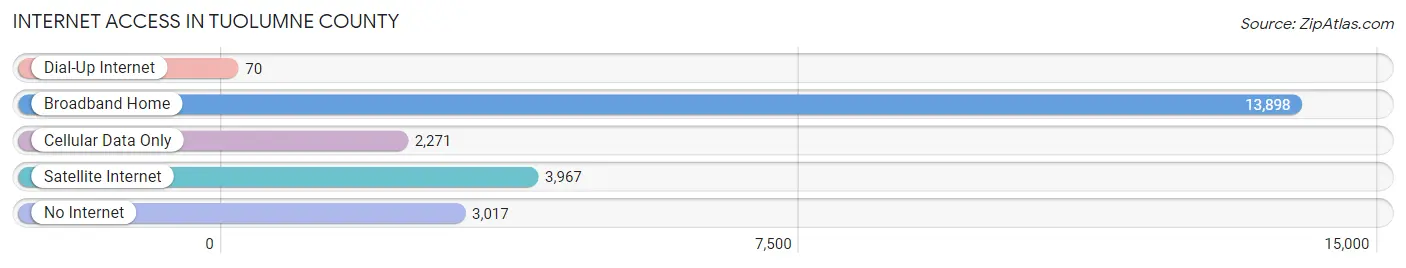
| Internet Type | # Households | % Households |
| Dial-Up Internet | 70 | 0.3% |
| Broadband Home | 13,898 | 60.9% |
| Cellular Data Only | 2,271 | 10.0% |
| Satellite Internet | 3,967 | 17.4% |
| No Internet | 3,017 | 13.2% |
| Total | 22,831 | 100.0% |
Tuolumne County Summary
Tuolumne County is located in the Sierra Nevada region of California, and is bordered by Calaveras County to the south, Stanislaus County to the north, and Mono County to the east. The county seat is Sonora, and the county has a total area of 2,274 square miles, making it the fourth largest county in California. The county is home to Yosemite National Park, which is located in the western part of the county.
History
The area that is now Tuolumne County was originally inhabited by the Miwok and Mono Native American tribes. The first European settlers arrived in the area in the early 1800s, and the county was officially established in 1850. The county was named after the Tuolumne River, which was named by Spanish explorer Gabriel Moraga in 1806.
The county experienced rapid growth during the Gold Rush of the 1850s, and the population increased from just over 1,000 in 1850 to over 10,000 by 1860. The county was also home to several mining towns, including Sonora, Jamestown, and Columbia.
Geography
Tuolumne County is located in the Sierra Nevada region of California, and is bordered by Calaveras County to the south, Stanislaus County to the north, and Mono County to the east. The county has a total area of 2,274 square miles, making it the fourth largest county in California. The county is home to Yosemite National Park, which is located in the western part of the county.
The county is home to several mountain ranges, including the Sierra Nevada, the Stanislaus National Forest, and the Emigrant Wilderness. The highest point in the county is Mount Lyell, which has an elevation of 13,114 feet. The county also contains several rivers, including the Tuolumne, Stanislaus, and Merced Rivers.
Economy
The economy of Tuolumne County is largely based on tourism, agriculture, and mining. The county is home to several tourist attractions, including Yosemite National Park, Columbia State Historic Park, and Railtown 1897 State Historic Park. The county is also home to several wineries, and is a popular destination for wine tasting.
Agriculture is also an important part of the county’s economy, and the county is home to several farms and ranches. The county is also home to several mining operations, including gold, silver, and copper mines.
Demographics
As of the 2010 census, the population of Tuolumne County was 54,530. The population is largely white (86.2%), with smaller percentages of Hispanic (7.2%), Asian (2.2%), and African American (1.2%) residents. The median household income in the county is $45,845, and the median age is 44.7 years. The county has a poverty rate of 13.2%, and the unemployment rate is 8.2%.
Common Questions
What is Per Capita Income in Tuolumne County?
Per Capita income in Tuolumne County is $40,095.
What is the Median Family Income in Tuolumne County?
Median Family Income in Tuolumne County is $91,287.
What is the Median Household income in Tuolumne County?
Median Household Income in Tuolumne County is $70,432.
What is Income or Wage Gap in Tuolumne County?
Income or Wage Gap in Tuolumne County is 26.0%.
Women in Tuolumne County earn 74.0 cents for every dollar earned by a man.
What is Family Income Deficit in Tuolumne County?
Family Income Deficit in Tuolumne County is $8,882.
Families that are below poverty line in Tuolumne County earn $8,882 less on average than the poverty threshold level.
What is Inequality or Gini Index in Tuolumne County?
Inequality or Gini Index in Tuolumne County is 0.45.
What is the Total Population of Tuolumne County?
Total Population of Tuolumne County is 54,993.
What is the Total Male Population of Tuolumne County?
Total Male Population of Tuolumne County is 28,367.
What is the Total Female Population of Tuolumne County?
Total Female Population of Tuolumne County is 26,626.
What is the Ratio of Males per 100 Females in Tuolumne County?
There are 106.54 Males per 100 Females in Tuolumne County.
What is the Ratio of Females per 100 Males in Tuolumne County?
There are 93.86 Females per 100 Males in Tuolumne County.
What is the Median Population Age in Tuolumne County?
Median Population Age in Tuolumne County is 48.7 Years.
What is the Average Family Size in Tuolumne County
Average Family Size in Tuolumne County is 2.9 People.
What is the Average Household Size in Tuolumne County
Average Household Size in Tuolumne County is 2.3 People.
How Large is the Labor Force in Tuolumne County?
There are 22,715 People in the Labor Forcein in Tuolumne County.
What is the Percentage of People in the Labor Force in Tuolumne County?
48.8% of People are in the Labor Force in Tuolumne County.
What is the Unemployment Rate in Tuolumne County?
Unemployment Rate in Tuolumne County is 8.3%.