Stanislaus County, CA Map & Demographics
Stanislaus County Map
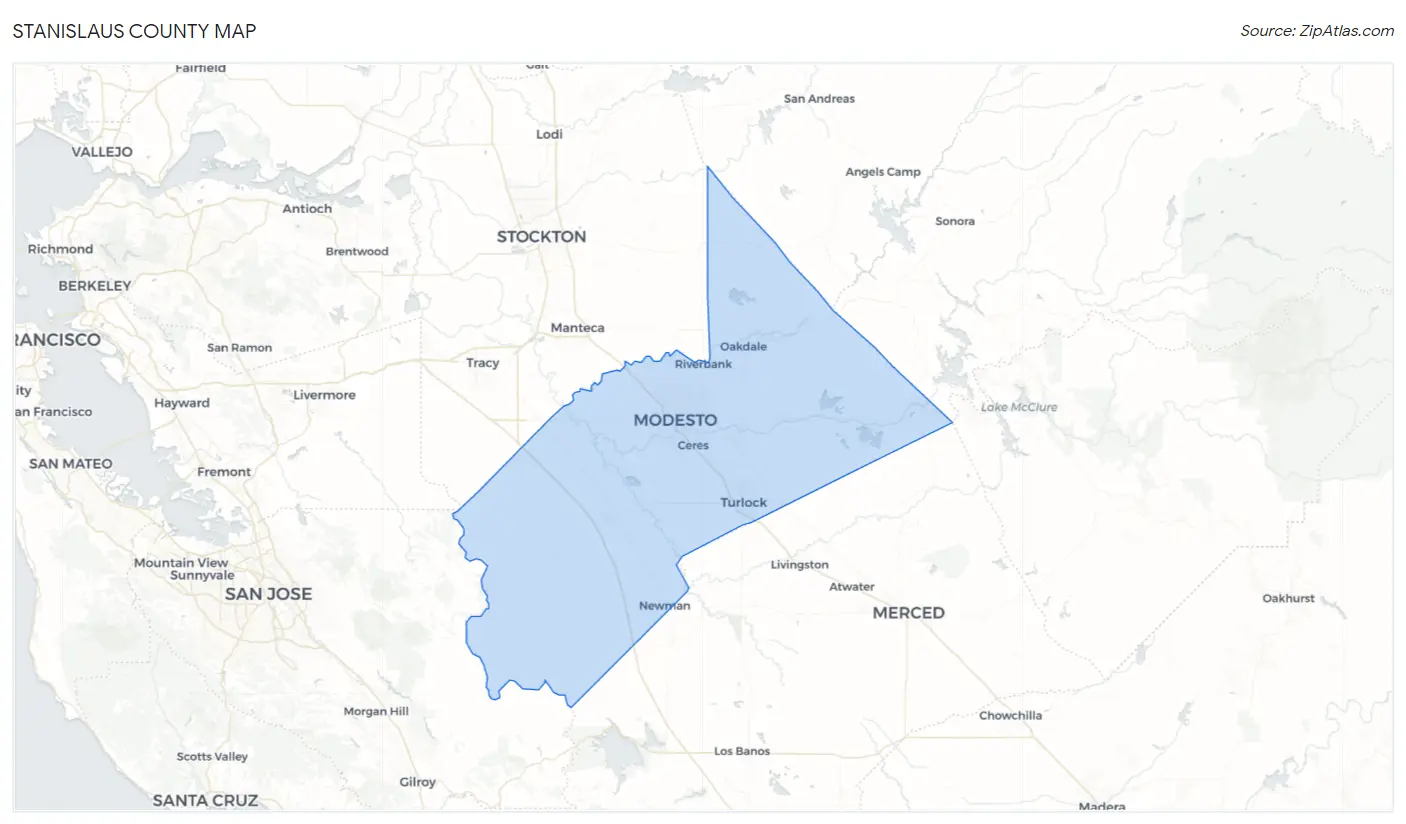
Stanislaus County Overview
$32,044
PER CAPITA INCOME
$83,732
AVG FAMILY INCOME
$74,872
AVG HOUSEHOLD INCOME
31.6%
WAGE / INCOME GAP [ % ]
68.4¢/ $1
WAGE / INCOME GAP [ $ ]
$11,478
FAMILY INCOME DEFICIT
0.44
INEQUALITY / GINI INDEX
552,063
TOTAL POPULATION
275,687
MALE POPULATION
276,376
FEMALE POPULATION
99.75
MALES / 100 FEMALES
100.25
FEMALES / 100 MALES
34.5
MEDIAN AGE
3.6
AVG FAMILY SIZE
3.1
AVG HOUSEHOLD SIZE
258,433
LABOR FORCE [ PEOPLE ]
61.4%
PERCENT IN LABOR FORCE
8.2%
UNEMPLOYMENT RATE
Stanislaus County Area Codes
Income in Stanislaus County
Income Overview in Stanislaus County
Per Capita Income in Stanislaus County is $32,044, while median incomes of families and households are $83,732 and $74,872 respectively.
| Characteristic | Number | Measure |
| Per Capita Income | 552,063 | $32,044 |
| Median Family Income | 130,092 | $83,732 |
| Mean Family Income | 130,092 | $106,542 |
| Median Household Income | 175,747 | $74,872 |
| Mean Household Income | 175,747 | $97,409 |
| Income Deficit | 130,092 | $11,478 |
| Wage / Income Gap (%) | 552,063 | 31.57% |
| Wage / Income Gap ($) | 552,063 | 68.43¢ per $1 |
| Gini / Inequality Index | 552,063 | 0.44 |
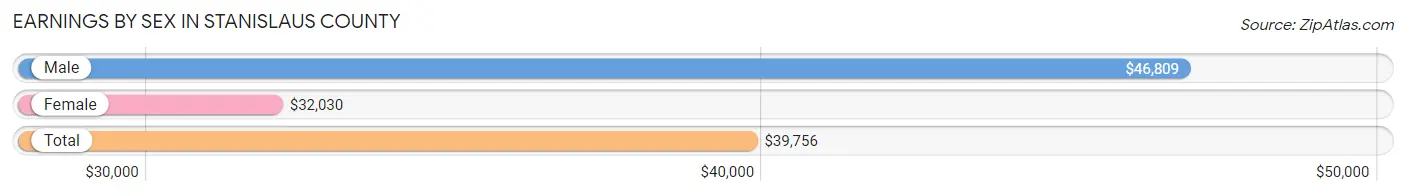
Earnings by Sex in Stanislaus County
Average Earnings in Stanislaus County are $39,756, $46,809 for men and $32,030 for women, a difference of 31.6%.
| Sex | Number | Average Earnings |
| Male | 146,153 (55.5%) | $46,809 |
| Female | 117,246 (44.5%) | $32,030 |
| Total | 263,399 (100.0%) | $39,756 |
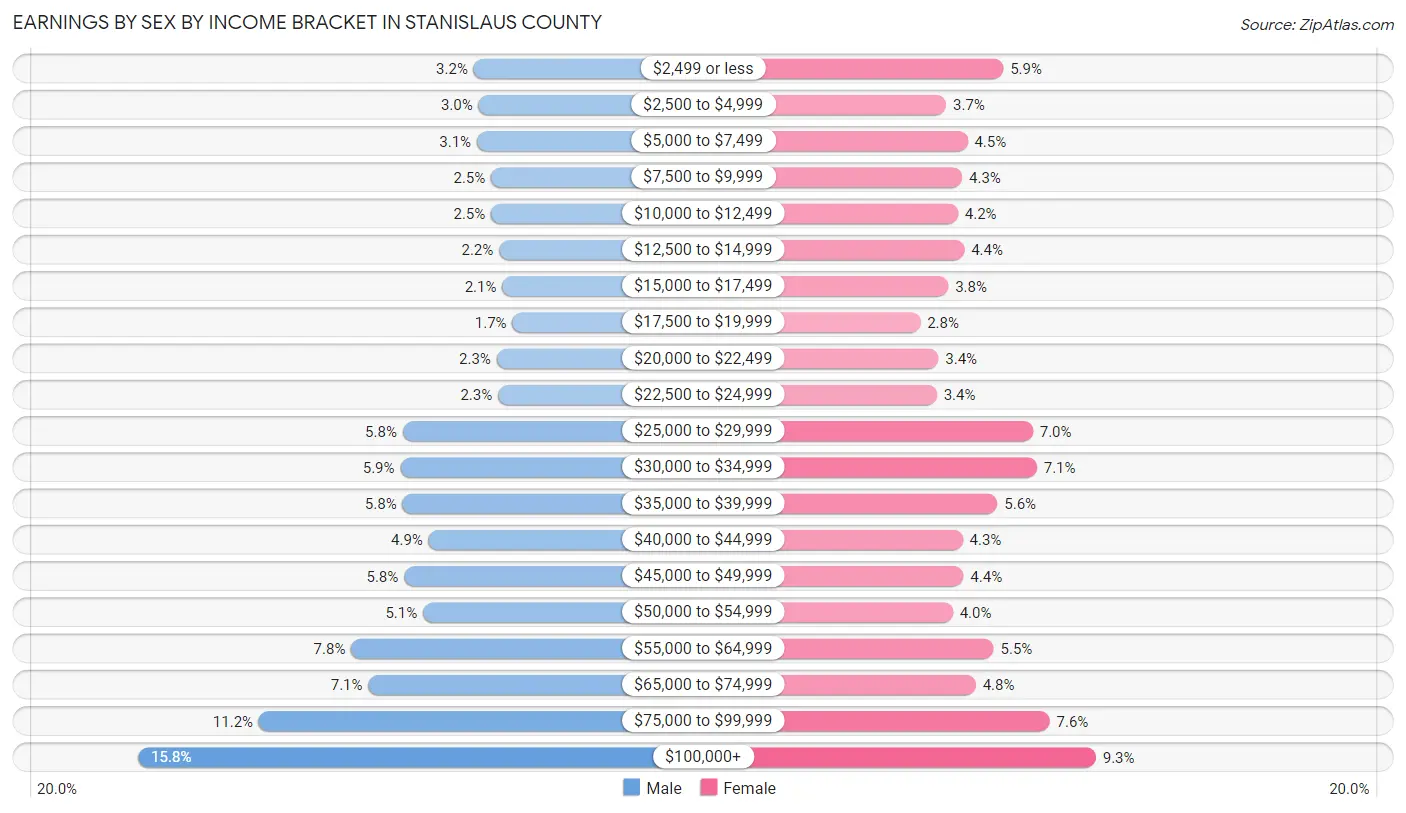
Earnings by Sex by Income Bracket in Stanislaus County
The most common earnings brackets in Stanislaus County are $100,000+ for men (23,017 | 15.8%) and $100,000+ for women (10,939 | 9.3%).
| Income | Male | Female |
| $2,499 or less | 4,631 (3.2%) | 6,875 (5.9%) |
| $2,500 to $4,999 | 4,377 (3.0%) | 4,359 (3.7%) |
| $5,000 to $7,499 | 4,460 (3.0%) | 5,300 (4.5%) |
| $7,500 to $9,999 | 3,680 (2.5%) | 5,066 (4.3%) |
| $10,000 to $12,499 | 3,687 (2.5%) | 4,880 (4.2%) |
| $12,500 to $14,999 | 3,238 (2.2%) | 5,155 (4.4%) |
| $15,000 to $17,499 | 3,072 (2.1%) | 4,459 (3.8%) |
| $17,500 to $19,999 | 2,514 (1.7%) | 3,225 (2.8%) |
| $20,000 to $22,499 | 3,371 (2.3%) | 4,020 (3.4%) |
| $22,500 to $24,999 | 3,303 (2.3%) | 3,947 (3.4%) |
| $25,000 to $29,999 | 8,527 (5.8%) | 8,175 (7.0%) |
| $30,000 to $34,999 | 8,648 (5.9%) | 8,346 (7.1%) |
| $35,000 to $39,999 | 8,530 (5.8%) | 6,616 (5.6%) |
| $40,000 to $44,999 | 7,098 (4.9%) | 5,085 (4.3%) |
| $45,000 to $49,999 | 8,443 (5.8%) | 5,124 (4.4%) |
| $50,000 to $54,999 | 7,412 (5.1%) | 4,653 (4.0%) |
| $55,000 to $64,999 | 11,339 (7.8%) | 6,445 (5.5%) |
| $65,000 to $74,999 | 10,402 (7.1%) | 5,661 (4.8%) |
| $75,000 to $99,999 | 16,404 (11.2%) | 8,916 (7.6%) |
| $100,000+ | 23,017 (15.8%) | 10,939 (9.3%) |
| Total | 146,153 (100.0%) | 117,246 (100.0%) |
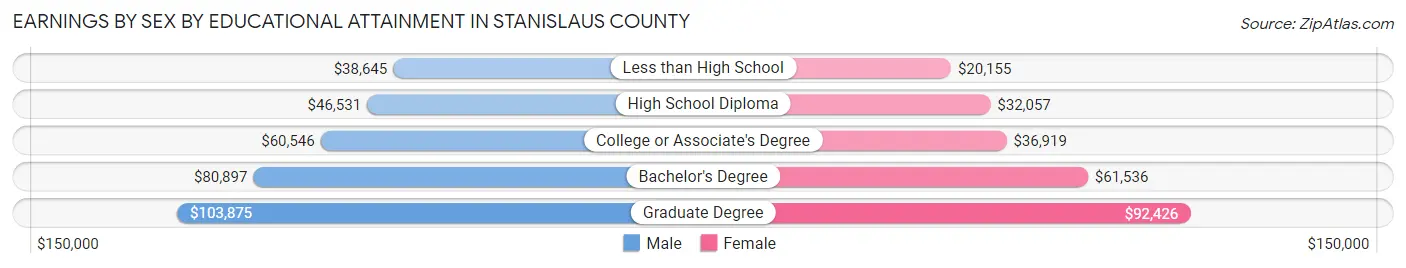
Earnings by Sex by Educational Attainment in Stanislaus County
Average earnings in Stanislaus County are $53,402 for men and $37,044 for women, a difference of 30.6%. Men with an educational attainment of graduate degree enjoy the highest average annual earnings of $103,875, while those with less than high school education earn the least with $38,645. Women with an educational attainment of graduate degree earn the most with the average annual earnings of $92,426, while those with less than high school education have the smallest earnings of $20,155.
| Educational Attainment | Male Income | Female Income |
| Less than High School | $38,645 | $20,155 |
| High School Diploma | $46,531 | $32,057 |
| College or Associate's Degree | $60,546 | $36,919 |
| Bachelor's Degree | $80,897 | $61,536 |
| Graduate Degree | $103,875 | $92,426 |
| Total | $53,402 | $37,044 |
Family Income in Stanislaus County
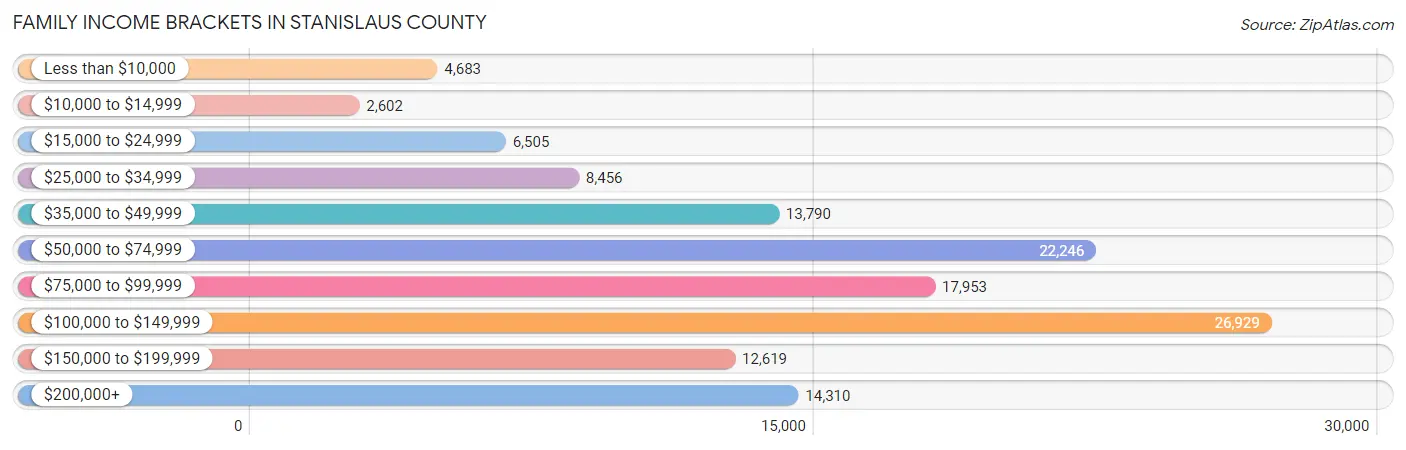
Family Income Brackets in Stanislaus County
According to the Stanislaus County family income data, there are 26,929 families falling into the $100,000 to $149,999 income range, which is the most common income bracket and makes up 20.7% of all families. Conversely, the $10,000 to $14,999 income bracket is the least frequent group with only 2,602 families (2.0%) belonging to this category.
| Income Bracket | # Families | % Families |
| Less than $10,000 | 4,683 | 3.6% |
| $10,000 to $14,999 | 2,602 | 2.0% |
| $15,000 to $24,999 | 6,505 | 5.0% |
| $25,000 to $34,999 | 8,456 | 6.5% |
| $35,000 to $49,999 | 13,790 | 10.6% |
| $50,000 to $74,999 | 22,246 | 17.1% |
| $75,000 to $99,999 | 17,953 | 13.8% |
| $100,000 to $149,999 | 26,929 | 20.7% |
| $150,000 to $199,999 | 12,619 | 9.7% |
| $200,000+ | 14,310 | 11.0% |
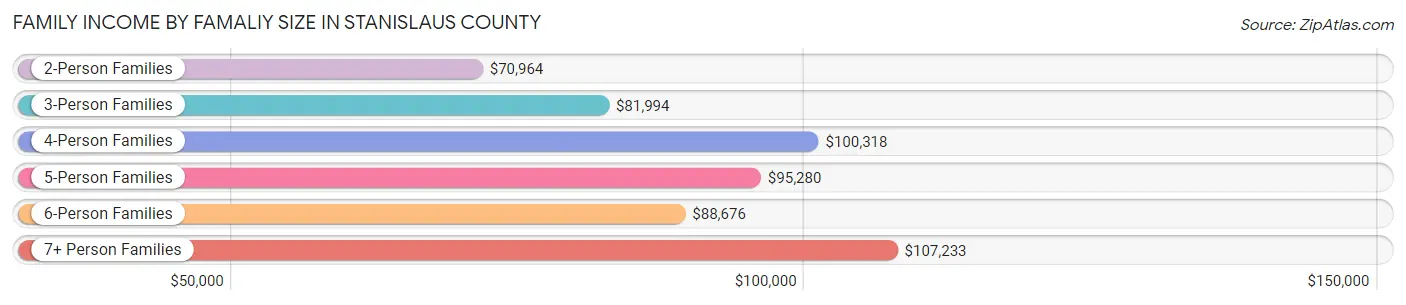
Family Income by Famaliy Size in Stanislaus County
7+ person families (5,452 | 4.2%) account for the highest median family income in Stanislaus County with $107,233 per family, while 2-person families (47,354 | 36.4%) have the highest median income of $35,482 per family member.
| Income Bracket | # Families | Median Income |
| 2-Person Families | 47,354 (36.4%) | $70,964 |
| 3-Person Families | 29,258 (22.5%) | $81,994 |
| 4-Person Families | 24,960 (19.2%) | $100,318 |
| 5-Person Families | 15,824 (12.2%) | $95,280 |
| 6-Person Families | 7,244 (5.6%) | $88,676 |
| 7+ Person Families | 5,452 (4.2%) | $107,233 |
| Total | 130,092 (100.0%) | $83,732 |
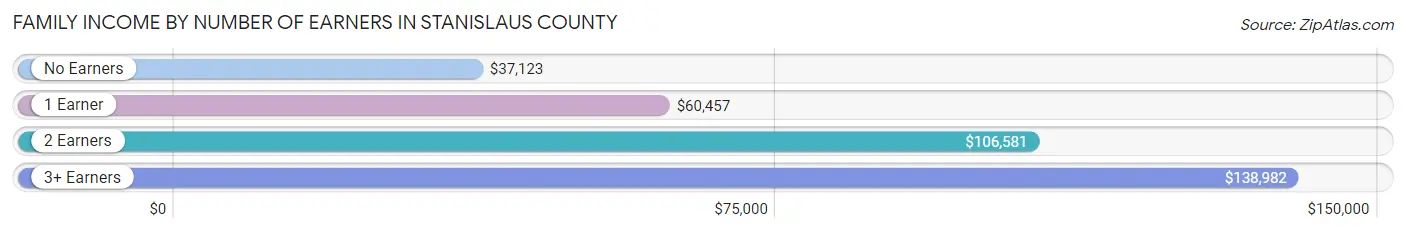
Family Income by Number of Earners in Stanislaus County
The median family income in Stanislaus County is $83,732, with families comprising 3+ earners (20,227) having the highest median family income of $138,982, while families with no earners (17,639) have the lowest median family income of $37,123, accounting for 15.5% and 13.6% of families, respectively.
| Number of Earners | # Families | Median Income |
| No Earners | 17,639 (13.6%) | $37,123 |
| 1 Earner | 45,526 (35.0%) | $60,457 |
| 2 Earners | 46,700 (35.9%) | $106,581 |
| 3+ Earners | 20,227 (15.5%) | $138,982 |
| Total | 130,092 (100.0%) | $83,732 |
Household Income in Stanislaus County
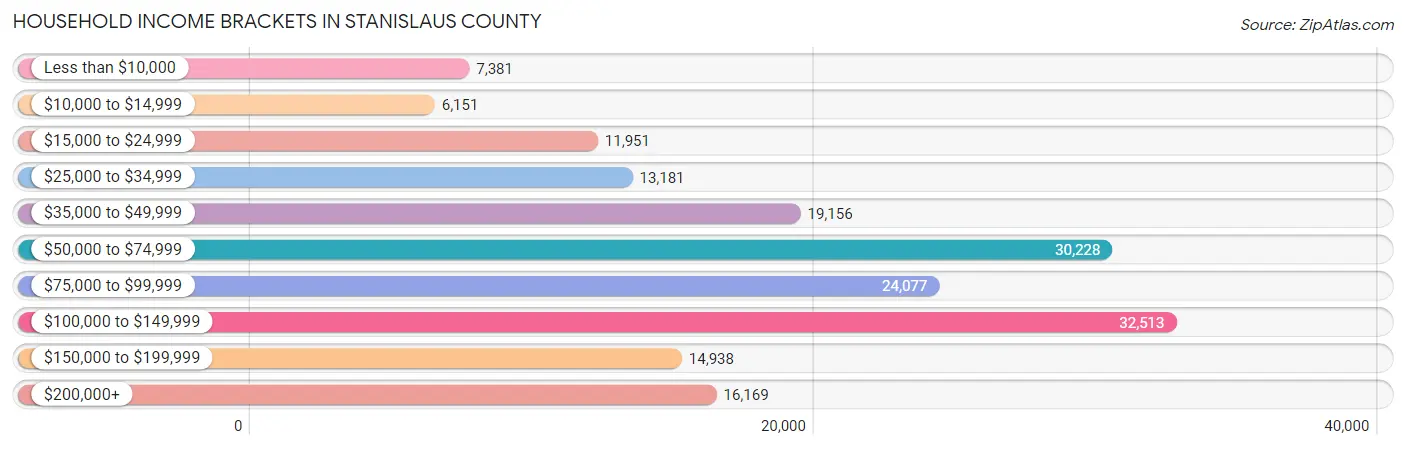
Household Income Brackets in Stanislaus County
With 32,513 households falling in the category, the $100,000 to $149,999 income range is the most frequent in Stanislaus County, accounting for 18.5% of all households. In contrast, only 6,151 households (3.5%) fall into the $10,000 to $14,999 income bracket, making it the least populous group.
| Income Bracket | # Households | % Households |
| Less than $10,000 | 7,381 | 4.2% |
| $10,000 to $14,999 | 6,151 | 3.5% |
| $15,000 to $24,999 | 11,951 | 6.8% |
| $25,000 to $34,999 | 13,181 | 7.5% |
| $35,000 to $49,999 | 19,156 | 10.9% |
| $50,000 to $74,999 | 30,228 | 17.2% |
| $75,000 to $99,999 | 24,077 | 13.7% |
| $100,000 to $149,999 | 32,513 | 18.5% |
| $150,000 to $199,999 | 14,938 | 8.5% |
| $200,000+ | 16,169 | 9.2% |
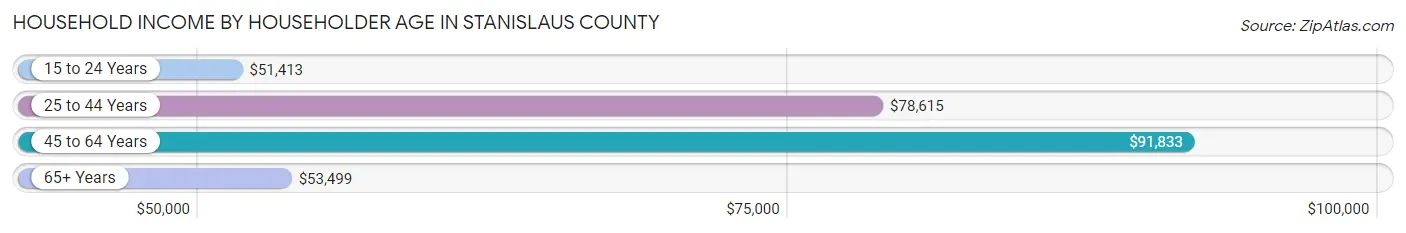
Household Income by Householder Age in Stanislaus County
The median household income in Stanislaus County is $74,872, with the highest median household income of $91,833 found in the 45 to 64 years age bracket for the primary householder. A total of 65,392 households (37.2%) fall into this category. Meanwhile, the 15 to 24 years age bracket for the primary householder has the lowest median household income of $51,413, with 4,981 households (2.8%) in this group.
| Income Bracket | # Households | Median Income |
| 15 to 24 Years | 4,981 (2.8%) | $51,413 |
| 25 to 44 Years | 62,911 (35.8%) | $78,615 |
| 45 to 64 Years | 65,392 (37.2%) | $91,833 |
| 65+ Years | 42,463 (24.2%) | $53,499 |
| Total | 175,747 (100.0%) | $74,872 |
Poverty in Stanislaus County
Income Below Poverty by Sex and Age in Stanislaus County
With 12.8% poverty level for males and 14.7% for females among the residents of Stanislaus County, 12 to 14 year old males and 12 to 14 year old females are the most vulnerable to poverty, with 2,756 males (20.6%) and 2,640 females (19.2%) in their respective age groups living below the poverty level.
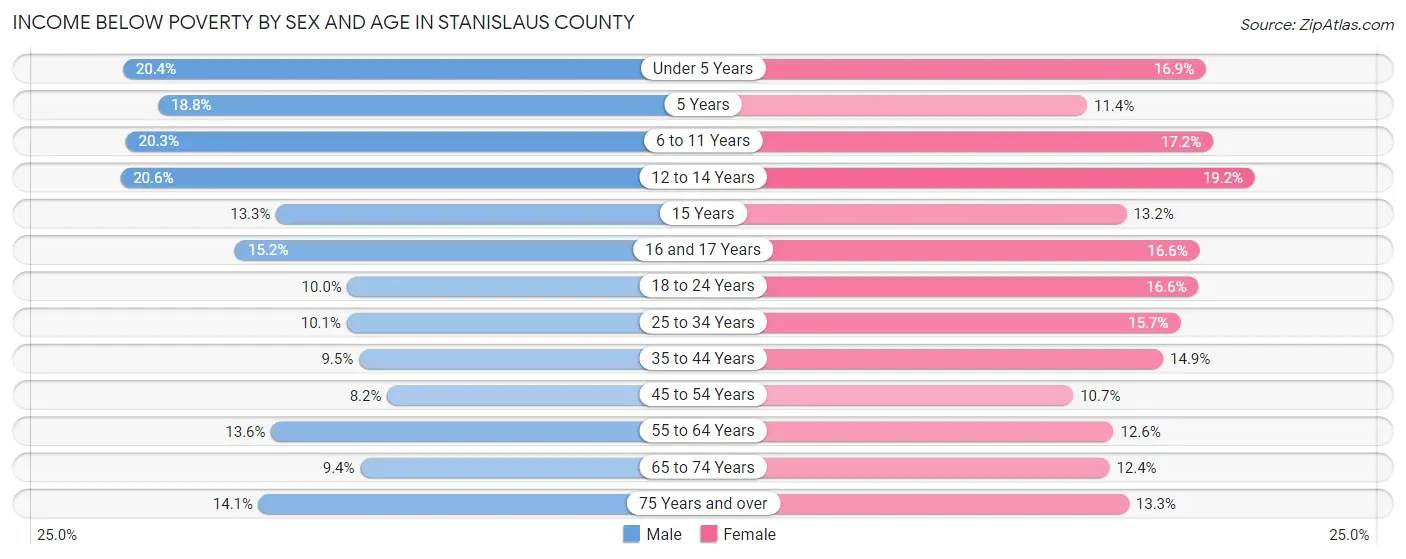
| Age Bracket | Male | Female |
| Under 5 Years | 3,906 (20.4%) | 3,114 (16.9%) |
| 5 Years | 724 (18.8%) | 338 (11.4%) |
| 6 to 11 Years | 5,087 (20.3%) | 4,134 (17.2%) |
| 12 to 14 Years | 2,756 (20.6%) | 2,640 (19.2%) |
| 15 Years | 602 (13.3%) | 565 (13.2%) |
| 16 and 17 Years | 1,320 (15.2%) | 1,363 (16.6%) |
| 18 to 24 Years | 2,720 (10.0%) | 4,257 (16.6%) |
| 25 to 34 Years | 4,021 (10.1%) | 6,051 (15.7%) |
| 35 to 44 Years | 3,484 (9.5%) | 5,266 (14.9%) |
| 45 to 54 Years | 2,654 (8.2%) | 3,411 (10.7%) |
| 55 to 64 Years | 4,098 (13.6%) | 3,934 (12.6%) |
| 65 to 74 Years | 1,902 (9.4%) | 2,849 (12.4%) |
| 75 Years and over | 1,698 (14.1%) | 2,231 (13.3%) |
| Total | 34,972 (12.8%) | 40,153 (14.7%) |
Income Above Poverty by Sex and Age in Stanislaus County
According to the poverty statistics in Stanislaus County, males aged 45 to 54 years and females aged 45 to 54 years are the age groups that are most secure financially, with 91.8% of males and 89.3% of females in these age groups living above the poverty line.
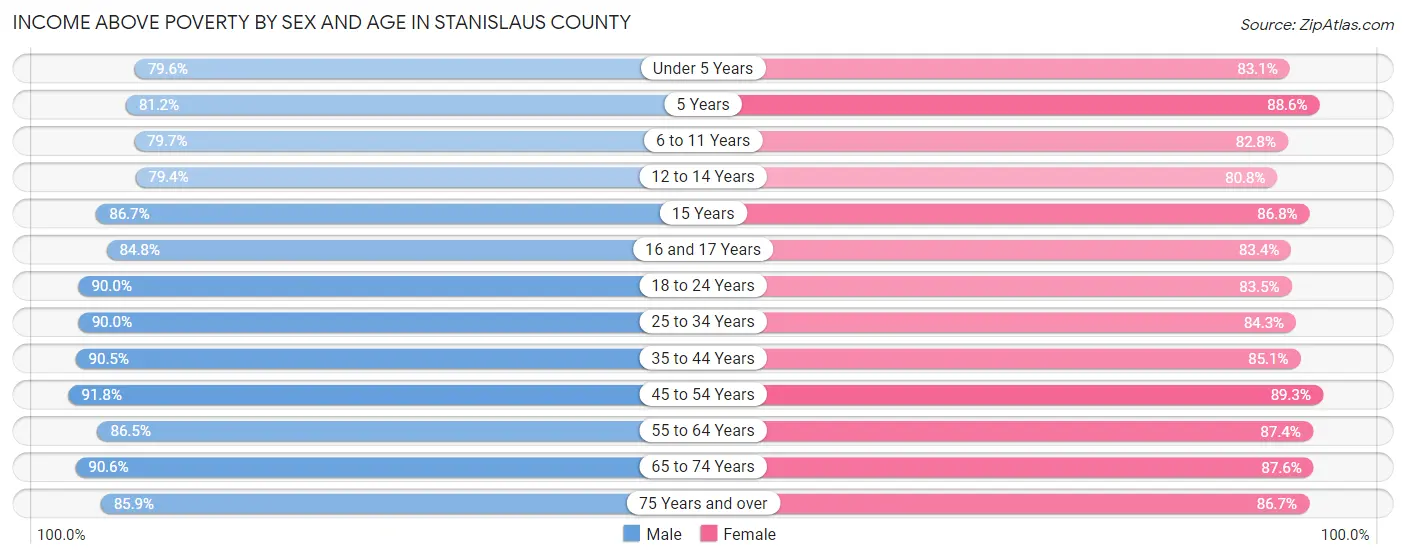
| Age Bracket | Male | Female |
| Under 5 Years | 15,201 (79.6%) | 15,307 (83.1%) |
| 5 Years | 3,127 (81.2%) | 2,631 (88.6%) |
| 6 to 11 Years | 19,961 (79.7%) | 19,853 (82.8%) |
| 12 to 14 Years | 10,646 (79.4%) | 11,134 (80.8%) |
| 15 Years | 3,918 (86.7%) | 3,712 (86.8%) |
| 16 and 17 Years | 7,349 (84.8%) | 6,850 (83.4%) |
| 18 to 24 Years | 24,451 (90.0%) | 21,459 (83.5%) |
| 25 to 34 Years | 35,984 (89.9%) | 32,477 (84.3%) |
| 35 to 44 Years | 33,257 (90.5%) | 30,051 (85.1%) |
| 45 to 54 Years | 29,836 (91.8%) | 28,346 (89.3%) |
| 55 to 64 Years | 26,137 (86.5%) | 27,260 (87.4%) |
| 65 to 74 Years | 18,291 (90.6%) | 20,099 (87.6%) |
| 75 Years and over | 10,320 (85.9%) | 14,521 (86.7%) |
| Total | 238,478 (87.2%) | 233,700 (85.3%) |
Income Below Poverty Among Married-Couple Families in Stanislaus County
The poverty statistics for married-couple families in Stanislaus County show that 6.7% or 6,041 of the total 89,808 families live below the poverty line. Families with 5 or more children have the highest poverty rate of 26.0%, comprising of 394 families. On the other hand, families with no children have the lowest poverty rate of 4.4%, which includes 2,011 families.
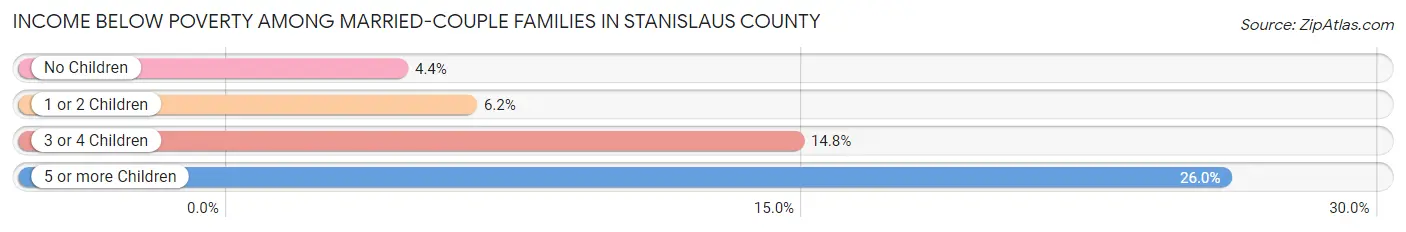
| Children | Above Poverty | Below Poverty |
| No Children | 43,256 (95.6%) | 2,011 (4.4%) |
| 1 or 2 Children | 29,908 (93.8%) | 1,992 (6.2%) |
| 3 or 4 Children | 9,479 (85.2%) | 1,644 (14.8%) |
| 5 or more Children | 1,124 (74.0%) | 394 (26.0%) |
| Total | 83,767 (93.3%) | 6,041 (6.7%) |
Income Below Poverty Among Single-Parent Households in Stanislaus County
According to the poverty data in Stanislaus County, 10.9% or 1,534 single-father households and 24.6% or 6,454 single-mother households are living below the poverty line. Among single-father households, those with 3 or 4 children have the highest poverty rate, with 338 households (24.7%) experiencing poverty. Likewise, among single-mother households, those with 5 or more children have the highest poverty rate, with 214 households (65.2%) falling below the poverty line.
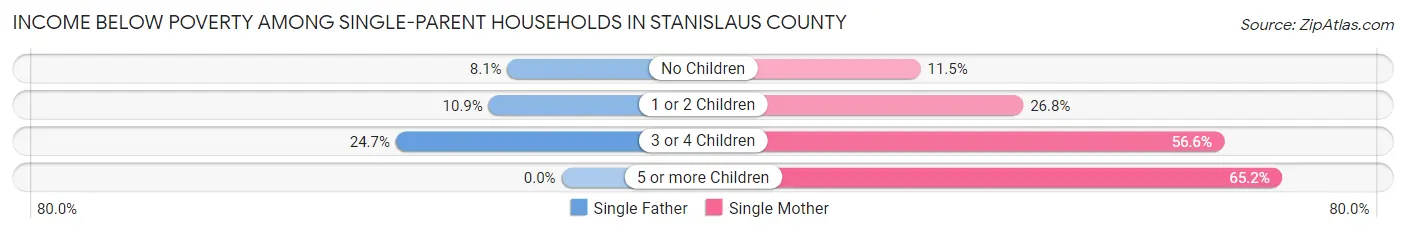
| Children | Single Father | Single Mother |
| No Children | 523 (8.1%) | 1,126 (11.5%) |
| 1 or 2 Children | 673 (10.9%) | 3,548 (26.8%) |
| 3 or 4 Children | 338 (24.7%) | 1,566 (56.6%) |
| 5 or more Children | 0 (0.0%) | 214 (65.2%) |
| Total | 1,534 (10.9%) | 6,454 (24.6%) |
Income Below Poverty Among Married-Couple vs Single-Parent Households in Stanislaus County
The poverty data for Stanislaus County shows that 6,041 of the married-couple family households (6.7%) and 7,988 of the single-parent households (19.8%) are living below the poverty level. Within the married-couple family households, those with 5 or more children have the highest poverty rate, with 394 households (26.0%) falling below the poverty line. Among the single-parent households, those with 5 or more children have the highest poverty rate, with 214 household (57.2%) living below poverty.
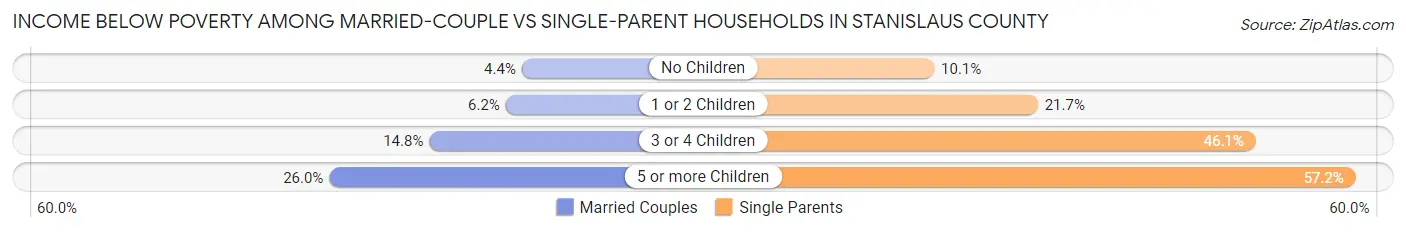
| Children | Married-Couple Families | Single-Parent Households |
| No Children | 2,011 (4.4%) | 1,649 (10.1%) |
| 1 or 2 Children | 1,992 (6.2%) | 4,221 (21.7%) |
| 3 or 4 Children | 1,644 (14.8%) | 1,904 (46.1%) |
| 5 or more Children | 394 (26.0%) | 214 (57.2%) |
| Total | 6,041 (6.7%) | 7,988 (19.8%) |
Race in Stanislaus County
The most populous races in Stanislaus County are White / Caucasian (316,065 | 57.3%), Hispanic or Latino (268,427 | 48.6%), and Two or more Races (106,332 | 19.3%).
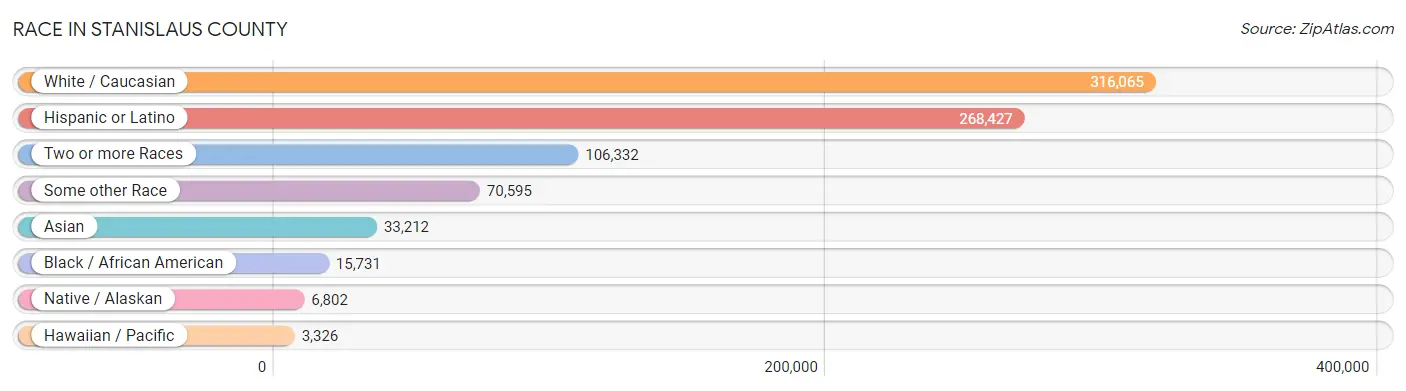
| Race | # Population | % Population |
| Asian | 33,212 | 6.0% |
| Black / African American | 15,731 | 2.9% |
| Hawaiian / Pacific | 3,326 | 0.6% |
| Hispanic or Latino | 268,427 | 48.6% |
| Native / Alaskan | 6,802 | 1.2% |
| White / Caucasian | 316,065 | 57.3% |
| Two or more Races | 106,332 | 19.3% |
| Some other Race | 70,595 | 12.8% |
| Total | 552,063 | 100.0% |
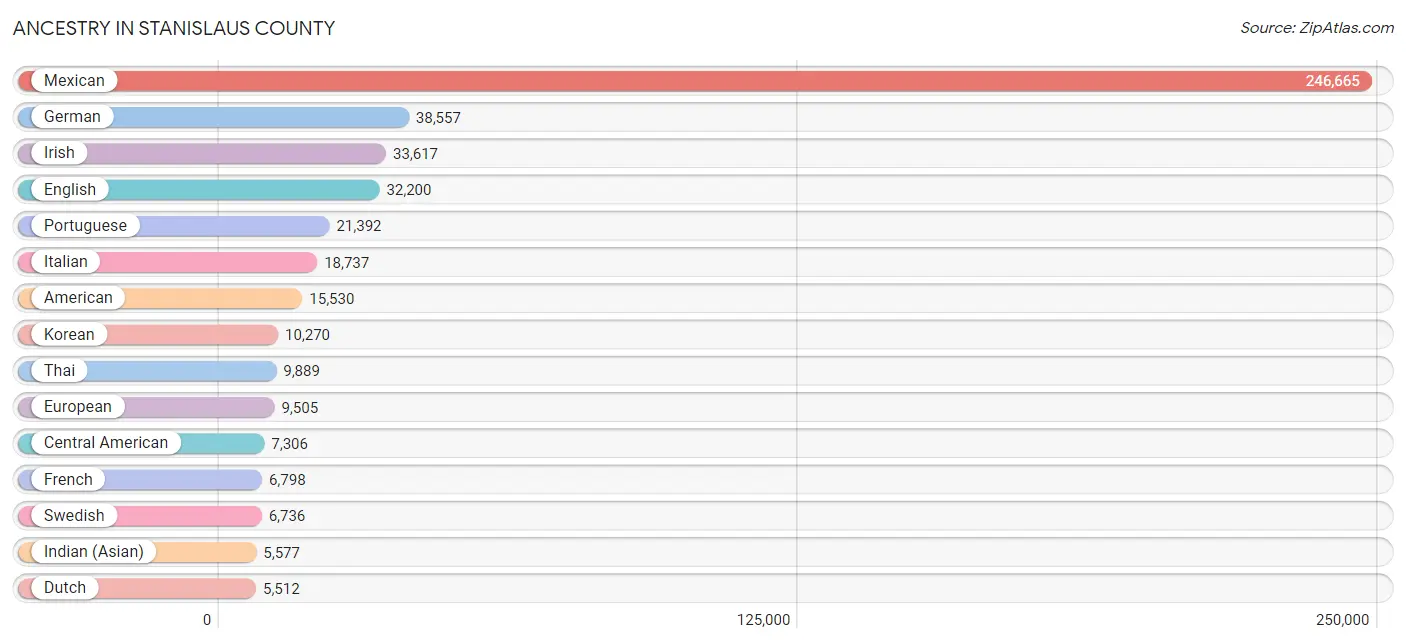
Ancestry in Stanislaus County
The most populous ancestries reported in Stanislaus County are Mexican (246,665 | 44.7%), German (38,557 | 7.0%), Irish (33,617 | 6.1%), English (32,200 | 5.8%), and Portuguese (21,392 | 3.9%), together accounting for 67.4% of all Stanislaus County residents.
| Ancestry | # Population | % Population |
| Afghan | 2,443 | 0.4% |
| African | 679 | 0.1% |
| Alaskan Athabascan | 15 | 0.0% |
| Aleut | 8 | 0.0% |
| American | 15,530 | 2.8% |
| Apache | 737 | 0.1% |
| Arab | 3,703 | 0.7% |
| Argentinean | 215 | 0.0% |
| Armenian | 505 | 0.1% |
| Assyrian / Chaldean / Syriac | 5,481 | 1.0% |
| Australian | 162 | 0.0% |
| Austrian | 641 | 0.1% |
| Bangladeshi | 735 | 0.1% |
| Basque | 151 | 0.0% |
| Belgian | 153 | 0.0% |
| Belizean | 19 | 0.0% |
| Bhutanese | 2,295 | 0.4% |
| Blackfeet | 358 | 0.1% |
| Bolivian | 99 | 0.0% |
| Brazilian | 327 | 0.1% |
| British | 1,732 | 0.3% |
| Bulgarian | 7 | 0.0% |
| Burmese | 1,324 | 0.2% |
| Cajun | 32 | 0.0% |
| Cambodian | 1 | 0.0% |
| Canadian | 507 | 0.1% |
| Celtic | 47 | 0.0% |
| Central American | 7,306 | 1.3% |
| Central American Indian | 1,081 | 0.2% |
| Cherokee | 2,267 | 0.4% |
| Cheyenne | 113 | 0.0% |
| Chickasaw | 150 | 0.0% |
| Chilean | 121 | 0.0% |
| Chinese | 6 | 0.0% |
| Chippewa | 75 | 0.0% |
| Choctaw | 656 | 0.1% |
| Colombian | 563 | 0.1% |
| Comanche | 7 | 0.0% |
| Costa Rican | 19 | 0.0% |
| Cree | 24 | 0.0% |
| Creek | 194 | 0.0% |
| Croatian | 122 | 0.0% |
| Crow | 130 | 0.0% |
| Cuban | 570 | 0.1% |
| Czech | 450 | 0.1% |
| Czechoslovakian | 221 | 0.0% |
| Danish | 2,079 | 0.4% |
| Delaware | 12 | 0.0% |
| Dominican | 66 | 0.0% |
| Dutch | 5,512 | 1.0% |
| Dutch West Indian | 39 | 0.0% |
| Eastern European | 667 | 0.1% |
| Ecuadorian | 208 | 0.0% |
| Egyptian | 43 | 0.0% |
| English | 32,200 | 5.8% |
| Estonian | 152 | 0.0% |
| Ethiopian | 601 | 0.1% |
| European | 9,505 | 1.7% |
| Filipino | 152 | 0.0% |
| Finnish | 648 | 0.1% |
| French | 6,798 | 1.2% |
| French American Indian | 35 | 0.0% |
| French Canadian | 905 | 0.2% |
| German | 38,557 | 7.0% |
| Ghanaian | 65 | 0.0% |
| Greek | 2,282 | 0.4% |
| Guamanian / Chamorro | 581 | 0.1% |
| Guatemalan | 1,934 | 0.4% |
| Haitian | 14 | 0.0% |
| Honduran | 208 | 0.0% |
| Hopi | 29 | 0.0% |
| Hungarian | 391 | 0.1% |
| Icelander | 81 | 0.0% |
| Indian (Asian) | 5,577 | 1.0% |
| Indonesian | 72 | 0.0% |
| Iranian | 1,389 | 0.3% |
| Iraqi | 576 | 0.1% |
| Irish | 33,617 | 6.1% |
| Iroquois | 24 | 0.0% |
| Israeli | 64 | 0.0% |
| Italian | 18,737 | 3.4% |
| Jamaican | 411 | 0.1% |
| Japanese | 3,960 | 0.7% |
| Jordanian | 86 | 0.0% |
| Kenyan | 18 | 0.0% |
| Korean | 10,270 | 1.9% |
| Laotian | 129 | 0.0% |
| Latvian | 35 | 0.0% |
| Lebanese | 445 | 0.1% |
| Liberian | 24 | 0.0% |
| Lithuanian | 56 | 0.0% |
| Lumbee | 33 | 0.0% |
| Luxembourger | 20 | 0.0% |
| Malaysian | 1,260 | 0.2% |
| Maltese | 114 | 0.0% |
| Mexican | 246,665 | 44.7% |
| Mexican American Indian | 2,999 | 0.5% |
| Native Hawaiian | 1,531 | 0.3% |
| Navajo | 279 | 0.1% |
| Nepalese | 121 | 0.0% |
| New Zealander | 48 | 0.0% |
| Nicaraguan | 983 | 0.2% |
| Nigerian | 941 | 0.2% |
| Northern European | 854 | 0.2% |
| Norwegian | 4,973 | 0.9% |
| Osage | 11 | 0.0% |
| Ottawa | 6 | 0.0% |
| Paiute | 170 | 0.0% |
| Pakistani | 220 | 0.0% |
| Palestinian | 132 | 0.0% |
| Panamanian | 95 | 0.0% |
| Pennsylvania German | 53 | 0.0% |
| Peruvian | 1,162 | 0.2% |
| Pima | 156 | 0.0% |
| Polish | 3,102 | 0.6% |
| Portuguese | 21,392 | 3.9% |
| Potawatomi | 10 | 0.0% |
| Pueblo | 124 | 0.0% |
| Puerto Rican | 3,448 | 0.6% |
| Romanian | 175 | 0.0% |
| Russian | 2,236 | 0.4% |
| Salvadoran | 4,067 | 0.7% |
| Samoan | 906 | 0.2% |
| Scandinavian | 1,725 | 0.3% |
| Scotch-Irish | 2,245 | 0.4% |
| Scottish | 5,159 | 0.9% |
| Seminole | 155 | 0.0% |
| Serbian | 32 | 0.0% |
| Shoshone | 104 | 0.0% |
| Sioux | 114 | 0.0% |
| Slavic | 136 | 0.0% |
| Slovak | 143 | 0.0% |
| Slovene | 8 | 0.0% |
| South American | 2,379 | 0.4% |
| South American Indian | 26 | 0.0% |
| Spaniard | 2,798 | 0.5% |
| Spanish | 2,048 | 0.4% |
| Spanish American | 45 | 0.0% |
| Spanish American Indian | 54 | 0.0% |
| Sri Lankan | 2,486 | 0.4% |
| Subsaharan African | 2,590 | 0.5% |
| Swedish | 6,736 | 1.2% |
| Swiss | 1,626 | 0.3% |
| Syrian | 320 | 0.1% |
| Thai | 9,889 | 1.8% |
| Tohono O'Odham | 89 | 0.0% |
| Tongan | 190 | 0.0% |
| Turkish | 248 | 0.0% |
| Ukrainian | 693 | 0.1% |
| Venezuelan | 11 | 0.0% |
| Welsh | 2,119 | 0.4% |
| Yaqui | 408 | 0.1% |
| Yugoslavian | 286 | 0.1% | View All 153 Rows |
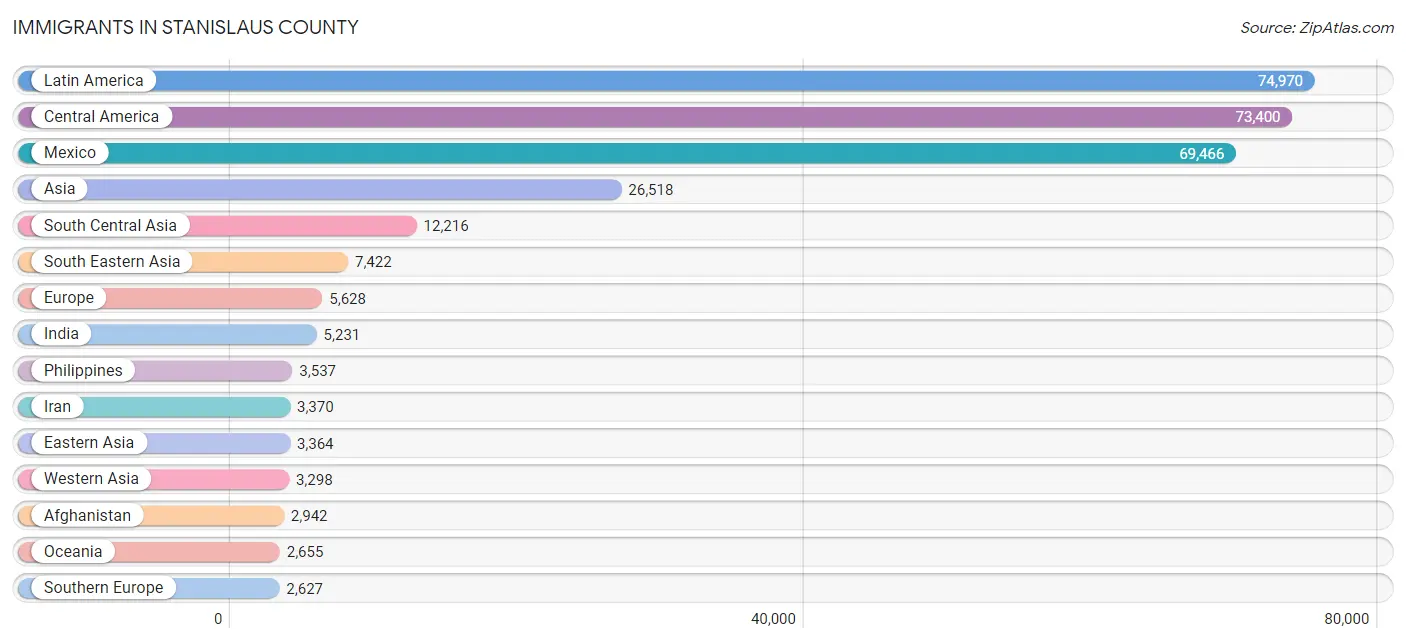
Immigrants in Stanislaus County
The most numerous immigrant groups reported in Stanislaus County came from Latin America (74,970 | 13.6%), Central America (73,400 | 13.3%), Mexico (69,466 | 12.6%), Asia (26,518 | 4.8%), and South Central Asia (12,216 | 2.2%), together accounting for 46.5% of all Stanislaus County residents.
| Immigration Origin | # Population | % Population |
| Afghanistan | 2,942 | 0.5% |
| Africa | 1,217 | 0.2% |
| Albania | 10 | 0.0% |
| Argentina | 90 | 0.0% |
| Armenia | 19 | 0.0% |
| Asia | 26,518 | 4.8% |
| Australia | 107 | 0.0% |
| Austria | 32 | 0.0% |
| Azores | 1,404 | 0.3% |
| Belarus | 21 | 0.0% |
| Belgium | 9 | 0.0% |
| Bolivia | 32 | 0.0% |
| Brazil | 56 | 0.0% |
| Bulgaria | 105 | 0.0% |
| Cambodia | 1,384 | 0.3% |
| Canada | 558 | 0.1% |
| Caribbean | 391 | 0.1% |
| Central America | 73,400 | 13.3% |
| Chile | 34 | 0.0% |
| China | 2,564 | 0.5% |
| Colombia | 114 | 0.0% |
| Cuba | 135 | 0.0% |
| Czechoslovakia | 58 | 0.0% |
| Dominican Republic | 59 | 0.0% |
| Eastern Africa | 455 | 0.1% |
| Eastern Asia | 3,364 | 0.6% |
| Eastern Europe | 1,134 | 0.2% |
| Ecuador | 30 | 0.0% |
| Egypt | 12 | 0.0% |
| El Salvador | 1,911 | 0.4% |
| England | 367 | 0.1% |
| Ethiopia | 228 | 0.0% |
| Europe | 5,628 | 1.0% |
| Fiji | 2,157 | 0.4% |
| France | 285 | 0.1% |
| Germany | 401 | 0.1% |
| Ghana | 41 | 0.0% |
| Greece | 187 | 0.0% |
| Guatemala | 1,255 | 0.2% |
| Honduras | 227 | 0.0% |
| Hong Kong | 195 | 0.0% |
| Hungary | 8 | 0.0% |
| India | 5,231 | 0.9% |
| Indonesia | 189 | 0.0% |
| Iran | 3,370 | 0.6% |
| Iraq | 2,019 | 0.4% |
| Ireland | 86 | 0.0% |
| Israel | 127 | 0.0% |
| Italy | 272 | 0.1% |
| Jamaica | 182 | 0.0% |
| Japan | 126 | 0.0% |
| Jordan | 53 | 0.0% |
| Kazakhstan | 43 | 0.0% |
| Kenya | 42 | 0.0% |
| Korea | 673 | 0.1% |
| Kuwait | 23 | 0.0% |
| Laos | 437 | 0.1% |
| Latin America | 74,970 | 13.6% |
| Latvia | 20 | 0.0% |
| Lebanon | 179 | 0.0% |
| Mexico | 69,466 | 12.6% |
| Middle Africa | 63 | 0.0% |
| Nepal | 34 | 0.0% |
| Netherlands | 343 | 0.1% |
| Nicaragua | 464 | 0.1% |
| Nigeria | 427 | 0.1% |
| Northern Africa | 134 | 0.0% |
| Northern Europe | 729 | 0.1% |
| Oceania | 2,655 | 0.5% |
| Pakistan | 531 | 0.1% |
| Panama | 23 | 0.0% |
| Peru | 812 | 0.2% |
| Philippines | 3,537 | 0.6% |
| Poland | 63 | 0.0% |
| Portugal | 2,059 | 0.4% |
| Romania | 100 | 0.0% |
| Russia | 351 | 0.1% |
| Scotland | 67 | 0.0% |
| Singapore | 30 | 0.0% |
| South Africa | 42 | 0.0% |
| South America | 1,179 | 0.2% |
| South Central Asia | 12,216 | 2.2% |
| South Eastern Asia | 7,422 | 1.3% |
| Southern Europe | 2,627 | 0.5% |
| Spain | 109 | 0.0% |
| Sri Lanka | 61 | 0.0% |
| Sweden | 19 | 0.0% |
| Switzerland | 68 | 0.0% |
| Syria | 338 | 0.1% |
| Taiwan | 225 | 0.0% |
| Thailand | 617 | 0.1% |
| Trinidad and Tobago | 15 | 0.0% |
| Turkey | 53 | 0.0% |
| Ukraine | 378 | 0.1% |
| Uzbekistan | 4 | 0.0% |
| Venezuela | 11 | 0.0% |
| Vietnam | 1,138 | 0.2% |
| Western Africa | 495 | 0.1% |
| Western Asia | 3,298 | 0.6% |
| Western Europe | 1,138 | 0.2% |
| Yemen | 475 | 0.1% | View All 101 Rows |
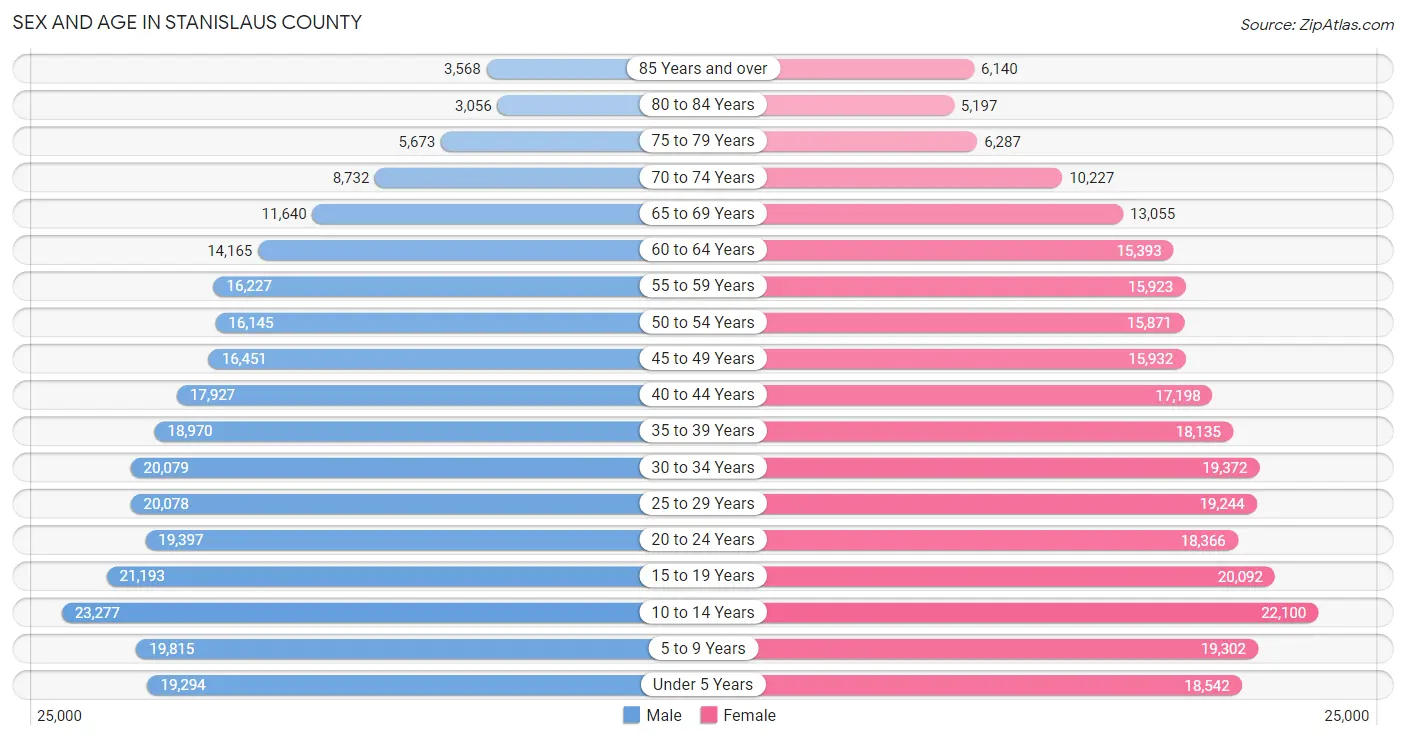
Sex and Age in Stanislaus County
Sex and Age in Stanislaus County
The most populous age groups in Stanislaus County are 10 to 14 Years (23,277 | 8.4%) for men and 10 to 14 Years (22,100 | 8.0%) for women.
| Age Bracket | Male | Female |
| Under 5 Years | 19,294 (7.0%) | 18,542 (6.7%) |
| 5 to 9 Years | 19,815 (7.2%) | 19,302 (7.0%) |
| 10 to 14 Years | 23,277 (8.4%) | 22,100 (8.0%) |
| 15 to 19 Years | 21,193 (7.7%) | 20,092 (7.3%) |
| 20 to 24 Years | 19,397 (7.0%) | 18,366 (6.7%) |
| 25 to 29 Years | 20,078 (7.3%) | 19,244 (7.0%) |
| 30 to 34 Years | 20,079 (7.3%) | 19,372 (7.0%) |
| 35 to 39 Years | 18,970 (6.9%) | 18,135 (6.6%) |
| 40 to 44 Years | 17,927 (6.5%) | 17,198 (6.2%) |
| 45 to 49 Years | 16,451 (6.0%) | 15,932 (5.8%) |
| 50 to 54 Years | 16,145 (5.9%) | 15,871 (5.7%) |
| 55 to 59 Years | 16,227 (5.9%) | 15,923 (5.8%) |
| 60 to 64 Years | 14,165 (5.1%) | 15,393 (5.6%) |
| 65 to 69 Years | 11,640 (4.2%) | 13,055 (4.7%) |
| 70 to 74 Years | 8,732 (3.2%) | 10,227 (3.7%) |
| 75 to 79 Years | 5,673 (2.1%) | 6,287 (2.3%) |
| 80 to 84 Years | 3,056 (1.1%) | 5,197 (1.9%) |
| 85 Years and over | 3,568 (1.3%) | 6,140 (2.2%) |
| Total | 275,687 (100.0%) | 276,376 (100.0%) |
Families and Households in Stanislaus County
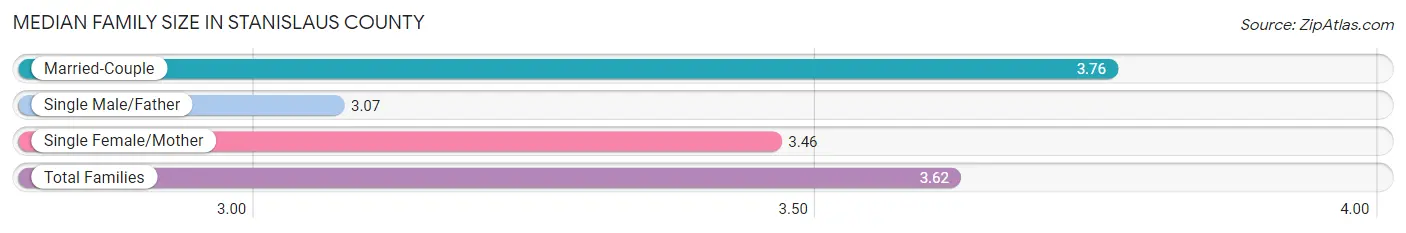
Median Family Size in Stanislaus County
The median family size in Stanislaus County is 3.62 persons per family, with married-couple families (89,808 | 69.0%) accounting for the largest median family size of 3.76 persons per family. On the other hand, single male/father families (14,105 | 10.8%) represent the smallest median family size with 3.07 persons per family.
| Family Type | # Families | Family Size |
| Married-Couple | 89,808 (69.0%) | 3.76 |
| Single Male/Father | 14,105 (10.8%) | 3.07 |
| Single Female/Mother | 26,179 (20.1%) | 3.46 |
| Total Families | 130,092 (100.0%) | 3.62 |
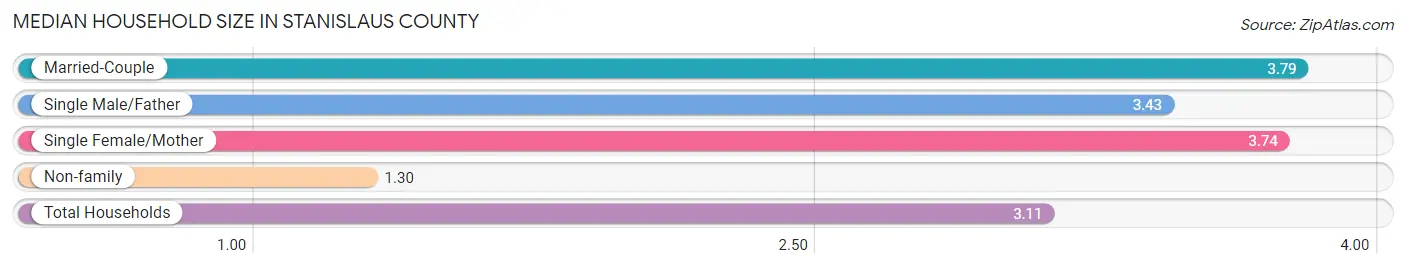
Median Household Size in Stanislaus County
The median household size in Stanislaus County is 3.11 persons per household, with married-couple households (89,808 | 51.1%) accounting for the largest median household size of 3.79 persons per household. non-family households (45,655 | 26.0%) represent the smallest median household size with 1.30 persons per household.
| Household Type | # Households | Household Size |
| Married-Couple | 89,808 (51.1%) | 3.79 |
| Single Male/Father | 14,105 (8.0%) | 3.43 |
| Single Female/Mother | 26,179 (14.9%) | 3.74 |
| Non-family | 45,655 (26.0%) | 1.30 |
| Total Households | 175,747 (100.0%) | 3.11 |
Household Size by Marriage Status in Stanislaus County
Out of a total of 175,747 households in Stanislaus County, 130,092 (74.0%) are family households, while 45,655 (26.0%) are nonfamily households. The most numerous type of family households are 2-person households, comprising 43,039, and the most common type of nonfamily households are 1-person households, comprising 35,730.
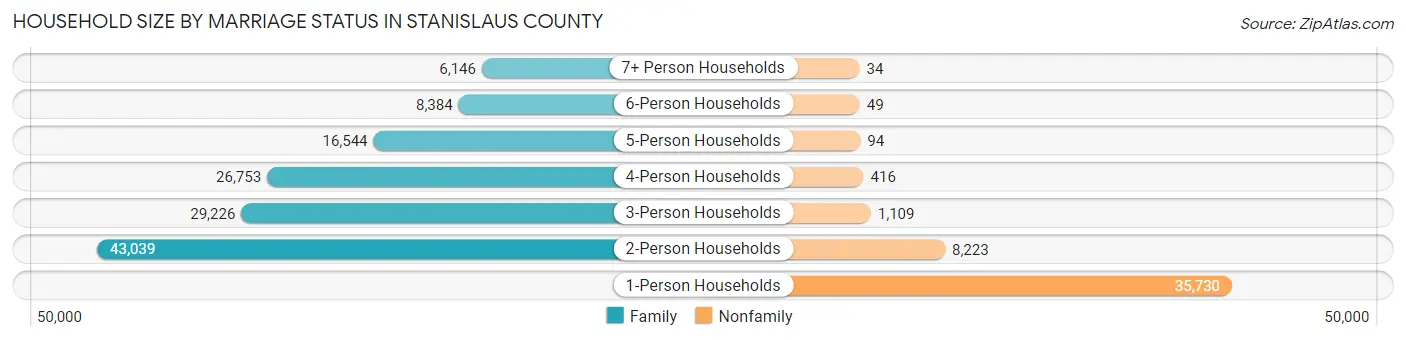
| Household Size | Family Households | Nonfamily Households |
| 1-Person Households | - | 35,730 (20.3%) |
| 2-Person Households | 43,039 (24.5%) | 8,223 (4.7%) |
| 3-Person Households | 29,226 (16.6%) | 1,109 (0.6%) |
| 4-Person Households | 26,753 (15.2%) | 416 (0.2%) |
| 5-Person Households | 16,544 (9.4%) | 94 (0.1%) |
| 6-Person Households | 8,384 (4.8%) | 49 (0.0%) |
| 7+ Person Households | 6,146 (3.5%) | 34 (0.0%) |
| Total | 130,092 (74.0%) | 45,655 (26.0%) |
Female Fertility in Stanislaus County
Fertility by Age in Stanislaus County
Average fertility rate in Stanislaus County is 53.0 births per 1,000 women. Women in the age bracket of 20 to 34 years have the highest fertility rate with 93.0 births per 1,000 women. Women in the age bracket of 20 to 34 years acount for 75.6% of all women with births.
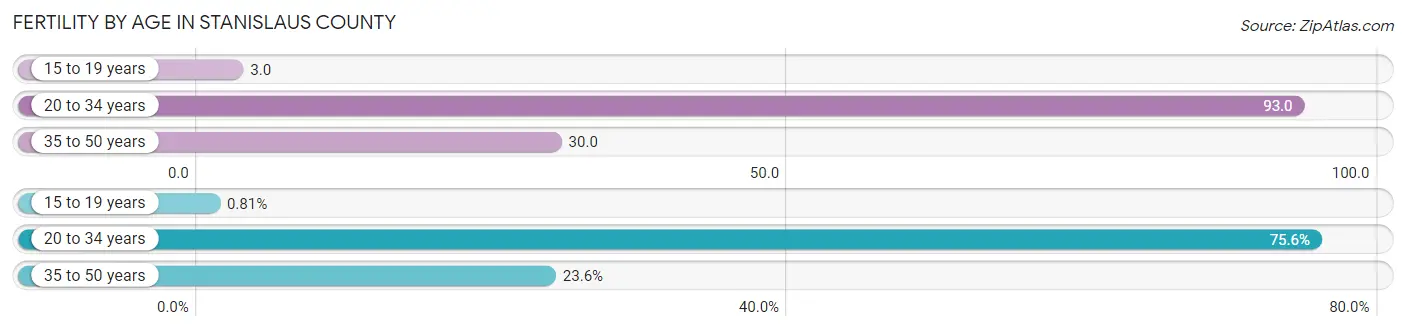
| Age Bracket | Women with Births | Births / 1,000 Women |
| 15 to 19 years | 57 (0.8%) | 3.0 |
| 20 to 34 years | 5,308 (75.6%) | 93.0 |
| 35 to 50 years | 1,658 (23.6%) | 30.0 |
| Total | 7,023 (100.0%) | 53.0 |
Fertility by Age by Marriage Status in Stanislaus County
66.2% of women with births (7,023) in Stanislaus County are married. The highest percentage of unmarried women with births falls into 15 to 19 years age bracket with 93.0% of them unmarried at the time of birth, while the lowest percentage of unmarried women with births belong to 35 to 50 years age bracket with 30.9% of them unmarried.
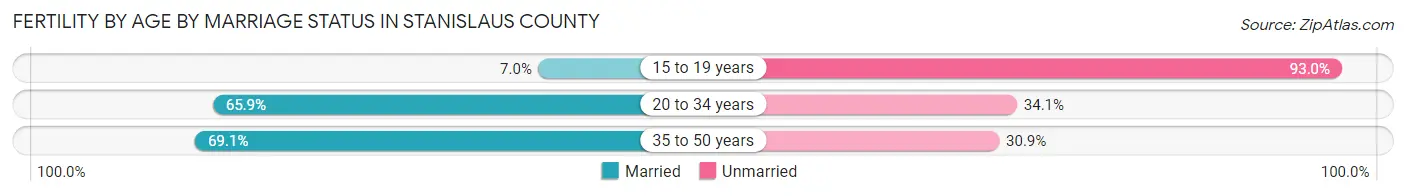
| Age Bracket | Married | Unmarried |
| 15 to 19 years | 4 (7.0%) | 53 (93.0%) |
| 20 to 34 years | 3,498 (65.9%) | 1,810 (34.1%) |
| 35 to 50 years | 1,146 (69.1%) | 512 (30.9%) |
| Total | 4,649 (66.2%) | 2,374 (33.8%) |
Fertility by Education in Stanislaus County
Average fertility rate in Stanislaus County is 53.0 births per 1,000 women. Women with the education attainment of graduate degree have the highest fertility rate of 67.0 births per 1,000 women, while women with the education attainment of less than high school have the lowest fertility at 28.0 births per 1,000 women. Women with the education attainment of college or associate's degree represent 38.1% of all women with births.
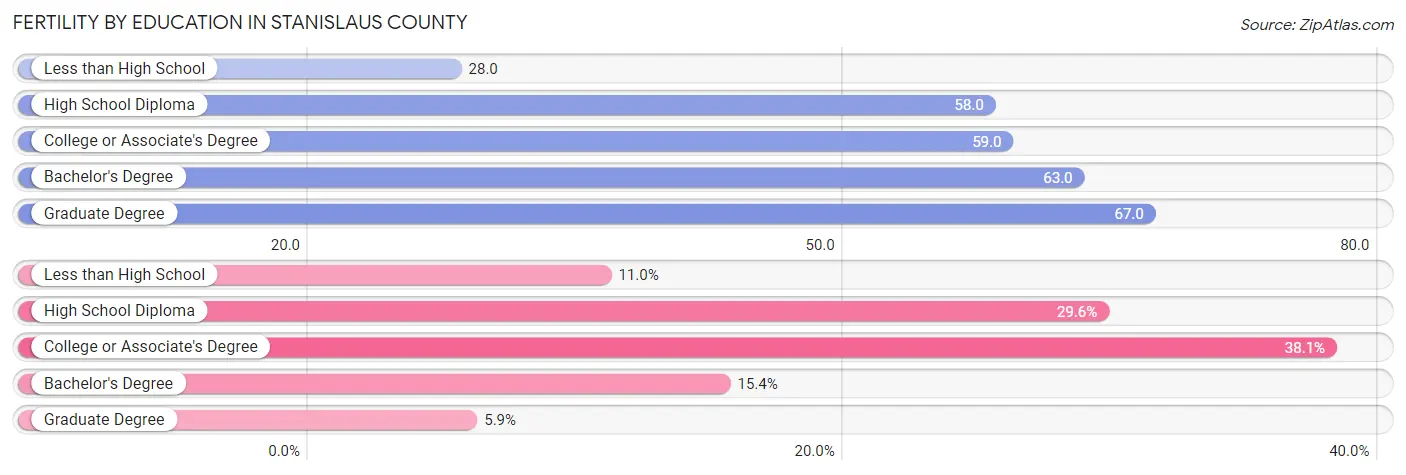
| Educational Attainment | Women with Births | Births / 1,000 Women |
| Less than High School | 769 (11.0%) | 28.0 |
| High School Diploma | 2,078 (29.6%) | 58.0 |
| College or Associate's Degree | 2,678 (38.1%) | 59.0 |
| Bachelor's Degree | 1,082 (15.4%) | 63.0 |
| Graduate Degree | 416 (5.9%) | 67.0 |
| Total | 7,023 (100.0%) | 53.0 |
Fertility by Education by Marriage Status in Stanislaus County
33.8% of women with births in Stanislaus County are unmarried. Women with the educational attainment of graduate degree are most likely to be married with 92.1% of them married at childbirth, while women with the educational attainment of high school diploma are least likely to be married with 43.3% of them unmarried at childbirth.
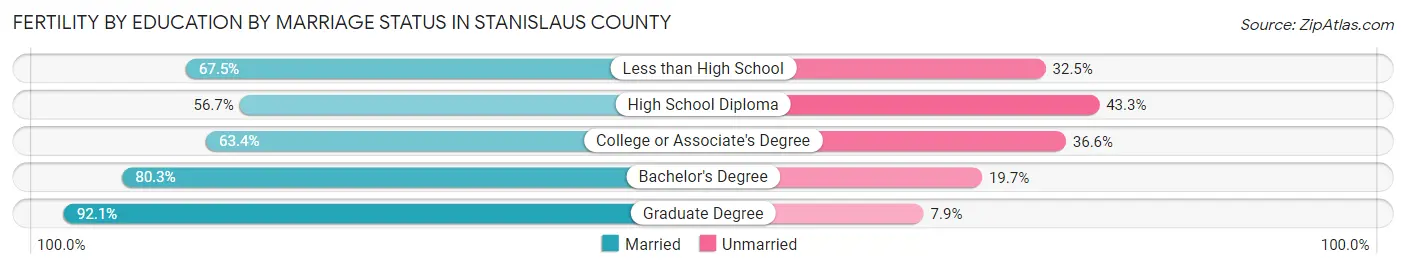
| Educational Attainment | Married | Unmarried |
| Less than High School | 519 (67.5%) | 250 (32.5%) |
| High School Diploma | 1,178 (56.7%) | 900 (43.3%) |
| College or Associate's Degree | 1,698 (63.4%) | 980 (36.6%) |
| Bachelor's Degree | 869 (80.3%) | 213 (19.7%) |
| Graduate Degree | 383 (92.1%) | 33 (7.9%) |
| Total | 4,649 (66.2%) | 2,374 (33.8%) |
Employment Characteristics in Stanislaus County
Employment by Class of Employer in Stanislaus County
Among the 229,451 employed individuals in Stanislaus County, private company employees (159,129 | 69.4%), local government employees (23,242 | 10.1%), and self-employed (not incorporated) (14,207 | 6.2%) make up the most common classes of employment.
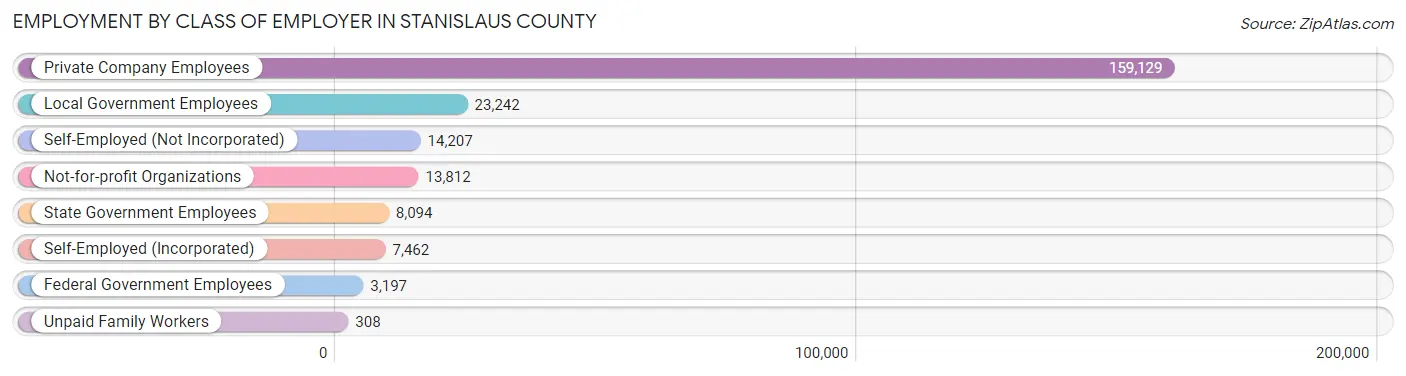
| Employer Class | # Employees | % Employees |
| Private Company Employees | 159,129 | 69.4% |
| Self-Employed (Incorporated) | 7,462 | 3.3% |
| Self-Employed (Not Incorporated) | 14,207 | 6.2% |
| Not-for-profit Organizations | 13,812 | 6.0% |
| Local Government Employees | 23,242 | 10.1% |
| State Government Employees | 8,094 | 3.5% |
| Federal Government Employees | 3,197 | 1.4% |
| Unpaid Family Workers | 308 | 0.1% |
| Total | 229,451 | 100.0% |
Employment Status by Age in Stanislaus County
According to the labor force statistics for Stanislaus County, out of the total population over 16 years of age (420,900), 61.4% or 258,433 individuals are in the labor force, with 8.2% or 21,192 of them unemployed. The age group with the highest labor force participation rate is 25 to 29 years, with 80.9% or 31,811 individuals in the labor force. Within the labor force, the 16 to 19 years age range has the highest percentage of unemployed individuals, with 15.8% or 1,790 of them being unemployed.
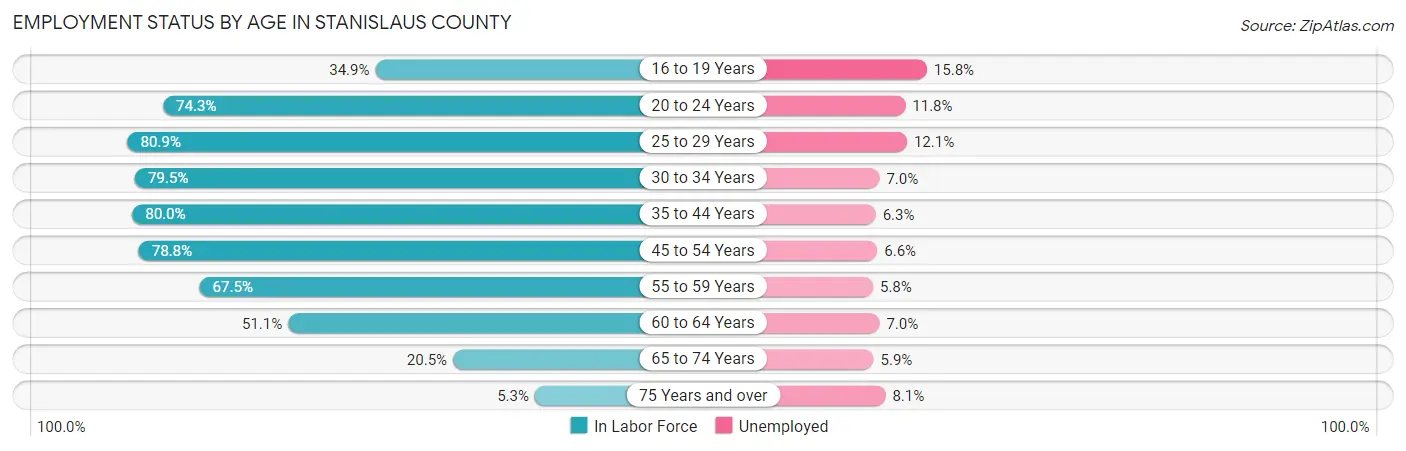
| Age Bracket | In Labor Force | Unemployed |
| 16 to 19 Years | 11,326 (34.9%) | 1,790 (15.8%) |
| 20 to 24 Years | 28,058 (74.3%) | 3,311 (11.8%) |
| 25 to 29 Years | 31,811 (80.9%) | 3,849 (12.1%) |
| 30 to 34 Years | 31,364 (79.5%) | 2,195 (7.0%) |
| 35 to 44 Years | 57,784 (80.0%) | 3,640 (6.3%) |
| 45 to 54 Years | 50,746 (78.8%) | 3,349 (6.6%) |
| 55 to 59 Years | 21,701 (67.5%) | 1,259 (5.8%) |
| 60 to 64 Years | 15,104 (51.1%) | 1,057 (7.0%) |
| 65 to 74 Years | 8,949 (20.5%) | 528 (5.9%) |
| 75 Years and over | 1,586 (5.3%) | 128 (8.1%) |
| Total | 258,433 (61.4%) | 21,192 (8.2%) |
Employment Status by Educational Attainment in Stanislaus County
According to labor force statistics for Stanislaus County, 75.3% of individuals (208,664) out of the total population between 25 and 64 years of age (277,110) are in the labor force, with 7.4% or 15,441 of them being unemployed. The group with the highest labor force participation rate are those with the educational attainment of bachelor's degree or higher, with 86.5% or 43,821 individuals in the labor force. Within the labor force, individuals with less than high school education have the highest percentage of unemployment, with 10.4% or 3,298 of them being unemployed.
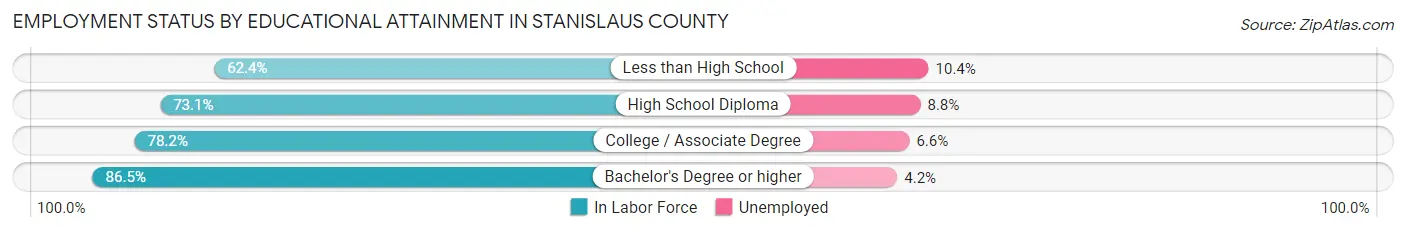
| Educational Attainment | In Labor Force | Unemployed |
| Less than High School | 31,715 (62.4%) | 5,286 (10.4%) |
| High School Diploma | 62,598 (73.1%) | 7,536 (8.8%) |
| College / Associate Degree | 70,373 (78.2%) | 5,939 (6.6%) |
| Bachelor's Degree or higher | 43,821 (86.5%) | 2,128 (4.2%) |
| Total | 208,664 (75.3%) | 20,506 (7.4%) |
Employment Occupations by Sex in Stanislaus County
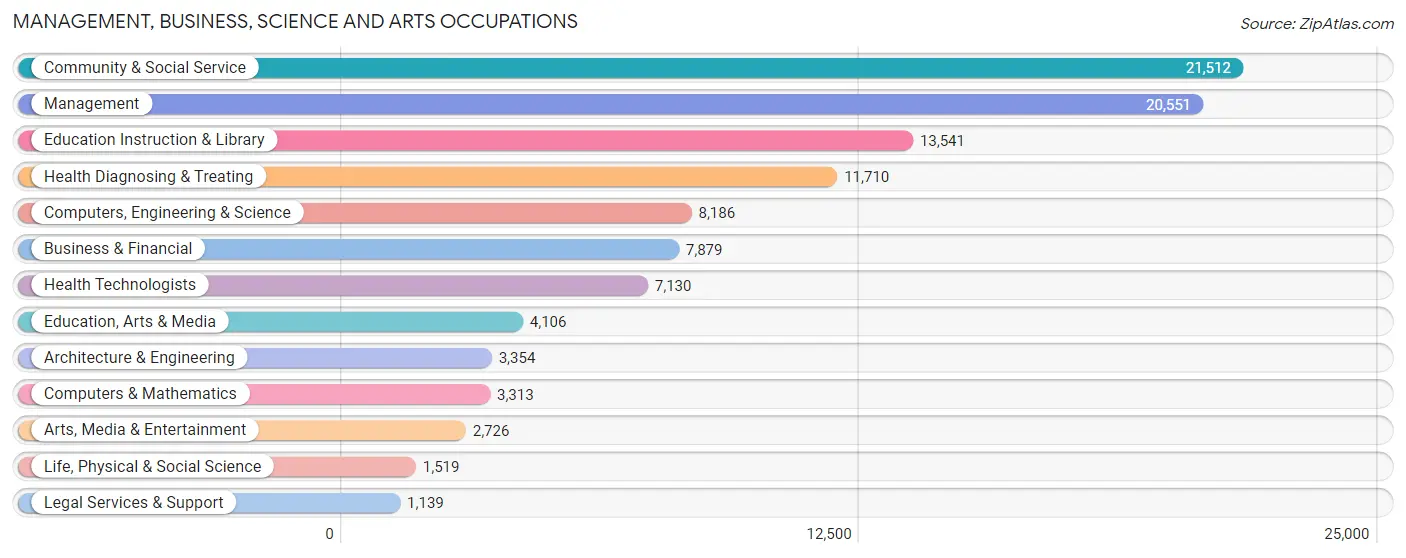
Management, Business, Science and Arts Occupations
The most common Management, Business, Science and Arts occupations in Stanislaus County are Community & Social Service (21,512 | 9.1%), Management (20,551 | 8.7%), Education Instruction & Library (13,541 | 5.7%), Health Diagnosing & Treating (11,710 | 4.9%), and Computers, Engineering & Science (8,186 | 3.5%).
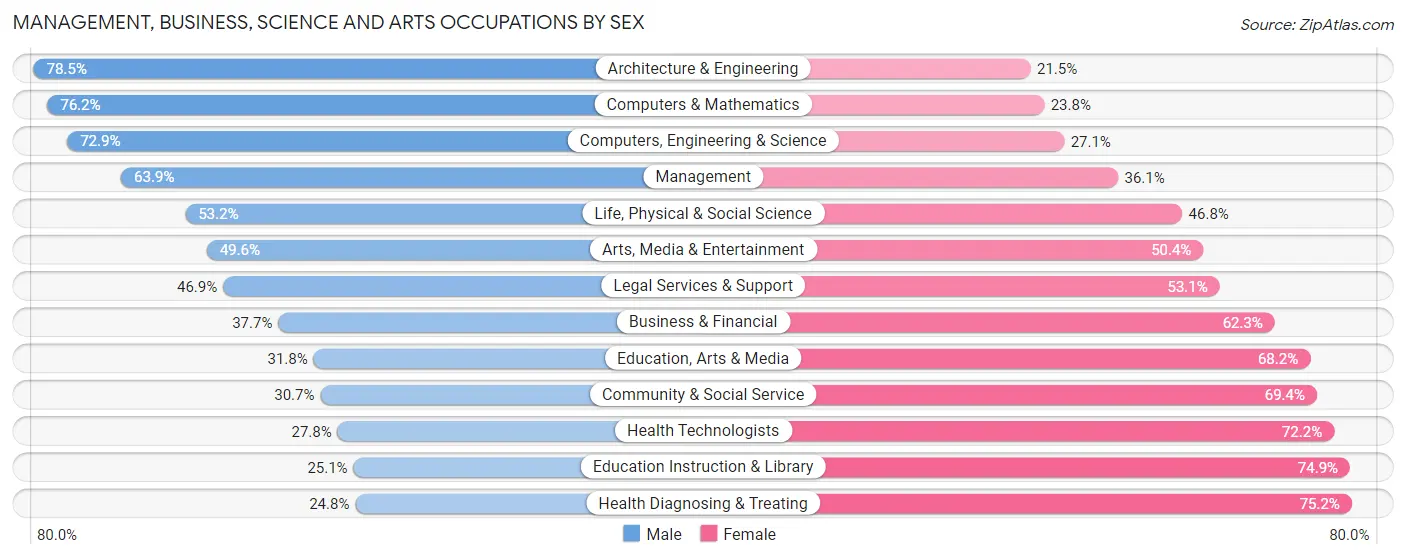
Management, Business, Science and Arts Occupations by Sex
Within the Management, Business, Science and Arts occupations in Stanislaus County, the most male-oriented occupations are Architecture & Engineering (78.5%), Computers & Mathematics (76.2%), and Computers, Engineering & Science (72.9%), while the most female-oriented occupations are Health Diagnosing & Treating (75.2%), Education Instruction & Library (74.9%), and Health Technologists (72.2%).
| Occupation | Male | Female |
| Management | 13,130 (63.9%) | 7,421 (36.1%) |
| Business & Financial | 2,968 (37.7%) | 4,911 (62.3%) |
| Computers, Engineering & Science | 5,966 (72.9%) | 2,220 (27.1%) |
| Computers & Mathematics | 2,525 (76.2%) | 788 (23.8%) |
| Architecture & Engineering | 2,633 (78.5%) | 721 (21.5%) |
| Life, Physical & Social Science | 808 (53.2%) | 711 (46.8%) |
| Community & Social Service | 6,593 (30.6%) | 14,919 (69.4%) |
| Education, Arts & Media | 1,305 (31.8%) | 2,801 (68.2%) |
| Legal Services & Support | 534 (46.9%) | 605 (53.1%) |
| Education Instruction & Library | 3,402 (25.1%) | 10,139 (74.9%) |
| Arts, Media & Entertainment | 1,352 (49.6%) | 1,374 (50.4%) |
| Health Diagnosing & Treating | 2,907 (24.8%) | 8,803 (75.2%) |
| Health Technologists | 1,981 (27.8%) | 5,149 (72.2%) |
| Total (Category) | 31,564 (45.2%) | 38,274 (54.8%) |
| Total (Overall) | 133,046 (56.1%) | 104,064 (43.9%) |
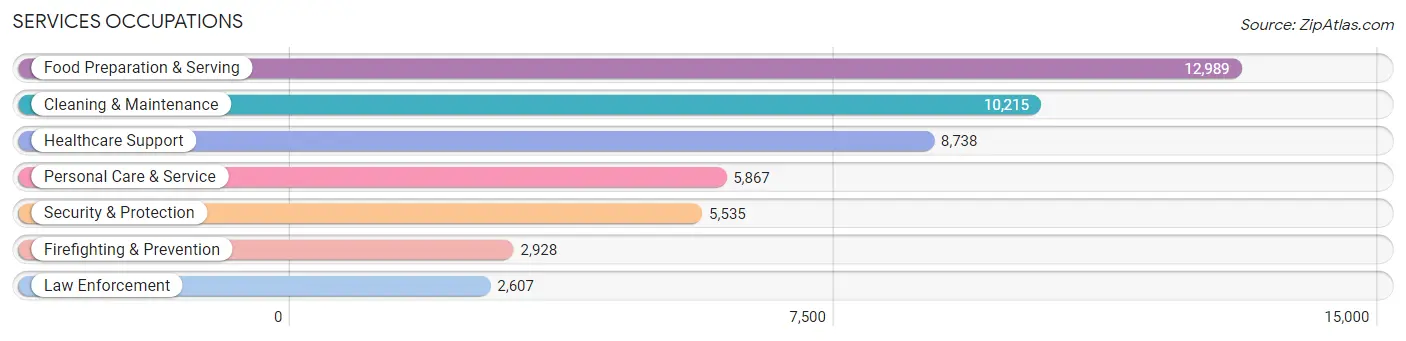
Services Occupations
The most common Services occupations in Stanislaus County are Food Preparation & Serving (12,989 | 5.5%), Cleaning & Maintenance (10,215 | 4.3%), Healthcare Support (8,738 | 3.7%), Personal Care & Service (5,867 | 2.5%), and Security & Protection (5,535 | 2.3%).
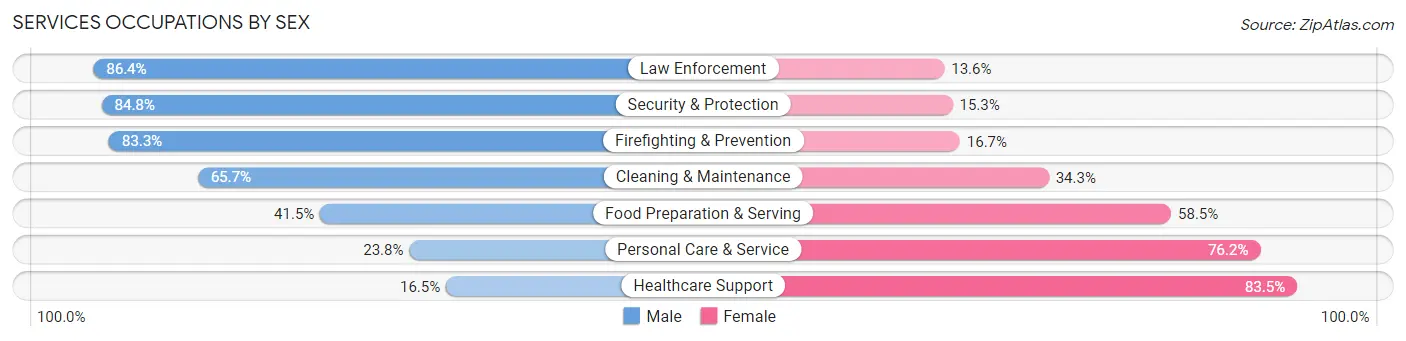
Services Occupations by Sex
Within the Services occupations in Stanislaus County, the most male-oriented occupations are Law Enforcement (86.4%), Security & Protection (84.8%), and Firefighting & Prevention (83.3%), while the most female-oriented occupations are Healthcare Support (83.5%), Personal Care & Service (76.2%), and Food Preparation & Serving (58.5%).
| Occupation | Male | Female |
| Healthcare Support | 1,445 (16.5%) | 7,293 (83.5%) |
| Security & Protection | 4,691 (84.8%) | 844 (15.2%) |
| Firefighting & Prevention | 2,439 (83.3%) | 489 (16.7%) |
| Law Enforcement | 2,252 (86.4%) | 355 (13.6%) |
| Food Preparation & Serving | 5,386 (41.5%) | 7,603 (58.5%) |
| Cleaning & Maintenance | 6,712 (65.7%) | 3,503 (34.3%) |
| Personal Care & Service | 1,398 (23.8%) | 4,469 (76.2%) |
| Total (Category) | 19,632 (45.3%) | 23,712 (54.7%) |
| Total (Overall) | 133,046 (56.1%) | 104,064 (43.9%) |
Sales and Office Occupations
The most common Sales and Office occupations in Stanislaus County are Office & Administration (24,721 | 10.4%), and Sales & Related (21,177 | 8.9%).
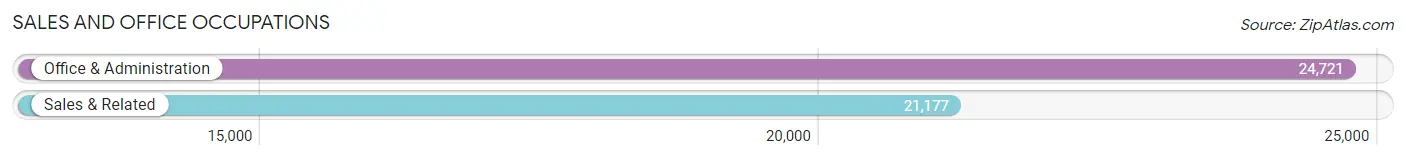
Sales and Office Occupations by Sex
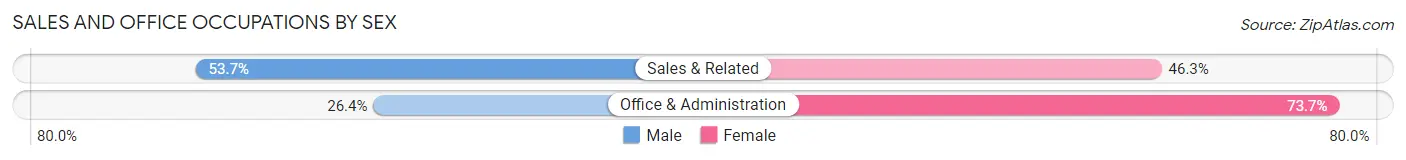
| Occupation | Male | Female |
| Sales & Related | 11,367 (53.7%) | 9,810 (46.3%) |
| Office & Administration | 6,513 (26.4%) | 18,208 (73.7%) |
| Total (Category) | 17,880 (39.0%) | 28,018 (61.0%) |
| Total (Overall) | 133,046 (56.1%) | 104,064 (43.9%) |
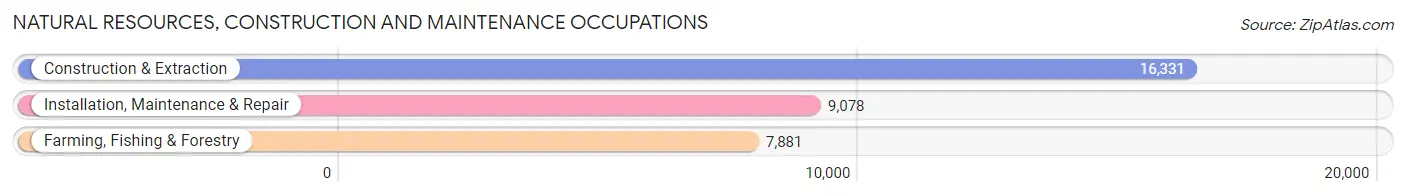
Natural Resources, Construction and Maintenance Occupations
The most common Natural Resources, Construction and Maintenance occupations in Stanislaus County are Construction & Extraction (16,331 | 6.9%), Installation, Maintenance & Repair (9,078 | 3.8%), and Farming, Fishing & Forestry (7,881 | 3.3%).
Natural Resources, Construction and Maintenance Occupations by Sex
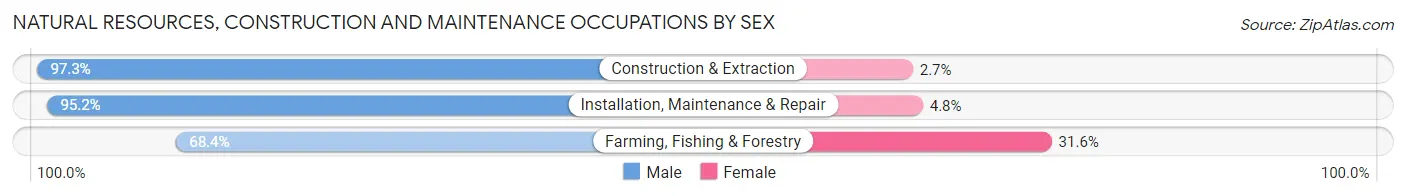
| Occupation | Male | Female |
| Farming, Fishing & Forestry | 5,393 (68.4%) | 2,488 (31.6%) |
| Construction & Extraction | 15,894 (97.3%) | 437 (2.7%) |
| Installation, Maintenance & Repair | 8,646 (95.2%) | 432 (4.8%) |
| Total (Category) | 29,933 (89.9%) | 3,357 (10.1%) |
| Total (Overall) | 133,046 (56.1%) | 104,064 (43.9%) |
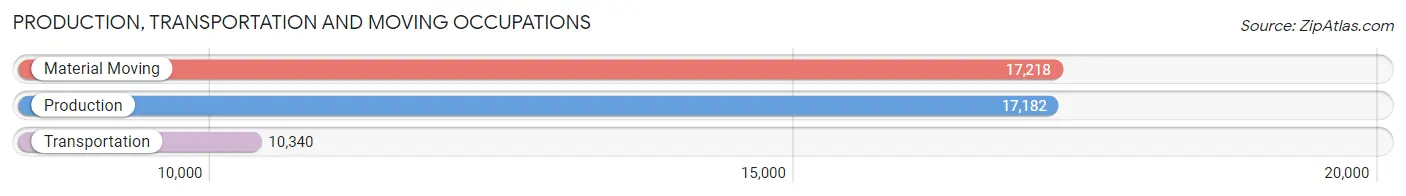
Production, Transportation and Moving Occupations
The most common Production, Transportation and Moving occupations in Stanislaus County are Material Moving (17,218 | 7.3%), Production (17,182 | 7.2%), and Transportation (10,340 | 4.4%).
Production, Transportation and Moving Occupations by Sex
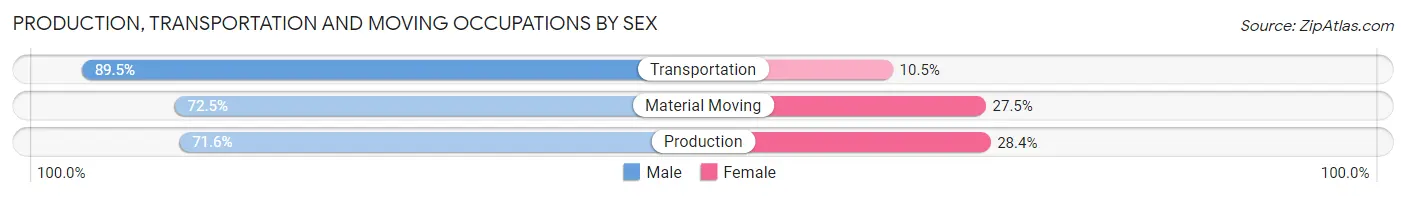
| Occupation | Male | Female |
| Production | 12,305 (71.6%) | 4,877 (28.4%) |
| Transportation | 9,256 (89.5%) | 1,084 (10.5%) |
| Material Moving | 12,476 (72.5%) | 4,742 (27.5%) |
| Total (Category) | 34,037 (76.1%) | 10,703 (23.9%) |
| Total (Overall) | 133,046 (56.1%) | 104,064 (43.9%) |
Employment Industries by Sex in Stanislaus County
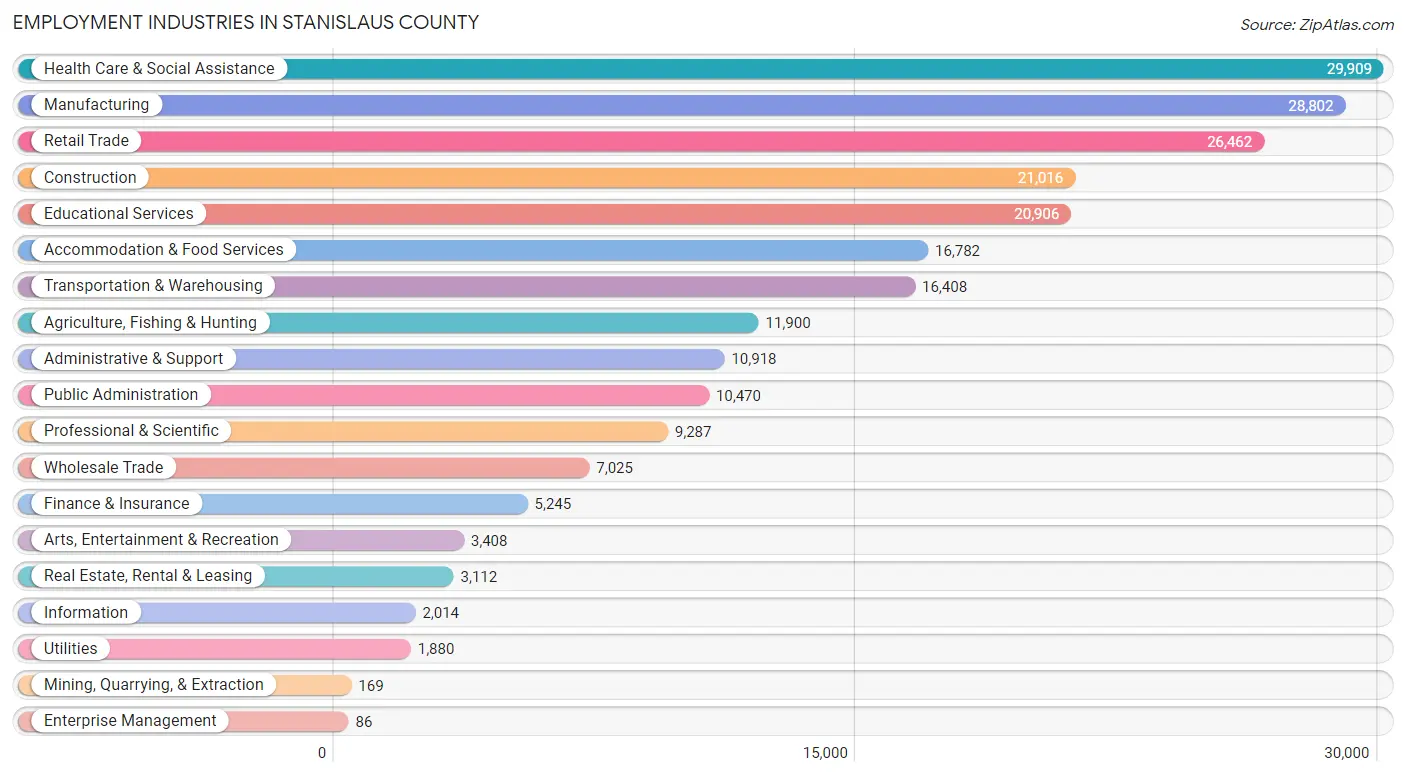
Employment Industries in Stanislaus County
The major employment industries in Stanislaus County include Health Care & Social Assistance (29,909 | 12.6%), Manufacturing (28,802 | 12.1%), Retail Trade (26,462 | 11.2%), Construction (21,016 | 8.9%), and Educational Services (20,906 | 8.8%).
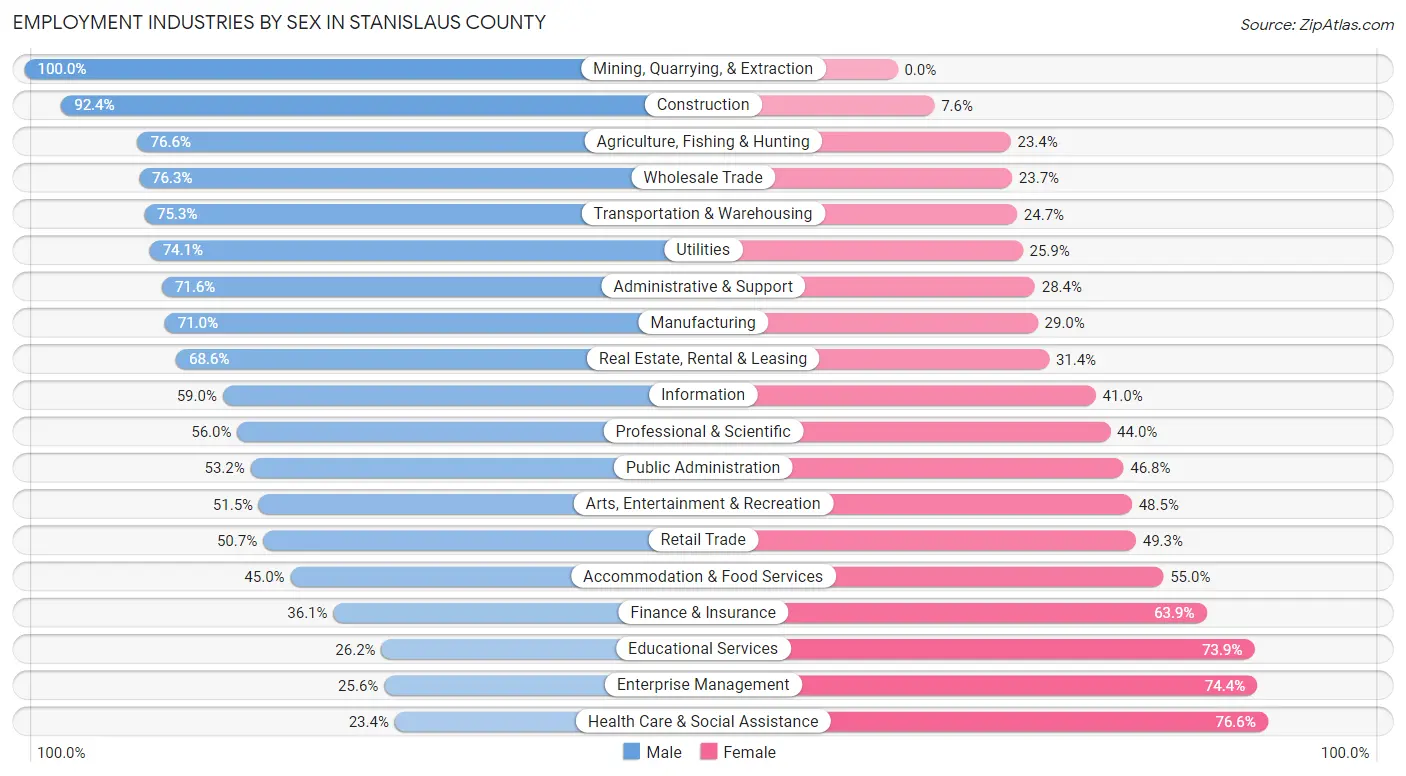
Employment Industries by Sex in Stanislaus County
The Stanislaus County industries that see more men than women are Mining, Quarrying, & Extraction (100.0%), Construction (92.4%), and Agriculture, Fishing & Hunting (76.6%), whereas the industries that tend to have a higher number of women are Health Care & Social Assistance (76.6%), Enterprise Management (74.4%), and Educational Services (73.9%).
| Industry | Male | Female |
| Agriculture, Fishing & Hunting | 9,114 (76.6%) | 2,786 (23.4%) |
| Mining, Quarrying, & Extraction | 169 (100.0%) | 0 (0.0%) |
| Construction | 19,416 (92.4%) | 1,600 (7.6%) |
| Manufacturing | 20,443 (71.0%) | 8,359 (29.0%) |
| Wholesale Trade | 5,360 (76.3%) | 1,665 (23.7%) |
| Retail Trade | 13,406 (50.7%) | 13,056 (49.3%) |
| Transportation & Warehousing | 12,350 (75.3%) | 4,058 (24.7%) |
| Utilities | 1,393 (74.1%) | 487 (25.9%) |
| Information | 1,188 (59.0%) | 826 (41.0%) |
| Finance & Insurance | 1,893 (36.1%) | 3,352 (63.9%) |
| Real Estate, Rental & Leasing | 2,136 (68.6%) | 976 (31.4%) |
| Professional & Scientific | 5,198 (56.0%) | 4,089 (44.0%) |
| Enterprise Management | 22 (25.6%) | 64 (74.4%) |
| Administrative & Support | 7,813 (71.6%) | 3,105 (28.4%) |
| Educational Services | 5,467 (26.2%) | 15,439 (73.9%) |
| Health Care & Social Assistance | 6,995 (23.4%) | 22,914 (76.6%) |
| Arts, Entertainment & Recreation | 1,755 (51.5%) | 1,653 (48.5%) |
| Accommodation & Food Services | 7,549 (45.0%) | 9,233 (55.0%) |
| Public Administration | 5,574 (53.2%) | 4,896 (46.8%) |
| Total | 133,046 (56.1%) | 104,064 (43.9%) |
Education in Stanislaus County
School Enrollment in Stanislaus County
The most common levels of schooling among the 152,746 students in Stanislaus County are high school (35,379 | 23.2%), middle school (34,648 | 22.7%), and college / undergraduate (32,556 | 21.3%).
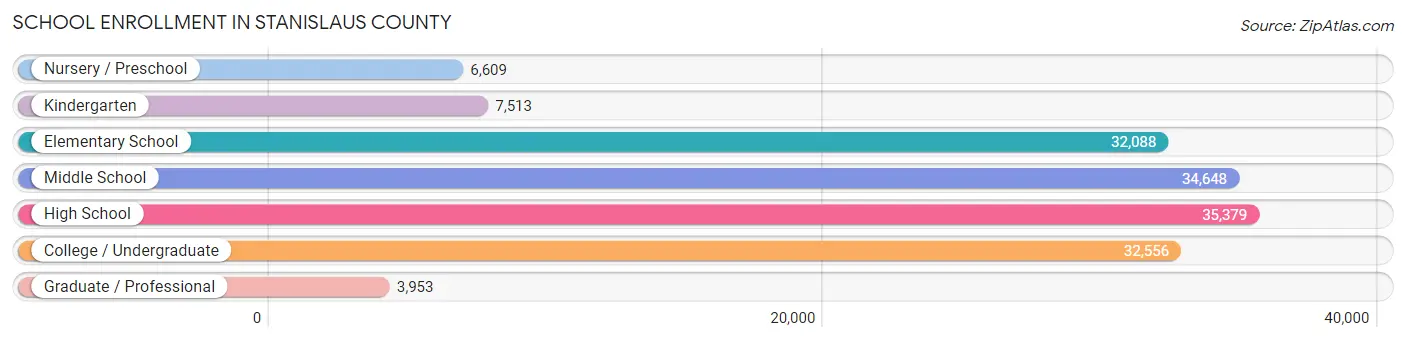
| School Level | # Students | % Students |
| Nursery / Preschool | 6,609 | 4.3% |
| Kindergarten | 7,513 | 4.9% |
| Elementary School | 32,088 | 21.0% |
| Middle School | 34,648 | 22.7% |
| High School | 35,379 | 23.2% |
| College / Undergraduate | 32,556 | 21.3% |
| Graduate / Professional | 3,953 | 2.6% |
| Total | 152,746 | 100.0% |
School Enrollment by Age by Funding Source in Stanislaus County
Out of a total of 152,746 students who are enrolled in schools in Stanislaus County, 13,747 (9.0%) attend a private institution, while the remaining 138,999 (91.0%) are enrolled in public schools. The age group of 3 to 4 year olds has the highest likelihood of being enrolled in private schools, with 1,434 (25.2% in the age bracket) enrolled. Conversely, the age group of 15 to 17 year olds has the lowest likelihood of being enrolled in a private school, with 24,259 (95.5% in the age bracket) attending a public institution.
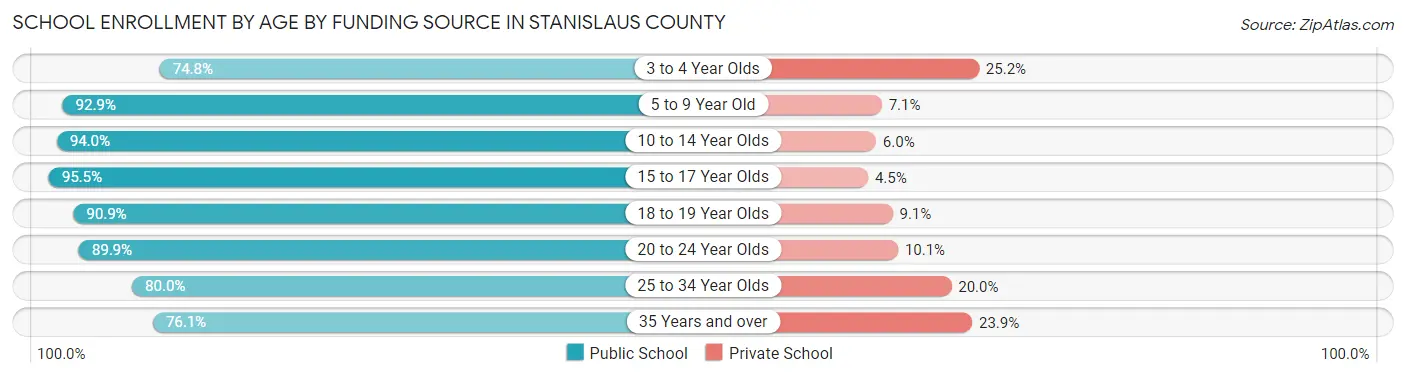
| Age Bracket | Public School | Private School |
| 3 to 4 Year Olds | 4,259 (74.8%) | 1,434 (25.2%) |
| 5 to 9 Year Old | 34,291 (92.9%) | 2,615 (7.1%) |
| 10 to 14 Year Olds | 41,563 (94.0%) | 2,651 (6.0%) |
| 15 to 17 Year Olds | 24,259 (95.5%) | 1,149 (4.5%) |
| 18 to 19 Year Olds | 9,326 (90.9%) | 934 (9.1%) |
| 20 to 24 Year Olds | 12,052 (89.9%) | 1,356 (10.1%) |
| 25 to 34 Year Olds | 8,181 (80.0%) | 2,051 (20.0%) |
| 35 Years and over | 5,041 (76.1%) | 1,584 (23.9%) |
| Total | 138,999 (91.0%) | 13,747 (9.0%) |
Educational Attainment by Field of Study in Stanislaus County
Business (12,141 | 17.9%), science & technology (6,454 | 9.5%), education (6,439 | 9.5%), arts & humanities (5,951 | 8.8%), and social sciences (5,771 | 8.5%) are the most common fields of study among 67,633 individuals in Stanislaus County who have obtained a bachelor's degree or higher.
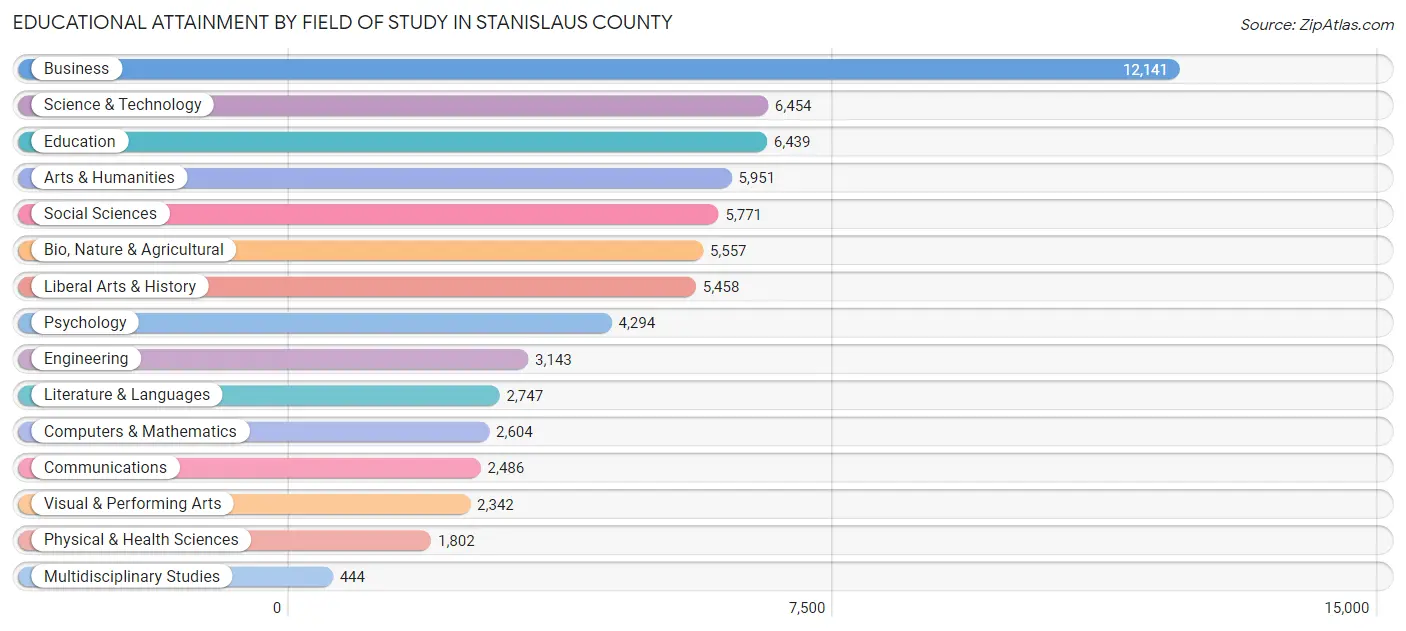
| Field of Study | # Graduates | % Graduates |
| Computers & Mathematics | 2,604 | 3.8% |
| Bio, Nature & Agricultural | 5,557 | 8.2% |
| Physical & Health Sciences | 1,802 | 2.7% |
| Psychology | 4,294 | 6.4% |
| Social Sciences | 5,771 | 8.5% |
| Engineering | 3,143 | 4.6% |
| Multidisciplinary Studies | 444 | 0.7% |
| Science & Technology | 6,454 | 9.5% |
| Business | 12,141 | 17.9% |
| Education | 6,439 | 9.5% |
| Literature & Languages | 2,747 | 4.1% |
| Liberal Arts & History | 5,458 | 8.1% |
| Visual & Performing Arts | 2,342 | 3.5% |
| Communications | 2,486 | 3.7% |
| Arts & Humanities | 5,951 | 8.8% |
| Total | 67,633 | 100.0% |
Transportation & Commute in Stanislaus County
Vehicle Availability by Sex in Stanislaus County
The most prevalent vehicle ownership categories in Stanislaus County are males with 2 vehicles (46,906, accounting for 36.2%) and females with 2 vehicles (34,494, making up 47.2%).
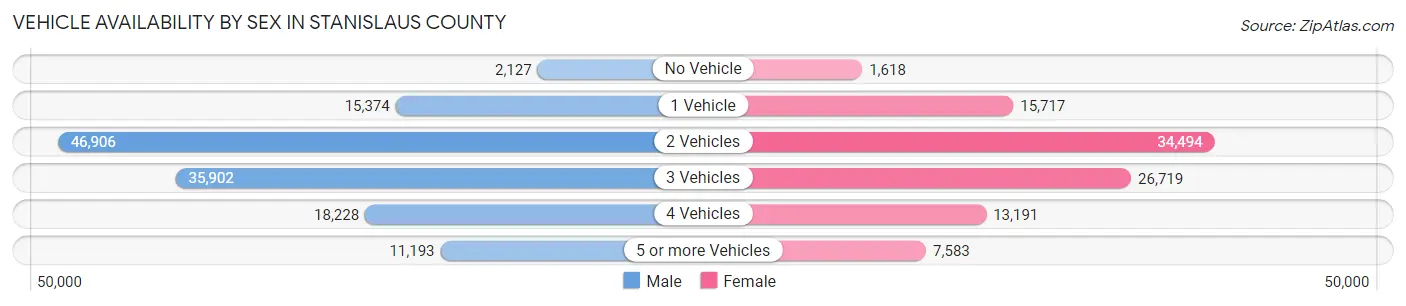
| Vehicles Available | Male | Female |
| No Vehicle | 2,127 (1.6%) | 1,618 (1.6%) |
| 1 Vehicle | 15,374 (11.8%) | 15,717 (15.8%) |
| 2 Vehicles | 46,906 (36.2%) | 34,494 (34.7%) |
| 3 Vehicles | 35,902 (27.7%) | 26,719 (26.9%) |
| 4 Vehicles | 18,228 (14.1%) | 13,191 (13.3%) |
| 5 or more Vehicles | 11,193 (8.6%) | 7,583 (7.6%) |
| Total | 129,730 (100.0%) | 99,322 (100.0%) |
Commute Time in Stanislaus County
The most frequently occuring commute durations in Stanislaus County are 15 to 19 minutes (31,594 commuters, 14.7%), 10 to 14 minutes (29,661 commuters, 13.8%), and 20 to 24 minutes (29,309 commuters, 13.7%).
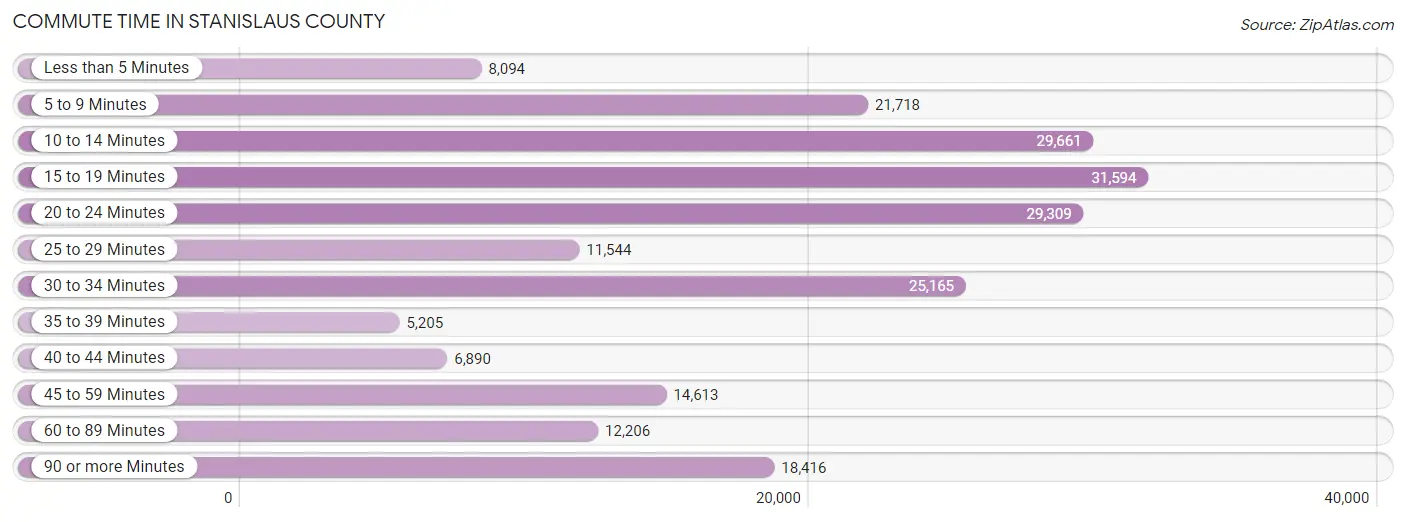
| Commute Time | # Commuters | % Commuters |
| Less than 5 Minutes | 8,094 | 3.8% |
| 5 to 9 Minutes | 21,718 | 10.1% |
| 10 to 14 Minutes | 29,661 | 13.8% |
| 15 to 19 Minutes | 31,594 | 14.7% |
| 20 to 24 Minutes | 29,309 | 13.7% |
| 25 to 29 Minutes | 11,544 | 5.4% |
| 30 to 34 Minutes | 25,165 | 11.7% |
| 35 to 39 Minutes | 5,205 | 2.4% |
| 40 to 44 Minutes | 6,890 | 3.2% |
| 45 to 59 Minutes | 14,613 | 6.8% |
| 60 to 89 Minutes | 12,206 | 5.7% |
| 90 or more Minutes | 18,416 | 8.6% |
Commute Time by Sex in Stanislaus County
The most common commute times in Stanislaus County are 15 to 19 minutes (16,877 commuters, 13.7%) for males and 10 to 14 minutes (15,325 commuters, 16.7%) for females.
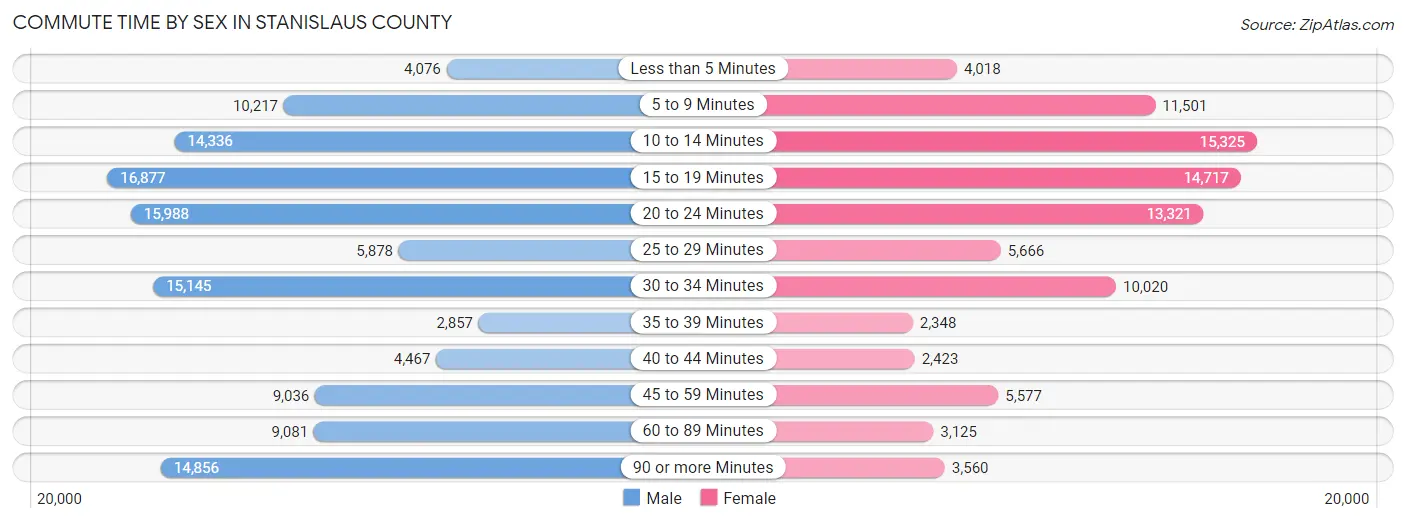
| Commute Time | Male | Female |
| Less than 5 Minutes | 4,076 (3.3%) | 4,018 (4.4%) |
| 5 to 9 Minutes | 10,217 (8.3%) | 11,501 (12.6%) |
| 10 to 14 Minutes | 14,336 (11.7%) | 15,325 (16.7%) |
| 15 to 19 Minutes | 16,877 (13.7%) | 14,717 (16.1%) |
| 20 to 24 Minutes | 15,988 (13.0%) | 13,321 (14.5%) |
| 25 to 29 Minutes | 5,878 (4.8%) | 5,666 (6.2%) |
| 30 to 34 Minutes | 15,145 (12.3%) | 10,020 (10.9%) |
| 35 to 39 Minutes | 2,857 (2.3%) | 2,348 (2.6%) |
| 40 to 44 Minutes | 4,467 (3.6%) | 2,423 (2.6%) |
| 45 to 59 Minutes | 9,036 (7.4%) | 5,577 (6.1%) |
| 60 to 89 Minutes | 9,081 (7.4%) | 3,125 (3.4%) |
| 90 or more Minutes | 14,856 (12.1%) | 3,560 (3.9%) |
Time of Departure to Work by Sex in Stanislaus County
The most frequent times of departure to work in Stanislaus County are 12:00 AM to 4:59 AM (20,967, 17.1%) for males and 7:00 AM to 7:29 AM (14,494, 15.8%) for females.
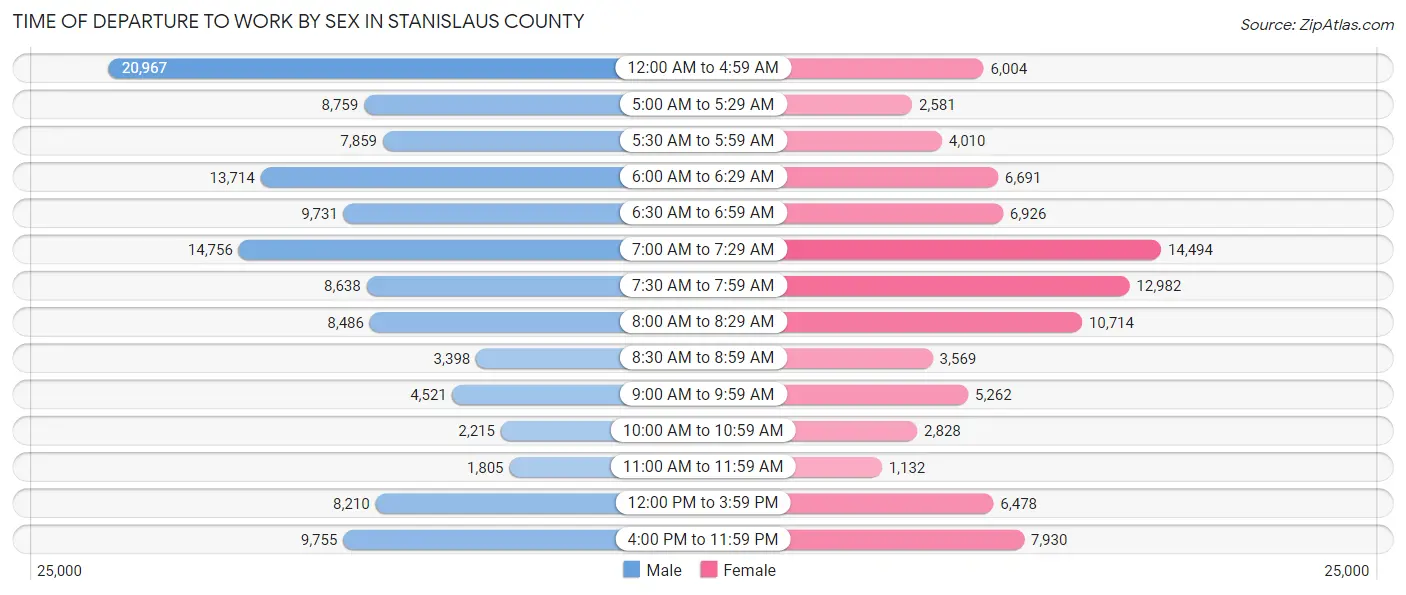
| Time of Departure | Male | Female |
| 12:00 AM to 4:59 AM | 20,967 (17.1%) | 6,004 (6.6%) |
| 5:00 AM to 5:29 AM | 8,759 (7.1%) | 2,581 (2.8%) |
| 5:30 AM to 5:59 AM | 7,859 (6.4%) | 4,010 (4.4%) |
| 6:00 AM to 6:29 AM | 13,714 (11.2%) | 6,691 (7.3%) |
| 6:30 AM to 6:59 AM | 9,731 (7.9%) | 6,926 (7.6%) |
| 7:00 AM to 7:29 AM | 14,756 (12.0%) | 14,494 (15.8%) |
| 7:30 AM to 7:59 AM | 8,638 (7.0%) | 12,982 (14.2%) |
| 8:00 AM to 8:29 AM | 8,486 (6.9%) | 10,714 (11.7%) |
| 8:30 AM to 8:59 AM | 3,398 (2.8%) | 3,569 (3.9%) |
| 9:00 AM to 9:59 AM | 4,521 (3.7%) | 5,262 (5.7%) |
| 10:00 AM to 10:59 AM | 2,215 (1.8%) | 2,828 (3.1%) |
| 11:00 AM to 11:59 AM | 1,805 (1.5%) | 1,132 (1.2%) |
| 12:00 PM to 3:59 PM | 8,210 (6.7%) | 6,478 (7.1%) |
| 4:00 PM to 11:59 PM | 9,755 (7.9%) | 7,930 (8.7%) |
| Total | 122,814 (100.0%) | 91,601 (100.0%) |
Housing Occupancy in Stanislaus County
Occupancy by Ownership in Stanislaus County
Of the total 175,747 dwellings in Stanislaus County, owner-occupied units account for 106,359 (60.5%), while renter-occupied units make up 69,388 (39.5%).
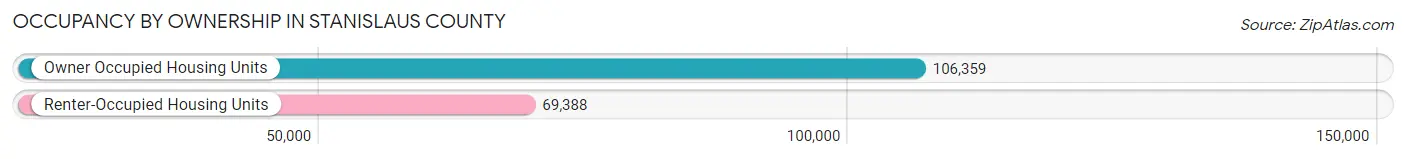
| Occupancy | # Housing Units | % Housing Units |
| Owner Occupied Housing Units | 106,359 | 60.5% |
| Renter-Occupied Housing Units | 69,388 | 39.5% |
| Total Occupied Housing Units | 175,747 | 100.0% |
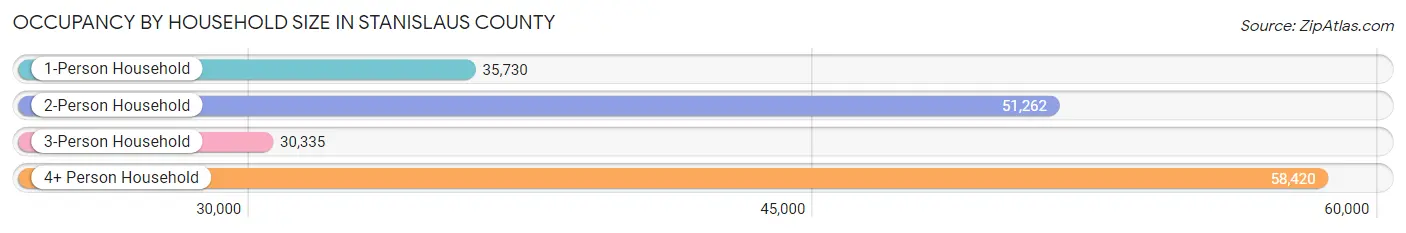
Occupancy by Household Size in Stanislaus County
| Household Size | # Housing Units | % Housing Units |
| 1-Person Household | 35,730 | 20.3% |
| 2-Person Household | 51,262 | 29.2% |
| 3-Person Household | 30,335 | 17.3% |
| 4+ Person Household | 58,420 | 33.2% |
| Total Housing Units | 175,747 | 100.0% |
Occupancy by Ownership by Household Size in Stanislaus County
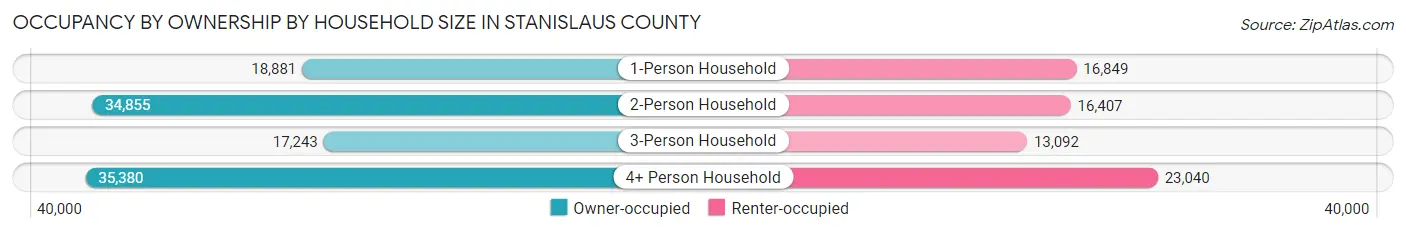
| Household Size | Owner-occupied | Renter-occupied |
| 1-Person Household | 18,881 (52.8%) | 16,849 (47.2%) |
| 2-Person Household | 34,855 (68.0%) | 16,407 (32.0%) |
| 3-Person Household | 17,243 (56.8%) | 13,092 (43.2%) |
| 4+ Person Household | 35,380 (60.6%) | 23,040 (39.4%) |
| Total Housing Units | 106,359 (60.5%) | 69,388 (39.5%) |
Occupancy by Educational Attainment in Stanislaus County
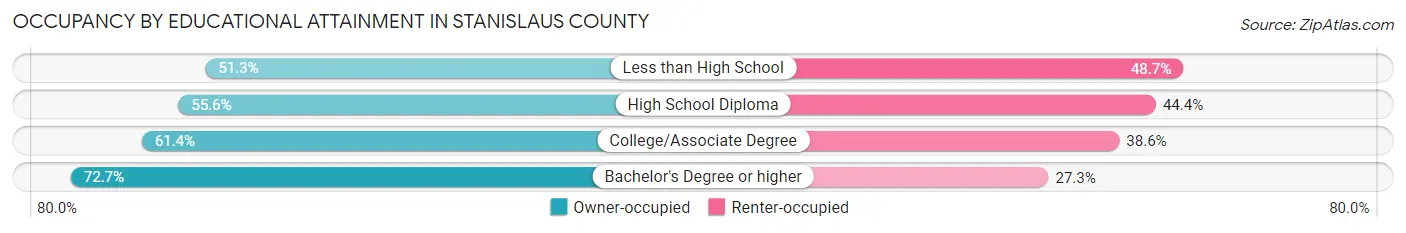
| Household Size | Owner-occupied | Renter-occupied |
| Less than High School | 15,181 (51.3%) | 14,386 (48.7%) |
| High School Diploma | 26,450 (55.6%) | 21,103 (44.4%) |
| College/Associate Degree | 37,903 (61.4%) | 23,805 (38.6%) |
| Bachelor's Degree or higher | 26,825 (72.7%) | 10,094 (27.3%) |
Occupancy by Age of Householder in Stanislaus County
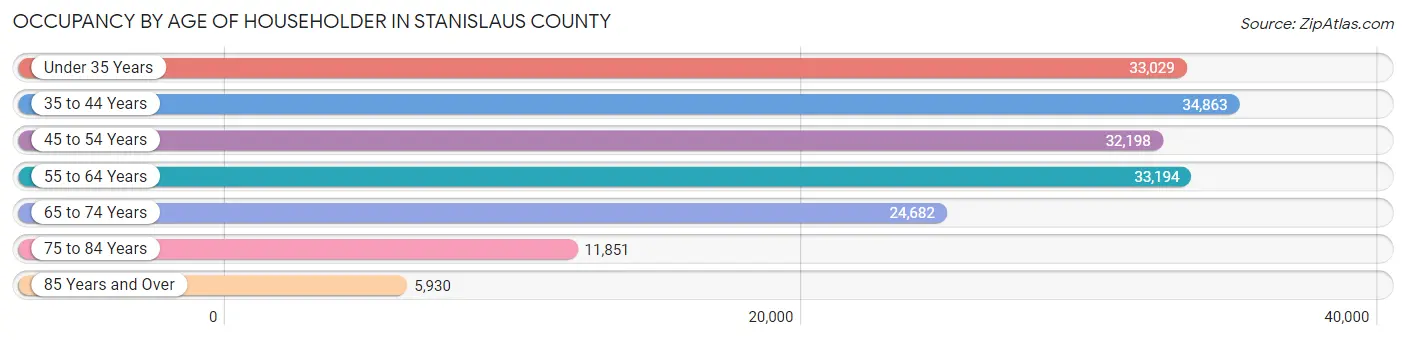
| Age Bracket | # Households | % Households |
| Under 35 Years | 33,029 | 18.8% |
| 35 to 44 Years | 34,863 | 19.8% |
| 45 to 54 Years | 32,198 | 18.3% |
| 55 to 64 Years | 33,194 | 18.9% |
| 65 to 74 Years | 24,682 | 14.0% |
| 75 to 84 Years | 11,851 | 6.7% |
| 85 Years and Over | 5,930 | 3.4% |
| Total | 175,747 | 100.0% |
Housing Finances in Stanislaus County
Median Income by Occupancy in Stanislaus County
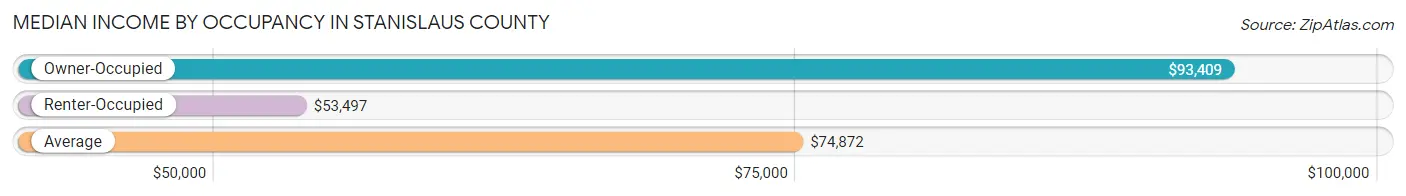
| Occupancy Type | # Households | Median Income |
| Owner-Occupied | 106,359 (60.5%) | $93,409 |
| Renter-Occupied | 69,388 (39.5%) | $53,497 |
| Average | 175,747 (100.0%) | $74,872 |
Occupancy by Householder Income Bracket in Stanislaus County
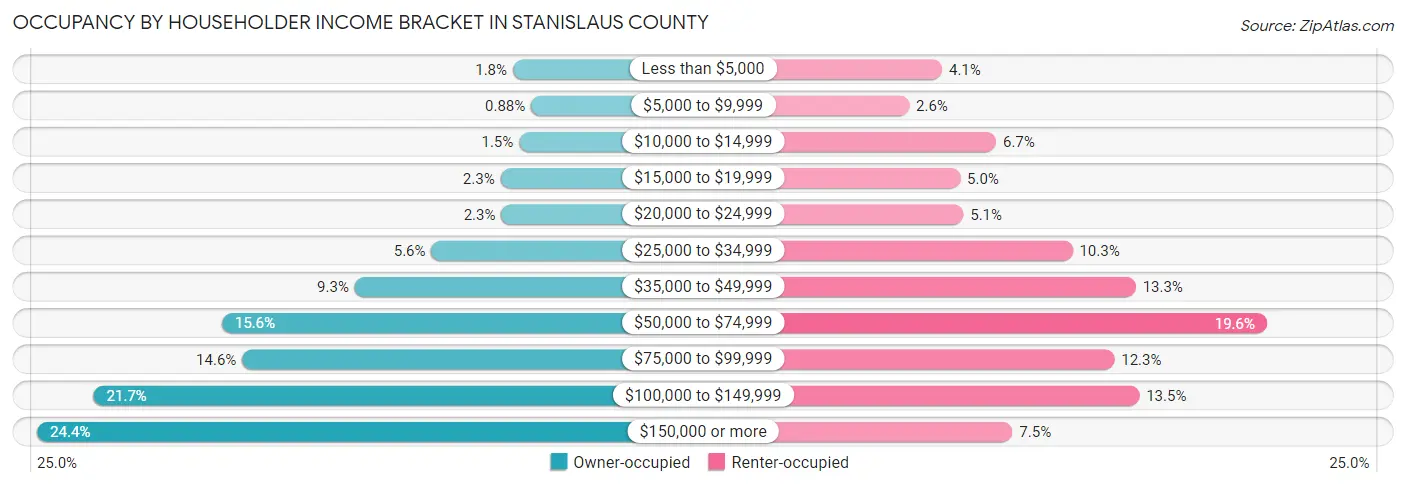
| Income Bracket | Owner-occupied | Renter-occupied |
| Less than $5,000 | 1,866 (1.8%) | 2,858 (4.1%) |
| $5,000 to $9,999 | 933 (0.9%) | 1,770 (2.5%) |
| $10,000 to $14,999 | 1,540 (1.5%) | 4,643 (6.7%) |
| $15,000 to $19,999 | 2,487 (2.3%) | 3,454 (5.0%) |
| $20,000 to $24,999 | 2,449 (2.3%) | 3,560 (5.1%) |
| $25,000 to $34,999 | 5,987 (5.6%) | 7,165 (10.3%) |
| $35,000 to $49,999 | 9,867 (9.3%) | 9,254 (13.3%) |
| $50,000 to $74,999 | 16,603 (15.6%) | 13,584 (19.6%) |
| $75,000 to $99,999 | 15,569 (14.6%) | 8,548 (12.3%) |
| $100,000 to $149,999 | 23,102 (21.7%) | 9,371 (13.5%) |
| $150,000 or more | 25,956 (24.4%) | 5,181 (7.5%) |
| Total | 106,359 (100.0%) | 69,388 (100.0%) |
Monthly Housing Cost Tiers in Stanislaus County
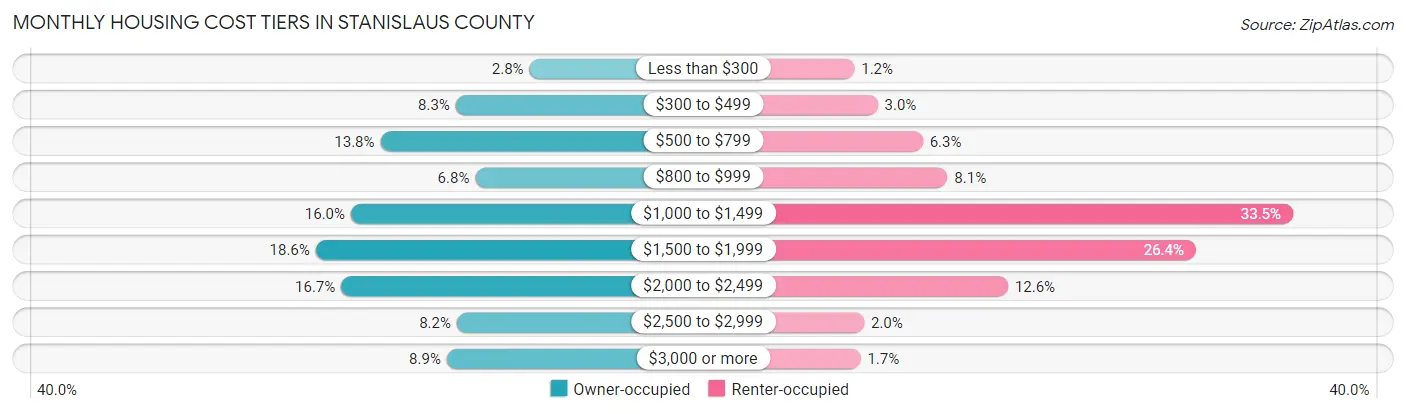
| Monthly Cost | Owner-occupied | Renter-occupied |
| Less than $300 | 2,996 (2.8%) | 860 (1.2%) |
| $300 to $499 | 8,775 (8.3%) | 2,055 (3.0%) |
| $500 to $799 | 14,680 (13.8%) | 4,359 (6.3%) |
| $800 to $999 | 7,239 (6.8%) | 5,618 (8.1%) |
| $1,000 to $1,499 | 16,989 (16.0%) | 23,271 (33.5%) |
| $1,500 to $1,999 | 19,755 (18.6%) | 18,313 (26.4%) |
| $2,000 to $2,499 | 17,754 (16.7%) | 8,715 (12.6%) |
| $2,500 to $2,999 | 8,694 (8.2%) | 1,363 (2.0%) |
| $3,000 or more | 9,477 (8.9%) | 1,180 (1.7%) |
| Total | 106,359 (100.0%) | 69,388 (100.0%) |
Physical Housing Characteristics in Stanislaus County
Housing Structures in Stanislaus County
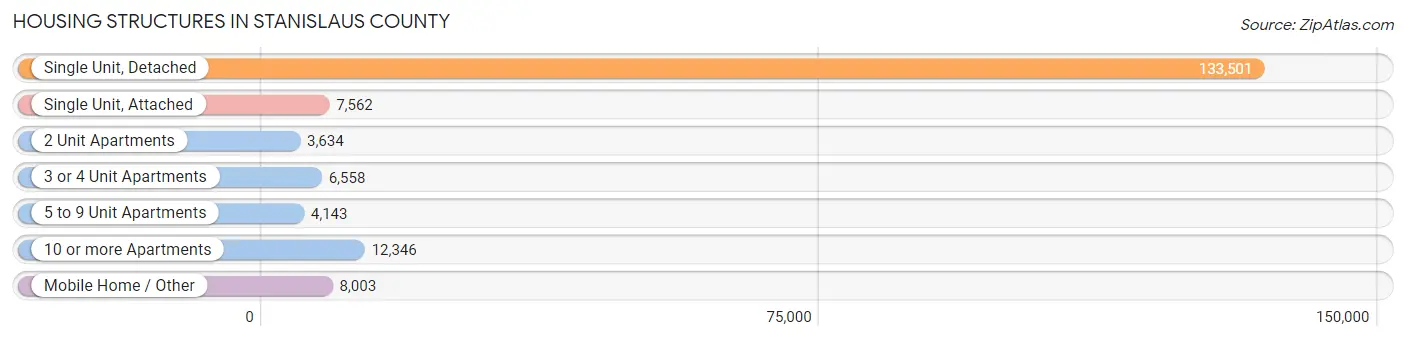
| Structure Type | # Housing Units | % Housing Units |
| Single Unit, Detached | 133,501 | 76.0% |
| Single Unit, Attached | 7,562 | 4.3% |
| 2 Unit Apartments | 3,634 | 2.1% |
| 3 or 4 Unit Apartments | 6,558 | 3.7% |
| 5 to 9 Unit Apartments | 4,143 | 2.4% |
| 10 or more Apartments | 12,346 | 7.0% |
| Mobile Home / Other | 8,003 | 4.5% |
| Total | 175,747 | 100.0% |
Housing Structures by Occupancy in Stanislaus County
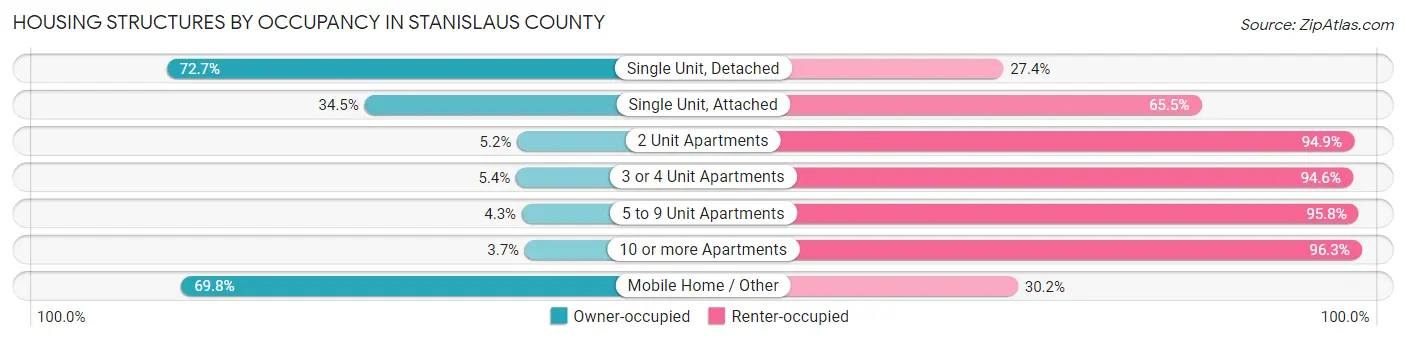
| Structure Type | Owner-occupied | Renter-occupied |
| Single Unit, Detached | 96,991 (72.7%) | 36,510 (27.4%) |
| Single Unit, Attached | 2,611 (34.5%) | 4,951 (65.5%) |
| 2 Unit Apartments | 187 (5.1%) | 3,447 (94.9%) |
| 3 or 4 Unit Apartments | 352 (5.4%) | 6,206 (94.6%) |
| 5 to 9 Unit Apartments | 176 (4.3%) | 3,967 (95.8%) |
| 10 or more Apartments | 453 (3.7%) | 11,893 (96.3%) |
| Mobile Home / Other | 5,589 (69.8%) | 2,414 (30.2%) |
| Total | 106,359 (60.5%) | 69,388 (39.5%) |
Housing Structures by Number of Rooms in Stanislaus County
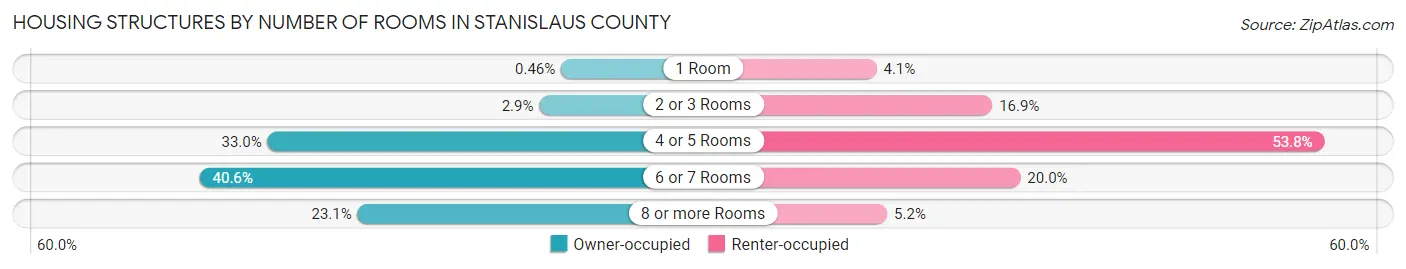
| Number of Rooms | Owner-occupied | Renter-occupied |
| 1 Room | 484 (0.5%) | 2,817 (4.1%) |
| 2 or 3 Rooms | 3,063 (2.9%) | 11,728 (16.9%) |
| 4 or 5 Rooms | 35,145 (33.0%) | 37,309 (53.8%) |
| 6 or 7 Rooms | 43,149 (40.6%) | 13,899 (20.0%) |
| 8 or more Rooms | 24,518 (23.1%) | 3,635 (5.2%) |
| Total | 106,359 (100.0%) | 69,388 (100.0%) |
Housing Structure by Heating Type in Stanislaus County
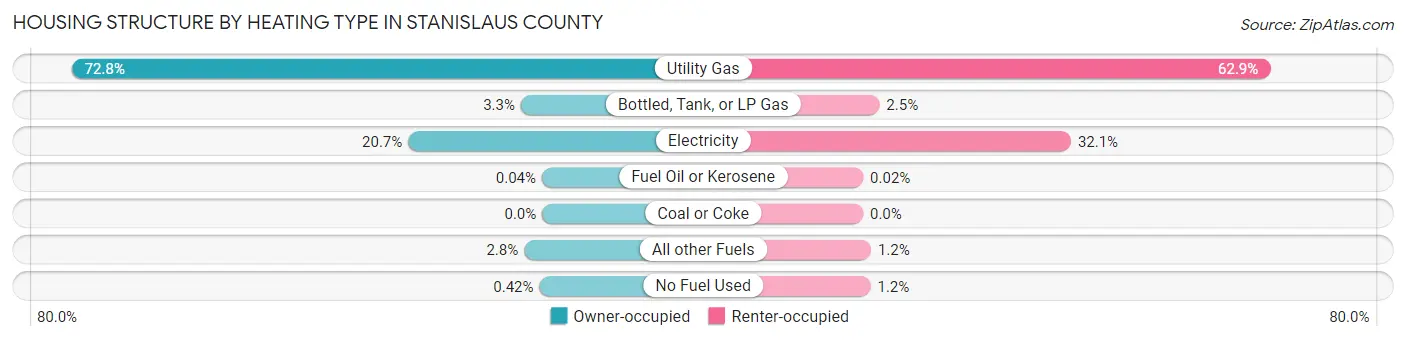
| Heating Type | Owner-occupied | Renter-occupied |
| Utility Gas | 77,380 (72.8%) | 43,662 (62.9%) |
| Bottled, Tank, or LP Gas | 3,499 (3.3%) | 1,754 (2.5%) |
| Electricity | 22,032 (20.7%) | 22,300 (32.1%) |
| Fuel Oil or Kerosene | 38 (0.0%) | 13 (0.0%) |
| Coal or Coke | 0 (0.0%) | 0 (0.0%) |
| All other Fuels | 2,965 (2.8%) | 853 (1.2%) |
| No Fuel Used | 445 (0.4%) | 806 (1.2%) |
| Total | 106,359 (100.0%) | 69,388 (100.0%) |
Household Vehicle Usage in Stanislaus County
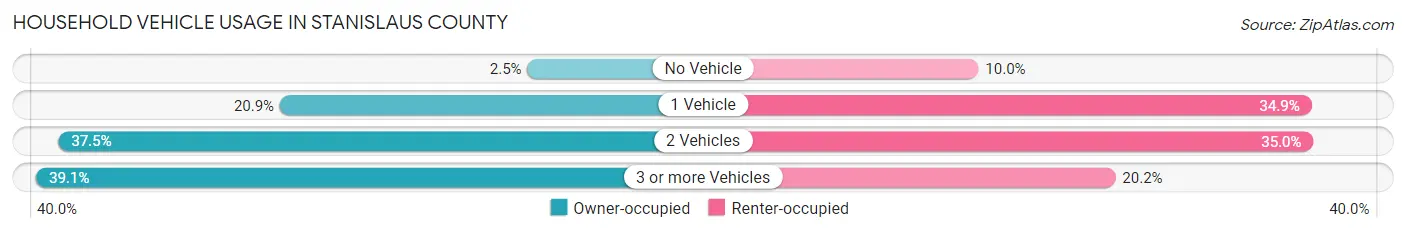
| Vehicles per Household | Owner-occupied | Renter-occupied |
| No Vehicle | 2,606 (2.5%) | 6,917 (10.0%) |
| 1 Vehicle | 22,262 (20.9%) | 24,182 (34.8%) |
| 2 Vehicles | 39,866 (37.5%) | 24,275 (35.0%) |
| 3 or more Vehicles | 41,625 (39.1%) | 14,014 (20.2%) |
| Total | 106,359 (100.0%) | 69,388 (100.0%) |
Real Estate & Mortgages in Stanislaus County
Real Estate and Mortgage Overview in Stanislaus County
| Characteristic | Without Mortgage | With Mortgage |
| Housing Units | 35,981 | 70,378 |
| Median Property Value | $365,300 | $404,900 |
| Median Household Income | $69,651 | $19,770 |
| Monthly Housing Costs | $632 | $9,319 |
| Real Estate Taxes | $2,234 | $1,473 |
Property Value by Mortgage Status in Stanislaus County
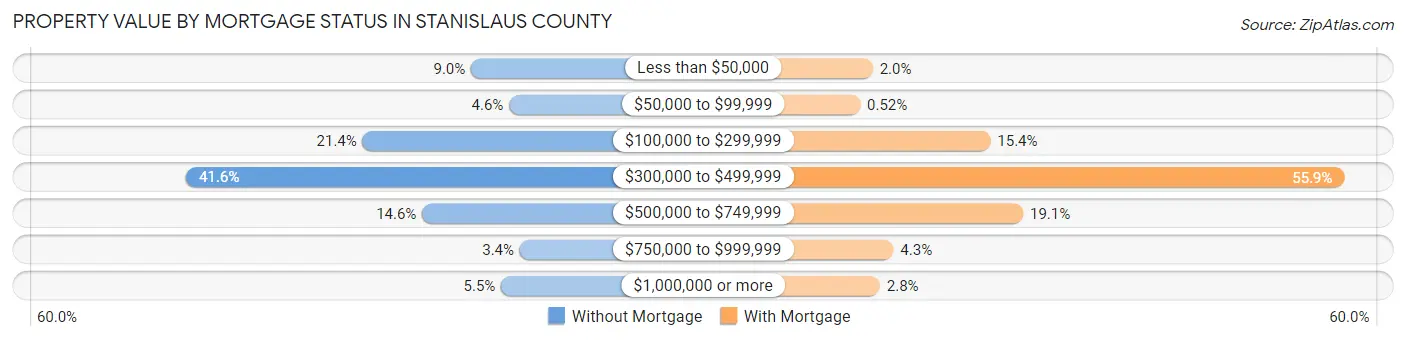
| Property Value | Without Mortgage | With Mortgage |
| Less than $50,000 | 3,226 (9.0%) | 1,380 (2.0%) |
| $50,000 to $99,999 | 1,664 (4.6%) | 368 (0.5%) |
| $100,000 to $299,999 | 7,689 (21.4%) | 10,847 (15.4%) |
| $300,000 to $499,999 | 14,950 (41.5%) | 39,315 (55.9%) |
| $500,000 to $749,999 | 5,238 (14.6%) | 13,468 (19.1%) |
| $750,000 to $999,999 | 1,223 (3.4%) | 3,046 (4.3%) |
| $1,000,000 or more | 1,991 (5.5%) | 1,954 (2.8%) |
| Total | 35,981 (100.0%) | 70,378 (100.0%) |
Household Income by Mortgage Status in Stanislaus County
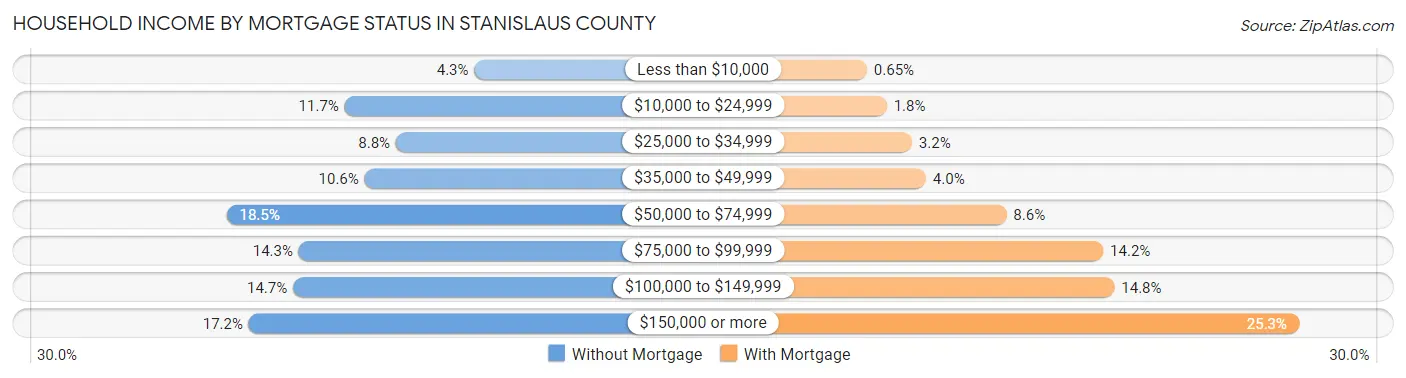
| Household Income | Without Mortgage | With Mortgage |
| Less than $10,000 | 1,547 (4.3%) | 454 (0.6%) |
| $10,000 to $24,999 | 4,213 (11.7%) | 1,252 (1.8%) |
| $25,000 to $34,999 | 3,158 (8.8%) | 2,263 (3.2%) |
| $35,000 to $49,999 | 3,802 (10.6%) | 2,829 (4.0%) |
| $50,000 to $74,999 | 6,642 (18.5%) | 6,065 (8.6%) |
| $75,000 to $99,999 | 5,157 (14.3%) | 9,961 (14.1%) |
| $100,000 to $149,999 | 5,276 (14.7%) | 10,412 (14.8%) |
| $150,000 or more | 6,186 (17.2%) | 17,826 (25.3%) |
| Total | 35,981 (100.0%) | 70,378 (100.0%) |
Property Value to Household Income Ratio in Stanislaus County
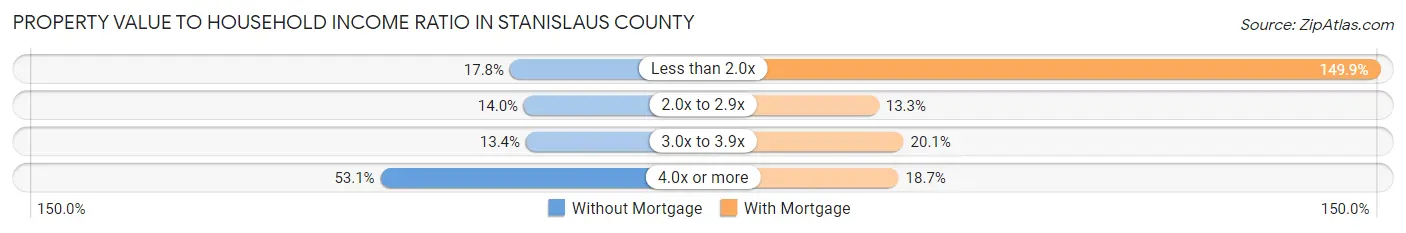
| Value-to-Income Ratio | Without Mortgage | With Mortgage |
| Less than 2.0x | 6,404 (17.8%) | 105,501 (149.9%) |
| 2.0x to 2.9x | 5,031 (14.0%) | 9,370 (13.3%) |
| 3.0x to 3.9x | 4,835 (13.4%) | 14,130 (20.1%) |
| 4.0x or more | 19,090 (53.1%) | 13,172 (18.7%) |
| Total | 35,981 (100.0%) | 70,378 (100.0%) |
Real Estate Taxes by Mortgage Status in Stanislaus County
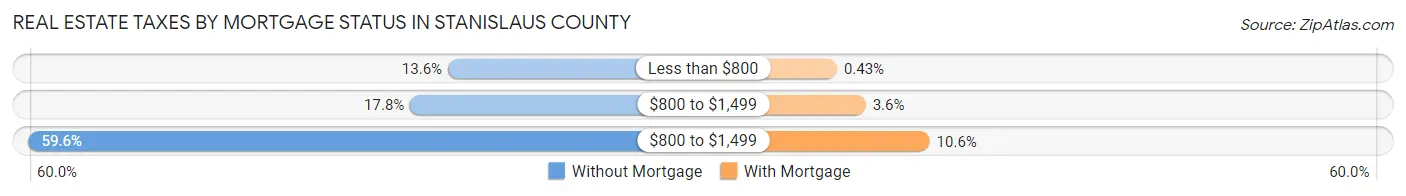
| Property Taxes | Without Mortgage | With Mortgage |
| Less than $800 | 4,898 (13.6%) | 304 (0.4%) |
| $800 to $1,499 | 6,387 (17.7%) | 2,517 (3.6%) |
| $800 to $1,499 | 21,425 (59.6%) | 7,455 (10.6%) |
| Total | 35,981 (100.0%) | 70,378 (100.0%) |
Health & Disability in Stanislaus County
Health Insurance Coverage by Age in Stanislaus County
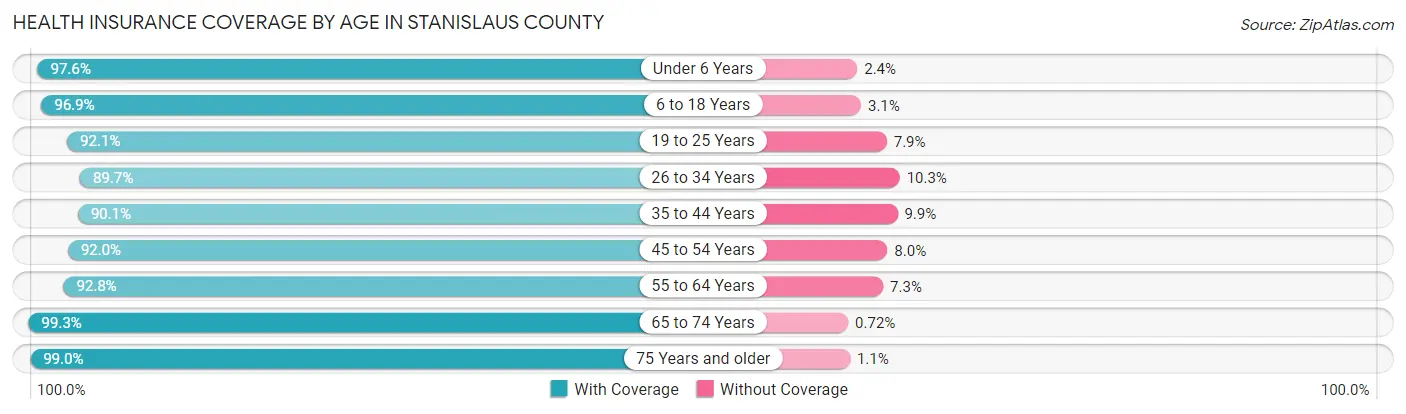
| Age Bracket | With Coverage | Without Coverage |
| Under 6 Years | 43,689 (97.6%) | 1,083 (2.4%) |
| 6 to 18 Years | 107,817 (96.9%) | 3,473 (3.1%) |
| 19 to 25 Years | 48,595 (92.1%) | 4,181 (7.9%) |
| 26 to 34 Years | 63,480 (89.7%) | 7,310 (10.3%) |
| 35 to 44 Years | 64,898 (90.1%) | 7,135 (9.9%) |
| 45 to 54 Years | 59,073 (92.0%) | 5,165 (8.0%) |
| 55 to 64 Years | 56,965 (92.7%) | 4,451 (7.2%) |
| 65 to 74 Years | 42,832 (99.3%) | 309 (0.7%) |
| 75 Years and older | 28,469 (99.0%) | 301 (1.1%) |
| Total | 515,818 (93.9%) | 33,408 (6.1%) |
Health Insurance Coverage by Citizenship Status in Stanislaus County
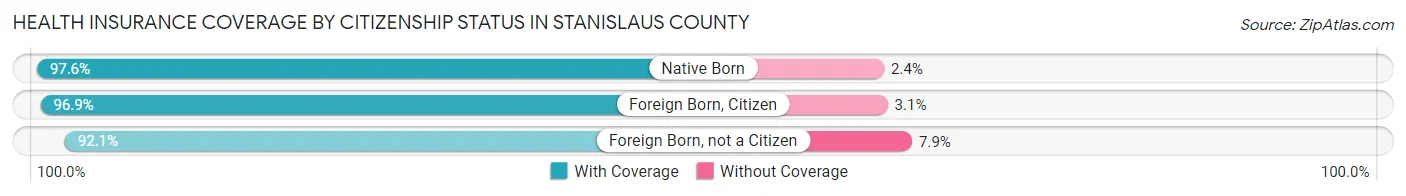
| Citizenship Status | With Coverage | Without Coverage |
| Native Born | 43,689 (97.6%) | 1,083 (2.4%) |
| Foreign Born, Citizen | 107,817 (96.9%) | 3,473 (3.1%) |
| Foreign Born, not a Citizen | 48,595 (92.1%) | 4,181 (7.9%) |
Health Insurance Coverage by Household Income in Stanislaus County
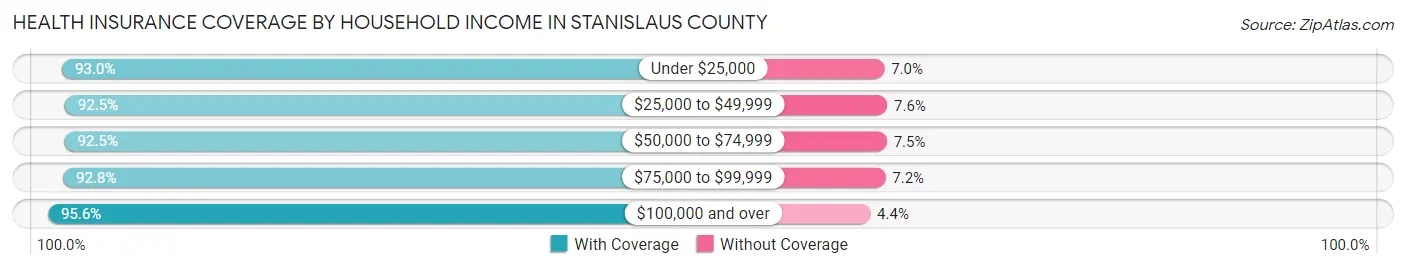
| Household Income | With Coverage | Without Coverage |
| Under $25,000 | 48,938 (93.0%) | 3,691 (7.0%) |
| $25,000 to $49,999 | 81,246 (92.4%) | 6,637 (7.5%) |
| $50,000 to $74,999 | 86,188 (92.5%) | 6,973 (7.5%) |
| $75,000 to $99,999 | 73,305 (92.8%) | 5,703 (7.2%) |
| $100,000 and over | 222,738 (95.6%) | 10,205 (4.4%) |
Public vs Private Health Insurance Coverage by Age in Stanislaus County
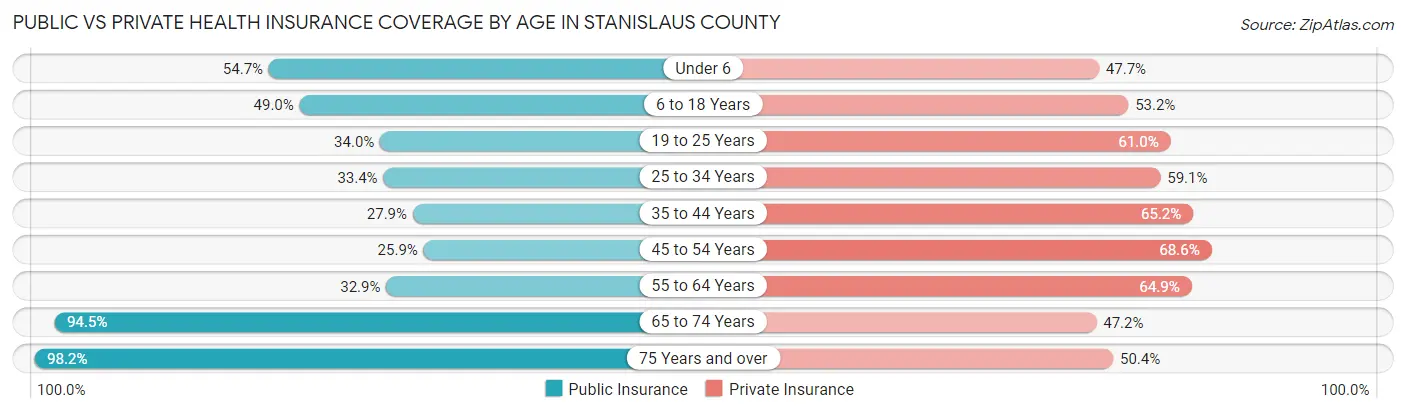
| Age Bracket | Public Insurance | Private Insurance |
| Under 6 | 24,469 (54.6%) | 21,364 (47.7%) |
| 6 to 18 Years | 54,477 (48.9%) | 59,163 (53.2%) |
| 19 to 25 Years | 17,945 (34.0%) | 32,198 (61.0%) |
| 25 to 34 Years | 23,636 (33.4%) | 41,854 (59.1%) |
| 35 to 44 Years | 20,117 (27.9%) | 46,963 (65.2%) |
| 45 to 54 Years | 16,657 (25.9%) | 44,074 (68.6%) |
| 55 to 64 Years | 20,187 (32.9%) | 39,873 (64.9%) |
| 65 to 74 Years | 40,784 (94.5%) | 20,381 (47.2%) |
| 75 Years and over | 28,260 (98.2%) | 14,486 (50.3%) |
| Total | 246,532 (44.9%) | 320,356 (58.3%) |
Disability Status by Sex by Age in Stanislaus County
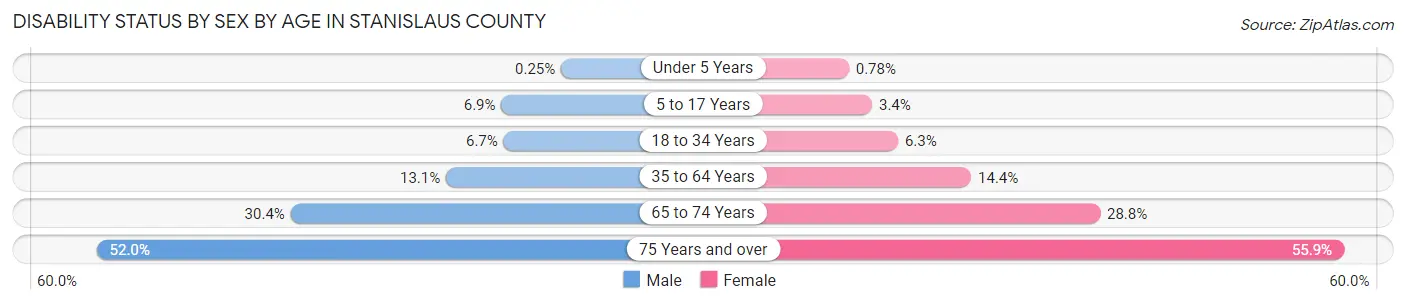
| Age Bracket | Male | Female |
| Under 5 Years | 48 (0.3%) | 145 (0.8%) |
| 5 to 17 Years | 3,883 (6.9%) | 1,818 (3.4%) |
| 18 to 34 Years | 4,467 (6.7%) | 4,035 (6.3%) |
| 35 to 64 Years | 12,989 (13.1%) | 14,153 (14.4%) |
| 65 to 74 Years | 6,132 (30.4%) | 6,600 (28.8%) |
| 75 Years and over | 6,247 (52.0%) | 9,368 (55.9%) |
Disability Class by Sex by Age in Stanislaus County
Disability Class: Hearing Difficulty
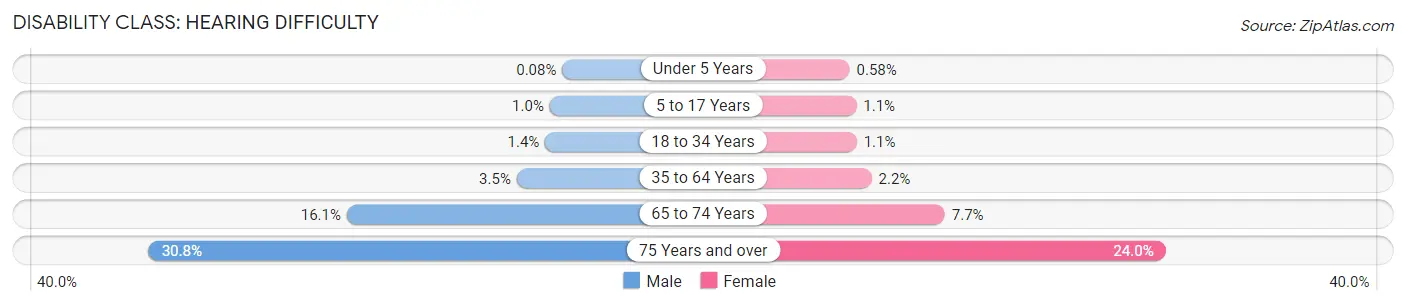
| Age Bracket | Male | Female |
| Under 5 Years | 15 (0.1%) | 107 (0.6%) |
| 5 to 17 Years | 571 (1.0%) | 580 (1.1%) |
| 18 to 34 Years | 905 (1.3%) | 715 (1.1%) |
| 35 to 64 Years | 3,436 (3.5%) | 2,173 (2.2%) |
| 65 to 74 Years | 3,247 (16.1%) | 1,756 (7.6%) |
| 75 Years and over | 3,699 (30.8%) | 4,025 (24.0%) |
Disability Class: Vision Difficulty
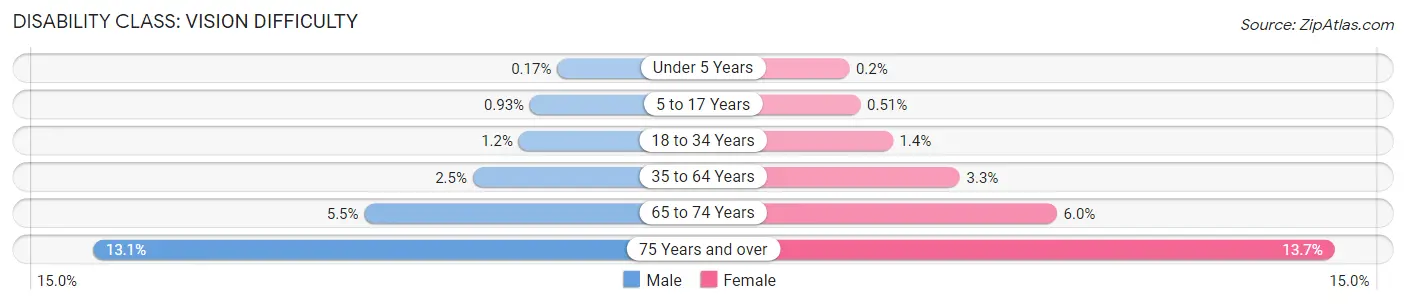
| Age Bracket | Male | Female |
| Under 5 Years | 33 (0.2%) | 38 (0.2%) |
| 5 to 17 Years | 525 (0.9%) | 277 (0.5%) |
| 18 to 34 Years | 832 (1.2%) | 912 (1.4%) |
| 35 to 64 Years | 2,508 (2.5%) | 3,224 (3.3%) |
| 65 to 74 Years | 1,119 (5.5%) | 1,373 (6.0%) |
| 75 Years and over | 1,574 (13.1%) | 2,298 (13.7%) |
Disability Class: Cognitive Difficulty
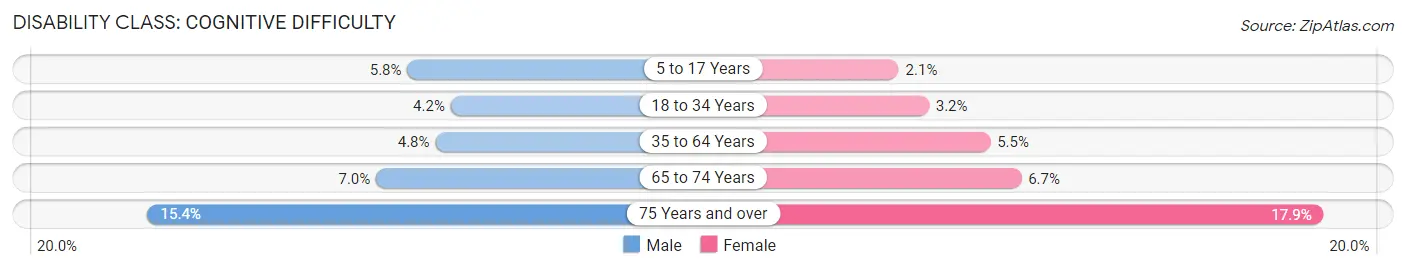
| Age Bracket | Male | Female |
| 5 to 17 Years | 3,260 (5.8%) | 1,137 (2.1%) |
| 18 to 34 Years | 2,805 (4.2%) | 2,082 (3.2%) |
| 35 to 64 Years | 4,727 (4.8%) | 5,417 (5.5%) |
| 65 to 74 Years | 1,403 (7.0%) | 1,529 (6.7%) |
| 75 Years and over | 1,854 (15.4%) | 2,995 (17.9%) |
Disability Class: Ambulatory Difficulty
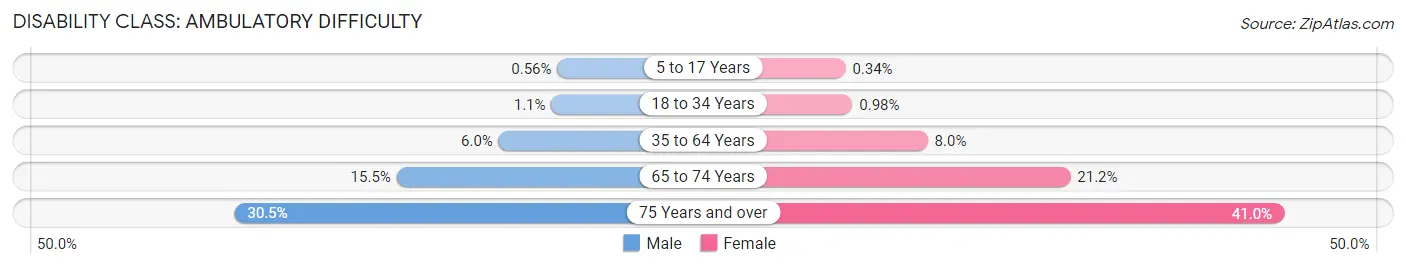
| Age Bracket | Male | Female |
| 5 to 17 Years | 316 (0.6%) | 182 (0.3%) |
| 18 to 34 Years | 743 (1.1%) | 629 (1.0%) |
| 35 to 64 Years | 5,969 (6.0%) | 7,836 (8.0%) |
| 65 to 74 Years | 3,123 (15.5%) | 4,867 (21.2%) |
| 75 Years and over | 3,669 (30.5%) | 6,874 (41.0%) |
Disability Class: Self-Care Difficulty
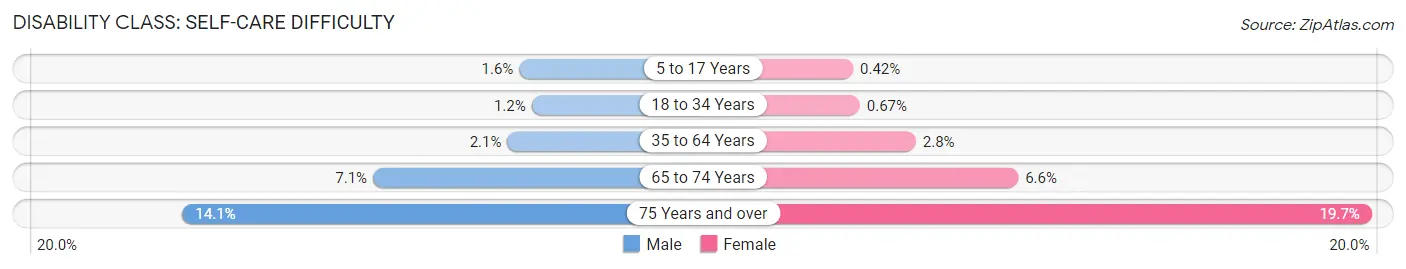
| Age Bracket | Male | Female |
| 5 to 17 Years | 924 (1.6%) | 229 (0.4%) |
| 18 to 34 Years | 791 (1.2%) | 432 (0.7%) |
| 35 to 64 Years | 2,064 (2.1%) | 2,703 (2.8%) |
| 65 to 74 Years | 1,427 (7.1%) | 1,503 (6.6%) |
| 75 Years and over | 1,699 (14.1%) | 3,295 (19.7%) |
Technology Access in Stanislaus County
Computing Device Access in Stanislaus County
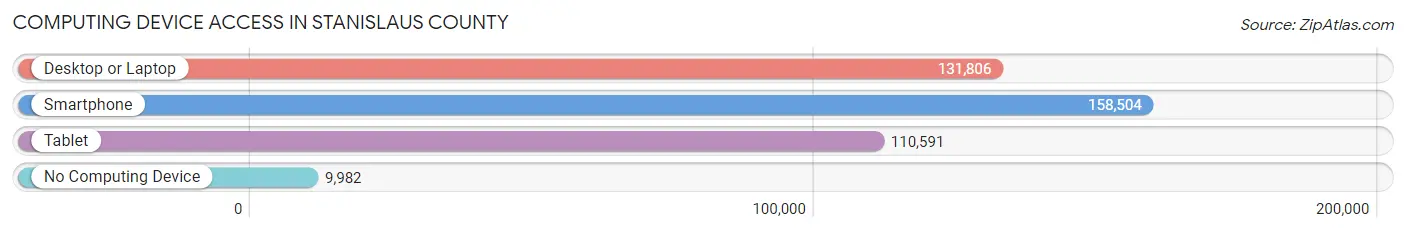
| Device Type | # Households | % Households |
| Desktop or Laptop | 131,806 | 75.0% |
| Smartphone | 158,504 | 90.2% |
| Tablet | 110,591 | 62.9% |
| No Computing Device | 9,982 | 5.7% |
| Total | 175,747 | 100.0% |
Internet Access in Stanislaus County
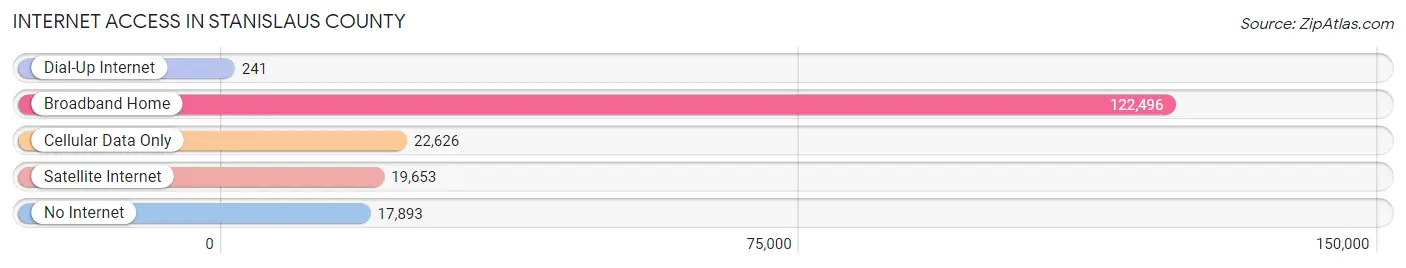
| Internet Type | # Households | % Households |
| Dial-Up Internet | 241 | 0.1% |
| Broadband Home | 122,496 | 69.7% |
| Cellular Data Only | 22,626 | 12.9% |
| Satellite Internet | 19,653 | 11.2% |
| No Internet | 17,893 | 10.2% |
| Total | 175,747 | 100.0% |
Stanislaus County Summary
Stanislaus County is located in the Central Valley of California, and is part of the San Joaquin Valley region. It is bordered by San Joaquin County to the north, Merced County to the south, Tuolumne County to the east, and San Joaquin County to the west. The county seat is Modesto, and the county has a population of 514,453 as of the 2020 census.
History
The area that is now Stanislaus County was originally inhabited by the Yokuts and Miwok Native American tribes. The first European settlers arrived in the area in the early 1800s, and the county was officially established in 1854. The county was named after Stanislaus, a Catholic saint who was martyred in the 4th century.
The county experienced rapid growth in the late 19th and early 20th centuries, due to the influx of settlers and the development of the agricultural industry. The county was also home to several military bases during World War II, including the Modesto Army Airfield.
Geography
Stanislaus County covers an area of 1,515 square miles, making it the 18th largest county in California. The county is located in the Central Valley of California, and is part of the San Joaquin Valley region. The county is bordered by San Joaquin County to the north, Merced County to the south, Tuolumne County to the east, and San Joaquin County to the west.
The county is divided into two distinct regions: the northern region is characterized by rolling hills and oak woodlands, while the southern region is characterized by flat plains and agricultural fields. The highest point in the county is Mount Oso, which has an elevation of 3,849 feet. The county also contains several rivers, including the Tuolumne, Stanislaus, and San Joaquin Rivers.
Economy
Stanislaus County has a diverse economy, with a mix of agriculture, manufacturing, and services. The county is home to several major employers, including E&J Gallo Winery, Foster Farms, and Blue Diamond Growers.
Agriculture is a major part of the county’s economy, and the county is one of the top producers of almonds, walnuts, and tomatoes in the United States. The county is also home to several wineries, and is a major producer of wine grapes.
Manufacturing is also an important part of the county’s economy, with several major employers in the area, including Del Monte Foods, Foster Farms, and Blue Diamond Growers.
Demographics
As of the 2020 census, Stanislaus County had a population of 514,453. The population is racially and ethnically diverse, with the largest racial/ethnic groups being White (48.3%), Hispanic or Latino (37.2%), and Asian (7.2%).
The median household income in the county is $60,945, and the median home value is $310,000. The county’s poverty rate is 17.2%, and the unemployment rate is 8.2%.
Conclusion
Stanislaus County is located in the Central Valley of California, and is part of the San Joaquin Valley region. The county has a diverse economy, with a mix of agriculture, manufacturing, and services. The county is also racially and ethnically diverse, with the largest racial/ethnic groups being White, Hispanic or Latino, and Asian. Stanislaus County has a population of 514,453, and the median household income is $60,945.
Common Questions
What is Per Capita Income in Stanislaus County?
Per Capita income in Stanislaus County is $32,044.
What is the Median Family Income in Stanislaus County?
Median Family Income in Stanislaus County is $83,732.
What is the Median Household income in Stanislaus County?
Median Household Income in Stanislaus County is $74,872.
What is Income or Wage Gap in Stanislaus County?
Income or Wage Gap in Stanislaus County is 31.6%.
Women in Stanislaus County earn 68.4 cents for every dollar earned by a man.
What is Family Income Deficit in Stanislaus County?
Family Income Deficit in Stanislaus County is $11,478.
Families that are below poverty line in Stanislaus County earn $11,478 less on average than the poverty threshold level.
What is Inequality or Gini Index in Stanislaus County?
Inequality or Gini Index in Stanislaus County is 0.44.
What is the Total Population of Stanislaus County?
Total Population of Stanislaus County is 552,063.
What is the Total Male Population of Stanislaus County?
Total Male Population of Stanislaus County is 275,687.
What is the Total Female Population of Stanislaus County?
Total Female Population of Stanislaus County is 276,376.
What is the Ratio of Males per 100 Females in Stanislaus County?
There are 99.75 Males per 100 Females in Stanislaus County.
What is the Ratio of Females per 100 Males in Stanislaus County?
There are 100.25 Females per 100 Males in Stanislaus County.
What is the Median Population Age in Stanislaus County?
Median Population Age in Stanislaus County is 34.5 Years.
What is the Average Family Size in Stanislaus County
Average Family Size in Stanislaus County is 3.6 People.
What is the Average Household Size in Stanislaus County
Average Household Size in Stanislaus County is 3.1 People.
How Large is the Labor Force in Stanislaus County?
There are 258,433 People in the Labor Forcein in Stanislaus County.
What is the Percentage of People in the Labor Force in Stanislaus County?
61.4% of People are in the Labor Force in Stanislaus County.
What is the Unemployment Rate in Stanislaus County?
Unemployment Rate in Stanislaus County is 8.2%.