San Mateo County, CA Map & Demographics
San Mateo County Map
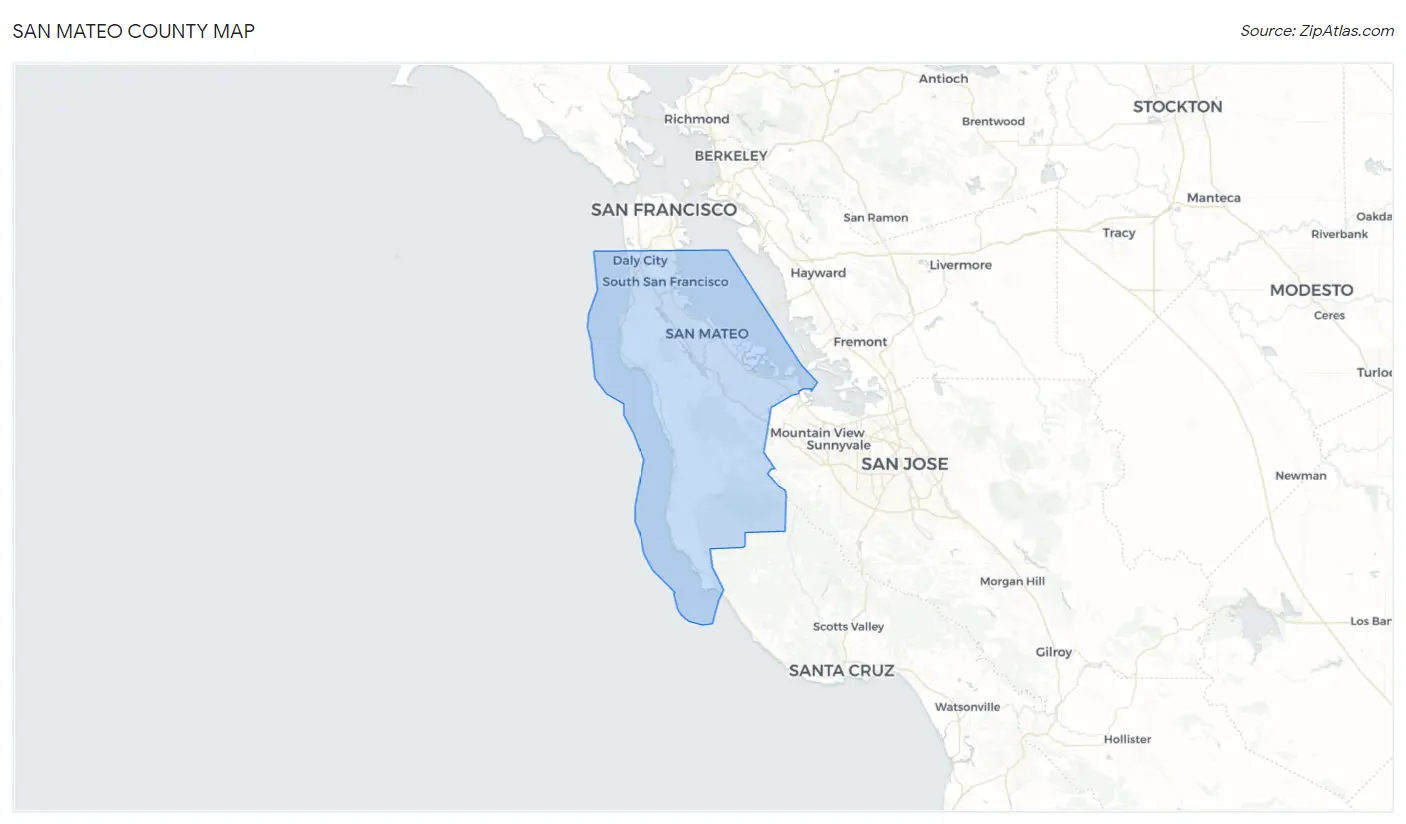
San Mateo County Overview
$77,741
PER CAPITA INCOME
$175,776
AVG FAMILY INCOME
$149,907
AVG HOUSEHOLD INCOME
19.3%
WAGE / INCOME GAP [ % ]
80.7¢/ $1
WAGE / INCOME GAP [ $ ]
$10,991
FAMILY INCOME DEFICIT
0.49
INEQUALITY / GINI INDEX
754,250
TOTAL POPULATION
376,542
MALE POPULATION
377,708
FEMALE POPULATION
99.69
MALES / 100 FEMALES
100.31
FEMALES / 100 MALES
40.3
MEDIAN AGE
3.3
AVG FAMILY SIZE
2.8
AVG HOUSEHOLD SIZE
422,052
LABOR FORCE [ PEOPLE ]
67.8%
PERCENT IN LABOR FORCE
4.5%
UNEMPLOYMENT RATE
Income in San Mateo County
Income Overview in San Mateo County
Per Capita Income in San Mateo County is $77,741, while median incomes of families and households are $175,776 and $149,907 respectively.
| Characteristic | Number | Measure |
| Per Capita Income | 754,250 | $77,741 |
| Median Family Income | 182,196 | $175,776 |
| Mean Family Income | 182,196 | $247,973 |
| Median Household Income | 264,323 | $149,907 |
| Mean Household Income | 264,323 | $216,684 |
| Income Deficit | 182,196 | $10,991 |
| Wage / Income Gap (%) | 754,250 | 19.27% |
| Wage / Income Gap ($) | 754,250 | 80.73¢ per $1 |
| Gini / Inequality Index | 754,250 | 0.49 |
Earnings by Sex in San Mateo County
Average Earnings in San Mateo County are $68,872, $75,083 for men and $60,614 for women, a difference of 19.3%.
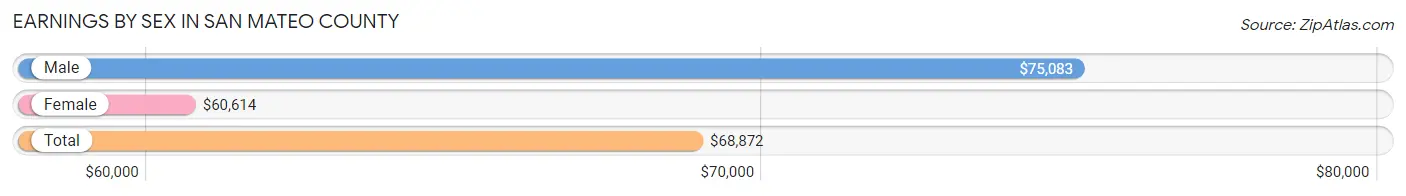
| Sex | Number | Average Earnings |
| Male | 233,282 (53.7%) | $75,083 |
| Female | 201,315 (46.3%) | $60,614 |
| Total | 434,597 (100.0%) | $68,872 |
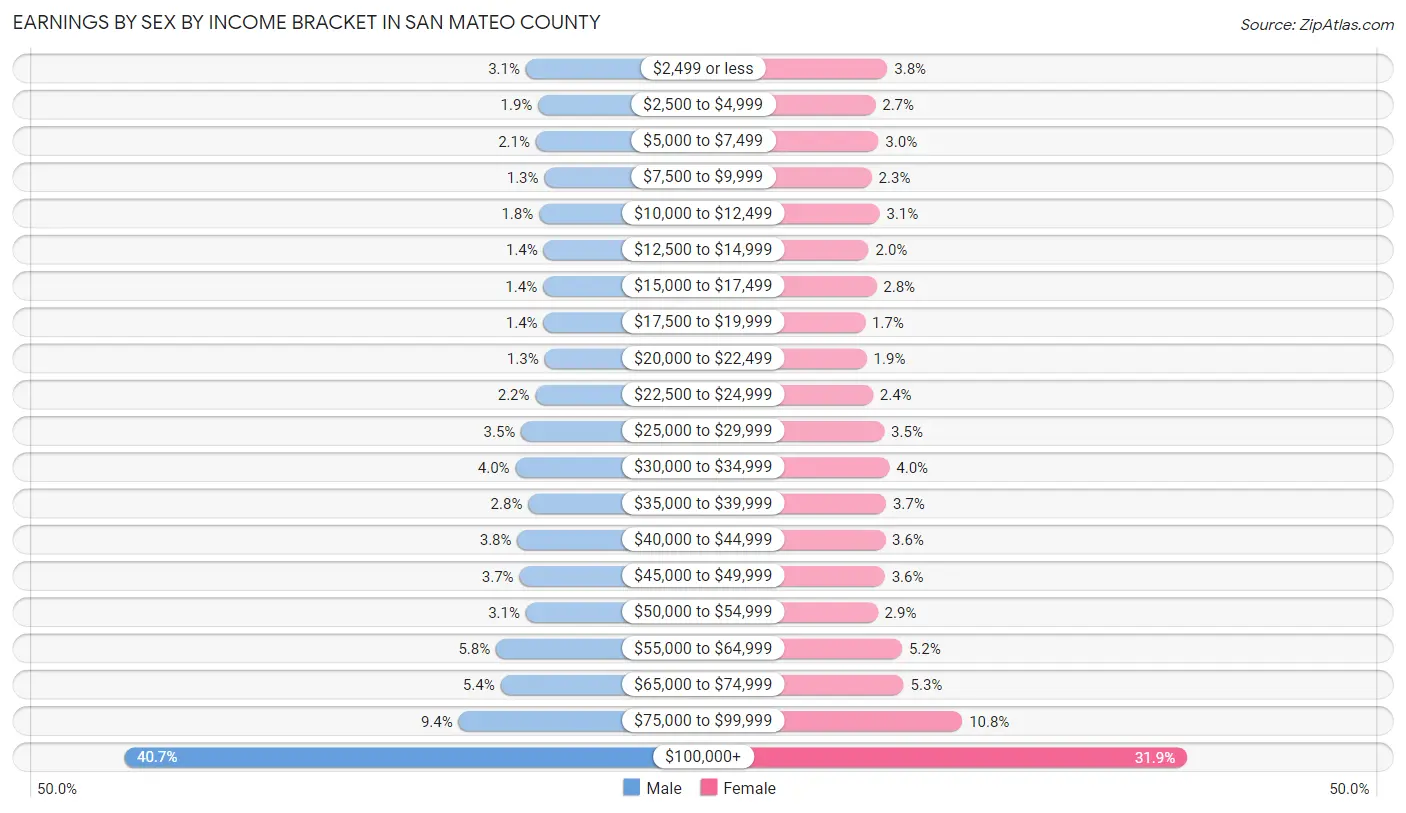
Earnings by Sex by Income Bracket in San Mateo County
The most common earnings brackets in San Mateo County are $100,000+ for men (94,888 | 40.7%) and $100,000+ for women (64,167 | 31.9%).
| Income | Male | Female |
| $2,499 or less | 7,114 (3.0%) | 7,647 (3.8%) |
| $2,500 to $4,999 | 4,406 (1.9%) | 5,366 (2.7%) |
| $5,000 to $7,499 | 4,923 (2.1%) | 5,960 (3.0%) |
| $7,500 to $9,999 | 3,048 (1.3%) | 4,691 (2.3%) |
| $10,000 to $12,499 | 4,219 (1.8%) | 6,173 (3.1%) |
| $12,500 to $14,999 | 3,218 (1.4%) | 4,101 (2.0%) |
| $15,000 to $17,499 | 3,351 (1.4%) | 5,584 (2.8%) |
| $17,500 to $19,999 | 3,274 (1.4%) | 3,418 (1.7%) |
| $20,000 to $22,499 | 3,026 (1.3%) | 3,754 (1.9%) |
| $22,500 to $24,999 | 5,026 (2.1%) | 4,905 (2.4%) |
| $25,000 to $29,999 | 8,128 (3.5%) | 7,044 (3.5%) |
| $30,000 to $34,999 | 9,389 (4.0%) | 8,039 (4.0%) |
| $35,000 to $39,999 | 6,572 (2.8%) | 7,394 (3.7%) |
| $40,000 to $44,999 | 8,967 (3.8%) | 7,223 (3.6%) |
| $45,000 to $49,999 | 8,525 (3.6%) | 7,143 (3.5%) |
| $50,000 to $54,999 | 7,113 (3.0%) | 5,827 (2.9%) |
| $55,000 to $64,999 | 13,621 (5.8%) | 10,401 (5.2%) |
| $65,000 to $74,999 | 12,652 (5.4%) | 10,706 (5.3%) |
| $75,000 to $99,999 | 21,822 (9.3%) | 21,772 (10.8%) |
| $100,000+ | 94,888 (40.7%) | 64,167 (31.9%) |
| Total | 233,282 (100.0%) | 201,315 (100.0%) |
Earnings by Sex by Educational Attainment in San Mateo County
Average earnings in San Mateo County are $85,886 for men and $69,803 for women, a difference of 18.7%. Men with an educational attainment of graduate degree enjoy the highest average annual earnings of $174,822, while those with less than high school education earn the least with $39,560. Women with an educational attainment of graduate degree earn the most with the average annual earnings of $118,838, while those with less than high school education have the smallest earnings of $27,203.
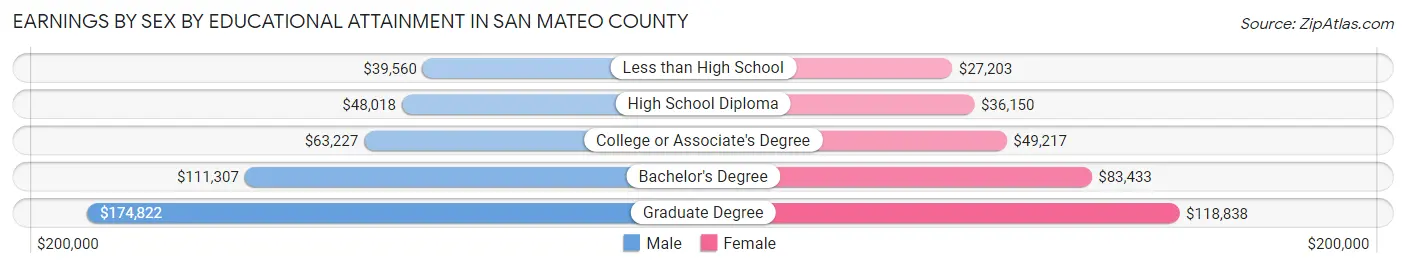
| Educational Attainment | Male Income | Female Income |
| Less than High School | $39,560 | $27,203 |
| High School Diploma | $48,018 | $36,150 |
| College or Associate's Degree | $63,227 | $49,217 |
| Bachelor's Degree | $111,307 | $83,433 |
| Graduate Degree | $174,822 | $118,838 |
| Total | $85,886 | $69,803 |
Family Income in San Mateo County
Family Income Brackets in San Mateo County
According to the San Mateo County family income data, there are 79,984 families falling into the $200,000+ income range, which is the most common income bracket and makes up 43.9% of all families. Conversely, the $10,000 to $14,999 income bracket is the least frequent group with only 1,275 families (0.7%) belonging to this category.
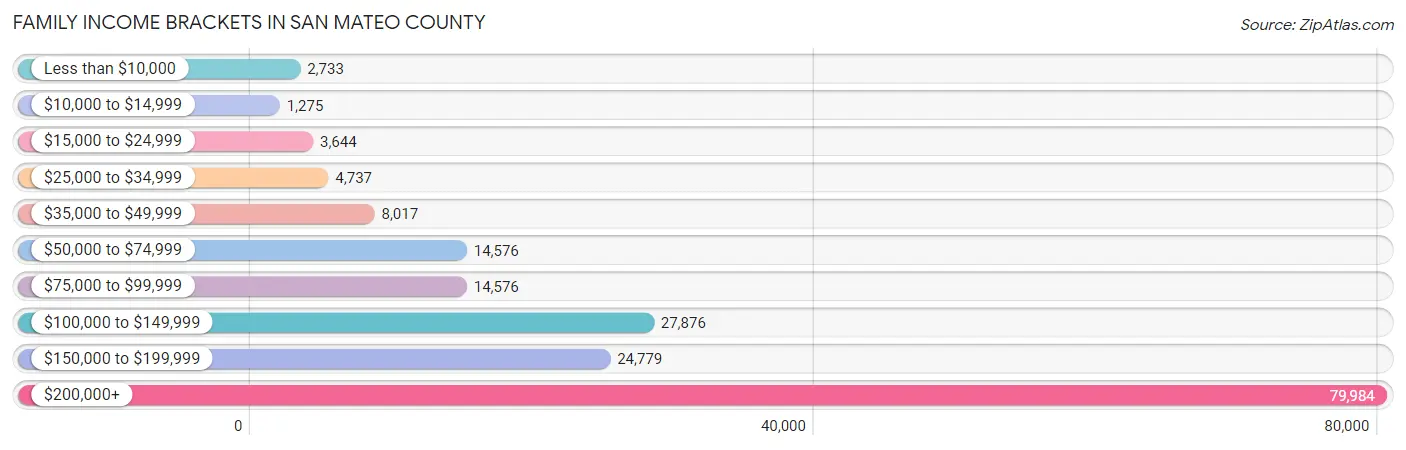
| Income Bracket | # Families | % Families |
| Less than $10,000 | 2,733 | 1.5% |
| $10,000 to $14,999 | 1,275 | 0.7% |
| $15,000 to $24,999 | 3,644 | 2.0% |
| $25,000 to $34,999 | 4,737 | 2.6% |
| $35,000 to $49,999 | 8,017 | 4.4% |
| $50,000 to $74,999 | 14,576 | 8.0% |
| $75,000 to $99,999 | 14,576 | 8.0% |
| $100,000 to $149,999 | 27,876 | 15.3% |
| $150,000 to $199,999 | 24,779 | 13.6% |
| $200,000+ | 79,984 | 43.9% |
Family Income by Famaliy Size in San Mateo County
4-person families (38,851 | 21.3%) account for the highest median family income in San Mateo County with $219,379 per family, while 2-person families (74,698 | 41.0%) have the highest median income of $71,800 per family member.
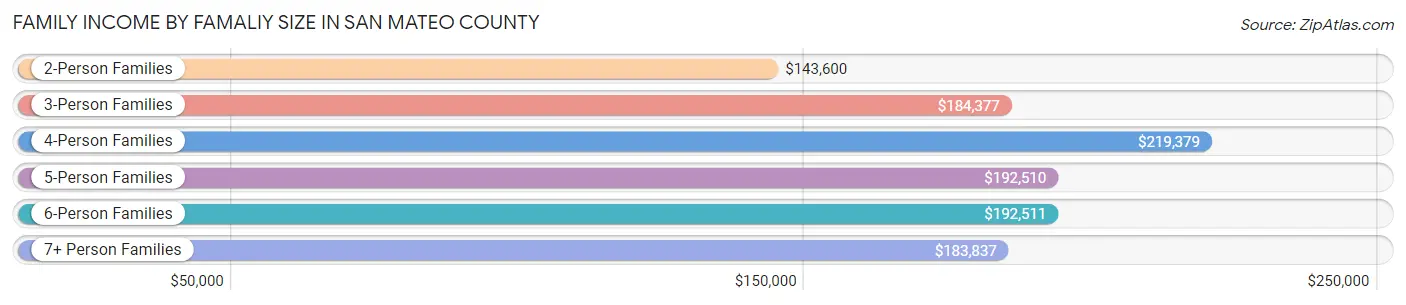
| Income Bracket | # Families | Median Income |
| 2-Person Families | 74,698 (41.0%) | $143,600 |
| 3-Person Families | 45,197 (24.8%) | $184,377 |
| 4-Person Families | 38,851 (21.3%) | $219,379 |
| 5-Person Families | 14,759 (8.1%) | $192,510 |
| 6-Person Families | 5,305 (2.9%) | $192,511 |
| 7+ Person Families | 3,386 (1.9%) | $183,837 |
| Total | 182,196 (100.0%) | $175,776 |
Family Income by Number of Earners in San Mateo County
The median family income in San Mateo County is $175,776, with families comprising 2 earners (85,047) having the highest median family income of $222,279, while families with no earners (18,830) have the lowest median family income of $81,646, accounting for 46.7% and 10.3% of families, respectively.
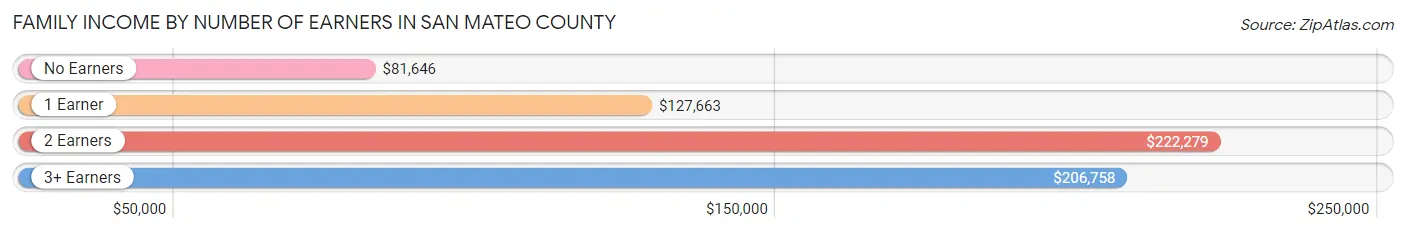
| Number of Earners | # Families | Median Income |
| No Earners | 18,830 (10.3%) | $81,646 |
| 1 Earner | 50,394 (27.7%) | $127,663 |
| 2 Earners | 85,047 (46.7%) | $222,279 |
| 3+ Earners | 27,925 (15.3%) | $206,758 |
| Total | 182,196 (100.0%) | $175,776 |
Household Income in San Mateo County
Household Income Brackets in San Mateo County
With 98,064 households falling in the category, the $200,000+ income range is the most frequent in San Mateo County, accounting for 37.1% of all households. In contrast, only 4,493 households (1.7%) fall into the $10,000 to $14,999 income bracket, making it the least populous group.
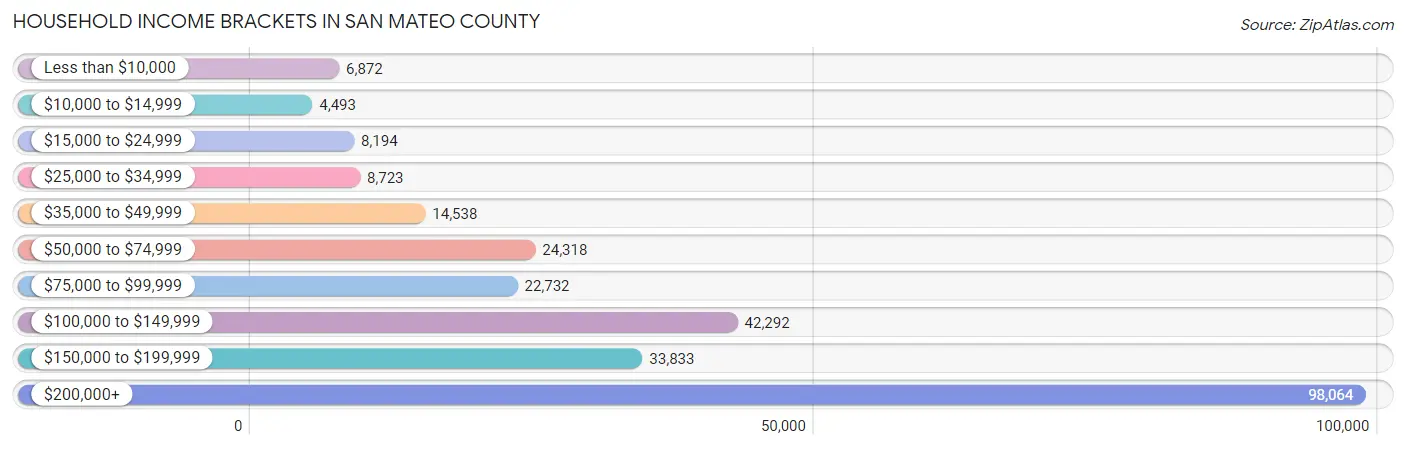
| Income Bracket | # Households | % Households |
| Less than $10,000 | 6,872 | 2.6% |
| $10,000 to $14,999 | 4,493 | 1.7% |
| $15,000 to $24,999 | 8,194 | 3.1% |
| $25,000 to $34,999 | 8,723 | 3.3% |
| $35,000 to $49,999 | 14,538 | 5.5% |
| $50,000 to $74,999 | 24,318 | 9.2% |
| $75,000 to $99,999 | 22,732 | 8.6% |
| $100,000 to $149,999 | 42,292 | 16.0% |
| $150,000 to $199,999 | 33,833 | 12.8% |
| $200,000+ | 98,064 | 37.1% |
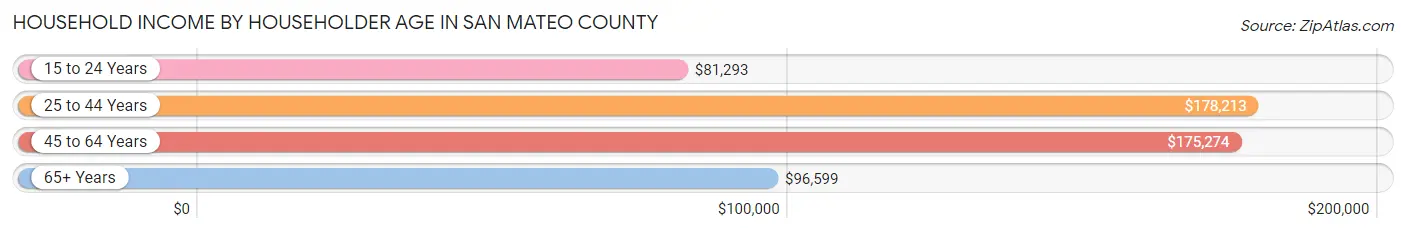
Household Income by Householder Age in San Mateo County
The median household income in San Mateo County is $149,907, with the highest median household income of $178,213 found in the 25 to 44 years age bracket for the primary householder. A total of 87,556 households (33.1%) fall into this category. Meanwhile, the 15 to 24 years age bracket for the primary householder has the lowest median household income of $81,293, with 5,047 households (1.9%) in this group.
| Income Bracket | # Households | Median Income |
| 15 to 24 Years | 5,047 (1.9%) | $81,293 |
| 25 to 44 Years | 87,556 (33.1%) | $178,213 |
| 45 to 64 Years | 101,365 (38.4%) | $175,274 |
| 65+ Years | 70,355 (26.6%) | $96,599 |
| Total | 264,323 (100.0%) | $149,907 |
Poverty in San Mateo County
Income Below Poverty by Sex and Age in San Mateo County
With 5.7% poverty level for males and 7.2% for females among the residents of San Mateo County, 16 and 17 year old males and 18 to 24 year old females are the most vulnerable to poverty, with 935 males (9.7%) and 3,436 females (13.0%) in their respective age groups living below the poverty level.
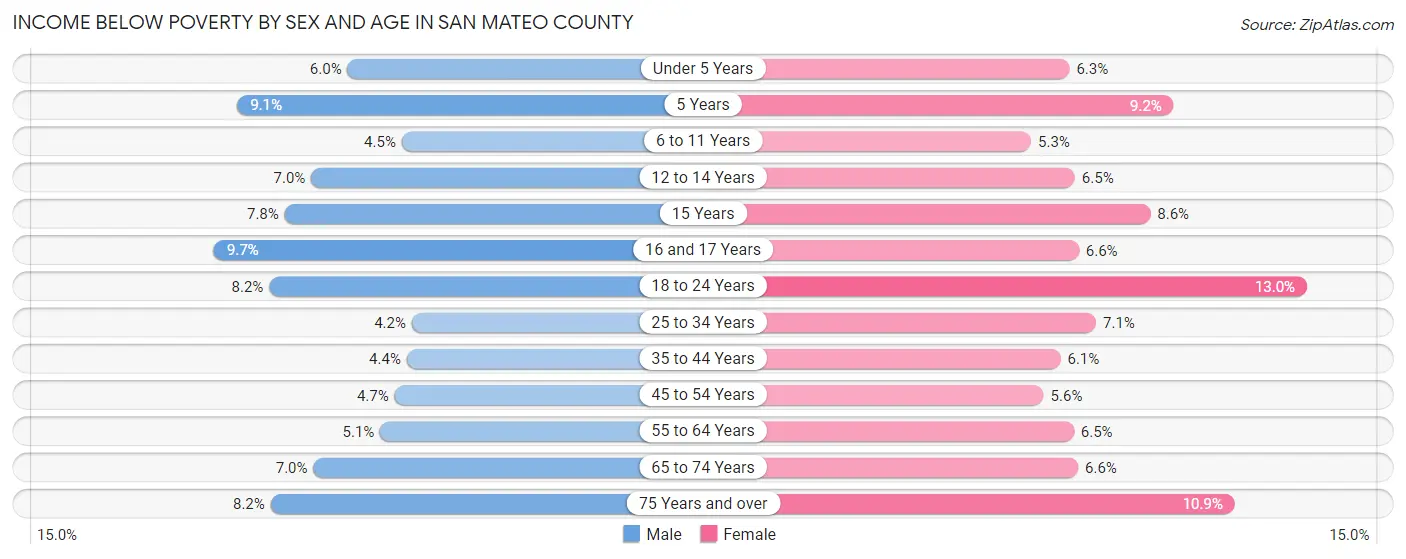
| Age Bracket | Male | Female |
| Under 5 Years | 1,210 (6.0%) | 1,202 (6.3%) |
| 5 Years | 437 (9.1%) | 367 (9.2%) |
| 6 to 11 Years | 1,155 (4.5%) | 1,243 (5.3%) |
| 12 to 14 Years | 849 (7.0%) | 827 (6.5%) |
| 15 Years | 285 (7.8%) | 360 (8.6%) |
| 16 and 17 Years | 935 (9.7%) | 577 (6.6%) |
| 18 to 24 Years | 2,356 (8.2%) | 3,436 (13.0%) |
| 25 to 34 Years | 2,421 (4.2%) | 3,685 (7.1%) |
| 35 to 44 Years | 2,423 (4.4%) | 3,267 (6.1%) |
| 45 to 54 Years | 2,432 (4.7%) | 2,860 (5.6%) |
| 55 to 64 Years | 2,468 (5.1%) | 3,216 (6.5%) |
| 65 to 74 Years | 2,329 (7.0%) | 2,506 (6.6%) |
| 75 Years and over | 1,792 (8.2%) | 3,499 (10.9%) |
| Total | 21,092 (5.7%) | 27,045 (7.2%) |
Income Above Poverty by Sex and Age in San Mateo County
According to the poverty statistics in San Mateo County, males aged 25 to 34 years and females aged 6 to 11 years are the age groups that are most secure financially, with 95.8% of males and 94.7% of females in these age groups living above the poverty line.
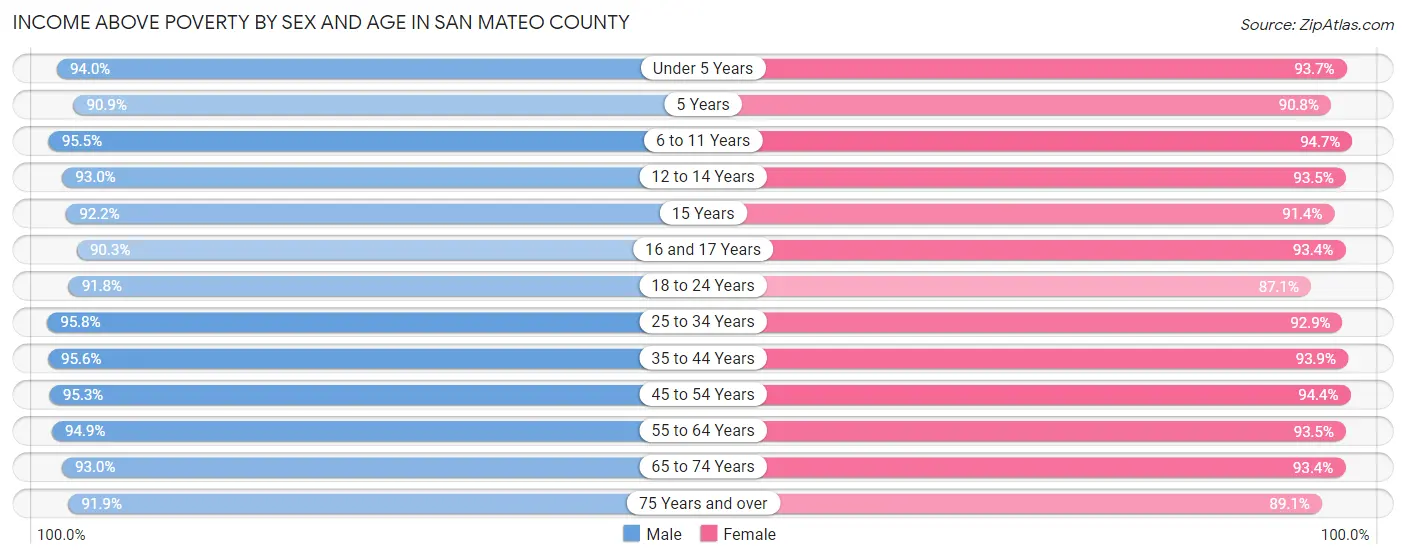
| Age Bracket | Male | Female |
| Under 5 Years | 18,930 (94.0%) | 17,757 (93.7%) |
| 5 Years | 4,377 (90.9%) | 3,605 (90.8%) |
| 6 to 11 Years | 24,539 (95.5%) | 22,338 (94.7%) |
| 12 to 14 Years | 11,248 (93.0%) | 11,906 (93.5%) |
| 15 Years | 3,388 (92.2%) | 3,831 (91.4%) |
| 16 and 17 Years | 8,672 (90.3%) | 8,172 (93.4%) |
| 18 to 24 Years | 26,425 (91.8%) | 23,097 (87.1%) |
| 25 to 34 Years | 54,882 (95.8%) | 48,368 (92.9%) |
| 35 to 44 Years | 53,194 (95.6%) | 50,348 (93.9%) |
| 45 to 54 Years | 49,263 (95.3%) | 48,065 (94.4%) |
| 55 to 64 Years | 45,903 (94.9%) | 46,570 (93.5%) |
| 65 to 74 Years | 31,149 (93.0%) | 35,587 (93.4%) |
| 75 Years and over | 20,187 (91.8%) | 28,472 (89.1%) |
| Total | 352,157 (94.4%) | 348,116 (92.8%) |
Income Below Poverty Among Married-Couple Families in San Mateo County
The poverty statistics for married-couple families in San Mateo County show that 2.5% or 3,650 of the total 145,150 families live below the poverty line. Families with 5 or more children have the highest poverty rate of 12.5%, comprising of 28 families. On the other hand, families with 1 or 2 children have the lowest poverty rate of 2.1%, which includes 1,224 families.
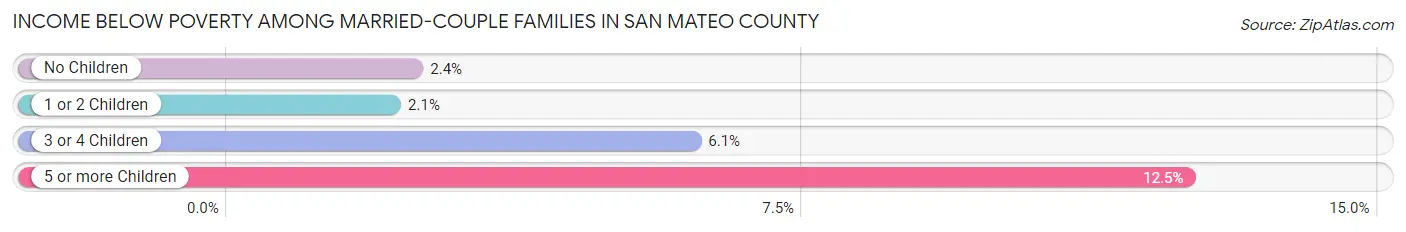
| Children | Above Poverty | Below Poverty |
| No Children | 77,884 (97.6%) | 1,929 (2.4%) |
| 1 or 2 Children | 56,135 (97.9%) | 1,224 (2.1%) |
| 3 or 4 Children | 7,285 (94.0%) | 469 (6.0%) |
| 5 or more Children | 196 (87.5%) | 28 (12.5%) |
| Total | 141,500 (97.5%) | 3,650 (2.5%) |
Income Below Poverty Among Single-Parent Households in San Mateo County
According to the poverty data in San Mateo County, 6.6% or 787 single-father households and 10.4% or 2,614 single-mother households are living below the poverty line. Among single-father households, those with 3 or 4 children have the highest poverty rate, with 118 households (32.2%) experiencing poverty. Likewise, among single-mother households, those with 5 or more children have the highest poverty rate, with 115 households (78.2%) falling below the poverty line.
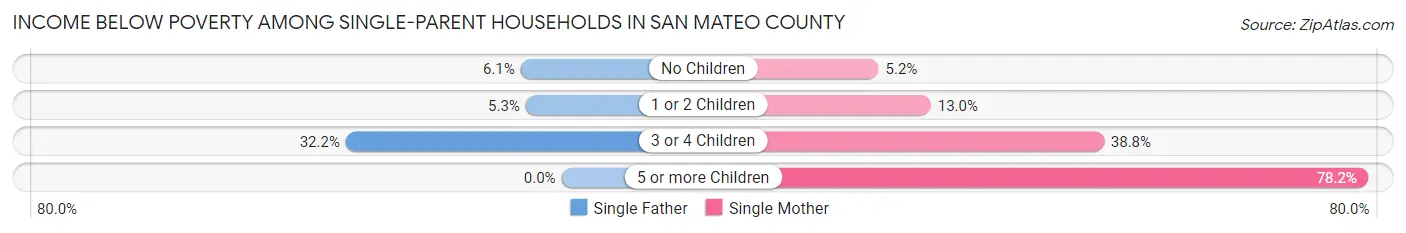
| Children | Single Father | Single Mother |
| No Children | 417 (6.1%) | 686 (5.2%) |
| 1 or 2 Children | 252 (5.3%) | 1,385 (13.0%) |
| 3 or 4 Children | 118 (32.2%) | 428 (38.8%) |
| 5 or more Children | 0 (0.0%) | 115 (78.2%) |
| Total | 787 (6.6%) | 2,614 (10.4%) |
Income Below Poverty Among Married-Couple vs Single-Parent Households in San Mateo County
The poverty data for San Mateo County shows that 3,650 of the married-couple family households (2.5%) and 3,401 of the single-parent households (9.2%) are living below the poverty level. Within the married-couple family households, those with 5 or more children have the highest poverty rate, with 28 households (12.5%) falling below the poverty line. Among the single-parent households, those with 5 or more children have the highest poverty rate, with 115 household (72.3%) living below poverty.
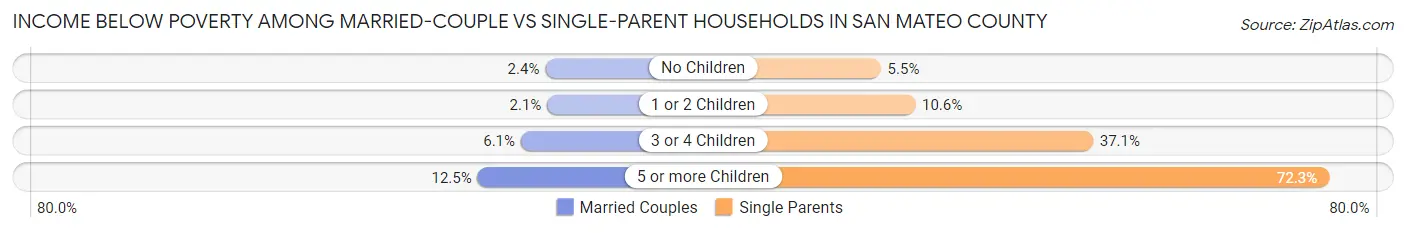
| Children | Married-Couple Families | Single-Parent Households |
| No Children | 1,929 (2.4%) | 1,103 (5.5%) |
| 1 or 2 Children | 1,224 (2.1%) | 1,637 (10.6%) |
| 3 or 4 Children | 469 (6.0%) | 546 (37.1%) |
| 5 or more Children | 28 (12.5%) | 115 (72.3%) |
| Total | 3,650 (2.5%) | 3,401 (9.2%) |
Race in San Mateo County
The most populous races in San Mateo County are White / Caucasian (327,625 | 43.4%), Asian (230,174 | 30.5%), and Hispanic or Latino (180,393 | 23.9%).
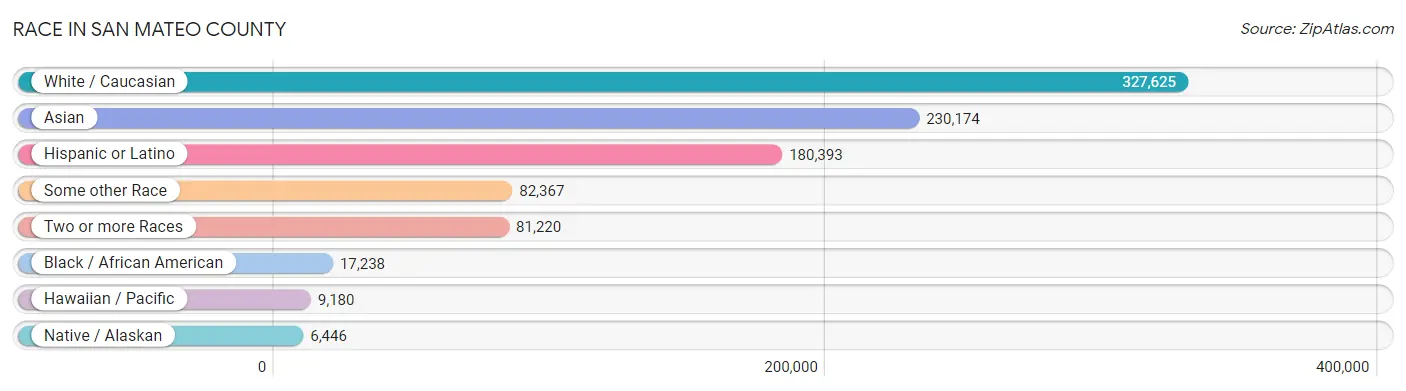
| Race | # Population | % Population |
| Asian | 230,174 | 30.5% |
| Black / African American | 17,238 | 2.3% |
| Hawaiian / Pacific | 9,180 | 1.2% |
| Hispanic or Latino | 180,393 | 23.9% |
| Native / Alaskan | 6,446 | 0.9% |
| White / Caucasian | 327,625 | 43.4% |
| Two or more Races | 81,220 | 10.8% |
| Some other Race | 82,367 | 10.9% |
| Total | 754,250 | 100.0% |
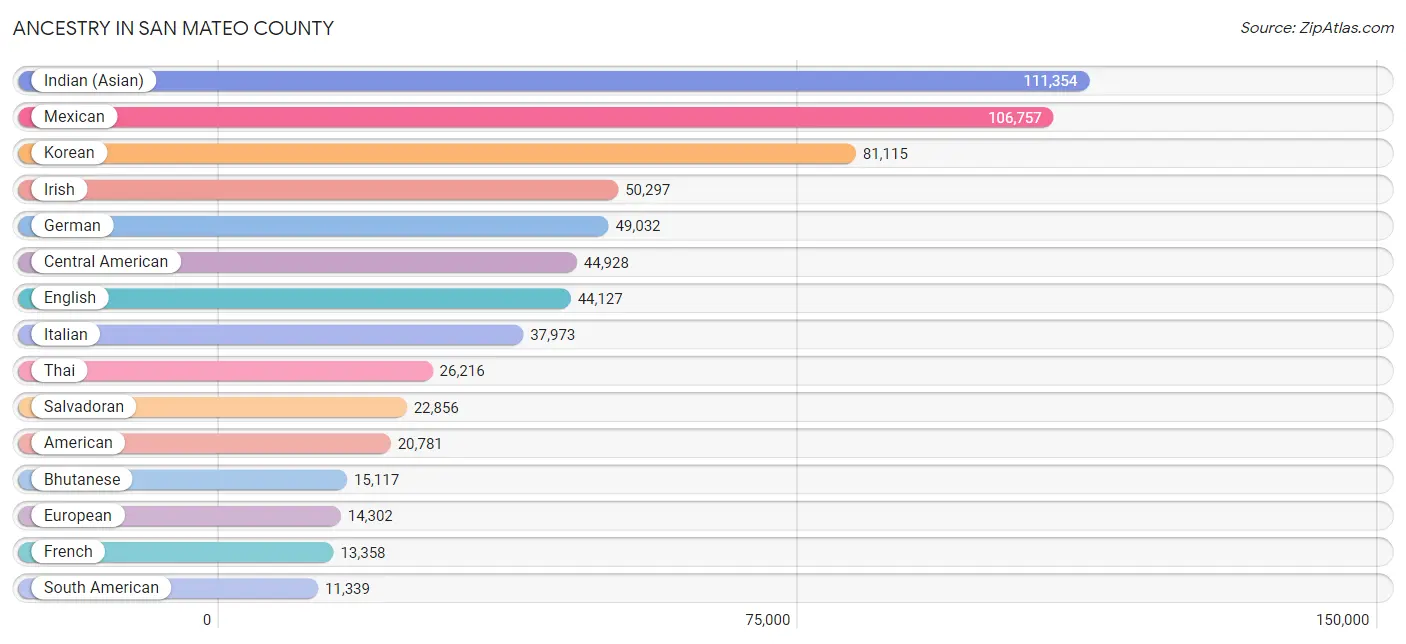
Ancestry in San Mateo County
The most populous ancestries reported in San Mateo County are Indian (Asian) (111,354 | 14.8%), Mexican (106,757 | 14.1%), Korean (81,115 | 10.7%), Irish (50,297 | 6.7%), and German (49,032 | 6.5%), together accounting for 52.8% of all San Mateo County residents.
| Ancestry | # Population | % Population |
| Afghan | 298 | 0.0% |
| African | 658 | 0.1% |
| Alaska Native | 19 | 0.0% |
| Alaskan Athabascan | 18 | 0.0% |
| Albanian | 13 | 0.0% |
| Alsatian | 36 | 0.0% |
| American | 20,781 | 2.8% |
| Apache | 531 | 0.1% |
| Arab | 9,411 | 1.3% |
| Argentinean | 1,058 | 0.1% |
| Armenian | 2,060 | 0.3% |
| Assyrian / Chaldean / Syriac | 222 | 0.0% |
| Australian | 387 | 0.1% |
| Austrian | 1,985 | 0.3% |
| Bahamian | 11 | 0.0% |
| Bangladeshi | 860 | 0.1% |
| Barbadian | 123 | 0.0% |
| Basque | 585 | 0.1% |
| Belgian | 693 | 0.1% |
| Belizean | 137 | 0.0% |
| Bhutanese | 15,117 | 2.0% |
| Blackfeet | 207 | 0.0% |
| Bolivian | 498 | 0.1% |
| Brazilian | 2,735 | 0.4% |
| British | 6,052 | 0.8% |
| British West Indian | 18 | 0.0% |
| Bulgarian | 515 | 0.1% |
| Burmese | 10,219 | 1.3% |
| Cajun | 22 | 0.0% |
| Cambodian | 301 | 0.0% |
| Canadian | 1,810 | 0.2% |
| Carpatho Rusyn | 23 | 0.0% |
| Celtic | 70 | 0.0% |
| Central American | 44,928 | 6.0% |
| Central American Indian | 2,125 | 0.3% |
| Cherokee | 1,019 | 0.1% |
| Chickasaw | 71 | 0.0% |
| Chilean | 1,106 | 0.2% |
| Chinese | 132 | 0.0% |
| Chippewa | 344 | 0.1% |
| Choctaw | 274 | 0.0% |
| Colombian | 2,142 | 0.3% |
| Colville | 8 | 0.0% |
| Comanche | 19 | 0.0% |
| Costa Rican | 431 | 0.1% |
| Cree | 14 | 0.0% |
| Creek | 74 | 0.0% |
| Croatian | 1,254 | 0.2% |
| Cuban | 1,810 | 0.2% |
| Czech | 2,329 | 0.3% |
| Czechoslovakian | 191 | 0.0% |
| Danish | 3,168 | 0.4% |
| Delaware | 10 | 0.0% |
| Dominican | 288 | 0.0% |
| Dutch | 5,688 | 0.7% |
| Eastern European | 3,412 | 0.4% |
| Ecuadorian | 742 | 0.1% |
| Egyptian | 1,150 | 0.2% |
| English | 44,127 | 5.9% |
| Estonian | 101 | 0.0% |
| Ethiopian | 253 | 0.0% |
| European | 14,302 | 1.9% |
| Filipino | 3,150 | 0.4% |
| Finnish | 1,065 | 0.1% |
| French | 13,358 | 1.8% |
| French American Indian | 42 | 0.0% |
| French Canadian | 1,630 | 0.2% |
| German | 49,032 | 6.5% |
| German Russian | 10 | 0.0% |
| Ghanaian | 138 | 0.0% |
| Greek | 5,834 | 0.8% |
| Guamanian / Chamorro | 844 | 0.1% |
| Guatemalan | 10,439 | 1.4% |
| Guyanese | 22 | 0.0% |
| Haitian | 107 | 0.0% |
| Honduran | 1,370 | 0.2% |
| Houma | 3 | 0.0% |
| Hungarian | 2,530 | 0.3% |
| Icelander | 107 | 0.0% |
| Indian (Asian) | 111,354 | 14.8% |
| Indonesian | 2,431 | 0.3% |
| Inupiat | 30 | 0.0% |
| Iranian | 5,474 | 0.7% |
| Iraqi | 543 | 0.1% |
| Irish | 50,297 | 6.7% |
| Iroquois | 41 | 0.0% |
| Israeli | 768 | 0.1% |
| Italian | 37,973 | 5.0% |
| Jamaican | 602 | 0.1% |
| Japanese | 1,135 | 0.2% |
| Jordanian | 722 | 0.1% |
| Kenyan | 85 | 0.0% |
| Kiowa | 5 | 0.0% |
| Korean | 81,115 | 10.7% |
| Laotian | 1,621 | 0.2% |
| Latvian | 313 | 0.0% |
| Lebanese | 1,715 | 0.2% |
| Lithuanian | 1,100 | 0.2% |
| Macedonian | 158 | 0.0% |
| Malaysian | 176 | 0.0% |
| Maltese | 1,082 | 0.1% |
| Mexican | 106,757 | 14.1% |
| Mexican American Indian | 3,328 | 0.4% |
| Mongolian | 323 | 0.0% |
| Moroccan | 95 | 0.0% |
| Native Hawaiian | 1,973 | 0.3% |
| Navajo | 234 | 0.0% |
| Nepalese | 102 | 0.0% |
| New Zealander | 157 | 0.0% |
| Nicaraguan | 8,863 | 1.2% |
| Nigerian | 710 | 0.1% |
| Northern European | 2,695 | 0.4% |
| Norwegian | 6,672 | 0.9% |
| Okinawan | 194 | 0.0% |
| Osage | 122 | 0.0% |
| Ottawa | 94 | 0.0% |
| Paiute | 46 | 0.0% |
| Pakistani | 1,841 | 0.2% |
| Palestinian | 1,653 | 0.2% |
| Panamanian | 670 | 0.1% |
| Paraguayan | 25 | 0.0% |
| Pennsylvania German | 199 | 0.0% |
| Peruvian | 5,153 | 0.7% |
| Polish | 9,510 | 1.3% |
| Portuguese | 5,915 | 0.8% |
| Pueblo | 126 | 0.0% |
| Puerto Rican | 3,508 | 0.5% |
| Romanian | 1,131 | 0.2% |
| Russian | 10,609 | 1.4% |
| Salvadoran | 22,856 | 3.0% |
| Samoan | 2,898 | 0.4% |
| Scandinavian | 1,878 | 0.3% |
| Scotch-Irish | 3,140 | 0.4% |
| Scottish | 9,013 | 1.2% |
| Seminole | 77 | 0.0% |
| Senegalese | 28 | 0.0% |
| Serbian | 491 | 0.1% |
| Shoshone | 1 | 0.0% |
| Sioux | 499 | 0.1% |
| Slavic | 347 | 0.1% |
| Slovak | 484 | 0.1% |
| Slovene | 289 | 0.0% |
| South African | 112 | 0.0% |
| South American | 11,339 | 1.5% |
| South American Indian | 279 | 0.0% |
| Soviet Union | 28 | 0.0% |
| Spaniard | 4,276 | 0.6% |
| Spanish | 2,344 | 0.3% |
| Spanish American | 106 | 0.0% |
| Spanish American Indian | 22 | 0.0% |
| Sri Lankan | 8,411 | 1.1% |
| Subsaharan African | 2,386 | 0.3% |
| Sudanese | 137 | 0.0% |
| Swedish | 6,504 | 0.9% |
| Swiss | 2,430 | 0.3% |
| Syrian | 603 | 0.1% |
| Taiwanese | 30 | 0.0% |
| Thai | 26,216 | 3.5% |
| Tlingit-Haida | 82 | 0.0% |
| Tohono O'Odham | 19 | 0.0% |
| Tongan | 4,948 | 0.7% |
| Trinidadian and Tobagonian | 70 | 0.0% |
| Turkish | 1,272 | 0.2% |
| Ukrainian | 3,860 | 0.5% |
| Uruguayan | 111 | 0.0% |
| Ute | 36 | 0.0% |
| Venezuelan | 448 | 0.1% |
| Vietnamese | 217 | 0.0% |
| Welsh | 2,662 | 0.4% |
| West Indian | 278 | 0.0% |
| Yaqui | 151 | 0.0% |
| Yugoslavian | 277 | 0.0% |
| Yuman | 15 | 0.0% |
| Zimbabwean | 15 | 0.0% | View All 174 Rows |
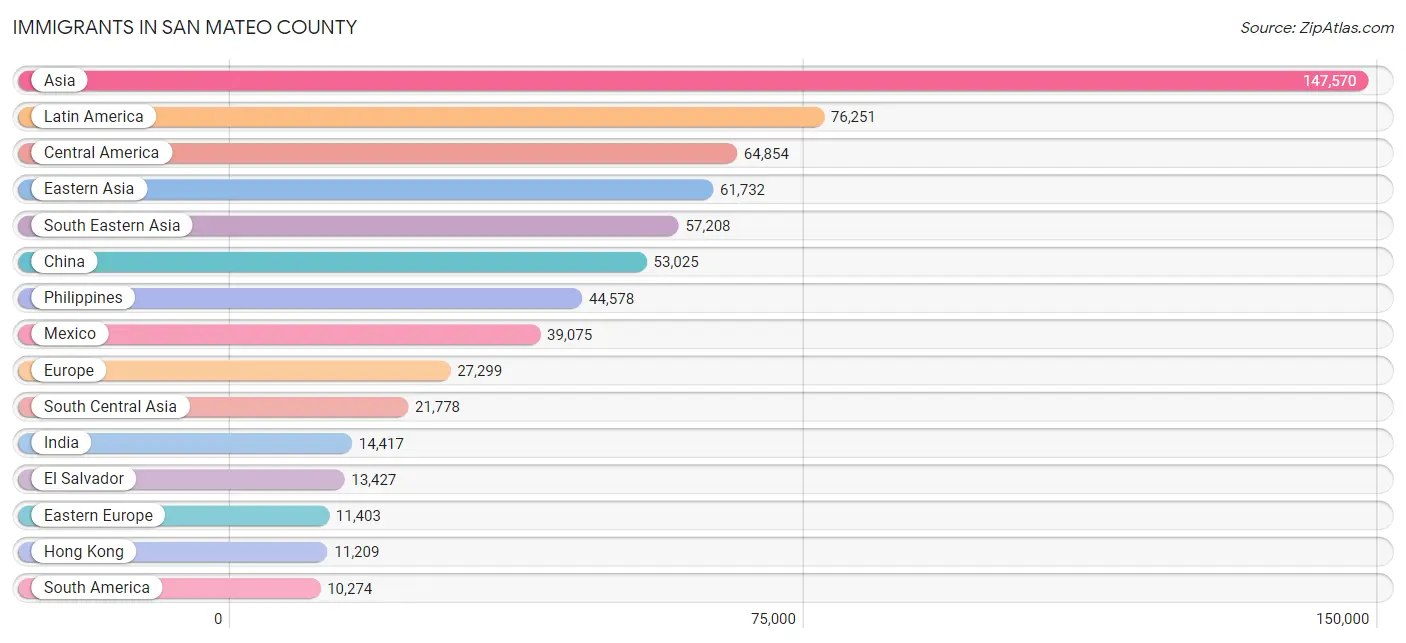
Immigrants in San Mateo County
The most numerous immigrant groups reported in San Mateo County came from Asia (147,570 | 19.6%), Latin America (76,251 | 10.1%), Central America (64,854 | 8.6%), Eastern Asia (61,732 | 8.2%), and South Eastern Asia (57,208 | 7.6%), together accounting for 54.0% of all San Mateo County residents.
| Immigration Origin | # Population | % Population |
| Afghanistan | 268 | 0.0% |
| Africa | 3,480 | 0.5% |
| Albania | 195 | 0.0% |
| Argentina | 777 | 0.1% |
| Armenia | 35 | 0.0% |
| Asia | 147,570 | 19.6% |
| Australia | 889 | 0.1% |
| Austria | 220 | 0.0% |
| Azores | 47 | 0.0% |
| Bahamas | 19 | 0.0% |
| Bangladesh | 315 | 0.0% |
| Barbados | 34 | 0.0% |
| Belarus | 729 | 0.1% |
| Belgium | 257 | 0.0% |
| Belize | 45 | 0.0% |
| Bolivia | 268 | 0.0% |
| Bosnia and Herzegovina | 56 | 0.0% |
| Brazil | 3,398 | 0.4% |
| Bulgaria | 668 | 0.1% |
| Cambodia | 441 | 0.1% |
| Canada | 4,332 | 0.6% |
| Caribbean | 1,123 | 0.2% |
| Central America | 64,854 | 8.6% |
| Chile | 547 | 0.1% |
| China | 53,025 | 7.0% |
| Colombia | 990 | 0.1% |
| Costa Rica | 299 | 0.0% |
| Croatia | 186 | 0.0% |
| Cuba | 382 | 0.1% |
| Czechoslovakia | 190 | 0.0% |
| Denmark | 310 | 0.0% |
| Dominican Republic | 188 | 0.0% |
| Eastern Africa | 615 | 0.1% |
| Eastern Asia | 61,732 | 8.2% |
| Eastern Europe | 11,403 | 1.5% |
| Ecuador | 350 | 0.1% |
| Egypt | 878 | 0.1% |
| El Salvador | 13,427 | 1.8% |
| England | 1,571 | 0.2% |
| Eritrea | 20 | 0.0% |
| Ethiopia | 157 | 0.0% |
| Europe | 27,299 | 3.6% |
| Fiji | 2,144 | 0.3% |
| France | 1,632 | 0.2% |
| Germany | 2,391 | 0.3% |
| Ghana | 155 | 0.0% |
| Greece | 651 | 0.1% |
| Guatemala | 6,258 | 0.8% |
| Guyana | 32 | 0.0% |
| Haiti | 4 | 0.0% |
| Honduras | 1,113 | 0.2% |
| Hong Kong | 11,209 | 1.5% |
| Hungary | 517 | 0.1% |
| India | 14,417 | 1.9% |
| Indonesia | 1,041 | 0.1% |
| Iran | 4,074 | 0.5% |
| Iraq | 467 | 0.1% |
| Ireland | 967 | 0.1% |
| Israel | 1,164 | 0.2% |
| Italy | 1,807 | 0.2% |
| Jamaica | 424 | 0.1% |
| Japan | 3,816 | 0.5% |
| Jordan | 742 | 0.1% |
| Kazakhstan | 324 | 0.0% |
| Kenya | 109 | 0.0% |
| Korea | 4,679 | 0.6% |
| Kuwait | 207 | 0.0% |
| Laos | 146 | 0.0% |
| Latin America | 76,251 | 10.1% |
| Latvia | 111 | 0.0% |
| Lebanon | 808 | 0.1% |
| Liberia | 132 | 0.0% |
| Lithuania | 65 | 0.0% |
| Malaysia | 713 | 0.1% |
| Mexico | 39,075 | 5.2% |
| Micronesia | 30 | 0.0% |
| Middle Africa | 40 | 0.0% |
| Moldova | 87 | 0.0% |
| Morocco | 173 | 0.0% |
| Nepal | 955 | 0.1% |
| Netherlands | 483 | 0.1% |
| Nicaragua | 4,443 | 0.6% |
| Nigeria | 172 | 0.0% |
| North Macedonia | 15 | 0.0% |
| Northern Africa | 1,785 | 0.2% |
| Northern Europe | 6,521 | 0.9% |
| Norway | 25 | 0.0% |
| Oceania | 6,257 | 0.8% |
| Pakistan | 914 | 0.1% |
| Panama | 160 | 0.0% |
| Peru | 3,270 | 0.4% |
| Philippines | 44,578 | 5.9% |
| Poland | 877 | 0.1% |
| Portugal | 553 | 0.1% |
| Romania | 532 | 0.1% |
| Russia | 3,012 | 0.4% |
| Saudi Arabia | 405 | 0.1% |
| Scotland | 161 | 0.0% |
| Senegal | 72 | 0.0% |
| Serbia | 320 | 0.0% |
| Singapore | 838 | 0.1% |
| South Africa | 376 | 0.1% |
| South America | 10,274 | 1.4% |
| South Central Asia | 21,778 | 2.9% |
| South Eastern Asia | 57,208 | 7.6% |
| Southern Europe | 3,887 | 0.5% |
| Spain | 582 | 0.1% |
| Sri Lanka | 189 | 0.0% |
| St. Vincent and the Grenadines | 7 | 0.0% |
| Sudan | 78 | 0.0% |
| Sweden | 689 | 0.1% |
| Switzerland | 418 | 0.1% |
| Syria | 188 | 0.0% |
| Taiwan | 5,644 | 0.7% |
| Thailand | 1,231 | 0.2% |
| Trinidad and Tobago | 54 | 0.0% |
| Turkey | 1,227 | 0.2% |
| Ukraine | 2,703 | 0.4% |
| Uruguay | 154 | 0.0% |
| Uzbekistan | 244 | 0.0% |
| Venezuela | 294 | 0.0% |
| Vietnam | 4,548 | 0.6% |
| Western Africa | 664 | 0.1% |
| Western Asia | 6,357 | 0.8% |
| Western Europe | 5,426 | 0.7% |
| Yemen | 615 | 0.1% |
| Zaire | 17 | 0.0% |
| Zimbabwe | 97 | 0.0% | View All 128 Rows |
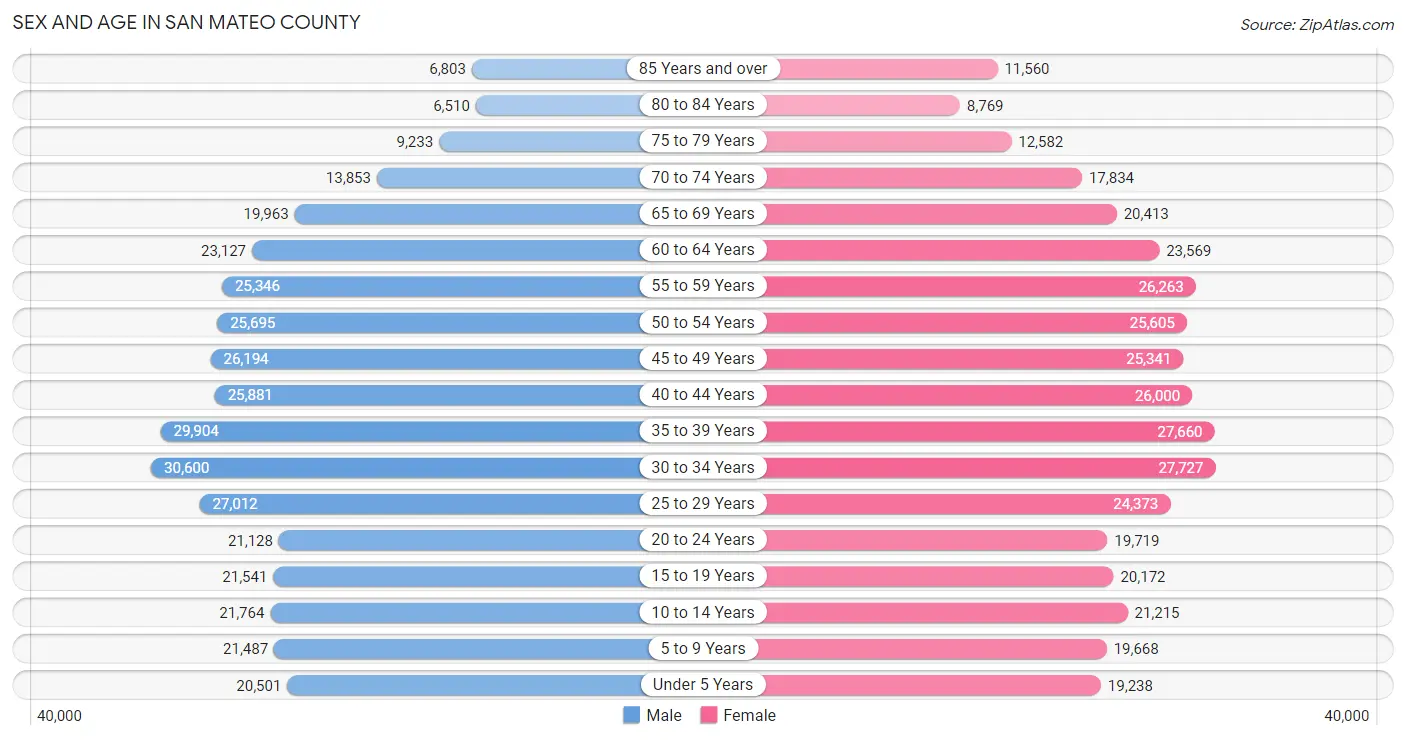
Sex and Age in San Mateo County
Sex and Age in San Mateo County
The most populous age groups in San Mateo County are 30 to 34 Years (30,600 | 8.1%) for men and 30 to 34 Years (27,727 | 7.3%) for women.
| Age Bracket | Male | Female |
| Under 5 Years | 20,501 (5.4%) | 19,238 (5.1%) |
| 5 to 9 Years | 21,487 (5.7%) | 19,668 (5.2%) |
| 10 to 14 Years | 21,764 (5.8%) | 21,215 (5.6%) |
| 15 to 19 Years | 21,541 (5.7%) | 20,172 (5.3%) |
| 20 to 24 Years | 21,128 (5.6%) | 19,719 (5.2%) |
| 25 to 29 Years | 27,012 (7.2%) | 24,373 (6.5%) |
| 30 to 34 Years | 30,600 (8.1%) | 27,727 (7.3%) |
| 35 to 39 Years | 29,904 (7.9%) | 27,660 (7.3%) |
| 40 to 44 Years | 25,881 (6.9%) | 26,000 (6.9%) |
| 45 to 49 Years | 26,194 (7.0%) | 25,341 (6.7%) |
| 50 to 54 Years | 25,695 (6.8%) | 25,605 (6.8%) |
| 55 to 59 Years | 25,346 (6.7%) | 26,263 (7.0%) |
| 60 to 64 Years | 23,127 (6.1%) | 23,569 (6.2%) |
| 65 to 69 Years | 19,963 (5.3%) | 20,413 (5.4%) |
| 70 to 74 Years | 13,853 (3.7%) | 17,834 (4.7%) |
| 75 to 79 Years | 9,233 (2.5%) | 12,582 (3.3%) |
| 80 to 84 Years | 6,510 (1.7%) | 8,769 (2.3%) |
| 85 Years and over | 6,803 (1.8%) | 11,560 (3.1%) |
| Total | 376,542 (100.0%) | 377,708 (100.0%) |
Families and Households in San Mateo County
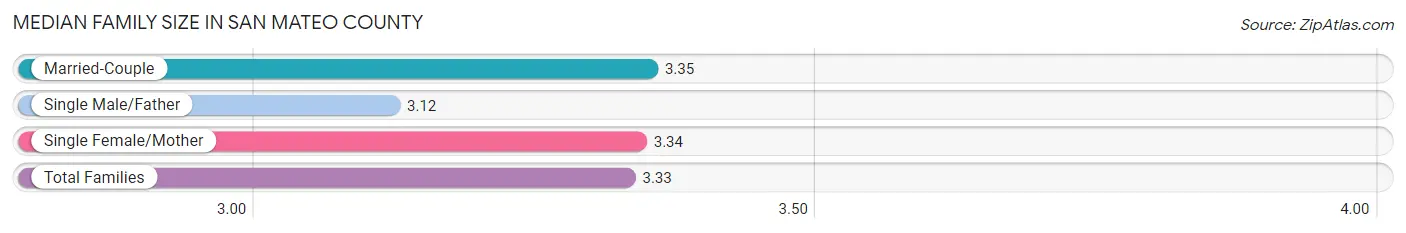
Median Family Size in San Mateo County
The median family size in San Mateo County is 3.33 persons per family, with married-couple families (145,150 | 79.7%) accounting for the largest median family size of 3.35 persons per family. On the other hand, single male/father families (11,939 | 6.6%) represent the smallest median family size with 3.12 persons per family.
| Family Type | # Families | Family Size |
| Married-Couple | 145,150 (79.7%) | 3.35 |
| Single Male/Father | 11,939 (6.6%) | 3.12 |
| Single Female/Mother | 25,107 (13.8%) | 3.34 |
| Total Families | 182,196 (100.0%) | 3.33 |
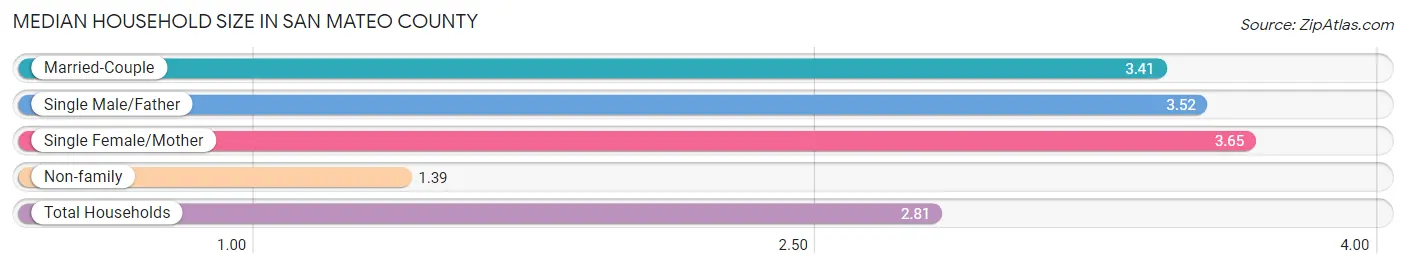
Median Household Size in San Mateo County
The median household size in San Mateo County is 2.81 persons per household, with single female/mother households (25,107 | 9.5%) accounting for the largest median household size of 3.65 persons per household. non-family households (82,127 | 31.1%) represent the smallest median household size with 1.39 persons per household.
| Household Type | # Households | Household Size |
| Married-Couple | 145,150 (54.9%) | 3.41 |
| Single Male/Father | 11,939 (4.5%) | 3.52 |
| Single Female/Mother | 25,107 (9.5%) | 3.65 |
| Non-family | 82,127 (31.1%) | 1.39 |
| Total Households | 264,323 (100.0%) | 2.81 |
Household Size by Marriage Status in San Mateo County
Out of a total of 264,323 households in San Mateo County, 182,196 (68.9%) are family households, while 82,127 (31.1%) are nonfamily households. The most numerous type of family households are 2-person households, comprising 68,636, and the most common type of nonfamily households are 1-person households, comprising 61,291.
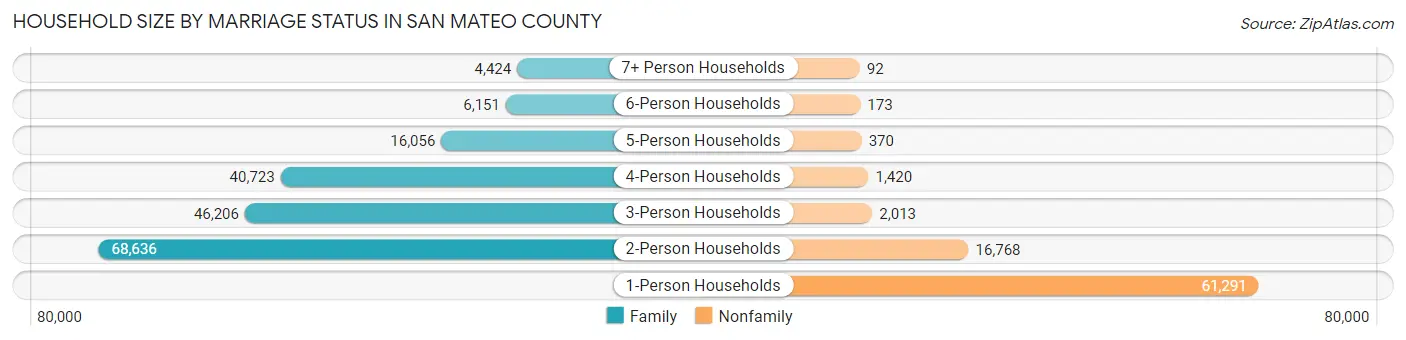
| Household Size | Family Households | Nonfamily Households |
| 1-Person Households | - | 61,291 (23.2%) |
| 2-Person Households | 68,636 (26.0%) | 16,768 (6.3%) |
| 3-Person Households | 46,206 (17.5%) | 2,013 (0.8%) |
| 4-Person Households | 40,723 (15.4%) | 1,420 (0.5%) |
| 5-Person Households | 16,056 (6.1%) | 370 (0.1%) |
| 6-Person Households | 6,151 (2.3%) | 173 (0.1%) |
| 7+ Person Households | 4,424 (1.7%) | 92 (0.0%) |
| Total | 182,196 (68.9%) | 82,127 (31.1%) |
Female Fertility in San Mateo County
Fertility by Age in San Mateo County
Average fertility rate in San Mateo County is 50.0 births per 1,000 women. Women in the age bracket of 20 to 34 years have the highest fertility rate with 62.0 births per 1,000 women. Women in the age bracket of 20 to 34 years acount for 51.0% of all women with births.
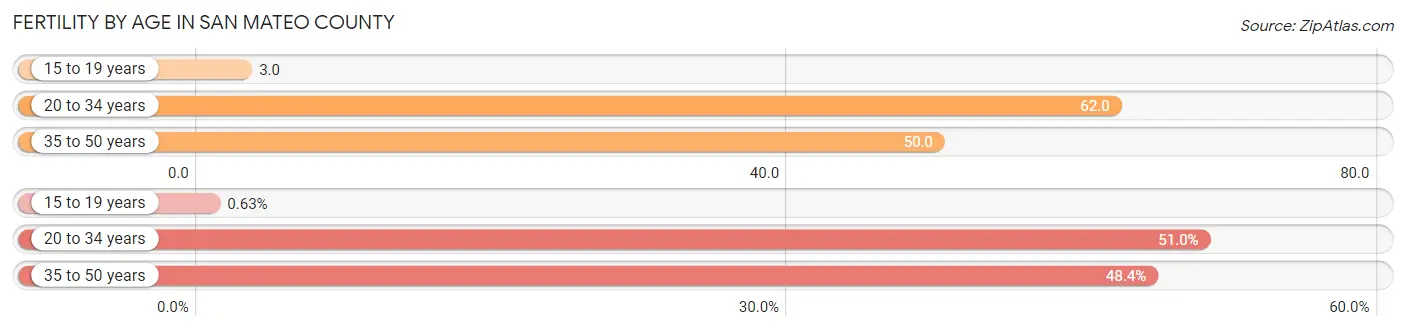
| Age Bracket | Women with Births | Births / 1,000 Women |
| 15 to 19 years | 55 (0.6%) | 3.0 |
| 20 to 34 years | 4,485 (51.0%) | 62.0 |
| 35 to 50 years | 4,251 (48.4%) | 50.0 |
| Total | 8,791 (100.0%) | 50.0 |
Fertility by Age by Marriage Status in San Mateo County
84.9% of women with births (8,791) in San Mateo County are married. The highest percentage of unmarried women with births falls into 15 to 19 years age bracket with 100.0% of them unmarried at the time of birth, while the lowest percentage of unmarried women with births belong to 35 to 50 years age bracket with 13.0% of them unmarried.
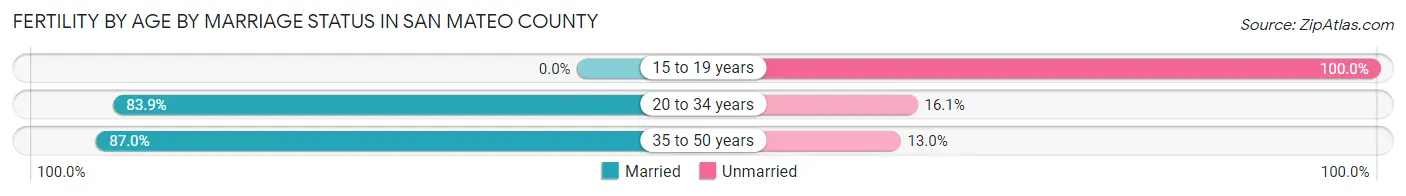
| Age Bracket | Married | Unmarried |
| 15 to 19 years | 0 (0.0%) | 55 (100.0%) |
| 20 to 34 years | 3,763 (83.9%) | 722 (16.1%) |
| 35 to 50 years | 3,698 (87.0%) | 553 (13.0%) |
| Total | 7,464 (84.9%) | 1,327 (15.1%) |
Fertility by Education in San Mateo County
Average fertility rate in San Mateo County is 50.0 births per 1,000 women. Women with the education attainment of graduate degree have the highest fertility rate of 76.0 births per 1,000 women, while women with the education attainment of less than high school have the lowest fertility at 20.0 births per 1,000 women. Women with the education attainment of graduate degree represent 35.8% of all women with births.
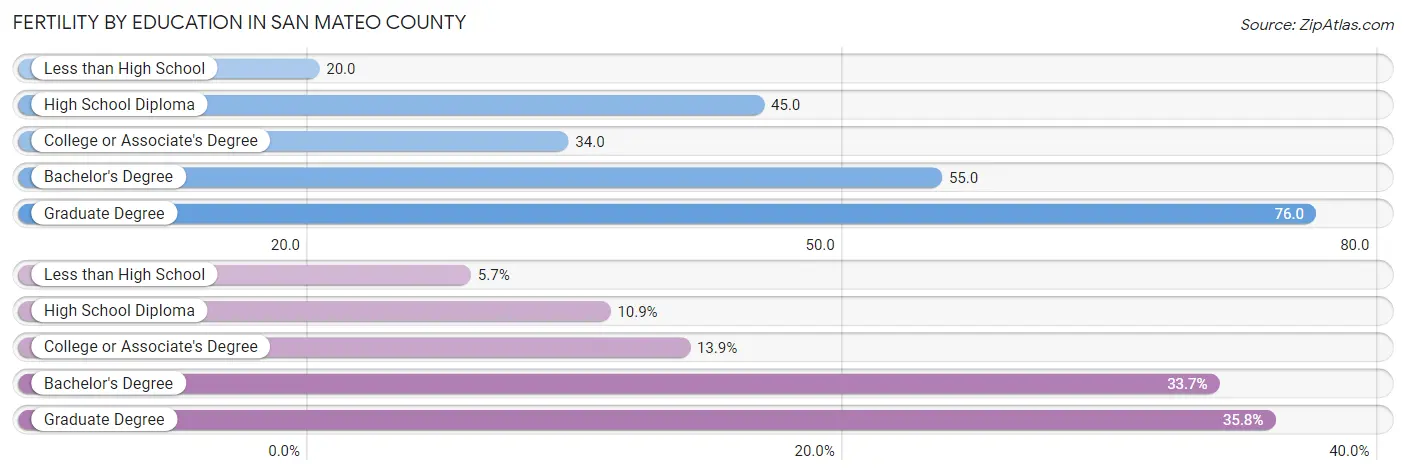
| Educational Attainment | Women with Births | Births / 1,000 Women |
| Less than High School | 499 (5.7%) | 20.0 |
| High School Diploma | 959 (10.9%) | 45.0 |
| College or Associate's Degree | 1,221 (13.9%) | 34.0 |
| Bachelor's Degree | 2,964 (33.7%) | 55.0 |
| Graduate Degree | 3,148 (35.8%) | 76.0 |
| Total | 8,791 (100.0%) | 50.0 |
Fertility by Education by Marriage Status in San Mateo County
15.1% of women with births in San Mateo County are unmarried. Women with the educational attainment of graduate degree are most likely to be married with 94.3% of them married at childbirth, while women with the educational attainment of college or associate's degree are least likely to be married with 35.7% of them unmarried at childbirth.
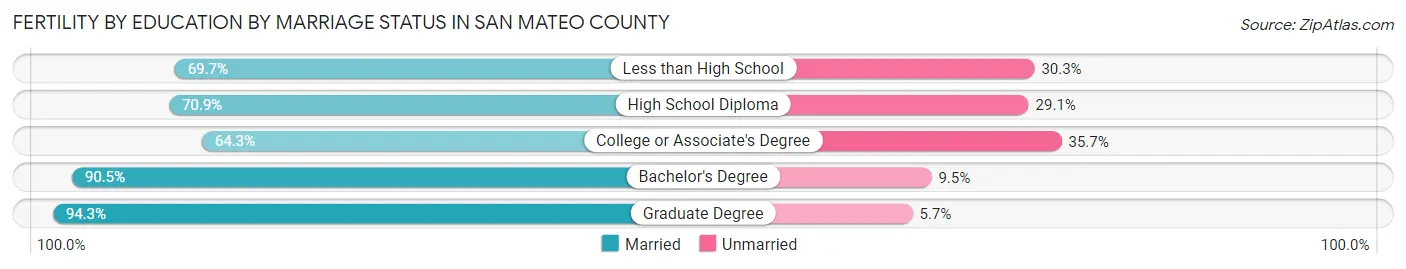
| Educational Attainment | Married | Unmarried |
| Less than High School | 348 (69.7%) | 151 (30.3%) |
| High School Diploma | 680 (70.9%) | 279 (29.1%) |
| College or Associate's Degree | 785 (64.3%) | 436 (35.7%) |
| Bachelor's Degree | 2,682 (90.5%) | 282 (9.5%) |
| Graduate Degree | 2,969 (94.3%) | 179 (5.7%) |
| Total | 7,464 (84.9%) | 1,327 (15.1%) |
Employment Characteristics in San Mateo County
Employment by Class of Employer in San Mateo County
Among the 393,729 employed individuals in San Mateo County, private company employees (275,958 | 70.1%), not-for-profit organizations (33,095 | 8.4%), and local government employees (27,040 | 6.9%) make up the most common classes of employment.
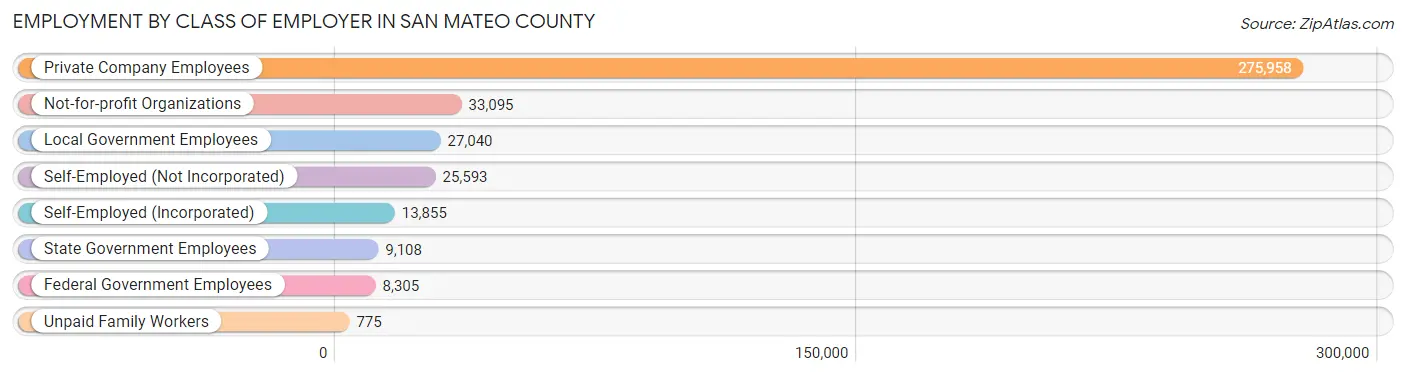
| Employer Class | # Employees | % Employees |
| Private Company Employees | 275,958 | 70.1% |
| Self-Employed (Incorporated) | 13,855 | 3.5% |
| Self-Employed (Not Incorporated) | 25,593 | 6.5% |
| Not-for-profit Organizations | 33,095 | 8.4% |
| Local Government Employees | 27,040 | 6.9% |
| State Government Employees | 9,108 | 2.3% |
| Federal Government Employees | 8,305 | 2.1% |
| Unpaid Family Workers | 775 | 0.2% |
| Total | 393,729 | 100.0% |
Employment Status by Age in San Mateo County
According to the labor force statistics for San Mateo County, out of the total population over 16 years of age (622,496), 67.8% or 422,052 individuals are in the labor force, with 4.5% or 18,992 of them unemployed. The age group with the highest labor force participation rate is 30 to 34 years, with 88.2% or 51,444 individuals in the labor force. Within the labor force, the 16 to 19 years age range has the highest percentage of unemployed individuals, with 13.1% or 1,276 of them being unemployed.
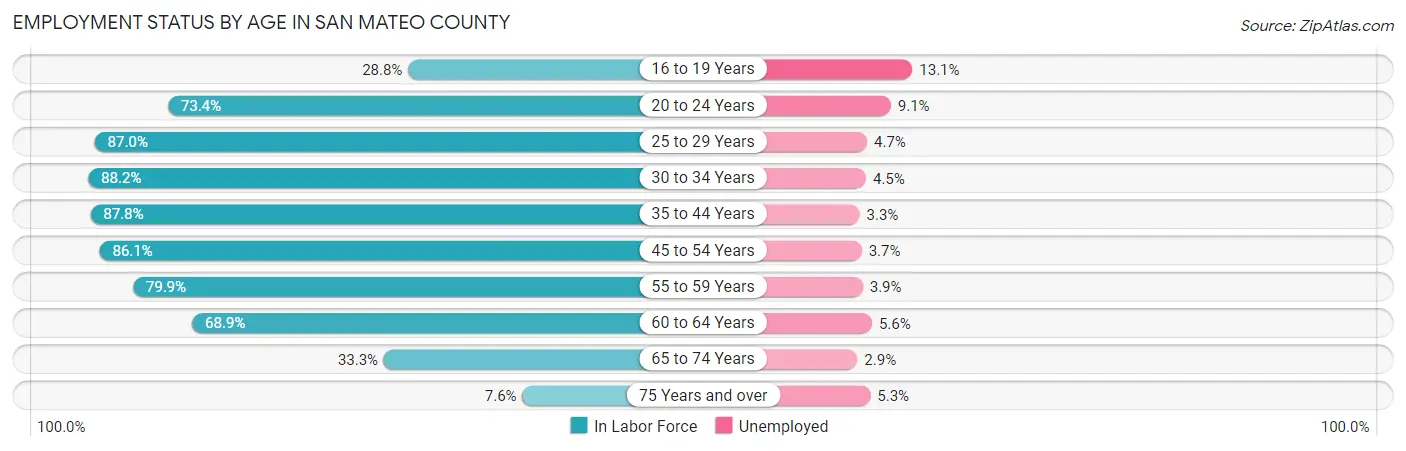
| Age Bracket | In Labor Force | Unemployed |
| 16 to 19 Years | 9,744 (28.8%) | 1,276 (13.1%) |
| 20 to 24 Years | 29,982 (73.4%) | 2,728 (9.1%) |
| 25 to 29 Years | 44,705 (87.0%) | 2,101 (4.7%) |
| 30 to 34 Years | 51,444 (88.2%) | 2,315 (4.5%) |
| 35 to 44 Years | 96,093 (87.8%) | 3,171 (3.3%) |
| 45 to 54 Years | 88,541 (86.1%) | 3,276 (3.7%) |
| 55 to 59 Years | 41,236 (79.9%) | 1,608 (3.9%) |
| 60 to 64 Years | 32,174 (68.9%) | 1,802 (5.6%) |
| 65 to 74 Years | 23,997 (33.3%) | 696 (2.9%) |
| 75 Years and over | 4,215 (7.6%) | 223 (5.3%) |
| Total | 422,052 (67.8%) | 18,992 (4.5%) |
Employment Status by Educational Attainment in San Mateo County
According to labor force statistics for San Mateo County, 84.3% of individuals (354,310) out of the total population between 25 and 64 years of age (420,297) are in the labor force, with 4.0% or 14,172 of them being unemployed. The group with the highest labor force participation rate are those with the educational attainment of bachelor's degree or higher, with 88.2% or 207,098 individuals in the labor force. Within the labor force, individuals with high school diploma education have the highest percentage of unemployment, with 6.2% or 2,893 of them being unemployed.
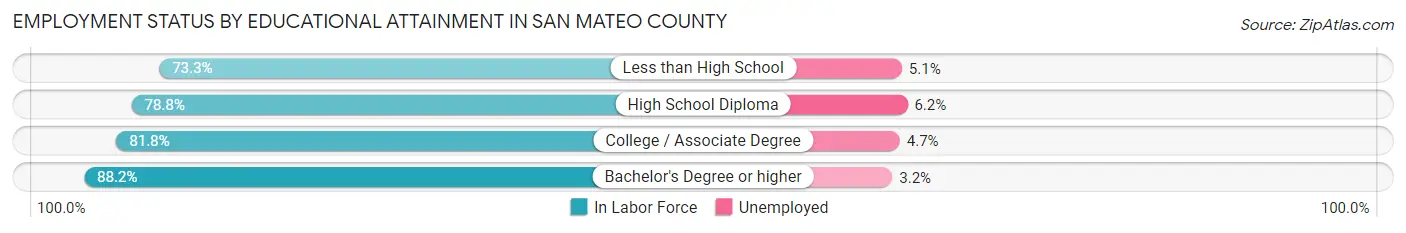
| Educational Attainment | In Labor Force | Unemployed |
| Less than High School | 25,799 (73.3%) | 1,795 (5.1%) |
| High School Diploma | 46,665 (78.8%) | 3,672 (6.2%) |
| College / Associate Degree | 74,501 (81.8%) | 4,281 (4.7%) |
| Bachelor's Degree or higher | 207,098 (88.2%) | 7,514 (3.2%) |
| Total | 354,310 (84.3%) | 16,812 (4.0%) |
Employment Occupations by Sex in San Mateo County
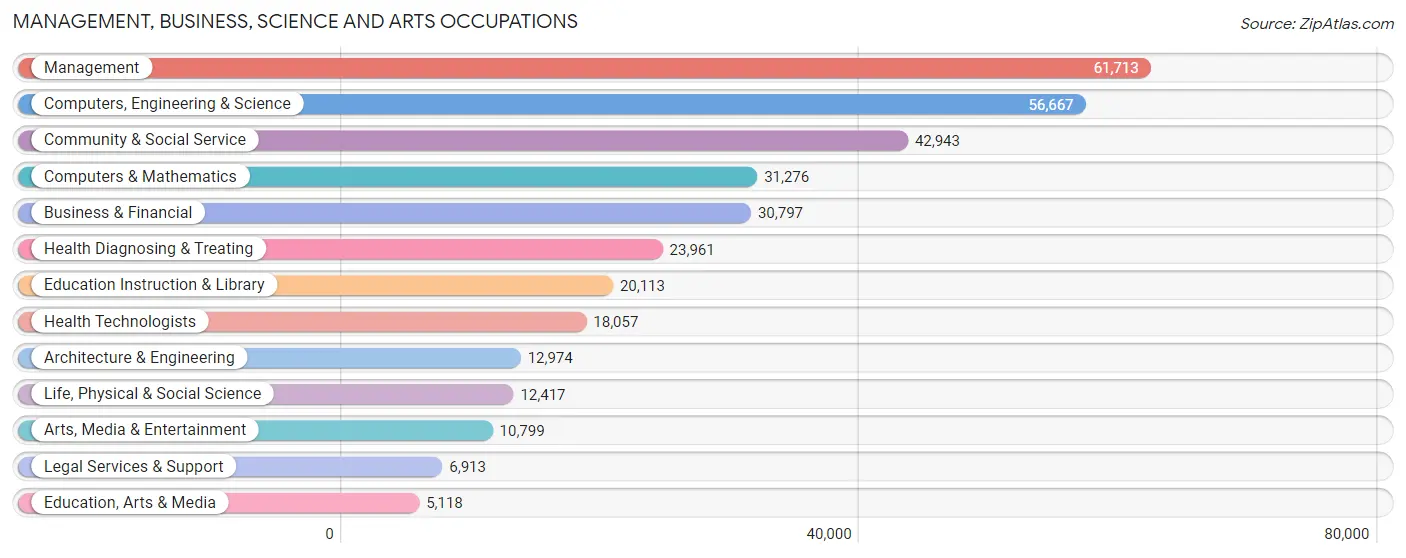
Management, Business, Science and Arts Occupations
The most common Management, Business, Science and Arts occupations in San Mateo County are Management (61,713 | 15.3%), Computers, Engineering & Science (56,667 | 14.1%), Community & Social Service (42,943 | 10.7%), Computers & Mathematics (31,276 | 7.8%), and Business & Financial (30,797 | 7.6%).
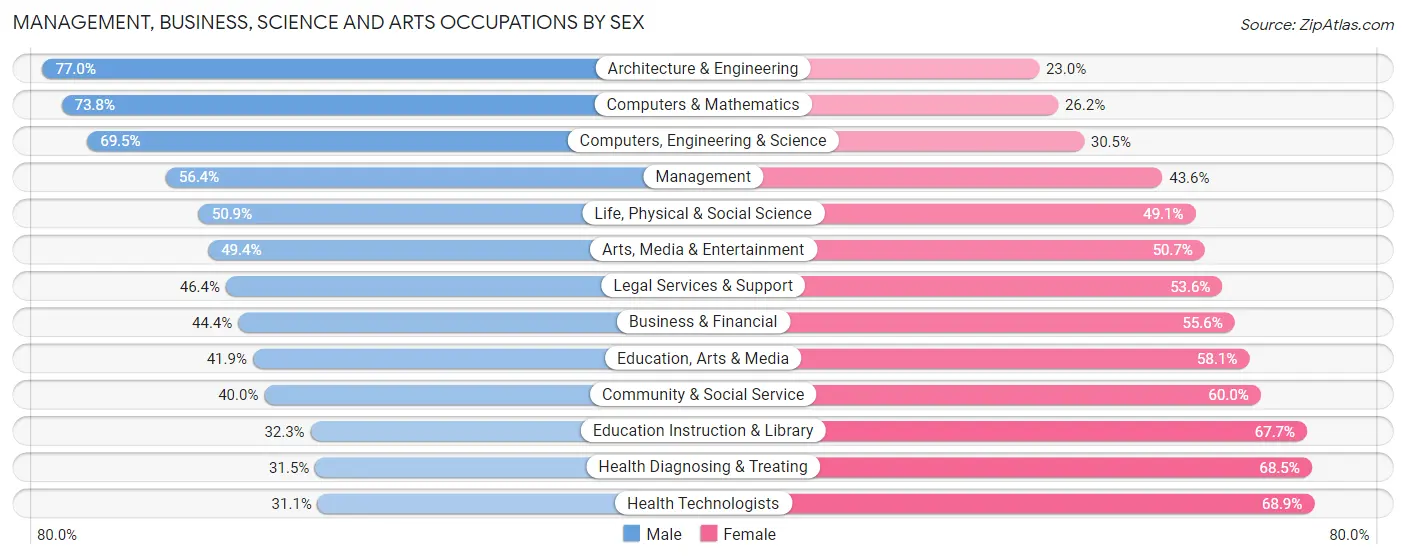
Management, Business, Science and Arts Occupations by Sex
Within the Management, Business, Science and Arts occupations in San Mateo County, the most male-oriented occupations are Architecture & Engineering (77.0%), Computers & Mathematics (73.8%), and Computers, Engineering & Science (69.5%), while the most female-oriented occupations are Health Technologists (68.9%), Health Diagnosing & Treating (68.5%), and Education Instruction & Library (67.7%).
| Occupation | Male | Female |
| Management | 34,821 (56.4%) | 26,892 (43.6%) |
| Business & Financial | 13,665 (44.4%) | 17,132 (55.6%) |
| Computers, Engineering & Science | 39,402 (69.5%) | 17,265 (30.5%) |
| Computers & Mathematics | 23,091 (73.8%) | 8,185 (26.2%) |
| Architecture & Engineering | 9,990 (77.0%) | 2,984 (23.0%) |
| Life, Physical & Social Science | 6,321 (50.9%) | 6,096 (49.1%) |
| Community & Social Service | 17,181 (40.0%) | 25,762 (60.0%) |
| Education, Arts & Media | 2,146 (41.9%) | 2,972 (58.1%) |
| Legal Services & Support | 3,210 (46.4%) | 3,703 (53.6%) |
| Education Instruction & Library | 6,496 (32.3%) | 13,617 (67.7%) |
| Arts, Media & Entertainment | 5,329 (49.3%) | 5,470 (50.6%) |
| Health Diagnosing & Treating | 7,551 (31.5%) | 16,410 (68.5%) |
| Health Technologists | 5,614 (31.1%) | 12,443 (68.9%) |
| Total (Category) | 112,620 (52.1%) | 103,461 (47.9%) |
| Total (Overall) | 217,101 (53.9%) | 185,366 (46.1%) |
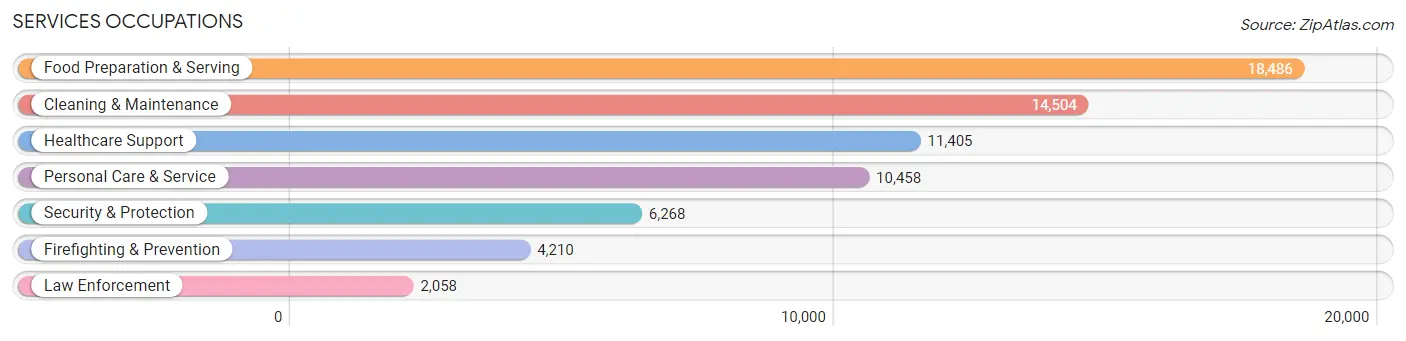
Services Occupations
The most common Services occupations in San Mateo County are Food Preparation & Serving (18,486 | 4.6%), Cleaning & Maintenance (14,504 | 3.6%), Healthcare Support (11,405 | 2.8%), Personal Care & Service (10,458 | 2.6%), and Security & Protection (6,268 | 1.6%).
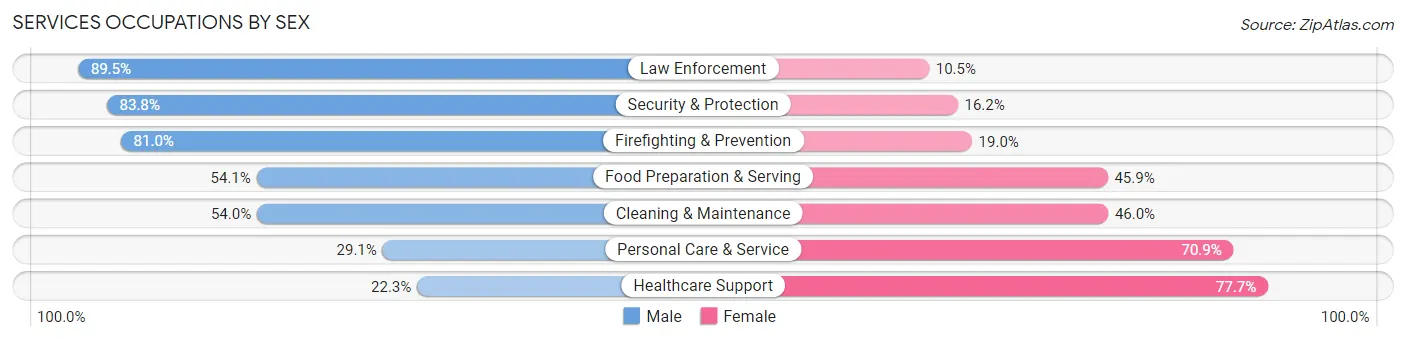
Services Occupations by Sex
Within the Services occupations in San Mateo County, the most male-oriented occupations are Law Enforcement (89.5%), Security & Protection (83.8%), and Firefighting & Prevention (81.0%), while the most female-oriented occupations are Healthcare Support (77.7%), Personal Care & Service (70.9%), and Cleaning & Maintenance (46.0%).
| Occupation | Male | Female |
| Healthcare Support | 2,541 (22.3%) | 8,864 (77.7%) |
| Security & Protection | 5,250 (83.8%) | 1,018 (16.2%) |
| Firefighting & Prevention | 3,409 (81.0%) | 801 (19.0%) |
| Law Enforcement | 1,841 (89.5%) | 217 (10.5%) |
| Food Preparation & Serving | 9,996 (54.1%) | 8,490 (45.9%) |
| Cleaning & Maintenance | 7,829 (54.0%) | 6,675 (46.0%) |
| Personal Care & Service | 3,044 (29.1%) | 7,414 (70.9%) |
| Total (Category) | 28,660 (46.9%) | 32,461 (53.1%) |
| Total (Overall) | 217,101 (53.9%) | 185,366 (46.1%) |
Sales and Office Occupations
The most common Sales and Office occupations in San Mateo County are Office & Administration (37,391 | 9.3%), and Sales & Related (32,057 | 8.0%).
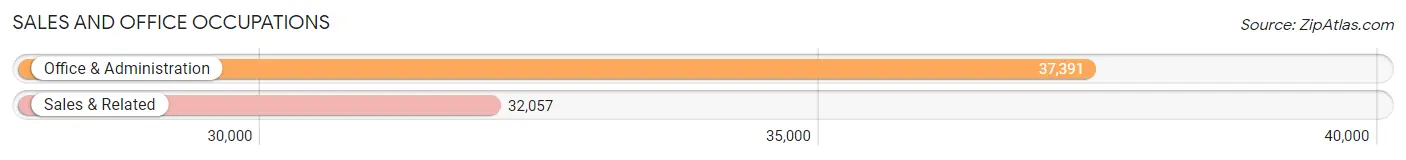
Sales and Office Occupations by Sex
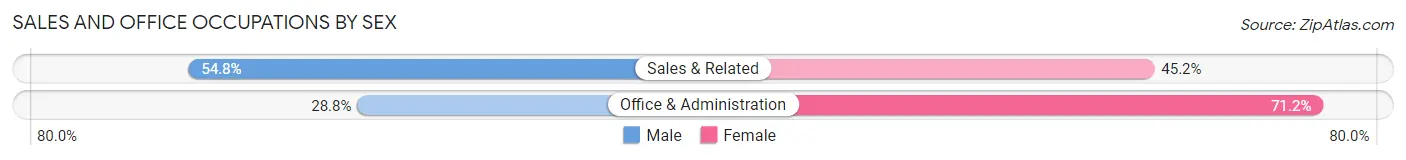
| Occupation | Male | Female |
| Sales & Related | 17,567 (54.8%) | 14,490 (45.2%) |
| Office & Administration | 10,777 (28.8%) | 26,614 (71.2%) |
| Total (Category) | 28,344 (40.8%) | 41,104 (59.2%) |
| Total (Overall) | 217,101 (53.9%) | 185,366 (46.1%) |
Natural Resources, Construction and Maintenance Occupations
The most common Natural Resources, Construction and Maintenance occupations in San Mateo County are Construction & Extraction (15,123 | 3.8%), Installation, Maintenance & Repair (7,029 | 1.8%), and Farming, Fishing & Forestry (1,778 | 0.4%).
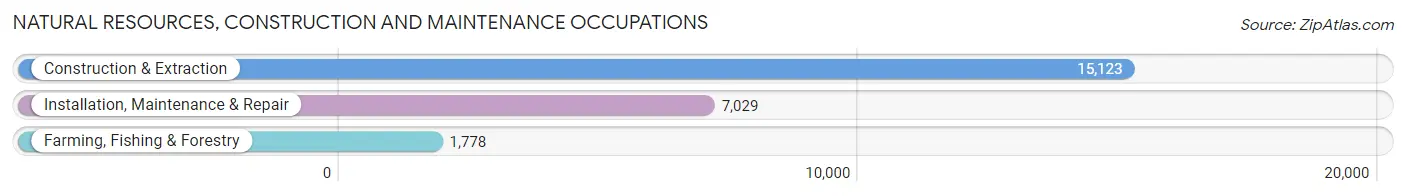
Natural Resources, Construction and Maintenance Occupations by Sex
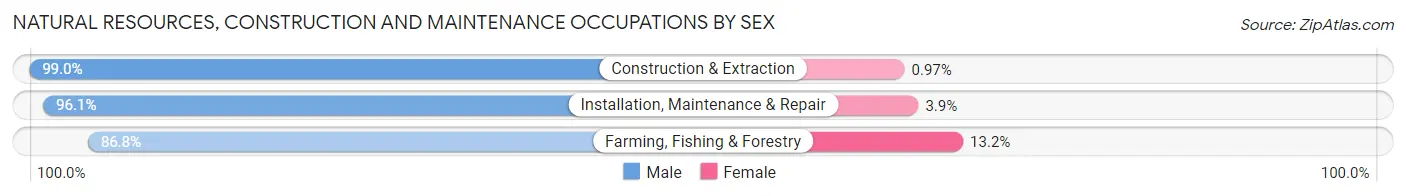
| Occupation | Male | Female |
| Farming, Fishing & Forestry | 1,544 (86.8%) | 234 (13.2%) |
| Construction & Extraction | 14,976 (99.0%) | 147 (1.0%) |
| Installation, Maintenance & Repair | 6,758 (96.1%) | 271 (3.9%) |
| Total (Category) | 23,278 (97.3%) | 652 (2.7%) |
| Total (Overall) | 217,101 (53.9%) | 185,366 (46.1%) |
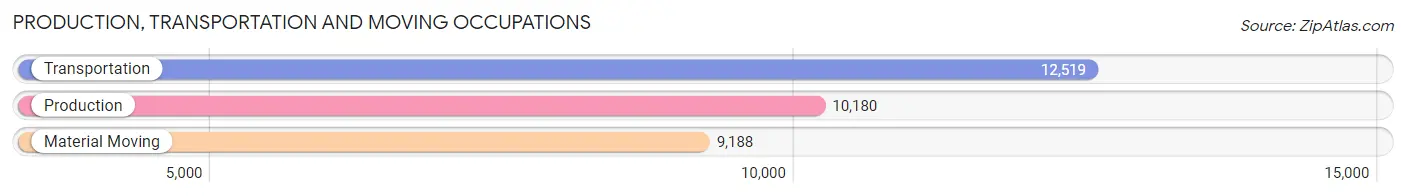
Production, Transportation and Moving Occupations
The most common Production, Transportation and Moving occupations in San Mateo County are Transportation (12,519 | 3.1%), Production (10,180 | 2.5%), and Material Moving (9,188 | 2.3%).
Production, Transportation and Moving Occupations by Sex
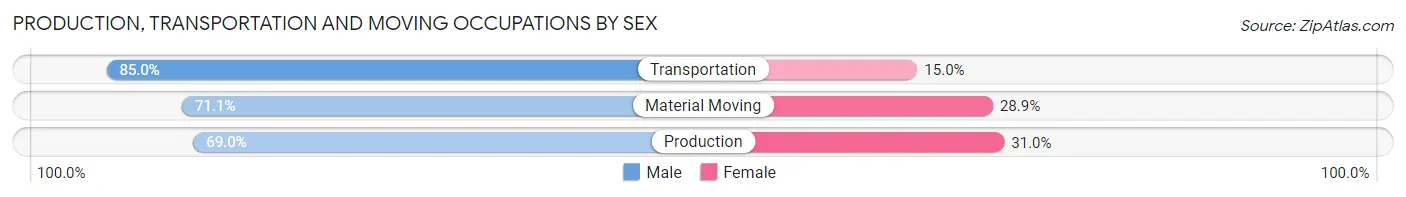
| Occupation | Male | Female |
| Production | 7,026 (69.0%) | 3,154 (31.0%) |
| Transportation | 10,639 (85.0%) | 1,880 (15.0%) |
| Material Moving | 6,534 (71.1%) | 2,654 (28.9%) |
| Total (Category) | 24,199 (75.9%) | 7,688 (24.1%) |
| Total (Overall) | 217,101 (53.9%) | 185,366 (46.1%) |
Employment Industries by Sex in San Mateo County
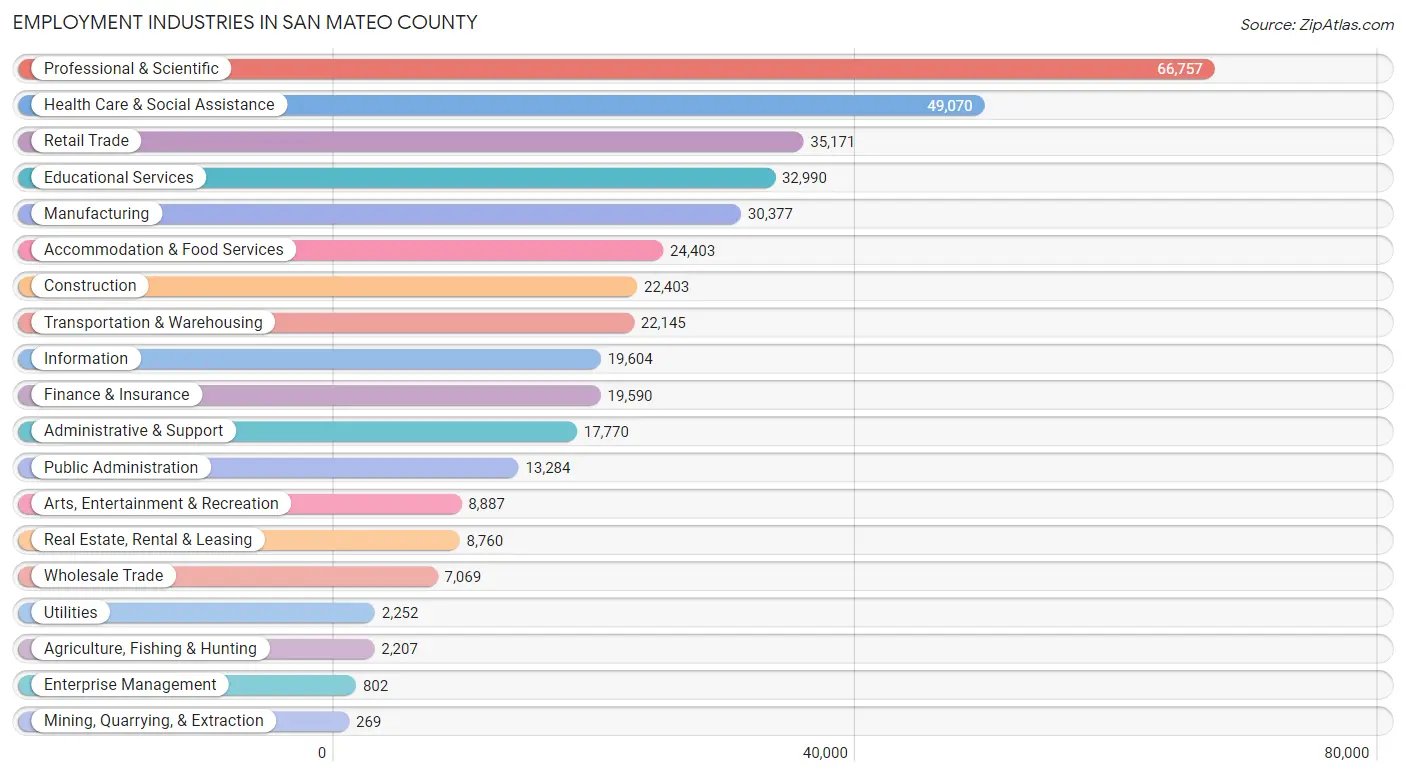
Employment Industries in San Mateo County
The major employment industries in San Mateo County include Professional & Scientific (66,757 | 16.6%), Health Care & Social Assistance (49,070 | 12.2%), Retail Trade (35,171 | 8.7%), Educational Services (32,990 | 8.2%), and Manufacturing (30,377 | 7.5%).
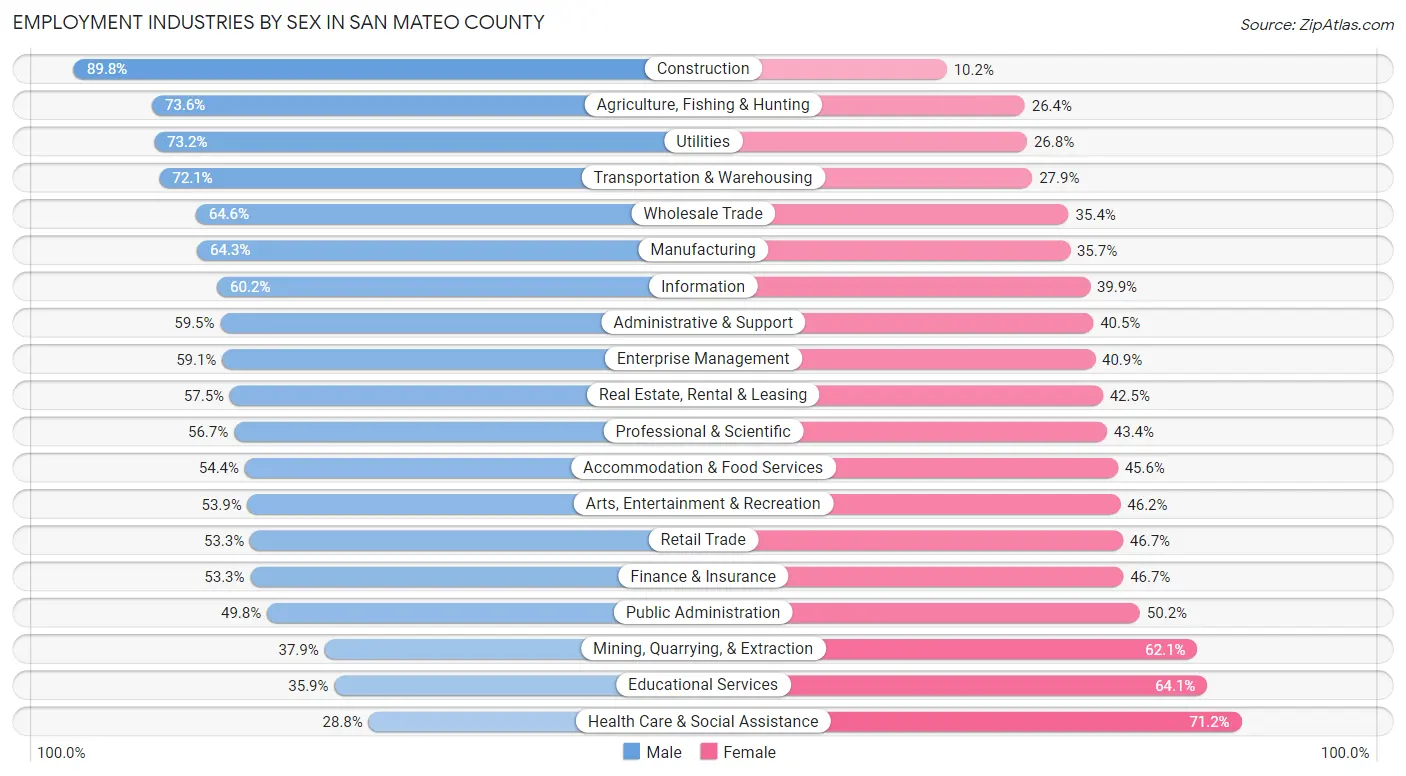
Employment Industries by Sex in San Mateo County
The San Mateo County industries that see more men than women are Construction (89.8%), Agriculture, Fishing & Hunting (73.6%), and Utilities (73.2%), whereas the industries that tend to have a higher number of women are Health Care & Social Assistance (71.2%), Educational Services (64.1%), and Mining, Quarrying, & Extraction (62.1%).
| Industry | Male | Female |
| Agriculture, Fishing & Hunting | 1,625 (73.6%) | 582 (26.4%) |
| Mining, Quarrying, & Extraction | 102 (37.9%) | 167 (62.1%) |
| Construction | 20,115 (89.8%) | 2,288 (10.2%) |
| Manufacturing | 19,527 (64.3%) | 10,850 (35.7%) |
| Wholesale Trade | 4,564 (64.6%) | 2,505 (35.4%) |
| Retail Trade | 18,756 (53.3%) | 16,415 (46.7%) |
| Transportation & Warehousing | 15,964 (72.1%) | 6,181 (27.9%) |
| Utilities | 1,648 (73.2%) | 604 (26.8%) |
| Information | 11,791 (60.2%) | 7,813 (39.9%) |
| Finance & Insurance | 10,435 (53.3%) | 9,155 (46.7%) |
| Real Estate, Rental & Leasing | 5,037 (57.5%) | 3,723 (42.5%) |
| Professional & Scientific | 37,819 (56.7%) | 28,938 (43.3%) |
| Enterprise Management | 474 (59.1%) | 328 (40.9%) |
| Administrative & Support | 10,570 (59.5%) | 7,200 (40.5%) |
| Educational Services | 11,840 (35.9%) | 21,150 (64.1%) |
| Health Care & Social Assistance | 14,131 (28.8%) | 34,939 (71.2%) |
| Arts, Entertainment & Recreation | 4,786 (53.8%) | 4,101 (46.2%) |
| Accommodation & Food Services | 13,277 (54.4%) | 11,126 (45.6%) |
| Public Administration | 6,617 (49.8%) | 6,667 (50.2%) |
| Total | 217,101 (53.9%) | 185,366 (46.1%) |
Education in San Mateo County
School Enrollment in San Mateo County
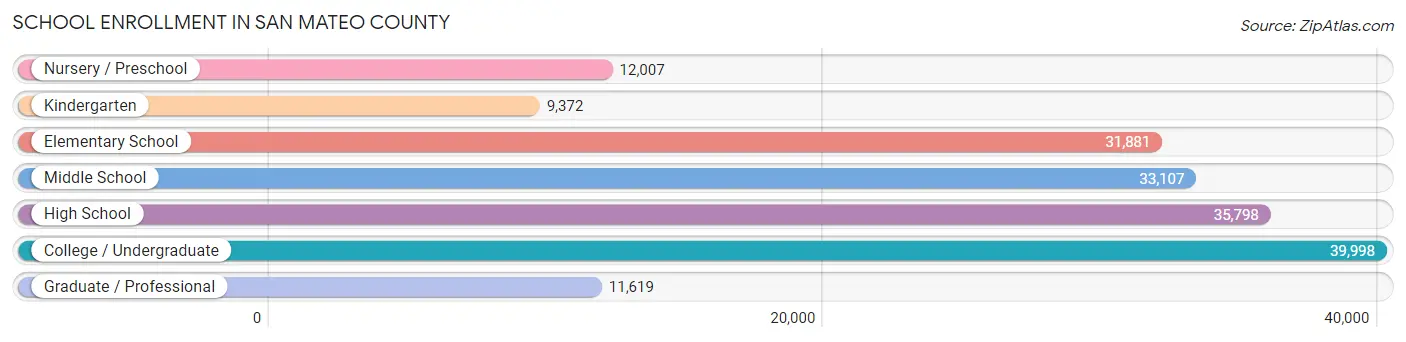
The most common levels of schooling among the 173,782 students in San Mateo County are college / undergraduate (39,998 | 23.0%), high school (35,798 | 20.6%), and middle school (33,107 | 19.1%).
| School Level | # Students | % Students |
| Nursery / Preschool | 12,007 | 6.9% |
| Kindergarten | 9,372 | 5.4% |
| Elementary School | 31,881 | 18.3% |
| Middle School | 33,107 | 19.1% |
| High School | 35,798 | 20.6% |
| College / Undergraduate | 39,998 | 23.0% |
| Graduate / Professional | 11,619 | 6.7% |
| Total | 173,782 | 100.0% |
School Enrollment by Age by Funding Source in San Mateo County
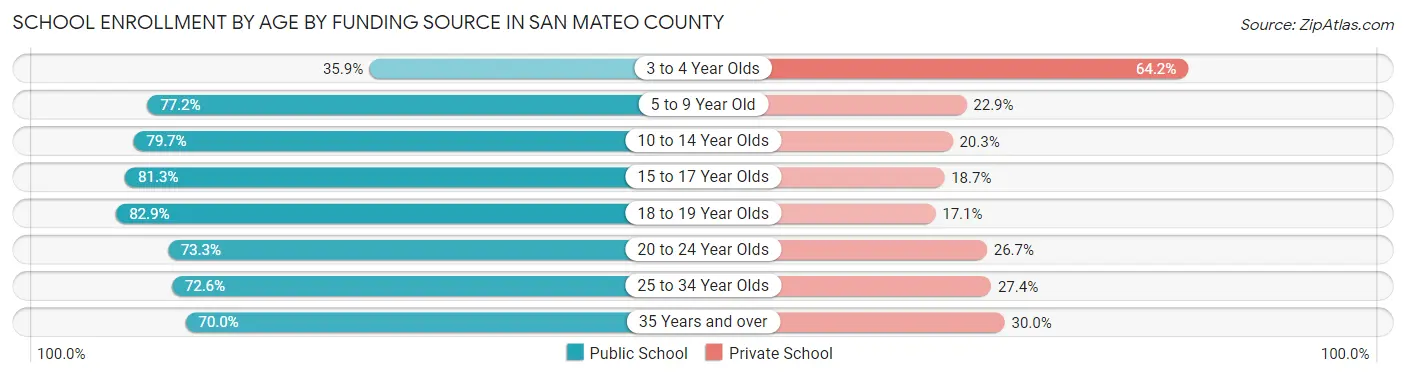
Out of a total of 173,782 students who are enrolled in schools in San Mateo County, 42,924 (24.7%) attend a private institution, while the remaining 130,858 (75.3%) are enrolled in public schools. The age group of 3 to 4 year olds has the highest likelihood of being enrolled in private schools, with 6,214 (64.1% in the age bracket) enrolled. Conversely, the age group of 18 to 19 year olds has the lowest likelihood of being enrolled in a private school, with 10,530 (82.9% in the age bracket) attending a public institution.
| Age Bracket | Public School | Private School |
| 3 to 4 Year Olds | 3,473 (35.8%) | 6,214 (64.1%) |
| 5 to 9 Year Old | 30,709 (77.1%) | 9,094 (22.9%) |
| 10 to 14 Year Olds | 33,640 (79.7%) | 8,554 (20.3%) |
| 15 to 17 Year Olds | 20,938 (81.3%) | 4,824 (18.7%) |
| 18 to 19 Year Olds | 10,530 (82.9%) | 2,167 (17.1%) |
| 20 to 24 Year Olds | 14,360 (73.3%) | 5,221 (26.7%) |
| 25 to 34 Year Olds | 9,803 (72.6%) | 3,708 (27.4%) |
| 35 Years and over | 7,387 (70.0%) | 3,160 (30.0%) |
| Total | 130,858 (75.3%) | 42,924 (24.7%) |
Educational Attainment by Field of Study in San Mateo County
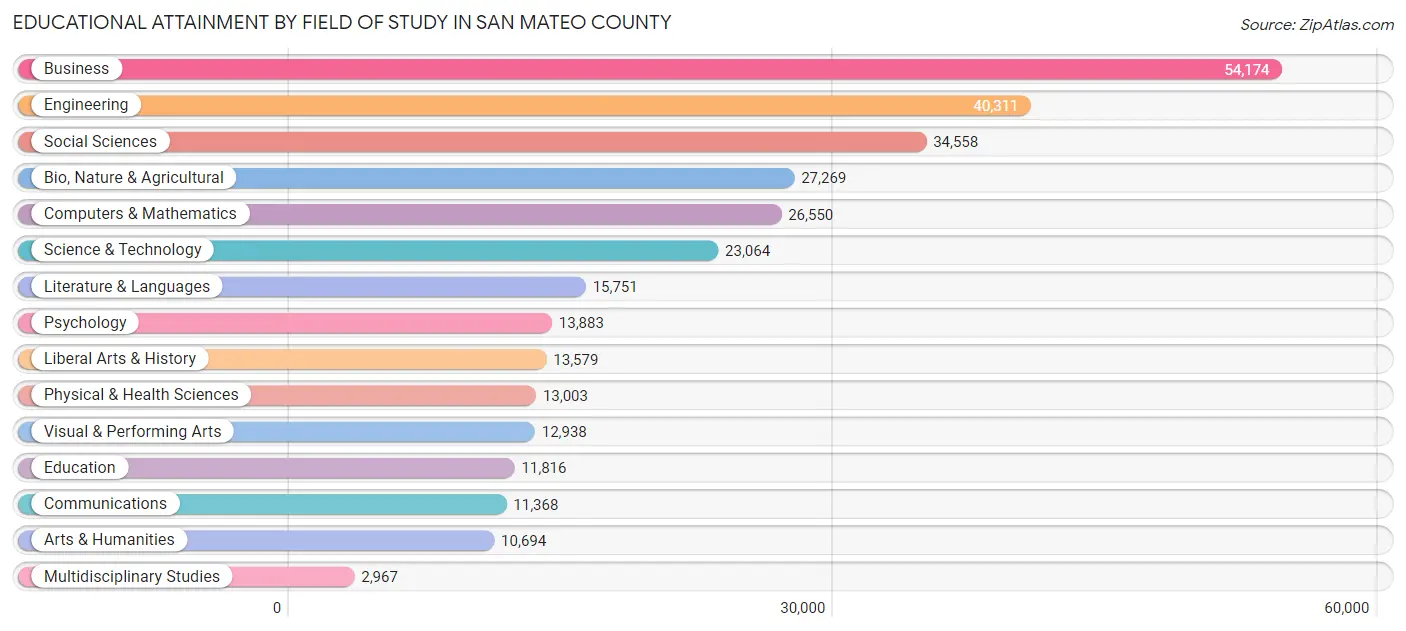
Business (54,174 | 17.4%), engineering (40,311 | 12.9%), social sciences (34,558 | 11.1%), bio, nature & agricultural (27,269 | 8.7%), and computers & mathematics (26,550 | 8.5%) are the most common fields of study among 311,925 individuals in San Mateo County who have obtained a bachelor's degree or higher.
| Field of Study | # Graduates | % Graduates |
| Computers & Mathematics | 26,550 | 8.5% |
| Bio, Nature & Agricultural | 27,269 | 8.7% |
| Physical & Health Sciences | 13,003 | 4.2% |
| Psychology | 13,883 | 4.4% |
| Social Sciences | 34,558 | 11.1% |
| Engineering | 40,311 | 12.9% |
| Multidisciplinary Studies | 2,967 | 0.9% |
| Science & Technology | 23,064 | 7.4% |
| Business | 54,174 | 17.4% |
| Education | 11,816 | 3.8% |
| Literature & Languages | 15,751 | 5.1% |
| Liberal Arts & History | 13,579 | 4.3% |
| Visual & Performing Arts | 12,938 | 4.2% |
| Communications | 11,368 | 3.6% |
| Arts & Humanities | 10,694 | 3.4% |
| Total | 311,925 | 100.0% |
Transportation & Commute in San Mateo County
Vehicle Availability by Sex in San Mateo County
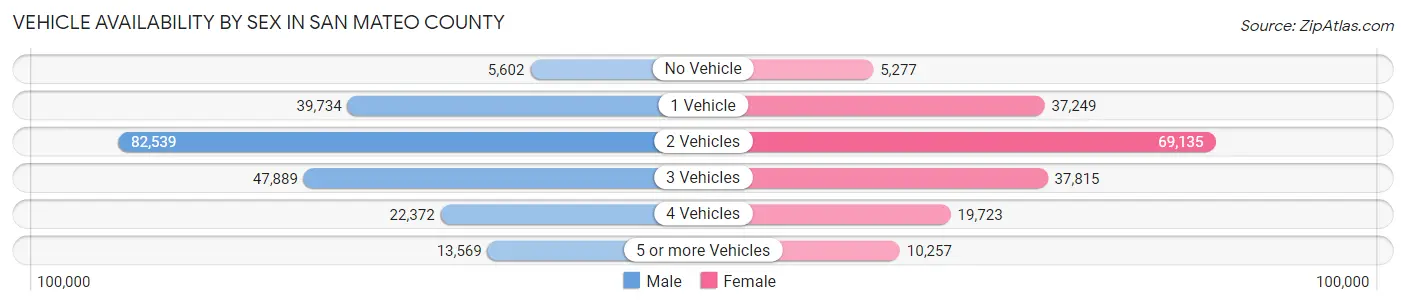
The most prevalent vehicle ownership categories in San Mateo County are males with 2 vehicles (82,539, accounting for 39.0%) and females with 2 vehicles (69,135, making up 46.0%).
| Vehicles Available | Male | Female |
| No Vehicle | 5,602 (2.6%) | 5,277 (2.9%) |
| 1 Vehicle | 39,734 (18.8%) | 37,249 (20.8%) |
| 2 Vehicles | 82,539 (39.0%) | 69,135 (38.5%) |
| 3 Vehicles | 47,889 (22.6%) | 37,815 (21.1%) |
| 4 Vehicles | 22,372 (10.6%) | 19,723 (11.0%) |
| 5 or more Vehicles | 13,569 (6.4%) | 10,257 (5.7%) |
| Total | 211,705 (100.0%) | 179,456 (100.0%) |
Commute Time in San Mateo County
The most frequently occuring commute durations in San Mateo County are 30 to 34 minutes (49,514 commuters, 15.5%), 15 to 19 minutes (49,513 commuters, 15.5%), and 20 to 24 minutes (47,570 commuters, 14.9%).
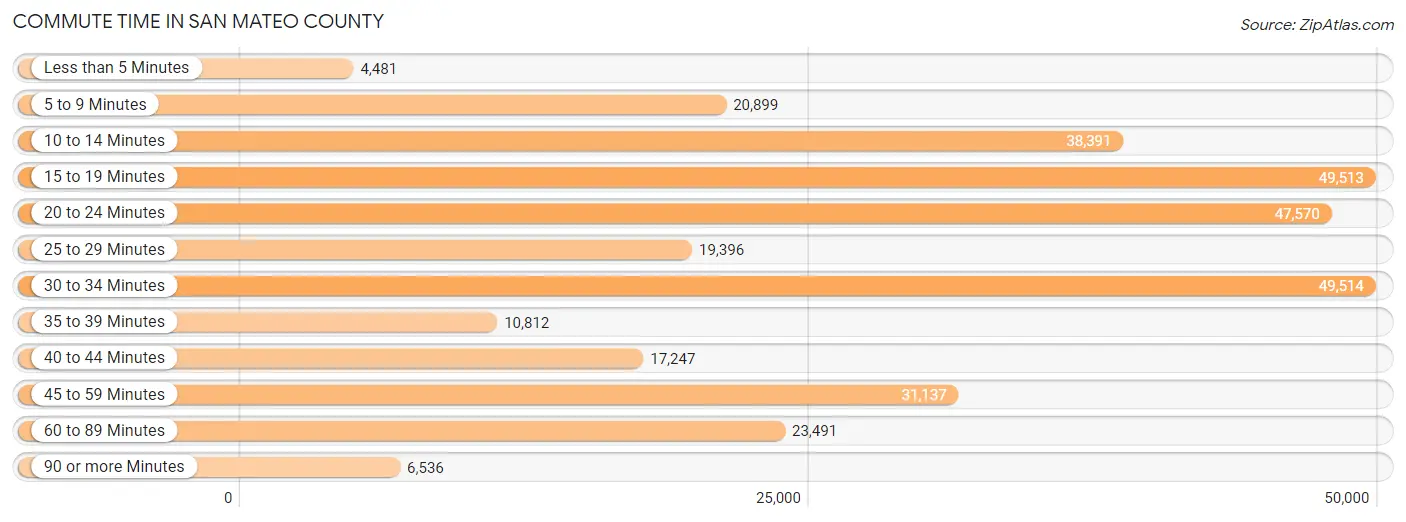
| Commute Time | # Commuters | % Commuters |
| Less than 5 Minutes | 4,481 | 1.4% |
| 5 to 9 Minutes | 20,899 | 6.6% |
| 10 to 14 Minutes | 38,391 | 12.0% |
| 15 to 19 Minutes | 49,513 | 15.5% |
| 20 to 24 Minutes | 47,570 | 14.9% |
| 25 to 29 Minutes | 19,396 | 6.1% |
| 30 to 34 Minutes | 49,514 | 15.5% |
| 35 to 39 Minutes | 10,812 | 3.4% |
| 40 to 44 Minutes | 17,247 | 5.4% |
| 45 to 59 Minutes | 31,137 | 9.8% |
| 60 to 89 Minutes | 23,491 | 7.4% |
| 90 or more Minutes | 6,536 | 2.1% |
Commute Time by Sex in San Mateo County
The most common commute times in San Mateo County are 30 to 34 minutes (27,883 commuters, 16.0%) for males and 15 to 19 minutes (23,677 commuters, 16.4%) for females.
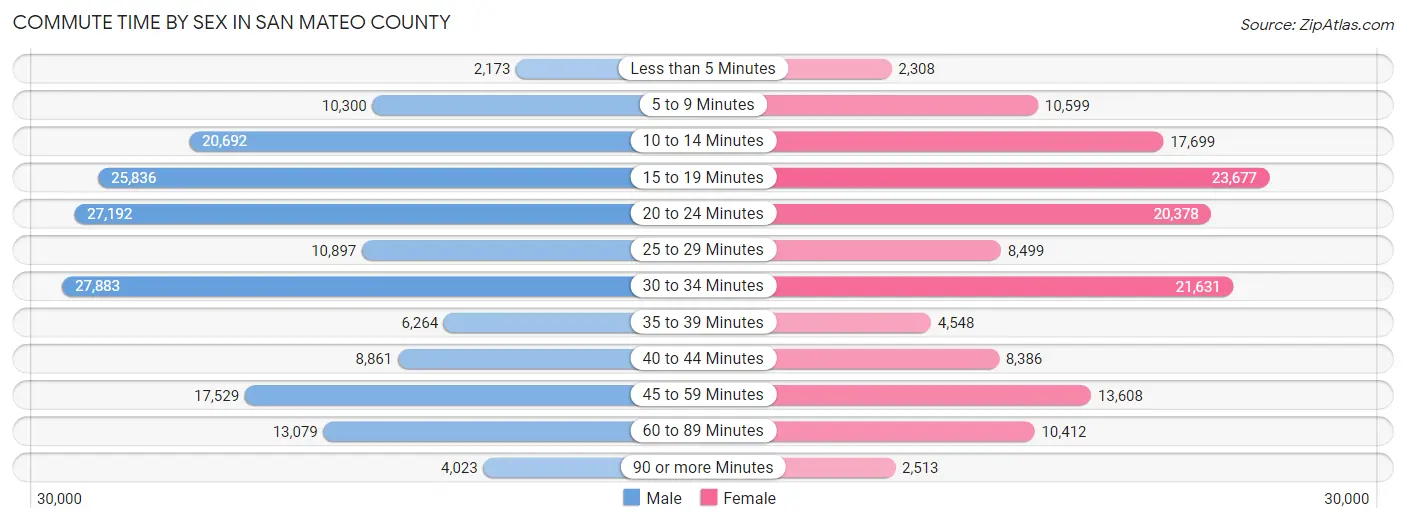
| Commute Time | Male | Female |
| Less than 5 Minutes | 2,173 (1.2%) | 2,308 (1.6%) |
| 5 to 9 Minutes | 10,300 (5.9%) | 10,599 (7.3%) |
| 10 to 14 Minutes | 20,692 (11.8%) | 17,699 (12.3%) |
| 15 to 19 Minutes | 25,836 (14.8%) | 23,677 (16.4%) |
| 20 to 24 Minutes | 27,192 (15.6%) | 20,378 (14.1%) |
| 25 to 29 Minutes | 10,897 (6.2%) | 8,499 (5.9%) |
| 30 to 34 Minutes | 27,883 (16.0%) | 21,631 (15.0%) |
| 35 to 39 Minutes | 6,264 (3.6%) | 4,548 (3.2%) |
| 40 to 44 Minutes | 8,861 (5.1%) | 8,386 (5.8%) |
| 45 to 59 Minutes | 17,529 (10.0%) | 13,608 (9.4%) |
| 60 to 89 Minutes | 13,079 (7.5%) | 10,412 (7.2%) |
| 90 or more Minutes | 4,023 (2.3%) | 2,513 (1.7%) |
Time of Departure to Work by Sex in San Mateo County
The most frequent times of departure to work in San Mateo County are 8:00 AM to 8:29 AM (26,803, 15.3%) for males and 8:00 AM to 8:29 AM (24,377, 16.9%) for females.
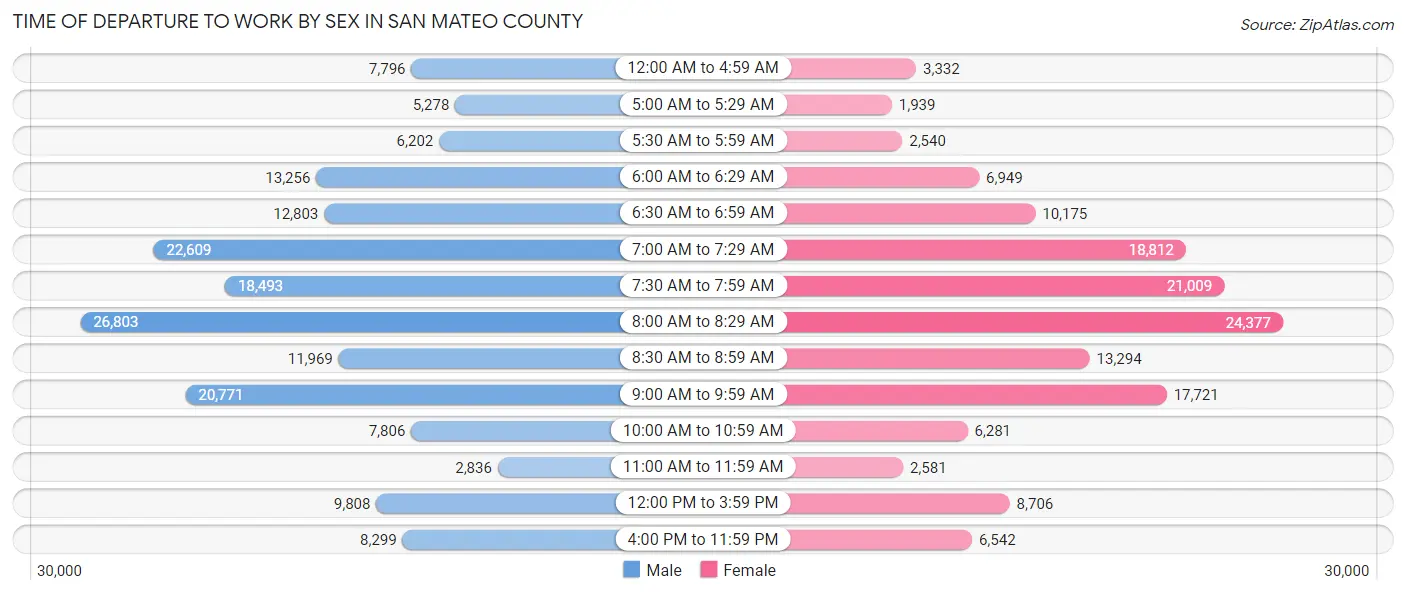
| Time of Departure | Male | Female |
| 12:00 AM to 4:59 AM | 7,796 (4.5%) | 3,332 (2.3%) |
| 5:00 AM to 5:29 AM | 5,278 (3.0%) | 1,939 (1.3%) |
| 5:30 AM to 5:59 AM | 6,202 (3.5%) | 2,540 (1.8%) |
| 6:00 AM to 6:29 AM | 13,256 (7.6%) | 6,949 (4.8%) |
| 6:30 AM to 6:59 AM | 12,803 (7.3%) | 10,175 (7.0%) |
| 7:00 AM to 7:29 AM | 22,609 (12.9%) | 18,812 (13.0%) |
| 7:30 AM to 7:59 AM | 18,493 (10.6%) | 21,009 (14.6%) |
| 8:00 AM to 8:29 AM | 26,803 (15.3%) | 24,377 (16.9%) |
| 8:30 AM to 8:59 AM | 11,969 (6.9%) | 13,294 (9.2%) |
| 9:00 AM to 9:59 AM | 20,771 (11.9%) | 17,721 (12.3%) |
| 10:00 AM to 10:59 AM | 7,806 (4.5%) | 6,281 (4.3%) |
| 11:00 AM to 11:59 AM | 2,836 (1.6%) | 2,581 (1.8%) |
| 12:00 PM to 3:59 PM | 9,808 (5.6%) | 8,706 (6.0%) |
| 4:00 PM to 11:59 PM | 8,299 (4.8%) | 6,542 (4.5%) |
| Total | 174,729 (100.0%) | 144,258 (100.0%) |
Housing Occupancy in San Mateo County
Occupancy by Ownership in San Mateo County
Of the total 264,323 dwellings in San Mateo County, owner-occupied units account for 157,368 (59.5%), while renter-occupied units make up 106,955 (40.5%).
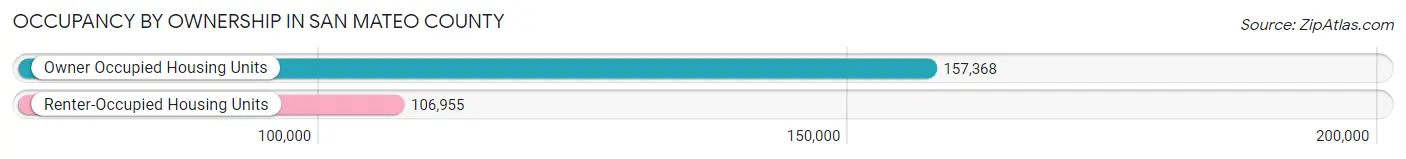
| Occupancy | # Housing Units | % Housing Units |
| Owner Occupied Housing Units | 157,368 | 59.5% |
| Renter-Occupied Housing Units | 106,955 | 40.5% |
| Total Occupied Housing Units | 264,323 | 100.0% |
Occupancy by Household Size in San Mateo County
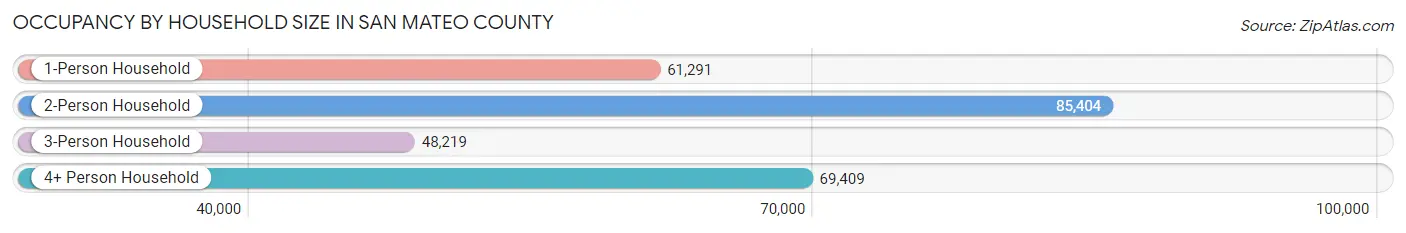
| Household Size | # Housing Units | % Housing Units |
| 1-Person Household | 61,291 | 23.2% |
| 2-Person Household | 85,404 | 32.3% |
| 3-Person Household | 48,219 | 18.2% |
| 4+ Person Household | 69,409 | 26.3% |
| Total Housing Units | 264,323 | 100.0% |
Occupancy by Ownership by Household Size in San Mateo County
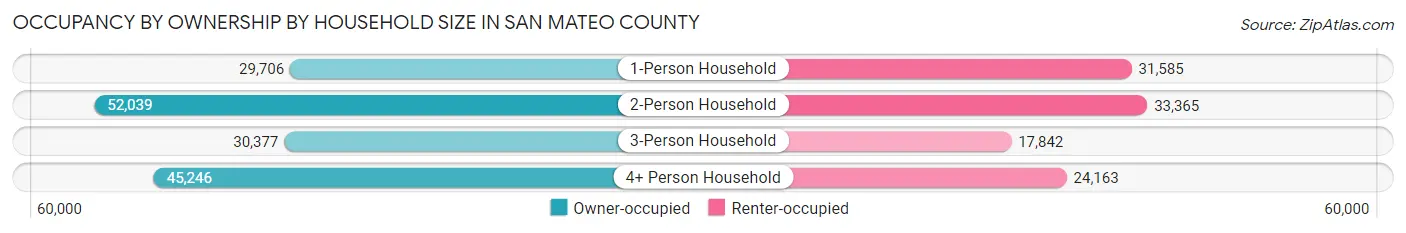
| Household Size | Owner-occupied | Renter-occupied |
| 1-Person Household | 29,706 (48.5%) | 31,585 (51.5%) |
| 2-Person Household | 52,039 (60.9%) | 33,365 (39.1%) |
| 3-Person Household | 30,377 (63.0%) | 17,842 (37.0%) |
| 4+ Person Household | 45,246 (65.2%) | 24,163 (34.8%) |
| Total Housing Units | 157,368 (59.5%) | 106,955 (40.5%) |
Occupancy by Educational Attainment in San Mateo County
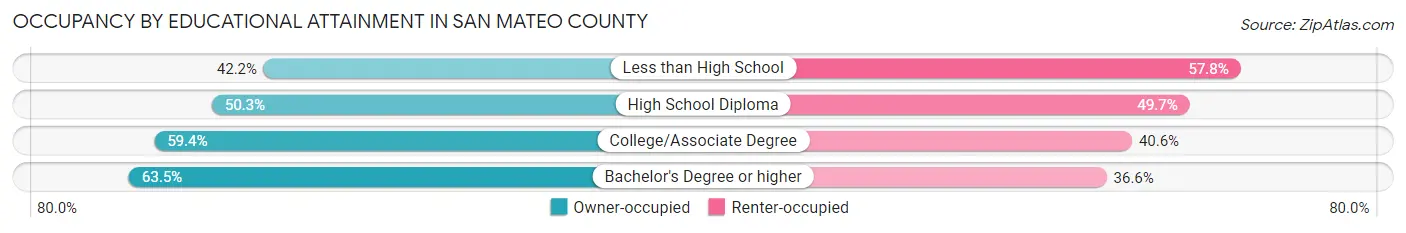
| Household Size | Owner-occupied | Renter-occupied |
| Less than High School | 7,780 (42.2%) | 10,652 (57.8%) |
| High School Diploma | 15,302 (50.3%) | 15,118 (49.7%) |
| College/Associate Degree | 35,952 (59.4%) | 24,544 (40.6%) |
| Bachelor's Degree or higher | 98,334 (63.4%) | 56,641 (36.5%) |
Occupancy by Age of Householder in San Mateo County
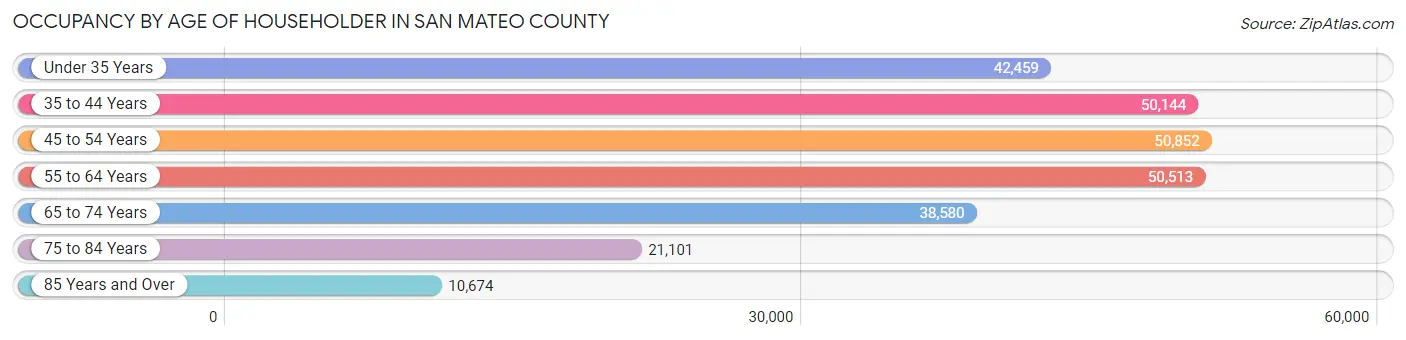
| Age Bracket | # Households | % Households |
| Under 35 Years | 42,459 | 16.1% |
| 35 to 44 Years | 50,144 | 19.0% |
| 45 to 54 Years | 50,852 | 19.2% |
| 55 to 64 Years | 50,513 | 19.1% |
| 65 to 74 Years | 38,580 | 14.6% |
| 75 to 84 Years | 21,101 | 8.0% |
| 85 Years and Over | 10,674 | 4.0% |
| Total | 264,323 | 100.0% |
Housing Finances in San Mateo County
Median Income by Occupancy in San Mateo County
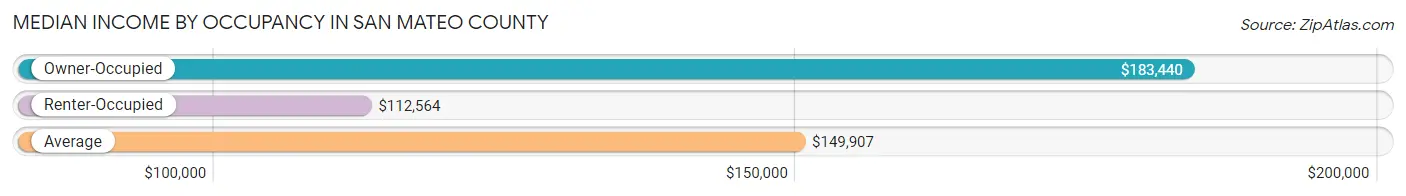
| Occupancy Type | # Households | Median Income |
| Owner-Occupied | 157,368 (59.5%) | $183,440 |
| Renter-Occupied | 106,955 (40.5%) | $112,564 |
| Average | 264,323 (100.0%) | $149,907 |
Occupancy by Householder Income Bracket in San Mateo County
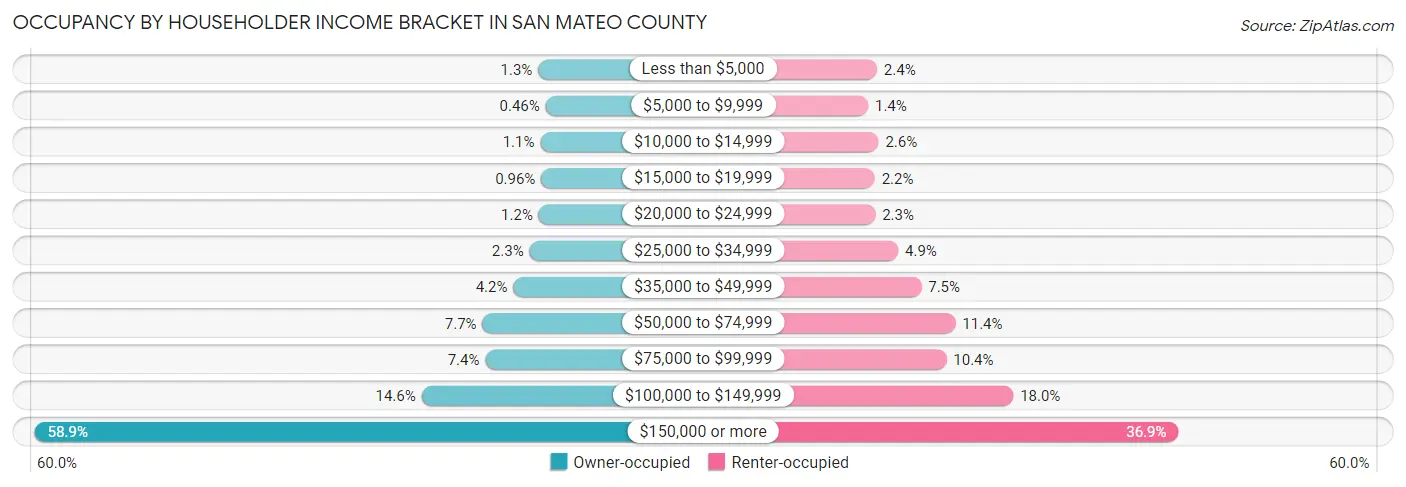
| Income Bracket | Owner-occupied | Renter-occupied |
| Less than $5,000 | 2,069 (1.3%) | 2,606 (2.4%) |
| $5,000 to $9,999 | 728 (0.5%) | 1,527 (1.4%) |
| $10,000 to $14,999 | 1,661 (1.1%) | 2,803 (2.6%) |
| $15,000 to $19,999 | 1,507 (1.0%) | 2,340 (2.2%) |
| $20,000 to $24,999 | 1,950 (1.2%) | 2,408 (2.2%) |
| $25,000 to $34,999 | 3,627 (2.3%) | 5,200 (4.9%) |
| $35,000 to $49,999 | 6,529 (4.2%) | 8,032 (7.5%) |
| $50,000 to $74,999 | 12,081 (7.7%) | 12,204 (11.4%) |
| $75,000 to $99,999 | 11,559 (7.3%) | 11,100 (10.4%) |
| $100,000 to $149,999 | 23,030 (14.6%) | 19,275 (18.0%) |
| $150,000 or more | 92,627 (58.9%) | 39,460 (36.9%) |
| Total | 157,368 (100.0%) | 106,955 (100.0%) |
Monthly Housing Cost Tiers in San Mateo County
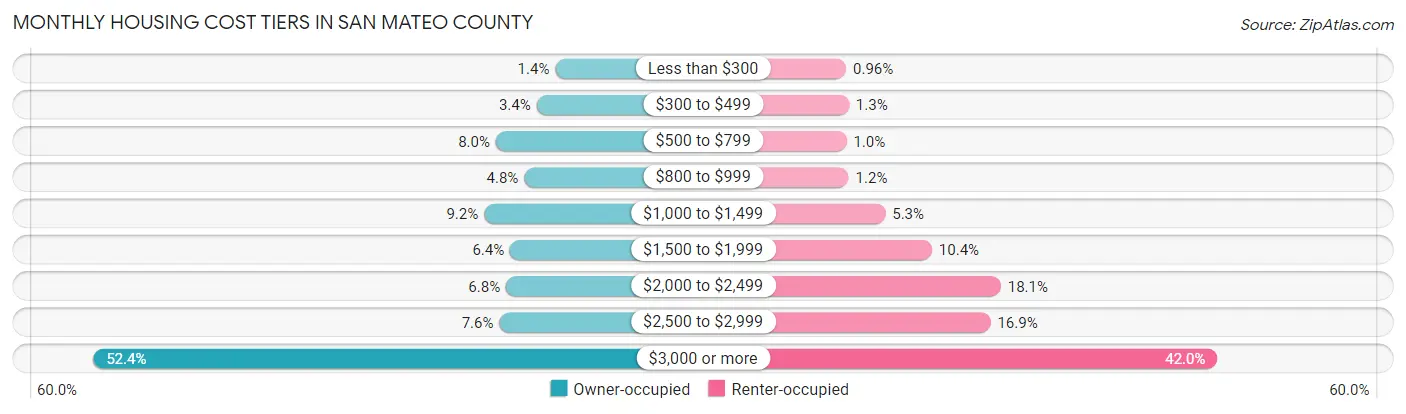
| Monthly Cost | Owner-occupied | Renter-occupied |
| Less than $300 | 2,173 (1.4%) | 1,030 (1.0%) |
| $300 to $499 | 5,420 (3.4%) | 1,361 (1.3%) |
| $500 to $799 | 12,513 (8.0%) | 1,074 (1.0%) |
| $800 to $999 | 7,576 (4.8%) | 1,330 (1.2%) |
| $1,000 to $1,499 | 14,544 (9.2%) | 5,660 (5.3%) |
| $1,500 to $1,999 | 10,019 (6.4%) | 11,169 (10.4%) |
| $2,000 to $2,499 | 10,733 (6.8%) | 19,303 (18.0%) |
| $2,500 to $2,999 | 11,892 (7.6%) | 18,082 (16.9%) |
| $3,000 or more | 82,498 (52.4%) | 44,883 (42.0%) |
| Total | 157,368 (100.0%) | 106,955 (100.0%) |
Physical Housing Characteristics in San Mateo County
Housing Structures in San Mateo County
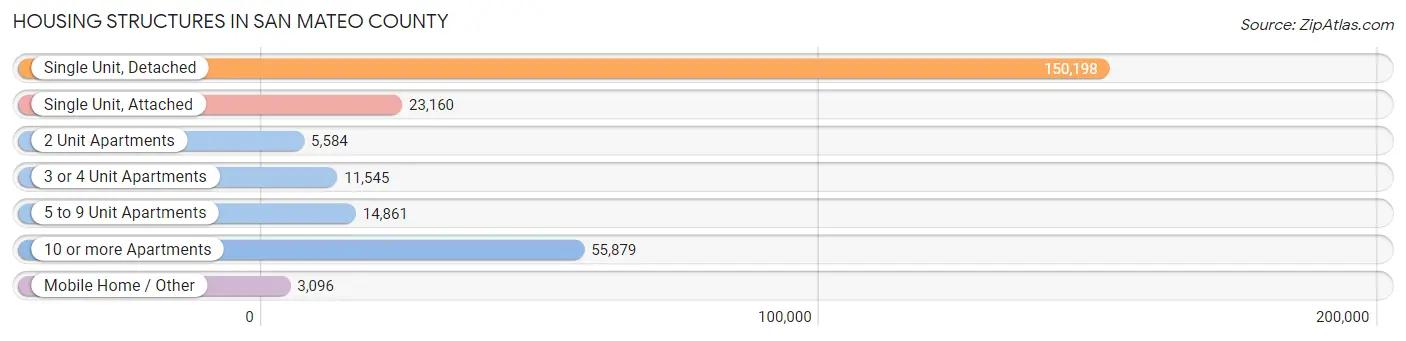
| Structure Type | # Housing Units | % Housing Units |
| Single Unit, Detached | 150,198 | 56.8% |
| Single Unit, Attached | 23,160 | 8.8% |
| 2 Unit Apartments | 5,584 | 2.1% |
| 3 or 4 Unit Apartments | 11,545 | 4.4% |
| 5 to 9 Unit Apartments | 14,861 | 5.6% |
| 10 or more Apartments | 55,879 | 21.1% |
| Mobile Home / Other | 3,096 | 1.2% |
| Total | 264,323 | 100.0% |
Housing Structures by Occupancy in San Mateo County
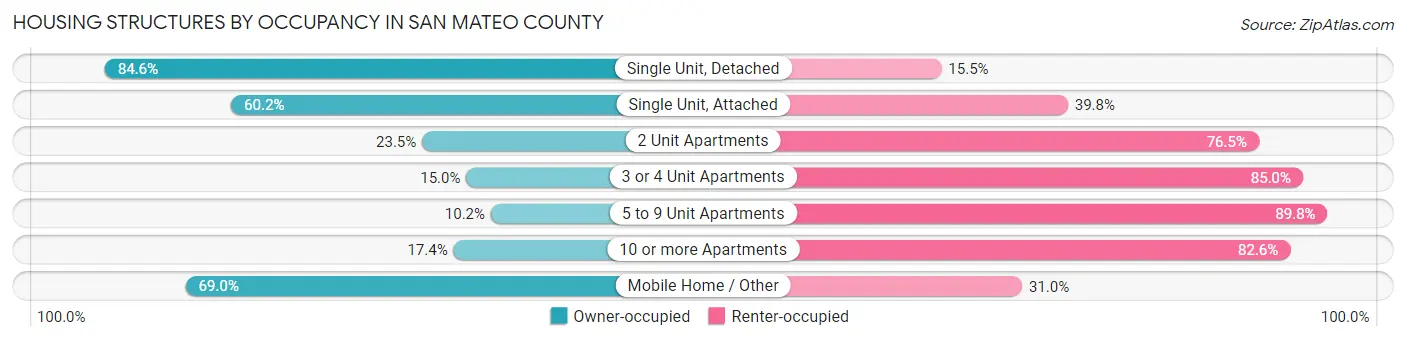
| Structure Type | Owner-occupied | Renter-occupied |
| Single Unit, Detached | 126,992 (84.6%) | 23,206 (15.4%) |
| Single Unit, Attached | 13,948 (60.2%) | 9,212 (39.8%) |
| 2 Unit Apartments | 1,310 (23.5%) | 4,274 (76.5%) |
| 3 or 4 Unit Apartments | 1,727 (15.0%) | 9,818 (85.0%) |
| 5 to 9 Unit Apartments | 1,520 (10.2%) | 13,341 (89.8%) |
| 10 or more Apartments | 9,734 (17.4%) | 46,145 (82.6%) |
| Mobile Home / Other | 2,137 (69.0%) | 959 (31.0%) |
| Total | 157,368 (59.5%) | 106,955 (40.5%) |
Housing Structures by Number of Rooms in San Mateo County
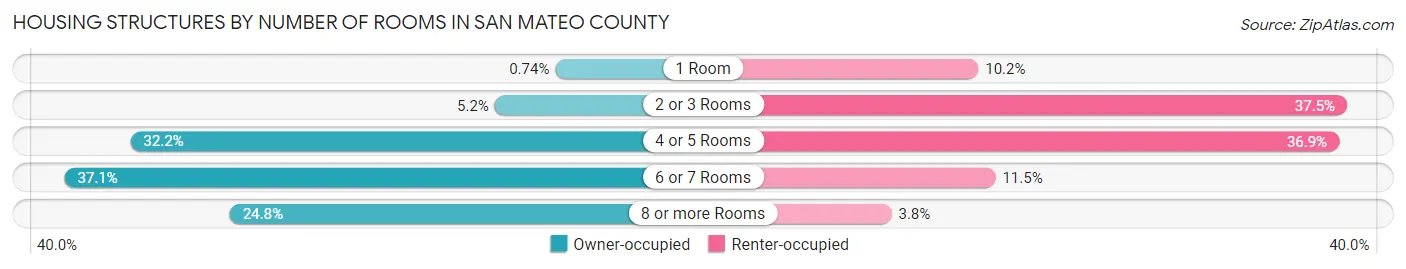
| Number of Rooms | Owner-occupied | Renter-occupied |
| 1 Room | 1,167 (0.7%) | 10,954 (10.2%) |
| 2 or 3 Rooms | 8,216 (5.2%) | 40,116 (37.5%) |
| 4 or 5 Rooms | 50,625 (32.2%) | 39,486 (36.9%) |
| 6 or 7 Rooms | 58,307 (37.0%) | 12,315 (11.5%) |
| 8 or more Rooms | 39,053 (24.8%) | 4,084 (3.8%) |
| Total | 157,368 (100.0%) | 106,955 (100.0%) |
Housing Structure by Heating Type in San Mateo County
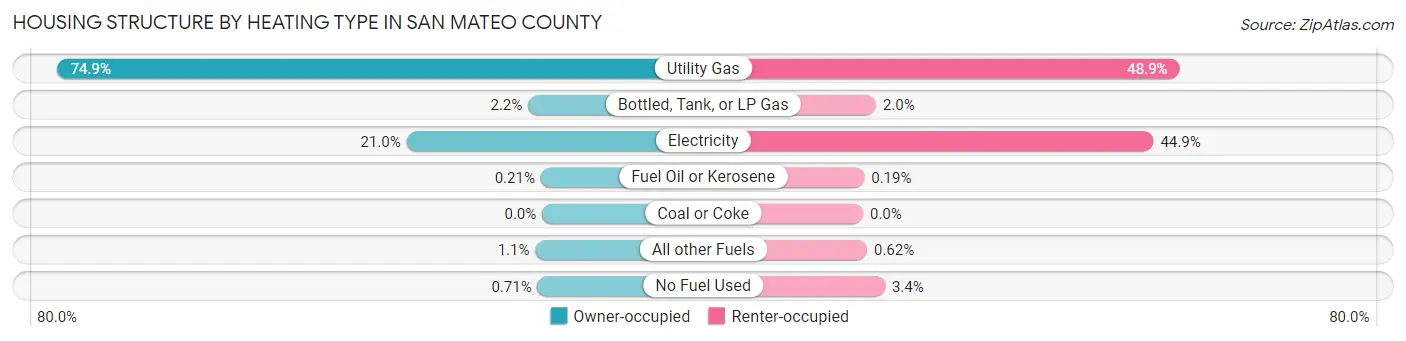
| Heating Type | Owner-occupied | Renter-occupied |
| Utility Gas | 117,889 (74.9%) | 52,299 (48.9%) |
| Bottled, Tank, or LP Gas | 3,395 (2.2%) | 2,136 (2.0%) |
| Electricity | 32,983 (21.0%) | 48,028 (44.9%) |
| Fuel Oil or Kerosene | 331 (0.2%) | 200 (0.2%) |
| Coal or Coke | 0 (0.0%) | 0 (0.0%) |
| All other Fuels | 1,658 (1.1%) | 667 (0.6%) |
| No Fuel Used | 1,112 (0.7%) | 3,625 (3.4%) |
| Total | 157,368 (100.0%) | 106,955 (100.0%) |
Household Vehicle Usage in San Mateo County
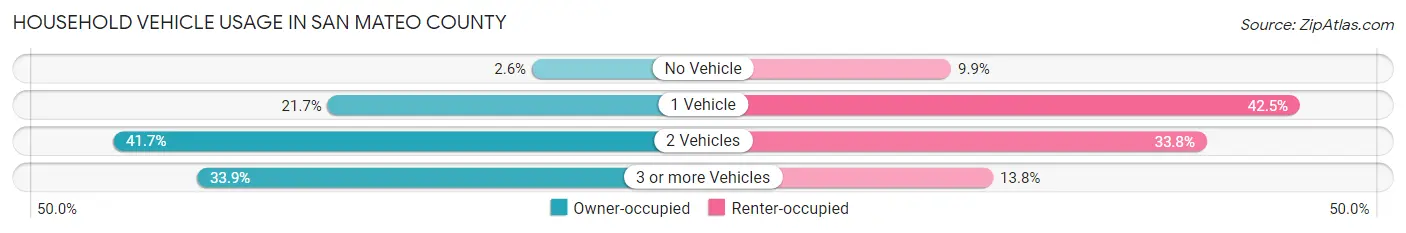
| Vehicles per Household | Owner-occupied | Renter-occupied |
| No Vehicle | 4,148 (2.6%) | 10,604 (9.9%) |
| 1 Vehicle | 34,170 (21.7%) | 45,419 (42.5%) |
| 2 Vehicles | 65,686 (41.7%) | 36,130 (33.8%) |
| 3 or more Vehicles | 53,364 (33.9%) | 14,802 (13.8%) |
| Total | 157,368 (100.0%) | 106,955 (100.0%) |
Real Estate & Mortgages in San Mateo County
Real Estate and Mortgage Overview in San Mateo County
| Characteristic | Without Mortgage | With Mortgage |
| Housing Units | 50,314 | 107,054 |
| Median Property Value | $1,346,300 | $1,474,100 |
| Median Household Income | $122,241 | $71,763 |
| Monthly Housing Costs | $975 | $79,907 |
| Real Estate Taxes | $5,683 | $1,136 |
Property Value by Mortgage Status in San Mateo County
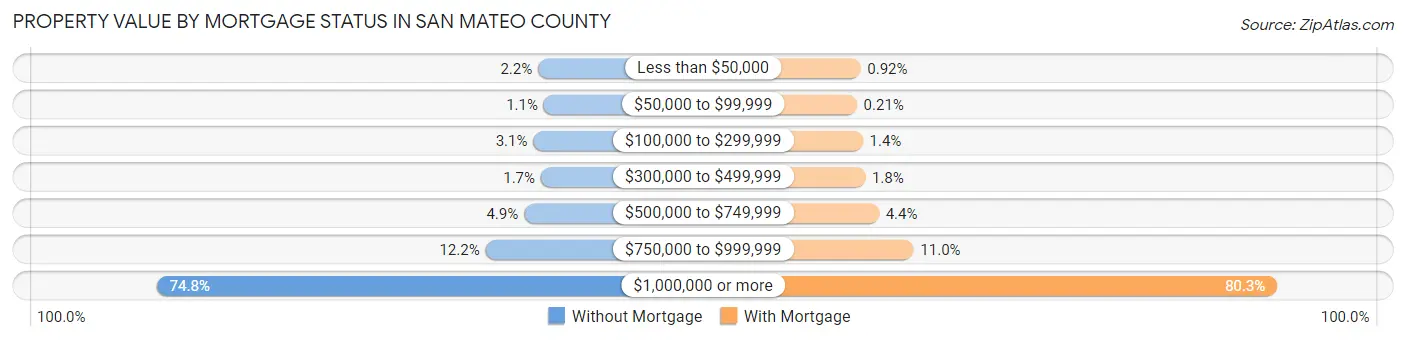
| Property Value | Without Mortgage | With Mortgage |
| Less than $50,000 | 1,107 (2.2%) | 983 (0.9%) |
| $50,000 to $99,999 | 559 (1.1%) | 229 (0.2%) |
| $100,000 to $299,999 | 1,559 (3.1%) | 1,446 (1.3%) |
| $300,000 to $499,999 | 842 (1.7%) | 1,916 (1.8%) |
| $500,000 to $749,999 | 2,446 (4.9%) | 4,716 (4.4%) |
| $750,000 to $999,999 | 6,144 (12.2%) | 11,792 (11.0%) |
| $1,000,000 or more | 37,657 (74.8%) | 85,972 (80.3%) |
| Total | 50,314 (100.0%) | 107,054 (100.0%) |
Household Income by Mortgage Status in San Mateo County
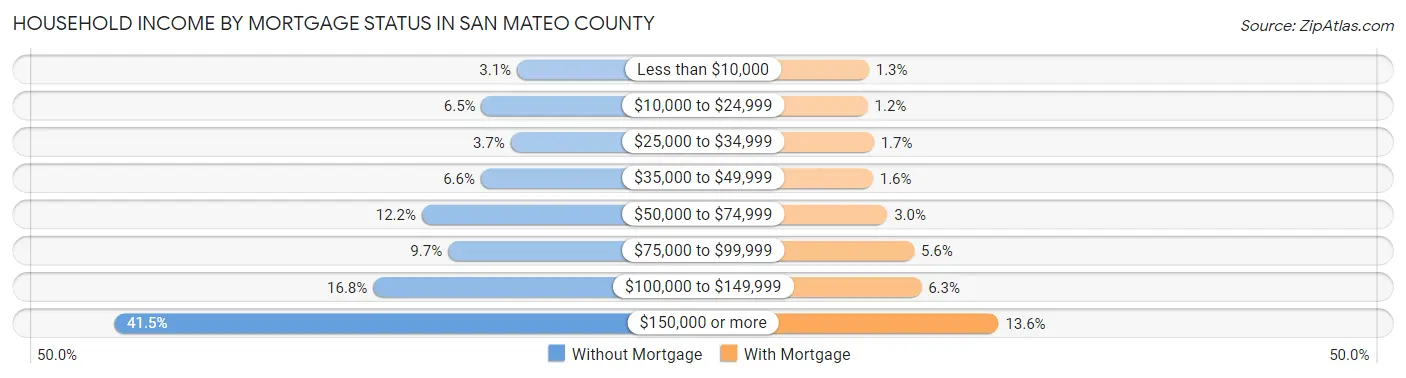
| Household Income | Without Mortgage | With Mortgage |
| Less than $10,000 | 1,567 (3.1%) | 1,345 (1.3%) |
| $10,000 to $24,999 | 3,266 (6.5%) | 1,230 (1.1%) |
| $25,000 to $34,999 | 1,873 (3.7%) | 1,852 (1.7%) |
| $35,000 to $49,999 | 3,294 (6.6%) | 1,754 (1.6%) |
| $50,000 to $74,999 | 6,121 (12.2%) | 3,235 (3.0%) |
| $75,000 to $99,999 | 4,870 (9.7%) | 5,960 (5.6%) |
| $100,000 to $149,999 | 8,459 (16.8%) | 6,689 (6.2%) |
| $150,000 or more | 20,864 (41.5%) | 14,571 (13.6%) |
| Total | 50,314 (100.0%) | 107,054 (100.0%) |
Property Value to Household Income Ratio in San Mateo County
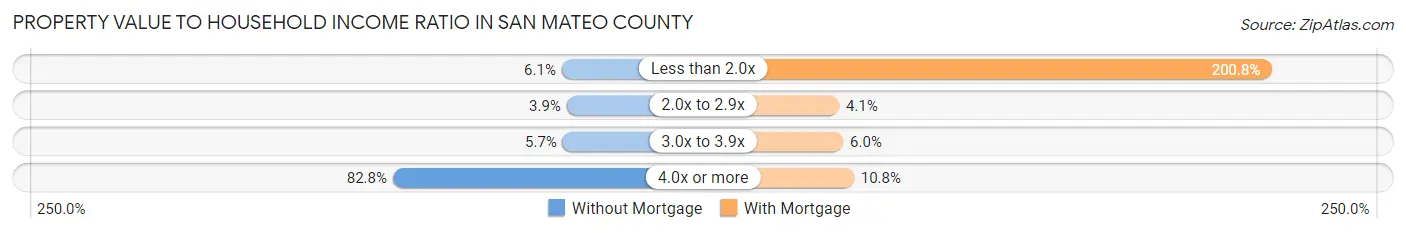
| Value-to-Income Ratio | Without Mortgage | With Mortgage |
| Less than 2.0x | 3,076 (6.1%) | 214,962 (200.8%) |
| 2.0x to 2.9x | 1,951 (3.9%) | 4,377 (4.1%) |
| 3.0x to 3.9x | 2,874 (5.7%) | 6,436 (6.0%) |
| 4.0x or more | 41,668 (82.8%) | 11,600 (10.8%) |
| Total | 50,314 (100.0%) | 107,054 (100.0%) |
Real Estate Taxes by Mortgage Status in San Mateo County
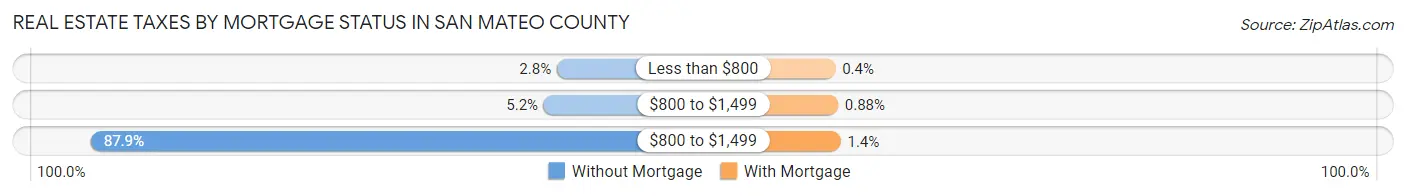
| Property Taxes | Without Mortgage | With Mortgage |
| Less than $800 | 1,391 (2.8%) | 427 (0.4%) |
| $800 to $1,499 | 2,592 (5.1%) | 941 (0.9%) |
| $800 to $1,499 | 44,224 (87.9%) | 1,468 (1.4%) |
| Total | 50,314 (100.0%) | 107,054 (100.0%) |
Health & Disability in San Mateo County
Health Insurance Coverage by Age in San Mateo County
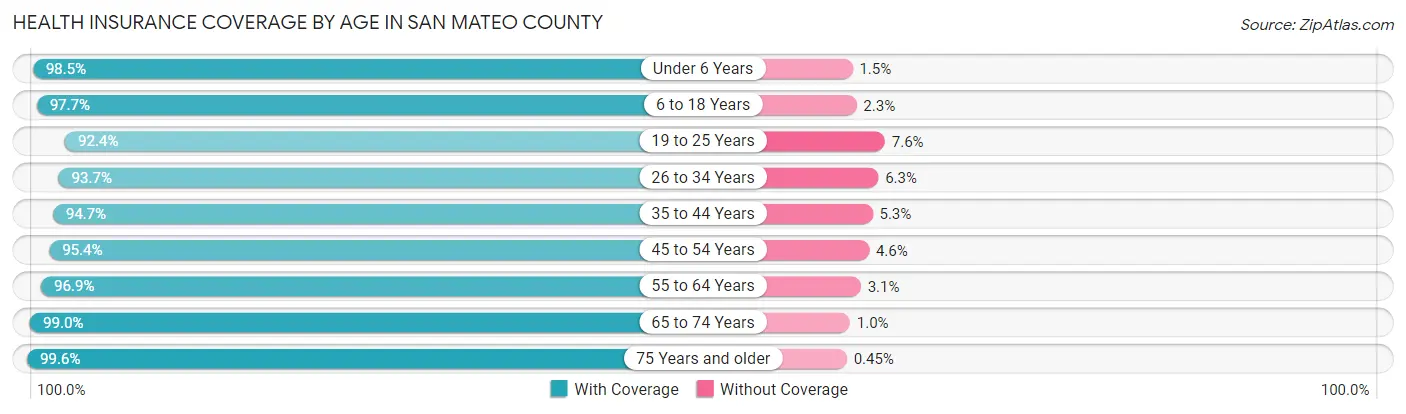
| Age Bracket | With Coverage | Without Coverage |
| Under 6 Years | 47,820 (98.5%) | 737 (1.5%) |
| 6 to 18 Years | 107,915 (97.7%) | 2,491 (2.3%) |
| 19 to 25 Years | 51,635 (92.4%) | 4,220 (7.6%) |
| 26 to 34 Years | 93,951 (93.7%) | 6,350 (6.3%) |
| 35 to 44 Years | 103,460 (94.7%) | 5,744 (5.3%) |
| 45 to 54 Years | 97,841 (95.4%) | 4,716 (4.6%) |
| 55 to 64 Years | 95,136 (96.9%) | 3,013 (3.1%) |
| 65 to 74 Years | 70,830 (99.0%) | 741 (1.0%) |
| 75 Years and older | 53,709 (99.6%) | 241 (0.4%) |
| Total | 722,297 (96.2%) | 28,253 (3.8%) |
Health Insurance Coverage by Citizenship Status in San Mateo County
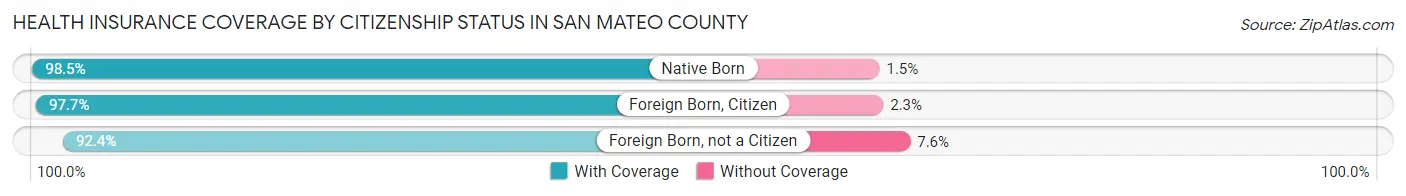
| Citizenship Status | With Coverage | Without Coverage |
| Native Born | 47,820 (98.5%) | 737 (1.5%) |
| Foreign Born, Citizen | 107,915 (97.7%) | 2,491 (2.3%) |
| Foreign Born, not a Citizen | 51,635 (92.4%) | 4,220 (7.6%) |
Health Insurance Coverage by Household Income in San Mateo County
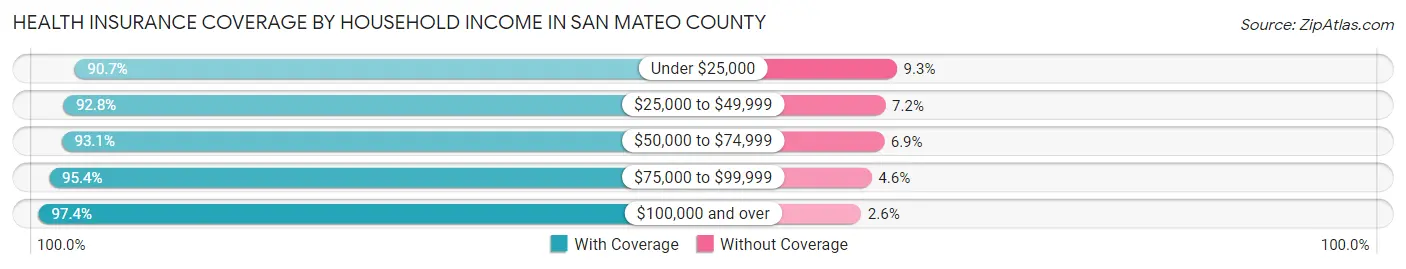
| Household Income | With Coverage | Without Coverage |
| Under $25,000 | 30,150 (90.7%) | 3,105 (9.3%) |
| $25,000 to $49,999 | 47,681 (92.8%) | 3,693 (7.2%) |
| $50,000 to $74,999 | 51,940 (93.1%) | 3,870 (6.9%) |
| $75,000 to $99,999 | 54,374 (95.4%) | 2,629 (4.6%) |
| $100,000 and over | 529,900 (97.4%) | 14,378 (2.6%) |
Public vs Private Health Insurance Coverage by Age in San Mateo County
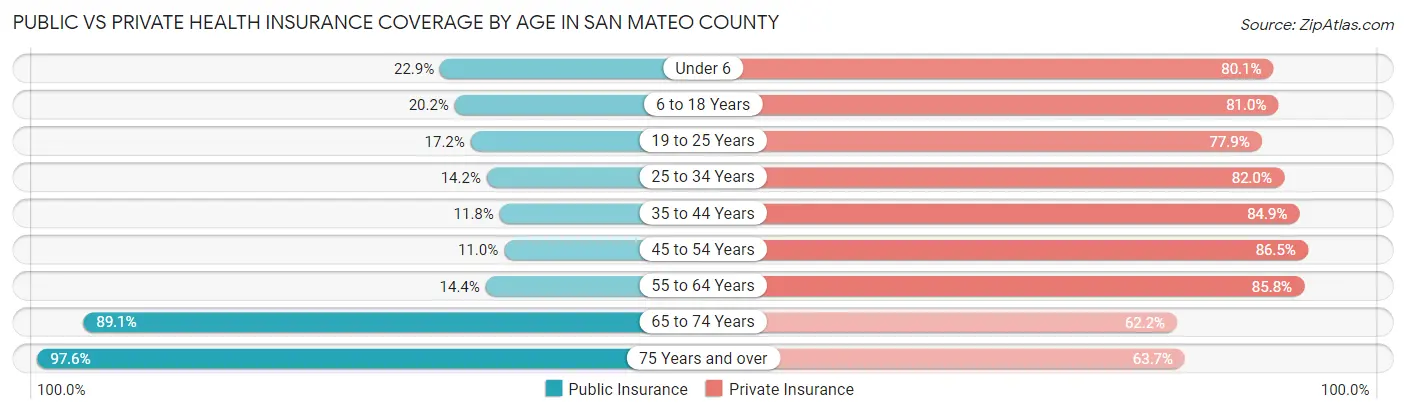
| Age Bracket | Public Insurance | Private Insurance |
| Under 6 | 11,117 (22.9%) | 38,890 (80.1%) |
| 6 to 18 Years | 22,266 (20.2%) | 89,433 (81.0%) |
| 19 to 25 Years | 9,617 (17.2%) | 43,511 (77.9%) |
| 25 to 34 Years | 14,267 (14.2%) | 82,275 (82.0%) |
| 35 to 44 Years | 12,919 (11.8%) | 92,717 (84.9%) |
| 45 to 54 Years | 11,300 (11.0%) | 88,683 (86.5%) |
| 55 to 64 Years | 14,158 (14.4%) | 84,178 (85.8%) |
| 65 to 74 Years | 63,768 (89.1%) | 44,515 (62.2%) |
| 75 Years and over | 52,678 (97.6%) | 34,349 (63.7%) |
| Total | 212,090 (28.3%) | 598,551 (79.7%) |
Disability Status by Sex by Age in San Mateo County
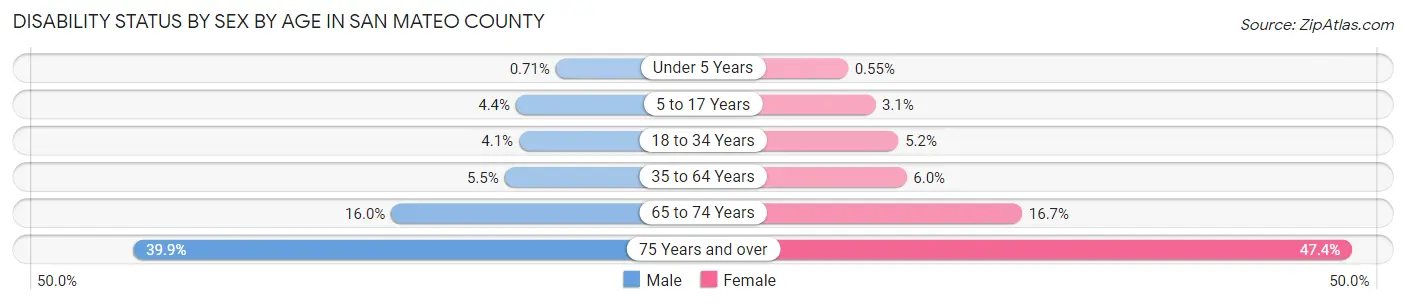
| Age Bracket | Male | Female |
| Under 5 Years | 146 (0.7%) | 105 (0.5%) |
| 5 to 17 Years | 2,495 (4.4%) | 1,656 (3.1%) |
| 18 to 34 Years | 3,557 (4.1%) | 4,132 (5.2%) |
| 35 to 64 Years | 8,501 (5.5%) | 9,241 (6.0%) |
| 65 to 74 Years | 5,349 (16.0%) | 6,365 (16.7%) |
| 75 Years and over | 8,777 (39.9%) | 15,142 (47.4%) |
Disability Class by Sex by Age in San Mateo County
Disability Class: Hearing Difficulty
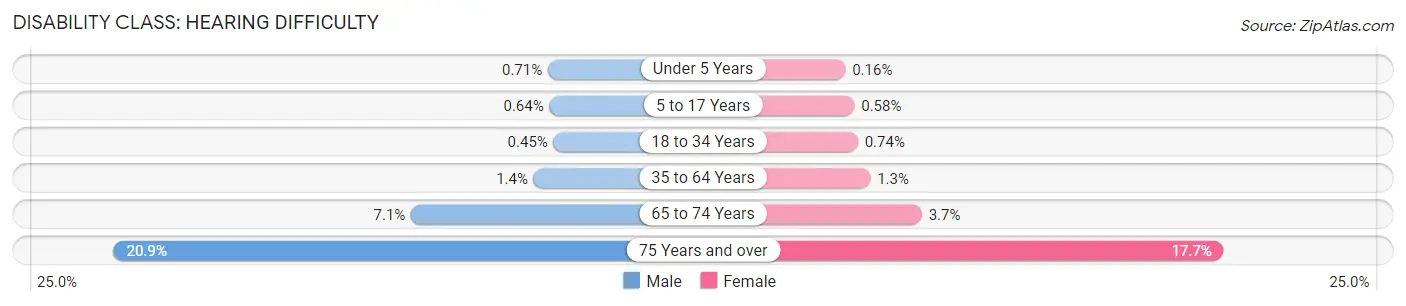
| Age Bracket | Male | Female |
| Under 5 Years | 146 (0.7%) | 31 (0.2%) |
| 5 to 17 Years | 360 (0.6%) | 311 (0.6%) |
| 18 to 34 Years | 387 (0.4%) | 584 (0.7%) |
| 35 to 64 Years | 2,126 (1.4%) | 2,033 (1.3%) |
| 65 to 74 Years | 2,363 (7.1%) | 1,414 (3.7%) |
| 75 Years and over | 4,588 (20.9%) | 5,665 (17.7%) |
Disability Class: Vision Difficulty
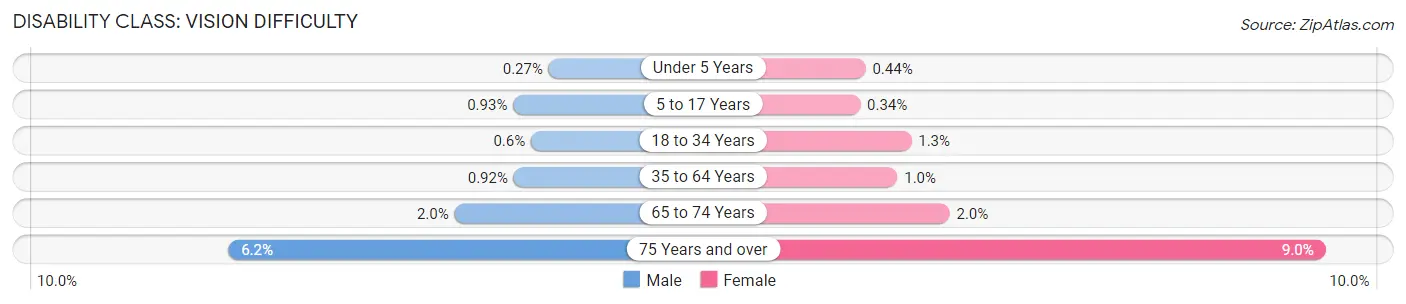
| Age Bracket | Male | Female |
| Under 5 Years | 56 (0.3%) | 84 (0.4%) |
| 5 to 17 Years | 525 (0.9%) | 184 (0.3%) |
| 18 to 34 Years | 516 (0.6%) | 1,019 (1.3%) |
| 35 to 64 Years | 1,433 (0.9%) | 1,596 (1.0%) |
| 65 to 74 Years | 675 (2.0%) | 760 (2.0%) |
| 75 Years and over | 1,366 (6.2%) | 2,872 (9.0%) |
Disability Class: Cognitive Difficulty
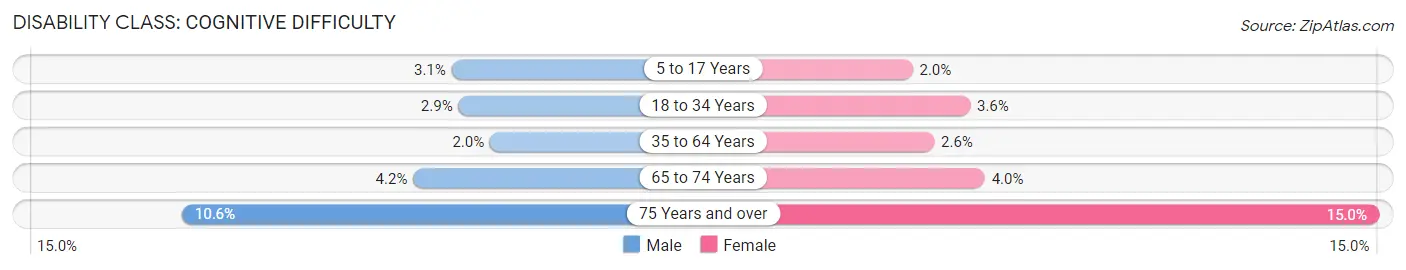
| Age Bracket | Male | Female |
| 5 to 17 Years | 1,755 (3.1%) | 1,062 (2.0%) |
| 18 to 34 Years | 2,515 (2.9%) | 2,814 (3.6%) |
| 35 to 64 Years | 3,175 (2.0%) | 3,965 (2.6%) |
| 65 to 74 Years | 1,399 (4.2%) | 1,518 (4.0%) |
| 75 Years and over | 2,334 (10.6%) | 4,781 (14.9%) |
Disability Class: Ambulatory Difficulty
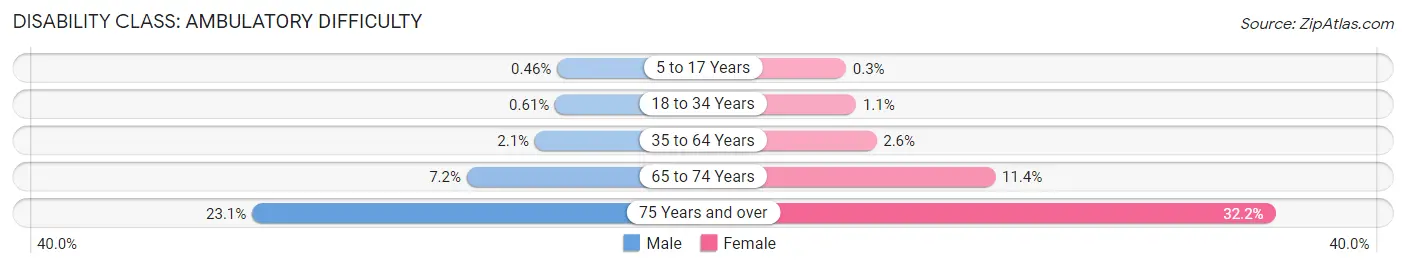
| Age Bracket | Male | Female |
| 5 to 17 Years | 259 (0.5%) | 159 (0.3%) |
| 18 to 34 Years | 522 (0.6%) | 831 (1.1%) |
| 35 to 64 Years | 3,281 (2.1%) | 3,942 (2.6%) |
| 65 to 74 Years | 2,402 (7.2%) | 4,335 (11.4%) |
| 75 Years and over | 5,080 (23.1%) | 10,290 (32.2%) |
Disability Class: Self-Care Difficulty
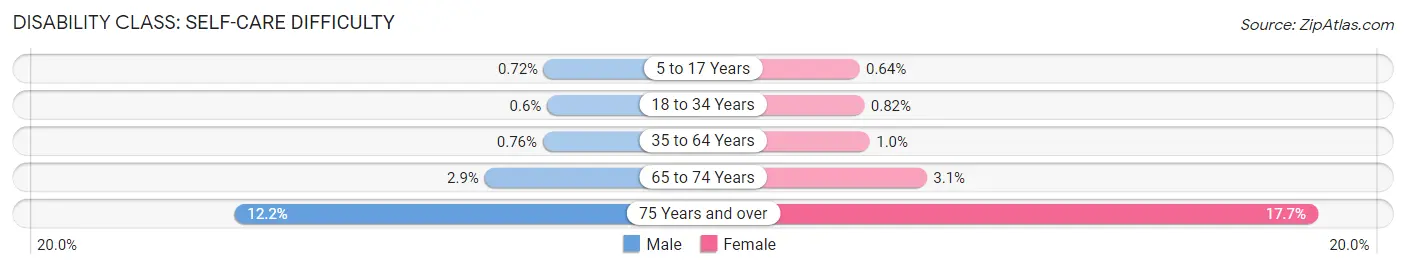
| Age Bracket | Male | Female |
| 5 to 17 Years | 405 (0.7%) | 343 (0.6%) |
| 18 to 34 Years | 519 (0.6%) | 643 (0.8%) |
| 35 to 64 Years | 1,187 (0.8%) | 1,576 (1.0%) |
| 65 to 74 Years | 979 (2.9%) | 1,197 (3.1%) |
| 75 Years and over | 2,684 (12.2%) | 5,648 (17.7%) |
Technology Access in San Mateo County
Computing Device Access in San Mateo County
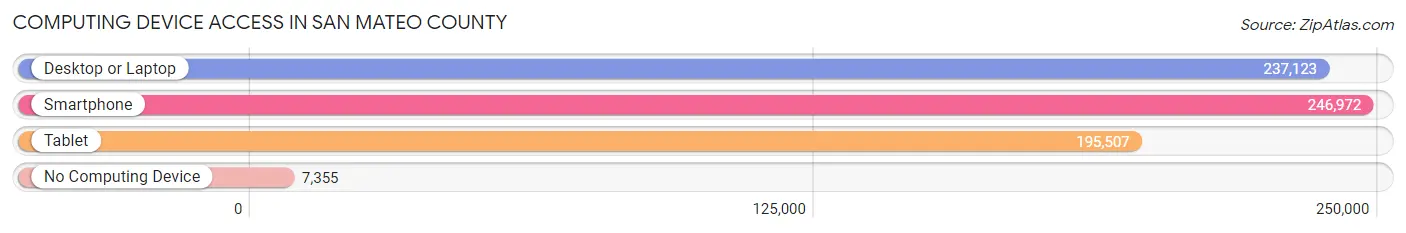
| Device Type | # Households | % Households |
| Desktop or Laptop | 237,123 | 89.7% |
| Smartphone | 246,972 | 93.4% |
| Tablet | 195,507 | 74.0% |
| No Computing Device | 7,355 | 2.8% |
| Total | 264,323 | 100.0% |
Internet Access in San Mateo County
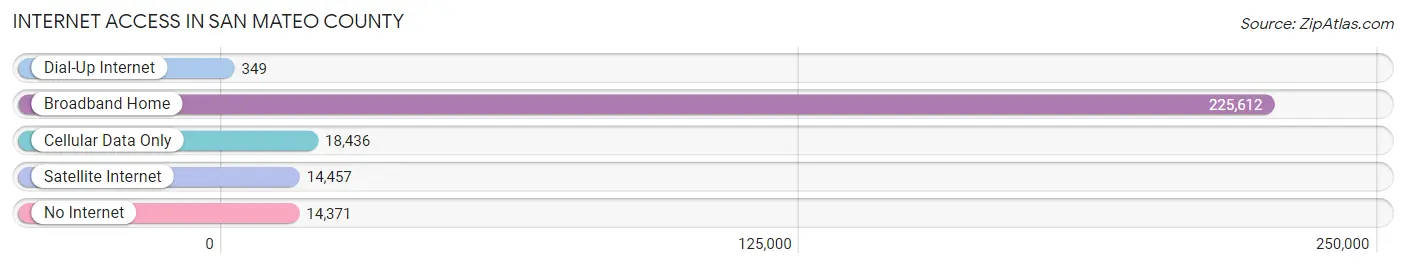
| Internet Type | # Households | % Households |
| Dial-Up Internet | 349 | 0.1% |
| Broadband Home | 225,612 | 85.4% |
| Cellular Data Only | 18,436 | 7.0% |
| Satellite Internet | 14,457 | 5.5% |
| No Internet | 14,371 | 5.4% |
| Total | 264,323 | 100.0% |
San Mateo County Summary
San Mateo County, California is located in the San Francisco Bay Area of the state and is one of the most populous counties in the state. It is bordered by San Francisco and Marin Counties to the north, Santa Clara County to the south, and Alameda County to the east. The county seat is Redwood City, and the county is home to a population of approximately 764,000 people.
History
San Mateo County was originally part of the Spanish Empire, and was part of the Rancho de las Pulgas land grant in 1835. The county was officially established in 1856, and was named after the Spanish name for Saint Matthew. The county was initially populated by Native Americans, and was later settled by Spanish and Mexican settlers. The county was also home to a large number of Chinese immigrants in the late 19th century.
Geography
San Mateo County is located in the San Francisco Bay Area of California, and is bordered by San Francisco and Marin Counties to the north, Santa Clara County to the south, and Alameda County to the east. The county covers an area of approximately 741 square miles, and is home to a variety of landscapes, including coastal bluffs, rolling hills, and redwood forests. The highest point in the county is the peak of Montara Mountain, which stands at 2,427 feet.
Economy
San Mateo County is home to a diverse economy, with a variety of industries represented. The county is home to a number of technology companies, including Oracle, Electronic Arts, and Google. The county is also home to a number of financial institutions, including Visa, Wells Fargo, and Bank of America. The county is also home to a number of healthcare providers, including Stanford Health Care and Kaiser Permanente. The county is also home to a number of retail outlets, including the Hillsdale Shopping Center and the Stanford Shopping Center.
Demographics
As of the 2010 census, San Mateo County had a population of 764,000 people. The racial makeup of the county was 57.2% White, 18.2% Asian, 11.3% Hispanic or Latino, 8.2% African American, 0.7% Native American, and 2.4% from other races. The median household income in the county was $90,890, and the median family income was $106,890. The county is home to a number of educational institutions, including Stanford University, San Mateo Community College, and the University of San Francisco.
Common Questions
What is Per Capita Income in San Mateo County?
Per Capita income in San Mateo County is $77,741.
What is the Median Family Income in San Mateo County?
Median Family Income in San Mateo County is $175,776.
What is the Median Household income in San Mateo County?
Median Household Income in San Mateo County is $149,907.
What is Income or Wage Gap in San Mateo County?
Income or Wage Gap in San Mateo County is 19.3%.
Women in San Mateo County earn 80.7 cents for every dollar earned by a man.
What is Family Income Deficit in San Mateo County?
Family Income Deficit in San Mateo County is $10,991.
Families that are below poverty line in San Mateo County earn $10,991 less on average than the poverty threshold level.
What is Inequality or Gini Index in San Mateo County?
Inequality or Gini Index in San Mateo County is 0.49.
What is the Total Population of San Mateo County?
Total Population of San Mateo County is 754,250.
What is the Total Male Population of San Mateo County?
Total Male Population of San Mateo County is 376,542.
What is the Total Female Population of San Mateo County?
Total Female Population of San Mateo County is 377,708.
What is the Ratio of Males per 100 Females in San Mateo County?
There are 99.69 Males per 100 Females in San Mateo County.
What is the Ratio of Females per 100 Males in San Mateo County?
There are 100.31 Females per 100 Males in San Mateo County.
What is the Median Population Age in San Mateo County?
Median Population Age in San Mateo County is 40.3 Years.
What is the Average Family Size in San Mateo County
Average Family Size in San Mateo County is 3.3 People.
What is the Average Household Size in San Mateo County
Average Household Size in San Mateo County is 2.8 People.
How Large is the Labor Force in San Mateo County?
There are 422,052 People in the Labor Forcein in San Mateo County.
What is the Percentage of People in the Labor Force in San Mateo County?
67.8% of People are in the Labor Force in San Mateo County.
What is the Unemployment Rate in San Mateo County?
Unemployment Rate in San Mateo County is 4.5%.