San Joaquin County, CA Map & Demographics
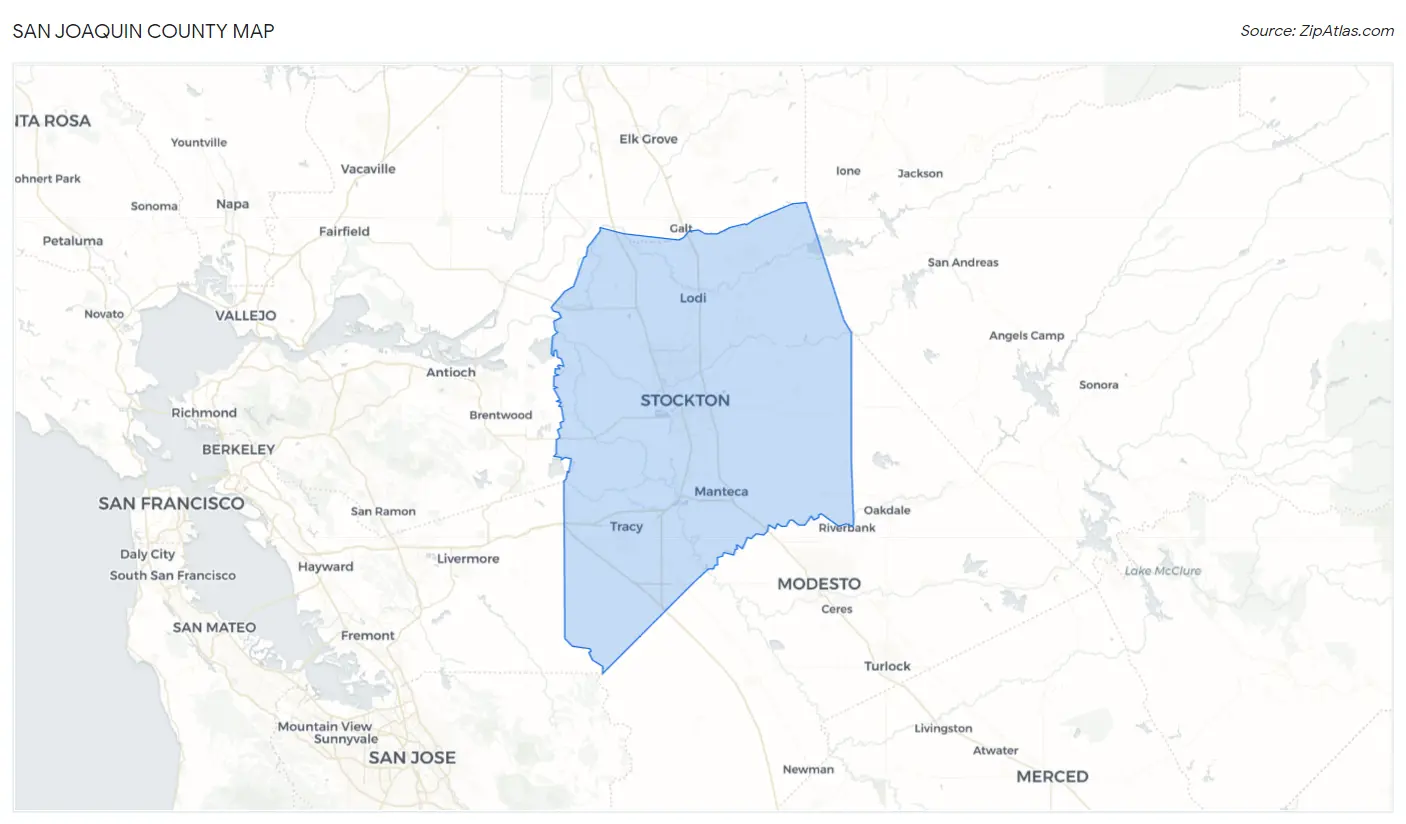
San Joaquin County Map
San Joaquin County Overview
$33,870
PER CAPITA INCOME
$91,565
AVG FAMILY INCOME
$82,837
AVG HOUSEHOLD INCOME
28.6%
WAGE / INCOME GAP [ % ]
71.4¢/ $1
WAGE / INCOME GAP [ $ ]
$11,453
FAMILY INCOME DEFICIT
0.44
INEQUALITY / GINI INDEX
779,445
TOTAL POPULATION
391,204
MALE POPULATION
388,241
FEMALE POPULATION
100.76
MALES / 100 FEMALES
99.24
FEMALES / 100 MALES
34.8
MEDIAN AGE
3.7
AVG FAMILY SIZE
3.2
AVG HOUSEHOLD SIZE
365,283
LABOR FORCE [ PEOPLE ]
61.3%
PERCENT IN LABOR FORCE
7.2%
UNEMPLOYMENT RATE
San Joaquin County Area Codes
Income in San Joaquin County
Income Overview in San Joaquin County
Per Capita Income in San Joaquin County is $33,870, while median incomes of families and households are $91,565 and $82,837 respectively.
| Characteristic | Number | Measure |
| Per Capita Income | 779,445 | $33,870 |
| Median Family Income | 177,846 | $91,565 |
| Mean Family Income | 177,846 | $116,537 |
| Median Household Income | 237,423 | $82,837 |
| Mean Household Income | 237,423 | $107,068 |
| Income Deficit | 177,846 | $11,453 |
| Wage / Income Gap (%) | 779,445 | 28.57% |
| Wage / Income Gap ($) | 779,445 | 71.43¢ per $1 |
| Gini / Inequality Index | 779,445 | 0.44 |
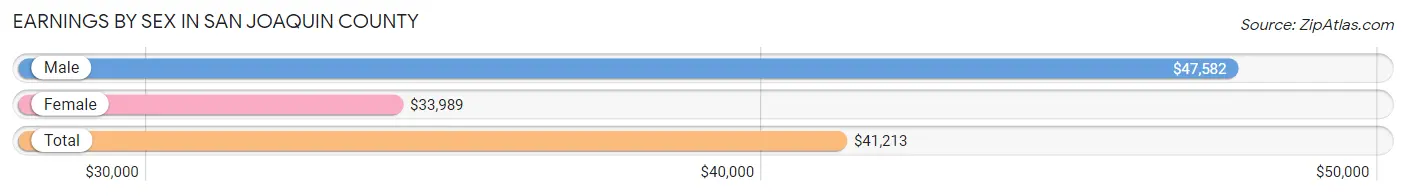
Earnings by Sex in San Joaquin County
Average Earnings in San Joaquin County are $41,213, $47,582 for men and $33,989 for women, a difference of 28.6%.
| Sex | Number | Average Earnings |
| Male | 203,928 (54.8%) | $47,582 |
| Female | 168,115 (45.2%) | $33,989 |
| Total | 372,043 (100.0%) | $41,213 |
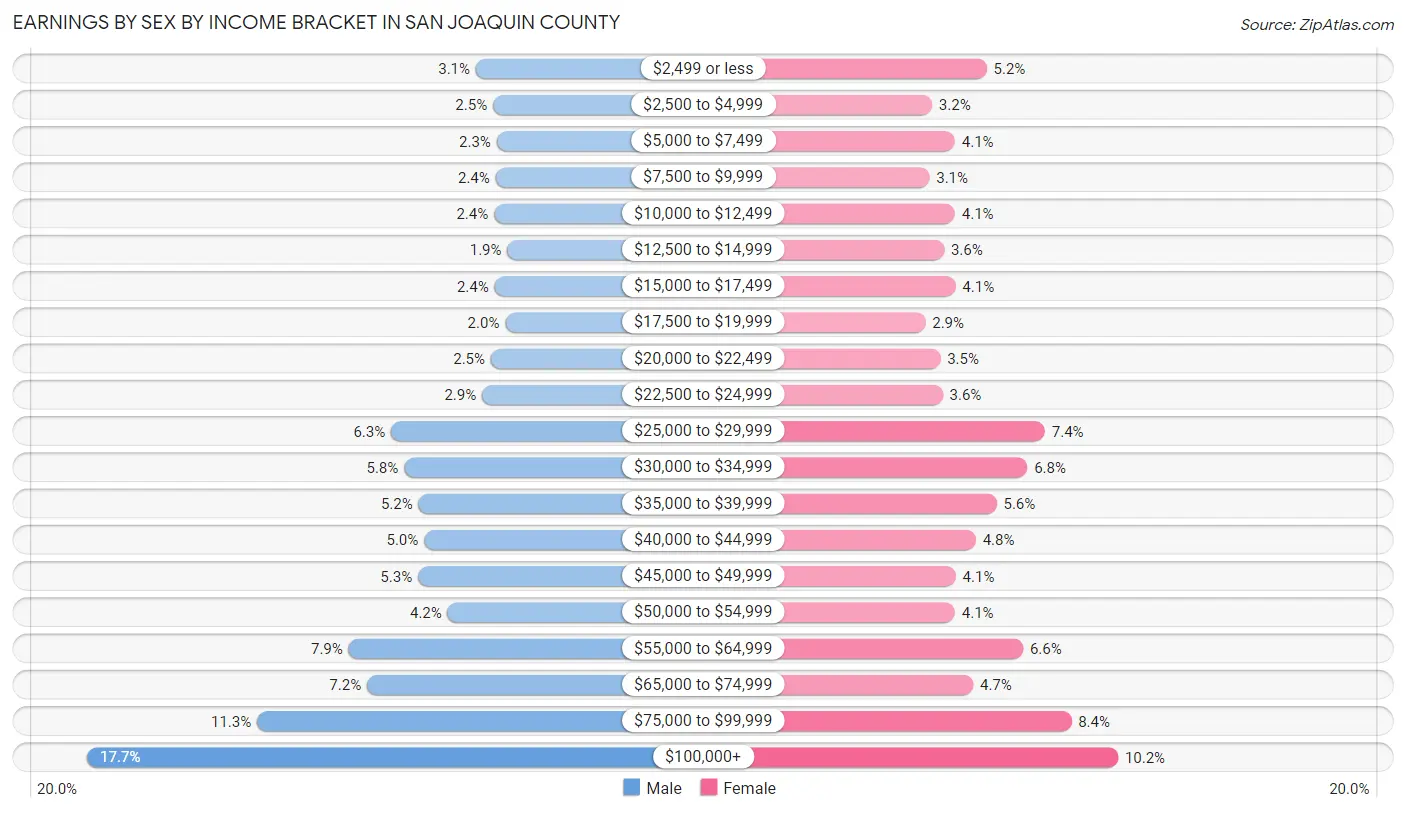
Earnings by Sex by Income Bracket in San Joaquin County
The most common earnings brackets in San Joaquin County are $100,000+ for men (36,006 | 17.7%) and $100,000+ for women (17,081 | 10.2%).
| Income | Male | Female |
| $2,499 or less | 6,310 (3.1%) | 8,815 (5.2%) |
| $2,500 to $4,999 | 4,991 (2.5%) | 5,356 (3.2%) |
| $5,000 to $7,499 | 4,717 (2.3%) | 6,815 (4.1%) |
| $7,500 to $9,999 | 4,798 (2.4%) | 5,191 (3.1%) |
| $10,000 to $12,499 | 4,906 (2.4%) | 6,802 (4.1%) |
| $12,500 to $14,999 | 3,887 (1.9%) | 6,114 (3.6%) |
| $15,000 to $17,499 | 4,870 (2.4%) | 6,837 (4.1%) |
| $17,500 to $19,999 | 4,067 (2.0%) | 4,938 (2.9%) |
| $20,000 to $22,499 | 5,161 (2.5%) | 5,890 (3.5%) |
| $22,500 to $24,999 | 5,835 (2.9%) | 6,029 (3.6%) |
| $25,000 to $29,999 | 12,784 (6.3%) | 12,477 (7.4%) |
| $30,000 to $34,999 | 11,781 (5.8%) | 11,372 (6.8%) |
| $35,000 to $39,999 | 10,690 (5.2%) | 9,437 (5.6%) |
| $40,000 to $44,999 | 10,267 (5.0%) | 8,117 (4.8%) |
| $45,000 to $49,999 | 10,731 (5.3%) | 6,853 (4.1%) |
| $50,000 to $54,999 | 8,458 (4.2%) | 6,810 (4.1%) |
| $55,000 to $64,999 | 16,032 (7.9%) | 11,093 (6.6%) |
| $65,000 to $74,999 | 14,614 (7.2%) | 7,952 (4.7%) |
| $75,000 to $99,999 | 23,023 (11.3%) | 14,136 (8.4%) |
| $100,000+ | 36,006 (17.7%) | 17,081 (10.2%) |
| Total | 203,928 (100.0%) | 168,115 (100.0%) |
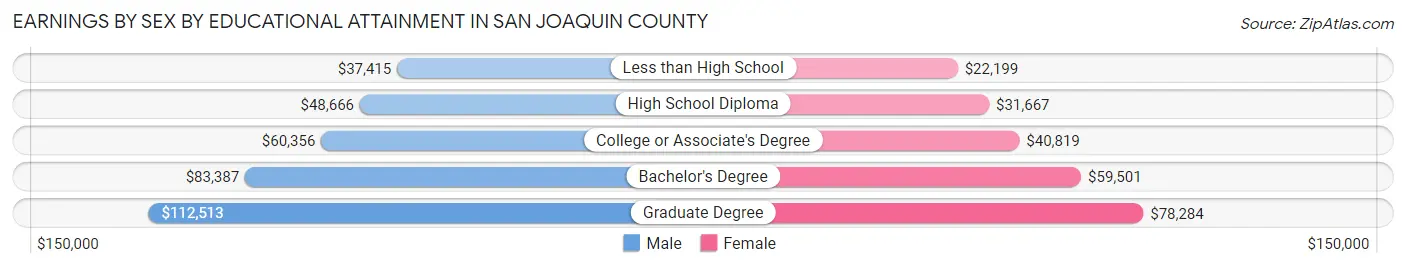
Earnings by Sex by Educational Attainment in San Joaquin County
Average earnings in San Joaquin County are $55,169 for men and $38,752 for women, a difference of 29.8%. Men with an educational attainment of graduate degree enjoy the highest average annual earnings of $112,513, while those with less than high school education earn the least with $37,415. Women with an educational attainment of graduate degree earn the most with the average annual earnings of $78,284, while those with less than high school education have the smallest earnings of $22,199.
| Educational Attainment | Male Income | Female Income |
| Less than High School | $37,415 | $22,199 |
| High School Diploma | $48,666 | $31,667 |
| College or Associate's Degree | $60,356 | $40,819 |
| Bachelor's Degree | $83,387 | $59,501 |
| Graduate Degree | $112,513 | $78,284 |
| Total | $55,169 | $38,752 |
Family Income in San Joaquin County
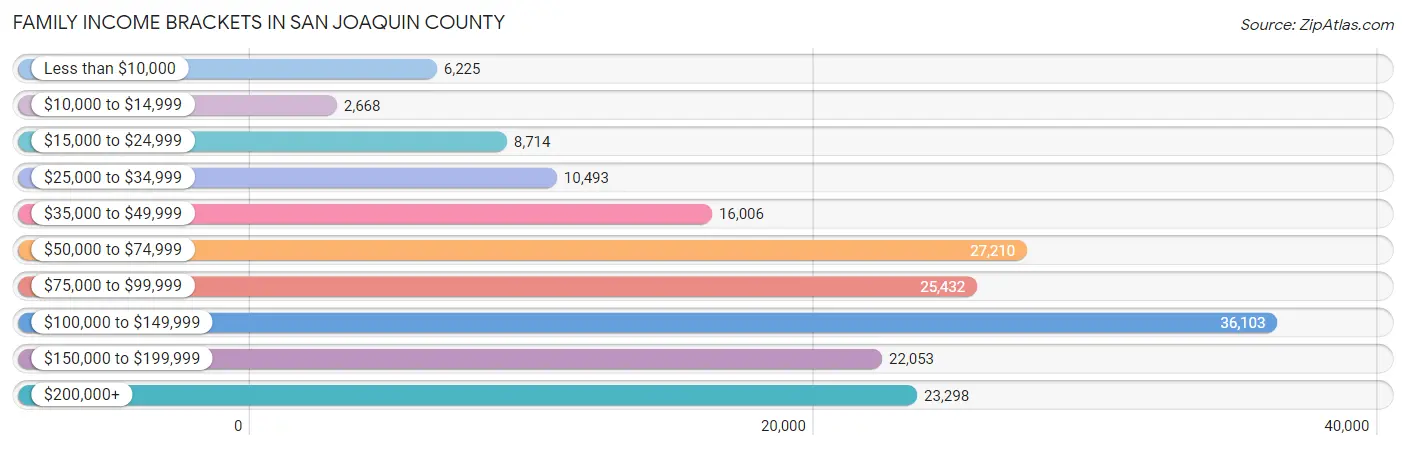
Family Income Brackets in San Joaquin County
According to the San Joaquin County family income data, there are 36,103 families falling into the $100,000 to $149,999 income range, which is the most common income bracket and makes up 20.3% of all families. Conversely, the $10,000 to $14,999 income bracket is the least frequent group with only 2,668 families (1.5%) belonging to this category.
| Income Bracket | # Families | % Families |
| Less than $10,000 | 6,225 | 3.5% |
| $10,000 to $14,999 | 2,668 | 1.5% |
| $15,000 to $24,999 | 8,714 | 4.9% |
| $25,000 to $34,999 | 10,493 | 5.9% |
| $35,000 to $49,999 | 16,006 | 9.0% |
| $50,000 to $74,999 | 27,210 | 15.3% |
| $75,000 to $99,999 | 25,432 | 14.3% |
| $100,000 to $149,999 | 36,103 | 20.3% |
| $150,000 to $199,999 | 22,053 | 12.4% |
| $200,000+ | 23,298 | 13.1% |
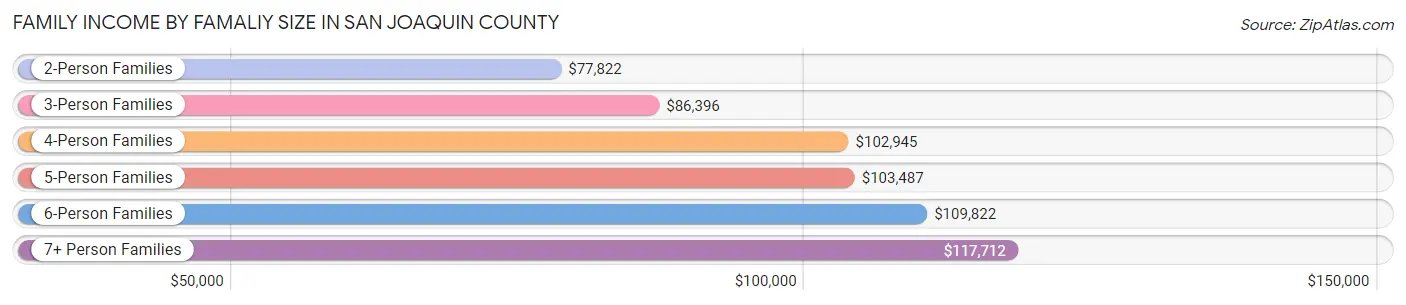
Family Income by Famaliy Size in San Joaquin County
7+ person families (8,059 | 4.5%) account for the highest median family income in San Joaquin County with $117,712 per family, while 2-person families (61,079 | 34.3%) have the highest median income of $38,911 per family member.
| Income Bracket | # Families | Median Income |
| 2-Person Families | 61,079 (34.3%) | $77,822 |
| 3-Person Families | 37,724 (21.2%) | $86,396 |
| 4-Person Families | 37,384 (21.0%) | $102,945 |
| 5-Person Families | 23,200 (13.0%) | $103,487 |
| 6-Person Families | 10,400 (5.9%) | $109,822 |
| 7+ Person Families | 8,059 (4.5%) | $117,712 |
| Total | 177,846 (100.0%) | $91,565 |
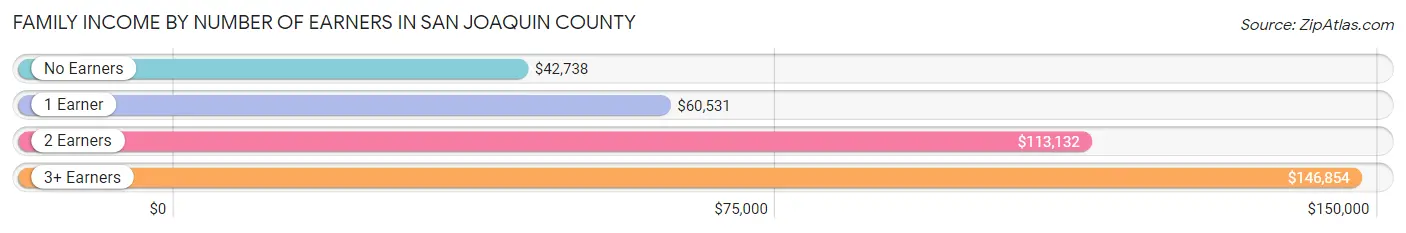
Family Income by Number of Earners in San Joaquin County
The median family income in San Joaquin County is $91,565, with families comprising 3+ earners (28,430) having the highest median family income of $146,854, while families with no earners (21,452) have the lowest median family income of $42,738, accounting for 16.0% and 12.1% of families, respectively.
| Number of Earners | # Families | Median Income |
| No Earners | 21,452 (12.1%) | $42,738 |
| 1 Earner | 61,199 (34.4%) | $60,531 |
| 2 Earners | 66,765 (37.5%) | $113,132 |
| 3+ Earners | 28,430 (16.0%) | $146,854 |
| Total | 177,846 (100.0%) | $91,565 |
Household Income in San Joaquin County
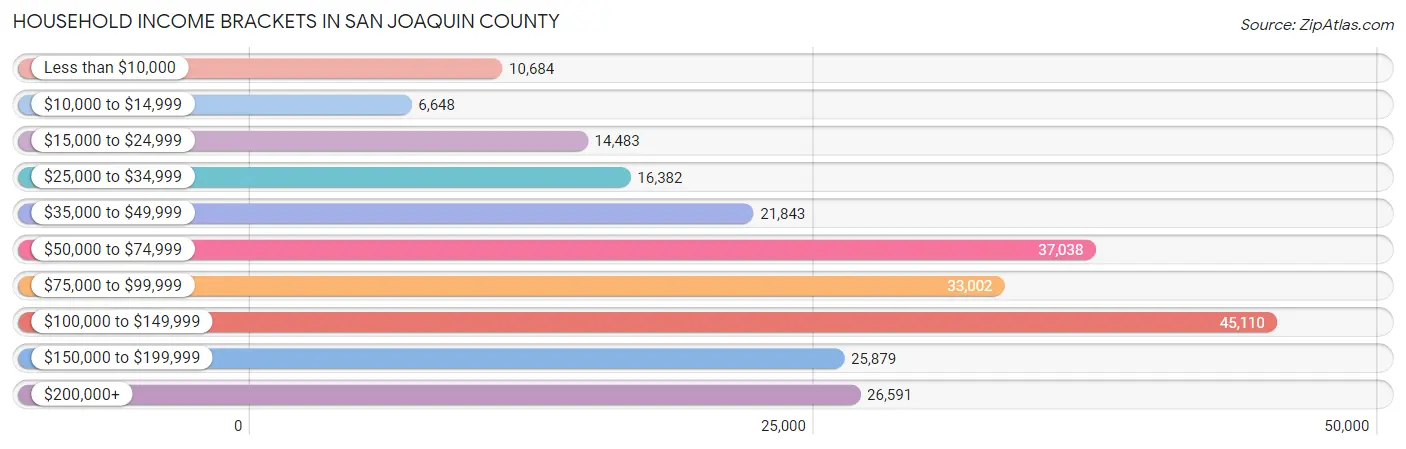
Household Income Brackets in San Joaquin County
With 45,110 households falling in the category, the $100,000 to $149,999 income range is the most frequent in San Joaquin County, accounting for 19.0% of all households. In contrast, only 6,648 households (2.8%) fall into the $10,000 to $14,999 income bracket, making it the least populous group.
| Income Bracket | # Households | % Households |
| Less than $10,000 | 10,684 | 4.5% |
| $10,000 to $14,999 | 6,648 | 2.8% |
| $15,000 to $24,999 | 14,483 | 6.1% |
| $25,000 to $34,999 | 16,382 | 6.9% |
| $35,000 to $49,999 | 21,843 | 9.2% |
| $50,000 to $74,999 | 37,038 | 15.6% |
| $75,000 to $99,999 | 33,002 | 13.9% |
| $100,000 to $149,999 | 45,110 | 19.0% |
| $150,000 to $199,999 | 25,879 | 10.9% |
| $200,000+ | 26,591 | 11.2% |
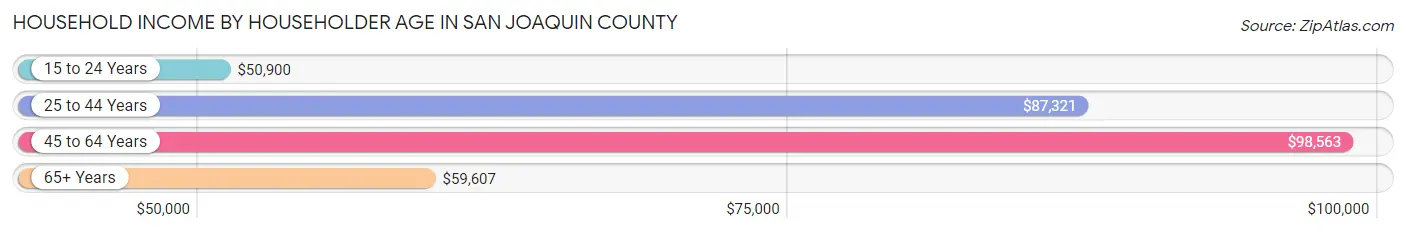
Household Income by Householder Age in San Joaquin County
The median household income in San Joaquin County is $82,837, with the highest median household income of $98,563 found in the 45 to 64 years age bracket for the primary householder. A total of 90,933 households (38.3%) fall into this category. Meanwhile, the 15 to 24 years age bracket for the primary householder has the lowest median household income of $50,900, with 5,604 households (2.4%) in this group.
| Income Bracket | # Households | Median Income |
| 15 to 24 Years | 5,604 (2.4%) | $50,900 |
| 25 to 44 Years | 85,975 (36.2%) | $87,321 |
| 45 to 64 Years | 90,933 (38.3%) | $98,563 |
| 65+ Years | 54,911 (23.1%) | $59,607 |
| Total | 237,423 (100.0%) | $82,837 |
Poverty in San Joaquin County
Income Below Poverty by Sex and Age in San Joaquin County
With 11.7% poverty level for males and 14.1% for females among the residents of San Joaquin County, 5 year old males and under 5 year old females are the most vulnerable to poverty, with 1,002 males (19.3%) and 5,004 females (20.2%) in their respective age groups living below the poverty level.
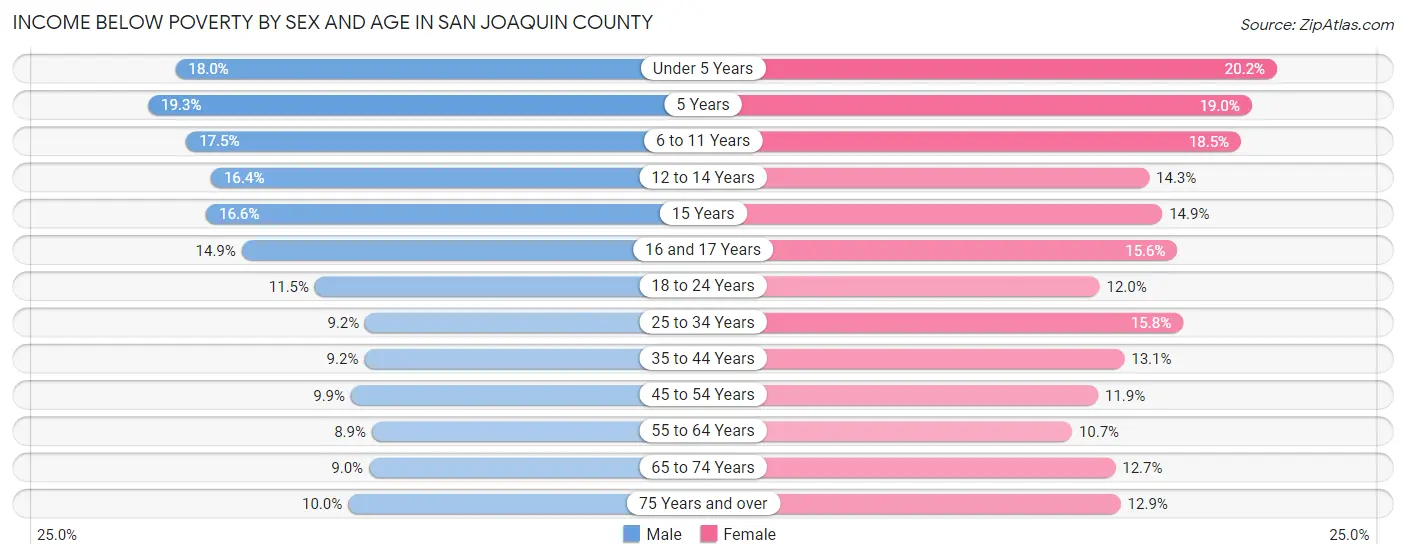
| Age Bracket | Male | Female |
| Under 5 Years | 4,677 (18.0%) | 5,004 (20.2%) |
| 5 Years | 1,002 (19.3%) | 866 (19.0%) |
| 6 to 11 Years | 6,188 (17.5%) | 6,143 (18.5%) |
| 12 to 14 Years | 3,211 (16.4%) | 2,575 (14.3%) |
| 15 Years | 1,025 (16.6%) | 931 (14.9%) |
| 16 and 17 Years | 1,874 (14.9%) | 1,755 (15.6%) |
| 18 to 24 Years | 4,352 (11.5%) | 4,276 (12.0%) |
| 25 to 34 Years | 4,989 (9.2%) | 8,318 (15.8%) |
| 35 to 44 Years | 4,855 (9.2%) | 6,776 (13.1%) |
| 45 to 54 Years | 4,581 (9.9%) | 5,478 (11.9%) |
| 55 to 64 Years | 3,740 (8.9%) | 4,643 (10.7%) |
| 65 to 74 Years | 2,423 (9.0%) | 4,036 (12.7%) |
| 75 Years and over | 1,614 (10.0%) | 3,020 (12.9%) |
| Total | 44,531 (11.7%) | 53,821 (14.1%) |
Income Above Poverty by Sex and Age in San Joaquin County
According to the poverty statistics in San Joaquin County, males aged 55 to 64 years and females aged 55 to 64 years are the age groups that are most secure financially, with 91.1% of males and 89.3% of females in these age groups living above the poverty line.
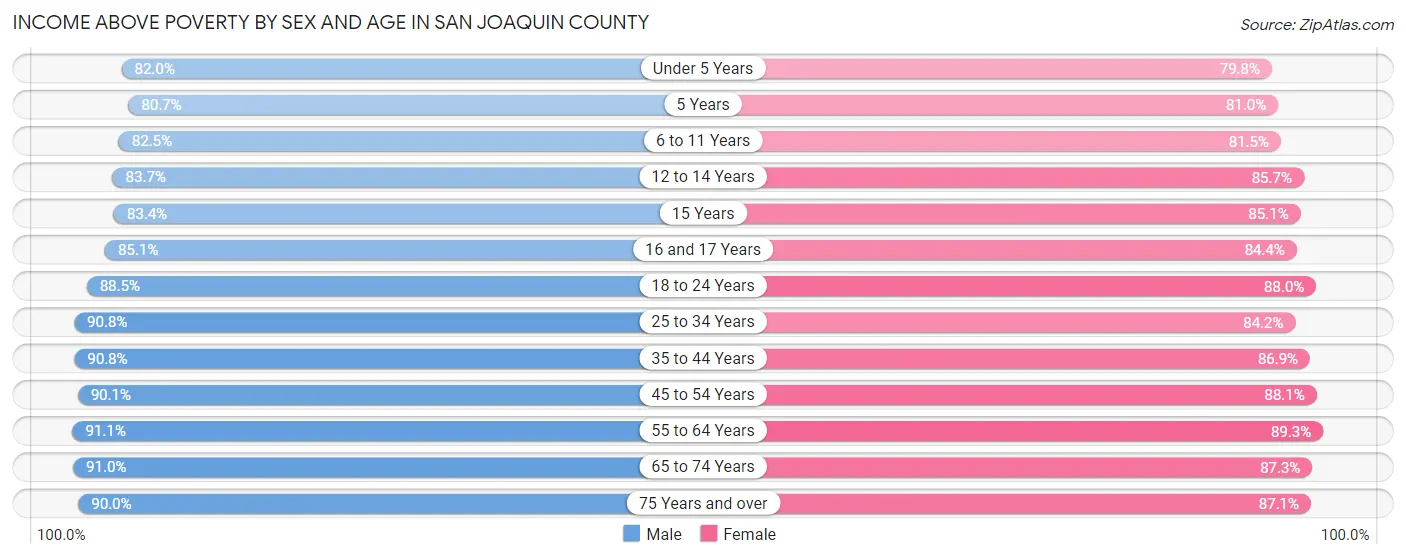
| Age Bracket | Male | Female |
| Under 5 Years | 21,312 (82.0%) | 19,777 (79.8%) |
| 5 Years | 4,198 (80.7%) | 3,686 (81.0%) |
| 6 to 11 Years | 29,167 (82.5%) | 27,019 (81.5%) |
| 12 to 14 Years | 16,428 (83.7%) | 15,479 (85.7%) |
| 15 Years | 5,156 (83.4%) | 5,329 (85.1%) |
| 16 and 17 Years | 10,681 (85.1%) | 9,515 (84.4%) |
| 18 to 24 Years | 33,387 (88.5%) | 31,487 (88.0%) |
| 25 to 34 Years | 49,223 (90.8%) | 44,237 (84.2%) |
| 35 to 44 Years | 47,702 (90.8%) | 44,903 (86.9%) |
| 45 to 54 Years | 41,897 (90.1%) | 40,597 (88.1%) |
| 55 to 64 Years | 38,342 (91.1%) | 38,818 (89.3%) |
| 65 to 74 Years | 24,444 (91.0%) | 27,771 (87.3%) |
| 75 Years and over | 14,535 (90.0%) | 20,312 (87.1%) |
| Total | 336,472 (88.3%) | 328,930 (85.9%) |
Income Below Poverty Among Married-Couple Families in San Joaquin County
The poverty statistics for married-couple families in San Joaquin County show that 6.1% or 7,485 of the total 122,617 families live below the poverty line. Families with 5 or more children have the highest poverty rate of 22.9%, comprising of 357 families. On the other hand, families with no children have the lowest poverty rate of 4.2%, which includes 2,462 families.
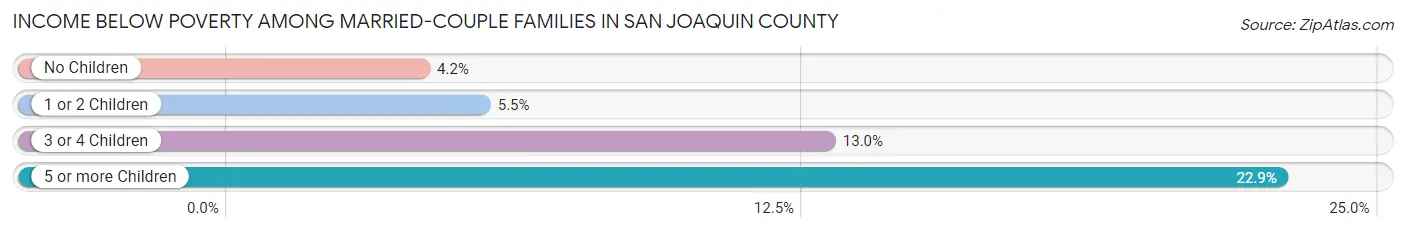
| Children | Above Poverty | Below Poverty |
| No Children | 56,416 (95.8%) | 2,462 (4.2%) |
| 1 or 2 Children | 43,071 (94.5%) | 2,506 (5.5%) |
| 3 or 4 Children | 14,440 (87.0%) | 2,160 (13.0%) |
| 5 or more Children | 1,205 (77.1%) | 357 (22.9%) |
| Total | 115,132 (93.9%) | 7,485 (6.1%) |
Income Below Poverty Among Single-Parent Households in San Joaquin County
According to the poverty data in San Joaquin County, 11.7% or 2,246 single-father households and 22.9% or 8,251 single-mother households are living below the poverty line. Among single-father households, those with 5 or more children have the highest poverty rate, with 48 households (22.8%) experiencing poverty. Likewise, among single-mother households, those with 5 or more children have the highest poverty rate, with 343 households (62.5%) falling below the poverty line.
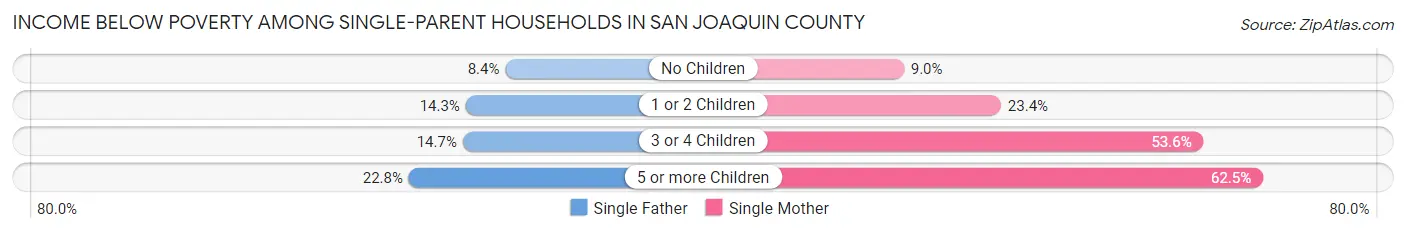
| Children | Single Father | Single Mother |
| No Children | 720 (8.4%) | 1,130 (9.0%) |
| 1 or 2 Children | 1,174 (14.3%) | 4,293 (23.4%) |
| 3 or 4 Children | 304 (14.7%) | 2,485 (53.6%) |
| 5 or more Children | 48 (22.8%) | 343 (62.5%) |
| Total | 2,246 (11.7%) | 8,251 (22.9%) |
Income Below Poverty Among Married-Couple vs Single-Parent Households in San Joaquin County
The poverty data for San Joaquin County shows that 7,485 of the married-couple family households (6.1%) and 10,497 of the single-parent households (19.0%) are living below the poverty level. Within the married-couple family households, those with 5 or more children have the highest poverty rate, with 357 households (22.9%) falling below the poverty line. Among the single-parent households, those with 5 or more children have the highest poverty rate, with 391 household (51.4%) living below poverty.
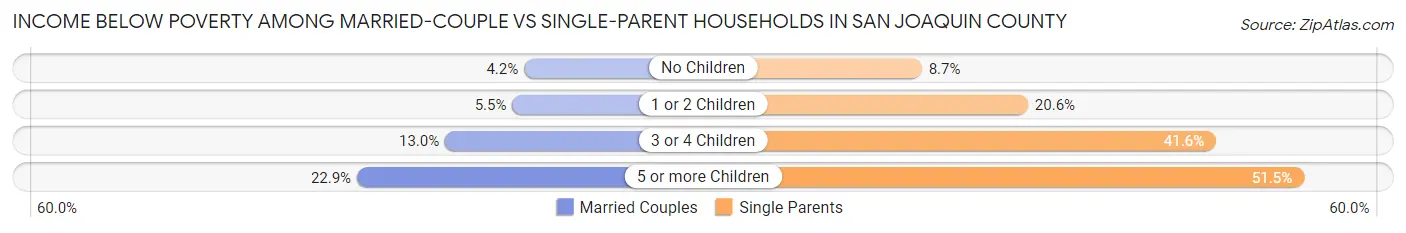
| Children | Married-Couple Families | Single-Parent Households |
| No Children | 2,462 (4.2%) | 1,850 (8.7%) |
| 1 or 2 Children | 2,506 (5.5%) | 5,467 (20.6%) |
| 3 or 4 Children | 2,160 (13.0%) | 2,789 (41.6%) |
| 5 or more Children | 357 (22.9%) | 391 (51.4%) |
| Total | 7,485 (6.1%) | 10,497 (19.0%) |
Race in San Joaquin County
The most populous races in San Joaquin County are Hispanic or Latino (331,382 | 42.5%), White / Caucasian (328,081 | 42.1%), and Two or more Races (143,390 | 18.4%).
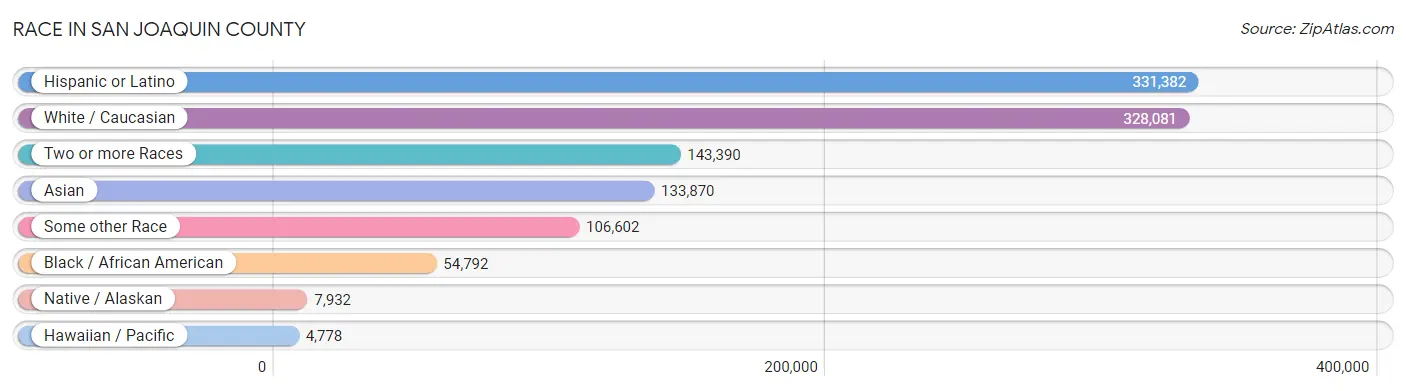
| Race | # Population | % Population |
| Asian | 133,870 | 17.2% |
| Black / African American | 54,792 | 7.0% |
| Hawaiian / Pacific | 4,778 | 0.6% |
| Hispanic or Latino | 331,382 | 42.5% |
| Native / Alaskan | 7,932 | 1.0% |
| White / Caucasian | 328,081 | 42.1% |
| Two or more Races | 143,390 | 18.4% |
| Some other Race | 106,602 | 13.7% |
| Total | 779,445 | 100.0% |
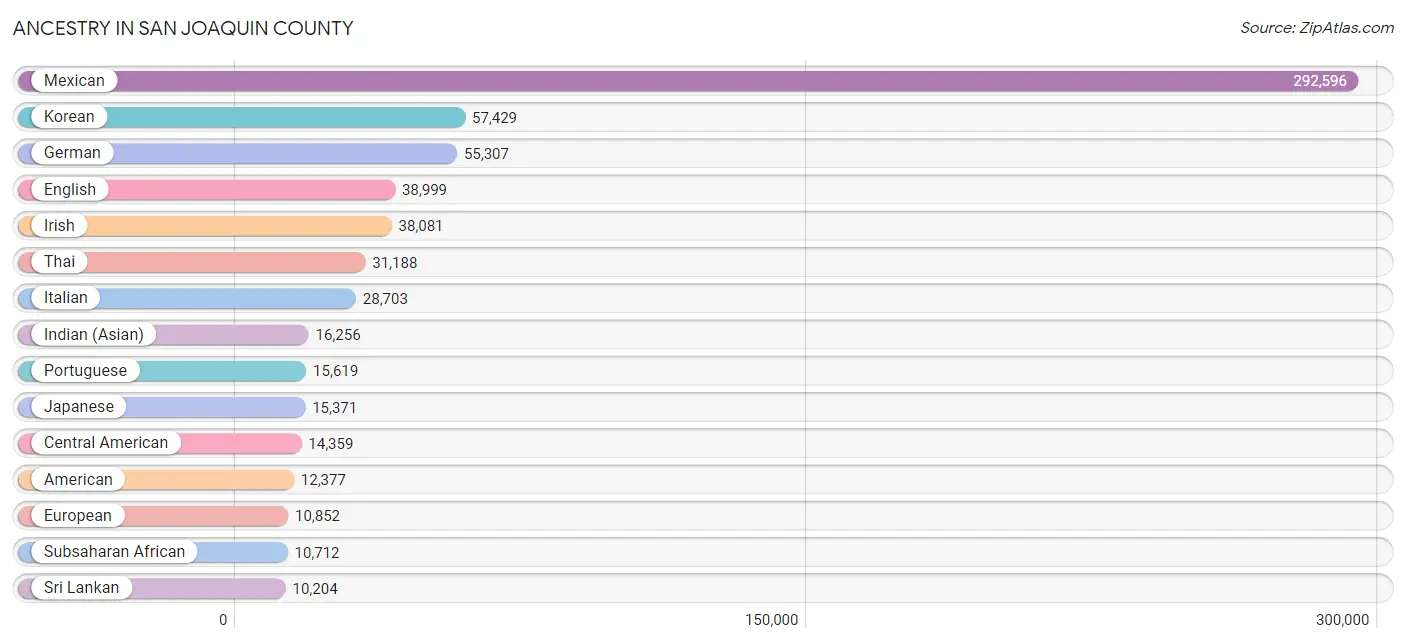
Ancestry in San Joaquin County
The most populous ancestries reported in San Joaquin County are Mexican (292,596 | 37.5%), Korean (57,429 | 7.4%), German (55,307 | 7.1%), English (38,999 | 5.0%), and Irish (38,081 | 4.9%), together accounting for 61.9% of all San Joaquin County residents.
| Ancestry | # Population | % Population |
| Afghan | 2,548 | 0.3% |
| African | 7,399 | 0.9% |
| Alaska Native | 15 | 0.0% |
| Alaskan Athabascan | 83 | 0.0% |
| Albanian | 100 | 0.0% |
| Aleut | 7 | 0.0% |
| Alsatian | 27 | 0.0% |
| American | 12,377 | 1.6% |
| Apache | 1,358 | 0.2% |
| Arab | 4,460 | 0.6% |
| Argentinean | 399 | 0.1% |
| Armenian | 365 | 0.1% |
| Assyrian / Chaldean / Syriac | 86 | 0.0% |
| Australian | 287 | 0.0% |
| Austrian | 716 | 0.1% |
| Bangladeshi | 6,253 | 0.8% |
| Barbadian | 26 | 0.0% |
| Basque | 316 | 0.0% |
| Belgian | 404 | 0.1% |
| Bhutanese | 6,301 | 0.8% |
| Blackfeet | 1,022 | 0.1% |
| Bolivian | 109 | 0.0% |
| Brazilian | 444 | 0.1% |
| British | 2,030 | 0.3% |
| British West Indian | 31 | 0.0% |
| Bulgarian | 19 | 0.0% |
| Burmese | 1,917 | 0.3% |
| Cajun | 21 | 0.0% |
| Cambodian | 39 | 0.0% |
| Canadian | 494 | 0.1% |
| Cape Verdean | 70 | 0.0% |
| Celtic | 33 | 0.0% |
| Central American | 14,359 | 1.8% |
| Central American Indian | 1,176 | 0.2% |
| Cherokee | 4,508 | 0.6% |
| Cheyenne | 17 | 0.0% |
| Chickasaw | 238 | 0.0% |
| Chilean | 264 | 0.0% |
| Chippewa | 268 | 0.0% |
| Choctaw | 1,002 | 0.1% |
| Colombian | 882 | 0.1% |
| Colville | 9 | 0.0% |
| Comanche | 135 | 0.0% |
| Costa Rican | 98 | 0.0% |
| Cree | 27 | 0.0% |
| Creek | 74 | 0.0% |
| Croatian | 568 | 0.1% |
| Crow | 25 | 0.0% |
| Cuban | 1,096 | 0.1% |
| Czech | 1,076 | 0.1% |
| Czechoslovakian | 489 | 0.1% |
| Danish | 2,806 | 0.4% |
| Delaware | 7 | 0.0% |
| Dominican | 190 | 0.0% |
| Dutch | 6,915 | 0.9% |
| Dutch West Indian | 17 | 0.0% |
| Eastern European | 890 | 0.1% |
| Ecuadorian | 326 | 0.0% |
| Egyptian | 332 | 0.0% |
| English | 38,999 | 5.0% |
| Estonian | 27 | 0.0% |
| Ethiopian | 86 | 0.0% |
| European | 10,852 | 1.4% |
| Filipino | 489 | 0.1% |
| Finnish | 415 | 0.1% |
| French | 8,770 | 1.1% |
| French American Indian | 35 | 0.0% |
| French Canadian | 1,015 | 0.1% |
| German | 55,307 | 7.1% |
| German Russian | 76 | 0.0% |
| Ghanaian | 354 | 0.1% |
| Greek | 2,189 | 0.3% |
| Guamanian / Chamorro | 1,722 | 0.2% |
| Guatemalan | 3,636 | 0.5% |
| Guyanese | 9 | 0.0% |
| Haitian | 104 | 0.0% |
| Honduran | 1,054 | 0.1% |
| Hopi | 174 | 0.0% |
| Houma | 11 | 0.0% |
| Hungarian | 768 | 0.1% |
| Icelander | 122 | 0.0% |
| Indian (Asian) | 16,256 | 2.1% |
| Indonesian | 396 | 0.1% |
| Inupiat | 62 | 0.0% |
| Iranian | 785 | 0.1% |
| Iraqi | 164 | 0.0% |
| Irish | 38,081 | 4.9% |
| Iroquois | 134 | 0.0% |
| Israeli | 92 | 0.0% |
| Italian | 28,703 | 3.7% |
| Jamaican | 285 | 0.0% |
| Japanese | 15,371 | 2.0% |
| Jordanian | 155 | 0.0% |
| Kenyan | 178 | 0.0% |
| Kiowa | 2 | 0.0% |
| Korean | 57,429 | 7.4% |
| Laotian | 465 | 0.1% |
| Latvian | 21 | 0.0% |
| Lebanese | 752 | 0.1% |
| Liberian | 546 | 0.1% |
| Lithuanian | 243 | 0.0% |
| Lumbee | 1 | 0.0% |
| Malaysian | 3,883 | 0.5% |
| Maltese | 99 | 0.0% |
| Mexican | 292,596 | 37.5% |
| Mexican American Indian | 2,682 | 0.3% |
| Moroccan | 16 | 0.0% |
| Native Hawaiian | 3,164 | 0.4% |
| Navajo | 616 | 0.1% |
| Nepalese | 264 | 0.0% |
| New Zealander | 41 | 0.0% |
| Nicaraguan | 2,450 | 0.3% |
| Nigerian | 1,678 | 0.2% |
| Northern European | 560 | 0.1% |
| Norwegian | 4,954 | 0.6% |
| Osage | 97 | 0.0% |
| Ottawa | 30 | 0.0% |
| Paiute | 136 | 0.0% |
| Pakistani | 1,416 | 0.2% |
| Palestinian | 760 | 0.1% |
| Panamanian | 315 | 0.0% |
| Pennsylvania German | 67 | 0.0% |
| Peruvian | 1,241 | 0.2% |
| Pima | 39 | 0.0% |
| Polish | 4,603 | 0.6% |
| Portuguese | 15,619 | 2.0% |
| Potawatomi | 63 | 0.0% |
| Pueblo | 165 | 0.0% |
| Puerto Rican | 5,783 | 0.7% |
| Puget Sound Salish | 26 | 0.0% |
| Romanian | 274 | 0.0% |
| Russian | 2,103 | 0.3% |
| Salvadoran | 6,695 | 0.9% |
| Samoan | 2,197 | 0.3% |
| Scandinavian | 1,198 | 0.2% |
| Scotch-Irish | 3,998 | 0.5% |
| Scottish | 7,140 | 0.9% |
| Seminole | 160 | 0.0% |
| Serbian | 22 | 0.0% |
| Shoshone | 11 | 0.0% |
| Sierra Leonean | 31 | 0.0% |
| Sioux | 961 | 0.1% |
| Slavic | 203 | 0.0% |
| Slovak | 122 | 0.0% |
| Slovene | 57 | 0.0% |
| South African | 27 | 0.0% |
| South American | 3,699 | 0.5% |
| South American Indian | 95 | 0.0% |
| Soviet Union | 6 | 0.0% |
| Spaniard | 3,761 | 0.5% |
| Spanish | 4,829 | 0.6% |
| Spanish American | 79 | 0.0% |
| Spanish American Indian | 6 | 0.0% |
| Sri Lankan | 10,204 | 1.3% |
| Subsaharan African | 10,712 | 1.4% |
| Swedish | 4,378 | 0.6% |
| Swiss | 1,343 | 0.2% |
| Syrian | 515 | 0.1% |
| Thai | 31,188 | 4.0% |
| Tlingit-Haida | 76 | 0.0% |
| Tohono O'Odham | 21 | 0.0% |
| Tongan | 648 | 0.1% |
| Trinidadian and Tobagonian | 171 | 0.0% |
| Turkish | 9 | 0.0% |
| Ukrainian | 513 | 0.1% |
| Uruguayan | 148 | 0.0% |
| Ute | 14 | 0.0% |
| Venezuelan | 324 | 0.0% |
| Vietnamese | 81 | 0.0% |
| Welsh | 2,379 | 0.3% |
| West Indian | 154 | 0.0% |
| Yakama | 6 | 0.0% |
| Yaqui | 400 | 0.1% |
| Yugoslavian | 348 | 0.0% |
| Yuman | 1 | 0.0% | View All 175 Rows |
Immigrants in San Joaquin County
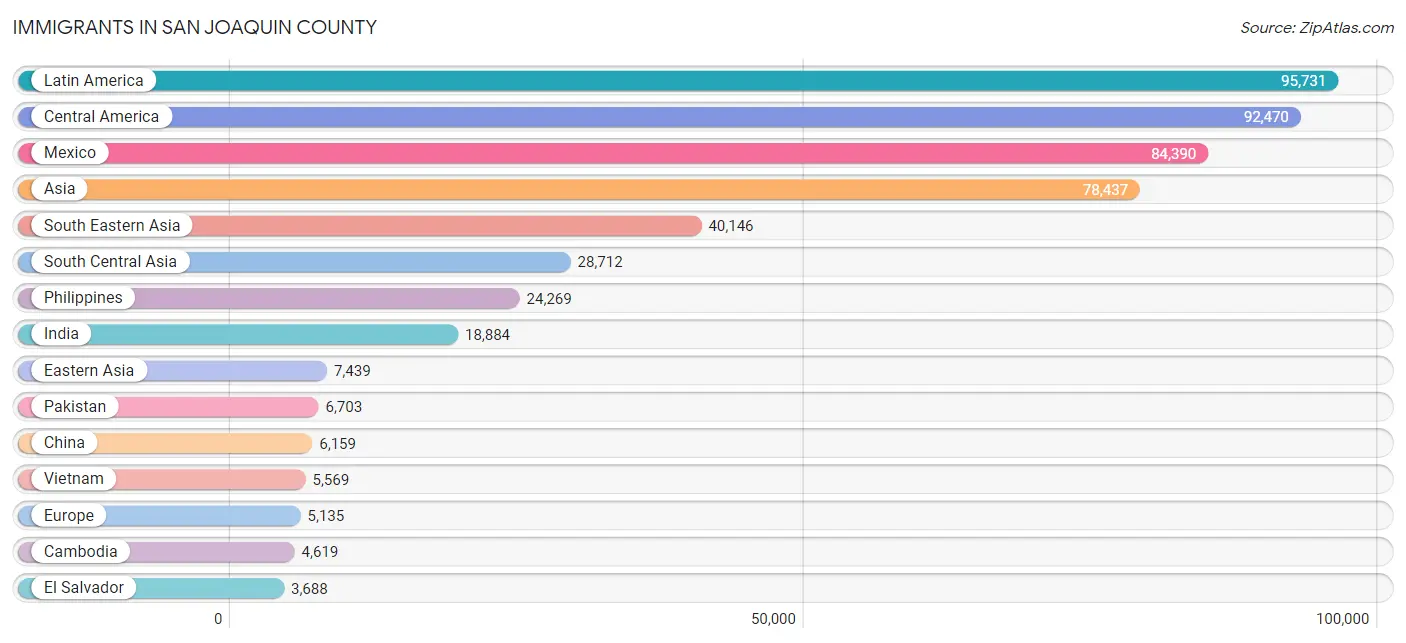
The most numerous immigrant groups reported in San Joaquin County came from Latin America (95,731 | 12.3%), Central America (92,470 | 11.9%), Mexico (84,390 | 10.8%), Asia (78,437 | 10.1%), and South Eastern Asia (40,146 | 5.1%), together accounting for 50.2% of all San Joaquin County residents.
| Immigration Origin | # Population | % Population |
| Afghanistan | 2,135 | 0.3% |
| Africa | 3,422 | 0.4% |
| Argentina | 400 | 0.1% |
| Armenia | 22 | 0.0% |
| Asia | 78,437 | 10.1% |
| Australia | 314 | 0.0% |
| Austria | 22 | 0.0% |
| Azores | 346 | 0.0% |
| Bangladesh | 111 | 0.0% |
| Barbados | 41 | 0.0% |
| Belarus | 27 | 0.0% |
| Belgium | 9 | 0.0% |
| Belize | 22 | 0.0% |
| Bolivia | 50 | 0.0% |
| Bosnia and Herzegovina | 30 | 0.0% |
| Brazil | 479 | 0.1% |
| Bulgaria | 1 | 0.0% |
| Cambodia | 4,619 | 0.6% |
| Cameroon | 113 | 0.0% |
| Canada | 996 | 0.1% |
| Caribbean | 617 | 0.1% |
| Central America | 92,470 | 11.9% |
| Chile | 102 | 0.0% |
| China | 6,159 | 0.8% |
| Colombia | 381 | 0.1% |
| Costa Rica | 283 | 0.0% |
| Croatia | 13 | 0.0% |
| Cuba | 260 | 0.0% |
| Czechoslovakia | 50 | 0.0% |
| Denmark | 46 | 0.0% |
| Dominica | 19 | 0.0% |
| Dominican Republic | 34 | 0.0% |
| Eastern Africa | 252 | 0.0% |
| Eastern Asia | 7,439 | 0.9% |
| Eastern Europe | 1,071 | 0.1% |
| Ecuador | 115 | 0.0% |
| Egypt | 221 | 0.0% |
| El Salvador | 3,688 | 0.5% |
| England | 345 | 0.0% |
| Eritrea | 25 | 0.0% |
| Ethiopia | 35 | 0.0% |
| Europe | 5,135 | 0.7% |
| Fiji | 1,804 | 0.2% |
| France | 322 | 0.0% |
| Germany | 575 | 0.1% |
| Ghana | 587 | 0.1% |
| Greece | 87 | 0.0% |
| Guatemala | 2,261 | 0.3% |
| Haiti | 17 | 0.0% |
| Honduras | 703 | 0.1% |
| Hong Kong | 599 | 0.1% |
| Hungary | 172 | 0.0% |
| India | 18,884 | 2.4% |
| Indonesia | 225 | 0.0% |
| Iran | 610 | 0.1% |
| Iraq | 190 | 0.0% |
| Ireland | 100 | 0.0% |
| Israel | 68 | 0.0% |
| Italy | 274 | 0.0% |
| Jamaica | 57 | 0.0% |
| Japan | 569 | 0.1% |
| Jordan | 267 | 0.0% |
| Kazakhstan | 12 | 0.0% |
| Kenya | 152 | 0.0% |
| Korea | 711 | 0.1% |
| Kuwait | 88 | 0.0% |
| Laos | 2,598 | 0.3% |
| Latin America | 95,731 | 12.3% |
| Lebanon | 102 | 0.0% |
| Liberia | 370 | 0.1% |
| Malaysia | 137 | 0.0% |
| Mexico | 84,390 | 10.8% |
| Micronesia | 21 | 0.0% |
| Middle Africa | 255 | 0.0% |
| Morocco | 32 | 0.0% |
| Nepal | 44 | 0.0% |
| Netherlands | 287 | 0.0% |
| Nicaragua | 876 | 0.1% |
| Nigeria | 1,020 | 0.1% |
| Northern Africa | 581 | 0.1% |
| Northern Europe | 932 | 0.1% |
| Norway | 25 | 0.0% |
| Oceania | 2,915 | 0.4% |
| Pakistan | 6,703 | 0.9% |
| Panama | 194 | 0.0% |
| Peru | 874 | 0.1% |
| Philippines | 24,269 | 3.1% |
| Poland | 291 | 0.0% |
| Portugal | 1,394 | 0.2% |
| Romania | 93 | 0.0% |
| Russia | 258 | 0.0% |
| Saudi Arabia | 40 | 0.0% |
| Scotland | 40 | 0.0% |
| Sierra Leone | 182 | 0.0% |
| Singapore | 91 | 0.0% |
| South Africa | 73 | 0.0% |
| South America | 2,644 | 0.3% |
| South Central Asia | 28,712 | 3.7% |
| South Eastern Asia | 40,146 | 5.1% |
| Southern Europe | 1,893 | 0.2% |
| Spain | 138 | 0.0% |
| Sri Lanka | 200 | 0.0% |
| Sudan | 303 | 0.0% |
| Sweden | 79 | 0.0% |
| Switzerland | 24 | 0.0% |
| Syria | 344 | 0.0% |
| Taiwan | 1,237 | 0.2% |
| Thailand | 2,139 | 0.3% |
| Trinidad and Tobago | 127 | 0.0% |
| Turkey | 28 | 0.0% |
| Uganda | 18 | 0.0% |
| Ukraine | 56 | 0.0% |
| Uzbekistan | 13 | 0.0% |
| Venezuela | 185 | 0.0% |
| Vietnam | 5,569 | 0.7% |
| West Indies | 31 | 0.0% |
| Western Africa | 2,227 | 0.3% |
| Western Asia | 1,775 | 0.2% |
| Western Europe | 1,239 | 0.2% |
| Yemen | 570 | 0.1% |
| Zaire | 37 | 0.0% | View All 121 Rows |
Sex and Age in San Joaquin County
Sex and Age in San Joaquin County
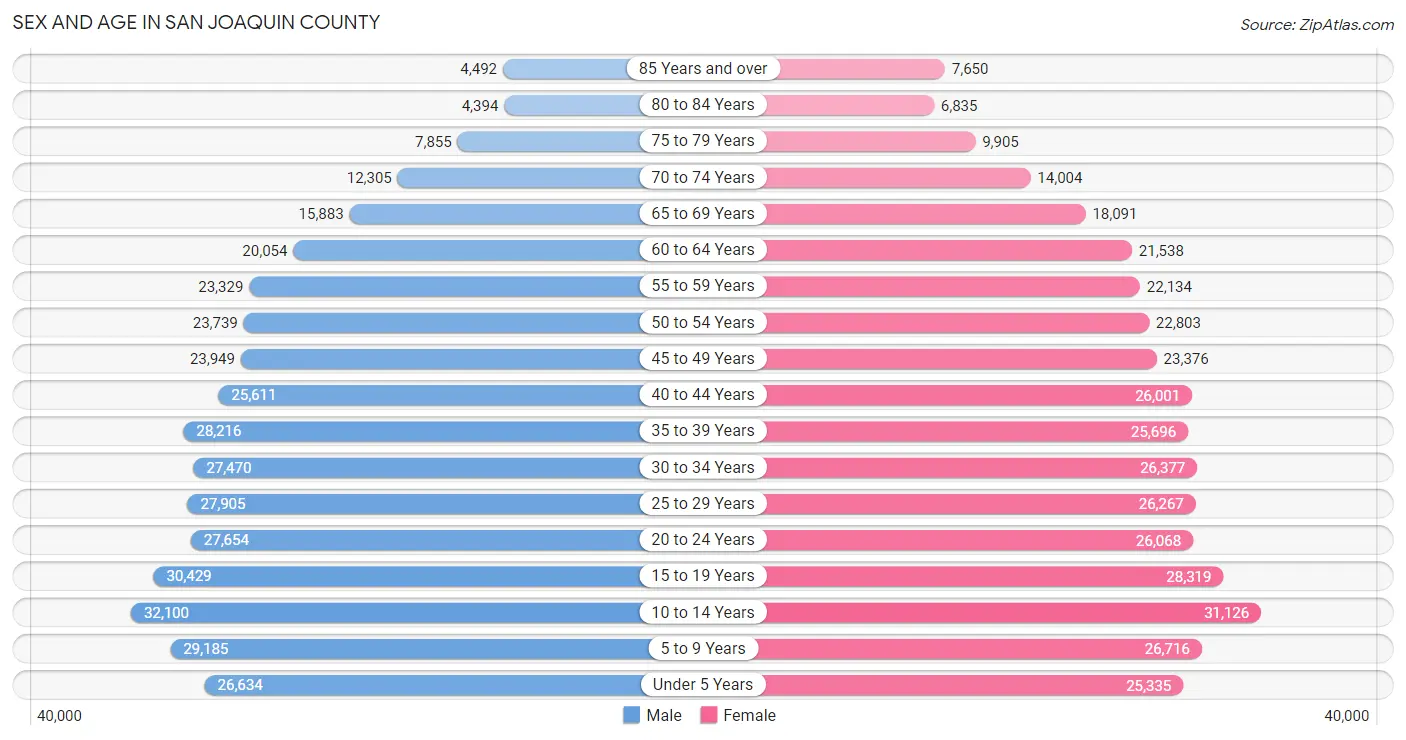
The most populous age groups in San Joaquin County are 10 to 14 Years (32,100 | 8.2%) for men and 10 to 14 Years (31,126 | 8.0%) for women.
| Age Bracket | Male | Female |
| Under 5 Years | 26,634 (6.8%) | 25,335 (6.5%) |
| 5 to 9 Years | 29,185 (7.5%) | 26,716 (6.9%) |
| 10 to 14 Years | 32,100 (8.2%) | 31,126 (8.0%) |
| 15 to 19 Years | 30,429 (7.8%) | 28,319 (7.3%) |
| 20 to 24 Years | 27,654 (7.1%) | 26,068 (6.7%) |
| 25 to 29 Years | 27,905 (7.1%) | 26,267 (6.8%) |
| 30 to 34 Years | 27,470 (7.0%) | 26,377 (6.8%) |
| 35 to 39 Years | 28,216 (7.2%) | 25,696 (6.6%) |
| 40 to 44 Years | 25,611 (6.6%) | 26,001 (6.7%) |
| 45 to 49 Years | 23,949 (6.1%) | 23,376 (6.0%) |
| 50 to 54 Years | 23,739 (6.1%) | 22,803 (5.9%) |
| 55 to 59 Years | 23,329 (6.0%) | 22,134 (5.7%) |
| 60 to 64 Years | 20,054 (5.1%) | 21,538 (5.6%) |
| 65 to 69 Years | 15,883 (4.1%) | 18,091 (4.7%) |
| 70 to 74 Years | 12,305 (3.2%) | 14,004 (3.6%) |
| 75 to 79 Years | 7,855 (2.0%) | 9,905 (2.5%) |
| 80 to 84 Years | 4,394 (1.1%) | 6,835 (1.8%) |
| 85 Years and over | 4,492 (1.1%) | 7,650 (2.0%) |
| Total | 391,204 (100.0%) | 388,241 (100.0%) |
Families and Households in San Joaquin County
Median Family Size in San Joaquin County
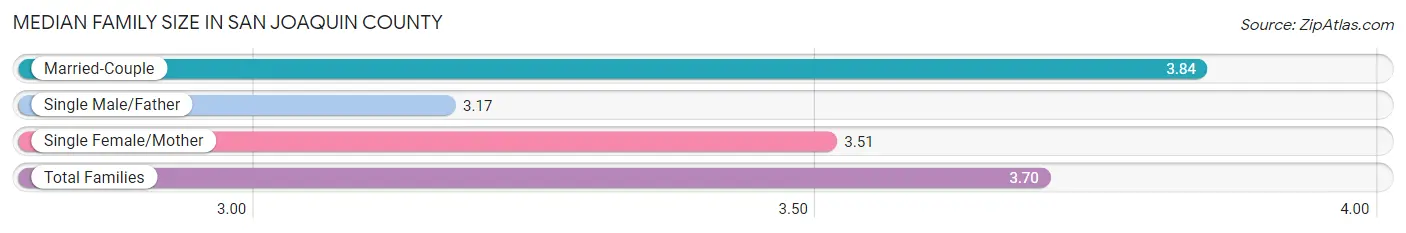
The median family size in San Joaquin County is 3.70 persons per family, with married-couple families (122,617 | 69.0%) accounting for the largest median family size of 3.84 persons per family. On the other hand, single male/father families (19,112 | 10.7%) represent the smallest median family size with 3.17 persons per family.
| Family Type | # Families | Family Size |
| Married-Couple | 122,617 (69.0%) | 3.84 |
| Single Male/Father | 19,112 (10.7%) | 3.17 |
| Single Female/Mother | 36,117 (20.3%) | 3.51 |
| Total Families | 177,846 (100.0%) | 3.70 |
Median Household Size in San Joaquin County
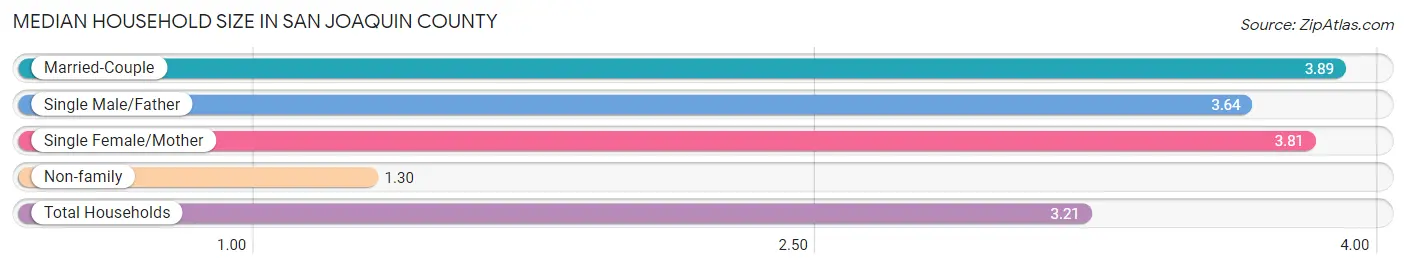
The median household size in San Joaquin County is 3.21 persons per household, with married-couple households (122,617 | 51.6%) accounting for the largest median household size of 3.89 persons per household. non-family households (59,577 | 25.1%) represent the smallest median household size with 1.30 persons per household.
| Household Type | # Households | Household Size |
| Married-Couple | 122,617 (51.6%) | 3.89 |
| Single Male/Father | 19,112 (8.1%) | 3.64 |
| Single Female/Mother | 36,117 (15.2%) | 3.81 |
| Non-family | 59,577 (25.1%) | 1.30 |
| Total Households | 237,423 (100.0%) | 3.21 |
Household Size by Marriage Status in San Joaquin County
Out of a total of 237,423 households in San Joaquin County, 177,846 (74.9%) are family households, while 59,577 (25.1%) are nonfamily households. The most numerous type of family households are 2-person households, comprising 54,758, and the most common type of nonfamily households are 1-person households, comprising 47,441.
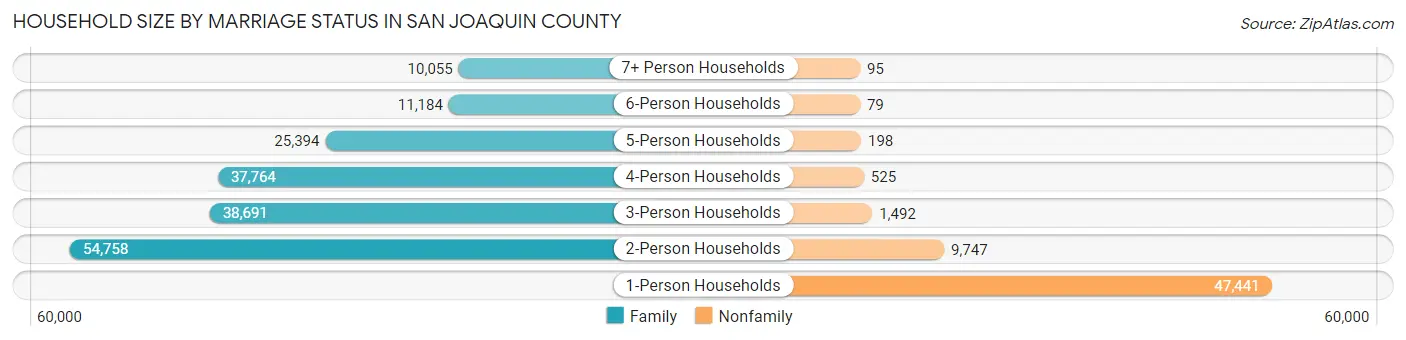
| Household Size | Family Households | Nonfamily Households |
| 1-Person Households | - | 47,441 (20.0%) |
| 2-Person Households | 54,758 (23.1%) | 9,747 (4.1%) |
| 3-Person Households | 38,691 (16.3%) | 1,492 (0.6%) |
| 4-Person Households | 37,764 (15.9%) | 525 (0.2%) |
| 5-Person Households | 25,394 (10.7%) | 198 (0.1%) |
| 6-Person Households | 11,184 (4.7%) | 79 (0.0%) |
| 7+ Person Households | 10,055 (4.2%) | 95 (0.0%) |
| Total | 177,846 (74.9%) | 59,577 (25.1%) |
Female Fertility in San Joaquin County
Fertility by Age in San Joaquin County
Average fertility rate in San Joaquin County is 53.0 births per 1,000 women. Women in the age bracket of 20 to 34 years have the highest fertility rate with 96.0 births per 1,000 women. Women in the age bracket of 20 to 34 years acount for 75.9% of all women with births.
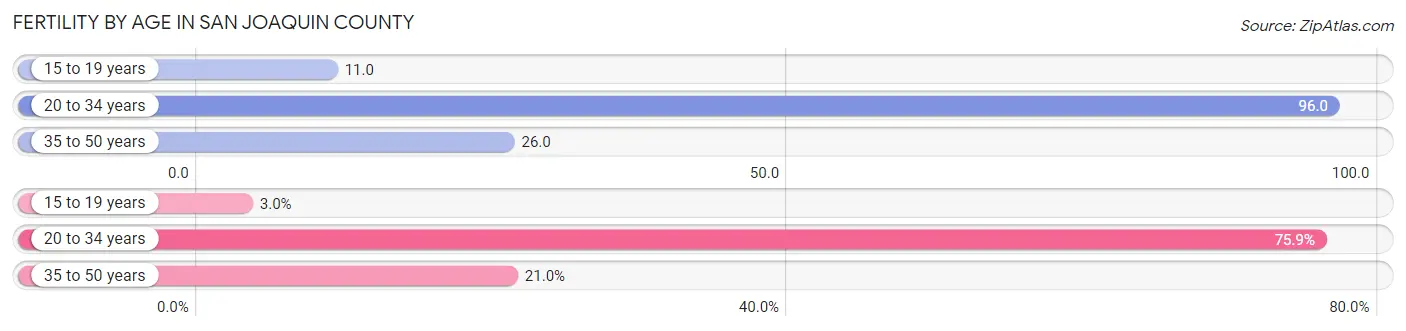
| Age Bracket | Women with Births | Births / 1,000 Women |
| 15 to 19 years | 303 (3.0%) | 11.0 |
| 20 to 34 years | 7,562 (75.9%) | 96.0 |
| 35 to 50 years | 2,095 (21.0%) | 26.0 |
| Total | 9,960 (100.0%) | 53.0 |
Fertility by Age by Marriage Status in San Joaquin County
64.1% of women with births (9,960) in San Joaquin County are married. The highest percentage of unmarried women with births falls into 15 to 19 years age bracket with 81.2% of them unmarried at the time of birth, while the lowest percentage of unmarried women with births belong to 35 to 50 years age bracket with 21.3% of them unmarried.
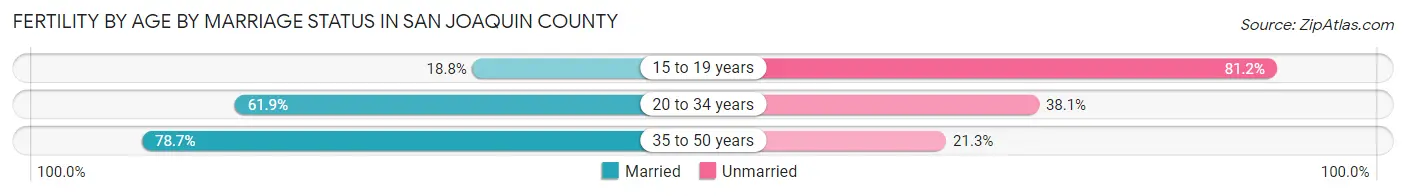
| Age Bracket | Married | Unmarried |
| 15 to 19 years | 57 (18.8%) | 246 (81.2%) |
| 20 to 34 years | 4,681 (61.9%) | 2,881 (38.1%) |
| 35 to 50 years | 1,649 (78.7%) | 446 (21.3%) |
| Total | 6,384 (64.1%) | 3,576 (35.9%) |
Fertility by Education in San Joaquin County
Average fertility rate in San Joaquin County is 53.0 births per 1,000 women. Women with the education attainment of graduate degree have the highest fertility rate of 64.0 births per 1,000 women, while women with the education attainment of less than high school have the lowest fertility at 33.0 births per 1,000 women. Women with the education attainment of college or associate's degree represent 34.8% of all women with births.
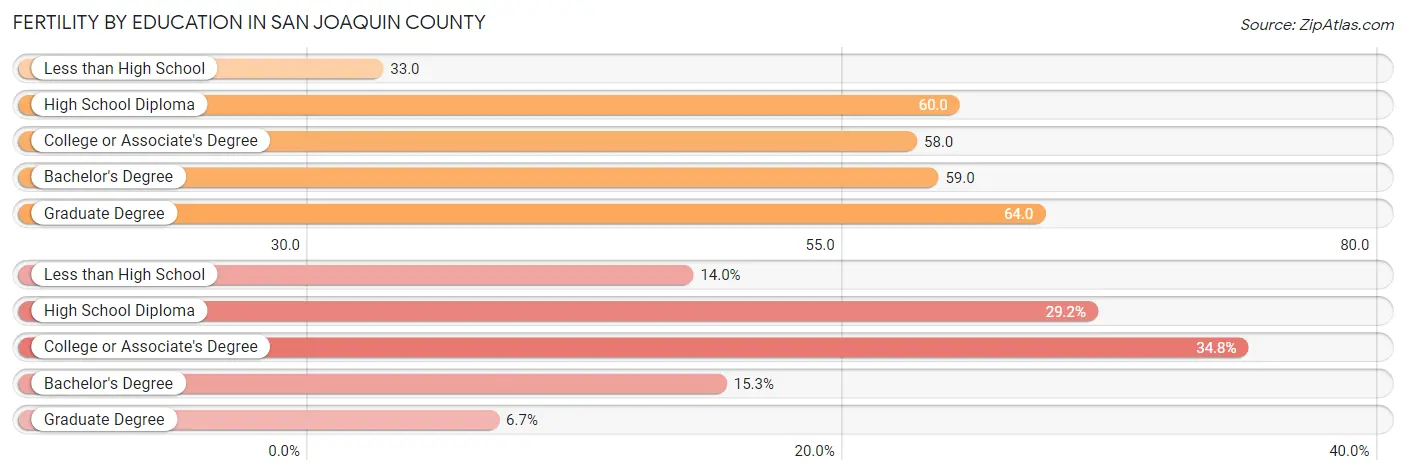
| Educational Attainment | Women with Births | Births / 1,000 Women |
| Less than High School | 1,396 (14.0%) | 33.0 |
| High School Diploma | 2,905 (29.2%) | 60.0 |
| College or Associate's Degree | 3,467 (34.8%) | 58.0 |
| Bachelor's Degree | 1,521 (15.3%) | 59.0 |
| Graduate Degree | 671 (6.7%) | 64.0 |
| Total | 9,960 (100.0%) | 53.0 |
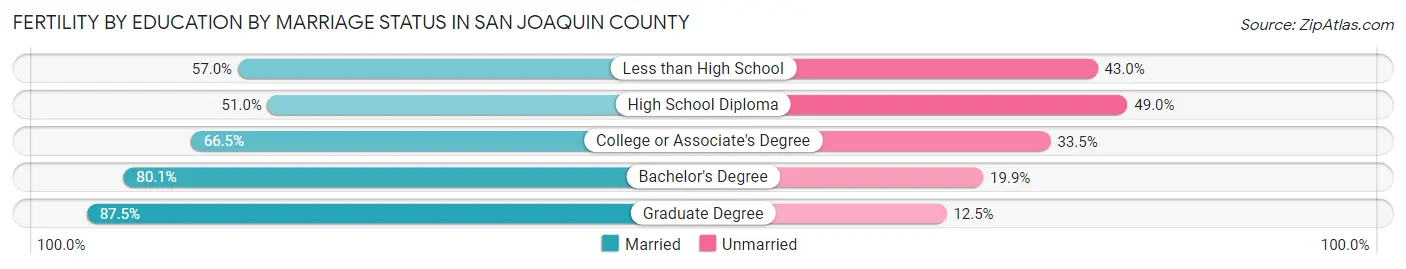
Fertility by Education by Marriage Status in San Joaquin County
35.9% of women with births in San Joaquin County are unmarried. Women with the educational attainment of graduate degree are most likely to be married with 87.5% of them married at childbirth, while women with the educational attainment of high school diploma are least likely to be married with 49.0% of them unmarried at childbirth.
| Educational Attainment | Married | Unmarried |
| Less than High School | 796 (57.0%) | 600 (43.0%) |
| High School Diploma | 1,482 (51.0%) | 1,423 (49.0%) |
| College or Associate's Degree | 2,306 (66.5%) | 1,161 (33.5%) |
| Bachelor's Degree | 1,218 (80.1%) | 303 (19.9%) |
| Graduate Degree | 587 (87.5%) | 84 (12.5%) |
| Total | 6,384 (64.1%) | 3,576 (35.9%) |
Employment Characteristics in San Joaquin County
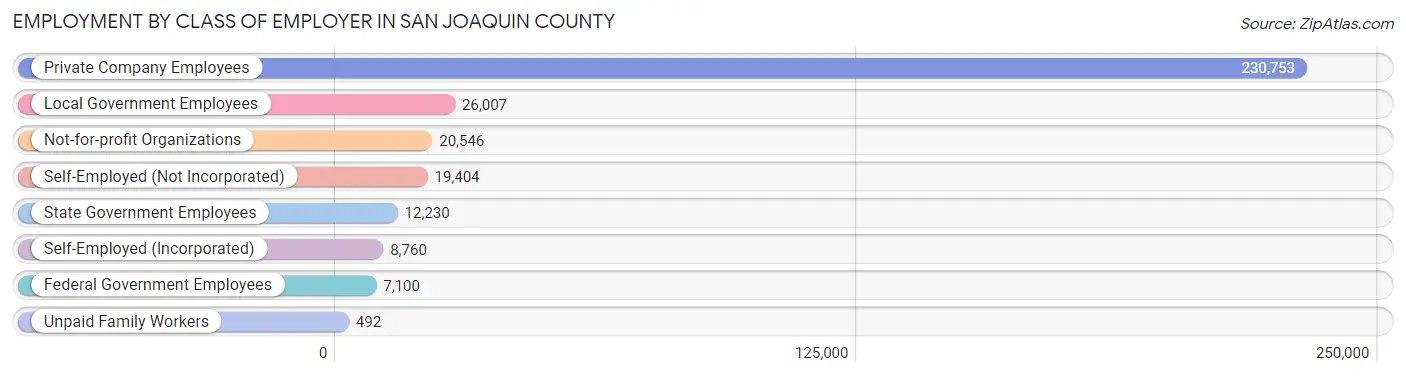
Employment by Class of Employer in San Joaquin County
Among the 325,292 employed individuals in San Joaquin County, private company employees (230,753 | 70.9%), local government employees (26,007 | 8.0%), and not-for-profit organizations (20,546 | 6.3%) make up the most common classes of employment.
| Employer Class | # Employees | % Employees |
| Private Company Employees | 230,753 | 70.9% |
| Self-Employed (Incorporated) | 8,760 | 2.7% |
| Self-Employed (Not Incorporated) | 19,404 | 6.0% |
| Not-for-profit Organizations | 20,546 | 6.3% |
| Local Government Employees | 26,007 | 8.0% |
| State Government Employees | 12,230 | 3.8% |
| Federal Government Employees | 7,100 | 2.2% |
| Unpaid Family Workers | 492 | 0.2% |
| Total | 325,292 | 100.0% |
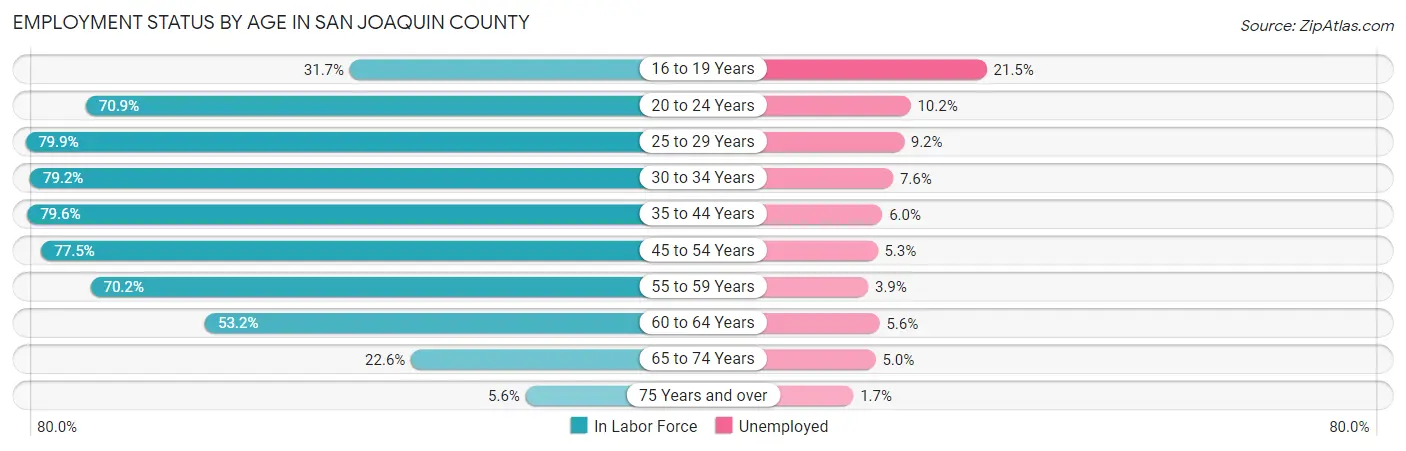
Employment Status by Age in San Joaquin County
According to the labor force statistics for San Joaquin County, out of the total population over 16 years of age (595,894), 61.3% or 365,283 individuals are in the labor force, with 7.2% or 26,300 of them unemployed. The age group with the highest labor force participation rate is 25 to 29 years, with 79.9% or 43,283 individuals in the labor force. Within the labor force, the 16 to 19 years age range has the highest percentage of unemployed individuals, with 21.5% or 3,155 of them being unemployed.
| Age Bracket | In Labor Force | Unemployed |
| 16 to 19 Years | 14,675 (31.7%) | 3,155 (21.5%) |
| 20 to 24 Years | 38,089 (70.9%) | 3,885 (10.2%) |
| 25 to 29 Years | 43,283 (79.9%) | 3,982 (9.2%) |
| 30 to 34 Years | 42,647 (79.2%) | 3,241 (7.6%) |
| 35 to 44 Years | 83,997 (79.6%) | 5,040 (6.0%) |
| 45 to 54 Years | 72,747 (77.5%) | 3,856 (5.3%) |
| 55 to 59 Years | 31,915 (70.2%) | 1,245 (3.9%) |
| 60 to 64 Years | 22,127 (53.2%) | 1,239 (5.6%) |
| 65 to 74 Years | 13,624 (22.6%) | 681 (5.0%) |
| 75 Years and over | 2,303 (5.6%) | 39 (1.7%) |
| Total | 365,283 (61.3%) | 26,300 (7.2%) |
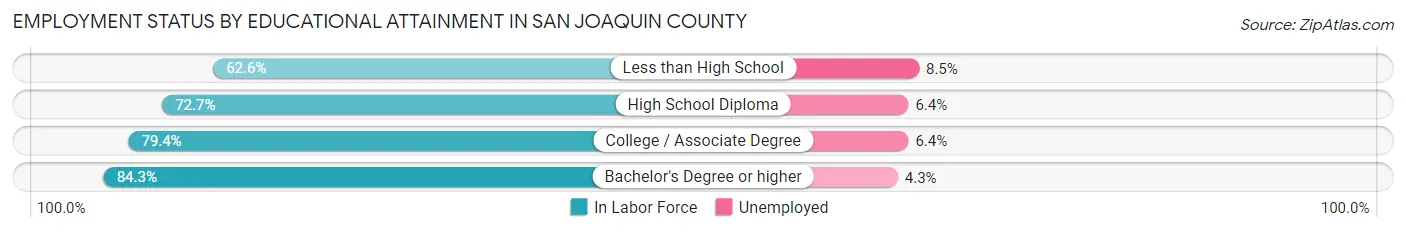
Employment Status by Educational Attainment in San Joaquin County
According to labor force statistics for San Joaquin County, 75.2% of individuals (296,638) out of the total population between 25 and 64 years of age (394,465) are in the labor force, with 6.3% or 18,688 of them being unemployed. The group with the highest labor force participation rate are those with the educational attainment of bachelor's degree or higher, with 84.3% or 67,269 individuals in the labor force. Within the labor force, individuals with less than high school education have the highest percentage of unemployment, with 8.5% or 4,058 of them being unemployed.
| Educational Attainment | In Labor Force | Unemployed |
| Less than High School | 47,740 (62.6%) | 6,482 (8.5%) |
| High School Diploma | 82,646 (72.7%) | 7,276 (6.4%) |
| College / Associate Degree | 99,032 (79.4%) | 7,982 (6.4%) |
| Bachelor's Degree or higher | 67,269 (84.3%) | 3,431 (4.3%) |
| Total | 296,638 (75.2%) | 24,851 (6.3%) |
Employment Occupations by Sex in San Joaquin County
Management, Business, Science and Arts Occupations
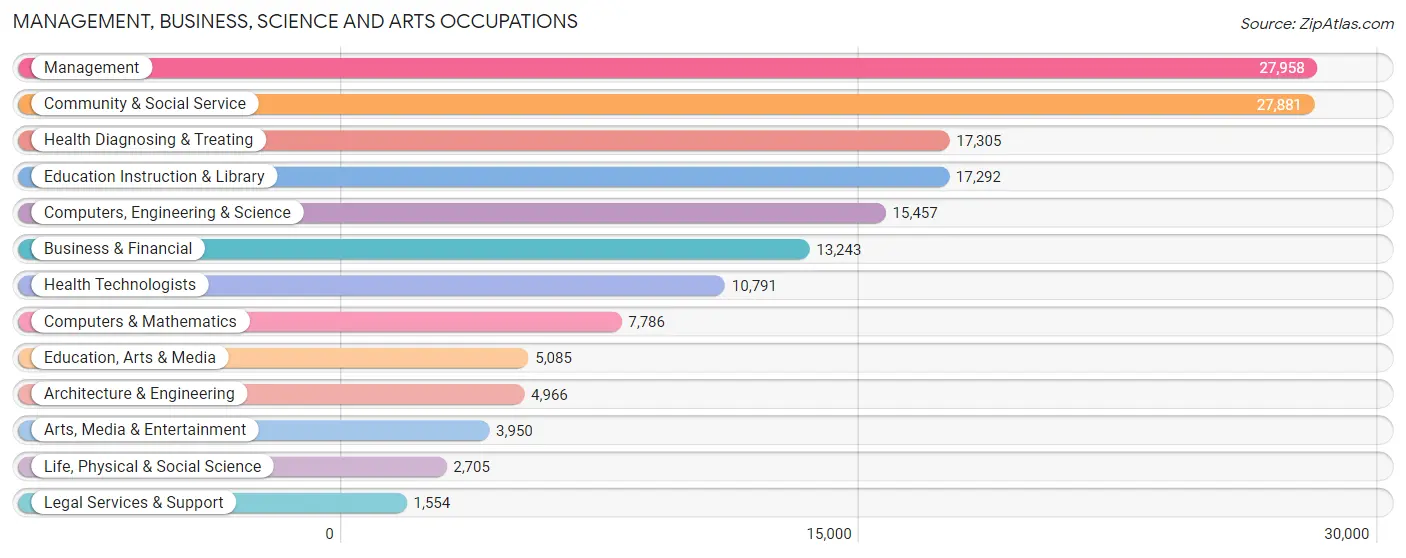
The most common Management, Business, Science and Arts occupations in San Joaquin County are Management (27,958 | 8.3%), Community & Social Service (27,881 | 8.2%), Health Diagnosing & Treating (17,305 | 5.1%), Education Instruction & Library (17,292 | 5.1%), and Computers, Engineering & Science (15,457 | 4.6%).
Management, Business, Science and Arts Occupations by Sex
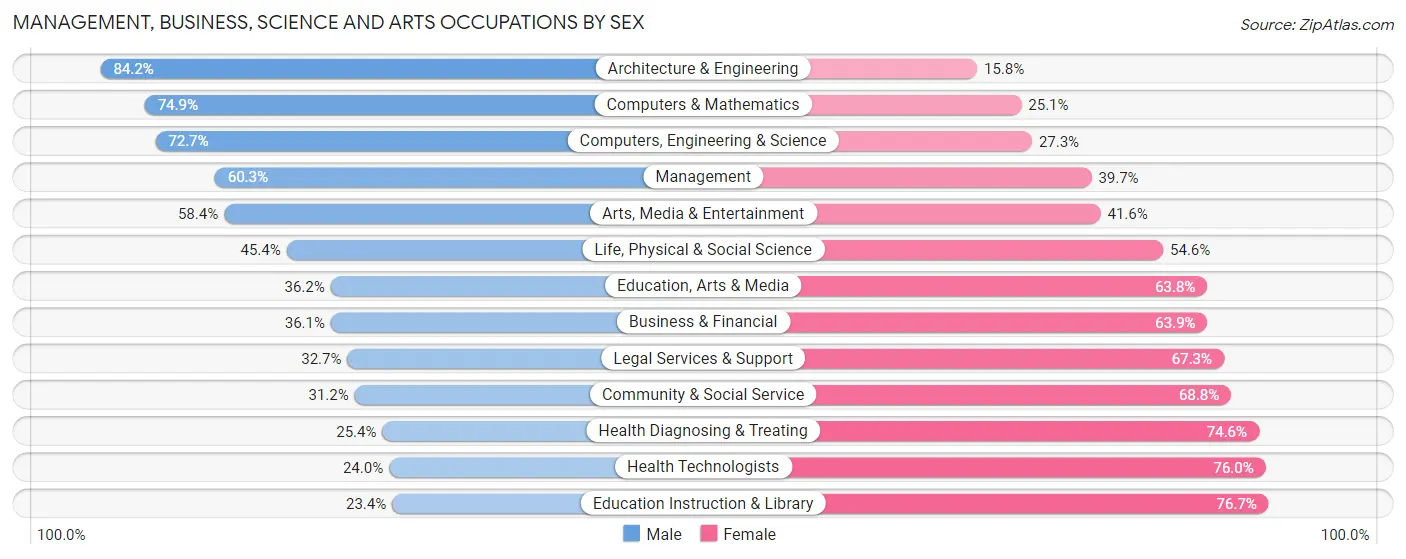
Within the Management, Business, Science and Arts occupations in San Joaquin County, the most male-oriented occupations are Architecture & Engineering (84.2%), Computers & Mathematics (74.9%), and Computers, Engineering & Science (72.7%), while the most female-oriented occupations are Education Instruction & Library (76.6%), Health Technologists (76.0%), and Health Diagnosing & Treating (74.6%).
| Occupation | Male | Female |
| Management | 16,862 (60.3%) | 11,096 (39.7%) |
| Business & Financial | 4,784 (36.1%) | 8,459 (63.9%) |
| Computers, Engineering & Science | 11,241 (72.7%) | 4,216 (27.3%) |
| Computers & Mathematics | 5,834 (74.9%) | 1,952 (25.1%) |
| Architecture & Engineering | 4,180 (84.2%) | 786 (15.8%) |
| Life, Physical & Social Science | 1,227 (45.4%) | 1,478 (54.6%) |
| Community & Social Service | 8,692 (31.2%) | 19,189 (68.8%) |
| Education, Arts & Media | 1,839 (36.2%) | 3,246 (63.8%) |
| Legal Services & Support | 508 (32.7%) | 1,046 (67.3%) |
| Education Instruction & Library | 4,038 (23.4%) | 13,254 (76.6%) |
| Arts, Media & Entertainment | 2,307 (58.4%) | 1,643 (41.6%) |
| Health Diagnosing & Treating | 4,393 (25.4%) | 12,912 (74.6%) |
| Health Technologists | 2,589 (24.0%) | 8,202 (76.0%) |
| Total (Category) | 45,972 (45.1%) | 55,872 (54.9%) |
| Total (Overall) | 188,578 (55.7%) | 150,047 (44.3%) |
Services Occupations
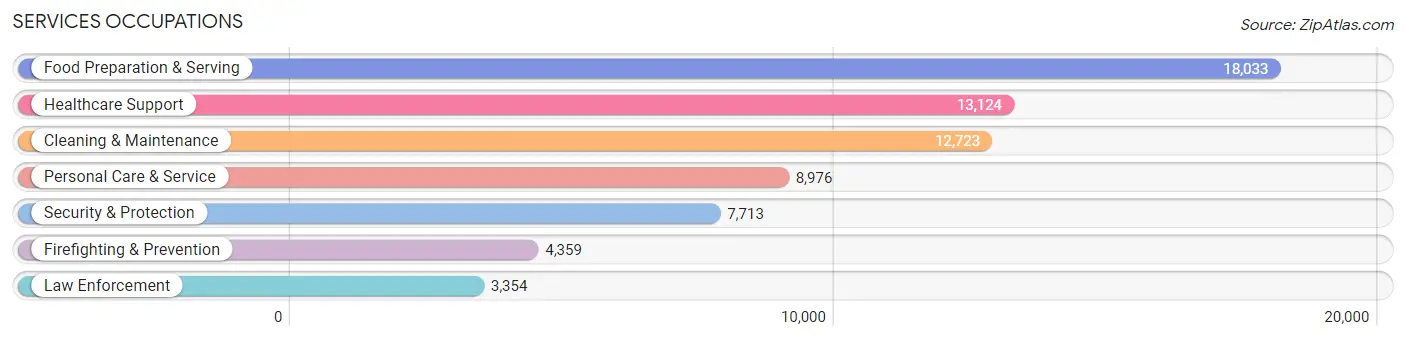
The most common Services occupations in San Joaquin County are Food Preparation & Serving (18,033 | 5.3%), Healthcare Support (13,124 | 3.9%), Cleaning & Maintenance (12,723 | 3.8%), Personal Care & Service (8,976 | 2.6%), and Security & Protection (7,713 | 2.3%).
Services Occupations by Sex
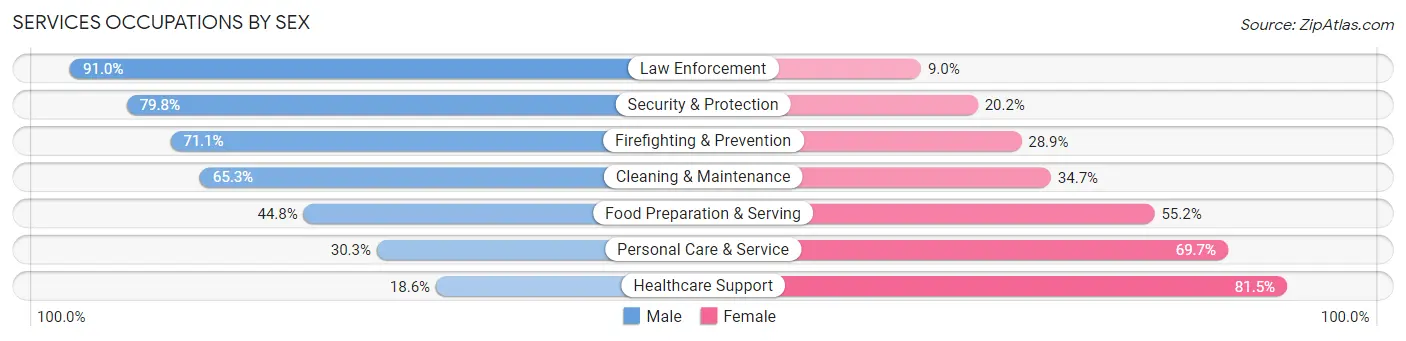
Within the Services occupations in San Joaquin County, the most male-oriented occupations are Law Enforcement (91.0%), Security & Protection (79.8%), and Firefighting & Prevention (71.1%), while the most female-oriented occupations are Healthcare Support (81.5%), Personal Care & Service (69.7%), and Food Preparation & Serving (55.2%).
| Occupation | Male | Female |
| Healthcare Support | 2,435 (18.5%) | 10,689 (81.5%) |
| Security & Protection | 6,153 (79.8%) | 1,560 (20.2%) |
| Firefighting & Prevention | 3,101 (71.1%) | 1,258 (28.9%) |
| Law Enforcement | 3,052 (91.0%) | 302 (9.0%) |
| Food Preparation & Serving | 8,072 (44.8%) | 9,961 (55.2%) |
| Cleaning & Maintenance | 8,306 (65.3%) | 4,417 (34.7%) |
| Personal Care & Service | 2,716 (30.3%) | 6,260 (69.7%) |
| Total (Category) | 27,682 (45.7%) | 32,887 (54.3%) |
| Total (Overall) | 188,578 (55.7%) | 150,047 (44.3%) |
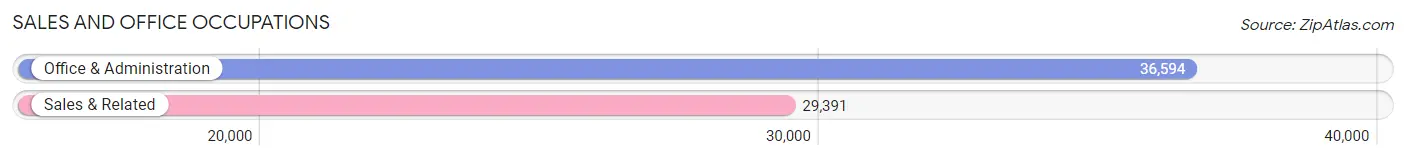
Sales and Office Occupations
The most common Sales and Office occupations in San Joaquin County are Office & Administration (36,594 | 10.8%), and Sales & Related (29,391 | 8.7%).
Sales and Office Occupations by Sex
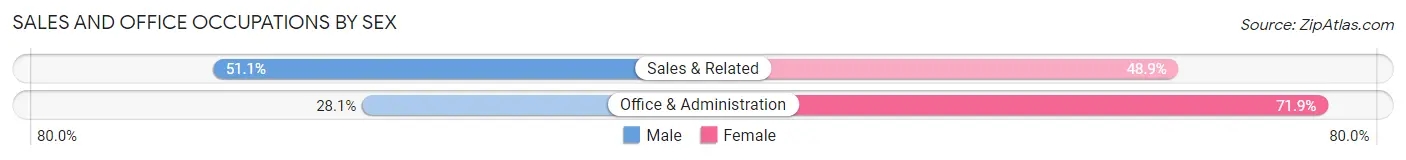
| Occupation | Male | Female |
| Sales & Related | 15,006 (51.1%) | 14,385 (48.9%) |
| Office & Administration | 10,269 (28.1%) | 26,325 (71.9%) |
| Total (Category) | 25,275 (38.3%) | 40,710 (61.7%) |
| Total (Overall) | 188,578 (55.7%) | 150,047 (44.3%) |
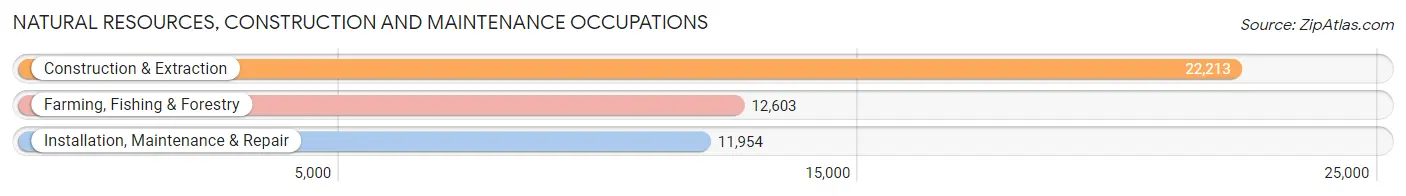
Natural Resources, Construction and Maintenance Occupations
The most common Natural Resources, Construction and Maintenance occupations in San Joaquin County are Construction & Extraction (22,213 | 6.6%), Farming, Fishing & Forestry (12,603 | 3.7%), and Installation, Maintenance & Repair (11,954 | 3.5%).
Natural Resources, Construction and Maintenance Occupations by Sex
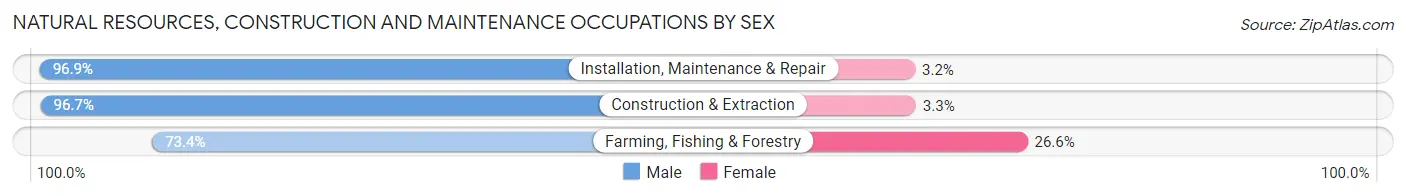
| Occupation | Male | Female |
| Farming, Fishing & Forestry | 9,256 (73.4%) | 3,347 (26.6%) |
| Construction & Extraction | 21,474 (96.7%) | 739 (3.3%) |
| Installation, Maintenance & Repair | 11,578 (96.9%) | 376 (3.2%) |
| Total (Category) | 42,308 (90.5%) | 4,462 (9.5%) |
| Total (Overall) | 188,578 (55.7%) | 150,047 (44.3%) |
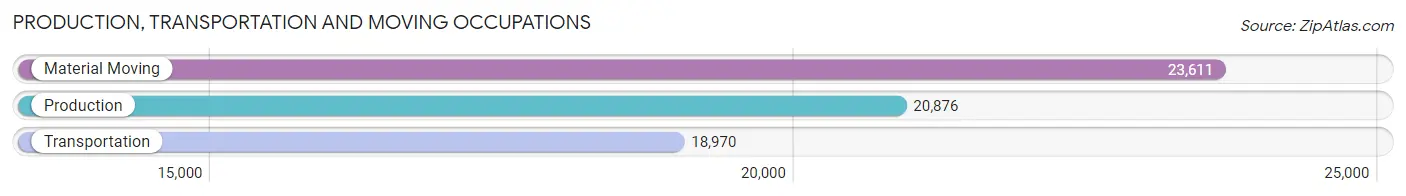
Production, Transportation and Moving Occupations
The most common Production, Transportation and Moving occupations in San Joaquin County are Material Moving (23,611 | 7.0%), Production (20,876 | 6.2%), and Transportation (18,970 | 5.6%).
Production, Transportation and Moving Occupations by Sex
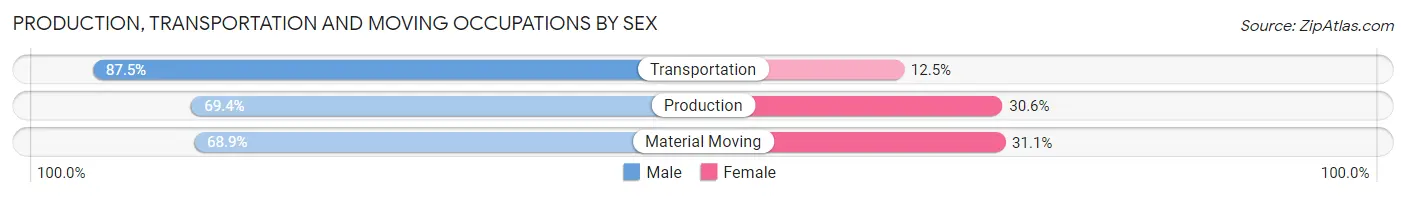
| Occupation | Male | Female |
| Production | 14,486 (69.4%) | 6,390 (30.6%) |
| Transportation | 16,592 (87.5%) | 2,378 (12.5%) |
| Material Moving | 16,263 (68.9%) | 7,348 (31.1%) |
| Total (Category) | 47,341 (74.6%) | 16,116 (25.4%) |
| Total (Overall) | 188,578 (55.7%) | 150,047 (44.3%) |
Employment Industries by Sex in San Joaquin County
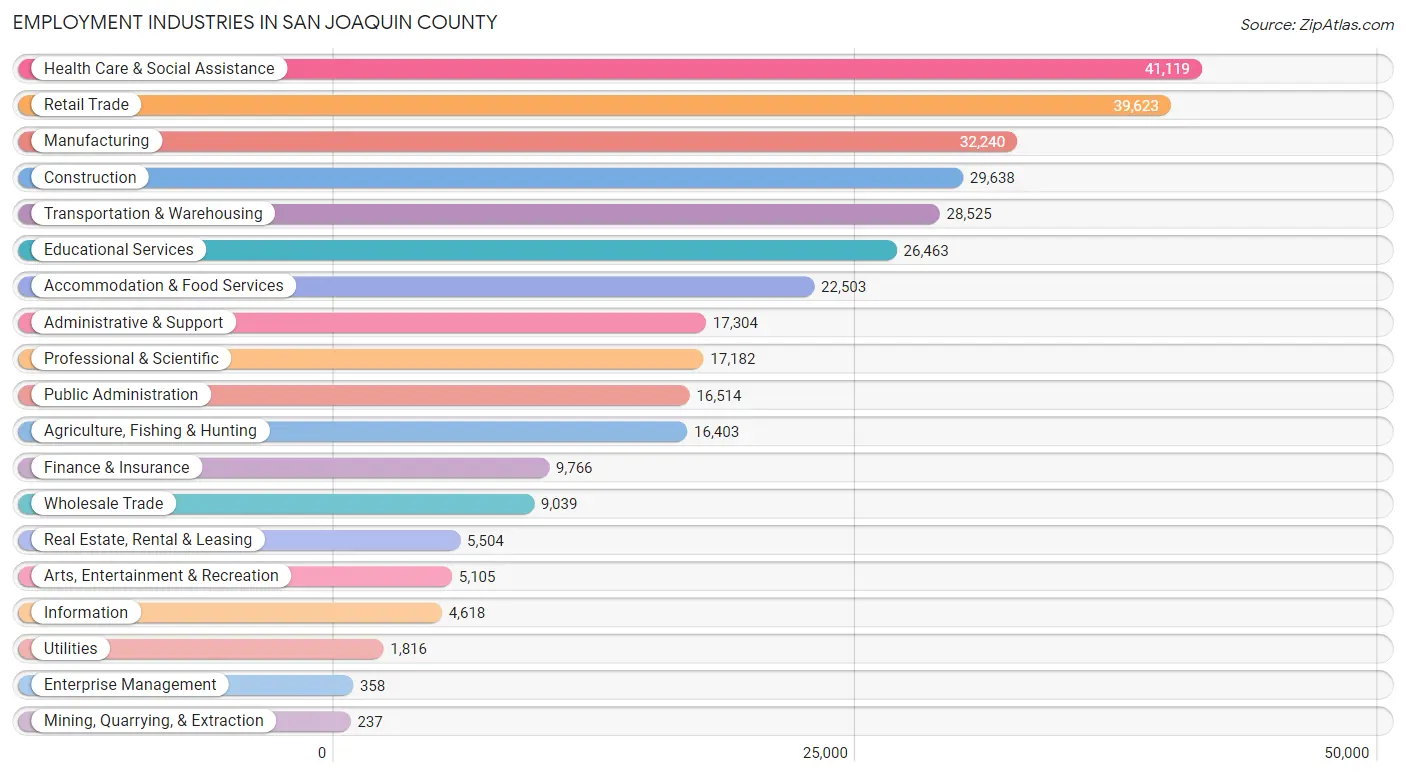
Employment Industries in San Joaquin County
The major employment industries in San Joaquin County include Health Care & Social Assistance (41,119 | 12.1%), Retail Trade (39,623 | 11.7%), Manufacturing (32,240 | 9.5%), Construction (29,638 | 8.7%), and Transportation & Warehousing (28,525 | 8.4%).
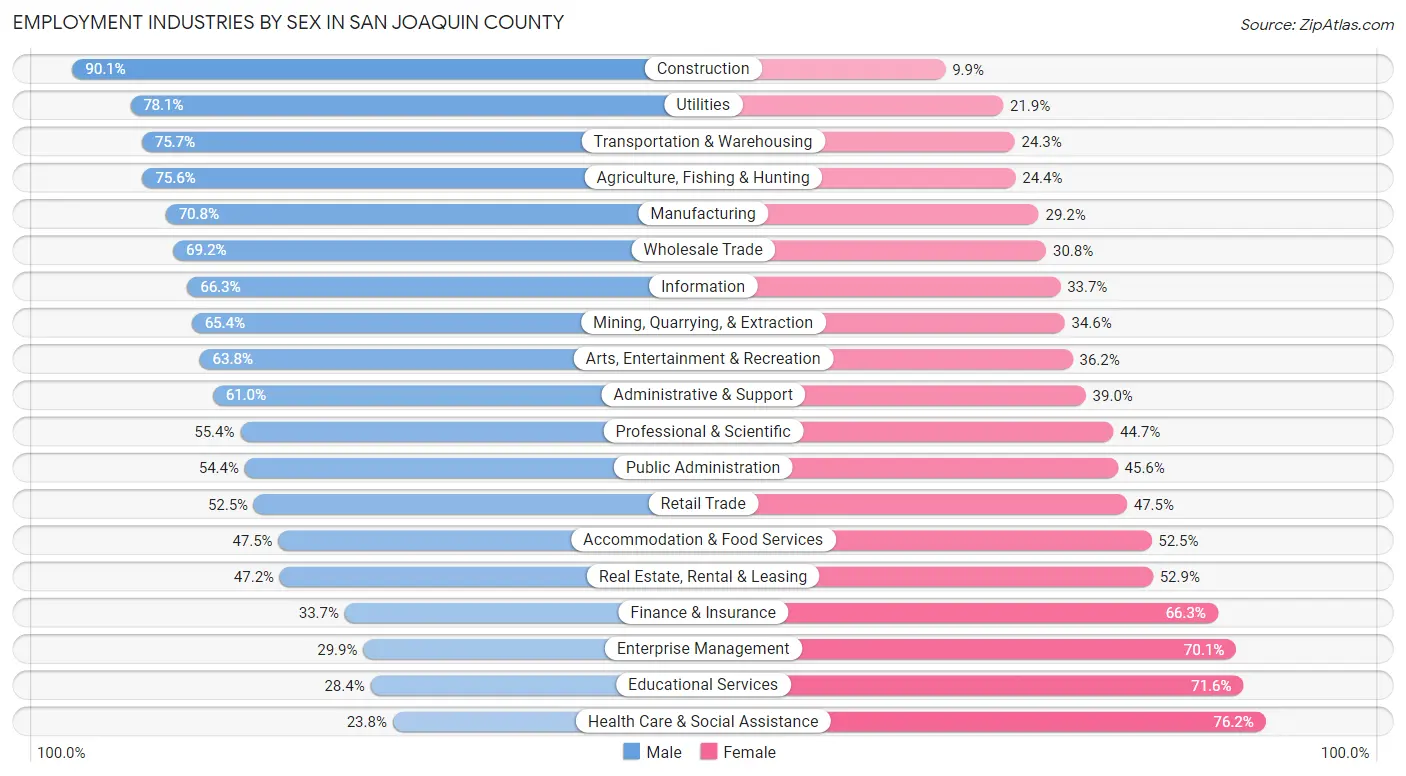
Employment Industries by Sex in San Joaquin County
The San Joaquin County industries that see more men than women are Construction (90.1%), Utilities (78.1%), and Transportation & Warehousing (75.7%), whereas the industries that tend to have a higher number of women are Health Care & Social Assistance (76.2%), Educational Services (71.6%), and Enterprise Management (70.1%).
| Industry | Male | Female |
| Agriculture, Fishing & Hunting | 12,402 (75.6%) | 4,001 (24.4%) |
| Mining, Quarrying, & Extraction | 155 (65.4%) | 82 (34.6%) |
| Construction | 26,706 (90.1%) | 2,932 (9.9%) |
| Manufacturing | 22,818 (70.8%) | 9,422 (29.2%) |
| Wholesale Trade | 6,259 (69.2%) | 2,780 (30.8%) |
| Retail Trade | 20,815 (52.5%) | 18,808 (47.5%) |
| Transportation & Warehousing | 21,604 (75.7%) | 6,921 (24.3%) |
| Utilities | 1,419 (78.1%) | 397 (21.9%) |
| Information | 3,062 (66.3%) | 1,556 (33.7%) |
| Finance & Insurance | 3,293 (33.7%) | 6,473 (66.3%) |
| Real Estate, Rental & Leasing | 2,595 (47.1%) | 2,909 (52.8%) |
| Professional & Scientific | 9,511 (55.3%) | 7,671 (44.7%) |
| Enterprise Management | 107 (29.9%) | 251 (70.1%) |
| Administrative & Support | 10,562 (61.0%) | 6,742 (39.0%) |
| Educational Services | 7,519 (28.4%) | 18,944 (71.6%) |
| Health Care & Social Assistance | 9,785 (23.8%) | 31,334 (76.2%) |
| Arts, Entertainment & Recreation | 3,255 (63.8%) | 1,850 (36.2%) |
| Accommodation & Food Services | 10,681 (47.5%) | 11,822 (52.5%) |
| Public Administration | 8,989 (54.4%) | 7,525 (45.6%) |
| Total | 188,578 (55.7%) | 150,047 (44.3%) |
Education in San Joaquin County
School Enrollment in San Joaquin County
The most common levels of schooling among the 217,081 students in San Joaquin County are middle school (49,858 | 23.0%), high school (49,684 | 22.9%), and elementary school (45,934 | 21.2%).
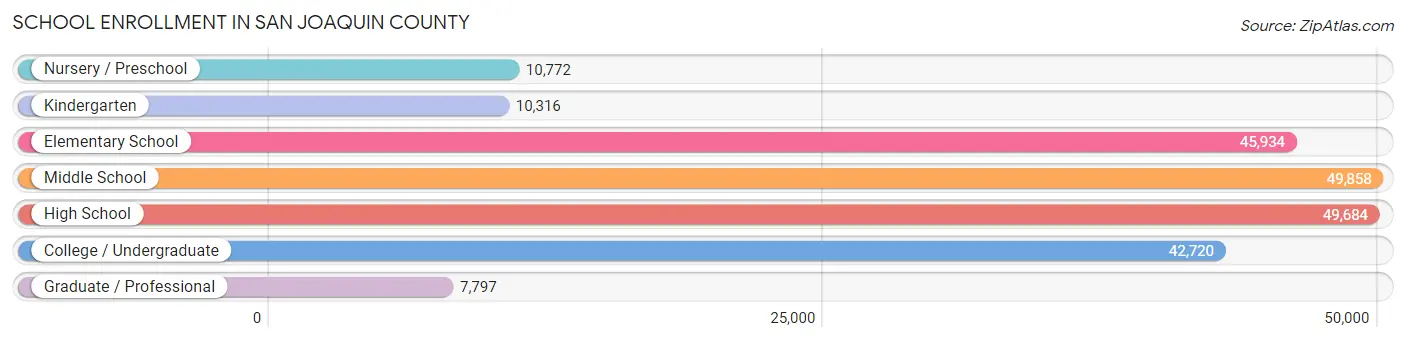
| School Level | # Students | % Students |
| Nursery / Preschool | 10,772 | 5.0% |
| Kindergarten | 10,316 | 4.8% |
| Elementary School | 45,934 | 21.2% |
| Middle School | 49,858 | 23.0% |
| High School | 49,684 | 22.9% |
| College / Undergraduate | 42,720 | 19.7% |
| Graduate / Professional | 7,797 | 3.6% |
| Total | 217,081 | 100.0% |
School Enrollment by Age by Funding Source in San Joaquin County
Out of a total of 217,081 students who are enrolled in schools in San Joaquin County, 24,096 (11.1%) attend a private institution, while the remaining 192,985 (88.9%) are enrolled in public schools. The age group of 35 years and over has the highest likelihood of being enrolled in private schools, with 3,707 (37.1% in the age bracket) enrolled. Conversely, the age group of 15 to 17 year olds has the lowest likelihood of being enrolled in a private school, with 33,414 (95.0% in the age bracket) attending a public institution.
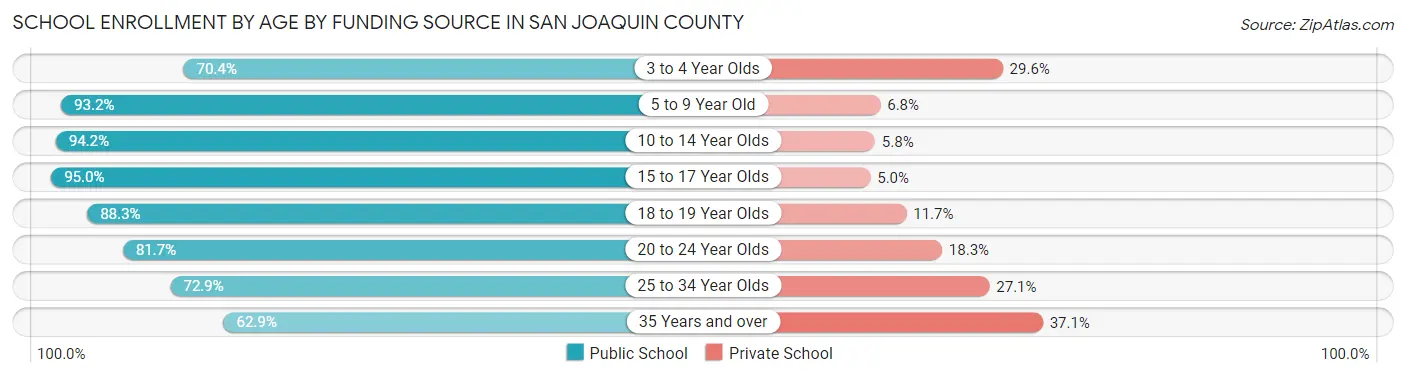
| Age Bracket | Public School | Private School |
| 3 to 4 Year Olds | 6,291 (70.4%) | 2,646 (29.6%) |
| 5 to 9 Year Old | 49,723 (93.2%) | 3,639 (6.8%) |
| 10 to 14 Year Olds | 58,762 (94.2%) | 3,631 (5.8%) |
| 15 to 17 Year Olds | 33,414 (95.0%) | 1,744 (5.0%) |
| 18 to 19 Year Olds | 13,143 (88.3%) | 1,736 (11.7%) |
| 20 to 24 Year Olds | 16,796 (81.7%) | 3,761 (18.3%) |
| 25 to 34 Year Olds | 8,593 (72.9%) | 3,201 (27.1%) |
| 35 Years and over | 6,294 (62.9%) | 3,707 (37.1%) |
| Total | 192,985 (88.9%) | 24,096 (11.1%) |
Educational Attainment by Field of Study in San Joaquin County
Business (20,396 | 19.0%), science & technology (12,248 | 11.4%), education (9,589 | 8.9%), social sciences (9,089 | 8.5%), and engineering (8,091 | 7.5%) are the most common fields of study among 107,296 individuals in San Joaquin County who have obtained a bachelor's degree or higher.
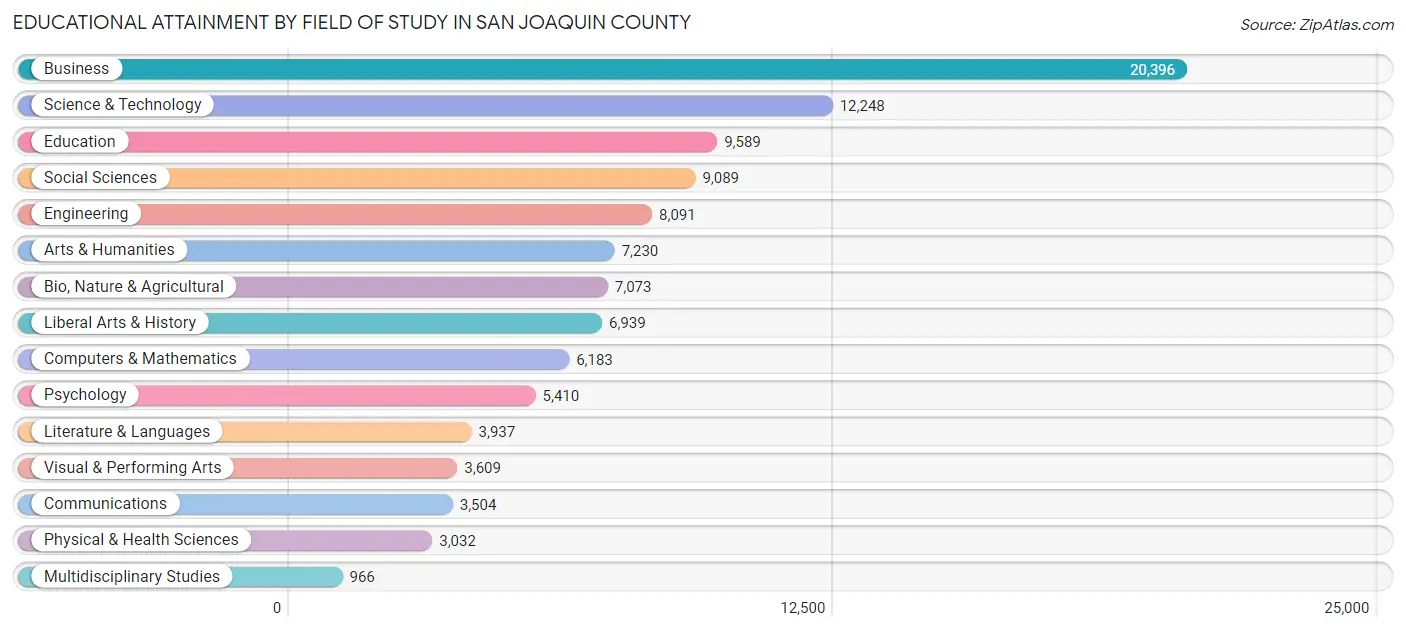
| Field of Study | # Graduates | % Graduates |
| Computers & Mathematics | 6,183 | 5.8% |
| Bio, Nature & Agricultural | 7,073 | 6.6% |
| Physical & Health Sciences | 3,032 | 2.8% |
| Psychology | 5,410 | 5.0% |
| Social Sciences | 9,089 | 8.5% |
| Engineering | 8,091 | 7.5% |
| Multidisciplinary Studies | 966 | 0.9% |
| Science & Technology | 12,248 | 11.4% |
| Business | 20,396 | 19.0% |
| Education | 9,589 | 8.9% |
| Literature & Languages | 3,937 | 3.7% |
| Liberal Arts & History | 6,939 | 6.5% |
| Visual & Performing Arts | 3,609 | 3.4% |
| Communications | 3,504 | 3.3% |
| Arts & Humanities | 7,230 | 6.7% |
| Total | 107,296 | 100.0% |
Transportation & Commute in San Joaquin County
Vehicle Availability by Sex in San Joaquin County
The most prevalent vehicle ownership categories in San Joaquin County are males with 2 vehicles (61,170, accounting for 33.9%) and females with 2 vehicles (48,669, making up 42.9%).
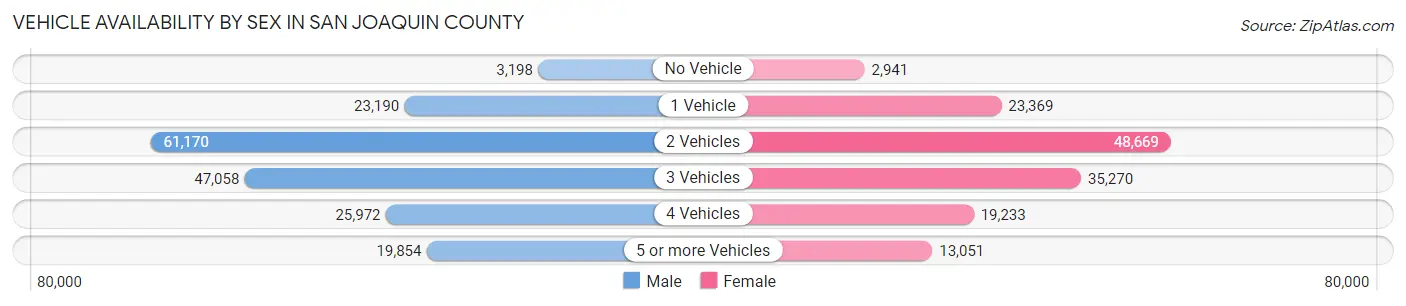
| Vehicles Available | Male | Female |
| No Vehicle | 3,198 (1.8%) | 2,941 (2.1%) |
| 1 Vehicle | 23,190 (12.9%) | 23,369 (16.4%) |
| 2 Vehicles | 61,170 (33.9%) | 48,669 (34.2%) |
| 3 Vehicles | 47,058 (26.1%) | 35,270 (24.7%) |
| 4 Vehicles | 25,972 (14.4%) | 19,233 (13.5%) |
| 5 or more Vehicles | 19,854 (11.0%) | 13,051 (9.2%) |
| Total | 180,442 (100.0%) | 142,533 (100.0%) |
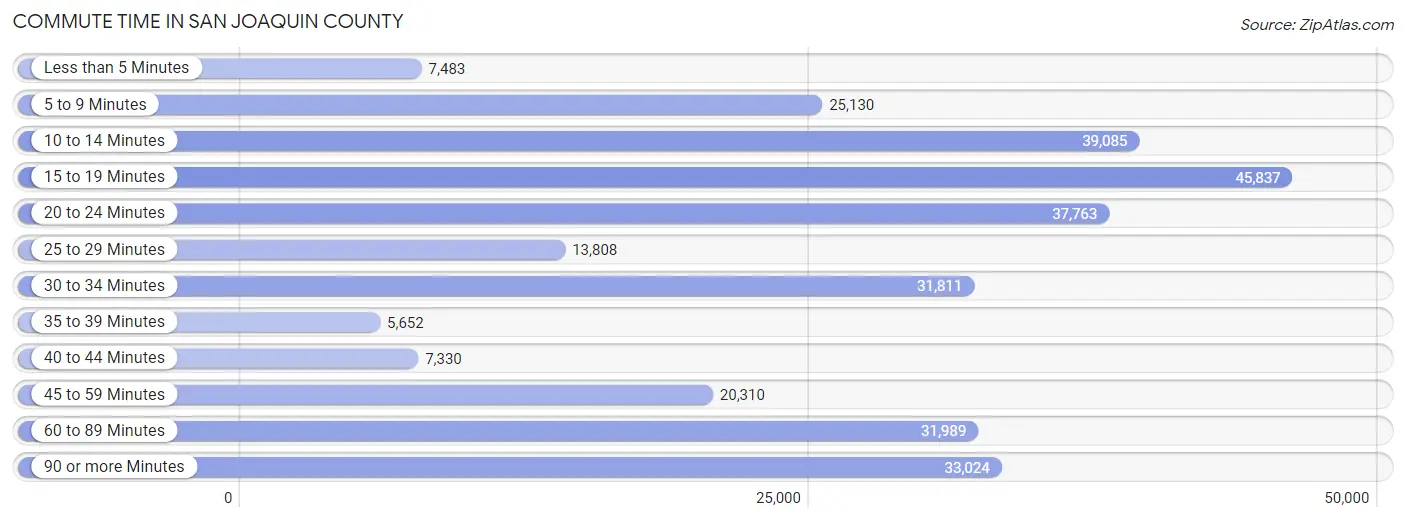
Commute Time in San Joaquin County
The most frequently occuring commute durations in San Joaquin County are 15 to 19 minutes (45,837 commuters, 15.3%), 10 to 14 minutes (39,085 commuters, 13.1%), and 20 to 24 minutes (37,763 commuters, 12.6%).
| Commute Time | # Commuters | % Commuters |
| Less than 5 Minutes | 7,483 | 2.5% |
| 5 to 9 Minutes | 25,130 | 8.4% |
| 10 to 14 Minutes | 39,085 | 13.1% |
| 15 to 19 Minutes | 45,837 | 15.3% |
| 20 to 24 Minutes | 37,763 | 12.6% |
| 25 to 29 Minutes | 13,808 | 4.6% |
| 30 to 34 Minutes | 31,811 | 10.6% |
| 35 to 39 Minutes | 5,652 | 1.9% |
| 40 to 44 Minutes | 7,330 | 2.5% |
| 45 to 59 Minutes | 20,310 | 6.8% |
| 60 to 89 Minutes | 31,989 | 10.7% |
| 90 or more Minutes | 33,024 | 11.0% |
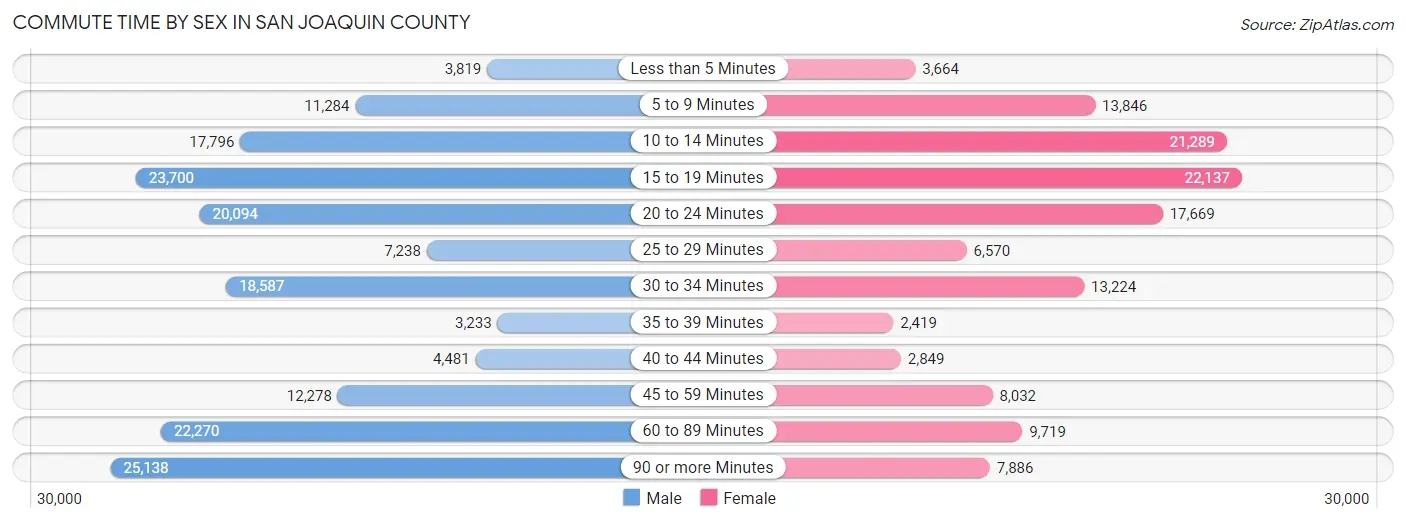
Commute Time by Sex in San Joaquin County
The most common commute times in San Joaquin County are 90 or more minutes (25,138 commuters, 14.8%) for males and 15 to 19 minutes (22,137 commuters, 17.1%) for females.
| Commute Time | Male | Female |
| Less than 5 Minutes | 3,819 (2.2%) | 3,664 (2.8%) |
| 5 to 9 Minutes | 11,284 (6.6%) | 13,846 (10.7%) |
| 10 to 14 Minutes | 17,796 (10.5%) | 21,289 (16.5%) |
| 15 to 19 Minutes | 23,700 (14.0%) | 22,137 (17.1%) |
| 20 to 24 Minutes | 20,094 (11.8%) | 17,669 (13.7%) |
| 25 to 29 Minutes | 7,238 (4.3%) | 6,570 (5.1%) |
| 30 to 34 Minutes | 18,587 (10.9%) | 13,224 (10.2%) |
| 35 to 39 Minutes | 3,233 (1.9%) | 2,419 (1.9%) |
| 40 to 44 Minutes | 4,481 (2.6%) | 2,849 (2.2%) |
| 45 to 59 Minutes | 12,278 (7.2%) | 8,032 (6.2%) |
| 60 to 89 Minutes | 22,270 (13.1%) | 9,719 (7.5%) |
| 90 or more Minutes | 25,138 (14.8%) | 7,886 (6.1%) |
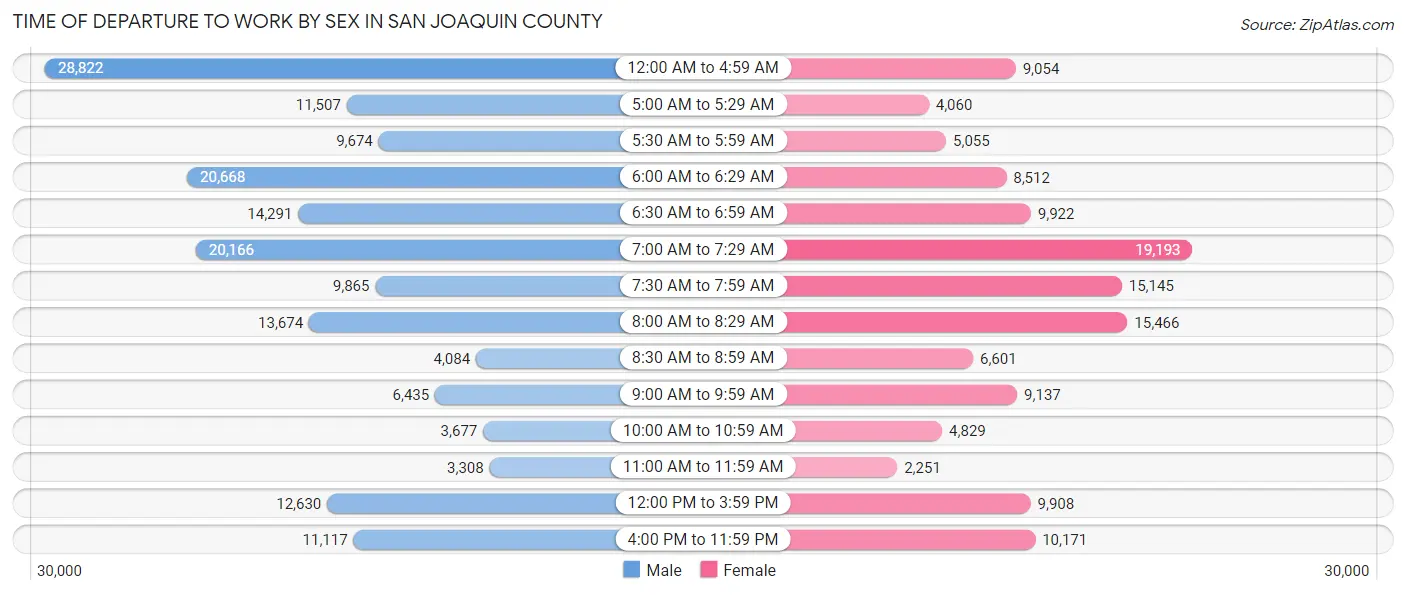
Time of Departure to Work by Sex in San Joaquin County
The most frequent times of departure to work in San Joaquin County are 12:00 AM to 4:59 AM (28,822, 17.0%) for males and 7:00 AM to 7:29 AM (19,193, 14.8%) for females.
| Time of Departure | Male | Female |
| 12:00 AM to 4:59 AM | 28,822 (17.0%) | 9,054 (7.0%) |
| 5:00 AM to 5:29 AM | 11,507 (6.8%) | 4,060 (3.1%) |
| 5:30 AM to 5:59 AM | 9,674 (5.7%) | 5,055 (3.9%) |
| 6:00 AM to 6:29 AM | 20,668 (12.2%) | 8,512 (6.6%) |
| 6:30 AM to 6:59 AM | 14,291 (8.4%) | 9,922 (7.7%) |
| 7:00 AM to 7:29 AM | 20,166 (11.9%) | 19,193 (14.8%) |
| 7:30 AM to 7:59 AM | 9,865 (5.8%) | 15,145 (11.7%) |
| 8:00 AM to 8:29 AM | 13,674 (8.1%) | 15,466 (12.0%) |
| 8:30 AM to 8:59 AM | 4,084 (2.4%) | 6,601 (5.1%) |
| 9:00 AM to 9:59 AM | 6,435 (3.8%) | 9,137 (7.1%) |
| 10:00 AM to 10:59 AM | 3,677 (2.2%) | 4,829 (3.7%) |
| 11:00 AM to 11:59 AM | 3,308 (1.9%) | 2,251 (1.7%) |
| 12:00 PM to 3:59 PM | 12,630 (7.4%) | 9,908 (7.7%) |
| 4:00 PM to 11:59 PM | 11,117 (6.5%) | 10,171 (7.9%) |
| Total | 169,918 (100.0%) | 129,304 (100.0%) |
Housing Occupancy in San Joaquin County
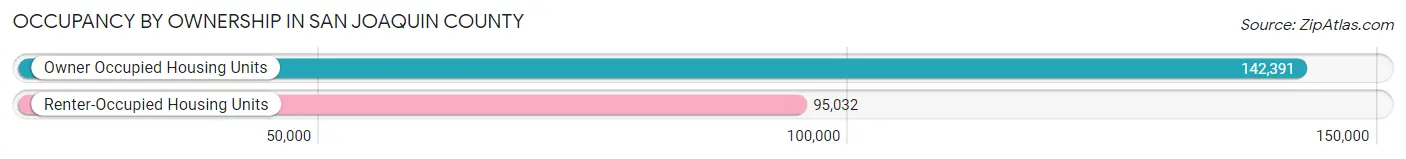
Occupancy by Ownership in San Joaquin County
Of the total 237,423 dwellings in San Joaquin County, owner-occupied units account for 142,391 (60.0%), while renter-occupied units make up 95,032 (40.0%).
| Occupancy | # Housing Units | % Housing Units |
| Owner Occupied Housing Units | 142,391 | 60.0% |
| Renter-Occupied Housing Units | 95,032 | 40.0% |
| Total Occupied Housing Units | 237,423 | 100.0% |
Occupancy by Household Size in San Joaquin County
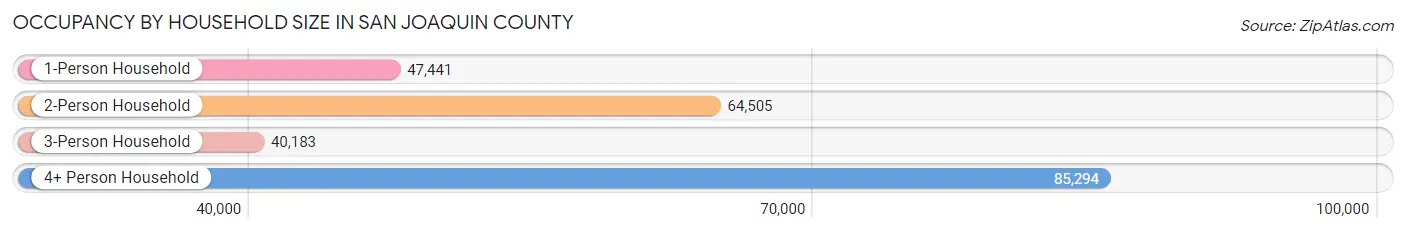
| Household Size | # Housing Units | % Housing Units |
| 1-Person Household | 47,441 | 20.0% |
| 2-Person Household | 64,505 | 27.2% |
| 3-Person Household | 40,183 | 16.9% |
| 4+ Person Household | 85,294 | 35.9% |
| Total Housing Units | 237,423 | 100.0% |
Occupancy by Ownership by Household Size in San Joaquin County
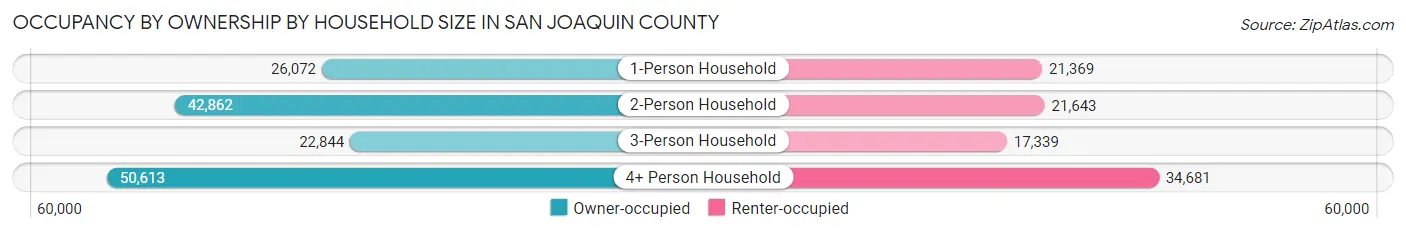
| Household Size | Owner-occupied | Renter-occupied |
| 1-Person Household | 26,072 (55.0%) | 21,369 (45.0%) |
| 2-Person Household | 42,862 (66.4%) | 21,643 (33.6%) |
| 3-Person Household | 22,844 (56.9%) | 17,339 (43.1%) |
| 4+ Person Household | 50,613 (59.3%) | 34,681 (40.7%) |
| Total Housing Units | 142,391 (60.0%) | 95,032 (40.0%) |
Occupancy by Educational Attainment in San Joaquin County
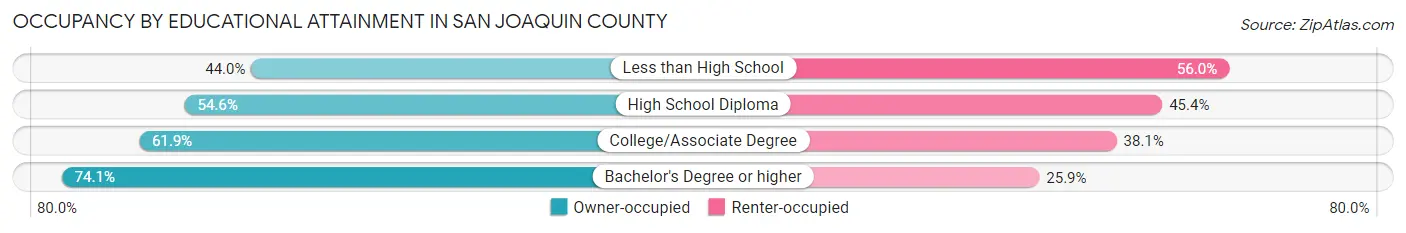
| Household Size | Owner-occupied | Renter-occupied |
| Less than High School | 17,072 (44.0%) | 21,691 (56.0%) |
| High School Diploma | 32,678 (54.6%) | 27,134 (45.4%) |
| College/Associate Degree | 51,862 (61.9%) | 31,971 (38.1%) |
| Bachelor's Degree or higher | 40,779 (74.1%) | 14,236 (25.9%) |
Occupancy by Age of Householder in San Joaquin County
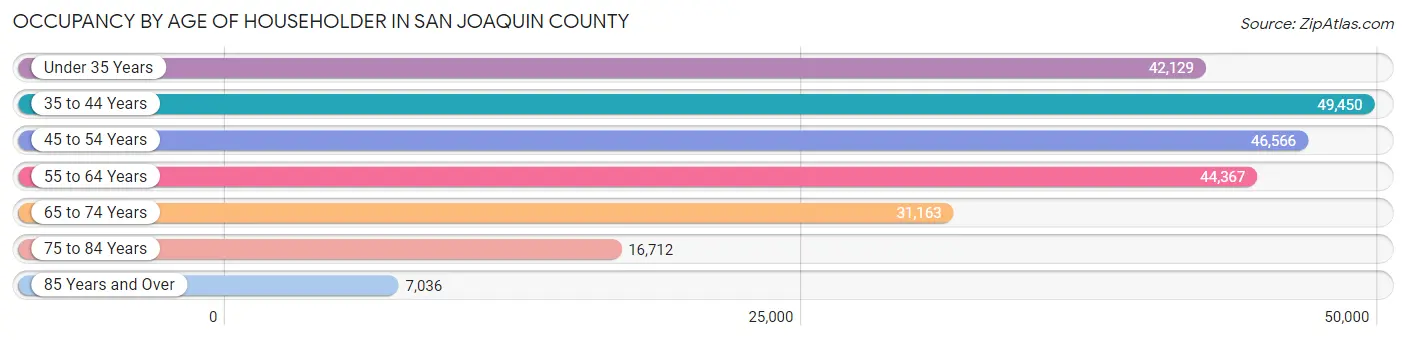
| Age Bracket | # Households | % Households |
| Under 35 Years | 42,129 | 17.7% |
| 35 to 44 Years | 49,450 | 20.8% |
| 45 to 54 Years | 46,566 | 19.6% |
| 55 to 64 Years | 44,367 | 18.7% |
| 65 to 74 Years | 31,163 | 13.1% |
| 75 to 84 Years | 16,712 | 7.0% |
| 85 Years and Over | 7,036 | 3.0% |
| Total | 237,423 | 100.0% |
Housing Finances in San Joaquin County
Median Income by Occupancy in San Joaquin County
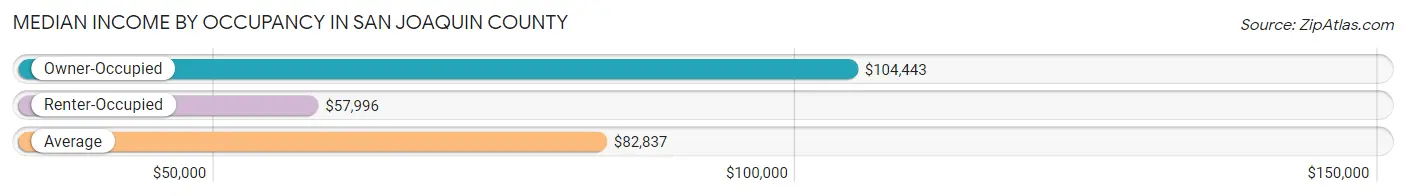
| Occupancy Type | # Households | Median Income |
| Owner-Occupied | 142,391 (60.0%) | $104,443 |
| Renter-Occupied | 95,032 (40.0%) | $57,996 |
| Average | 237,423 (100.0%) | $82,837 |
Occupancy by Householder Income Bracket in San Joaquin County
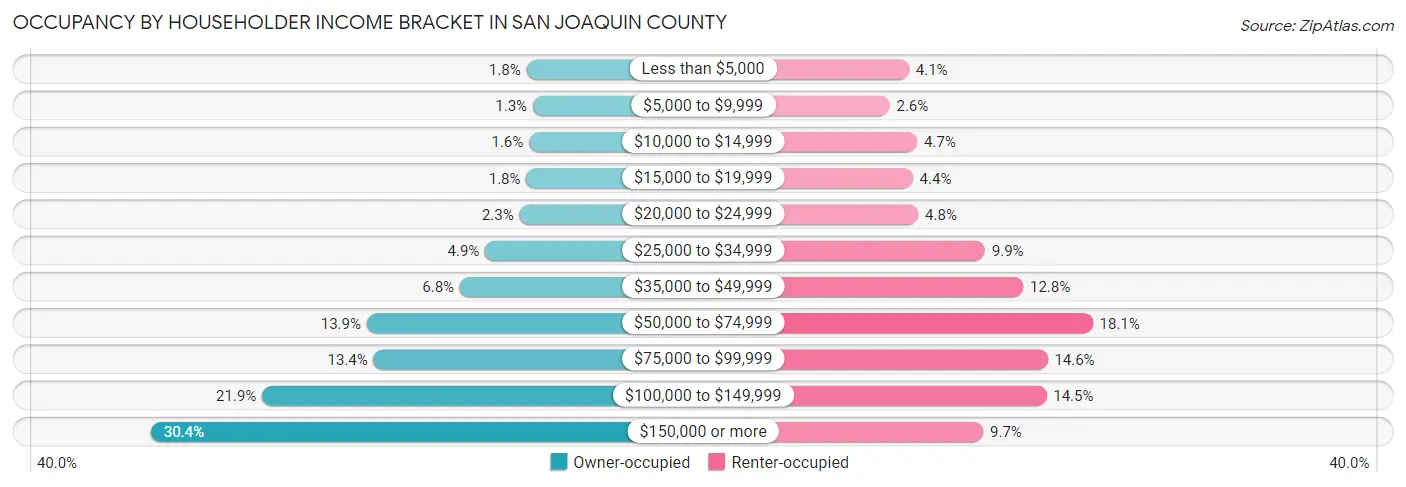
| Income Bracket | Owner-occupied | Renter-occupied |
| Less than $5,000 | 2,504 (1.8%) | 3,862 (4.1%) |
| $5,000 to $9,999 | 1,814 (1.3%) | 2,460 (2.6%) |
| $10,000 to $14,999 | 2,218 (1.6%) | 4,454 (4.7%) |
| $15,000 to $19,999 | 2,527 (1.8%) | 4,131 (4.3%) |
| $20,000 to $24,999 | 3,260 (2.3%) | 4,537 (4.8%) |
| $25,000 to $34,999 | 6,985 (4.9%) | 9,356 (9.9%) |
| $35,000 to $49,999 | 9,720 (6.8%) | 12,123 (12.8%) |
| $50,000 to $74,999 | 19,834 (13.9%) | 17,166 (18.1%) |
| $75,000 to $99,999 | 19,088 (13.4%) | 13,895 (14.6%) |
| $100,000 to $149,999 | 31,189 (21.9%) | 13,809 (14.5%) |
| $150,000 or more | 43,252 (30.4%) | 9,239 (9.7%) |
| Total | 142,391 (100.0%) | 95,032 (100.0%) |
Monthly Housing Cost Tiers in San Joaquin County
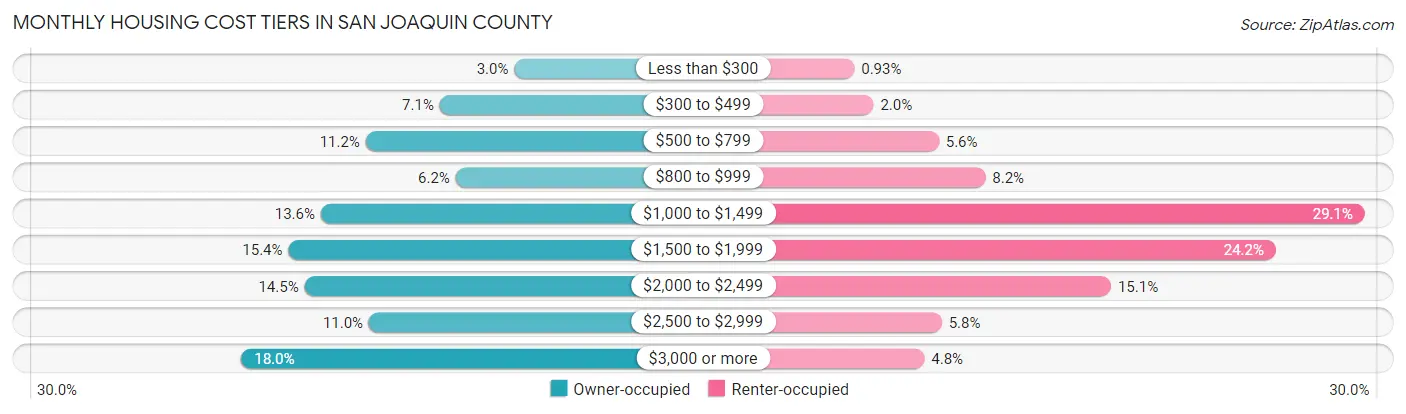
| Monthly Cost | Owner-occupied | Renter-occupied |
| Less than $300 | 4,206 (2.9%) | 881 (0.9%) |
| $300 to $499 | 10,068 (7.1%) | 1,888 (2.0%) |
| $500 to $799 | 15,893 (11.2%) | 5,318 (5.6%) |
| $800 to $999 | 8,819 (6.2%) | 7,761 (8.2%) |
| $1,000 to $1,499 | 19,424 (13.6%) | 27,680 (29.1%) |
| $1,500 to $1,999 | 21,973 (15.4%) | 23,009 (24.2%) |
| $2,000 to $2,499 | 20,701 (14.5%) | 14,360 (15.1%) |
| $2,500 to $2,999 | 15,633 (11.0%) | 5,476 (5.8%) |
| $3,000 or more | 25,674 (18.0%) | 4,563 (4.8%) |
| Total | 142,391 (100.0%) | 95,032 (100.0%) |
Physical Housing Characteristics in San Joaquin County
Housing Structures in San Joaquin County
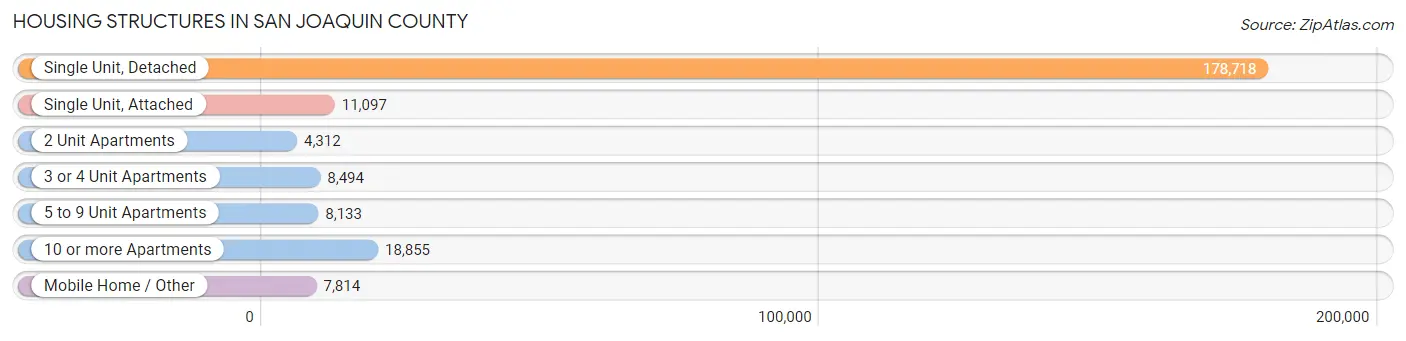
| Structure Type | # Housing Units | % Housing Units |
| Single Unit, Detached | 178,718 | 75.3% |
| Single Unit, Attached | 11,097 | 4.7% |
| 2 Unit Apartments | 4,312 | 1.8% |
| 3 or 4 Unit Apartments | 8,494 | 3.6% |
| 5 to 9 Unit Apartments | 8,133 | 3.4% |
| 10 or more Apartments | 18,855 | 7.9% |
| Mobile Home / Other | 7,814 | 3.3% |
| Total | 237,423 | 100.0% |
Housing Structures by Occupancy in San Joaquin County
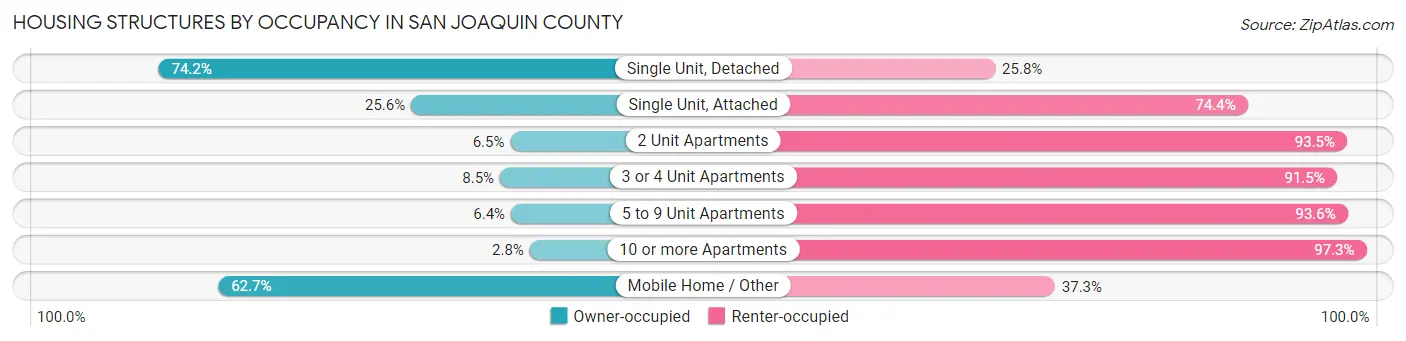
| Structure Type | Owner-occupied | Renter-occupied |
| Single Unit, Detached | 132,614 (74.2%) | 46,104 (25.8%) |
| Single Unit, Attached | 2,841 (25.6%) | 8,256 (74.4%) |
| 2 Unit Apartments | 280 (6.5%) | 4,032 (93.5%) |
| 3 or 4 Unit Apartments | 720 (8.5%) | 7,774 (91.5%) |
| 5 to 9 Unit Apartments | 517 (6.4%) | 7,616 (93.6%) |
| 10 or more Apartments | 519 (2.8%) | 18,336 (97.3%) |
| Mobile Home / Other | 4,900 (62.7%) | 2,914 (37.3%) |
| Total | 142,391 (60.0%) | 95,032 (40.0%) |
Housing Structures by Number of Rooms in San Joaquin County
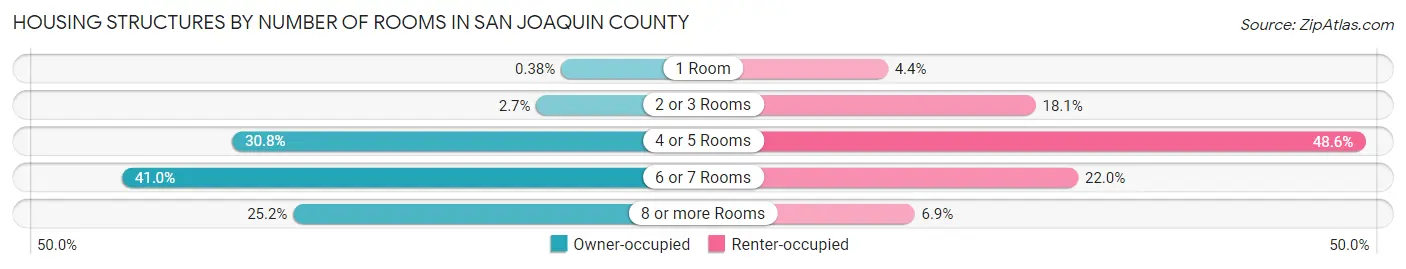
| Number of Rooms | Owner-occupied | Renter-occupied |
| 1 Room | 535 (0.4%) | 4,205 (4.4%) |
| 2 or 3 Rooms | 3,797 (2.7%) | 17,193 (18.1%) |
| 4 or 5 Rooms | 43,856 (30.8%) | 46,143 (48.6%) |
| 6 or 7 Rooms | 58,376 (41.0%) | 20,930 (22.0%) |
| 8 or more Rooms | 35,827 (25.2%) | 6,561 (6.9%) |
| Total | 142,391 (100.0%) | 95,032 (100.0%) |
Housing Structure by Heating Type in San Joaquin County
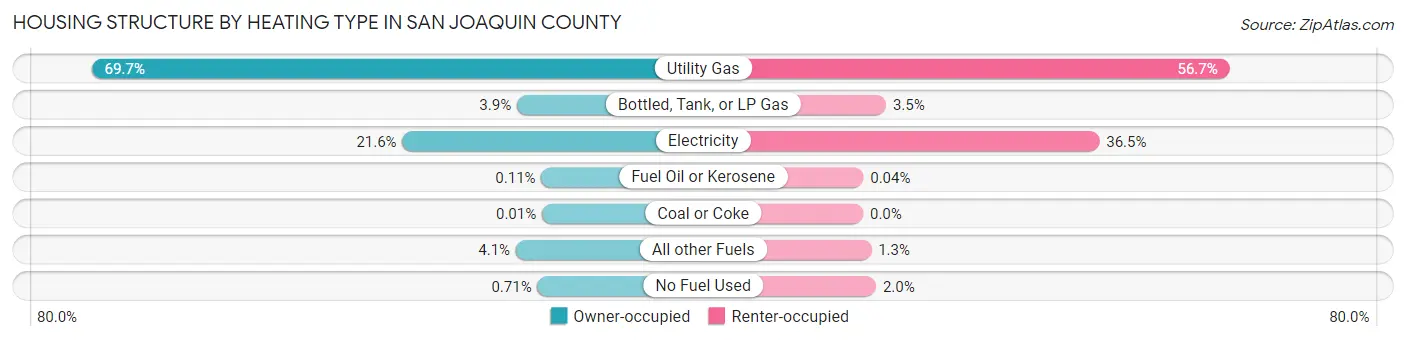
| Heating Type | Owner-occupied | Renter-occupied |
| Utility Gas | 99,177 (69.7%) | 53,833 (56.7%) |
| Bottled, Tank, or LP Gas | 5,526 (3.9%) | 3,360 (3.5%) |
| Electricity | 30,747 (21.6%) | 34,703 (36.5%) |
| Fuel Oil or Kerosene | 152 (0.1%) | 41 (0.0%) |
| Coal or Coke | 18 (0.0%) | 0 (0.0%) |
| All other Fuels | 5,767 (4.1%) | 1,196 (1.3%) |
| No Fuel Used | 1,004 (0.7%) | 1,899 (2.0%) |
| Total | 142,391 (100.0%) | 95,032 (100.0%) |
Household Vehicle Usage in San Joaquin County
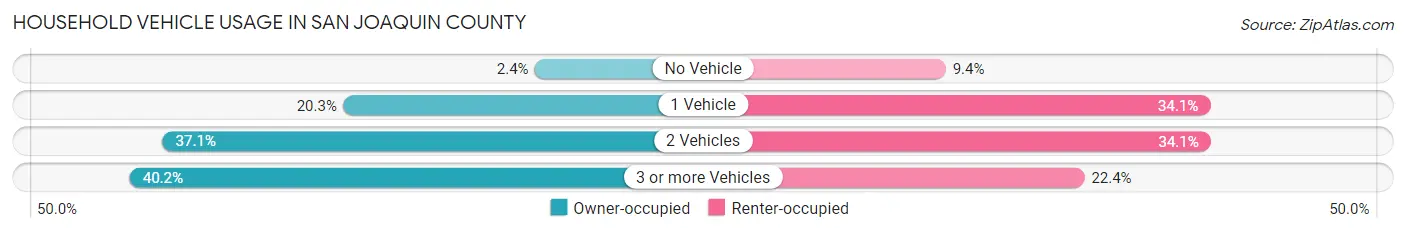
| Vehicles per Household | Owner-occupied | Renter-occupied |
| No Vehicle | 3,429 (2.4%) | 8,947 (9.4%) |
| 1 Vehicle | 28,902 (20.3%) | 32,400 (34.1%) |
| 2 Vehicles | 52,844 (37.1%) | 32,437 (34.1%) |
| 3 or more Vehicles | 57,216 (40.2%) | 21,248 (22.4%) |
| Total | 142,391 (100.0%) | 95,032 (100.0%) |
Real Estate & Mortgages in San Joaquin County
Real Estate and Mortgage Overview in San Joaquin County
| Characteristic | Without Mortgage | With Mortgage |
| Housing Units | 42,509 | 99,882 |
| Median Property Value | $407,500 | $483,100 |
| Median Household Income | $72,742 | $35,095 |
| Monthly Housing Costs | $644 | $25,530 |
| Real Estate Taxes | $2,679 | $1,755 |
Property Value by Mortgage Status in San Joaquin County
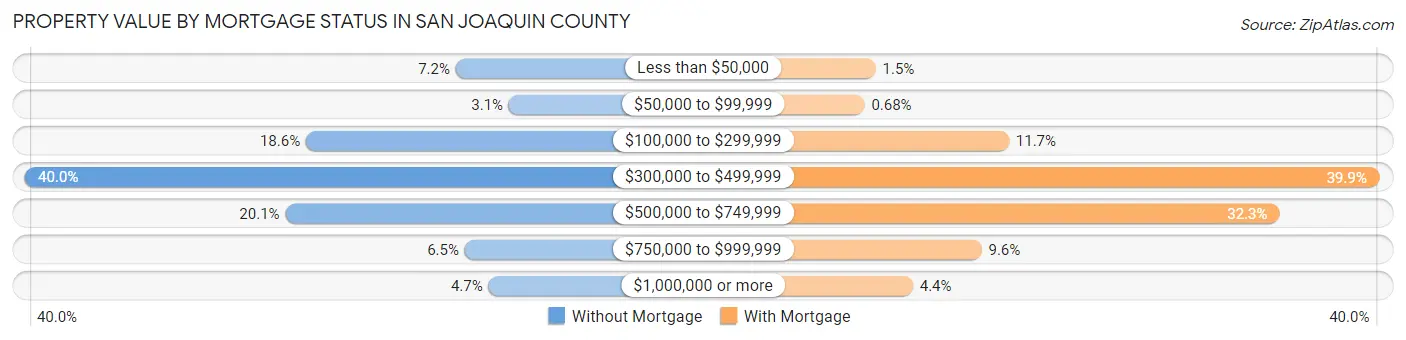
| Property Value | Without Mortgage | With Mortgage |
| Less than $50,000 | 3,039 (7.1%) | 1,532 (1.5%) |
| $50,000 to $99,999 | 1,317 (3.1%) | 683 (0.7%) |
| $100,000 to $299,999 | 7,888 (18.6%) | 11,668 (11.7%) |
| $300,000 to $499,999 | 16,986 (40.0%) | 39,817 (39.9%) |
| $500,000 to $749,999 | 8,557 (20.1%) | 32,238 (32.3%) |
| $750,000 to $999,999 | 2,744 (6.5%) | 9,593 (9.6%) |
| $1,000,000 or more | 1,978 (4.6%) | 4,351 (4.4%) |
| Total | 42,509 (100.0%) | 99,882 (100.0%) |
Household Income by Mortgage Status in San Joaquin County
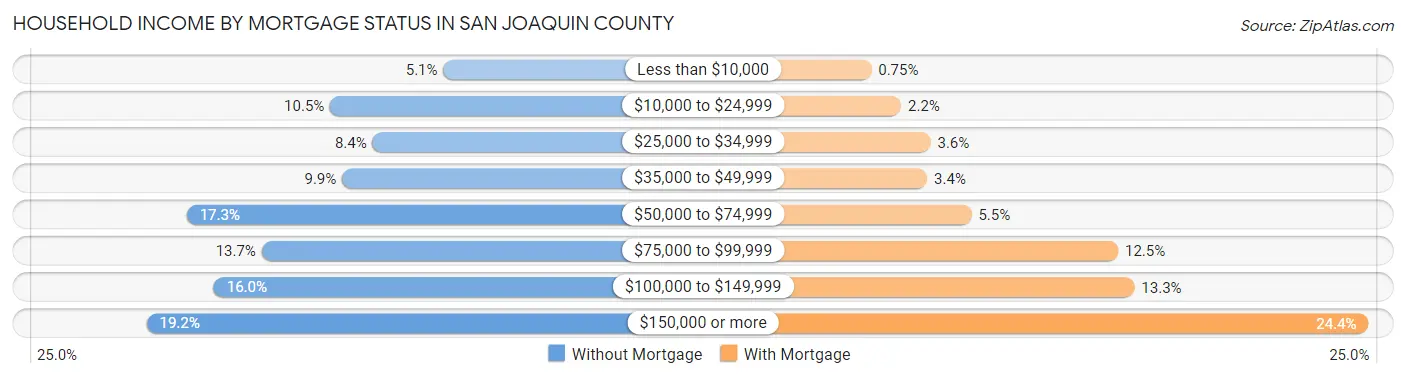
| Household Income | Without Mortgage | With Mortgage |
| Less than $10,000 | 2,149 (5.1%) | 750 (0.7%) |
| $10,000 to $24,999 | 4,444 (10.4%) | 2,169 (2.2%) |
| $25,000 to $34,999 | 3,584 (8.4%) | 3,561 (3.6%) |
| $35,000 to $49,999 | 4,202 (9.9%) | 3,401 (3.4%) |
| $50,000 to $74,999 | 7,347 (17.3%) | 5,518 (5.5%) |
| $75,000 to $99,999 | 5,827 (13.7%) | 12,487 (12.5%) |
| $100,000 to $149,999 | 6,799 (16.0%) | 13,261 (13.3%) |
| $150,000 or more | 8,157 (19.2%) | 24,390 (24.4%) |
| Total | 42,509 (100.0%) | 99,882 (100.0%) |
Property Value to Household Income Ratio in San Joaquin County
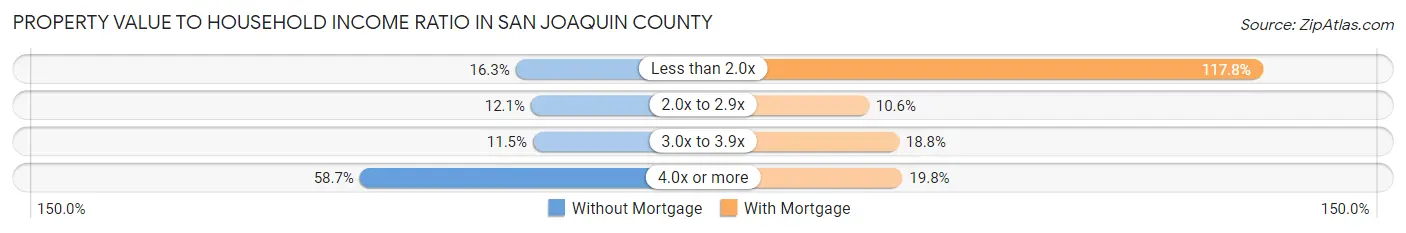
| Value-to-Income Ratio | Without Mortgage | With Mortgage |
| Less than 2.0x | 6,913 (16.3%) | 117,703 (117.8%) |
| 2.0x to 2.9x | 5,142 (12.1%) | 10,566 (10.6%) |
| 3.0x to 3.9x | 4,905 (11.5%) | 18,762 (18.8%) |
| 4.0x or more | 24,958 (58.7%) | 19,723 (19.8%) |
| Total | 42,509 (100.0%) | 99,882 (100.0%) |
Real Estate Taxes by Mortgage Status in San Joaquin County
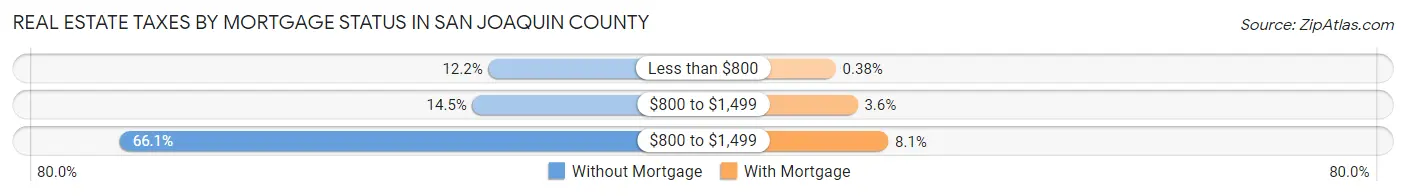
| Property Taxes | Without Mortgage | With Mortgage |
| Less than $800 | 5,195 (12.2%) | 383 (0.4%) |
| $800 to $1,499 | 6,178 (14.5%) | 3,562 (3.6%) |
| $800 to $1,499 | 28,093 (66.1%) | 8,039 (8.1%) |
| Total | 42,509 (100.0%) | 99,882 (100.0%) |
Health & Disability in San Joaquin County
Health Insurance Coverage by Age in San Joaquin County
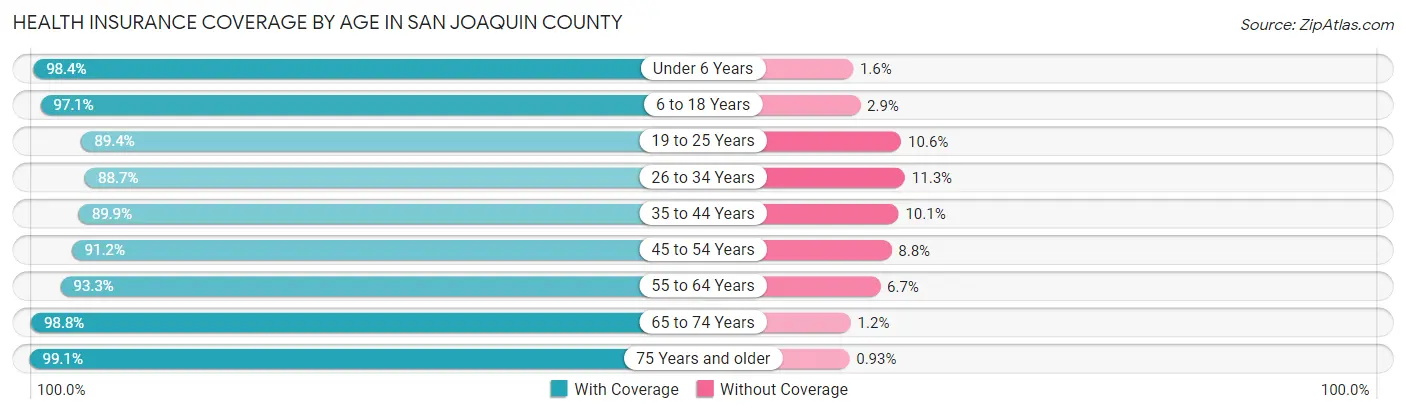
| Age Bracket | With Coverage | Without Coverage |
| Under 6 Years | 60,977 (98.4%) | 1,000 (1.6%) |
| 6 to 18 Years | 152,600 (97.1%) | 4,619 (2.9%) |
| 19 to 25 Years | 65,261 (89.4%) | 7,736 (10.6%) |
| 26 to 34 Years | 86,046 (88.7%) | 10,957 (11.3%) |
| 35 to 44 Years | 93,564 (89.9%) | 10,527 (10.1%) |
| 45 to 54 Years | 84,416 (91.2%) | 8,117 (8.8%) |
| 55 to 64 Years | 79,828 (93.3%) | 5,715 (6.7%) |
| 65 to 74 Years | 57,974 (98.8%) | 700 (1.2%) |
| 75 Years and older | 39,114 (99.1%) | 367 (0.9%) |
| Total | 719,780 (93.5%) | 49,738 (6.5%) |
Health Insurance Coverage by Citizenship Status in San Joaquin County
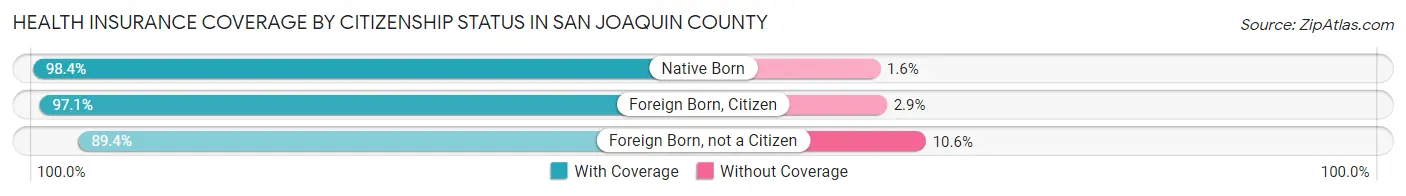
| Citizenship Status | With Coverage | Without Coverage |
| Native Born | 60,977 (98.4%) | 1,000 (1.6%) |
| Foreign Born, Citizen | 152,600 (97.1%) | 4,619 (2.9%) |
| Foreign Born, not a Citizen | 65,261 (89.4%) | 7,736 (10.6%) |
Health Insurance Coverage by Household Income in San Joaquin County
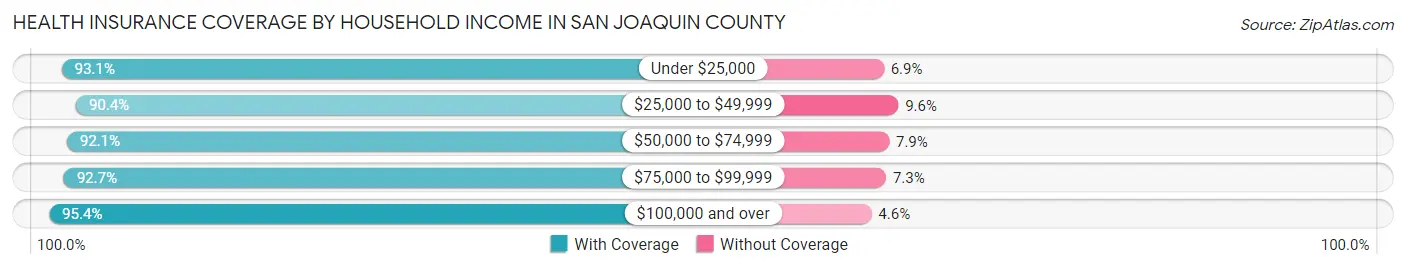
| Household Income | With Coverage | Without Coverage |
| Under $25,000 | 61,648 (93.1%) | 4,586 (6.9%) |
| $25,000 to $49,999 | 93,973 (90.4%) | 10,017 (9.6%) |
| $50,000 to $74,999 | 102,632 (92.1%) | 8,816 (7.9%) |
| $75,000 to $99,999 | 102,430 (92.7%) | 8,115 (7.3%) |
| $100,000 and over | 352,034 (95.4%) | 17,003 (4.6%) |
Public vs Private Health Insurance Coverage by Age in San Joaquin County
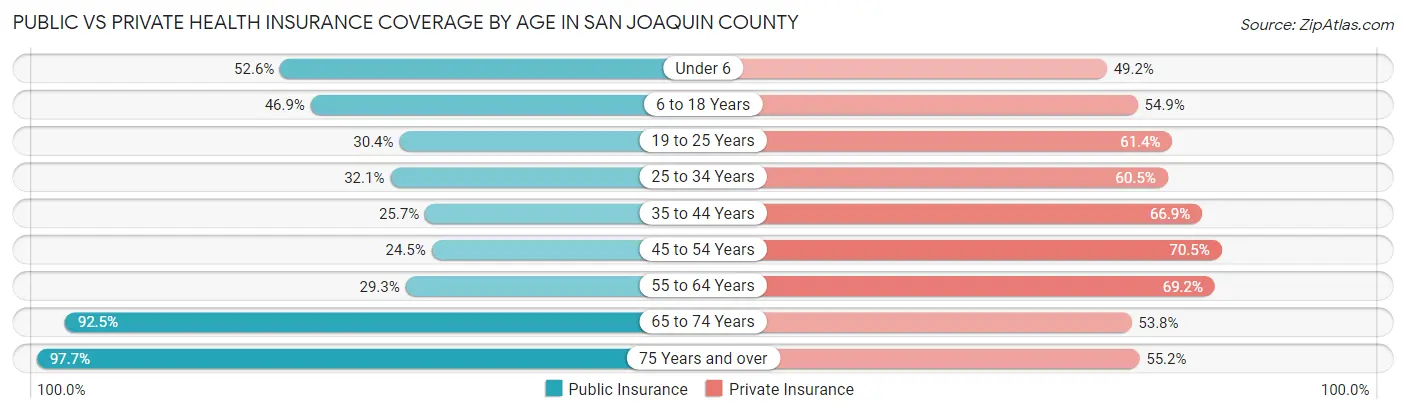
| Age Bracket | Public Insurance | Private Insurance |
| Under 6 | 32,574 (52.6%) | 30,474 (49.2%) |
| 6 to 18 Years | 73,736 (46.9%) | 86,332 (54.9%) |
| 19 to 25 Years | 22,223 (30.4%) | 44,790 (61.4%) |
| 25 to 34 Years | 31,163 (32.1%) | 58,666 (60.5%) |
| 35 to 44 Years | 26,717 (25.7%) | 69,606 (66.9%) |
| 45 to 54 Years | 22,638 (24.5%) | 65,231 (70.5%) |
| 55 to 64 Years | 25,059 (29.3%) | 59,225 (69.2%) |
| 65 to 74 Years | 54,290 (92.5%) | 31,538 (53.7%) |
| 75 Years and over | 38,590 (97.7%) | 21,800 (55.2%) |
| Total | 326,990 (42.5%) | 467,662 (60.8%) |
Disability Status by Sex by Age in San Joaquin County
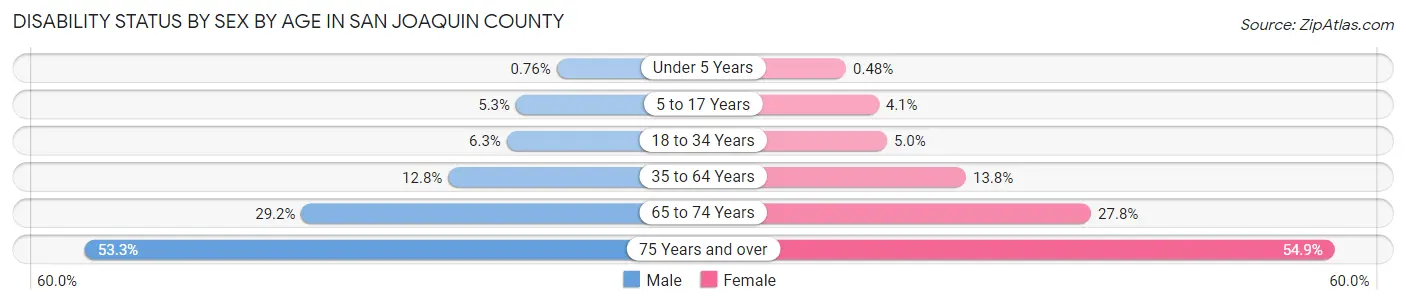
| Age Bracket | Male | Female |
| Under 5 Years | 202 (0.8%) | 122 (0.5%) |
| 5 to 17 Years | 4,229 (5.3%) | 3,104 (4.1%) |
| 18 to 34 Years | 5,835 (6.3%) | 4,498 (5.0%) |
| 35 to 64 Years | 18,085 (12.8%) | 19,543 (13.8%) |
| 65 to 74 Years | 7,840 (29.2%) | 8,833 (27.8%) |
| 75 Years and over | 8,604 (53.3%) | 12,806 (54.9%) |
Disability Class by Sex by Age in San Joaquin County
Disability Class: Hearing Difficulty
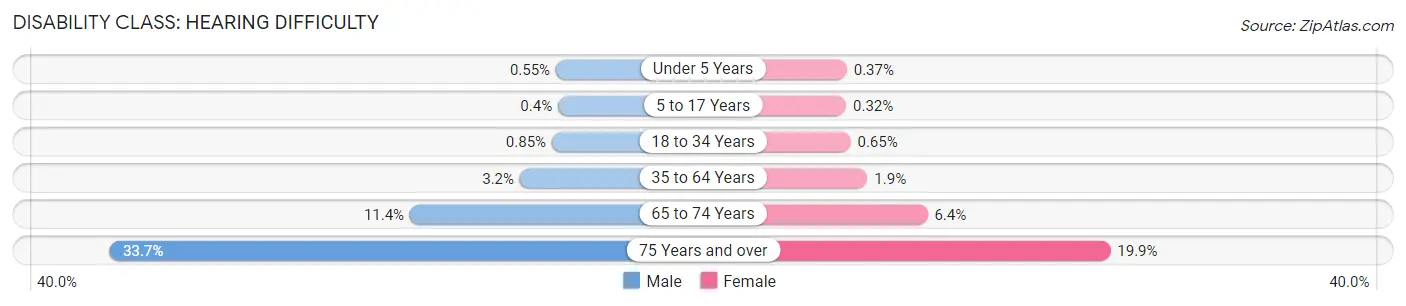
| Age Bracket | Male | Female |
| Under 5 Years | 147 (0.5%) | 94 (0.4%) |
| 5 to 17 Years | 317 (0.4%) | 244 (0.3%) |
| 18 to 34 Years | 788 (0.9%) | 581 (0.6%) |
| 35 to 64 Years | 4,553 (3.2%) | 2,685 (1.9%) |
| 65 to 74 Years | 3,061 (11.4%) | 2,022 (6.4%) |
| 75 Years and over | 5,436 (33.7%) | 4,653 (19.9%) |
Disability Class: Vision Difficulty
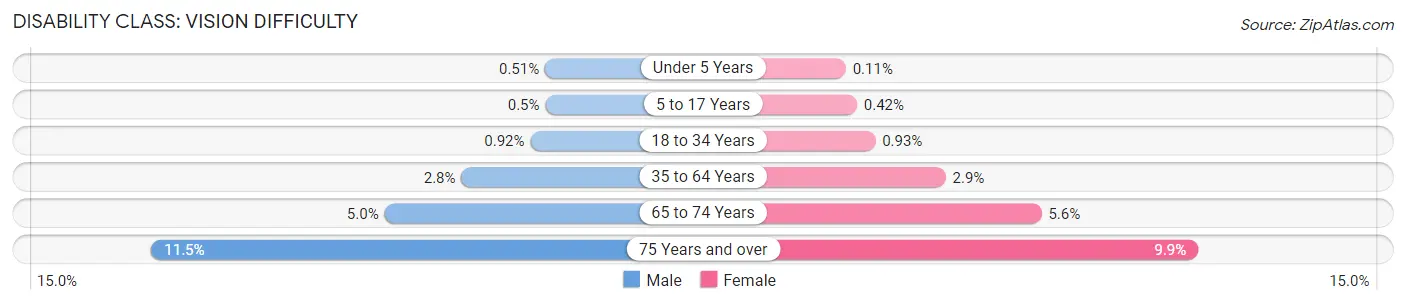
| Age Bracket | Male | Female |
| Under 5 Years | 135 (0.5%) | 28 (0.1%) |
| 5 to 17 Years | 401 (0.5%) | 313 (0.4%) |
| 18 to 34 Years | 848 (0.9%) | 829 (0.9%) |
| 35 to 64 Years | 4,006 (2.8%) | 4,078 (2.9%) |
| 65 to 74 Years | 1,337 (5.0%) | 1,770 (5.6%) |
| 75 Years and over | 1,853 (11.5%) | 2,315 (9.9%) |
Disability Class: Cognitive Difficulty
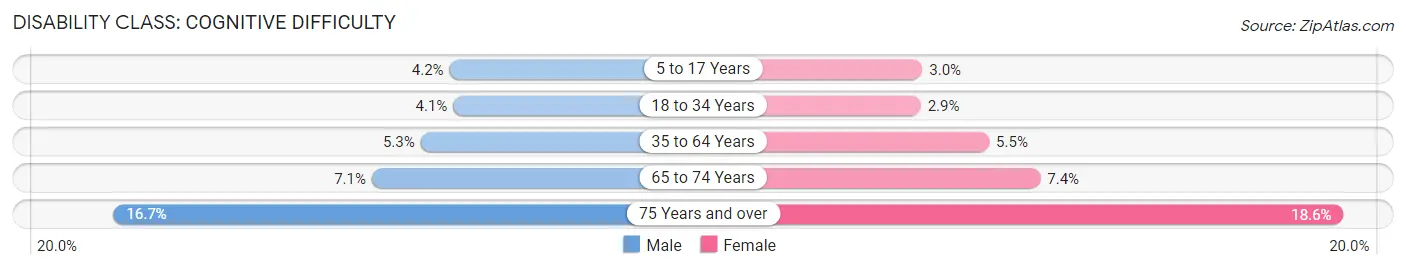
| Age Bracket | Male | Female |
| 5 to 17 Years | 3,387 (4.2%) | 2,255 (3.0%) |
| 18 to 34 Years | 3,780 (4.1%) | 2,618 (2.9%) |
| 35 to 64 Years | 7,472 (5.3%) | 7,723 (5.5%) |
| 65 to 74 Years | 1,911 (7.1%) | 2,345 (7.4%) |
| 75 Years and over | 2,697 (16.7%) | 4,345 (18.6%) |
Disability Class: Ambulatory Difficulty
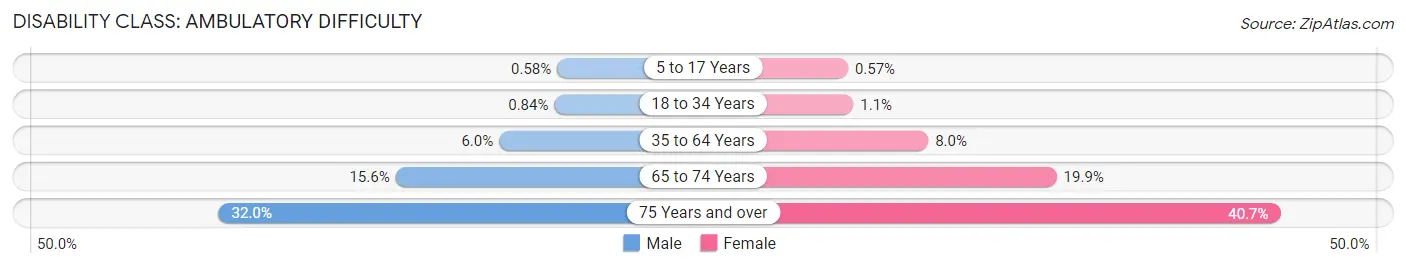
| Age Bracket | Male | Female |
| 5 to 17 Years | 464 (0.6%) | 432 (0.6%) |
| 18 to 34 Years | 777 (0.8%) | 957 (1.1%) |
| 35 to 64 Years | 8,415 (6.0%) | 11,322 (8.0%) |
| 65 to 74 Years | 4,185 (15.6%) | 6,342 (19.9%) |
| 75 Years and over | 5,166 (32.0%) | 9,495 (40.7%) |
Disability Class: Self-Care Difficulty
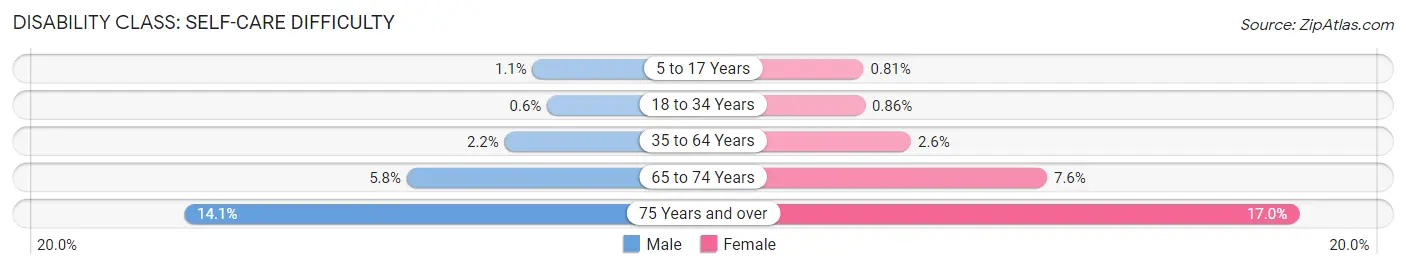
| Age Bracket | Male | Female |
| 5 to 17 Years | 913 (1.1%) | 611 (0.8%) |
| 18 to 34 Years | 552 (0.6%) | 766 (0.9%) |
| 35 to 64 Years | 3,069 (2.2%) | 3,625 (2.6%) |
| 65 to 74 Years | 1,562 (5.8%) | 2,425 (7.6%) |
| 75 Years and over | 2,274 (14.1%) | 3,959 (17.0%) |
Technology Access in San Joaquin County
Computing Device Access in San Joaquin County
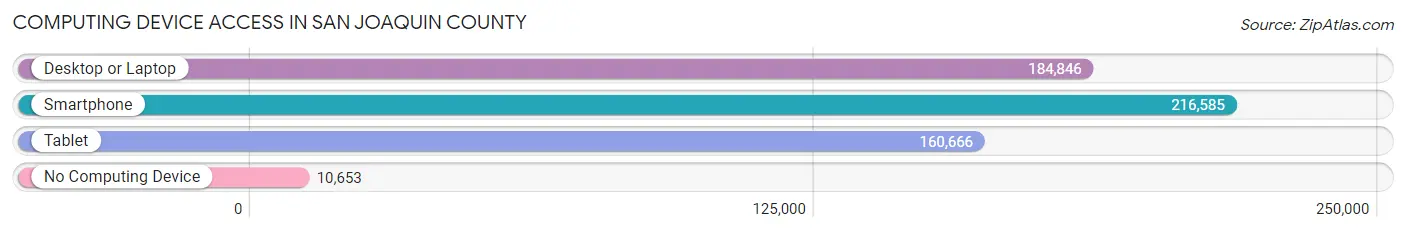
| Device Type | # Households | % Households |
| Desktop or Laptop | 184,846 | 77.9% |
| Smartphone | 216,585 | 91.2% |
| Tablet | 160,666 | 67.7% |
| No Computing Device | 10,653 | 4.5% |
| Total | 237,423 | 100.0% |
Internet Access in San Joaquin County
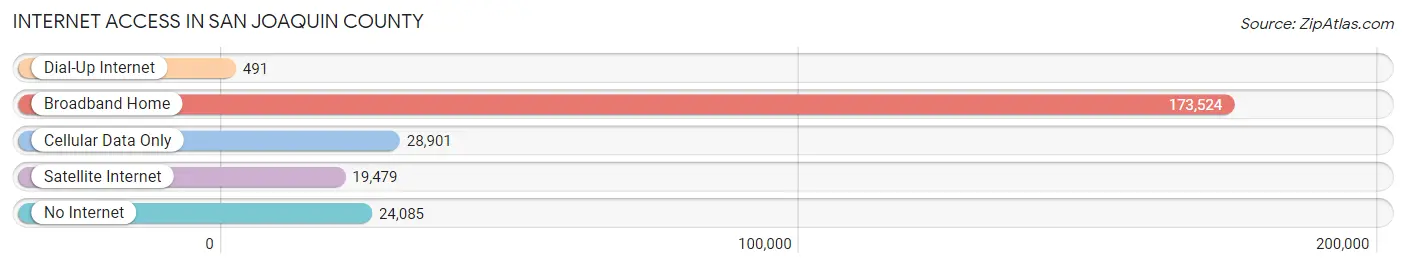
| Internet Type | # Households | % Households |
| Dial-Up Internet | 491 | 0.2% |
| Broadband Home | 173,524 | 73.1% |
| Cellular Data Only | 28,901 | 12.2% |
| Satellite Internet | 19,479 | 8.2% |
| No Internet | 24,085 | 10.1% |
| Total | 237,423 | 100.0% |
San Joaquin County Summary
San Joaquin County, California is located in the Central Valley of California, and is part of the San Francisco Bay Area. It is the eighth most populous county in the state, with a population of 785,306 as of the 2019 census. The county seat is Stockton, and the largest city is Stockton.
Geography
San Joaquin County is located in the Central Valley of California, and is bordered by Sacramento County to the north, Stanislaus County to the east, Merced County to the south, and Contra Costa County to the west. The county covers an area of 1,426 square miles, making it the fourth largest county in California. The terrain is mostly flat, with some rolling hills in the western part of the county. The highest point in the county is the peak of Mount Oso, which rises to an elevation of 2,788 feet. The county is home to several rivers, including the San Joaquin River, which forms the western boundary of the county, and the Mokelumne River, which flows through the eastern part of the county.
The climate of San Joaquin County is Mediterranean, with hot, dry summers and mild, wet winters. The average annual temperature is 61°F, and the average annual precipitation is 17.5 inches.
Economy
San Joaquin County has a diverse economy, with a mix of agriculture, manufacturing, and services. Agriculture is the largest sector of the economy, accounting for about one-third of the county’s total economic output. The county is one of the top agricultural producers in the state, with crops such as tomatoes, almonds, grapes, and cotton. Manufacturing is the second largest sector of the economy, and includes food processing, metal fabrication, and electronics. The service sector is the third largest sector, and includes healthcare, education, and retail.
The county’s largest employers are the San Joaquin County Office of Education, San Joaquin General Hospital, and the University of the Pacific. Other major employers include the San Joaquin County government, the City of Stockton, and the San Joaquin County Sheriff’s Office.
Demographics
As of the 2019 census, San Joaquin County had a population of 785,306, making it the eighth most populous county in California. The population is racially and ethnically diverse, with the largest racial/ethnic groups being White (47.3%), Hispanic or Latino (37.2%), Asian (9.2%), and Black or African American (4.2%). The median household income is $63,845, and the median home value is $346,400.
The county is home to several large cities, including Stockton, which is the largest city in the county and the 13th largest city in California. Other major cities include Lodi, Tracy, and Manteca.
Conclusion
San Joaquin County is a diverse and vibrant county located in the Central Valley of California. It has a diverse economy, with a mix of agriculture, manufacturing, and services, and is home to several large cities. The population is racially and ethnically diverse, and the median household income is above the state average. San Joaquin County is an important part of the San Francisco Bay Area, and is an attractive place to live and work.
Common Questions
What is Per Capita Income in San Joaquin County?
Per Capita income in San Joaquin County is $33,870.
What is the Median Family Income in San Joaquin County?
Median Family Income in San Joaquin County is $91,565.
What is the Median Household income in San Joaquin County?
Median Household Income in San Joaquin County is $82,837.
What is Income or Wage Gap in San Joaquin County?
Income or Wage Gap in San Joaquin County is 28.6%.
Women in San Joaquin County earn 71.4 cents for every dollar earned by a man.
What is Family Income Deficit in San Joaquin County?
Family Income Deficit in San Joaquin County is $11,453.
Families that are below poverty line in San Joaquin County earn $11,453 less on average than the poverty threshold level.
What is Inequality or Gini Index in San Joaquin County?
Inequality or Gini Index in San Joaquin County is 0.44.
What is the Total Population of San Joaquin County?
Total Population of San Joaquin County is 779,445.
What is the Total Male Population of San Joaquin County?
Total Male Population of San Joaquin County is 391,204.
What is the Total Female Population of San Joaquin County?
Total Female Population of San Joaquin County is 388,241.
What is the Ratio of Males per 100 Females in San Joaquin County?
There are 100.76 Males per 100 Females in San Joaquin County.
What is the Ratio of Females per 100 Males in San Joaquin County?
There are 99.24 Females per 100 Males in San Joaquin County.
What is the Median Population Age in San Joaquin County?
Median Population Age in San Joaquin County is 34.8 Years.
What is the Average Family Size in San Joaquin County
Average Family Size in San Joaquin County is 3.7 People.
What is the Average Household Size in San Joaquin County
Average Household Size in San Joaquin County is 3.2 People.
How Large is the Labor Force in San Joaquin County?
There are 365,283 People in the Labor Forcein in San Joaquin County.
What is the Percentage of People in the Labor Force in San Joaquin County?
61.3% of People are in the Labor Force in San Joaquin County.
What is the Unemployment Rate in San Joaquin County?
Unemployment Rate in San Joaquin County is 7.2%.