San Diego County, CA Map & Demographics
San Diego County Map
San Diego County Overview
$46,957
PER CAPITA INCOME
$111,734
AVG FAMILY INCOME
$96,974
AVG HOUSEHOLD INCOME
26.1%
WAGE / INCOME GAP [ % ]
73.9¢/ $1
WAGE / INCOME GAP [ $ ]
$11,123
FAMILY INCOME DEFICIT
0.46
INEQUALITY / GINI INDEX
3,289,701
TOTAL POPULATION
1,667,851
MALE POPULATION
1,621,850
FEMALE POPULATION
102.84
MALES / 100 FEMALES
97.24
FEMALES / 100 MALES
36.7
MEDIAN AGE
3.3
AVG FAMILY SIZE
2.8
AVG HOUSEHOLD SIZE
1,766,964
LABOR FORCE [ PEOPLE ]
66.2%
PERCENT IN LABOR FORCE
6.3%
UNEMPLOYMENT RATE
Income in San Diego County
Income Overview in San Diego County
Per Capita Income in San Diego County is $46,957, while median incomes of families and households are $111,734 and $96,974 respectively.
| Characteristic | Number | Measure |
| Per Capita Income | 3,289,701 | $46,957 |
| Median Family Income | 767,463 | $111,734 |
| Mean Family Income | 767,463 | $145,676 |
| Median Household Income | 1,149,157 | $96,974 |
| Mean Household Income | 1,149,157 | $129,234 |
| Income Deficit | 767,463 | $11,123 |
| Wage / Income Gap (%) | 3,289,701 | 26.06% |
| Wage / Income Gap ($) | 3,289,701 | 73.94¢ per $1 |
| Gini / Inequality Index | 3,289,701 | 0.46 |
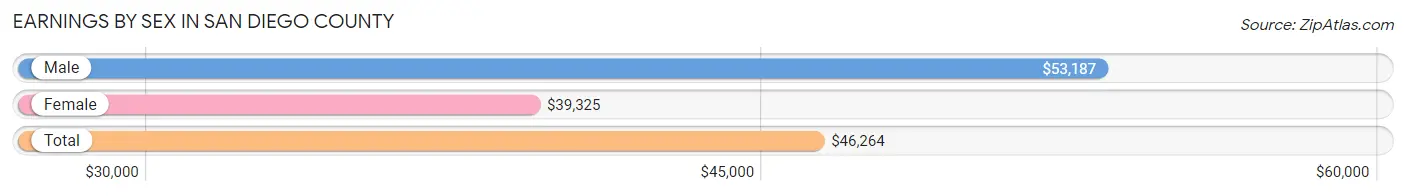
Earnings by Sex in San Diego County
Average Earnings in San Diego County are $46,264, $53,187 for men and $39,325 for women, a difference of 26.1%.
| Sex | Number | Average Earnings |
| Male | 994,454 (55.2%) | $53,187 |
| Female | 808,515 (44.8%) | $39,325 |
| Total | 1,802,969 (100.0%) | $46,264 |
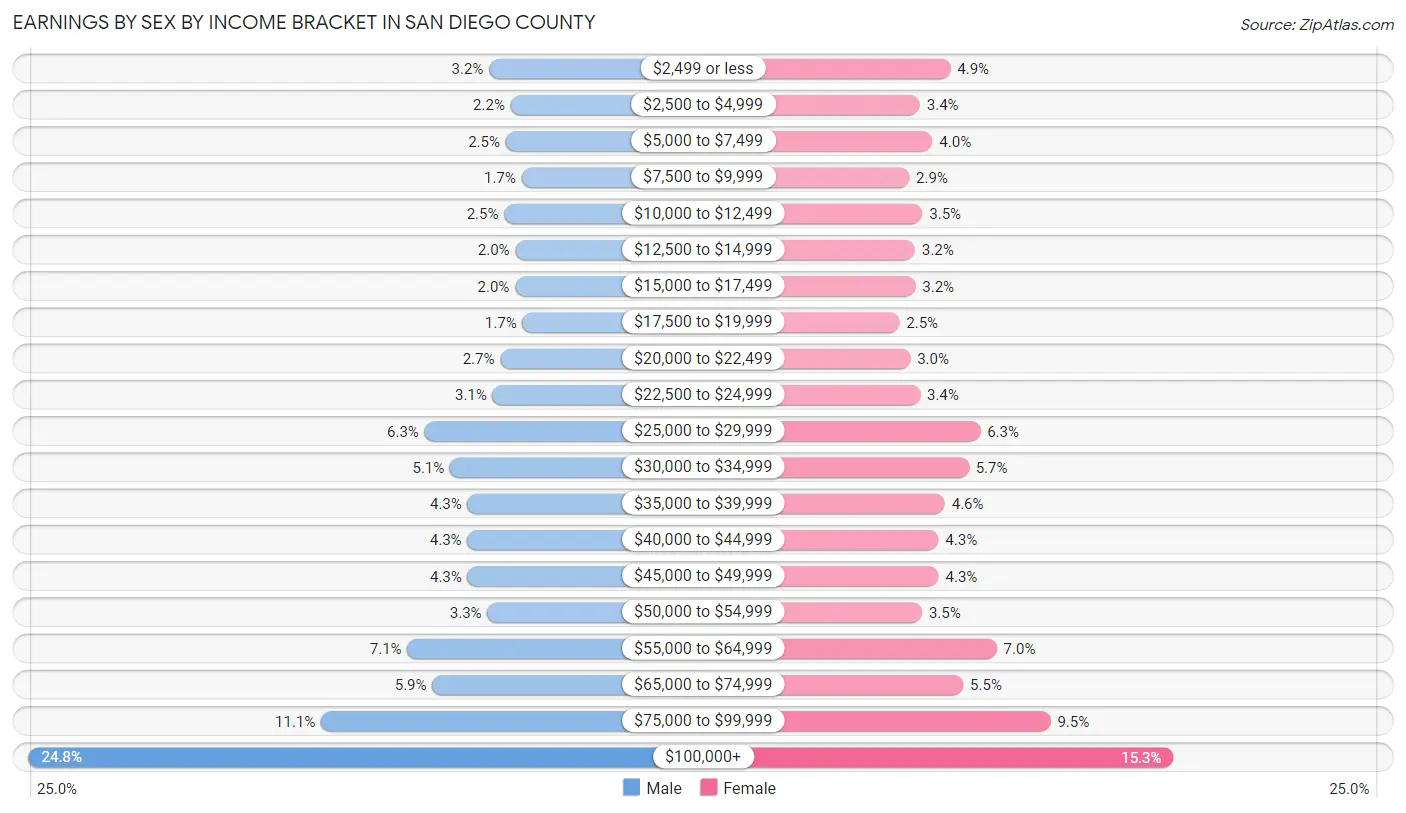
Earnings by Sex by Income Bracket in San Diego County
The most common earnings brackets in San Diego County are $100,000+ for men (246,715 | 24.8%) and $100,000+ for women (123,640 | 15.3%).
| Income | Male | Female |
| $2,499 or less | 32,228 (3.2%) | 39,235 (4.9%) |
| $2,500 to $4,999 | 22,157 (2.2%) | 27,667 (3.4%) |
| $5,000 to $7,499 | 24,464 (2.5%) | 32,412 (4.0%) |
| $7,500 to $9,999 | 17,153 (1.7%) | 23,624 (2.9%) |
| $10,000 to $12,499 | 25,132 (2.5%) | 28,661 (3.5%) |
| $12,500 to $14,999 | 19,988 (2.0%) | 25,780 (3.2%) |
| $15,000 to $17,499 | 20,127 (2.0%) | 25,950 (3.2%) |
| $17,500 to $19,999 | 16,722 (1.7%) | 19,920 (2.5%) |
| $20,000 to $22,499 | 27,007 (2.7%) | 24,029 (3.0%) |
| $22,500 to $24,999 | 30,599 (3.1%) | 27,768 (3.4%) |
| $25,000 to $29,999 | 62,240 (6.3%) | 50,565 (6.2%) |
| $30,000 to $34,999 | 50,371 (5.1%) | 46,196 (5.7%) |
| $35,000 to $39,999 | 42,303 (4.3%) | 37,143 (4.6%) |
| $40,000 to $44,999 | 42,395 (4.3%) | 34,719 (4.3%) |
| $45,000 to $49,999 | 42,251 (4.3%) | 34,767 (4.3%) |
| $50,000 to $54,999 | 33,064 (3.3%) | 28,481 (3.5%) |
| $55,000 to $64,999 | 70,307 (7.1%) | 56,768 (7.0%) |
| $65,000 to $74,999 | 58,710 (5.9%) | 44,083 (5.4%) |
| $75,000 to $99,999 | 110,521 (11.1%) | 77,107 (9.5%) |
| $100,000+ | 246,715 (24.8%) | 123,640 (15.3%) |
| Total | 994,454 (100.0%) | 808,515 (100.0%) |
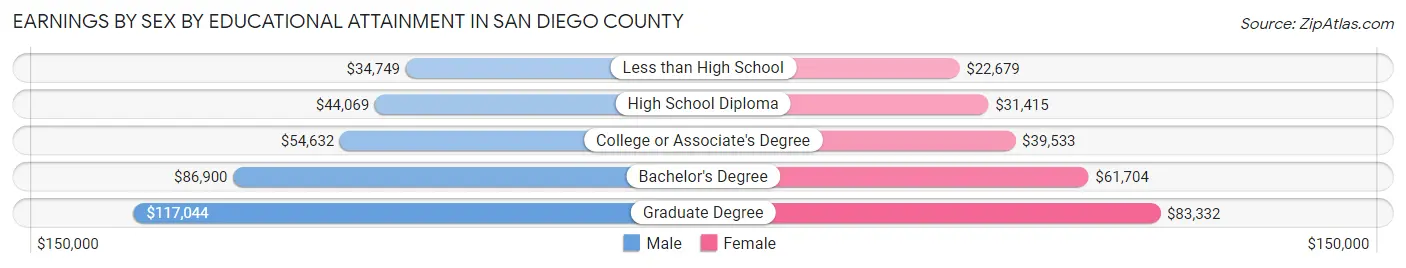
Earnings by Sex by Educational Attainment in San Diego County
Average earnings in San Diego County are $62,168 for men and $46,098 for women, a difference of 25.9%. Men with an educational attainment of graduate degree enjoy the highest average annual earnings of $117,044, while those with less than high school education earn the least with $34,749. Women with an educational attainment of graduate degree earn the most with the average annual earnings of $83,332, while those with less than high school education have the smallest earnings of $22,679.
| Educational Attainment | Male Income | Female Income |
| Less than High School | $34,749 | $22,679 |
| High School Diploma | $44,069 | $31,415 |
| College or Associate's Degree | $54,632 | $39,533 |
| Bachelor's Degree | $86,900 | $61,704 |
| Graduate Degree | $117,044 | $83,332 |
| Total | $62,168 | $46,098 |
Family Income in San Diego County
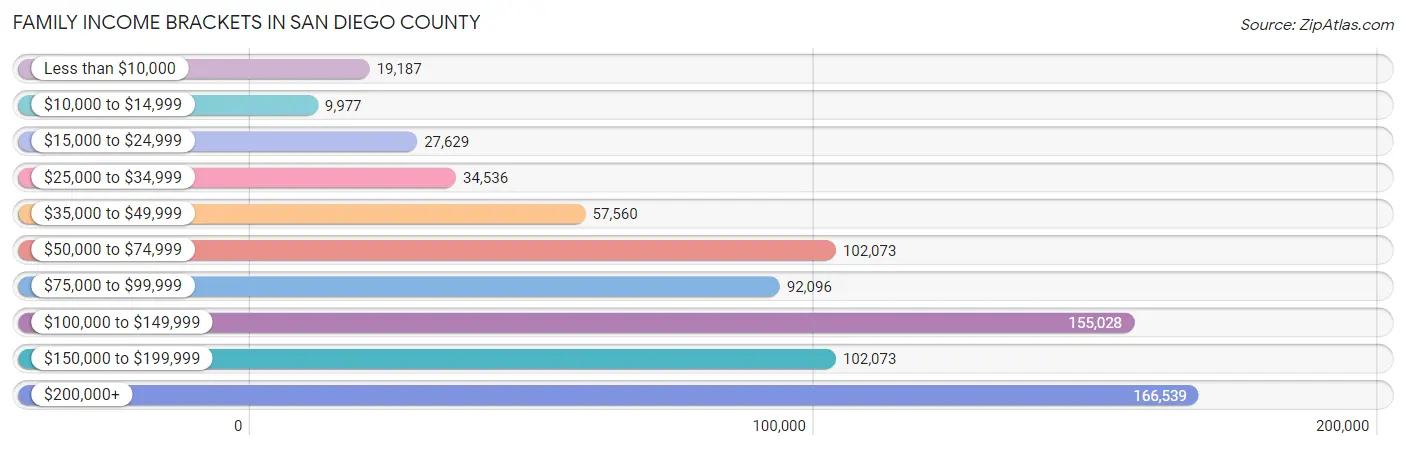
Family Income Brackets in San Diego County
According to the San Diego County family income data, there are 166,539 families falling into the $200,000+ income range, which is the most common income bracket and makes up 21.7% of all families. Conversely, the $10,000 to $14,999 income bracket is the least frequent group with only 9,977 families (1.3%) belonging to this category.
| Income Bracket | # Families | % Families |
| Less than $10,000 | 19,187 | 2.5% |
| $10,000 to $14,999 | 9,977 | 1.3% |
| $15,000 to $24,999 | 27,629 | 3.6% |
| $25,000 to $34,999 | 34,536 | 4.5% |
| $35,000 to $49,999 | 57,560 | 7.5% |
| $50,000 to $74,999 | 102,073 | 13.3% |
| $75,000 to $99,999 | 92,096 | 12.0% |
| $100,000 to $149,999 | 155,028 | 20.2% |
| $150,000 to $199,999 | 102,073 | 13.3% |
| $200,000+ | 166,539 | 21.7% |
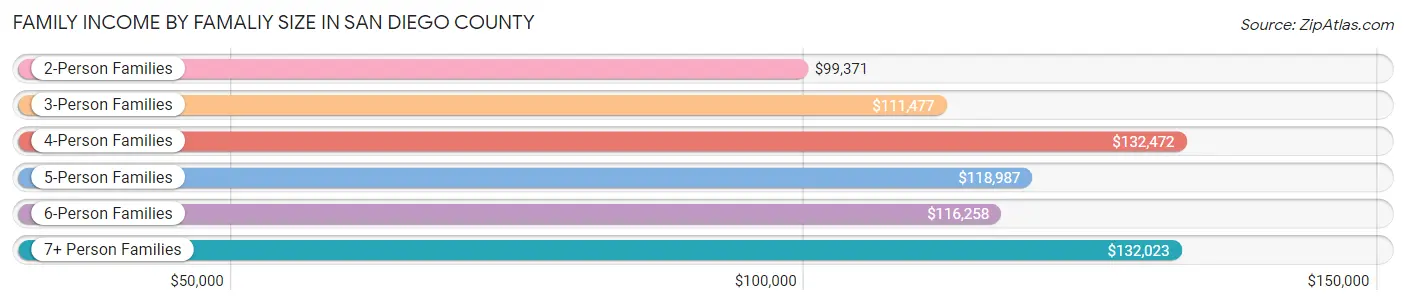
Family Income by Famaliy Size in San Diego County
4-person families (155,568 | 20.3%) account for the highest median family income in San Diego County with $132,472 per family, while 2-person families (323,165 | 42.1%) have the highest median income of $49,686 per family member.
| Income Bracket | # Families | Median Income |
| 2-Person Families | 323,165 (42.1%) | $99,371 |
| 3-Person Families | 174,487 (22.7%) | $111,477 |
| 4-Person Families | 155,568 (20.3%) | $132,472 |
| 5-Person Families | 70,587 (9.2%) | $118,987 |
| 6-Person Families | 26,147 (3.4%) | $116,258 |
| 7+ Person Families | 17,509 (2.3%) | $132,023 |
| Total | 767,463 (100.0%) | $111,734 |
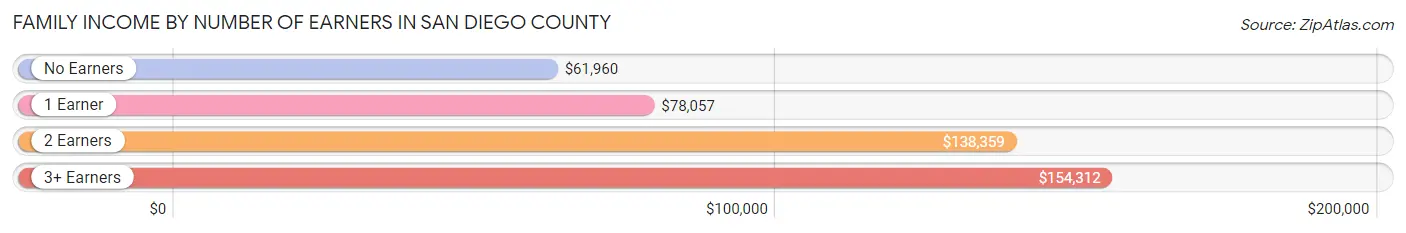
Family Income by Number of Earners in San Diego County
The median family income in San Diego County is $111,734, with families comprising 3+ earners (101,218) having the highest median family income of $154,312, while families with no earners (95,338) have the lowest median family income of $61,960, accounting for 13.2% and 12.4% of families, respectively.
| Number of Earners | # Families | Median Income |
| No Earners | 95,338 (12.4%) | $61,960 |
| 1 Earner | 241,112 (31.4%) | $78,057 |
| 2 Earners | 329,795 (43.0%) | $138,359 |
| 3+ Earners | 101,218 (13.2%) | $154,312 |
| Total | 767,463 (100.0%) | $111,734 |
Household Income in San Diego County
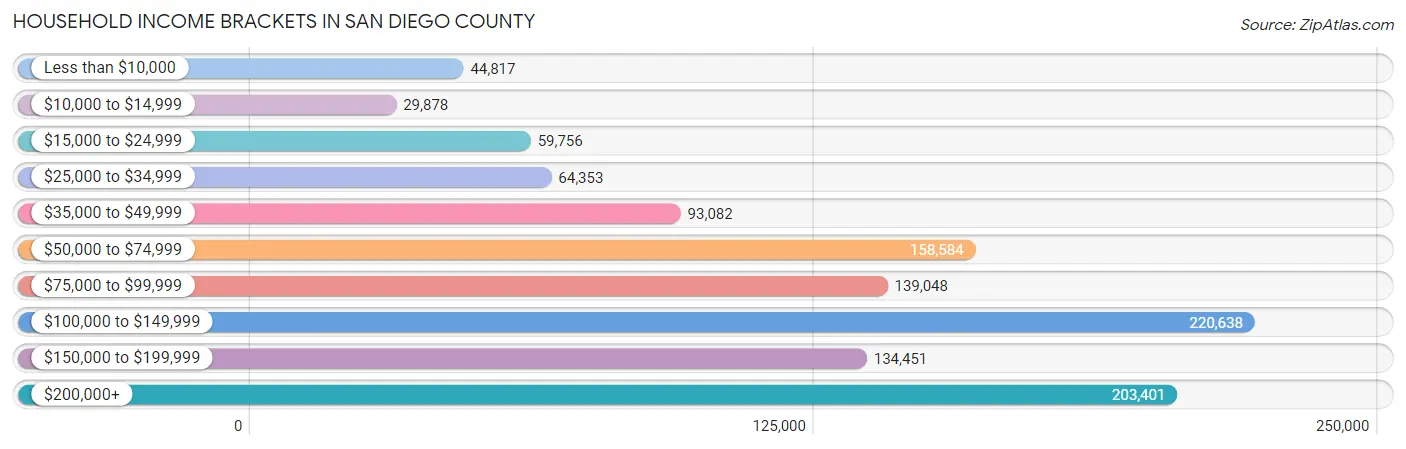
Household Income Brackets in San Diego County
With 220,638 households falling in the category, the $100,000 to $149,999 income range is the most frequent in San Diego County, accounting for 19.2% of all households. In contrast, only 29,878 households (2.6%) fall into the $10,000 to $14,999 income bracket, making it the least populous group.
| Income Bracket | # Households | % Households |
| Less than $10,000 | 44,817 | 3.9% |
| $10,000 to $14,999 | 29,878 | 2.6% |
| $15,000 to $24,999 | 59,756 | 5.2% |
| $25,000 to $34,999 | 64,353 | 5.6% |
| $35,000 to $49,999 | 93,082 | 8.1% |
| $50,000 to $74,999 | 158,584 | 13.8% |
| $75,000 to $99,999 | 139,048 | 12.1% |
| $100,000 to $149,999 | 220,638 | 19.2% |
| $150,000 to $199,999 | 134,451 | 11.7% |
| $200,000+ | 203,401 | 17.7% |
Household Income by Householder Age in San Diego County
The median household income in San Diego County is $96,974, with the highest median household income of $113,519 found in the 45 to 64 years age bracket for the primary householder. A total of 412,571 households (35.9%) fall into this category. Meanwhile, the 15 to 24 years age bracket for the primary householder has the lowest median household income of $53,279, with 40,429 households (3.5%) in this group.
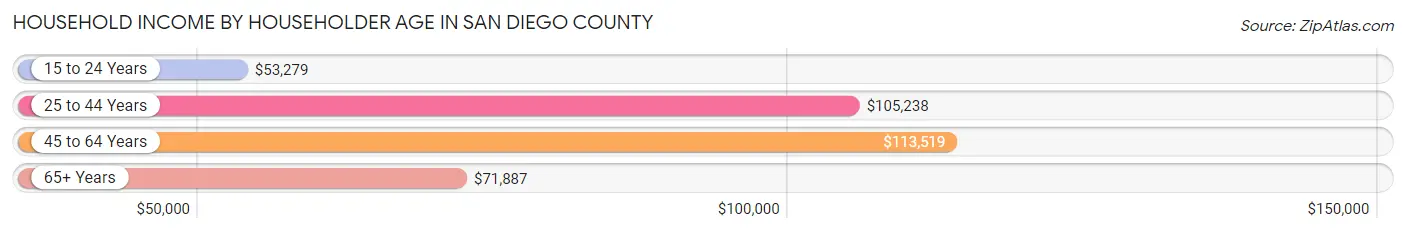
| Income Bracket | # Households | Median Income |
| 15 to 24 Years | 40,429 (3.5%) | $53,279 |
| 25 to 44 Years | 421,078 (36.6%) | $105,238 |
| 45 to 64 Years | 412,571 (35.9%) | $113,519 |
| 65+ Years | 275,079 (23.9%) | $71,887 |
| Total | 1,149,157 (100.0%) | $96,974 |
Poverty in San Diego County
Income Below Poverty by Sex and Age in San Diego County
With 9.5% poverty level for males and 11.7% for females among the residents of San Diego County, 18 to 24 year old males and 18 to 24 year old females are the most vulnerable to poverty, with 24,046 males (16.1%) and 27,359 females (19.7%) in their respective age groups living below the poverty level.
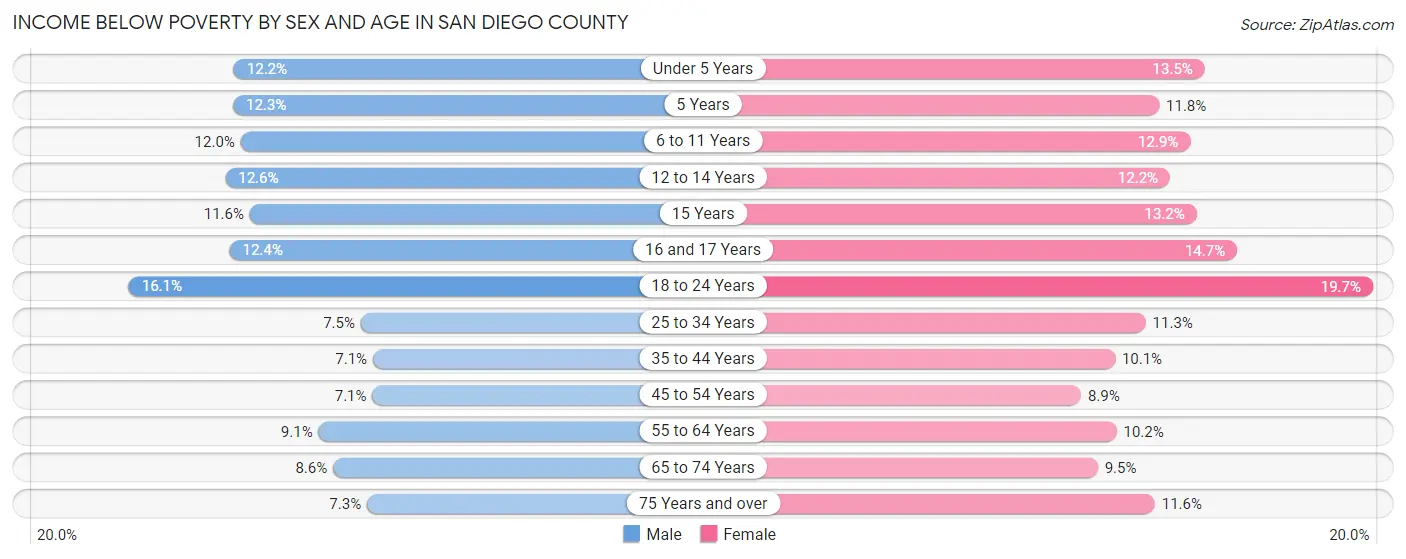
| Age Bracket | Male | Female |
| Under 5 Years | 11,777 (12.2%) | 12,354 (13.5%) |
| 5 Years | 2,354 (12.3%) | 2,069 (11.8%) |
| 6 to 11 Years | 13,721 (12.0%) | 14,218 (12.9%) |
| 12 to 14 Years | 7,969 (12.6%) | 7,254 (12.2%) |
| 15 Years | 2,326 (11.6%) | 2,509 (13.2%) |
| 16 and 17 Years | 4,800 (12.4%) | 5,467 (14.7%) |
| 18 to 24 Years | 24,046 (16.1%) | 27,359 (19.7%) |
| 25 to 34 Years | 20,296 (7.5%) | 28,185 (11.3%) |
| 35 to 44 Years | 16,488 (7.1%) | 22,204 (10.1%) |
| 45 to 54 Years | 14,240 (7.1%) | 17,548 (8.9%) |
| 55 to 64 Years | 17,323 (9.1%) | 19,840 (10.2%) |
| 65 to 74 Years | 11,266 (8.6%) | 14,004 (9.5%) |
| 75 Years and over | 5,924 (7.3%) | 13,211 (11.6%) |
| Total | 152,530 (9.5%) | 186,222 (11.7%) |
Income Above Poverty by Sex and Age in San Diego County
According to the poverty statistics in San Diego County, males aged 35 to 44 years and females aged 45 to 54 years are the age groups that are most secure financially, with 92.9% of males and 91.1% of females in these age groups living above the poverty line.
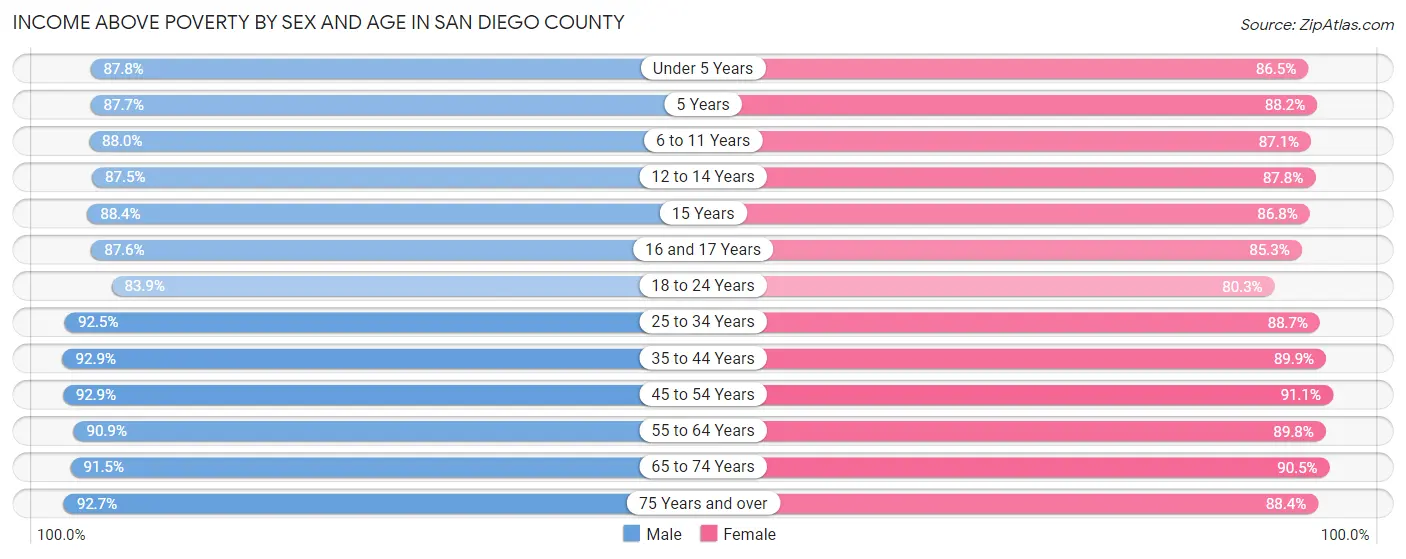
| Age Bracket | Male | Female |
| Under 5 Years | 84,494 (87.8%) | 79,340 (86.5%) |
| 5 Years | 16,852 (87.7%) | 15,496 (88.2%) |
| 6 to 11 Years | 100,833 (88.0%) | 95,753 (87.1%) |
| 12 to 14 Years | 55,518 (87.5%) | 52,302 (87.8%) |
| 15 Years | 17,652 (88.4%) | 16,548 (86.8%) |
| 16 and 17 Years | 33,945 (87.6%) | 31,807 (85.3%) |
| 18 to 24 Years | 124,988 (83.9%) | 111,425 (80.3%) |
| 25 to 34 Years | 249,535 (92.5%) | 221,765 (88.7%) |
| 35 to 44 Years | 216,605 (92.9%) | 196,823 (89.9%) |
| 45 to 54 Years | 186,507 (92.9%) | 179,960 (91.1%) |
| 55 to 64 Years | 173,200 (90.9%) | 174,624 (89.8%) |
| 65 to 74 Years | 120,512 (91.4%) | 133,421 (90.5%) |
| 75 Years and over | 75,293 (92.7%) | 100,525 (88.4%) |
| Total | 1,455,934 (90.5%) | 1,409,789 (88.3%) |
Income Below Poverty Among Married-Couple Families in San Diego County
The poverty statistics for married-couple families in San Diego County show that 4.2% or 24,124 of the total 575,880 families live below the poverty line. Families with 5 or more children have the highest poverty rate of 27.5%, comprising of 769 families. On the other hand, families with no children have the lowest poverty rate of 3.0%, which includes 9,702 families.
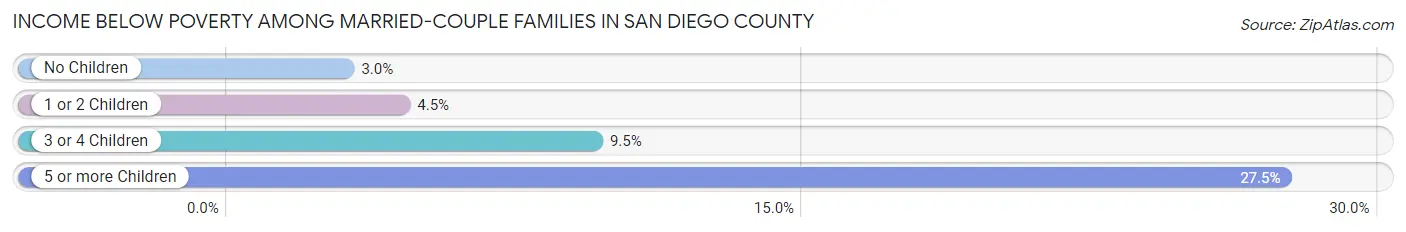
| Children | Above Poverty | Below Poverty |
| No Children | 309,192 (97.0%) | 9,702 (3.0%) |
| 1 or 2 Children | 200,557 (95.5%) | 9,442 (4.5%) |
| 3 or 4 Children | 39,983 (90.5%) | 4,211 (9.5%) |
| 5 or more Children | 2,024 (72.5%) | 769 (27.5%) |
| Total | 551,756 (95.8%) | 24,124 (4.2%) |
Income Below Poverty Among Single-Parent Households in San Diego County
According to the poverty data in San Diego County, 9.4% or 5,624 single-father households and 18.4% or 24,171 single-mother households are living below the poverty line. Among single-father households, those with 3 or 4 children have the highest poverty rate, with 721 households (22.5%) experiencing poverty. Likewise, among single-mother households, those with 5 or more children have the highest poverty rate, with 670 households (69.1%) falling below the poverty line.
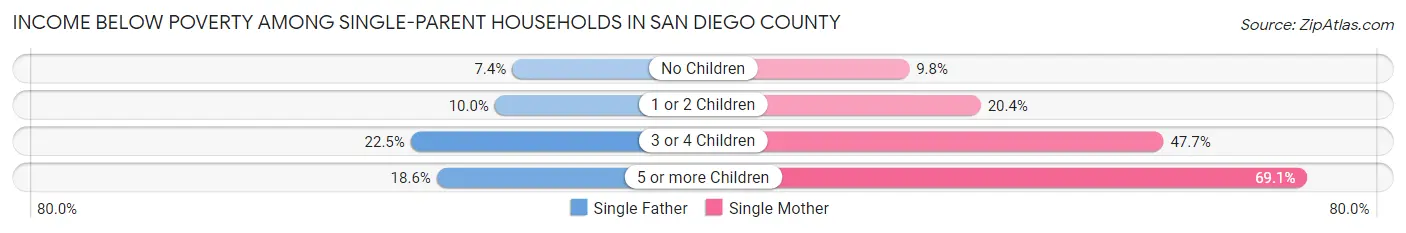
| Children | Single Father | Single Mother |
| No Children | 2,226 (7.4%) | 5,759 (9.8%) |
| 1 or 2 Children | 2,629 (10.0%) | 12,274 (20.4%) |
| 3 or 4 Children | 721 (22.5%) | 5,468 (47.7%) |
| 5 or more Children | 48 (18.6%) | 670 (69.1%) |
| Total | 5,624 (9.4%) | 24,171 (18.4%) |
Income Below Poverty Among Married-Couple vs Single-Parent Households in San Diego County
The poverty data for San Diego County shows that 24,124 of the married-couple family households (4.2%) and 29,795 of the single-parent households (15.5%) are living below the poverty level. Within the married-couple family households, those with 5 or more children have the highest poverty rate, with 769 households (27.5%) falling below the poverty line. Among the single-parent households, those with 5 or more children have the highest poverty rate, with 718 household (58.5%) living below poverty.
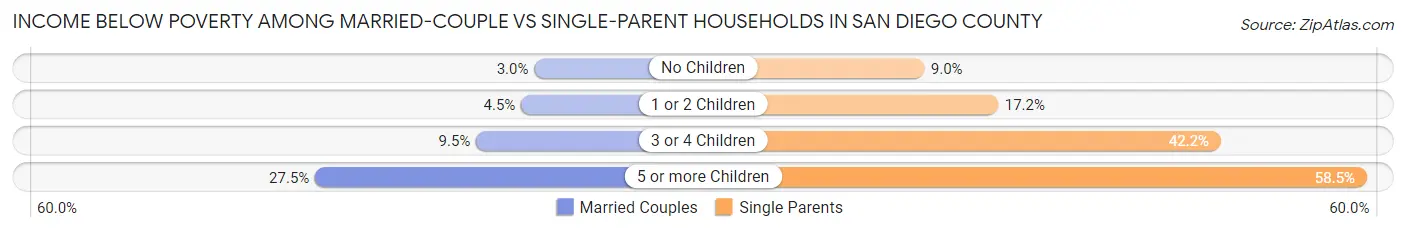
| Children | Married-Couple Families | Single-Parent Households |
| No Children | 9,702 (3.0%) | 7,985 (9.0%) |
| 1 or 2 Children | 9,442 (4.5%) | 14,903 (17.2%) |
| 3 or 4 Children | 4,211 (9.5%) | 6,189 (42.2%) |
| 5 or more Children | 769 (27.5%) | 718 (58.5%) |
| Total | 24,124 (4.2%) | 29,795 (15.5%) |
Race in San Diego County
The most populous races in San Diego County are White / Caucasian (1,899,871 | 57.8%), Hispanic or Latino (1,134,647 | 34.5%), and Two or more Races (490,015 | 14.9%).
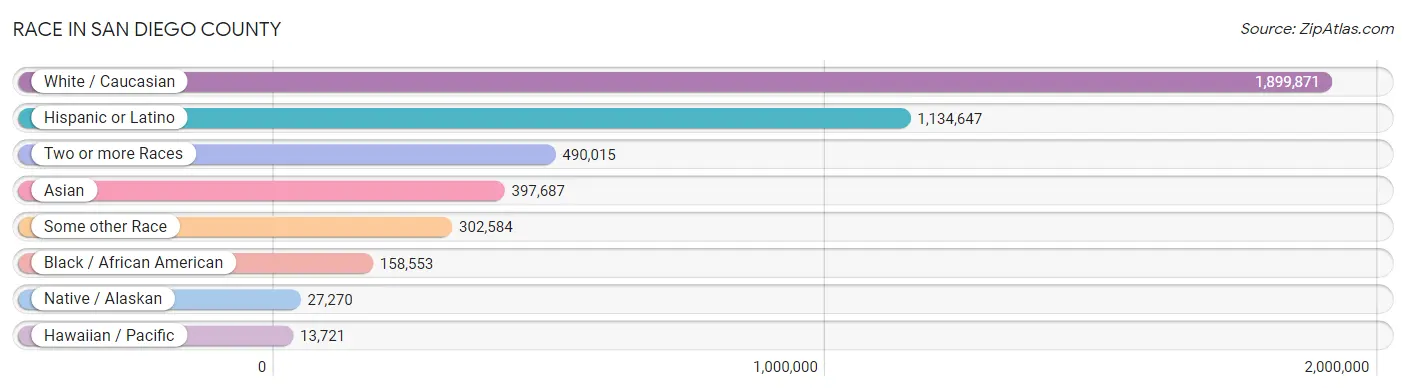
| Race | # Population | % Population |
| Asian | 397,687 | 12.1% |
| Black / African American | 158,553 | 4.8% |
| Hawaiian / Pacific | 13,721 | 0.4% |
| Hispanic or Latino | 1,134,647 | 34.5% |
| Native / Alaskan | 27,270 | 0.8% |
| White / Caucasian | 1,899,871 | 57.8% |
| Two or more Races | 490,015 | 14.9% |
| Some other Race | 302,584 | 9.2% |
| Total | 3,289,701 | 100.0% |
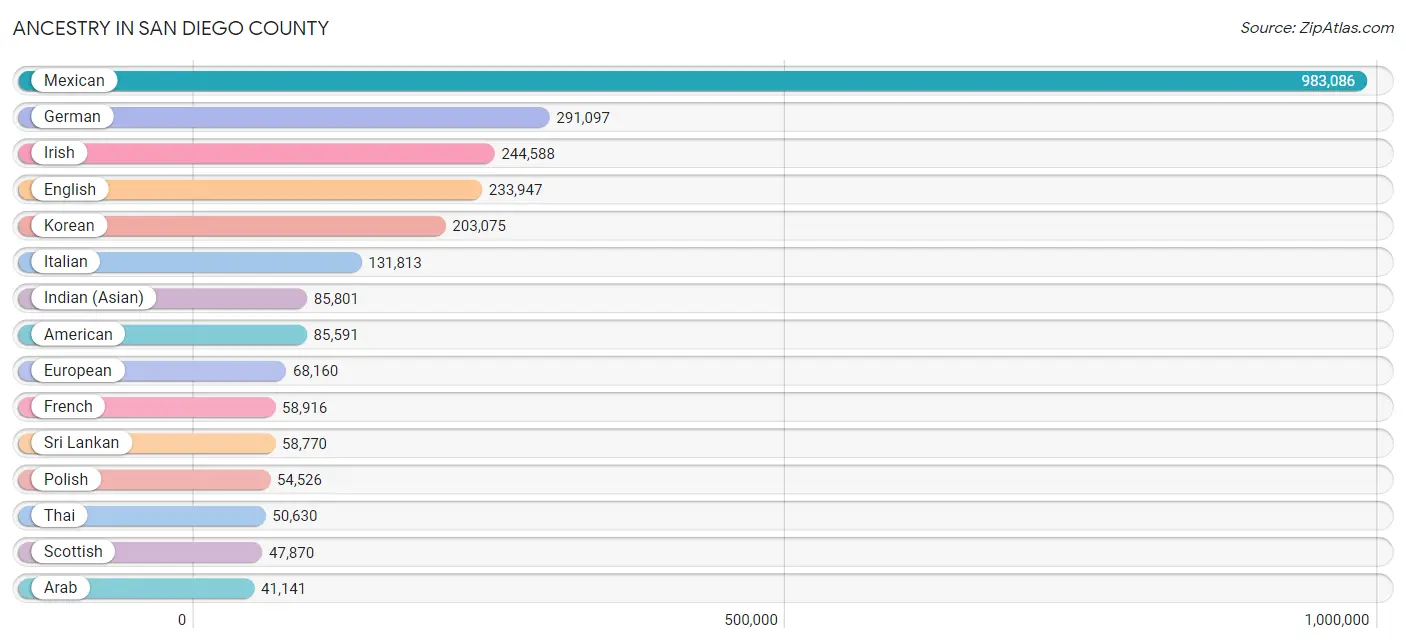
Ancestry in San Diego County
The most populous ancestries reported in San Diego County are Mexican (983,086 | 29.9%), German (291,097 | 8.8%), Irish (244,588 | 7.4%), English (233,947 | 7.1%), and Korean (203,075 | 6.2%), together accounting for 59.4% of all San Diego County residents.
| Ancestry | # Population | % Population |
| Afghan | 4,065 | 0.1% |
| African | 13,078 | 0.4% |
| Alaska Native | 54 | 0.0% |
| Alaskan Athabascan | 73 | 0.0% |
| Albanian | 928 | 0.0% |
| Aleut | 65 | 0.0% |
| Alsatian | 82 | 0.0% |
| American | 85,591 | 2.6% |
| Apache | 1,787 | 0.1% |
| Arab | 41,141 | 1.3% |
| Arapaho | 48 | 0.0% |
| Argentinean | 3,251 | 0.1% |
| Armenian | 5,079 | 0.2% |
| Assyrian / Chaldean / Syriac | 9,223 | 0.3% |
| Australian | 1,176 | 0.0% |
| Austrian | 5,519 | 0.2% |
| Bahamian | 76 | 0.0% |
| Bangladeshi | 1,608 | 0.1% |
| Barbadian | 230 | 0.0% |
| Basque | 1,811 | 0.1% |
| Belgian | 2,574 | 0.1% |
| Belizean | 371 | 0.0% |
| Bermudan | 38 | 0.0% |
| Bhutanese | 39,685 | 1.2% |
| Blackfeet | 1,802 | 0.1% |
| Bolivian | 839 | 0.0% |
| Brazilian | 5,547 | 0.2% |
| British | 21,007 | 0.6% |
| British West Indian | 286 | 0.0% |
| Bulgarian | 2,233 | 0.1% |
| Burmese | 31,267 | 0.9% |
| Cajun | 164 | 0.0% |
| Cambodian | 226 | 0.0% |
| Canadian | 7,066 | 0.2% |
| Cape Verdean | 141 | 0.0% |
| Carpatho Rusyn | 12 | 0.0% |
| Celtic | 355 | 0.0% |
| Central American | 34,329 | 1.0% |
| Central American Indian | 4,338 | 0.1% |
| Cherokee | 7,560 | 0.2% |
| Cheyenne | 39 | 0.0% |
| Chickasaw | 462 | 0.0% |
| Chilean | 3,914 | 0.1% |
| Chinese | 398 | 0.0% |
| Chippewa | 586 | 0.0% |
| Choctaw | 2,861 | 0.1% |
| Colombian | 8,981 | 0.3% |
| Colville | 63 | 0.0% |
| Comanche | 293 | 0.0% |
| Costa Rican | 1,646 | 0.1% |
| Cree | 101 | 0.0% |
| Creek | 317 | 0.0% |
| Croatian | 3,610 | 0.1% |
| Crow | 62 | 0.0% |
| Cuban | 8,024 | 0.2% |
| Cypriot | 326 | 0.0% |
| Czech | 7,762 | 0.2% |
| Czechoslovakian | 2,193 | 0.1% |
| Danish | 14,611 | 0.4% |
| Delaware | 337 | 0.0% |
| Dominican | 3,797 | 0.1% |
| Dutch | 26,938 | 0.8% |
| Dutch West Indian | 86 | 0.0% |
| Eastern European | 11,677 | 0.4% |
| Ecuadorian | 3,097 | 0.1% |
| Egyptian | 3,229 | 0.1% |
| English | 233,947 | 7.1% |
| Estonian | 479 | 0.0% |
| Ethiopian | 4,608 | 0.1% |
| European | 68,160 | 2.1% |
| Fijian | 364 | 0.0% |
| Filipino | 6,513 | 0.2% |
| Finnish | 5,060 | 0.2% |
| French | 58,916 | 1.8% |
| French American Indian | 263 | 0.0% |
| French Canadian | 10,572 | 0.3% |
| German | 291,097 | 8.8% |
| German Russian | 77 | 0.0% |
| Ghanaian | 581 | 0.0% |
| Greek | 13,269 | 0.4% |
| Guamanian / Chamorro | 8,870 | 0.3% |
| Guatemalan | 13,617 | 0.4% |
| Guyanese | 483 | 0.0% |
| Haitian | 1,828 | 0.1% |
| Hmong | 52 | 0.0% |
| Honduran | 2,619 | 0.1% |
| Hopi | 59 | 0.0% |
| Houma | 4 | 0.0% |
| Hungarian | 11,499 | 0.4% |
| Icelander | 555 | 0.0% |
| Indian (Asian) | 85,801 | 2.6% |
| Indonesian | 1,646 | 0.1% |
| Inupiat | 221 | 0.0% |
| Iranian | 16,117 | 0.5% |
| Iraqi | 13,612 | 0.4% |
| Irish | 244,588 | 7.4% |
| Iroquois | 441 | 0.0% |
| Israeli | 2,410 | 0.1% |
| Italian | 131,813 | 4.0% |
| Jamaican | 4,133 | 0.1% |
| Japanese | 8,199 | 0.3% |
| Jordanian | 618 | 0.0% |
| Kenyan | 545 | 0.0% |
| Kiowa | 24 | 0.0% |
| Korean | 203,075 | 6.2% |
| Laotian | 3,368 | 0.1% |
| Latvian | 727 | 0.0% |
| Lebanese | 6,744 | 0.2% |
| Liberian | 82 | 0.0% |
| Lithuanian | 5,720 | 0.2% |
| Lumbee | 75 | 0.0% |
| Luxembourger | 490 | 0.0% |
| Macedonian | 359 | 0.0% |
| Malaysian | 9,987 | 0.3% |
| Maltese | 339 | 0.0% |
| Marshallese | 76 | 0.0% |
| Menominee | 70 | 0.0% |
| Mexican | 983,086 | 29.9% |
| Mexican American Indian | 12,141 | 0.4% |
| Mongolian | 594 | 0.0% |
| Moroccan | 837 | 0.0% |
| Native Hawaiian | 9,837 | 0.3% |
| Navajo | 1,674 | 0.1% |
| Nepalese | 139 | 0.0% |
| New Zealander | 325 | 0.0% |
| Nicaraguan | 2,844 | 0.1% |
| Nigerian | 2,725 | 0.1% |
| Northern European | 7,823 | 0.2% |
| Norwegian | 36,662 | 1.1% |
| Okinawan | 282 | 0.0% |
| Osage | 232 | 0.0% |
| Ottawa | 90 | 0.0% |
| Paiute | 80 | 0.0% |
| Pakistani | 5,287 | 0.2% |
| Palestinian | 2,379 | 0.1% |
| Panamanian | 3,300 | 0.1% |
| Paraguayan | 88 | 0.0% |
| Pennsylvania German | 420 | 0.0% |
| Peruvian | 7,168 | 0.2% |
| Pima | 200 | 0.0% |
| Polish | 54,526 | 1.7% |
| Portuguese | 17,729 | 0.5% |
| Potawatomi | 237 | 0.0% |
| Pueblo | 540 | 0.0% |
| Puerto Rican | 27,674 | 0.8% |
| Puget Sound Salish | 17 | 0.0% |
| Romanian | 4,287 | 0.1% |
| Russian | 28,728 | 0.9% |
| Salvadoran | 9,634 | 0.3% |
| Samoan | 6,530 | 0.2% |
| Scandinavian | 11,693 | 0.4% |
| Scotch-Irish | 19,165 | 0.6% |
| Scottish | 47,870 | 1.5% |
| Seminole | 353 | 0.0% |
| Senegalese | 89 | 0.0% |
| Serbian | 3,044 | 0.1% |
| Shoshone | 153 | 0.0% |
| Sierra Leonean | 42 | 0.0% |
| Sioux | 1,357 | 0.0% |
| Slavic | 926 | 0.0% |
| Slovak | 3,167 | 0.1% |
| Slovene | 968 | 0.0% |
| Somali | 3,910 | 0.1% |
| South African | 1,830 | 0.1% |
| South American | 30,451 | 0.9% |
| South American Indian | 486 | 0.0% |
| Soviet Union | 96 | 0.0% |
| Spaniard | 15,160 | 0.5% |
| Spanish | 12,875 | 0.4% |
| Spanish American | 277 | 0.0% |
| Spanish American Indian | 115 | 0.0% |
| Sri Lankan | 58,770 | 1.8% |
| Subsaharan African | 31,138 | 0.9% |
| Sudanese | 1,190 | 0.0% |
| Swedish | 39,140 | 1.2% |
| Swiss | 8,369 | 0.3% |
| Syrian | 3,487 | 0.1% |
| Thai | 50,630 | 1.5% |
| Tlingit-Haida | 431 | 0.0% |
| Tohono O'Odham | 134 | 0.0% |
| Tongan | 694 | 0.0% |
| Trinidadian and Tobagonian | 704 | 0.0% |
| Tsimshian | 34 | 0.0% |
| Turkish | 2,485 | 0.1% |
| U.S. Virgin Islander | 67 | 0.0% |
| Ugandan | 414 | 0.0% |
| Ukrainian | 9,642 | 0.3% |
| Uruguayan | 565 | 0.0% |
| Ute | 54 | 0.0% |
| Venezuelan | 2,282 | 0.1% |
| Vietnamese | 723 | 0.0% |
| Welsh | 15,135 | 0.5% |
| West Indian | 929 | 0.0% |
| Yaqui | 1,690 | 0.1% |
| Yugoslavian | 1,496 | 0.1% |
| Yuman | 182 | 0.0% |
| Zimbabwean | 132 | 0.0% | View All 197 Rows |
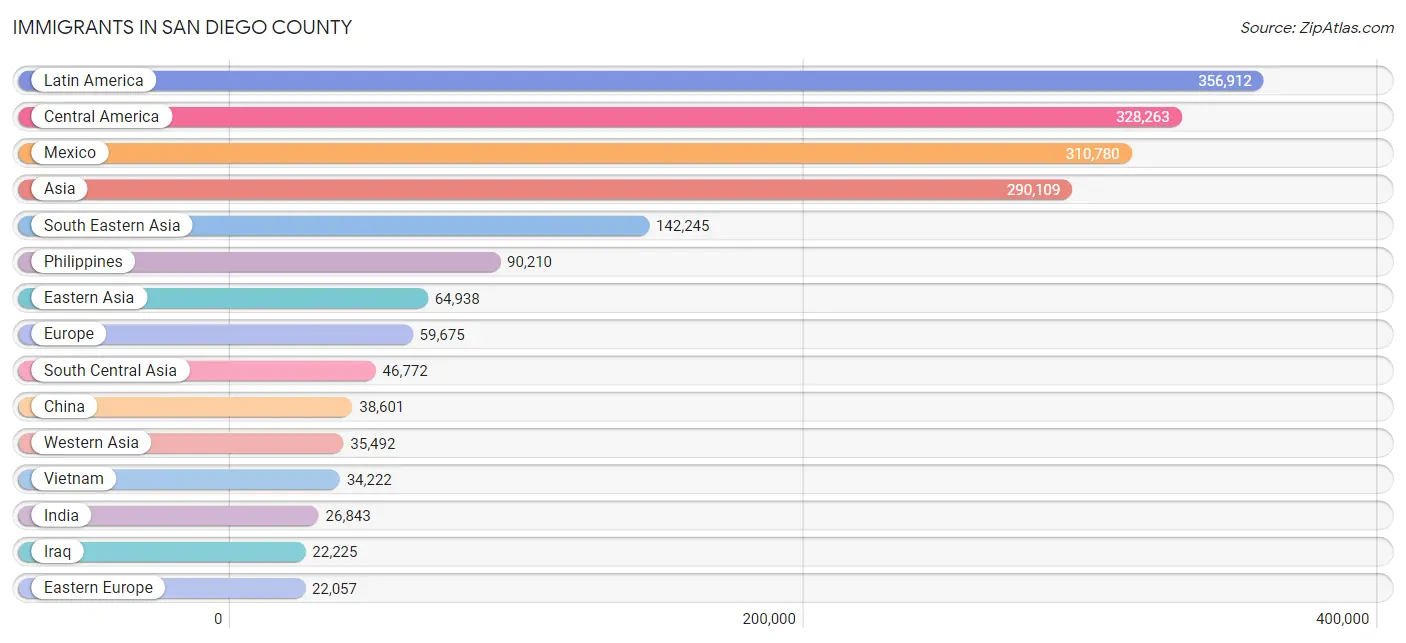
Immigrants in San Diego County
The most numerous immigrant groups reported in San Diego County came from Latin America (356,912 | 10.8%), Central America (328,263 | 10.0%), Mexico (310,780 | 9.5%), Asia (290,109 | 8.8%), and South Eastern Asia (142,245 | 4.3%), together accounting for 43.4% of all San Diego County residents.
| Immigration Origin | # Population | % Population |
| Afghanistan | 3,526 | 0.1% |
| Africa | 19,895 | 0.6% |
| Albania | 350 | 0.0% |
| Argentina | 1,805 | 0.1% |
| Armenia | 442 | 0.0% |
| Asia | 290,109 | 8.8% |
| Australia | 1,805 | 0.1% |
| Austria | 453 | 0.0% |
| Azores | 53 | 0.0% |
| Bahamas | 44 | 0.0% |
| Bangladesh | 620 | 0.0% |
| Barbados | 73 | 0.0% |
| Belarus | 892 | 0.0% |
| Belgium | 642 | 0.0% |
| Belize | 306 | 0.0% |
| Bolivia | 446 | 0.0% |
| Bosnia and Herzegovina | 454 | 0.0% |
| Brazil | 5,915 | 0.2% |
| Bulgaria | 1,376 | 0.0% |
| Cambodia | 2,792 | 0.1% |
| Cameroon | 277 | 0.0% |
| Canada | 11,911 | 0.4% |
| Caribbean | 7,294 | 0.2% |
| Central America | 328,263 | 10.0% |
| Chile | 1,299 | 0.0% |
| China | 38,601 | 1.2% |
| Colombia | 5,003 | 0.2% |
| Congo | 429 | 0.0% |
| Costa Rica | 667 | 0.0% |
| Croatia | 201 | 0.0% |
| Cuba | 1,844 | 0.1% |
| Czechoslovakia | 878 | 0.0% |
| Denmark | 864 | 0.0% |
| Dominican Republic | 1,341 | 0.0% |
| Eastern Africa | 8,565 | 0.3% |
| Eastern Asia | 64,938 | 2.0% |
| Eastern Europe | 22,057 | 0.7% |
| Ecuador | 1,108 | 0.0% |
| Egypt | 1,613 | 0.1% |
| El Salvador | 4,609 | 0.1% |
| England | 4,912 | 0.2% |
| Eritrea | 778 | 0.0% |
| Ethiopia | 3,016 | 0.1% |
| Europe | 59,675 | 1.8% |
| Fiji | 222 | 0.0% |
| France | 3,594 | 0.1% |
| Germany | 7,065 | 0.2% |
| Ghana | 666 | 0.0% |
| Greece | 794 | 0.0% |
| Grenada | 46 | 0.0% |
| Guatemala | 8,032 | 0.2% |
| Guyana | 658 | 0.0% |
| Haiti | 1,006 | 0.0% |
| Honduras | 1,626 | 0.1% |
| Hong Kong | 3,378 | 0.1% |
| Hungary | 991 | 0.0% |
| India | 26,843 | 0.8% |
| Indonesia | 2,389 | 0.1% |
| Iran | 11,517 | 0.4% |
| Iraq | 22,225 | 0.7% |
| Ireland | 1,122 | 0.0% |
| Israel | 2,289 | 0.1% |
| Italy | 3,434 | 0.1% |
| Jamaica | 1,861 | 0.1% |
| Japan | 11,311 | 0.3% |
| Jordan | 854 | 0.0% |
| Kazakhstan | 791 | 0.0% |
| Kenya | 1,066 | 0.0% |
| Korea | 14,867 | 0.4% |
| Kuwait | 910 | 0.0% |
| Laos | 5,073 | 0.2% |
| Latin America | 356,912 | 10.8% |
| Latvia | 323 | 0.0% |
| Lebanon | 2,323 | 0.1% |
| Liberia | 199 | 0.0% |
| Lithuania | 597 | 0.0% |
| Malaysia | 1,067 | 0.0% |
| Mexico | 310,780 | 9.5% |
| Micronesia | 212 | 0.0% |
| Middle Africa | 1,097 | 0.0% |
| Moldova | 310 | 0.0% |
| Morocco | 484 | 0.0% |
| Nepal | 442 | 0.0% |
| Netherlands | 1,696 | 0.1% |
| Nicaragua | 1,133 | 0.0% |
| Nigeria | 1,397 | 0.0% |
| North Macedonia | 123 | 0.0% |
| Northern Africa | 3,904 | 0.1% |
| Northern Europe | 15,688 | 0.5% |
| Norway | 502 | 0.0% |
| Oceania | 4,298 | 0.1% |
| Pakistan | 1,689 | 0.1% |
| Panama | 1,085 | 0.0% |
| Peru | 3,296 | 0.1% |
| Philippines | 90,210 | 2.7% |
| Poland | 2,162 | 0.1% |
| Portugal | 1,220 | 0.0% |
| Romania | 1,539 | 0.1% |
| Russia | 6,226 | 0.2% |
| Saudi Arabia | 649 | 0.0% |
| Scotland | 905 | 0.0% |
| Senegal | 87 | 0.0% |
| Serbia | 930 | 0.0% |
| Sierra Leone | 118 | 0.0% |
| Singapore | 599 | 0.0% |
| Somalia | 1,972 | 0.1% |
| South Africa | 2,953 | 0.1% |
| South America | 21,355 | 0.6% |
| South Central Asia | 46,772 | 1.4% |
| South Eastern Asia | 142,245 | 4.3% |
| Southern Europe | 7,364 | 0.2% |
| Spain | 1,838 | 0.1% |
| Sri Lanka | 538 | 0.0% |
| St. Vincent and the Grenadines | 89 | 0.0% |
| Sudan | 1,207 | 0.0% |
| Sweden | 1,710 | 0.1% |
| Switzerland | 954 | 0.0% |
| Syria | 3,069 | 0.1% |
| Taiwan | 7,020 | 0.2% |
| Thailand | 4,877 | 0.2% |
| Trinidad and Tobago | 750 | 0.0% |
| Turkey | 1,360 | 0.0% |
| Uganda | 543 | 0.0% |
| Ukraine | 2,808 | 0.1% |
| Uruguay | 357 | 0.0% |
| Uzbekistan | 461 | 0.0% |
| Venezuela | 1,200 | 0.0% |
| Vietnam | 34,222 | 1.0% |
| West Indies | 39 | 0.0% |
| Western Africa | 2,775 | 0.1% |
| Western Asia | 35,492 | 1.1% |
| Western Europe | 14,458 | 0.4% |
| Yemen | 147 | 0.0% |
| Zaire | 276 | 0.0% |
| Zimbabwe | 196 | 0.0% | View All 135 Rows |
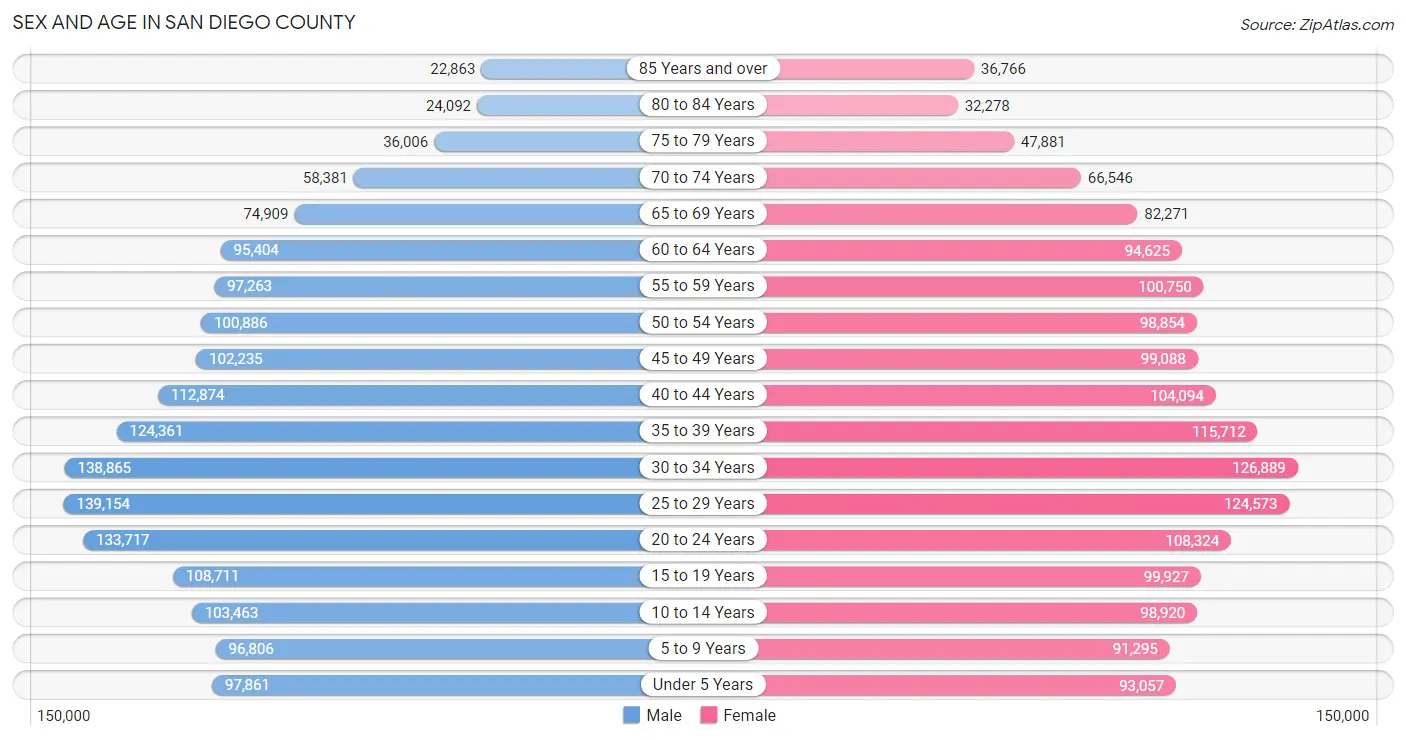
Sex and Age in San Diego County
Sex and Age in San Diego County
The most populous age groups in San Diego County are 25 to 29 Years (139,154 | 8.3%) for men and 30 to 34 Years (126,889 | 7.8%) for women.
| Age Bracket | Male | Female |
| Under 5 Years | 97,861 (5.9%) | 93,057 (5.7%) |
| 5 to 9 Years | 96,806 (5.8%) | 91,295 (5.6%) |
| 10 to 14 Years | 103,463 (6.2%) | 98,920 (6.1%) |
| 15 to 19 Years | 108,711 (6.5%) | 99,927 (6.2%) |
| 20 to 24 Years | 133,717 (8.0%) | 108,324 (6.7%) |
| 25 to 29 Years | 139,154 (8.3%) | 124,573 (7.7%) |
| 30 to 34 Years | 138,865 (8.3%) | 126,889 (7.8%) |
| 35 to 39 Years | 124,361 (7.5%) | 115,712 (7.1%) |
| 40 to 44 Years | 112,874 (6.8%) | 104,094 (6.4%) |
| 45 to 49 Years | 102,235 (6.1%) | 99,088 (6.1%) |
| 50 to 54 Years | 100,886 (6.0%) | 98,854 (6.1%) |
| 55 to 59 Years | 97,263 (5.8%) | 100,750 (6.2%) |
| 60 to 64 Years | 95,404 (5.7%) | 94,625 (5.8%) |
| 65 to 69 Years | 74,909 (4.5%) | 82,271 (5.1%) |
| 70 to 74 Years | 58,381 (3.5%) | 66,546 (4.1%) |
| 75 to 79 Years | 36,006 (2.2%) | 47,881 (2.9%) |
| 80 to 84 Years | 24,092 (1.4%) | 32,278 (2.0%) |
| 85 Years and over | 22,863 (1.4%) | 36,766 (2.3%) |
| Total | 1,667,851 (100.0%) | 1,621,850 (100.0%) |
Families and Households in San Diego County
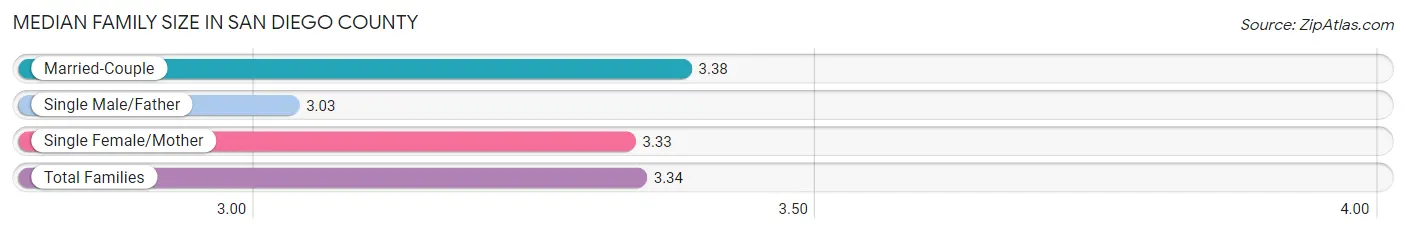
Median Family Size in San Diego County
The median family size in San Diego County is 3.34 persons per family, with married-couple families (575,880 | 75.0%) accounting for the largest median family size of 3.38 persons per family. On the other hand, single male/father families (60,106 | 7.8%) represent the smallest median family size with 3.03 persons per family.
| Family Type | # Families | Family Size |
| Married-Couple | 575,880 (75.0%) | 3.38 |
| Single Male/Father | 60,106 (7.8%) | 3.03 |
| Single Female/Mother | 131,477 (17.1%) | 3.33 |
| Total Families | 767,463 (100.0%) | 3.34 |
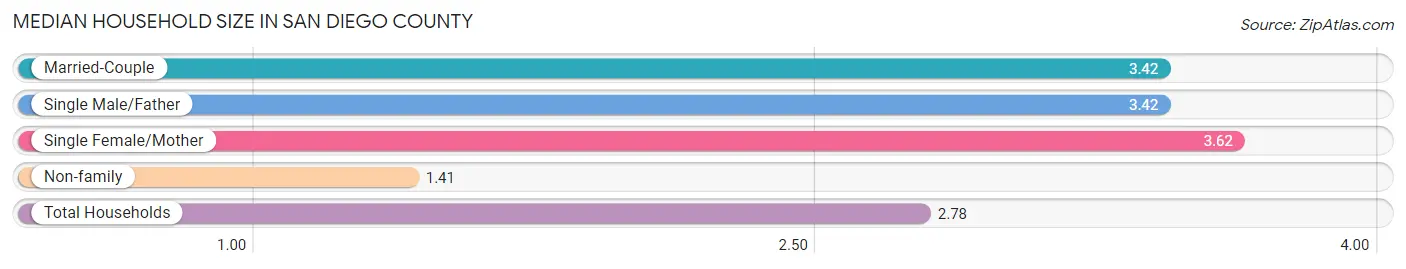
Median Household Size in San Diego County
The median household size in San Diego County is 2.78 persons per household, with single female/mother households (131,477 | 11.4%) accounting for the largest median household size of 3.62 persons per household. non-family households (381,694 | 33.2%) represent the smallest median household size with 1.41 persons per household.
| Household Type | # Households | Household Size |
| Married-Couple | 575,880 (50.1%) | 3.42 |
| Single Male/Father | 60,106 (5.2%) | 3.42 |
| Single Female/Mother | 131,477 (11.4%) | 3.62 |
| Non-family | 381,694 (33.2%) | 1.41 |
| Total Households | 1,149,157 (100.0%) | 2.78 |
Household Size by Marriage Status in San Diego County
Out of a total of 1,149,157 households in San Diego County, 767,463 (66.8%) are family households, while 381,694 (33.2%) are nonfamily households. The most numerous type of family households are 2-person households, comprising 295,736, and the most common type of nonfamily households are 1-person households, comprising 276,409.
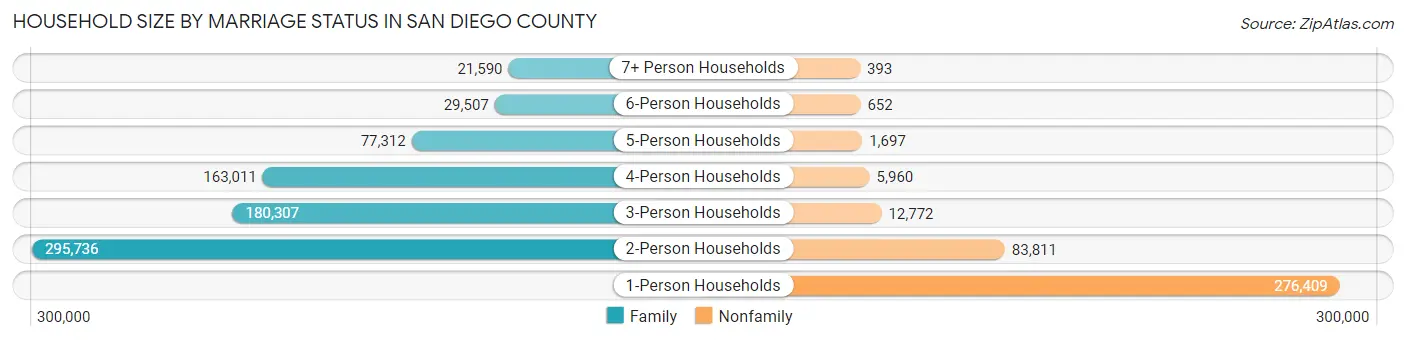
| Household Size | Family Households | Nonfamily Households |
| 1-Person Households | - | 276,409 (24.0%) |
| 2-Person Households | 295,736 (25.7%) | 83,811 (7.3%) |
| 3-Person Households | 180,307 (15.7%) | 12,772 (1.1%) |
| 4-Person Households | 163,011 (14.2%) | 5,960 (0.5%) |
| 5-Person Households | 77,312 (6.7%) | 1,697 (0.2%) |
| 6-Person Households | 29,507 (2.6%) | 652 (0.1%) |
| 7+ Person Households | 21,590 (1.9%) | 393 (0.0%) |
| Total | 767,463 (66.8%) | 381,694 (33.2%) |
Female Fertility in San Diego County
Fertility by Age in San Diego County
Average fertility rate in San Diego County is 52.0 births per 1,000 women. Women in the age bracket of 20 to 34 years have the highest fertility rate with 75.0 births per 1,000 women. Women in the age bracket of 20 to 34 years acount for 65.4% of all women with births.
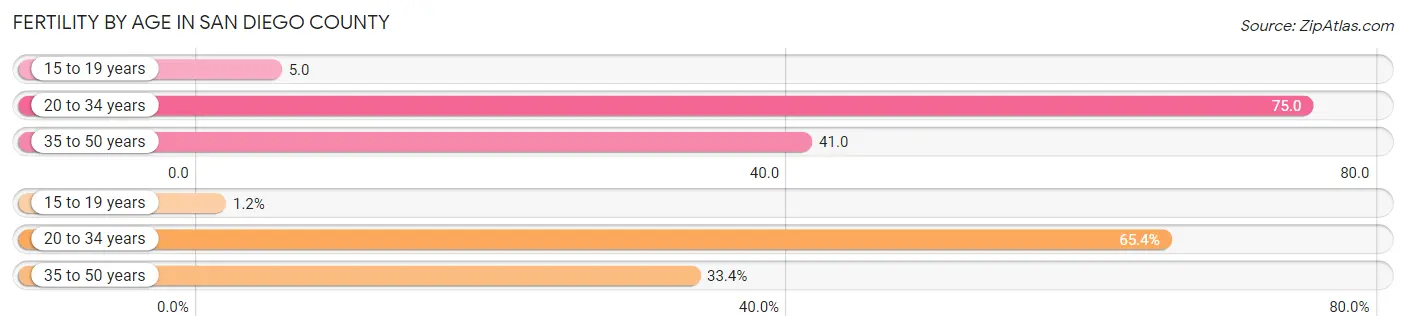
| Age Bracket | Women with Births | Births / 1,000 Women |
| 15 to 19 years | 504 (1.2%) | 5.0 |
| 20 to 34 years | 27,123 (65.4%) | 75.0 |
| 35 to 50 years | 13,850 (33.4%) | 41.0 |
| Total | 41,477 (100.0%) | 52.0 |
Fertility by Age by Marriage Status in San Diego County
75.2% of women with births (41,477) in San Diego County are married. The highest percentage of unmarried women with births falls into 15 to 19 years age bracket with 63.7% of them unmarried at the time of birth, while the lowest percentage of unmarried women with births belong to 35 to 50 years age bracket with 18.7% of them unmarried.
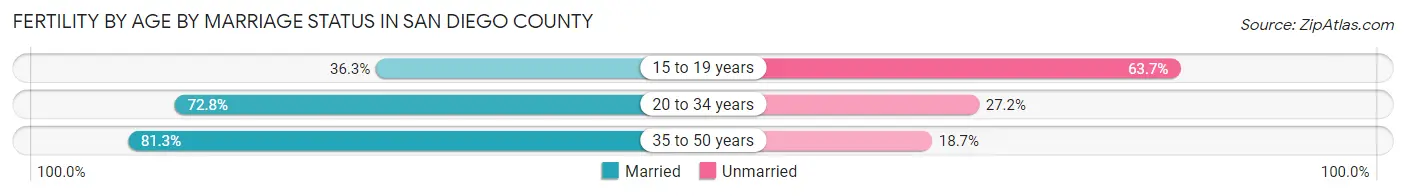
| Age Bracket | Married | Unmarried |
| 15 to 19 years | 183 (36.3%) | 321 (63.7%) |
| 20 to 34 years | 19,746 (72.8%) | 7,377 (27.2%) |
| 35 to 50 years | 11,260 (81.3%) | 2,590 (18.7%) |
| Total | 31,191 (75.2%) | 10,286 (24.8%) |
Fertility by Education in San Diego County
Average fertility rate in San Diego County is 52.0 births per 1,000 women. Women with the education attainment of graduate degree have the highest fertility rate of 63.0 births per 1,000 women, while women with the education attainment of less than high school have the lowest fertility at 26.0 births per 1,000 women. Women with the education attainment of college or associate's degree represent 33.2% of all women with births.
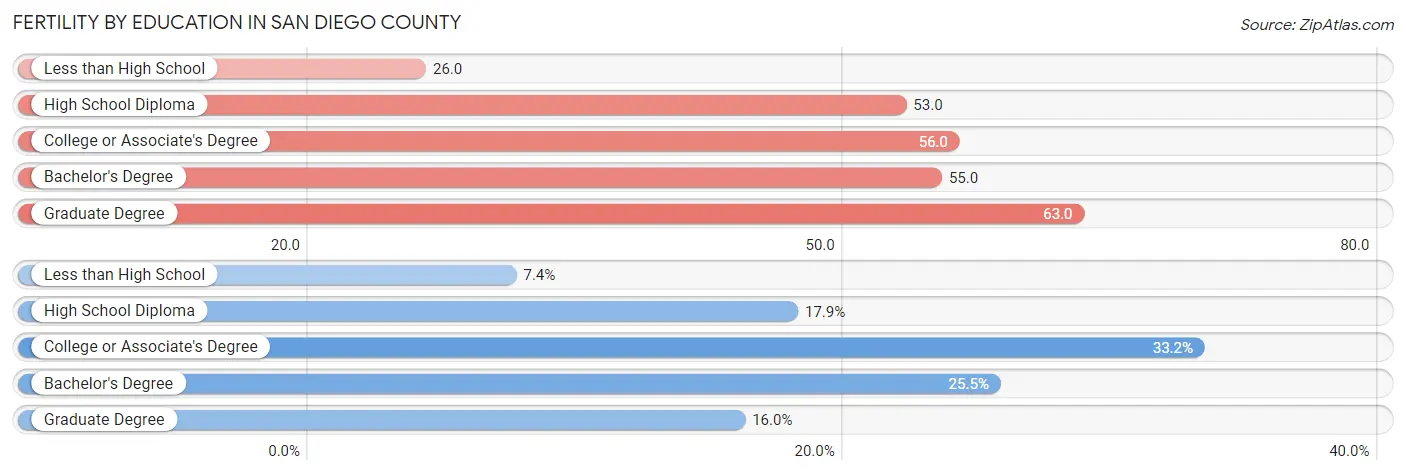
| Educational Attainment | Women with Births | Births / 1,000 Women |
| Less than High School | 3,064 (7.4%) | 26.0 |
| High School Diploma | 7,443 (17.9%) | 53.0 |
| College or Associate's Degree | 13,763 (33.2%) | 56.0 |
| Bachelor's Degree | 10,589 (25.5%) | 55.0 |
| Graduate Degree | 6,618 (16.0%) | 63.0 |
| Total | 41,477 (100.0%) | 52.0 |
Fertility by Education by Marriage Status in San Diego County
24.8% of women with births in San Diego County are unmarried. Women with the educational attainment of graduate degree are most likely to be married with 91.9% of them married at childbirth, while women with the educational attainment of high school diploma are least likely to be married with 38.7% of them unmarried at childbirth.
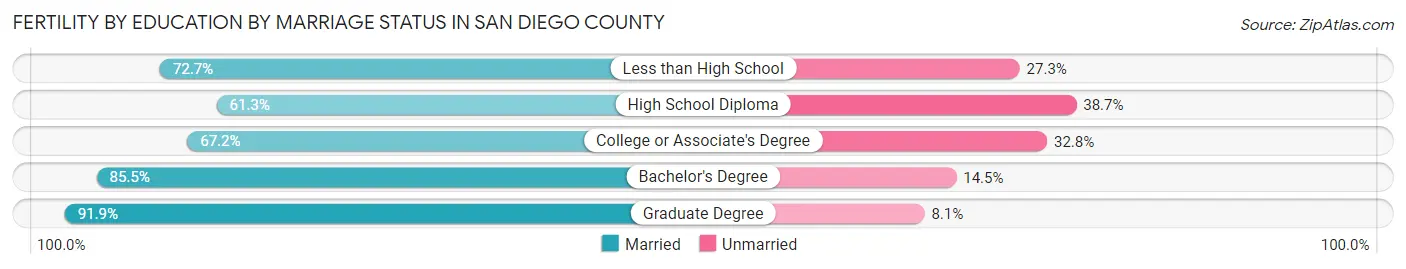
| Educational Attainment | Married | Unmarried |
| Less than High School | 2,228 (72.7%) | 836 (27.3%) |
| High School Diploma | 4,563 (61.3%) | 2,880 (38.7%) |
| College or Associate's Degree | 9,249 (67.2%) | 4,514 (32.8%) |
| Bachelor's Degree | 9,054 (85.5%) | 1,535 (14.5%) |
| Graduate Degree | 6,082 (91.9%) | 536 (8.1%) |
| Total | 31,191 (75.2%) | 10,286 (24.8%) |
Employment Characteristics in San Diego County
Employment by Class of Employer in San Diego County
Among the 1,622,954 employed individuals in San Diego County, private company employees (1,021,818 | 63.0%), federal government employees (144,131 | 8.9%), and not-for-profit organizations (120,541 | 7.4%) make up the most common classes of employment.
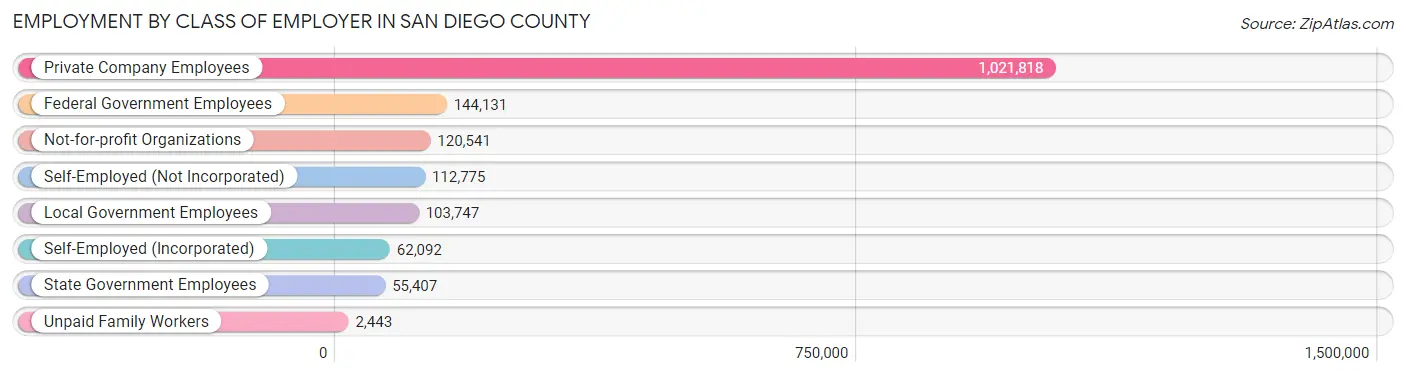
| Employer Class | # Employees | % Employees |
| Private Company Employees | 1,021,818 | 63.0% |
| Self-Employed (Incorporated) | 62,092 | 3.8% |
| Self-Employed (Not Incorporated) | 112,775 | 7.0% |
| Not-for-profit Organizations | 120,541 | 7.4% |
| Local Government Employees | 103,747 | 6.4% |
| State Government Employees | 55,407 | 3.4% |
| Federal Government Employees | 144,131 | 8.9% |
| Unpaid Family Workers | 2,443 | 0.2% |
| Total | 1,622,954 | 100.0% |
Employment Status by Age in San Diego County
According to the labor force statistics for San Diego County, out of the total population over 16 years of age (2,669,130), 66.2% or 1,766,964 individuals are in the labor force, with 6.3% or 111,319 of them unemployed. The age group with the highest labor force participation rate is 30 to 34 years, with 85.5% or 227,220 individuals in the labor force. Within the labor force, the 16 to 19 years age range has the highest percentage of unemployed individuals, with 18.8% or 11,406 of them being unemployed.
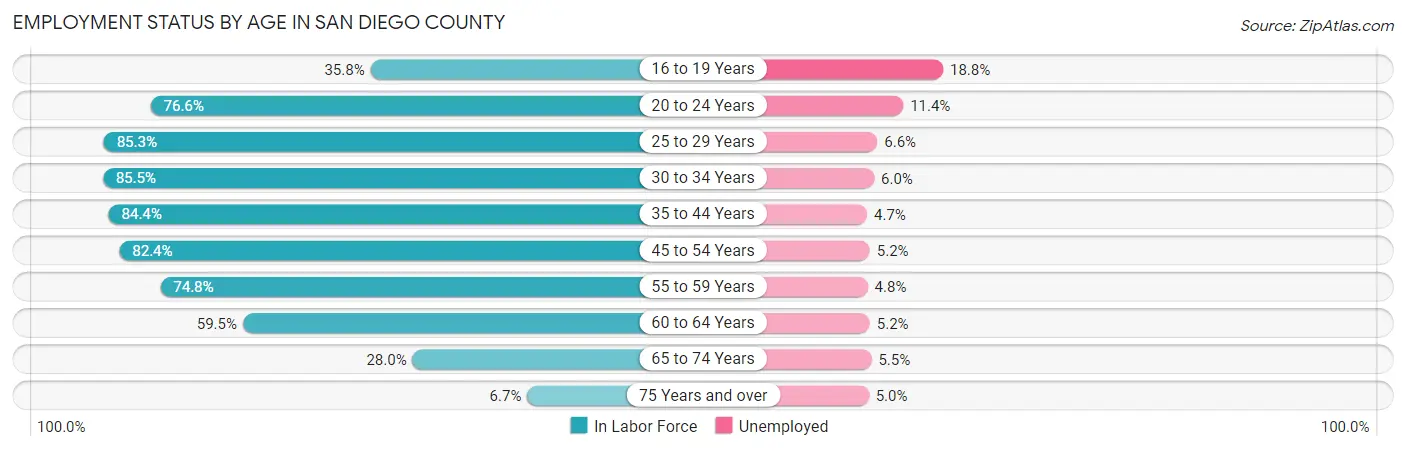
| Age Bracket | In Labor Force | Unemployed |
| 16 to 19 Years | 60,670 (35.8%) | 11,406 (18.8%) |
| 20 to 24 Years | 185,403 (76.6%) | 21,136 (11.4%) |
| 25 to 29 Years | 224,959 (85.3%) | 14,847 (6.6%) |
| 30 to 34 Years | 227,220 (85.5%) | 13,633 (6.0%) |
| 35 to 44 Years | 385,743 (84.4%) | 18,130 (4.7%) |
| 45 to 54 Years | 330,476 (82.4%) | 17,185 (5.2%) |
| 55 to 59 Years | 148,114 (74.8%) | 7,109 (4.8%) |
| 60 to 64 Years | 113,067 (59.5%) | 5,879 (5.2%) |
| 65 to 74 Years | 78,990 (28.0%) | 4,344 (5.5%) |
| 75 Years and over | 13,392 (6.7%) | 670 (5.0%) |
| Total | 1,766,964 (66.2%) | 111,319 (6.3%) |
Employment Status by Educational Attainment in San Diego County
According to labor force statistics for San Diego County, 80.5% of individuals (1,429,380) out of the total population between 25 and 64 years of age (1,775,627) are in the labor force, with 5.4% or 77,187 of them being unemployed. The group with the highest labor force participation rate are those with the educational attainment of bachelor's degree or higher, with 87.0% or 647,718 individuals in the labor force. Within the labor force, individuals with less than high school education have the highest percentage of unemployment, with 8.3% or 10,391 of them being unemployed.
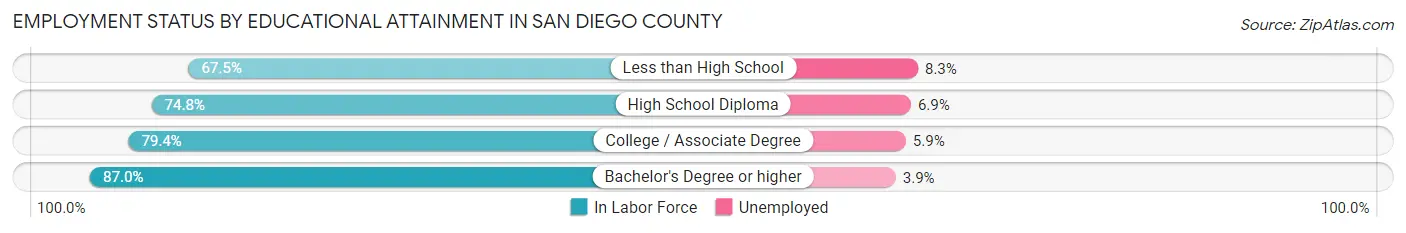
| Educational Attainment | In Labor Force | Unemployed |
| Less than High School | 125,195 (67.5%) | 15,394 (8.3%) |
| High School Diploma | 240,124 (74.8%) | 22,151 (6.9%) |
| College / Associate Degree | 416,555 (79.4%) | 30,953 (5.9%) |
| Bachelor's Degree or higher | 647,718 (87.0%) | 29,036 (3.9%) |
| Total | 1,429,380 (80.5%) | 95,884 (5.4%) |
Employment Occupations by Sex in San Diego County
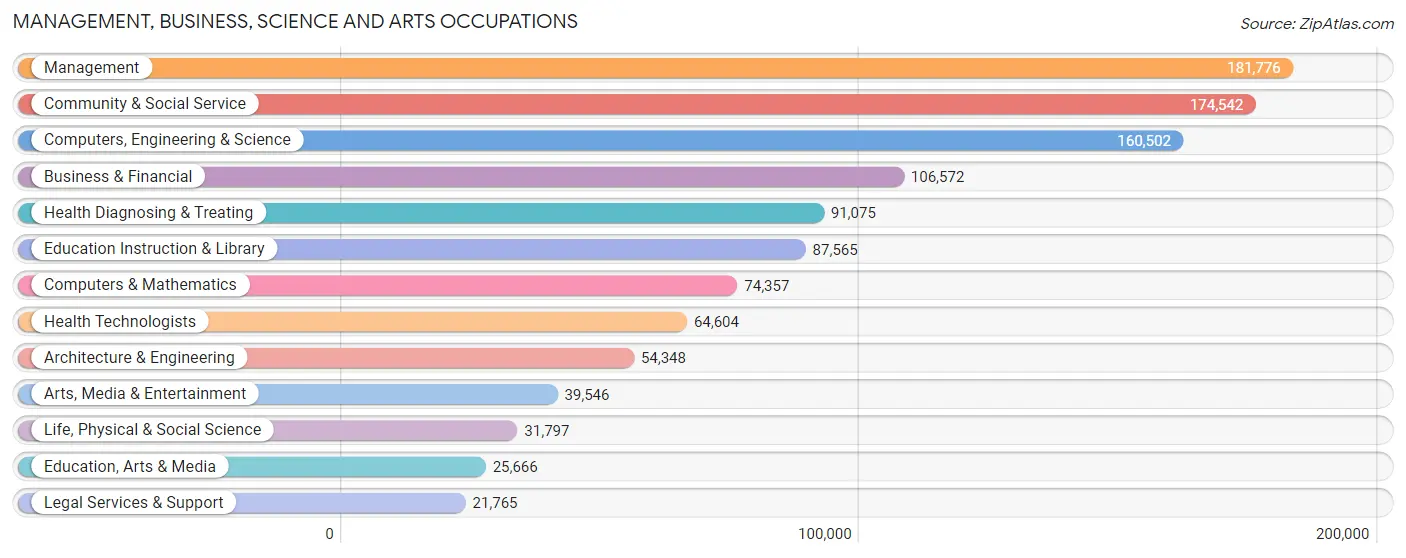
Management, Business, Science and Arts Occupations
The most common Management, Business, Science and Arts occupations in San Diego County are Management (181,776 | 11.5%), Community & Social Service (174,542 | 11.1%), Computers, Engineering & Science (160,502 | 10.2%), Business & Financial (106,572 | 6.8%), and Health Diagnosing & Treating (91,075 | 5.8%).
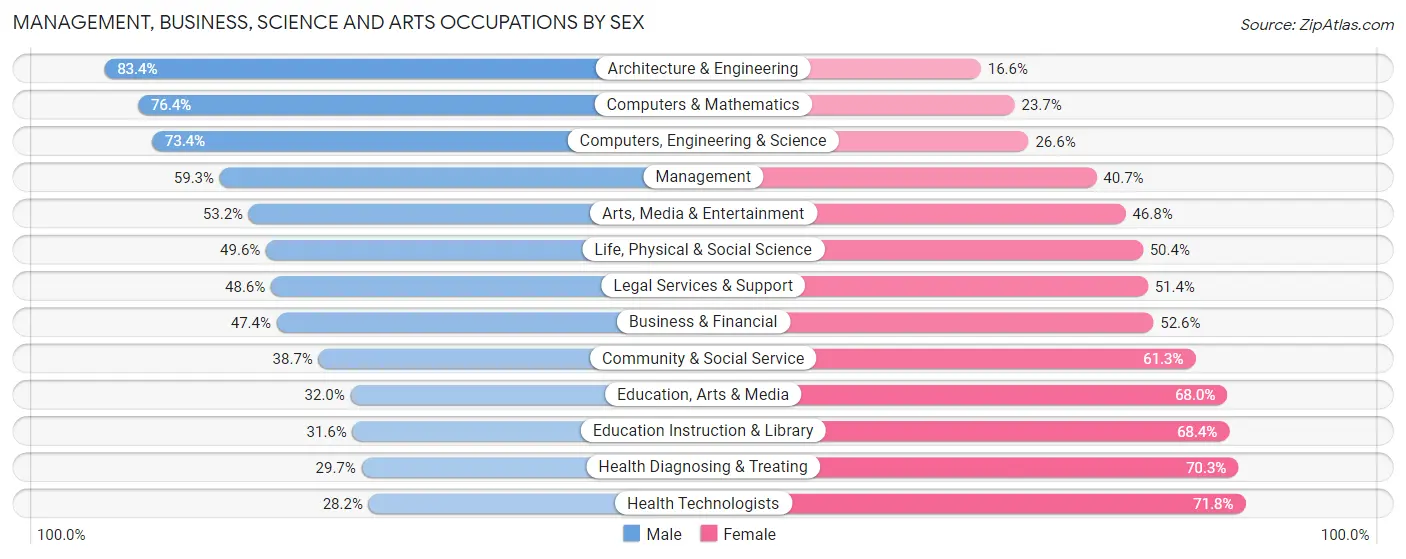
Management, Business, Science and Arts Occupations by Sex
Within the Management, Business, Science and Arts occupations in San Diego County, the most male-oriented occupations are Architecture & Engineering (83.4%), Computers & Mathematics (76.3%), and Computers, Engineering & Science (73.4%), while the most female-oriented occupations are Health Technologists (71.8%), Health Diagnosing & Treating (70.3%), and Education Instruction & Library (68.4%).
| Occupation | Male | Female |
| Management | 107,732 (59.3%) | 74,044 (40.7%) |
| Business & Financial | 50,513 (47.4%) | 56,059 (52.6%) |
| Computers, Engineering & Science | 117,870 (73.4%) | 42,632 (26.6%) |
| Computers & Mathematics | 56,771 (76.3%) | 17,586 (23.6%) |
| Architecture & Engineering | 45,323 (83.4%) | 9,025 (16.6%) |
| Life, Physical & Social Science | 15,776 (49.6%) | 16,021 (50.4%) |
| Community & Social Service | 67,477 (38.7%) | 107,065 (61.3%) |
| Education, Arts & Media | 8,210 (32.0%) | 17,456 (68.0%) |
| Legal Services & Support | 10,571 (48.6%) | 11,194 (51.4%) |
| Education Instruction & Library | 27,654 (31.6%) | 59,911 (68.4%) |
| Arts, Media & Entertainment | 21,042 (53.2%) | 18,504 (46.8%) |
| Health Diagnosing & Treating | 27,049 (29.7%) | 64,026 (70.3%) |
| Health Technologists | 18,224 (28.2%) | 46,380 (71.8%) |
| Total (Category) | 370,641 (51.9%) | 343,826 (48.1%) |
| Total (Overall) | 849,019 (53.9%) | 725,806 (46.1%) |
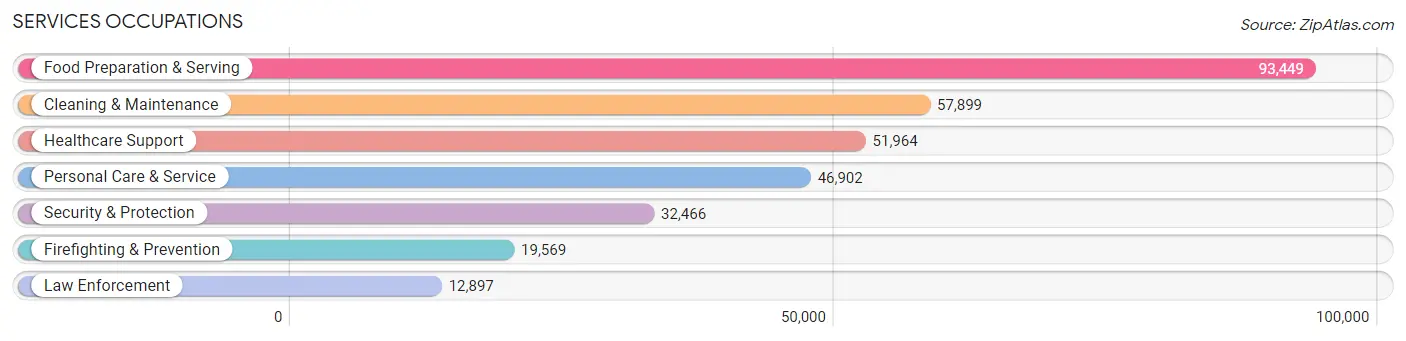
Services Occupations
The most common Services occupations in San Diego County are Food Preparation & Serving (93,449 | 5.9%), Cleaning & Maintenance (57,899 | 3.7%), Healthcare Support (51,964 | 3.3%), Personal Care & Service (46,902 | 3.0%), and Security & Protection (32,466 | 2.1%).
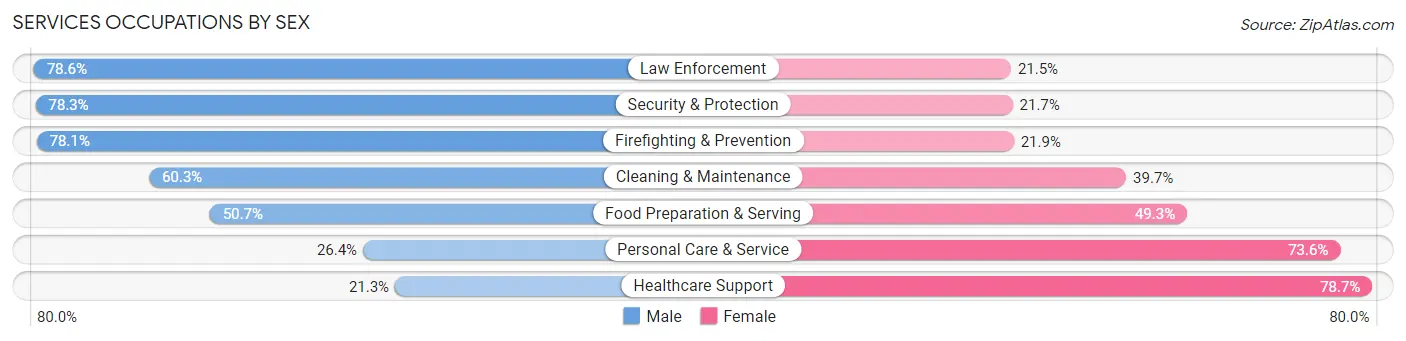
Services Occupations by Sex
Within the Services occupations in San Diego County, the most male-oriented occupations are Law Enforcement (78.5%), Security & Protection (78.3%), and Firefighting & Prevention (78.1%), while the most female-oriented occupations are Healthcare Support (78.7%), Personal Care & Service (73.6%), and Food Preparation & Serving (49.3%).
| Occupation | Male | Female |
| Healthcare Support | 11,083 (21.3%) | 40,881 (78.7%) |
| Security & Protection | 25,417 (78.3%) | 7,049 (21.7%) |
| Firefighting & Prevention | 15,286 (78.1%) | 4,283 (21.9%) |
| Law Enforcement | 10,131 (78.5%) | 2,766 (21.4%) |
| Food Preparation & Serving | 47,350 (50.7%) | 46,099 (49.3%) |
| Cleaning & Maintenance | 34,915 (60.3%) | 22,984 (39.7%) |
| Personal Care & Service | 12,383 (26.4%) | 34,519 (73.6%) |
| Total (Category) | 131,148 (46.4%) | 151,532 (53.6%) |
| Total (Overall) | 849,019 (53.9%) | 725,806 (46.1%) |
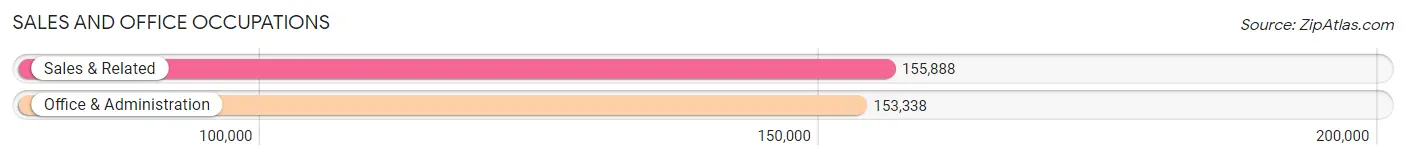
Sales and Office Occupations
The most common Sales and Office occupations in San Diego County are Sales & Related (155,888 | 9.9%), and Office & Administration (153,338 | 9.7%).
Sales and Office Occupations by Sex
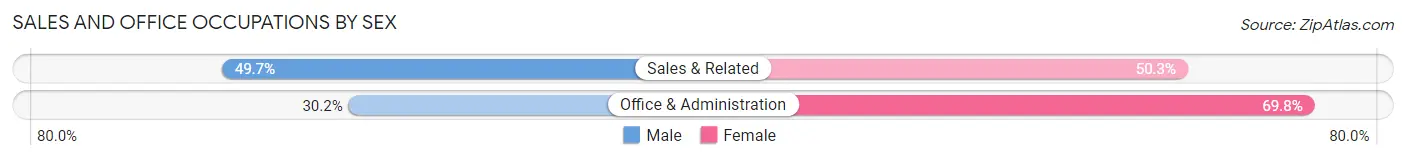
| Occupation | Male | Female |
| Sales & Related | 77,412 (49.7%) | 78,476 (50.3%) |
| Office & Administration | 46,262 (30.2%) | 107,076 (69.8%) |
| Total (Category) | 123,674 (40.0%) | 185,552 (60.0%) |
| Total (Overall) | 849,019 (53.9%) | 725,806 (46.1%) |
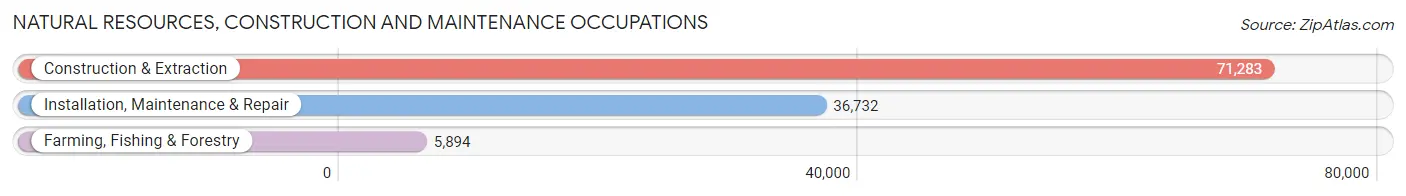
Natural Resources, Construction and Maintenance Occupations
The most common Natural Resources, Construction and Maintenance occupations in San Diego County are Construction & Extraction (71,283 | 4.5%), Installation, Maintenance & Repair (36,732 | 2.3%), and Farming, Fishing & Forestry (5,894 | 0.4%).
Natural Resources, Construction and Maintenance Occupations by Sex
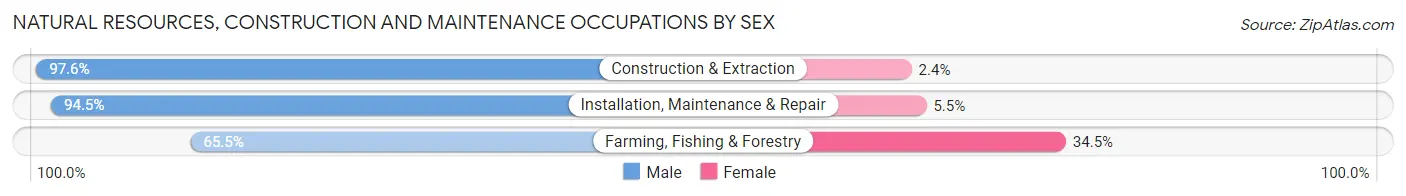
| Occupation | Male | Female |
| Farming, Fishing & Forestry | 3,858 (65.5%) | 2,036 (34.5%) |
| Construction & Extraction | 69,546 (97.6%) | 1,737 (2.4%) |
| Installation, Maintenance & Repair | 34,703 (94.5%) | 2,029 (5.5%) |
| Total (Category) | 108,107 (94.9%) | 5,802 (5.1%) |
| Total (Overall) | 849,019 (53.9%) | 725,806 (46.1%) |
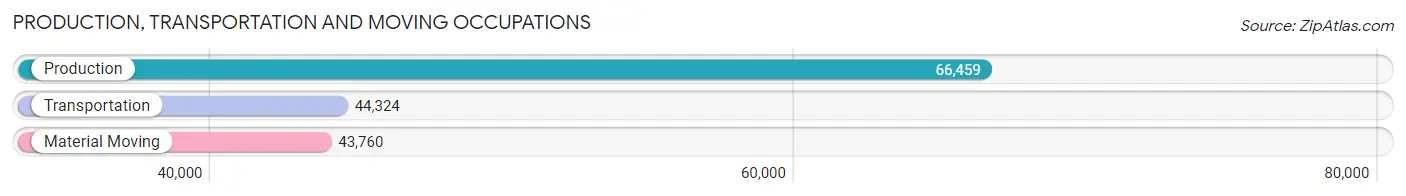
Production, Transportation and Moving Occupations
The most common Production, Transportation and Moving occupations in San Diego County are Production (66,459 | 4.2%), Transportation (44,324 | 2.8%), and Material Moving (43,760 | 2.8%).
Production, Transportation and Moving Occupations by Sex
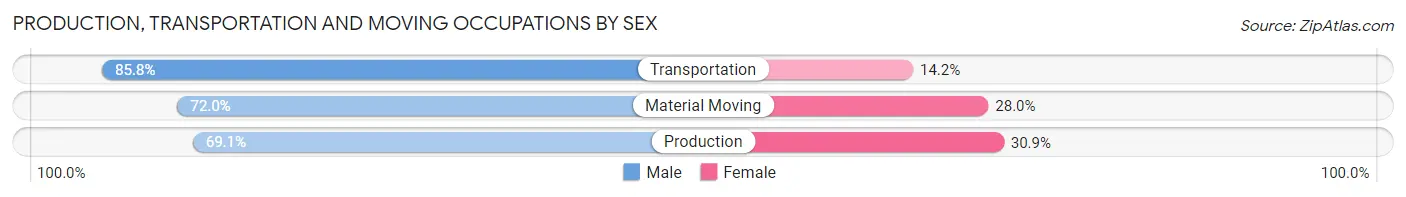
| Occupation | Male | Female |
| Production | 45,940 (69.1%) | 20,519 (30.9%) |
| Transportation | 38,019 (85.8%) | 6,305 (14.2%) |
| Material Moving | 31,490 (72.0%) | 12,270 (28.0%) |
| Total (Category) | 115,449 (74.7%) | 39,094 (25.3%) |
| Total (Overall) | 849,019 (53.9%) | 725,806 (46.1%) |
Employment Industries by Sex in San Diego County
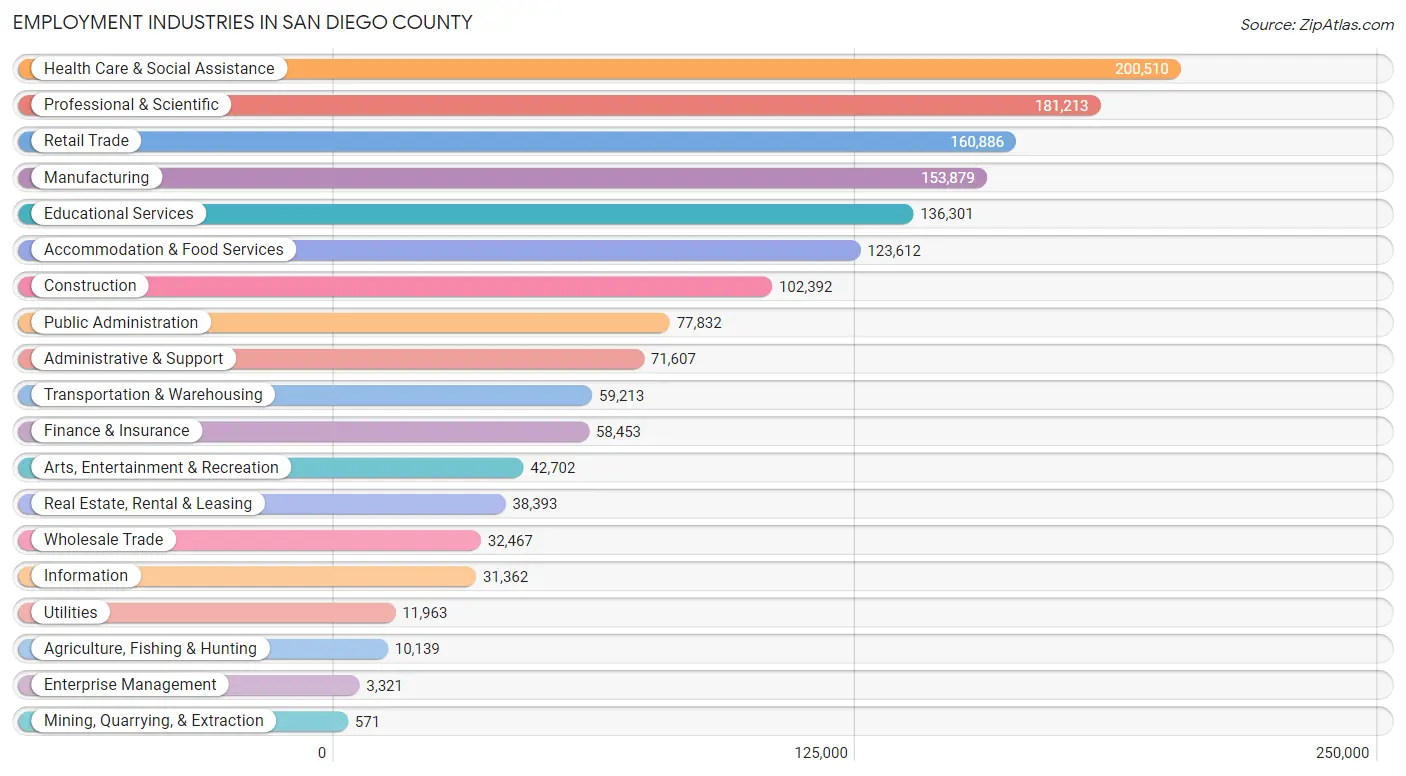
Employment Industries in San Diego County
The major employment industries in San Diego County include Health Care & Social Assistance (200,510 | 12.7%), Professional & Scientific (181,213 | 11.5%), Retail Trade (160,886 | 10.2%), Manufacturing (153,879 | 9.8%), and Educational Services (136,301 | 8.6%).
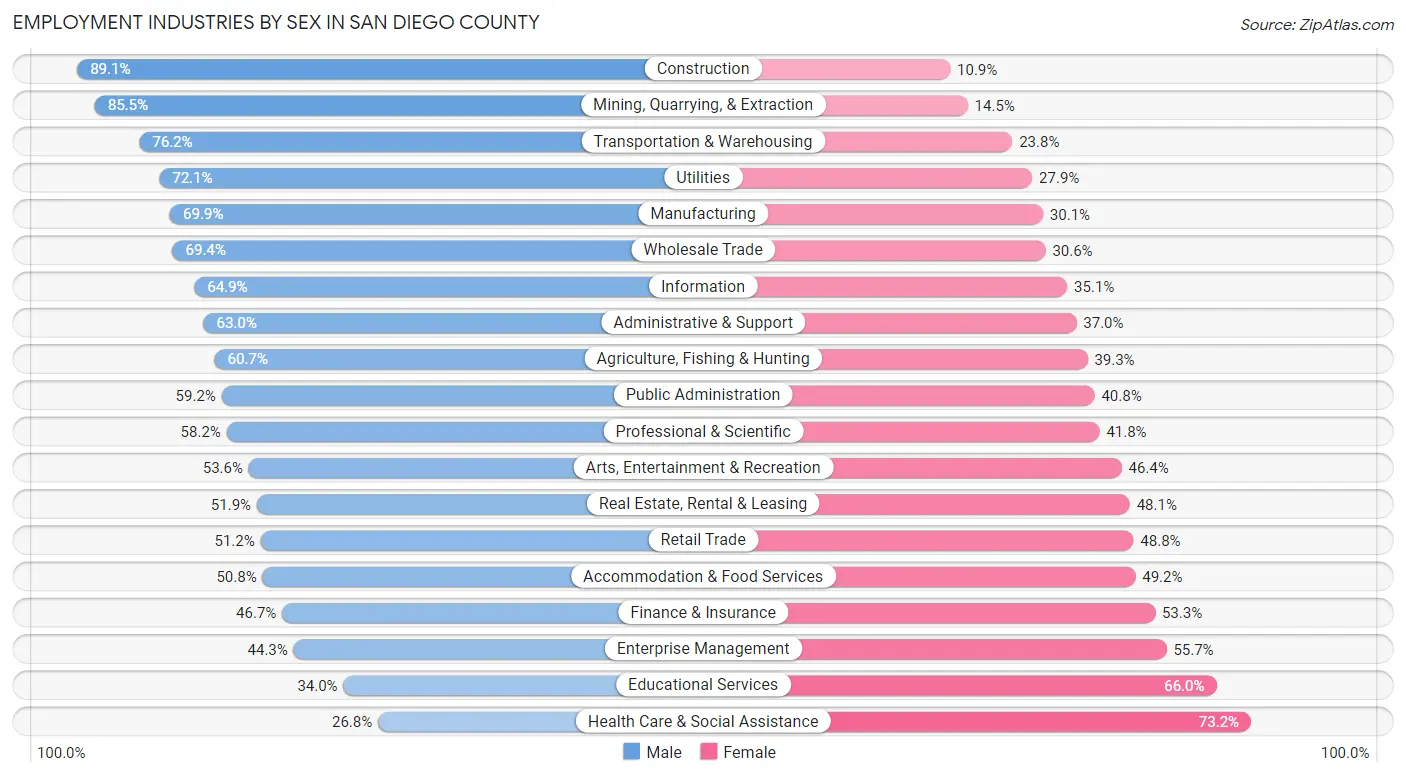
Employment Industries by Sex in San Diego County
The San Diego County industries that see more men than women are Construction (89.1%), Mining, Quarrying, & Extraction (85.5%), and Transportation & Warehousing (76.2%), whereas the industries that tend to have a higher number of women are Health Care & Social Assistance (73.2%), Educational Services (66.0%), and Enterprise Management (55.7%).
| Industry | Male | Female |
| Agriculture, Fishing & Hunting | 6,151 (60.7%) | 3,988 (39.3%) |
| Mining, Quarrying, & Extraction | 488 (85.5%) | 83 (14.5%) |
| Construction | 91,233 (89.1%) | 11,159 (10.9%) |
| Manufacturing | 107,553 (69.9%) | 46,326 (30.1%) |
| Wholesale Trade | 22,520 (69.4%) | 9,947 (30.6%) |
| Retail Trade | 82,315 (51.2%) | 78,571 (48.8%) |
| Transportation & Warehousing | 45,142 (76.2%) | 14,071 (23.8%) |
| Utilities | 8,626 (72.1%) | 3,337 (27.9%) |
| Information | 20,343 (64.9%) | 11,019 (35.1%) |
| Finance & Insurance | 27,294 (46.7%) | 31,159 (53.3%) |
| Real Estate, Rental & Leasing | 19,934 (51.9%) | 18,459 (48.1%) |
| Professional & Scientific | 105,428 (58.2%) | 75,785 (41.8%) |
| Enterprise Management | 1,472 (44.3%) | 1,849 (55.7%) |
| Administrative & Support | 45,087 (63.0%) | 26,520 (37.0%) |
| Educational Services | 46,341 (34.0%) | 89,960 (66.0%) |
| Health Care & Social Assistance | 53,814 (26.8%) | 146,696 (73.2%) |
| Arts, Entertainment & Recreation | 22,886 (53.6%) | 19,816 (46.4%) |
| Accommodation & Food Services | 62,746 (50.8%) | 60,866 (49.2%) |
| Public Administration | 46,084 (59.2%) | 31,748 (40.8%) |
| Total | 849,019 (53.9%) | 725,806 (46.1%) |
Education in San Diego County
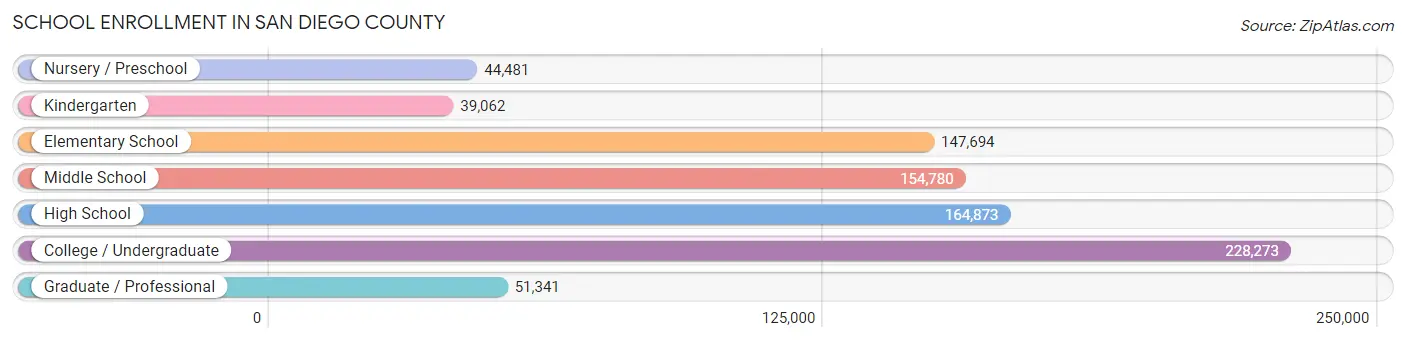
School Enrollment in San Diego County
The most common levels of schooling among the 830,504 students in San Diego County are college / undergraduate (228,273 | 27.5%), high school (164,873 | 19.9%), and middle school (154,780 | 18.6%).
| School Level | # Students | % Students |
| Nursery / Preschool | 44,481 | 5.4% |
| Kindergarten | 39,062 | 4.7% |
| Elementary School | 147,694 | 17.8% |
| Middle School | 154,780 | 18.6% |
| High School | 164,873 | 19.9% |
| College / Undergraduate | 228,273 | 27.5% |
| Graduate / Professional | 51,341 | 6.2% |
| Total | 830,504 | 100.0% |
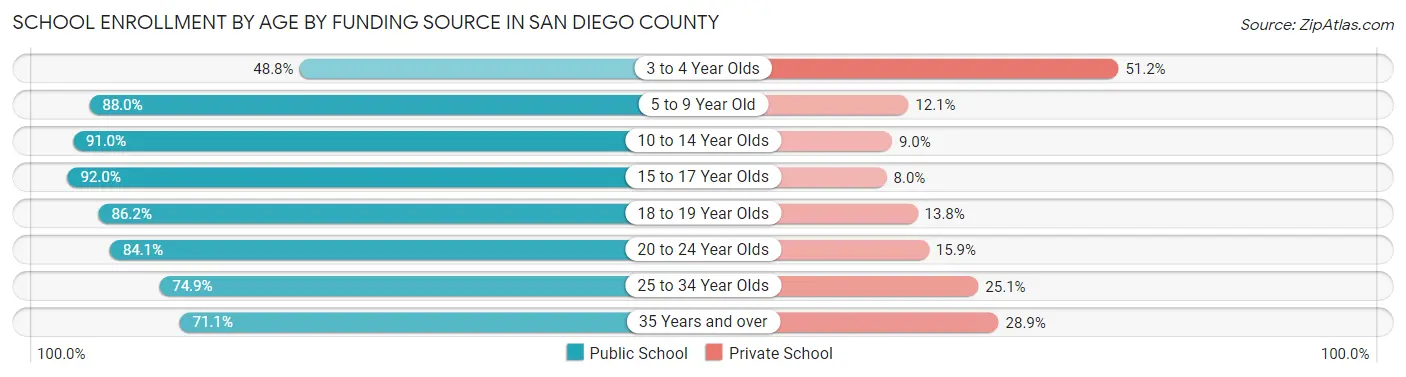
School Enrollment by Age by Funding Source in San Diego County
Out of a total of 830,504 students who are enrolled in schools in San Diego County, 127,898 (15.4%) attend a private institution, while the remaining 702,606 (84.6%) are enrolled in public schools. The age group of 3 to 4 year olds has the highest likelihood of being enrolled in private schools, with 18,582 (51.2% in the age bracket) enrolled. Conversely, the age group of 15 to 17 year olds has the lowest likelihood of being enrolled in a private school, with 104,786 (92.0% in the age bracket) attending a public institution.
| Age Bracket | Public School | Private School |
| 3 to 4 Year Olds | 17,722 (48.8%) | 18,582 (51.2%) |
| 5 to 9 Year Old | 156,674 (87.9%) | 21,463 (12.0%) |
| 10 to 14 Year Olds | 180,643 (91.0%) | 17,863 (9.0%) |
| 15 to 17 Year Olds | 104,786 (92.0%) | 9,098 (8.0%) |
| 18 to 19 Year Olds | 59,141 (86.2%) | 9,445 (13.8%) |
| 20 to 24 Year Olds | 85,843 (84.1%) | 16,193 (15.9%) |
| 25 to 34 Year Olds | 58,594 (74.9%) | 19,631 (25.1%) |
| 35 Years and over | 39,005 (71.1%) | 15,821 (28.9%) |
| Total | 702,606 (84.6%) | 127,898 (15.4%) |
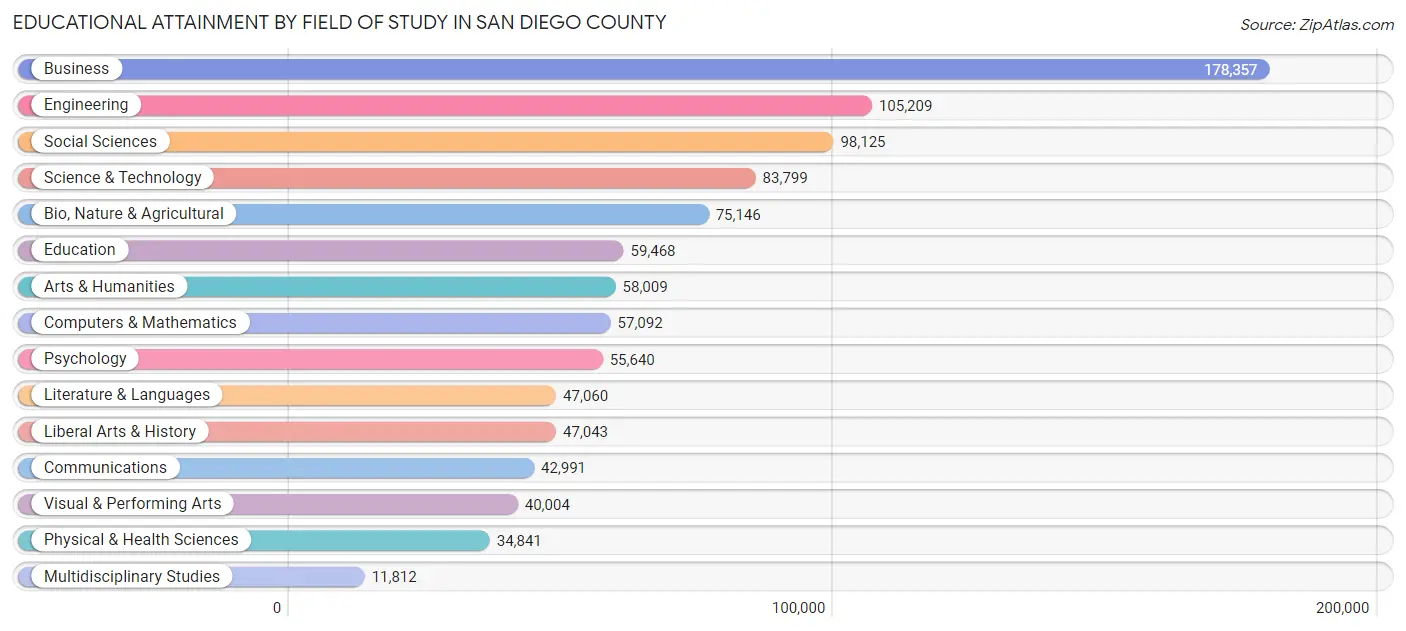
Educational Attainment by Field of Study in San Diego County
Business (178,357 | 17.9%), engineering (105,209 | 10.6%), social sciences (98,125 | 9.9%), science & technology (83,799 | 8.4%), and bio, nature & agricultural (75,146 | 7.6%) are the most common fields of study among 994,596 individuals in San Diego County who have obtained a bachelor's degree or higher.
| Field of Study | # Graduates | % Graduates |
| Computers & Mathematics | 57,092 | 5.7% |
| Bio, Nature & Agricultural | 75,146 | 7.6% |
| Physical & Health Sciences | 34,841 | 3.5% |
| Psychology | 55,640 | 5.6% |
| Social Sciences | 98,125 | 9.9% |
| Engineering | 105,209 | 10.6% |
| Multidisciplinary Studies | 11,812 | 1.2% |
| Science & Technology | 83,799 | 8.4% |
| Business | 178,357 | 17.9% |
| Education | 59,468 | 6.0% |
| Literature & Languages | 47,060 | 4.7% |
| Liberal Arts & History | 47,043 | 4.7% |
| Visual & Performing Arts | 40,004 | 4.0% |
| Communications | 42,991 | 4.3% |
| Arts & Humanities | 58,009 | 5.8% |
| Total | 994,596 | 100.0% |
Transportation & Commute in San Diego County
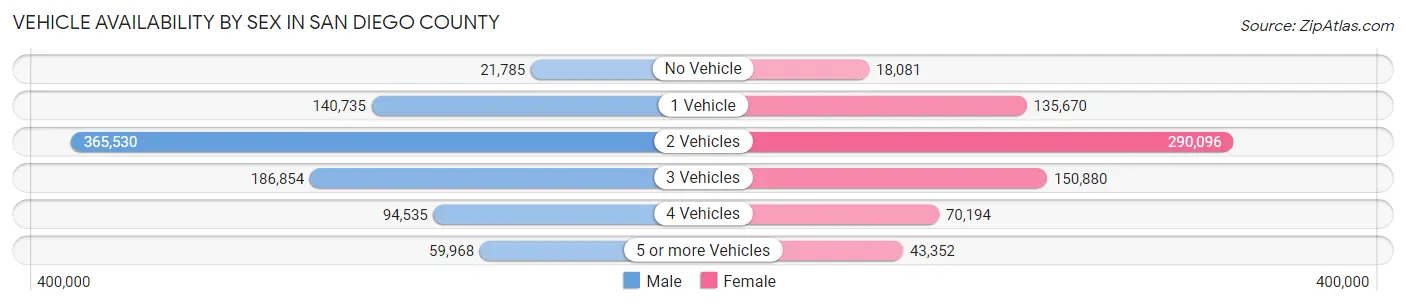
Vehicle Availability by Sex in San Diego County
The most prevalent vehicle ownership categories in San Diego County are males with 2 vehicles (365,530, accounting for 42.0%) and females with 2 vehicles (290,096, making up 51.6%).
| Vehicles Available | Male | Female |
| No Vehicle | 21,785 (2.5%) | 18,081 (2.5%) |
| 1 Vehicle | 140,735 (16.2%) | 135,670 (19.2%) |
| 2 Vehicles | 365,530 (42.0%) | 290,096 (41.0%) |
| 3 Vehicles | 186,854 (21.5%) | 150,880 (21.3%) |
| 4 Vehicles | 94,535 (10.9%) | 70,194 (9.9%) |
| 5 or more Vehicles | 59,968 (6.9%) | 43,352 (6.1%) |
| Total | 869,407 (100.0%) | 708,273 (100.0%) |
Commute Time in San Diego County
The most frequently occuring commute durations in San Diego County are 20 to 24 minutes (236,951 commuters, 17.2%), 15 to 19 minutes (236,534 commuters, 17.1%), and 30 to 34 minutes (220,935 commuters, 16.0%).
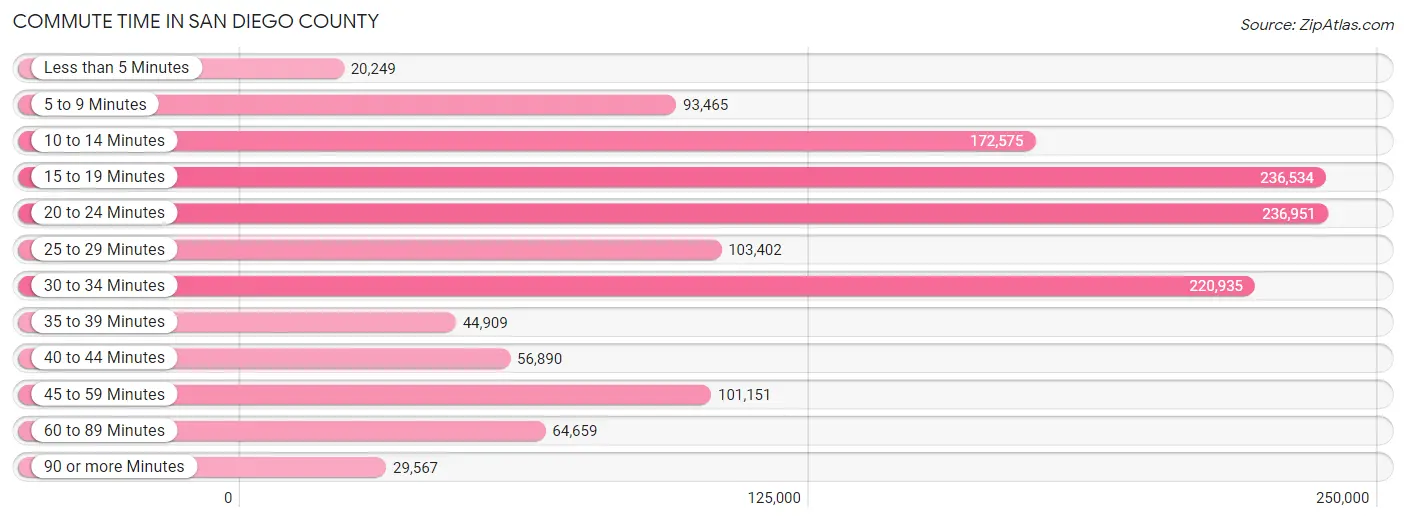
| Commute Time | # Commuters | % Commuters |
| Less than 5 Minutes | 20,249 | 1.5% |
| 5 to 9 Minutes | 93,465 | 6.8% |
| 10 to 14 Minutes | 172,575 | 12.5% |
| 15 to 19 Minutes | 236,534 | 17.1% |
| 20 to 24 Minutes | 236,951 | 17.2% |
| 25 to 29 Minutes | 103,402 | 7.5% |
| 30 to 34 Minutes | 220,935 | 16.0% |
| 35 to 39 Minutes | 44,909 | 3.3% |
| 40 to 44 Minutes | 56,890 | 4.1% |
| 45 to 59 Minutes | 101,151 | 7.3% |
| 60 to 89 Minutes | 64,659 | 4.7% |
| 90 or more Minutes | 29,567 | 2.1% |
Commute Time by Sex in San Diego County
The most common commute times in San Diego County are 20 to 24 minutes (132,499 commuters, 16.9%) for males and 15 to 19 minutes (108,133 commuters, 18.1%) for females.
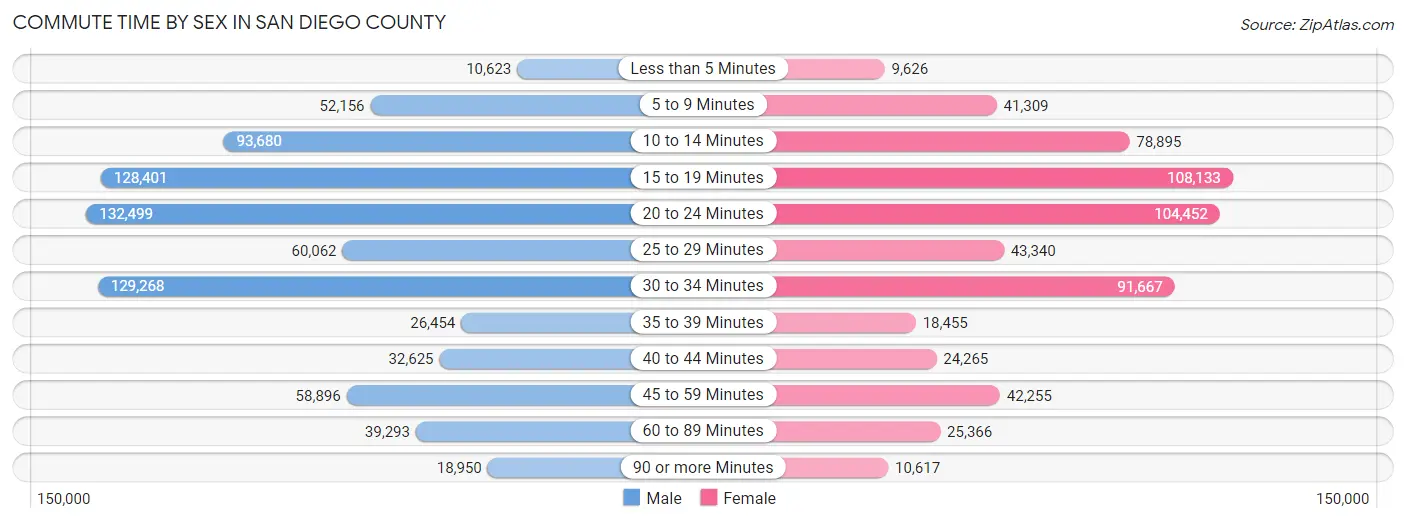
| Commute Time | Male | Female |
| Less than 5 Minutes | 10,623 (1.4%) | 9,626 (1.6%) |
| 5 to 9 Minutes | 52,156 (6.7%) | 41,309 (6.9%) |
| 10 to 14 Minutes | 93,680 (12.0%) | 78,895 (13.2%) |
| 15 to 19 Minutes | 128,401 (16.4%) | 108,133 (18.1%) |
| 20 to 24 Minutes | 132,499 (16.9%) | 104,452 (17.5%) |
| 25 to 29 Minutes | 60,062 (7.7%) | 43,340 (7.2%) |
| 30 to 34 Minutes | 129,268 (16.5%) | 91,667 (15.3%) |
| 35 to 39 Minutes | 26,454 (3.4%) | 18,455 (3.1%) |
| 40 to 44 Minutes | 32,625 (4.2%) | 24,265 (4.1%) |
| 45 to 59 Minutes | 58,896 (7.5%) | 42,255 (7.1%) |
| 60 to 89 Minutes | 39,293 (5.0%) | 25,366 (4.2%) |
| 90 or more Minutes | 18,950 (2.4%) | 10,617 (1.8%) |
Time of Departure to Work by Sex in San Diego County
The most frequent times of departure to work in San Diego County are 7:00 AM to 7:29 AM (103,319, 13.2%) for males and 7:00 AM to 7:29 AM (89,863, 15.0%) for females.
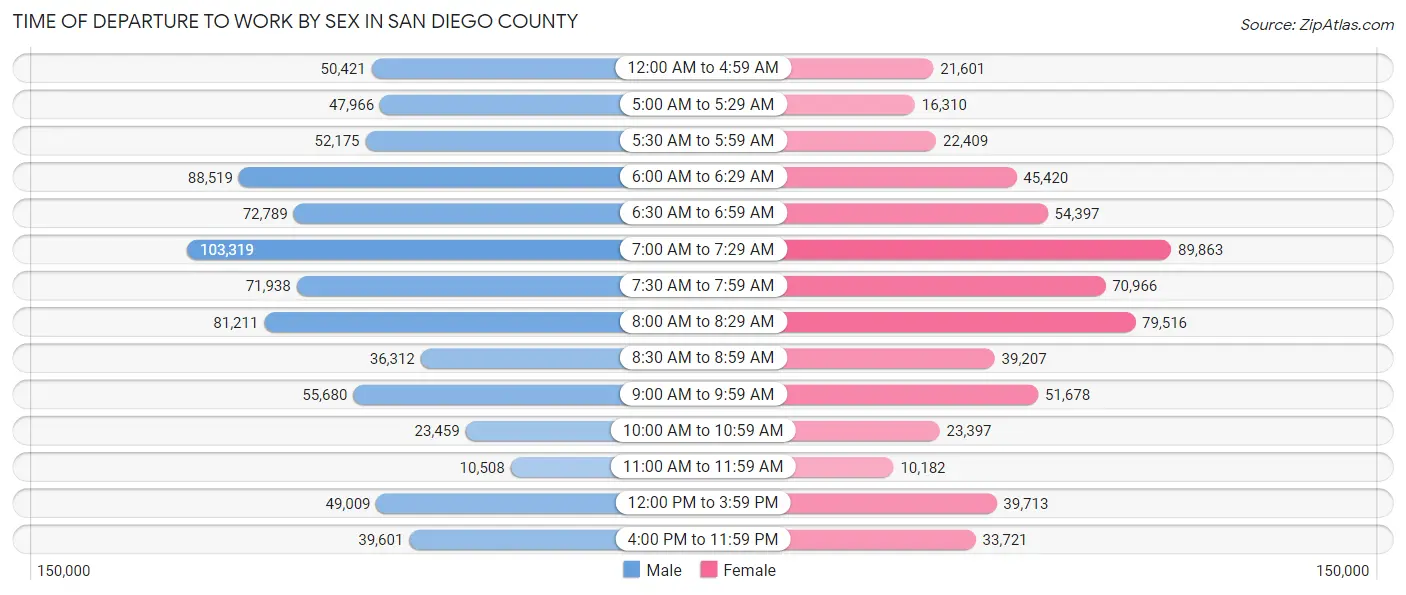
| Time of Departure | Male | Female |
| 12:00 AM to 4:59 AM | 50,421 (6.4%) | 21,601 (3.6%) |
| 5:00 AM to 5:29 AM | 47,966 (6.1%) | 16,310 (2.7%) |
| 5:30 AM to 5:59 AM | 52,175 (6.7%) | 22,409 (3.7%) |
| 6:00 AM to 6:29 AM | 88,519 (11.3%) | 45,420 (7.6%) |
| 6:30 AM to 6:59 AM | 72,789 (9.3%) | 54,397 (9.1%) |
| 7:00 AM to 7:29 AM | 103,319 (13.2%) | 89,863 (15.0%) |
| 7:30 AM to 7:59 AM | 71,938 (9.2%) | 70,966 (11.9%) |
| 8:00 AM to 8:29 AM | 81,211 (10.4%) | 79,516 (13.3%) |
| 8:30 AM to 8:59 AM | 36,312 (4.6%) | 39,207 (6.6%) |
| 9:00 AM to 9:59 AM | 55,680 (7.1%) | 51,678 (8.6%) |
| 10:00 AM to 10:59 AM | 23,459 (3.0%) | 23,397 (3.9%) |
| 11:00 AM to 11:59 AM | 10,508 (1.3%) | 10,182 (1.7%) |
| 12:00 PM to 3:59 PM | 49,009 (6.3%) | 39,713 (6.6%) |
| 4:00 PM to 11:59 PM | 39,601 (5.1%) | 33,721 (5.6%) |
| Total | 782,907 (100.0%) | 598,380 (100.0%) |
Housing Occupancy in San Diego County
Occupancy by Ownership in San Diego County
Of the total 1,149,157 dwellings in San Diego County, owner-occupied units account for 623,317 (54.2%), while renter-occupied units make up 525,840 (45.8%).
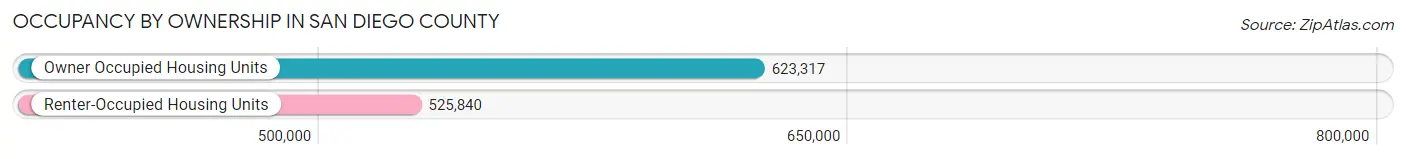
| Occupancy | # Housing Units | % Housing Units |
| Owner Occupied Housing Units | 623,317 | 54.2% |
| Renter-Occupied Housing Units | 525,840 | 45.8% |
| Total Occupied Housing Units | 1,149,157 | 100.0% |
Occupancy by Household Size in San Diego County
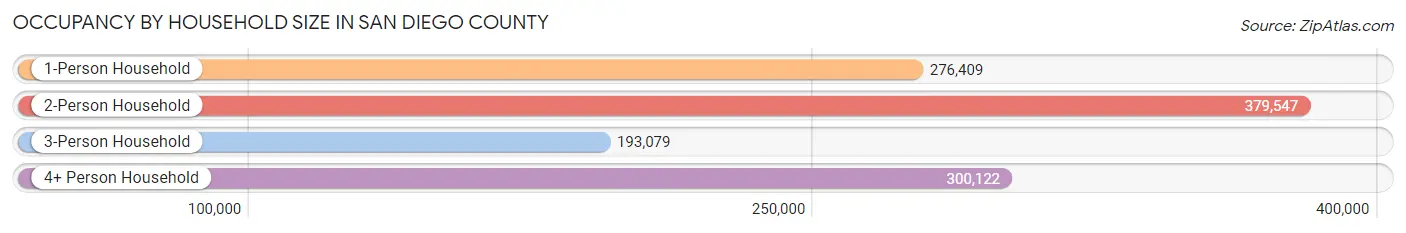
| Household Size | # Housing Units | % Housing Units |
| 1-Person Household | 276,409 | 24.0% |
| 2-Person Household | 379,547 | 33.0% |
| 3-Person Household | 193,079 | 16.8% |
| 4+ Person Household | 300,122 | 26.1% |
| Total Housing Units | 1,149,157 | 100.0% |
Occupancy by Ownership by Household Size in San Diego County
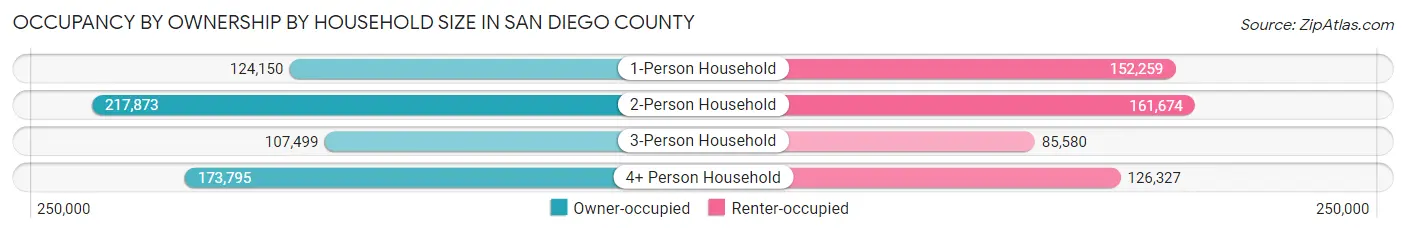
| Household Size | Owner-occupied | Renter-occupied |
| 1-Person Household | 124,150 (44.9%) | 152,259 (55.1%) |
| 2-Person Household | 217,873 (57.4%) | 161,674 (42.6%) |
| 3-Person Household | 107,499 (55.7%) | 85,580 (44.3%) |
| 4+ Person Household | 173,795 (57.9%) | 126,327 (42.1%) |
| Total Housing Units | 623,317 (54.2%) | 525,840 (45.8%) |
Occupancy by Educational Attainment in San Diego County
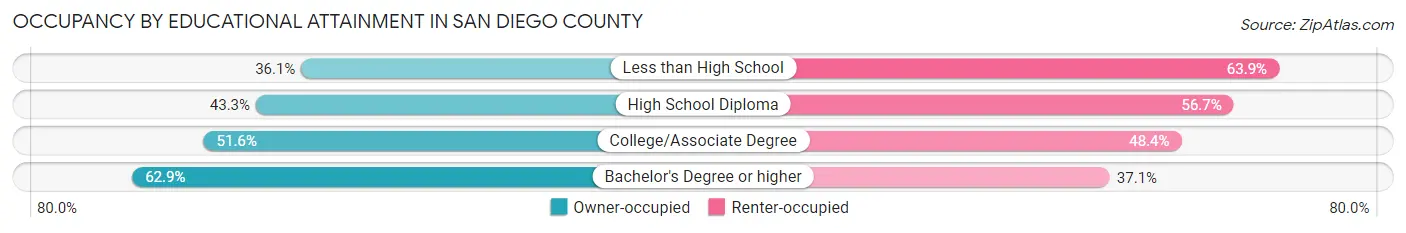
| Household Size | Owner-occupied | Renter-occupied |
| Less than High School | 35,976 (36.1%) | 63,584 (63.9%) |
| High School Diploma | 74,404 (43.3%) | 97,348 (56.7%) |
| College/Associate Degree | 180,002 (51.6%) | 168,822 (48.4%) |
| Bachelor's Degree or higher | 332,935 (62.9%) | 196,086 (37.1%) |
Occupancy by Age of Householder in San Diego County
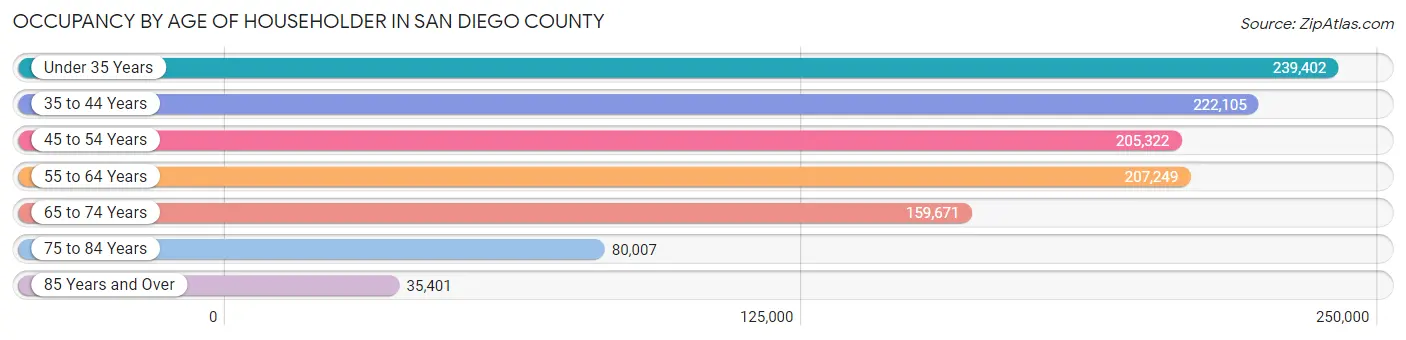
| Age Bracket | # Households | % Households |
| Under 35 Years | 239,402 | 20.8% |
| 35 to 44 Years | 222,105 | 19.3% |
| 45 to 54 Years | 205,322 | 17.9% |
| 55 to 64 Years | 207,249 | 18.0% |
| 65 to 74 Years | 159,671 | 13.9% |
| 75 to 84 Years | 80,007 | 7.0% |
| 85 Years and Over | 35,401 | 3.1% |
| Total | 1,149,157 | 100.0% |
Housing Finances in San Diego County
Median Income by Occupancy in San Diego County
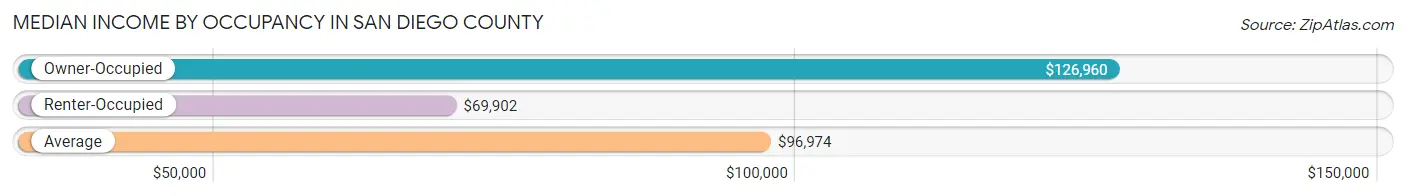
| Occupancy Type | # Households | Median Income |
| Owner-Occupied | 623,317 (54.2%) | $126,960 |
| Renter-Occupied | 525,840 (45.8%) | $69,902 |
| Average | 1,149,157 (100.0%) | $96,974 |
Occupancy by Householder Income Bracket in San Diego County
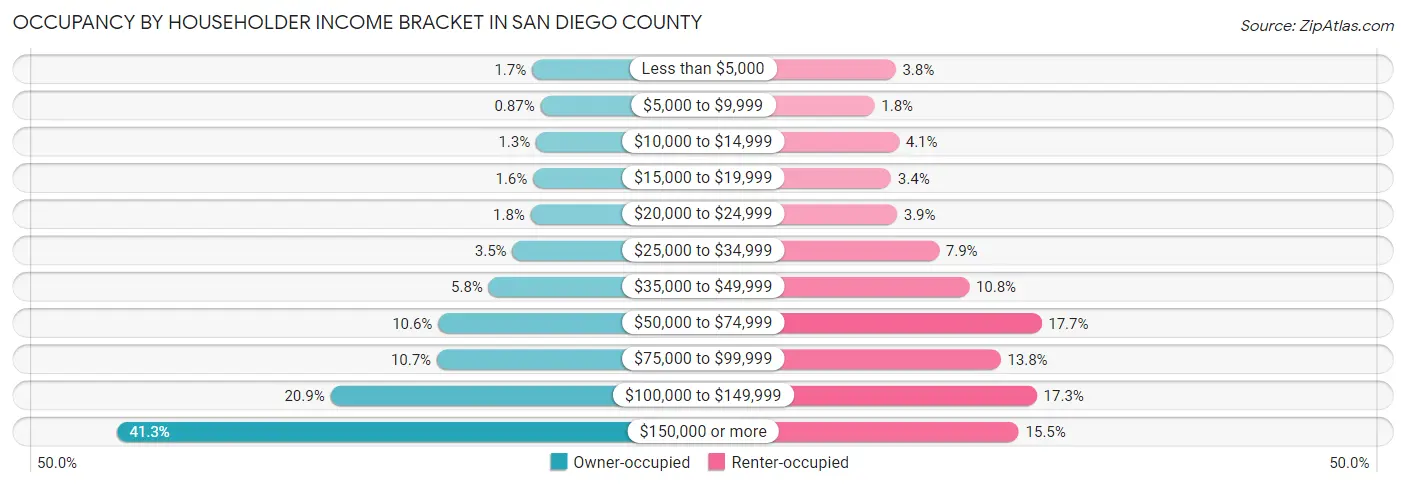
| Income Bracket | Owner-occupied | Renter-occupied |
| Less than $5,000 | 10,428 (1.7%) | 19,983 (3.8%) |
| $5,000 to $9,999 | 5,412 (0.9%) | 9,392 (1.8%) |
| $10,000 to $14,999 | 8,058 (1.3%) | 21,663 (4.1%) |
| $15,000 to $19,999 | 9,756 (1.6%) | 17,707 (3.4%) |
| $20,000 to $24,999 | 11,246 (1.8%) | 20,650 (3.9%) |
| $25,000 to $34,999 | 22,075 (3.5%) | 41,725 (7.9%) |
| $35,000 to $49,999 | 36,163 (5.8%) | 56,788 (10.8%) |
| $50,000 to $74,999 | 66,126 (10.6%) | 93,000 (17.7%) |
| $75,000 to $99,999 | 66,867 (10.7%) | 72,556 (13.8%) |
| $100,000 to $149,999 | 130,087 (20.9%) | 90,705 (17.2%) |
| $150,000 or more | 257,099 (41.2%) | 81,671 (15.5%) |
| Total | 623,317 (100.0%) | 525,840 (100.0%) |
Monthly Housing Cost Tiers in San Diego County
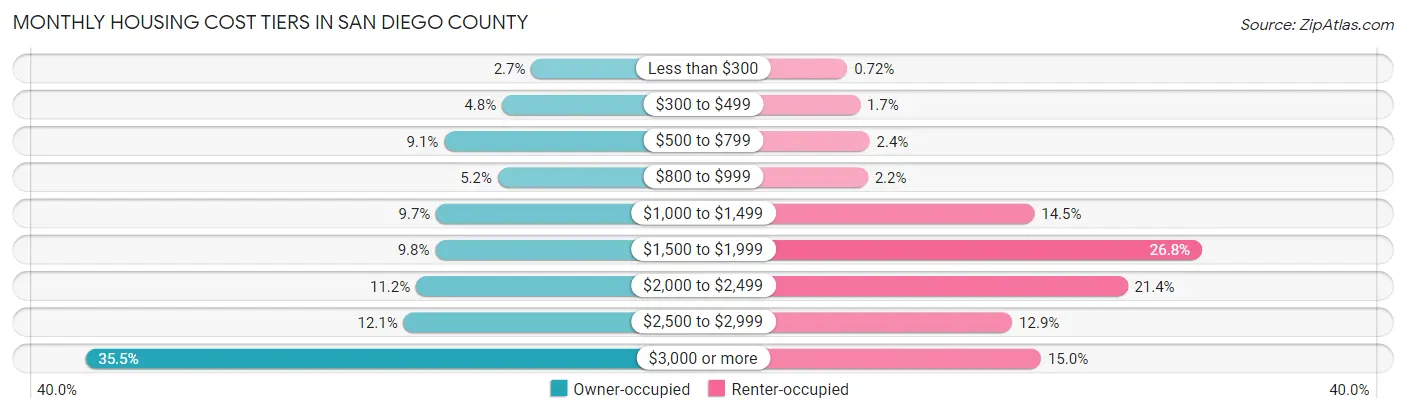
| Monthly Cost | Owner-occupied | Renter-occupied |
| Less than $300 | 16,712 (2.7%) | 3,798 (0.7%) |
| $300 to $499 | 30,178 (4.8%) | 8,722 (1.7%) |
| $500 to $799 | 56,695 (9.1%) | 12,448 (2.4%) |
| $800 to $999 | 32,123 (5.1%) | 11,716 (2.2%) |
| $1,000 to $1,499 | 60,396 (9.7%) | 76,272 (14.5%) |
| $1,500 to $1,999 | 60,795 (9.8%) | 141,151 (26.8%) |
| $2,000 to $2,499 | 69,594 (11.2%) | 112,337 (21.4%) |
| $2,500 to $2,999 | 75,373 (12.1%) | 67,699 (12.9%) |
| $3,000 or more | 221,451 (35.5%) | 78,816 (15.0%) |
| Total | 623,317 (100.0%) | 525,840 (100.0%) |
Physical Housing Characteristics in San Diego County
Housing Structures in San Diego County
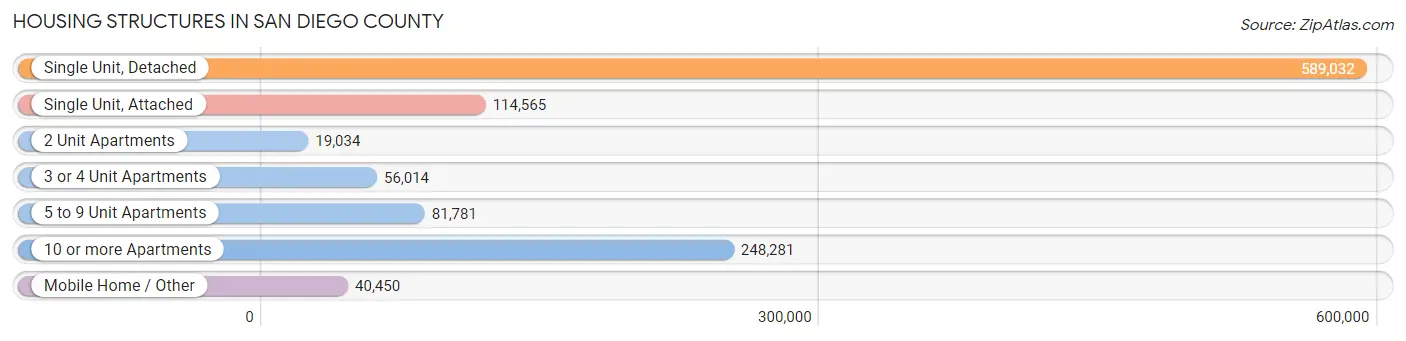
| Structure Type | # Housing Units | % Housing Units |
| Single Unit, Detached | 589,032 | 51.3% |
| Single Unit, Attached | 114,565 | 10.0% |
| 2 Unit Apartments | 19,034 | 1.7% |
| 3 or 4 Unit Apartments | 56,014 | 4.9% |
| 5 to 9 Unit Apartments | 81,781 | 7.1% |
| 10 or more Apartments | 248,281 | 21.6% |
| Mobile Home / Other | 40,450 | 3.5% |
| Total | 1,149,157 | 100.0% |
Housing Structures by Occupancy in San Diego County
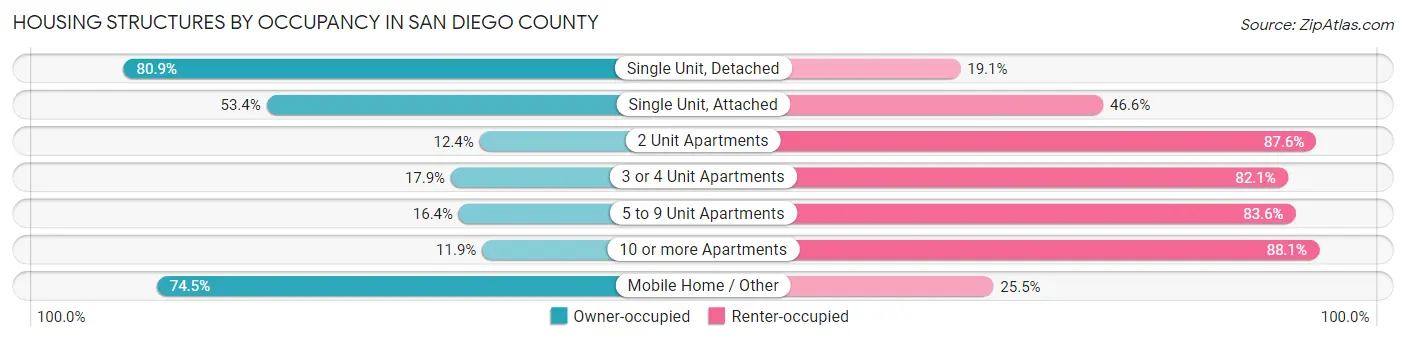
| Structure Type | Owner-occupied | Renter-occupied |
| Single Unit, Detached | 476,622 (80.9%) | 112,410 (19.1%) |
| Single Unit, Attached | 61,196 (53.4%) | 53,369 (46.6%) |
| 2 Unit Apartments | 2,360 (12.4%) | 16,674 (87.6%) |
| 3 or 4 Unit Apartments | 10,031 (17.9%) | 45,983 (82.1%) |
| 5 to 9 Unit Apartments | 13,402 (16.4%) | 68,379 (83.6%) |
| 10 or more Apartments | 29,554 (11.9%) | 218,727 (88.1%) |
| Mobile Home / Other | 30,152 (74.5%) | 10,298 (25.5%) |
| Total | 623,317 (54.2%) | 525,840 (45.8%) |
Housing Structures by Number of Rooms in San Diego County
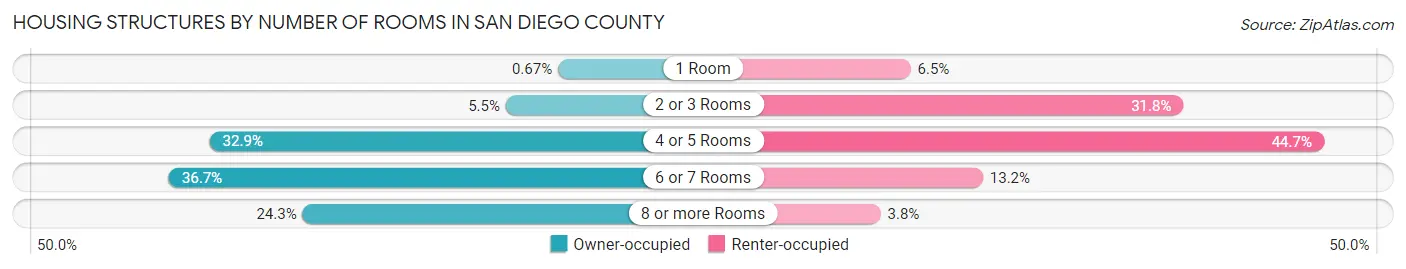
| Number of Rooms | Owner-occupied | Renter-occupied |
| 1 Room | 4,164 (0.7%) | 34,374 (6.5%) |
| 2 or 3 Rooms | 34,297 (5.5%) | 166,948 (31.8%) |
| 4 or 5 Rooms | 204,933 (32.9%) | 235,265 (44.7%) |
| 6 or 7 Rooms | 228,475 (36.6%) | 69,498 (13.2%) |
| 8 or more Rooms | 151,448 (24.3%) | 19,755 (3.8%) |
| Total | 623,317 (100.0%) | 525,840 (100.0%) |
Housing Structure by Heating Type in San Diego County
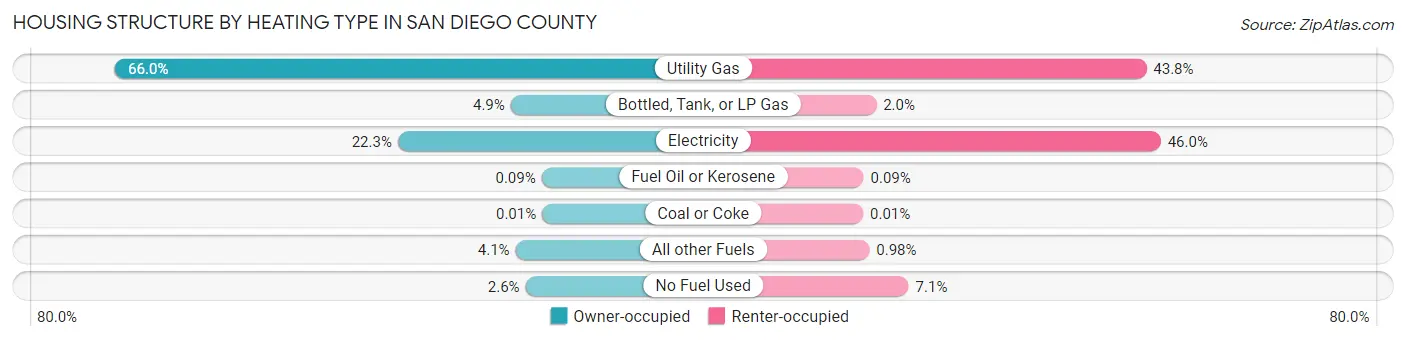
| Heating Type | Owner-occupied | Renter-occupied |
| Utility Gas | 411,449 (66.0%) | 230,337 (43.8%) |
| Bottled, Tank, or LP Gas | 30,379 (4.9%) | 10,753 (2.0%) |
| Electricity | 139,098 (22.3%) | 241,997 (46.0%) |
| Fuel Oil or Kerosene | 539 (0.1%) | 495 (0.1%) |
| Coal or Coke | 56 (0.0%) | 33 (0.0%) |
| All other Fuels | 25,707 (4.1%) | 5,130 (1.0%) |
| No Fuel Used | 16,089 (2.6%) | 37,095 (7.0%) |
| Total | 623,317 (100.0%) | 525,840 (100.0%) |
Household Vehicle Usage in San Diego County
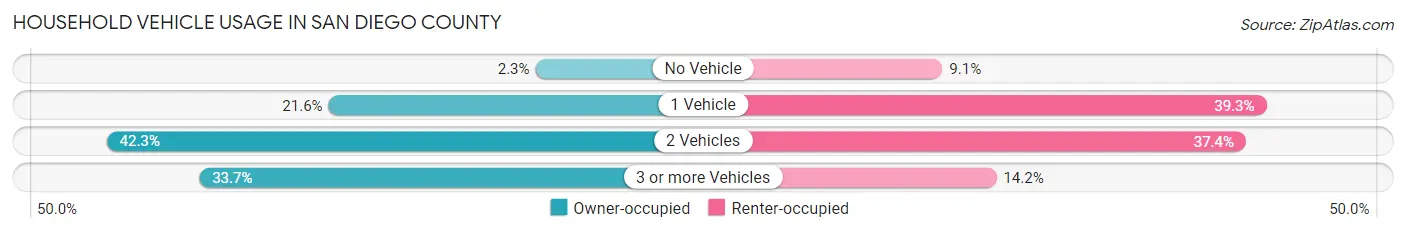
| Vehicles per Household | Owner-occupied | Renter-occupied |
| No Vehicle | 14,446 (2.3%) | 47,856 (9.1%) |
| 1 Vehicle | 134,910 (21.6%) | 206,808 (39.3%) |
| 2 Vehicles | 263,889 (42.3%) | 196,775 (37.4%) |
| 3 or more Vehicles | 210,072 (33.7%) | 74,401 (14.1%) |
| Total | 623,317 (100.0%) | 525,840 (100.0%) |
Real Estate & Mortgages in San Diego County
Real Estate and Mortgage Overview in San Diego County
| Characteristic | Without Mortgage | With Mortgage |
| Housing Units | 185,512 | 437,805 |
| Median Property Value | $679,500 | $741,500 |
| Median Household Income | $86,223 | $209,233 |
| Monthly Housing Costs | $767 | $217,858 |
| Real Estate Taxes | $3,620 | $8,485 |
Property Value by Mortgage Status in San Diego County
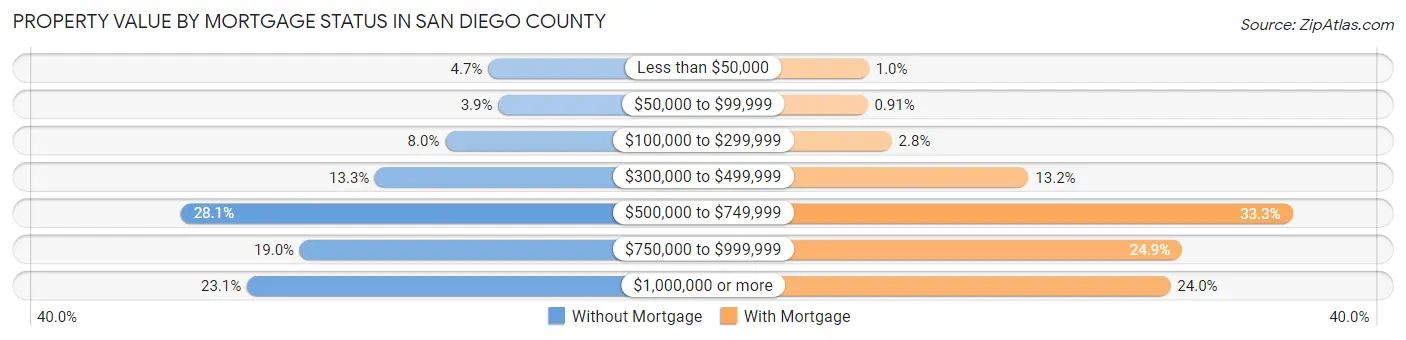
| Property Value | Without Mortgage | With Mortgage |
| Less than $50,000 | 8,689 (4.7%) | 4,412 (1.0%) |
| $50,000 to $99,999 | 7,251 (3.9%) | 3,980 (0.9%) |
| $100,000 to $299,999 | 14,742 (8.0%) | 12,044 (2.8%) |
| $300,000 to $499,999 | 24,647 (13.3%) | 57,663 (13.2%) |
| $500,000 to $749,999 | 52,130 (28.1%) | 145,747 (33.3%) |
| $750,000 to $999,999 | 35,287 (19.0%) | 108,945 (24.9%) |
| $1,000,000 or more | 42,766 (23.1%) | 105,014 (24.0%) |
| Total | 185,512 (100.0%) | 437,805 (100.0%) |
Household Income by Mortgage Status in San Diego County
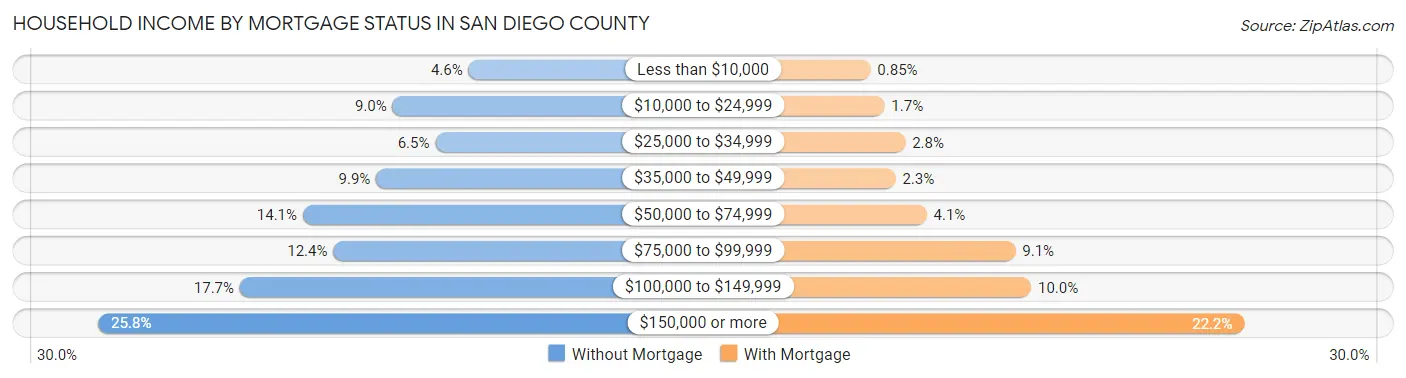
| Household Income | Without Mortgage | With Mortgage |
| Less than $10,000 | 8,596 (4.6%) | 3,735 (0.9%) |
| $10,000 to $24,999 | 16,632 (9.0%) | 7,244 (1.7%) |
| $25,000 to $34,999 | 12,113 (6.5%) | 12,428 (2.8%) |
| $35,000 to $49,999 | 18,377 (9.9%) | 9,962 (2.3%) |
| $50,000 to $74,999 | 26,158 (14.1%) | 17,786 (4.1%) |
| $75,000 to $99,999 | 22,938 (12.4%) | 39,968 (9.1%) |
| $100,000 to $149,999 | 32,832 (17.7%) | 43,929 (10.0%) |
| $150,000 or more | 47,866 (25.8%) | 97,255 (22.2%) |
| Total | 185,512 (100.0%) | 437,805 (100.0%) |
Property Value to Household Income Ratio in San Diego County
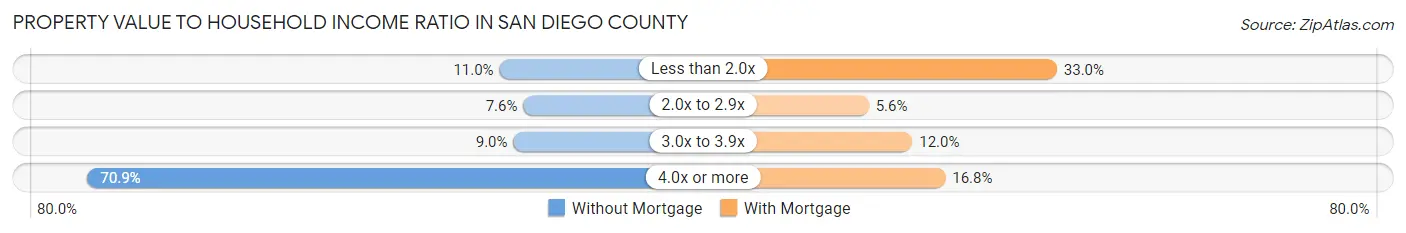
| Value-to-Income Ratio | Without Mortgage | With Mortgage |
| Less than 2.0x | 20,422 (11.0%) | 144,355 (33.0%) |
| 2.0x to 2.9x | 14,009 (7.5%) | 24,688 (5.6%) |
| 3.0x to 3.9x | 16,675 (9.0%) | 52,407 (12.0%) |
| 4.0x or more | 131,472 (70.9%) | 73,389 (16.8%) |
| Total | 185,512 (100.0%) | 437,805 (100.0%) |
Real Estate Taxes by Mortgage Status in San Diego County
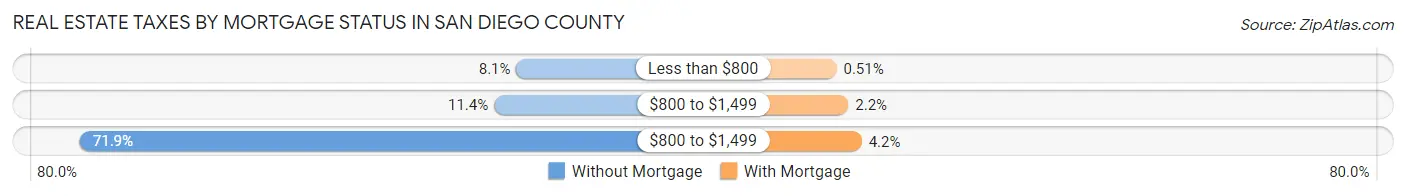
| Property Taxes | Without Mortgage | With Mortgage |
| Less than $800 | 15,099 (8.1%) | 2,252 (0.5%) |
| $800 to $1,499 | 21,148 (11.4%) | 9,797 (2.2%) |
| $800 to $1,499 | 133,424 (71.9%) | 18,357 (4.2%) |
| Total | 185,512 (100.0%) | 437,805 (100.0%) |
Health & Disability in San Diego County
Health Insurance Coverage by Age in San Diego County
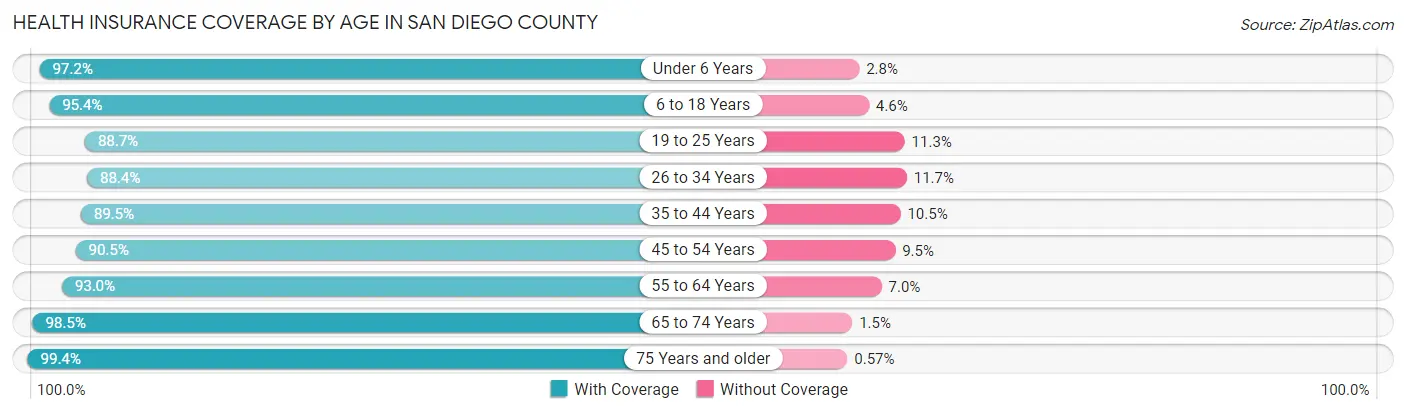
| Age Bracket | With Coverage | Without Coverage |
| Under 6 Years | 221,703 (97.2%) | 6,335 (2.8%) |
| 6 to 18 Years | 490,839 (95.4%) | 23,627 (4.6%) |
| 19 to 25 Years | 262,805 (88.7%) | 33,331 (11.3%) |
| 26 to 34 Years | 394,569 (88.3%) | 52,007 (11.7%) |
| 35 to 44 Years | 394,374 (89.5%) | 46,158 (10.5%) |
| 45 to 54 Years | 357,849 (90.5%) | 37,566 (9.5%) |
| 55 to 64 Years | 358,086 (93.0%) | 26,780 (7.0%) |
| 65 to 74 Years | 275,057 (98.5%) | 4,146 (1.5%) |
| 75 Years and older | 193,836 (99.4%) | 1,117 (0.6%) |
| Total | 2,949,118 (92.7%) | 231,067 (7.3%) |
Health Insurance Coverage by Citizenship Status in San Diego County
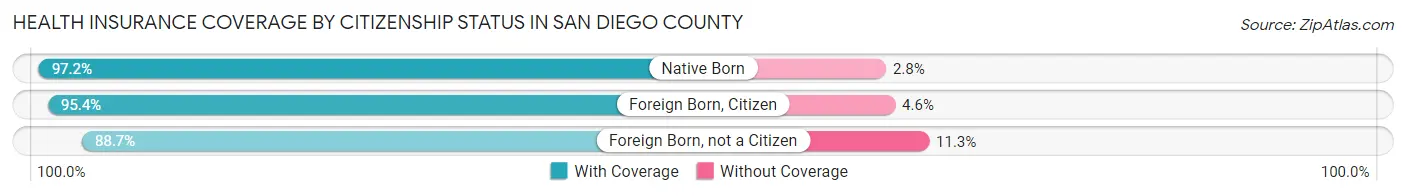
| Citizenship Status | With Coverage | Without Coverage |
| Native Born | 221,703 (97.2%) | 6,335 (2.8%) |
| Foreign Born, Citizen | 490,839 (95.4%) | 23,627 (4.6%) |
| Foreign Born, not a Citizen | 262,805 (88.7%) | 33,331 (11.3%) |
Health Insurance Coverage by Household Income in San Diego County
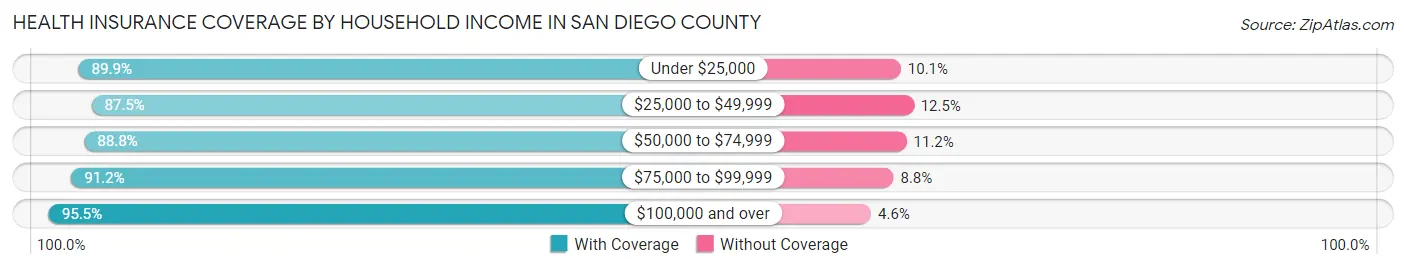
| Household Income | With Coverage | Without Coverage |
| Under $25,000 | 225,733 (89.9%) | 25,444 (10.1%) |
| $25,000 to $49,999 | 318,814 (87.5%) | 45,684 (12.5%) |
| $50,000 to $74,999 | 355,259 (88.8%) | 44,849 (11.2%) |
| $75,000 to $99,999 | 339,200 (91.2%) | 32,582 (8.8%) |
| $100,000 and over | 1,673,132 (95.5%) | 79,789 (4.5%) |
Public vs Private Health Insurance Coverage by Age in San Diego County
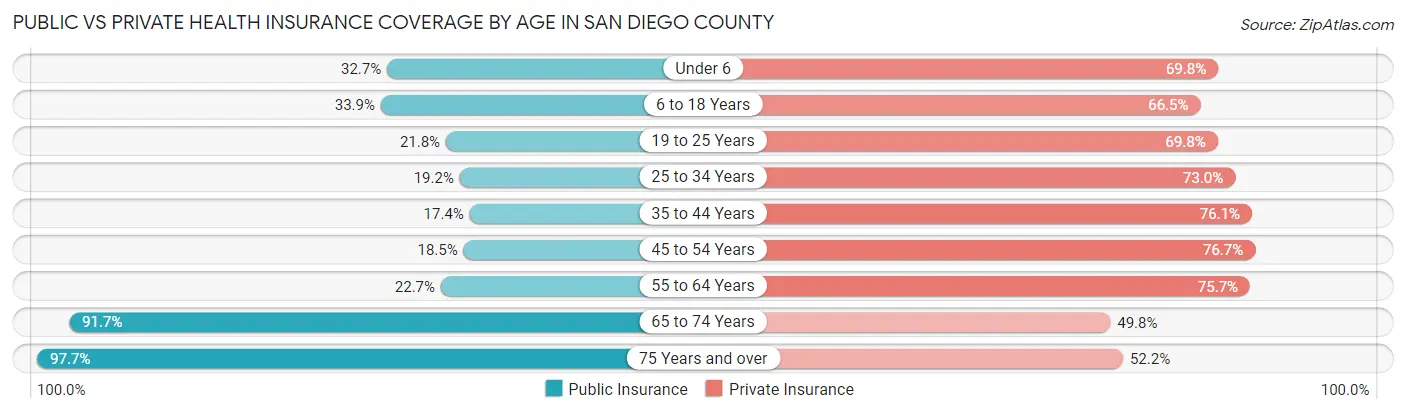
| Age Bracket | Public Insurance | Private Insurance |
| Under 6 | 74,612 (32.7%) | 159,205 (69.8%) |
| 6 to 18 Years | 174,284 (33.9%) | 342,252 (66.5%) |
| 19 to 25 Years | 64,531 (21.8%) | 206,591 (69.8%) |
| 25 to 34 Years | 85,872 (19.2%) | 326,004 (73.0%) |
| 35 to 44 Years | 76,597 (17.4%) | 335,314 (76.1%) |
| 45 to 54 Years | 73,254 (18.5%) | 303,303 (76.7%) |
| 55 to 64 Years | 87,501 (22.7%) | 291,495 (75.7%) |
| 65 to 74 Years | 256,112 (91.7%) | 139,142 (49.8%) |
| 75 Years and over | 190,403 (97.7%) | 101,745 (52.2%) |
| Total | 1,083,166 (34.1%) | 2,205,051 (69.3%) |
Disability Status by Sex by Age in San Diego County
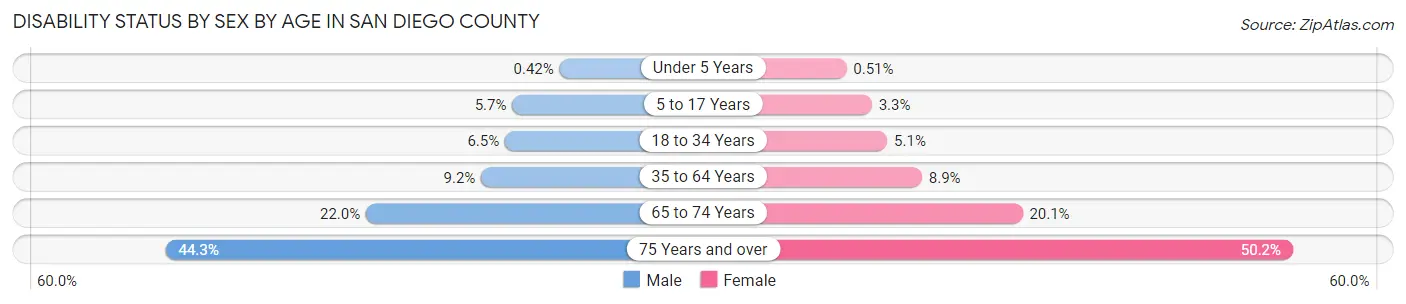
| Age Bracket | Male | Female |
| Under 5 Years | 412 (0.4%) | 477 (0.5%) |
| 5 to 17 Years | 14,731 (5.7%) | 8,225 (3.3%) |
| 18 to 34 Years | 25,786 (6.5%) | 19,798 (5.1%) |
| 35 to 64 Years | 55,953 (9.1%) | 54,315 (8.9%) |
| 65 to 74 Years | 28,946 (22.0%) | 29,662 (20.1%) |
| 75 Years and over | 35,980 (44.3%) | 57,133 (50.2%) |
Disability Class by Sex by Age in San Diego County
Disability Class: Hearing Difficulty
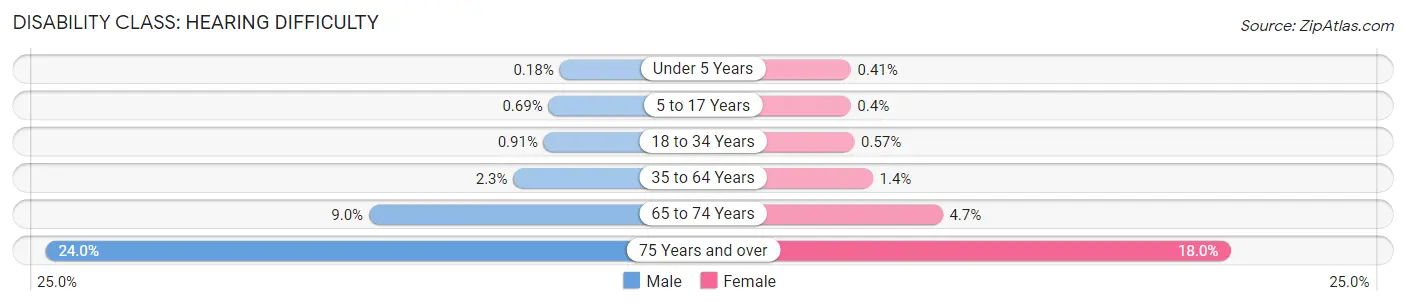
| Age Bracket | Male | Female |
| Under 5 Years | 176 (0.2%) | 386 (0.4%) |
| 5 to 17 Years | 1,790 (0.7%) | 989 (0.4%) |
| 18 to 34 Years | 3,625 (0.9%) | 2,221 (0.6%) |
| 35 to 64 Years | 14,197 (2.3%) | 8,726 (1.4%) |
| 65 to 74 Years | 11,888 (9.0%) | 6,891 (4.7%) |
| 75 Years and over | 19,516 (24.0%) | 20,498 (18.0%) |
Disability Class: Vision Difficulty
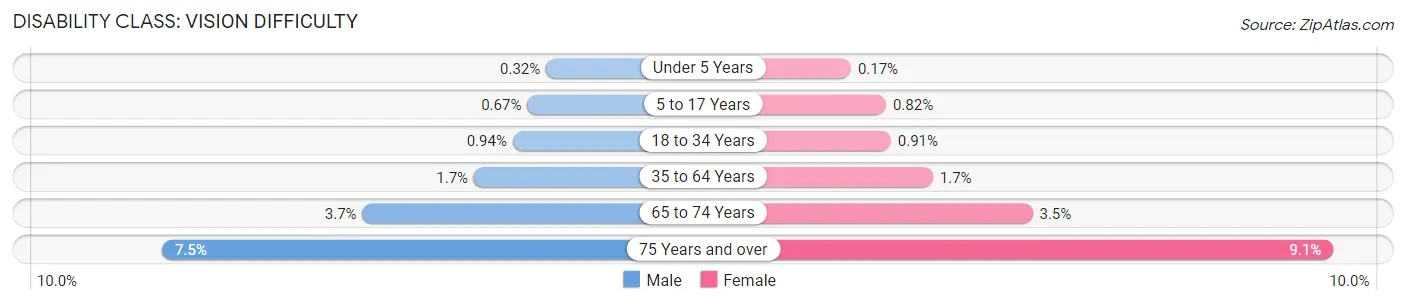
| Age Bracket | Male | Female |
| Under 5 Years | 310 (0.3%) | 154 (0.2%) |
| 5 to 17 Years | 1,729 (0.7%) | 2,033 (0.8%) |
| 18 to 34 Years | 3,720 (0.9%) | 3,558 (0.9%) |
| 35 to 64 Years | 10,163 (1.7%) | 10,316 (1.7%) |
| 65 to 74 Years | 4,917 (3.7%) | 5,213 (3.5%) |
| 75 Years and over | 6,047 (7.4%) | 10,368 (9.1%) |
Disability Class: Cognitive Difficulty
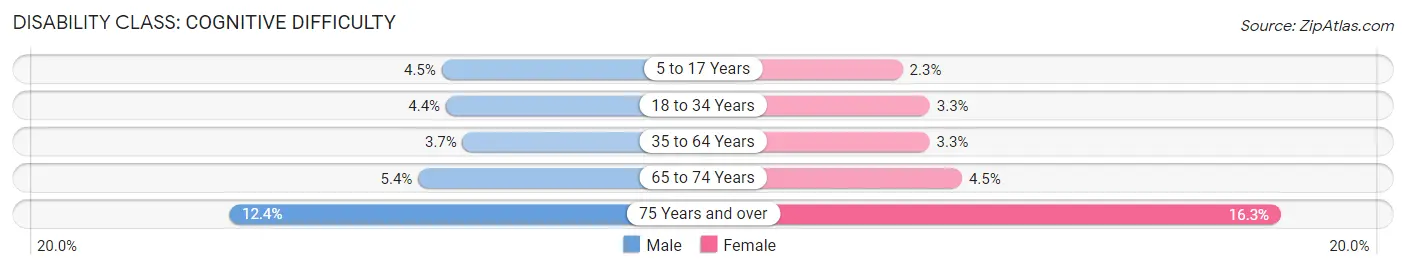
| Age Bracket | Male | Female |
| 5 to 17 Years | 11,695 (4.5%) | 5,572 (2.3%) |
| 18 to 34 Years | 17,317 (4.4%) | 12,803 (3.3%) |
| 35 to 64 Years | 22,861 (3.7%) | 19,853 (3.3%) |
| 65 to 74 Years | 7,107 (5.4%) | 6,571 (4.5%) |
| 75 Years and over | 10,083 (12.4%) | 18,539 (16.3%) |
Disability Class: Ambulatory Difficulty
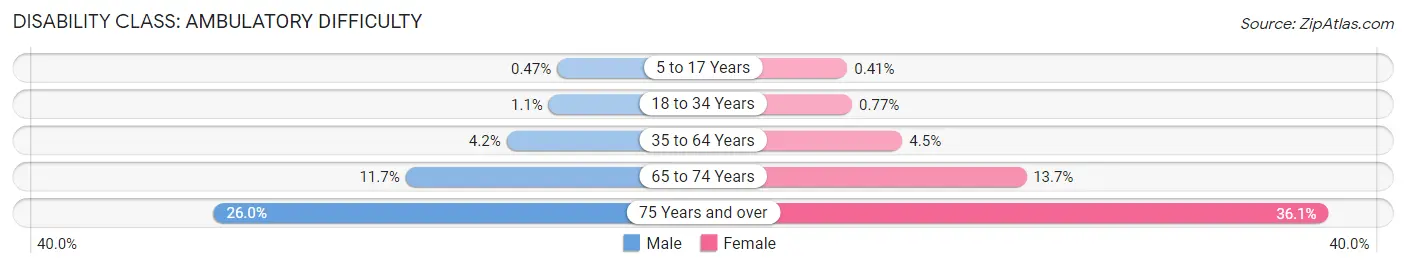
| Age Bracket | Male | Female |
| 5 to 17 Years | 1,218 (0.5%) | 1,019 (0.4%) |
| 18 to 34 Years | 4,330 (1.1%) | 3,008 (0.8%) |
| 35 to 64 Years | 25,827 (4.2%) | 27,393 (4.5%) |
| 65 to 74 Years | 15,447 (11.7%) | 20,180 (13.7%) |
| 75 Years and over | 21,096 (26.0%) | 41,088 (36.1%) |
Disability Class: Self-Care Difficulty
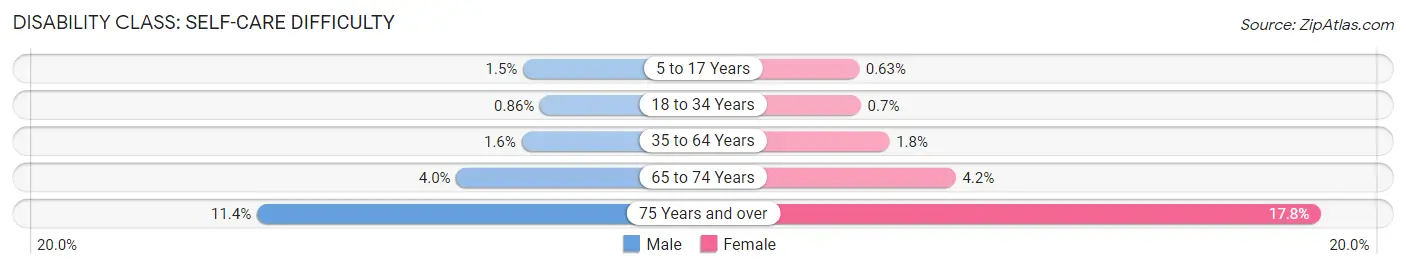
| Age Bracket | Male | Female |
| 5 to 17 Years | 3,862 (1.5%) | 1,548 (0.6%) |
| 18 to 34 Years | 3,418 (0.9%) | 2,740 (0.7%) |
| 35 to 64 Years | 9,452 (1.5%) | 10,703 (1.8%) |
| 65 to 74 Years | 5,233 (4.0%) | 6,215 (4.2%) |
| 75 Years and over | 9,231 (11.4%) | 20,236 (17.8%) |
Technology Access in San Diego County
Computing Device Access in San Diego County
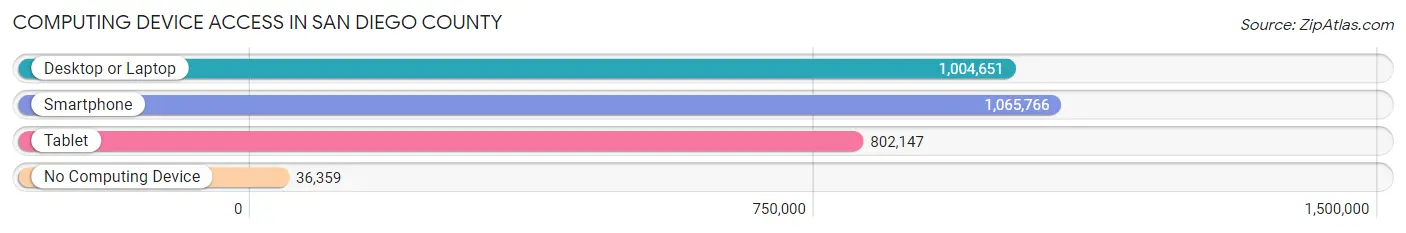
| Device Type | # Households | % Households |
| Desktop or Laptop | 1,004,651 | 87.4% |
| Smartphone | 1,065,766 | 92.7% |
| Tablet | 802,147 | 69.8% |
| No Computing Device | 36,359 | 3.2% |
| Total | 1,149,157 | 100.0% |
Internet Access in San Diego County
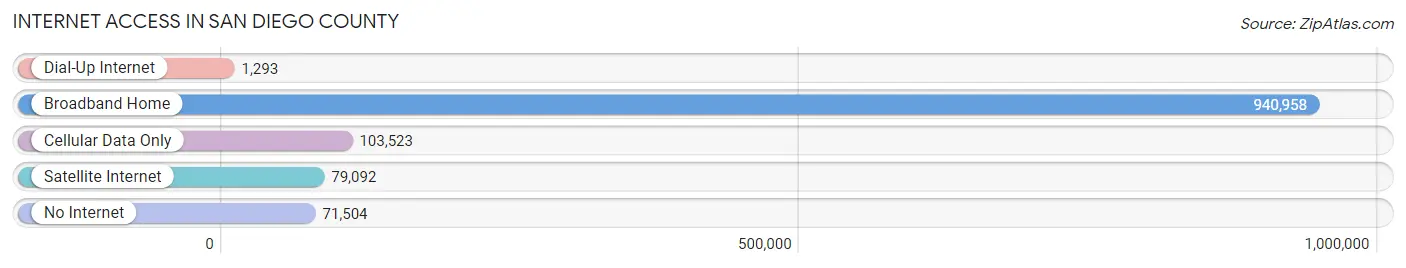
| Internet Type | # Households | % Households |
| Dial-Up Internet | 1,293 | 0.1% |
| Broadband Home | 940,958 | 81.9% |
| Cellular Data Only | 103,523 | 9.0% |
| Satellite Internet | 79,092 | 6.9% |
| No Internet | 71,504 | 6.2% |
| Total | 1,149,157 | 100.0% |
San Diego County Summary
San Diego County is located in the southwestern corner of California, bordered by Mexico to the south and the Pacific Ocean to the west. It is the second-most populous county in California, with a population of 3,095,313 as of the 2019 census. The county seat is San Diego, the eighth-largest city in the United States. San Diego County is home to a diverse population, with a mix of cultures, languages, and religions.
Geography
San Diego County covers an area of 4,526 square miles, making it the fifth-largest county in California. It is located on the Pacific Coast, with the Pacific Ocean to the west and Mexico to the south. The county is divided into 18 incorporated cities and numerous unincorporated communities. The county is home to a variety of landscapes, including mountains, deserts, and beaches. The highest point in the county is Cuyamaca Peak, at 6,512 feet.
The climate of San Diego County is generally mild, with temperatures ranging from the mid-50s to the mid-70s throughout the year. The county receives an average of 10 inches of rain per year, with most of the rain falling in the winter months.
Economy
San Diego County has a diverse economy, with a mix of industries including tourism, defense, technology, and agriculture. The county is home to several major military bases, including Marine Corps Air Station Miramar, Naval Base San Diego, and Naval Base Coronado. The defense industry is a major employer in the county, with more than 100,000 military personnel and civilian employees.
The tourism industry is also a major contributor to the economy, with more than 32 million visitors to the county each year. San Diego is home to several popular attractions, including SeaWorld, the San Diego Zoo, and Balboa Park.
The technology industry is also a major employer in the county, with several major companies, including Qualcomm, Intuit, and Sony Electronics, based in San Diego. The county is also home to several universities and research institutions, including the University of California, San Diego, San Diego State University, and the Scripps Research Institute.
Demographics
As of the 2019 census, San Diego County had a population of 3,095,313. The population is racially and ethnically diverse, with a mix of races and ethnicities. The largest racial group is White, at 44.3%, followed by Hispanic or Latino, at 33.2%. Other racial groups include Asian (13.2%), African American (5.2%), and Native American (1.2%).
The median household income in San Diego County is $77,890, and the median home value is $619,400. The county has a high rate of homeownership, with more than 60% of households owning their own homes.
San Diego County is home to a variety of religions, with the largest religious group being Christianity, at 44.3%. Other religious groups include Judaism (7.2%), Islam (2.2%), and Buddhism (1.2%).
Conclusion
San Diego County is a diverse and vibrant region of California, with a mix of cultures, languages, and religions. The county has a diverse economy, with a mix of industries including tourism, defense, technology, and agriculture. The population is racially and ethnically diverse, with a mix of races and ethnicities. San Diego County is a great place to live, work, and visit.
Common Questions
What is Per Capita Income in San Diego County?
Per Capita income in San Diego County is $46,957.
What is the Median Family Income in San Diego County?
Median Family Income in San Diego County is $111,734.
What is the Median Household income in San Diego County?
Median Household Income in San Diego County is $96,974.
What is Income or Wage Gap in San Diego County?
Income or Wage Gap in San Diego County is 26.1%.
Women in San Diego County earn 73.9 cents for every dollar earned by a man.
What is Family Income Deficit in San Diego County?
Family Income Deficit in San Diego County is $11,123.
Families that are below poverty line in San Diego County earn $11,123 less on average than the poverty threshold level.
What is Inequality or Gini Index in San Diego County?
Inequality or Gini Index in San Diego County is 0.46.
What is the Total Population of San Diego County?
Total Population of San Diego County is 3,289,701.
What is the Total Male Population of San Diego County?
Total Male Population of San Diego County is 1,667,851.
What is the Total Female Population of San Diego County?
Total Female Population of San Diego County is 1,621,850.
What is the Ratio of Males per 100 Females in San Diego County?
There are 102.84 Males per 100 Females in San Diego County.
What is the Ratio of Females per 100 Males in San Diego County?
There are 97.24 Females per 100 Males in San Diego County.
What is the Median Population Age in San Diego County?
Median Population Age in San Diego County is 36.7 Years.
What is the Average Family Size in San Diego County
Average Family Size in San Diego County is 3.3 People.
What is the Average Household Size in San Diego County
Average Household Size in San Diego County is 2.8 People.
How Large is the Labor Force in San Diego County?
There are 1,766,964 People in the Labor Forcein in San Diego County.
What is the Percentage of People in the Labor Force in San Diego County?
66.2% of People are in the Labor Force in San Diego County.
What is the Unemployment Rate in San Diego County?
Unemployment Rate in San Diego County is 6.3%.