San Bernardino County, CA Map & Demographics
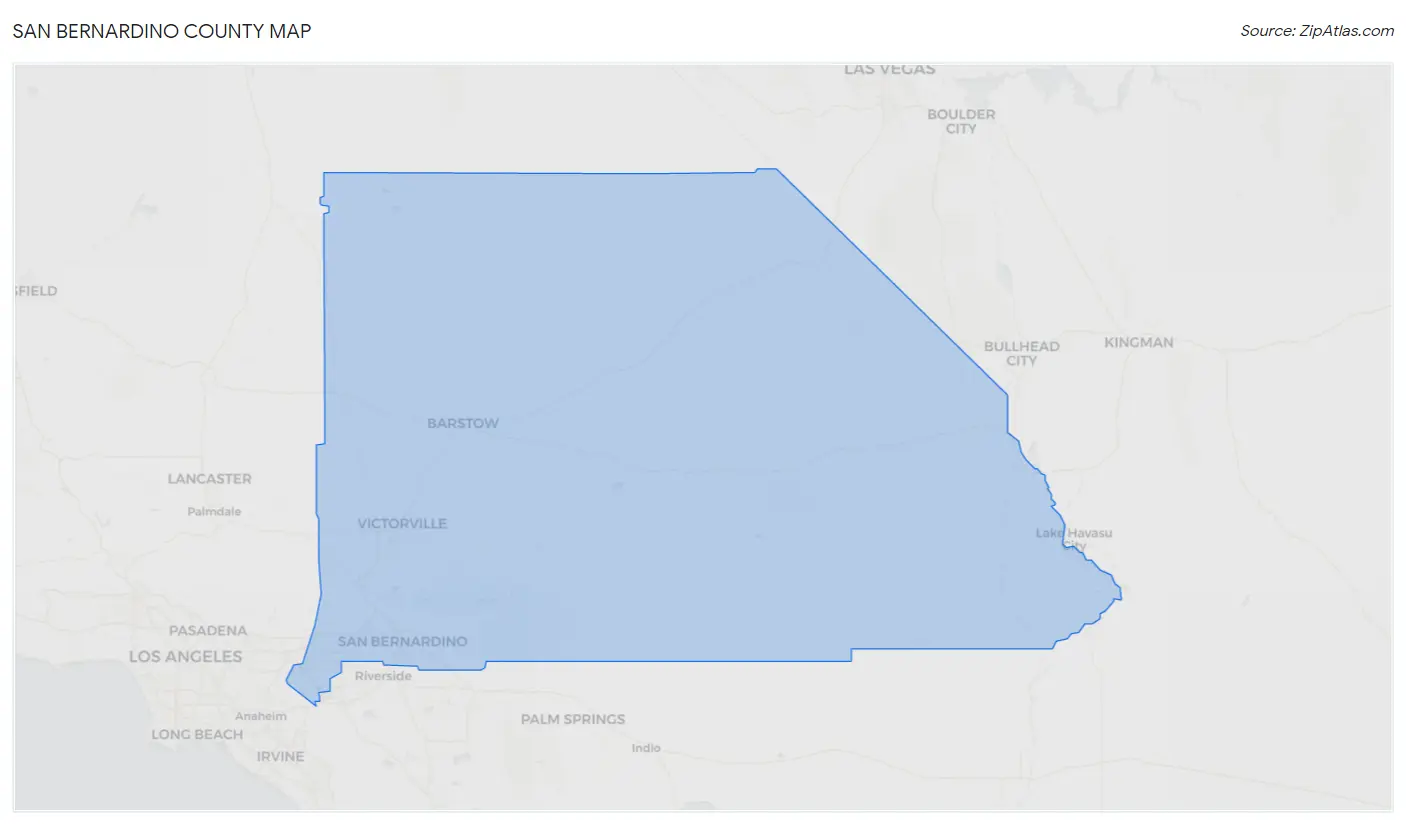
San Bernardino County Map
San Bernardino County Overview
$31,348
PER CAPITA INCOME
$85,528
AVG FAMILY INCOME
$77,423
AVG HOUSEHOLD INCOME
26.0%
WAGE / INCOME GAP [ % ]
74.0¢/ $1
WAGE / INCOME GAP [ $ ]
$11,861
FAMILY INCOME DEFICIT
0.44
INEQUALITY / GINI INDEX
2,180,563
TOTAL POPULATION
1,094,825
MALE POPULATION
1,085,738
FEMALE POPULATION
100.84
MALES / 100 FEMALES
99.17
FEMALES / 100 MALES
33.9
MEDIAN AGE
3.7
AVG FAMILY SIZE
3.2
AVG HOUSEHOLD SIZE
1,044,064
LABOR FORCE [ PEOPLE ]
62.1%
PERCENT IN LABOR FORCE
7.2%
UNEMPLOYMENT RATE
Income in San Bernardino County
Income Overview in San Bernardino County
Per Capita Income in San Bernardino County is $31,348, while median incomes of families and households are $85,528 and $77,423 respectively.
| Characteristic | Number | Measure |
| Per Capita Income | 2,180,563 | $31,348 |
| Median Family Income | 503,057 | $85,528 |
| Mean Family Income | 503,057 | $107,756 |
| Median Household Income | 659,928 | $77,423 |
| Mean Household Income | 659,928 | $100,078 |
| Income Deficit | 503,057 | $11,861 |
| Wage / Income Gap (%) | 2,180,563 | 26.01% |
| Wage / Income Gap ($) | 2,180,563 | 73.99¢ per $1 |
| Gini / Inequality Index | 2,180,563 | 0.44 |
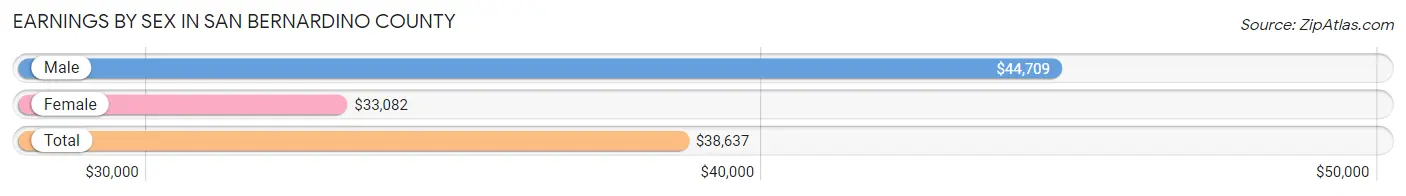
Earnings by Sex in San Bernardino County
Average Earnings in San Bernardino County are $38,637, $44,709 for men and $33,082 for women, a difference of 26.0%.
| Sex | Number | Average Earnings |
| Male | 582,894 (55.1%) | $44,709 |
| Female | 475,436 (44.9%) | $33,082 |
| Total | 1,058,330 (100.0%) | $38,637 |
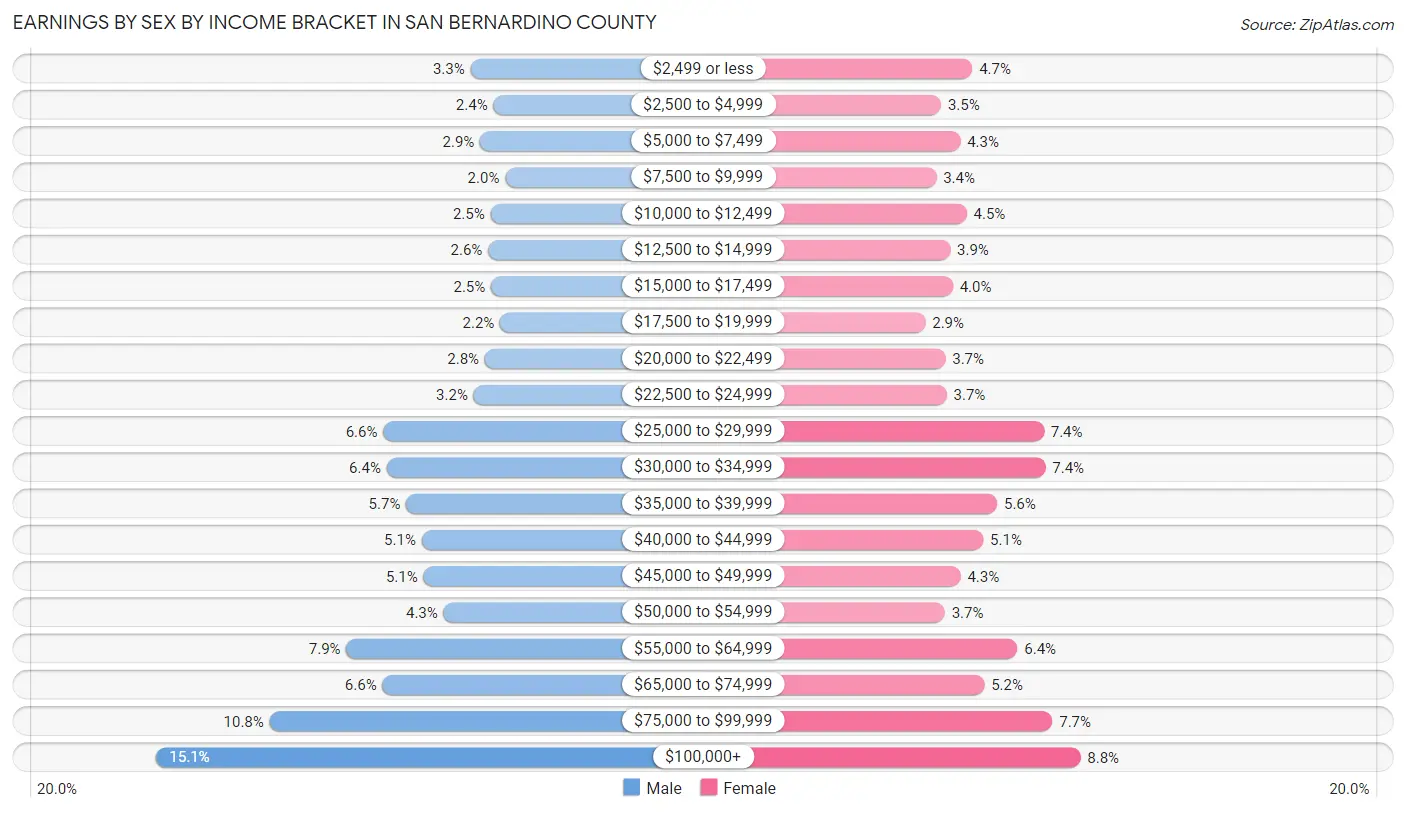
Earnings by Sex by Income Bracket in San Bernardino County
The most common earnings brackets in San Bernardino County are $100,000+ for men (87,780 | 15.1%) and $100,000+ for women (41,596 | 8.7%).
| Income | Male | Female |
| $2,499 or less | 19,189 (3.3%) | 22,337 (4.7%) |
| $2,500 to $4,999 | 14,144 (2.4%) | 16,773 (3.5%) |
| $5,000 to $7,499 | 17,078 (2.9%) | 20,216 (4.3%) |
| $7,500 to $9,999 | 11,592 (2.0%) | 15,916 (3.4%) |
| $10,000 to $12,499 | 14,792 (2.5%) | 21,342 (4.5%) |
| $12,500 to $14,999 | 15,304 (2.6%) | 18,378 (3.9%) |
| $15,000 to $17,499 | 14,694 (2.5%) | 18,877 (4.0%) |
| $17,500 to $19,999 | 12,729 (2.2%) | 13,993 (2.9%) |
| $20,000 to $22,499 | 16,054 (2.8%) | 17,527 (3.7%) |
| $22,500 to $24,999 | 18,497 (3.2%) | 17,784 (3.7%) |
| $25,000 to $29,999 | 38,214 (6.6%) | 35,090 (7.4%) |
| $30,000 to $34,999 | 37,480 (6.4%) | 35,371 (7.4%) |
| $35,000 to $39,999 | 33,216 (5.7%) | 26,784 (5.6%) |
| $40,000 to $44,999 | 29,849 (5.1%) | 24,290 (5.1%) |
| $45,000 to $49,999 | 29,455 (5.1%) | 20,265 (4.3%) |
| $50,000 to $54,999 | 25,050 (4.3%) | 17,441 (3.7%) |
| $55,000 to $64,999 | 46,296 (7.9%) | 30,395 (6.4%) |
| $65,000 to $74,999 | 38,393 (6.6%) | 24,463 (5.1%) |
| $75,000 to $99,999 | 63,088 (10.8%) | 36,598 (7.7%) |
| $100,000+ | 87,780 (15.1%) | 41,596 (8.7%) |
| Total | 582,894 (100.0%) | 475,436 (100.0%) |
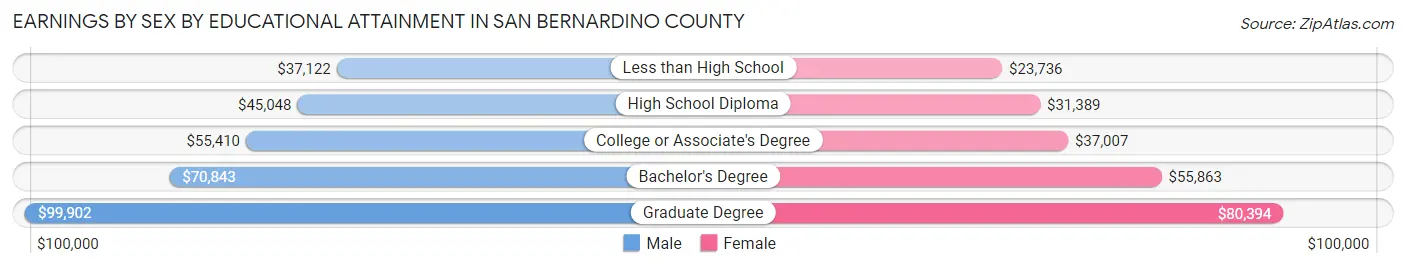
Earnings by Sex by Educational Attainment in San Bernardino County
Average earnings in San Bernardino County are $51,491 for men and $37,861 for women, a difference of 26.5%. Men with an educational attainment of graduate degree enjoy the highest average annual earnings of $99,902, while those with less than high school education earn the least with $37,122. Women with an educational attainment of graduate degree earn the most with the average annual earnings of $80,394, while those with less than high school education have the smallest earnings of $23,736.
| Educational Attainment | Male Income | Female Income |
| Less than High School | $37,122 | $23,736 |
| High School Diploma | $45,048 | $31,389 |
| College or Associate's Degree | $55,410 | $37,007 |
| Bachelor's Degree | $70,843 | $55,863 |
| Graduate Degree | $99,902 | $80,394 |
| Total | $51,491 | $37,861 |
Family Income in San Bernardino County
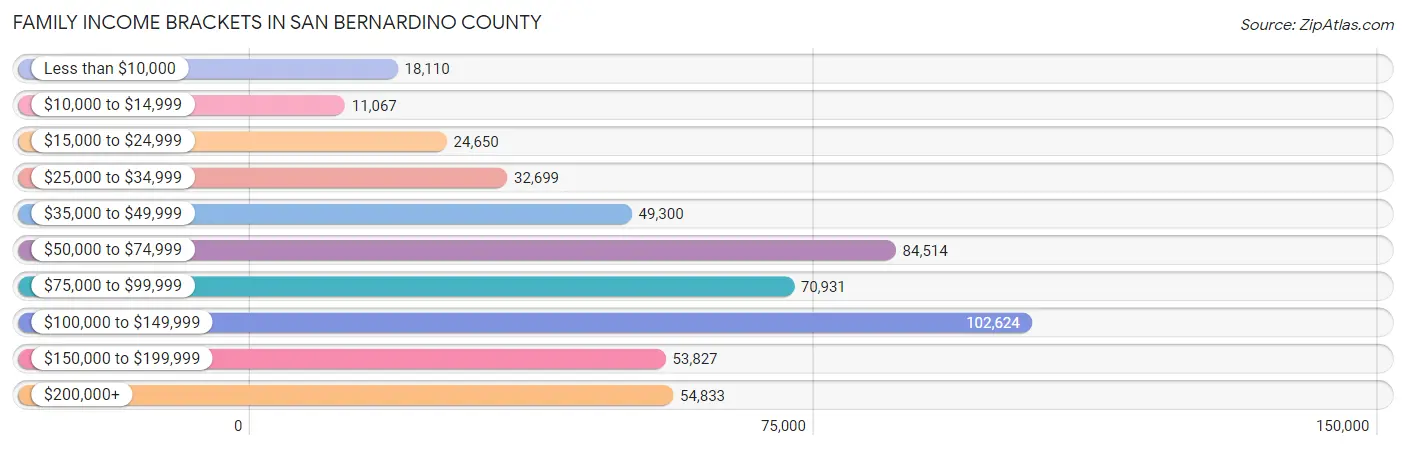
Family Income Brackets in San Bernardino County
According to the San Bernardino County family income data, there are 102,624 families falling into the $100,000 to $149,999 income range, which is the most common income bracket and makes up 20.4% of all families. Conversely, the $10,000 to $14,999 income bracket is the least frequent group with only 11,067 families (2.2%) belonging to this category.
| Income Bracket | # Families | % Families |
| Less than $10,000 | 18,110 | 3.6% |
| $10,000 to $14,999 | 11,067 | 2.2% |
| $15,000 to $24,999 | 24,650 | 4.9% |
| $25,000 to $34,999 | 32,699 | 6.5% |
| $35,000 to $49,999 | 49,300 | 9.8% |
| $50,000 to $74,999 | 84,514 | 16.8% |
| $75,000 to $99,999 | 70,931 | 14.1% |
| $100,000 to $149,999 | 102,624 | 20.4% |
| $150,000 to $199,999 | 53,827 | 10.7% |
| $200,000+ | 54,833 | 10.9% |
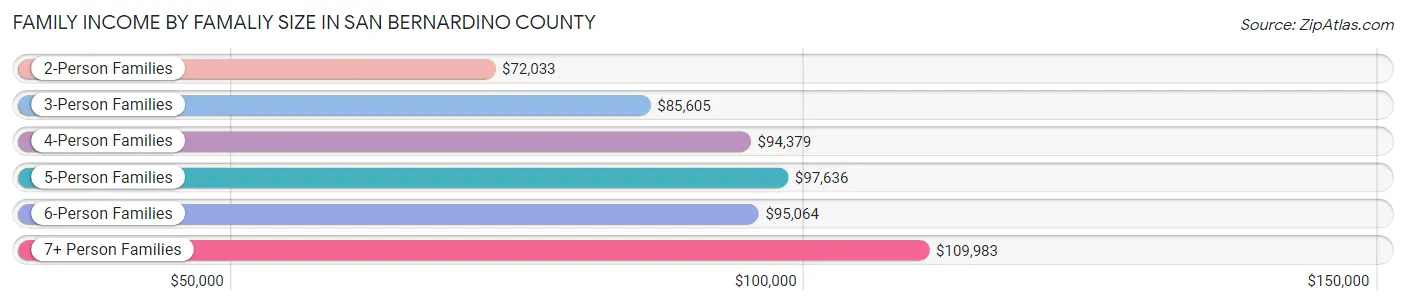
Family Income by Famaliy Size in San Bernardino County
7+ person families (21,322 | 4.2%) account for the highest median family income in San Bernardino County with $109,983 per family, while 2-person families (168,538 | 33.5%) have the highest median income of $36,016 per family member.
| Income Bracket | # Families | Median Income |
| 2-Person Families | 168,538 (33.5%) | $72,033 |
| 3-Person Families | 112,483 (22.4%) | $85,605 |
| 4-Person Families | 108,457 (21.6%) | $94,379 |
| 5-Person Families | 62,236 (12.4%) | $97,636 |
| 6-Person Families | 30,021 (6.0%) | $95,064 |
| 7+ Person Families | 21,322 (4.2%) | $109,983 |
| Total | 503,057 (100.0%) | $85,528 |
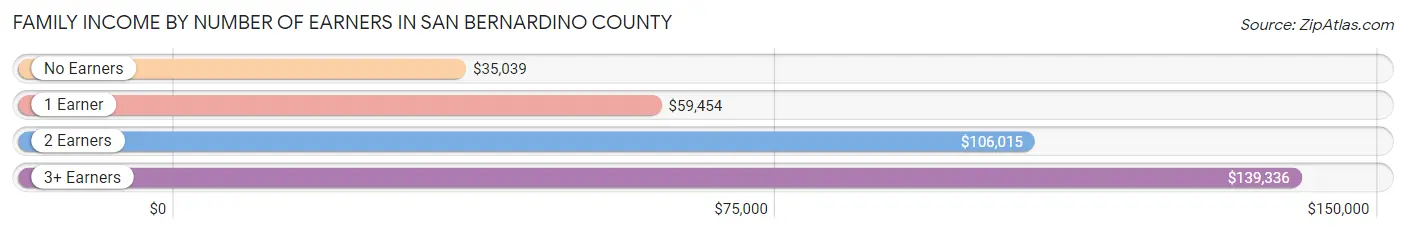
Family Income by Number of Earners in San Bernardino County
The median family income in San Bernardino County is $85,528, with families comprising 3+ earners (87,371) having the highest median family income of $139,336, while families with no earners (64,197) have the lowest median family income of $35,039, accounting for 17.4% and 12.8% of families, respectively.
| Number of Earners | # Families | Median Income |
| No Earners | 64,197 (12.8%) | $35,039 |
| 1 Earner | 167,060 (33.2%) | $59,454 |
| 2 Earners | 184,429 (36.7%) | $106,015 |
| 3+ Earners | 87,371 (17.4%) | $139,336 |
| Total | 503,057 (100.0%) | $85,528 |
Household Income in San Bernardino County
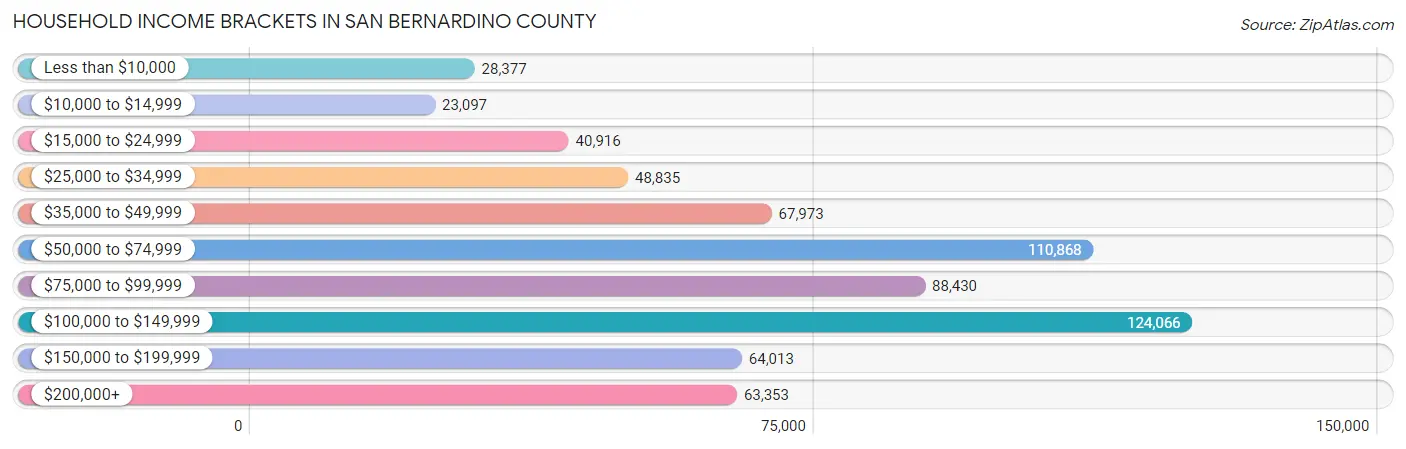
Household Income Brackets in San Bernardino County
With 124,066 households falling in the category, the $100,000 to $149,999 income range is the most frequent in San Bernardino County, accounting for 18.8% of all households. In contrast, only 23,097 households (3.5%) fall into the $10,000 to $14,999 income bracket, making it the least populous group.
| Income Bracket | # Households | % Households |
| Less than $10,000 | 28,377 | 4.3% |
| $10,000 to $14,999 | 23,097 | 3.5% |
| $15,000 to $24,999 | 40,916 | 6.2% |
| $25,000 to $34,999 | 48,835 | 7.4% |
| $35,000 to $49,999 | 67,973 | 10.3% |
| $50,000 to $74,999 | 110,868 | 16.8% |
| $75,000 to $99,999 | 88,430 | 13.4% |
| $100,000 to $149,999 | 124,066 | 18.8% |
| $150,000 to $199,999 | 64,013 | 9.7% |
| $200,000+ | 63,353 | 9.6% |
Household Income by Householder Age in San Bernardino County
The median household income in San Bernardino County is $77,423, with the highest median household income of $91,708 found in the 45 to 64 years age bracket for the primary householder. A total of 258,484 households (39.2%) fall into this category. Meanwhile, the 15 to 24 years age bracket for the primary householder has the lowest median household income of $46,002, with 18,381 households (2.8%) in this group.
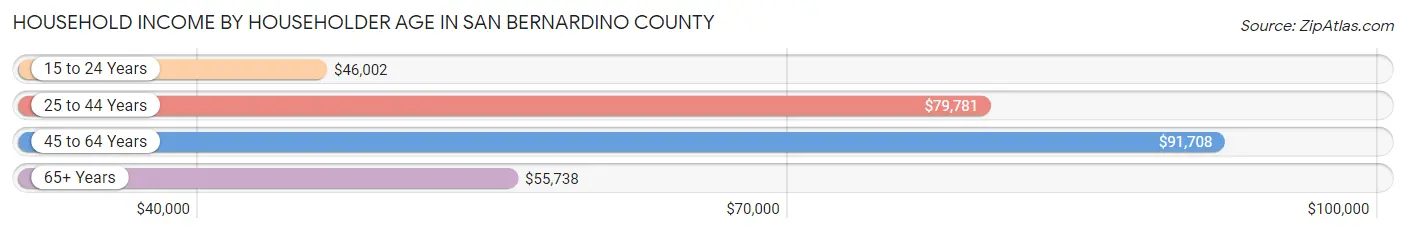
| Income Bracket | # Households | Median Income |
| 15 to 24 Years | 18,381 (2.8%) | $46,002 |
| 25 to 44 Years | 240,969 (36.5%) | $79,781 |
| 45 to 64 Years | 258,484 (39.2%) | $91,708 |
| 65+ Years | 142,094 (21.5%) | $55,738 |
| Total | 659,928 (100.0%) | $77,423 |
Poverty in San Bernardino County
Income Below Poverty by Sex and Age in San Bernardino County
With 12.5% poverty level for males and 15.1% for females among the residents of San Bernardino County, under 5 year old males and under 5 year old females are the most vulnerable to poverty, with 13,859 males (19.1%) and 13,459 females (19.5%) in their respective age groups living below the poverty level.
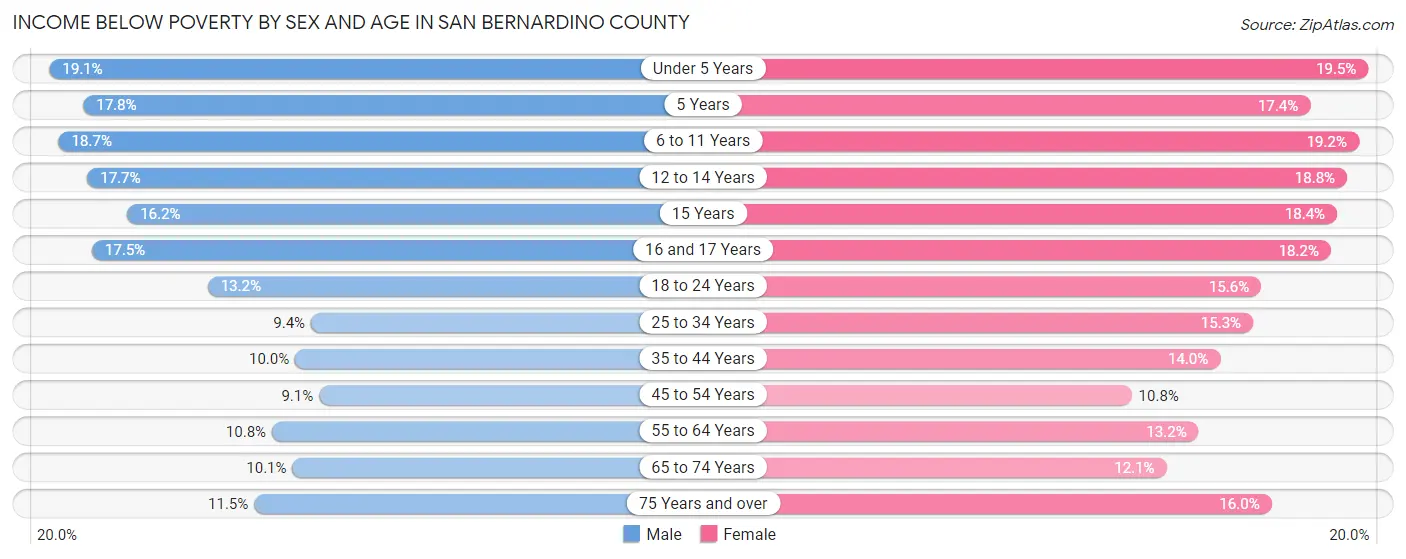
| Age Bracket | Male | Female |
| Under 5 Years | 13,859 (19.1%) | 13,459 (19.5%) |
| 5 Years | 2,484 (17.8%) | 2,596 (17.4%) |
| 6 to 11 Years | 17,788 (18.7%) | 17,630 (19.2%) |
| 12 to 14 Years | 9,125 (17.7%) | 8,820 (18.8%) |
| 15 Years | 2,712 (16.2%) | 3,007 (18.4%) |
| 16 and 17 Years | 5,916 (17.5%) | 5,704 (18.1%) |
| 18 to 24 Years | 14,781 (13.2%) | 16,352 (15.6%) |
| 25 to 34 Years | 15,456 (9.4%) | 24,482 (15.3%) |
| 35 to 44 Years | 14,174 (10.0%) | 19,863 (14.0%) |
| 45 to 54 Years | 11,595 (9.1%) | 14,044 (10.8%) |
| 55 to 64 Years | 12,698 (10.8%) | 16,443 (13.2%) |
| 65 to 74 Years | 7,503 (10.1%) | 10,156 (12.0%) |
| 75 Years and over | 4,632 (11.5%) | 8,967 (16.0%) |
| Total | 132,723 (12.5%) | 161,523 (15.1%) |
Income Above Poverty by Sex and Age in San Bernardino County
According to the poverty statistics in San Bernardino County, males aged 45 to 54 years and females aged 45 to 54 years are the age groups that are most secure financially, with 90.9% of males and 89.2% of females in these age groups living above the poverty line.
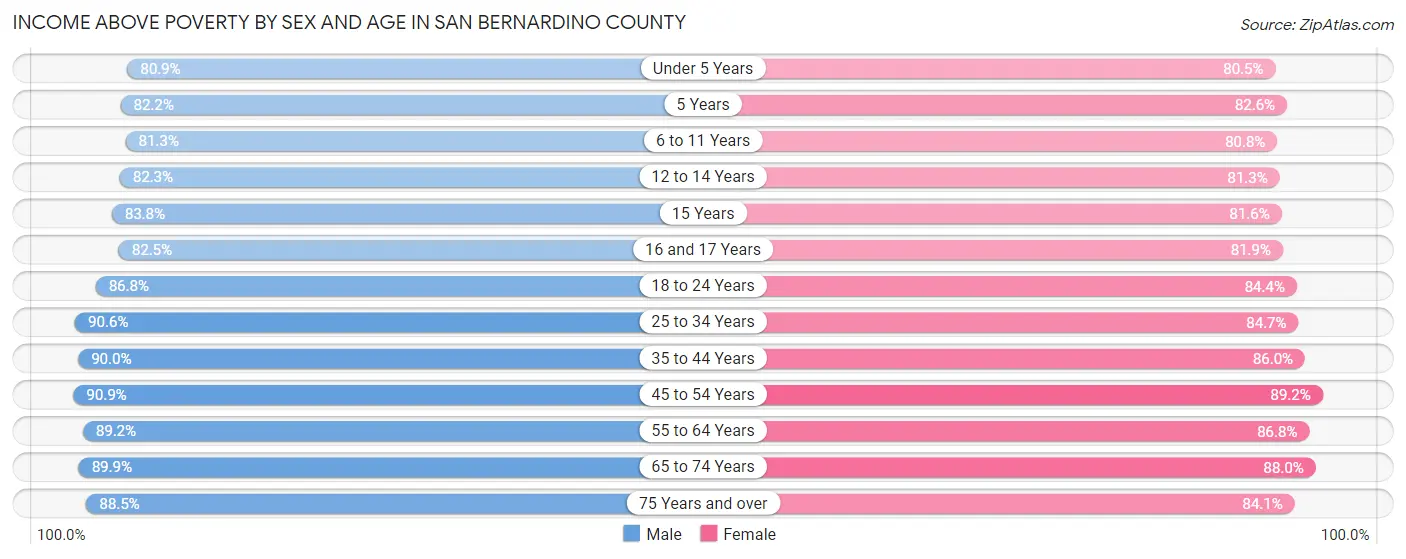
| Age Bracket | Male | Female |
| Under 5 Years | 58,765 (80.9%) | 55,436 (80.5%) |
| 5 Years | 11,457 (82.2%) | 12,339 (82.6%) |
| 6 to 11 Years | 77,119 (81.3%) | 74,248 (80.8%) |
| 12 to 14 Years | 42,519 (82.3%) | 38,224 (81.2%) |
| 15 Years | 14,044 (83.8%) | 13,354 (81.6%) |
| 16 and 17 Years | 27,884 (82.5%) | 25,718 (81.9%) |
| 18 to 24 Years | 97,224 (86.8%) | 88,767 (84.4%) |
| 25 to 34 Years | 149,502 (90.6%) | 135,936 (84.7%) |
| 35 to 44 Years | 128,118 (90.0%) | 121,658 (86.0%) |
| 45 to 54 Years | 116,219 (90.9%) | 116,431 (89.2%) |
| 55 to 64 Years | 104,689 (89.2%) | 107,717 (86.8%) |
| 65 to 74 Years | 67,075 (89.9%) | 74,142 (87.9%) |
| 75 Years and over | 35,702 (88.5%) | 47,252 (84.1%) |
| Total | 930,317 (87.5%) | 911,222 (84.9%) |
Income Below Poverty Among Married-Couple Families in San Bernardino County
The poverty statistics for married-couple families in San Bernardino County show that 6.5% or 22,407 of the total 343,271 families live below the poverty line. Families with 5 or more children have the highest poverty rate of 26.8%, comprising of 1,124 families. On the other hand, families with no children have the lowest poverty rate of 4.7%, which includes 8,099 families.
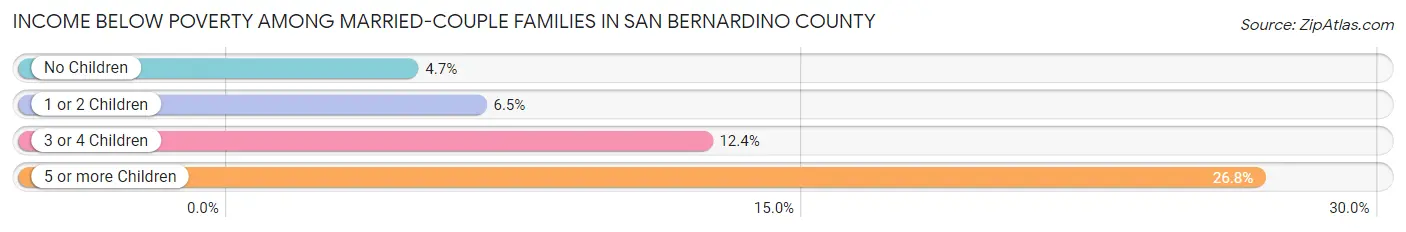
| Children | Above Poverty | Below Poverty |
| No Children | 163,819 (95.3%) | 8,099 (4.7%) |
| 1 or 2 Children | 119,355 (93.5%) | 8,288 (6.5%) |
| 3 or 4 Children | 34,623 (87.6%) | 4,896 (12.4%) |
| 5 or more Children | 3,067 (73.2%) | 1,124 (26.8%) |
| Total | 320,864 (93.5%) | 22,407 (6.5%) |
Income Below Poverty Among Single-Parent Households in San Bernardino County
According to the poverty data in San Bernardino County, 12.3% or 6,473 single-father households and 24.0% or 25,690 single-mother households are living below the poverty line. Among single-father households, those with 5 or more children have the highest poverty rate, with 130 households (24.2%) experiencing poverty. Likewise, among single-mother households, those with 5 or more children have the highest poverty rate, with 1,149 households (67.0%) falling below the poverty line.
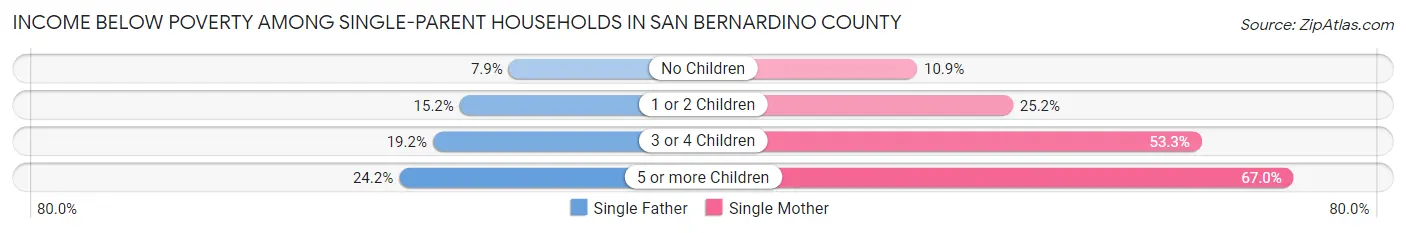
| Children | Single Father | Single Mother |
| No Children | 1,907 (7.9%) | 4,676 (10.9%) |
| 1 or 2 Children | 3,501 (15.2%) | 12,153 (25.2%) |
| 3 or 4 Children | 935 (19.2%) | 7,712 (53.3%) |
| 5 or more Children | 130 (24.2%) | 1,149 (67.0%) |
| Total | 6,473 (12.3%) | 25,690 (24.0%) |
Income Below Poverty Among Married-Couple vs Single-Parent Households in San Bernardino County
The poverty data for San Bernardino County shows that 22,407 of the married-couple family households (6.5%) and 32,163 of the single-parent households (20.1%) are living below the poverty level. Within the married-couple family households, those with 5 or more children have the highest poverty rate, with 1,124 households (26.8%) falling below the poverty line. Among the single-parent households, those with 5 or more children have the highest poverty rate, with 1,279 household (56.8%) living below poverty.
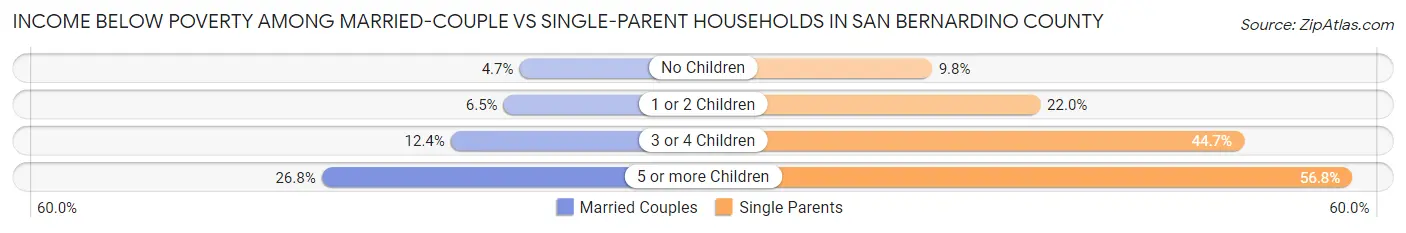
| Children | Married-Couple Families | Single-Parent Households |
| No Children | 8,099 (4.7%) | 6,583 (9.8%) |
| 1 or 2 Children | 8,288 (6.5%) | 15,654 (22.0%) |
| 3 or 4 Children | 4,896 (12.4%) | 8,647 (44.7%) |
| 5 or more Children | 1,124 (26.8%) | 1,279 (56.8%) |
| Total | 22,407 (6.5%) | 32,163 (20.1%) |
Race in San Bernardino County
The most populous races in San Bernardino County are Hispanic or Latino (1,200,147 | 55.0%), White / Caucasian (975,461 | 44.7%), and Some other Race (484,024 | 22.2%).
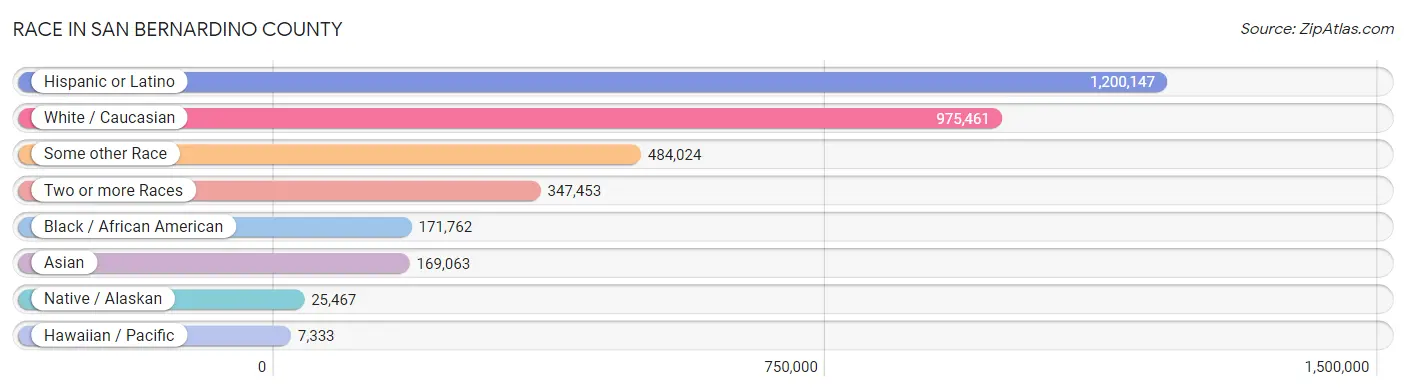
| Race | # Population | % Population |
| Asian | 169,063 | 7.7% |
| Black / African American | 171,762 | 7.9% |
| Hawaiian / Pacific | 7,333 | 0.3% |
| Hispanic or Latino | 1,200,147 | 55.0% |
| Native / Alaskan | 25,467 | 1.2% |
| White / Caucasian | 975,461 | 44.7% |
| Two or more Races | 347,453 | 15.9% |
| Some other Race | 484,024 | 22.2% |
| Total | 2,180,563 | 100.0% |
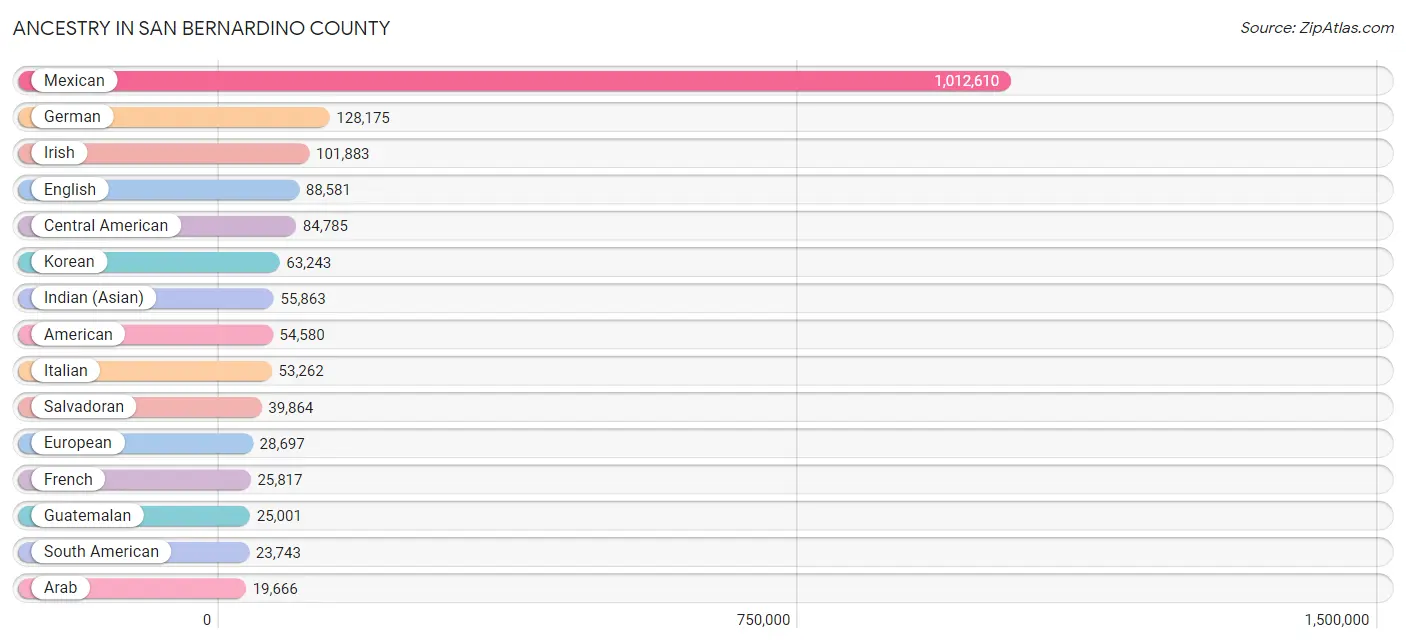
Ancestry in San Bernardino County
The most populous ancestries reported in San Bernardino County are Mexican (1,012,610 | 46.4%), German (128,175 | 5.9%), Irish (101,883 | 4.7%), English (88,581 | 4.1%), and Central American (84,785 | 3.9%), together accounting for 64.9% of all San Bernardino County residents.
| Ancestry | # Population | % Population |
| Afghan | 978 | 0.0% |
| African | 11,058 | 0.5% |
| Alaska Native | 20 | 0.0% |
| Alaskan Athabascan | 33 | 0.0% |
| Albanian | 70 | 0.0% |
| Aleut | 64 | 0.0% |
| Alsatian | 11 | 0.0% |
| American | 54,580 | 2.5% |
| Apache | 2,132 | 0.1% |
| Arab | 19,666 | 0.9% |
| Arapaho | 81 | 0.0% |
| Argentinean | 4,354 | 0.2% |
| Armenian | 3,227 | 0.2% |
| Assyrian / Chaldean / Syriac | 155 | 0.0% |
| Australian | 513 | 0.0% |
| Austrian | 1,747 | 0.1% |
| Bahamian | 97 | 0.0% |
| Bangladeshi | 661 | 0.0% |
| Barbadian | 110 | 0.0% |
| Basque | 512 | 0.0% |
| Belgian | 685 | 0.0% |
| Belizean | 1,141 | 0.1% |
| Bermudan | 7 | 0.0% |
| Bhutanese | 12,574 | 0.6% |
| Blackfeet | 1,468 | 0.1% |
| Bolivian | 1,034 | 0.1% |
| Brazilian | 937 | 0.0% |
| British | 6,307 | 0.3% |
| British West Indian | 237 | 0.0% |
| Bulgarian | 110 | 0.0% |
| Burmese | 17,725 | 0.8% |
| Cajun | 80 | 0.0% |
| Cambodian | 63 | 0.0% |
| Canadian | 2,845 | 0.1% |
| Cape Verdean | 274 | 0.0% |
| Celtic | 65 | 0.0% |
| Central American | 84,785 | 3.9% |
| Central American Indian | 5,054 | 0.2% |
| Cherokee | 7,346 | 0.3% |
| Cheyenne | 196 | 0.0% |
| Chickasaw | 256 | 0.0% |
| Chilean | 845 | 0.0% |
| Chinese | 56 | 0.0% |
| Chippewa | 379 | 0.0% |
| Choctaw | 1,935 | 0.1% |
| Colombian | 4,917 | 0.2% |
| Colville | 20 | 0.0% |
| Comanche | 286 | 0.0% |
| Costa Rican | 2,230 | 0.1% |
| Cree | 26 | 0.0% |
| Creek | 366 | 0.0% |
| Croatian | 1,049 | 0.1% |
| Crow | 18 | 0.0% |
| Cuban | 7,767 | 0.4% |
| Czech | 1,921 | 0.1% |
| Czechoslovakian | 973 | 0.0% |
| Danish | 3,843 | 0.2% |
| Delaware | 47 | 0.0% |
| Dominican | 907 | 0.0% |
| Dutch | 16,897 | 0.8% |
| Eastern European | 2,313 | 0.1% |
| Ecuadorian | 4,271 | 0.2% |
| Egyptian | 4,277 | 0.2% |
| English | 88,581 | 4.1% |
| Estonian | 47 | 0.0% |
| Ethiopian | 908 | 0.0% |
| European | 28,697 | 1.3% |
| Fijian | 10 | 0.0% |
| Filipino | 4,874 | 0.2% |
| Finnish | 1,431 | 0.1% |
| French | 25,817 | 1.2% |
| French American Indian | 86 | 0.0% |
| French Canadian | 4,032 | 0.2% |
| German | 128,175 | 5.9% |
| German Russian | 64 | 0.0% |
| Ghanaian | 706 | 0.0% |
| Greek | 3,295 | 0.2% |
| Guamanian / Chamorro | 2,247 | 0.1% |
| Guatemalan | 25,001 | 1.1% |
| Guyanese | 342 | 0.0% |
| Haitian | 817 | 0.0% |
| Honduran | 7,019 | 0.3% |
| Hopi | 190 | 0.0% |
| Hungarian | 3,942 | 0.2% |
| Icelander | 320 | 0.0% |
| Indian (Asian) | 55,863 | 2.6% |
| Indonesian | 685 | 0.0% |
| Inupiat | 265 | 0.0% |
| Iranian | 2,549 | 0.1% |
| Iraqi | 421 | 0.0% |
| Irish | 101,883 | 4.7% |
| Iroquois | 367 | 0.0% |
| Israeli | 456 | 0.0% |
| Italian | 53,262 | 2.4% |
| Jamaican | 2,664 | 0.1% |
| Japanese | 3,731 | 0.2% |
| Jordanian | 1,826 | 0.1% |
| Kenyan | 581 | 0.0% |
| Kiowa | 14 | 0.0% |
| Korean | 63,243 | 2.9% |
| Laotian | 7,816 | 0.4% |
| Latvian | 195 | 0.0% |
| Lebanese | 2,801 | 0.1% |
| Liberian | 68 | 0.0% |
| Lithuanian | 1,286 | 0.1% |
| Lumbee | 19 | 0.0% |
| Luxembourger | 93 | 0.0% |
| Macedonian | 34 | 0.0% |
| Malaysian | 1,118 | 0.1% |
| Maltese | 60 | 0.0% |
| Mexican | 1,012,610 | 46.4% |
| Mexican American Indian | 12,114 | 0.6% |
| Mongolian | 444 | 0.0% |
| Moroccan | 380 | 0.0% |
| Native Hawaiian | 4,997 | 0.2% |
| Navajo | 2,350 | 0.1% |
| Nepalese | 94 | 0.0% |
| New Zealander | 32 | 0.0% |
| Nicaraguan | 9,553 | 0.4% |
| Nigerian | 4,100 | 0.2% |
| Northern European | 2,134 | 0.1% |
| Norwegian | 13,827 | 0.6% |
| Okinawan | 36 | 0.0% |
| Osage | 145 | 0.0% |
| Ottawa | 8 | 0.0% |
| Paiute | 173 | 0.0% |
| Pakistani | 4,452 | 0.2% |
| Palestinian | 1,779 | 0.1% |
| Panamanian | 832 | 0.0% |
| Paraguayan | 351 | 0.0% |
| Pennsylvania German | 145 | 0.0% |
| Peruvian | 7,055 | 0.3% |
| Pima | 240 | 0.0% |
| Polish | 17,352 | 0.8% |
| Portuguese | 5,788 | 0.3% |
| Potawatomi | 165 | 0.0% |
| Pueblo | 1,192 | 0.1% |
| Puerto Rican | 16,862 | 0.8% |
| Puget Sound Salish | 17 | 0.0% |
| Romanian | 1,738 | 0.1% |
| Russian | 5,867 | 0.3% |
| Salvadoran | 39,864 | 1.8% |
| Samoan | 3,450 | 0.2% |
| Scandinavian | 3,507 | 0.2% |
| Scotch-Irish | 7,412 | 0.3% |
| Scottish | 16,248 | 0.7% |
| Seminole | 132 | 0.0% |
| Senegalese | 15 | 0.0% |
| Serbian | 474 | 0.0% |
| Shoshone | 152 | 0.0% |
| Sierra Leonean | 124 | 0.0% |
| Sioux | 841 | 0.0% |
| Slavic | 293 | 0.0% |
| Slovak | 1,033 | 0.1% |
| Slovene | 488 | 0.0% |
| South African | 254 | 0.0% |
| South American | 23,743 | 1.1% |
| South American Indian | 488 | 0.0% |
| Soviet Union | 8 | 0.0% |
| Spaniard | 11,094 | 0.5% |
| Spanish | 7,167 | 0.3% |
| Spanish American | 327 | 0.0% |
| Spanish American Indian | 296 | 0.0% |
| Sri Lankan | 18,634 | 0.9% |
| Subsaharan African | 18,889 | 0.9% |
| Sudanese | 181 | 0.0% |
| Swedish | 11,671 | 0.5% |
| Swiss | 2,190 | 0.1% |
| Syrian | 3,344 | 0.2% |
| Taiwanese | 48 | 0.0% |
| Thai | 16,659 | 0.8% |
| Tlingit-Haida | 36 | 0.0% |
| Tohono O'Odham | 373 | 0.0% |
| Tongan | 1,291 | 0.1% |
| Trinidadian and Tobagonian | 671 | 0.0% |
| Tsimshian | 14 | 0.0% |
| Turkish | 211 | 0.0% |
| Ugandan | 19 | 0.0% |
| Ukrainian | 1,855 | 0.1% |
| Uruguayan | 87 | 0.0% |
| Ute | 116 | 0.0% |
| Venezuelan | 772 | 0.0% |
| Vietnamese | 364 | 0.0% |
| Welsh | 5,664 | 0.3% |
| West Indian | 525 | 0.0% |
| Yaqui | 1,513 | 0.1% |
| Yugoslavian | 472 | 0.0% |
| Yuman | 739 | 0.0% |
| Yup'ik | 9 | 0.0% |
| Zimbabwean | 17 | 0.0% | View All 190 Rows |
Immigrants in San Bernardino County
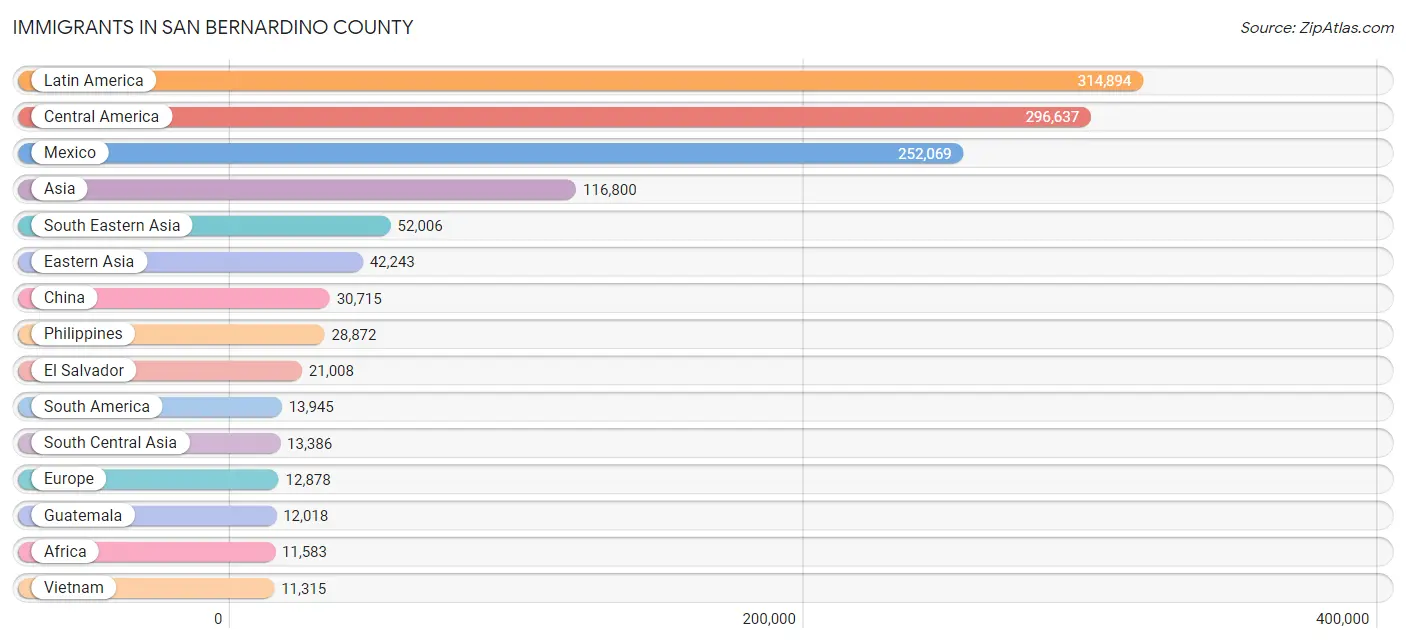
The most numerous immigrant groups reported in San Bernardino County came from Latin America (314,894 | 14.4%), Central America (296,637 | 13.6%), Mexico (252,069 | 11.6%), Asia (116,800 | 5.4%), and South Eastern Asia (52,006 | 2.4%), together accounting for 47.3% of all San Bernardino County residents.
| Immigration Origin | # Population | % Population |
| Afghanistan | 501 | 0.0% |
| Africa | 11,583 | 0.5% |
| Albania | 47 | 0.0% |
| Argentina | 2,209 | 0.1% |
| Armenia | 185 | 0.0% |
| Asia | 116,800 | 5.4% |
| Australia | 375 | 0.0% |
| Austria | 187 | 0.0% |
| Azores | 264 | 0.0% |
| Bahamas | 45 | 0.0% |
| Bangladesh | 490 | 0.0% |
| Barbados | 62 | 0.0% |
| Belarus | 59 | 0.0% |
| Belgium | 105 | 0.0% |
| Belize | 632 | 0.0% |
| Bolivia | 246 | 0.0% |
| Bosnia and Herzegovina | 30 | 0.0% |
| Brazil | 1,051 | 0.1% |
| Bulgaria | 62 | 0.0% |
| Cabo Verde | 47 | 0.0% |
| Cambodia | 1,489 | 0.1% |
| Cameroon | 136 | 0.0% |
| Canada | 3,345 | 0.2% |
| Caribbean | 4,312 | 0.2% |
| Central America | 296,637 | 13.6% |
| Chile | 286 | 0.0% |
| China | 30,715 | 1.4% |
| Colombia | 2,874 | 0.1% |
| Congo | 11 | 0.0% |
| Costa Rica | 1,090 | 0.1% |
| Croatia | 34 | 0.0% |
| Cuba | 2,417 | 0.1% |
| Czechoslovakia | 111 | 0.0% |
| Denmark | 125 | 0.0% |
| Dominica | 24 | 0.0% |
| Dominican Republic | 248 | 0.0% |
| Eastern Africa | 2,061 | 0.1% |
| Eastern Asia | 42,243 | 1.9% |
| Eastern Europe | 3,228 | 0.2% |
| Ecuador | 1,735 | 0.1% |
| Egypt | 3,993 | 0.2% |
| El Salvador | 21,008 | 1.0% |
| England | 1,695 | 0.1% |
| Eritrea | 153 | 0.0% |
| Ethiopia | 634 | 0.0% |
| Europe | 12,878 | 0.6% |
| Fiji | 261 | 0.0% |
| France | 523 | 0.0% |
| Germany | 2,131 | 0.1% |
| Ghana | 770 | 0.0% |
| Greece | 364 | 0.0% |
| Grenada | 6 | 0.0% |
| Guatemala | 12,018 | 0.5% |
| Guyana | 364 | 0.0% |
| Haiti | 341 | 0.0% |
| Honduras | 4,051 | 0.2% |
| Hong Kong | 2,808 | 0.1% |
| Hungary | 188 | 0.0% |
| India | 7,947 | 0.4% |
| Indonesia | 4,920 | 0.2% |
| Iran | 1,949 | 0.1% |
| Iraq | 693 | 0.0% |
| Ireland | 286 | 0.0% |
| Israel | 459 | 0.0% |
| Italy | 631 | 0.0% |
| Jamaica | 664 | 0.0% |
| Japan | 1,651 | 0.1% |
| Jordan | 1,576 | 0.1% |
| Kazakhstan | 63 | 0.0% |
| Kenya | 554 | 0.0% |
| Korea | 9,808 | 0.4% |
| Kuwait | 420 | 0.0% |
| Laos | 679 | 0.0% |
| Latin America | 314,894 | 14.4% |
| Latvia | 20 | 0.0% |
| Lebanon | 1,472 | 0.1% |
| Liberia | 172 | 0.0% |
| Lithuania | 23 | 0.0% |
| Malaysia | 1,086 | 0.1% |
| Mexico | 252,069 | 11.6% |
| Micronesia | 6 | 0.0% |
| Middle Africa | 246 | 0.0% |
| Morocco | 321 | 0.0% |
| Nepal | 283 | 0.0% |
| Netherlands | 726 | 0.0% |
| Nicaragua | 5,069 | 0.2% |
| Nigeria | 2,972 | 0.1% |
| North Macedonia | 32 | 0.0% |
| Northern Africa | 4,505 | 0.2% |
| Northern Europe | 3,621 | 0.2% |
| Norway | 93 | 0.0% |
| Oceania | 1,290 | 0.1% |
| Pakistan | 1,616 | 0.1% |
| Panama | 647 | 0.0% |
| Peru | 4,351 | 0.2% |
| Philippines | 28,872 | 1.3% |
| Poland | 450 | 0.0% |
| Portugal | 626 | 0.0% |
| Romania | 929 | 0.0% |
| Russia | 520 | 0.0% |
| Saudi Arabia | 332 | 0.0% |
| Scotland | 115 | 0.0% |
| Serbia | 3 | 0.0% |
| Sierra Leone | 143 | 0.0% |
| Singapore | 148 | 0.0% |
| Somalia | 12 | 0.0% |
| South Africa | 231 | 0.0% |
| South America | 13,945 | 0.6% |
| South Central Asia | 13,386 | 0.6% |
| South Eastern Asia | 52,006 | 2.4% |
| Southern Europe | 2,029 | 0.1% |
| Spain | 400 | 0.0% |
| Sri Lanka | 506 | 0.0% |
| Sudan | 100 | 0.0% |
| Sweden | 189 | 0.0% |
| Switzerland | 197 | 0.0% |
| Syria | 2,702 | 0.1% |
| Taiwan | 7,029 | 0.3% |
| Thailand | 2,637 | 0.1% |
| Trinidad and Tobago | 406 | 0.0% |
| Turkey | 167 | 0.0% |
| Uganda | 261 | 0.0% |
| Ukraine | 399 | 0.0% |
| Uruguay | 27 | 0.0% |
| Venezuela | 592 | 0.0% |
| Vietnam | 11,315 | 0.5% |
| West Indies | 33 | 0.0% |
| Western Africa | 4,191 | 0.2% |
| Western Asia | 8,400 | 0.4% |
| Western Europe | 3,869 | 0.2% |
| Zaire | 90 | 0.0% |
| Zimbabwe | 288 | 0.0% | View All 132 Rows |
Sex and Age in San Bernardino County
Sex and Age in San Bernardino County
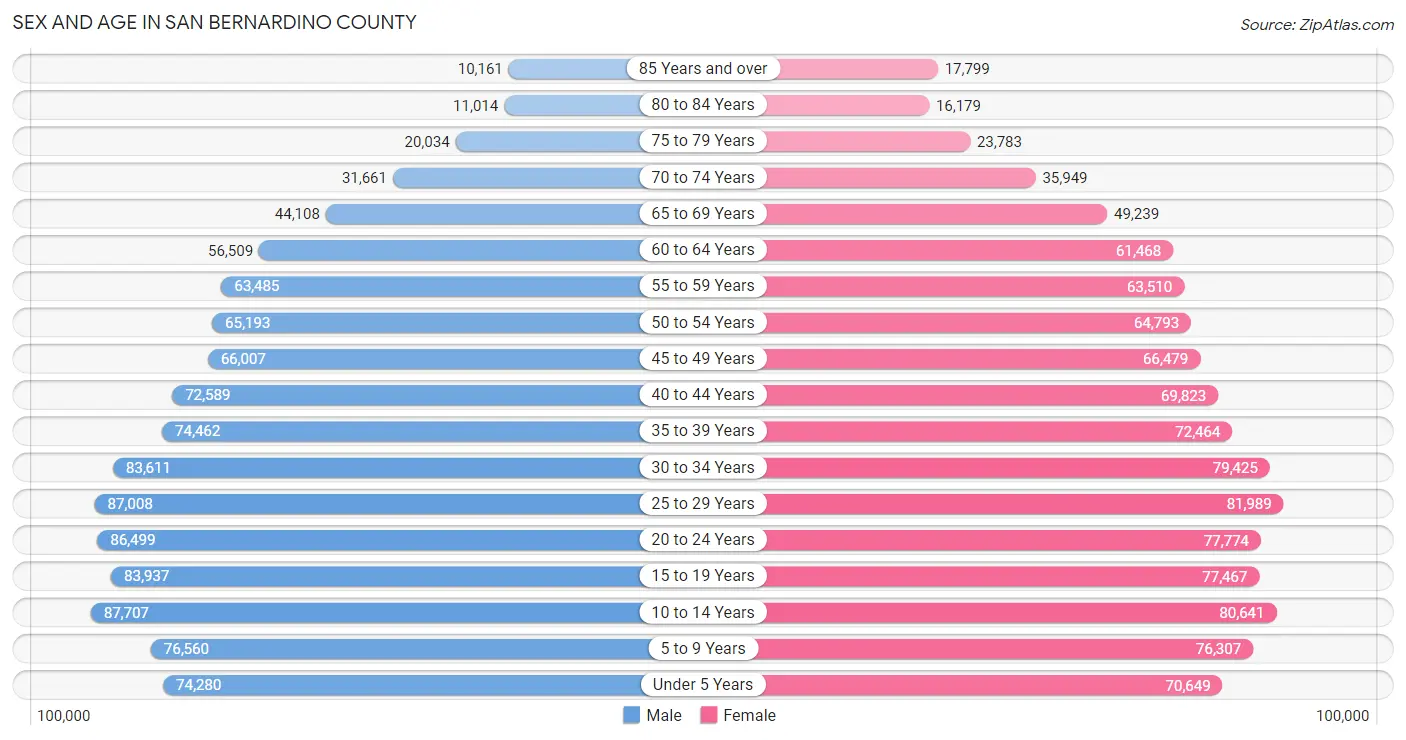
The most populous age groups in San Bernardino County are 10 to 14 Years (87,707 | 8.0%) for men and 25 to 29 Years (81,989 | 7.5%) for women.
| Age Bracket | Male | Female |
| Under 5 Years | 74,280 (6.8%) | 70,649 (6.5%) |
| 5 to 9 Years | 76,560 (7.0%) | 76,307 (7.0%) |
| 10 to 14 Years | 87,707 (8.0%) | 80,641 (7.4%) |
| 15 to 19 Years | 83,937 (7.7%) | 77,467 (7.1%) |
| 20 to 24 Years | 86,499 (7.9%) | 77,774 (7.2%) |
| 25 to 29 Years | 87,008 (8.0%) | 81,989 (7.5%) |
| 30 to 34 Years | 83,611 (7.6%) | 79,425 (7.3%) |
| 35 to 39 Years | 74,462 (6.8%) | 72,464 (6.7%) |
| 40 to 44 Years | 72,589 (6.6%) | 69,823 (6.4%) |
| 45 to 49 Years | 66,007 (6.0%) | 66,479 (6.1%) |
| 50 to 54 Years | 65,193 (5.9%) | 64,793 (6.0%) |
| 55 to 59 Years | 63,485 (5.8%) | 63,510 (5.9%) |
| 60 to 64 Years | 56,509 (5.2%) | 61,468 (5.7%) |
| 65 to 69 Years | 44,108 (4.0%) | 49,239 (4.5%) |
| 70 to 74 Years | 31,661 (2.9%) | 35,949 (3.3%) |
| 75 to 79 Years | 20,034 (1.8%) | 23,783 (2.2%) |
| 80 to 84 Years | 11,014 (1.0%) | 16,179 (1.5%) |
| 85 Years and over | 10,161 (0.9%) | 17,799 (1.6%) |
| Total | 1,094,825 (100.0%) | 1,085,738 (100.0%) |
Families and Households in San Bernardino County
Median Family Size in San Bernardino County
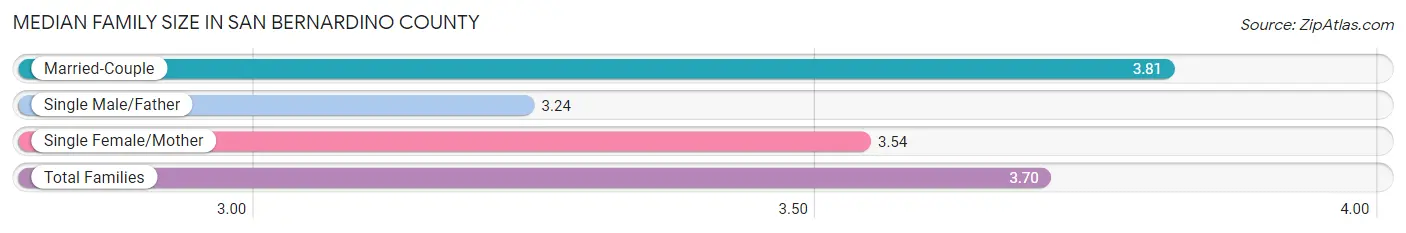
The median family size in San Bernardino County is 3.70 persons per family, with married-couple families (343,271 | 68.2%) accounting for the largest median family size of 3.81 persons per family. On the other hand, single male/father families (52,640 | 10.5%) represent the smallest median family size with 3.24 persons per family.
| Family Type | # Families | Family Size |
| Married-Couple | 343,271 (68.2%) | 3.81 |
| Single Male/Father | 52,640 (10.5%) | 3.24 |
| Single Female/Mother | 107,146 (21.3%) | 3.54 |
| Total Families | 503,057 (100.0%) | 3.70 |
Median Household Size in San Bernardino County
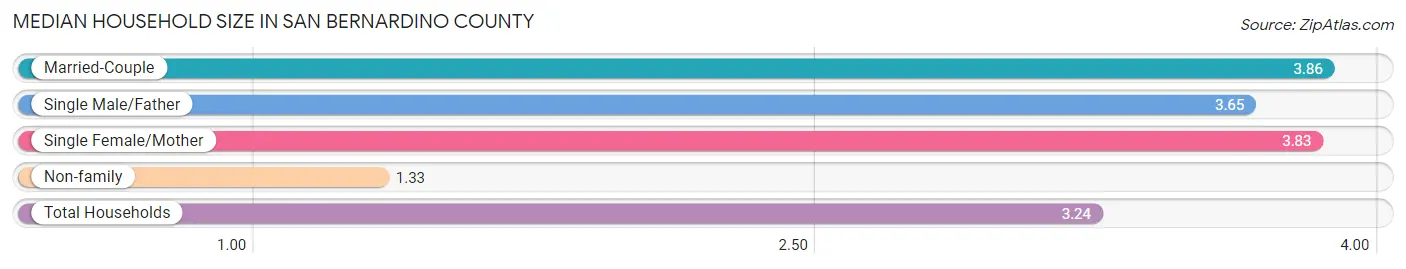
The median household size in San Bernardino County is 3.24 persons per household, with married-couple households (343,271 | 52.0%) accounting for the largest median household size of 3.86 persons per household. non-family households (156,871 | 23.8%) represent the smallest median household size with 1.33 persons per household.
| Household Type | # Households | Household Size |
| Married-Couple | 343,271 (52.0%) | 3.86 |
| Single Male/Father | 52,640 (8.0%) | 3.65 |
| Single Female/Mother | 107,146 (16.2%) | 3.83 |
| Non-family | 156,871 (23.8%) | 1.33 |
| Total Households | 659,928 (100.0%) | 3.24 |
Household Size by Marriage Status in San Bernardino County
Out of a total of 659,928 households in San Bernardino County, 503,057 (76.2%) are family households, while 156,871 (23.8%) are nonfamily households. The most numerous type of family households are 2-person households, comprising 150,409, and the most common type of nonfamily households are 1-person households, comprising 120,566.
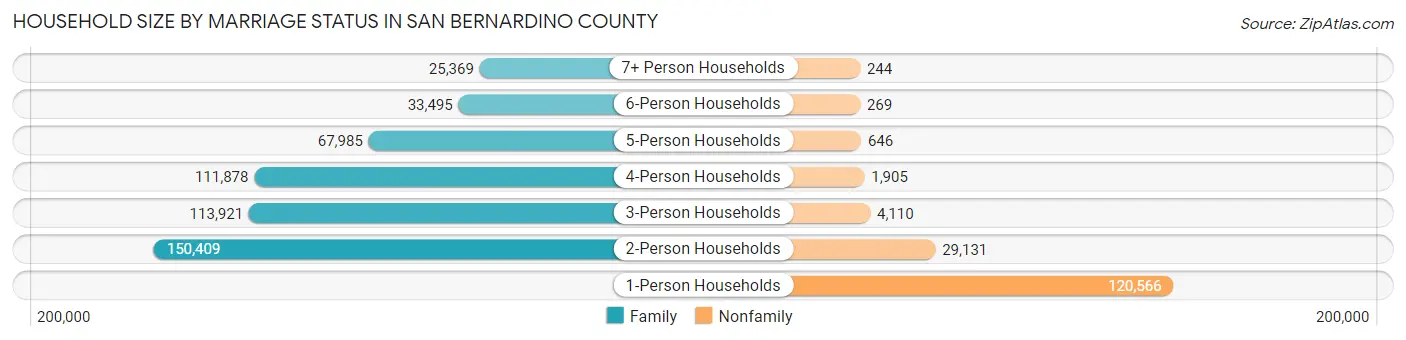
| Household Size | Family Households | Nonfamily Households |
| 1-Person Households | - | 120,566 (18.3%) |
| 2-Person Households | 150,409 (22.8%) | 29,131 (4.4%) |
| 3-Person Households | 113,921 (17.3%) | 4,110 (0.6%) |
| 4-Person Households | 111,878 (17.0%) | 1,905 (0.3%) |
| 5-Person Households | 67,985 (10.3%) | 646 (0.1%) |
| 6-Person Households | 33,495 (5.1%) | 269 (0.0%) |
| 7+ Person Households | 25,369 (3.8%) | 244 (0.0%) |
| Total | 503,057 (76.2%) | 156,871 (23.8%) |
Female Fertility in San Bernardino County
Fertility by Age in San Bernardino County
Average fertility rate in San Bernardino County is 54.0 births per 1,000 women. Women in the age bracket of 20 to 34 years have the highest fertility rate with 89.0 births per 1,000 women. Women in the age bracket of 20 to 34 years acount for 72.5% of all women with births.
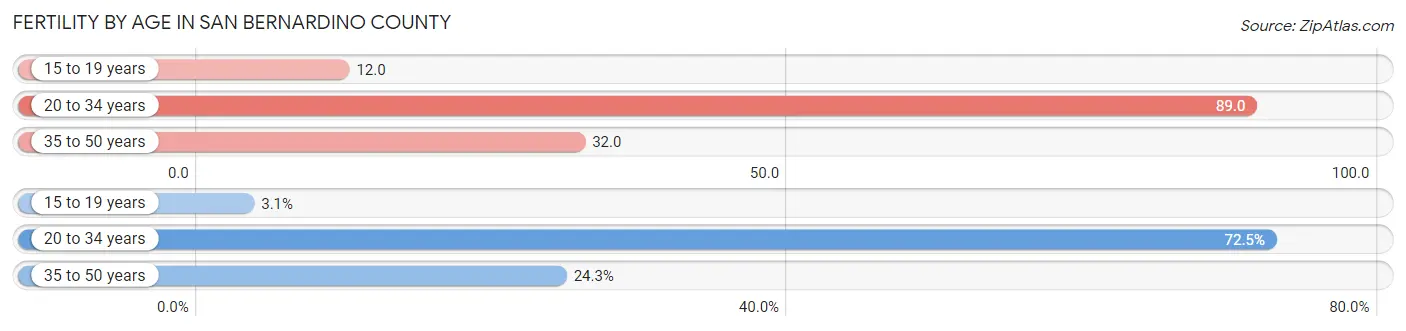
| Age Bracket | Women with Births | Births / 1,000 Women |
| 15 to 19 years | 922 (3.1%) | 12.0 |
| 20 to 34 years | 21,287 (72.5%) | 89.0 |
| 35 to 50 years | 7,144 (24.3%) | 32.0 |
| Total | 29,353 (100.0%) | 54.0 |
Fertility by Age by Marriage Status in San Bernardino County
61.6% of women with births (29,353) in San Bernardino County are married. The highest percentage of unmarried women with births falls into 15 to 19 years age bracket with 77.0% of them unmarried at the time of birth, while the lowest percentage of unmarried women with births belong to 35 to 50 years age bracket with 22.3% of them unmarried.
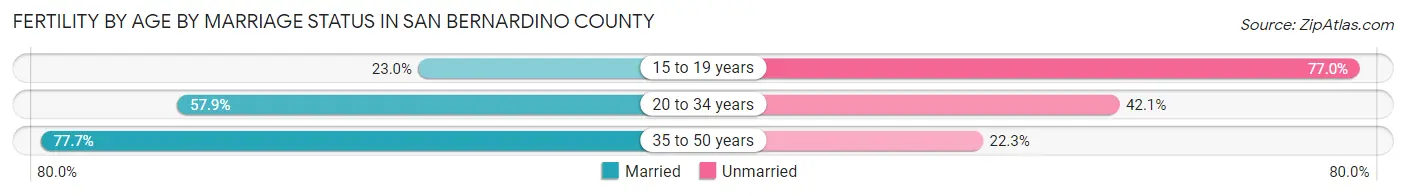
| Age Bracket | Married | Unmarried |
| 15 to 19 years | 212 (23.0%) | 710 (77.0%) |
| 20 to 34 years | 12,325 (57.9%) | 8,962 (42.1%) |
| 35 to 50 years | 5,551 (77.7%) | 1,593 (22.3%) |
| Total | 18,081 (61.6%) | 11,272 (38.4%) |
Fertility by Education in San Bernardino County
Average fertility rate in San Bernardino County is 54.0 births per 1,000 women. Women with the education attainment of high school diploma have the highest fertility rate of 63.0 births per 1,000 women, while women with the education attainment of less than high school have the lowest fertility at 29.0 births per 1,000 women. Women with the education attainment of college or associate's degree represent 37.6% of all women with births.
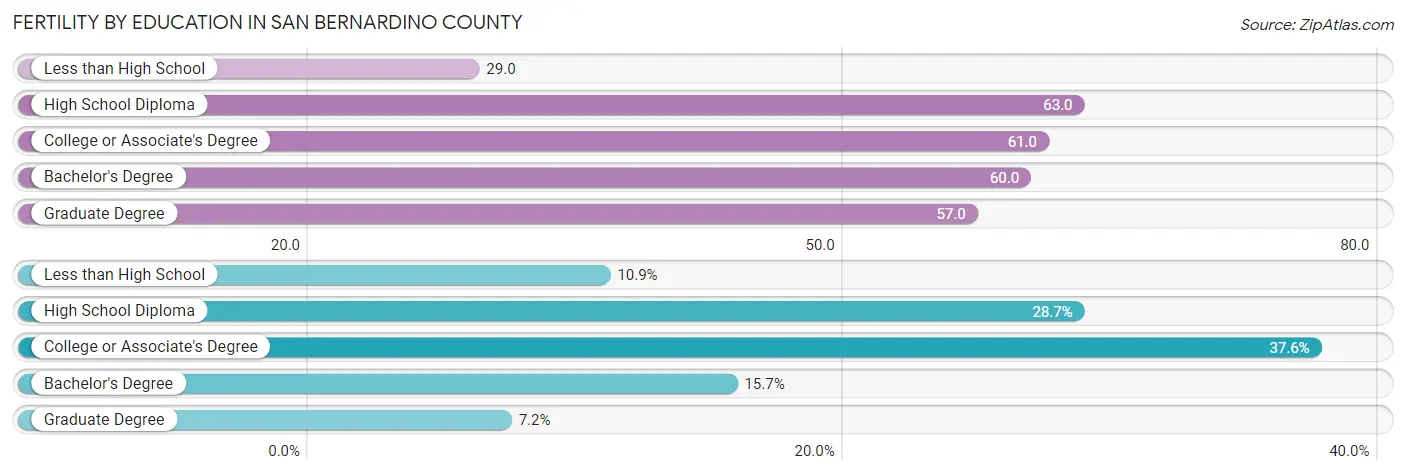
| Educational Attainment | Women with Births | Births / 1,000 Women |
| Less than High School | 3,201 (10.9%) | 29.0 |
| High School Diploma | 8,416 (28.7%) | 63.0 |
| College or Associate's Degree | 11,021 (37.6%) | 61.0 |
| Bachelor's Degree | 4,599 (15.7%) | 60.0 |
| Graduate Degree | 2,116 (7.2%) | 57.0 |
| Total | 29,353 (100.0%) | 54.0 |
Fertility by Education by Marriage Status in San Bernardino County
38.4% of women with births in San Bernardino County are unmarried. Women with the educational attainment of graduate degree are most likely to be married with 93.0% of them married at childbirth, while women with the educational attainment of less than high school are least likely to be married with 52.1% of them unmarried at childbirth.
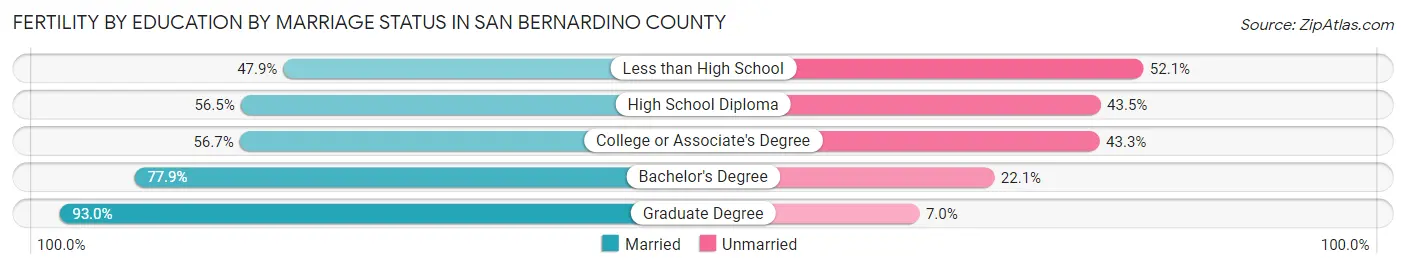
| Educational Attainment | Married | Unmarried |
| Less than High School | 1,533 (47.9%) | 1,668 (52.1%) |
| High School Diploma | 4,755 (56.5%) | 3,661 (43.5%) |
| College or Associate's Degree | 6,249 (56.7%) | 4,772 (43.3%) |
| Bachelor's Degree | 3,583 (77.9%) | 1,016 (22.1%) |
| Graduate Degree | 1,968 (93.0%) | 148 (7.0%) |
| Total | 18,081 (61.6%) | 11,272 (38.4%) |
Employment Characteristics in San Bernardino County
Employment by Class of Employer in San Bernardino County
Among the 946,303 employed individuals in San Bernardino County, private company employees (638,497 | 67.5%), local government employees (90,589 | 9.6%), and not-for-profit organizations (58,735 | 6.2%) make up the most common classes of employment.
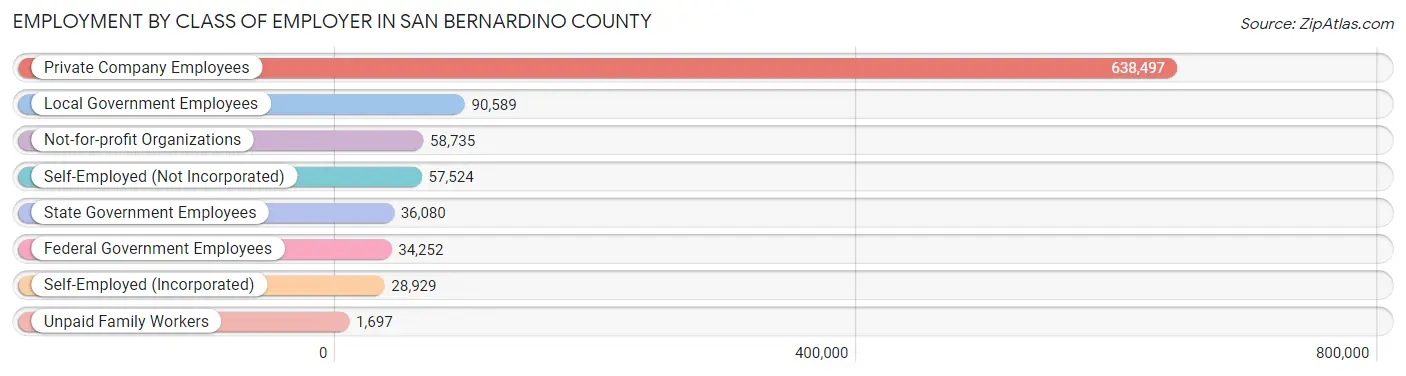
| Employer Class | # Employees | % Employees |
| Private Company Employees | 638,497 | 67.5% |
| Self-Employed (Incorporated) | 28,929 | 3.1% |
| Self-Employed (Not Incorporated) | 57,524 | 6.1% |
| Not-for-profit Organizations | 58,735 | 6.2% |
| Local Government Employees | 90,589 | 9.6% |
| State Government Employees | 36,080 | 3.8% |
| Federal Government Employees | 34,252 | 3.6% |
| Unpaid Family Workers | 1,697 | 0.2% |
| Total | 946,303 | 100.0% |
Employment Status by Age in San Bernardino County
According to the labor force statistics for San Bernardino County, out of the total population over 16 years of age (1,681,263), 62.1% or 1,044,064 individuals are in the labor force, with 7.2% or 75,173 of them unemployed. The age group with the highest labor force participation rate is 30 to 34 years, with 78.6% or 128,146 individuals in the labor force. Within the labor force, the 16 to 19 years age range has the highest percentage of unemployed individuals, with 20.4% or 8,372 of them being unemployed.
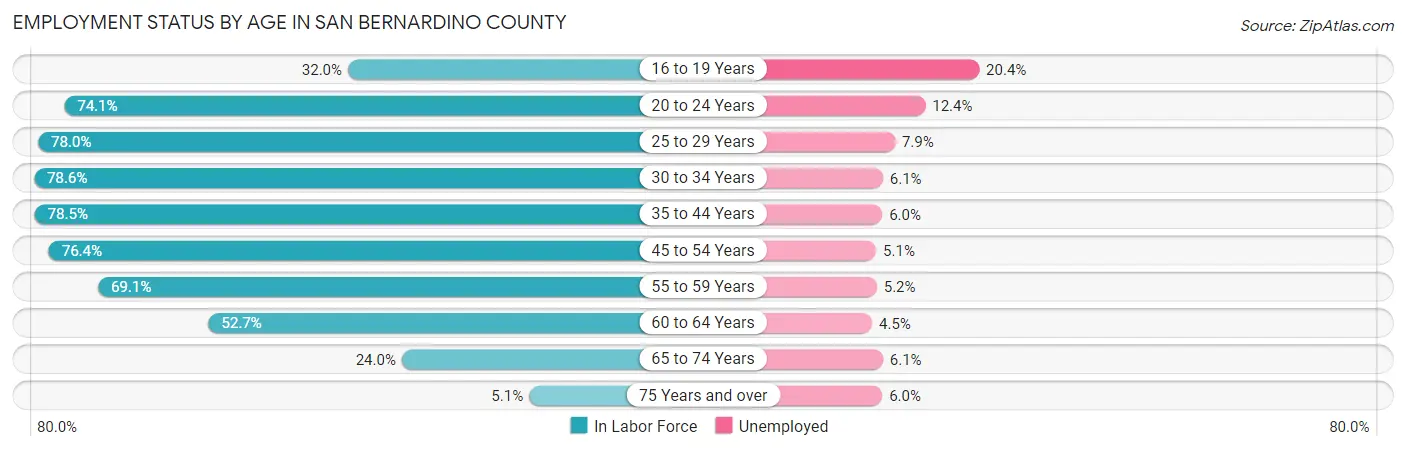
| Age Bracket | In Labor Force | Unemployed |
| 16 to 19 Years | 41,039 (32.0%) | 8,372 (20.4%) |
| 20 to 24 Years | 121,726 (74.1%) | 15,094 (12.4%) |
| 25 to 29 Years | 131,818 (78.0%) | 10,414 (7.9%) |
| 30 to 34 Years | 128,146 (78.6%) | 7,817 (6.1%) |
| 35 to 44 Years | 227,130 (78.5%) | 13,628 (6.0%) |
| 45 to 54 Years | 200,529 (76.4%) | 10,227 (5.1%) |
| 55 to 59 Years | 87,754 (69.1%) | 4,563 (5.2%) |
| 60 to 64 Years | 62,174 (52.7%) | 2,798 (4.5%) |
| 65 to 74 Years | 38,630 (24.0%) | 2,356 (6.1%) |
| 75 Years and over | 5,047 (5.1%) | 303 (6.0%) |
| Total | 1,044,064 (62.1%) | 75,173 (7.2%) |
Employment Status by Educational Attainment in San Bernardino County
According to labor force statistics for San Bernardino County, 74.2% of individuals (837,581) out of the total population between 25 and 64 years of age (1,128,815) are in the labor force, with 5.9% or 49,417 of them being unemployed. The group with the highest labor force participation rate are those with the educational attainment of bachelor's degree or higher, with 84.4% or 216,800 individuals in the labor force. Within the labor force, individuals with less than high school education have the highest percentage of unemployment, with 7.7% or 9,538 of them being unemployed.
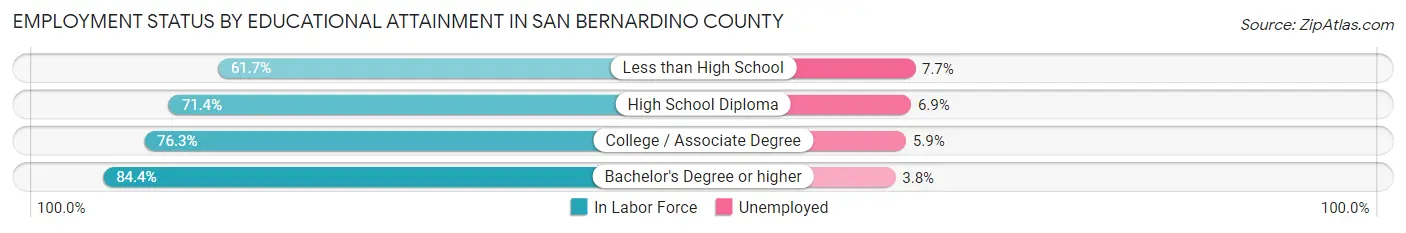
| Educational Attainment | In Labor Force | Unemployed |
| Less than High School | 123,873 (61.7%) | 15,459 (7.7%) |
| High School Diploma | 222,604 (71.4%) | 21,512 (6.9%) |
| College / Associate Degree | 274,228 (76.3%) | 21,205 (5.9%) |
| Bachelor's Degree or higher | 216,800 (84.4%) | 9,761 (3.8%) |
| Total | 837,581 (74.2%) | 66,600 (5.9%) |
Employment Occupations by Sex in San Bernardino County
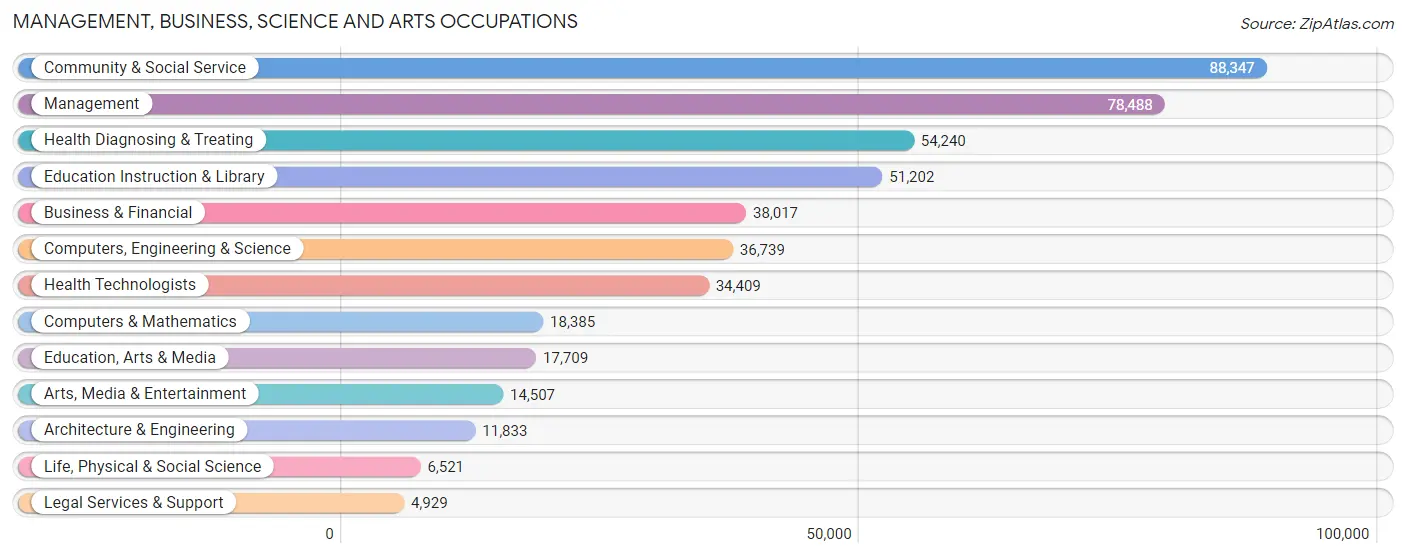
Management, Business, Science and Arts Occupations
The most common Management, Business, Science and Arts occupations in San Bernardino County are Community & Social Service (88,347 | 9.2%), Management (78,488 | 8.2%), Health Diagnosing & Treating (54,240 | 5.7%), Education Instruction & Library (51,202 | 5.4%), and Business & Financial (38,017 | 4.0%).
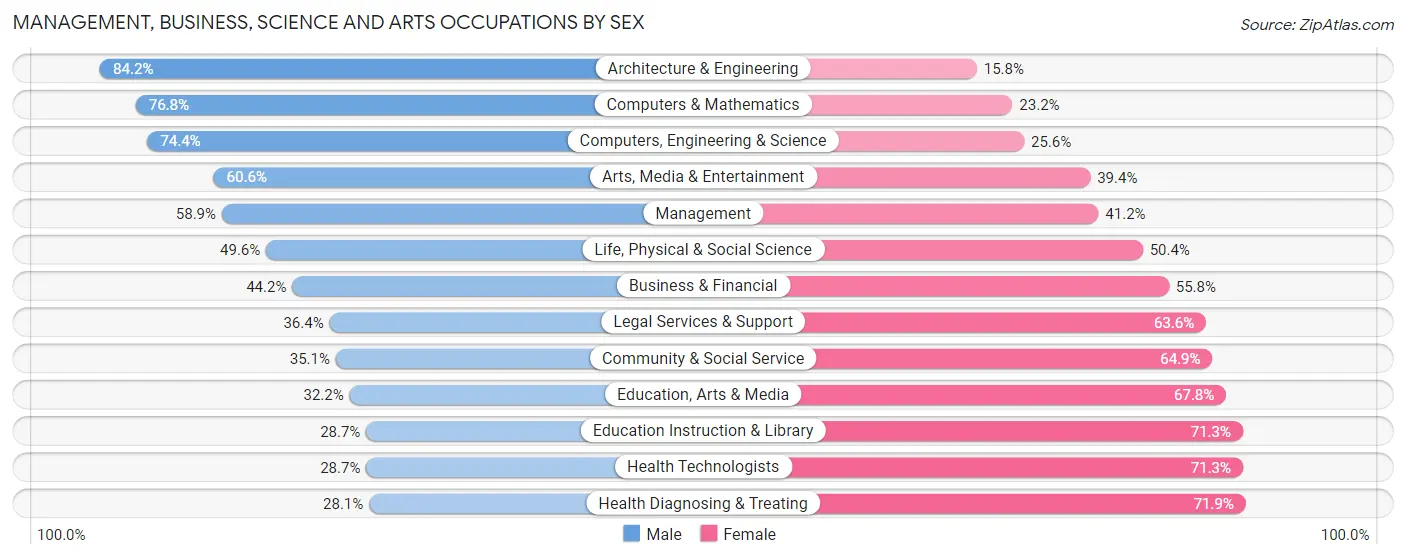
Management, Business, Science and Arts Occupations by Sex
Within the Management, Business, Science and Arts occupations in San Bernardino County, the most male-oriented occupations are Architecture & Engineering (84.2%), Computers & Mathematics (76.8%), and Computers, Engineering & Science (74.4%), while the most female-oriented occupations are Health Diagnosing & Treating (71.9%), Health Technologists (71.3%), and Education Instruction & Library (71.3%).
| Occupation | Male | Female |
| Management | 46,192 (58.9%) | 32,296 (41.1%) |
| Business & Financial | 16,793 (44.2%) | 21,224 (55.8%) |
| Computers, Engineering & Science | 27,323 (74.4%) | 9,416 (25.6%) |
| Computers & Mathematics | 14,120 (76.8%) | 4,265 (23.2%) |
| Architecture & Engineering | 9,967 (84.2%) | 1,866 (15.8%) |
| Life, Physical & Social Science | 3,236 (49.6%) | 3,285 (50.4%) |
| Community & Social Service | 31,002 (35.1%) | 57,345 (64.9%) |
| Education, Arts & Media | 5,705 (32.2%) | 12,004 (67.8%) |
| Legal Services & Support | 1,794 (36.4%) | 3,135 (63.6%) |
| Education Instruction & Library | 14,718 (28.7%) | 36,484 (71.3%) |
| Arts, Media & Entertainment | 8,785 (60.6%) | 5,722 (39.4%) |
| Health Diagnosing & Treating | 15,257 (28.1%) | 38,983 (71.9%) |
| Health Technologists | 9,885 (28.7%) | 24,524 (71.3%) |
| Total (Category) | 136,567 (46.2%) | 159,264 (53.8%) |
| Total (Overall) | 525,173 (54.9%) | 430,486 (45.1%) |
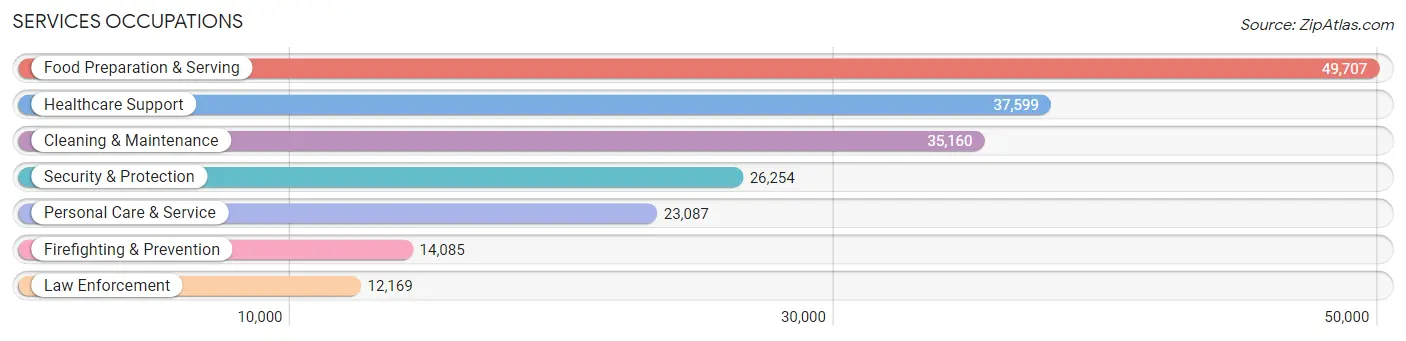
Services Occupations
The most common Services occupations in San Bernardino County are Food Preparation & Serving (49,707 | 5.2%), Healthcare Support (37,599 | 3.9%), Cleaning & Maintenance (35,160 | 3.7%), Security & Protection (26,254 | 2.8%), and Personal Care & Service (23,087 | 2.4%).
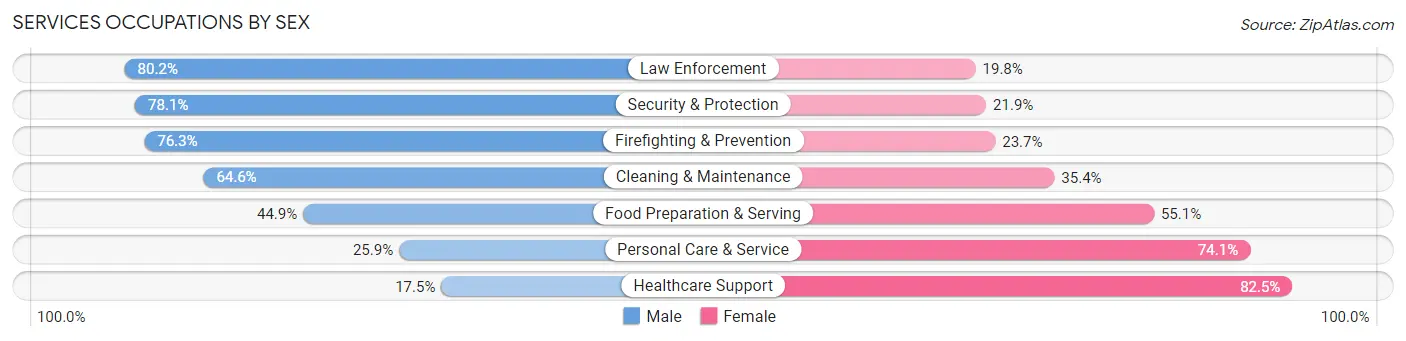
Services Occupations by Sex
Within the Services occupations in San Bernardino County, the most male-oriented occupations are Law Enforcement (80.2%), Security & Protection (78.1%), and Firefighting & Prevention (76.3%), while the most female-oriented occupations are Healthcare Support (82.5%), Personal Care & Service (74.1%), and Food Preparation & Serving (55.1%).
| Occupation | Male | Female |
| Healthcare Support | 6,580 (17.5%) | 31,019 (82.5%) |
| Security & Protection | 20,504 (78.1%) | 5,750 (21.9%) |
| Firefighting & Prevention | 10,746 (76.3%) | 3,339 (23.7%) |
| Law Enforcement | 9,758 (80.2%) | 2,411 (19.8%) |
| Food Preparation & Serving | 22,301 (44.9%) | 27,406 (55.1%) |
| Cleaning & Maintenance | 22,705 (64.6%) | 12,455 (35.4%) |
| Personal Care & Service | 5,970 (25.9%) | 17,117 (74.1%) |
| Total (Category) | 78,060 (45.4%) | 93,747 (54.6%) |
| Total (Overall) | 525,173 (54.9%) | 430,486 (45.1%) |
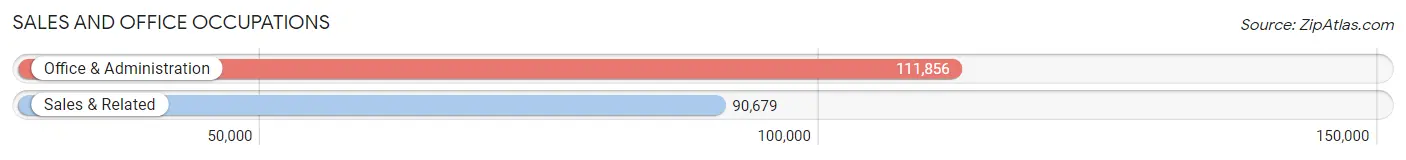
Sales and Office Occupations
The most common Sales and Office occupations in San Bernardino County are Office & Administration (111,856 | 11.7%), and Sales & Related (90,679 | 9.5%).
Sales and Office Occupations by Sex
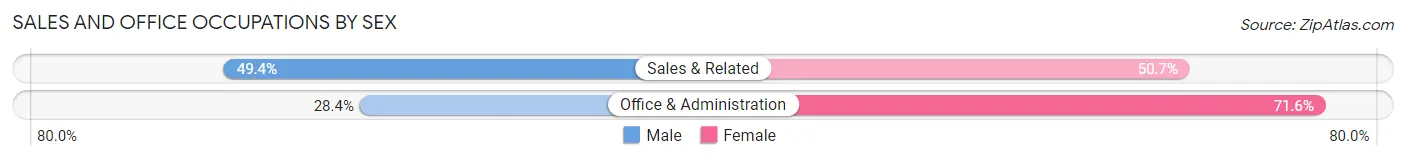
| Occupation | Male | Female |
| Sales & Related | 44,754 (49.3%) | 45,925 (50.6%) |
| Office & Administration | 31,807 (28.4%) | 80,049 (71.6%) |
| Total (Category) | 76,561 (37.8%) | 125,974 (62.2%) |
| Total (Overall) | 525,173 (54.9%) | 430,486 (45.1%) |
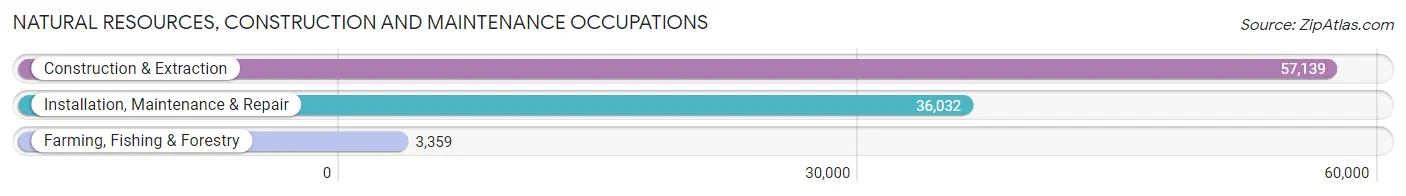
Natural Resources, Construction and Maintenance Occupations
The most common Natural Resources, Construction and Maintenance occupations in San Bernardino County are Construction & Extraction (57,139 | 6.0%), Installation, Maintenance & Repair (36,032 | 3.8%), and Farming, Fishing & Forestry (3,359 | 0.4%).
Natural Resources, Construction and Maintenance Occupations by Sex
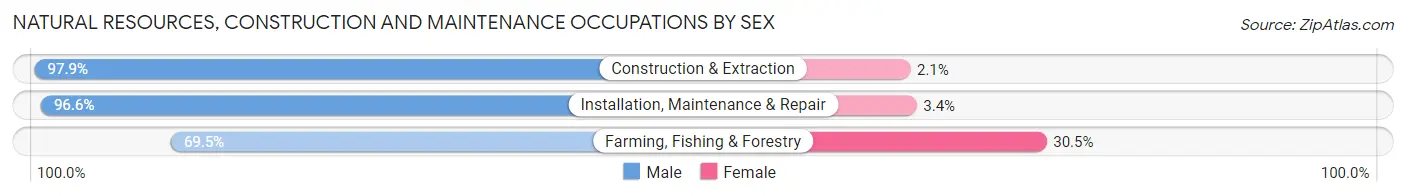
| Occupation | Male | Female |
| Farming, Fishing & Forestry | 2,336 (69.5%) | 1,023 (30.5%) |
| Construction & Extraction | 55,939 (97.9%) | 1,200 (2.1%) |
| Installation, Maintenance & Repair | 34,800 (96.6%) | 1,232 (3.4%) |
| Total (Category) | 93,075 (96.4%) | 3,455 (3.6%) |
| Total (Overall) | 525,173 (54.9%) | 430,486 (45.1%) |
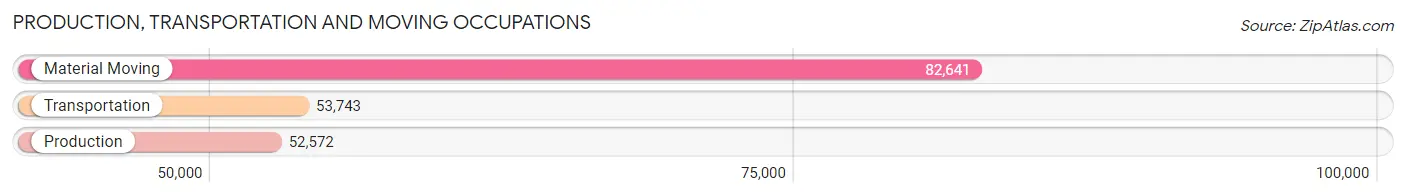
Production, Transportation and Moving Occupations
The most common Production, Transportation and Moving occupations in San Bernardino County are Material Moving (82,641 | 8.6%), Transportation (53,743 | 5.6%), and Production (52,572 | 5.5%).
Production, Transportation and Moving Occupations by Sex
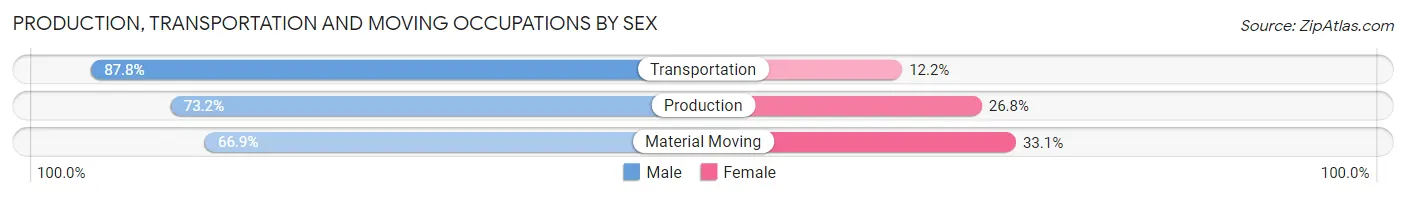
| Occupation | Male | Female |
| Production | 38,465 (73.2%) | 14,107 (26.8%) |
| Transportation | 47,168 (87.8%) | 6,575 (12.2%) |
| Material Moving | 55,277 (66.9%) | 27,364 (33.1%) |
| Total (Category) | 140,910 (74.6%) | 48,046 (25.4%) |
| Total (Overall) | 525,173 (54.9%) | 430,486 (45.1%) |
Employment Industries by Sex in San Bernardino County
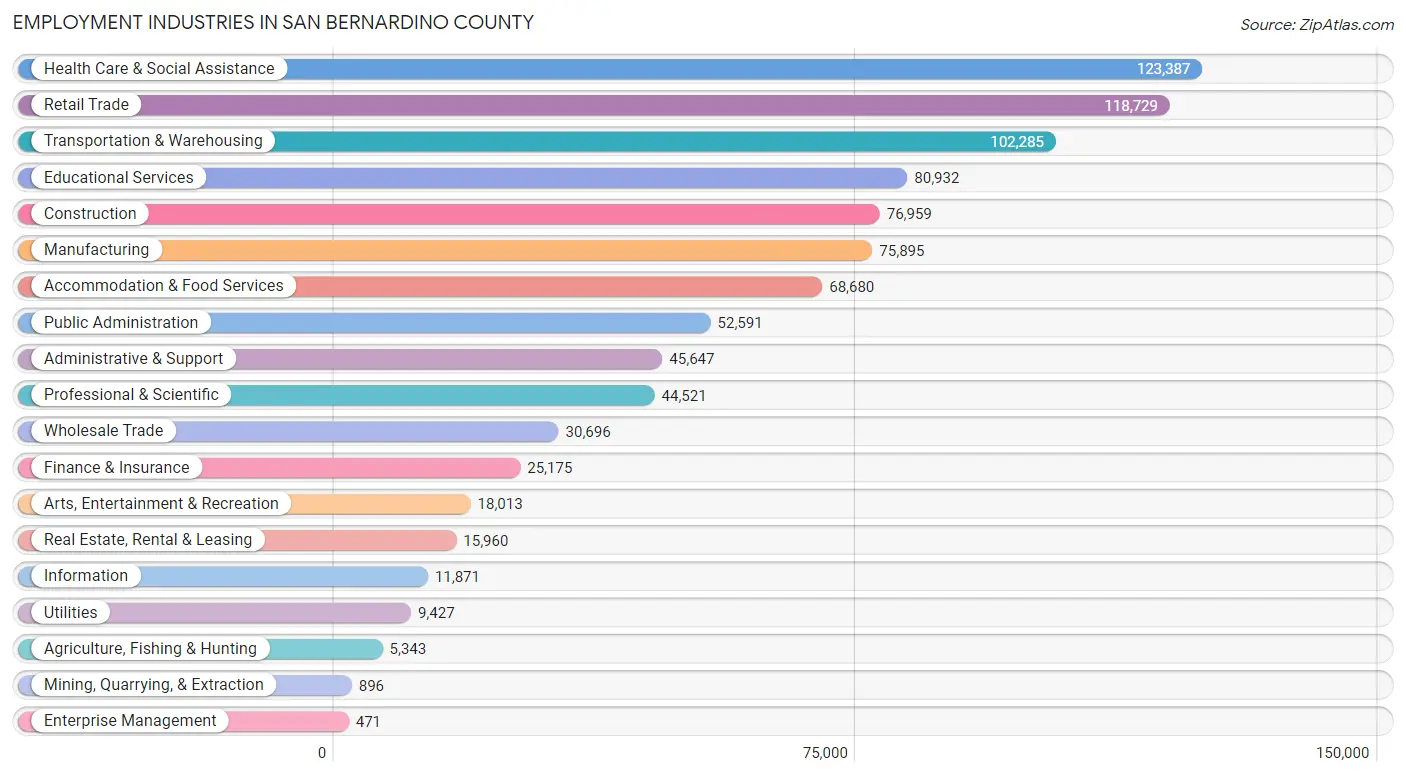
Employment Industries in San Bernardino County
The major employment industries in San Bernardino County include Health Care & Social Assistance (123,387 | 12.9%), Retail Trade (118,729 | 12.4%), Transportation & Warehousing (102,285 | 10.7%), Educational Services (80,932 | 8.5%), and Construction (76,959 | 8.1%).
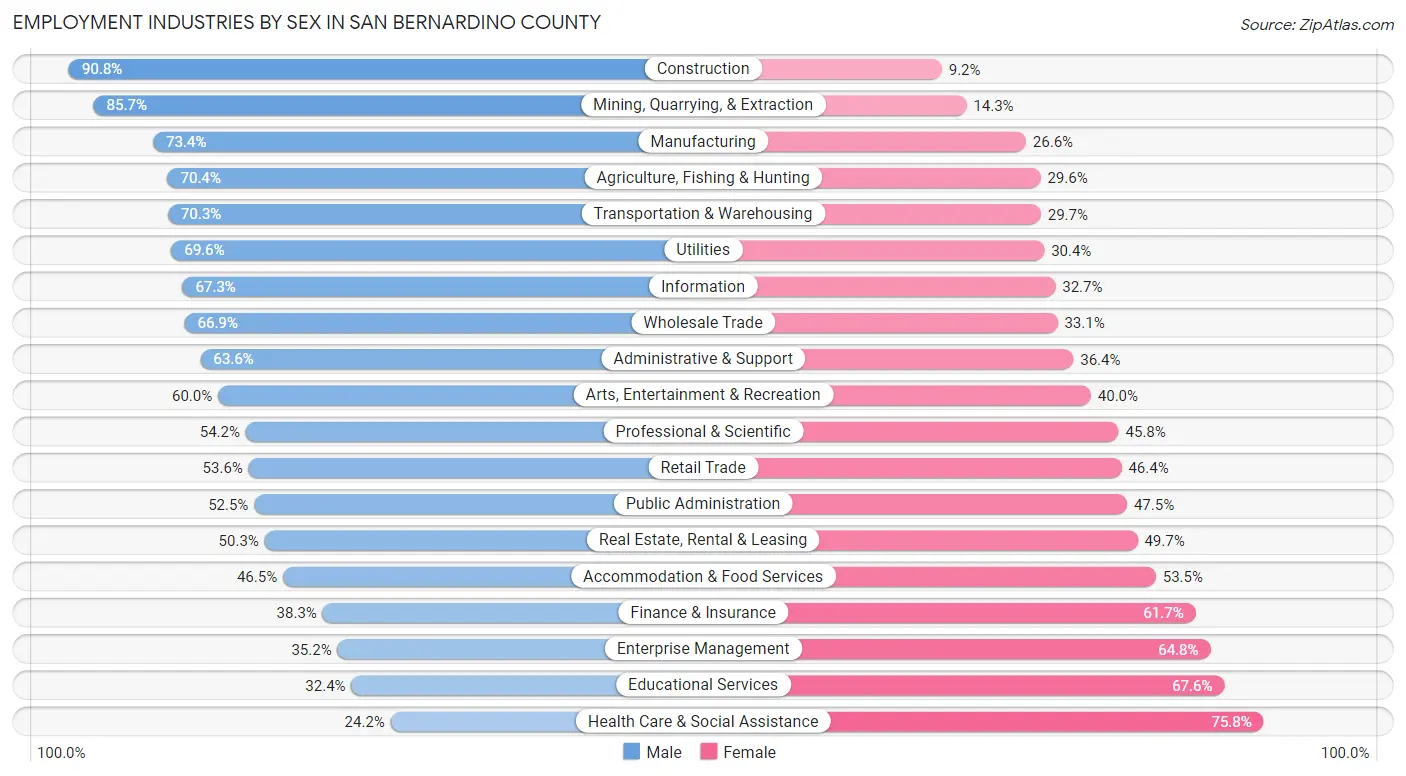
Employment Industries by Sex in San Bernardino County
The San Bernardino County industries that see more men than women are Construction (90.8%), Mining, Quarrying, & Extraction (85.7%), and Manufacturing (73.4%), whereas the industries that tend to have a higher number of women are Health Care & Social Assistance (75.8%), Educational Services (67.6%), and Enterprise Management (64.8%).
| Industry | Male | Female |
| Agriculture, Fishing & Hunting | 3,761 (70.4%) | 1,582 (29.6%) |
| Mining, Quarrying, & Extraction | 768 (85.7%) | 128 (14.3%) |
| Construction | 69,896 (90.8%) | 7,063 (9.2%) |
| Manufacturing | 55,709 (73.4%) | 20,186 (26.6%) |
| Wholesale Trade | 20,525 (66.9%) | 10,171 (33.1%) |
| Retail Trade | 63,663 (53.6%) | 55,066 (46.4%) |
| Transportation & Warehousing | 71,935 (70.3%) | 30,350 (29.7%) |
| Utilities | 6,563 (69.6%) | 2,864 (30.4%) |
| Information | 7,991 (67.3%) | 3,880 (32.7%) |
| Finance & Insurance | 9,645 (38.3%) | 15,530 (61.7%) |
| Real Estate, Rental & Leasing | 8,029 (50.3%) | 7,931 (49.7%) |
| Professional & Scientific | 24,141 (54.2%) | 20,380 (45.8%) |
| Enterprise Management | 166 (35.2%) | 305 (64.8%) |
| Administrative & Support | 29,030 (63.6%) | 16,617 (36.4%) |
| Educational Services | 26,193 (32.4%) | 54,739 (67.6%) |
| Health Care & Social Assistance | 29,894 (24.2%) | 93,493 (75.8%) |
| Arts, Entertainment & Recreation | 10,800 (60.0%) | 7,213 (40.0%) |
| Accommodation & Food Services | 31,949 (46.5%) | 36,731 (53.5%) |
| Public Administration | 27,602 (52.5%) | 24,989 (47.5%) |
| Total | 525,173 (54.9%) | 430,486 (45.1%) |
Education in San Bernardino County
School Enrollment in San Bernardino County
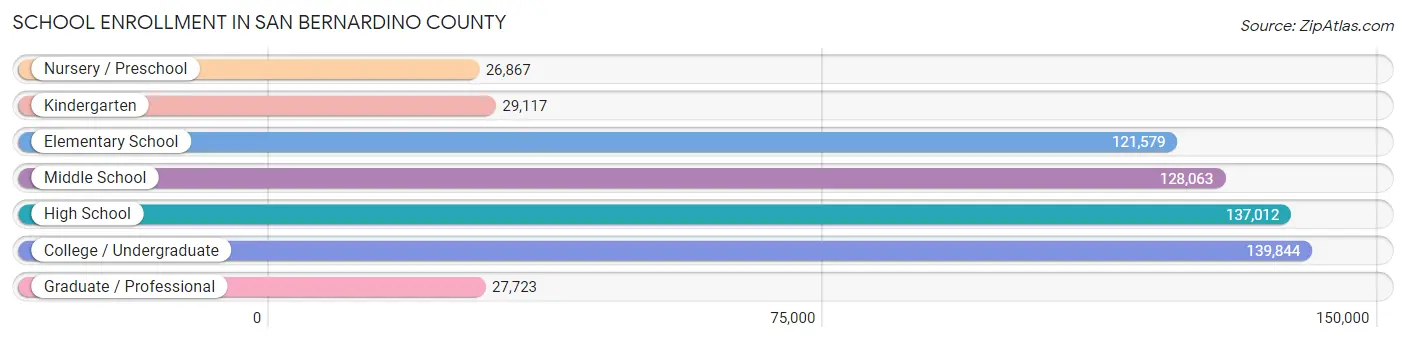
The most common levels of schooling among the 610,205 students in San Bernardino County are college / undergraduate (139,844 | 22.9%), high school (137,012 | 22.5%), and middle school (128,063 | 21.0%).
| School Level | # Students | % Students |
| Nursery / Preschool | 26,867 | 4.4% |
| Kindergarten | 29,117 | 4.8% |
| Elementary School | 121,579 | 19.9% |
| Middle School | 128,063 | 21.0% |
| High School | 137,012 | 22.5% |
| College / Undergraduate | 139,844 | 22.9% |
| Graduate / Professional | 27,723 | 4.5% |
| Total | 610,205 | 100.0% |
School Enrollment by Age by Funding Source in San Bernardino County
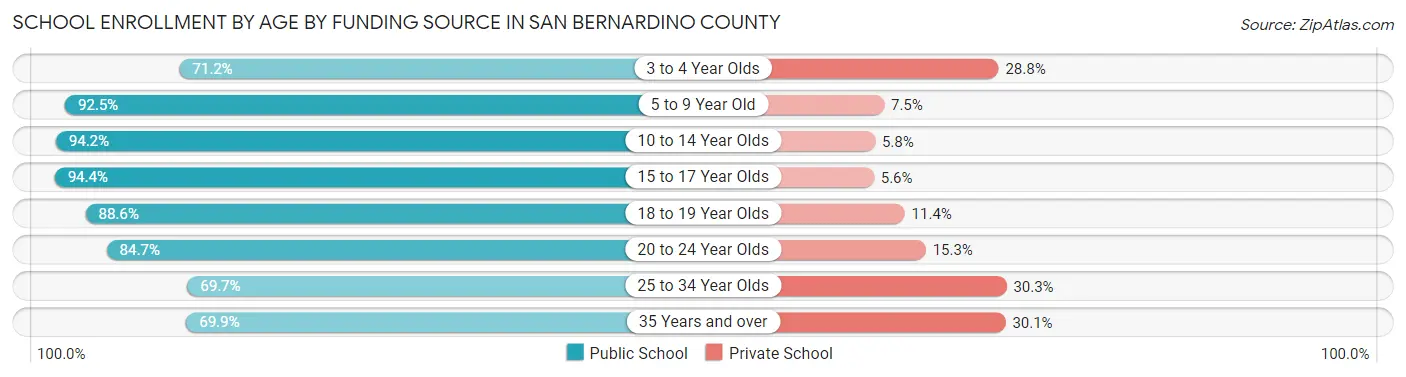
Out of a total of 610,205 students who are enrolled in schools in San Bernardino County, 70,784 (11.6%) attend a private institution, while the remaining 539,421 (88.4%) are enrolled in public schools. The age group of 25 to 34 year olds has the highest likelihood of being enrolled in private schools, with 13,942 (30.3% in the age bracket) enrolled. Conversely, the age group of 15 to 17 year olds has the lowest likelihood of being enrolled in a private school, with 89,902 (94.4% in the age bracket) attending a public institution.
| Age Bracket | Public School | Private School |
| 3 to 4 Year Olds | 14,732 (71.2%) | 5,971 (28.8%) |
| 5 to 9 Year Old | 133,472 (92.5%) | 10,860 (7.5%) |
| 10 to 14 Year Olds | 154,459 (94.2%) | 9,558 (5.8%) |
| 15 to 17 Year Olds | 89,902 (94.4%) | 5,342 (5.6%) |
| 18 to 19 Year Olds | 36,457 (88.6%) | 4,670 (11.4%) |
| 20 to 24 Year Olds | 54,499 (84.7%) | 9,829 (15.3%) |
| 25 to 34 Year Olds | 32,034 (69.7%) | 13,942 (30.3%) |
| 35 Years and over | 24,091 (69.9%) | 10,387 (30.1%) |
| Total | 539,421 (88.4%) | 70,784 (11.6%) |
Educational Attainment by Field of Study in San Bernardino County
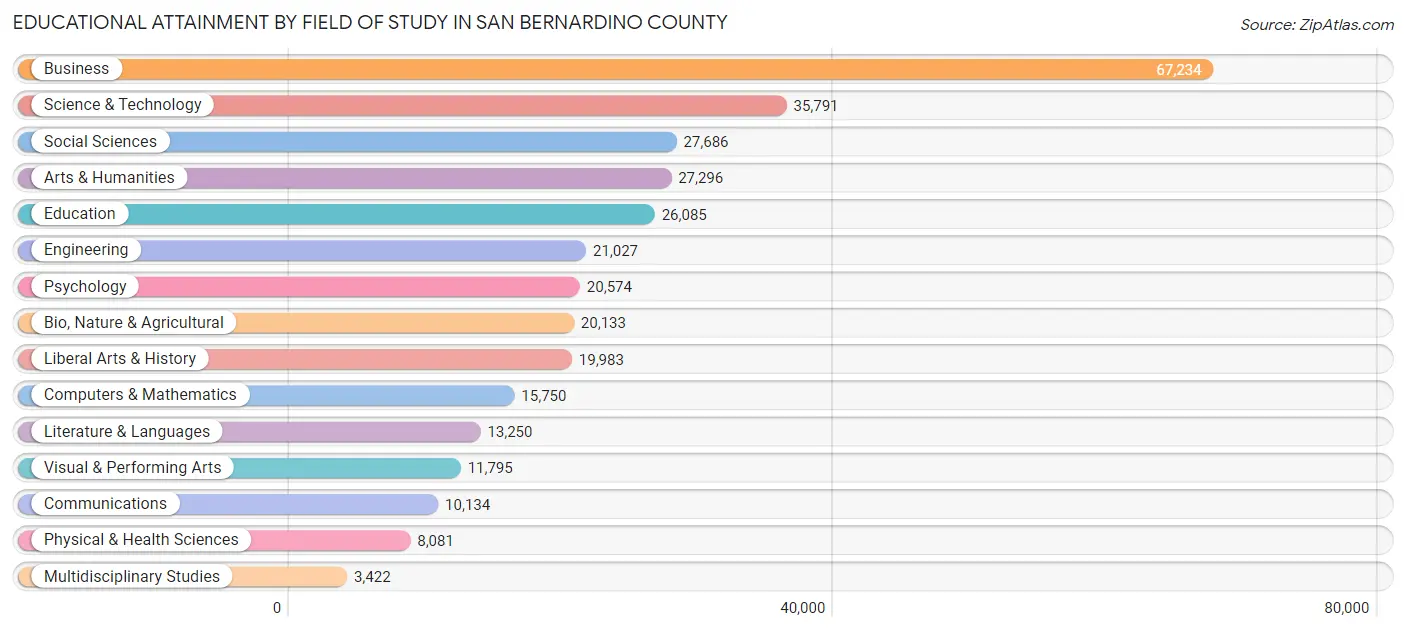
Business (67,234 | 20.5%), science & technology (35,791 | 10.9%), social sciences (27,686 | 8.4%), arts & humanities (27,296 | 8.3%), and education (26,085 | 8.0%) are the most common fields of study among 328,241 individuals in San Bernardino County who have obtained a bachelor's degree or higher.
| Field of Study | # Graduates | % Graduates |
| Computers & Mathematics | 15,750 | 4.8% |
| Bio, Nature & Agricultural | 20,133 | 6.1% |
| Physical & Health Sciences | 8,081 | 2.5% |
| Psychology | 20,574 | 6.3% |
| Social Sciences | 27,686 | 8.4% |
| Engineering | 21,027 | 6.4% |
| Multidisciplinary Studies | 3,422 | 1.0% |
| Science & Technology | 35,791 | 10.9% |
| Business | 67,234 | 20.5% |
| Education | 26,085 | 8.0% |
| Literature & Languages | 13,250 | 4.0% |
| Liberal Arts & History | 19,983 | 6.1% |
| Visual & Performing Arts | 11,795 | 3.6% |
| Communications | 10,134 | 3.1% |
| Arts & Humanities | 27,296 | 8.3% |
| Total | 328,241 | 100.0% |
Transportation & Commute in San Bernardino County
Vehicle Availability by Sex in San Bernardino County
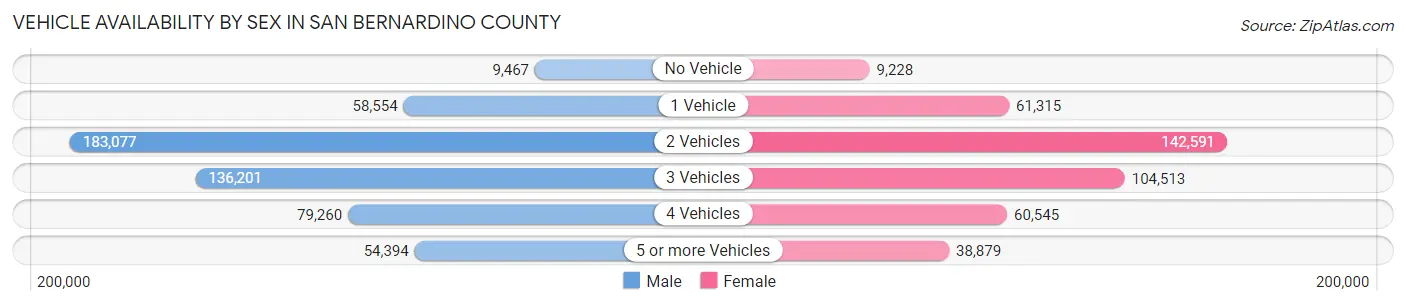
The most prevalent vehicle ownership categories in San Bernardino County are males with 2 vehicles (183,077, accounting for 35.1%) and females with 2 vehicles (142,591, making up 43.9%).
| Vehicles Available | Male | Female |
| No Vehicle | 9,467 (1.8%) | 9,228 (2.2%) |
| 1 Vehicle | 58,554 (11.2%) | 61,315 (14.7%) |
| 2 Vehicles | 183,077 (35.1%) | 142,591 (34.2%) |
| 3 Vehicles | 136,201 (26.1%) | 104,513 (25.1%) |
| 4 Vehicles | 79,260 (15.2%) | 60,545 (14.5%) |
| 5 or more Vehicles | 54,394 (10.4%) | 38,879 (9.3%) |
| Total | 520,953 (100.0%) | 417,071 (100.0%) |
Commute Time in San Bernardino County
The most frequently occuring commute durations in San Bernardino County are 15 to 19 minutes (122,511 commuters, 14.2%), 20 to 24 minutes (117,609 commuters, 13.7%), and 30 to 34 minutes (113,451 commuters, 13.2%).
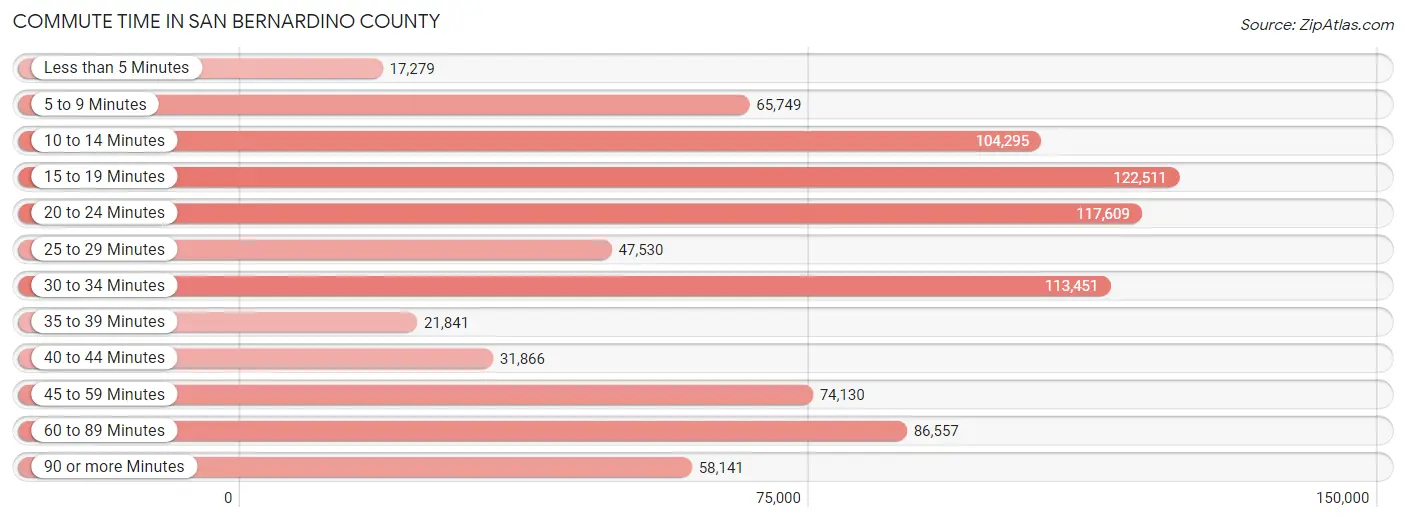
| Commute Time | # Commuters | % Commuters |
| Less than 5 Minutes | 17,279 | 2.0% |
| 5 to 9 Minutes | 65,749 | 7.6% |
| 10 to 14 Minutes | 104,295 | 12.1% |
| 15 to 19 Minutes | 122,511 | 14.2% |
| 20 to 24 Minutes | 117,609 | 13.7% |
| 25 to 29 Minutes | 47,530 | 5.5% |
| 30 to 34 Minutes | 113,451 | 13.2% |
| 35 to 39 Minutes | 21,841 | 2.5% |
| 40 to 44 Minutes | 31,866 | 3.7% |
| 45 to 59 Minutes | 74,130 | 8.6% |
| 60 to 89 Minutes | 86,557 | 10.1% |
| 90 or more Minutes | 58,141 | 6.8% |
Commute Time by Sex in San Bernardino County
The most common commute times in San Bernardino County are 30 to 34 minutes (63,964 commuters, 13.2%) for males and 15 to 19 minutes (59,556 commuters, 15.9%) for females.
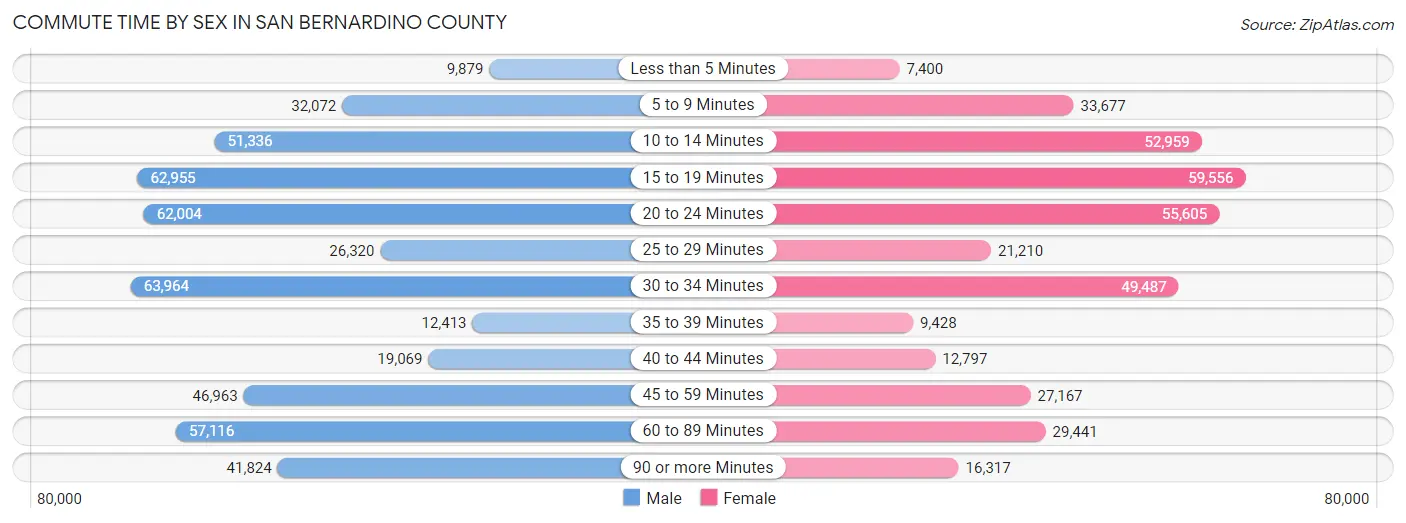
| Commute Time | Male | Female |
| Less than 5 Minutes | 9,879 (2.0%) | 7,400 (2.0%) |
| 5 to 9 Minutes | 32,072 (6.6%) | 33,677 (9.0%) |
| 10 to 14 Minutes | 51,336 (10.6%) | 52,959 (14.1%) |
| 15 to 19 Minutes | 62,955 (13.0%) | 59,556 (15.9%) |
| 20 to 24 Minutes | 62,004 (12.8%) | 55,605 (14.8%) |
| 25 to 29 Minutes | 26,320 (5.4%) | 21,210 (5.7%) |
| 30 to 34 Minutes | 63,964 (13.2%) | 49,487 (13.2%) |
| 35 to 39 Minutes | 12,413 (2.5%) | 9,428 (2.5%) |
| 40 to 44 Minutes | 19,069 (3.9%) | 12,797 (3.4%) |
| 45 to 59 Minutes | 46,963 (9.7%) | 27,167 (7.2%) |
| 60 to 89 Minutes | 57,116 (11.7%) | 29,441 (7.9%) |
| 90 or more Minutes | 41,824 (8.6%) | 16,317 (4.3%) |
Time of Departure to Work by Sex in San Bernardino County
The most frequent times of departure to work in San Bernardino County are 12:00 AM to 4:59 AM (72,484, 14.9%) for males and 7:00 AM to 7:29 AM (50,350, 13.4%) for females.
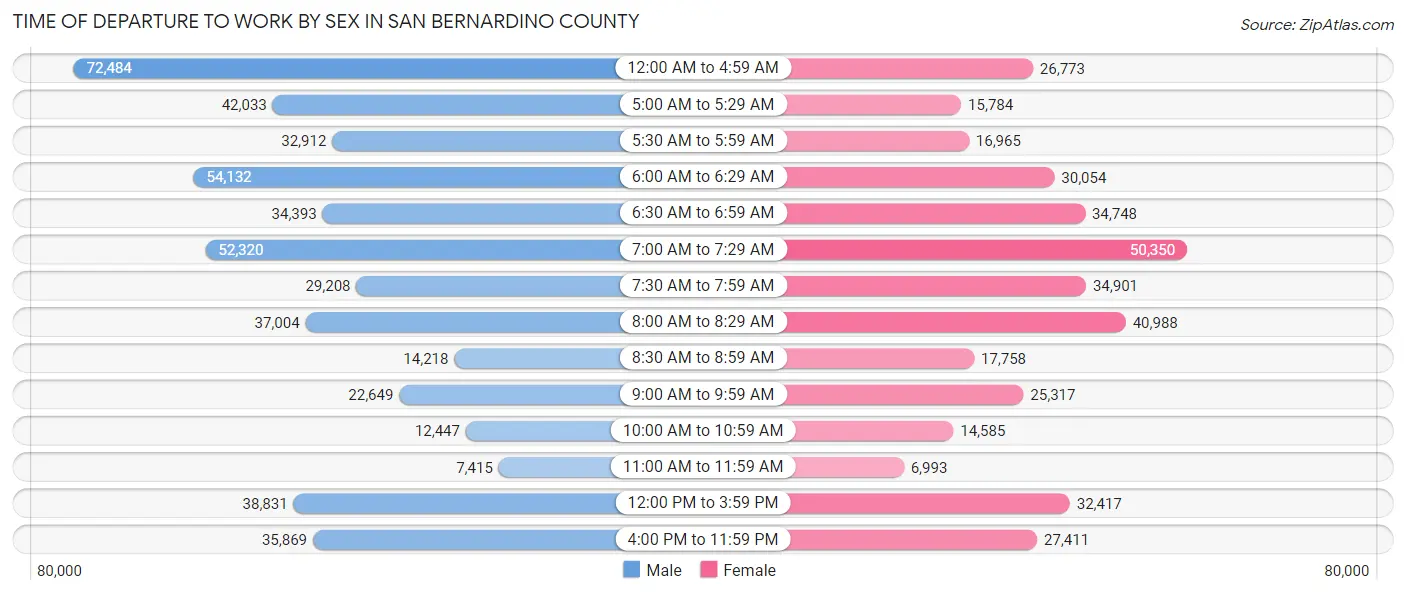
| Time of Departure | Male | Female |
| 12:00 AM to 4:59 AM | 72,484 (14.9%) | 26,773 (7.1%) |
| 5:00 AM to 5:29 AM | 42,033 (8.6%) | 15,784 (4.2%) |
| 5:30 AM to 5:59 AM | 32,912 (6.8%) | 16,965 (4.5%) |
| 6:00 AM to 6:29 AM | 54,132 (11.1%) | 30,054 (8.0%) |
| 6:30 AM to 6:59 AM | 34,393 (7.1%) | 34,748 (9.3%) |
| 7:00 AM to 7:29 AM | 52,320 (10.8%) | 50,350 (13.4%) |
| 7:30 AM to 7:59 AM | 29,208 (6.0%) | 34,901 (9.3%) |
| 8:00 AM to 8:29 AM | 37,004 (7.6%) | 40,988 (10.9%) |
| 8:30 AM to 8:59 AM | 14,218 (2.9%) | 17,758 (4.7%) |
| 9:00 AM to 9:59 AM | 22,649 (4.7%) | 25,317 (6.8%) |
| 10:00 AM to 10:59 AM | 12,447 (2.6%) | 14,585 (3.9%) |
| 11:00 AM to 11:59 AM | 7,415 (1.5%) | 6,993 (1.9%) |
| 12:00 PM to 3:59 PM | 38,831 (8.0%) | 32,417 (8.6%) |
| 4:00 PM to 11:59 PM | 35,869 (7.4%) | 27,411 (7.3%) |
| Total | 485,915 (100.0%) | 375,044 (100.0%) |
Housing Occupancy in San Bernardino County
Occupancy by Ownership in San Bernardino County
Of the total 659,928 dwellings in San Bernardino County, owner-occupied units account for 403,105 (61.1%), while renter-occupied units make up 256,823 (38.9%).
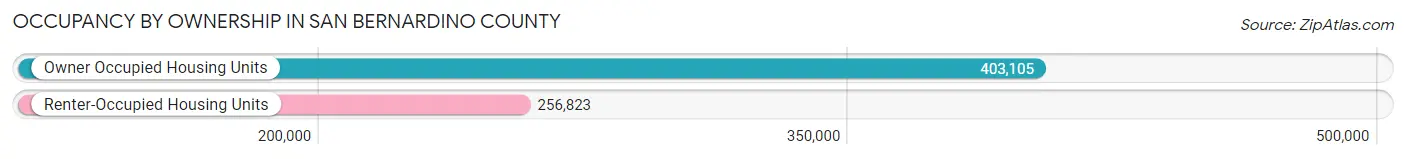
| Occupancy | # Housing Units | % Housing Units |
| Owner Occupied Housing Units | 403,105 | 61.1% |
| Renter-Occupied Housing Units | 256,823 | 38.9% |
| Total Occupied Housing Units | 659,928 | 100.0% |
Occupancy by Household Size in San Bernardino County
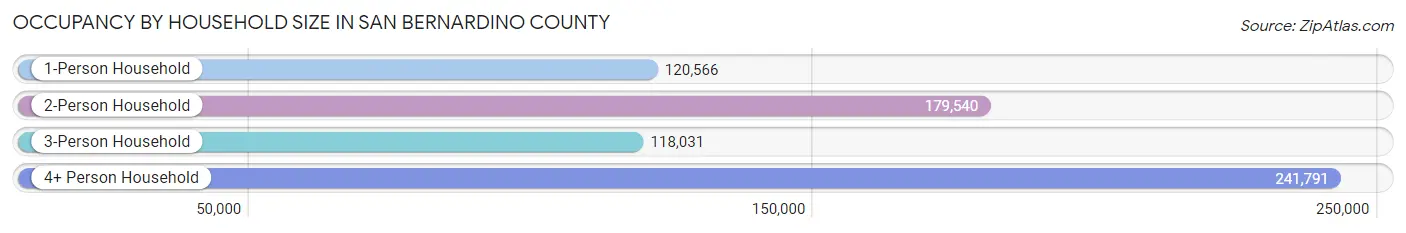
| Household Size | # Housing Units | % Housing Units |
| 1-Person Household | 120,566 | 18.3% |
| 2-Person Household | 179,540 | 27.2% |
| 3-Person Household | 118,031 | 17.9% |
| 4+ Person Household | 241,791 | 36.6% |
| Total Housing Units | 659,928 | 100.0% |
Occupancy by Ownership by Household Size in San Bernardino County
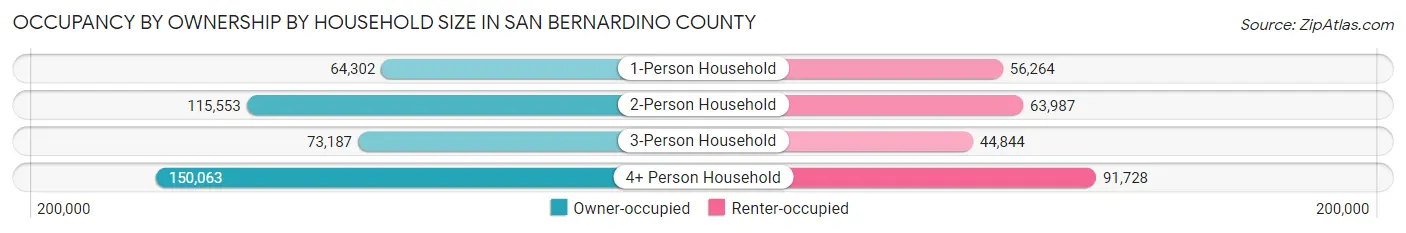
| Household Size | Owner-occupied | Renter-occupied |
| 1-Person Household | 64,302 (53.3%) | 56,264 (46.7%) |
| 2-Person Household | 115,553 (64.4%) | 63,987 (35.6%) |
| 3-Person Household | 73,187 (62.0%) | 44,844 (38.0%) |
| 4+ Person Household | 150,063 (62.1%) | 91,728 (37.9%) |
| Total Housing Units | 403,105 (61.1%) | 256,823 (38.9%) |
Occupancy by Educational Attainment in San Bernardino County
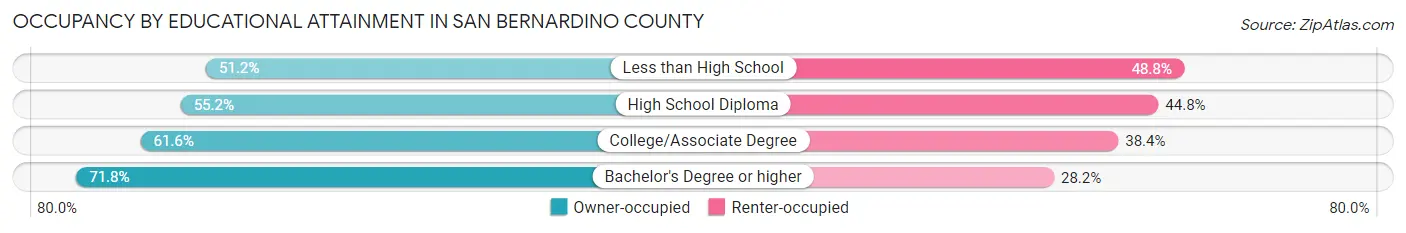
| Household Size | Owner-occupied | Renter-occupied |
| Less than High School | 52,426 (51.2%) | 49,938 (48.8%) |
| High School Diploma | 86,910 (55.2%) | 70,438 (44.8%) |
| College/Associate Degree | 142,385 (61.6%) | 88,748 (38.4%) |
| Bachelor's Degree or higher | 121,384 (71.8%) | 47,699 (28.2%) |
Occupancy by Age of Householder in San Bernardino County
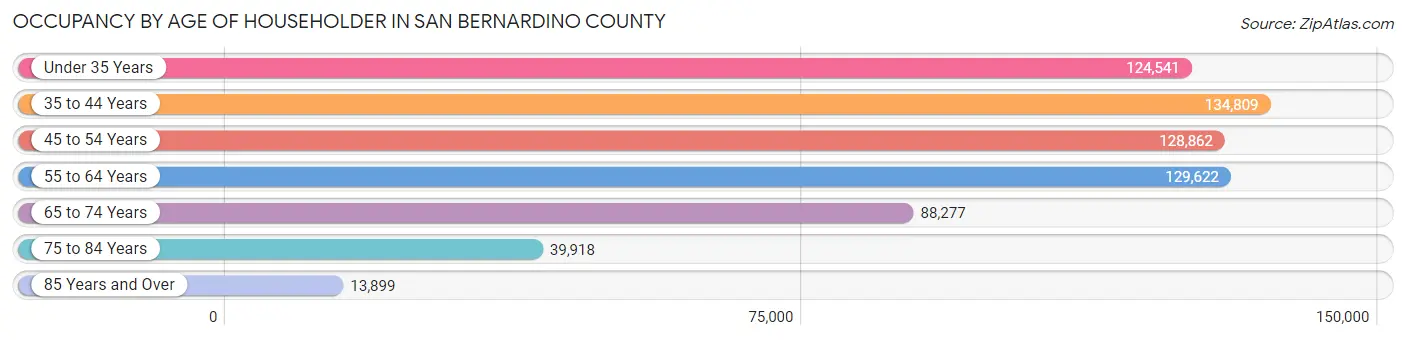
| Age Bracket | # Households | % Households |
| Under 35 Years | 124,541 | 18.9% |
| 35 to 44 Years | 134,809 | 20.4% |
| 45 to 54 Years | 128,862 | 19.5% |
| 55 to 64 Years | 129,622 | 19.6% |
| 65 to 74 Years | 88,277 | 13.4% |
| 75 to 84 Years | 39,918 | 6.0% |
| 85 Years and Over | 13,899 | 2.1% |
| Total | 659,928 | 100.0% |
Housing Finances in San Bernardino County
Median Income by Occupancy in San Bernardino County
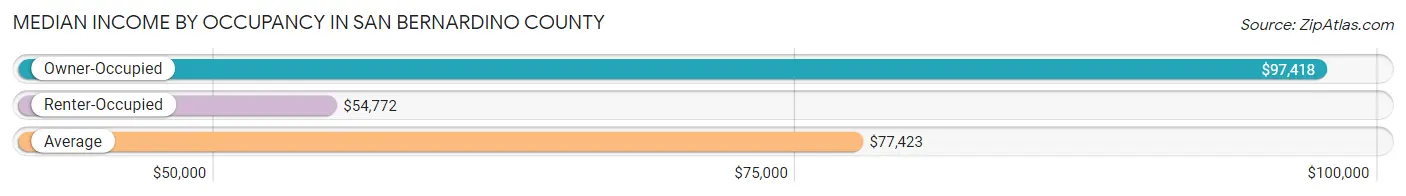
| Occupancy Type | # Households | Median Income |
| Owner-Occupied | 403,105 (61.1%) | $97,418 |
| Renter-Occupied | 256,823 (38.9%) | $54,772 |
| Average | 659,928 (100.0%) | $77,423 |
Occupancy by Householder Income Bracket in San Bernardino County
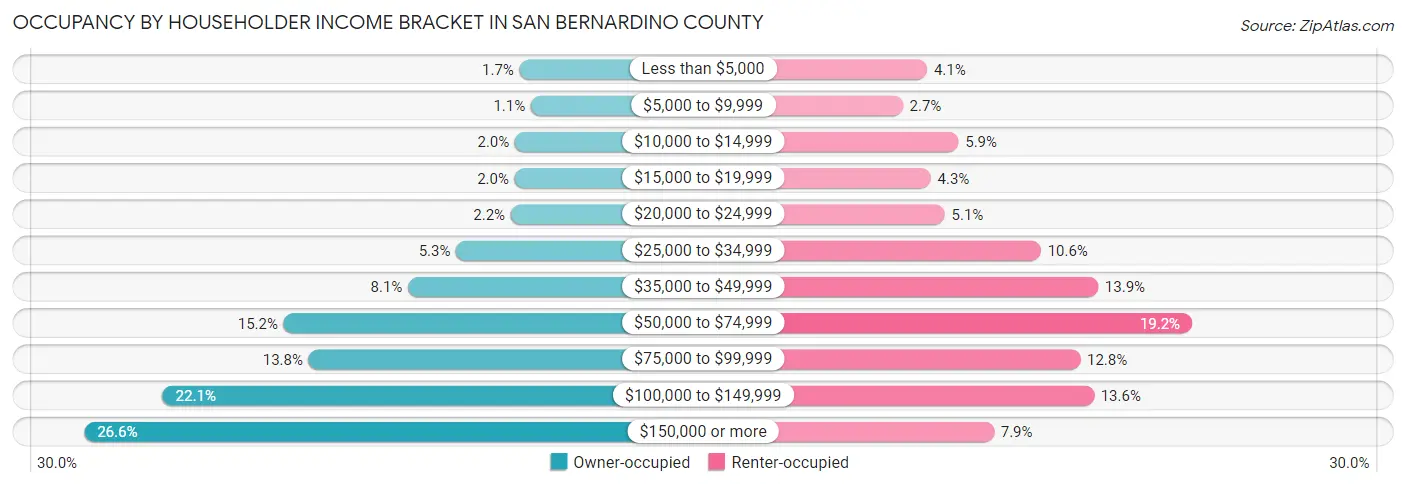
| Income Bracket | Owner-occupied | Renter-occupied |
| Less than $5,000 | 6,894 (1.7%) | 10,473 (4.1%) |
| $5,000 to $9,999 | 4,263 (1.1%) | 6,910 (2.7%) |
| $10,000 to $14,999 | 7,924 (2.0%) | 15,080 (5.9%) |
| $15,000 to $19,999 | 8,033 (2.0%) | 11,022 (4.3%) |
| $20,000 to $24,999 | 8,904 (2.2%) | 13,063 (5.1%) |
| $25,000 to $34,999 | 21,493 (5.3%) | 27,167 (10.6%) |
| $35,000 to $49,999 | 32,587 (8.1%) | 35,565 (13.9%) |
| $50,000 to $74,999 | 61,220 (15.2%) | 49,358 (19.2%) |
| $75,000 to $99,999 | 55,458 (13.8%) | 32,944 (12.8%) |
| $100,000 to $149,999 | 89,133 (22.1%) | 34,958 (13.6%) |
| $150,000 or more | 107,196 (26.6%) | 20,283 (7.9%) |
| Total | 403,105 (100.0%) | 256,823 (100.0%) |
Monthly Housing Cost Tiers in San Bernardino County
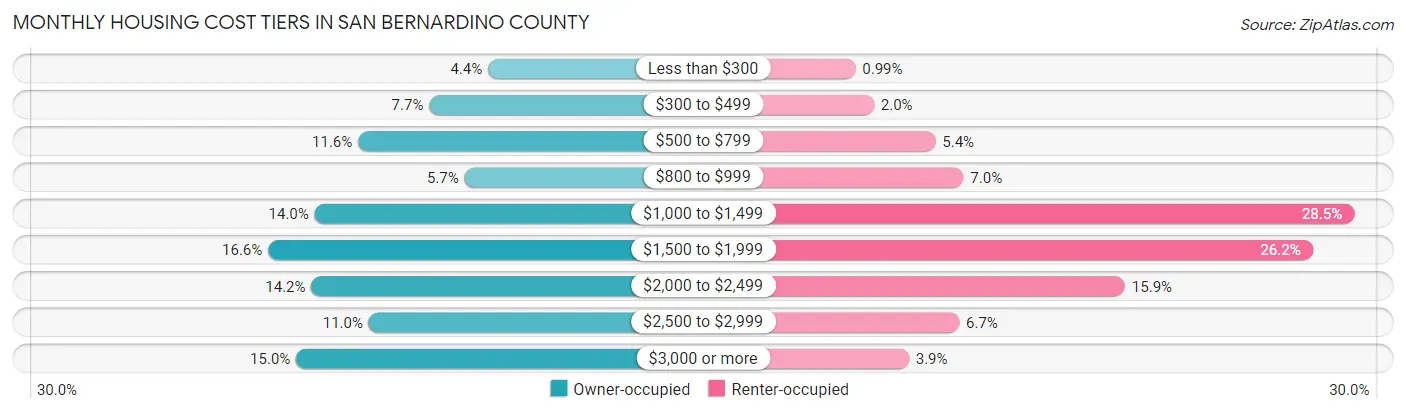
| Monthly Cost | Owner-occupied | Renter-occupied |
| Less than $300 | 17,732 (4.4%) | 2,555 (1.0%) |
| $300 to $499 | 30,856 (7.6%) | 5,163 (2.0%) |
| $500 to $799 | 46,681 (11.6%) | 13,906 (5.4%) |
| $800 to $999 | 22,964 (5.7%) | 17,877 (7.0%) |
| $1,000 to $1,499 | 56,349 (14.0%) | 73,269 (28.5%) |
| $1,500 to $1,999 | 66,701 (16.6%) | 67,388 (26.2%) |
| $2,000 to $2,499 | 57,082 (14.2%) | 40,773 (15.9%) |
| $2,500 to $2,999 | 44,287 (11.0%) | 17,257 (6.7%) |
| $3,000 or more | 60,453 (15.0%) | 10,127 (3.9%) |
| Total | 403,105 (100.0%) | 256,823 (100.0%) |
Physical Housing Characteristics in San Bernardino County
Housing Structures in San Bernardino County
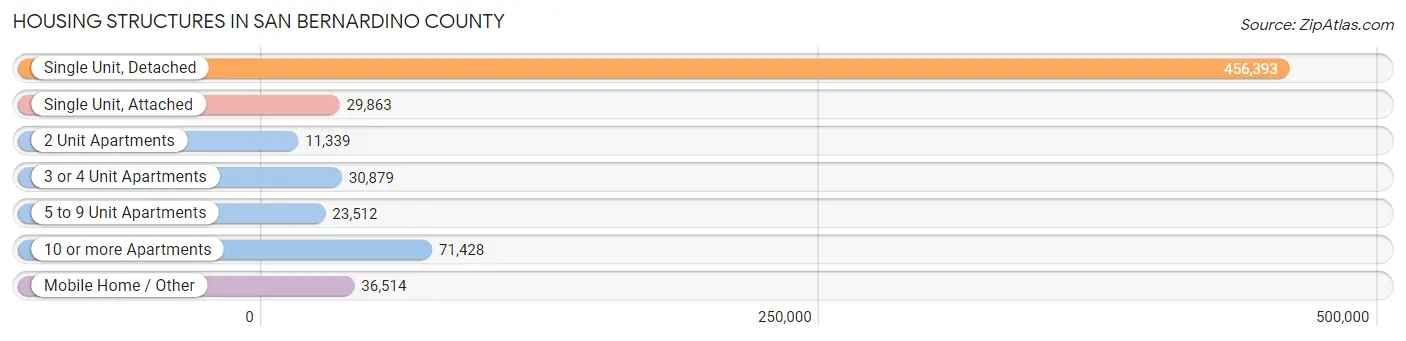
| Structure Type | # Housing Units | % Housing Units |
| Single Unit, Detached | 456,393 | 69.2% |
| Single Unit, Attached | 29,863 | 4.5% |
| 2 Unit Apartments | 11,339 | 1.7% |
| 3 or 4 Unit Apartments | 30,879 | 4.7% |
| 5 to 9 Unit Apartments | 23,512 | 3.6% |
| 10 or more Apartments | 71,428 | 10.8% |
| Mobile Home / Other | 36,514 | 5.5% |
| Total | 659,928 | 100.0% |
Housing Structures by Occupancy in San Bernardino County
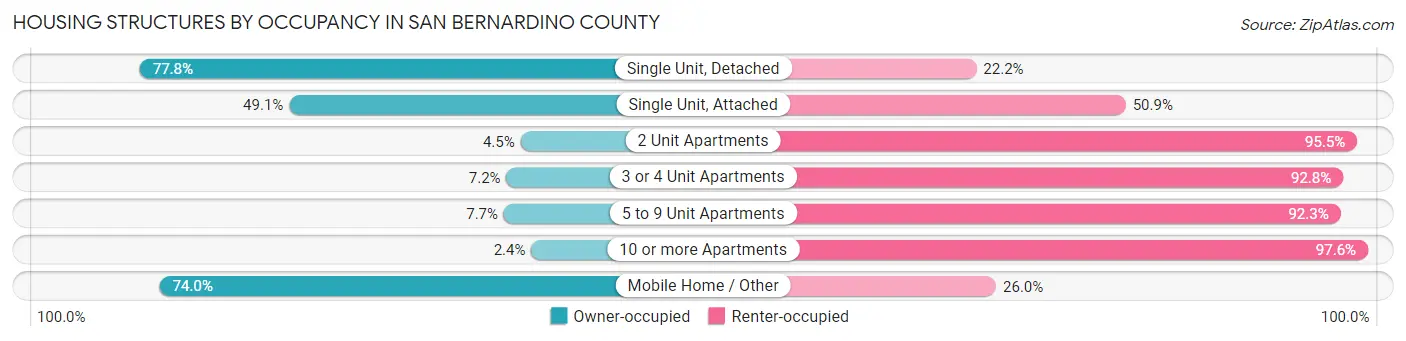
| Structure Type | Owner-occupied | Renter-occupied |
| Single Unit, Detached | 355,126 (77.8%) | 101,267 (22.2%) |
| Single Unit, Attached | 14,652 (49.1%) | 15,211 (50.9%) |
| 2 Unit Apartments | 511 (4.5%) | 10,828 (95.5%) |
| 3 or 4 Unit Apartments | 2,234 (7.2%) | 28,645 (92.8%) |
| 5 to 9 Unit Apartments | 1,815 (7.7%) | 21,697 (92.3%) |
| 10 or more Apartments | 1,740 (2.4%) | 69,688 (97.6%) |
| Mobile Home / Other | 27,027 (74.0%) | 9,487 (26.0%) |
| Total | 403,105 (61.1%) | 256,823 (38.9%) |
Housing Structures by Number of Rooms in San Bernardino County
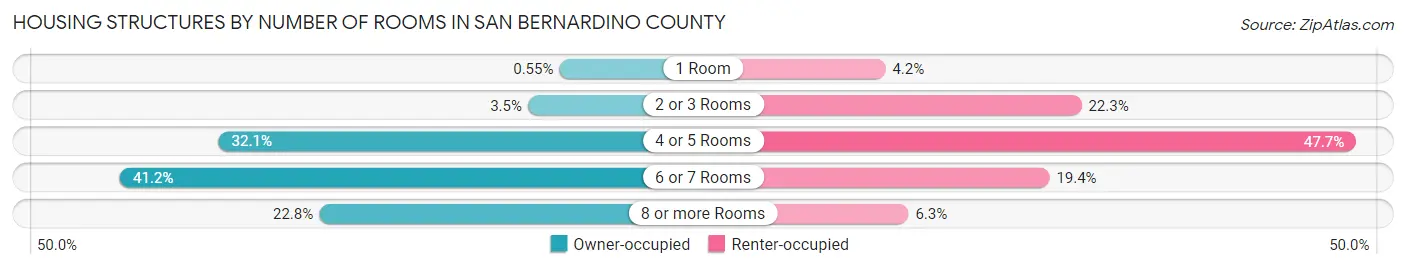
| Number of Rooms | Owner-occupied | Renter-occupied |
| 1 Room | 2,198 (0.5%) | 10,802 (4.2%) |
| 2 or 3 Rooms | 13,958 (3.5%) | 57,368 (22.3%) |
| 4 or 5 Rooms | 129,210 (32.1%) | 122,590 (47.7%) |
| 6 or 7 Rooms | 165,942 (41.2%) | 49,783 (19.4%) |
| 8 or more Rooms | 91,797 (22.8%) | 16,280 (6.3%) |
| Total | 403,105 (100.0%) | 256,823 (100.0%) |
Housing Structure by Heating Type in San Bernardino County
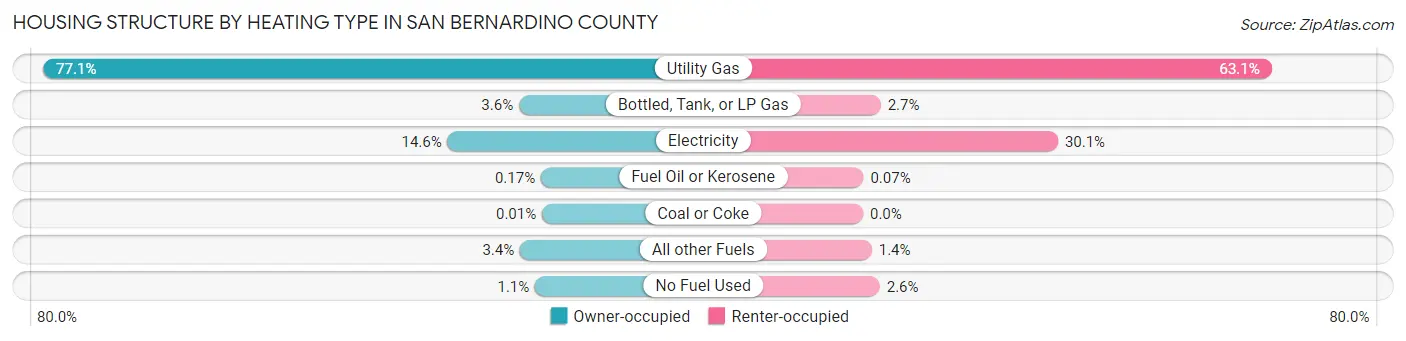
| Heating Type | Owner-occupied | Renter-occupied |
| Utility Gas | 310,930 (77.1%) | 162,155 (63.1%) |
| Bottled, Tank, or LP Gas | 14,409 (3.6%) | 7,006 (2.7%) |
| Electricity | 58,937 (14.6%) | 77,387 (30.1%) |
| Fuel Oil or Kerosene | 686 (0.2%) | 169 (0.1%) |
| Coal or Coke | 43 (0.0%) | 7 (0.0%) |
| All other Fuels | 13,759 (3.4%) | 3,456 (1.3%) |
| No Fuel Used | 4,341 (1.1%) | 6,643 (2.6%) |
| Total | 403,105 (100.0%) | 256,823 (100.0%) |
Household Vehicle Usage in San Bernardino County
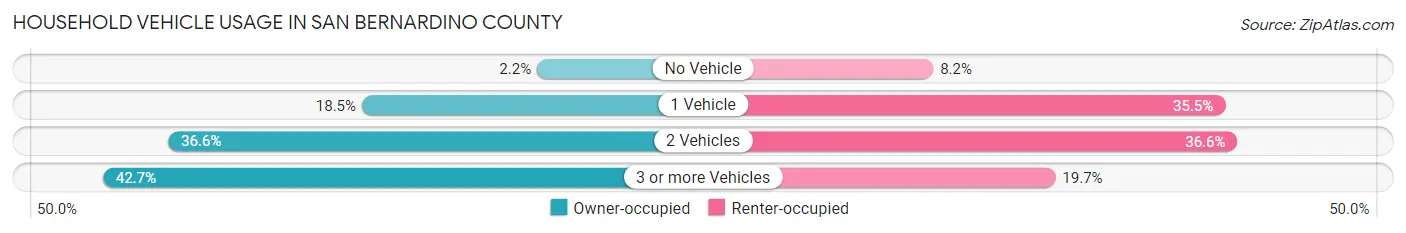
| Vehicles per Household | Owner-occupied | Renter-occupied |
| No Vehicle | 8,760 (2.2%) | 21,173 (8.2%) |
| 1 Vehicle | 74,642 (18.5%) | 91,115 (35.5%) |
| 2 Vehicles | 147,560 (36.6%) | 94,067 (36.6%) |
| 3 or more Vehicles | 172,143 (42.7%) | 50,468 (19.7%) |
| Total | 403,105 (100.0%) | 256,823 (100.0%) |
Real Estate & Mortgages in San Bernardino County
Real Estate and Mortgage Overview in San Bernardino County
| Characteristic | Without Mortgage | With Mortgage |
| Housing Units | 120,907 | 282,198 |
| Median Property Value | $371,900 | $460,500 |
| Median Household Income | $68,310 | $87,015 |
| Monthly Housing Costs | $583 | $60,162 |
| Real Estate Taxes | $2,311 | $5,822 |
Property Value by Mortgage Status in San Bernardino County
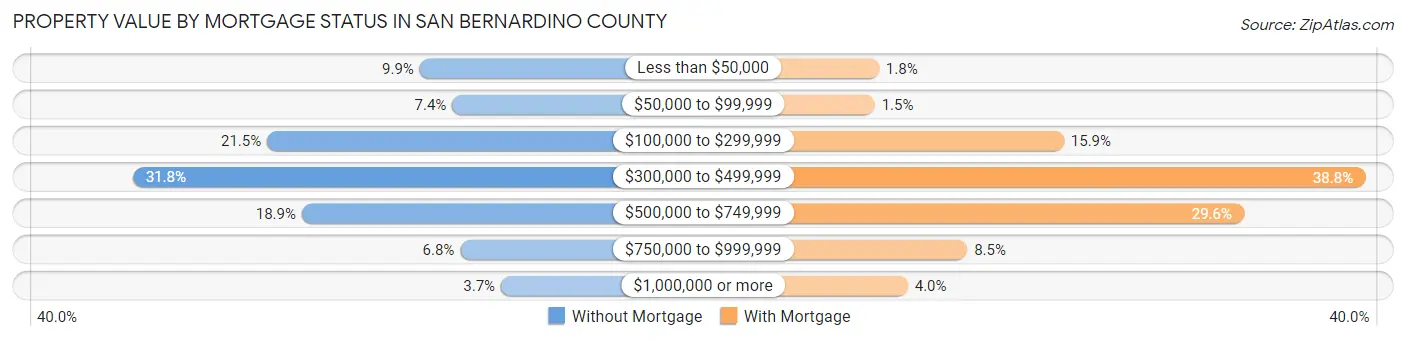
| Property Value | Without Mortgage | With Mortgage |
| Less than $50,000 | 11,974 (9.9%) | 5,031 (1.8%) |
| $50,000 to $99,999 | 8,967 (7.4%) | 4,122 (1.5%) |
| $100,000 to $299,999 | 26,028 (21.5%) | 44,797 (15.9%) |
| $300,000 to $499,999 | 38,396 (31.8%) | 109,512 (38.8%) |
| $500,000 to $749,999 | 22,823 (18.9%) | 83,471 (29.6%) |
| $750,000 to $999,999 | 8,233 (6.8%) | 24,029 (8.5%) |
| $1,000,000 or more | 4,486 (3.7%) | 11,236 (4.0%) |
| Total | 120,907 (100.0%) | 282,198 (100.0%) |
Household Income by Mortgage Status in San Bernardino County
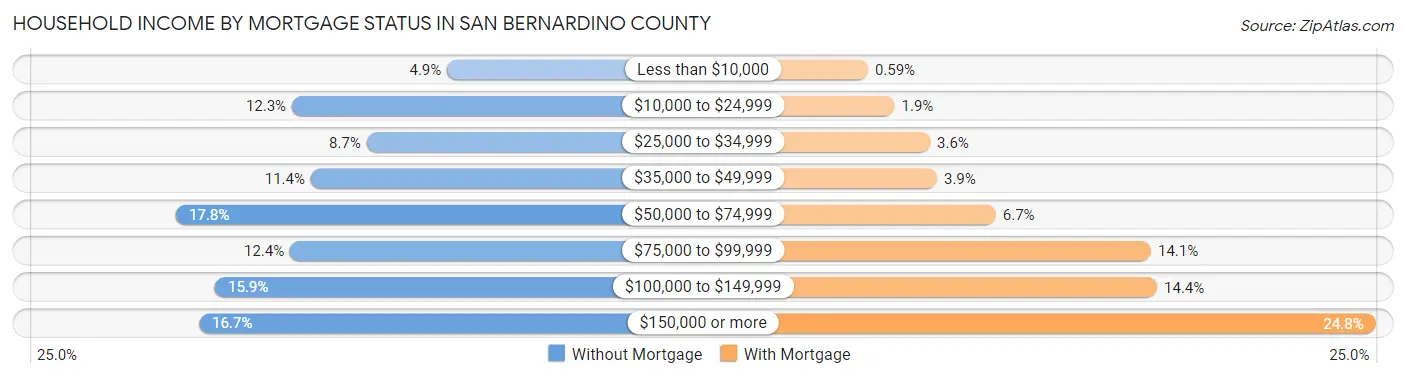
| Household Income | Without Mortgage | With Mortgage |
| Less than $10,000 | 5,906 (4.9%) | 1,677 (0.6%) |
| $10,000 to $24,999 | 14,832 (12.3%) | 5,251 (1.9%) |
| $25,000 to $34,999 | 10,532 (8.7%) | 10,029 (3.5%) |
| $35,000 to $49,999 | 13,749 (11.4%) | 10,961 (3.9%) |
| $50,000 to $74,999 | 21,508 (17.8%) | 18,838 (6.7%) |
| $75,000 to $99,999 | 14,940 (12.4%) | 39,712 (14.1%) |
| $100,000 to $149,999 | 19,259 (15.9%) | 40,518 (14.4%) |
| $150,000 or more | 20,181 (16.7%) | 69,874 (24.8%) |
| Total | 120,907 (100.0%) | 282,198 (100.0%) |
Property Value to Household Income Ratio in San Bernardino County
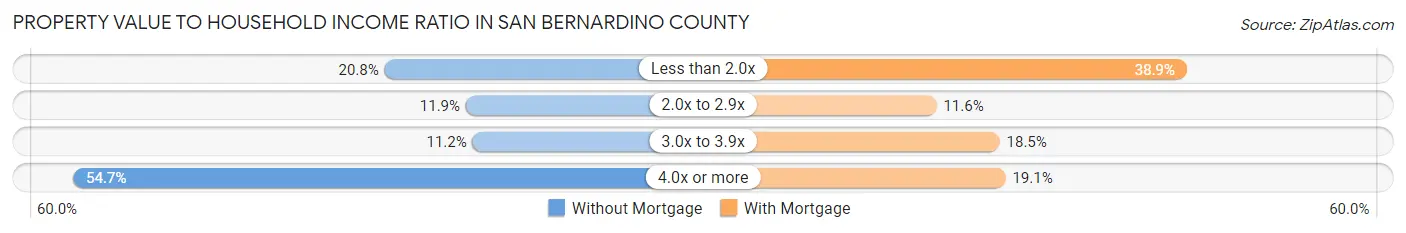
| Value-to-Income Ratio | Without Mortgage | With Mortgage |
| Less than 2.0x | 25,123 (20.8%) | 109,755 (38.9%) |
| 2.0x to 2.9x | 14,414 (11.9%) | 32,770 (11.6%) |
| 3.0x to 3.9x | 13,533 (11.2%) | 52,179 (18.5%) |
| 4.0x or more | 66,163 (54.7%) | 53,993 (19.1%) |
| Total | 120,907 (100.0%) | 282,198 (100.0%) |
Real Estate Taxes by Mortgage Status in San Bernardino County
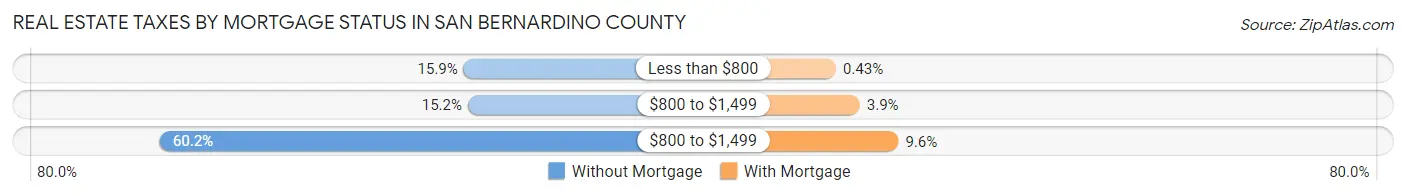
| Property Taxes | Without Mortgage | With Mortgage |
| Less than $800 | 19,160 (15.9%) | 1,217 (0.4%) |
| $800 to $1,499 | 18,428 (15.2%) | 11,030 (3.9%) |
| $800 to $1,499 | 72,812 (60.2%) | 27,007 (9.6%) |
| Total | 120,907 (100.0%) | 282,198 (100.0%) |
Health & Disability in San Bernardino County
Health Insurance Coverage by Age in San Bernardino County
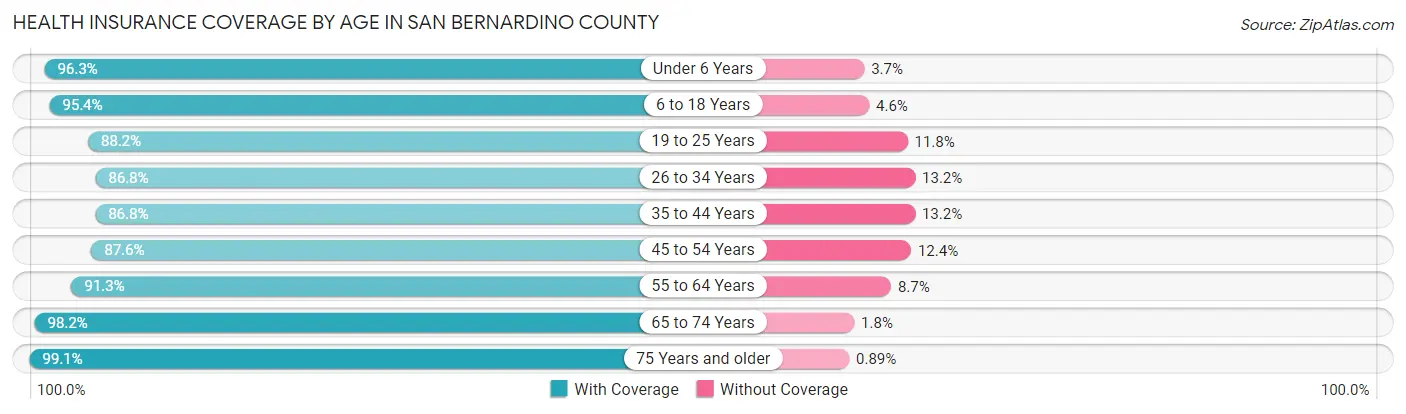
| Age Bracket | With Coverage | Without Coverage |
| Under 6 Years | 168,069 (96.3%) | 6,476 (3.7%) |
| 6 to 18 Years | 402,696 (95.4%) | 19,523 (4.6%) |
| 19 to 25 Years | 191,296 (88.2%) | 25,588 (11.8%) |
| 26 to 34 Years | 251,286 (86.8%) | 38,221 (13.2%) |
| 35 to 44 Years | 245,135 (86.8%) | 37,216 (13.2%) |
| 45 to 54 Years | 225,888 (87.6%) | 32,107 (12.4%) |
| 55 to 64 Years | 220,507 (91.3%) | 21,040 (8.7%) |
| 65 to 74 Years | 155,955 (98.2%) | 2,921 (1.8%) |
| 75 Years and older | 95,690 (99.1%) | 863 (0.9%) |
| Total | 1,956,522 (91.4%) | 183,955 (8.6%) |
Health Insurance Coverage by Citizenship Status in San Bernardino County
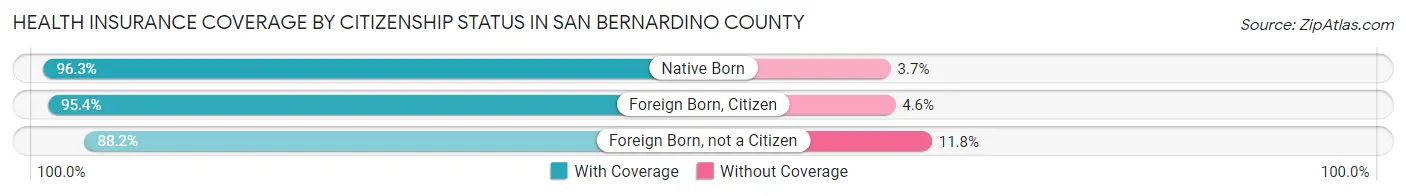
| Citizenship Status | With Coverage | Without Coverage |
| Native Born | 168,069 (96.3%) | 6,476 (3.7%) |
| Foreign Born, Citizen | 402,696 (95.4%) | 19,523 (4.6%) |
| Foreign Born, not a Citizen | 191,296 (88.2%) | 25,588 (11.8%) |
Health Insurance Coverage by Household Income in San Bernardino County
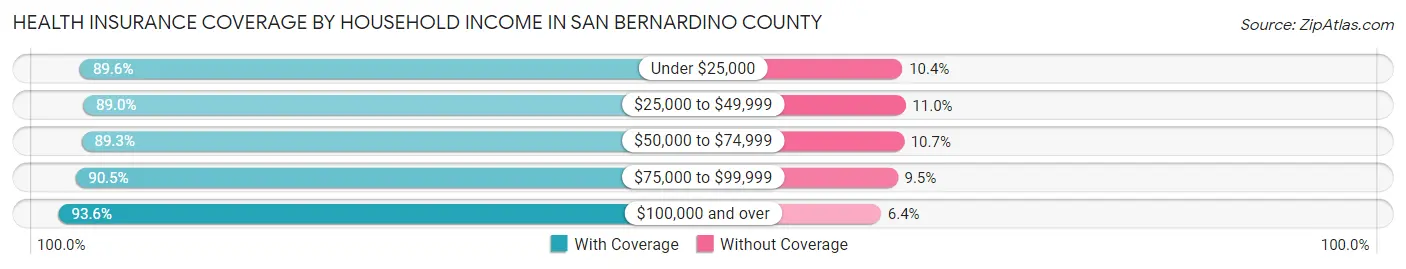
| Household Income | With Coverage | Without Coverage |
| Under $25,000 | 182,679 (89.6%) | 21,154 (10.4%) |
| $25,000 to $49,999 | 290,045 (89.0%) | 35,770 (11.0%) |
| $50,000 to $74,999 | 310,793 (89.3%) | 37,113 (10.7%) |
| $75,000 to $99,999 | 270,984 (90.5%) | 28,457 (9.5%) |
| $100,000 and over | 891,189 (93.6%) | 60,709 (6.4%) |
Public vs Private Health Insurance Coverage by Age in San Bernardino County
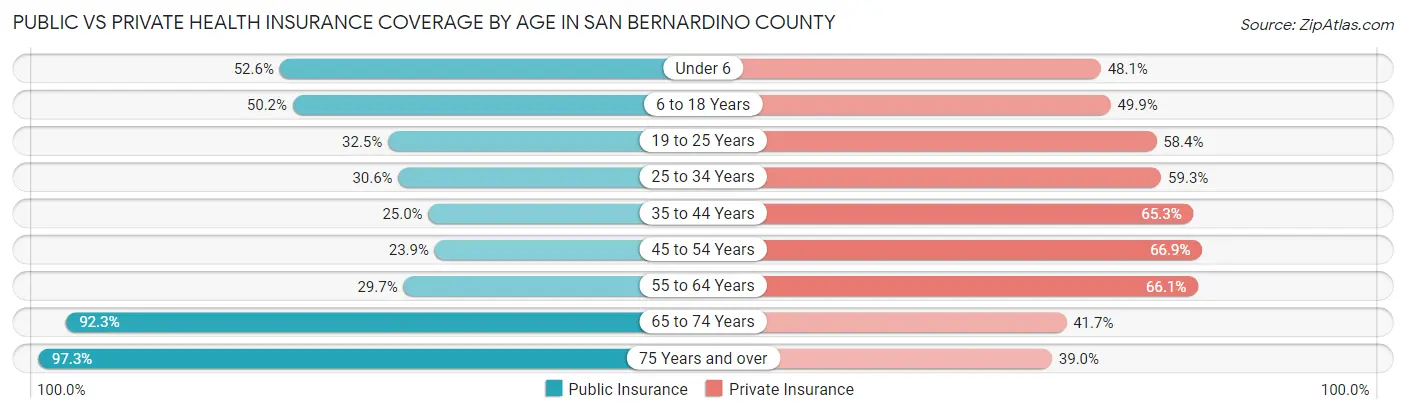
| Age Bracket | Public Insurance | Private Insurance |
| Under 6 | 91,880 (52.6%) | 83,880 (48.1%) |
| 6 to 18 Years | 212,005 (50.2%) | 210,546 (49.9%) |
| 19 to 25 Years | 70,553 (32.5%) | 126,574 (58.4%) |
| 25 to 34 Years | 88,632 (30.6%) | 171,622 (59.3%) |
| 35 to 44 Years | 70,712 (25.0%) | 184,345 (65.3%) |
| 45 to 54 Years | 61,557 (23.9%) | 172,601 (66.9%) |
| 55 to 64 Years | 71,672 (29.7%) | 159,757 (66.1%) |
| 65 to 74 Years | 146,592 (92.3%) | 66,190 (41.7%) |
| 75 Years and over | 93,987 (97.3%) | 37,649 (39.0%) |
| Total | 907,590 (42.4%) | 1,213,164 (56.7%) |
Disability Status by Sex by Age in San Bernardino County
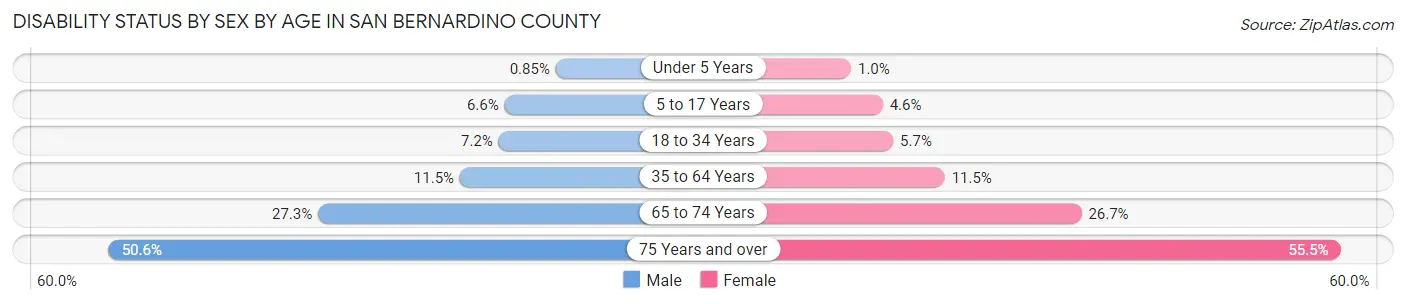
| Age Bracket | Male | Female |
| Under 5 Years | 628 (0.9%) | 727 (1.0%) |
| 5 to 17 Years | 14,068 (6.6%) | 9,342 (4.6%) |
| 18 to 34 Years | 19,571 (7.2%) | 15,268 (5.7%) |
| 35 to 64 Years | 44,452 (11.5%) | 45,379 (11.5%) |
| 65 to 74 Years | 20,378 (27.3%) | 22,500 (26.7%) |
| 75 Years and over | 20,423 (50.6%) | 31,216 (55.5%) |
Disability Class by Sex by Age in San Bernardino County
Disability Class: Hearing Difficulty
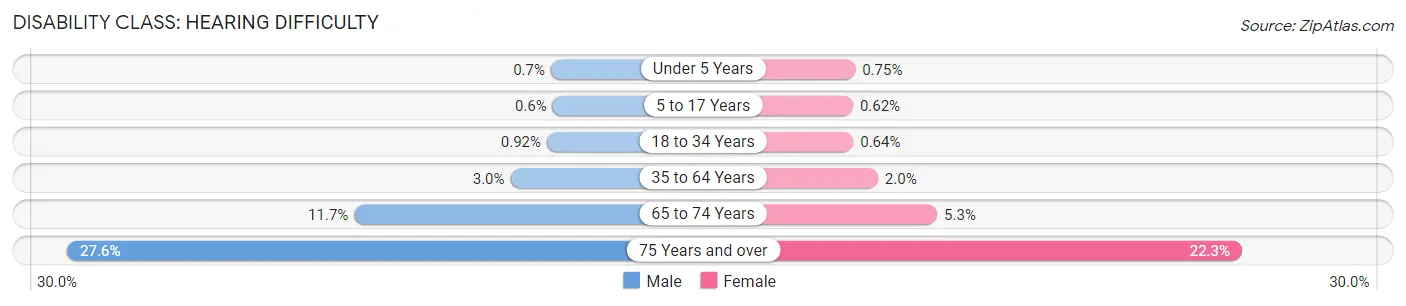
| Age Bracket | Male | Female |
| Under 5 Years | 520 (0.7%) | 533 (0.7%) |
| 5 to 17 Years | 1,285 (0.6%) | 1,268 (0.6%) |
| 18 to 34 Years | 2,504 (0.9%) | 1,701 (0.6%) |
| 35 to 64 Years | 11,405 (2.9%) | 7,949 (2.0%) |
| 65 to 74 Years | 8,685 (11.7%) | 4,478 (5.3%) |
| 75 Years and over | 11,146 (27.6%) | 12,520 (22.3%) |
Disability Class: Vision Difficulty
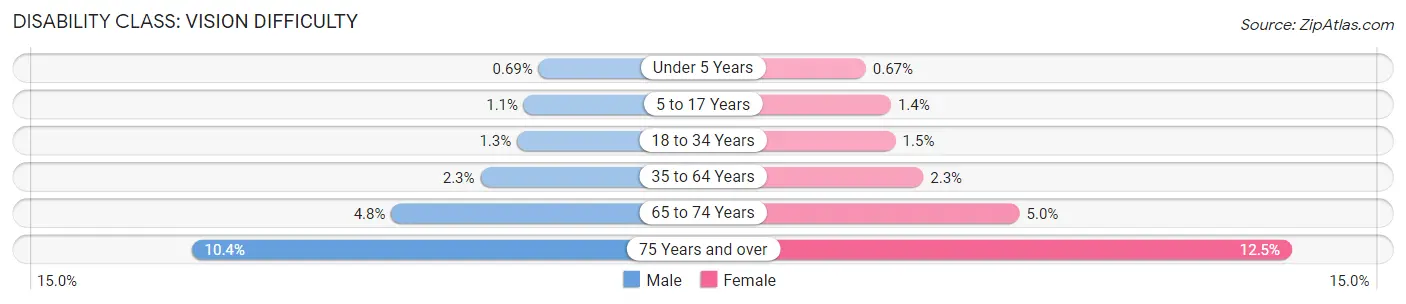
| Age Bracket | Male | Female |
| Under 5 Years | 509 (0.7%) | 475 (0.7%) |
| 5 to 17 Years | 2,371 (1.1%) | 2,800 (1.4%) |
| 18 to 34 Years | 3,503 (1.3%) | 3,992 (1.5%) |
| 35 to 64 Years | 8,934 (2.3%) | 8,970 (2.3%) |
| 65 to 74 Years | 3,571 (4.8%) | 4,173 (5.0%) |
| 75 Years and over | 4,176 (10.3%) | 7,046 (12.5%) |
Disability Class: Cognitive Difficulty
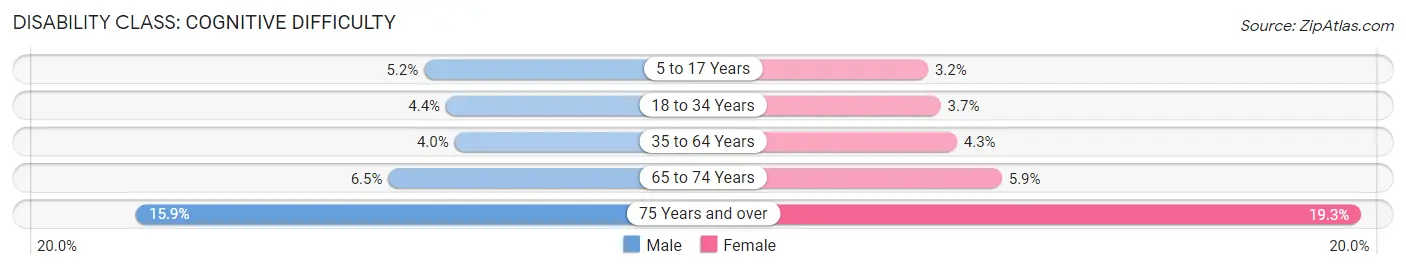
| Age Bracket | Male | Female |
| 5 to 17 Years | 11,105 (5.2%) | 6,552 (3.2%) |
| 18 to 34 Years | 11,863 (4.4%) | 9,803 (3.7%) |
| 35 to 64 Years | 15,595 (4.0%) | 16,917 (4.3%) |
| 65 to 74 Years | 4,845 (6.5%) | 5,004 (5.9%) |
| 75 Years and over | 6,396 (15.9%) | 10,840 (19.3%) |
Disability Class: Ambulatory Difficulty
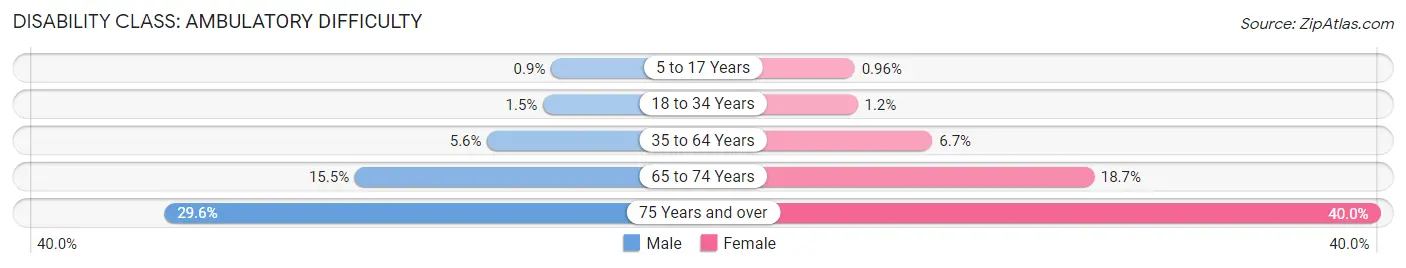
| Age Bracket | Male | Female |
| 5 to 17 Years | 1,924 (0.9%) | 1,959 (1.0%) |
| 18 to 34 Years | 4,088 (1.5%) | 3,116 (1.2%) |
| 35 to 64 Years | 21,765 (5.6%) | 26,602 (6.7%) |
| 65 to 74 Years | 11,536 (15.5%) | 15,774 (18.7%) |
| 75 Years and over | 11,952 (29.6%) | 22,482 (40.0%) |
Disability Class: Self-Care Difficulty
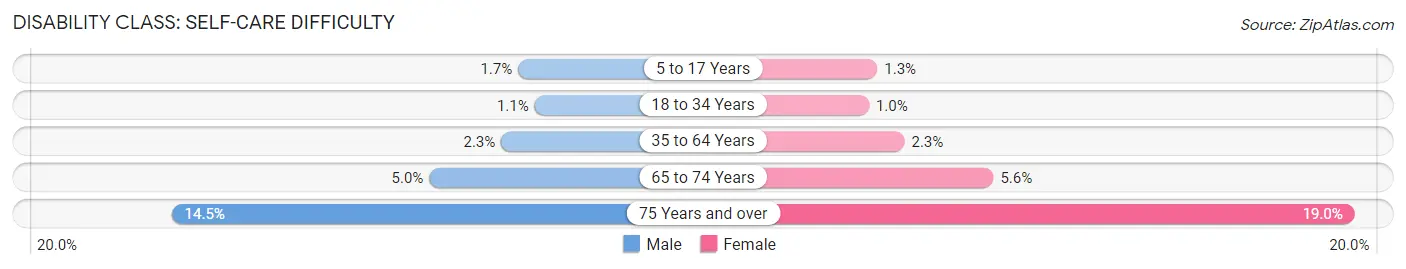
| Age Bracket | Male | Female |
| 5 to 17 Years | 3,599 (1.7%) | 2,709 (1.3%) |
| 18 to 34 Years | 2,902 (1.1%) | 2,709 (1.0%) |
| 35 to 64 Years | 8,936 (2.3%) | 9,236 (2.3%) |
| 65 to 74 Years | 3,714 (5.0%) | 4,746 (5.6%) |
| 75 Years and over | 5,864 (14.5%) | 10,706 (19.0%) |
Technology Access in San Bernardino County
Computing Device Access in San Bernardino County
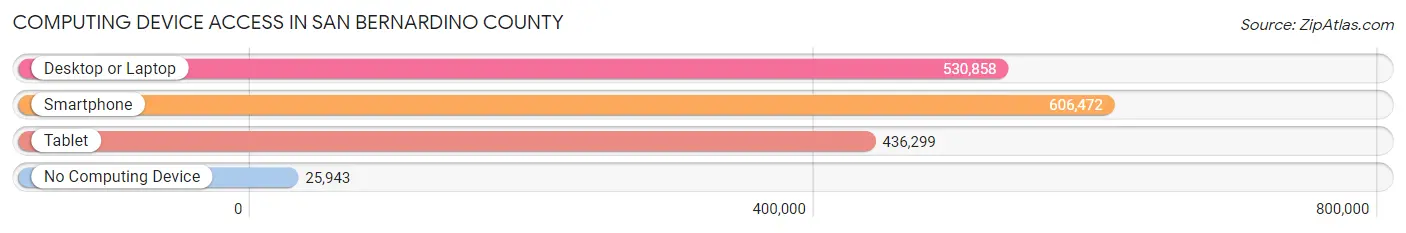
| Device Type | # Households | % Households |
| Desktop or Laptop | 530,858 | 80.4% |
| Smartphone | 606,472 | 91.9% |
| Tablet | 436,299 | 66.1% |
| No Computing Device | 25,943 | 3.9% |
| Total | 659,928 | 100.0% |
Internet Access in San Bernardino County
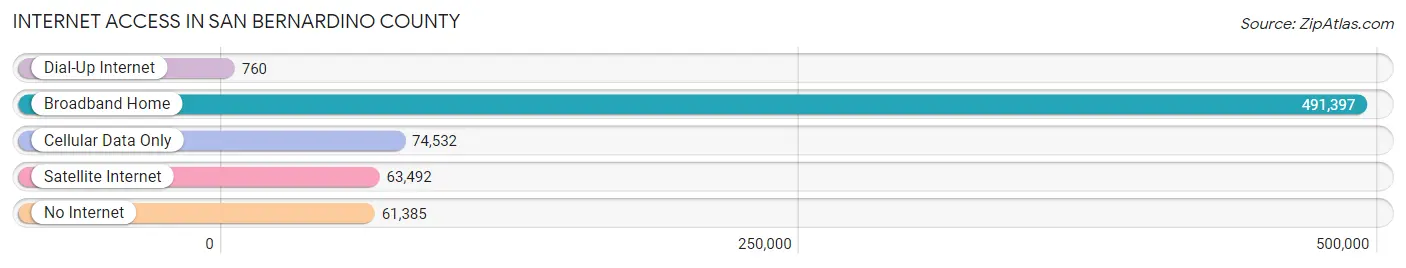
| Internet Type | # Households | % Households |
| Dial-Up Internet | 760 | 0.1% |
| Broadband Home | 491,397 | 74.5% |
| Cellular Data Only | 74,532 | 11.3% |
| Satellite Internet | 63,492 | 9.6% |
| No Internet | 61,385 | 9.3% |
| Total | 659,928 | 100.0% |
San Bernardino County Summary
San Bernardino County is located in the southern portion of California and is the largest county in the state by area. It is bordered by Los Angeles County to the west, Orange County to the south, Riverside County to the east, and Kern County to the north. The county seat is San Bernardino, which is also the largest city in the county.
History
San Bernardino County was established in 1853 and was named after Saint Bernardino of Siena, an Italian Franciscan friar. The area was originally inhabited by the Serrano and Cahuilla Native American tribes. The first Europeans to explore the area were the Spanish, who arrived in the late 1700s. The area was part of Mexico until 1848, when it became part of the United States after the Mexican-American War.
The county was initially used for ranching and mining, and the first settlers arrived in the 1850s. The county was officially established in 1853 and the city of San Bernardino was incorporated in 1854. The county experienced rapid growth in the late 1800s and early 1900s due to the arrival of the railroad and the discovery of gold and silver in the area.
Geography
San Bernardino County covers an area of 20,105 square miles, making it the largest county in California. It is located in the southern portion of the state and is bordered by Los Angeles County to the west, Orange County to the south, Riverside County to the east, and Kern County to the north. The county is divided into two distinct regions: the Mojave Desert in the east and the San Bernardino Mountains in the west.
The county is home to several mountain ranges, including the San Bernardino Mountains, the San Gabriel Mountains, and the San Jacinto Mountains. The highest point in the county is San Gorgonio Mountain, which has an elevation of 11,503 feet. The county also contains several rivers, including the Mojave River, the Santa Ana River, and the San Gabriel River.
Economy
San Bernardino County has a diverse economy that is driven by several industries, including manufacturing, healthcare, retail, and tourism. The county is home to several major employers, including Amazon, Stater Bros. Markets, and the San Manuel Band of Mission Indians.
The county is also home to several military bases, including the Marine Corps Air Ground Combat Center Twentynine Palms, the Marine Corps Logistics Base Barstow, and the Naval Air Weapons Station China Lake.
Demographics
As of the 2020 census, San Bernardino County had a population of 2,170,110. The population is racially and ethnically diverse, with the largest racial/ethnic groups being White (48.2%), Hispanic or Latino (37.2%), and Black or African American (7.2%). The median household income is $60,945 and the median age is 34.
San Bernardino County is home to several major cities, including San Bernardino, Fontana, Rancho Cucamonga, and Victorville. The county also contains several smaller towns and unincorporated communities.
Conclusion
San Bernardino County is the largest county in California and is located in the southern portion of the state. It has a diverse economy that is driven by several industries, including manufacturing, healthcare, retail, and tourism. The county is also home to several major cities and military bases. The population is racially and ethnically diverse, with the largest racial/ethnic groups being White, Hispanic or Latino, and Black or African American.
Common Questions
What is Per Capita Income in San Bernardino County?
Per Capita income in San Bernardino County is $31,348.
What is the Median Family Income in San Bernardino County?
Median Family Income in San Bernardino County is $85,528.
What is the Median Household income in San Bernardino County?
Median Household Income in San Bernardino County is $77,423.
What is Income or Wage Gap in San Bernardino County?
Income or Wage Gap in San Bernardino County is 26.0%.
Women in San Bernardino County earn 74.0 cents for every dollar earned by a man.
What is Family Income Deficit in San Bernardino County?
Family Income Deficit in San Bernardino County is $11,861.
Families that are below poverty line in San Bernardino County earn $11,861 less on average than the poverty threshold level.
What is Inequality or Gini Index in San Bernardino County?
Inequality or Gini Index in San Bernardino County is 0.44.
What is the Total Population of San Bernardino County?
Total Population of San Bernardino County is 2,180,563.
What is the Total Male Population of San Bernardino County?
Total Male Population of San Bernardino County is 1,094,825.
What is the Total Female Population of San Bernardino County?
Total Female Population of San Bernardino County is 1,085,738.
What is the Ratio of Males per 100 Females in San Bernardino County?
There are 100.84 Males per 100 Females in San Bernardino County.
What is the Ratio of Females per 100 Males in San Bernardino County?
There are 99.17 Females per 100 Males in San Bernardino County.
What is the Median Population Age in San Bernardino County?
Median Population Age in San Bernardino County is 33.9 Years.
What is the Average Family Size in San Bernardino County
Average Family Size in San Bernardino County is 3.7 People.
What is the Average Household Size in San Bernardino County
Average Household Size in San Bernardino County is 3.2 People.
How Large is the Labor Force in San Bernardino County?
There are 1,044,064 People in the Labor Forcein in San Bernardino County.
What is the Percentage of People in the Labor Force in San Bernardino County?
62.1% of People are in the Labor Force in San Bernardino County.
What is the Unemployment Rate in San Bernardino County?
Unemployment Rate in San Bernardino County is 7.2%.