Sacramento County, CA Map & Demographics
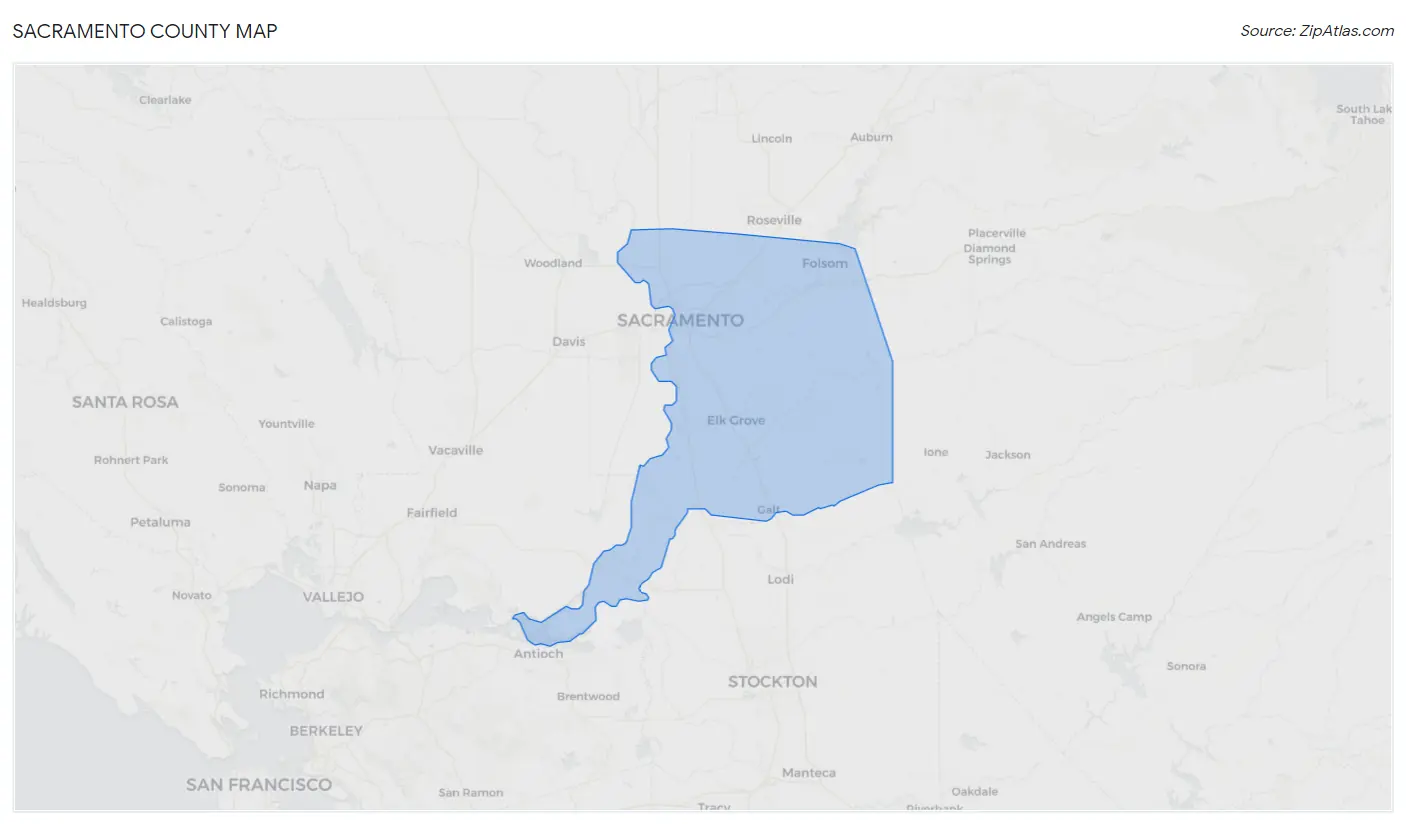
Sacramento County Map
Sacramento County Overview
$39,763
PER CAPITA INCOME
$97,966
AVG FAMILY INCOME
$84,010
AVG HOUSEHOLD INCOME
16.6%
WAGE / INCOME GAP [ % ]
83.4¢/ $1
WAGE / INCOME GAP [ $ ]
$11,855
FAMILY INCOME DEFICIT
0.44
INEQUALITY / GINI INDEX
1,579,211
TOTAL POPULATION
779,030
MALE POPULATION
800,181
FEMALE POPULATION
97.36
MALES / 100 FEMALES
102.72
FEMALES / 100 MALES
36.8
MEDIAN AGE
3.4
AVG FAMILY SIZE
2.8
AVG HOUSEHOLD SIZE
796,969
LABOR FORCE [ PEOPLE ]
63.5%
PERCENT IN LABOR FORCE
6.3%
UNEMPLOYMENT RATE
Income in Sacramento County
Income Overview in Sacramento County
Per Capita Income in Sacramento County is $39,763, while median incomes of families and households are $97,966 and $84,010 respectively.
| Characteristic | Number | Measure |
| Per Capita Income | 1,579,211 | $39,763 |
| Median Family Income | 372,584 | $97,966 |
| Mean Family Income | 372,584 | $122,662 |
| Median Household Income | 563,856 | $84,010 |
| Mean Household Income | 563,856 | $108,612 |
| Income Deficit | 372,584 | $11,855 |
| Wage / Income Gap (%) | 1,579,211 | 16.58% |
| Wage / Income Gap ($) | 1,579,211 | 83.42¢ per $1 |
| Gini / Inequality Index | 1,579,211 | 0.44 |
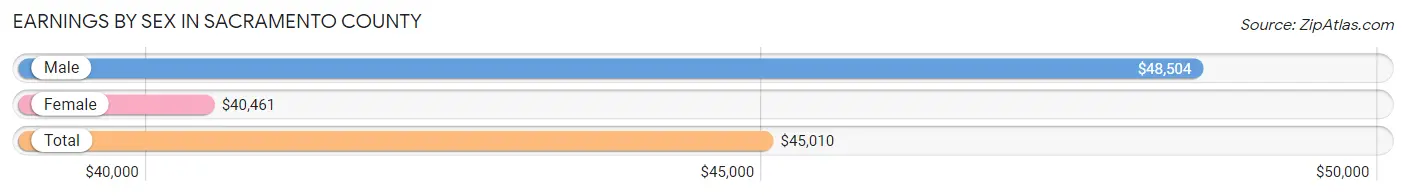
Earnings by Sex in Sacramento County
Average Earnings in Sacramento County are $45,010, $48,504 for men and $40,461 for women, a difference of 16.6%.
| Sex | Number | Average Earnings |
| Male | 425,435 (52.3%) | $48,504 |
| Female | 387,622 (47.7%) | $40,461 |
| Total | 813,057 (100.0%) | $45,010 |
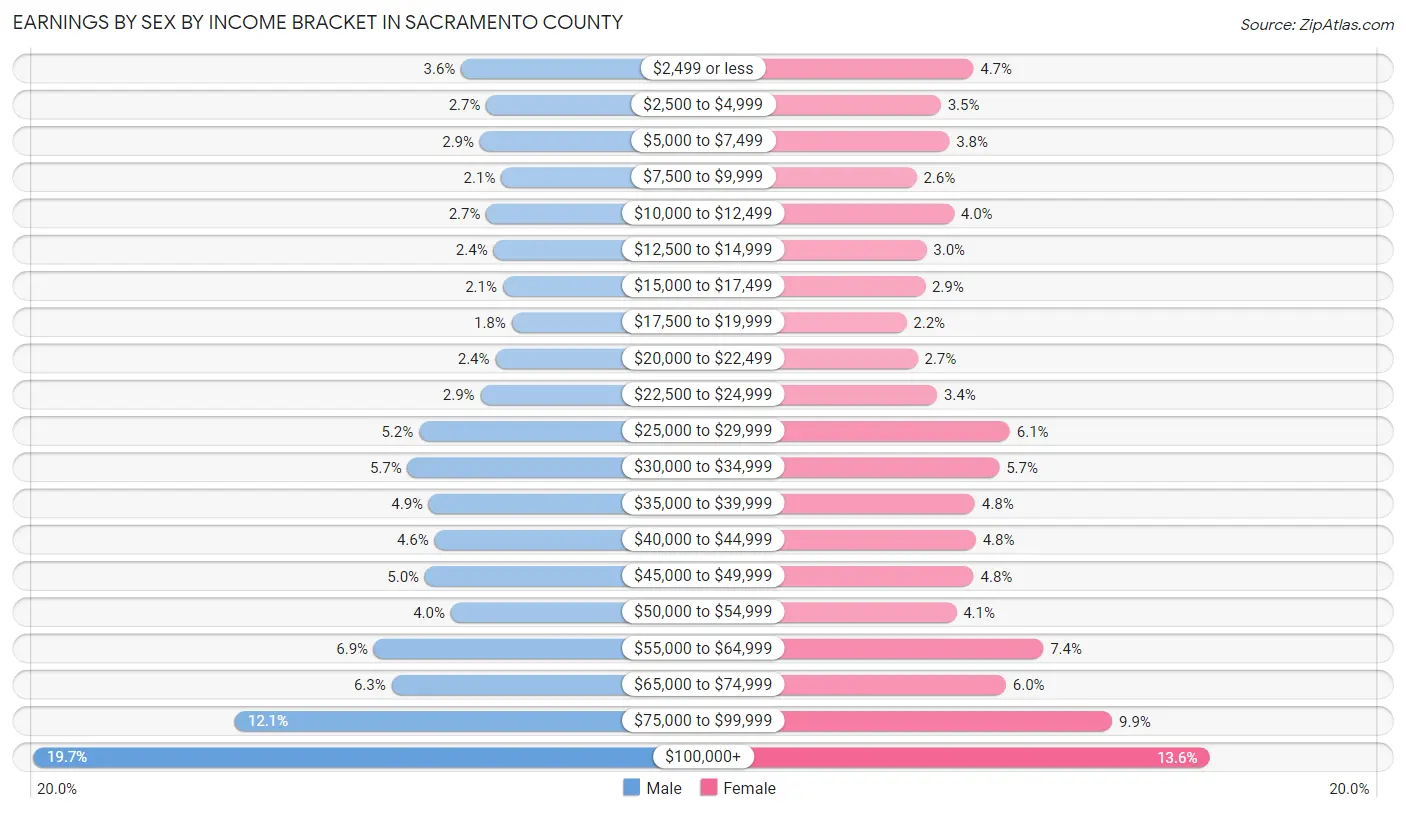
Earnings by Sex by Income Bracket in Sacramento County
The most common earnings brackets in Sacramento County are $100,000+ for men (83,597 | 19.7%) and $100,000+ for women (52,628 | 13.6%).
| Income | Male | Female |
| $2,499 or less | 15,473 (3.6%) | 18,366 (4.7%) |
| $2,500 to $4,999 | 11,505 (2.7%) | 13,636 (3.5%) |
| $5,000 to $7,499 | 12,513 (2.9%) | 14,867 (3.8%) |
| $7,500 to $9,999 | 9,114 (2.1%) | 10,101 (2.6%) |
| $10,000 to $12,499 | 11,502 (2.7%) | 15,549 (4.0%) |
| $12,500 to $14,999 | 10,345 (2.4%) | 11,538 (3.0%) |
| $15,000 to $17,499 | 8,849 (2.1%) | 11,359 (2.9%) |
| $17,500 to $19,999 | 7,439 (1.8%) | 8,650 (2.2%) |
| $20,000 to $22,499 | 10,041 (2.4%) | 10,260 (2.6%) |
| $22,500 to $24,999 | 12,443 (2.9%) | 13,094 (3.4%) |
| $25,000 to $29,999 | 22,188 (5.2%) | 23,666 (6.1%) |
| $30,000 to $34,999 | 24,055 (5.7%) | 22,116 (5.7%) |
| $35,000 to $39,999 | 20,648 (4.9%) | 18,625 (4.8%) |
| $40,000 to $44,999 | 19,761 (4.6%) | 18,730 (4.8%) |
| $45,000 to $49,999 | 21,255 (5.0%) | 18,394 (4.8%) |
| $50,000 to $54,999 | 17,166 (4.0%) | 15,905 (4.1%) |
| $55,000 to $64,999 | 29,406 (6.9%) | 28,512 (7.4%) |
| $65,000 to $74,999 | 26,582 (6.2%) | 23,085 (6.0%) |
| $75,000 to $99,999 | 51,553 (12.1%) | 38,541 (9.9%) |
| $100,000+ | 83,597 (19.7%) | 52,628 (13.6%) |
| Total | 425,435 (100.0%) | 387,622 (100.0%) |
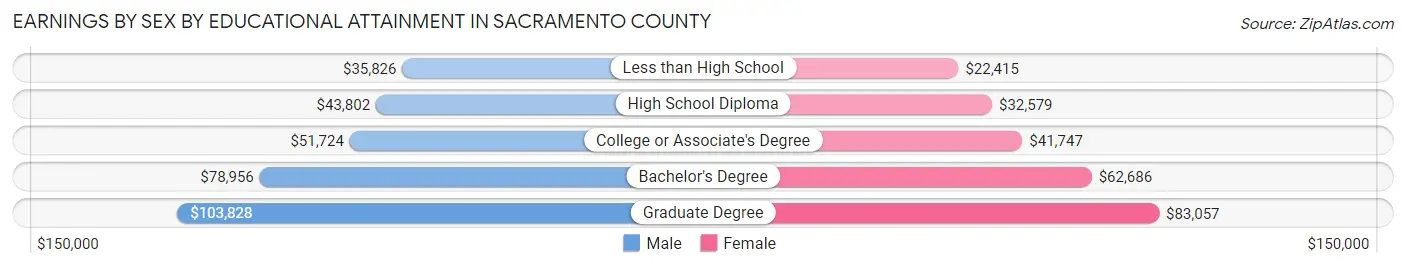
Earnings by Sex by Educational Attainment in Sacramento County
Average earnings in Sacramento County are $55,609 for men and $46,634 for women, a difference of 16.1%. Men with an educational attainment of graduate degree enjoy the highest average annual earnings of $103,828, while those with less than high school education earn the least with $35,826. Women with an educational attainment of graduate degree earn the most with the average annual earnings of $83,057, while those with less than high school education have the smallest earnings of $22,415.
| Educational Attainment | Male Income | Female Income |
| Less than High School | $35,826 | $22,415 |
| High School Diploma | $43,802 | $32,579 |
| College or Associate's Degree | $51,724 | $41,747 |
| Bachelor's Degree | $78,956 | $62,686 |
| Graduate Degree | $103,828 | $83,057 |
| Total | $55,609 | $46,634 |
Family Income in Sacramento County
Family Income Brackets in Sacramento County
According to the Sacramento County family income data, there are 77,497 families falling into the $100,000 to $149,999 income range, which is the most common income bracket and makes up 20.8% of all families. Conversely, the $10,000 to $14,999 income bracket is the least frequent group with only 6,707 families (1.8%) belonging to this category.
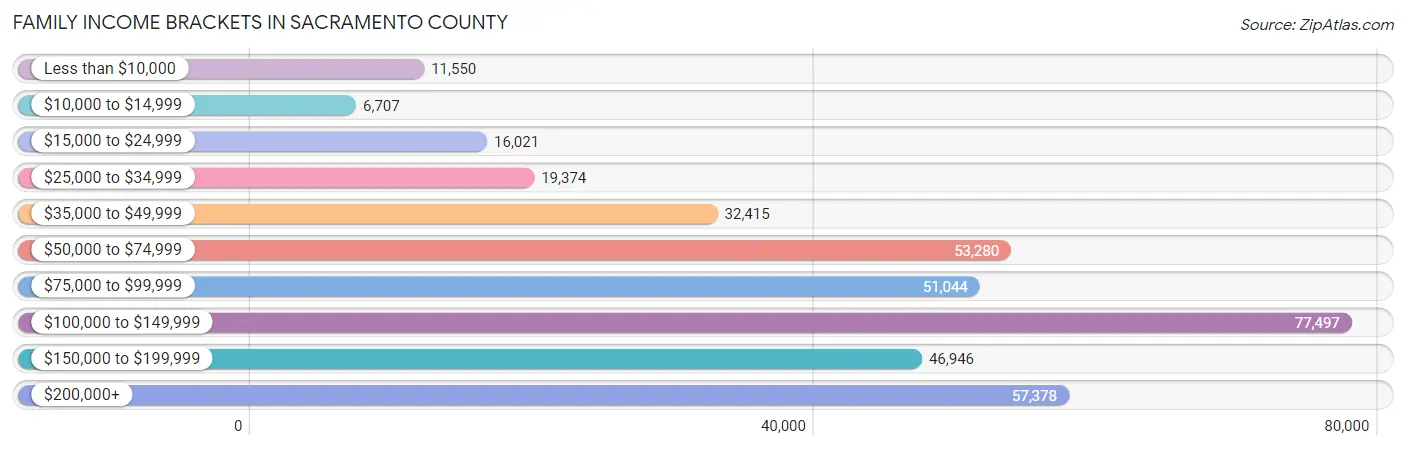
| Income Bracket | # Families | % Families |
| Less than $10,000 | 11,550 | 3.1% |
| $10,000 to $14,999 | 6,707 | 1.8% |
| $15,000 to $24,999 | 16,021 | 4.3% |
| $25,000 to $34,999 | 19,374 | 5.2% |
| $35,000 to $49,999 | 32,415 | 8.7% |
| $50,000 to $74,999 | 53,280 | 14.3% |
| $75,000 to $99,999 | 51,044 | 13.7% |
| $100,000 to $149,999 | 77,497 | 20.8% |
| $150,000 to $199,999 | 46,946 | 12.6% |
| $200,000+ | 57,378 | 15.4% |
Family Income by Famaliy Size in Sacramento County
7+ person families (11,417 | 3.1%) account for the highest median family income in Sacramento County with $118,177 per family, while 2-person families (151,426 | 40.6%) have the highest median income of $45,032 per family member.
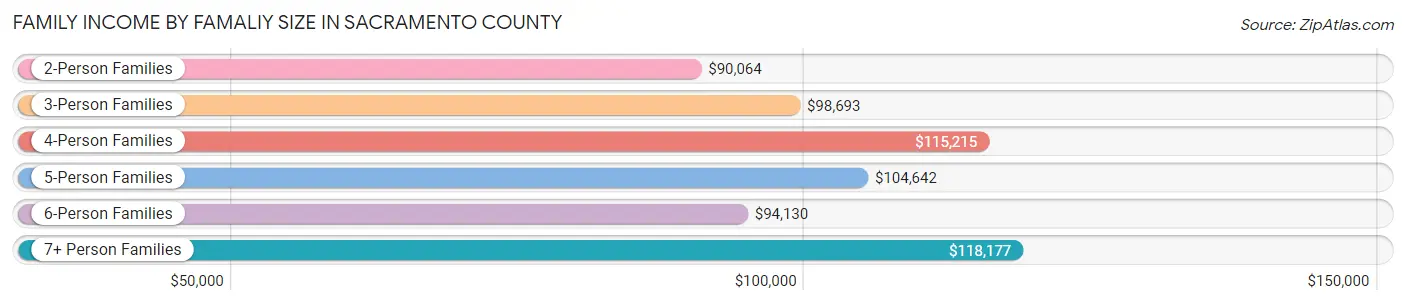
| Income Bracket | # Families | Median Income |
| 2-Person Families | 151,426 (40.6%) | $90,064 |
| 3-Person Families | 83,090 (22.3%) | $98,693 |
| 4-Person Families | 74,816 (20.1%) | $115,215 |
| 5-Person Families | 36,756 (9.9%) | $104,642 |
| 6-Person Families | 15,079 (4.1%) | $94,130 |
| 7+ Person Families | 11,417 (3.1%) | $118,177 |
| Total | 372,584 (100.0%) | $97,966 |
Family Income by Number of Earners in Sacramento County
The median family income in Sacramento County is $97,966, with families comprising 3+ earners (49,083) having the highest median family income of $147,026, while families with no earners (50,146) have the lowest median family income of $55,176, accounting for 13.2% and 13.5% of families, respectively.
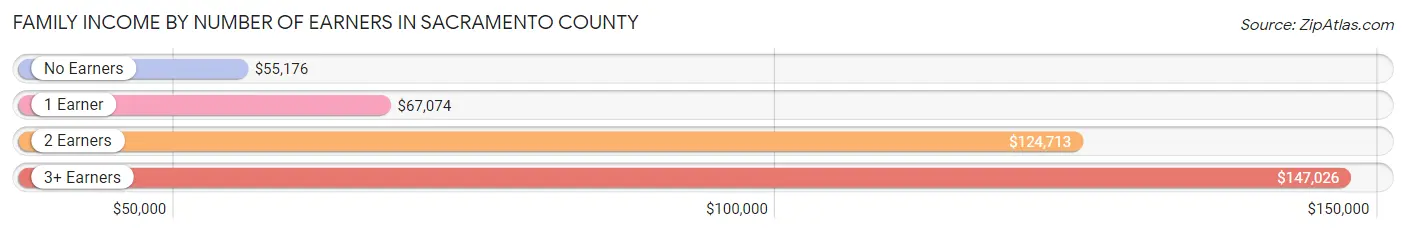
| Number of Earners | # Families | Median Income |
| No Earners | 50,146 (13.5%) | $55,176 |
| 1 Earner | 121,681 (32.7%) | $67,074 |
| 2 Earners | 151,674 (40.7%) | $124,713 |
| 3+ Earners | 49,083 (13.2%) | $147,026 |
| Total | 372,584 (100.0%) | $97,966 |
Household Income in Sacramento County
Household Income Brackets in Sacramento County
With 107,133 households falling in the category, the $100,000 to $149,999 income range is the most frequent in Sacramento County, accounting for 19.0% of all households. In contrast, only 19,171 households (3.4%) fall into the $10,000 to $14,999 income bracket, making it the least populous group.
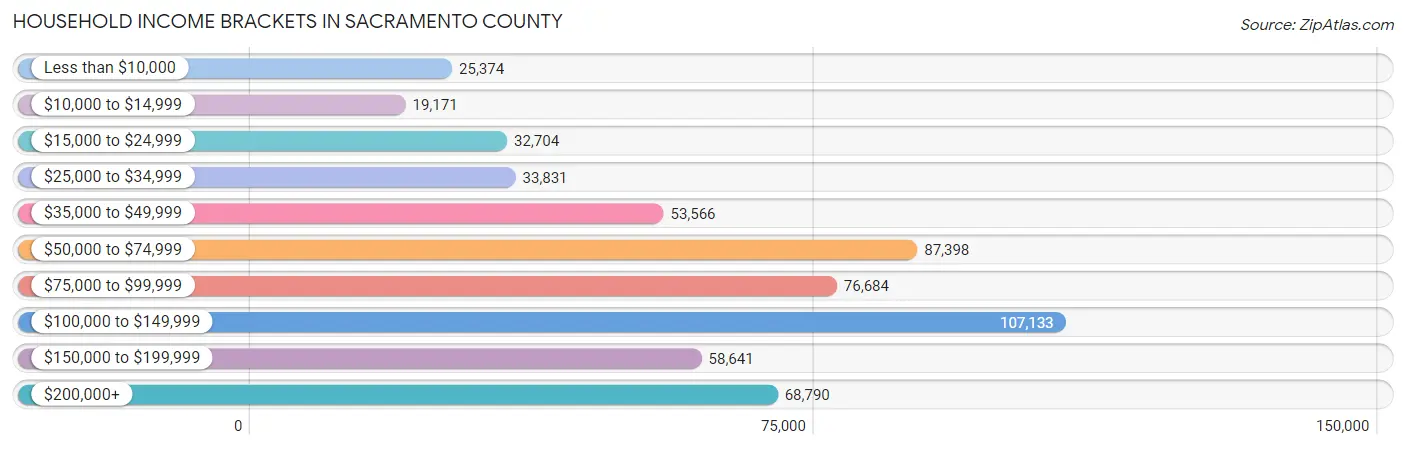
| Income Bracket | # Households | % Households |
| Less than $10,000 | 25,374 | 4.5% |
| $10,000 to $14,999 | 19,171 | 3.4% |
| $15,000 to $24,999 | 32,704 | 5.8% |
| $25,000 to $34,999 | 33,831 | 6.0% |
| $35,000 to $49,999 | 53,566 | 9.5% |
| $50,000 to $74,999 | 87,398 | 15.5% |
| $75,000 to $99,999 | 76,684 | 13.6% |
| $100,000 to $149,999 | 107,133 | 19.0% |
| $150,000 to $199,999 | 58,641 | 10.4% |
| $200,000+ | 68,790 | 12.2% |
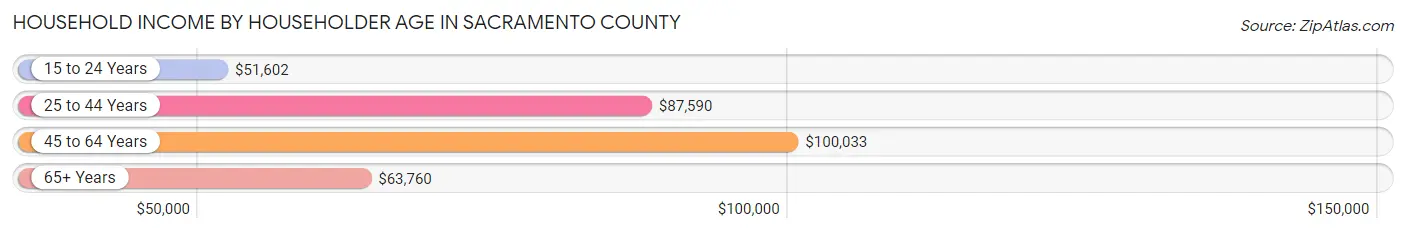
Household Income by Householder Age in Sacramento County
The median household income in Sacramento County is $84,010, with the highest median household income of $100,033 found in the 45 to 64 years age bracket for the primary householder. A total of 208,718 households (37.0%) fall into this category. Meanwhile, the 15 to 24 years age bracket for the primary householder has the lowest median household income of $51,602, with 17,034 households (3.0%) in this group.
| Income Bracket | # Households | Median Income |
| 15 to 24 Years | 17,034 (3.0%) | $51,602 |
| 25 to 44 Years | 203,284 (36.0%) | $87,590 |
| 45 to 64 Years | 208,718 (37.0%) | $100,033 |
| 65+ Years | 134,820 (23.9%) | $63,760 |
| Total | 563,856 (100.0%) | $84,010 |
Poverty in Sacramento County
Income Below Poverty by Sex and Age in Sacramento County
With 12.3% poverty level for males and 13.9% for females among the residents of Sacramento County, 15 year old males and 18 to 24 year old females are the most vulnerable to poverty, with 2,374 males (22.1%) and 13,704 females (20.9%) in their respective age groups living below the poverty level.
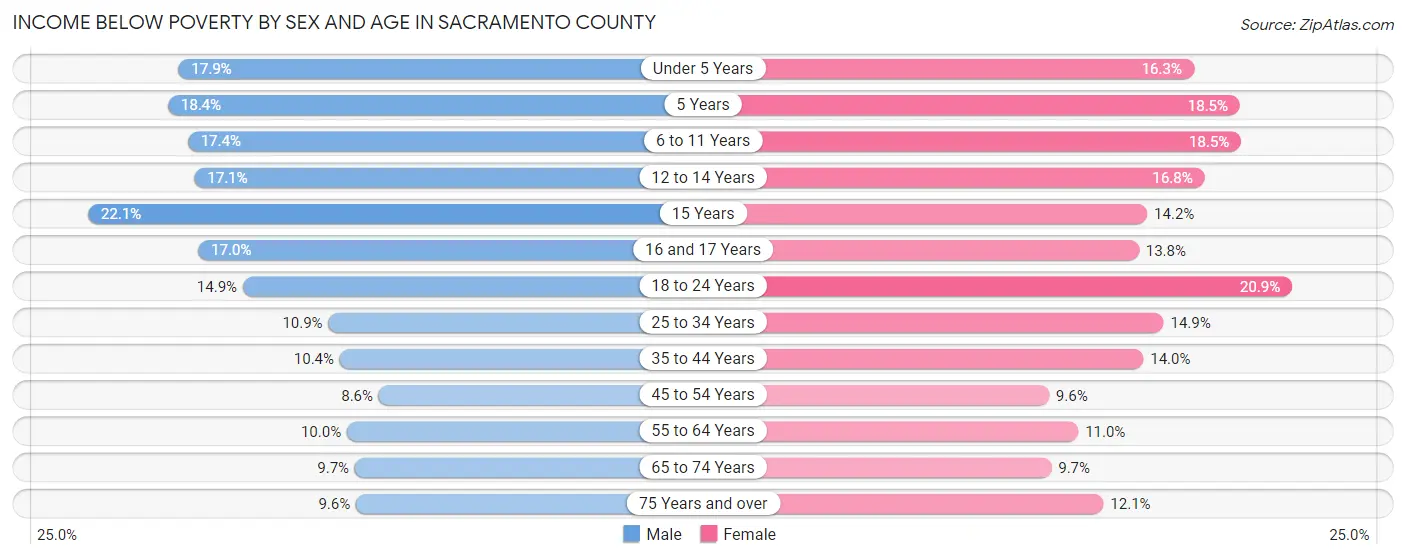
| Age Bracket | Male | Female |
| Under 5 Years | 8,670 (17.9%) | 7,525 (16.3%) |
| 5 Years | 1,688 (18.3%) | 1,822 (18.5%) |
| 6 to 11 Years | 10,789 (17.4%) | 10,837 (18.5%) |
| 12 to 14 Years | 5,635 (17.1%) | 5,235 (16.8%) |
| 15 Years | 2,374 (22.1%) | 1,501 (14.2%) |
| 16 and 17 Years | 3,547 (17.0%) | 2,760 (13.8%) |
| 18 to 24 Years | 10,105 (14.9%) | 13,704 (20.9%) |
| 25 to 34 Years | 13,146 (10.9%) | 17,994 (14.9%) |
| 35 to 44 Years | 11,249 (10.4%) | 15,131 (14.0%) |
| 45 to 54 Years | 8,153 (8.6%) | 9,346 (9.6%) |
| 55 to 64 Years | 9,161 (10.0%) | 10,741 (11.0%) |
| 65 to 74 Years | 6,030 (9.7%) | 7,178 (9.7%) |
| 75 Years and over | 3,556 (9.6%) | 6,511 (12.1%) |
| Total | 94,103 (12.3%) | 110,285 (13.9%) |
Income Above Poverty by Sex and Age in Sacramento County
According to the poverty statistics in Sacramento County, males aged 45 to 54 years and females aged 45 to 54 years are the age groups that are most secure financially, with 91.4% of males and 90.4% of females in these age groups living above the poverty line.
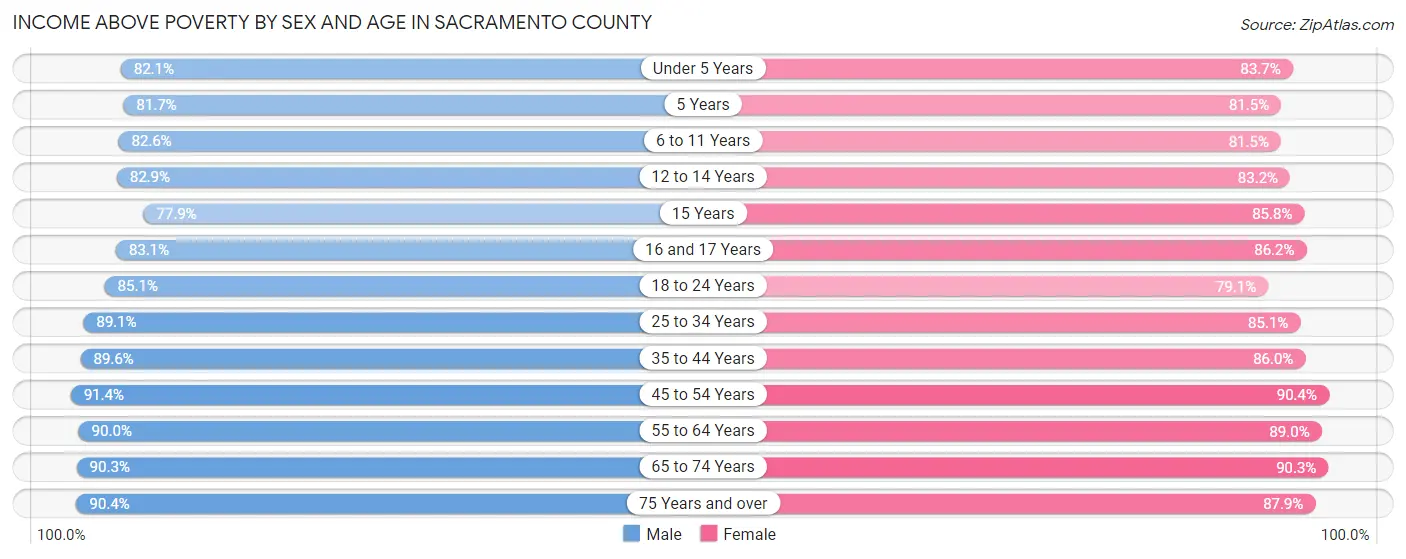
| Age Bracket | Male | Female |
| Under 5 Years | 39,864 (82.1%) | 38,547 (83.7%) |
| 5 Years | 7,509 (81.7%) | 8,040 (81.5%) |
| 6 to 11 Years | 51,100 (82.6%) | 47,657 (81.5%) |
| 12 to 14 Years | 27,289 (82.9%) | 25,879 (83.2%) |
| 15 Years | 8,389 (77.9%) | 9,090 (85.8%) |
| 16 and 17 Years | 17,382 (83.1%) | 17,274 (86.2%) |
| 18 to 24 Years | 57,836 (85.1%) | 51,883 (79.1%) |
| 25 to 34 Years | 107,480 (89.1%) | 102,509 (85.1%) |
| 35 to 44 Years | 97,236 (89.6%) | 93,015 (86.0%) |
| 45 to 54 Years | 87,071 (91.4%) | 87,912 (90.4%) |
| 55 to 64 Years | 82,074 (90.0%) | 87,194 (89.0%) |
| 65 to 74 Years | 56,359 (90.3%) | 66,680 (90.3%) |
| 75 Years and over | 33,396 (90.4%) | 47,120 (87.9%) |
| Total | 672,985 (87.7%) | 682,800 (86.1%) |
Income Below Poverty Among Married-Couple Families in Sacramento County
The poverty statistics for married-couple families in Sacramento County show that 5.9% or 15,423 of the total 259,157 families live below the poverty line. Families with 5 or more children have the highest poverty rate of 27.0%, comprising of 722 families. On the other hand, families with no children have the lowest poverty rate of 3.4%, which includes 4,633 families.
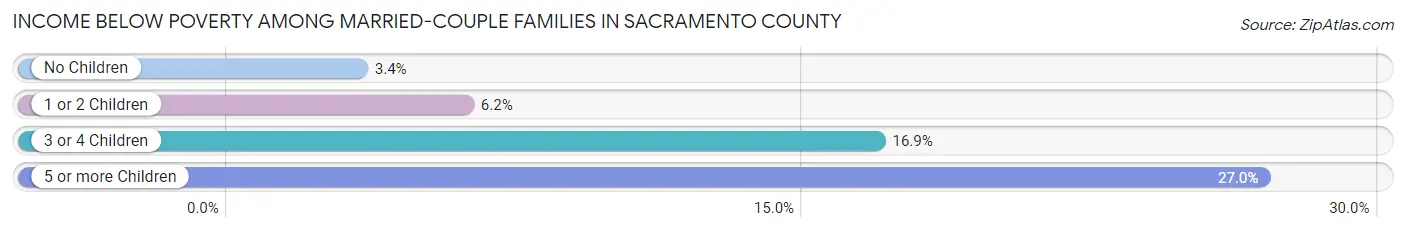
| Children | Above Poverty | Below Poverty |
| No Children | 132,226 (96.6%) | 4,633 (3.4%) |
| 1 or 2 Children | 88,724 (93.8%) | 5,829 (6.2%) |
| 3 or 4 Children | 20,827 (83.1%) | 4,239 (16.9%) |
| 5 or more Children | 1,957 (73.1%) | 722 (27.0%) |
| Total | 243,734 (94.1%) | 15,423 (5.9%) |
Income Below Poverty Among Single-Parent Households in Sacramento County
According to the poverty data in Sacramento County, 10.7% or 3,770 single-father households and 19.7% or 15,409 single-mother households are living below the poverty line. Among single-father households, those with 5 or more children have the highest poverty rate, with 184 households (52.6%) experiencing poverty. Likewise, among single-mother households, those with 5 or more children have the highest poverty rate, with 563 households (66.0%) falling below the poverty line.
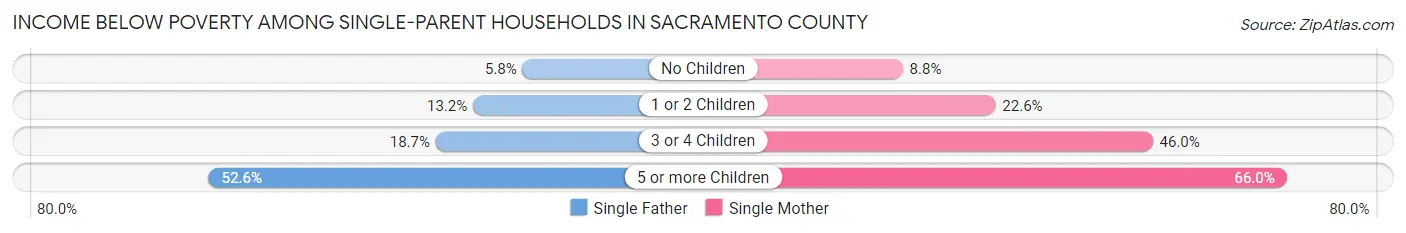
| Children | Single Father | Single Mother |
| No Children | 931 (5.8%) | 2,918 (8.8%) |
| 1 or 2 Children | 2,028 (13.2%) | 8,130 (22.6%) |
| 3 or 4 Children | 627 (18.7%) | 3,798 (46.0%) |
| 5 or more Children | 184 (52.6%) | 563 (66.0%) |
| Total | 3,770 (10.7%) | 15,409 (19.7%) |
Income Below Poverty Among Married-Couple vs Single-Parent Households in Sacramento County
The poverty data for Sacramento County shows that 15,423 of the married-couple family households (5.9%) and 19,179 of the single-parent households (16.9%) are living below the poverty level. Within the married-couple family households, those with 5 or more children have the highest poverty rate, with 722 households (27.0%) falling below the poverty line. Among the single-parent households, those with 5 or more children have the highest poverty rate, with 747 household (62.1%) living below poverty.
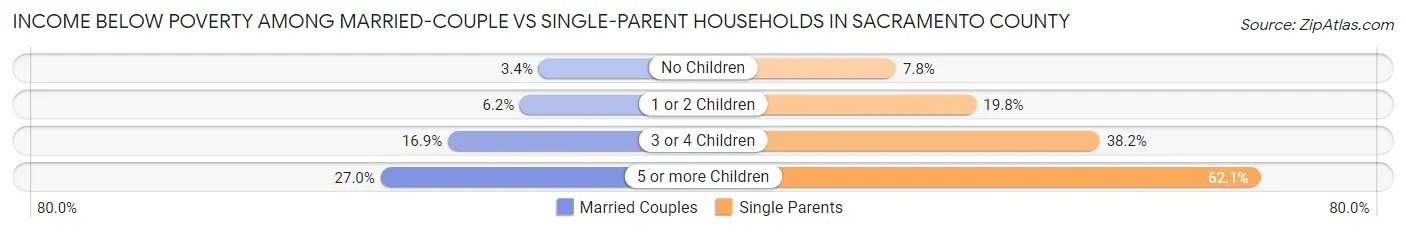
| Children | Married-Couple Families | Single-Parent Households |
| No Children | 4,633 (3.4%) | 3,849 (7.8%) |
| 1 or 2 Children | 5,829 (6.2%) | 10,158 (19.8%) |
| 3 or 4 Children | 4,239 (16.9%) | 4,425 (38.2%) |
| 5 or more Children | 722 (27.0%) | 747 (62.1%) |
| Total | 15,423 (5.9%) | 19,179 (16.9%) |
Race in Sacramento County
The most populous races in Sacramento County are White / Caucasian (785,699 | 49.7%), Hispanic or Latino (378,350 | 24.0%), and Asian (271,712 | 17.2%).
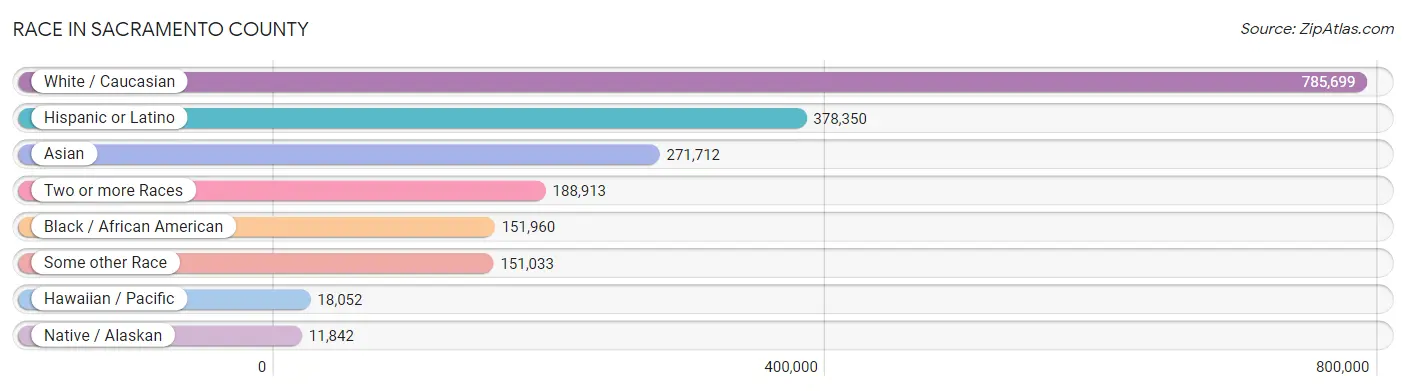
| Race | # Population | % Population |
| Asian | 271,712 | 17.2% |
| Black / African American | 151,960 | 9.6% |
| Hawaiian / Pacific | 18,052 | 1.1% |
| Hispanic or Latino | 378,350 | 24.0% |
| Native / Alaskan | 11,842 | 0.7% |
| White / Caucasian | 785,699 | 49.7% |
| Two or more Races | 188,913 | 12.0% |
| Some other Race | 151,033 | 9.6% |
| Total | 1,579,211 | 100.0% |
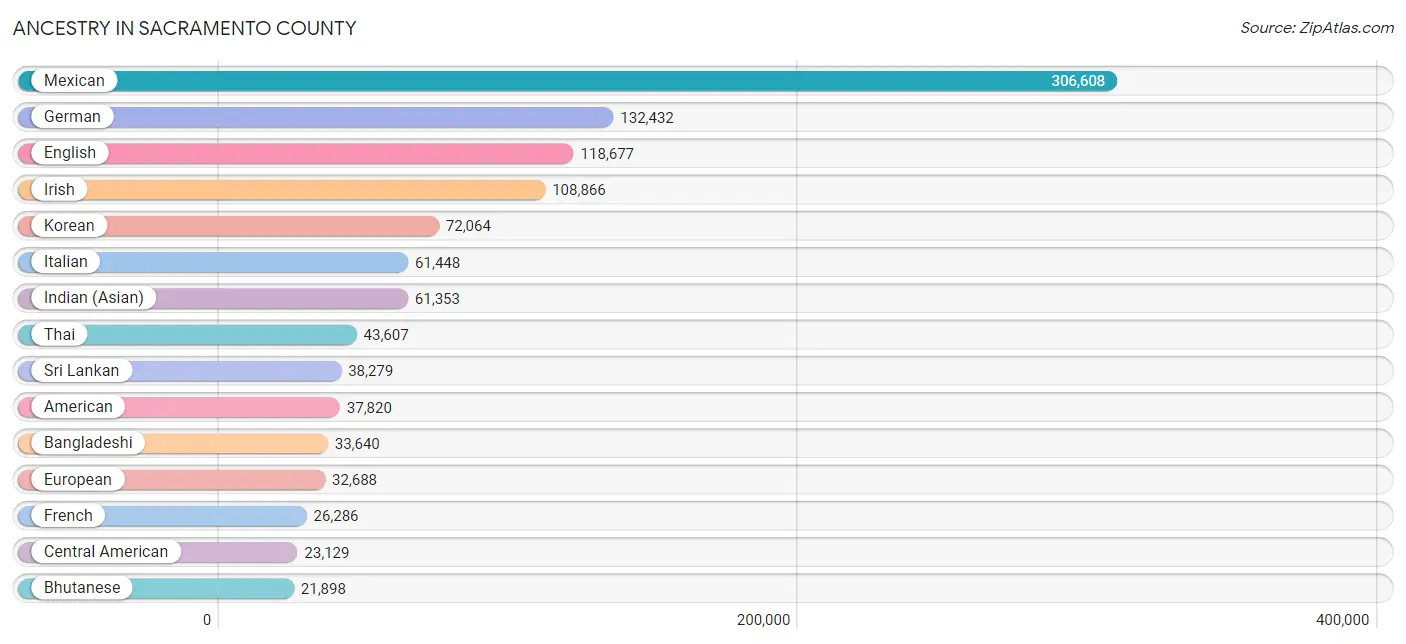
Ancestry in Sacramento County
The most populous ancestries reported in Sacramento County are Mexican (306,608 | 19.4%), German (132,432 | 8.4%), English (118,677 | 7.5%), Irish (108,866 | 6.9%), and Korean (72,064 | 4.6%), together accounting for 46.8% of all Sacramento County residents.
| Ancestry | # Population | % Population |
| Afghan | 16,218 | 1.0% |
| African | 7,505 | 0.5% |
| Alaska Native | 41 | 0.0% |
| Alaskan Athabascan | 35 | 0.0% |
| Albanian | 404 | 0.0% |
| Aleut | 69 | 0.0% |
| Alsatian | 6 | 0.0% |
| American | 37,820 | 2.4% |
| Apache | 2,100 | 0.1% |
| Arab | 12,953 | 0.8% |
| Arapaho | 38 | 0.0% |
| Argentinean | 719 | 0.1% |
| Armenian | 5,327 | 0.3% |
| Assyrian / Chaldean / Syriac | 425 | 0.0% |
| Australian | 590 | 0.0% |
| Austrian | 2,048 | 0.1% |
| Bahamian | 30 | 0.0% |
| Bangladeshi | 33,640 | 2.1% |
| Barbadian | 76 | 0.0% |
| Basque | 601 | 0.0% |
| Belgian | 648 | 0.0% |
| Belizean | 148 | 0.0% |
| Bermudan | 17 | 0.0% |
| Bhutanese | 21,898 | 1.4% |
| Blackfeet | 2,152 | 0.1% |
| Bolivian | 407 | 0.0% |
| Brazilian | 1,294 | 0.1% |
| British | 8,306 | 0.5% |
| British West Indian | 61 | 0.0% |
| Bulgarian | 885 | 0.1% |
| Burmese | 10,911 | 0.7% |
| Cajun | 155 | 0.0% |
| Cambodian | 194 | 0.0% |
| Canadian | 2,149 | 0.1% |
| Cape Verdean | 698 | 0.0% |
| Carpatho Rusyn | 15 | 0.0% |
| Celtic | 246 | 0.0% |
| Central American | 23,129 | 1.5% |
| Central American Indian | 1,738 | 0.1% |
| Cherokee | 7,745 | 0.5% |
| Cheyenne | 32 | 0.0% |
| Chickasaw | 317 | 0.0% |
| Chilean | 570 | 0.0% |
| Chinese | 51 | 0.0% |
| Chippewa | 259 | 0.0% |
| Choctaw | 2,621 | 0.2% |
| Colombian | 2,557 | 0.2% |
| Colville | 8 | 0.0% |
| Comanche | 306 | 0.0% |
| Costa Rican | 892 | 0.1% |
| Cree | 393 | 0.0% |
| Creek | 810 | 0.1% |
| Croatian | 1,771 | 0.1% |
| Crow | 146 | 0.0% |
| Cuban | 2,222 | 0.1% |
| Czech | 2,702 | 0.2% |
| Czechoslovakian | 711 | 0.1% |
| Danish | 6,259 | 0.4% |
| Delaware | 37 | 0.0% |
| Dominican | 864 | 0.1% |
| Dutch | 12,236 | 0.8% |
| Dutch West Indian | 62 | 0.0% |
| Eastern European | 2,649 | 0.2% |
| Ecuadorian | 961 | 0.1% |
| Egyptian | 2,211 | 0.1% |
| English | 118,677 | 7.5% |
| Estonian | 152 | 0.0% |
| Ethiopian | 2,591 | 0.2% |
| European | 32,688 | 2.1% |
| Fijian | 1,408 | 0.1% |
| Filipino | 1,561 | 0.1% |
| Finnish | 2,443 | 0.2% |
| French | 26,286 | 1.7% |
| French American Indian | 83 | 0.0% |
| French Canadian | 3,209 | 0.2% |
| German | 132,432 | 8.4% |
| German Russian | 106 | 0.0% |
| Ghanaian | 374 | 0.0% |
| Greek | 5,499 | 0.4% |
| Guamanian / Chamorro | 2,344 | 0.2% |
| Guatemalan | 5,854 | 0.4% |
| Guyanese | 136 | 0.0% |
| Haitian | 601 | 0.0% |
| Hmong | 36 | 0.0% |
| Honduran | 1,377 | 0.1% |
| Hopi | 141 | 0.0% |
| Hungarian | 3,449 | 0.2% |
| Icelander | 157 | 0.0% |
| Indian (Asian) | 61,353 | 3.9% |
| Indonesian | 486 | 0.0% |
| Inupiat | 87 | 0.0% |
| Iranian | 5,377 | 0.3% |
| Iraqi | 885 | 0.1% |
| Irish | 108,866 | 6.9% |
| Iroquois | 218 | 0.0% |
| Israeli | 207 | 0.0% |
| Italian | 61,448 | 3.9% |
| Jamaican | 1,295 | 0.1% |
| Japanese | 4,492 | 0.3% |
| Jordanian | 1,335 | 0.1% |
| Kenyan | 716 | 0.1% |
| Kiowa | 10 | 0.0% |
| Korean | 72,064 | 4.6% |
| Laotian | 1,374 | 0.1% |
| Latvian | 540 | 0.0% |
| Lebanese | 1,462 | 0.1% |
| Liberian | 469 | 0.0% |
| Lithuanian | 1,494 | 0.1% |
| Lumbee | 31 | 0.0% |
| Luxembourger | 56 | 0.0% |
| Macedonian | 147 | 0.0% |
| Malaysian | 8,712 | 0.5% |
| Maltese | 318 | 0.0% |
| Marshallese | 17 | 0.0% |
| Menominee | 24 | 0.0% |
| Mexican | 306,608 | 19.4% |
| Mexican American Indian | 4,387 | 0.3% |
| Mongolian | 124 | 0.0% |
| Moroccan | 348 | 0.0% |
| Native Hawaiian | 4,639 | 0.3% |
| Navajo | 1,462 | 0.1% |
| Nepalese | 4,460 | 0.3% |
| New Zealander | 110 | 0.0% |
| Nicaraguan | 3,545 | 0.2% |
| Nigerian | 2,408 | 0.2% |
| Northern European | 2,850 | 0.2% |
| Norwegian | 18,237 | 1.1% |
| Okinawan | 44 | 0.0% |
| Osage | 111 | 0.0% |
| Ottawa | 41 | 0.0% |
| Paiute | 621 | 0.0% |
| Pakistani | 2,738 | 0.2% |
| Palestinian | 1,062 | 0.1% |
| Panamanian | 1,238 | 0.1% |
| Paraguayan | 42 | 0.0% |
| Pennsylvania German | 175 | 0.0% |
| Peruvian | 2,686 | 0.2% |
| Pima | 94 | 0.0% |
| Polish | 17,231 | 1.1% |
| Portuguese | 19,437 | 1.2% |
| Potawatomi | 245 | 0.0% |
| Pueblo | 582 | 0.0% |
| Puerto Rican | 11,960 | 0.8% |
| Puget Sound Salish | 101 | 0.0% |
| Romanian | 7,592 | 0.5% |
| Russian | 20,956 | 1.3% |
| Salvadoran | 10,206 | 0.6% |
| Samoan | 2,519 | 0.2% |
| Scandinavian | 4,665 | 0.3% |
| Scotch-Irish | 11,649 | 0.7% |
| Scottish | 21,205 | 1.3% |
| Seminole | 338 | 0.0% |
| Senegalese | 151 | 0.0% |
| Serbian | 677 | 0.0% |
| Shoshone | 97 | 0.0% |
| Sierra Leonean | 95 | 0.0% |
| Sioux | 847 | 0.1% |
| Slavic | 1,546 | 0.1% |
| Slovak | 728 | 0.1% |
| Slovene | 178 | 0.0% |
| Somali | 8 | 0.0% |
| South African | 409 | 0.0% |
| South American | 8,838 | 0.6% |
| South American Indian | 439 | 0.0% |
| Soviet Union | 81 | 0.0% |
| Spaniard | 9,603 | 0.6% |
| Spanish | 6,648 | 0.4% |
| Spanish American | 336 | 0.0% |
| Spanish American Indian | 58 | 0.0% |
| Sri Lankan | 38,279 | 2.4% |
| Subsaharan African | 17,697 | 1.1% |
| Sudanese | 100 | 0.0% |
| Swedish | 15,157 | 1.0% |
| Swiss | 5,108 | 0.3% |
| Syrian | 938 | 0.1% |
| Taiwanese | 68 | 0.0% |
| Thai | 43,607 | 2.8% |
| Tlingit-Haida | 89 | 0.0% |
| Tohono O'Odham | 56 | 0.0% |
| Tongan | 921 | 0.1% |
| Trinidadian and Tobagonian | 239 | 0.0% |
| Tsimshian | 12 | 0.0% |
| Turkish | 662 | 0.0% |
| Ugandan | 238 | 0.0% |
| Ukrainian | 21,173 | 1.3% |
| Uruguayan | 16 | 0.0% |
| Ute | 42 | 0.0% |
| Venezuelan | 858 | 0.1% |
| Vietnamese | 414 | 0.0% |
| Welsh | 7,912 | 0.5% |
| West Indian | 284 | 0.0% |
| Yakama | 33 | 0.0% |
| Yaqui | 554 | 0.0% |
| Yugoslavian | 1,644 | 0.1% |
| Yup'ik | 6 | 0.0% |
| Zimbabwean | 32 | 0.0% | View All 196 Rows |
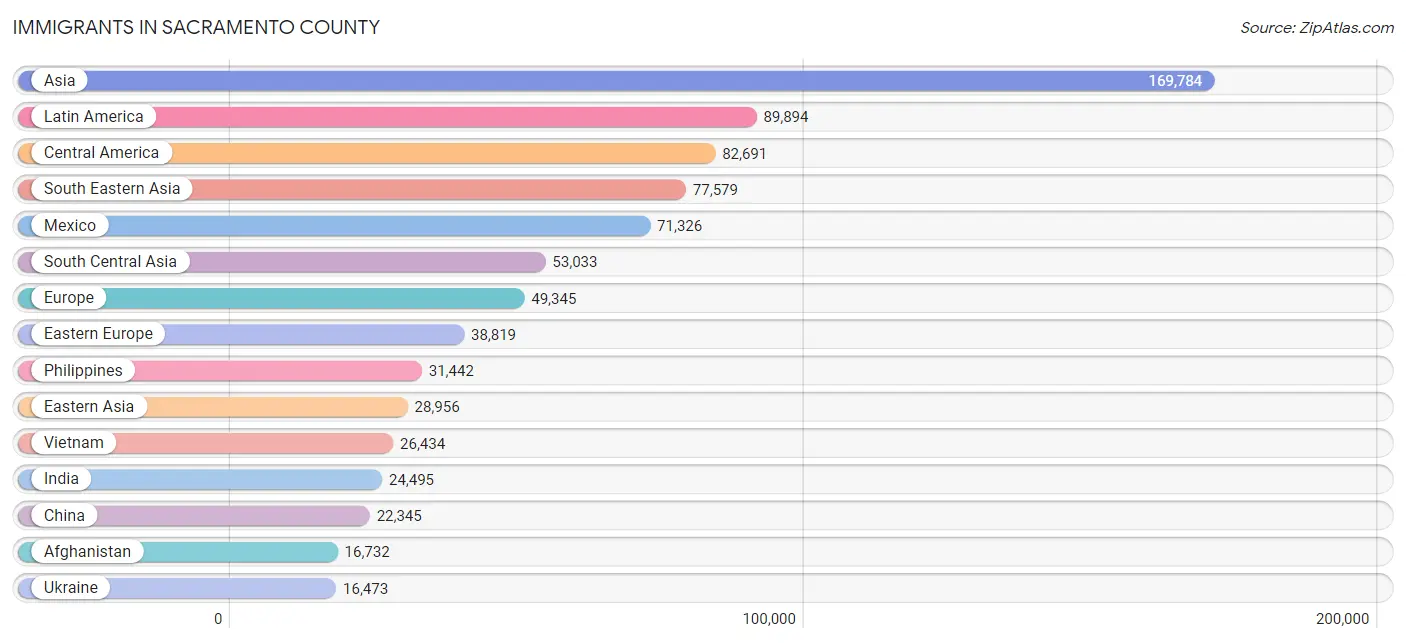
Immigrants in Sacramento County
The most numerous immigrant groups reported in Sacramento County came from Asia (169,784 | 10.7%), Latin America (89,894 | 5.7%), Central America (82,691 | 5.2%), South Eastern Asia (77,579 | 4.9%), and Mexico (71,326 | 4.5%), together accounting for 31.1% of all Sacramento County residents.
| Immigration Origin | # Population | % Population |
| Afghanistan | 16,732 | 1.1% |
| Africa | 9,895 | 0.6% |
| Albania | 14 | 0.0% |
| Argentina | 373 | 0.0% |
| Armenia | 2,366 | 0.2% |
| Asia | 169,784 | 10.7% |
| Australia | 387 | 0.0% |
| Austria | 189 | 0.0% |
| Azores | 425 | 0.0% |
| Bangladesh | 394 | 0.0% |
| Belarus | 2,311 | 0.2% |
| Belgium | 58 | 0.0% |
| Belize | 137 | 0.0% |
| Bolivia | 147 | 0.0% |
| Bosnia and Herzegovina | 751 | 0.1% |
| Brazil | 1,229 | 0.1% |
| Bulgaria | 260 | 0.0% |
| Cabo Verde | 111 | 0.0% |
| Cambodia | 1,006 | 0.1% |
| Cameroon | 153 | 0.0% |
| Canada | 3,304 | 0.2% |
| Caribbean | 1,650 | 0.1% |
| Central America | 82,691 | 5.2% |
| Chile | 250 | 0.0% |
| China | 22,345 | 1.4% |
| Colombia | 1,404 | 0.1% |
| Costa Rica | 407 | 0.0% |
| Croatia | 139 | 0.0% |
| Cuba | 435 | 0.0% |
| Czechoslovakia | 303 | 0.0% |
| Denmark | 186 | 0.0% |
| Dominican Republic | 214 | 0.0% |
| Eastern Africa | 4,264 | 0.3% |
| Eastern Asia | 28,956 | 1.8% |
| Eastern Europe | 38,819 | 2.5% |
| Ecuador | 229 | 0.0% |
| Egypt | 819 | 0.1% |
| El Salvador | 5,231 | 0.3% |
| England | 2,027 | 0.1% |
| Eritrea | 175 | 0.0% |
| Ethiopia | 2,018 | 0.1% |
| Europe | 49,345 | 3.1% |
| Fiji | 10,856 | 0.7% |
| France | 718 | 0.1% |
| Germany | 2,247 | 0.1% |
| Ghana | 388 | 0.0% |
| Greece | 347 | 0.0% |
| Guatemala | 3,051 | 0.2% |
| Guyana | 48 | 0.0% |
| Haiti | 150 | 0.0% |
| Honduras | 897 | 0.1% |
| Hong Kong | 3,326 | 0.2% |
| Hungary | 334 | 0.0% |
| India | 24,495 | 1.5% |
| Indonesia | 1,375 | 0.1% |
| Iran | 3,891 | 0.3% |
| Iraq | 2,003 | 0.1% |
| Ireland | 360 | 0.0% |
| Israel | 439 | 0.0% |
| Italy | 708 | 0.0% |
| Jamaica | 454 | 0.0% |
| Japan | 2,336 | 0.2% |
| Jordan | 849 | 0.1% |
| Kazakhstan | 812 | 0.1% |
| Kenya | 1,089 | 0.1% |
| Korea | 4,155 | 0.3% |
| Kuwait | 171 | 0.0% |
| Laos | 9,667 | 0.6% |
| Latin America | 89,894 | 5.7% |
| Latvia | 290 | 0.0% |
| Lebanon | 530 | 0.0% |
| Liberia | 385 | 0.0% |
| Lithuania | 148 | 0.0% |
| Malaysia | 441 | 0.0% |
| Mexico | 71,326 | 4.5% |
| Micronesia | 247 | 0.0% |
| Middle Africa | 224 | 0.0% |
| Moldova | 5,102 | 0.3% |
| Morocco | 361 | 0.0% |
| Nepal | 1,019 | 0.1% |
| Netherlands | 448 | 0.0% |
| Nicaragua | 1,091 | 0.1% |
| Nigeria | 1,399 | 0.1% |
| North Macedonia | 28 | 0.0% |
| Northern Africa | 1,667 | 0.1% |
| Northern Europe | 4,508 | 0.3% |
| Norway | 89 | 0.0% |
| Oceania | 13,242 | 0.8% |
| Pakistan | 3,892 | 0.3% |
| Panama | 532 | 0.0% |
| Peru | 1,169 | 0.1% |
| Philippines | 31,442 | 2.0% |
| Poland | 1,017 | 0.1% |
| Portugal | 788 | 0.1% |
| Romania | 2,360 | 0.2% |
| Russia | 7,883 | 0.5% |
| Saudi Arabia | 589 | 0.0% |
| Scotland | 134 | 0.0% |
| Senegal | 167 | 0.0% |
| Serbia | 217 | 0.0% |
| Sierra Leone | 130 | 0.0% |
| Singapore | 134 | 0.0% |
| Somalia | 51 | 0.0% |
| South Africa | 748 | 0.1% |
| South America | 5,553 | 0.4% |
| South Central Asia | 53,033 | 3.4% |
| South Eastern Asia | 77,579 | 4.9% |
| Southern Europe | 2,140 | 0.1% |
| Spain | 297 | 0.0% |
| Sri Lanka | 315 | 0.0% |
| St. Vincent and the Grenadines | 71 | 0.0% |
| Sudan | 86 | 0.0% |
| Sweden | 148 | 0.0% |
| Switzerland | 165 | 0.0% |
| Syria | 1,174 | 0.1% |
| Taiwan | 2,331 | 0.2% |
| Thailand | 6,297 | 0.4% |
| Trinidad and Tobago | 227 | 0.0% |
| Turkey | 463 | 0.0% |
| Uganda | 136 | 0.0% |
| Ukraine | 16,473 | 1.0% |
| Uzbekistan | 964 | 0.1% |
| Venezuela | 673 | 0.0% |
| Vietnam | 26,434 | 1.7% |
| West Indies | 19 | 0.0% |
| Western Africa | 2,735 | 0.2% |
| Western Asia | 9,774 | 0.6% |
| Western Europe | 3,830 | 0.2% |
| Yemen | 208 | 0.0% |
| Zaire | 71 | 0.0% |
| Zimbabwe | 228 | 0.0% | View All 131 Rows |
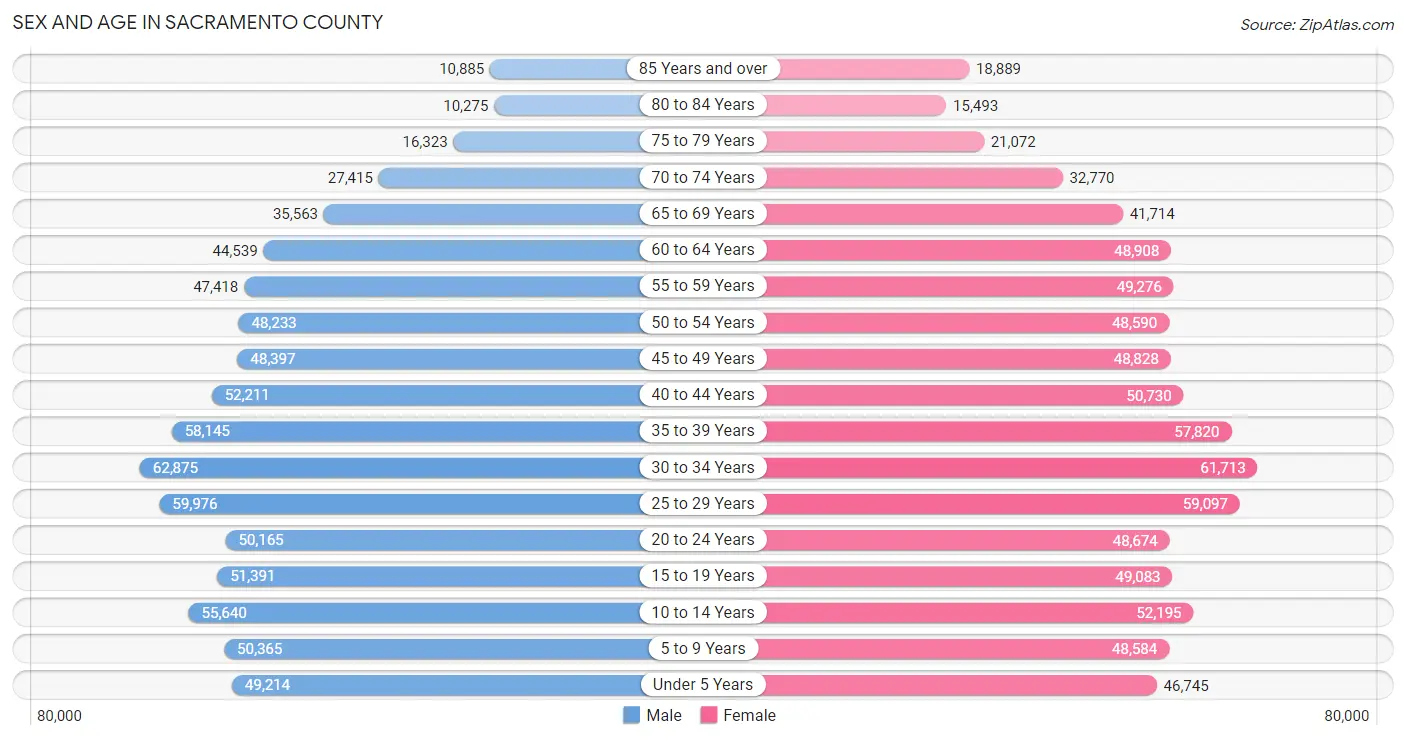
Sex and Age in Sacramento County
Sex and Age in Sacramento County
The most populous age groups in Sacramento County are 30 to 34 Years (62,875 | 8.1%) for men and 30 to 34 Years (61,713 | 7.7%) for women.
| Age Bracket | Male | Female |
| Under 5 Years | 49,214 (6.3%) | 46,745 (5.8%) |
| 5 to 9 Years | 50,365 (6.5%) | 48,584 (6.1%) |
| 10 to 14 Years | 55,640 (7.1%) | 52,195 (6.5%) |
| 15 to 19 Years | 51,391 (6.6%) | 49,083 (6.1%) |
| 20 to 24 Years | 50,165 (6.4%) | 48,674 (6.1%) |
| 25 to 29 Years | 59,976 (7.7%) | 59,097 (7.4%) |
| 30 to 34 Years | 62,875 (8.1%) | 61,713 (7.7%) |
| 35 to 39 Years | 58,145 (7.5%) | 57,820 (7.2%) |
| 40 to 44 Years | 52,211 (6.7%) | 50,730 (6.3%) |
| 45 to 49 Years | 48,397 (6.2%) | 48,828 (6.1%) |
| 50 to 54 Years | 48,233 (6.2%) | 48,590 (6.1%) |
| 55 to 59 Years | 47,418 (6.1%) | 49,276 (6.2%) |
| 60 to 64 Years | 44,539 (5.7%) | 48,908 (6.1%) |
| 65 to 69 Years | 35,563 (4.6%) | 41,714 (5.2%) |
| 70 to 74 Years | 27,415 (3.5%) | 32,770 (4.1%) |
| 75 to 79 Years | 16,323 (2.1%) | 21,072 (2.6%) |
| 80 to 84 Years | 10,275 (1.3%) | 15,493 (1.9%) |
| 85 Years and over | 10,885 (1.4%) | 18,889 (2.4%) |
| Total | 779,030 (100.0%) | 800,181 (100.0%) |
Families and Households in Sacramento County
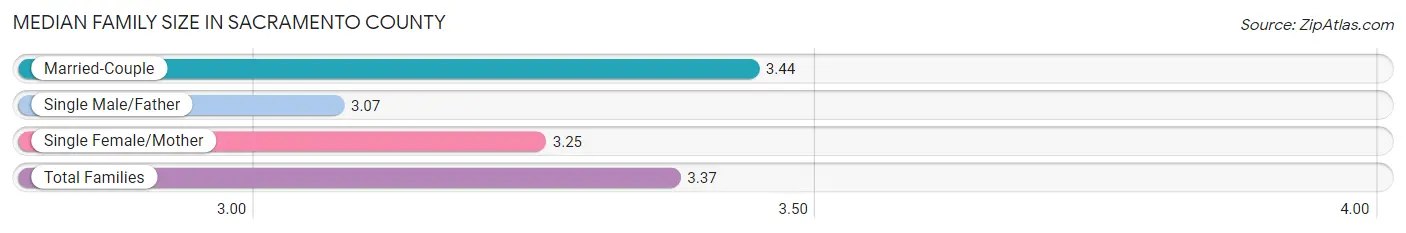
Median Family Size in Sacramento County
The median family size in Sacramento County is 3.37 persons per family, with married-couple families (259,157 | 69.6%) accounting for the largest median family size of 3.44 persons per family. On the other hand, single male/father families (35,166 | 9.4%) represent the smallest median family size with 3.07 persons per family.
| Family Type | # Families | Family Size |
| Married-Couple | 259,157 (69.6%) | 3.44 |
| Single Male/Father | 35,166 (9.4%) | 3.07 |
| Single Female/Mother | 78,261 (21.0%) | 3.25 |
| Total Families | 372,584 (100.0%) | 3.37 |
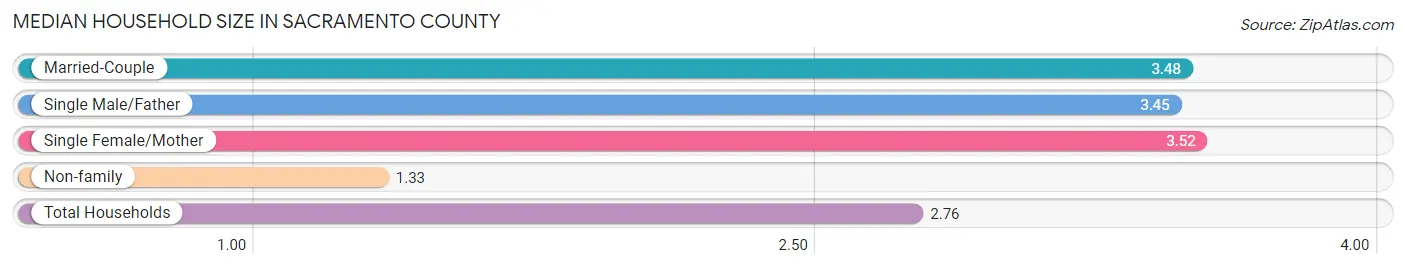
Median Household Size in Sacramento County
The median household size in Sacramento County is 2.76 persons per household, with single female/mother households (78,261 | 13.9%) accounting for the largest median household size of 3.52 persons per household. non-family households (191,272 | 33.9%) represent the smallest median household size with 1.33 persons per household.
| Household Type | # Households | Household Size |
| Married-Couple | 259,157 (46.0%) | 3.48 |
| Single Male/Father | 35,166 (6.2%) | 3.45 |
| Single Female/Mother | 78,261 (13.9%) | 3.52 |
| Non-family | 191,272 (33.9%) | 1.33 |
| Total Households | 563,856 (100.0%) | 2.76 |
Household Size by Marriage Status in Sacramento County
Out of a total of 563,856 households in Sacramento County, 372,584 (66.1%) are family households, while 191,272 (33.9%) are nonfamily households. The most numerous type of family households are 2-person households, comprising 137,302, and the most common type of nonfamily households are 1-person households, comprising 146,206.
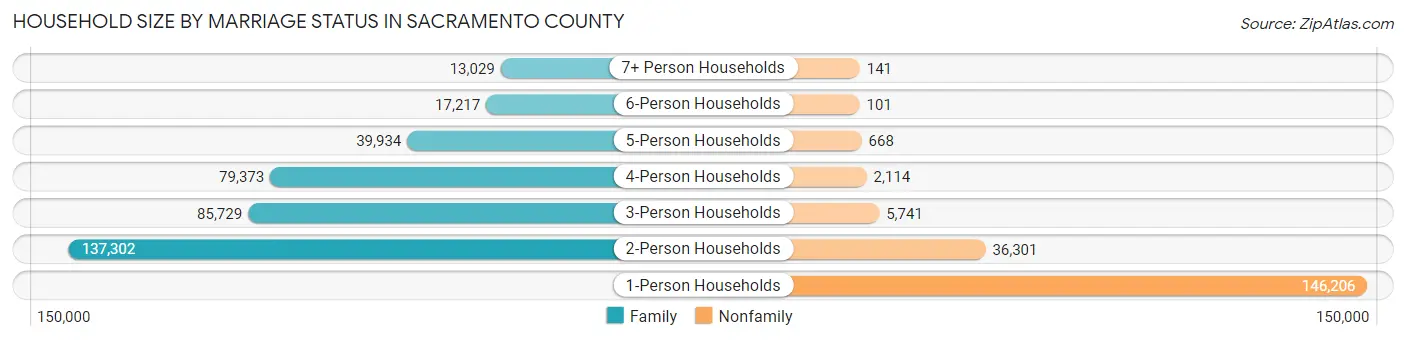
| Household Size | Family Households | Nonfamily Households |
| 1-Person Households | - | 146,206 (25.9%) |
| 2-Person Households | 137,302 (24.3%) | 36,301 (6.4%) |
| 3-Person Households | 85,729 (15.2%) | 5,741 (1.0%) |
| 4-Person Households | 79,373 (14.1%) | 2,114 (0.4%) |
| 5-Person Households | 39,934 (7.1%) | 668 (0.1%) |
| 6-Person Households | 17,217 (3.0%) | 101 (0.0%) |
| 7+ Person Households | 13,029 (2.3%) | 141 (0.0%) |
| Total | 372,584 (66.1%) | 191,272 (33.9%) |
Female Fertility in Sacramento County
Fertility by Age in Sacramento County
Average fertility rate in Sacramento County is 51.0 births per 1,000 women. Women in the age bracket of 20 to 34 years have the highest fertility rate with 75.0 births per 1,000 women. Women in the age bracket of 20 to 34 years acount for 65.3% of all women with births.
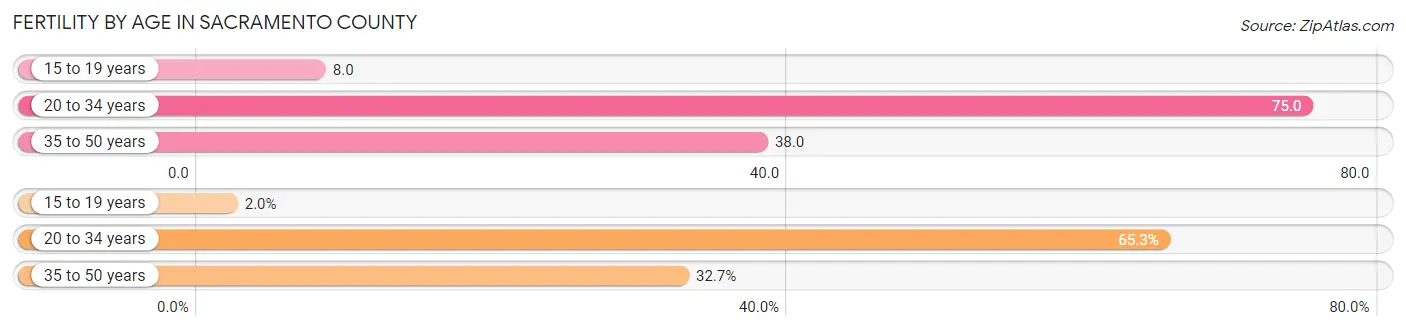
| Age Bracket | Women with Births | Births / 1,000 Women |
| 15 to 19 years | 396 (2.0%) | 8.0 |
| 20 to 34 years | 12,783 (65.3%) | 75.0 |
| 35 to 50 years | 6,388 (32.7%) | 38.0 |
| Total | 19,567 (100.0%) | 51.0 |
Fertility by Age by Marriage Status in Sacramento County
70.3% of women with births (19,567) in Sacramento County are married. The highest percentage of unmarried women with births falls into 15 to 19 years age bracket with 74.0% of them unmarried at the time of birth, while the lowest percentage of unmarried women with births belong to 35 to 50 years age bracket with 19.3% of them unmarried.
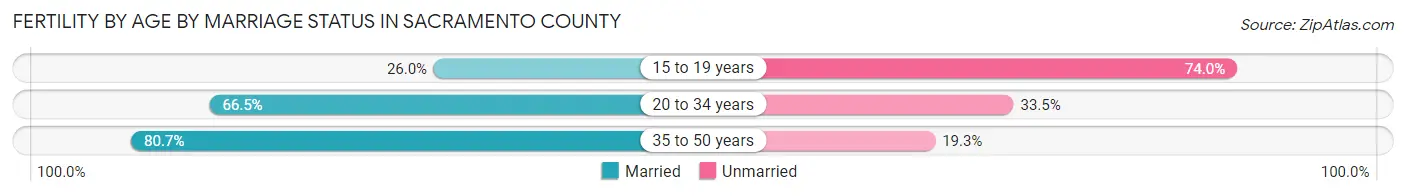
| Age Bracket | Married | Unmarried |
| 15 to 19 years | 103 (26.0%) | 293 (74.0%) |
| 20 to 34 years | 8,501 (66.5%) | 4,282 (33.5%) |
| 35 to 50 years | 5,155 (80.7%) | 1,233 (19.3%) |
| Total | 13,756 (70.3%) | 5,811 (29.7%) |
Fertility by Education in Sacramento County
Average fertility rate in Sacramento County is 51.0 births per 1,000 women. Women with the education attainment of high school diploma have the highest fertility rate of 64.0 births per 1,000 women, while women with the education attainment of less than high school have the lowest fertility at 25.0 births per 1,000 women. Women with the education attainment of college or associate's degree represent 34.6% of all women with births.
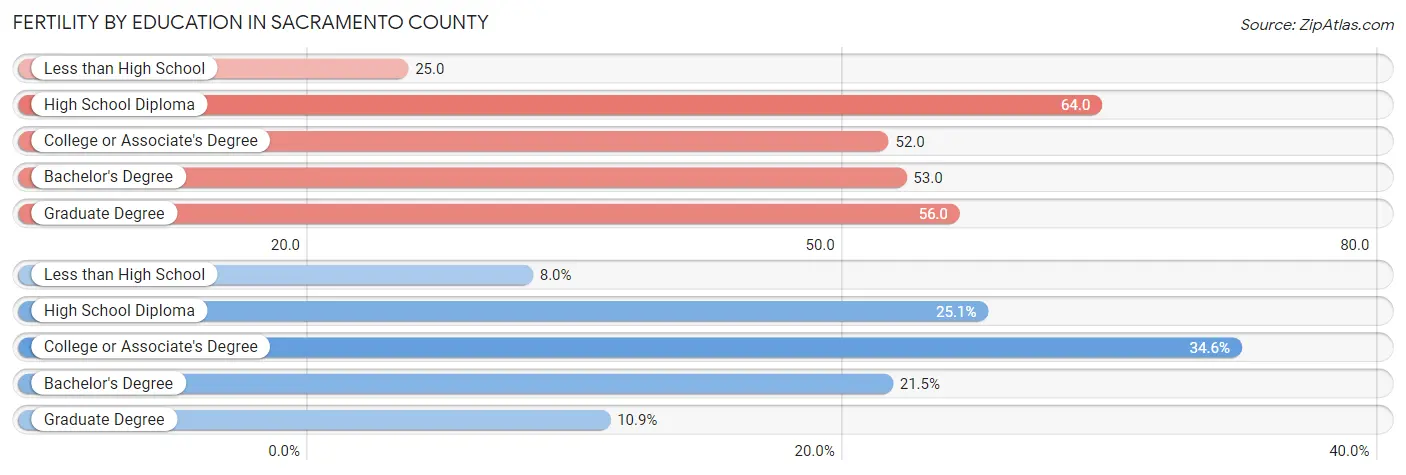
| Educational Attainment | Women with Births | Births / 1,000 Women |
| Less than High School | 1,565 (8.0%) | 25.0 |
| High School Diploma | 4,904 (25.1%) | 64.0 |
| College or Associate's Degree | 6,762 (34.6%) | 52.0 |
| Bachelor's Degree | 4,204 (21.5%) | 53.0 |
| Graduate Degree | 2,132 (10.9%) | 56.0 |
| Total | 19,567 (100.0%) | 51.0 |
Fertility by Education by Marriage Status in Sacramento County
29.7% of women with births in Sacramento County are unmarried. Women with the educational attainment of graduate degree are most likely to be married with 89.4% of them married at childbirth, while women with the educational attainment of high school diploma are least likely to be married with 39.8% of them unmarried at childbirth.
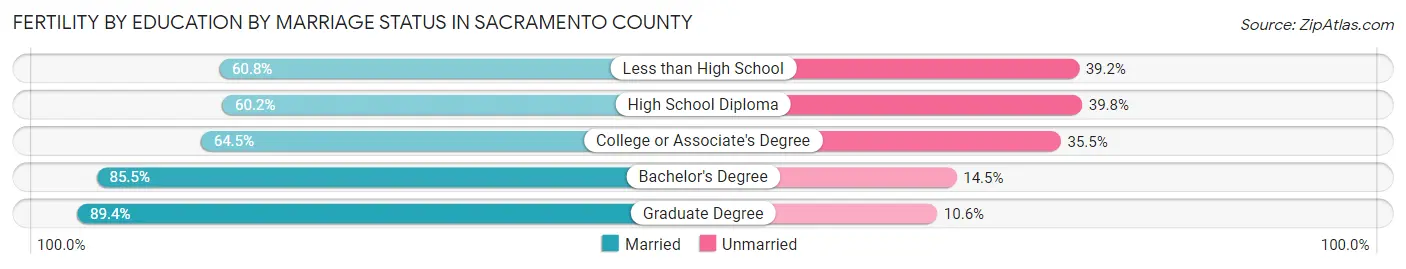
| Educational Attainment | Married | Unmarried |
| Less than High School | 952 (60.8%) | 613 (39.2%) |
| High School Diploma | 2,952 (60.2%) | 1,952 (39.8%) |
| College or Associate's Degree | 4,361 (64.5%) | 2,401 (35.5%) |
| Bachelor's Degree | 3,594 (85.5%) | 610 (14.5%) |
| Graduate Degree | 1,906 (89.4%) | 226 (10.6%) |
| Total | 13,756 (70.3%) | 5,811 (29.7%) |
Employment Characteristics in Sacramento County
Employment by Class of Employer in Sacramento County
Among the 727,094 employed individuals in Sacramento County, private company employees (433,907 | 59.7%), state government employees (89,256 | 12.3%), and not-for-profit organizations (60,051 | 8.3%) make up the most common classes of employment.
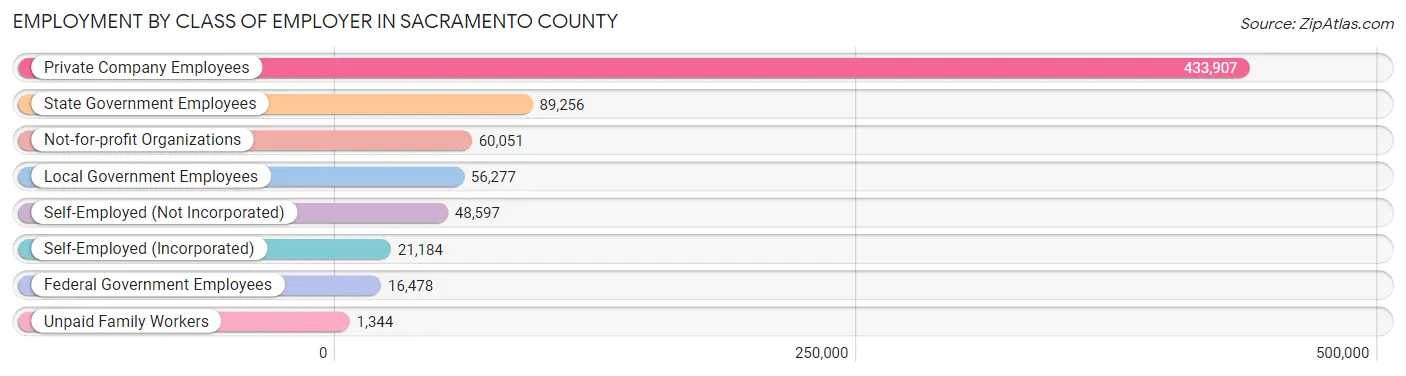
| Employer Class | # Employees | % Employees |
| Private Company Employees | 433,907 | 59.7% |
| Self-Employed (Incorporated) | 21,184 | 2.9% |
| Self-Employed (Not Incorporated) | 48,597 | 6.7% |
| Not-for-profit Organizations | 60,051 | 8.3% |
| Local Government Employees | 56,277 | 7.7% |
| State Government Employees | 89,256 | 12.3% |
| Federal Government Employees | 16,478 | 2.3% |
| Unpaid Family Workers | 1,344 | 0.2% |
| Total | 727,094 | 100.0% |
Employment Status by Age in Sacramento County
According to the labor force statistics for Sacramento County, out of the total population over 16 years of age (1,255,070), 63.5% or 796,969 individuals are in the labor force, with 6.3% or 50,209 of them unemployed. The age group with the highest labor force participation rate is 35 to 44 years, with 82.3% or 180,160 individuals in the labor force. Within the labor force, the 16 to 19 years age range has the highest percentage of unemployed individuals, with 17.2% or 4,611 of them being unemployed.
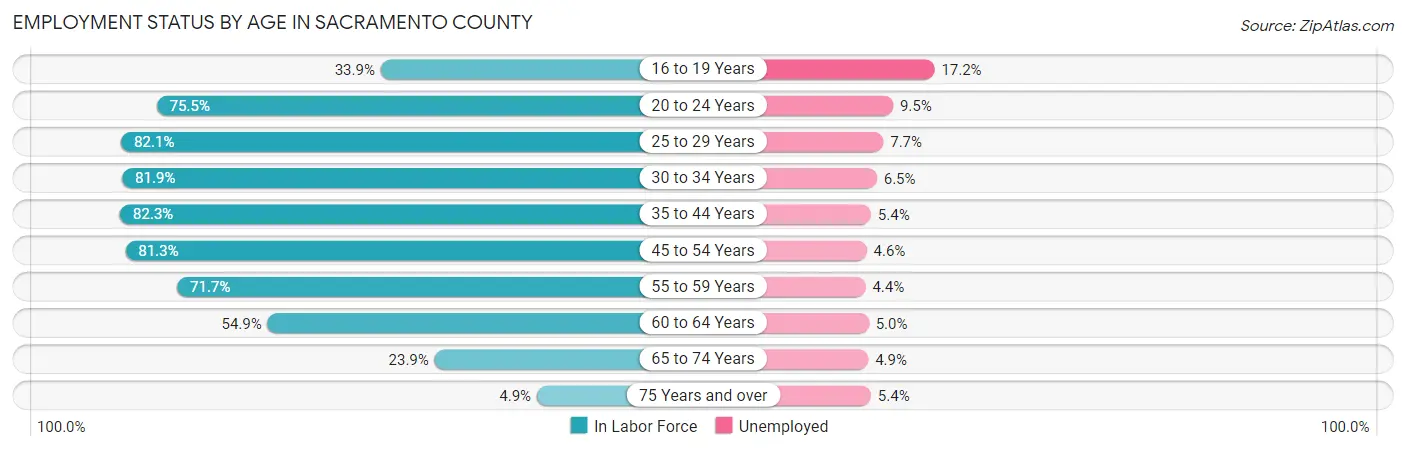
| Age Bracket | In Labor Force | Unemployed |
| 16 to 19 Years | 26,807 (33.9%) | 4,611 (17.2%) |
| 20 to 24 Years | 74,623 (75.5%) | 7,089 (9.5%) |
| 25 to 29 Years | 97,759 (82.1%) | 7,527 (7.7%) |
| 30 to 34 Years | 102,038 (81.9%) | 6,632 (6.5%) |
| 35 to 44 Years | 180,160 (82.3%) | 9,729 (5.4%) |
| 45 to 54 Years | 157,761 (81.3%) | 7,257 (4.6%) |
| 55 to 59 Years | 69,330 (71.7%) | 3,051 (4.4%) |
| 60 to 64 Years | 51,302 (54.9%) | 2,565 (5.0%) |
| 65 to 74 Years | 32,853 (23.9%) | 1,610 (4.9%) |
| 75 Years and over | 4,554 (4.9%) | 246 (5.4%) |
| Total | 796,969 (63.5%) | 50,209 (6.3%) |
Employment Status by Educational Attainment in Sacramento County
According to labor force statistics for Sacramento County, 77.7% of individuals (657,929) out of the total population between 25 and 64 years of age (846,756) are in the labor force, with 5.6% or 36,844 of them being unemployed. The group with the highest labor force participation rate are those with the educational attainment of bachelor's degree or higher, with 87.4% or 245,125 individuals in the labor force. Within the labor force, individuals with less than high school education have the highest percentage of unemployment, with 8.3% or 4,603 of them being unemployed.
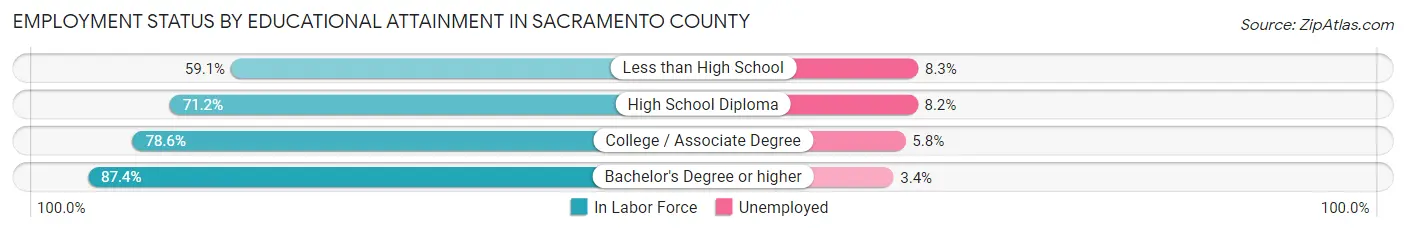
| Educational Attainment | In Labor Force | Unemployed |
| Less than High School | 55,460 (59.1%) | 7,789 (8.3%) |
| High School Diploma | 132,532 (71.2%) | 15,264 (8.2%) |
| College / Associate Degree | 225,040 (78.6%) | 16,606 (5.8%) |
| Bachelor's Degree or higher | 245,125 (87.4%) | 9,536 (3.4%) |
| Total | 657,929 (77.7%) | 47,418 (5.6%) |
Employment Occupations by Sex in Sacramento County
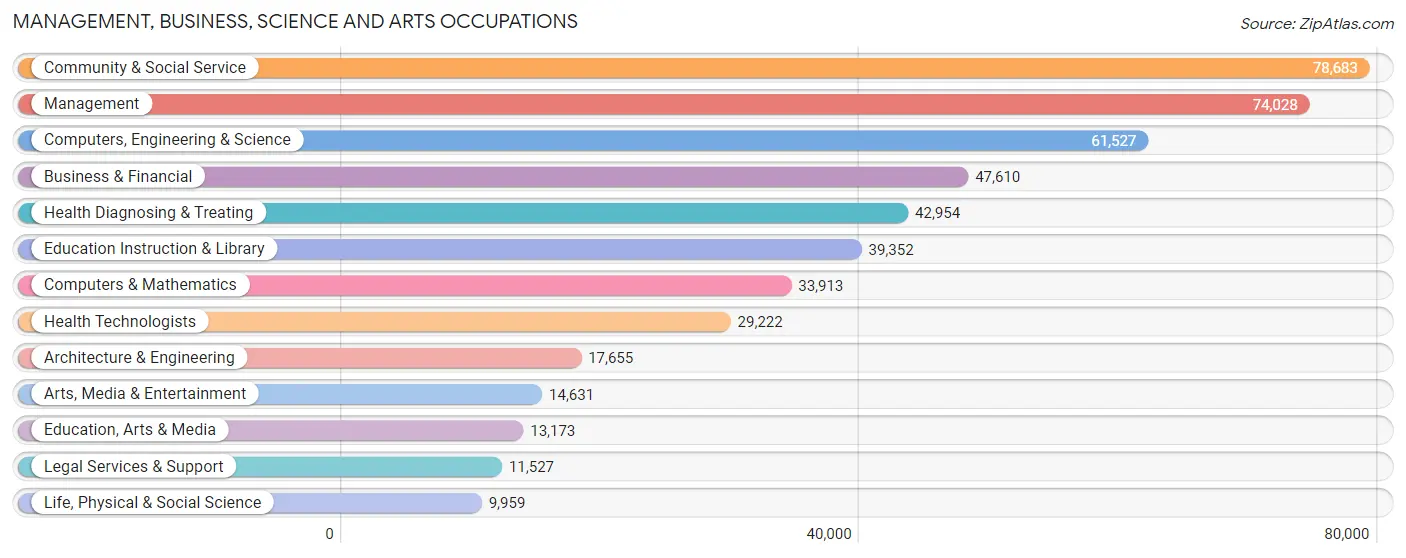
Management, Business, Science and Arts Occupations
The most common Management, Business, Science and Arts occupations in Sacramento County are Community & Social Service (78,683 | 10.6%), Management (74,028 | 9.9%), Computers, Engineering & Science (61,527 | 8.3%), Business & Financial (47,610 | 6.4%), and Health Diagnosing & Treating (42,954 | 5.8%).
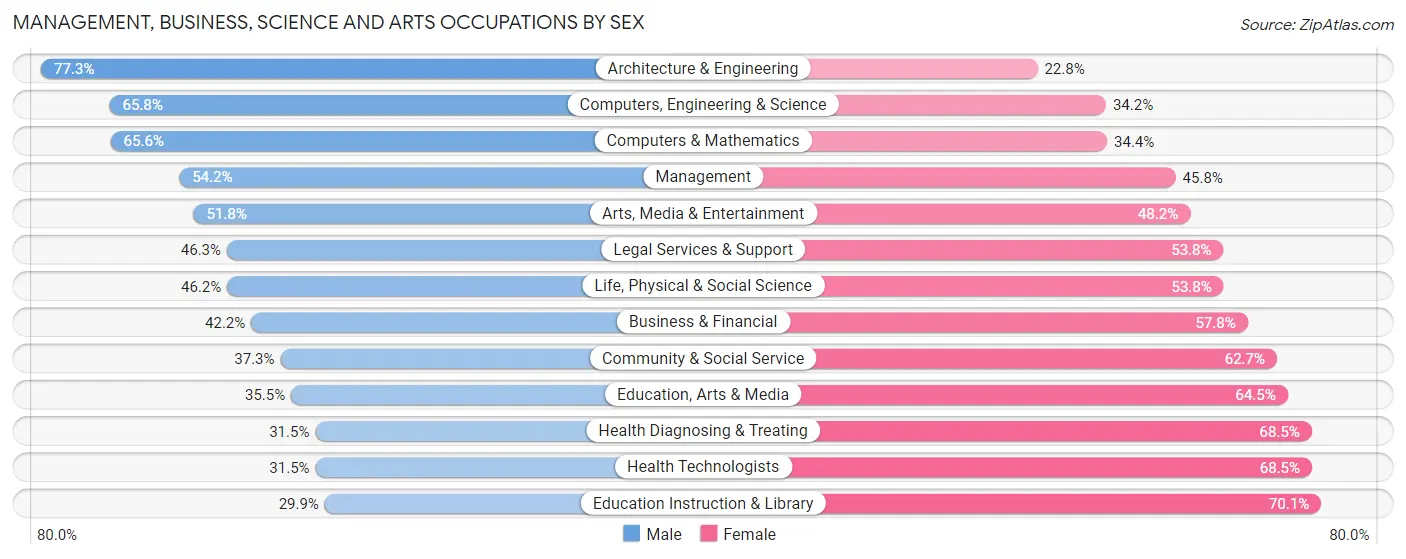
Management, Business, Science and Arts Occupations by Sex
Within the Management, Business, Science and Arts occupations in Sacramento County, the most male-oriented occupations are Architecture & Engineering (77.2%), Computers, Engineering & Science (65.8%), and Computers & Mathematics (65.6%), while the most female-oriented occupations are Education Instruction & Library (70.1%), Health Technologists (68.5%), and Health Diagnosing & Treating (68.5%).
| Occupation | Male | Female |
| Management | 40,117 (54.2%) | 33,911 (45.8%) |
| Business & Financial | 20,091 (42.2%) | 27,519 (57.8%) |
| Computers, Engineering & Science | 40,496 (65.8%) | 21,031 (34.2%) |
| Computers & Mathematics | 22,256 (65.6%) | 11,657 (34.4%) |
| Architecture & Engineering | 13,639 (77.2%) | 4,016 (22.8%) |
| Life, Physical & Social Science | 4,601 (46.2%) | 5,358 (53.8%) |
| Community & Social Service | 29,367 (37.3%) | 49,316 (62.7%) |
| Education, Arts & Media | 4,680 (35.5%) | 8,493 (64.5%) |
| Legal Services & Support | 5,331 (46.3%) | 6,196 (53.7%) |
| Education Instruction & Library | 11,776 (29.9%) | 27,576 (70.1%) |
| Arts, Media & Entertainment | 7,580 (51.8%) | 7,051 (48.2%) |
| Health Diagnosing & Treating | 13,531 (31.5%) | 29,423 (68.5%) |
| Health Technologists | 9,196 (31.5%) | 20,026 (68.5%) |
| Total (Category) | 143,602 (47.1%) | 161,200 (52.9%) |
| Total (Overall) | 390,316 (52.4%) | 354,829 (47.6%) |
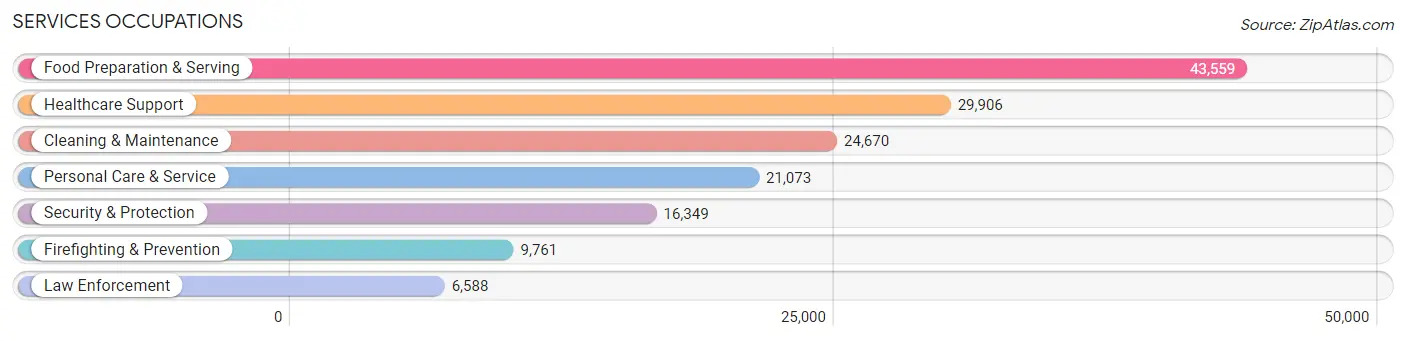
Services Occupations
The most common Services occupations in Sacramento County are Food Preparation & Serving (43,559 | 5.9%), Healthcare Support (29,906 | 4.0%), Cleaning & Maintenance (24,670 | 3.3%), Personal Care & Service (21,073 | 2.8%), and Security & Protection (16,349 | 2.2%).
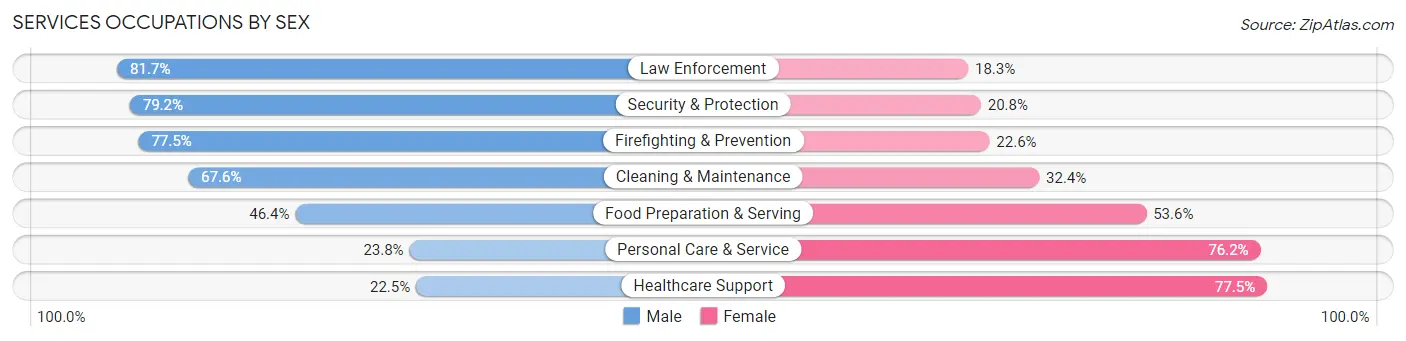
Services Occupations by Sex
Within the Services occupations in Sacramento County, the most male-oriented occupations are Law Enforcement (81.7%), Security & Protection (79.2%), and Firefighting & Prevention (77.4%), while the most female-oriented occupations are Healthcare Support (77.5%), Personal Care & Service (76.2%), and Food Preparation & Serving (53.6%).
| Occupation | Male | Female |
| Healthcare Support | 6,724 (22.5%) | 23,182 (77.5%) |
| Security & Protection | 12,942 (79.2%) | 3,407 (20.8%) |
| Firefighting & Prevention | 7,560 (77.4%) | 2,201 (22.6%) |
| Law Enforcement | 5,382 (81.7%) | 1,206 (18.3%) |
| Food Preparation & Serving | 20,212 (46.4%) | 23,347 (53.6%) |
| Cleaning & Maintenance | 16,679 (67.6%) | 7,991 (32.4%) |
| Personal Care & Service | 5,013 (23.8%) | 16,060 (76.2%) |
| Total (Category) | 61,570 (45.4%) | 73,987 (54.6%) |
| Total (Overall) | 390,316 (52.4%) | 354,829 (47.6%) |
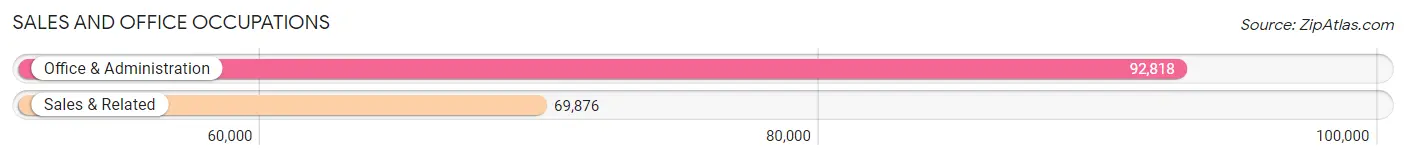
Sales and Office Occupations
The most common Sales and Office occupations in Sacramento County are Office & Administration (92,818 | 12.5%), and Sales & Related (69,876 | 9.4%).
Sales and Office Occupations by Sex
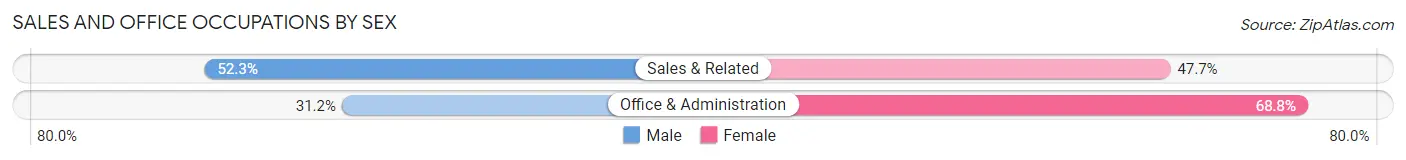
| Occupation | Male | Female |
| Sales & Related | 36,561 (52.3%) | 33,315 (47.7%) |
| Office & Administration | 28,961 (31.2%) | 63,857 (68.8%) |
| Total (Category) | 65,522 (40.3%) | 97,172 (59.7%) |
| Total (Overall) | 390,316 (52.4%) | 354,829 (47.6%) |
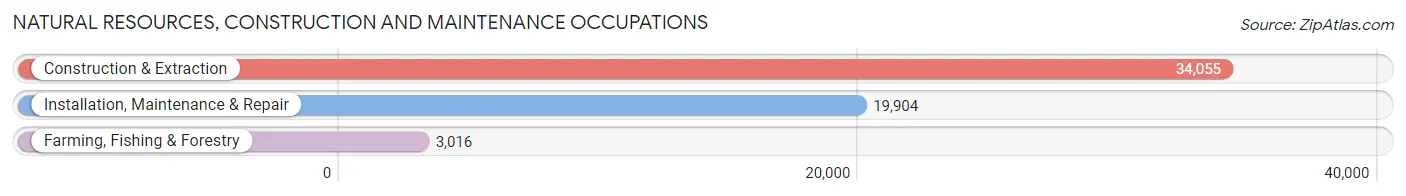
Natural Resources, Construction and Maintenance Occupations
The most common Natural Resources, Construction and Maintenance occupations in Sacramento County are Construction & Extraction (34,055 | 4.6%), Installation, Maintenance & Repair (19,904 | 2.7%), and Farming, Fishing & Forestry (3,016 | 0.4%).
Natural Resources, Construction and Maintenance Occupations by Sex
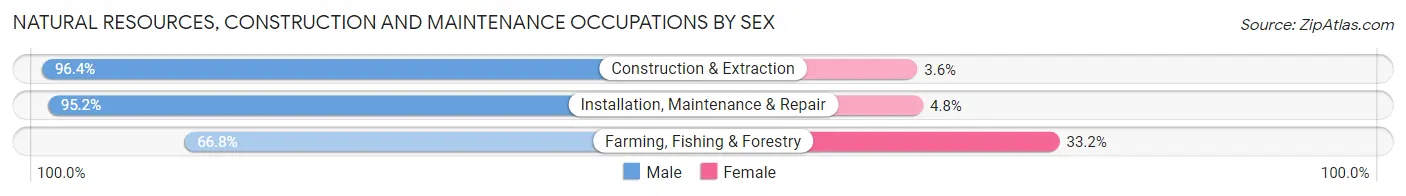
| Occupation | Male | Female |
| Farming, Fishing & Forestry | 2,014 (66.8%) | 1,002 (33.2%) |
| Construction & Extraction | 32,821 (96.4%) | 1,234 (3.6%) |
| Installation, Maintenance & Repair | 18,942 (95.2%) | 962 (4.8%) |
| Total (Category) | 53,777 (94.4%) | 3,198 (5.6%) |
| Total (Overall) | 390,316 (52.4%) | 354,829 (47.6%) |
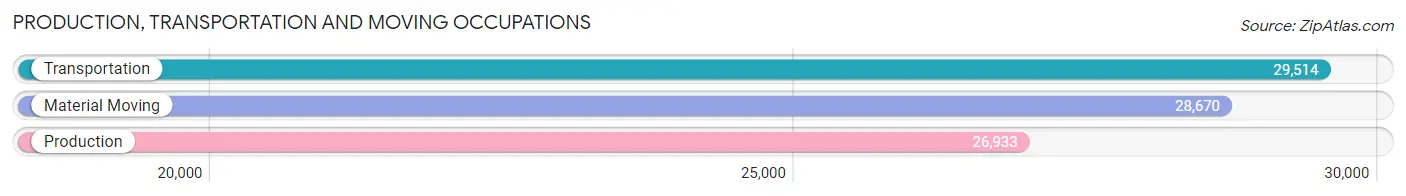
Production, Transportation and Moving Occupations
The most common Production, Transportation and Moving occupations in Sacramento County are Transportation (29,514 | 4.0%), Material Moving (28,670 | 3.8%), and Production (26,933 | 3.6%).
Production, Transportation and Moving Occupations by Sex
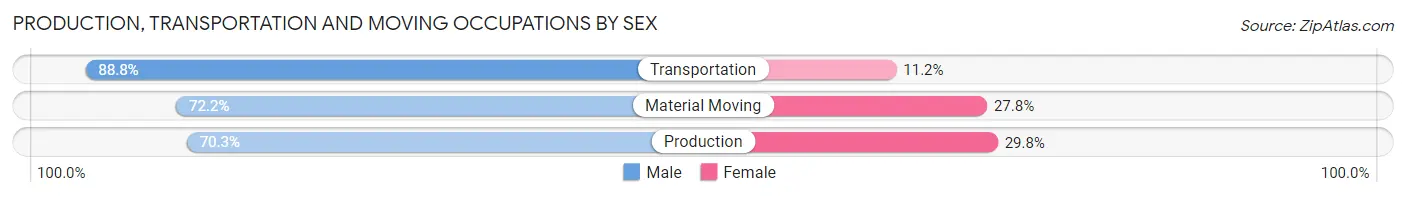
| Occupation | Male | Female |
| Production | 18,920 (70.3%) | 8,013 (29.7%) |
| Transportation | 26,221 (88.8%) | 3,293 (11.2%) |
| Material Moving | 20,704 (72.2%) | 7,966 (27.8%) |
| Total (Category) | 65,845 (77.4%) | 19,272 (22.6%) |
| Total (Overall) | 390,316 (52.4%) | 354,829 (47.6%) |
Employment Industries by Sex in Sacramento County
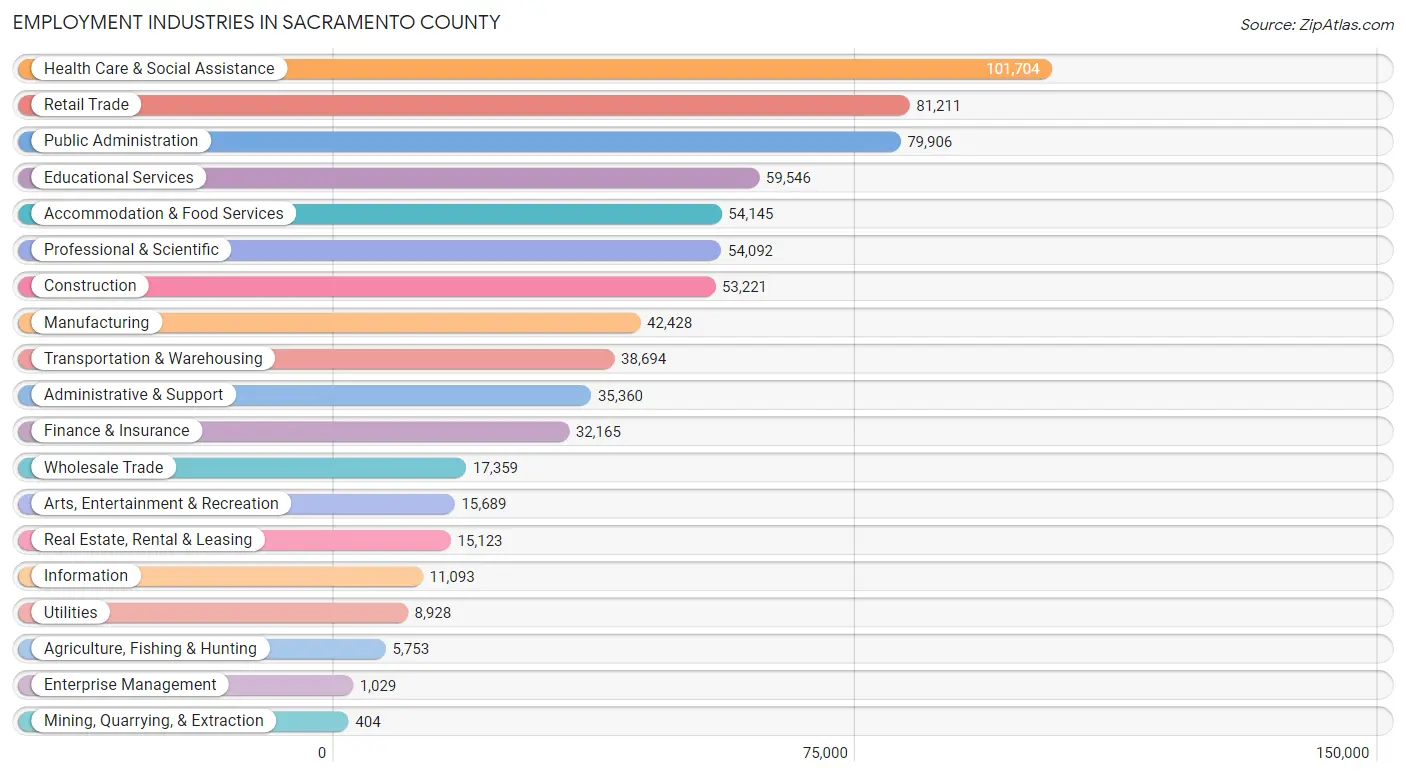
Employment Industries in Sacramento County
The major employment industries in Sacramento County include Health Care & Social Assistance (101,704 | 13.7%), Retail Trade (81,211 | 10.9%), Public Administration (79,906 | 10.7%), Educational Services (59,546 | 8.0%), and Accommodation & Food Services (54,145 | 7.3%).
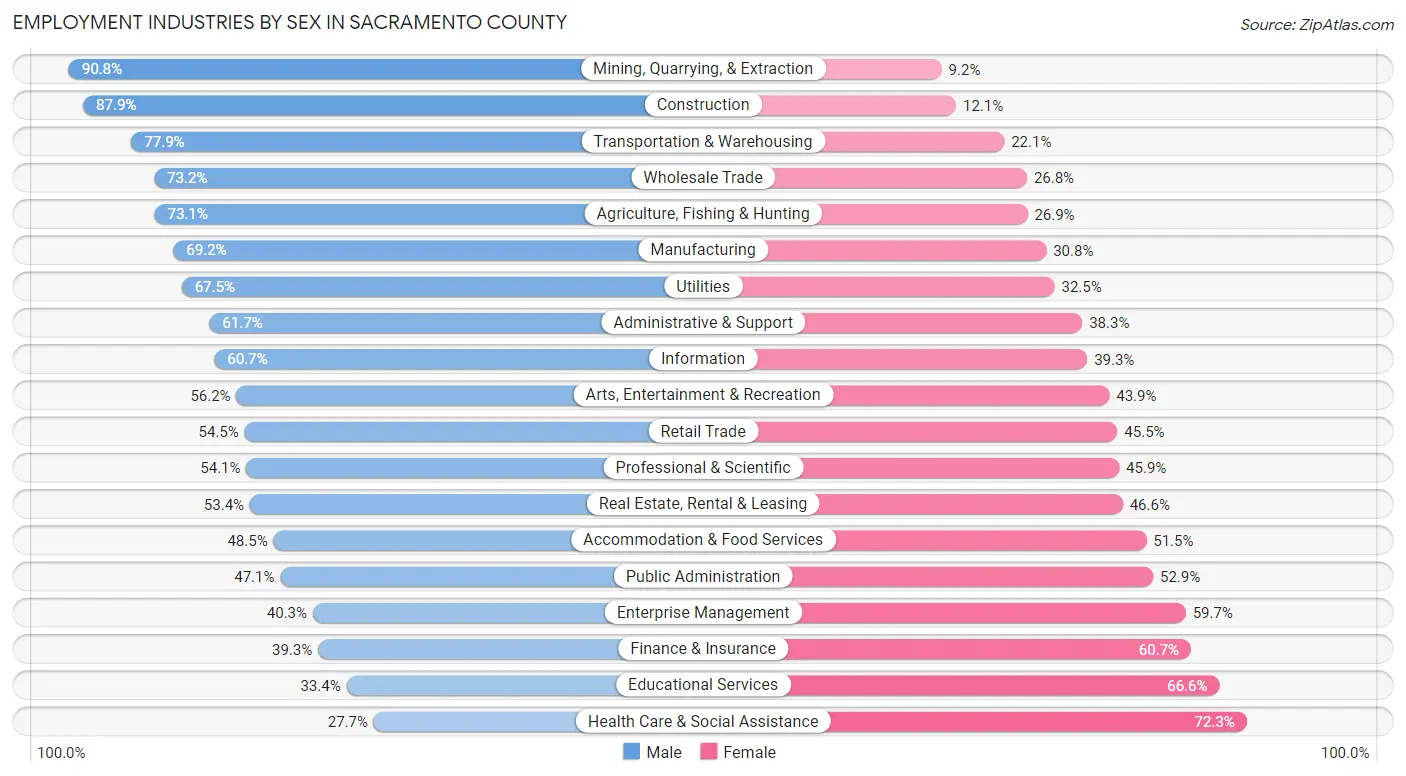
Employment Industries by Sex in Sacramento County
The Sacramento County industries that see more men than women are Mining, Quarrying, & Extraction (90.8%), Construction (87.9%), and Transportation & Warehousing (77.9%), whereas the industries that tend to have a higher number of women are Health Care & Social Assistance (72.3%), Educational Services (66.6%), and Finance & Insurance (60.7%).
| Industry | Male | Female |
| Agriculture, Fishing & Hunting | 4,205 (73.1%) | 1,548 (26.9%) |
| Mining, Quarrying, & Extraction | 367 (90.8%) | 37 (9.2%) |
| Construction | 46,764 (87.9%) | 6,457 (12.1%) |
| Manufacturing | 29,360 (69.2%) | 13,068 (30.8%) |
| Wholesale Trade | 12,705 (73.2%) | 4,654 (26.8%) |
| Retail Trade | 44,233 (54.5%) | 36,978 (45.5%) |
| Transportation & Warehousing | 30,139 (77.9%) | 8,555 (22.1%) |
| Utilities | 6,025 (67.5%) | 2,903 (32.5%) |
| Information | 6,736 (60.7%) | 4,357 (39.3%) |
| Finance & Insurance | 12,627 (39.3%) | 19,538 (60.7%) |
| Real Estate, Rental & Leasing | 8,070 (53.4%) | 7,053 (46.6%) |
| Professional & Scientific | 29,265 (54.1%) | 24,827 (45.9%) |
| Enterprise Management | 415 (40.3%) | 614 (59.7%) |
| Administrative & Support | 21,832 (61.7%) | 13,528 (38.3%) |
| Educational Services | 19,876 (33.4%) | 39,670 (66.6%) |
| Health Care & Social Assistance | 28,189 (27.7%) | 73,515 (72.3%) |
| Arts, Entertainment & Recreation | 8,810 (56.1%) | 6,879 (43.9%) |
| Accommodation & Food Services | 26,252 (48.5%) | 27,893 (51.5%) |
| Public Administration | 37,615 (47.1%) | 42,291 (52.9%) |
| Total | 390,316 (52.4%) | 354,829 (47.6%) |
Education in Sacramento County
School Enrollment in Sacramento County
The most common levels of schooling among the 405,174 students in Sacramento County are college / undergraduate (97,314 | 24.0%), high school (86,262 | 21.3%), and middle school (82,118 | 20.3%).
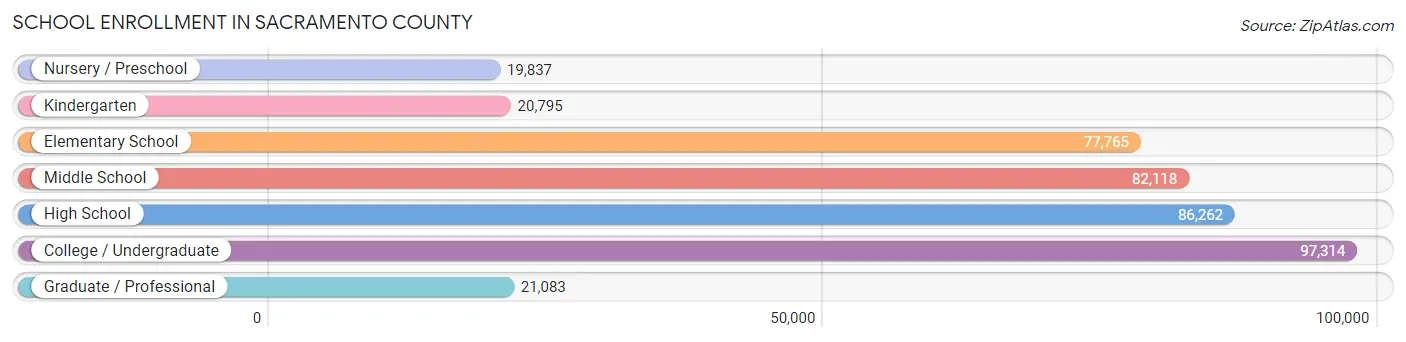
| School Level | # Students | % Students |
| Nursery / Preschool | 19,837 | 4.9% |
| Kindergarten | 20,795 | 5.1% |
| Elementary School | 77,765 | 19.2% |
| Middle School | 82,118 | 20.3% |
| High School | 86,262 | 21.3% |
| College / Undergraduate | 97,314 | 24.0% |
| Graduate / Professional | 21,083 | 5.2% |
| Total | 405,174 | 100.0% |
School Enrollment by Age by Funding Source in Sacramento County
Out of a total of 405,174 students who are enrolled in schools in Sacramento County, 47,811 (11.8%) attend a private institution, while the remaining 357,363 (88.2%) are enrolled in public schools. The age group of 3 to 4 year olds has the highest likelihood of being enrolled in private schools, with 6,180 (37.8% in the age bracket) enrolled. Conversely, the age group of 20 to 24 year olds has the lowest likelihood of being enrolled in a private school, with 38,298 (92.9% in the age bracket) attending a public institution.
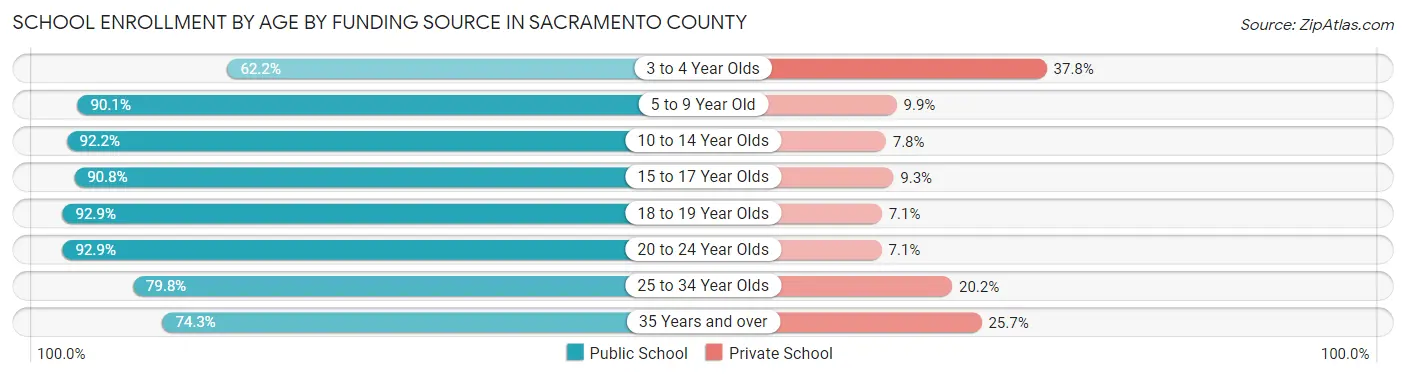
| Age Bracket | Public School | Private School |
| 3 to 4 Year Olds | 10,169 (62.2%) | 6,180 (37.8%) |
| 5 to 9 Year Old | 83,352 (90.1%) | 9,116 (9.9%) |
| 10 to 14 Year Olds | 96,881 (92.2%) | 8,246 (7.8%) |
| 15 to 17 Year Olds | 55,356 (90.7%) | 5,639 (9.2%) |
| 18 to 19 Year Olds | 26,022 (92.9%) | 1,983 (7.1%) |
| 20 to 24 Year Olds | 38,298 (92.9%) | 2,909 (7.1%) |
| 25 to 34 Year Olds | 27,235 (79.8%) | 6,886 (20.2%) |
| 35 Years and over | 19,996 (74.3%) | 6,906 (25.7%) |
| Total | 357,363 (88.2%) | 47,811 (11.8%) |
Educational Attainment by Field of Study in Sacramento County
Business (65,335 | 17.2%), social sciences (42,657 | 11.2%), science & technology (32,724 | 8.6%), arts & humanities (30,655 | 8.1%), and bio, nature & agricultural (30,090 | 7.9%) are the most common fields of study among 379,412 individuals in Sacramento County who have obtained a bachelor's degree or higher.
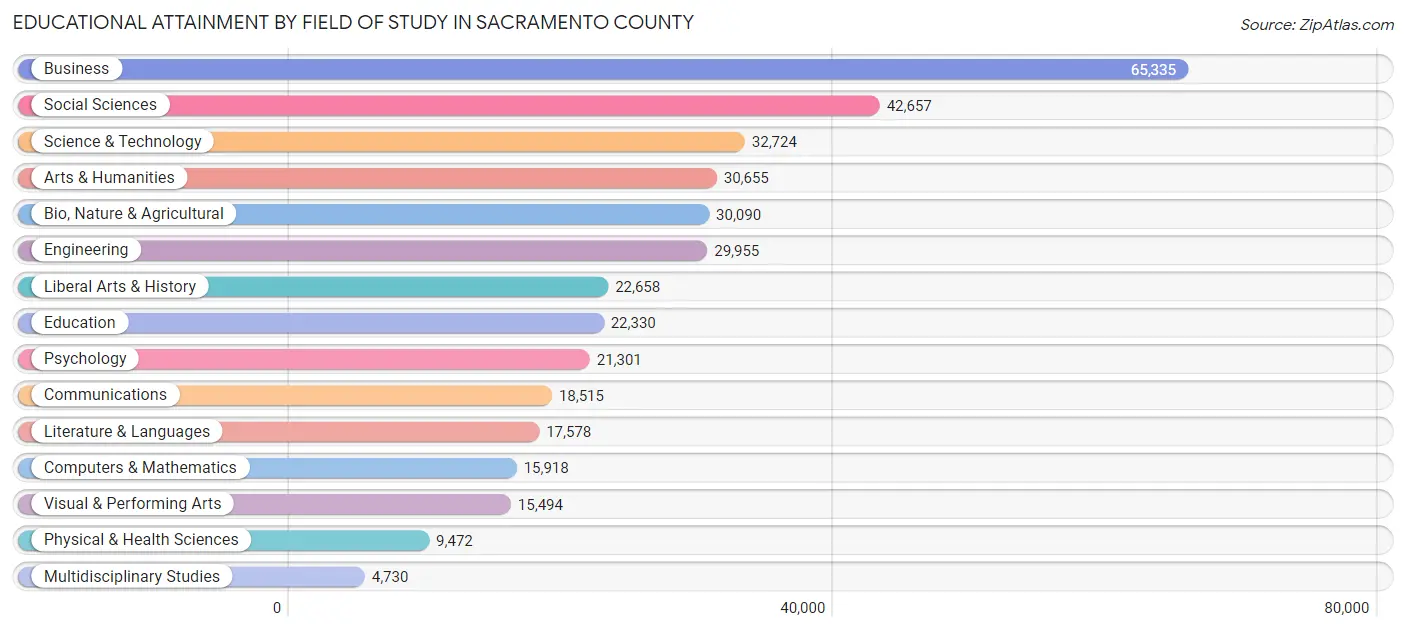
| Field of Study | # Graduates | % Graduates |
| Computers & Mathematics | 15,918 | 4.2% |
| Bio, Nature & Agricultural | 30,090 | 7.9% |
| Physical & Health Sciences | 9,472 | 2.5% |
| Psychology | 21,301 | 5.6% |
| Social Sciences | 42,657 | 11.2% |
| Engineering | 29,955 | 7.9% |
| Multidisciplinary Studies | 4,730 | 1.3% |
| Science & Technology | 32,724 | 8.6% |
| Business | 65,335 | 17.2% |
| Education | 22,330 | 5.9% |
| Literature & Languages | 17,578 | 4.6% |
| Liberal Arts & History | 22,658 | 6.0% |
| Visual & Performing Arts | 15,494 | 4.1% |
| Communications | 18,515 | 4.9% |
| Arts & Humanities | 30,655 | 8.1% |
| Total | 379,412 | 100.0% |
Transportation & Commute in Sacramento County
Vehicle Availability by Sex in Sacramento County
The most prevalent vehicle ownership categories in Sacramento County are males with 2 vehicles (156,262, accounting for 40.9%) and females with 2 vehicles (134,223, making up 45.6%).
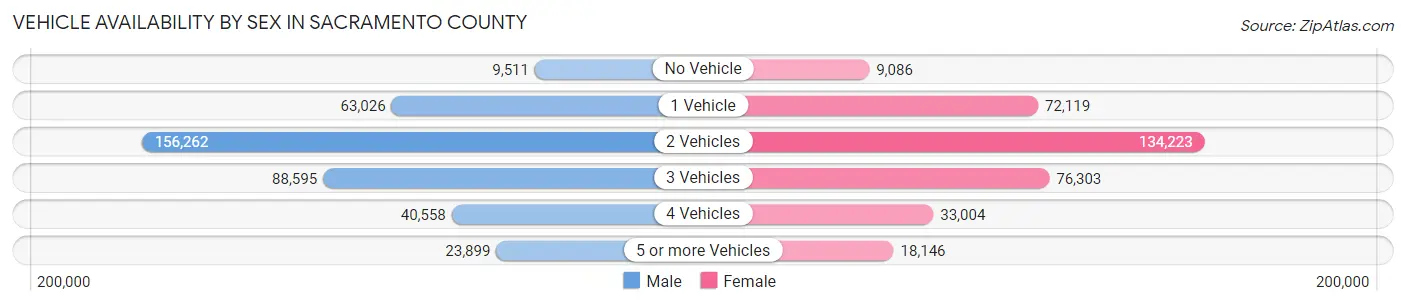
| Vehicles Available | Male | Female |
| No Vehicle | 9,511 (2.5%) | 9,086 (2.6%) |
| 1 Vehicle | 63,026 (16.5%) | 72,119 (21.0%) |
| 2 Vehicles | 156,262 (40.9%) | 134,223 (39.2%) |
| 3 Vehicles | 88,595 (23.2%) | 76,303 (22.3%) |
| 4 Vehicles | 40,558 (10.6%) | 33,004 (9.6%) |
| 5 or more Vehicles | 23,899 (6.3%) | 18,146 (5.3%) |
| Total | 381,851 (100.0%) | 342,881 (100.0%) |
Commute Time in Sacramento County
The most frequently occuring commute durations in Sacramento County are 30 to 34 minutes (106,806 commuters, 17.3%), 20 to 24 minutes (104,878 commuters, 17.0%), and 15 to 19 minutes (98,264 commuters, 15.9%).
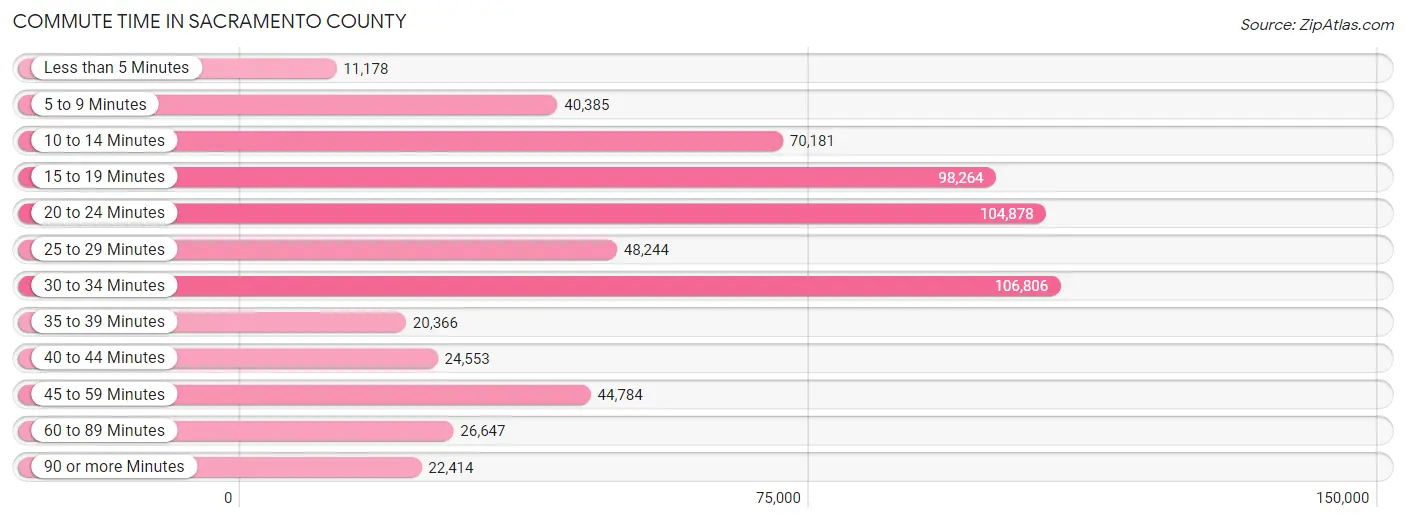
| Commute Time | # Commuters | % Commuters |
| Less than 5 Minutes | 11,178 | 1.8% |
| 5 to 9 Minutes | 40,385 | 6.5% |
| 10 to 14 Minutes | 70,181 | 11.3% |
| 15 to 19 Minutes | 98,264 | 15.9% |
| 20 to 24 Minutes | 104,878 | 17.0% |
| 25 to 29 Minutes | 48,244 | 7.8% |
| 30 to 34 Minutes | 106,806 | 17.3% |
| 35 to 39 Minutes | 20,366 | 3.3% |
| 40 to 44 Minutes | 24,553 | 4.0% |
| 45 to 59 Minutes | 44,784 | 7.2% |
| 60 to 89 Minutes | 26,647 | 4.3% |
| 90 or more Minutes | 22,414 | 3.6% |
Commute Time by Sex in Sacramento County
The most common commute times in Sacramento County are 30 to 34 minutes (58,417 commuters, 17.6%) for males and 30 to 34 minutes (48,389 commuters, 16.9%) for females.
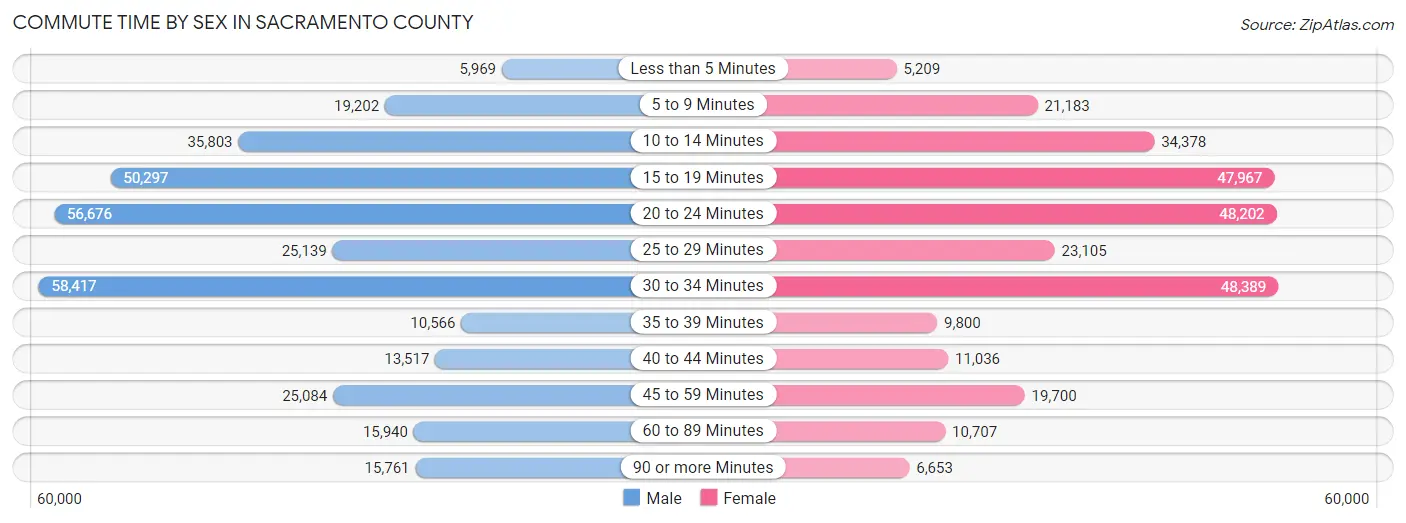
| Commute Time | Male | Female |
| Less than 5 Minutes | 5,969 (1.8%) | 5,209 (1.8%) |
| 5 to 9 Minutes | 19,202 (5.8%) | 21,183 (7.4%) |
| 10 to 14 Minutes | 35,803 (10.8%) | 34,378 (12.0%) |
| 15 to 19 Minutes | 50,297 (15.1%) | 47,967 (16.8%) |
| 20 to 24 Minutes | 56,676 (17.1%) | 48,202 (16.8%) |
| 25 to 29 Minutes | 25,139 (7.6%) | 23,105 (8.1%) |
| 30 to 34 Minutes | 58,417 (17.6%) | 48,389 (16.9%) |
| 35 to 39 Minutes | 10,566 (3.2%) | 9,800 (3.4%) |
| 40 to 44 Minutes | 13,517 (4.1%) | 11,036 (3.8%) |
| 45 to 59 Minutes | 25,084 (7.5%) | 19,700 (6.9%) |
| 60 to 89 Minutes | 15,940 (4.8%) | 10,707 (3.7%) |
| 90 or more Minutes | 15,761 (4.7%) | 6,653 (2.3%) |
Time of Departure to Work by Sex in Sacramento County
The most frequent times of departure to work in Sacramento County are 7:00 AM to 7:29 AM (41,822, 12.6%) for males and 7:00 AM to 7:29 AM (41,003, 14.3%) for females.
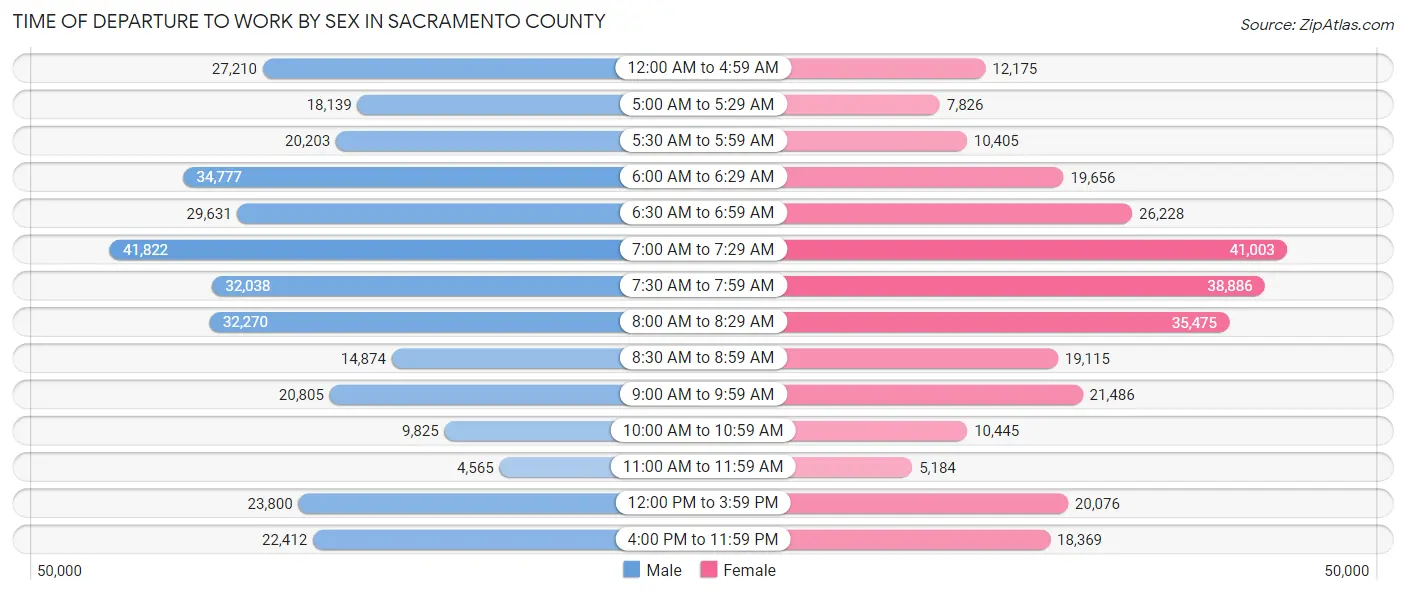
| Time of Departure | Male | Female |
| 12:00 AM to 4:59 AM | 27,210 (8.2%) | 12,175 (4.3%) |
| 5:00 AM to 5:29 AM | 18,139 (5.5%) | 7,826 (2.7%) |
| 5:30 AM to 5:59 AM | 20,203 (6.1%) | 10,405 (3.6%) |
| 6:00 AM to 6:29 AM | 34,777 (10.5%) | 19,656 (6.9%) |
| 6:30 AM to 6:59 AM | 29,631 (8.9%) | 26,228 (9.2%) |
| 7:00 AM to 7:29 AM | 41,822 (12.6%) | 41,003 (14.3%) |
| 7:30 AM to 7:59 AM | 32,038 (9.6%) | 38,886 (13.6%) |
| 8:00 AM to 8:29 AM | 32,270 (9.7%) | 35,475 (12.4%) |
| 8:30 AM to 8:59 AM | 14,874 (4.5%) | 19,115 (6.7%) |
| 9:00 AM to 9:59 AM | 20,805 (6.3%) | 21,486 (7.5%) |
| 10:00 AM to 10:59 AM | 9,825 (3.0%) | 10,445 (3.6%) |
| 11:00 AM to 11:59 AM | 4,565 (1.4%) | 5,184 (1.8%) |
| 12:00 PM to 3:59 PM | 23,800 (7.2%) | 20,076 (7.0%) |
| 4:00 PM to 11:59 PM | 22,412 (6.7%) | 18,369 (6.4%) |
| Total | 332,371 (100.0%) | 286,329 (100.0%) |
Housing Occupancy in Sacramento County
Occupancy by Ownership in Sacramento County
Of the total 563,856 dwellings in Sacramento County, owner-occupied units account for 328,664 (58.3%), while renter-occupied units make up 235,192 (41.7%).
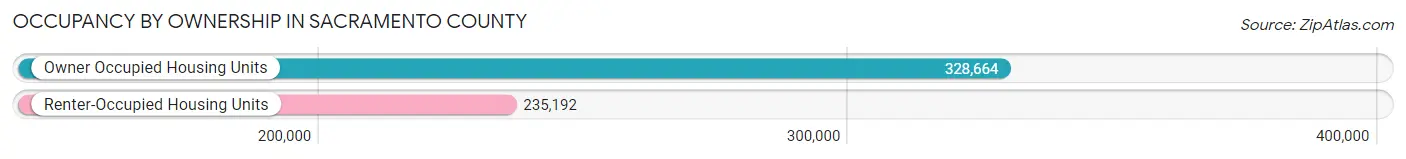
| Occupancy | # Housing Units | % Housing Units |
| Owner Occupied Housing Units | 328,664 | 58.3% |
| Renter-Occupied Housing Units | 235,192 | 41.7% |
| Total Occupied Housing Units | 563,856 | 100.0% |
Occupancy by Household Size in Sacramento County
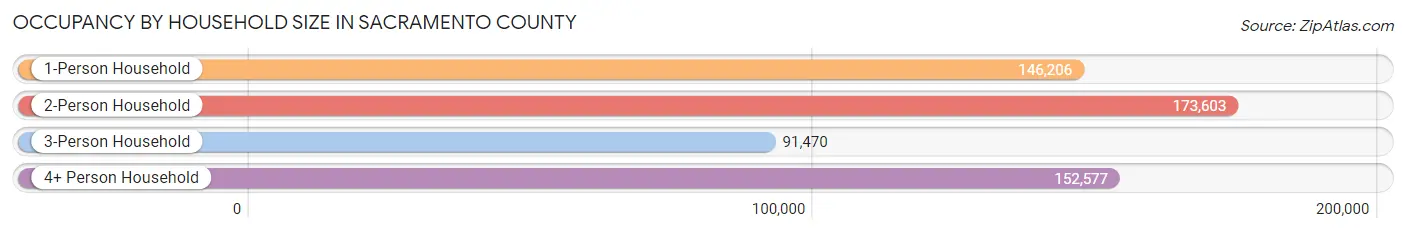
| Household Size | # Housing Units | % Housing Units |
| 1-Person Household | 146,206 | 25.9% |
| 2-Person Household | 173,603 | 30.8% |
| 3-Person Household | 91,470 | 16.2% |
| 4+ Person Household | 152,577 | 27.1% |
| Total Housing Units | 563,856 | 100.0% |
Occupancy by Ownership by Household Size in Sacramento County
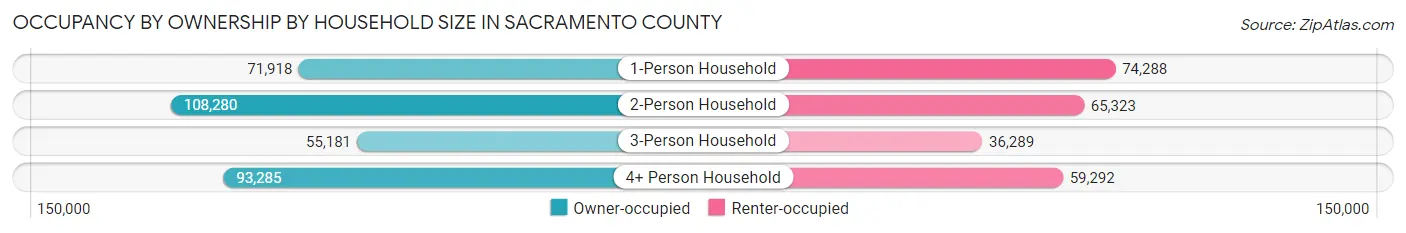
| Household Size | Owner-occupied | Renter-occupied |
| 1-Person Household | 71,918 (49.2%) | 74,288 (50.8%) |
| 2-Person Household | 108,280 (62.4%) | 65,323 (37.6%) |
| 3-Person Household | 55,181 (60.3%) | 36,289 (39.7%) |
| 4+ Person Household | 93,285 (61.1%) | 59,292 (38.9%) |
| Total Housing Units | 328,664 (58.3%) | 235,192 (41.7%) |
Occupancy by Educational Attainment in Sacramento County
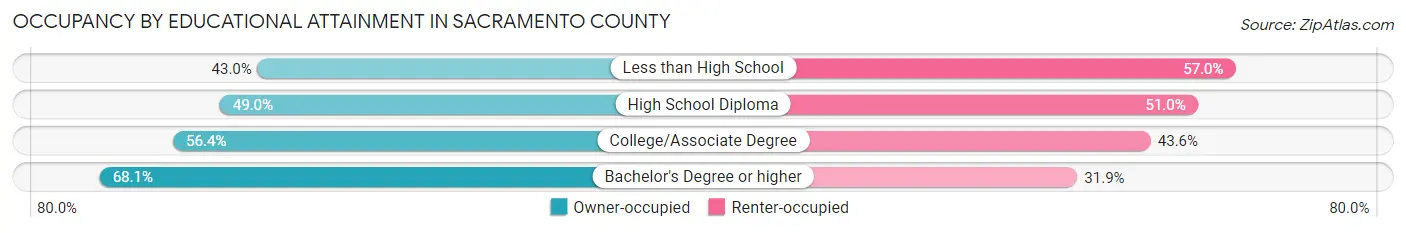
| Household Size | Owner-occupied | Renter-occupied |
| Less than High School | 20,351 (43.0%) | 26,929 (57.0%) |
| High School Diploma | 49,484 (49.0%) | 51,435 (51.0%) |
| College/Associate Degree | 116,961 (56.4%) | 90,300 (43.6%) |
| Bachelor's Degree or higher | 141,868 (68.1%) | 66,528 (31.9%) |
Occupancy by Age of Householder in Sacramento County
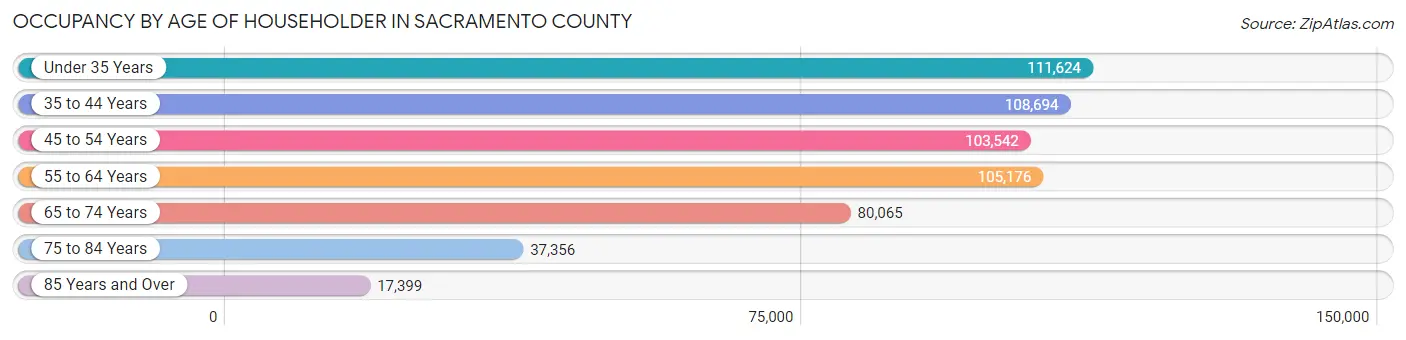
| Age Bracket | # Households | % Households |
| Under 35 Years | 111,624 | 19.8% |
| 35 to 44 Years | 108,694 | 19.3% |
| 45 to 54 Years | 103,542 | 18.4% |
| 55 to 64 Years | 105,176 | 18.6% |
| 65 to 74 Years | 80,065 | 14.2% |
| 75 to 84 Years | 37,356 | 6.6% |
| 85 Years and Over | 17,399 | 3.1% |
| Total | 563,856 | 100.0% |
Housing Finances in Sacramento County
Median Income by Occupancy in Sacramento County
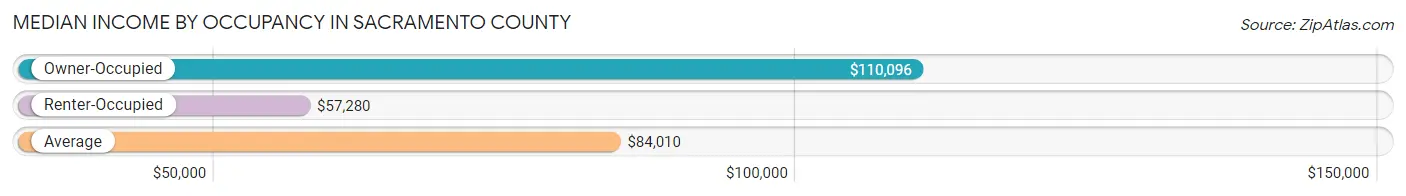
| Occupancy Type | # Households | Median Income |
| Owner-Occupied | 328,664 (58.3%) | $110,096 |
| Renter-Occupied | 235,192 (41.7%) | $57,280 |
| Average | 563,856 (100.0%) | $84,010 |
Occupancy by Householder Income Bracket in Sacramento County
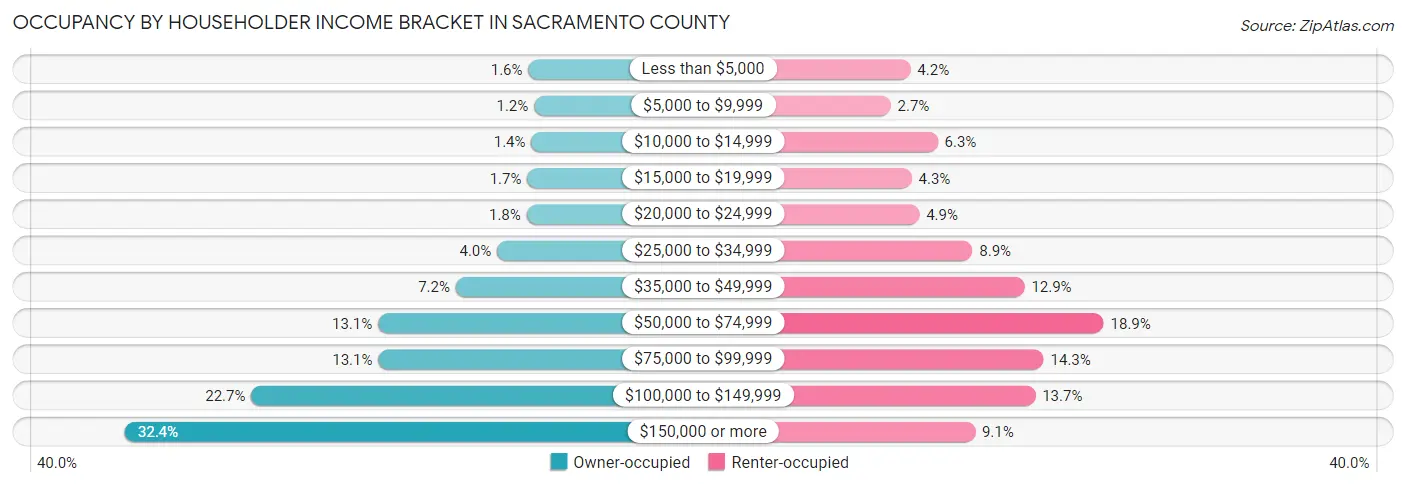
| Income Bracket | Owner-occupied | Renter-occupied |
| Less than $5,000 | 5,314 (1.6%) | 9,824 (4.2%) |
| $5,000 to $9,999 | 3,883 (1.2%) | 6,288 (2.7%) |
| $10,000 to $14,999 | 4,573 (1.4%) | 14,711 (6.2%) |
| $15,000 to $19,999 | 5,583 (1.7%) | 10,031 (4.3%) |
| $20,000 to $24,999 | 5,757 (1.8%) | 11,399 (4.9%) |
| $25,000 to $34,999 | 13,159 (4.0%) | 20,936 (8.9%) |
| $35,000 to $49,999 | 23,490 (7.1%) | 30,272 (12.9%) |
| $50,000 to $74,999 | 42,950 (13.1%) | 44,441 (18.9%) |
| $75,000 to $99,999 | 42,876 (13.1%) | 33,700 (14.3%) |
| $100,000 to $149,999 | 74,709 (22.7%) | 32,193 (13.7%) |
| $150,000 or more | 106,370 (32.4%) | 21,397 (9.1%) |
| Total | 328,664 (100.0%) | 235,192 (100.0%) |
Monthly Housing Cost Tiers in Sacramento County
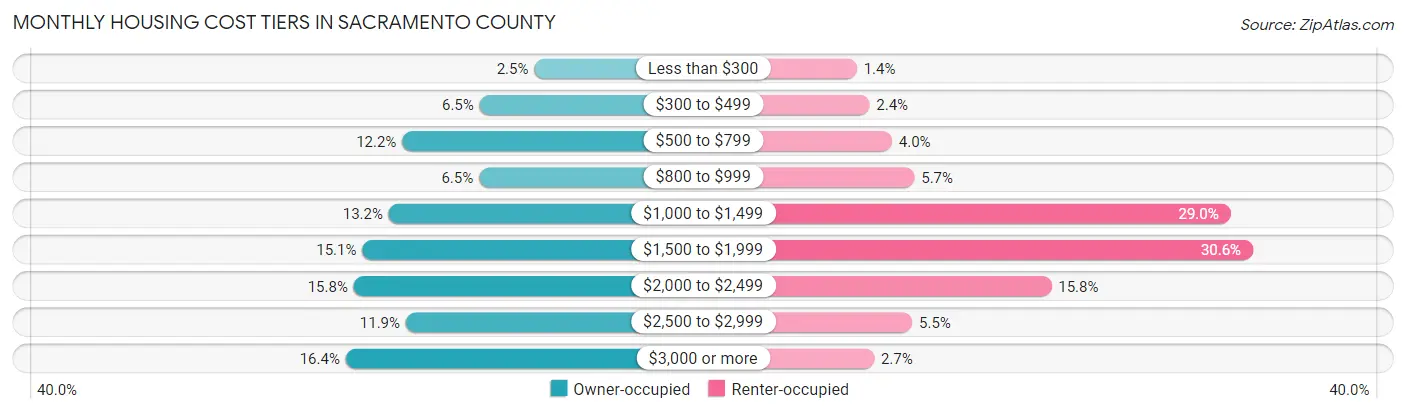
| Monthly Cost | Owner-occupied | Renter-occupied |
| Less than $300 | 8,085 (2.5%) | 3,328 (1.4%) |
| $300 to $499 | 21,331 (6.5%) | 5,532 (2.4%) |
| $500 to $799 | 40,065 (12.2%) | 9,429 (4.0%) |
| $800 to $999 | 21,455 (6.5%) | 13,309 (5.7%) |
| $1,000 to $1,499 | 43,303 (13.2%) | 68,093 (28.9%) |
| $1,500 to $1,999 | 49,726 (15.1%) | 71,974 (30.6%) |
| $2,000 to $2,499 | 51,790 (15.8%) | 37,034 (15.8%) |
| $2,500 to $2,999 | 39,164 (11.9%) | 12,924 (5.5%) |
| $3,000 or more | 53,745 (16.4%) | 6,336 (2.7%) |
| Total | 328,664 (100.0%) | 235,192 (100.0%) |
Physical Housing Characteristics in Sacramento County
Housing Structures in Sacramento County
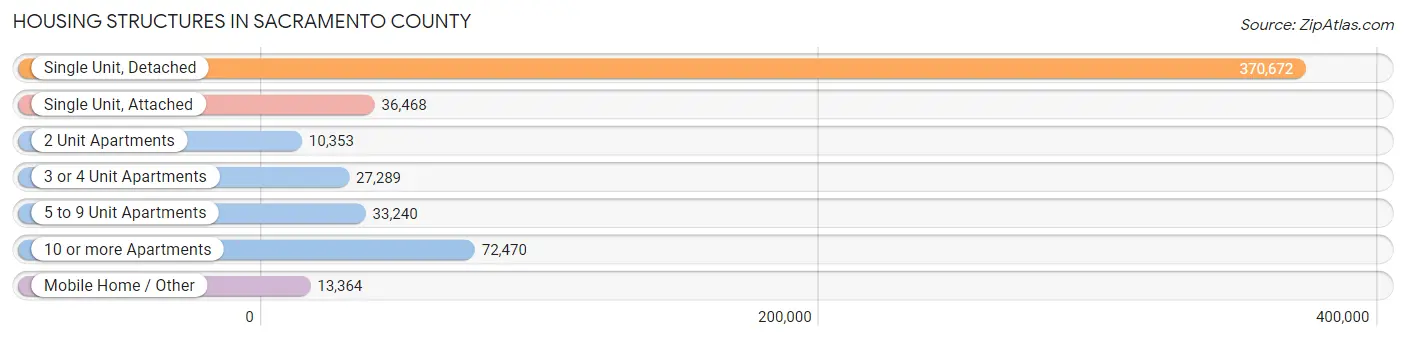
| Structure Type | # Housing Units | % Housing Units |
| Single Unit, Detached | 370,672 | 65.7% |
| Single Unit, Attached | 36,468 | 6.5% |
| 2 Unit Apartments | 10,353 | 1.8% |
| 3 or 4 Unit Apartments | 27,289 | 4.8% |
| 5 to 9 Unit Apartments | 33,240 | 5.9% |
| 10 or more Apartments | 72,470 | 12.9% |
| Mobile Home / Other | 13,364 | 2.4% |
| Total | 563,856 | 100.0% |
Housing Structures by Occupancy in Sacramento County
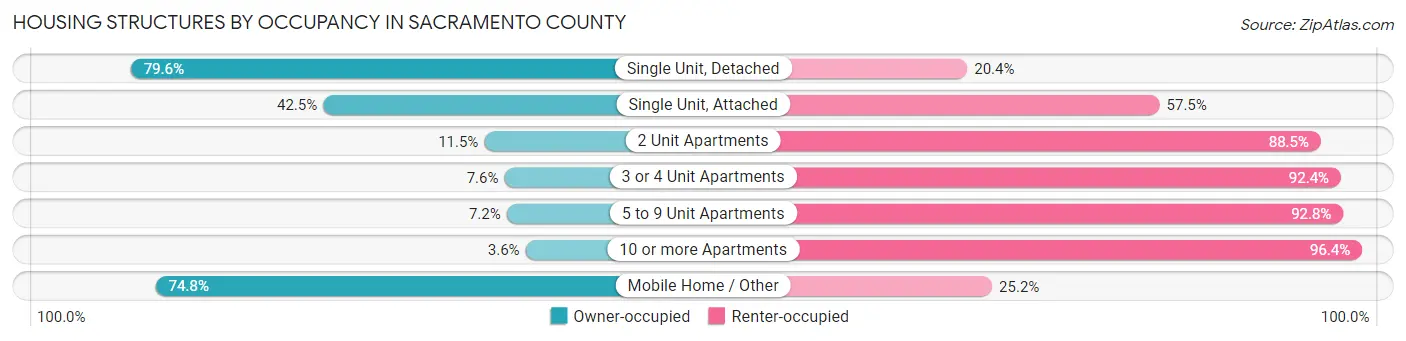
| Structure Type | Owner-occupied | Renter-occupied |
| Single Unit, Detached | 294,897 (79.6%) | 75,775 (20.4%) |
| Single Unit, Attached | 15,512 (42.5%) | 20,956 (57.5%) |
| 2 Unit Apartments | 1,192 (11.5%) | 9,161 (88.5%) |
| 3 or 4 Unit Apartments | 2,085 (7.6%) | 25,204 (92.4%) |
| 5 to 9 Unit Apartments | 2,394 (7.2%) | 30,846 (92.8%) |
| 10 or more Apartments | 2,590 (3.6%) | 69,880 (96.4%) |
| Mobile Home / Other | 9,994 (74.8%) | 3,370 (25.2%) |
| Total | 328,664 (58.3%) | 235,192 (41.7%) |
Housing Structures by Number of Rooms in Sacramento County
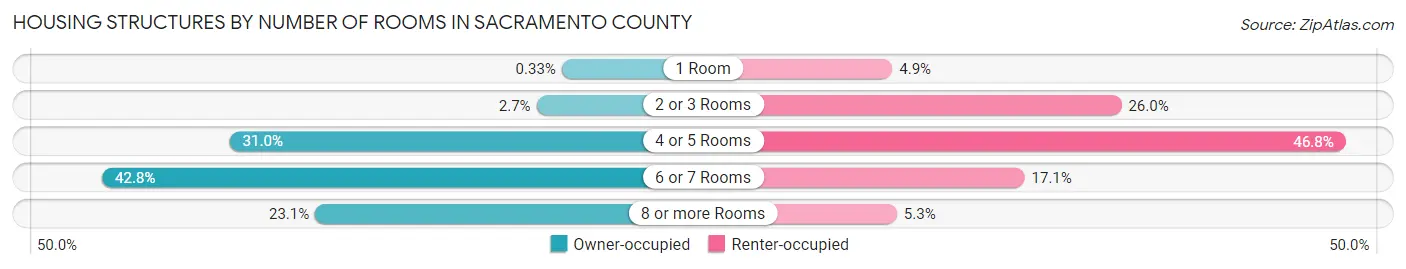
| Number of Rooms | Owner-occupied | Renter-occupied |
| 1 Room | 1,100 (0.3%) | 11,414 (4.9%) |
| 2 or 3 Rooms | 8,741 (2.7%) | 61,246 (26.0%) |
| 4 or 5 Rooms | 101,979 (31.0%) | 109,982 (46.8%) |
| 6 or 7 Rooms | 140,801 (42.8%) | 40,165 (17.1%) |
| 8 or more Rooms | 76,043 (23.1%) | 12,385 (5.3%) |
| Total | 328,664 (100.0%) | 235,192 (100.0%) |
Housing Structure by Heating Type in Sacramento County
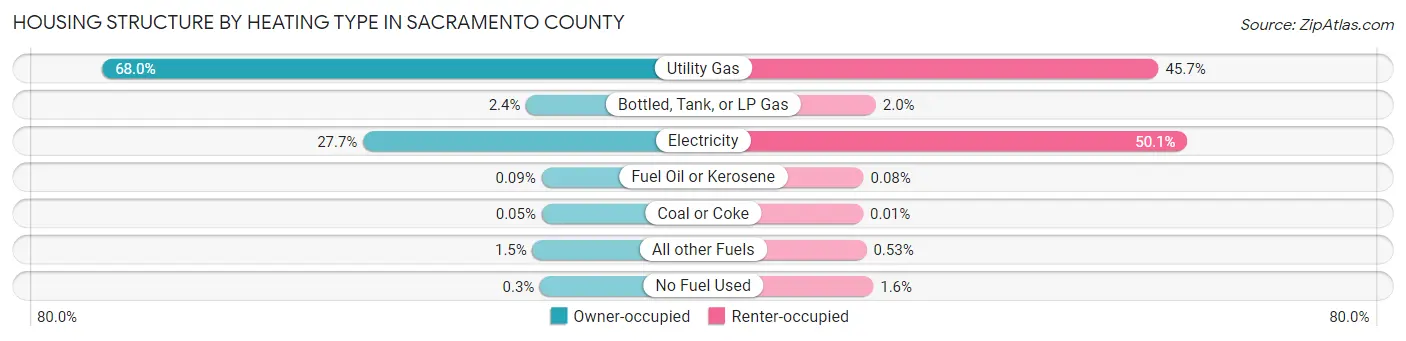
| Heating Type | Owner-occupied | Renter-occupied |
| Utility Gas | 223,467 (68.0%) | 107,441 (45.7%) |
| Bottled, Tank, or LP Gas | 8,013 (2.4%) | 4,658 (2.0%) |
| Electricity | 90,897 (27.7%) | 117,932 (50.1%) |
| Fuel Oil or Kerosene | 294 (0.1%) | 194 (0.1%) |
| Coal or Coke | 163 (0.1%) | 17 (0.0%) |
| All other Fuels | 4,846 (1.5%) | 1,241 (0.5%) |
| No Fuel Used | 984 (0.3%) | 3,709 (1.6%) |
| Total | 328,664 (100.0%) | 235,192 (100.0%) |
Household Vehicle Usage in Sacramento County
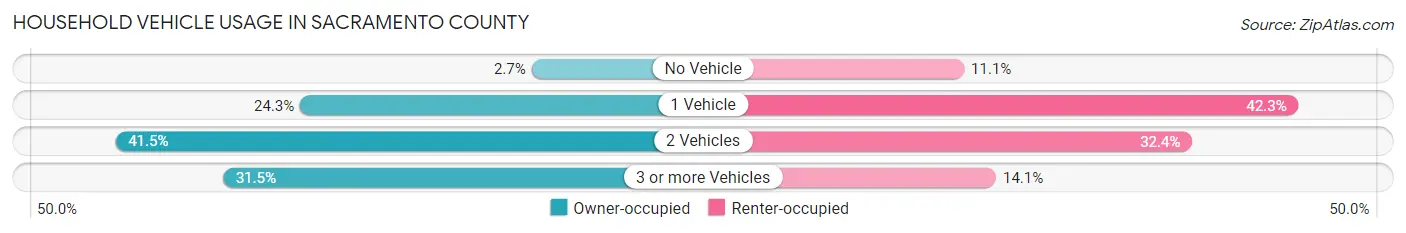
| Vehicles per Household | Owner-occupied | Renter-occupied |
| No Vehicle | 8,797 (2.7%) | 26,176 (11.1%) |
| 1 Vehicle | 79,819 (24.3%) | 99,592 (42.3%) |
| 2 Vehicles | 136,524 (41.5%) | 76,247 (32.4%) |
| 3 or more Vehicles | 103,524 (31.5%) | 33,177 (14.1%) |
| Total | 328,664 (100.0%) | 235,192 (100.0%) |
Real Estate & Mortgages in Sacramento County
Real Estate and Mortgage Overview in Sacramento County
| Characteristic | Without Mortgage | With Mortgage |
| Housing Units | 98,289 | 230,375 |
| Median Property Value | $437,500 | $475,800 |
| Median Household Income | $81,863 | $84,495 |
| Monthly Housing Costs | $659 | $53,211 |
| Real Estate Taxes | $2,718 | $4,947 |
Property Value by Mortgage Status in Sacramento County
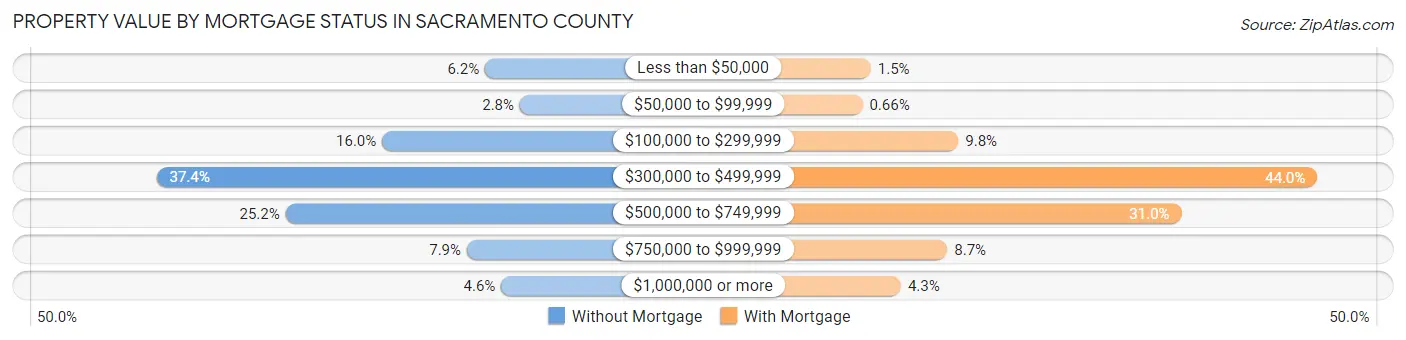
| Property Value | Without Mortgage | With Mortgage |
| Less than $50,000 | 6,044 (6.1%) | 3,371 (1.5%) |
| $50,000 to $99,999 | 2,783 (2.8%) | 1,530 (0.7%) |
| $100,000 to $299,999 | 15,677 (16.0%) | 22,565 (9.8%) |
| $300,000 to $499,999 | 36,790 (37.4%) | 101,318 (44.0%) |
| $500,000 to $749,999 | 24,717 (25.2%) | 71,486 (31.0%) |
| $750,000 to $999,999 | 7,749 (7.9%) | 20,128 (8.7%) |
| $1,000,000 or more | 4,529 (4.6%) | 9,977 (4.3%) |
| Total | 98,289 (100.0%) | 230,375 (100.0%) |
Household Income by Mortgage Status in Sacramento County
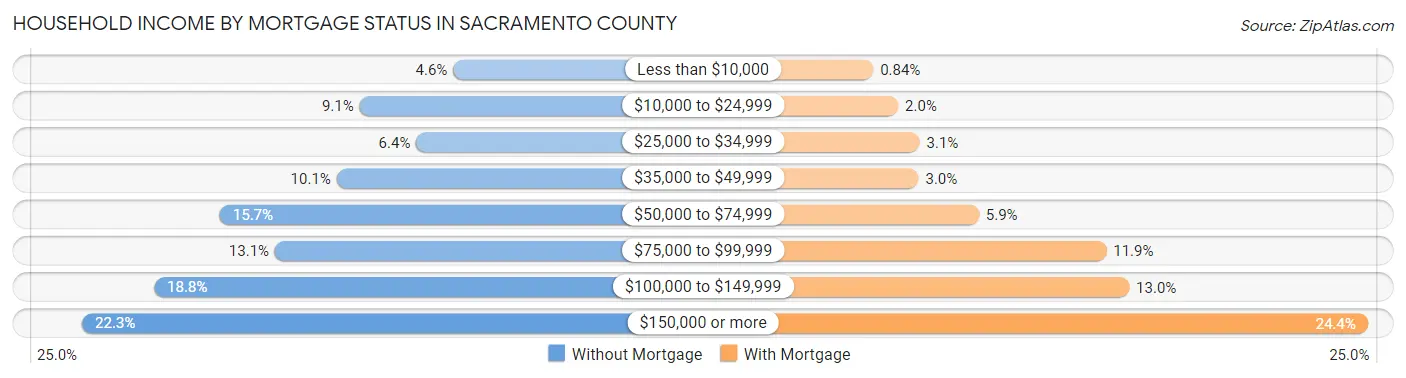
| Household Income | Without Mortgage | With Mortgage |
| Less than $10,000 | 4,513 (4.6%) | 1,931 (0.8%) |
| $10,000 to $24,999 | 8,894 (9.0%) | 4,684 (2.0%) |
| $25,000 to $34,999 | 6,238 (6.4%) | 7,019 (3.0%) |
| $35,000 to $49,999 | 9,962 (10.1%) | 6,921 (3.0%) |
| $50,000 to $74,999 | 15,434 (15.7%) | 13,528 (5.9%) |
| $75,000 to $99,999 | 12,861 (13.1%) | 27,516 (11.9%) |
| $100,000 to $149,999 | 18,512 (18.8%) | 30,015 (13.0%) |
| $150,000 or more | 21,875 (22.3%) | 56,197 (24.4%) |
| Total | 98,289 (100.0%) | 230,375 (100.0%) |
Property Value to Household Income Ratio in Sacramento County
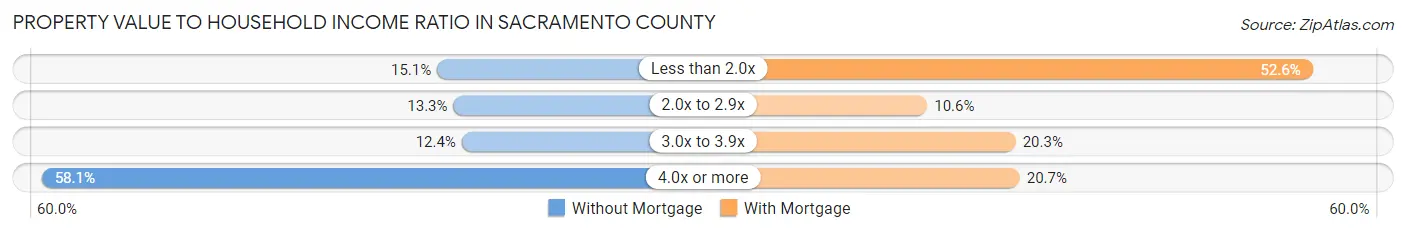
| Value-to-Income Ratio | Without Mortgage | With Mortgage |
| Less than 2.0x | 14,799 (15.1%) | 121,186 (52.6%) |
| 2.0x to 2.9x | 13,056 (13.3%) | 24,444 (10.6%) |
| 3.0x to 3.9x | 12,163 (12.4%) | 46,648 (20.3%) |
| 4.0x or more | 57,134 (58.1%) | 47,673 (20.7%) |
| Total | 98,289 (100.0%) | 230,375 (100.0%) |
Real Estate Taxes by Mortgage Status in Sacramento County
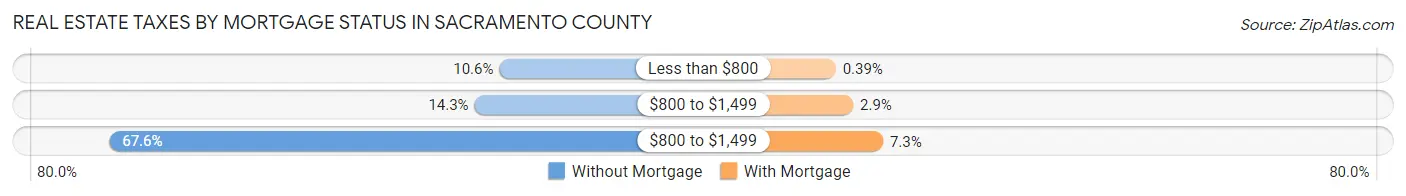
| Property Taxes | Without Mortgage | With Mortgage |
| Less than $800 | 10,461 (10.6%) | 895 (0.4%) |
| $800 to $1,499 | 14,021 (14.3%) | 6,749 (2.9%) |
| $800 to $1,499 | 66,467 (67.6%) | 16,797 (7.3%) |
| Total | 98,289 (100.0%) | 230,375 (100.0%) |
Health & Disability in Sacramento County
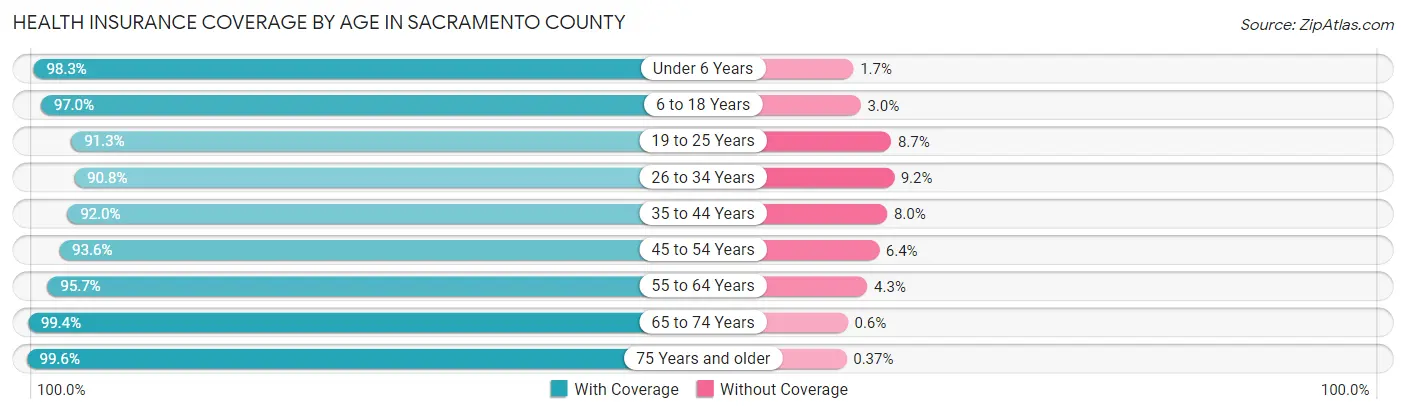
Health Insurance Coverage by Age in Sacramento County
| Age Bracket | With Coverage | Without Coverage |
| Under 6 Years | 113,318 (98.3%) | 1,910 (1.7%) |
| 6 to 18 Years | 262,221 (97.0%) | 8,158 (3.0%) |
| 19 to 25 Years | 125,885 (91.3%) | 11,993 (8.7%) |
| 26 to 34 Years | 197,593 (90.8%) | 20,063 (9.2%) |
| 35 to 44 Years | 198,853 (92.0%) | 17,194 (8.0%) |
| 45 to 54 Years | 180,047 (93.6%) | 12,394 (6.4%) |
| 55 to 64 Years | 181,078 (95.7%) | 8,066 (4.3%) |
| 65 to 74 Years | 135,423 (99.4%) | 824 (0.6%) |
| 75 Years and older | 90,252 (99.6%) | 331 (0.4%) |
| Total | 1,484,670 (94.8%) | 80,933 (5.2%) |
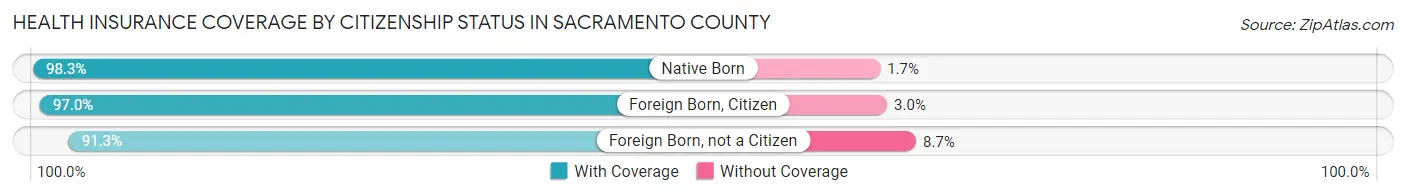
Health Insurance Coverage by Citizenship Status in Sacramento County
| Citizenship Status | With Coverage | Without Coverage |
| Native Born | 113,318 (98.3%) | 1,910 (1.7%) |
| Foreign Born, Citizen | 262,221 (97.0%) | 8,158 (3.0%) |
| Foreign Born, not a Citizen | 125,885 (91.3%) | 11,993 (8.7%) |
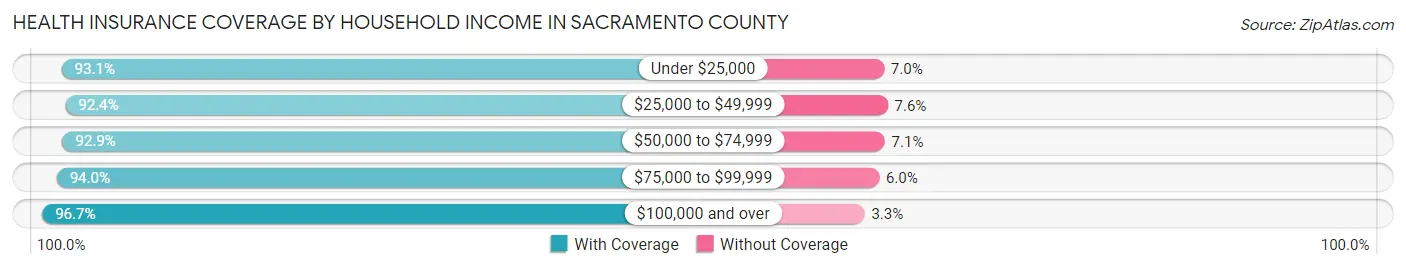
Health Insurance Coverage by Household Income in Sacramento County
| Household Income | With Coverage | Without Coverage |
| Under $25,000 | 142,186 (93.0%) | 10,619 (7.0%) |
| $25,000 to $49,999 | 192,924 (92.4%) | 15,959 (7.6%) |
| $50,000 to $74,999 | 209,016 (92.9%) | 15,957 (7.1%) |
| $75,000 to $99,999 | 199,380 (94.0%) | 12,786 (6.0%) |
| $100,000 and over | 727,969 (96.7%) | 24,933 (3.3%) |
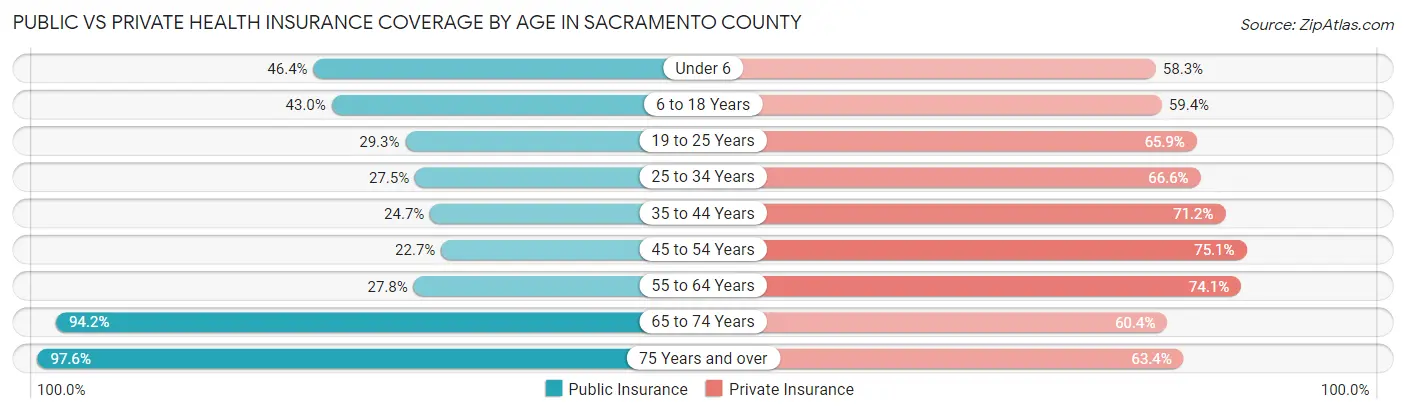
Public vs Private Health Insurance Coverage by Age in Sacramento County
| Age Bracket | Public Insurance | Private Insurance |
| Under 6 | 53,458 (46.4%) | 67,180 (58.3%) |
| 6 to 18 Years | 116,308 (43.0%) | 160,672 (59.4%) |
| 19 to 25 Years | 40,450 (29.3%) | 90,822 (65.9%) |
| 25 to 34 Years | 59,912 (27.5%) | 144,868 (66.6%) |
| 35 to 44 Years | 53,417 (24.7%) | 153,780 (71.2%) |
| 45 to 54 Years | 43,653 (22.7%) | 144,510 (75.1%) |
| 55 to 64 Years | 52,602 (27.8%) | 140,183 (74.1%) |
| 65 to 74 Years | 128,307 (94.2%) | 82,293 (60.4%) |
| 75 Years and over | 88,396 (97.6%) | 57,465 (63.4%) |
| Total | 636,503 (40.7%) | 1,041,773 (66.5%) |
Disability Status by Sex by Age in Sacramento County
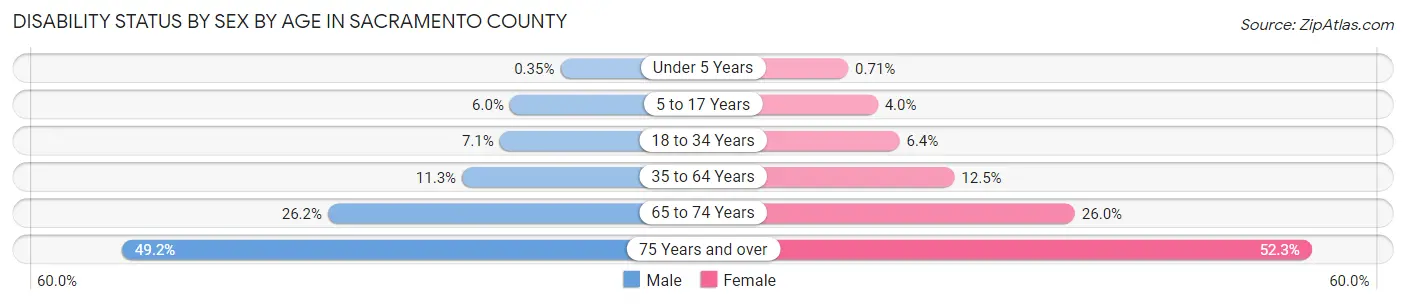
| Age Bracket | Male | Female |
| Under 5 Years | 173 (0.4%) | 334 (0.7%) |
| 5 to 17 Years | 8,218 (6.0%) | 5,260 (4.0%) |
| 18 to 34 Years | 13,428 (7.1%) | 12,034 (6.4%) |
| 35 to 64 Years | 33,274 (11.3%) | 38,033 (12.5%) |
| 65 to 74 Years | 16,363 (26.2%) | 19,171 (26.0%) |
| 75 Years and over | 18,164 (49.2%) | 28,066 (52.3%) |
Disability Class by Sex by Age in Sacramento County
Disability Class: Hearing Difficulty
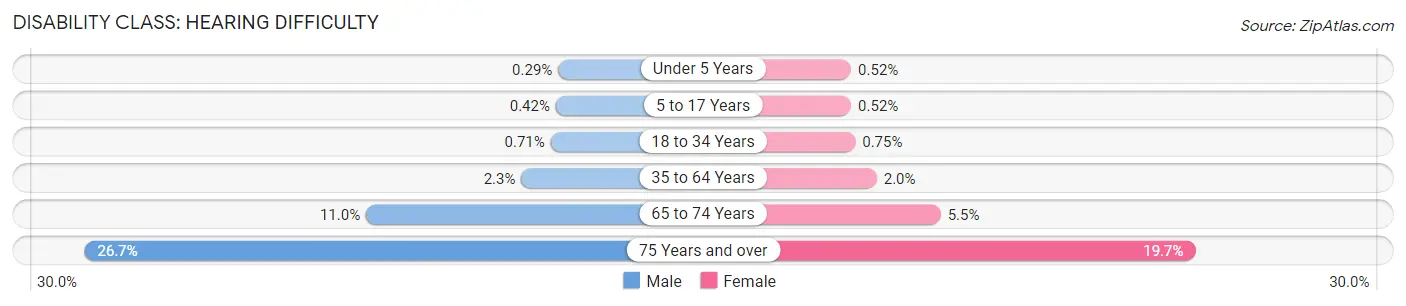
| Age Bracket | Male | Female |
| Under 5 Years | 141 (0.3%) | 242 (0.5%) |
| 5 to 17 Years | 576 (0.4%) | 678 (0.5%) |
| 18 to 34 Years | 1,347 (0.7%) | 1,397 (0.7%) |
| 35 to 64 Years | 6,879 (2.3%) | 5,907 (1.9%) |
| 65 to 74 Years | 6,855 (11.0%) | 4,073 (5.5%) |
| 75 Years and over | 9,855 (26.7%) | 10,557 (19.7%) |
Disability Class: Vision Difficulty
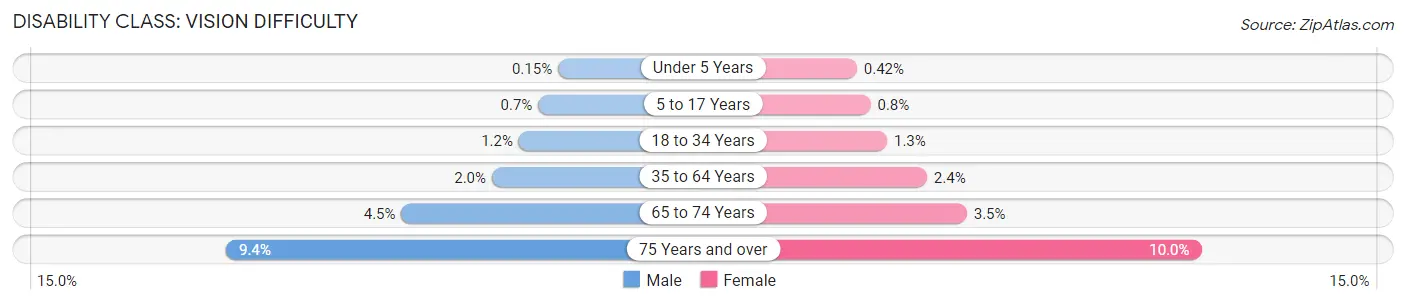
| Age Bracket | Male | Female |
| Under 5 Years | 74 (0.2%) | 198 (0.4%) |
| 5 to 17 Years | 970 (0.7%) | 1,056 (0.8%) |
| 18 to 34 Years | 2,341 (1.2%) | 2,363 (1.3%) |
| 35 to 64 Years | 5,871 (2.0%) | 7,189 (2.4%) |
| 65 to 74 Years | 2,815 (4.5%) | 2,572 (3.5%) |
| 75 Years and over | 3,470 (9.4%) | 5,369 (10.0%) |
Disability Class: Cognitive Difficulty
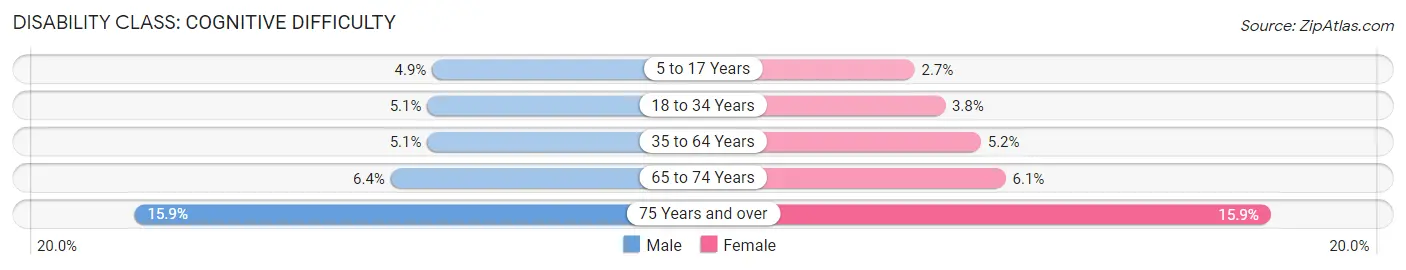
| Age Bracket | Male | Female |
| 5 to 17 Years | 6,699 (4.9%) | 3,547 (2.7%) |
| 18 to 34 Years | 9,542 (5.1%) | 7,173 (3.8%) |
| 35 to 64 Years | 14,860 (5.1%) | 15,649 (5.2%) |
| 65 to 74 Years | 3,999 (6.4%) | 4,490 (6.1%) |
| 75 Years and over | 5,883 (15.9%) | 8,540 (15.9%) |
Disability Class: Ambulatory Difficulty
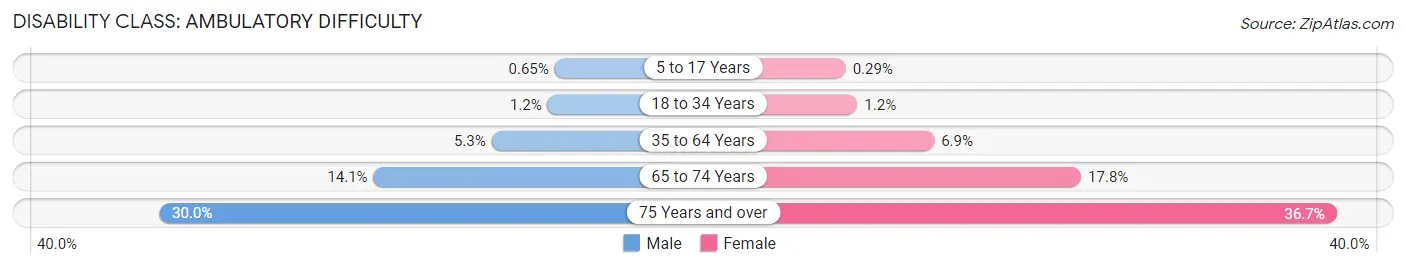
| Age Bracket | Male | Female |
| 5 to 17 Years | 892 (0.6%) | 375 (0.3%) |
| 18 to 34 Years | 2,213 (1.2%) | 2,180 (1.2%) |
| 35 to 64 Years | 15,698 (5.3%) | 20,796 (6.9%) |
| 65 to 74 Years | 8,798 (14.1%) | 13,123 (17.8%) |
| 75 Years and over | 11,088 (30.0%) | 19,696 (36.7%) |
Disability Class: Self-Care Difficulty
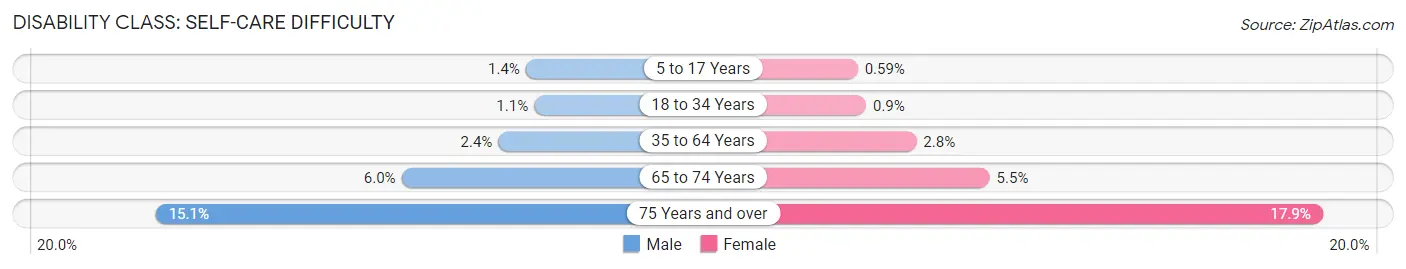
| Age Bracket | Male | Female |
| 5 to 17 Years | 1,922 (1.4%) | 778 (0.6%) |
| 18 to 34 Years | 2,052 (1.1%) | 1,676 (0.9%) |
| 35 to 64 Years | 7,133 (2.4%) | 8,404 (2.8%) |
| 65 to 74 Years | 3,748 (6.0%) | 4,053 (5.5%) |
| 75 Years and over | 5,592 (15.1%) | 9,574 (17.8%) |
Technology Access in Sacramento County
Computing Device Access in Sacramento County
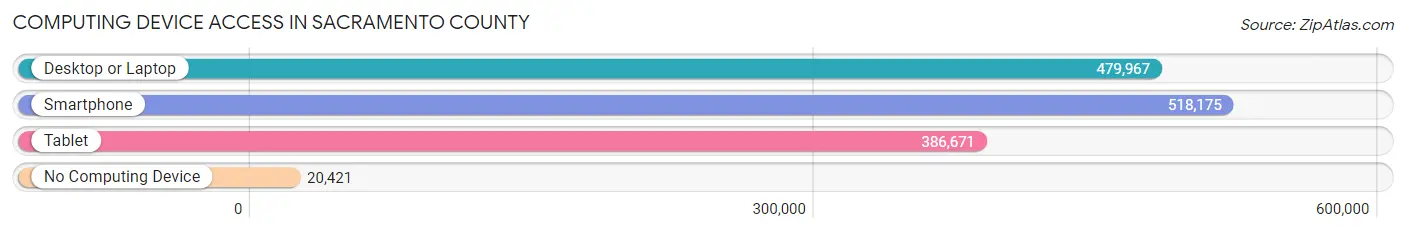
| Device Type | # Households | % Households |
| Desktop or Laptop | 479,967 | 85.1% |
| Smartphone | 518,175 | 91.9% |
| Tablet | 386,671 | 68.6% |
| No Computing Device | 20,421 | 3.6% |
| Total | 563,856 | 100.0% |
Internet Access in Sacramento County
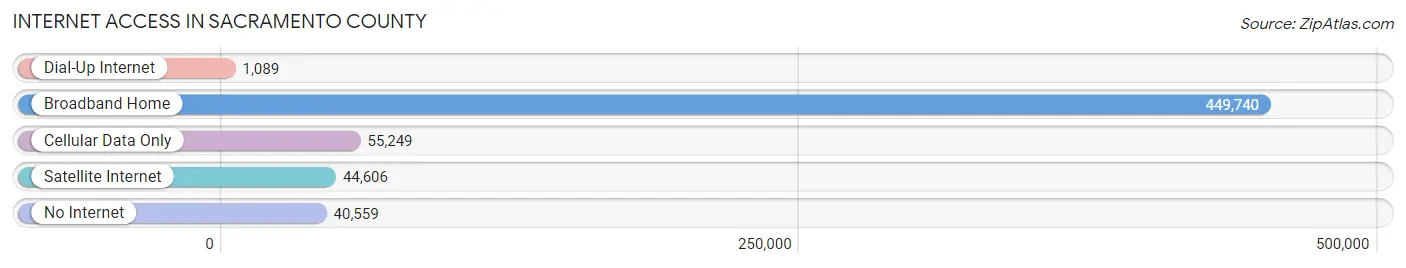
| Internet Type | # Households | % Households |
| Dial-Up Internet | 1,089 | 0.2% |
| Broadband Home | 449,740 | 79.8% |
| Cellular Data Only | 55,249 | 9.8% |
| Satellite Internet | 44,606 | 7.9% |
| No Internet | 40,559 | 7.2% |
| Total | 563,856 | 100.0% |
Sacramento County Summary
Sacramento County is located in the Central Valley of California, and is the state’s capital. It is the fifth most populous county in California, with a population of 1,418,788 in 2019. The county seat is the city of Sacramento, which is also the state capital. Sacramento County is bordered by Placer County to the north, El Dorado County to the east, San Joaquin County to the south, and Yolo County to the west.
History
Sacramento County was established in 1850, when California was admitted to the Union. The county was named after the Sacramento River, which was named by Spanish explorer Gabriel Moraga in 1808. The county was originally part of Yolo County, but was split off in 1854.
The county has a long and rich history. It was the site of the first gold discovery in California, and the first state capital. It was also the site of the Pony Express, and the first transcontinental railroad.
Geography
Sacramento County covers an area of 906 square miles, making it the 19th largest county in California. It is located in the Central Valley of California, and is bordered by Placer County to the north, El Dorado County to the east, San Joaquin County to the south, and Yolo County to the west.
The county is divided into five regions: the Sacramento Valley, the Sierra Nevada foothills, the Sacramento-San Joaquin Delta, the Central Valley, and the Coast Range. The Sacramento Valley is the most populous region, and is home to the cities of Sacramento, Folsom, and Rancho Cordova. The Sierra Nevada foothills are located in the eastern part of the county, and are home to the cities of Auburn and Placerville. The Sacramento-San Joaquin Delta is located in the northern part of the county, and is home to the cities of Stockton and Lodi. The Central Valley is located in the southern part of the county, and is home to the cities of Modesto and Turlock. The Coast Range is located in the western part of the county, and is home to the cities of Davis and Woodland.
Economy
Sacramento County has a diverse economy, with a variety of industries. The county is home to a number of major employers, including Intel, Sutter Health, Kaiser Permanente, and the State of California. The county is also home to a number of agricultural businesses, including fruit and nut farms, vineyards, and dairies.
The county’s economy is also supported by tourism. The county is home to a number of attractions, including Old Sacramento, the California State Railroad Museum, and the Sacramento Zoo.
Demographics
As of 2019, the population of Sacramento County was 1,418,788. The population is racially and ethnically diverse, with the largest racial/ethnic groups being White (48.3%), Hispanic or Latino (27.2%), Asian (13.2%), and African American (7.2%). The median household income is $63,845, and the median home value is $372,400. The county’s poverty rate is 13.2%.
Sacramento County is a vibrant and diverse county with a rich history and a strong economy. It is home to a variety of industries, attractions, and people, making it a great place to live and work.
Common Questions
What is Per Capita Income in Sacramento County?
Per Capita income in Sacramento County is $39,763.
What is the Median Family Income in Sacramento County?
Median Family Income in Sacramento County is $97,966.
What is the Median Household income in Sacramento County?
Median Household Income in Sacramento County is $84,010.
What is Income or Wage Gap in Sacramento County?
Income or Wage Gap in Sacramento County is 16.6%.
Women in Sacramento County earn 83.4 cents for every dollar earned by a man.
What is Family Income Deficit in Sacramento County?
Family Income Deficit in Sacramento County is $11,855.
Families that are below poverty line in Sacramento County earn $11,855 less on average than the poverty threshold level.
What is Inequality or Gini Index in Sacramento County?
Inequality or Gini Index in Sacramento County is 0.44.
What is the Total Population of Sacramento County?
Total Population of Sacramento County is 1,579,211.
What is the Total Male Population of Sacramento County?
Total Male Population of Sacramento County is 779,030.
What is the Total Female Population of Sacramento County?
Total Female Population of Sacramento County is 800,181.
What is the Ratio of Males per 100 Females in Sacramento County?
There are 97.36 Males per 100 Females in Sacramento County.
What is the Ratio of Females per 100 Males in Sacramento County?
There are 102.72 Females per 100 Males in Sacramento County.
What is the Median Population Age in Sacramento County?
Median Population Age in Sacramento County is 36.8 Years.
What is the Average Family Size in Sacramento County
Average Family Size in Sacramento County is 3.4 People.
What is the Average Household Size in Sacramento County
Average Household Size in Sacramento County is 2.8 People.
How Large is the Labor Force in Sacramento County?
There are 796,969 People in the Labor Forcein in Sacramento County.
What is the Percentage of People in the Labor Force in Sacramento County?
63.5% of People are in the Labor Force in Sacramento County.
What is the Unemployment Rate in Sacramento County?
Unemployment Rate in Sacramento County is 6.3%.