Riverside County, CA Map & Demographics
Riverside County Map
Riverside County Overview
$35,356
PER CAPITA INCOME
$95,246
AVG FAMILY INCOME
$84,505
AVG HOUSEHOLD INCOME
29.4%
WAGE / INCOME GAP [ % ]
70.6¢/ $1
WAGE / INCOME GAP [ $ ]
$11,114
FAMILY INCOME DEFICIT
0.45
INEQUALITY / GINI INDEX
2,429,487
TOTAL POPULATION
1,220,393
MALE POPULATION
1,209,094
FEMALE POPULATION
100.93
MALES / 100 FEMALES
99.07
FEMALES / 100 MALES
36.3
MEDIAN AGE
3.7
AVG FAMILY SIZE
3.2
AVG HOUSEHOLD SIZE
1,155,940
LABOR FORCE [ PEOPLE ]
60.7%
PERCENT IN LABOR FORCE
6.7%
UNEMPLOYMENT RATE
Income in Riverside County
Income Overview in Riverside County
Per Capita Income in Riverside County is $35,356, while median incomes of families and households are $95,246 and $84,505 respectively.
| Characteristic | Number | Measure |
| Per Capita Income | 2,429,487 | $35,356 |
| Median Family Income | 558,130 | $95,246 |
| Mean Family Income | 558,130 | $120,564 |
| Median Household Income | 749,976 | $84,505 |
| Mean Household Income | 749,976 | $110,021 |
| Income Deficit | 558,130 | $11,114 |
| Wage / Income Gap (%) | 2,429,487 | 29.41% |
| Wage / Income Gap ($) | 2,429,487 | 70.59¢ per $1 |
| Gini / Inequality Index | 2,429,487 | 0.45 |
Earnings by Sex in Riverside County
Average Earnings in Riverside County are $40,149, $46,811 for men and $33,044 for women, a difference of 29.4%.
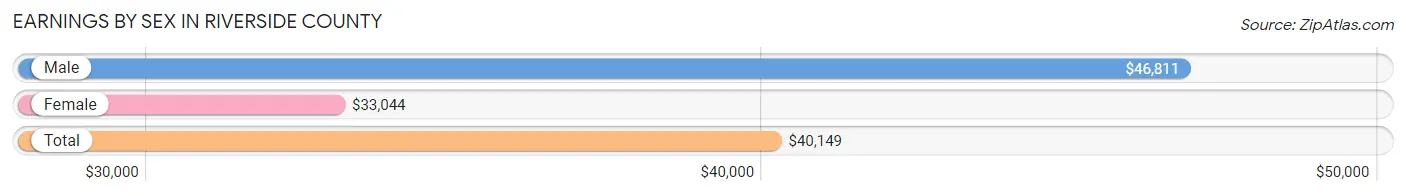
| Sex | Number | Average Earnings |
| Male | 648,355 (55.2%) | $46,811 |
| Female | 526,006 (44.8%) | $33,044 |
| Total | 1,174,361 (100.0%) | $40,149 |
Earnings by Sex by Income Bracket in Riverside County
The most common earnings brackets in Riverside County are $100,000+ for men (118,999 | 18.3%) and $100,000+ for women (55,528 | 10.6%).
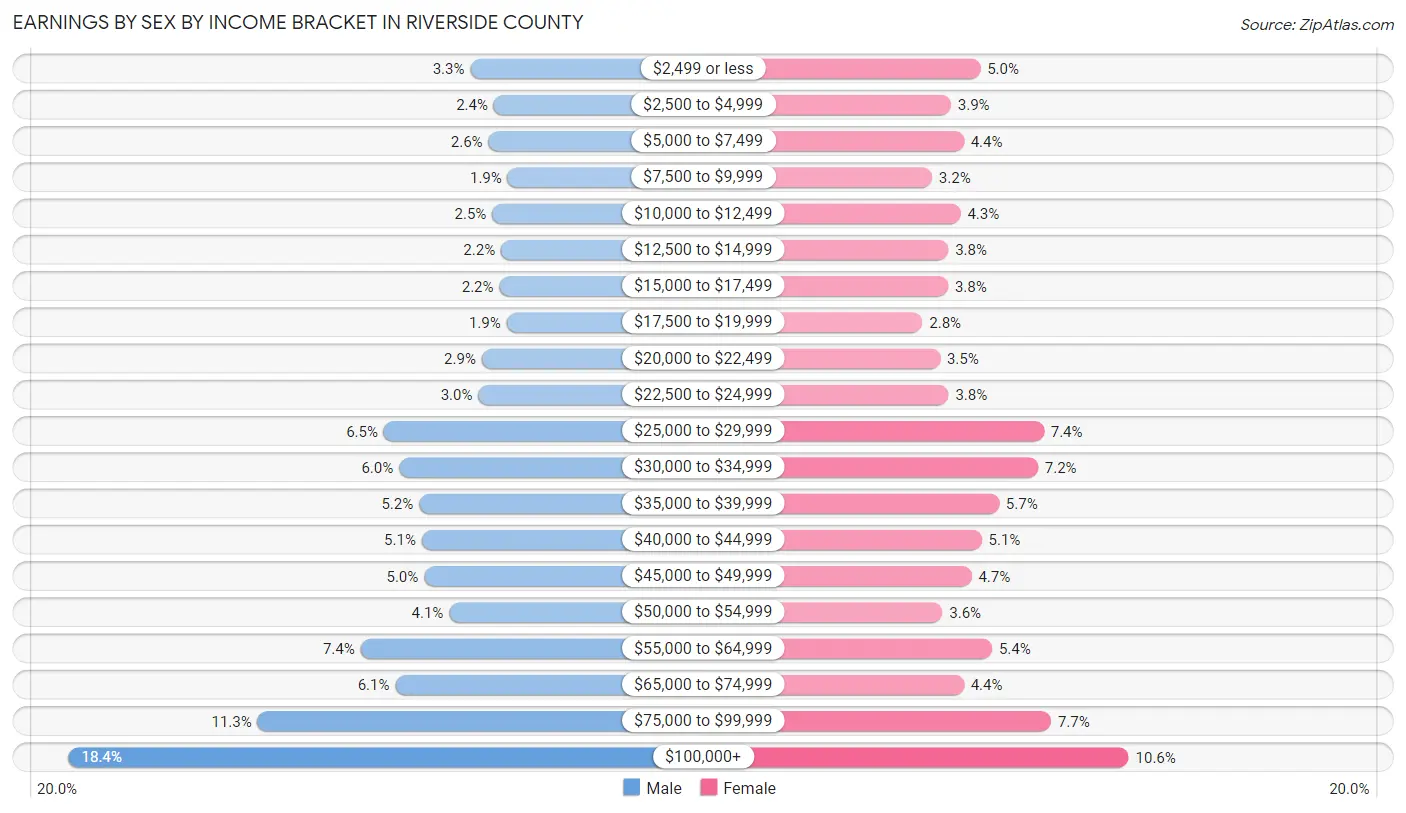
| Income | Male | Female |
| $2,499 or less | 21,425 (3.3%) | 26,288 (5.0%) |
| $2,500 to $4,999 | 15,710 (2.4%) | 20,489 (3.9%) |
| $5,000 to $7,499 | 16,975 (2.6%) | 23,014 (4.4%) |
| $7,500 to $9,999 | 12,305 (1.9%) | 16,754 (3.2%) |
| $10,000 to $12,499 | 16,063 (2.5%) | 22,402 (4.3%) |
| $12,500 to $14,999 | 13,929 (2.1%) | 20,009 (3.8%) |
| $15,000 to $17,499 | 14,328 (2.2%) | 19,932 (3.8%) |
| $17,500 to $19,999 | 12,583 (1.9%) | 14,868 (2.8%) |
| $20,000 to $22,499 | 18,629 (2.9%) | 18,364 (3.5%) |
| $22,500 to $24,999 | 19,455 (3.0%) | 20,026 (3.8%) |
| $25,000 to $29,999 | 42,400 (6.5%) | 38,826 (7.4%) |
| $30,000 to $34,999 | 38,700 (6.0%) | 37,681 (7.2%) |
| $35,000 to $39,999 | 33,871 (5.2%) | 29,979 (5.7%) |
| $40,000 to $44,999 | 33,215 (5.1%) | 26,547 (5.1%) |
| $45,000 to $49,999 | 32,585 (5.0%) | 24,569 (4.7%) |
| $50,000 to $54,999 | 26,490 (4.1%) | 18,805 (3.6%) |
| $55,000 to $64,999 | 48,013 (7.4%) | 28,624 (5.4%) |
| $65,000 to $74,999 | 39,608 (6.1%) | 23,045 (4.4%) |
| $75,000 to $99,999 | 73,072 (11.3%) | 40,256 (7.6%) |
| $100,000+ | 118,999 (18.3%) | 55,528 (10.6%) |
| Total | 648,355 (100.0%) | 526,006 (100.0%) |
Earnings by Sex by Educational Attainment in Riverside County
Average earnings in Riverside County are $53,998 for men and $38,015 for women, a difference of 29.6%. Men with an educational attainment of graduate degree enjoy the highest average annual earnings of $107,032, while those with less than high school education earn the least with $37,132. Women with an educational attainment of graduate degree earn the most with the average annual earnings of $85,682, while those with less than high school education have the smallest earnings of $23,511.
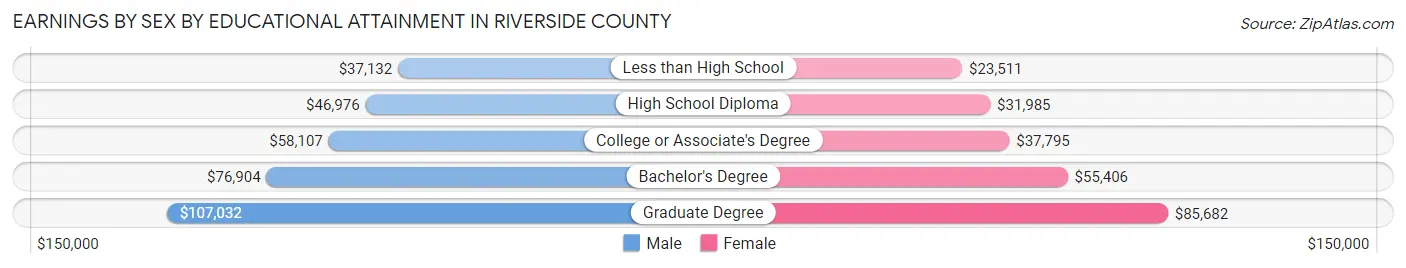
| Educational Attainment | Male Income | Female Income |
| Less than High School | $37,132 | $23,511 |
| High School Diploma | $46,976 | $31,985 |
| College or Associate's Degree | $58,107 | $37,795 |
| Bachelor's Degree | $76,904 | $55,406 |
| Graduate Degree | $107,032 | $85,682 |
| Total | $53,998 | $38,015 |
Family Income in Riverside County
Family Income Brackets in Riverside County
According to the Riverside County family income data, there are 119,440 families falling into the $100,000 to $149,999 income range, which is the most common income bracket and makes up 21.4% of all families. Conversely, the $10,000 to $14,999 income bracket is the least frequent group with only 7,256 families (1.3%) belonging to this category.
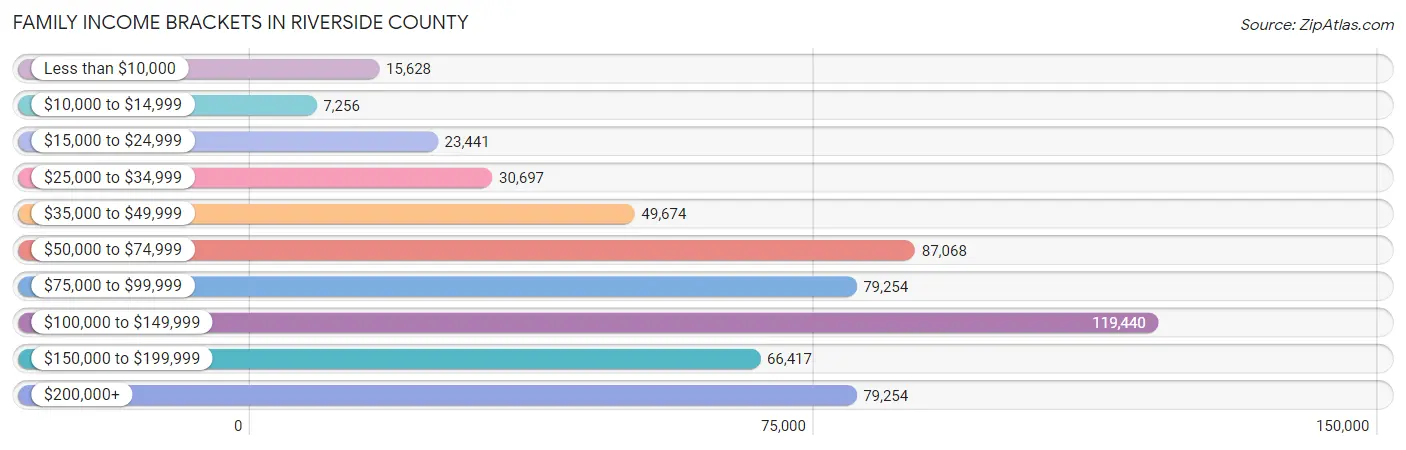
| Income Bracket | # Families | % Families |
| Less than $10,000 | 15,628 | 2.8% |
| $10,000 to $14,999 | 7,256 | 1.3% |
| $15,000 to $24,999 | 23,441 | 4.2% |
| $25,000 to $34,999 | 30,697 | 5.5% |
| $35,000 to $49,999 | 49,674 | 8.9% |
| $50,000 to $74,999 | 87,068 | 15.6% |
| $75,000 to $99,999 | 79,254 | 14.2% |
| $100,000 to $149,999 | 119,440 | 21.4% |
| $150,000 to $199,999 | 66,417 | 11.9% |
| $200,000+ | 79,254 | 14.2% |
Family Income by Famaliy Size in Riverside County
7+ person families (25,274 | 4.5%) account for the highest median family income in Riverside County with $124,692 per family, while 2-person families (202,777 | 36.3%) have the highest median income of $40,488 per family member.
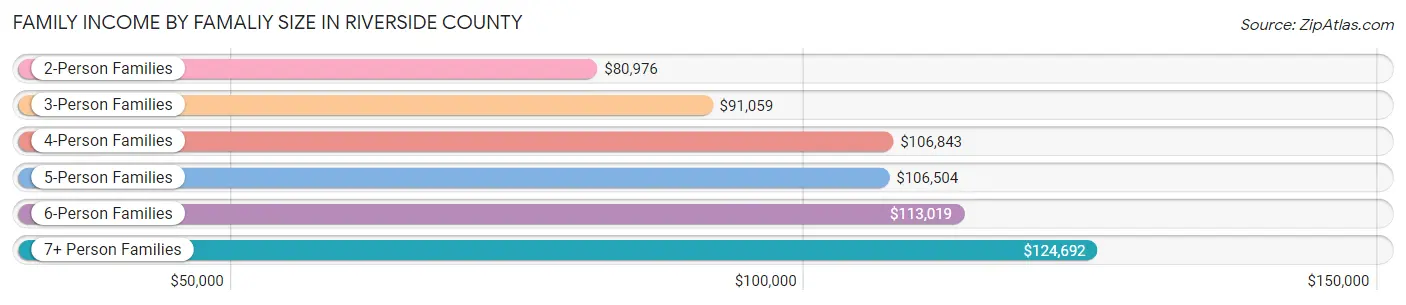
| Income Bracket | # Families | Median Income |
| 2-Person Families | 202,777 (36.3%) | $80,976 |
| 3-Person Families | 113,289 (20.3%) | $91,059 |
| 4-Person Families | 115,739 (20.7%) | $106,843 |
| 5-Person Families | 69,930 (12.5%) | $106,504 |
| 6-Person Families | 31,121 (5.6%) | $113,019 |
| 7+ Person Families | 25,274 (4.5%) | $124,692 |
| Total | 558,130 (100.0%) | $95,246 |
Family Income by Number of Earners in Riverside County
The median family income in Riverside County is $95,246, with families comprising 3+ earners (94,237) having the highest median family income of $144,983, while families with no earners (79,931) have the lowest median family income of $51,734, accounting for 16.9% and 14.3% of families, respectively.
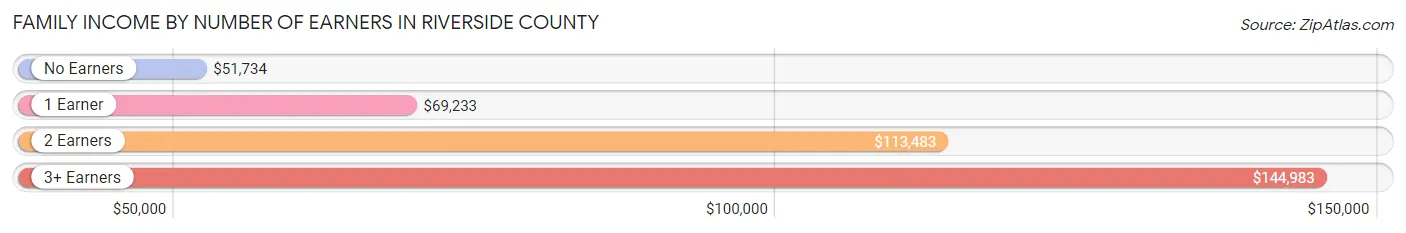
| Number of Earners | # Families | Median Income |
| No Earners | 79,931 (14.3%) | $51,734 |
| 1 Earner | 177,790 (31.9%) | $69,233 |
| 2 Earners | 206,172 (36.9%) | $113,483 |
| 3+ Earners | 94,237 (16.9%) | $144,983 |
| Total | 558,130 (100.0%) | $95,246 |
Household Income in Riverside County
Household Income Brackets in Riverside County
With 145,495 households falling in the category, the $100,000 to $149,999 income range is the most frequent in Riverside County, accounting for 19.4% of all households. In contrast, only 20,999 households (2.8%) fall into the $10,000 to $14,999 income bracket, making it the least populous group.
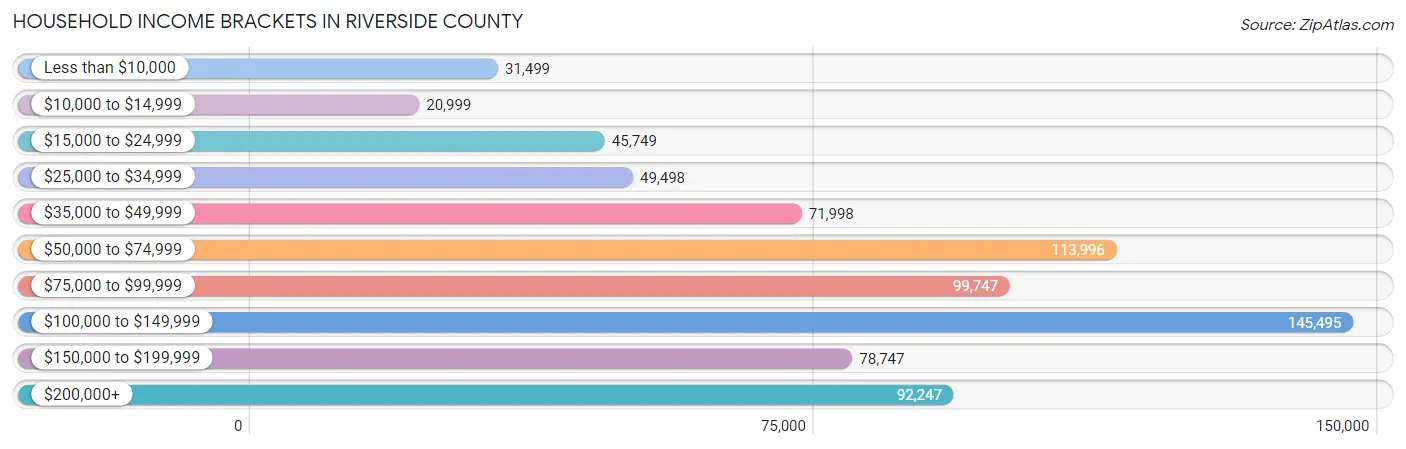
| Income Bracket | # Households | % Households |
| Less than $10,000 | 31,499 | 4.2% |
| $10,000 to $14,999 | 20,999 | 2.8% |
| $15,000 to $24,999 | 45,749 | 6.1% |
| $25,000 to $34,999 | 49,498 | 6.6% |
| $35,000 to $49,999 | 71,998 | 9.6% |
| $50,000 to $74,999 | 113,996 | 15.2% |
| $75,000 to $99,999 | 99,747 | 13.3% |
| $100,000 to $149,999 | 145,495 | 19.4% |
| $150,000 to $199,999 | 78,747 | 10.5% |
| $200,000+ | 92,247 | 12.3% |
Household Income by Householder Age in Riverside County
The median household income in Riverside County is $84,505, with the highest median household income of $101,725 found in the 45 to 64 years age bracket for the primary householder. A total of 291,144 households (38.8%) fall into this category. Meanwhile, the 15 to 24 years age bracket for the primary householder has the lowest median household income of $50,727, with 14,383 households (1.9%) in this group.
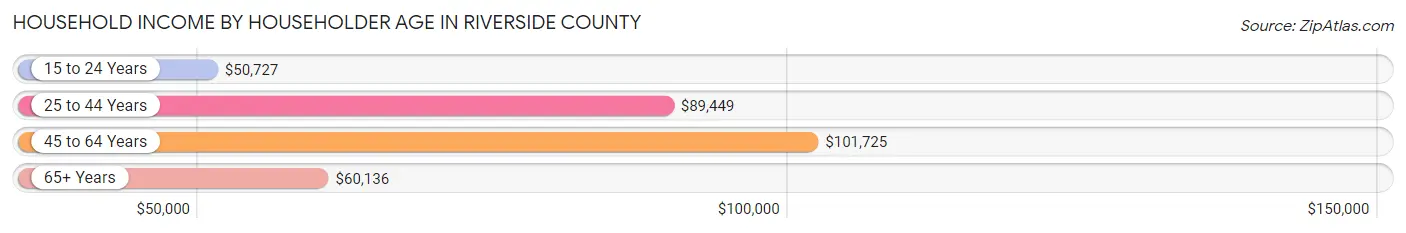
| Income Bracket | # Households | Median Income |
| 15 to 24 Years | 14,383 (1.9%) | $50,727 |
| 25 to 44 Years | 244,399 (32.6%) | $89,449 |
| 45 to 64 Years | 291,144 (38.8%) | $101,725 |
| 65+ Years | 200,050 (26.7%) | $60,136 |
| Total | 749,976 (100.0%) | $84,505 |
Poverty in Riverside County
Income Below Poverty by Sex and Age in Riverside County
With 10.3% poverty level for males and 12.5% for females among the residents of Riverside County, 15 year old males and 5 year old females are the most vulnerable to poverty, with 2,884 males (15.8%) and 2,462 females (16.9%) in their respective age groups living below the poverty level.
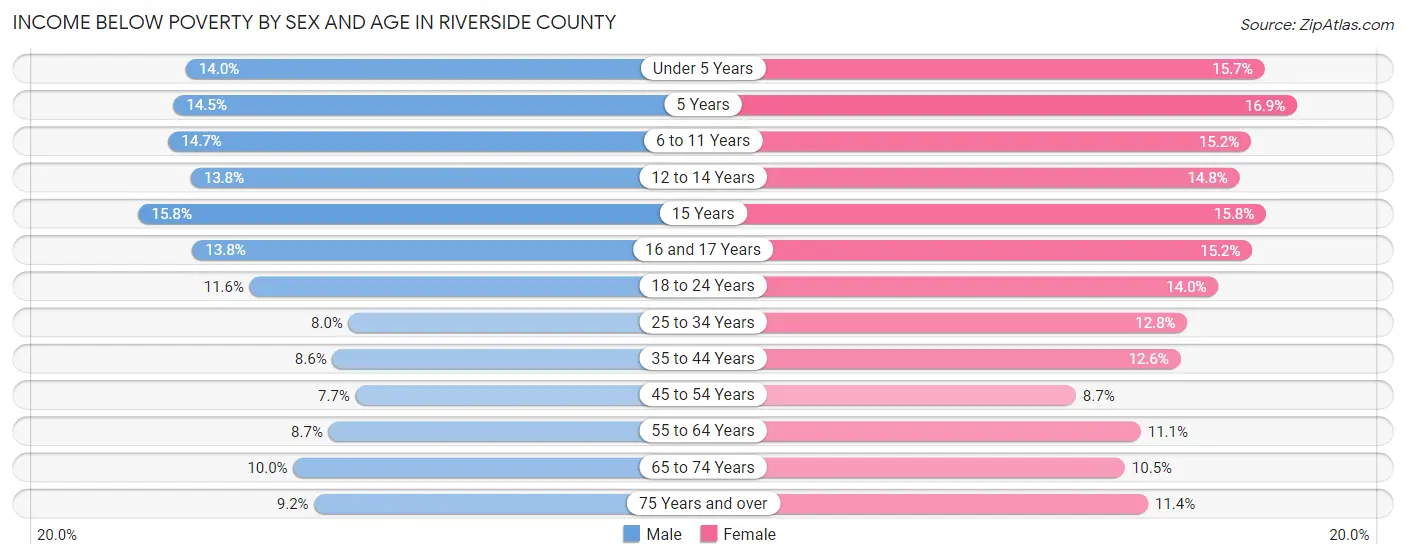
| Age Bracket | Male | Female |
| Under 5 Years | 10,301 (14.0%) | 10,991 (15.7%) |
| 5 Years | 2,293 (14.5%) | 2,462 (16.9%) |
| 6 to 11 Years | 14,770 (14.7%) | 14,645 (15.2%) |
| 12 to 14 Years | 7,709 (13.8%) | 7,963 (14.8%) |
| 15 Years | 2,884 (15.8%) | 2,765 (15.8%) |
| 16 and 17 Years | 5,037 (13.8%) | 5,399 (15.2%) |
| 18 to 24 Years | 13,503 (11.6%) | 15,321 (14.0%) |
| 25 to 34 Years | 13,462 (8.0%) | 20,825 (12.8%) |
| 35 to 44 Years | 13,730 (8.6%) | 19,798 (12.6%) |
| 45 to 54 Years | 11,487 (7.7%) | 12,733 (8.7%) |
| 55 to 64 Years | 12,170 (8.7%) | 15,451 (11.1%) |
| 65 to 74 Years | 9,747 (10.0%) | 11,256 (10.5%) |
| 75 Years and over | 6,105 (9.2%) | 9,625 (11.4%) |
| Total | 123,198 (10.3%) | 149,234 (12.5%) |
Income Above Poverty by Sex and Age in Riverside County
According to the poverty statistics in Riverside County, males aged 45 to 54 years and females aged 45 to 54 years are the age groups that are most secure financially, with 92.3% of males and 91.3% of females in these age groups living above the poverty line.
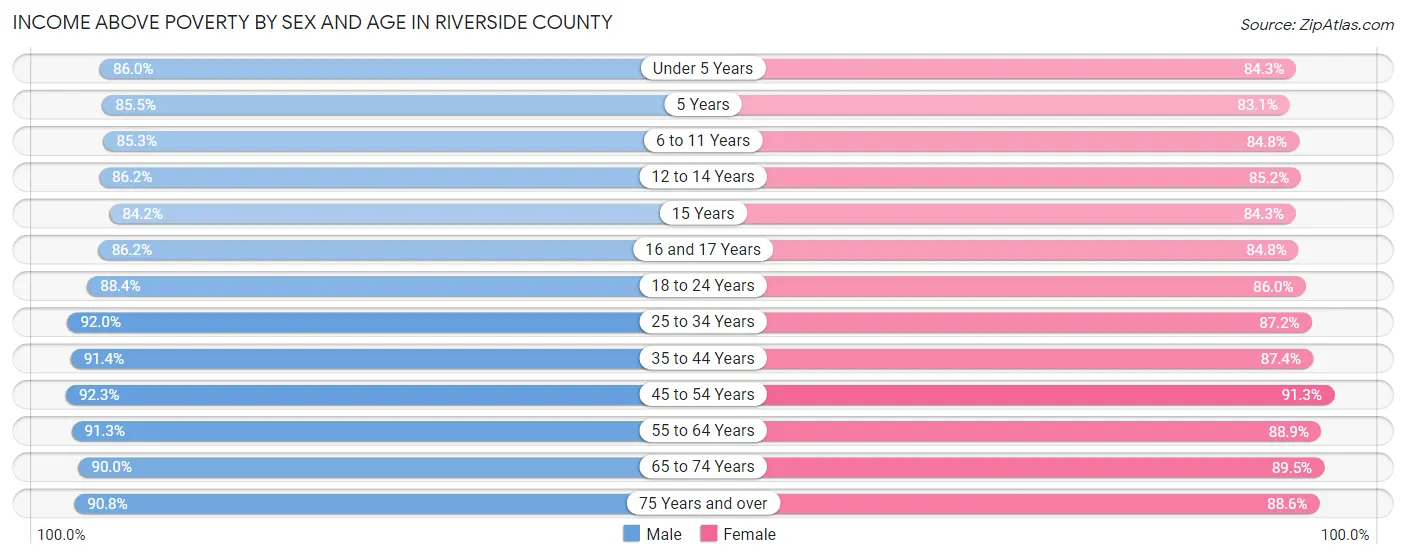
| Age Bracket | Male | Female |
| Under 5 Years | 63,226 (86.0%) | 59,049 (84.3%) |
| 5 Years | 13,557 (85.5%) | 12,107 (83.1%) |
| 6 to 11 Years | 85,951 (85.3%) | 81,794 (84.8%) |
| 12 to 14 Years | 48,031 (86.2%) | 45,951 (85.2%) |
| 15 Years | 15,406 (84.2%) | 14,792 (84.3%) |
| 16 and 17 Years | 31,545 (86.2%) | 30,030 (84.8%) |
| 18 to 24 Years | 102,455 (88.4%) | 94,258 (86.0%) |
| 25 to 34 Years | 155,522 (92.0%) | 141,463 (87.2%) |
| 35 to 44 Years | 146,518 (91.4%) | 137,583 (87.4%) |
| 45 to 54 Years | 137,447 (92.3%) | 133,828 (91.3%) |
| 55 to 64 Years | 127,577 (91.3%) | 123,792 (88.9%) |
| 65 to 74 Years | 87,528 (90.0%) | 95,849 (89.5%) |
| 75 Years and over | 59,977 (90.8%) | 75,014 (88.6%) |
| Total | 1,074,740 (89.7%) | 1,045,510 (87.5%) |
Income Below Poverty Among Married-Couple Families in Riverside County
The poverty statistics for married-couple families in Riverside County show that 5.3% or 21,773 of the total 410,751 families live below the poverty line. Families with 5 or more children have the highest poverty rate of 15.7%, comprising of 576 families. On the other hand, families with no children have the lowest poverty rate of 4.2%, which includes 9,119 families.
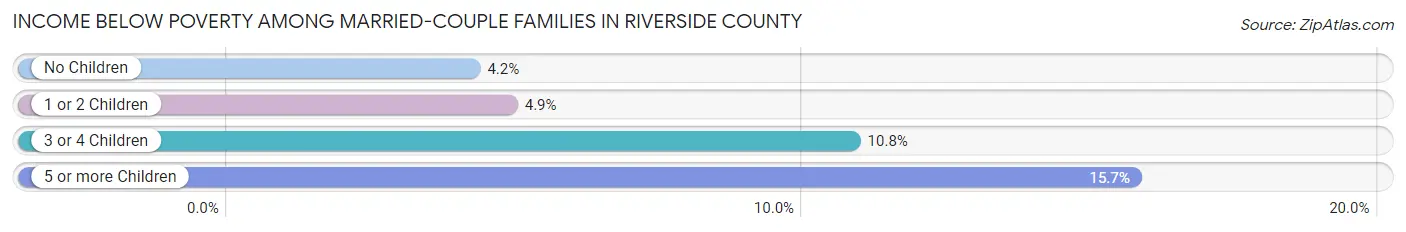
| Children | Above Poverty | Below Poverty |
| No Children | 206,968 (95.8%) | 9,119 (4.2%) |
| 1 or 2 Children | 137,582 (95.1%) | 7,050 (4.9%) |
| 3 or 4 Children | 41,343 (89.2%) | 5,028 (10.8%) |
| 5 or more Children | 3,085 (84.3%) | 576 (15.7%) |
| Total | 388,978 (94.7%) | 21,773 (5.3%) |
Income Below Poverty Among Single-Parent Households in Riverside County
According to the poverty data in Riverside County, 10.6% or 4,890 single-father households and 21.1% or 21,412 single-mother households are living below the poverty line. Among single-father households, those with 3 or 4 children have the highest poverty rate, with 1,195 households (21.6%) experiencing poverty. Likewise, among single-mother households, those with 5 or more children have the highest poverty rate, with 572 households (53.7%) falling below the poverty line.
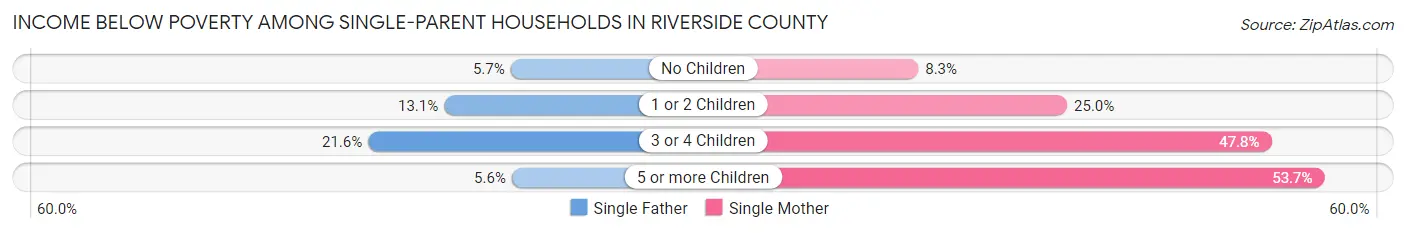
| Children | Single Father | Single Mother |
| No Children | 1,205 (5.7%) | 3,515 (8.3%) |
| 1 or 2 Children | 2,469 (13.1%) | 11,514 (25.0%) |
| 3 or 4 Children | 1,195 (21.6%) | 5,811 (47.8%) |
| 5 or more Children | 21 (5.6%) | 572 (53.7%) |
| Total | 4,890 (10.6%) | 21,412 (21.1%) |
Income Below Poverty Among Married-Couple vs Single-Parent Households in Riverside County
The poverty data for Riverside County shows that 21,773 of the married-couple family households (5.3%) and 26,302 of the single-parent households (17.8%) are living below the poverty level. Within the married-couple family households, those with 5 or more children have the highest poverty rate, with 576 households (15.7%) falling below the poverty line. Among the single-parent households, those with 5 or more children have the highest poverty rate, with 593 household (41.1%) living below poverty.
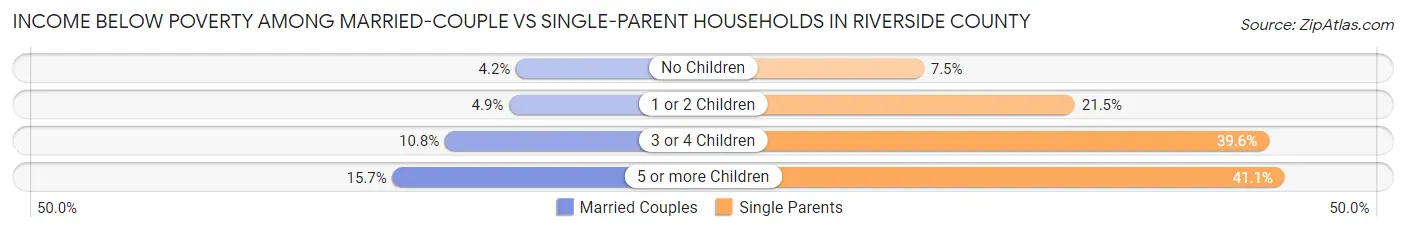
| Children | Married-Couple Families | Single-Parent Households |
| No Children | 9,119 (4.2%) | 4,720 (7.5%) |
| 1 or 2 Children | 7,050 (4.9%) | 13,983 (21.5%) |
| 3 or 4 Children | 5,028 (10.8%) | 7,006 (39.6%) |
| 5 or more Children | 576 (15.7%) | 593 (41.1%) |
| Total | 21,773 (5.3%) | 26,302 (17.8%) |
Race in Riverside County
The most populous races in Riverside County are Hispanic or Latino (1,233,277 | 50.8%), White / Caucasian (1,138,018 | 46.8%), and Some other Race (574,403 | 23.6%).
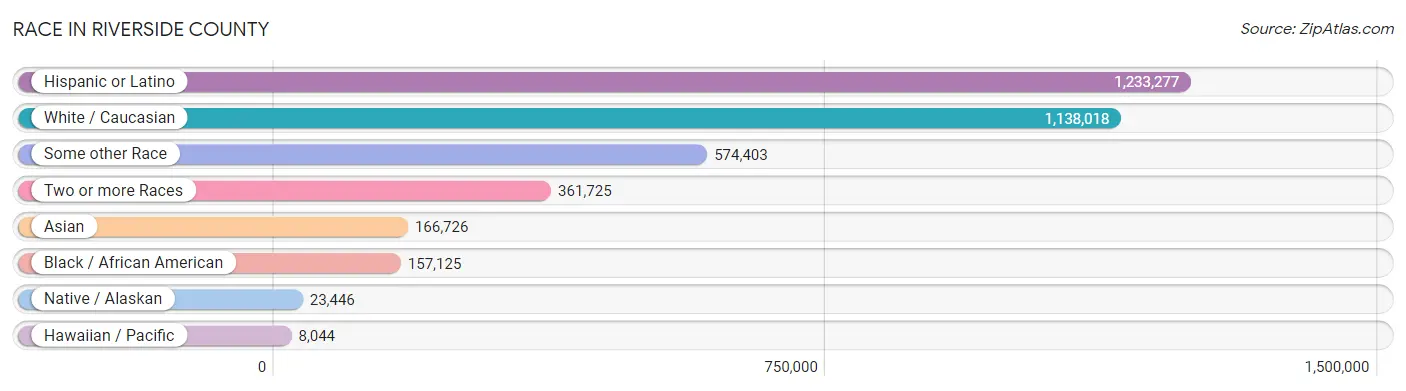
| Race | # Population | % Population |
| Asian | 166,726 | 6.9% |
| Black / African American | 157,125 | 6.5% |
| Hawaiian / Pacific | 8,044 | 0.3% |
| Hispanic or Latino | 1,233,277 | 50.8% |
| Native / Alaskan | 23,446 | 1.0% |
| White / Caucasian | 1,138,018 | 46.8% |
| Two or more Races | 361,725 | 14.9% |
| Some other Race | 574,403 | 23.6% |
| Total | 2,429,487 | 100.0% |
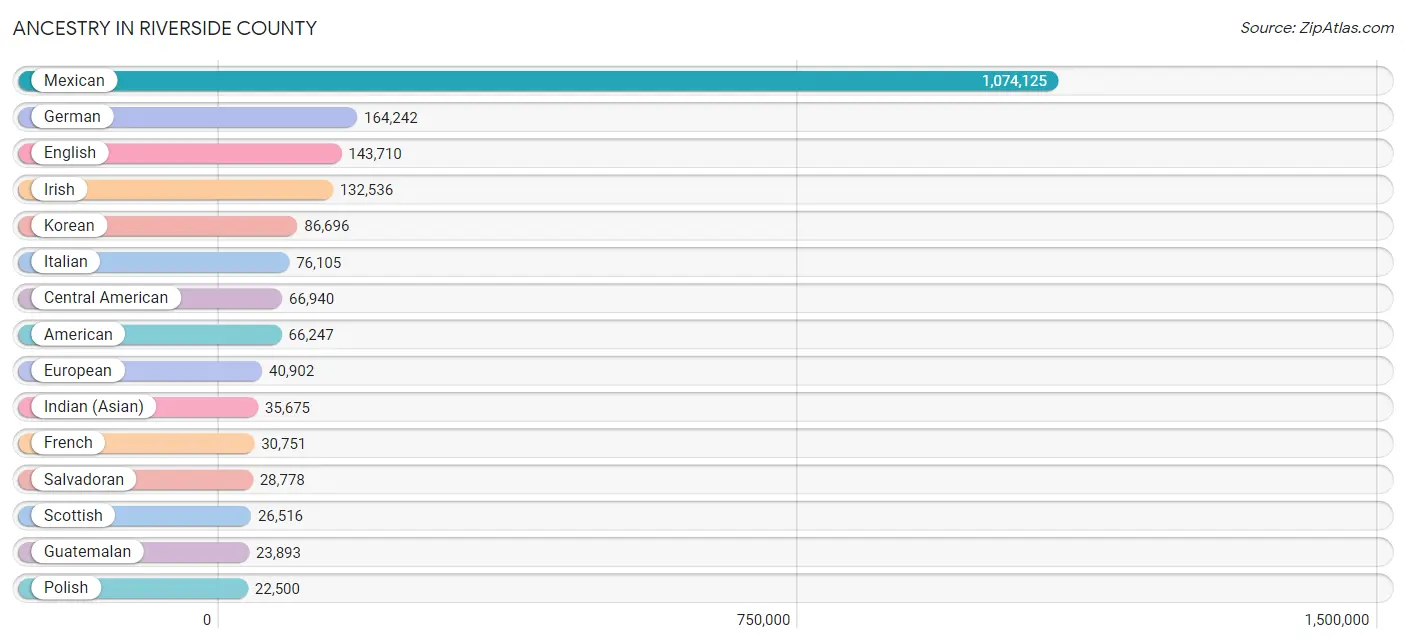
Ancestry in Riverside County
The most populous ancestries reported in Riverside County are Mexican (1,074,125 | 44.2%), German (164,242 | 6.8%), English (143,710 | 5.9%), Irish (132,536 | 5.5%), and Korean (86,696 | 3.6%), together accounting for 65.9% of all Riverside County residents.
| Ancestry | # Population | % Population |
| Afghan | 1,942 | 0.1% |
| African | 8,841 | 0.4% |
| Alaska Native | 14 | 0.0% |
| Alaskan Athabascan | 69 | 0.0% |
| Albanian | 192 | 0.0% |
| Aleut | 149 | 0.0% |
| Alsatian | 4 | 0.0% |
| American | 66,247 | 2.7% |
| Apache | 2,599 | 0.1% |
| Arab | 17,702 | 0.7% |
| Argentinean | 2,475 | 0.1% |
| Armenian | 2,278 | 0.1% |
| Assyrian / Chaldean / Syriac | 237 | 0.0% |
| Australian | 659 | 0.0% |
| Austrian | 2,688 | 0.1% |
| Bahamian | 7 | 0.0% |
| Bangladeshi | 1,193 | 0.1% |
| Barbadian | 119 | 0.0% |
| Basque | 689 | 0.0% |
| Belgian | 950 | 0.0% |
| Belizean | 853 | 0.0% |
| Bermudan | 46 | 0.0% |
| Bhutanese | 13,582 | 0.6% |
| Blackfeet | 1,885 | 0.1% |
| Bolivian | 1,020 | 0.0% |
| Brazilian | 1,201 | 0.1% |
| British | 10,224 | 0.4% |
| British West Indian | 174 | 0.0% |
| Bulgarian | 534 | 0.0% |
| Burmese | 14,609 | 0.6% |
| Cajun | 135 | 0.0% |
| Cambodian | 174 | 0.0% |
| Canadian | 5,334 | 0.2% |
| Cape Verdean | 68 | 0.0% |
| Carpatho Rusyn | 5 | 0.0% |
| Celtic | 138 | 0.0% |
| Central American | 66,940 | 2.8% |
| Central American Indian | 3,462 | 0.1% |
| Cherokee | 6,748 | 0.3% |
| Cheyenne | 149 | 0.0% |
| Chickasaw | 402 | 0.0% |
| Chilean | 994 | 0.0% |
| Chinese | 128 | 0.0% |
| Chippewa | 1,268 | 0.1% |
| Choctaw | 1,584 | 0.1% |
| Colombian | 8,496 | 0.4% |
| Comanche | 200 | 0.0% |
| Costa Rican | 1,870 | 0.1% |
| Cree | 95 | 0.0% |
| Creek | 359 | 0.0% |
| Croatian | 2,659 | 0.1% |
| Crow | 3 | 0.0% |
| Cuban | 9,009 | 0.4% |
| Cypriot | 9 | 0.0% |
| Czech | 4,755 | 0.2% |
| Czechoslovakian | 1,591 | 0.1% |
| Danish | 7,422 | 0.3% |
| Delaware | 81 | 0.0% |
| Dominican | 2,358 | 0.1% |
| Dutch | 16,985 | 0.7% |
| Dutch West Indian | 13 | 0.0% |
| Eastern European | 4,686 | 0.2% |
| Ecuadorian | 1,928 | 0.1% |
| Egyptian | 3,833 | 0.2% |
| English | 143,710 | 5.9% |
| Estonian | 81 | 0.0% |
| Ethiopian | 363 | 0.0% |
| European | 40,902 | 1.7% |
| Fijian | 89 | 0.0% |
| Filipino | 3,016 | 0.1% |
| Finnish | 2,208 | 0.1% |
| French | 30,751 | 1.3% |
| French American Indian | 430 | 0.0% |
| French Canadian | 7,296 | 0.3% |
| German | 164,242 | 6.8% |
| German Russian | 37 | 0.0% |
| Ghanaian | 905 | 0.0% |
| Greek | 5,393 | 0.2% |
| Guamanian / Chamorro | 2,924 | 0.1% |
| Guatemalan | 23,893 | 1.0% |
| Guyanese | 207 | 0.0% |
| Haitian | 1,027 | 0.0% |
| Honduran | 4,103 | 0.2% |
| Hopi | 76 | 0.0% |
| Houma | 21 | 0.0% |
| Hungarian | 5,823 | 0.2% |
| Icelander | 278 | 0.0% |
| Indian (Asian) | 35,675 | 1.5% |
| Indonesian | 444 | 0.0% |
| Inupiat | 76 | 0.0% |
| Iranian | 4,087 | 0.2% |
| Iraqi | 935 | 0.0% |
| Irish | 132,536 | 5.5% |
| Iroquois | 591 | 0.0% |
| Israeli | 365 | 0.0% |
| Italian | 76,105 | 3.1% |
| Jamaican | 2,878 | 0.1% |
| Japanese | 4,597 | 0.2% |
| Jordanian | 1,166 | 0.1% |
| Kenyan | 310 | 0.0% |
| Kiowa | 87 | 0.0% |
| Korean | 86,696 | 3.6% |
| Laotian | 3,110 | 0.1% |
| Latvian | 289 | 0.0% |
| Lebanese | 3,728 | 0.2% |
| Liberian | 120 | 0.0% |
| Lithuanian | 1,527 | 0.1% |
| Lumbee | 209 | 0.0% |
| Luxembourger | 51 | 0.0% |
| Macedonian | 90 | 0.0% |
| Malaysian | 2,516 | 0.1% |
| Maltese | 327 | 0.0% |
| Menominee | 2 | 0.0% |
| Mexican | 1,074,125 | 44.2% |
| Mexican American Indian | 12,179 | 0.5% |
| Mongolian | 138 | 0.0% |
| Moroccan | 119 | 0.0% |
| Native Hawaiian | 4,835 | 0.2% |
| Navajo | 1,923 | 0.1% |
| Nepalese | 27 | 0.0% |
| New Zealander | 45 | 0.0% |
| Nicaraguan | 5,650 | 0.2% |
| Nigerian | 4,232 | 0.2% |
| Northern European | 2,639 | 0.1% |
| Norwegian | 21,160 | 0.9% |
| Okinawan | 7 | 0.0% |
| Osage | 170 | 0.0% |
| Ottawa | 2 | 0.0% |
| Paiute | 244 | 0.0% |
| Pakistani | 2,869 | 0.1% |
| Palestinian | 1,398 | 0.1% |
| Panamanian | 2,353 | 0.1% |
| Paraguayan | 34 | 0.0% |
| Pennsylvania German | 298 | 0.0% |
| Peruvian | 5,255 | 0.2% |
| Pima | 254 | 0.0% |
| Polish | 22,500 | 0.9% |
| Portuguese | 7,719 | 0.3% |
| Potawatomi | 199 | 0.0% |
| Pueblo | 1,047 | 0.0% |
| Puerto Rican | 16,438 | 0.7% |
| Puget Sound Salish | 21 | 0.0% |
| Romanian | 3,054 | 0.1% |
| Russian | 10,515 | 0.4% |
| Salvadoran | 28,778 | 1.2% |
| Samoan | 4,180 | 0.2% |
| Scandinavian | 7,146 | 0.3% |
| Scotch-Irish | 10,565 | 0.4% |
| Scottish | 26,516 | 1.1% |
| Seminole | 158 | 0.0% |
| Senegalese | 28 | 0.0% |
| Serbian | 791 | 0.0% |
| Shoshone | 74 | 0.0% |
| Sierra Leonean | 81 | 0.0% |
| Sioux | 539 | 0.0% |
| Slavic | 411 | 0.0% |
| Slovak | 1,453 | 0.1% |
| Slovene | 497 | 0.0% |
| Somali | 80 | 0.0% |
| South African | 325 | 0.0% |
| South American | 22,396 | 0.9% |
| South American Indian | 284 | 0.0% |
| Soviet Union | 2 | 0.0% |
| Spaniard | 11,007 | 0.4% |
| Spanish | 9,295 | 0.4% |
| Spanish American | 623 | 0.0% |
| Spanish American Indian | 244 | 0.0% |
| Sri Lankan | 22,452 | 0.9% |
| Subsaharan African | 15,671 | 0.6% |
| Sudanese | 109 | 0.0% |
| Swedish | 17,688 | 0.7% |
| Swiss | 3,112 | 0.1% |
| Syrian | 2,129 | 0.1% |
| Thai | 18,026 | 0.7% |
| Tlingit-Haida | 34 | 0.0% |
| Tohono O'Odham | 262 | 0.0% |
| Tongan | 1,825 | 0.1% |
| Trinidadian and Tobagonian | 326 | 0.0% |
| Turkish | 1,191 | 0.1% |
| Ugandan | 29 | 0.0% |
| Ukrainian | 2,485 | 0.1% |
| Uruguayan | 259 | 0.0% |
| Ute | 54 | 0.0% |
| Venezuelan | 1,584 | 0.1% |
| Vietnamese | 485 | 0.0% |
| Welsh | 8,711 | 0.4% |
| West Indian | 639 | 0.0% |
| Yakama | 24 | 0.0% |
| Yaqui | 1,789 | 0.1% |
| Yugoslavian | 972 | 0.0% |
| Yuman | 512 | 0.0% |
| Yup'ik | 47 | 0.0% |
| Zimbabwean | 38 | 0.0% | View All 193 Rows |
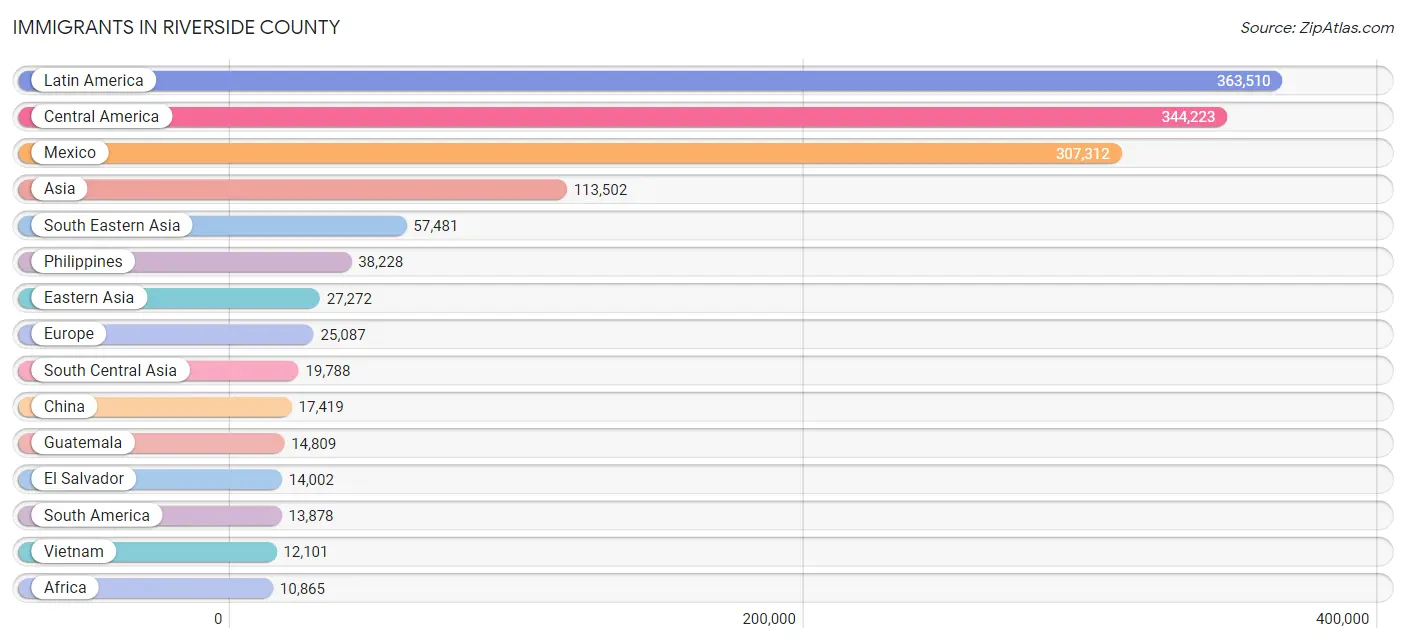
Immigrants in Riverside County
The most numerous immigrant groups reported in Riverside County came from Latin America (363,510 | 15.0%), Central America (344,223 | 14.2%), Mexico (307,312 | 12.7%), Asia (113,502 | 4.7%), and South Eastern Asia (57,481 | 2.4%), together accounting for 48.8% of all Riverside County residents.
| Immigration Origin | # Population | % Population |
| Afghanistan | 1,688 | 0.1% |
| Africa | 10,865 | 0.4% |
| Albania | 97 | 0.0% |
| Argentina | 1,494 | 0.1% |
| Armenia | 310 | 0.0% |
| Asia | 113,502 | 4.7% |
| Australia | 659 | 0.0% |
| Austria | 374 | 0.0% |
| Azores | 67 | 0.0% |
| Bahamas | 58 | 0.0% |
| Bangladesh | 777 | 0.0% |
| Barbados | 139 | 0.0% |
| Belarus | 206 | 0.0% |
| Belgium | 152 | 0.0% |
| Belize | 725 | 0.0% |
| Bolivia | 434 | 0.0% |
| Bosnia and Herzegovina | 150 | 0.0% |
| Brazil | 1,293 | 0.1% |
| Bulgaria | 468 | 0.0% |
| Cambodia | 1,648 | 0.1% |
| Cameroon | 76 | 0.0% |
| Canada | 10,474 | 0.4% |
| Caribbean | 5,409 | 0.2% |
| Central America | 344,223 | 14.2% |
| Chile | 533 | 0.0% |
| China | 17,419 | 0.7% |
| Colombia | 4,137 | 0.2% |
| Congo | 30 | 0.0% |
| Costa Rica | 820 | 0.0% |
| Croatia | 372 | 0.0% |
| Cuba | 2,472 | 0.1% |
| Czechoslovakia | 466 | 0.0% |
| Denmark | 434 | 0.0% |
| Dominican Republic | 408 | 0.0% |
| Eastern Africa | 1,635 | 0.1% |
| Eastern Asia | 27,272 | 1.1% |
| Eastern Europe | 6,943 | 0.3% |
| Ecuador | 987 | 0.0% |
| Egypt | 3,173 | 0.1% |
| El Salvador | 14,002 | 0.6% |
| England | 4,486 | 0.2% |
| Eritrea | 71 | 0.0% |
| Ethiopia | 366 | 0.0% |
| Europe | 25,087 | 1.0% |
| Fiji | 611 | 0.0% |
| France | 1,044 | 0.0% |
| Germany | 3,597 | 0.2% |
| Ghana | 724 | 0.0% |
| Greece | 422 | 0.0% |
| Grenada | 44 | 0.0% |
| Guatemala | 14,809 | 0.6% |
| Guyana | 262 | 0.0% |
| Haiti | 475 | 0.0% |
| Honduras | 2,658 | 0.1% |
| Hong Kong | 870 | 0.0% |
| Hungary | 541 | 0.0% |
| India | 9,576 | 0.4% |
| Indonesia | 1,429 | 0.1% |
| Iran | 3,215 | 0.1% |
| Iraq | 1,776 | 0.1% |
| Ireland | 566 | 0.0% |
| Israel | 634 | 0.0% |
| Italy | 1,112 | 0.1% |
| Jamaica | 1,106 | 0.1% |
| Japan | 2,520 | 0.1% |
| Jordan | 1,192 | 0.1% |
| Kazakhstan | 73 | 0.0% |
| Kenya | 635 | 0.0% |
| Korea | 7,293 | 0.3% |
| Kuwait | 193 | 0.0% |
| Laos | 1,290 | 0.1% |
| Latin America | 363,510 | 15.0% |
| Latvia | 65 | 0.0% |
| Lebanon | 1,549 | 0.1% |
| Liberia | 99 | 0.0% |
| Lithuania | 86 | 0.0% |
| Malaysia | 379 | 0.0% |
| Mexico | 307,312 | 12.7% |
| Micronesia | 52 | 0.0% |
| Middle Africa | 253 | 0.0% |
| Moldova | 19 | 0.0% |
| Morocco | 115 | 0.0% |
| Nepal | 373 | 0.0% |
| Netherlands | 803 | 0.0% |
| Nicaragua | 3,072 | 0.1% |
| Nigeria | 3,215 | 0.1% |
| North Macedonia | 12 | 0.0% |
| Northern Africa | 3,416 | 0.1% |
| Northern Europe | 9,367 | 0.4% |
| Norway | 233 | 0.0% |
| Oceania | 2,500 | 0.1% |
| Pakistan | 3,468 | 0.1% |
| Panama | 682 | 0.0% |
| Peru | 3,659 | 0.2% |
| Philippines | 38,228 | 1.6% |
| Poland | 1,075 | 0.0% |
| Portugal | 388 | 0.0% |
| Romania | 1,183 | 0.1% |
| Russia | 999 | 0.0% |
| Saudi Arabia | 246 | 0.0% |
| Scotland | 885 | 0.0% |
| Serbia | 163 | 0.0% |
| Sierra Leone | 229 | 0.0% |
| Singapore | 145 | 0.0% |
| Somalia | 34 | 0.0% |
| South Africa | 691 | 0.0% |
| South America | 13,878 | 0.6% |
| South Central Asia | 19,788 | 0.8% |
| South Eastern Asia | 57,481 | 2.4% |
| Southern Europe | 2,624 | 0.1% |
| Spain | 671 | 0.0% |
| Sri Lanka | 536 | 0.0% |
| St. Vincent and the Grenadines | 36 | 0.0% |
| Sudan | 55 | 0.0% |
| Sweden | 441 | 0.0% |
| Switzerland | 174 | 0.0% |
| Syria | 1,694 | 0.1% |
| Taiwan | 3,573 | 0.2% |
| Thailand | 1,797 | 0.1% |
| Trinidad and Tobago | 481 | 0.0% |
| Turkey | 611 | 0.0% |
| Uganda | 136 | 0.0% |
| Ukraine | 538 | 0.0% |
| Uruguay | 121 | 0.0% |
| Uzbekistan | 44 | 0.0% |
| Venezuela | 815 | 0.0% |
| Vietnam | 12,101 | 0.5% |
| West Indies | 72 | 0.0% |
| Western Africa | 4,314 | 0.2% |
| Western Asia | 8,545 | 0.4% |
| Western Europe | 6,153 | 0.3% |
| Yemen | 25 | 0.0% |
| Zaire | 71 | 0.0% |
| Zimbabwe | 81 | 0.0% | View All 134 Rows |
Sex and Age in Riverside County
Sex and Age in Riverside County
The most populous age groups in Riverside County are 10 to 14 Years (92,354 | 7.6%) for men and 10 to 14 Years (88,758 | 7.3%) for women.
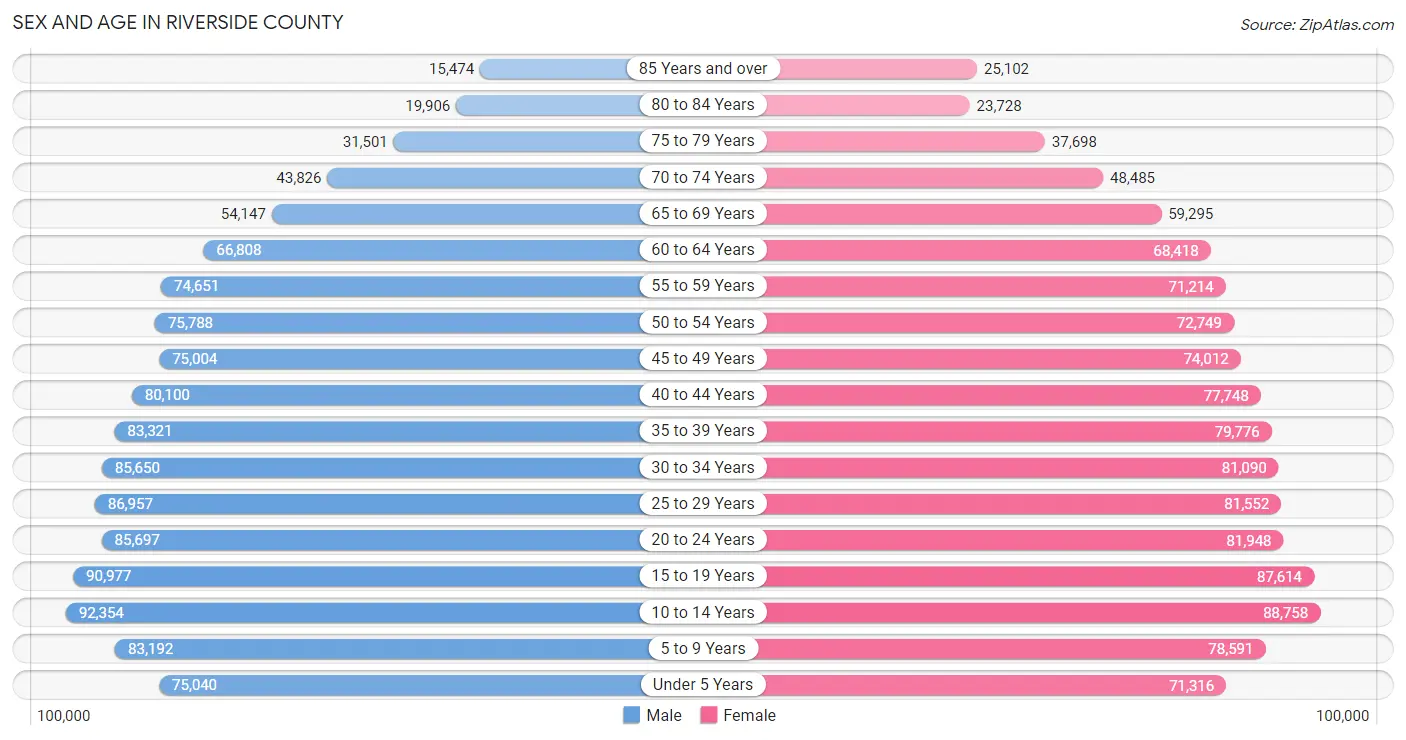
| Age Bracket | Male | Female |
| Under 5 Years | 75,040 (6.1%) | 71,316 (5.9%) |
| 5 to 9 Years | 83,192 (6.8%) | 78,591 (6.5%) |
| 10 to 14 Years | 92,354 (7.6%) | 88,758 (7.3%) |
| 15 to 19 Years | 90,977 (7.4%) | 87,614 (7.2%) |
| 20 to 24 Years | 85,697 (7.0%) | 81,948 (6.8%) |
| 25 to 29 Years | 86,957 (7.1%) | 81,552 (6.7%) |
| 30 to 34 Years | 85,650 (7.0%) | 81,090 (6.7%) |
| 35 to 39 Years | 83,321 (6.8%) | 79,776 (6.6%) |
| 40 to 44 Years | 80,100 (6.6%) | 77,748 (6.4%) |
| 45 to 49 Years | 75,004 (6.1%) | 74,012 (6.1%) |
| 50 to 54 Years | 75,788 (6.2%) | 72,749 (6.0%) |
| 55 to 59 Years | 74,651 (6.1%) | 71,214 (5.9%) |
| 60 to 64 Years | 66,808 (5.5%) | 68,418 (5.7%) |
| 65 to 69 Years | 54,147 (4.4%) | 59,295 (4.9%) |
| 70 to 74 Years | 43,826 (3.6%) | 48,485 (4.0%) |
| 75 to 79 Years | 31,501 (2.6%) | 37,698 (3.1%) |
| 80 to 84 Years | 19,906 (1.6%) | 23,728 (2.0%) |
| 85 Years and over | 15,474 (1.3%) | 25,102 (2.1%) |
| Total | 1,220,393 (100.0%) | 1,209,094 (100.0%) |
Families and Households in Riverside County
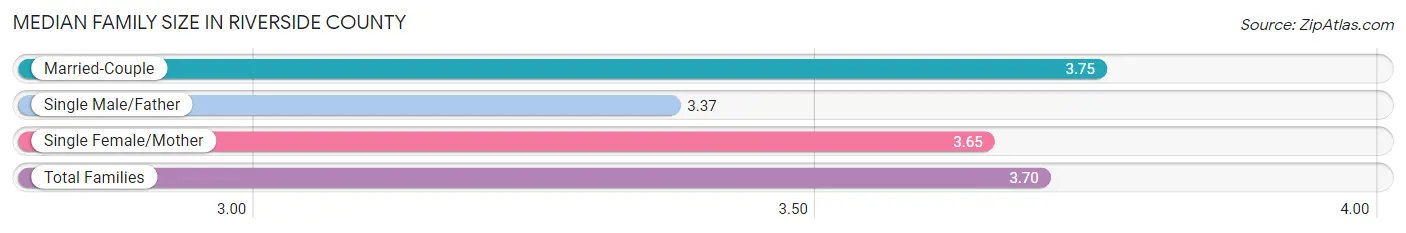
Median Family Size in Riverside County
The median family size in Riverside County is 3.70 persons per family, with married-couple families (410,751 | 73.6%) accounting for the largest median family size of 3.75 persons per family. On the other hand, single male/father families (45,912 | 8.2%) represent the smallest median family size with 3.37 persons per family.
| Family Type | # Families | Family Size |
| Married-Couple | 410,751 (73.6%) | 3.75 |
| Single Male/Father | 45,912 (8.2%) | 3.37 |
| Single Female/Mother | 101,467 (18.2%) | 3.65 |
| Total Families | 558,130 (100.0%) | 3.70 |
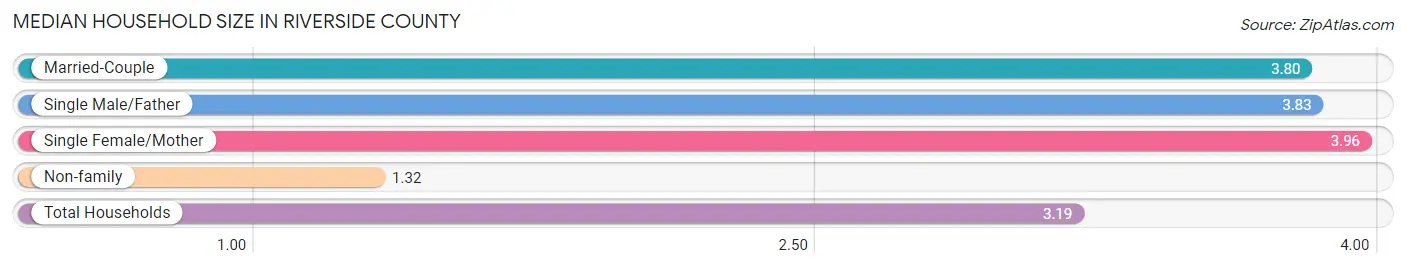
Median Household Size in Riverside County
The median household size in Riverside County is 3.19 persons per household, with single female/mother households (101,467 | 13.5%) accounting for the largest median household size of 3.96 persons per household. non-family households (191,846 | 25.6%) represent the smallest median household size with 1.32 persons per household.
| Household Type | # Households | Household Size |
| Married-Couple | 410,751 (54.8%) | 3.80 |
| Single Male/Father | 45,912 (6.1%) | 3.83 |
| Single Female/Mother | 101,467 (13.5%) | 3.96 |
| Non-family | 191,846 (25.6%) | 1.32 |
| Total Households | 749,976 (100.0%) | 3.19 |
Household Size by Marriage Status in Riverside County
Out of a total of 749,976 households in Riverside County, 558,130 (74.4%) are family households, while 191,846 (25.6%) are nonfamily households. The most numerous type of family households are 2-person households, comprising 186,474, and the most common type of nonfamily households are 1-person households, comprising 150,035.
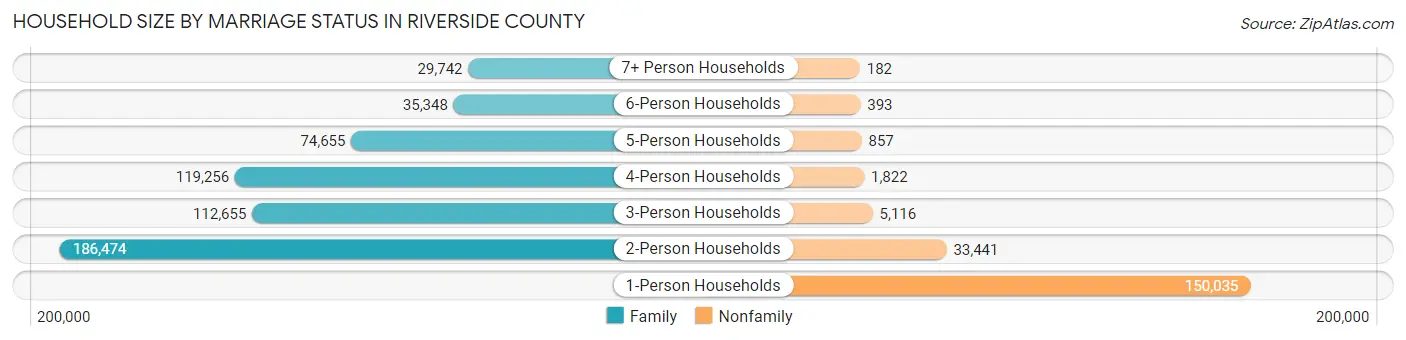
| Household Size | Family Households | Nonfamily Households |
| 1-Person Households | - | 150,035 (20.0%) |
| 2-Person Households | 186,474 (24.9%) | 33,441 (4.5%) |
| 3-Person Households | 112,655 (15.0%) | 5,116 (0.7%) |
| 4-Person Households | 119,256 (15.9%) | 1,822 (0.2%) |
| 5-Person Households | 74,655 (10.0%) | 857 (0.1%) |
| 6-Person Households | 35,348 (4.7%) | 393 (0.1%) |
| 7+ Person Households | 29,742 (4.0%) | 182 (0.0%) |
| Total | 558,130 (74.4%) | 191,846 (25.6%) |
Female Fertility in Riverside County
Fertility by Age in Riverside County
Average fertility rate in Riverside County is 51.0 births per 1,000 women. Women in the age bracket of 20 to 34 years have the highest fertility rate with 84.0 births per 1,000 women. Women in the age bracket of 20 to 34 years acount for 69.8% of all women with births.
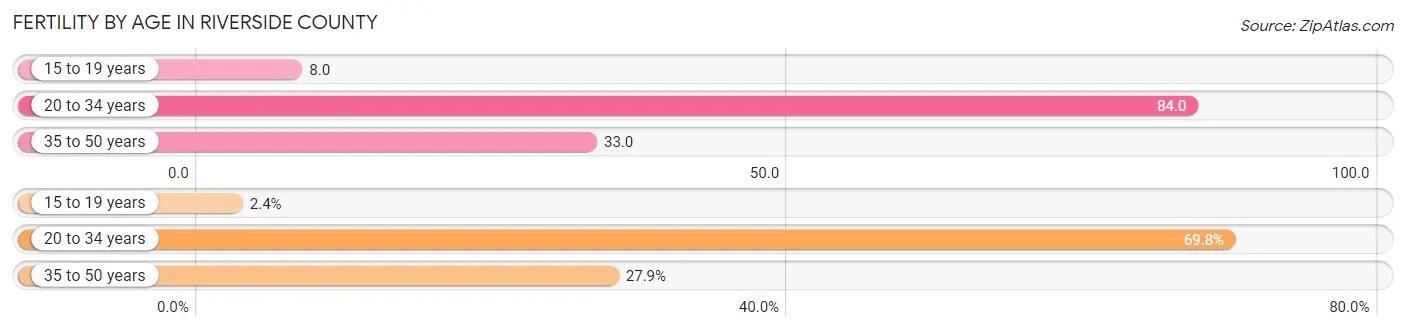
| Age Bracket | Women with Births | Births / 1,000 Women |
| 15 to 19 years | 694 (2.4%) | 8.0 |
| 20 to 34 years | 20,520 (69.8%) | 84.0 |
| 35 to 50 years | 8,201 (27.9%) | 33.0 |
| Total | 29,415 (100.0%) | 51.0 |
Fertility by Age by Marriage Status in Riverside County
66.2% of women with births (29,415) in Riverside County are married. The highest percentage of unmarried women with births falls into 15 to 19 years age bracket with 94.4% of them unmarried at the time of birth, while the lowest percentage of unmarried women with births belong to 35 to 50 years age bracket with 23.5% of them unmarried.
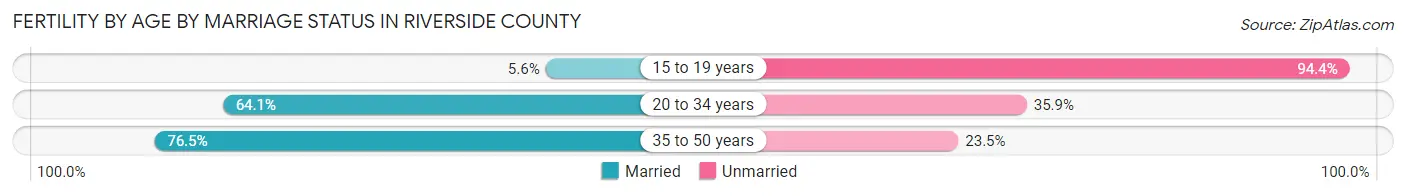
| Age Bracket | Married | Unmarried |
| 15 to 19 years | 39 (5.6%) | 655 (94.4%) |
| 20 to 34 years | 13,153 (64.1%) | 7,367 (35.9%) |
| 35 to 50 years | 6,274 (76.5%) | 1,927 (23.5%) |
| Total | 19,473 (66.2%) | 9,942 (33.8%) |
Fertility by Education in Riverside County
Average fertility rate in Riverside County is 51.0 births per 1,000 women. Women with the education attainment of graduate degree have the highest fertility rate of 67.0 births per 1,000 women, while women with the education attainment of less than high school have the lowest fertility at 25.0 births per 1,000 women. Women with the education attainment of college or associate's degree represent 36.4% of all women with births.
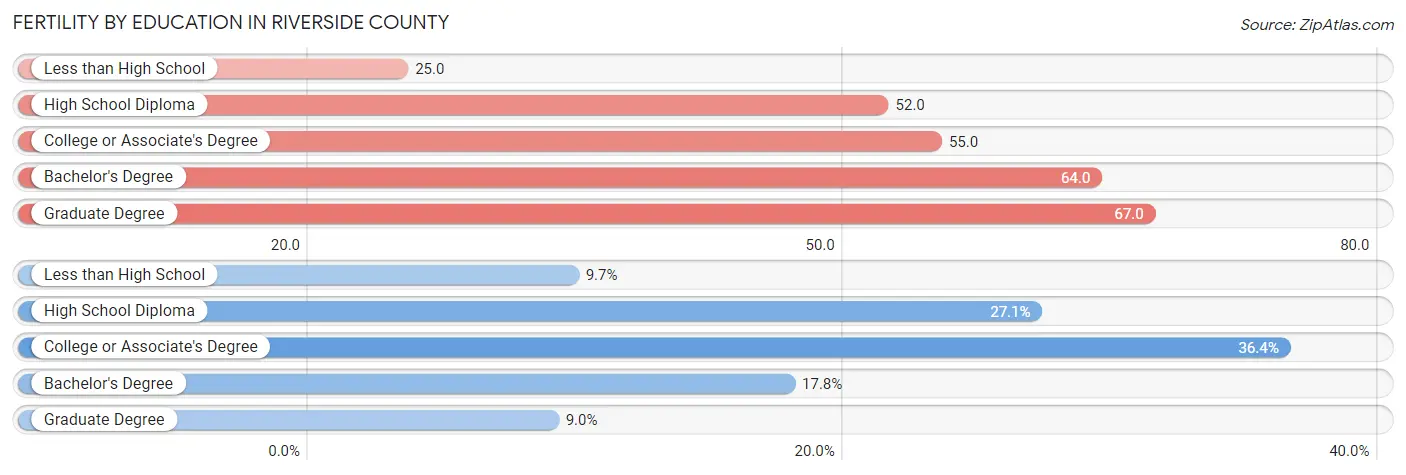
| Educational Attainment | Women with Births | Births / 1,000 Women |
| Less than High School | 2,858 (9.7%) | 25.0 |
| High School Diploma | 7,969 (27.1%) | 52.0 |
| College or Associate's Degree | 10,705 (36.4%) | 55.0 |
| Bachelor's Degree | 5,245 (17.8%) | 64.0 |
| Graduate Degree | 2,638 (9.0%) | 67.0 |
| Total | 29,415 (100.0%) | 51.0 |
Fertility by Education by Marriage Status in Riverside County
33.8% of women with births in Riverside County are unmarried. Women with the educational attainment of graduate degree are most likely to be married with 87.8% of them married at childbirth, while women with the educational attainment of high school diploma are least likely to be married with 46.4% of them unmarried at childbirth.
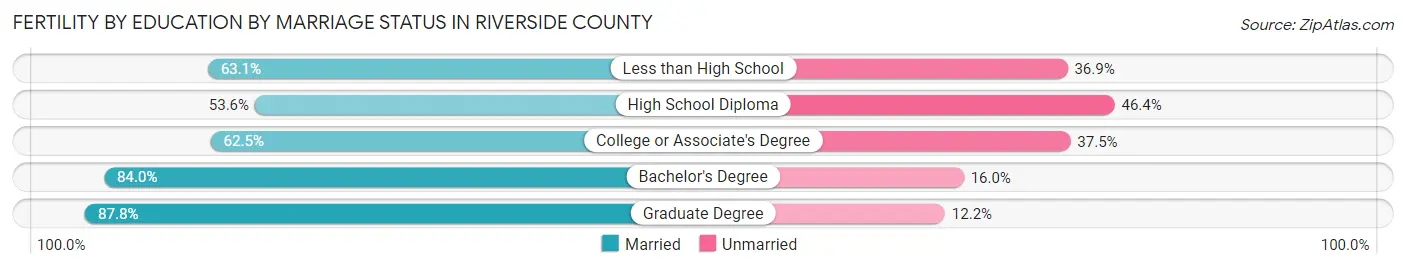
| Educational Attainment | Married | Unmarried |
| Less than High School | 1,803 (63.1%) | 1,055 (36.9%) |
| High School Diploma | 4,271 (53.6%) | 3,698 (46.4%) |
| College or Associate's Degree | 6,691 (62.5%) | 4,014 (37.5%) |
| Bachelor's Degree | 4,406 (84.0%) | 839 (16.0%) |
| Graduate Degree | 2,316 (87.8%) | 322 (12.2%) |
| Total | 19,473 (66.2%) | 9,942 (33.8%) |
Employment Characteristics in Riverside County
Employment by Class of Employer in Riverside County
Among the 1,048,421 employed individuals in Riverside County, private company employees (718,935 | 68.6%), local government employees (97,523 | 9.3%), and self-employed (not incorporated) (68,431 | 6.5%) make up the most common classes of employment.
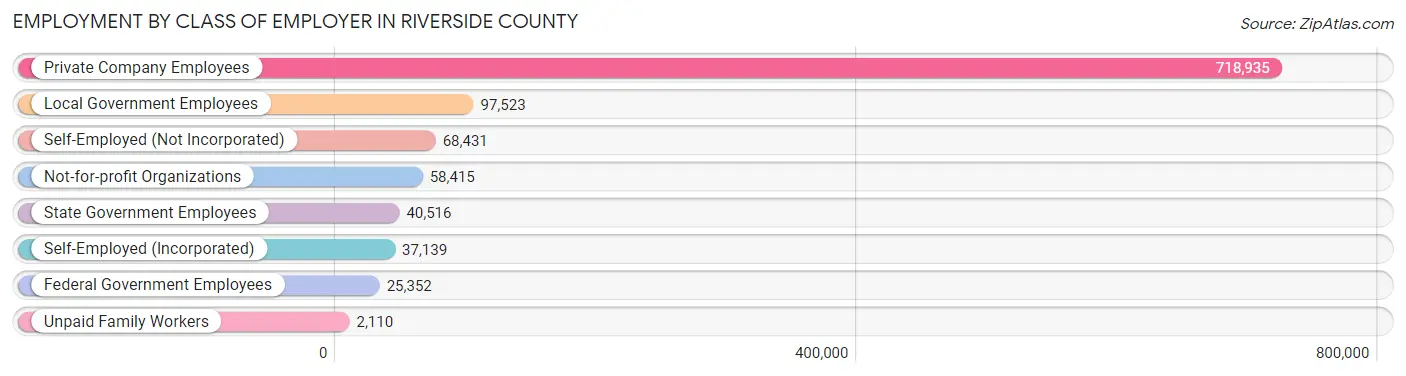
| Employer Class | # Employees | % Employees |
| Private Company Employees | 718,935 | 68.6% |
| Self-Employed (Incorporated) | 37,139 | 3.5% |
| Self-Employed (Not Incorporated) | 68,431 | 6.5% |
| Not-for-profit Organizations | 58,415 | 5.6% |
| Local Government Employees | 97,523 | 9.3% |
| State Government Employees | 40,516 | 3.9% |
| Federal Government Employees | 25,352 | 2.4% |
| Unpaid Family Workers | 2,110 | 0.2% |
| Total | 1,048,421 | 100.0% |
Employment Status by Age in Riverside County
According to the labor force statistics for Riverside County, out of the total population over 16 years of age (1,904,350), 60.7% or 1,155,940 individuals are in the labor force, with 6.7% or 77,448 of them unemployed. The age group with the highest labor force participation rate is 30 to 34 years, with 80.3% or 133,892 individuals in the labor force. Within the labor force, the 16 to 19 years age range has the highest percentage of unemployed individuals, with 19.6% or 8,587 of them being unemployed.
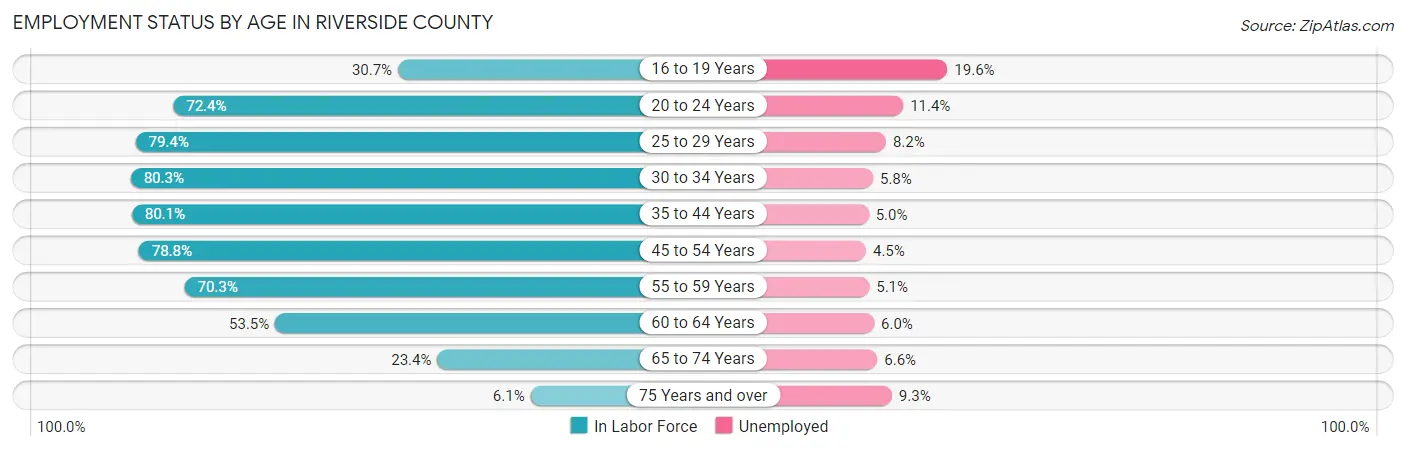
| Age Bracket | In Labor Force | Unemployed |
| 16 to 19 Years | 43,810 (30.7%) | 8,587 (19.6%) |
| 20 to 24 Years | 121,375 (72.4%) | 13,837 (11.4%) |
| 25 to 29 Years | 133,796 (79.4%) | 10,971 (8.2%) |
| 30 to 34 Years | 133,892 (80.3%) | 7,766 (5.8%) |
| 35 to 44 Years | 257,077 (80.1%) | 12,854 (5.0%) |
| 45 to 54 Years | 234,472 (78.8%) | 10,551 (4.5%) |
| 55 to 59 Years | 102,543 (70.3%) | 5,230 (5.1%) |
| 60 to 64 Years | 72,346 (53.5%) | 4,341 (6.0%) |
| 65 to 74 Years | 48,146 (23.4%) | 3,178 (6.6%) |
| 75 Years and over | 9,358 (6.1%) | 870 (9.3%) |
| Total | 1,155,940 (60.7%) | 77,448 (6.7%) |
Employment Status by Educational Attainment in Riverside County
According to labor force statistics for Riverside County, 75.6% of individuals (933,538) out of the total population between 25 and 64 years of age (1,234,838) are in the labor force, with 5.5% or 51,345 of them being unemployed. The group with the highest labor force participation rate are those with the educational attainment of bachelor's degree or higher, with 83.5% or 239,976 individuals in the labor force. Within the labor force, individuals with less than high school education have the highest percentage of unemployment, with 7.6% or 9,856 of them being unemployed.
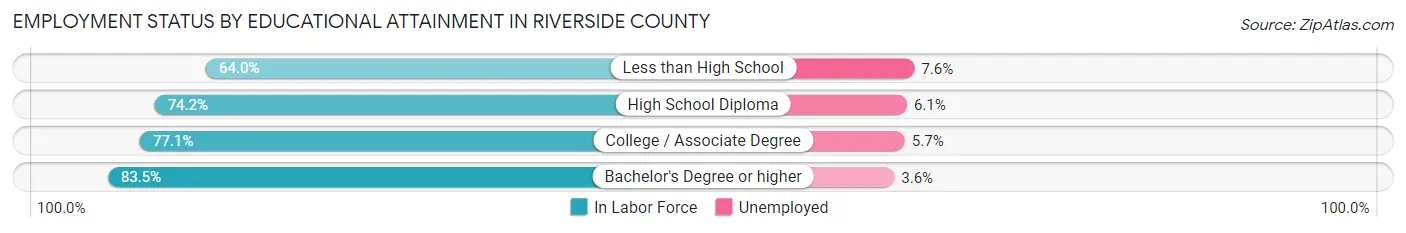
| Educational Attainment | In Labor Force | Unemployed |
| Less than High School | 129,680 (64.0%) | 15,400 (7.6%) |
| High School Diploma | 253,947 (74.2%) | 20,877 (6.1%) |
| College / Associate Degree | 310,382 (77.1%) | 22,947 (5.7%) |
| Bachelor's Degree or higher | 239,976 (83.5%) | 10,346 (3.6%) |
| Total | 933,538 (75.6%) | 67,916 (5.5%) |
Employment Occupations by Sex in Riverside County
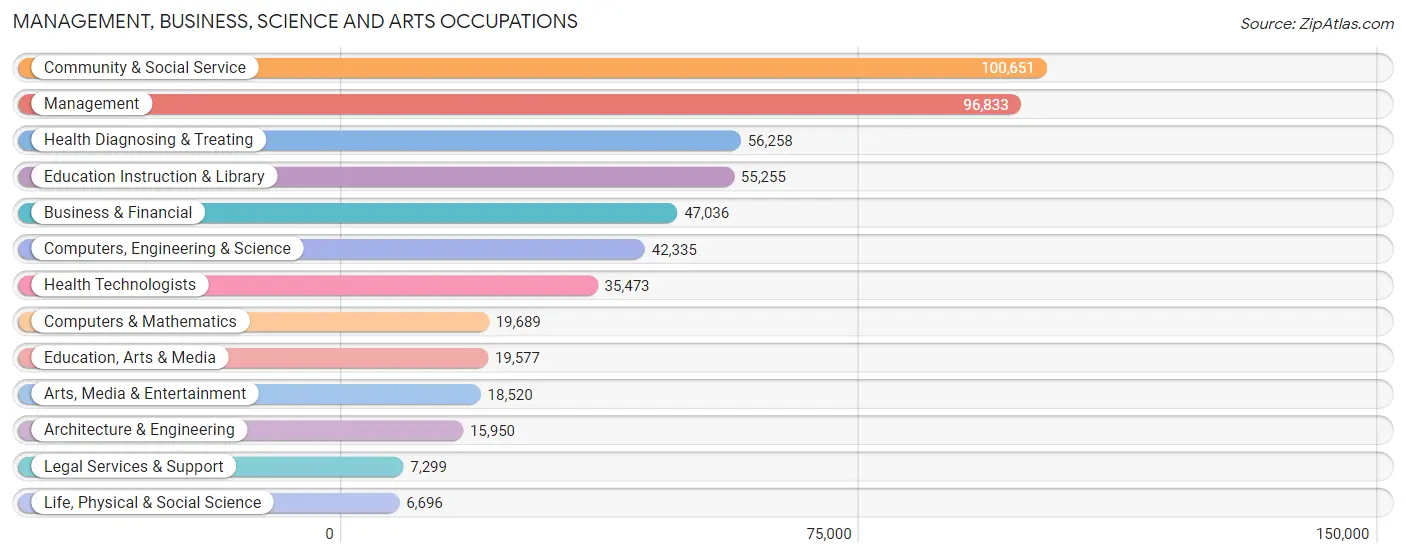
Management, Business, Science and Arts Occupations
The most common Management, Business, Science and Arts occupations in Riverside County are Community & Social Service (100,651 | 9.4%), Management (96,833 | 9.0%), Health Diagnosing & Treating (56,258 | 5.2%), Education Instruction & Library (55,255 | 5.1%), and Business & Financial (47,036 | 4.4%).
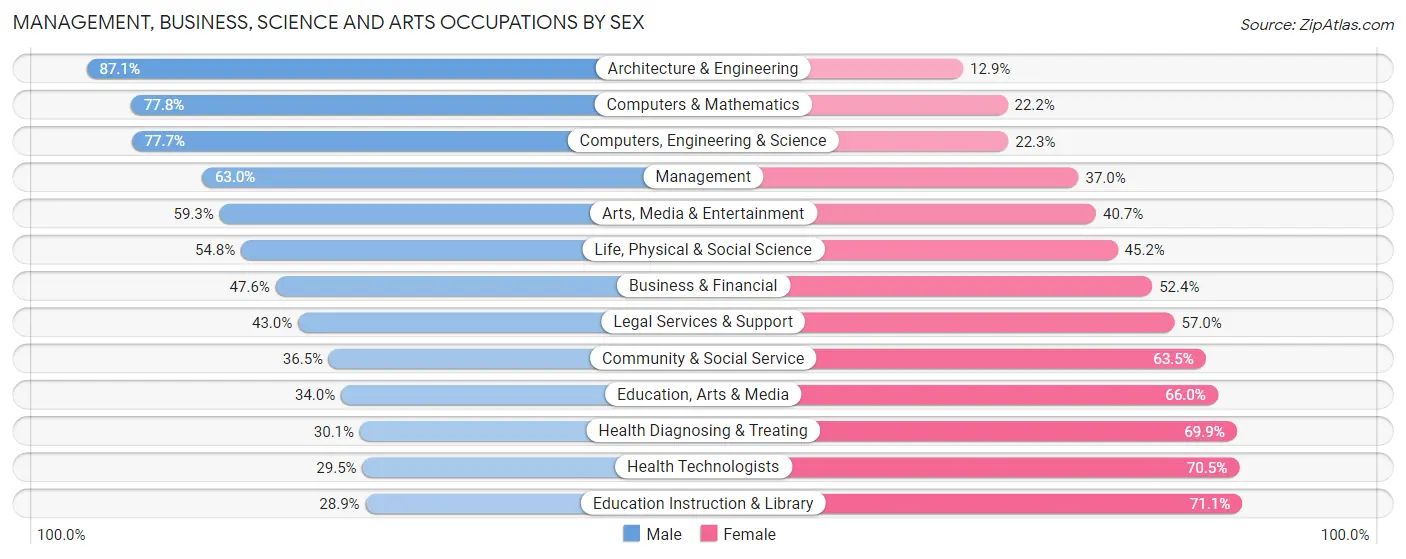
Management, Business, Science and Arts Occupations by Sex
Within the Management, Business, Science and Arts occupations in Riverside County, the most male-oriented occupations are Architecture & Engineering (87.1%), Computers & Mathematics (77.8%), and Computers, Engineering & Science (77.7%), while the most female-oriented occupations are Education Instruction & Library (71.1%), Health Technologists (70.5%), and Health Diagnosing & Treating (69.9%).
| Occupation | Male | Female |
| Management | 61,005 (63.0%) | 35,828 (37.0%) |
| Business & Financial | 22,402 (47.6%) | 24,634 (52.4%) |
| Computers, Engineering & Science | 32,879 (77.7%) | 9,456 (22.3%) |
| Computers & Mathematics | 15,320 (77.8%) | 4,369 (22.2%) |
| Architecture & Engineering | 13,887 (87.1%) | 2,063 (12.9%) |
| Life, Physical & Social Science | 3,672 (54.8%) | 3,024 (45.2%) |
| Community & Social Service | 36,755 (36.5%) | 63,896 (63.5%) |
| Education, Arts & Media | 6,655 (34.0%) | 12,922 (66.0%) |
| Legal Services & Support | 3,136 (43.0%) | 4,163 (57.0%) |
| Education Instruction & Library | 15,974 (28.9%) | 39,281 (71.1%) |
| Arts, Media & Entertainment | 10,990 (59.3%) | 7,530 (40.7%) |
| Health Diagnosing & Treating | 16,912 (30.1%) | 39,346 (69.9%) |
| Health Technologists | 10,474 (29.5%) | 24,999 (70.5%) |
| Total (Category) | 169,953 (49.5%) | 173,160 (50.5%) |
| Total (Overall) | 595,642 (55.5%) | 477,700 (44.5%) |
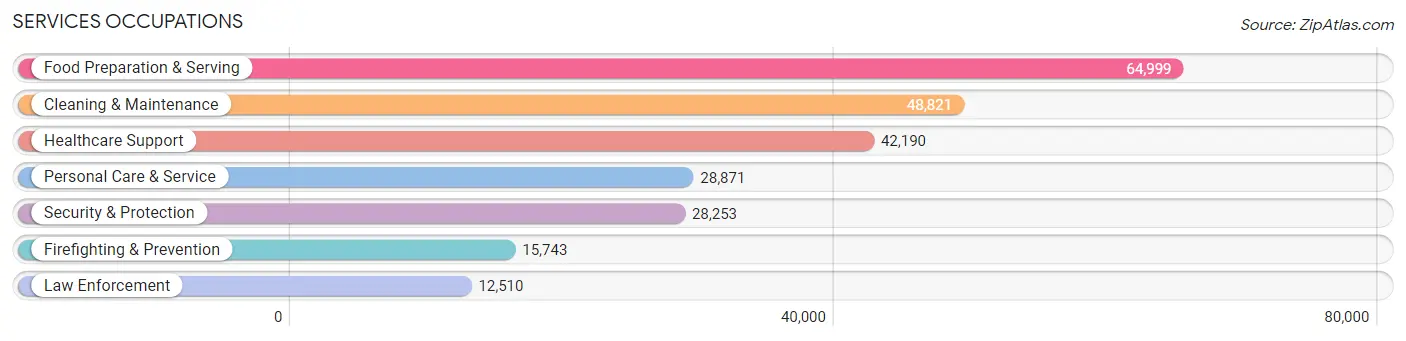
Services Occupations
The most common Services occupations in Riverside County are Food Preparation & Serving (64,999 | 6.1%), Cleaning & Maintenance (48,821 | 4.5%), Healthcare Support (42,190 | 3.9%), Personal Care & Service (28,871 | 2.7%), and Security & Protection (28,253 | 2.6%).
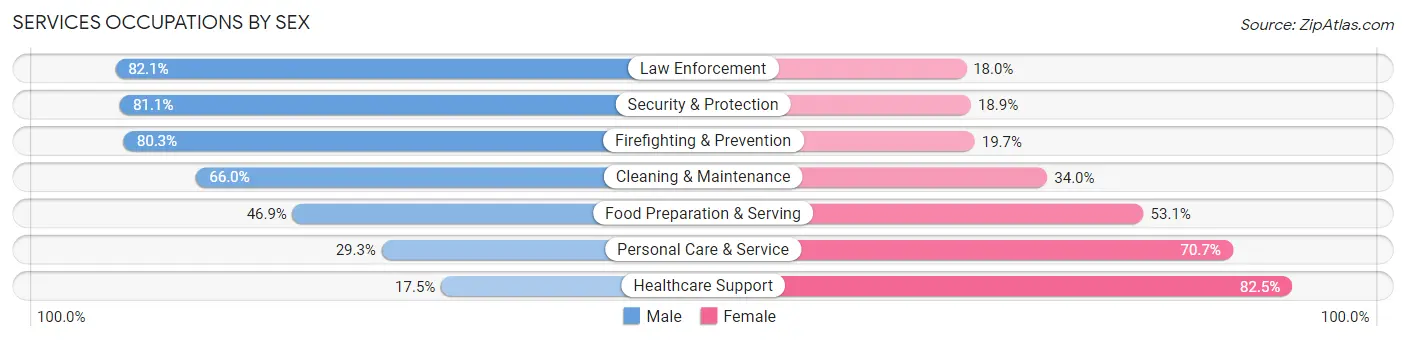
Services Occupations by Sex
Within the Services occupations in Riverside County, the most male-oriented occupations are Law Enforcement (82.1%), Security & Protection (81.1%), and Firefighting & Prevention (80.3%), while the most female-oriented occupations are Healthcare Support (82.5%), Personal Care & Service (70.7%), and Food Preparation & Serving (53.1%).
| Occupation | Male | Female |
| Healthcare Support | 7,386 (17.5%) | 34,804 (82.5%) |
| Security & Protection | 22,912 (81.1%) | 5,341 (18.9%) |
| Firefighting & Prevention | 12,648 (80.3%) | 3,095 (19.7%) |
| Law Enforcement | 10,264 (82.1%) | 2,246 (17.9%) |
| Food Preparation & Serving | 30,489 (46.9%) | 34,510 (53.1%) |
| Cleaning & Maintenance | 32,213 (66.0%) | 16,608 (34.0%) |
| Personal Care & Service | 8,456 (29.3%) | 20,415 (70.7%) |
| Total (Category) | 101,456 (47.6%) | 111,678 (52.4%) |
| Total (Overall) | 595,642 (55.5%) | 477,700 (44.5%) |
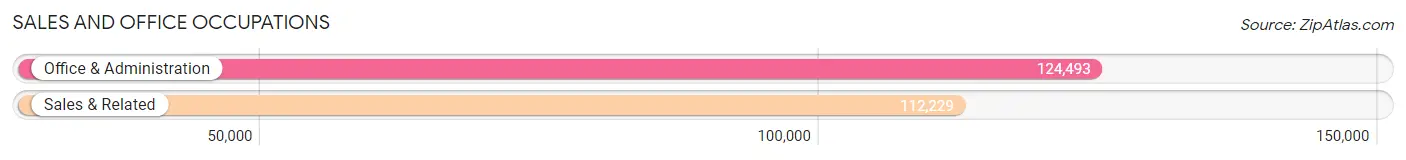
Sales and Office Occupations
The most common Sales and Office occupations in Riverside County are Office & Administration (124,493 | 11.6%), and Sales & Related (112,229 | 10.5%).
Sales and Office Occupations by Sex
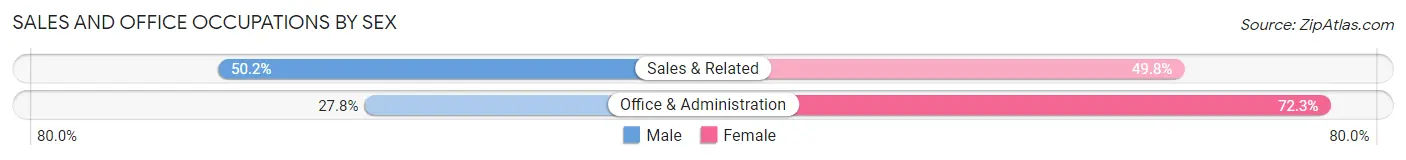
| Occupation | Male | Female |
| Sales & Related | 56,361 (50.2%) | 55,868 (49.8%) |
| Office & Administration | 34,546 (27.8%) | 89,947 (72.3%) |
| Total (Category) | 90,907 (38.4%) | 145,815 (61.6%) |
| Total (Overall) | 595,642 (55.5%) | 477,700 (44.5%) |
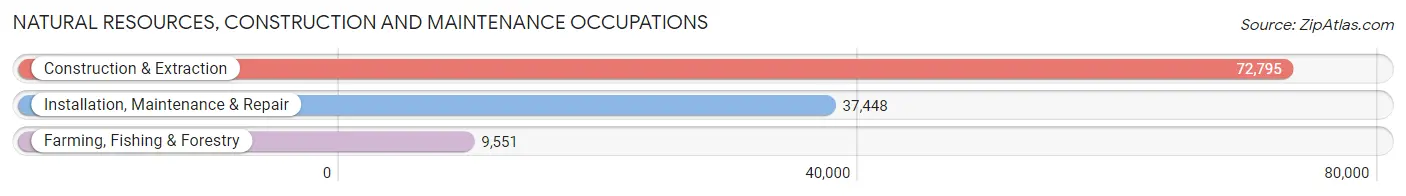
Natural Resources, Construction and Maintenance Occupations
The most common Natural Resources, Construction and Maintenance occupations in Riverside County are Construction & Extraction (72,795 | 6.8%), Installation, Maintenance & Repair (37,448 | 3.5%), and Farming, Fishing & Forestry (9,551 | 0.9%).
Natural Resources, Construction and Maintenance Occupations by Sex
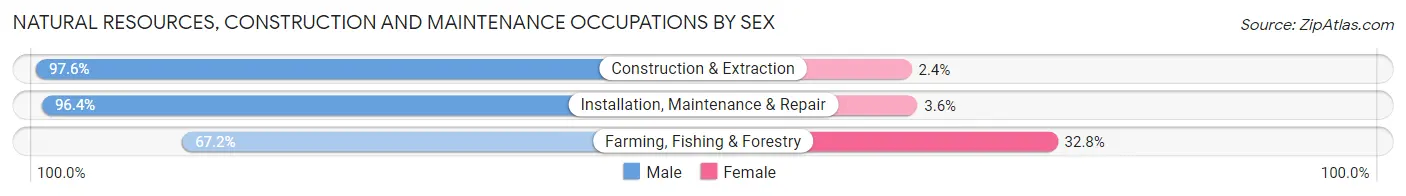
| Occupation | Male | Female |
| Farming, Fishing & Forestry | 6,417 (67.2%) | 3,134 (32.8%) |
| Construction & Extraction | 71,041 (97.6%) | 1,754 (2.4%) |
| Installation, Maintenance & Repair | 36,092 (96.4%) | 1,356 (3.6%) |
| Total (Category) | 113,550 (94.8%) | 6,244 (5.2%) |
| Total (Overall) | 595,642 (55.5%) | 477,700 (44.5%) |
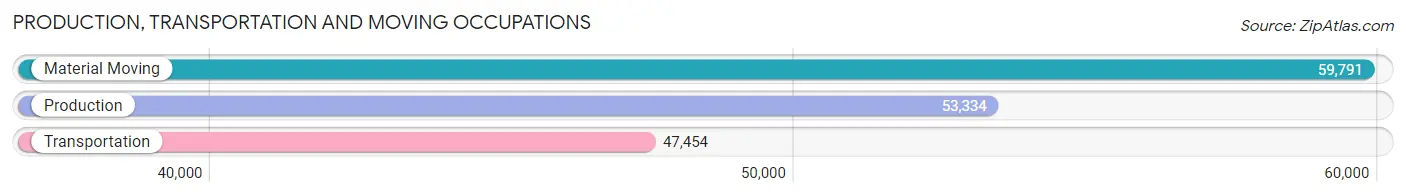
Production, Transportation and Moving Occupations
The most common Production, Transportation and Moving occupations in Riverside County are Material Moving (59,791 | 5.6%), Production (53,334 | 5.0%), and Transportation (47,454 | 4.4%).
Production, Transportation and Moving Occupations by Sex
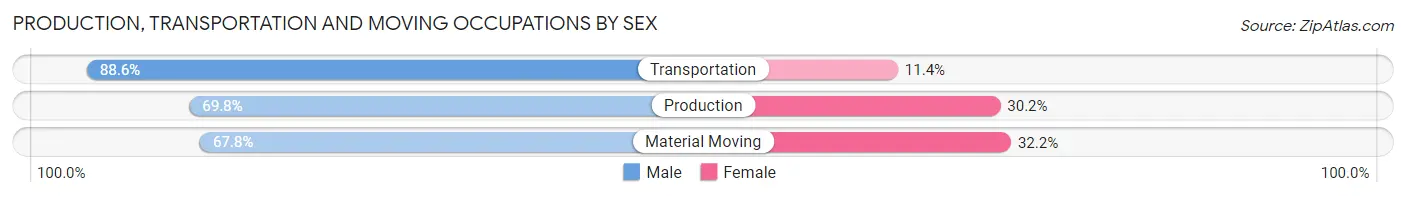
| Occupation | Male | Female |
| Production | 37,204 (69.8%) | 16,130 (30.2%) |
| Transportation | 42,027 (88.6%) | 5,427 (11.4%) |
| Material Moving | 40,545 (67.8%) | 19,246 (32.2%) |
| Total (Category) | 119,776 (74.6%) | 40,803 (25.4%) |
| Total (Overall) | 595,642 (55.5%) | 477,700 (44.5%) |
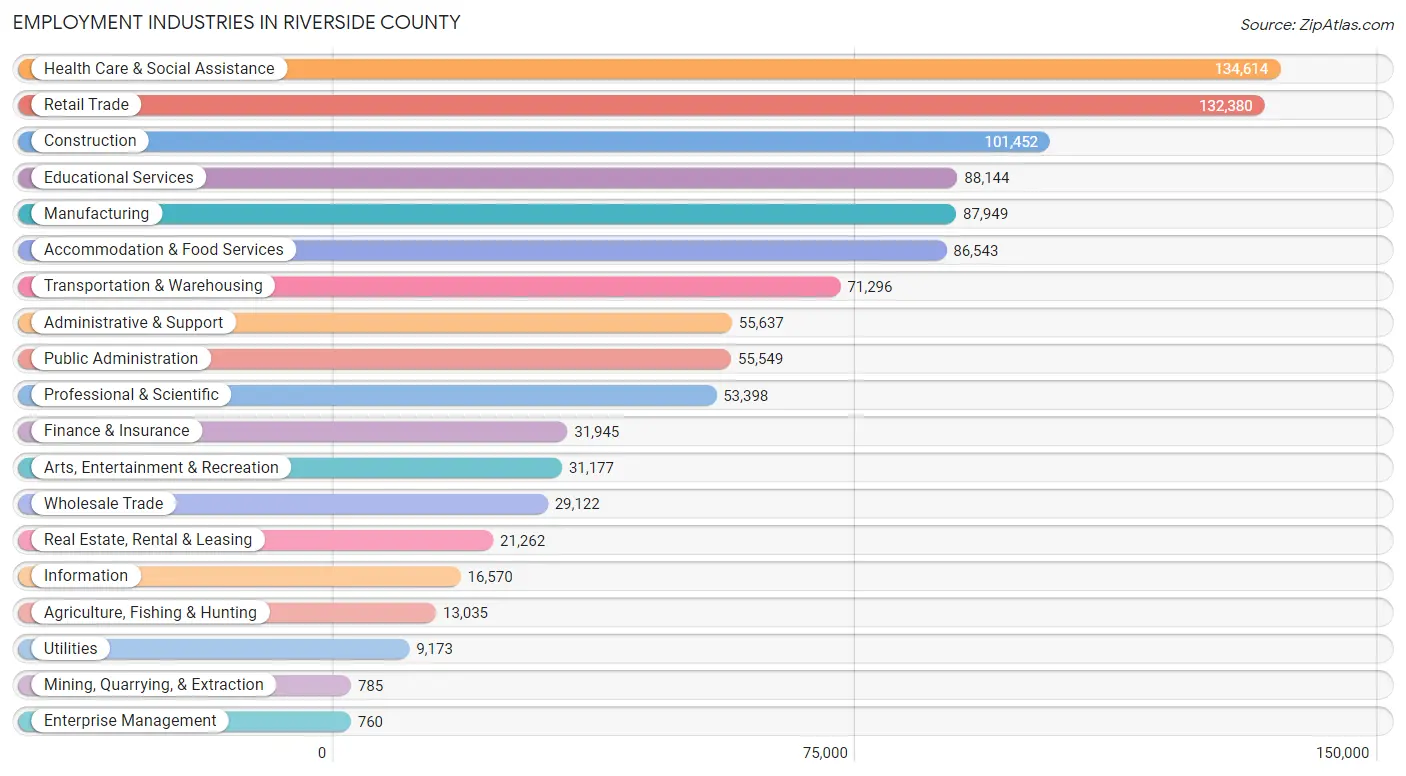
Employment Industries by Sex in Riverside County
Employment Industries in Riverside County
The major employment industries in Riverside County include Health Care & Social Assistance (134,614 | 12.5%), Retail Trade (132,380 | 12.3%), Construction (101,452 | 9.5%), Educational Services (88,144 | 8.2%), and Manufacturing (87,949 | 8.2%).
Employment Industries by Sex in Riverside County
The Riverside County industries that see more men than women are Construction (91.0%), Mining, Quarrying, & Extraction (85.4%), and Utilities (77.6%), whereas the industries that tend to have a higher number of women are Health Care & Social Assistance (75.3%), Educational Services (68.6%), and Finance & Insurance (58.8%).
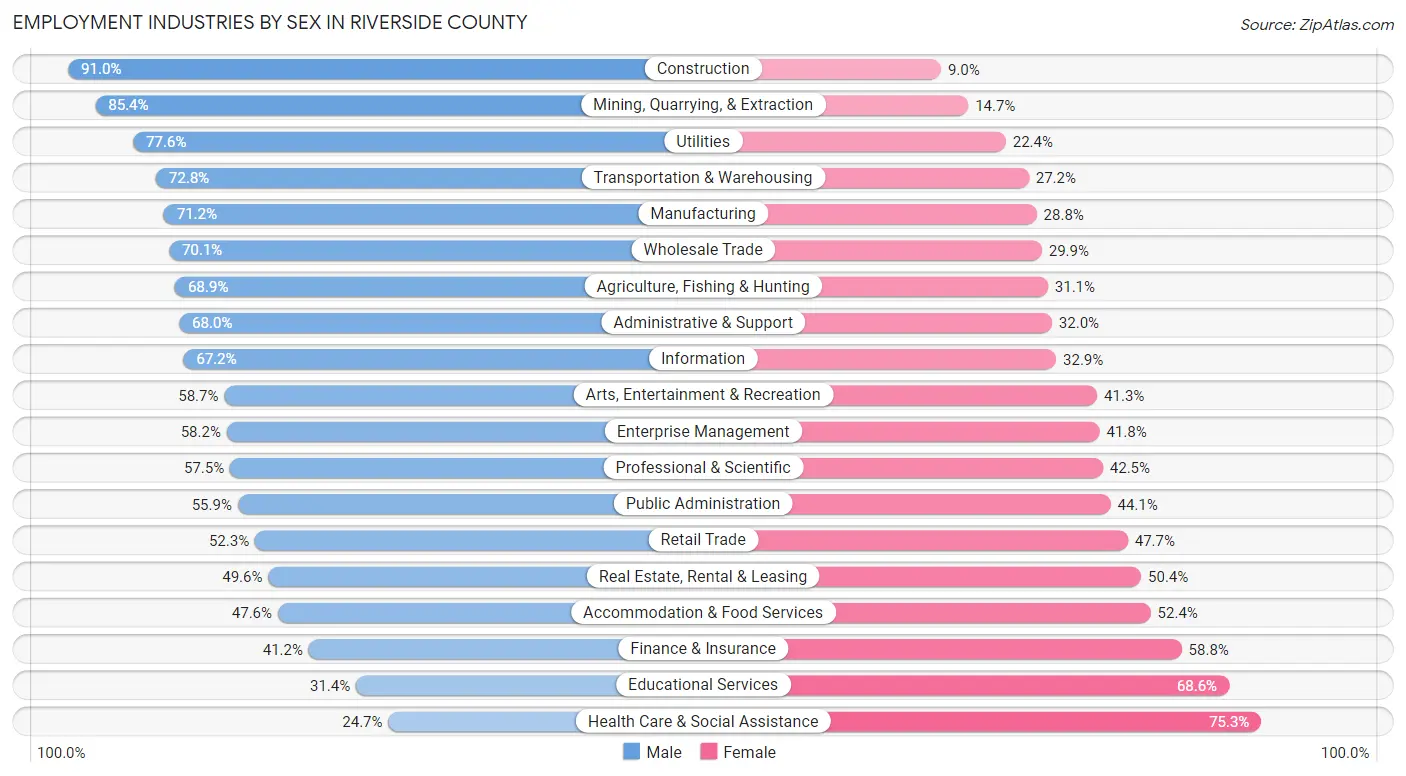
| Industry | Male | Female |
| Agriculture, Fishing & Hunting | 8,976 (68.9%) | 4,059 (31.1%) |
| Mining, Quarrying, & Extraction | 670 (85.4%) | 115 (14.6%) |
| Construction | 92,296 (91.0%) | 9,156 (9.0%) |
| Manufacturing | 62,601 (71.2%) | 25,348 (28.8%) |
| Wholesale Trade | 20,419 (70.1%) | 8,703 (29.9%) |
| Retail Trade | 69,243 (52.3%) | 63,137 (47.7%) |
| Transportation & Warehousing | 51,910 (72.8%) | 19,386 (27.2%) |
| Utilities | 7,115 (77.6%) | 2,058 (22.4%) |
| Information | 11,126 (67.1%) | 5,444 (32.9%) |
| Finance & Insurance | 13,151 (41.2%) | 18,794 (58.8%) |
| Real Estate, Rental & Leasing | 10,538 (49.6%) | 10,724 (50.4%) |
| Professional & Scientific | 30,692 (57.5%) | 22,706 (42.5%) |
| Enterprise Management | 442 (58.2%) | 318 (41.8%) |
| Administrative & Support | 37,844 (68.0%) | 17,793 (32.0%) |
| Educational Services | 27,671 (31.4%) | 60,473 (68.6%) |
| Health Care & Social Assistance | 33,261 (24.7%) | 101,353 (75.3%) |
| Arts, Entertainment & Recreation | 18,287 (58.7%) | 12,890 (41.3%) |
| Accommodation & Food Services | 41,181 (47.6%) | 45,362 (52.4%) |
| Public Administration | 31,040 (55.9%) | 24,509 (44.1%) |
| Total | 595,642 (55.5%) | 477,700 (44.5%) |
Education in Riverside County
School Enrollment in Riverside County
The most common levels of schooling among the 652,316 students in Riverside County are college / undergraduate (152,903 | 23.4%), high school (149,890 | 23.0%), and middle school (138,973 | 21.3%).
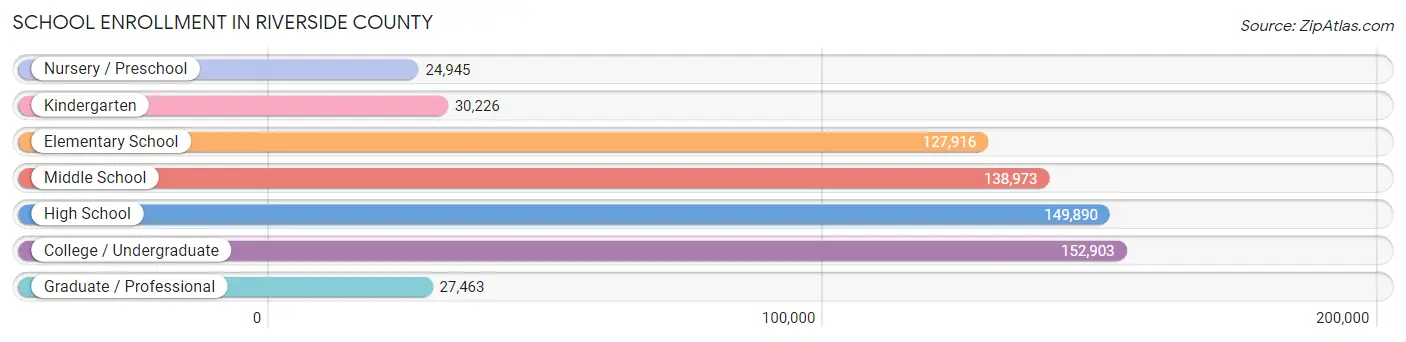
| School Level | # Students | % Students |
| Nursery / Preschool | 24,945 | 3.8% |
| Kindergarten | 30,226 | 4.6% |
| Elementary School | 127,916 | 19.6% |
| Middle School | 138,973 | 21.3% |
| High School | 149,890 | 23.0% |
| College / Undergraduate | 152,903 | 23.4% |
| Graduate / Professional | 27,463 | 4.2% |
| Total | 652,316 | 100.0% |
School Enrollment by Age by Funding Source in Riverside County
Out of a total of 652,316 students who are enrolled in schools in Riverside County, 78,930 (12.1%) attend a private institution, while the remaining 573,386 (87.9%) are enrolled in public schools. The age group of 3 to 4 year olds has the highest likelihood of being enrolled in private schools, with 7,235 (38.3% in the age bracket) enrolled. Conversely, the age group of 15 to 17 year olds has the lowest likelihood of being enrolled in a private school, with 99,601 (94.8% in the age bracket) attending a public institution.
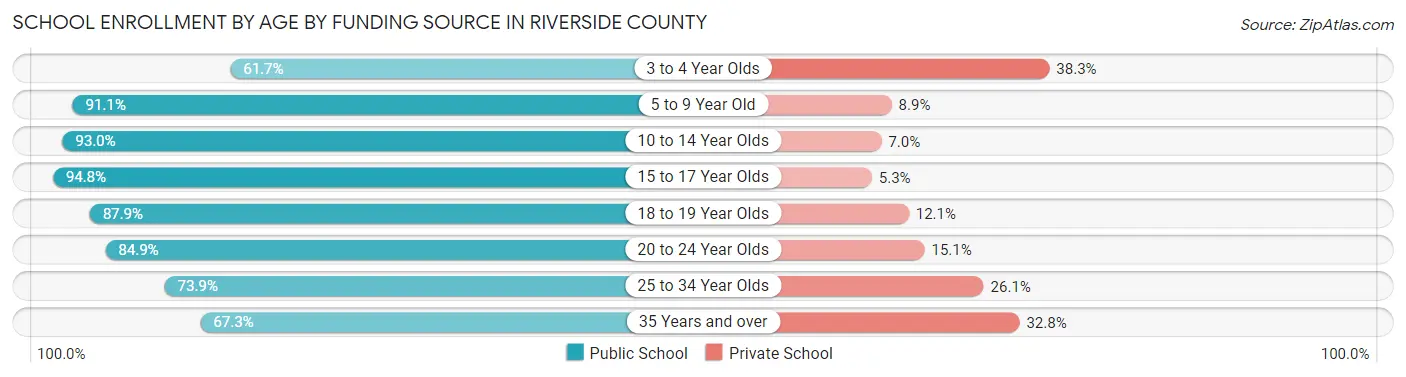
| Age Bracket | Public School | Private School |
| 3 to 4 Year Olds | 11,645 (61.7%) | 7,235 (38.3%) |
| 5 to 9 Year Old | 136,933 (91.1%) | 13,438 (8.9%) |
| 10 to 14 Year Olds | 165,380 (93.0%) | 12,525 (7.0%) |
| 15 to 17 Year Olds | 99,601 (94.8%) | 5,520 (5.2%) |
| 18 to 19 Year Olds | 42,715 (87.9%) | 5,898 (12.1%) |
| 20 to 24 Year Olds | 58,316 (84.9%) | 10,340 (15.1%) |
| 25 to 34 Year Olds | 33,489 (73.9%) | 11,810 (26.1%) |
| 35 Years and over | 25,201 (67.2%) | 12,270 (32.8%) |
| Total | 573,386 (87.9%) | 78,930 (12.1%) |
Educational Attainment by Field of Study in Riverside County
Business (83,749 | 20.6%), science & technology (41,129 | 10.1%), social sciences (37,220 | 9.1%), education (35,823 | 8.8%), and arts & humanities (29,524 | 7.3%) are the most common fields of study among 406,741 individuals in Riverside County who have obtained a bachelor's degree or higher.
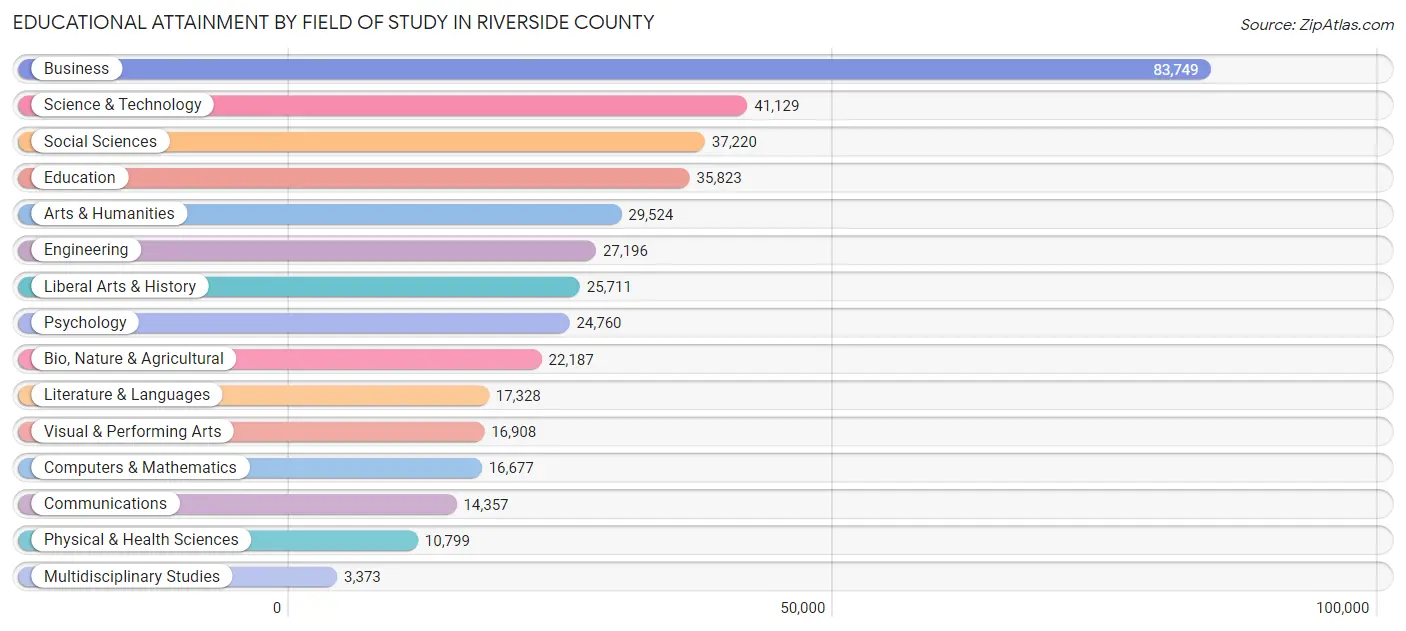
| Field of Study | # Graduates | % Graduates |
| Computers & Mathematics | 16,677 | 4.1% |
| Bio, Nature & Agricultural | 22,187 | 5.4% |
| Physical & Health Sciences | 10,799 | 2.7% |
| Psychology | 24,760 | 6.1% |
| Social Sciences | 37,220 | 9.1% |
| Engineering | 27,196 | 6.7% |
| Multidisciplinary Studies | 3,373 | 0.8% |
| Science & Technology | 41,129 | 10.1% |
| Business | 83,749 | 20.6% |
| Education | 35,823 | 8.8% |
| Literature & Languages | 17,328 | 4.3% |
| Liberal Arts & History | 25,711 | 6.3% |
| Visual & Performing Arts | 16,908 | 4.2% |
| Communications | 14,357 | 3.5% |
| Arts & Humanities | 29,524 | 7.3% |
| Total | 406,741 | 100.0% |
Transportation & Commute in Riverside County
Vehicle Availability by Sex in Riverside County
The most prevalent vehicle ownership categories in Riverside County are males with 2 vehicles (198,837, accounting for 34.0%) and females with 2 vehicles (151,842, making up 43.5%).
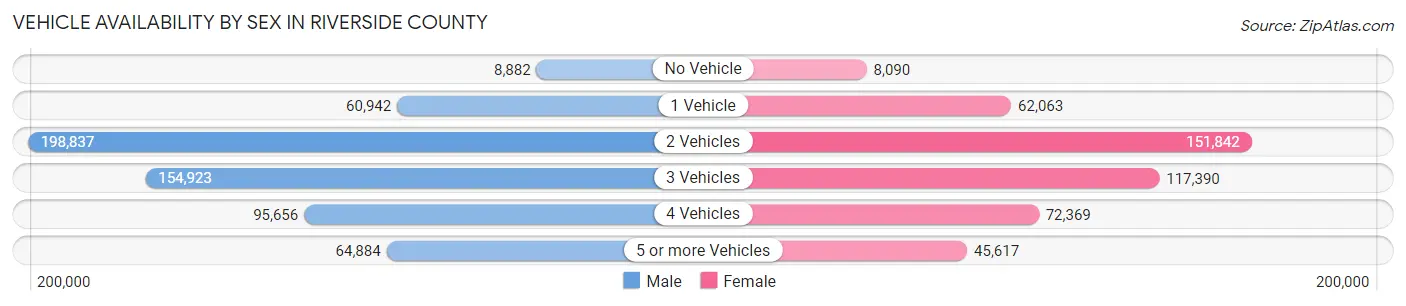
| Vehicles Available | Male | Female |
| No Vehicle | 8,882 (1.5%) | 8,090 (1.8%) |
| 1 Vehicle | 60,942 (10.4%) | 62,063 (13.6%) |
| 2 Vehicles | 198,837 (34.0%) | 151,842 (33.2%) |
| 3 Vehicles | 154,923 (26.5%) | 117,390 (25.7%) |
| 4 Vehicles | 95,656 (16.4%) | 72,369 (15.8%) |
| 5 or more Vehicles | 64,884 (11.1%) | 45,617 (10.0%) |
| Total | 584,124 (100.0%) | 457,371 (100.0%) |
Commute Time in Riverside County
The most frequently occuring commute durations in Riverside County are 30 to 34 minutes (133,261 commuters, 14.0%), 15 to 19 minutes (127,390 commuters, 13.4%), and 20 to 24 minutes (121,299 commuters, 12.8%).
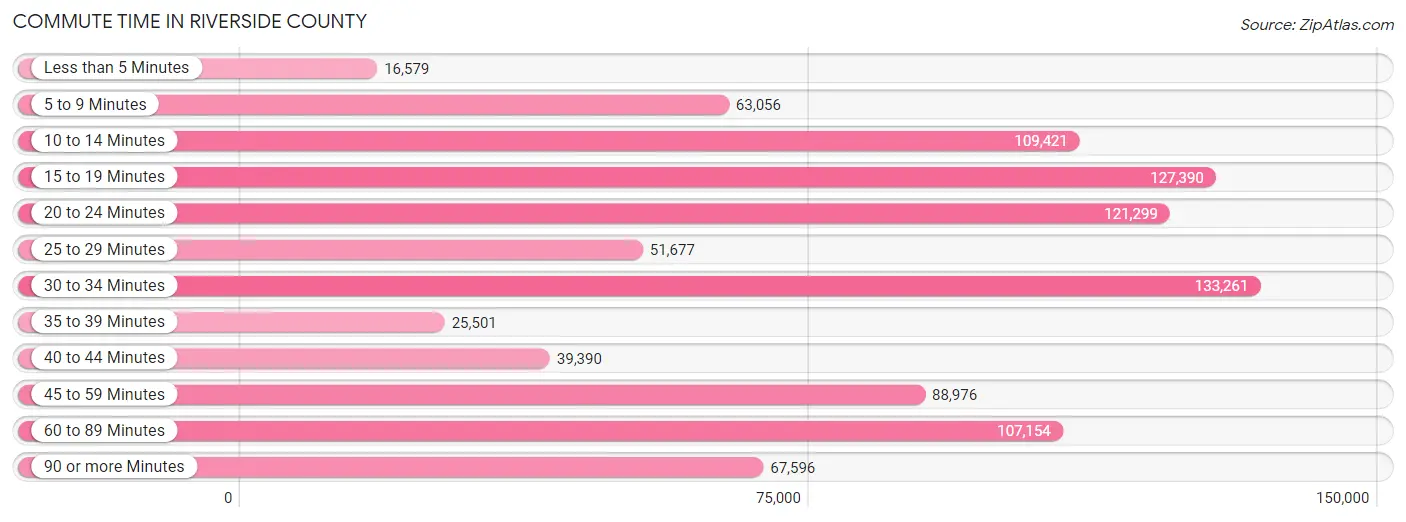
| Commute Time | # Commuters | % Commuters |
| Less than 5 Minutes | 16,579 | 1.7% |
| 5 to 9 Minutes | 63,056 | 6.6% |
| 10 to 14 Minutes | 109,421 | 11.5% |
| 15 to 19 Minutes | 127,390 | 13.4% |
| 20 to 24 Minutes | 121,299 | 12.8% |
| 25 to 29 Minutes | 51,677 | 5.4% |
| 30 to 34 Minutes | 133,261 | 14.0% |
| 35 to 39 Minutes | 25,501 | 2.7% |
| 40 to 44 Minutes | 39,390 | 4.1% |
| 45 to 59 Minutes | 88,976 | 9.3% |
| 60 to 89 Minutes | 107,154 | 11.3% |
| 90 or more Minutes | 67,596 | 7.1% |
Commute Time by Sex in Riverside County
The most common commute times in Riverside County are 30 to 34 minutes (78,670 commuters, 14.6%) for males and 15 to 19 minutes (63,776 commuters, 15.5%) for females.
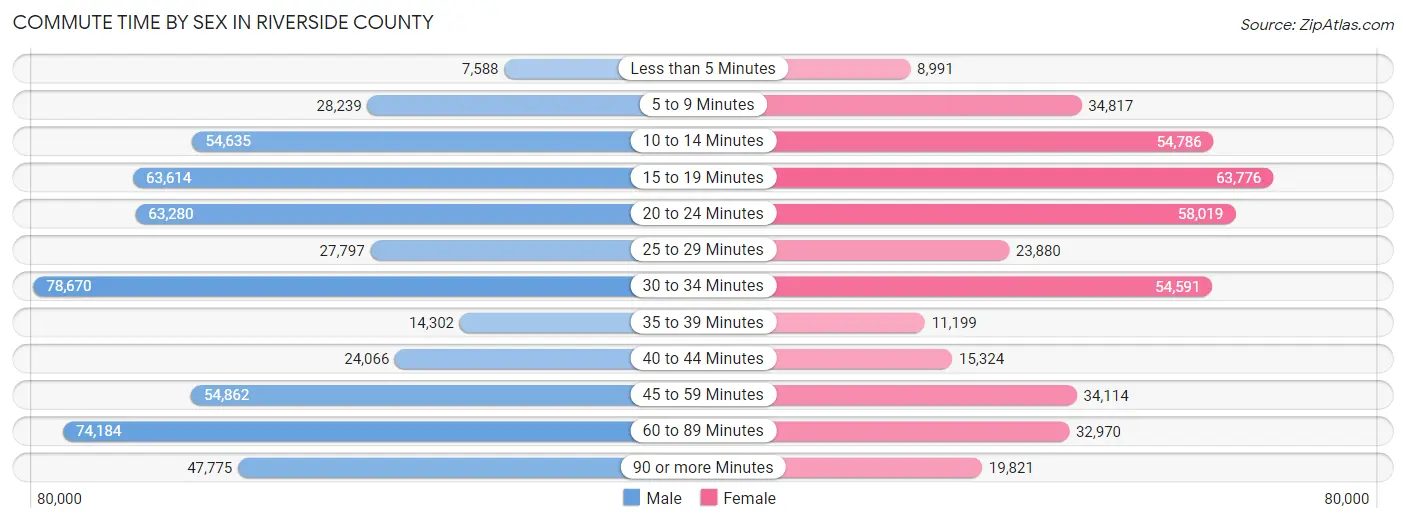
| Commute Time | Male | Female |
| Less than 5 Minutes | 7,588 (1.4%) | 8,991 (2.2%) |
| 5 to 9 Minutes | 28,239 (5.2%) | 34,817 (8.4%) |
| 10 to 14 Minutes | 54,635 (10.1%) | 54,786 (13.3%) |
| 15 to 19 Minutes | 63,614 (11.8%) | 63,776 (15.5%) |
| 20 to 24 Minutes | 63,280 (11.7%) | 58,019 (14.1%) |
| 25 to 29 Minutes | 27,797 (5.2%) | 23,880 (5.8%) |
| 30 to 34 Minutes | 78,670 (14.6%) | 54,591 (13.2%) |
| 35 to 39 Minutes | 14,302 (2.6%) | 11,199 (2.7%) |
| 40 to 44 Minutes | 24,066 (4.5%) | 15,324 (3.7%) |
| 45 to 59 Minutes | 54,862 (10.2%) | 34,114 (8.3%) |
| 60 to 89 Minutes | 74,184 (13.8%) | 32,970 (8.0%) |
| 90 or more Minutes | 47,775 (8.9%) | 19,821 (4.8%) |
Time of Departure to Work by Sex in Riverside County
The most frequent times of departure to work in Riverside County are 12:00 AM to 4:59 AM (86,139, 16.0%) for males and 7:00 AM to 7:29 AM (63,308, 15.4%) for females.
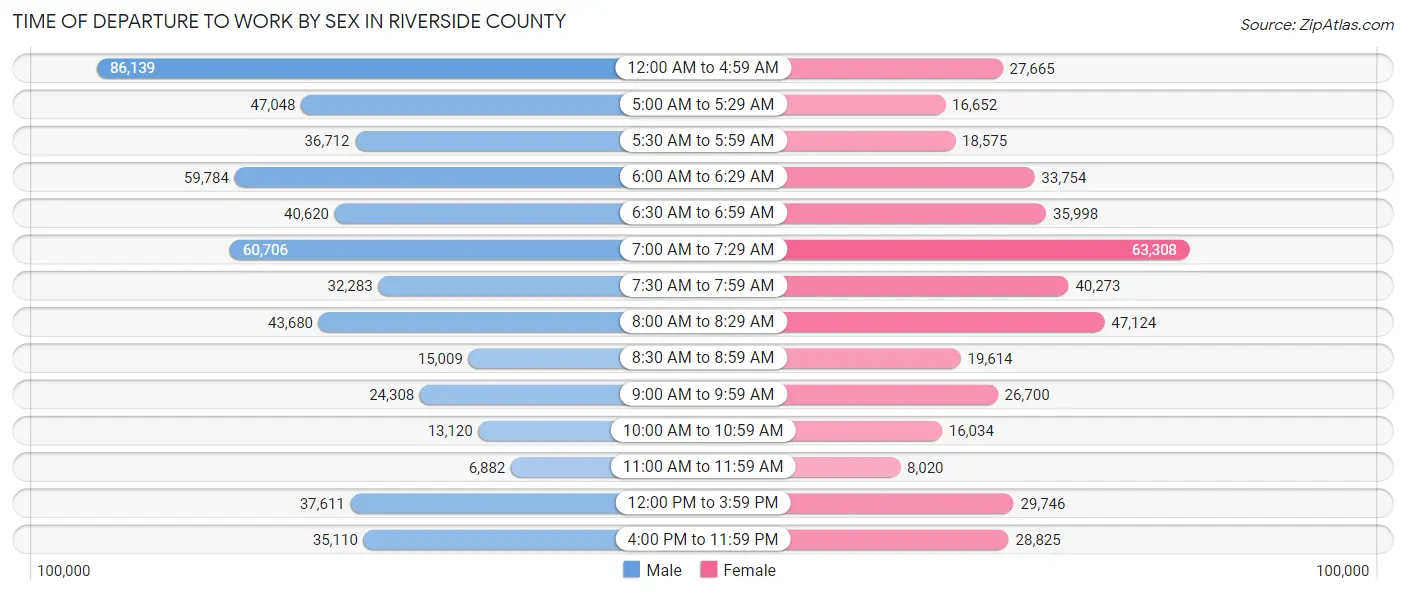
| Time of Departure | Male | Female |
| 12:00 AM to 4:59 AM | 86,139 (16.0%) | 27,665 (6.7%) |
| 5:00 AM to 5:29 AM | 47,048 (8.7%) | 16,652 (4.0%) |
| 5:30 AM to 5:59 AM | 36,712 (6.8%) | 18,575 (4.5%) |
| 6:00 AM to 6:29 AM | 59,784 (11.1%) | 33,754 (8.2%) |
| 6:30 AM to 6:59 AM | 40,620 (7.5%) | 35,998 (8.7%) |
| 7:00 AM to 7:29 AM | 60,706 (11.3%) | 63,308 (15.4%) |
| 7:30 AM to 7:59 AM | 32,283 (6.0%) | 40,273 (9.8%) |
| 8:00 AM to 8:29 AM | 43,680 (8.1%) | 47,124 (11.4%) |
| 8:30 AM to 8:59 AM | 15,009 (2.8%) | 19,614 (4.8%) |
| 9:00 AM to 9:59 AM | 24,308 (4.5%) | 26,700 (6.5%) |
| 10:00 AM to 10:59 AM | 13,120 (2.4%) | 16,034 (3.9%) |
| 11:00 AM to 11:59 AM | 6,882 (1.3%) | 8,020 (1.9%) |
| 12:00 PM to 3:59 PM | 37,611 (7.0%) | 29,746 (7.2%) |
| 4:00 PM to 11:59 PM | 35,110 (6.5%) | 28,825 (7.0%) |
| Total | 539,012 (100.0%) | 412,288 (100.0%) |
Housing Occupancy in Riverside County
Occupancy by Ownership in Riverside County
Of the total 749,976 dwellings in Riverside County, owner-occupied units account for 513,821 (68.5%), while renter-occupied units make up 236,155 (31.5%).
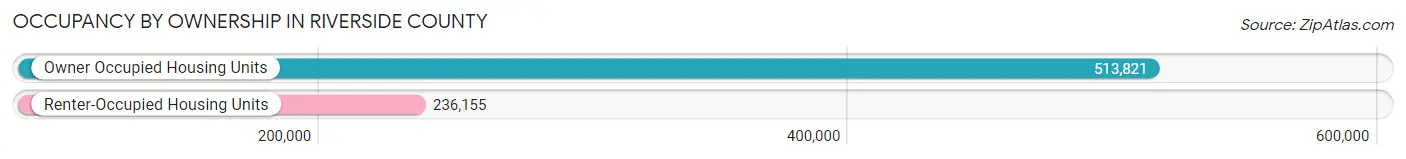
| Occupancy | # Housing Units | % Housing Units |
| Owner Occupied Housing Units | 513,821 | 68.5% |
| Renter-Occupied Housing Units | 236,155 | 31.5% |
| Total Occupied Housing Units | 749,976 | 100.0% |
Occupancy by Household Size in Riverside County
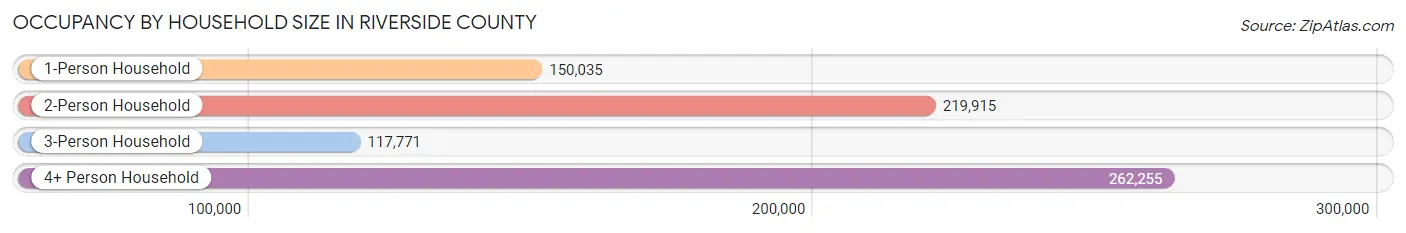
| Household Size | # Housing Units | % Housing Units |
| 1-Person Household | 150,035 | 20.0% |
| 2-Person Household | 219,915 | 29.3% |
| 3-Person Household | 117,771 | 15.7% |
| 4+ Person Household | 262,255 | 35.0% |
| Total Housing Units | 749,976 | 100.0% |
Occupancy by Ownership by Household Size in Riverside County
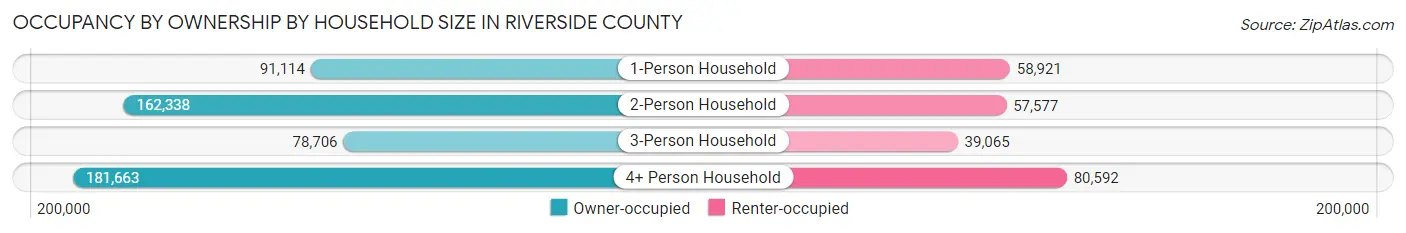
| Household Size | Owner-occupied | Renter-occupied |
| 1-Person Household | 91,114 (60.7%) | 58,921 (39.3%) |
| 2-Person Household | 162,338 (73.8%) | 57,577 (26.2%) |
| 3-Person Household | 78,706 (66.8%) | 39,065 (33.2%) |
| 4+ Person Household | 181,663 (69.3%) | 80,592 (30.7%) |
| Total Housing Units | 513,821 (68.5%) | 236,155 (31.5%) |
Occupancy by Educational Attainment in Riverside County
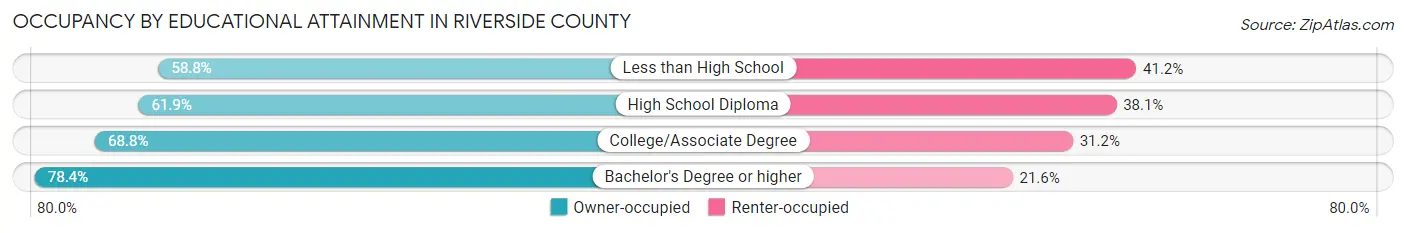
| Household Size | Owner-occupied | Renter-occupied |
| Less than High School | 62,505 (58.8%) | 43,846 (41.2%) |
| High School Diploma | 105,472 (61.9%) | 64,839 (38.1%) |
| College/Associate Degree | 180,943 (68.8%) | 81,961 (31.2%) |
| Bachelor's Degree or higher | 164,901 (78.4%) | 45,509 (21.6%) |
Occupancy by Age of Householder in Riverside County
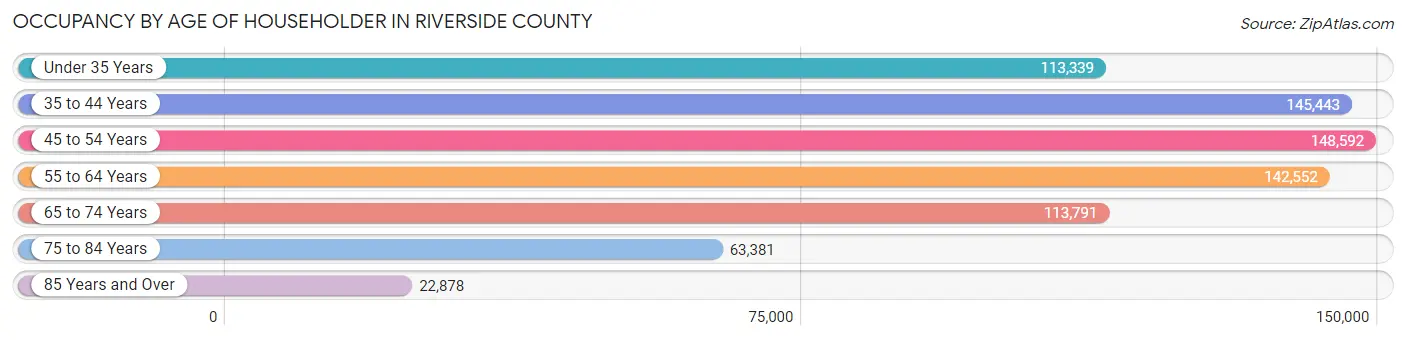
| Age Bracket | # Households | % Households |
| Under 35 Years | 113,339 | 15.1% |
| 35 to 44 Years | 145,443 | 19.4% |
| 45 to 54 Years | 148,592 | 19.8% |
| 55 to 64 Years | 142,552 | 19.0% |
| 65 to 74 Years | 113,791 | 15.2% |
| 75 to 84 Years | 63,381 | 8.5% |
| 85 Years and Over | 22,878 | 3.0% |
| Total | 749,976 | 100.0% |
Housing Finances in Riverside County
Median Income by Occupancy in Riverside County
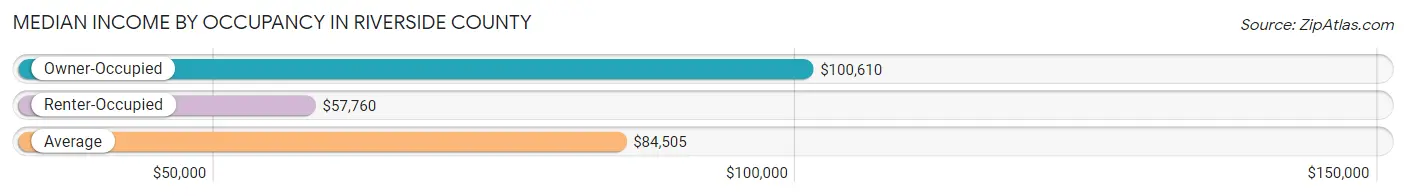
| Occupancy Type | # Households | Median Income |
| Owner-Occupied | 513,821 (68.5%) | $100,610 |
| Renter-Occupied | 236,155 (31.5%) | $57,760 |
| Average | 749,976 (100.0%) | $84,505 |
Occupancy by Householder Income Bracket in Riverside County
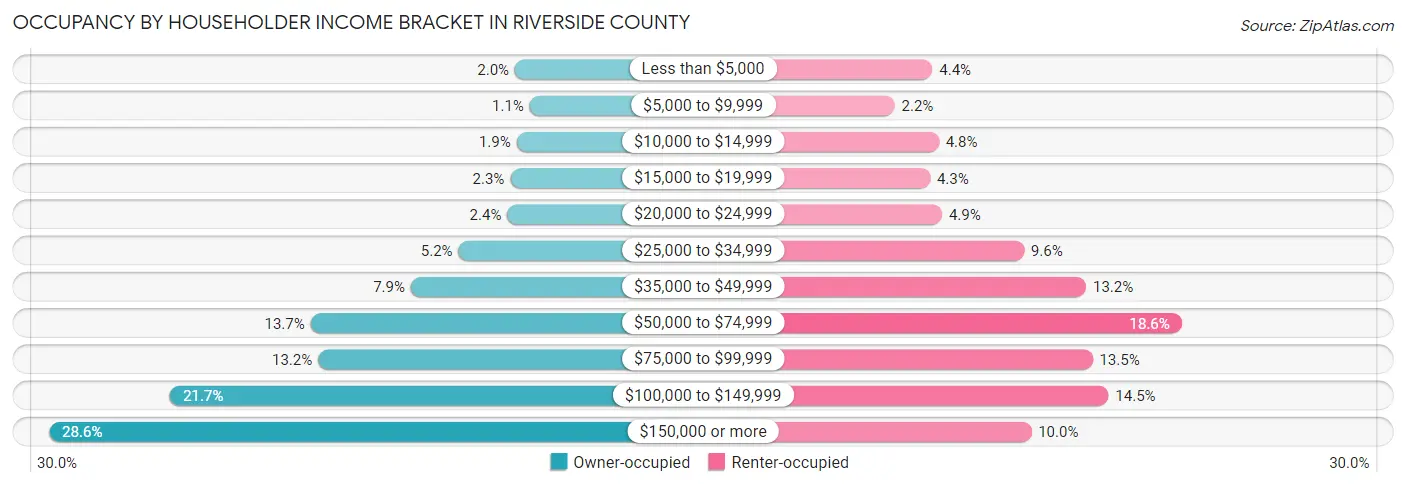
| Income Bracket | Owner-occupied | Renter-occupied |
| Less than $5,000 | 10,181 (2.0%) | 10,379 (4.4%) |
| $5,000 to $9,999 | 5,880 (1.1%) | 5,263 (2.2%) |
| $10,000 to $14,999 | 9,693 (1.9%) | 11,216 (4.8%) |
| $15,000 to $19,999 | 11,541 (2.2%) | 10,032 (4.3%) |
| $20,000 to $24,999 | 12,420 (2.4%) | 11,674 (4.9%) |
| $25,000 to $34,999 | 26,790 (5.2%) | 22,721 (9.6%) |
| $35,000 to $49,999 | 40,728 (7.9%) | 31,096 (13.2%) |
| $50,000 to $74,999 | 70,179 (13.7%) | 43,985 (18.6%) |
| $75,000 to $99,999 | 67,999 (13.2%) | 31,966 (13.5%) |
| $100,000 to $149,999 | 111,462 (21.7%) | 34,124 (14.4%) |
| $150,000 or more | 146,948 (28.6%) | 23,699 (10.0%) |
| Total | 513,821 (100.0%) | 236,155 (100.0%) |
Monthly Housing Cost Tiers in Riverside County
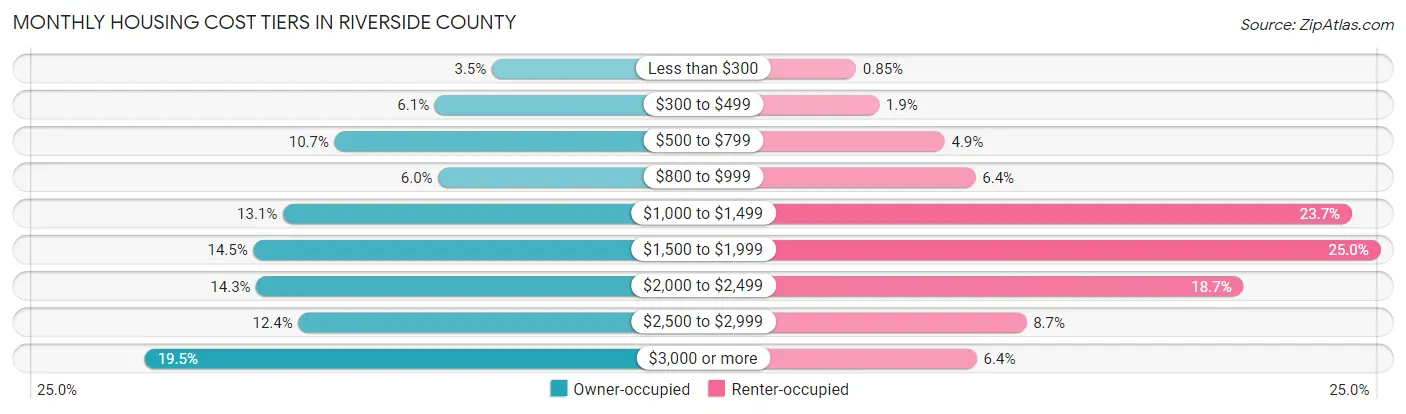
| Monthly Cost | Owner-occupied | Renter-occupied |
| Less than $300 | 17,866 (3.5%) | 2,014 (0.9%) |
| $300 to $499 | 31,389 (6.1%) | 4,511 (1.9%) |
| $500 to $799 | 55,070 (10.7%) | 11,650 (4.9%) |
| $800 to $999 | 30,551 (5.9%) | 14,996 (6.4%) |
| $1,000 to $1,499 | 67,310 (13.1%) | 55,922 (23.7%) |
| $1,500 to $1,999 | 74,302 (14.5%) | 59,036 (25.0%) |
| $2,000 to $2,499 | 73,624 (14.3%) | 44,146 (18.7%) |
| $2,500 to $2,999 | 63,688 (12.4%) | 20,517 (8.7%) |
| $3,000 or more | 100,021 (19.5%) | 15,135 (6.4%) |
| Total | 513,821 (100.0%) | 236,155 (100.0%) |
Physical Housing Characteristics in Riverside County
Housing Structures in Riverside County
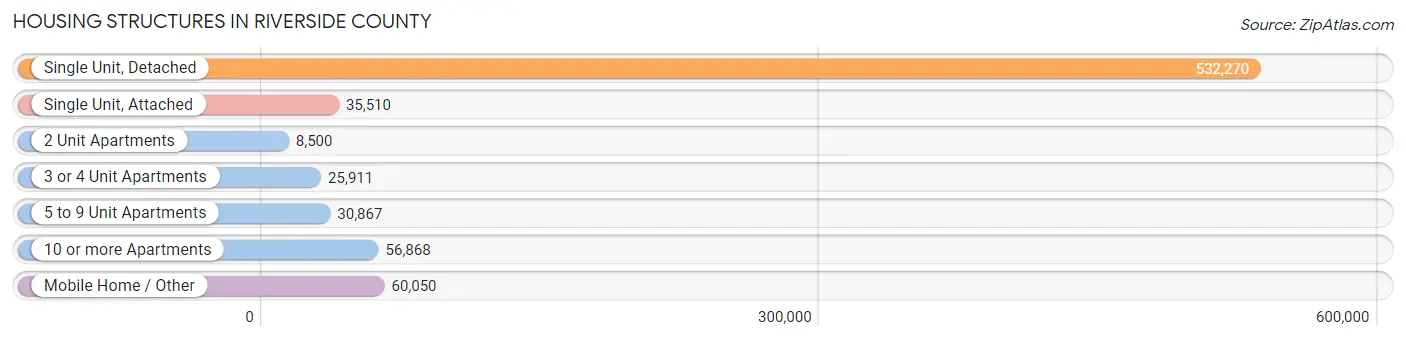
| Structure Type | # Housing Units | % Housing Units |
| Single Unit, Detached | 532,270 | 71.0% |
| Single Unit, Attached | 35,510 | 4.7% |
| 2 Unit Apartments | 8,500 | 1.1% |
| 3 or 4 Unit Apartments | 25,911 | 3.5% |
| 5 to 9 Unit Apartments | 30,867 | 4.1% |
| 10 or more Apartments | 56,868 | 7.6% |
| Mobile Home / Other | 60,050 | 8.0% |
| Total | 749,976 | 100.0% |
Housing Structures by Occupancy in Riverside County
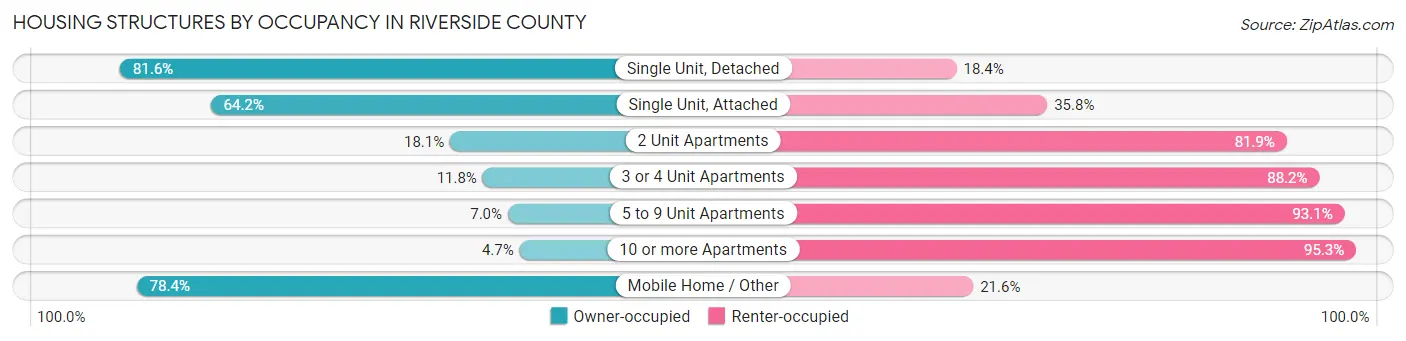
| Structure Type | Owner-occupied | Renter-occupied |
| Single Unit, Detached | 434,523 (81.6%) | 97,747 (18.4%) |
| Single Unit, Attached | 22,790 (64.2%) | 12,720 (35.8%) |
| 2 Unit Apartments | 1,537 (18.1%) | 6,963 (81.9%) |
| 3 or 4 Unit Apartments | 3,057 (11.8%) | 22,854 (88.2%) |
| 5 to 9 Unit Apartments | 2,146 (7.0%) | 28,721 (93.0%) |
| 10 or more Apartments | 2,677 (4.7%) | 54,191 (95.3%) |
| Mobile Home / Other | 47,091 (78.4%) | 12,959 (21.6%) |
| Total | 513,821 (68.5%) | 236,155 (31.5%) |
Housing Structures by Number of Rooms in Riverside County
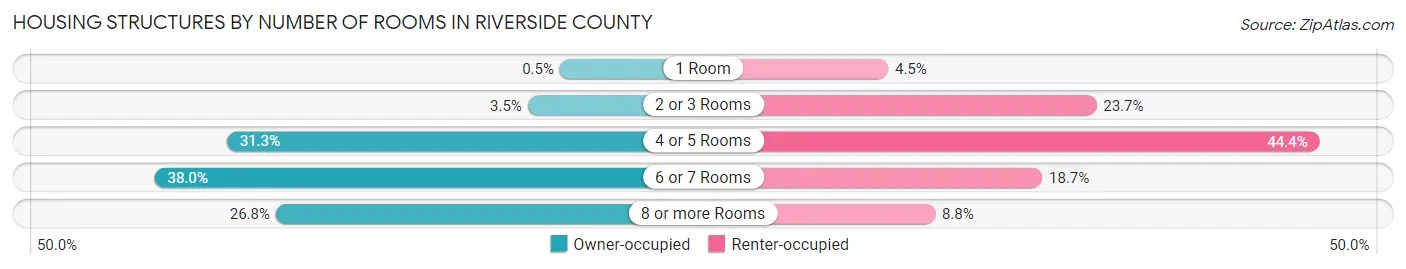
| Number of Rooms | Owner-occupied | Renter-occupied |
| 1 Room | 2,546 (0.5%) | 10,516 (4.4%) |
| 2 or 3 Rooms | 17,820 (3.5%) | 55,993 (23.7%) |
| 4 or 5 Rooms | 160,818 (31.3%) | 104,746 (44.4%) |
| 6 or 7 Rooms | 195,101 (38.0%) | 44,152 (18.7%) |
| 8 or more Rooms | 137,536 (26.8%) | 20,748 (8.8%) |
| Total | 513,821 (100.0%) | 236,155 (100.0%) |
Housing Structure by Heating Type in Riverside County
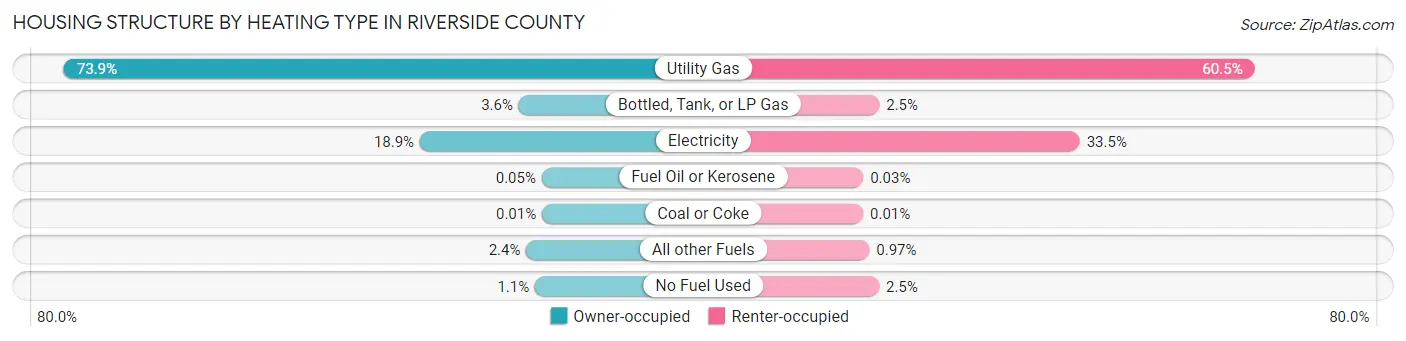
| Heating Type | Owner-occupied | Renter-occupied |
| Utility Gas | 379,894 (73.9%) | 142,890 (60.5%) |
| Bottled, Tank, or LP Gas | 18,474 (3.6%) | 5,939 (2.5%) |
| Electricity | 97,034 (18.9%) | 79,108 (33.5%) |
| Fuel Oil or Kerosene | 247 (0.1%) | 78 (0.0%) |
| Coal or Coke | 59 (0.0%) | 32 (0.0%) |
| All other Fuels | 12,527 (2.4%) | 2,284 (1.0%) |
| No Fuel Used | 5,586 (1.1%) | 5,824 (2.5%) |
| Total | 513,821 (100.0%) | 236,155 (100.0%) |
Household Vehicle Usage in Riverside County
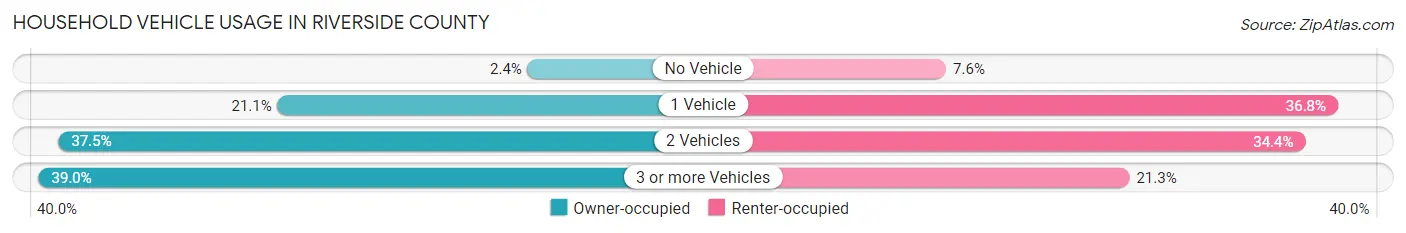
| Vehicles per Household | Owner-occupied | Renter-occupied |
| No Vehicle | 12,493 (2.4%) | 17,844 (7.6%) |
| 1 Vehicle | 108,489 (21.1%) | 86,939 (36.8%) |
| 2 Vehicles | 192,603 (37.5%) | 81,182 (34.4%) |
| 3 or more Vehicles | 200,236 (39.0%) | 50,190 (21.2%) |
| Total | 513,821 (100.0%) | 236,155 (100.0%) |
Real Estate & Mortgages in Riverside County
Real Estate and Mortgage Overview in Riverside County
| Characteristic | Without Mortgage | With Mortgage |
| Housing Units | 157,794 | 356,027 |
| Median Property Value | $379,000 | $486,900 |
| Median Household Income | $67,078 | $118,992 |
| Monthly Housing Costs | $683 | $98,628 |
| Real Estate Taxes | $2,917 | $7,249 |
Property Value by Mortgage Status in Riverside County
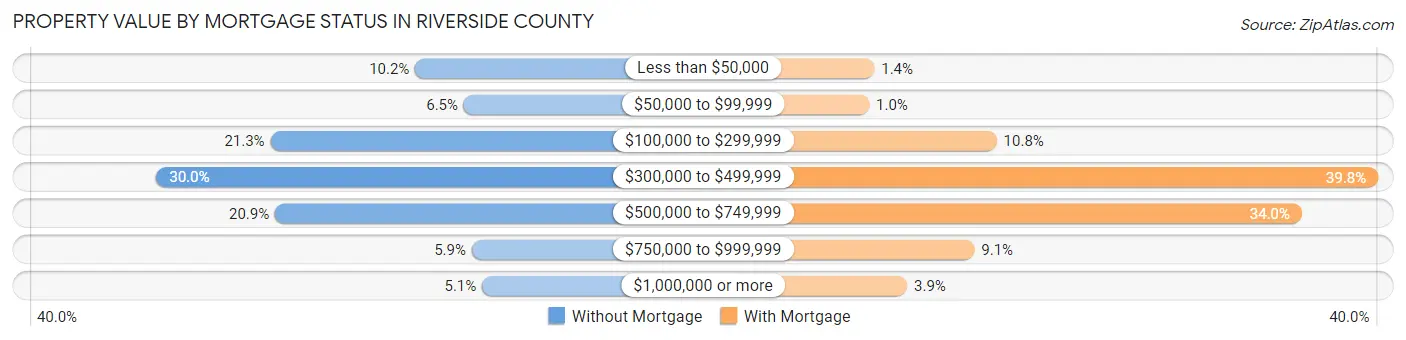
| Property Value | Without Mortgage | With Mortgage |
| Less than $50,000 | 16,163 (10.2%) | 5,097 (1.4%) |
| $50,000 to $99,999 | 10,308 (6.5%) | 3,663 (1.0%) |
| $100,000 to $299,999 | 33,559 (21.3%) | 38,277 (10.7%) |
| $300,000 to $499,999 | 47,277 (30.0%) | 141,740 (39.8%) |
| $500,000 to $749,999 | 33,014 (20.9%) | 121,032 (34.0%) |
| $750,000 to $999,999 | 9,359 (5.9%) | 32,211 (9.0%) |
| $1,000,000 or more | 8,114 (5.1%) | 14,007 (3.9%) |
| Total | 157,794 (100.0%) | 356,027 (100.0%) |
Household Income by Mortgage Status in Riverside County
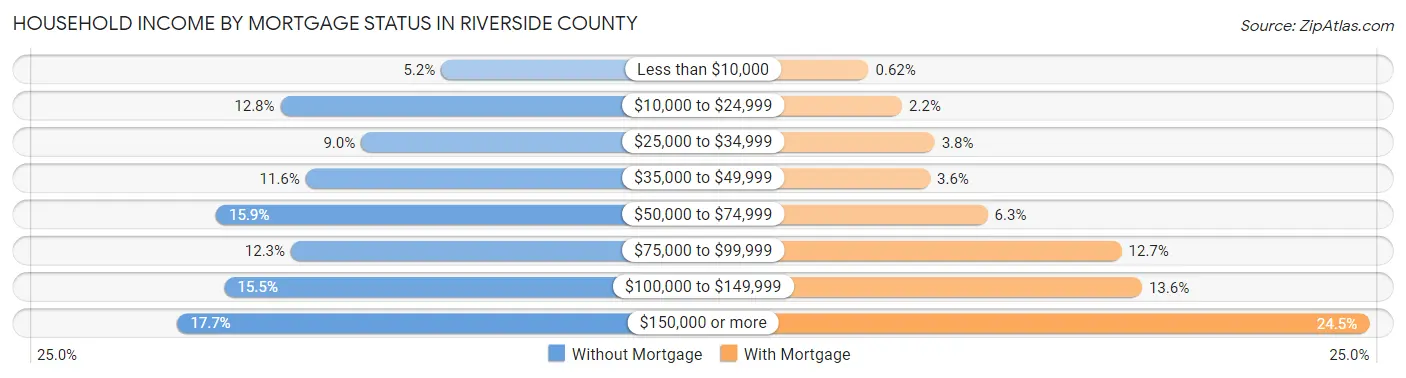
| Household Income | Without Mortgage | With Mortgage |
| Less than $10,000 | 8,163 (5.2%) | 2,202 (0.6%) |
| $10,000 to $24,999 | 20,232 (12.8%) | 7,898 (2.2%) |
| $25,000 to $34,999 | 14,167 (9.0%) | 13,422 (3.8%) |
| $35,000 to $49,999 | 18,342 (11.6%) | 12,623 (3.5%) |
| $50,000 to $74,999 | 25,056 (15.9%) | 22,386 (6.3%) |
| $75,000 to $99,999 | 19,447 (12.3%) | 45,123 (12.7%) |
| $100,000 to $149,999 | 24,431 (15.5%) | 48,552 (13.6%) |
| $150,000 or more | 27,956 (17.7%) | 87,031 (24.4%) |
| Total | 157,794 (100.0%) | 356,027 (100.0%) |
Property Value to Household Income Ratio in Riverside County
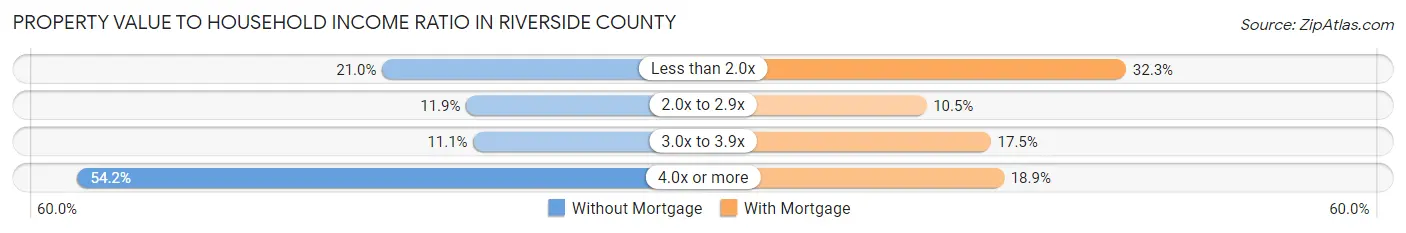
| Value-to-Income Ratio | Without Mortgage | With Mortgage |
| Less than 2.0x | 33,164 (21.0%) | 114,823 (32.3%) |
| 2.0x to 2.9x | 18,726 (11.9%) | 37,339 (10.5%) |
| 3.0x to 3.9x | 17,498 (11.1%) | 62,332 (17.5%) |
| 4.0x or more | 85,549 (54.2%) | 67,423 (18.9%) |
| Total | 157,794 (100.0%) | 356,027 (100.0%) |
Real Estate Taxes by Mortgage Status in Riverside County
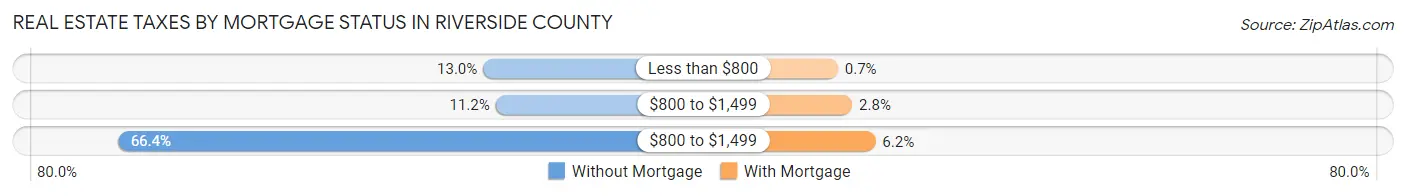
| Property Taxes | Without Mortgage | With Mortgage |
| Less than $800 | 20,510 (13.0%) | 2,497 (0.7%) |
| $800 to $1,499 | 17,661 (11.2%) | 9,950 (2.8%) |
| $800 to $1,499 | 104,764 (66.4%) | 22,044 (6.2%) |
| Total | 157,794 (100.0%) | 356,027 (100.0%) |
Health & Disability in Riverside County
Health Insurance Coverage by Age in Riverside County
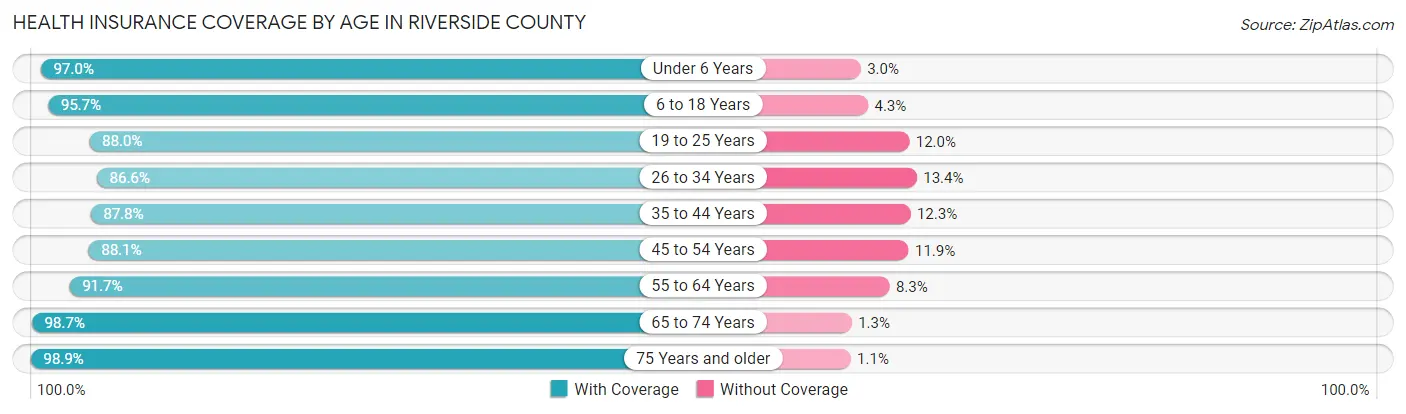
| Age Bracket | With Coverage | Without Coverage |
| Under 6 Years | 171,913 (97.0%) | 5,257 (3.0%) |
| 6 to 18 Years | 437,929 (95.7%) | 19,797 (4.3%) |
| 19 to 25 Years | 204,440 (88.0%) | 27,932 (12.0%) |
| 26 to 34 Years | 255,269 (86.6%) | 39,612 (13.4%) |
| 35 to 44 Years | 277,135 (87.7%) | 38,685 (12.2%) |
| 45 to 54 Years | 260,073 (88.1%) | 35,092 (11.9%) |
| 55 to 64 Years | 255,733 (91.7%) | 23,232 (8.3%) |
| 65 to 74 Years | 201,752 (98.7%) | 2,628 (1.3%) |
| 75 Years and older | 149,082 (98.9%) | 1,639 (1.1%) |
| Total | 2,213,326 (91.9%) | 193,874 (8.1%) |
Health Insurance Coverage by Citizenship Status in Riverside County
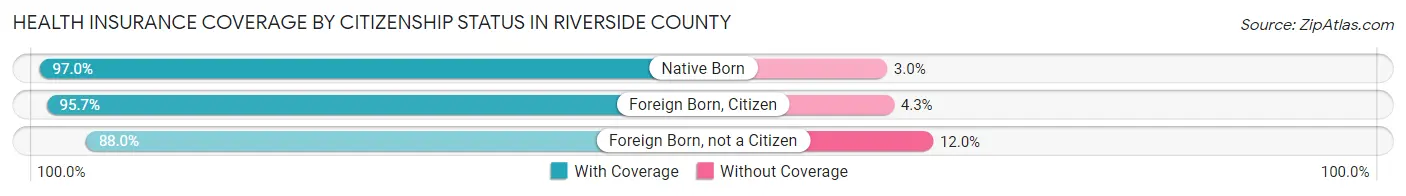
| Citizenship Status | With Coverage | Without Coverage |
| Native Born | 171,913 (97.0%) | 5,257 (3.0%) |
| Foreign Born, Citizen | 437,929 (95.7%) | 19,797 (4.3%) |
| Foreign Born, not a Citizen | 204,440 (88.0%) | 27,932 (12.0%) |
Health Insurance Coverage by Household Income in Riverside County
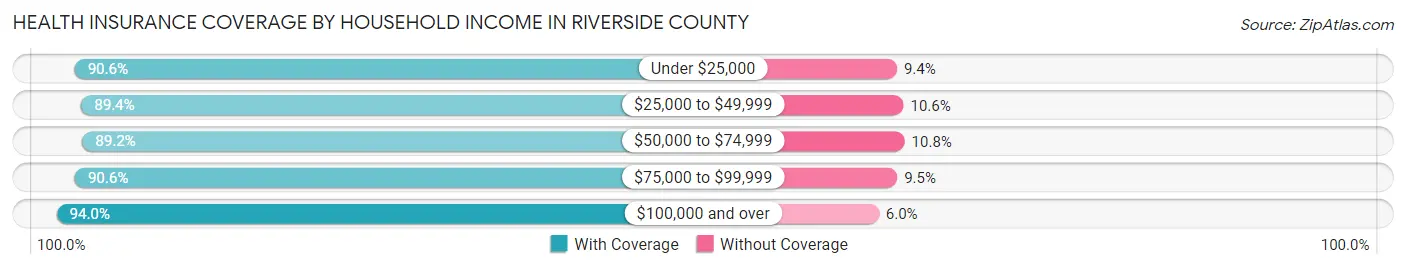
| Household Income | With Coverage | Without Coverage |
| Under $25,000 | 174,703 (90.6%) | 18,135 (9.4%) |
| $25,000 to $49,999 | 282,365 (89.4%) | 33,618 (10.6%) |
| $50,000 to $74,999 | 314,532 (89.2%) | 38,253 (10.8%) |
| $75,000 to $99,999 | 304,306 (90.5%) | 31,761 (9.5%) |
| $100,000 and over | 1,116,440 (94.0%) | 71,239 (6.0%) |
Public vs Private Health Insurance Coverage by Age in Riverside County
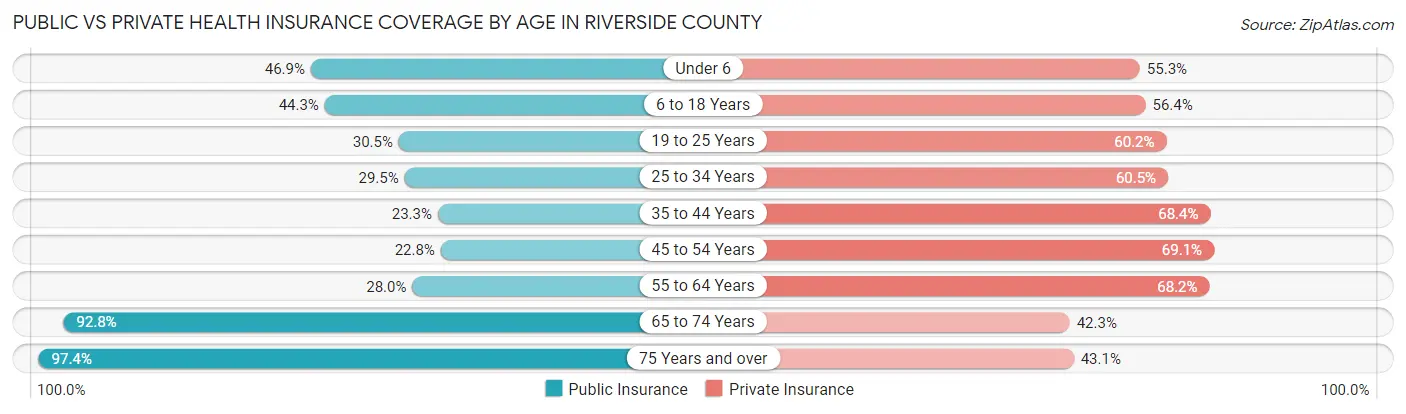
| Age Bracket | Public Insurance | Private Insurance |
| Under 6 | 83,057 (46.9%) | 98,027 (55.3%) |
| 6 to 18 Years | 202,755 (44.3%) | 258,076 (56.4%) |
| 19 to 25 Years | 70,964 (30.5%) | 139,983 (60.2%) |
| 25 to 34 Years | 86,888 (29.5%) | 178,492 (60.5%) |
| 35 to 44 Years | 73,575 (23.3%) | 215,978 (68.4%) |
| 45 to 54 Years | 67,222 (22.8%) | 203,833 (69.1%) |
| 55 to 64 Years | 78,227 (28.0%) | 190,300 (68.2%) |
| 65 to 74 Years | 189,634 (92.8%) | 86,463 (42.3%) |
| 75 Years and over | 146,781 (97.4%) | 64,891 (43.0%) |
| Total | 999,103 (41.5%) | 1,436,043 (59.7%) |
Disability Status by Sex by Age in Riverside County
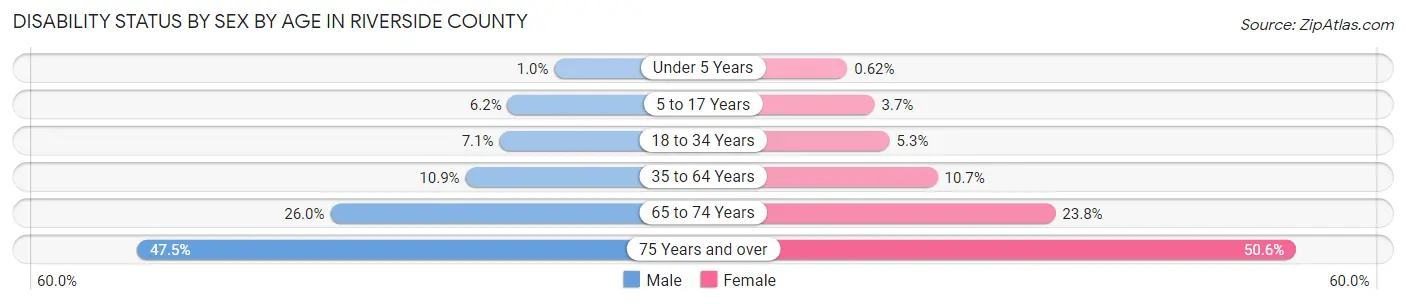
| Age Bracket | Male | Female |
| Under 5 Years | 753 (1.0%) | 441 (0.6%) |
| 5 to 17 Years | 14,324 (6.2%) | 8,054 (3.6%) |
| 18 to 34 Years | 20,434 (7.1%) | 14,825 (5.3%) |
| 35 to 64 Years | 48,731 (10.9%) | 47,272 (10.7%) |
| 65 to 74 Years | 25,238 (26.0%) | 25,483 (23.8%) |
| 75 Years and over | 31,376 (47.5%) | 42,815 (50.6%) |
Disability Class by Sex by Age in Riverside County
Disability Class: Hearing Difficulty
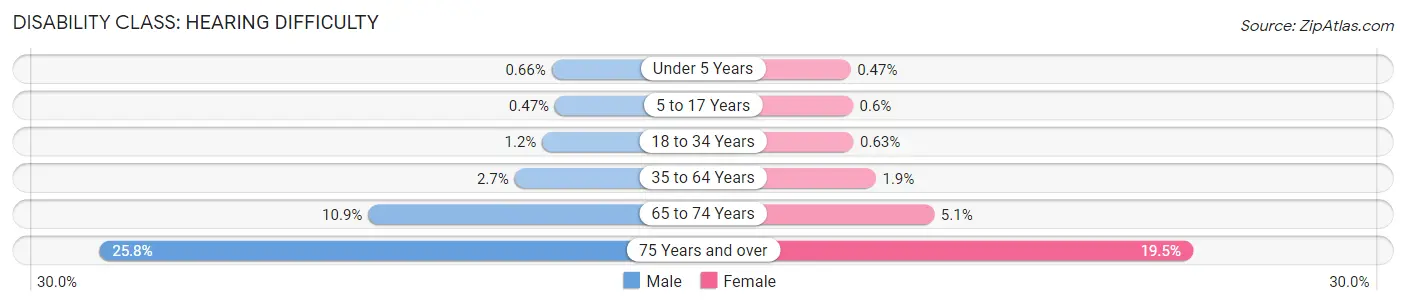
| Age Bracket | Male | Female |
| Under 5 Years | 498 (0.7%) | 338 (0.5%) |
| 5 to 17 Years | 1,076 (0.5%) | 1,314 (0.6%) |
| 18 to 34 Years | 3,377 (1.2%) | 1,764 (0.6%) |
| 35 to 64 Years | 12,155 (2.7%) | 8,325 (1.9%) |
| 65 to 74 Years | 10,570 (10.9%) | 5,496 (5.1%) |
| 75 Years and over | 17,074 (25.8%) | 16,540 (19.5%) |
Disability Class: Vision Difficulty
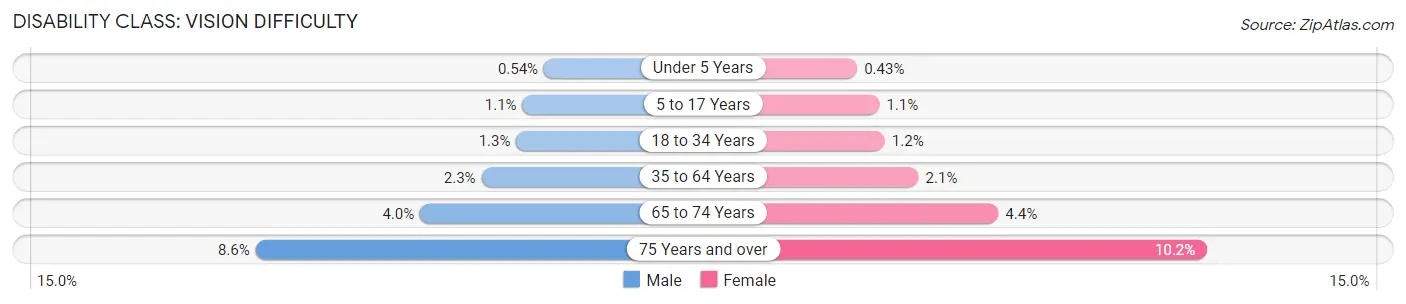
| Age Bracket | Male | Female |
| Under 5 Years | 407 (0.5%) | 308 (0.4%) |
| 5 to 17 Years | 2,638 (1.1%) | 2,316 (1.1%) |
| 18 to 34 Years | 3,768 (1.3%) | 3,349 (1.2%) |
| 35 to 64 Years | 10,175 (2.3%) | 9,498 (2.1%) |
| 65 to 74 Years | 3,886 (4.0%) | 4,675 (4.4%) |
| 75 Years and over | 5,662 (8.6%) | 8,608 (10.2%) |
Disability Class: Cognitive Difficulty
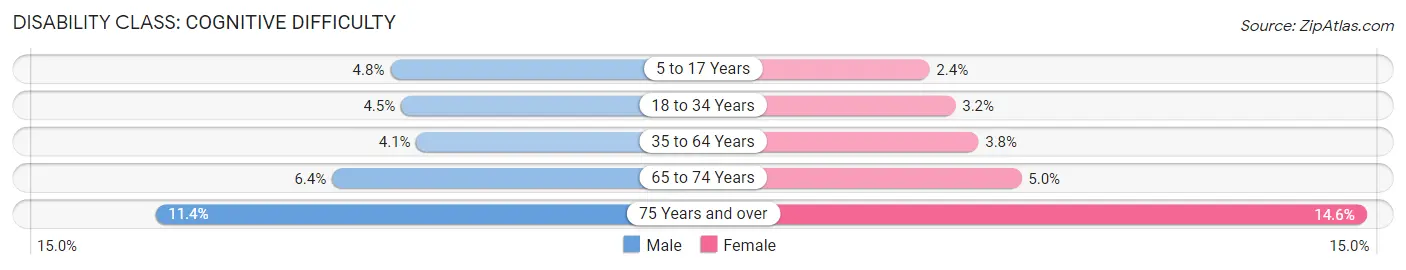
| Age Bracket | Male | Female |
| 5 to 17 Years | 11,115 (4.8%) | 5,384 (2.4%) |
| 18 to 34 Years | 12,972 (4.5%) | 8,803 (3.2%) |
| 35 to 64 Years | 18,287 (4.1%) | 16,839 (3.8%) |
| 65 to 74 Years | 6,261 (6.4%) | 5,356 (5.0%) |
| 75 Years and over | 7,505 (11.4%) | 12,369 (14.6%) |
Disability Class: Ambulatory Difficulty
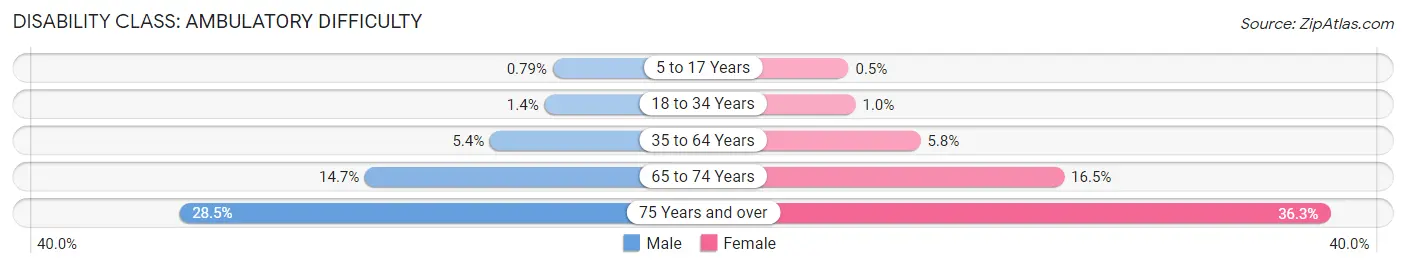
| Age Bracket | Male | Female |
| 5 to 17 Years | 1,825 (0.8%) | 1,094 (0.5%) |
| 18 to 34 Years | 4,014 (1.4%) | 2,847 (1.0%) |
| 35 to 64 Years | 24,300 (5.4%) | 25,864 (5.8%) |
| 65 to 74 Years | 14,317 (14.7%) | 17,678 (16.5%) |
| 75 Years and over | 18,848 (28.5%) | 30,690 (36.3%) |
Disability Class: Self-Care Difficulty
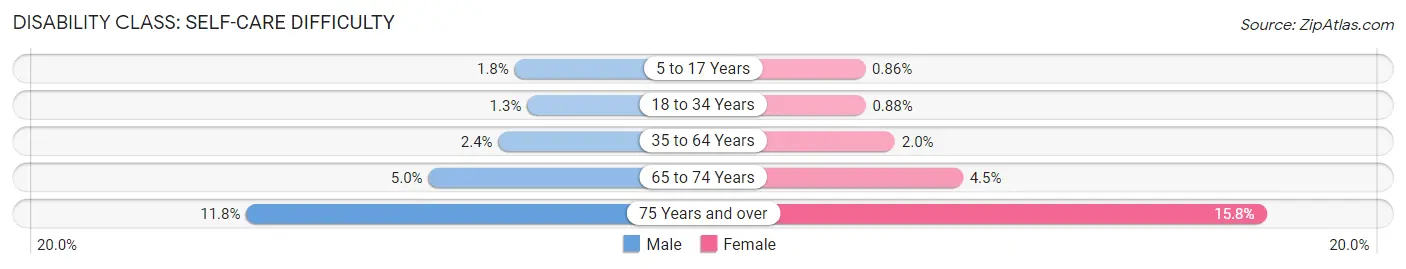
| Age Bracket | Male | Female |
| 5 to 17 Years | 4,179 (1.8%) | 1,893 (0.9%) |
| 18 to 34 Years | 3,841 (1.3%) | 2,436 (0.9%) |
| 35 to 64 Years | 10,773 (2.4%) | 8,737 (2.0%) |
| 65 to 74 Years | 4,873 (5.0%) | 4,804 (4.5%) |
| 75 Years and over | 7,778 (11.8%) | 13,339 (15.8%) |
Technology Access in Riverside County
Computing Device Access in Riverside County
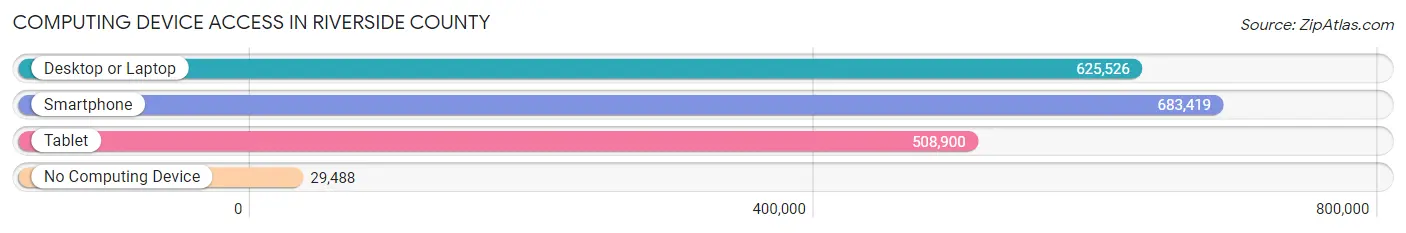
| Device Type | # Households | % Households |
| Desktop or Laptop | 625,526 | 83.4% |
| Smartphone | 683,419 | 91.1% |
| Tablet | 508,900 | 67.9% |
| No Computing Device | 29,488 | 3.9% |
| Total | 749,976 | 100.0% |
Internet Access in Riverside County
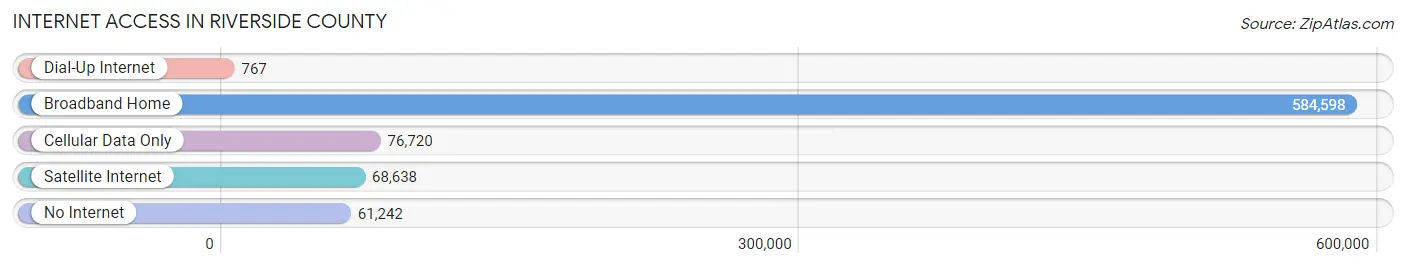
| Internet Type | # Households | % Households |
| Dial-Up Internet | 767 | 0.1% |
| Broadband Home | 584,598 | 77.9% |
| Cellular Data Only | 76,720 | 10.2% |
| Satellite Internet | 68,638 | 9.1% |
| No Internet | 61,242 | 8.2% |
| Total | 749,976 | 100.0% |
Riverside County Summary
Riverside County is located in the southern part of California, and is the fourth most populous county in the state. It is bordered by San Bernardino County to the north, Orange County to the south, San Diego County to the west, and Imperial County to the east. The county seat is Riverside, the largest city in the county.
History
Riverside County was established in 1893, when it was separated from San Bernardino County. The county was named for the Santa Ana River, which flows through the county. The area was originally inhabited by the Cahuilla and Serrano Native American tribes. The first Europeans to settle in the area were the Spanish, who established the Mission San Luis Rey de Francia in 1798.
In the mid-1800s, the area was part of the Rancho San Jacinto, a large Mexican land grant. After the Mexican-American War, the area was ceded to the United States and became part of the United States Territory of California. In 1853, the area was divided into two counties, San Bernardino and San Diego. In 1893, Riverside County was created from parts of San Bernardino and San Diego counties.
Geography
Riverside County covers 7,208 square miles, making it the 11th largest county in the United States. The county is located in the southern part of California, and is bordered by San Bernardino County to the north, Orange County to the south, San Diego County to the west, and Imperial County to the east. The county is divided into two distinct regions: the Inland Empire and the Coachella Valley.
The Inland Empire is located in the northern part of the county and is home to the cities of Riverside, Moreno Valley, and Corona. The region is characterized by its rolling hills and valleys, and is home to the San Bernardino National Forest. The Coachella Valley is located in the southern part of the county and is home to the cities of Palm Springs, Indio, and Coachella. The region is characterized by its desert climate and is home to the Santa Rosa and San Jacinto Mountains National Monument.
Economy
Riverside County has a diverse economy, with a variety of industries contributing to its economic growth. The county is home to a number of major employers, including the University of California, Riverside, the March Air Reserve Base, and the Riverside County Regional Medical Center. The county is also home to a number of manufacturing companies, including Nestle, Frito-Lay, and PepsiCo.
The county is also home to a number of agricultural operations, including citrus and avocado groves, vineyards, and date farms. The county is also home to a number of tourist attractions, including the Palm Springs Aerial Tramway, the Mission Inn Hotel & Spa, and the Living Desert Zoo & Gardens.
Demographics
As of the 2020 census, Riverside County had a population of 2,485,223. The population is racially and ethnically diverse, with the largest racial group being White (48.3%), followed by Hispanic or Latino (37.2%), Asian (7.2%), African American (4.7%), and Native American (1.2%). The median household income in the county is $68,845, and the median home value is $364,400. The county has a poverty rate of 14.2%.
Conclusion
Riverside County is a large and diverse county located in the southern part of California. The county has a rich history, and is home to a variety of industries and attractions. The county is racially and ethnically diverse, and has a median household income of $68,845. Riverside County is an important part of the state of California, and is an important contributor to the state’s economy.
Common Questions
What is Per Capita Income in Riverside County?
Per Capita income in Riverside County is $35,356.
What is the Median Family Income in Riverside County?
Median Family Income in Riverside County is $95,246.
What is the Median Household income in Riverside County?
Median Household Income in Riverside County is $84,505.
What is Income or Wage Gap in Riverside County?
Income or Wage Gap in Riverside County is 29.4%.
Women in Riverside County earn 70.6 cents for every dollar earned by a man.
What is Family Income Deficit in Riverside County?
Family Income Deficit in Riverside County is $11,114.
Families that are below poverty line in Riverside County earn $11,114 less on average than the poverty threshold level.
What is Inequality or Gini Index in Riverside County?
Inequality or Gini Index in Riverside County is 0.45.
What is the Total Population of Riverside County?
Total Population of Riverside County is 2,429,487.
What is the Total Male Population of Riverside County?
Total Male Population of Riverside County is 1,220,393.
What is the Total Female Population of Riverside County?
Total Female Population of Riverside County is 1,209,094.
What is the Ratio of Males per 100 Females in Riverside County?
There are 100.93 Males per 100 Females in Riverside County.
What is the Ratio of Females per 100 Males in Riverside County?
There are 99.07 Females per 100 Males in Riverside County.
What is the Median Population Age in Riverside County?
Median Population Age in Riverside County is 36.3 Years.
What is the Average Family Size in Riverside County
Average Family Size in Riverside County is 3.7 People.
What is the Average Household Size in Riverside County
Average Household Size in Riverside County is 3.2 People.
How Large is the Labor Force in Riverside County?
There are 1,155,940 People in the Labor Forcein in Riverside County.
What is the Percentage of People in the Labor Force in Riverside County?
60.7% of People are in the Labor Force in Riverside County.
What is the Unemployment Rate in Riverside County?
Unemployment Rate in Riverside County is 6.7%.