Orange County, CA Map & Demographics
Orange County Map
Orange County Overview
$50,683
PER CAPITA INCOME
$124,132
AVG FAMILY INCOME
$109,361
AVG HOUSEHOLD INCOME
27.7%
WAGE / INCOME GAP [ % ]
72.3¢/ $1
WAGE / INCOME GAP [ $ ]
$11,685
FAMILY INCOME DEFICIT
0.47
INEQUALITY / GINI INDEX
3,175,227
TOTAL POPULATION
1,578,013
MALE POPULATION
1,597,214
FEMALE POPULATION
98.80
MALES / 100 FEMALES
101.22
FEMALES / 100 MALES
38.7
MEDIAN AGE
3.4
AVG FAMILY SIZE
2.9
AVG HOUSEHOLD SIZE
1,691,614
LABOR FORCE [ PEOPLE ]
65.6%
PERCENT IN LABOR FORCE
5.4%
UNEMPLOYMENT RATE
Income in Orange County
Income Overview in Orange County
Per Capita Income in Orange County is $50,683, while median incomes of families and households are $124,132 and $109,361 respectively.
| Characteristic | Number | Measure |
| Per Capita Income | 3,175,227 | $50,683 |
| Median Family Income | 754,132 | $124,132 |
| Mean Family Income | 754,132 | $164,097 |
| Median Household Income | 1,066,286 | $109,361 |
| Mean Household Income | 1,066,286 | $147,182 |
| Income Deficit | 754,132 | $11,685 |
| Wage / Income Gap (%) | 3,175,227 | 27.69% |
| Wage / Income Gap ($) | 3,175,227 | 72.31¢ per $1 |
| Gini / Inequality Index | 3,175,227 | 0.47 |
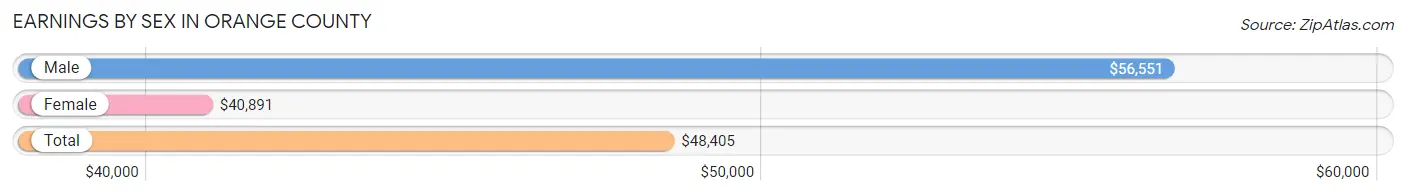
Earnings by Sex in Orange County
Average Earnings in Orange County are $48,405, $56,551 for men and $40,891 for women, a difference of 27.7%.
| Sex | Number | Average Earnings |
| Male | 934,902 (54.0%) | $56,551 |
| Female | 795,826 (46.0%) | $40,891 |
| Total | 1,730,728 (100.0%) | $48,405 |
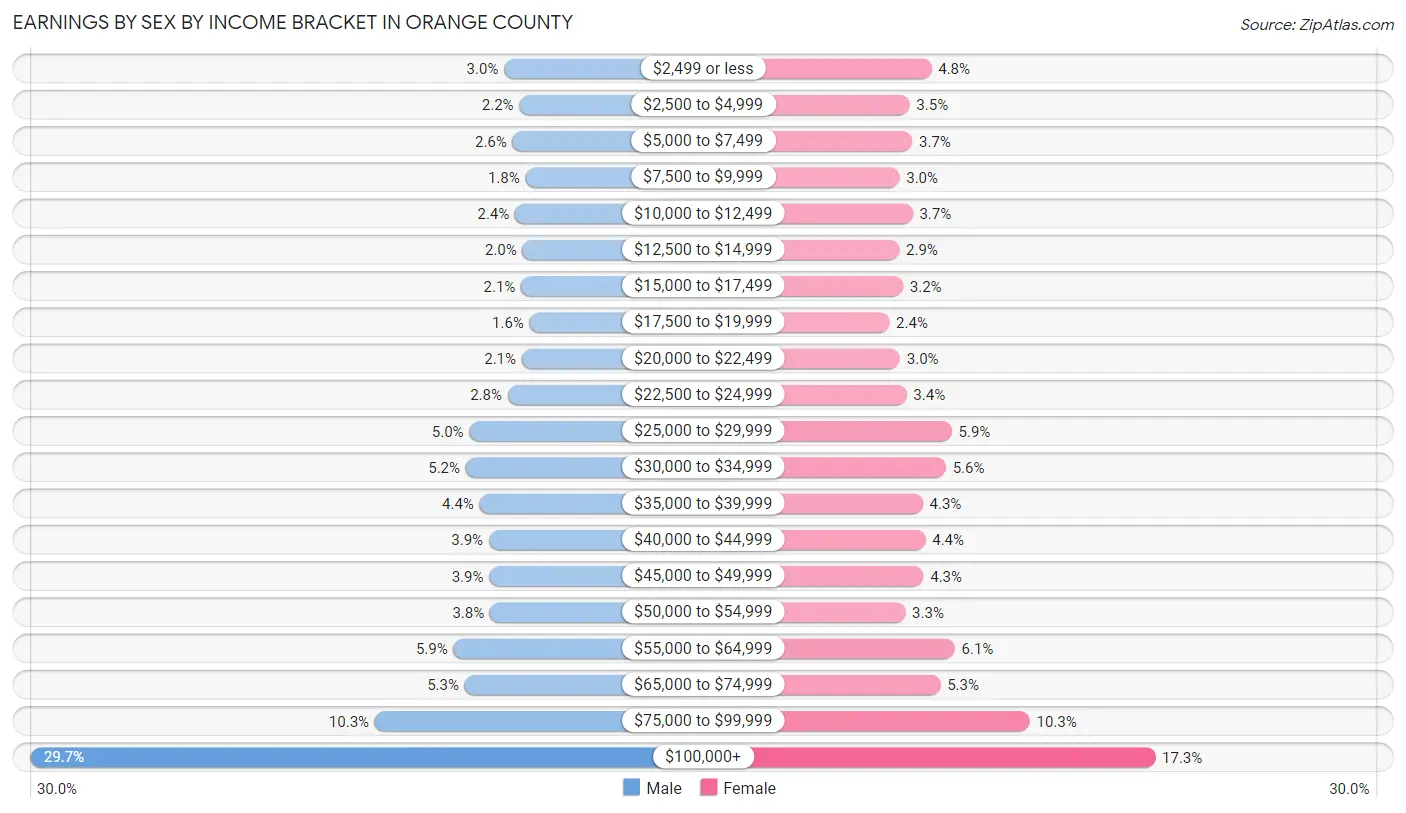
Earnings by Sex by Income Bracket in Orange County
The most common earnings brackets in Orange County are $100,000+ for men (277,184 | 29.6%) and $100,000+ for women (137,940 | 17.3%).
| Income | Male | Female |
| $2,499 or less | 28,396 (3.0%) | 37,793 (4.8%) |
| $2,500 to $4,999 | 20,455 (2.2%) | 28,016 (3.5%) |
| $5,000 to $7,499 | 24,002 (2.6%) | 29,219 (3.7%) |
| $7,500 to $9,999 | 17,210 (1.8%) | 23,446 (2.9%) |
| $10,000 to $12,499 | 22,727 (2.4%) | 29,403 (3.7%) |
| $12,500 to $14,999 | 18,774 (2.0%) | 23,399 (2.9%) |
| $15,000 to $17,499 | 19,559 (2.1%) | 25,039 (3.2%) |
| $17,500 to $19,999 | 15,042 (1.6%) | 18,965 (2.4%) |
| $20,000 to $22,499 | 19,191 (2.1%) | 23,739 (3.0%) |
| $22,500 to $24,999 | 26,547 (2.8%) | 26,625 (3.4%) |
| $25,000 to $29,999 | 46,707 (5.0%) | 46,893 (5.9%) |
| $30,000 to $34,999 | 48,600 (5.2%) | 44,219 (5.6%) |
| $35,000 to $39,999 | 41,298 (4.4%) | 33,891 (4.3%) |
| $40,000 to $44,999 | 36,429 (3.9%) | 35,060 (4.4%) |
| $45,000 to $49,999 | 36,303 (3.9%) | 34,204 (4.3%) |
| $50,000 to $54,999 | 35,876 (3.8%) | 26,136 (3.3%) |
| $55,000 to $64,999 | 55,107 (5.9%) | 48,259 (6.1%) |
| $65,000 to $74,999 | 49,151 (5.3%) | 41,816 (5.2%) |
| $75,000 to $99,999 | 96,344 (10.3%) | 81,764 (10.3%) |
| $100,000+ | 277,184 (29.6%) | 137,940 (17.3%) |
| Total | 934,902 (100.0%) | 795,826 (100.0%) |
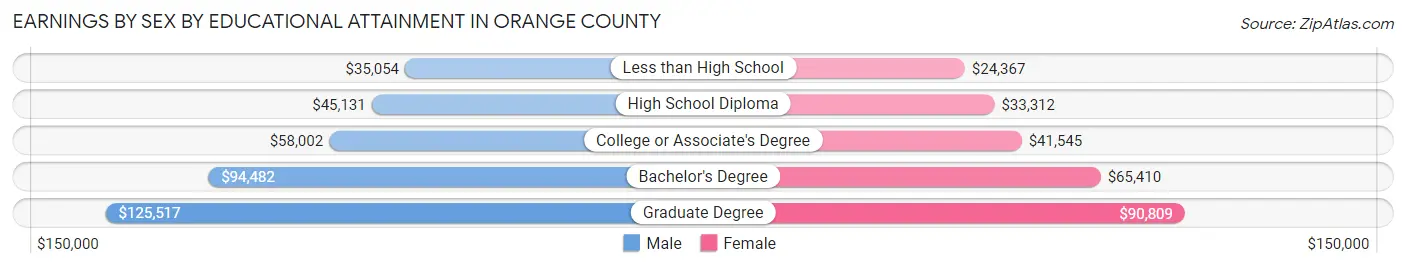
Earnings by Sex by Educational Attainment in Orange County
Average earnings in Orange County are $66,187 for men and $47,396 for women, a difference of 28.4%. Men with an educational attainment of graduate degree enjoy the highest average annual earnings of $125,517, while those with less than high school education earn the least with $35,054. Women with an educational attainment of graduate degree earn the most with the average annual earnings of $90,809, while those with less than high school education have the smallest earnings of $24,367.
| Educational Attainment | Male Income | Female Income |
| Less than High School | $35,054 | $24,367 |
| High School Diploma | $45,131 | $33,312 |
| College or Associate's Degree | $58,002 | $41,545 |
| Bachelor's Degree | $94,482 | $65,410 |
| Graduate Degree | $125,517 | $90,809 |
| Total | $66,187 | $47,396 |
Family Income in Orange County
Family Income Brackets in Orange County
According to the Orange County family income data, there are 199,845 families falling into the $200,000+ income range, which is the most common income bracket and makes up 26.5% of all families. Conversely, the $10,000 to $14,999 income bracket is the least frequent group with only 9,804 families (1.3%) belonging to this category.
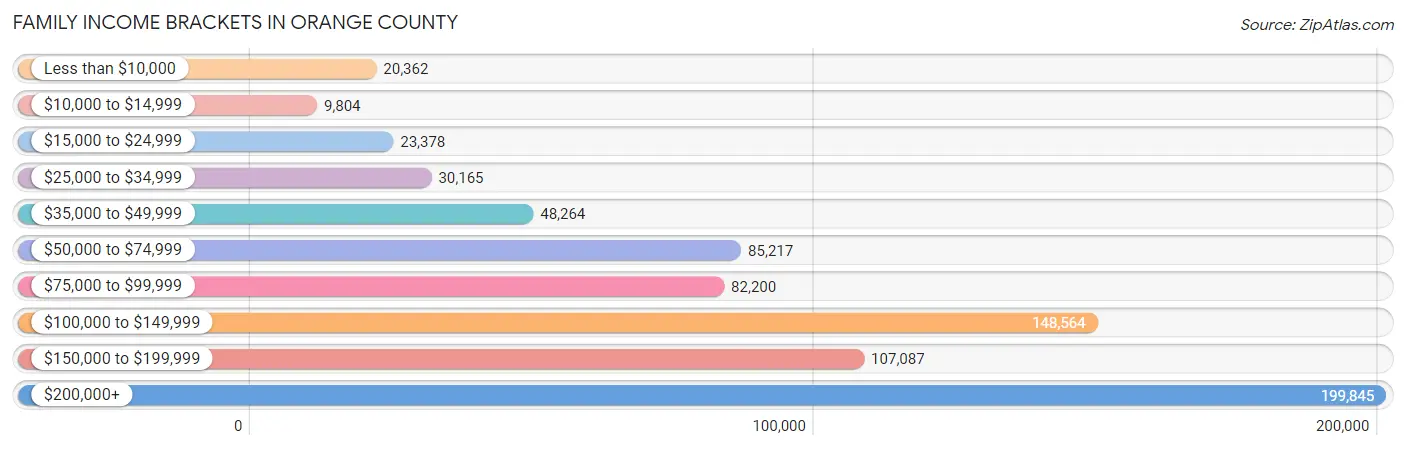
| Income Bracket | # Families | % Families |
| Less than $10,000 | 20,362 | 2.7% |
| $10,000 to $14,999 | 9,804 | 1.3% |
| $15,000 to $24,999 | 23,378 | 3.1% |
| $25,000 to $34,999 | 30,165 | 4.0% |
| $35,000 to $49,999 | 48,264 | 6.4% |
| $50,000 to $74,999 | 85,217 | 11.3% |
| $75,000 to $99,999 | 82,200 | 10.9% |
| $100,000 to $149,999 | 148,564 | 19.7% |
| $150,000 to $199,999 | 107,087 | 14.2% |
| $200,000+ | 199,845 | 26.5% |
Family Income by Famaliy Size in Orange County
7+ person families (22,571 | 3.0%) account for the highest median family income in Orange County with $148,149 per family, while 2-person families (288,375 | 38.2%) have the highest median income of $54,782 per family member.
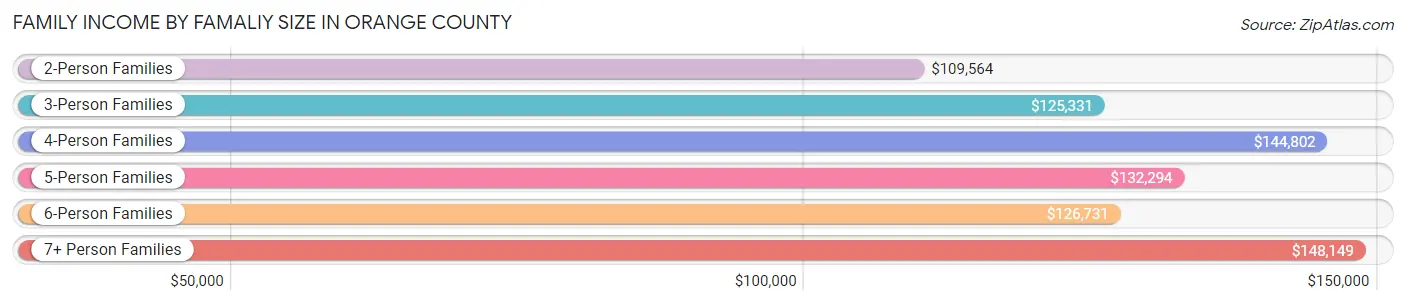
| Income Bracket | # Families | Median Income |
| 2-Person Families | 288,375 (38.2%) | $109,564 |
| 3-Person Families | 173,832 (23.1%) | $125,331 |
| 4-Person Families | 164,909 (21.9%) | $144,802 |
| 5-Person Families | 74,861 (9.9%) | $132,294 |
| 6-Person Families | 29,584 (3.9%) | $126,731 |
| 7+ Person Families | 22,571 (3.0%) | $148,149 |
| Total | 754,132 (100.0%) | $124,132 |
Family Income by Number of Earners in Orange County
The median family income in Orange County is $124,132, with families comprising 3+ earners (133,184) having the highest median family income of $161,310, while families with no earners (87,287) have the lowest median family income of $57,761, accounting for 17.7% and 11.6% of families, respectively.
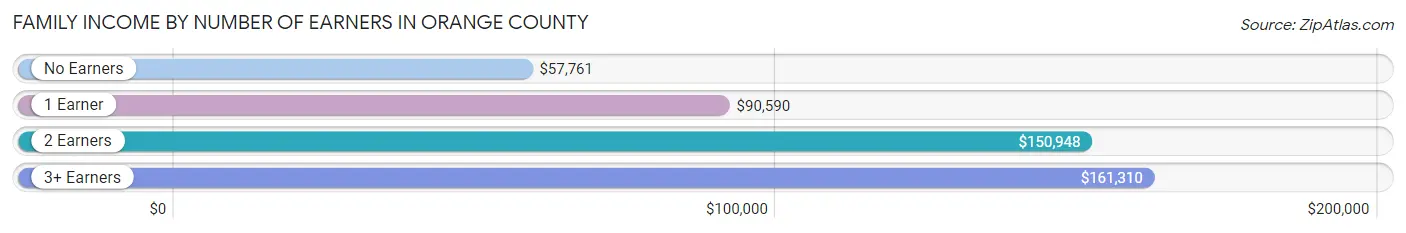
| Number of Earners | # Families | Median Income |
| No Earners | 87,287 (11.6%) | $57,761 |
| 1 Earner | 218,583 (29.0%) | $90,590 |
| 2 Earners | 315,078 (41.8%) | $150,948 |
| 3+ Earners | 133,184 (17.7%) | $161,310 |
| Total | 754,132 (100.0%) | $124,132 |
Household Income in Orange County
Household Income Brackets in Orange County
With 237,782 households falling in the category, the $200,000+ income range is the most frequent in Orange County, accounting for 22.3% of all households. In contrast, only 24,525 households (2.3%) fall into the $10,000 to $14,999 income bracket, making it the least populous group.
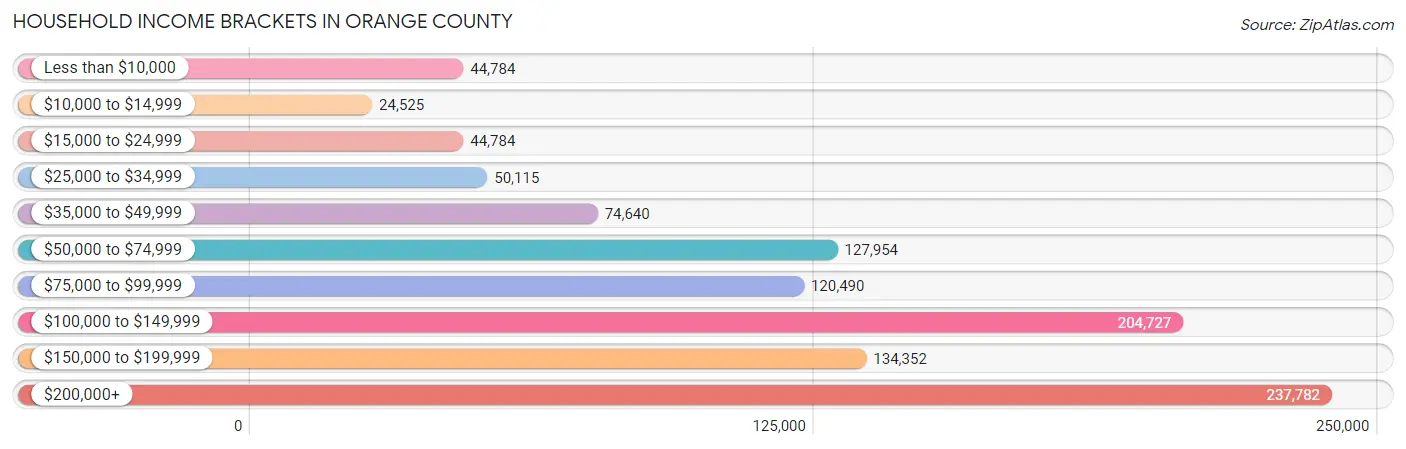
| Income Bracket | # Households | % Households |
| Less than $10,000 | 44,784 | 4.2% |
| $10,000 to $14,999 | 24,525 | 2.3% |
| $15,000 to $24,999 | 44,784 | 4.2% |
| $25,000 to $34,999 | 50,115 | 4.7% |
| $35,000 to $49,999 | 74,640 | 7.0% |
| $50,000 to $74,999 | 127,954 | 12.0% |
| $75,000 to $99,999 | 120,490 | 11.3% |
| $100,000 to $149,999 | 204,727 | 19.2% |
| $150,000 to $199,999 | 134,352 | 12.6% |
| $200,000+ | 237,782 | 22.3% |
Household Income by Householder Age in Orange County
The median household income in Orange County is $109,361, with the highest median household income of $128,975 found in the 45 to 64 years age bracket for the primary householder. A total of 435,108 households (40.8%) fall into this category. Meanwhile, the 15 to 24 years age bracket for the primary householder has the lowest median household income of $51,244, with 26,819 households (2.5%) in this group.
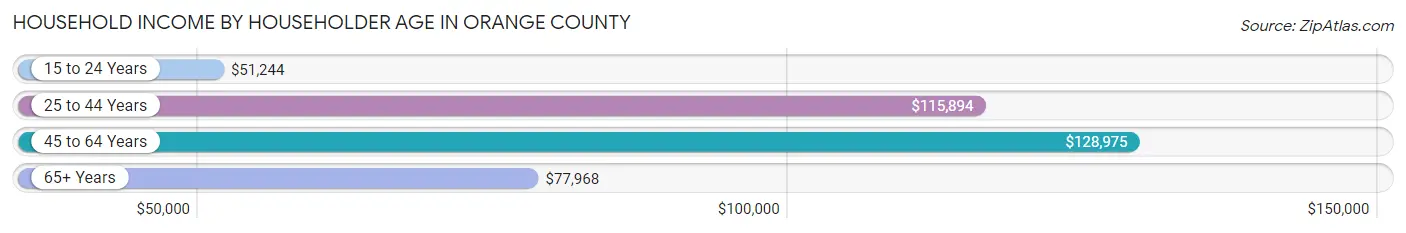
| Income Bracket | # Households | Median Income |
| 15 to 24 Years | 26,819 (2.5%) | $51,244 |
| 25 to 44 Years | 334,181 (31.3%) | $115,894 |
| 45 to 64 Years | 435,108 (40.8%) | $128,975 |
| 65+ Years | 270,178 (25.3%) | $77,968 |
| Total | 1,066,286 (100.0%) | $109,361 |
Poverty in Orange County
Income Below Poverty by Sex and Age in Orange County
With 8.7% poverty level for males and 10.6% for females among the residents of Orange County, 18 to 24 year old males and 18 to 24 year old females are the most vulnerable to poverty, with 21,524 males (14.9%) and 23,511 females (17.0%) in their respective age groups living below the poverty level.
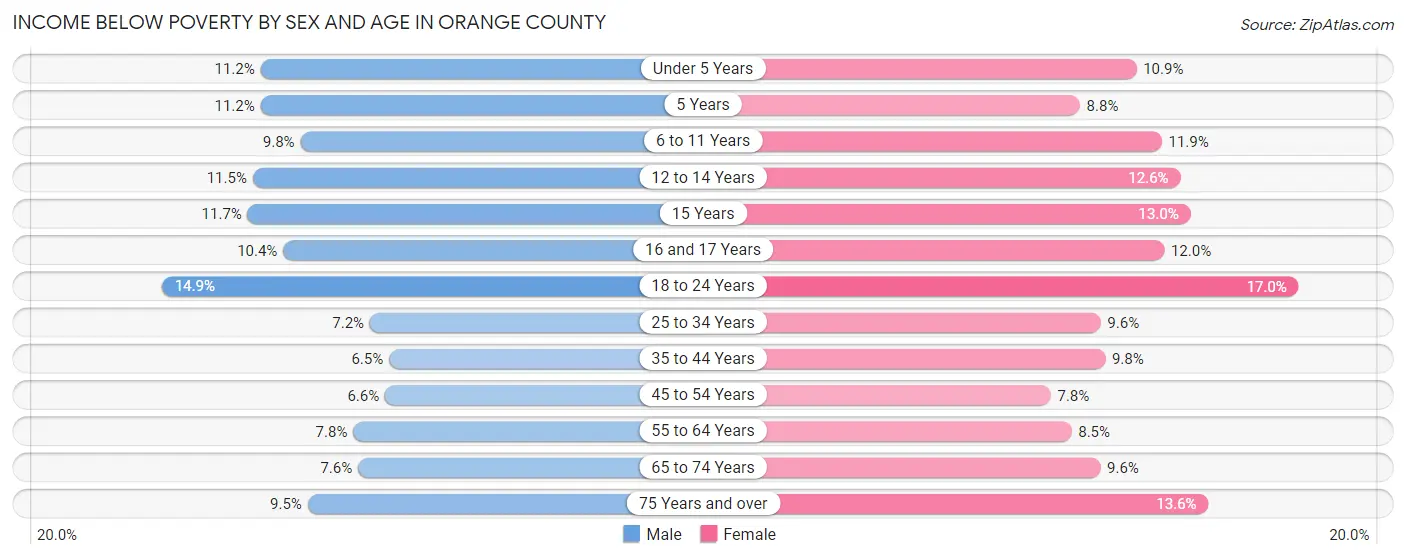
| Age Bracket | Male | Female |
| Under 5 Years | 9,875 (11.2%) | 9,132 (10.9%) |
| 5 Years | 1,944 (11.2%) | 1,459 (8.8%) |
| 6 to 11 Years | 10,911 (9.8%) | 12,657 (11.9%) |
| 12 to 14 Years | 7,318 (11.5%) | 7,522 (12.6%) |
| 15 Years | 2,390 (11.7%) | 2,528 (13.0%) |
| 16 and 17 Years | 4,414 (10.4%) | 4,830 (12.0%) |
| 18 to 24 Years | 21,524 (14.9%) | 23,511 (17.0%) |
| 25 to 34 Years | 16,503 (7.2%) | 20,989 (9.6%) |
| 35 to 44 Years | 13,418 (6.5%) | 20,000 (9.8%) |
| 45 to 54 Years | 14,253 (6.6%) | 16,884 (7.7%) |
| 55 to 64 Years | 15,876 (7.8%) | 17,512 (8.5%) |
| 65 to 74 Years | 9,875 (7.6%) | 14,116 (9.6%) |
| 75 Years and over | 8,171 (9.5%) | 16,198 (13.6%) |
| Total | 136,472 (8.7%) | 167,338 (10.6%) |
Income Above Poverty by Sex and Age in Orange County
According to the poverty statistics in Orange County, males aged 35 to 44 years and females aged 45 to 54 years are the age groups that are most secure financially, with 93.5% of males and 92.2% of females in these age groups living above the poverty line.
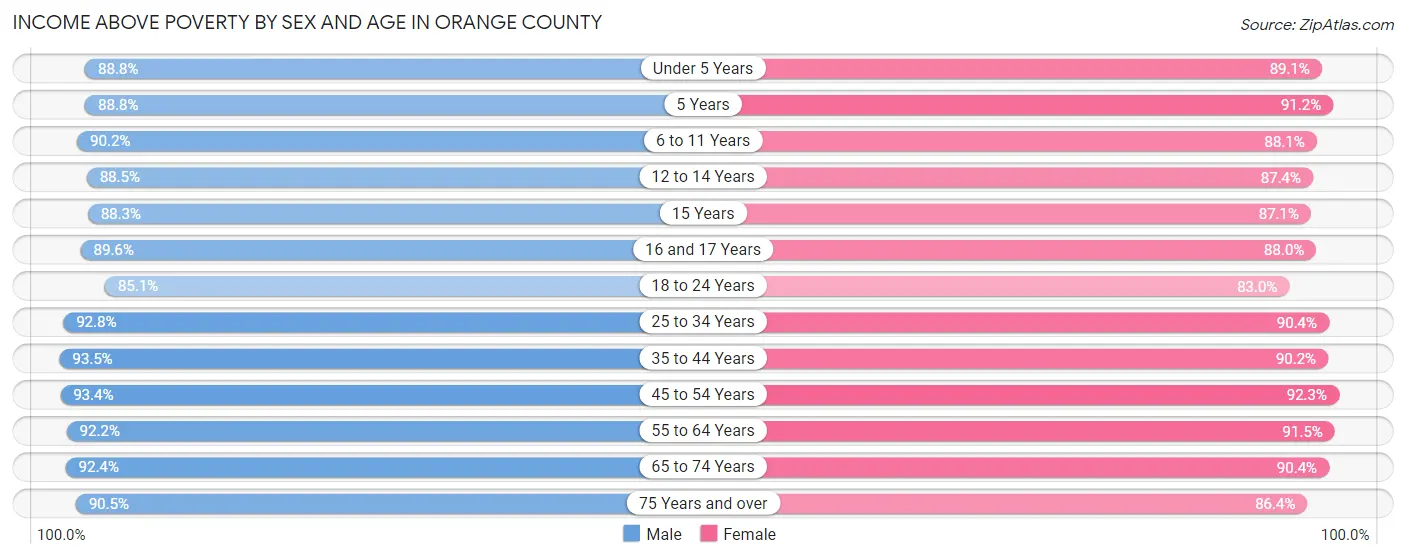
| Age Bracket | Male | Female |
| Under 5 Years | 78,000 (88.8%) | 74,435 (89.1%) |
| 5 Years | 15,346 (88.8%) | 15,069 (91.2%) |
| 6 to 11 Years | 100,933 (90.2%) | 93,962 (88.1%) |
| 12 to 14 Years | 56,130 (88.5%) | 52,332 (87.4%) |
| 15 Years | 17,995 (88.3%) | 16,990 (87.1%) |
| 16 and 17 Years | 38,048 (89.6%) | 35,562 (88.0%) |
| 18 to 24 Years | 122,834 (85.1%) | 115,137 (83.0%) |
| 25 to 34 Years | 213,195 (92.8%) | 197,651 (90.4%) |
| 35 to 44 Years | 194,106 (93.5%) | 184,641 (90.2%) |
| 45 to 54 Years | 201,096 (93.4%) | 200,915 (92.2%) |
| 55 to 64 Years | 187,701 (92.2%) | 188,099 (91.5%) |
| 65 to 74 Years | 119,687 (92.4%) | 133,096 (90.4%) |
| 75 Years and over | 77,899 (90.5%) | 102,814 (86.4%) |
| Total | 1,422,970 (91.2%) | 1,410,703 (89.4%) |
Income Below Poverty Among Married-Couple Families in Orange County
The poverty statistics for married-couple families in Orange County show that 4.3% or 24,874 of the total 572,619 families live below the poverty line. Families with 5 or more children have the highest poverty rate of 20.6%, comprising of 614 families. On the other hand, families with no children have the lowest poverty rate of 3.7%, which includes 11,462 families.
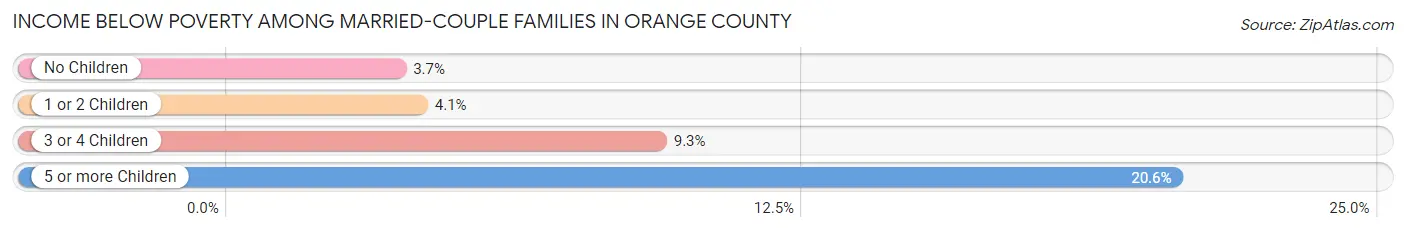
| Children | Above Poverty | Below Poverty |
| No Children | 301,609 (96.3%) | 11,462 (3.7%) |
| 1 or 2 Children | 205,331 (95.9%) | 8,843 (4.1%) |
| 3 or 4 Children | 38,434 (90.7%) | 3,955 (9.3%) |
| 5 or more Children | 2,371 (79.4%) | 614 (20.6%) |
| Total | 547,745 (95.7%) | 24,874 (4.3%) |
Income Below Poverty Among Single-Parent Households in Orange County
According to the poverty data in Orange County, 9.6% or 5,695 single-father households and 16.8% or 20,512 single-mother households are living below the poverty line. Among single-father households, those with 3 or 4 children have the highest poverty rate, with 1,048 households (26.1%) experiencing poverty. Likewise, among single-mother households, those with 5 or more children have the highest poverty rate, with 361 households (46.1%) falling below the poverty line.
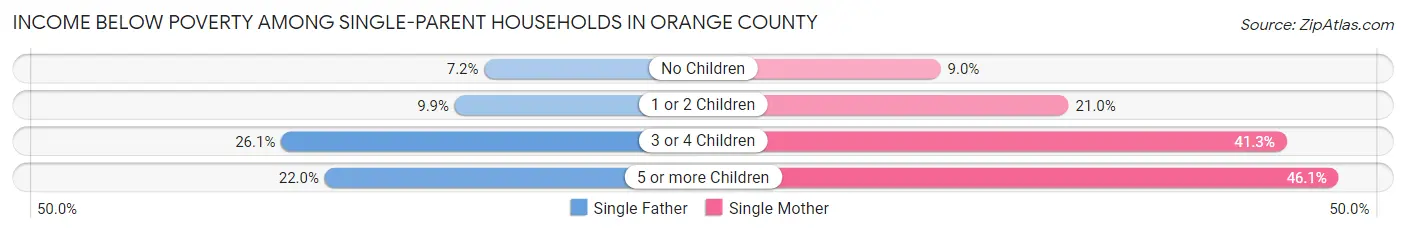
| Children | Single Father | Single Mother |
| No Children | 2,339 (7.2%) | 5,462 (9.0%) |
| 1 or 2 Children | 2,241 (9.9%) | 10,737 (20.9%) |
| 3 or 4 Children | 1,048 (26.1%) | 3,952 (41.2%) |
| 5 or more Children | 67 (22.0%) | 361 (46.1%) |
| Total | 5,695 (9.6%) | 20,512 (16.8%) |
Income Below Poverty Among Married-Couple vs Single-Parent Households in Orange County
The poverty data for Orange County shows that 24,874 of the married-couple family households (4.3%) and 26,207 of the single-parent households (14.4%) are living below the poverty level. Within the married-couple family households, those with 5 or more children have the highest poverty rate, with 614 households (20.6%) falling below the poverty line. Among the single-parent households, those with 5 or more children have the highest poverty rate, with 428 household (39.4%) living below poverty.
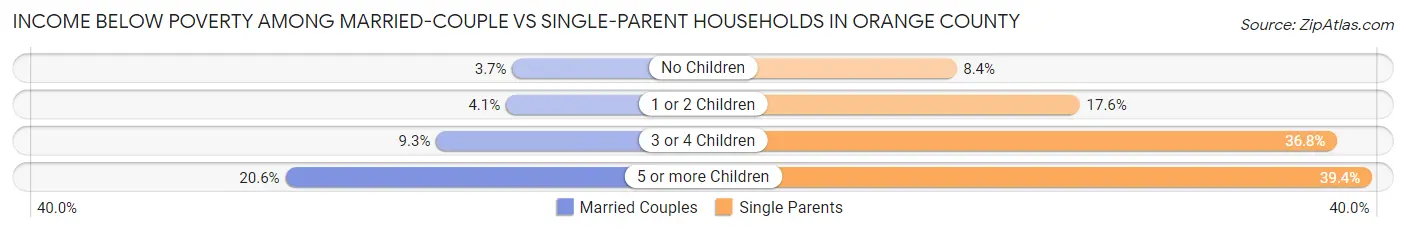
| Children | Married-Couple Families | Single-Parent Households |
| No Children | 11,462 (3.7%) | 7,801 (8.4%) |
| 1 or 2 Children | 8,843 (4.1%) | 12,978 (17.6%) |
| 3 or 4 Children | 3,955 (9.3%) | 5,000 (36.8%) |
| 5 or more Children | 614 (20.6%) | 428 (39.4%) |
| Total | 24,874 (4.3%) | 26,207 (14.4%) |
Race in Orange County
The most populous races in Orange County are White / Caucasian (1,594,137 | 50.2%), Hispanic or Latino (1,077,367 | 33.9%), and Asian (688,905 | 21.7%).
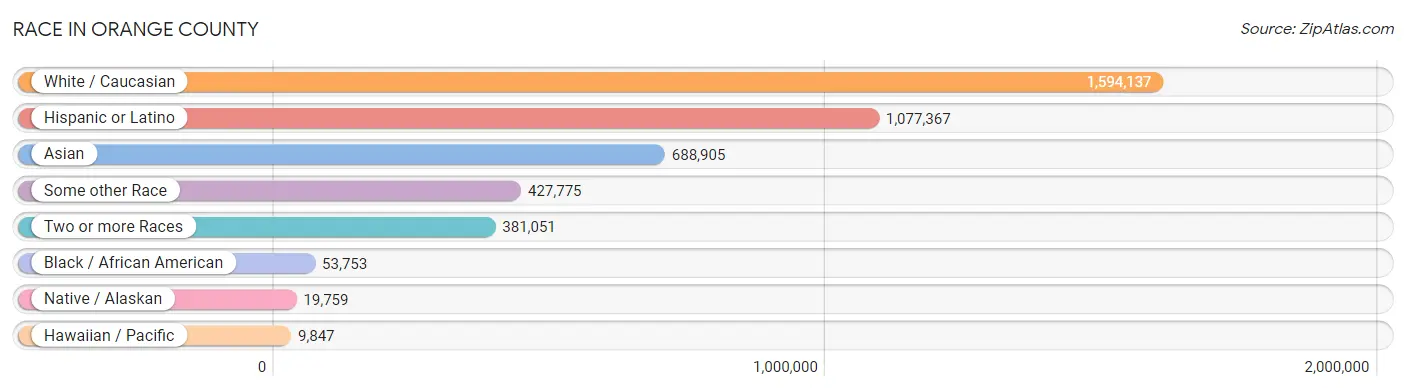
| Race | # Population | % Population |
| Asian | 688,905 | 21.7% |
| Black / African American | 53,753 | 1.7% |
| Hawaiian / Pacific | 9,847 | 0.3% |
| Hispanic or Latino | 1,077,367 | 33.9% |
| Native / Alaskan | 19,759 | 0.6% |
| White / Caucasian | 1,594,137 | 50.2% |
| Two or more Races | 381,051 | 12.0% |
| Some other Race | 427,775 | 13.5% |
| Total | 3,175,227 | 100.0% |
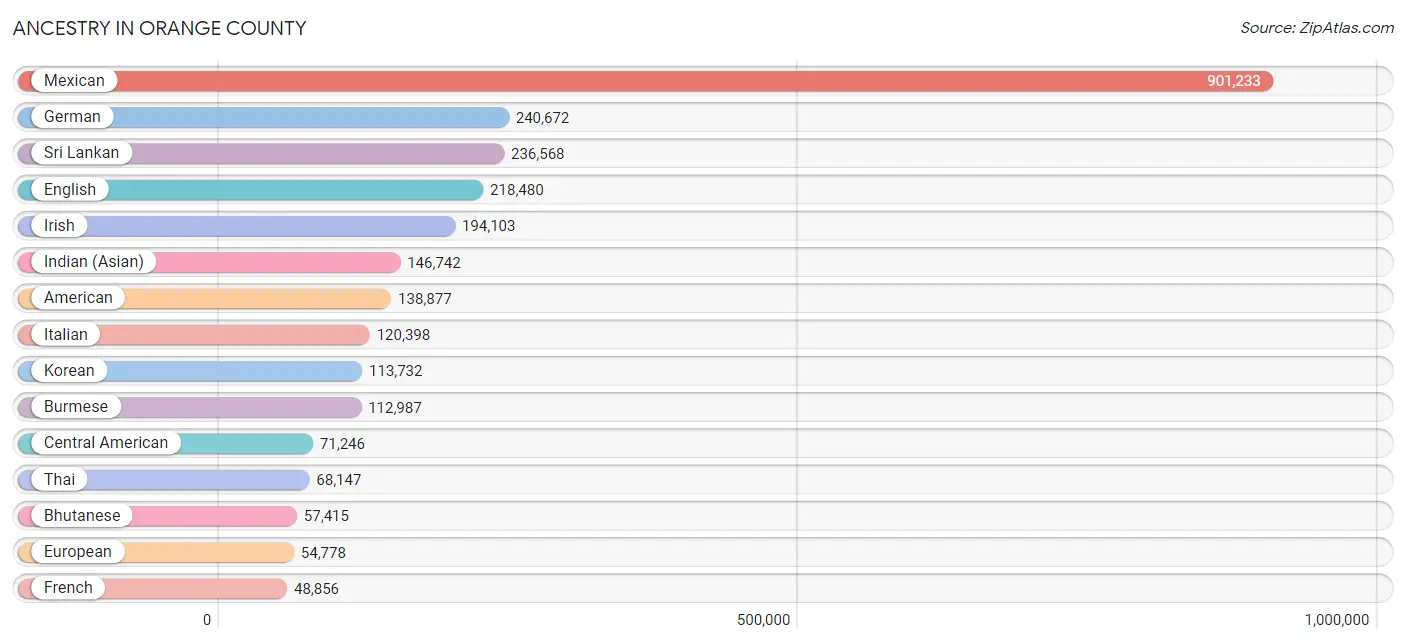
Ancestry in Orange County
The most populous ancestries reported in Orange County are Mexican (901,233 | 28.4%), German (240,672 | 7.6%), Sri Lankan (236,568 | 7.4%), English (218,480 | 6.9%), and Irish (194,103 | 6.1%), together accounting for 56.4% of all Orange County residents.
| Ancestry | # Population | % Population |
| Afghan | 4,695 | 0.2% |
| African | 4,109 | 0.1% |
| Alaska Native | 3 | 0.0% |
| Alaskan Athabascan | 38 | 0.0% |
| Albanian | 573 | 0.0% |
| Aleut | 61 | 0.0% |
| Alsatian | 41 | 0.0% |
| American | 138,877 | 4.4% |
| Apache | 1,462 | 0.1% |
| Arab | 38,584 | 1.2% |
| Arapaho | 13 | 0.0% |
| Argentinean | 6,579 | 0.2% |
| Armenian | 8,539 | 0.3% |
| Assyrian / Chaldean / Syriac | 938 | 0.0% |
| Australian | 1,421 | 0.0% |
| Austrian | 5,992 | 0.2% |
| Bahamian | 25 | 0.0% |
| Bangladeshi | 1,614 | 0.1% |
| Barbadian | 133 | 0.0% |
| Basque | 1,275 | 0.0% |
| Belgian | 2,384 | 0.1% |
| Belizean | 343 | 0.0% |
| Bhutanese | 57,415 | 1.8% |
| Blackfeet | 1,051 | 0.0% |
| Bolivian | 2,763 | 0.1% |
| Brazilian | 3,819 | 0.1% |
| British | 17,759 | 0.6% |
| British West Indian | 55 | 0.0% |
| Bulgarian | 940 | 0.0% |
| Burmese | 112,987 | 3.6% |
| Cajun | 99 | 0.0% |
| Cambodian | 302 | 0.0% |
| Canadian | 8,165 | 0.3% |
| Cape Verdean | 123 | 0.0% |
| Carpatho Rusyn | 34 | 0.0% |
| Celtic | 334 | 0.0% |
| Central American | 71,246 | 2.2% |
| Central American Indian | 4,157 | 0.1% |
| Cherokee | 5,586 | 0.2% |
| Cheyenne | 99 | 0.0% |
| Chickasaw | 272 | 0.0% |
| Chilean | 2,056 | 0.1% |
| Chinese | 224 | 0.0% |
| Chippewa | 686 | 0.0% |
| Choctaw | 1,681 | 0.1% |
| Colombian | 9,466 | 0.3% |
| Colville | 20 | 0.0% |
| Comanche | 247 | 0.0% |
| Costa Rican | 3,291 | 0.1% |
| Cree | 82 | 0.0% |
| Creek | 583 | 0.0% |
| Croatian | 4,414 | 0.1% |
| Crow | 16 | 0.0% |
| Cuban | 9,076 | 0.3% |
| Czech | 7,436 | 0.2% |
| Czechoslovakian | 1,763 | 0.1% |
| Danish | 11,975 | 0.4% |
| Delaware | 75 | 0.0% |
| Dominican | 1,125 | 0.0% |
| Dutch | 27,266 | 0.9% |
| Eastern European | 9,120 | 0.3% |
| Ecuadorian | 4,604 | 0.1% |
| Egyptian | 10,253 | 0.3% |
| English | 218,480 | 6.9% |
| Estonian | 580 | 0.0% |
| Ethiopian | 1,580 | 0.1% |
| European | 54,778 | 1.7% |
| Fijian | 69 | 0.0% |
| Filipino | 18,067 | 0.6% |
| Finnish | 3,480 | 0.1% |
| French | 48,856 | 1.5% |
| French American Indian | 136 | 0.0% |
| French Canadian | 8,967 | 0.3% |
| German | 240,672 | 7.6% |
| German Russian | 81 | 0.0% |
| Ghanaian | 302 | 0.0% |
| Greek | 11,070 | 0.4% |
| Guamanian / Chamorro | 2,602 | 0.1% |
| Guatemalan | 23,117 | 0.7% |
| Guyanese | 405 | 0.0% |
| Haitian | 406 | 0.0% |
| Hmong | 13 | 0.0% |
| Honduran | 3,687 | 0.1% |
| Hopi | 118 | 0.0% |
| Hungarian | 9,921 | 0.3% |
| Icelander | 719 | 0.0% |
| Indian (Asian) | 146,742 | 4.6% |
| Indonesian | 730 | 0.0% |
| Inupiat | 16 | 0.0% |
| Iranian | 34,582 | 1.1% |
| Iraqi | 1,004 | 0.0% |
| Irish | 194,103 | 6.1% |
| Iroquois | 601 | 0.0% |
| Israeli | 1,743 | 0.1% |
| Italian | 120,398 | 3.8% |
| Jamaican | 1,242 | 0.0% |
| Japanese | 10,510 | 0.3% |
| Jordanian | 2,562 | 0.1% |
| Kenyan | 852 | 0.0% |
| Korean | 113,732 | 3.6% |
| Laotian | 6,369 | 0.2% |
| Latvian | 655 | 0.0% |
| Lebanese | 8,366 | 0.3% |
| Lithuanian | 3,469 | 0.1% |
| Lumbee | 6 | 0.0% |
| Luxembourger | 159 | 0.0% |
| Macedonian | 394 | 0.0% |
| Malaysian | 3,867 | 0.1% |
| Maltese | 362 | 0.0% |
| Menominee | 21 | 0.0% |
| Mexican | 901,233 | 28.4% |
| Mexican American Indian | 11,515 | 0.4% |
| Mongolian | 688 | 0.0% |
| Moroccan | 1,010 | 0.0% |
| Native Hawaiian | 7,340 | 0.2% |
| Navajo | 1,540 | 0.1% |
| Nepalese | 22 | 0.0% |
| New Zealander | 441 | 0.0% |
| Nicaraguan | 3,769 | 0.1% |
| Nigerian | 1,744 | 0.1% |
| Northern European | 5,701 | 0.2% |
| Norwegian | 29,463 | 0.9% |
| Okinawan | 238 | 0.0% |
| Osage | 183 | 0.0% |
| Ottawa | 57 | 0.0% |
| Paiute | 25 | 0.0% |
| Pakistani | 7,913 | 0.3% |
| Palestinian | 2,656 | 0.1% |
| Panamanian | 1,299 | 0.0% |
| Paraguayan | 121 | 0.0% |
| Pennsylvania German | 411 | 0.0% |
| Peruvian | 8,988 | 0.3% |
| Pima | 128 | 0.0% |
| Polish | 43,842 | 1.4% |
| Portuguese | 10,748 | 0.3% |
| Potawatomi | 354 | 0.0% |
| Pueblo | 694 | 0.0% |
| Puerto Rican | 13,224 | 0.4% |
| Puget Sound Salish | 89 | 0.0% |
| Romanian | 8,236 | 0.3% |
| Russian | 26,043 | 0.8% |
| Salvadoran | 35,105 | 1.1% |
| Samoan | 5,514 | 0.2% |
| Scandinavian | 10,169 | 0.3% |
| Scotch-Irish | 14,890 | 0.5% |
| Scottish | 40,574 | 1.3% |
| Seminole | 233 | 0.0% |
| Senegalese | 4 | 0.0% |
| Serbian | 1,918 | 0.1% |
| Shoshone | 138 | 0.0% |
| Sioux | 705 | 0.0% |
| Slavic | 860 | 0.0% |
| Slovak | 2,999 | 0.1% |
| Slovene | 1,081 | 0.0% |
| Somali | 220 | 0.0% |
| South African | 1,660 | 0.1% |
| South American | 38,715 | 1.2% |
| South American Indian | 486 | 0.0% |
| Soviet Union | 24 | 0.0% |
| Spaniard | 12,675 | 0.4% |
| Spanish | 12,747 | 0.4% |
| Spanish American | 393 | 0.0% |
| Spanish American Indian | 63 | 0.0% |
| Sri Lankan | 236,568 | 7.4% |
| Subsaharan African | 11,283 | 0.4% |
| Sudanese | 237 | 0.0% |
| Swedish | 32,282 | 1.0% |
| Swiss | 5,837 | 0.2% |
| Syrian | 4,319 | 0.1% |
| Taiwanese | 68 | 0.0% |
| Thai | 68,147 | 2.1% |
| Tohono O'Odham | 130 | 0.0% |
| Tongan | 1,101 | 0.0% |
| Trinidadian and Tobagonian | 633 | 0.0% |
| Turkish | 4,036 | 0.1% |
| U.S. Virgin Islander | 5 | 0.0% |
| Ugandan | 89 | 0.0% |
| Ukrainian | 6,966 | 0.2% |
| Uruguayan | 862 | 0.0% |
| Ute | 74 | 0.0% |
| Venezuelan | 2,442 | 0.1% |
| Vietnamese | 1,734 | 0.1% |
| Welsh | 12,664 | 0.4% |
| West Indian | 343 | 0.0% |
| Yakama | 56 | 0.0% |
| Yaqui | 1,089 | 0.0% |
| Yugoslavian | 1,689 | 0.1% |
| Yup'ik | 9 | 0.0% |
| Zimbabwean | 74 | 0.0% | View All 189 Rows |
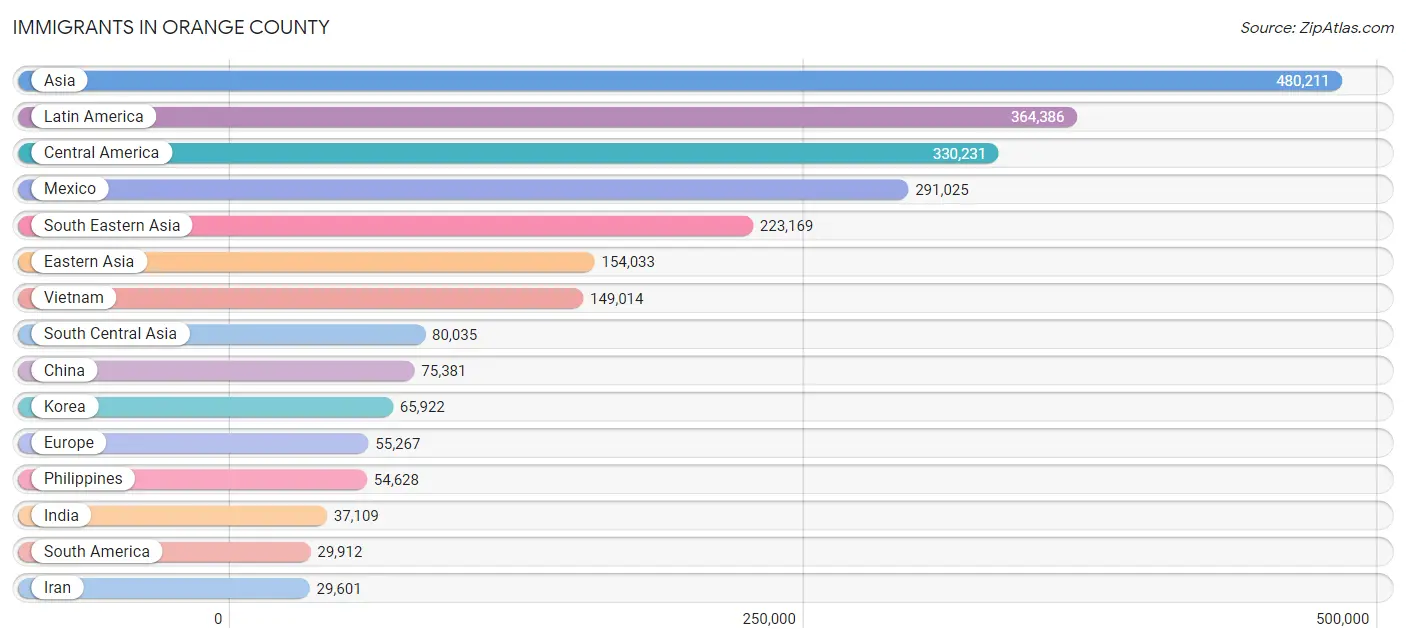
Immigrants in Orange County
The most numerous immigrant groups reported in Orange County came from Asia (480,211 | 15.1%), Latin America (364,386 | 11.5%), Central America (330,231 | 10.4%), Mexico (291,025 | 9.2%), and South Eastern Asia (223,169 | 7.0%), together accounting for 53.2% of all Orange County residents.
| Immigration Origin | # Population | % Population |
| Afghanistan | 3,724 | 0.1% |
| Africa | 19,283 | 0.6% |
| Albania | 159 | 0.0% |
| Argentina | 3,805 | 0.1% |
| Armenia | 1,119 | 0.0% |
| Asia | 480,211 | 15.1% |
| Australia | 1,924 | 0.1% |
| Austria | 555 | 0.0% |
| Azores | 24 | 0.0% |
| Bahamas | 8 | 0.0% |
| Bangladesh | 1,574 | 0.1% |
| Barbados | 68 | 0.0% |
| Belarus | 480 | 0.0% |
| Belgium | 540 | 0.0% |
| Belize | 143 | 0.0% |
| Bolivia | 1,807 | 0.1% |
| Bosnia and Herzegovina | 316 | 0.0% |
| Brazil | 5,037 | 0.2% |
| Bulgaria | 1,011 | 0.0% |
| Cabo Verde | 11 | 0.0% |
| Cambodia | 5,667 | 0.2% |
| Cameroon | 34 | 0.0% |
| Canada | 13,171 | 0.4% |
| Caribbean | 4,243 | 0.1% |
| Central America | 330,231 | 10.4% |
| Chile | 1,233 | 0.0% |
| China | 75,381 | 2.4% |
| Colombia | 5,840 | 0.2% |
| Congo | 51 | 0.0% |
| Costa Rica | 1,286 | 0.0% |
| Croatia | 337 | 0.0% |
| Cuba | 2,040 | 0.1% |
| Czechoslovakia | 1,391 | 0.0% |
| Denmark | 515 | 0.0% |
| Dominica | 24 | 0.0% |
| Dominican Republic | 331 | 0.0% |
| Eastern Africa | 4,194 | 0.1% |
| Eastern Asia | 154,033 | 4.9% |
| Eastern Europe | 22,112 | 0.7% |
| Ecuador | 2,291 | 0.1% |
| Egypt | 8,425 | 0.3% |
| El Salvador | 19,991 | 0.6% |
| England | 5,760 | 0.2% |
| Eritrea | 162 | 0.0% |
| Ethiopia | 1,402 | 0.0% |
| Europe | 55,267 | 1.7% |
| Fiji | 843 | 0.0% |
| France | 3,082 | 0.1% |
| Germany | 6,454 | 0.2% |
| Ghana | 176 | 0.0% |
| Greece | 768 | 0.0% |
| Grenada | 73 | 0.0% |
| Guatemala | 13,266 | 0.4% |
| Guyana | 456 | 0.0% |
| Haiti | 200 | 0.0% |
| Honduras | 2,086 | 0.1% |
| Hong Kong | 5,296 | 0.2% |
| Hungary | 1,314 | 0.0% |
| India | 37,109 | 1.2% |
| Indonesia | 4,330 | 0.1% |
| Iran | 29,601 | 0.9% |
| Iraq | 1,331 | 0.0% |
| Ireland | 1,365 | 0.0% |
| Israel | 2,053 | 0.1% |
| Italy | 2,499 | 0.1% |
| Jamaica | 539 | 0.0% |
| Japan | 12,606 | 0.4% |
| Jordan | 2,745 | 0.1% |
| Kazakhstan | 325 | 0.0% |
| Kenya | 1,713 | 0.1% |
| Korea | 65,922 | 2.1% |
| Kuwait | 876 | 0.0% |
| Laos | 2,455 | 0.1% |
| Latin America | 364,386 | 11.5% |
| Latvia | 120 | 0.0% |
| Lebanon | 3,615 | 0.1% |
| Liberia | 26 | 0.0% |
| Lithuania | 175 | 0.0% |
| Malaysia | 1,353 | 0.0% |
| Mexico | 291,025 | 9.2% |
| Middle Africa | 168 | 0.0% |
| Moldova | 425 | 0.0% |
| Morocco | 655 | 0.0% |
| Nepal | 1,630 | 0.1% |
| Netherlands | 1,785 | 0.1% |
| Nicaragua | 1,704 | 0.1% |
| Nigeria | 817 | 0.0% |
| North Macedonia | 64 | 0.0% |
| Northern Africa | 9,695 | 0.3% |
| Northern Europe | 15,360 | 0.5% |
| Norway | 305 | 0.0% |
| Oceania | 4,936 | 0.2% |
| Pakistan | 4,768 | 0.2% |
| Panama | 637 | 0.0% |
| Peru | 7,362 | 0.2% |
| Philippines | 54,628 | 1.7% |
| Poland | 2,161 | 0.1% |
| Portugal | 503 | 0.0% |
| Romania | 4,454 | 0.1% |
| Russia | 5,037 | 0.2% |
| Saudi Arabia | 1,571 | 0.1% |
| Scotland | 1,054 | 0.0% |
| Senegal | 336 | 0.0% |
| Serbia | 446 | 0.0% |
| Sierra Leone | 112 | 0.0% |
| Singapore | 797 | 0.0% |
| Somalia | 42 | 0.0% |
| South Africa | 3,252 | 0.1% |
| South America | 29,912 | 0.9% |
| South Central Asia | 80,035 | 2.5% |
| South Eastern Asia | 223,169 | 7.0% |
| Southern Europe | 4,733 | 0.2% |
| Spain | 868 | 0.0% |
| Sri Lanka | 1,014 | 0.0% |
| St. Vincent and the Grenadines | 6 | 0.0% |
| Sudan | 309 | 0.0% |
| Sweden | 757 | 0.0% |
| Switzerland | 609 | 0.0% |
| Syria | 4,295 | 0.1% |
| Taiwan | 23,424 | 0.7% |
| Thailand | 4,004 | 0.1% |
| Trinidad and Tobago | 340 | 0.0% |
| Turkey | 3,177 | 0.1% |
| Uganda | 124 | 0.0% |
| Ukraine | 2,811 | 0.1% |
| Uruguay | 395 | 0.0% |
| Uzbekistan | 191 | 0.0% |
| Venezuela | 1,424 | 0.0% |
| Vietnam | 149,014 | 4.7% |
| West Indies | 310 | 0.0% |
| Western Africa | 1,557 | 0.1% |
| Western Asia | 21,941 | 0.7% |
| Western Europe | 13,025 | 0.4% |
| Yemen | 63 | 0.0% |
| Zaire | 46 | 0.0% |
| Zimbabwe | 249 | 0.0% | View All 136 Rows |
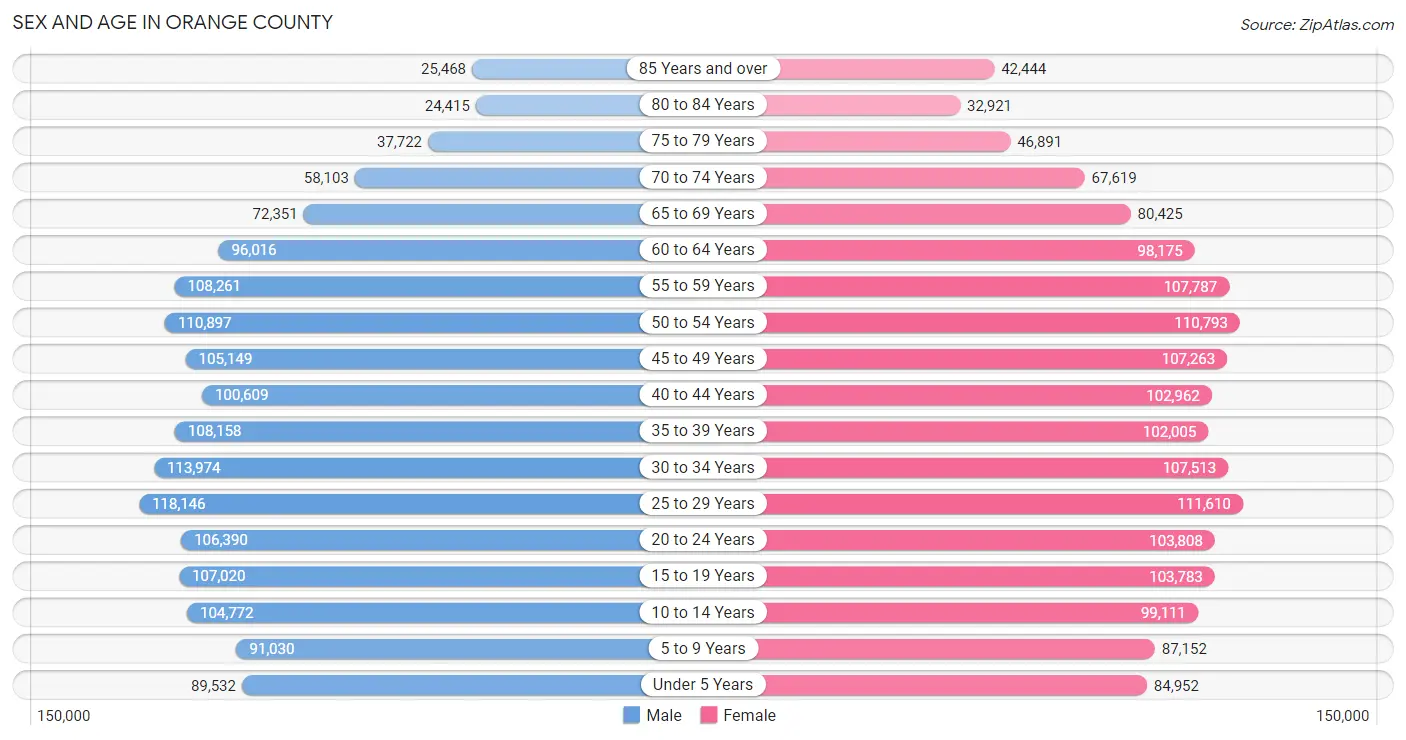
Sex and Age in Orange County
Sex and Age in Orange County
The most populous age groups in Orange County are 25 to 29 Years (118,146 | 7.5%) for men and 25 to 29 Years (111,610 | 7.0%) for women.
| Age Bracket | Male | Female |
| Under 5 Years | 89,532 (5.7%) | 84,952 (5.3%) |
| 5 to 9 Years | 91,030 (5.8%) | 87,152 (5.5%) |
| 10 to 14 Years | 104,772 (6.6%) | 99,111 (6.2%) |
| 15 to 19 Years | 107,020 (6.8%) | 103,783 (6.5%) |
| 20 to 24 Years | 106,390 (6.7%) | 103,808 (6.5%) |
| 25 to 29 Years | 118,146 (7.5%) | 111,610 (7.0%) |
| 30 to 34 Years | 113,974 (7.2%) | 107,513 (6.7%) |
| 35 to 39 Years | 108,158 (6.9%) | 102,005 (6.4%) |
| 40 to 44 Years | 100,609 (6.4%) | 102,962 (6.5%) |
| 45 to 49 Years | 105,149 (6.7%) | 107,263 (6.7%) |
| 50 to 54 Years | 110,897 (7.0%) | 110,793 (6.9%) |
| 55 to 59 Years | 108,261 (6.9%) | 107,787 (6.8%) |
| 60 to 64 Years | 96,016 (6.1%) | 98,175 (6.1%) |
| 65 to 69 Years | 72,351 (4.6%) | 80,425 (5.0%) |
| 70 to 74 Years | 58,103 (3.7%) | 67,619 (4.2%) |
| 75 to 79 Years | 37,722 (2.4%) | 46,891 (2.9%) |
| 80 to 84 Years | 24,415 (1.5%) | 32,921 (2.1%) |
| 85 Years and over | 25,468 (1.6%) | 42,444 (2.7%) |
| Total | 1,578,013 (100.0%) | 1,597,214 (100.0%) |
Families and Households in Orange County
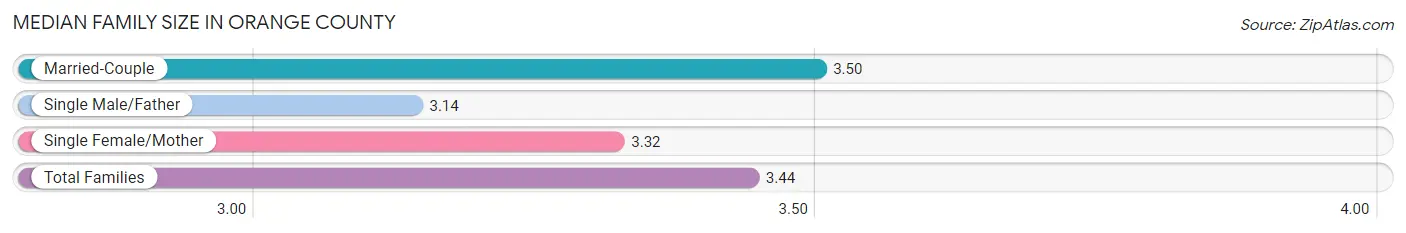
Median Family Size in Orange County
The median family size in Orange County is 3.44 persons per family, with married-couple families (572,619 | 75.9%) accounting for the largest median family size of 3.5 persons per family. On the other hand, single male/father families (59,443 | 7.9%) represent the smallest median family size with 3.14 persons per family.
| Family Type | # Families | Family Size |
| Married-Couple | 572,619 (75.9%) | 3.50 |
| Single Male/Father | 59,443 (7.9%) | 3.14 |
| Single Female/Mother | 122,070 (16.2%) | 3.32 |
| Total Families | 754,132 (100.0%) | 3.44 |
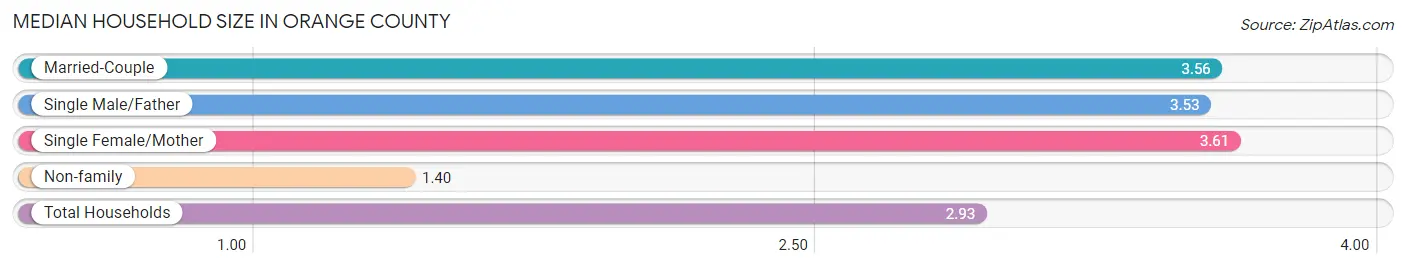
Median Household Size in Orange County
The median household size in Orange County is 2.93 persons per household, with single female/mother households (122,070 | 11.5%) accounting for the largest median household size of 3.61 persons per household. non-family households (312,154 | 29.3%) represent the smallest median household size with 1.40 persons per household.
| Household Type | # Households | Household Size |
| Married-Couple | 572,619 (53.7%) | 3.56 |
| Single Male/Father | 59,443 (5.6%) | 3.53 |
| Single Female/Mother | 122,070 (11.5%) | 3.61 |
| Non-family | 312,154 (29.3%) | 1.40 |
| Total Households | 1,066,286 (100.0%) | 2.93 |
Household Size by Marriage Status in Orange County
Out of a total of 1,066,286 households in Orange County, 754,132 (70.7%) are family households, while 312,154 (29.3%) are nonfamily households. The most numerous type of family households are 2-person households, comprising 264,566, and the most common type of nonfamily households are 1-person households, comprising 230,727.
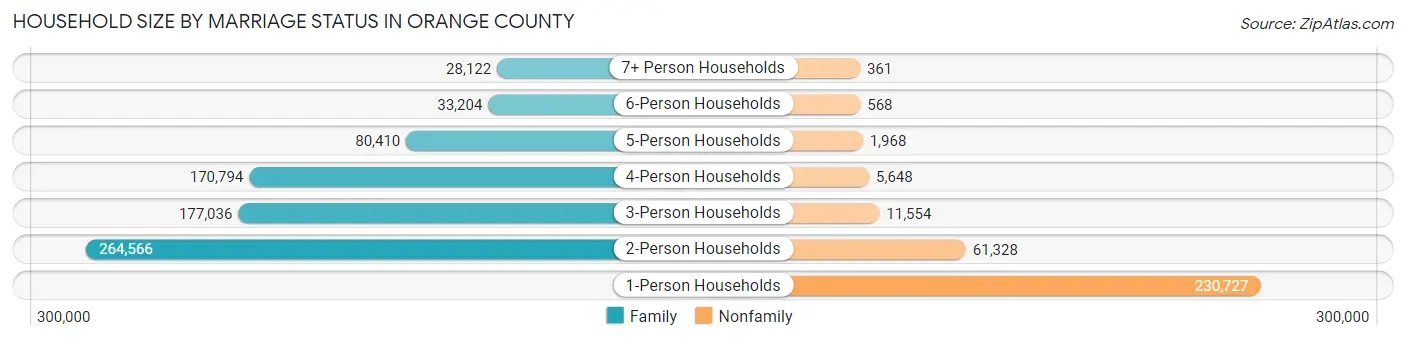
| Household Size | Family Households | Nonfamily Households |
| 1-Person Households | - | 230,727 (21.6%) |
| 2-Person Households | 264,566 (24.8%) | 61,328 (5.8%) |
| 3-Person Households | 177,036 (16.6%) | 11,554 (1.1%) |
| 4-Person Households | 170,794 (16.0%) | 5,648 (0.5%) |
| 5-Person Households | 80,410 (7.5%) | 1,968 (0.2%) |
| 6-Person Households | 33,204 (3.1%) | 568 (0.1%) |
| 7+ Person Households | 28,122 (2.6%) | 361 (0.0%) |
| Total | 754,132 (70.7%) | 312,154 (29.3%) |
Female Fertility in Orange County
Fertility by Age in Orange County
Average fertility rate in Orange County is 45.0 births per 1,000 women. Women in the age bracket of 20 to 34 years have the highest fertility rate with 65.0 births per 1,000 women. Women in the age bracket of 20 to 34 years acount for 61.9% of all women with births.
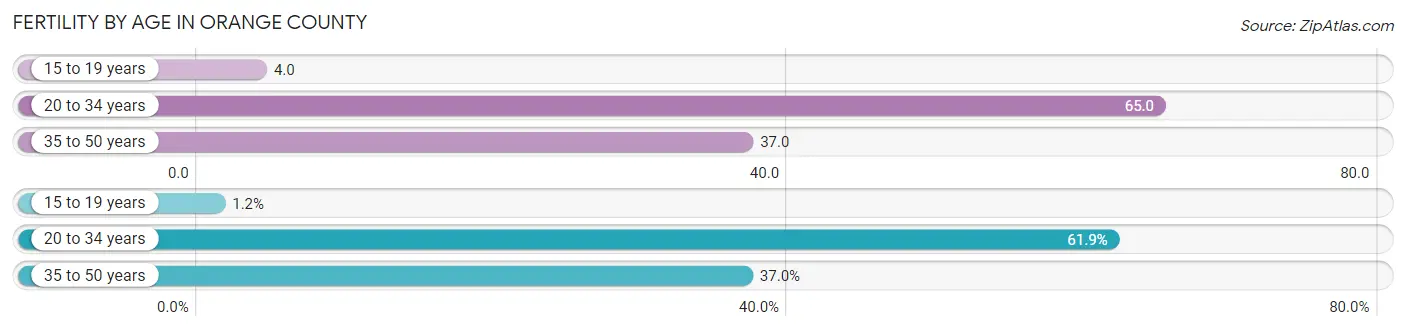
| Age Bracket | Women with Births | Births / 1,000 Women |
| 15 to 19 years | 397 (1.2%) | 4.0 |
| 20 to 34 years | 21,051 (61.9%) | 65.0 |
| 35 to 50 years | 12,587 (37.0%) | 37.0 |
| Total | 34,035 (100.0%) | 45.0 |
Fertility by Age by Marriage Status in Orange County
79.2% of women with births (34,035) in Orange County are married. The highest percentage of unmarried women with births falls into 15 to 19 years age bracket with 73.6% of them unmarried at the time of birth, while the lowest percentage of unmarried women with births belong to 35 to 50 years age bracket with 13.5% of them unmarried.
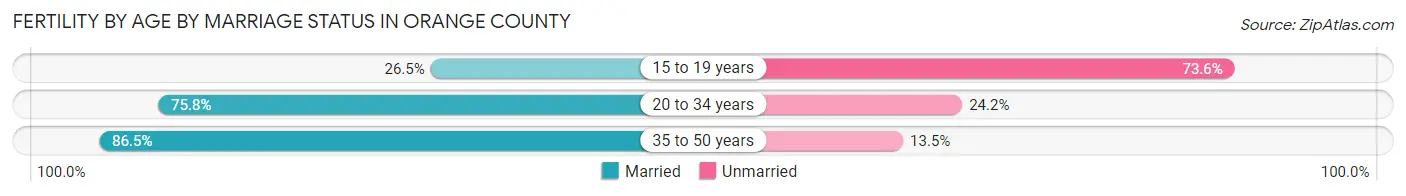
| Age Bracket | Married | Unmarried |
| 15 to 19 years | 105 (26.5%) | 292 (73.6%) |
| 20 to 34 years | 15,957 (75.8%) | 5,094 (24.2%) |
| 35 to 50 years | 10,888 (86.5%) | 1,699 (13.5%) |
| Total | 26,956 (79.2%) | 7,079 (20.8%) |
Fertility by Education in Orange County
Average fertility rate in Orange County is 45.0 births per 1,000 women. Women with the education attainment of graduate degree have the highest fertility rate of 66.0 births per 1,000 women, while women with the education attainment of less than high school have the lowest fertility at 25.0 births per 1,000 women. Women with the education attainment of bachelor's degree represent 32.8% of all women with births.
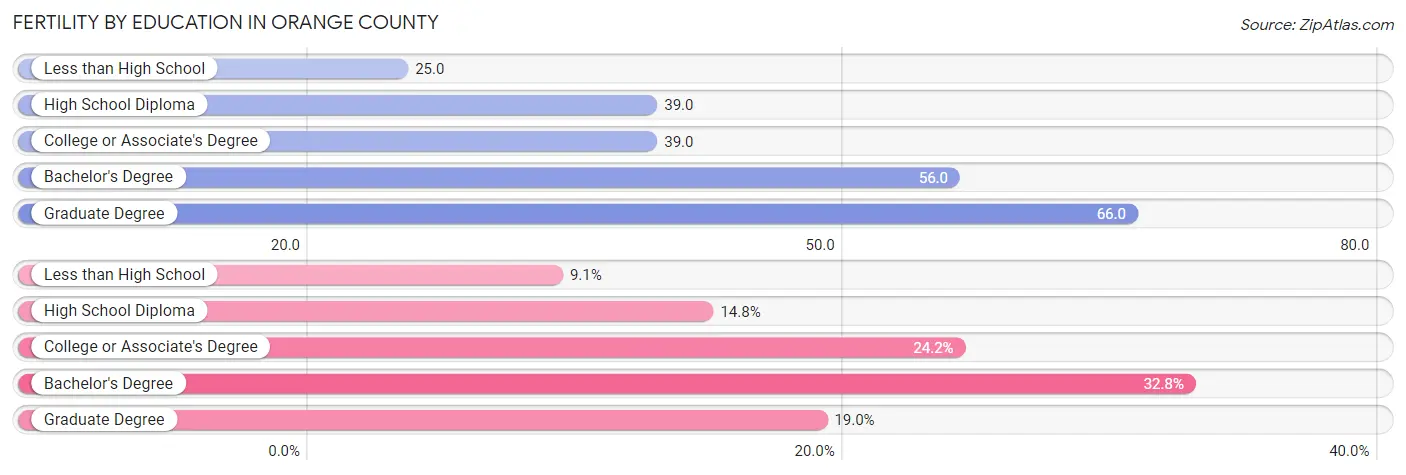
| Educational Attainment | Women with Births | Births / 1,000 Women |
| Less than High School | 3,109 (9.1%) | 25.0 |
| High School Diploma | 5,027 (14.8%) | 39.0 |
| College or Associate's Degree | 8,241 (24.2%) | 39.0 |
| Bachelor's Degree | 11,178 (32.8%) | 56.0 |
| Graduate Degree | 6,480 (19.0%) | 66.0 |
| Total | 34,035 (100.0%) | 45.0 |
Fertility by Education by Marriage Status in Orange County
20.8% of women with births in Orange County are unmarried. Women with the educational attainment of bachelor's degree are most likely to be married with 91.5% of them married at childbirth, while women with the educational attainment of less than high school are least likely to be married with 42.5% of them unmarried at childbirth.
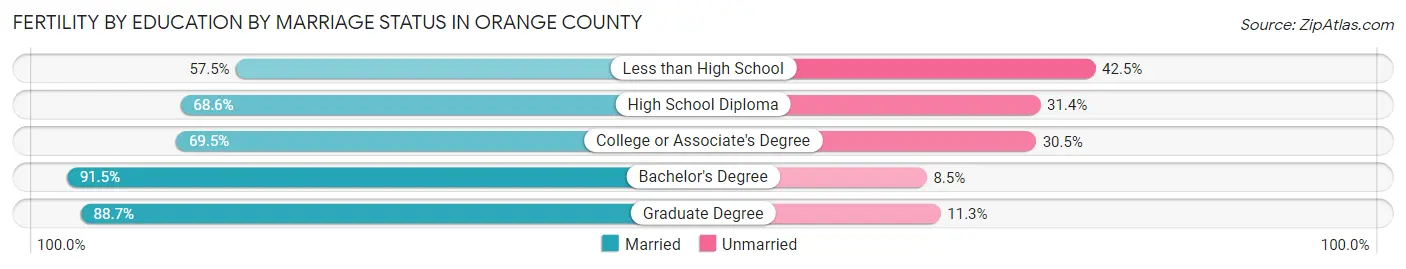
| Educational Attainment | Married | Unmarried |
| Less than High School | 1,788 (57.5%) | 1,321 (42.5%) |
| High School Diploma | 3,449 (68.6%) | 1,578 (31.4%) |
| College or Associate's Degree | 5,727 (69.5%) | 2,514 (30.5%) |
| Bachelor's Degree | 10,228 (91.5%) | 950 (8.5%) |
| Graduate Degree | 5,748 (88.7%) | 732 (11.3%) |
| Total | 26,956 (79.2%) | 7,079 (20.8%) |
Employment Characteristics in Orange County
Employment by Class of Employer in Orange County
Among the 1,563,277 employed individuals in Orange County, private company employees (1,091,898 | 69.9%), self-employed (not incorporated) (114,918 | 7.3%), and local government employees (109,186 | 7.0%) make up the most common classes of employment.
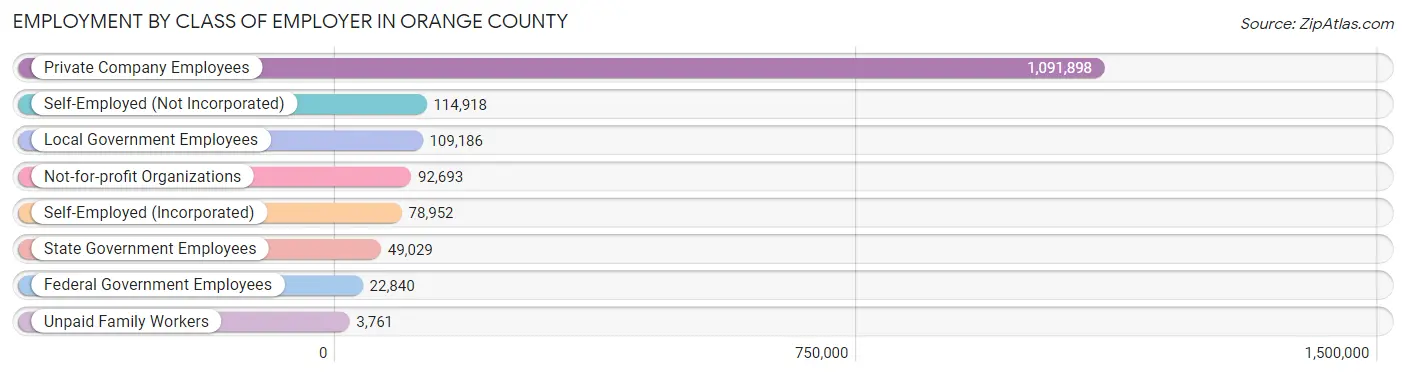
| Employer Class | # Employees | % Employees |
| Private Company Employees | 1,091,898 | 69.9% |
| Self-Employed (Incorporated) | 78,952 | 5.1% |
| Self-Employed (Not Incorporated) | 114,918 | 7.3% |
| Not-for-profit Organizations | 92,693 | 5.9% |
| Local Government Employees | 109,186 | 7.0% |
| State Government Employees | 49,029 | 3.1% |
| Federal Government Employees | 22,840 | 1.5% |
| Unpaid Family Workers | 3,761 | 0.2% |
| Total | 1,563,277 | 100.0% |
Employment Status by Age in Orange County
According to the labor force statistics for Orange County, out of the total population over 16 years of age (2,578,680), 65.6% or 1,691,614 individuals are in the labor force, with 5.4% or 91,347 of them unemployed. The age group with the highest labor force participation rate is 25 to 29 years, with 85.3% or 195,982 individuals in the labor force. Within the labor force, the 16 to 19 years age range has the highest percentage of unemployed individuals, with 14.3% or 7,963 of them being unemployed.
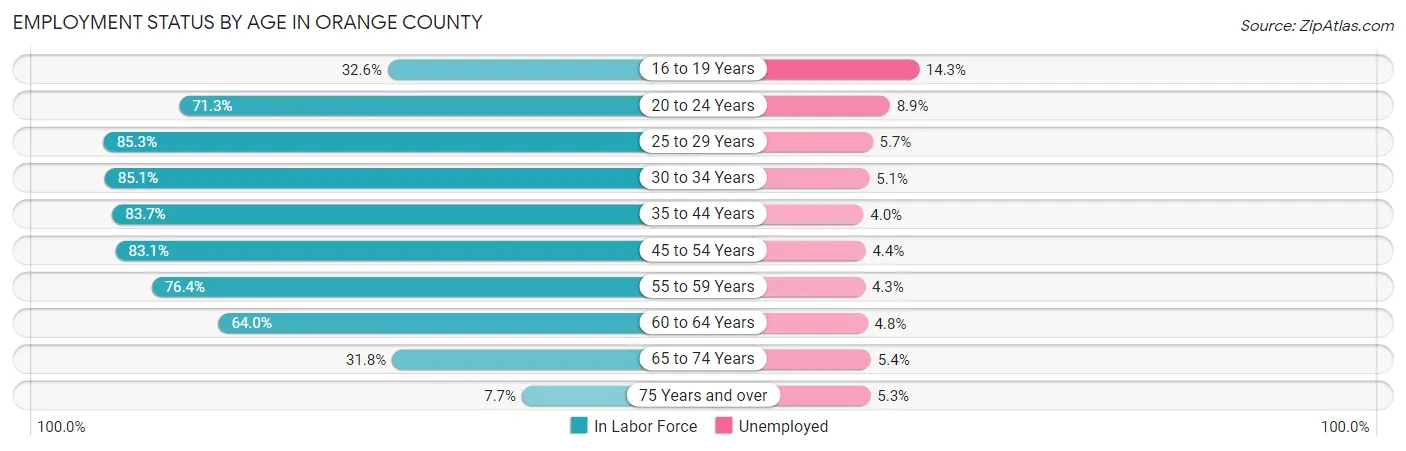
| Age Bracket | In Labor Force | Unemployed |
| 16 to 19 Years | 55,682 (32.6%) | 7,963 (14.3%) |
| 20 to 24 Years | 149,871 (71.3%) | 13,339 (8.9%) |
| 25 to 29 Years | 195,982 (85.3%) | 11,171 (5.7%) |
| 30 to 34 Years | 188,485 (85.1%) | 9,613 (5.1%) |
| 35 to 44 Years | 346,295 (83.7%) | 13,852 (4.0%) |
| 45 to 54 Years | 360,739 (83.1%) | 15,873 (4.4%) |
| 55 to 59 Years | 165,061 (76.4%) | 7,098 (4.3%) |
| 60 to 64 Years | 124,282 (64.0%) | 5,966 (4.8%) |
| 65 to 74 Years | 88,562 (31.8%) | 4,782 (5.4%) |
| 75 Years and over | 16,159 (7.7%) | 856 (5.3%) |
| Total | 1,691,614 (65.6%) | 91,347 (5.4%) |
Employment Status by Educational Attainment in Orange County
According to labor force statistics for Orange County, 80.8% of individuals (1,381,129) out of the total population between 25 and 64 years of age (1,709,318) are in the labor force, with 4.6% or 63,532 of them being unemployed. The group with the highest labor force participation rate are those with the educational attainment of bachelor's degree or higher, with 85.7% or 643,027 individuals in the labor force. Within the labor force, individuals with less than high school education have the highest percentage of unemployment, with 5.7% or 8,491 of them being unemployed.
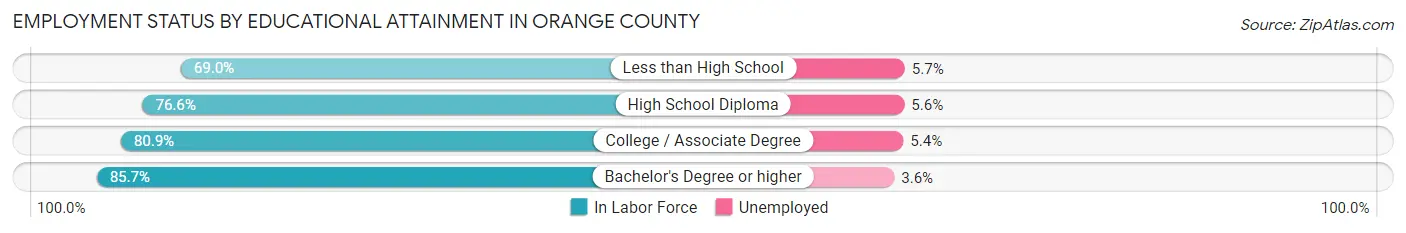
| Educational Attainment | In Labor Force | Unemployed |
| Less than High School | 148,959 (69.0%) | 12,305 (5.7%) |
| High School Diploma | 222,526 (76.6%) | 16,268 (5.6%) |
| College / Associate Degree | 366,160 (80.9%) | 24,441 (5.4%) |
| Bachelor's Degree or higher | 643,027 (85.7%) | 27,012 (3.6%) |
| Total | 1,381,129 (80.8%) | 78,629 (4.6%) |
Employment Occupations by Sex in Orange County
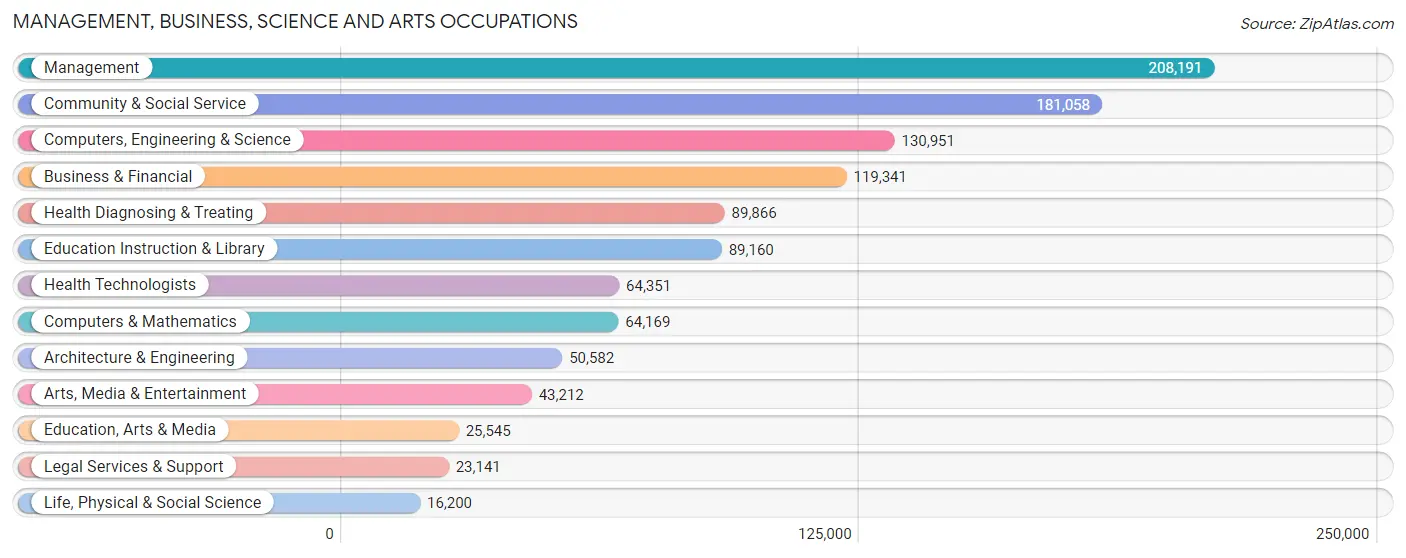
Management, Business, Science and Arts Occupations
The most common Management, Business, Science and Arts occupations in Orange County are Management (208,191 | 13.0%), Community & Social Service (181,058 | 11.3%), Computers, Engineering & Science (130,951 | 8.2%), Business & Financial (119,341 | 7.5%), and Health Diagnosing & Treating (89,866 | 5.6%).
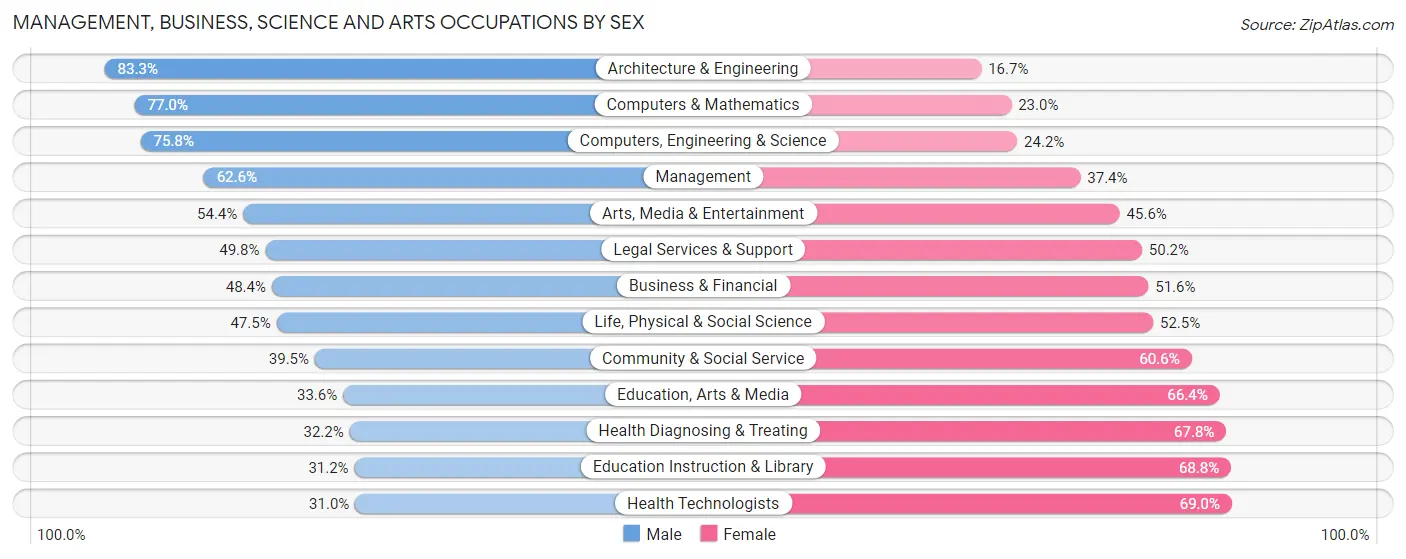
Management, Business, Science and Arts Occupations by Sex
Within the Management, Business, Science and Arts occupations in Orange County, the most male-oriented occupations are Architecture & Engineering (83.3%), Computers & Mathematics (77.0%), and Computers, Engineering & Science (75.8%), while the most female-oriented occupations are Health Technologists (69.0%), Education Instruction & Library (68.8%), and Health Diagnosing & Treating (67.8%).
| Occupation | Male | Female |
| Management | 130,376 (62.6%) | 77,815 (37.4%) |
| Business & Financial | 57,811 (48.4%) | 61,530 (51.6%) |
| Computers, Engineering & Science | 99,260 (75.8%) | 31,691 (24.2%) |
| Computers & Mathematics | 49,437 (77.0%) | 14,732 (23.0%) |
| Architecture & Engineering | 42,135 (83.3%) | 8,447 (16.7%) |
| Life, Physical & Social Science | 7,688 (47.5%) | 8,512 (52.5%) |
| Community & Social Service | 71,424 (39.5%) | 109,634 (60.6%) |
| Education, Arts & Media | 8,578 (33.6%) | 16,967 (66.4%) |
| Legal Services & Support | 11,523 (49.8%) | 11,618 (50.2%) |
| Education Instruction & Library | 27,806 (31.2%) | 61,354 (68.8%) |
| Arts, Media & Entertainment | 23,517 (54.4%) | 19,695 (45.6%) |
| Health Diagnosing & Treating | 28,944 (32.2%) | 60,922 (67.8%) |
| Health Technologists | 19,976 (31.0%) | 44,375 (69.0%) |
| Total (Category) | 387,815 (53.2%) | 341,592 (46.8%) |
| Total (Overall) | 869,451 (54.4%) | 728,675 (45.6%) |
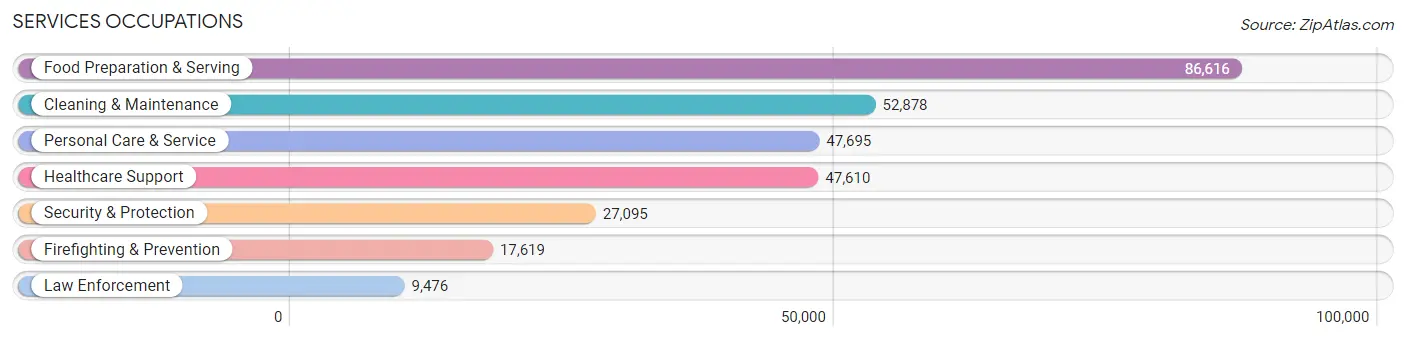
Services Occupations
The most common Services occupations in Orange County are Food Preparation & Serving (86,616 | 5.4%), Cleaning & Maintenance (52,878 | 3.3%), Personal Care & Service (47,695 | 3.0%), Healthcare Support (47,610 | 3.0%), and Security & Protection (27,095 | 1.7%).
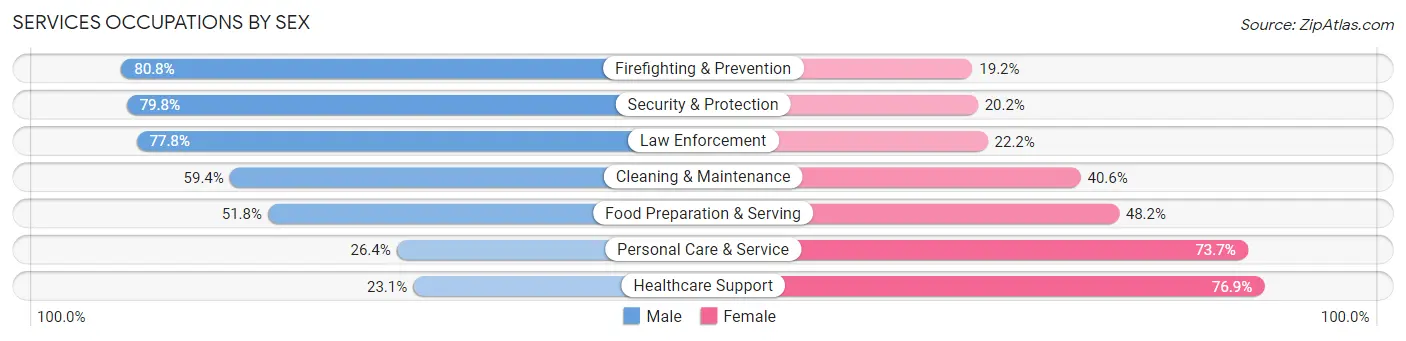
Services Occupations by Sex
Within the Services occupations in Orange County, the most male-oriented occupations are Firefighting & Prevention (80.8%), Security & Protection (79.8%), and Law Enforcement (77.8%), while the most female-oriented occupations are Healthcare Support (76.9%), Personal Care & Service (73.7%), and Food Preparation & Serving (48.2%).
| Occupation | Male | Female |
| Healthcare Support | 10,988 (23.1%) | 36,622 (76.9%) |
| Security & Protection | 21,614 (79.8%) | 5,481 (20.2%) |
| Firefighting & Prevention | 14,241 (80.8%) | 3,378 (19.2%) |
| Law Enforcement | 7,373 (77.8%) | 2,103 (22.2%) |
| Food Preparation & Serving | 44,902 (51.8%) | 41,714 (48.2%) |
| Cleaning & Maintenance | 31,408 (59.4%) | 21,470 (40.6%) |
| Personal Care & Service | 12,568 (26.4%) | 35,127 (73.7%) |
| Total (Category) | 121,480 (46.4%) | 140,414 (53.6%) |
| Total (Overall) | 869,451 (54.4%) | 728,675 (45.6%) |
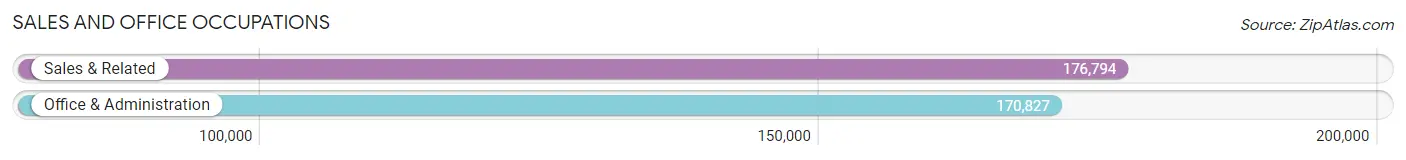
Sales and Office Occupations
The most common Sales and Office occupations in Orange County are Sales & Related (176,794 | 11.1%), and Office & Administration (170,827 | 10.7%).
Sales and Office Occupations by Sex
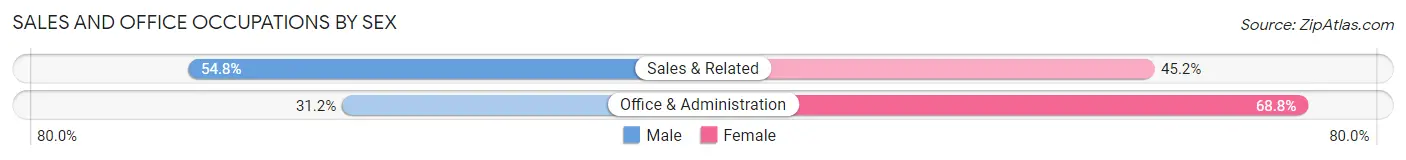
| Occupation | Male | Female |
| Sales & Related | 96,960 (54.8%) | 79,834 (45.2%) |
| Office & Administration | 53,253 (31.2%) | 117,574 (68.8%) |
| Total (Category) | 150,213 (43.2%) | 197,408 (56.8%) |
| Total (Overall) | 869,451 (54.4%) | 728,675 (45.6%) |
Natural Resources, Construction and Maintenance Occupations
The most common Natural Resources, Construction and Maintenance occupations in Orange County are Construction & Extraction (60,400 | 3.8%), Installation, Maintenance & Repair (30,950 | 1.9%), and Farming, Fishing & Forestry (5,920 | 0.4%).

Natural Resources, Construction and Maintenance Occupations by Sex
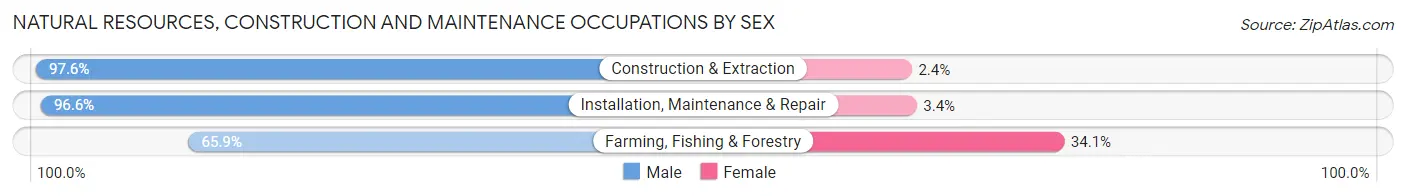
| Occupation | Male | Female |
| Farming, Fishing & Forestry | 3,900 (65.9%) | 2,020 (34.1%) |
| Construction & Extraction | 58,953 (97.6%) | 1,447 (2.4%) |
| Installation, Maintenance & Repair | 29,896 (96.6%) | 1,054 (3.4%) |
| Total (Category) | 92,749 (95.4%) | 4,521 (4.6%) |
| Total (Overall) | 869,451 (54.4%) | 728,675 (45.6%) |
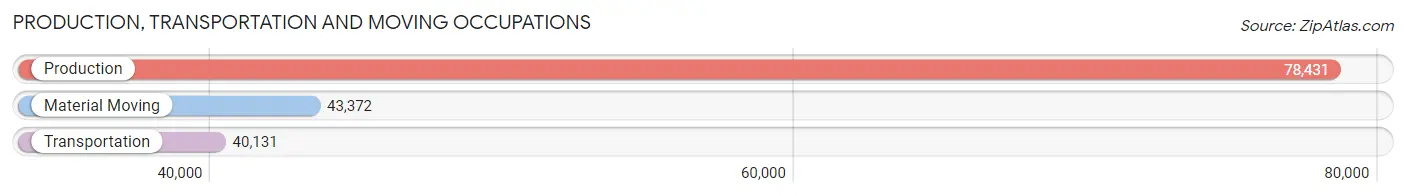
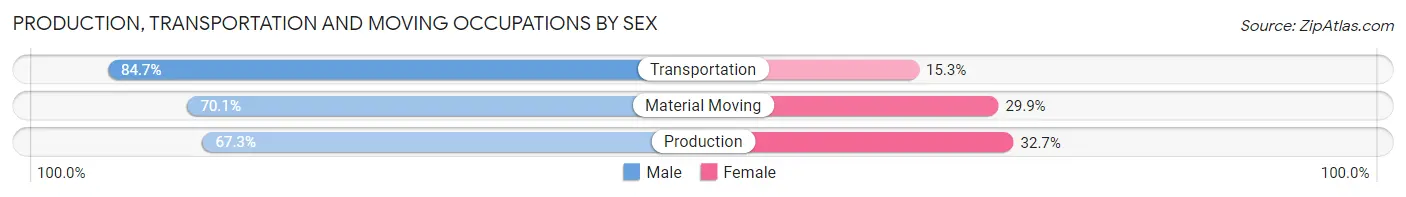
Production, Transportation and Moving Occupations
The most common Production, Transportation and Moving occupations in Orange County are Production (78,431 | 4.9%), Material Moving (43,372 | 2.7%), and Transportation (40,131 | 2.5%).
Production, Transportation and Moving Occupations by Sex
| Occupation | Male | Female |
| Production | 52,806 (67.3%) | 25,625 (32.7%) |
| Transportation | 33,982 (84.7%) | 6,149 (15.3%) |
| Material Moving | 30,406 (70.1%) | 12,966 (29.9%) |
| Total (Category) | 117,194 (72.4%) | 44,740 (27.6%) |
| Total (Overall) | 869,451 (54.4%) | 728,675 (45.6%) |
Employment Industries by Sex in Orange County
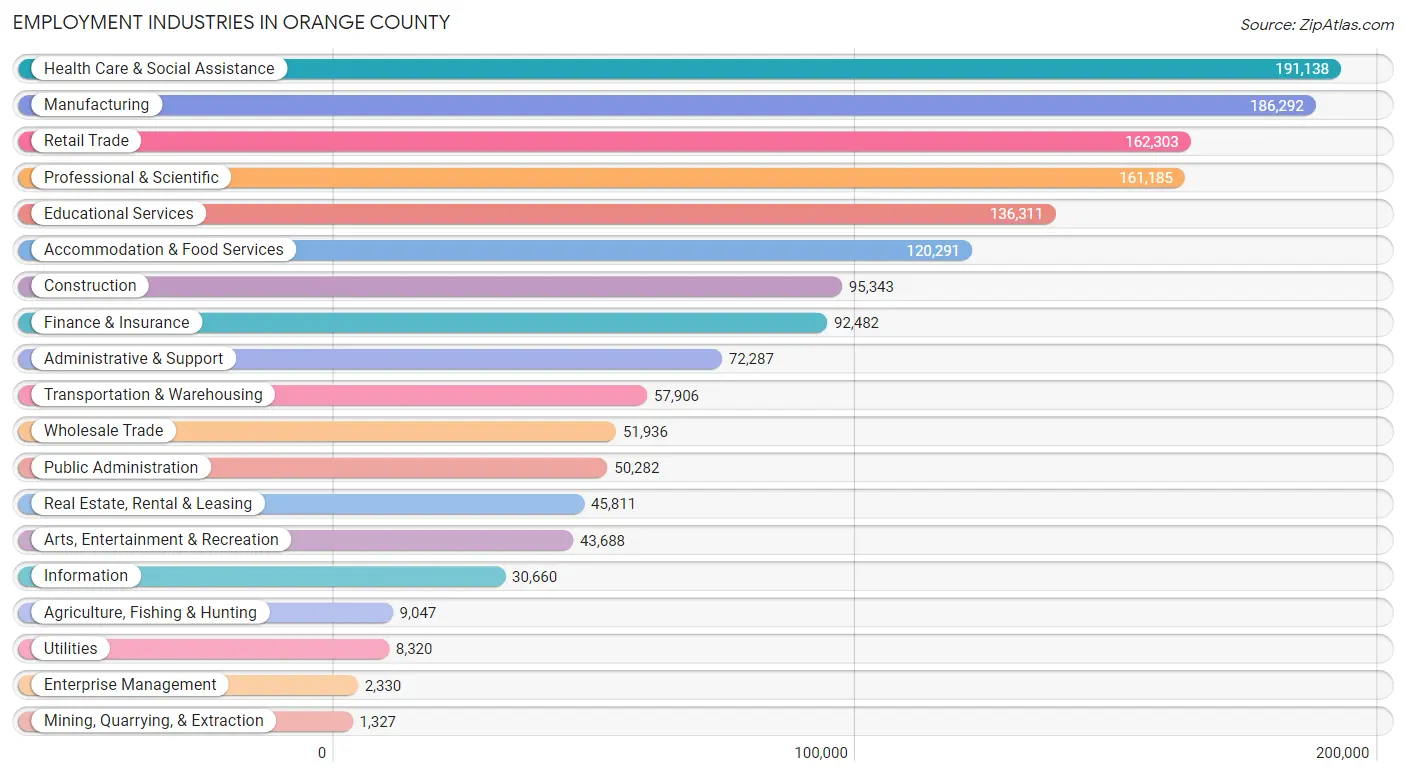
Employment Industries in Orange County
The major employment industries in Orange County include Health Care & Social Assistance (191,138 | 12.0%), Manufacturing (186,292 | 11.7%), Retail Trade (162,303 | 10.2%), Professional & Scientific (161,185 | 10.1%), and Educational Services (136,311 | 8.5%).
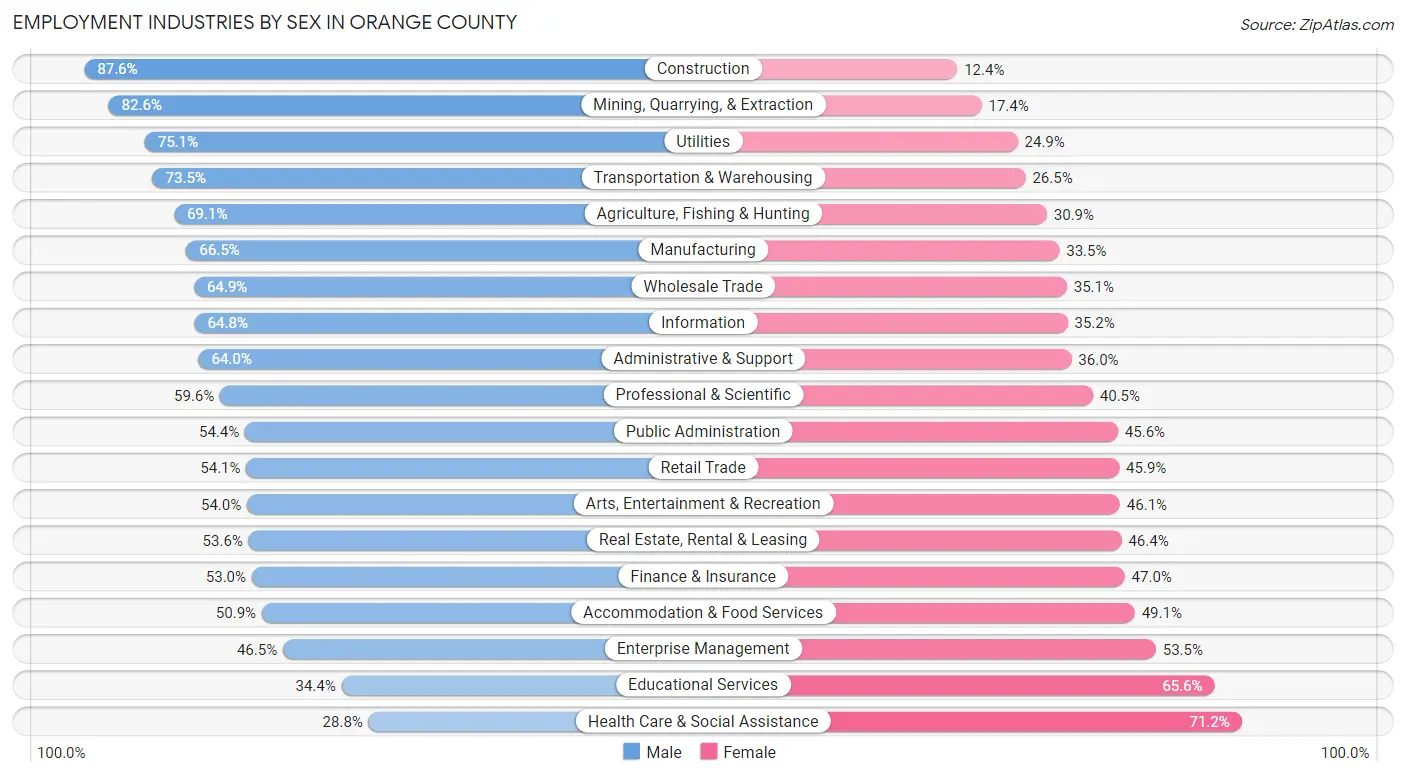
Employment Industries by Sex in Orange County
The Orange County industries that see more men than women are Construction (87.6%), Mining, Quarrying, & Extraction (82.6%), and Utilities (75.1%), whereas the industries that tend to have a higher number of women are Health Care & Social Assistance (71.2%), Educational Services (65.6%), and Enterprise Management (53.5%).
| Industry | Male | Female |
| Agriculture, Fishing & Hunting | 6,249 (69.1%) | 2,798 (30.9%) |
| Mining, Quarrying, & Extraction | 1,096 (82.6%) | 231 (17.4%) |
| Construction | 83,542 (87.6%) | 11,801 (12.4%) |
| Manufacturing | 123,876 (66.5%) | 62,416 (33.5%) |
| Wholesale Trade | 33,726 (64.9%) | 18,210 (35.1%) |
| Retail Trade | 87,813 (54.1%) | 74,490 (45.9%) |
| Transportation & Warehousing | 42,553 (73.5%) | 15,353 (26.5%) |
| Utilities | 6,250 (75.1%) | 2,070 (24.9%) |
| Information | 19,864 (64.8%) | 10,796 (35.2%) |
| Finance & Insurance | 48,981 (53.0%) | 43,501 (47.0%) |
| Real Estate, Rental & Leasing | 24,563 (53.6%) | 21,248 (46.4%) |
| Professional & Scientific | 95,980 (59.6%) | 65,205 (40.5%) |
| Enterprise Management | 1,084 (46.5%) | 1,246 (53.5%) |
| Administrative & Support | 46,259 (64.0%) | 26,028 (36.0%) |
| Educational Services | 46,871 (34.4%) | 89,440 (65.6%) |
| Health Care & Social Assistance | 55,006 (28.8%) | 136,132 (71.2%) |
| Arts, Entertainment & Recreation | 23,571 (53.9%) | 20,117 (46.1%) |
| Accommodation & Food Services | 61,208 (50.9%) | 59,083 (49.1%) |
| Public Administration | 27,331 (54.4%) | 22,951 (45.6%) |
| Total | 869,451 (54.4%) | 728,675 (45.6%) |
Education in Orange County
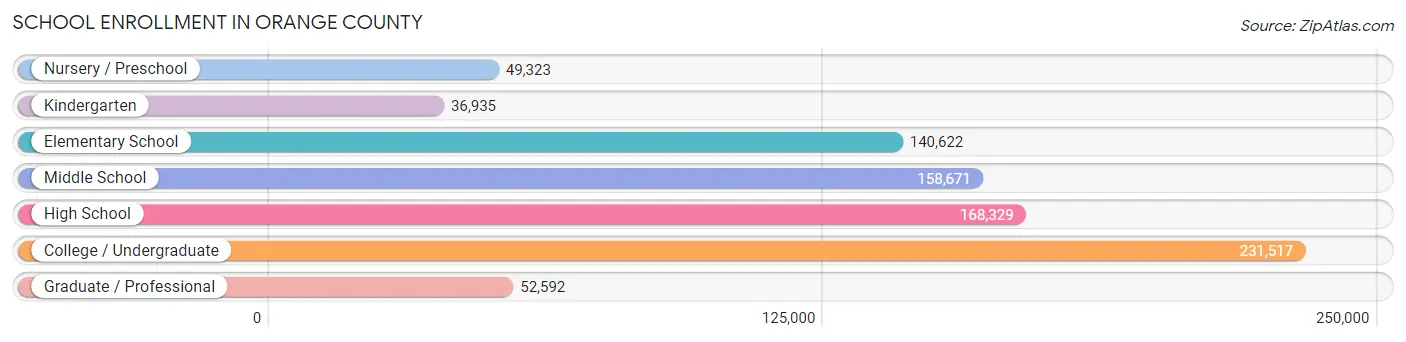
School Enrollment in Orange County
The most common levels of schooling among the 837,989 students in Orange County are college / undergraduate (231,517 | 27.6%), high school (168,329 | 20.1%), and middle school (158,671 | 18.9%).
| School Level | # Students | % Students |
| Nursery / Preschool | 49,323 | 5.9% |
| Kindergarten | 36,935 | 4.4% |
| Elementary School | 140,622 | 16.8% |
| Middle School | 158,671 | 18.9% |
| High School | 168,329 | 20.1% |
| College / Undergraduate | 231,517 | 27.6% |
| Graduate / Professional | 52,592 | 6.3% |
| Total | 837,989 | 100.0% |
School Enrollment by Age by Funding Source in Orange County
Out of a total of 837,989 students who are enrolled in schools in Orange County, 133,240 (15.9%) attend a private institution, while the remaining 704,749 (84.1%) are enrolled in public schools. The age group of 3 to 4 year olds has the highest likelihood of being enrolled in private schools, with 21,774 (53.8% in the age bracket) enrolled. Conversely, the age group of 18 to 19 year olds has the lowest likelihood of being enrolled in a private school, with 65,706 (90.9% in the age bracket) attending a public institution.
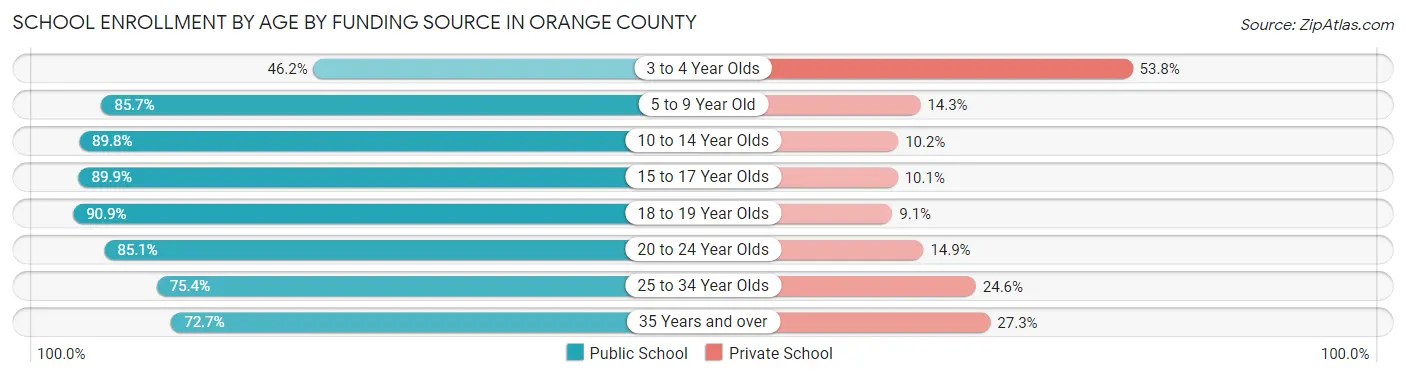
| Age Bracket | Public School | Private School |
| 3 to 4 Year Olds | 18,680 (46.2%) | 21,774 (53.8%) |
| 5 to 9 Year Old | 144,808 (85.7%) | 24,167 (14.3%) |
| 10 to 14 Year Olds | 180,016 (89.8%) | 20,366 (10.2%) |
| 15 to 17 Year Olds | 108,564 (89.9%) | 12,160 (10.1%) |
| 18 to 19 Year Olds | 65,706 (90.9%) | 6,545 (9.1%) |
| 20 to 24 Year Olds | 97,279 (85.1%) | 16,980 (14.9%) |
| 25 to 34 Year Olds | 51,748 (75.4%) | 16,897 (24.6%) |
| 35 Years and over | 38,008 (72.7%) | 14,291 (27.3%) |
| Total | 704,749 (84.1%) | 133,240 (15.9%) |
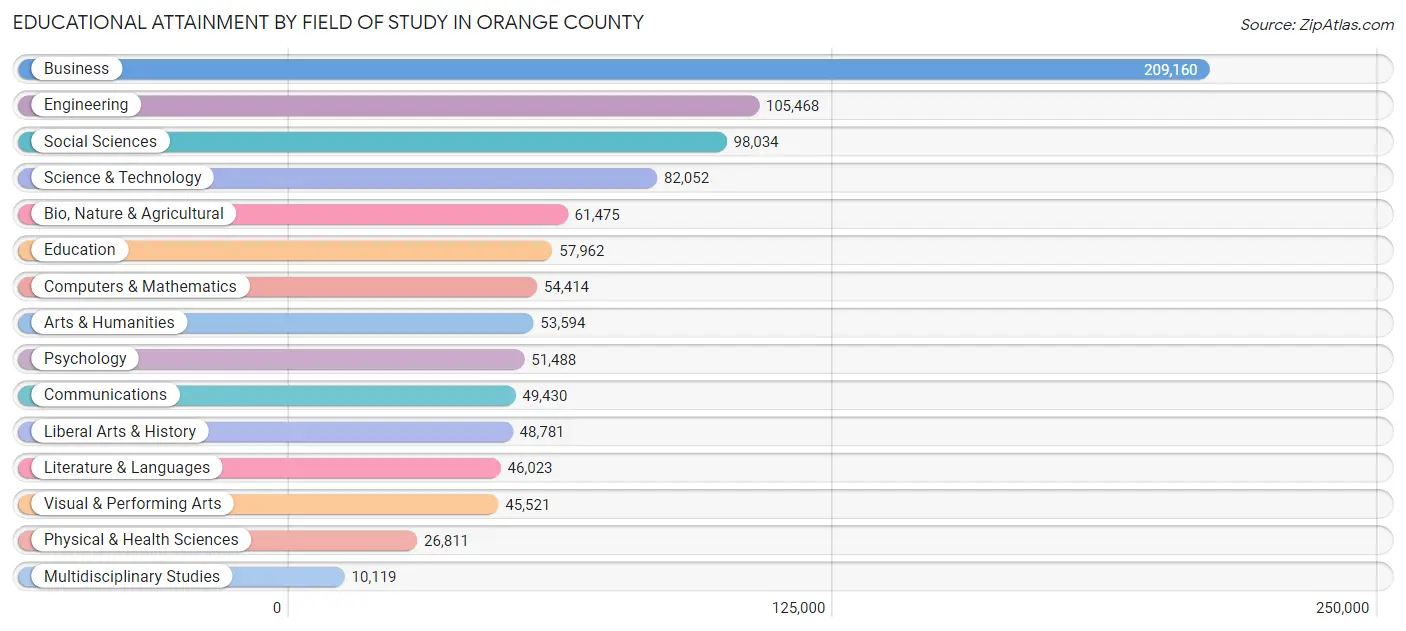
Educational Attainment by Field of Study in Orange County
Business (209,160 | 20.9%), engineering (105,468 | 10.5%), social sciences (98,034 | 9.8%), science & technology (82,052 | 8.2%), and bio, nature & agricultural (61,475 | 6.1%) are the most common fields of study among 1,000,332 individuals in Orange County who have obtained a bachelor's degree or higher.
| Field of Study | # Graduates | % Graduates |
| Computers & Mathematics | 54,414 | 5.4% |
| Bio, Nature & Agricultural | 61,475 | 6.1% |
| Physical & Health Sciences | 26,811 | 2.7% |
| Psychology | 51,488 | 5.1% |
| Social Sciences | 98,034 | 9.8% |
| Engineering | 105,468 | 10.5% |
| Multidisciplinary Studies | 10,119 | 1.0% |
| Science & Technology | 82,052 | 8.2% |
| Business | 209,160 | 20.9% |
| Education | 57,962 | 5.8% |
| Literature & Languages | 46,023 | 4.6% |
| Liberal Arts & History | 48,781 | 4.9% |
| Visual & Performing Arts | 45,521 | 4.5% |
| Communications | 49,430 | 4.9% |
| Arts & Humanities | 53,594 | 5.4% |
| Total | 1,000,332 | 100.0% |
Transportation & Commute in Orange County
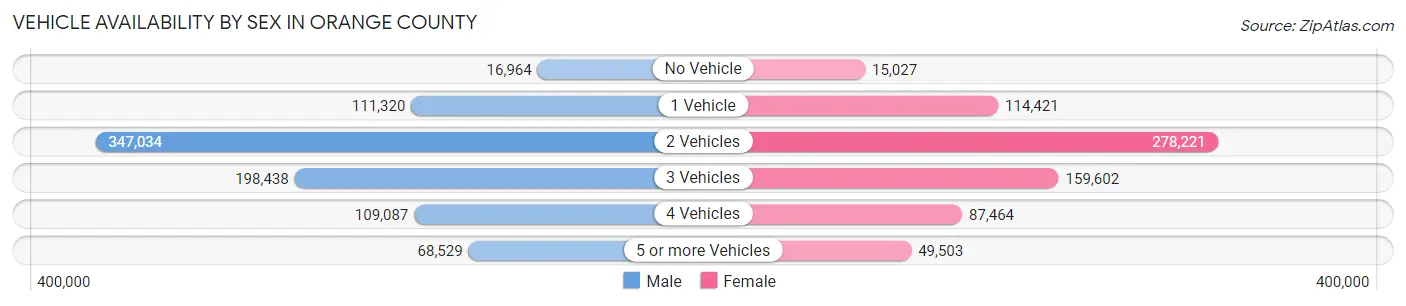
Vehicle Availability by Sex in Orange County
The most prevalent vehicle ownership categories in Orange County are males with 2 vehicles (347,034, accounting for 40.8%) and females with 2 vehicles (278,221, making up 49.3%).
| Vehicles Available | Male | Female |
| No Vehicle | 16,964 (2.0%) | 15,027 (2.1%) |
| 1 Vehicle | 111,320 (13.1%) | 114,421 (16.3%) |
| 2 Vehicles | 347,034 (40.8%) | 278,221 (39.5%) |
| 3 Vehicles | 198,438 (23.3%) | 159,602 (22.7%) |
| 4 Vehicles | 109,087 (12.8%) | 87,464 (12.4%) |
| 5 or more Vehicles | 68,529 (8.1%) | 49,503 (7.0%) |
| Total | 851,372 (100.0%) | 704,238 (100.0%) |
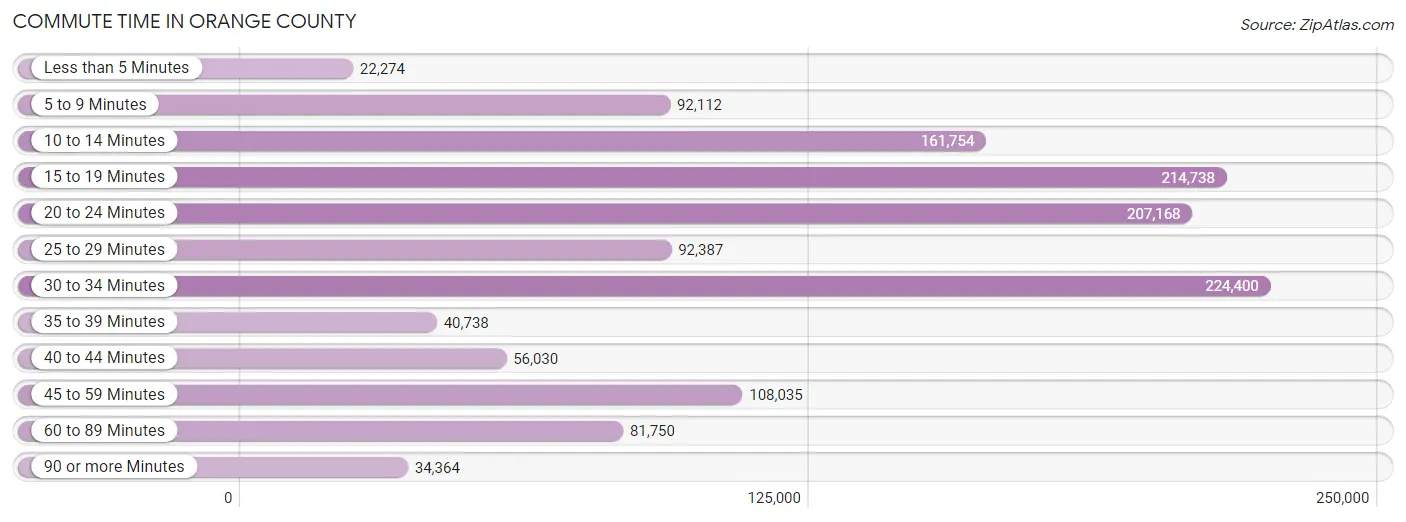
Commute Time in Orange County
The most frequently occuring commute durations in Orange County are 30 to 34 minutes (224,400 commuters, 16.8%), 15 to 19 minutes (214,738 commuters, 16.1%), and 20 to 24 minutes (207,168 commuters, 15.5%).
| Commute Time | # Commuters | % Commuters |
| Less than 5 Minutes | 22,274 | 1.7% |
| 5 to 9 Minutes | 92,112 | 6.9% |
| 10 to 14 Minutes | 161,754 | 12.1% |
| 15 to 19 Minutes | 214,738 | 16.1% |
| 20 to 24 Minutes | 207,168 | 15.5% |
| 25 to 29 Minutes | 92,387 | 6.9% |
| 30 to 34 Minutes | 224,400 | 16.8% |
| 35 to 39 Minutes | 40,738 | 3.0% |
| 40 to 44 Minutes | 56,030 | 4.2% |
| 45 to 59 Minutes | 108,035 | 8.1% |
| 60 to 89 Minutes | 81,750 | 6.1% |
| 90 or more Minutes | 34,364 | 2.6% |
Commute Time by Sex in Orange County
The most common commute times in Orange County are 30 to 34 minutes (126,455 commuters, 17.2%) for males and 15 to 19 minutes (103,818 commuters, 17.3%) for females.
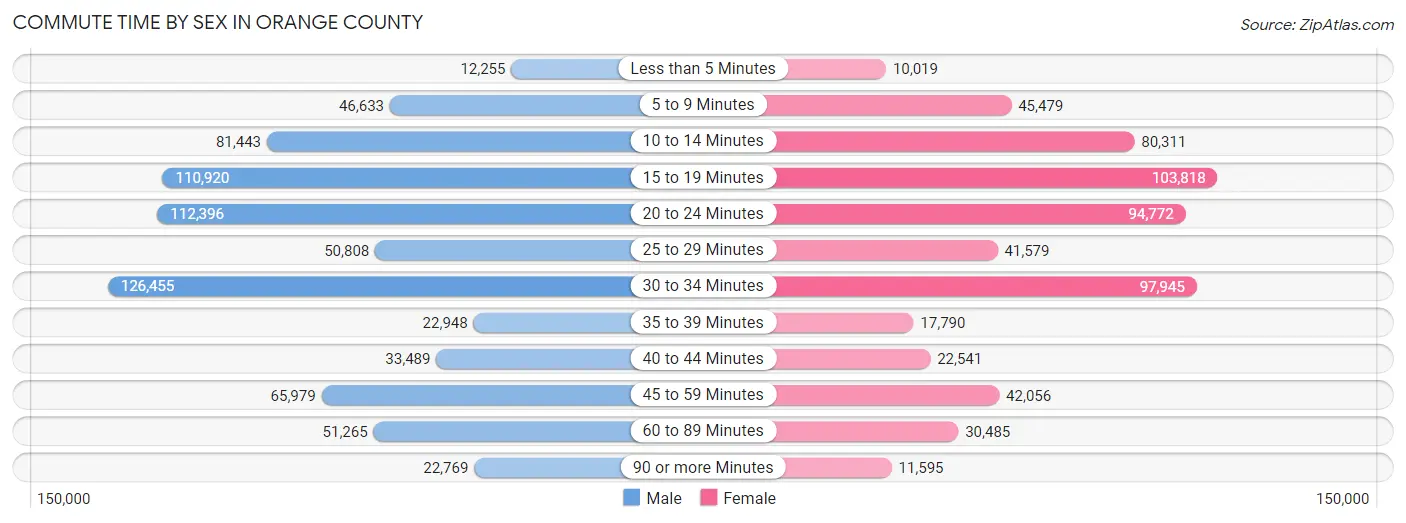
| Commute Time | Male | Female |
| Less than 5 Minutes | 12,255 (1.7%) | 10,019 (1.7%) |
| 5 to 9 Minutes | 46,633 (6.3%) | 45,479 (7.6%) |
| 10 to 14 Minutes | 81,443 (11.1%) | 80,311 (13.4%) |
| 15 to 19 Minutes | 110,920 (15.0%) | 103,818 (17.3%) |
| 20 to 24 Minutes | 112,396 (15.2%) | 94,772 (15.8%) |
| 25 to 29 Minutes | 50,808 (6.9%) | 41,579 (7.0%) |
| 30 to 34 Minutes | 126,455 (17.2%) | 97,945 (16.4%) |
| 35 to 39 Minutes | 22,948 (3.1%) | 17,790 (3.0%) |
| 40 to 44 Minutes | 33,489 (4.5%) | 22,541 (3.8%) |
| 45 to 59 Minutes | 65,979 (8.9%) | 42,056 (7.0%) |
| 60 to 89 Minutes | 51,265 (7.0%) | 30,485 (5.1%) |
| 90 or more Minutes | 22,769 (3.1%) | 11,595 (1.9%) |
Time of Departure to Work by Sex in Orange County
The most frequent times of departure to work in Orange County are 7:00 AM to 7:29 AM (96,107, 13.0%) for males and 7:00 AM to 7:29 AM (86,976, 14.5%) for females.
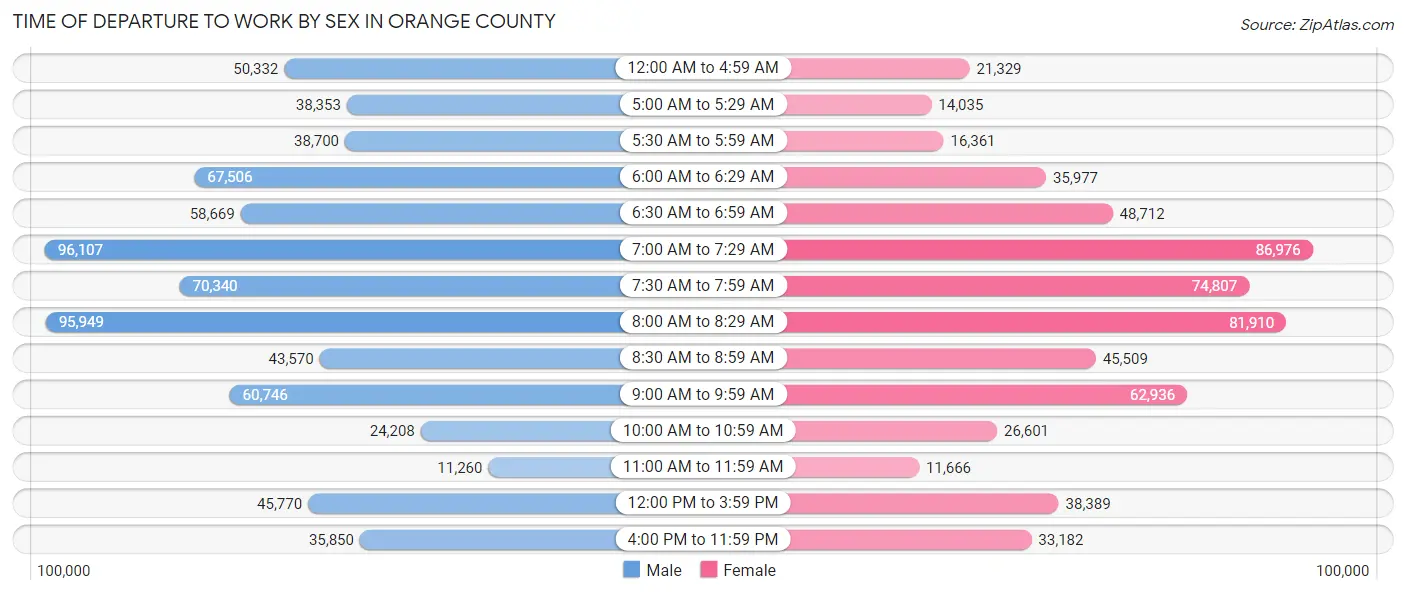
| Time of Departure | Male | Female |
| 12:00 AM to 4:59 AM | 50,332 (6.8%) | 21,329 (3.6%) |
| 5:00 AM to 5:29 AM | 38,353 (5.2%) | 14,035 (2.4%) |
| 5:30 AM to 5:59 AM | 38,700 (5.2%) | 16,361 (2.7%) |
| 6:00 AM to 6:29 AM | 67,506 (9.2%) | 35,977 (6.0%) |
| 6:30 AM to 6:59 AM | 58,669 (8.0%) | 48,712 (8.1%) |
| 7:00 AM to 7:29 AM | 96,107 (13.0%) | 86,976 (14.5%) |
| 7:30 AM to 7:59 AM | 70,340 (9.5%) | 74,807 (12.5%) |
| 8:00 AM to 8:29 AM | 95,949 (13.0%) | 81,910 (13.7%) |
| 8:30 AM to 8:59 AM | 43,570 (5.9%) | 45,509 (7.6%) |
| 9:00 AM to 9:59 AM | 60,746 (8.2%) | 62,936 (10.5%) |
| 10:00 AM to 10:59 AM | 24,208 (3.3%) | 26,601 (4.4%) |
| 11:00 AM to 11:59 AM | 11,260 (1.5%) | 11,666 (1.9%) |
| 12:00 PM to 3:59 PM | 45,770 (6.2%) | 38,389 (6.4%) |
| 4:00 PM to 11:59 PM | 35,850 (4.9%) | 33,182 (5.6%) |
| Total | 737,360 (100.0%) | 598,390 (100.0%) |
Housing Occupancy in Orange County
Occupancy by Ownership in Orange County
Of the total 1,066,286 dwellings in Orange County, owner-occupied units account for 602,959 (56.6%), while renter-occupied units make up 463,327 (43.4%).
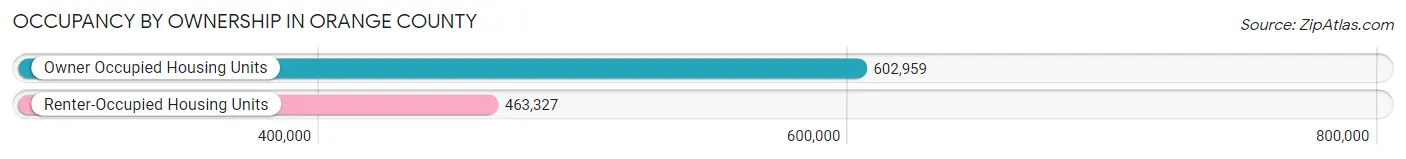
| Occupancy | # Housing Units | % Housing Units |
| Owner Occupied Housing Units | 602,959 | 56.6% |
| Renter-Occupied Housing Units | 463,327 | 43.4% |
| Total Occupied Housing Units | 1,066,286 | 100.0% |
Occupancy by Household Size in Orange County
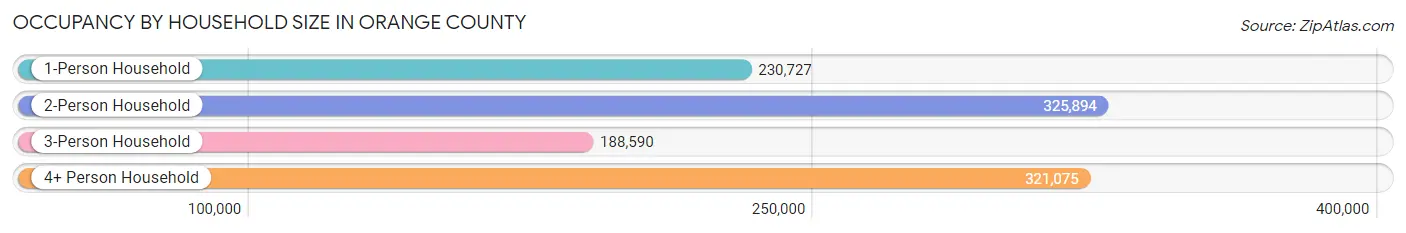
| Household Size | # Housing Units | % Housing Units |
| 1-Person Household | 230,727 | 21.6% |
| 2-Person Household | 325,894 | 30.6% |
| 3-Person Household | 188,590 | 17.7% |
| 4+ Person Household | 321,075 | 30.1% |
| Total Housing Units | 1,066,286 | 100.0% |
Occupancy by Ownership by Household Size in Orange County
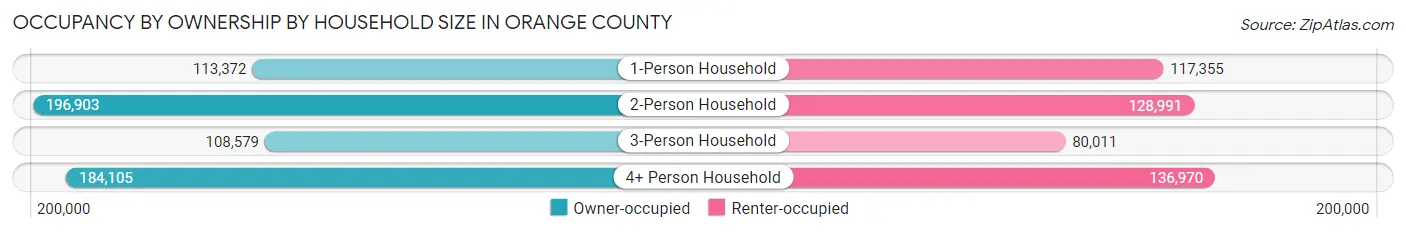
| Household Size | Owner-occupied | Renter-occupied |
| 1-Person Household | 113,372 (49.1%) | 117,355 (50.9%) |
| 2-Person Household | 196,903 (60.4%) | 128,991 (39.6%) |
| 3-Person Household | 108,579 (57.6%) | 80,011 (42.4%) |
| 4+ Person Household | 184,105 (57.3%) | 136,970 (42.7%) |
| Total Housing Units | 602,959 (56.6%) | 463,327 (43.4%) |
Occupancy by Educational Attainment in Orange County
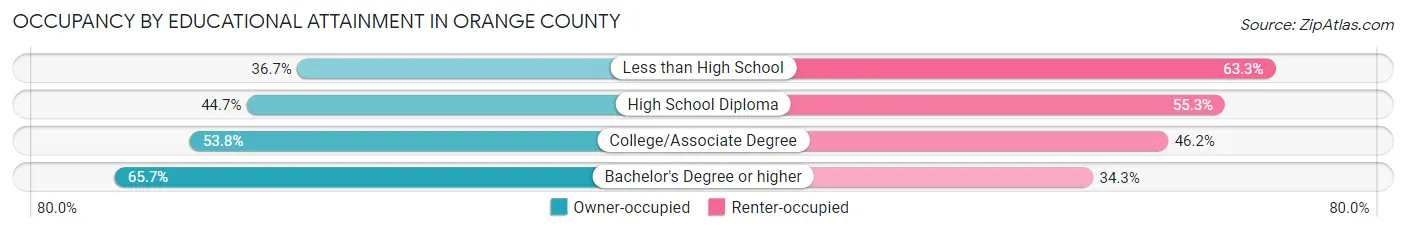
| Household Size | Owner-occupied | Renter-occupied |
| Less than High School | 38,542 (36.7%) | 66,496 (63.3%) |
| High School Diploma | 65,660 (44.7%) | 81,268 (55.3%) |
| College/Associate Degree | 162,417 (53.8%) | 139,706 (46.2%) |
| Bachelor's Degree or higher | 336,340 (65.7%) | 175,857 (34.3%) |
Occupancy by Age of Householder in Orange County
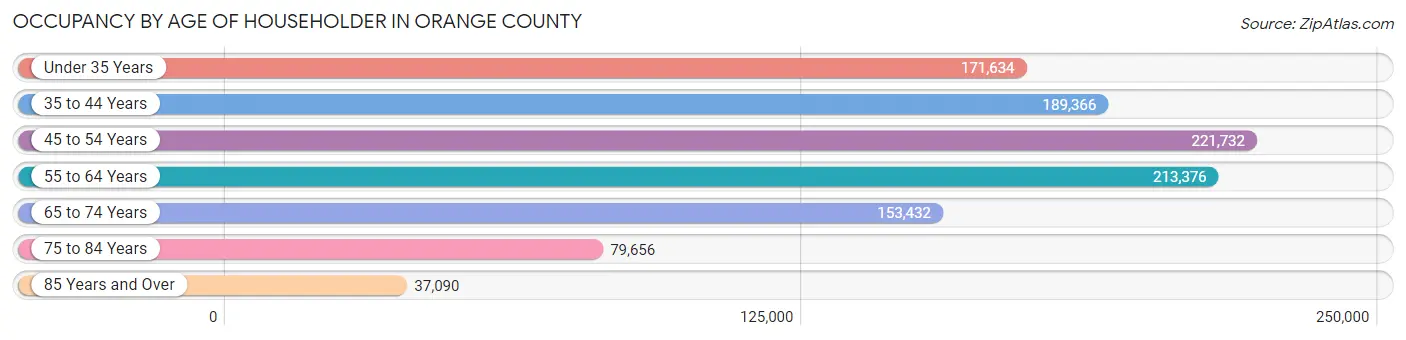
| Age Bracket | # Households | % Households |
| Under 35 Years | 171,634 | 16.1% |
| 35 to 44 Years | 189,366 | 17.8% |
| 45 to 54 Years | 221,732 | 20.8% |
| 55 to 64 Years | 213,376 | 20.0% |
| 65 to 74 Years | 153,432 | 14.4% |
| 75 to 84 Years | 79,656 | 7.5% |
| 85 Years and Over | 37,090 | 3.5% |
| Total | 1,066,286 | 100.0% |
Housing Finances in Orange County
Median Income by Occupancy in Orange County
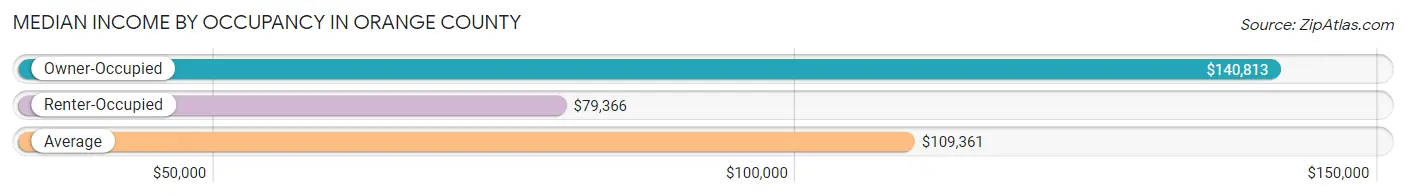
| Occupancy Type | # Households | Median Income |
| Owner-Occupied | 602,959 (56.6%) | $140,813 |
| Renter-Occupied | 463,327 (43.4%) | $79,366 |
| Average | 1,066,286 (100.0%) | $109,361 |
Occupancy by Householder Income Bracket in Orange County
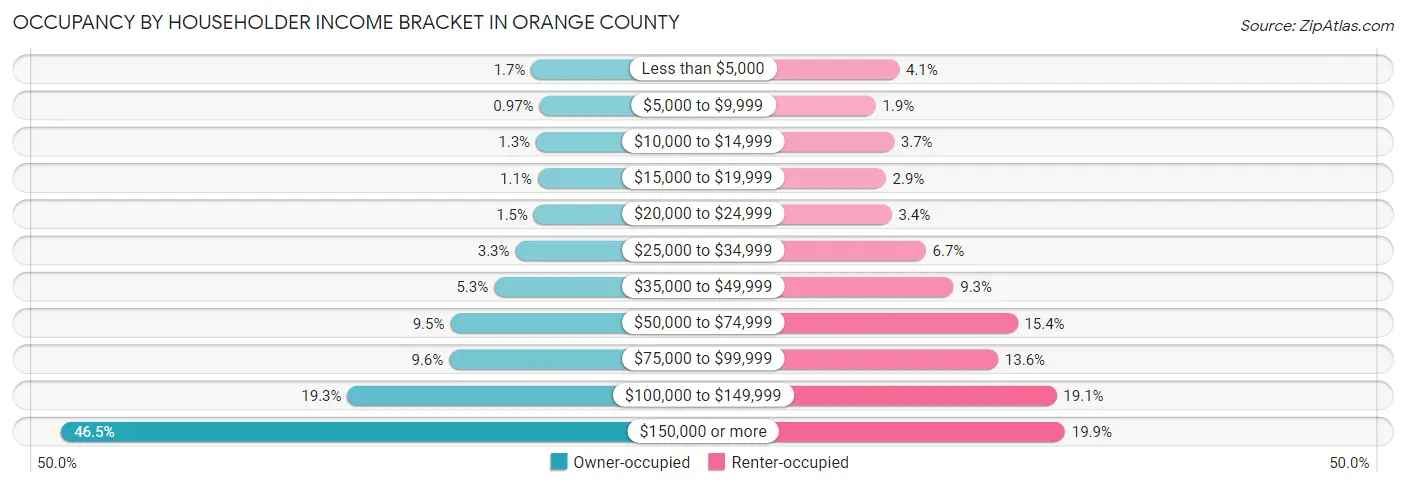
| Income Bracket | Owner-occupied | Renter-occupied |
| Less than $5,000 | 10,517 (1.7%) | 19,172 (4.1%) |
| $5,000 to $9,999 | 5,832 (1.0%) | 8,819 (1.9%) |
| $10,000 to $14,999 | 7,854 (1.3%) | 16,931 (3.6%) |
| $15,000 to $19,999 | 6,843 (1.1%) | 13,250 (2.9%) |
| $20,000 to $24,999 | 9,061 (1.5%) | 15,864 (3.4%) |
| $25,000 to $34,999 | 19,637 (3.3%) | 30,888 (6.7%) |
| $35,000 to $49,999 | 31,883 (5.3%) | 43,157 (9.3%) |
| $50,000 to $74,999 | 57,031 (9.5%) | 71,446 (15.4%) |
| $75,000 to $99,999 | 57,730 (9.6%) | 62,850 (13.6%) |
| $100,000 to $149,999 | 116,121 (19.3%) | 88,613 (19.1%) |
| $150,000 or more | 280,450 (46.5%) | 92,337 (19.9%) |
| Total | 602,959 (100.0%) | 463,327 (100.0%) |
Monthly Housing Cost Tiers in Orange County
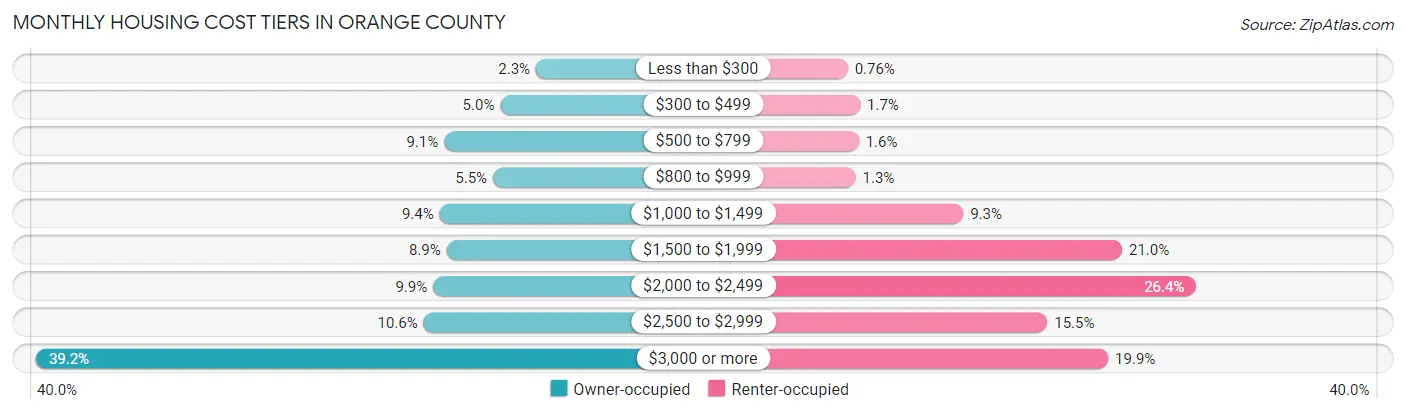
| Monthly Cost | Owner-occupied | Renter-occupied |
| Less than $300 | 14,121 (2.3%) | 3,534 (0.8%) |
| $300 to $499 | 29,984 (5.0%) | 7,731 (1.7%) |
| $500 to $799 | 54,943 (9.1%) | 7,275 (1.6%) |
| $800 to $999 | 33,212 (5.5%) | 6,230 (1.3%) |
| $1,000 to $1,499 | 56,920 (9.4%) | 42,955 (9.3%) |
| $1,500 to $1,999 | 53,791 (8.9%) | 97,095 (21.0%) |
| $2,000 to $2,499 | 59,840 (9.9%) | 122,389 (26.4%) |
| $2,500 to $2,999 | 64,040 (10.6%) | 71,629 (15.5%) |
| $3,000 or more | 236,108 (39.2%) | 92,388 (19.9%) |
| Total | 602,959 (100.0%) | 463,327 (100.0%) |
Physical Housing Characteristics in Orange County
Housing Structures in Orange County
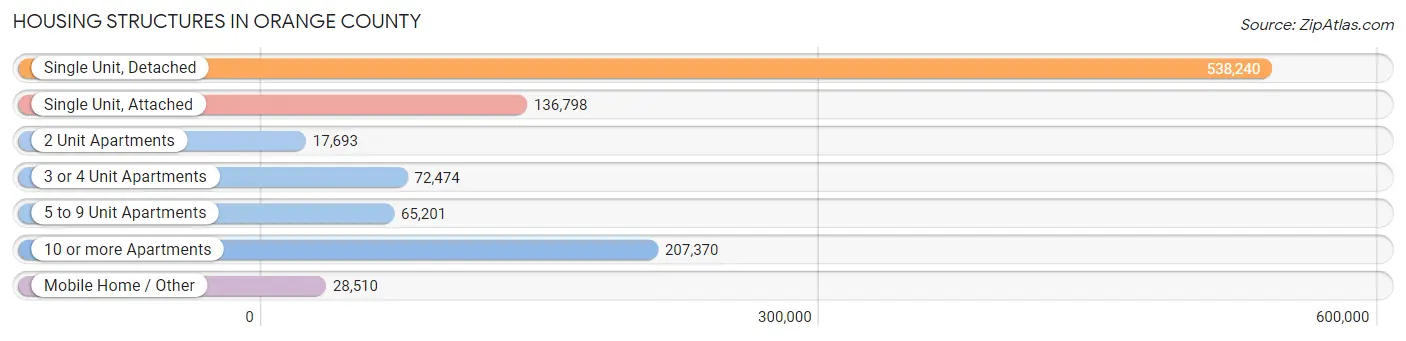
| Structure Type | # Housing Units | % Housing Units |
| Single Unit, Detached | 538,240 | 50.5% |
| Single Unit, Attached | 136,798 | 12.8% |
| 2 Unit Apartments | 17,693 | 1.7% |
| 3 or 4 Unit Apartments | 72,474 | 6.8% |
| 5 to 9 Unit Apartments | 65,201 | 6.1% |
| 10 or more Apartments | 207,370 | 19.5% |
| Mobile Home / Other | 28,510 | 2.7% |
| Total | 1,066,286 | 100.0% |
Housing Structures by Occupancy in Orange County
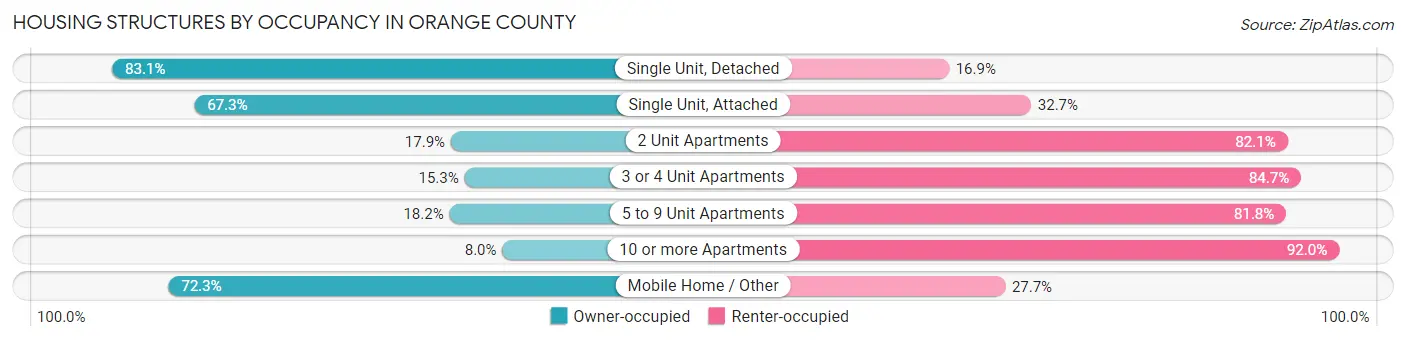
| Structure Type | Owner-occupied | Renter-occupied |
| Single Unit, Detached | 447,505 (83.1%) | 90,735 (16.9%) |
| Single Unit, Attached | 92,107 (67.3%) | 44,691 (32.7%) |
| 2 Unit Apartments | 3,171 (17.9%) | 14,522 (82.1%) |
| 3 or 4 Unit Apartments | 11,081 (15.3%) | 61,393 (84.7%) |
| 5 to 9 Unit Apartments | 11,863 (18.2%) | 53,338 (81.8%) |
| 10 or more Apartments | 16,613 (8.0%) | 190,757 (92.0%) |
| Mobile Home / Other | 20,619 (72.3%) | 7,891 (27.7%) |
| Total | 602,959 (56.6%) | 463,327 (43.4%) |
Housing Structures by Number of Rooms in Orange County
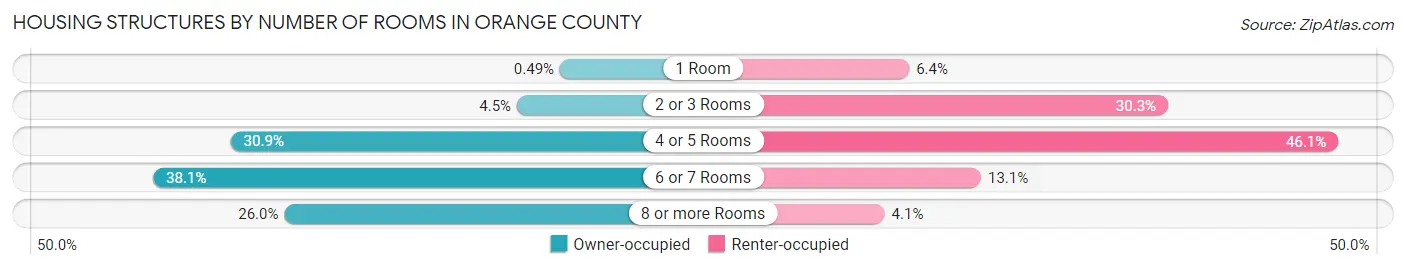
| Number of Rooms | Owner-occupied | Renter-occupied |
| 1 Room | 2,947 (0.5%) | 29,701 (6.4%) |
| 2 or 3 Rooms | 26,927 (4.5%) | 140,506 (30.3%) |
| 4 or 5 Rooms | 186,555 (30.9%) | 213,466 (46.1%) |
| 6 or 7 Rooms | 229,866 (38.1%) | 60,484 (13.1%) |
| 8 or more Rooms | 156,664 (26.0%) | 19,170 (4.1%) |
| Total | 602,959 (100.0%) | 463,327 (100.0%) |
Housing Structure by Heating Type in Orange County
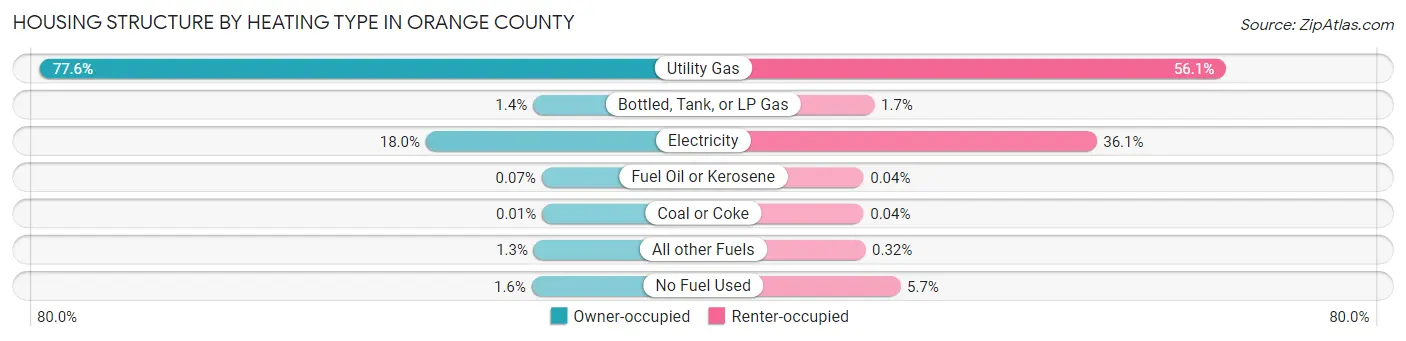
| Heating Type | Owner-occupied | Renter-occupied |
| Utility Gas | 468,137 (77.6%) | 259,932 (56.1%) |
| Bottled, Tank, or LP Gas | 8,489 (1.4%) | 7,924 (1.7%) |
| Electricity | 108,421 (18.0%) | 167,075 (36.1%) |
| Fuel Oil or Kerosene | 395 (0.1%) | 195 (0.0%) |
| Coal or Coke | 44 (0.0%) | 181 (0.0%) |
| All other Fuels | 7,731 (1.3%) | 1,473 (0.3%) |
| No Fuel Used | 9,742 (1.6%) | 26,547 (5.7%) |
| Total | 602,959 (100.0%) | 463,327 (100.0%) |
Household Vehicle Usage in Orange County
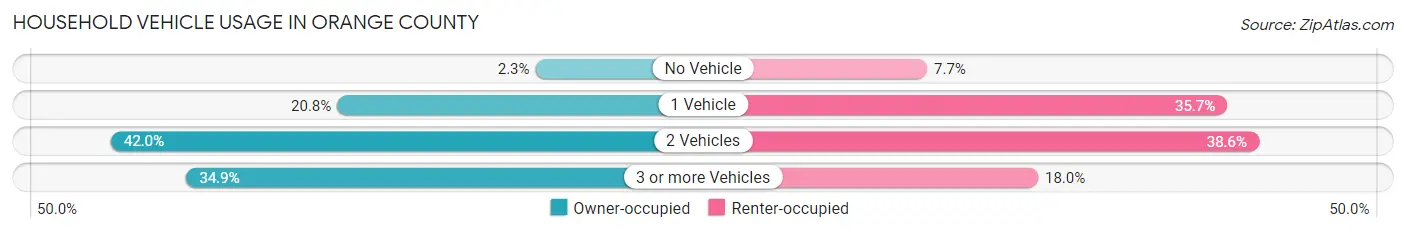
| Vehicles per Household | Owner-occupied | Renter-occupied |
| No Vehicle | 13,999 (2.3%) | 35,515 (7.7%) |
| 1 Vehicle | 125,594 (20.8%) | 165,287 (35.7%) |
| 2 Vehicles | 252,913 (41.9%) | 178,987 (38.6%) |
| 3 or more Vehicles | 210,453 (34.9%) | 83,538 (18.0%) |
| Total | 602,959 (100.0%) | 463,327 (100.0%) |
Real Estate & Mortgages in Orange County
Real Estate and Mortgage Overview in Orange County
| Characteristic | Without Mortgage | With Mortgage |
| Housing Units | 189,268 | 413,691 |
| Median Property Value | $814,400 | $881,800 |
| Median Household Income | $97,613 | $222,032 |
| Monthly Housing Costs | $804 | $231,518 |
| Real Estate Taxes | $4,222 | $5,275 |
Property Value by Mortgage Status in Orange County
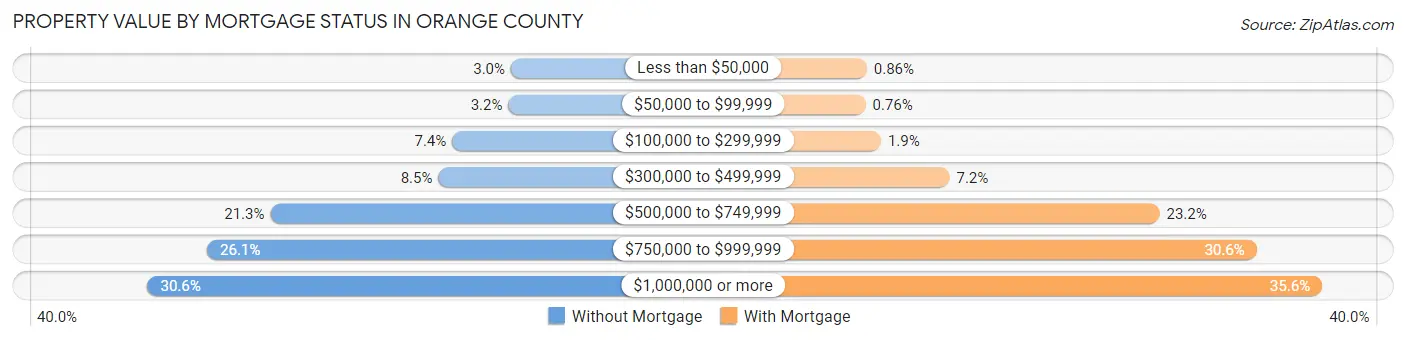
| Property Value | Without Mortgage | With Mortgage |
| Less than $50,000 | 5,583 (2.9%) | 3,567 (0.9%) |
| $50,000 to $99,999 | 5,955 (3.2%) | 3,152 (0.8%) |
| $100,000 to $299,999 | 14,054 (7.4%) | 8,012 (1.9%) |
| $300,000 to $499,999 | 16,043 (8.5%) | 29,638 (7.2%) |
| $500,000 to $749,999 | 40,283 (21.3%) | 95,813 (23.2%) |
| $750,000 to $999,999 | 49,378 (26.1%) | 126,442 (30.6%) |
| $1,000,000 or more | 57,972 (30.6%) | 147,067 (35.5%) |
| Total | 189,268 (100.0%) | 413,691 (100.0%) |
Household Income by Mortgage Status in Orange County
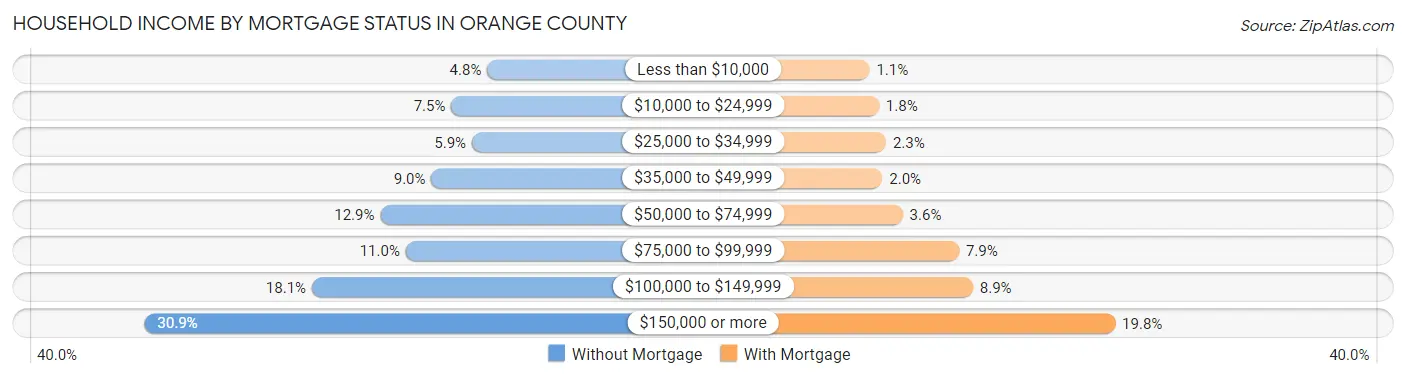
| Household Income | Without Mortgage | With Mortgage |
| Less than $10,000 | 8,985 (4.8%) | 4,374 (1.1%) |
| $10,000 to $24,999 | 14,172 (7.5%) | 7,364 (1.8%) |
| $25,000 to $34,999 | 11,214 (5.9%) | 9,586 (2.3%) |
| $35,000 to $49,999 | 17,045 (9.0%) | 8,423 (2.0%) |
| $50,000 to $74,999 | 24,415 (12.9%) | 14,838 (3.6%) |
| $75,000 to $99,999 | 20,744 (11.0%) | 32,616 (7.9%) |
| $100,000 to $149,999 | 34,275 (18.1%) | 36,986 (8.9%) |
| $150,000 or more | 58,418 (30.9%) | 81,846 (19.8%) |
| Total | 189,268 (100.0%) | 413,691 (100.0%) |
Property Value to Household Income Ratio in Orange County
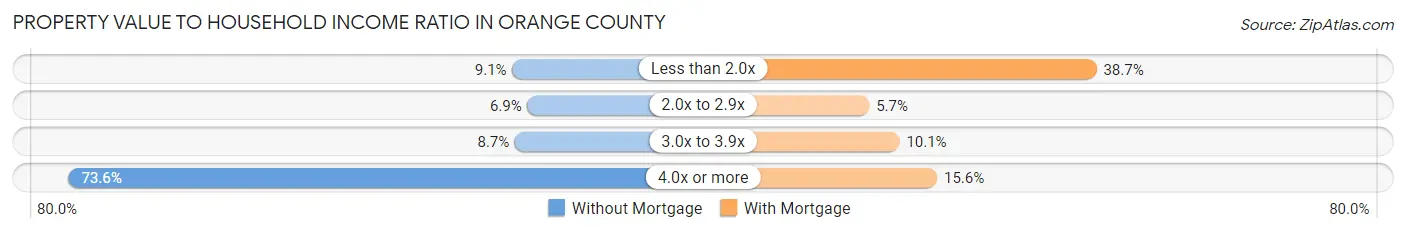
| Value-to-Income Ratio | Without Mortgage | With Mortgage |
| Less than 2.0x | 17,258 (9.1%) | 160,203 (38.7%) |
| 2.0x to 2.9x | 13,115 (6.9%) | 23,621 (5.7%) |
| 3.0x to 3.9x | 16,522 (8.7%) | 41,796 (10.1%) |
| 4.0x or more | 139,336 (73.6%) | 64,370 (15.6%) |
| Total | 189,268 (100.0%) | 413,691 (100.0%) |
Real Estate Taxes by Mortgage Status in Orange County
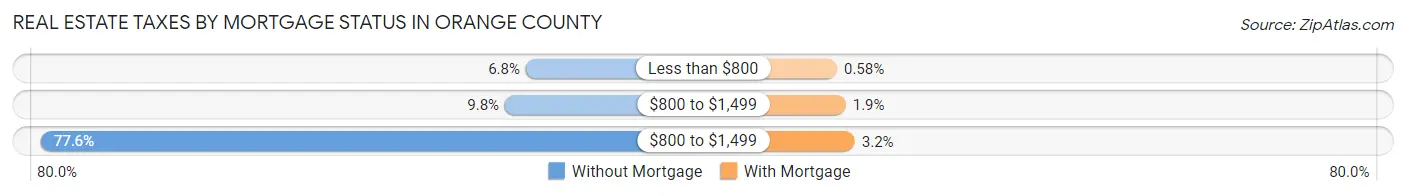
| Property Taxes | Without Mortgage | With Mortgage |
| Less than $800 | 12,822 (6.8%) | 2,403 (0.6%) |
| $800 to $1,499 | 18,592 (9.8%) | 7,684 (1.9%) |
| $800 to $1,499 | 146,902 (77.6%) | 13,147 (3.2%) |
| Total | 189,268 (100.0%) | 413,691 (100.0%) |
Health & Disability in Orange County
Health Insurance Coverage by Age in Orange County
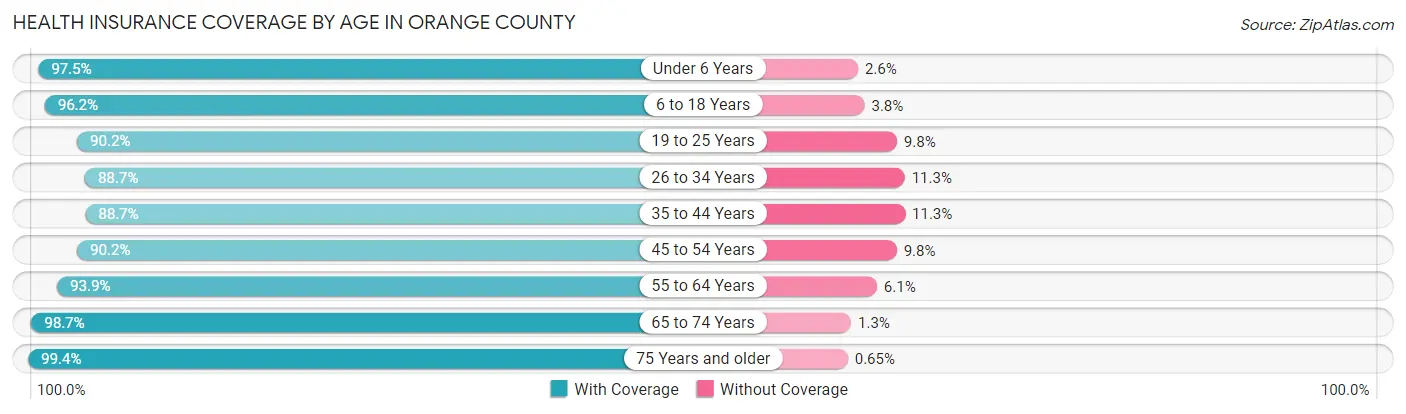
| Age Bracket | With Coverage | Without Coverage |
| Under 6 Years | 203,584 (97.5%) | 5,323 (2.5%) |
| 6 to 18 Years | 496,263 (96.2%) | 19,421 (3.8%) |
| 19 to 25 Years | 269,071 (90.2%) | 29,275 (9.8%) |
| 26 to 34 Years | 355,332 (88.7%) | 45,121 (11.3%) |
| 35 to 44 Years | 365,125 (88.7%) | 46,718 (11.3%) |
| 45 to 54 Years | 390,615 (90.2%) | 42,347 (9.8%) |
| 55 to 64 Years | 384,267 (93.9%) | 24,878 (6.1%) |
| 65 to 74 Years | 273,258 (98.7%) | 3,516 (1.3%) |
| 75 Years and older | 203,743 (99.4%) | 1,339 (0.6%) |
| Total | 2,941,258 (93.1%) | 217,938 (6.9%) |
Health Insurance Coverage by Citizenship Status in Orange County
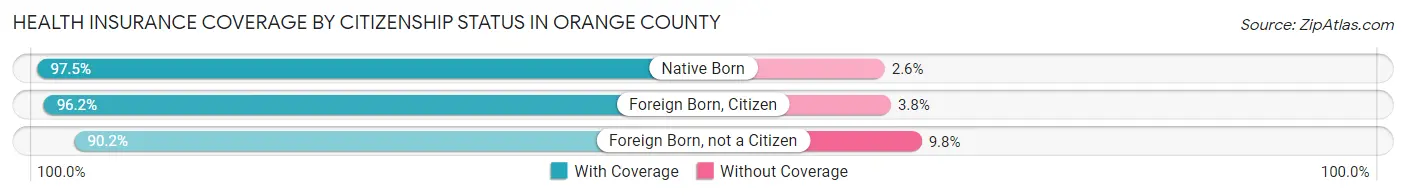
| Citizenship Status | With Coverage | Without Coverage |
| Native Born | 203,584 (97.5%) | 5,323 (2.5%) |
| Foreign Born, Citizen | 496,263 (96.2%) | 19,421 (3.8%) |
| Foreign Born, not a Citizen | 269,071 (90.2%) | 29,275 (9.8%) |
Health Insurance Coverage by Household Income in Orange County
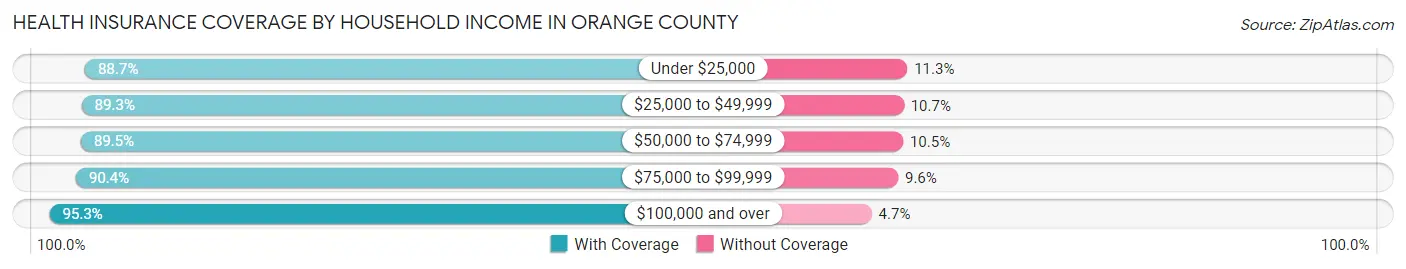
| Household Income | With Coverage | Without Coverage |
| Under $25,000 | 194,680 (88.7%) | 24,849 (11.3%) |
| $25,000 to $49,999 | 277,852 (89.3%) | 33,185 (10.7%) |
| $50,000 to $74,999 | 310,171 (89.5%) | 36,495 (10.5%) |
| $75,000 to $99,999 | 312,273 (90.4%) | 33,156 (9.6%) |
| $100,000 and over | 1,810,716 (95.3%) | 88,439 (4.7%) |
Public vs Private Health Insurance Coverage by Age in Orange County
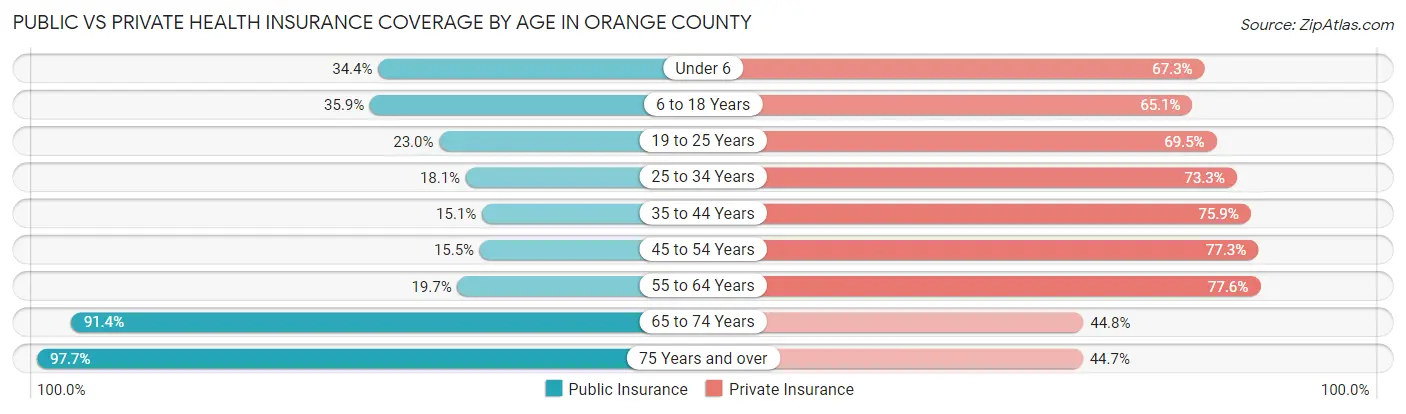
| Age Bracket | Public Insurance | Private Insurance |
| Under 6 | 71,750 (34.4%) | 140,603 (67.3%) |
| 6 to 18 Years | 184,959 (35.9%) | 335,597 (65.1%) |
| 19 to 25 Years | 68,721 (23.0%) | 207,453 (69.5%) |
| 25 to 34 Years | 72,401 (18.1%) | 293,455 (73.3%) |
| 35 to 44 Years | 62,051 (15.1%) | 312,508 (75.9%) |
| 45 to 54 Years | 67,012 (15.5%) | 334,502 (77.3%) |
| 55 to 64 Years | 80,413 (19.7%) | 317,642 (77.6%) |
| 65 to 74 Years | 253,029 (91.4%) | 124,039 (44.8%) |
| 75 Years and over | 200,349 (97.7%) | 91,719 (44.7%) |
| Total | 1,060,685 (33.6%) | 2,157,518 (68.3%) |
Disability Status by Sex by Age in Orange County
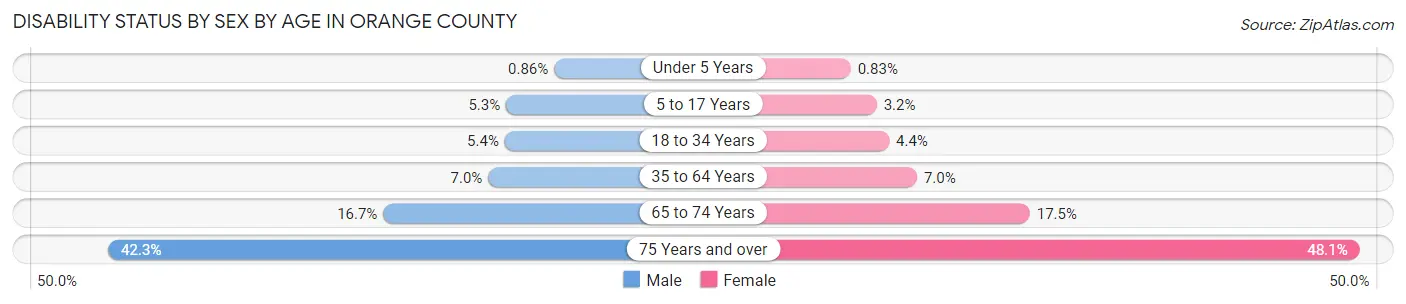
| Age Bracket | Male | Female |
| Under 5 Years | 773 (0.9%) | 703 (0.8%) |
| 5 to 17 Years | 13,750 (5.3%) | 7,985 (3.2%) |
| 18 to 34 Years | 20,556 (5.4%) | 16,040 (4.4%) |
| 35 to 64 Years | 43,676 (7.0%) | 43,813 (7.0%) |
| 65 to 74 Years | 21,665 (16.7%) | 25,695 (17.4%) |
| 75 Years and over | 36,370 (42.3%) | 57,191 (48.0%) |
Disability Class by Sex by Age in Orange County
Disability Class: Hearing Difficulty
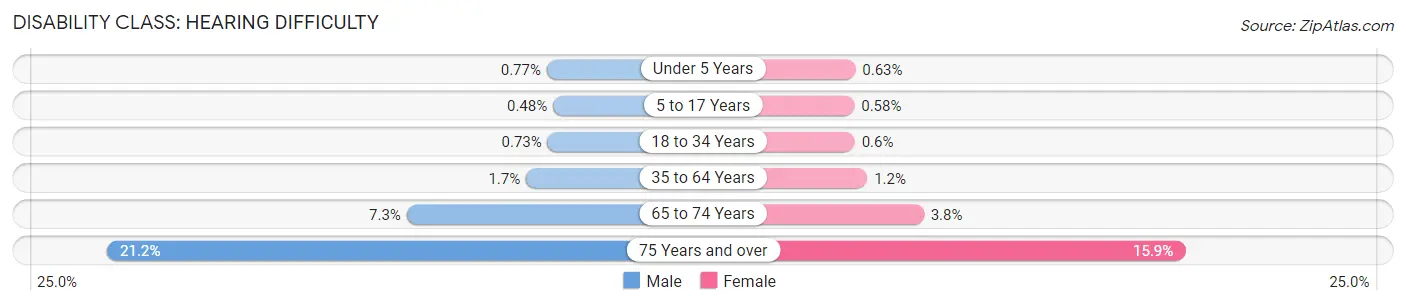
| Age Bracket | Male | Female |
| Under 5 Years | 692 (0.8%) | 533 (0.6%) |
| 5 to 17 Years | 1,234 (0.5%) | 1,435 (0.6%) |
| 18 to 34 Years | 2,754 (0.7%) | 2,193 (0.6%) |
| 35 to 64 Years | 10,852 (1.7%) | 7,380 (1.2%) |
| 65 to 74 Years | 9,422 (7.3%) | 5,598 (3.8%) |
| 75 Years and over | 18,224 (21.2%) | 18,958 (15.9%) |
Disability Class: Vision Difficulty
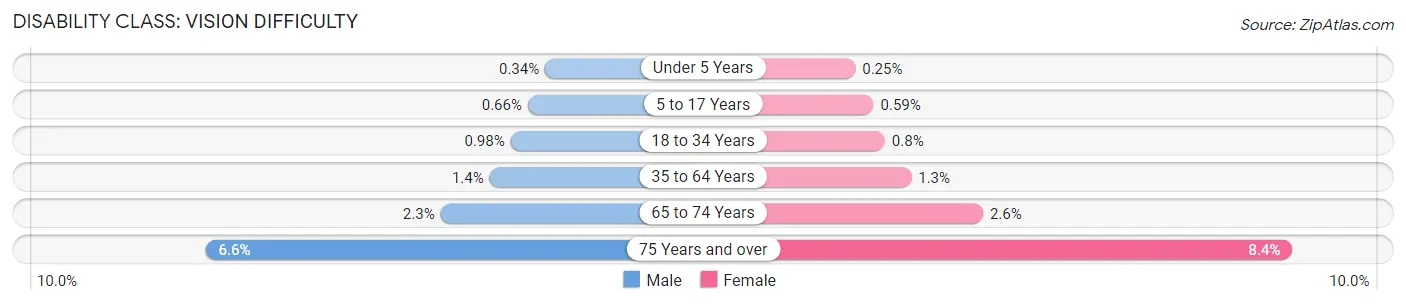
| Age Bracket | Male | Female |
| Under 5 Years | 305 (0.3%) | 210 (0.3%) |
| 5 to 17 Years | 1,709 (0.7%) | 1,447 (0.6%) |
| 18 to 34 Years | 3,702 (1.0%) | 2,930 (0.8%) |
| 35 to 64 Years | 8,594 (1.4%) | 8,085 (1.3%) |
| 65 to 74 Years | 2,960 (2.3%) | 3,862 (2.6%) |
| 75 Years and over | 5,719 (6.6%) | 9,946 (8.4%) |
Disability Class: Cognitive Difficulty
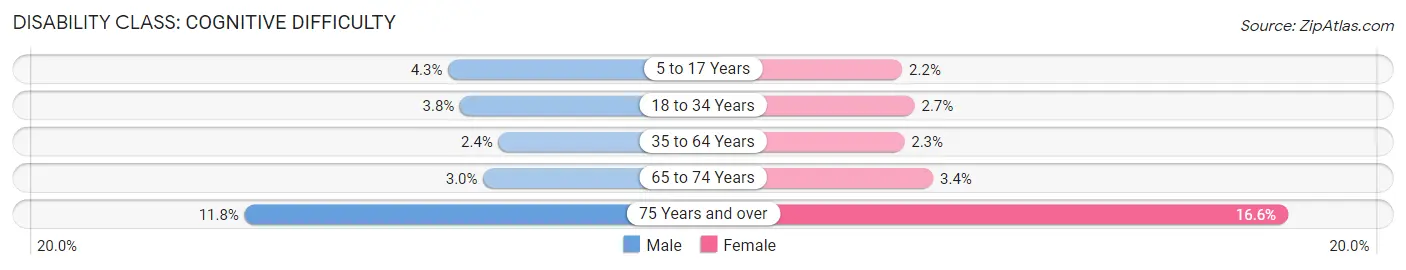
| Age Bracket | Male | Female |
| 5 to 17 Years | 11,037 (4.3%) | 5,523 (2.2%) |
| 18 to 34 Years | 14,491 (3.8%) | 9,885 (2.7%) |
| 35 to 64 Years | 14,996 (2.4%) | 14,552 (2.3%) |
| 65 to 74 Years | 3,843 (3.0%) | 4,995 (3.4%) |
| 75 Years and over | 10,181 (11.8%) | 19,707 (16.6%) |
Disability Class: Ambulatory Difficulty
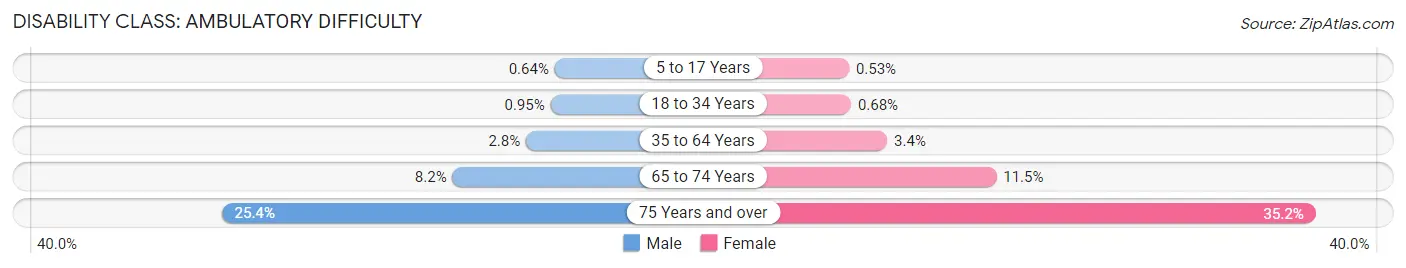
| Age Bracket | Male | Female |
| 5 to 17 Years | 1,660 (0.6%) | 1,298 (0.5%) |
| 18 to 34 Years | 3,611 (0.9%) | 2,478 (0.7%) |
| 35 to 64 Years | 17,324 (2.8%) | 21,135 (3.4%) |
| 65 to 74 Years | 10,658 (8.2%) | 16,891 (11.5%) |
| 75 Years and over | 21,832 (25.4%) | 41,863 (35.2%) |
Disability Class: Self-Care Difficulty
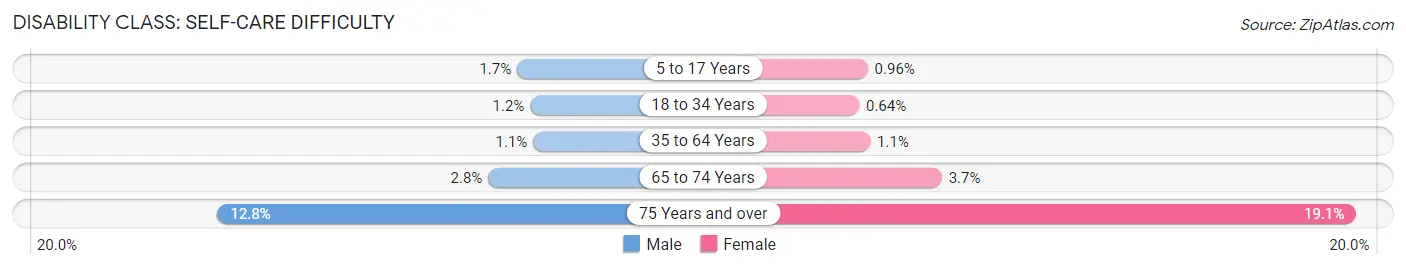
| Age Bracket | Male | Female |
| 5 to 17 Years | 4,444 (1.7%) | 2,357 (1.0%) |
| 18 to 34 Years | 4,633 (1.2%) | 2,350 (0.6%) |
| 35 to 64 Years | 6,982 (1.1%) | 6,613 (1.1%) |
| 65 to 74 Years | 3,614 (2.8%) | 5,461 (3.7%) |
| 75 Years and over | 11,048 (12.8%) | 22,714 (19.1%) |
Technology Access in Orange County
Computing Device Access in Orange County
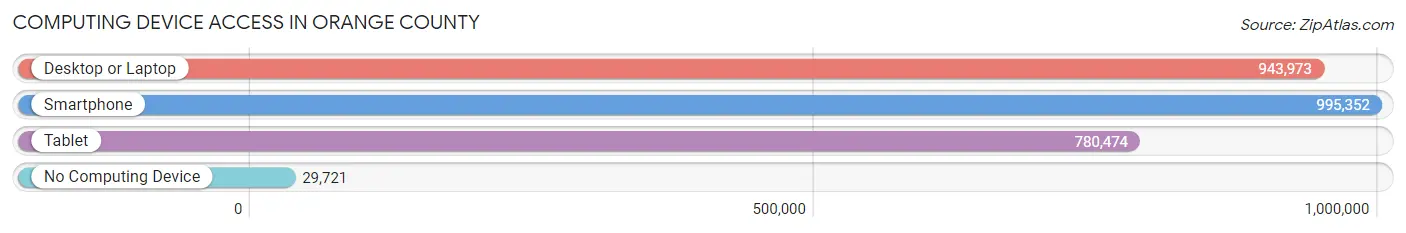
| Device Type | # Households | % Households |
| Desktop or Laptop | 943,973 | 88.5% |
| Smartphone | 995,352 | 93.3% |
| Tablet | 780,474 | 73.2% |
| No Computing Device | 29,721 | 2.8% |
| Total | 1,066,286 | 100.0% |
Internet Access in Orange County
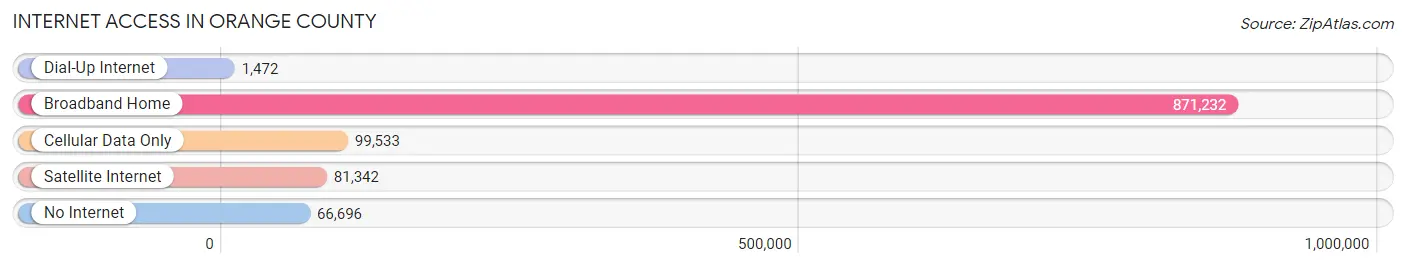
| Internet Type | # Households | % Households |
| Dial-Up Internet | 1,472 | 0.1% |
| Broadband Home | 871,232 | 81.7% |
| Cellular Data Only | 99,533 | 9.3% |
| Satellite Internet | 81,342 | 7.6% |
| No Internet | 66,696 | 6.2% |
| Total | 1,066,286 | 100.0% |
Orange County Summary
Orange County, California is located in the southern part of the state, and is bordered by Los Angeles County to the north, San Diego County to the south, and the Pacific Ocean to the west. It is the third most populous county in California, with a population of 3,010,232 as of the 2010 census. The county seat is Santa Ana, and the largest city is Anaheim.
History
Orange County was originally part of Los Angeles County, and was created in 1889. It was named after the orange fruit, which was grown in abundance in the area. The county was originally divided into seven districts, and the first county seat was located in Santa Ana.
In the early 1900s, the county experienced a population boom due to the development of the citrus industry. This led to the development of cities such as Anaheim, Fullerton, and Huntington Beach.
In the 1950s, Orange County experienced a population boom due to the development of the aerospace industry. This led to the development of cities such as Irvine, Costa Mesa, and Mission Viejo.
In the 1970s, Orange County experienced a population boom due to the development of the technology industry. This led to the development of cities such as Newport Beach, Laguna Beach, and San Clemente.
Geography
Orange County covers an area of 2,455 square miles, making it the third largest county in California. It is located in the southern part of the state, and is bordered by Los Angeles County to the north, San Diego County to the south, and the Pacific Ocean to the west.
The county is divided into 34 cities and towns, and is home to numerous beaches, parks, and other attractions. The Santa Ana Mountains are located in the northern part of the county, and the San Joaquin Hills are located in the southern part.
Economy
Orange County has a diverse economy, with a variety of industries including tourism, technology, manufacturing, finance, and healthcare. The county is home to numerous Fortune 500 companies, including Allergan, Broadcom, Ingram Micro, and Western Digital.
The county is also home to several major universities, including the University of California, Irvine, Chapman University, and California State University, Fullerton.
Demographics
As of the 2010 census, Orange County had a population of 3,010,232. The racial makeup of the county was 57.2% White, 6.7% African American, 0.7% Native American, 22.3% Asian, 0.3% Pacific Islander, 8.2% from other races, and 5.2% from two or more races. Hispanic or Latino of any race were 24.6% of the population.
The median income for a household in the county was $71,837, and the median income for a family was $86,845. The per capita income for the county was $35,845.
Conclusion
Orange County, California is a vibrant and diverse county located in the southern part of the state. It has a rich history, diverse geography, and a thriving economy. The county is home to numerous Fortune 500 companies, universities, and attractions, and has a population of over 3 million people. The county is diverse in terms of race, ethnicity, and income, and is a great place to live, work, and visit.
Common Questions
What is Per Capita Income in Orange County?
Per Capita income in Orange County is $50,683.
What is the Median Family Income in Orange County?
Median Family Income in Orange County is $124,132.
What is the Median Household income in Orange County?
Median Household Income in Orange County is $109,361.
What is Income or Wage Gap in Orange County?
Income or Wage Gap in Orange County is 27.7%.
Women in Orange County earn 72.3 cents for every dollar earned by a man.
What is Family Income Deficit in Orange County?
Family Income Deficit in Orange County is $11,685.
Families that are below poverty line in Orange County earn $11,685 less on average than the poverty threshold level.
What is Inequality or Gini Index in Orange County?
Inequality or Gini Index in Orange County is 0.47.
What is the Total Population of Orange County?
Total Population of Orange County is 3,175,227.
What is the Total Male Population of Orange County?
Total Male Population of Orange County is 1,578,013.
What is the Total Female Population of Orange County?
Total Female Population of Orange County is 1,597,214.
What is the Ratio of Males per 100 Females in Orange County?
There are 98.80 Males per 100 Females in Orange County.
What is the Ratio of Females per 100 Males in Orange County?
There are 101.22 Females per 100 Males in Orange County.
What is the Median Population Age in Orange County?
Median Population Age in Orange County is 38.7 Years.
What is the Average Family Size in Orange County
Average Family Size in Orange County is 3.4 People.
What is the Average Household Size in Orange County
Average Household Size in Orange County is 2.9 People.
How Large is the Labor Force in Orange County?
There are 1,691,614 People in the Labor Forcein in Orange County.
What is the Percentage of People in the Labor Force in Orange County?
65.6% of People are in the Labor Force in Orange County.
What is the Unemployment Rate in Orange County?
Unemployment Rate in Orange County is 5.4%.