Mono County, CA Map & Demographics
Mono County Map
Mono County Overview
$43,315
PER CAPITA INCOME
$99,721
AVG FAMILY INCOME
$82,038
AVG HOUSEHOLD INCOME
2.5%
WAGE / INCOME GAP [ % ]
97.5¢/ $1
WAGE / INCOME GAP [ $ ]
0.41
INEQUALITY / GINI INDEX
13,219
TOTAL POPULATION
7,279
MALE POPULATION
5,940
FEMALE POPULATION
122.54
MALES / 100 FEMALES
81.60
FEMALES / 100 MALES
40.5
MEDIAN AGE
2.9
AVG FAMILY SIZE
2.3
AVG HOUSEHOLD SIZE
7,580
LABOR FORCE [ PEOPLE ]
69.5%
PERCENT IN LABOR FORCE
1.9%
UNEMPLOYMENT RATE
Income in Mono County
Income Overview in Mono County
Per Capita Income in Mono County is $43,315, while median incomes of families and households are $99,721 and $82,038 respectively.
| Characteristic | Number | Measure |
| Per Capita Income | 13,219 | $43,315 |
| Median Family Income | 3,451 | $99,721 |
| Mean Family Income | 3,451 | $108,485 |
| Median Household Income | 5,473 | $82,038 |
| Mean Household Income | 5,473 | $100,757 |
| Income Deficit | 3,451 | $0 |
| Wage / Income Gap (%) | 13,219 | 2.52% |
| Wage / Income Gap ($) | 13,219 | 97.48¢ per $1 |
| Gini / Inequality Index | 13,219 | 0.41 |
Earnings by Sex in Mono County
Average Earnings in Mono County are $45,782, $46,305 for men and $45,136 for women, a difference of 2.5%.

| Sex | Number | Average Earnings |
| Male | 4,585 (58.3%) | $46,305 |
| Female | 3,284 (41.7%) | $45,136 |
| Total | 7,869 (100.0%) | $45,782 |
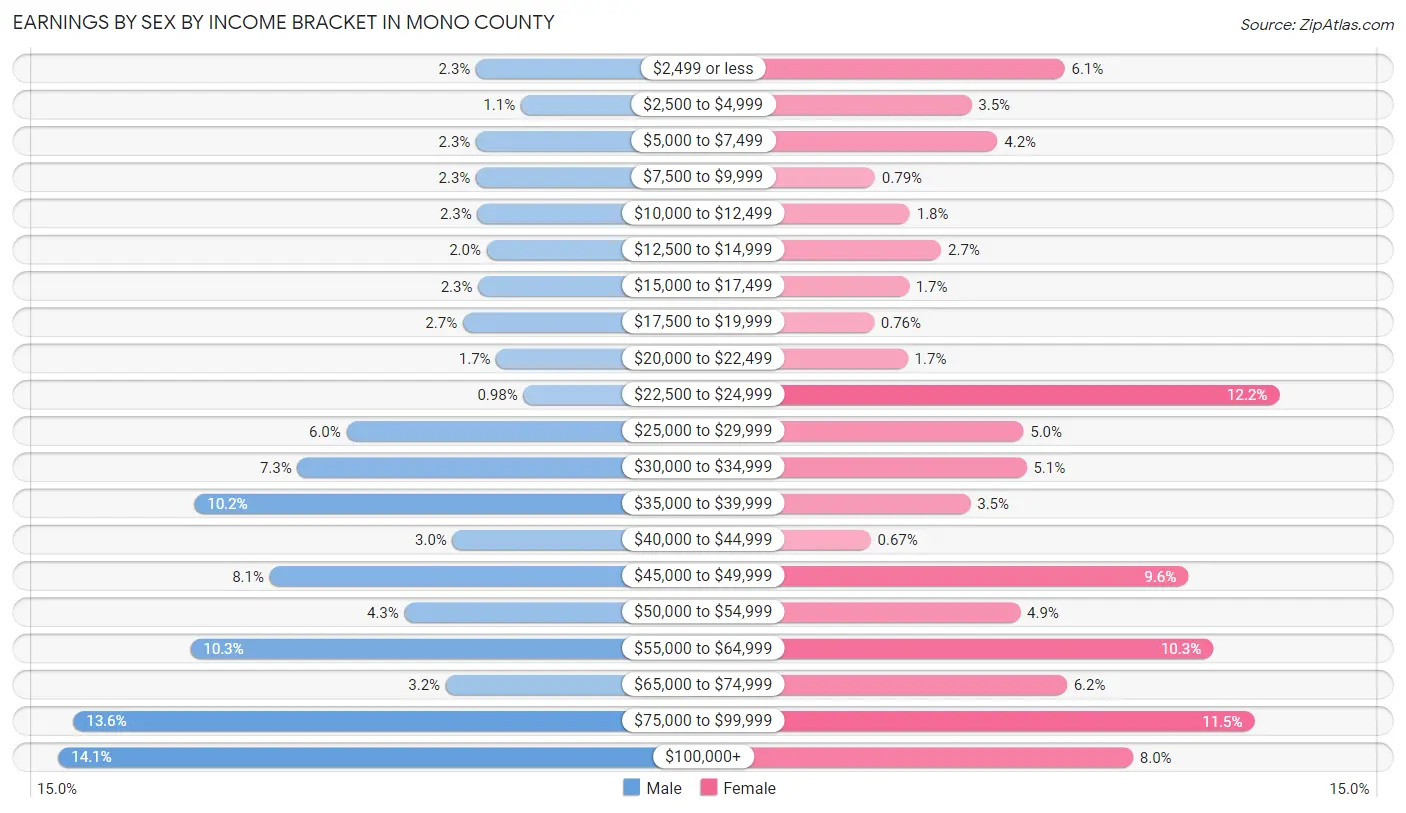
Earnings by Sex by Income Bracket in Mono County
The most common earnings brackets in Mono County are $100,000+ for men (644 | 14.1%) and $22,500 to $24,999 for women (399 | 12.1%).
| Income | Male | Female |
| $2,499 or less | 106 (2.3%) | 201 (6.1%) |
| $2,500 to $4,999 | 48 (1.1%) | 115 (3.5%) |
| $5,000 to $7,499 | 106 (2.3%) | 139 (4.2%) |
| $7,500 to $9,999 | 106 (2.3%) | 26 (0.8%) |
| $10,000 to $12,499 | 104 (2.3%) | 58 (1.8%) |
| $12,500 to $14,999 | 92 (2.0%) | 87 (2.6%) |
| $15,000 to $17,499 | 103 (2.2%) | 57 (1.7%) |
| $17,500 to $19,999 | 123 (2.7%) | 25 (0.8%) |
| $20,000 to $22,499 | 80 (1.7%) | 56 (1.7%) |
| $22,500 to $24,999 | 45 (1.0%) | 399 (12.1%) |
| $25,000 to $29,999 | 273 (5.9%) | 163 (5.0%) |
| $30,000 to $34,999 | 336 (7.3%) | 166 (5.1%) |
| $35,000 to $39,999 | 469 (10.2%) | 114 (3.5%) |
| $40,000 to $44,999 | 136 (3.0%) | 22 (0.7%) |
| $45,000 to $49,999 | 372 (8.1%) | 315 (9.6%) |
| $50,000 to $54,999 | 198 (4.3%) | 160 (4.9%) |
| $55,000 to $64,999 | 474 (10.3%) | 338 (10.3%) |
| $65,000 to $74,999 | 145 (3.2%) | 203 (6.2%) |
| $75,000 to $99,999 | 625 (13.6%) | 376 (11.5%) |
| $100,000+ | 644 (14.1%) | 264 (8.0%) |
| Total | 4,585 (100.0%) | 3,284 (100.0%) |
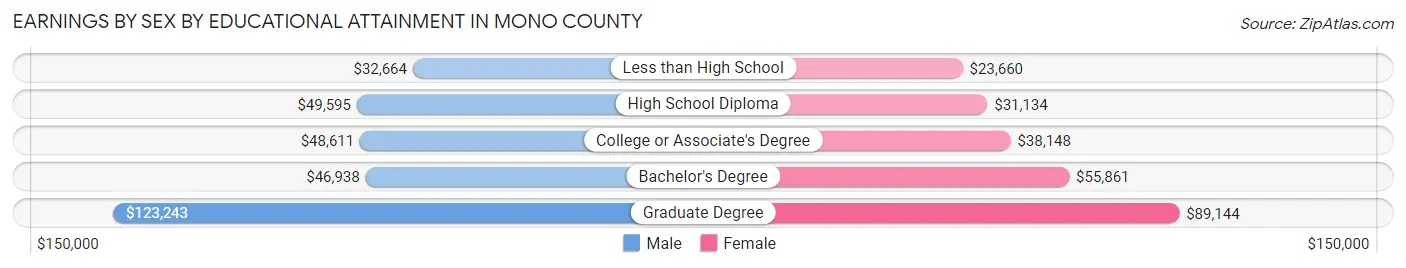
Earnings by Sex by Educational Attainment in Mono County
Average earnings in Mono County are $47,054 for men and $46,921 for women, a difference of 0.3%. Men with an educational attainment of graduate degree enjoy the highest average annual earnings of $123,243, while those with less than high school education earn the least with $32,664. Women with an educational attainment of graduate degree earn the most with the average annual earnings of $89,144, while those with less than high school education have the smallest earnings of $23,660.
| Educational Attainment | Male Income | Female Income |
| Less than High School | $32,664 | $23,660 |
| High School Diploma | $49,595 | $31,134 |
| College or Associate's Degree | $48,611 | $38,148 |
| Bachelor's Degree | $46,938 | $55,861 |
| Graduate Degree | $123,243 | $89,144 |
| Total | $47,054 | $46,921 |
Family Income in Mono County
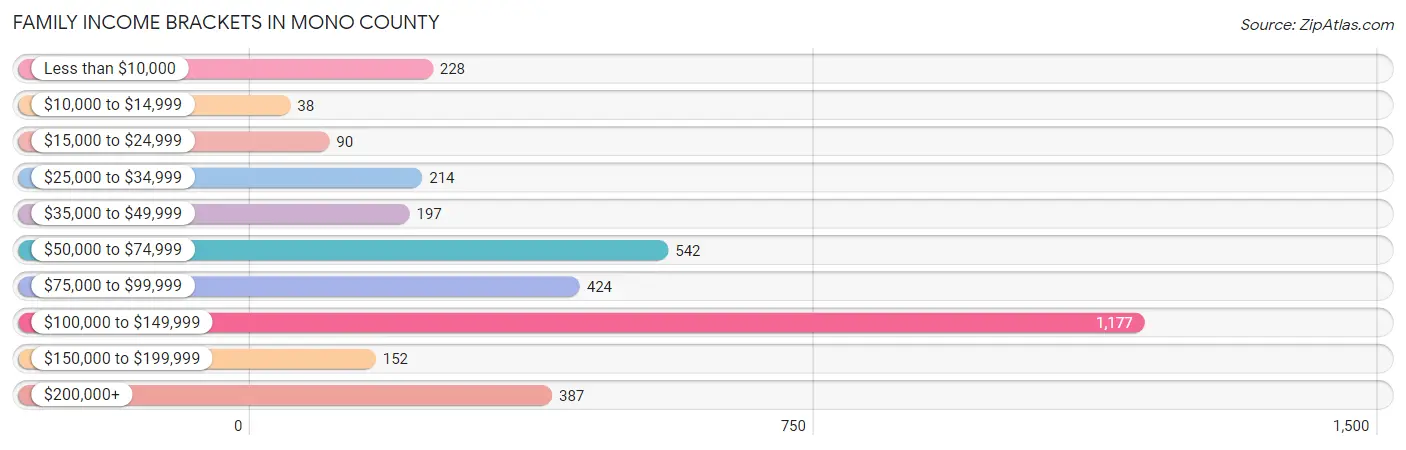
Family Income Brackets in Mono County
According to the Mono County family income data, there are 1,177 families falling into the $100,000 to $149,999 income range, which is the most common income bracket and makes up 34.1% of all families. Conversely, the $10,000 to $14,999 income bracket is the least frequent group with only 38 families (1.1%) belonging to this category.
| Income Bracket | # Families | % Families |
| Less than $10,000 | 228 | 6.6% |
| $10,000 to $14,999 | 38 | 1.1% |
| $15,000 to $24,999 | 90 | 2.6% |
| $25,000 to $34,999 | 214 | 6.2% |
| $35,000 to $49,999 | 197 | 5.7% |
| $50,000 to $74,999 | 542 | 15.7% |
| $75,000 to $99,999 | 424 | 12.3% |
| $100,000 to $149,999 | 1,177 | 34.1% |
| $150,000 to $199,999 | 152 | 4.4% |
| $200,000+ | 387 | 11.2% |
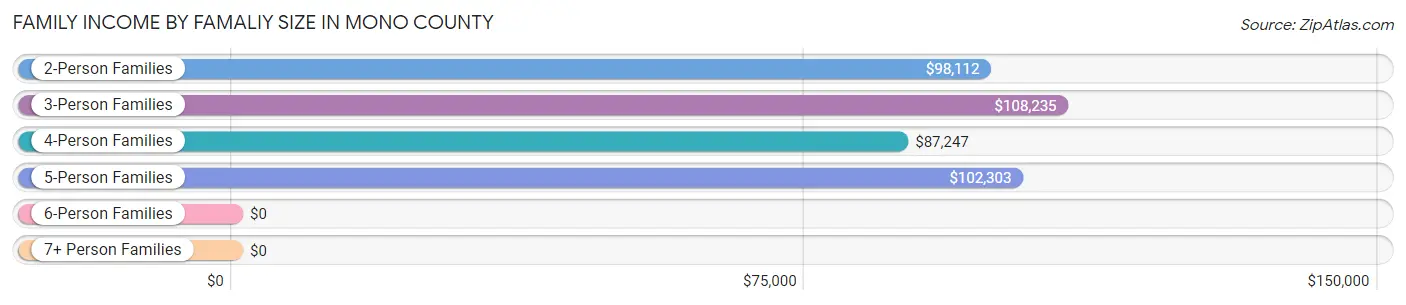
Family Income by Famaliy Size in Mono County
3-person families (478 | 13.9%) account for the highest median family income in Mono County with $108,235 per family, while 2-person families (2,059 | 59.7%) have the highest median income of $49,056 per family member.
| Income Bracket | # Families | Median Income |
| 2-Person Families | 2,059 (59.7%) | $98,112 |
| 3-Person Families | 478 (13.9%) | $108,235 |
| 4-Person Families | 635 (18.4%) | $87,247 |
| 5-Person Families | 252 (7.3%) | $102,303 |
| 6-Person Families | 27 (0.8%) | $0 |
| 7+ Person Families | 0 (0.0%) | $0 |
| Total | 3,451 (100.0%) | $99,721 |
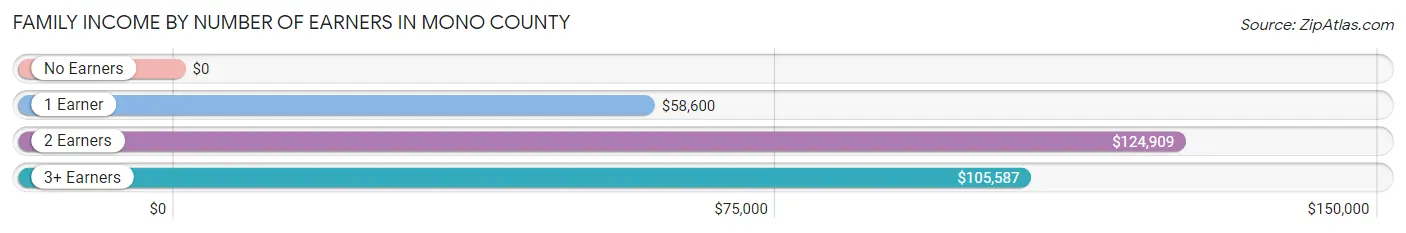
Family Income by Number of Earners in Mono County
| Number of Earners | # Families | Median Income |
| No Earners | 739 (21.4%) | $0 |
| 1 Earner | 880 (25.5%) | $58,600 |
| 2 Earners | 1,567 (45.4%) | $124,909 |
| 3+ Earners | 265 (7.7%) | $105,587 |
| Total | 3,451 (100.0%) | $99,721 |
Household Income in Mono County
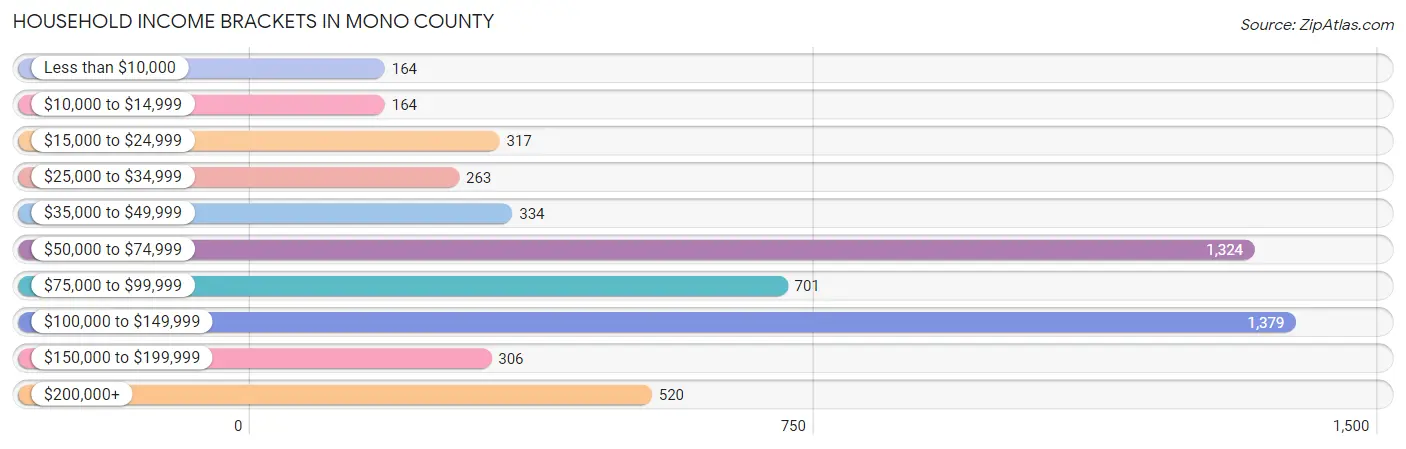
Household Income Brackets in Mono County
With 1,379 households falling in the category, the $100,000 to $149,999 income range is the most frequent in Mono County, accounting for 25.2% of all households. In contrast, only 164 households (3.0%) fall into the less than $10,000 income bracket, making it the least populous group.
| Income Bracket | # Households | % Households |
| Less than $10,000 | 164 | 3.0% |
| $10,000 to $14,999 | 164 | 3.0% |
| $15,000 to $24,999 | 317 | 5.8% |
| $25,000 to $34,999 | 263 | 4.8% |
| $35,000 to $49,999 | 334 | 6.1% |
| $50,000 to $74,999 | 1,324 | 24.2% |
| $75,000 to $99,999 | 701 | 12.8% |
| $100,000 to $149,999 | 1,379 | 25.2% |
| $150,000 to $199,999 | 306 | 5.6% |
| $200,000+ | 520 | 9.5% |
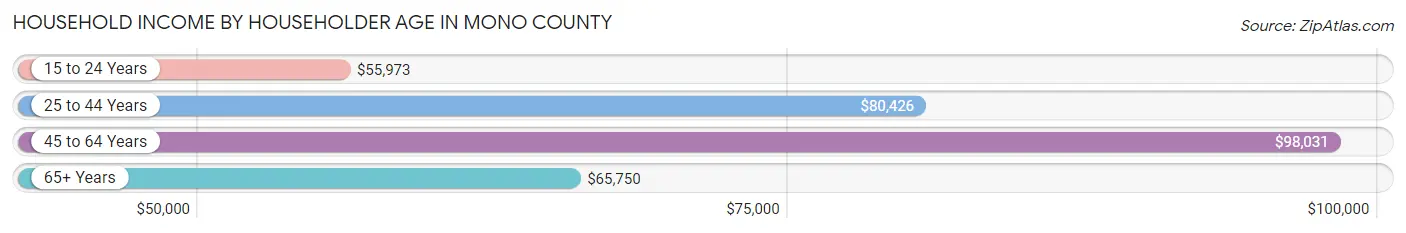
Household Income by Householder Age in Mono County
The median household income in Mono County is $82,038, with the highest median household income of $98,031 found in the 45 to 64 years age bracket for the primary householder. A total of 2,095 households (38.3%) fall into this category. Meanwhile, the 15 to 24 years age bracket for the primary householder has the lowest median household income of $55,973, with 265 households (4.8%) in this group.
| Income Bracket | # Households | Median Income |
| 15 to 24 Years | 265 (4.8%) | $55,973 |
| 25 to 44 Years | 1,836 (33.6%) | $80,426 |
| 45 to 64 Years | 2,095 (38.3%) | $98,031 |
| 65+ Years | 1,277 (23.3%) | $65,750 |
| Total | 5,473 (100.0%) | $82,038 |
Poverty in Mono County
Income Below Poverty by Sex and Age in Mono County
With 14.3% poverty level for males and 7.6% for females among the residents of Mono County, under 5 year old males and 18 to 24 year old females are the most vulnerable to poverty, with 308 males (74.0%) and 133 females (34.7%) in their respective age groups living below the poverty level.
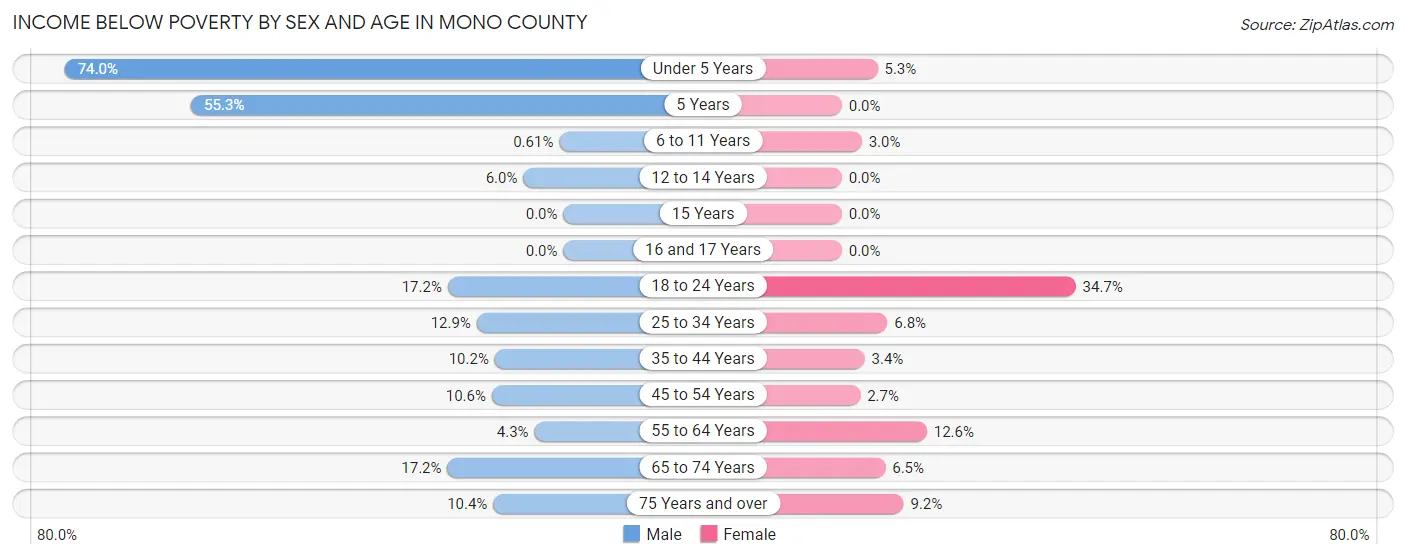
| Age Bracket | Male | Female |
| Under 5 Years | 308 (74.0%) | 6 (5.3%) |
| 5 Years | 68 (55.3%) | 0 (0.0%) |
| 6 to 11 Years | 2 (0.6%) | 9 (3.0%) |
| 12 to 14 Years | 21 (5.9%) | 0 (0.0%) |
| 15 Years | 0 (0.0%) | 0 (0.0%) |
| 16 and 17 Years | 0 (0.0%) | 0 (0.0%) |
| 18 to 24 Years | 103 (17.2%) | 133 (34.7%) |
| 25 to 34 Years | 100 (12.9%) | 65 (6.8%) |
| 35 to 44 Years | 111 (10.2%) | 27 (3.4%) |
| 45 to 54 Years | 95 (10.6%) | 25 (2.7%) |
| 55 to 64 Years | 51 (4.3%) | 115 (12.6%) |
| 65 to 74 Years | 129 (17.2%) | 39 (6.5%) |
| 75 Years and over | 40 (10.4%) | 31 (9.2%) |
| Total | 1,028 (14.3%) | 450 (7.6%) |
Income Above Poverty by Sex and Age in Mono County
According to the poverty statistics in Mono County, males aged 15 years and females aged 5 years are the age groups that are most secure financially, with 100.0% of males and 100.0% of females in these age groups living above the poverty line.
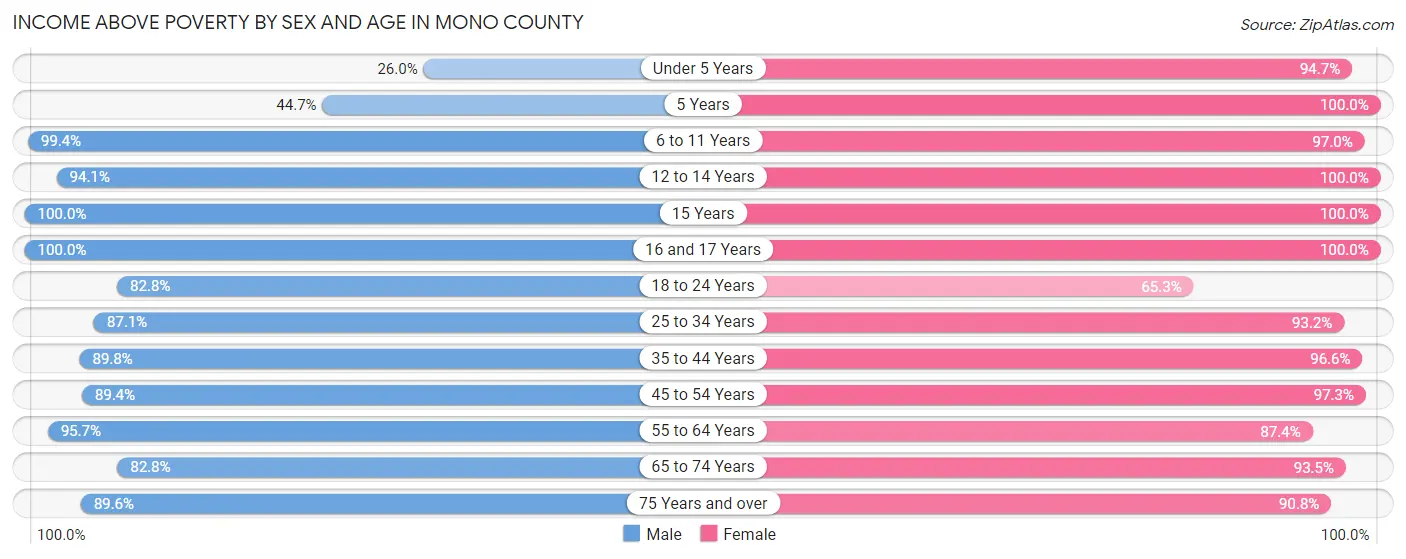
| Age Bracket | Male | Female |
| Under 5 Years | 108 (26.0%) | 107 (94.7%) |
| 5 Years | 55 (44.7%) | 154 (100.0%) |
| 6 to 11 Years | 324 (99.4%) | 295 (97.0%) |
| 12 to 14 Years | 332 (94.1%) | 182 (100.0%) |
| 15 Years | 199 (100.0%) | 142 (100.0%) |
| 16 and 17 Years | 70 (100.0%) | 127 (100.0%) |
| 18 to 24 Years | 497 (82.8%) | 250 (65.3%) |
| 25 to 34 Years | 677 (87.1%) | 896 (93.2%) |
| 35 to 44 Years | 978 (89.8%) | 769 (96.6%) |
| 45 to 54 Years | 799 (89.4%) | 888 (97.3%) |
| 55 to 64 Years | 1,136 (95.7%) | 796 (87.4%) |
| 65 to 74 Years | 620 (82.8%) | 565 (93.5%) |
| 75 Years and over | 344 (89.6%) | 307 (90.8%) |
| Total | 6,139 (85.7%) | 5,478 (92.4%) |
Income Below Poverty Among Married-Couple Families in Mono County
The poverty statistics for married-couple families in Mono County show that 5.3% or 157 of the total 2,959 families live below the poverty line. Families with no children have the highest poverty rate of 6.3%, comprising of 128 families. On the other hand, families with 3 or 4 children have the lowest poverty rate of 0.0%, which includes 0 families.
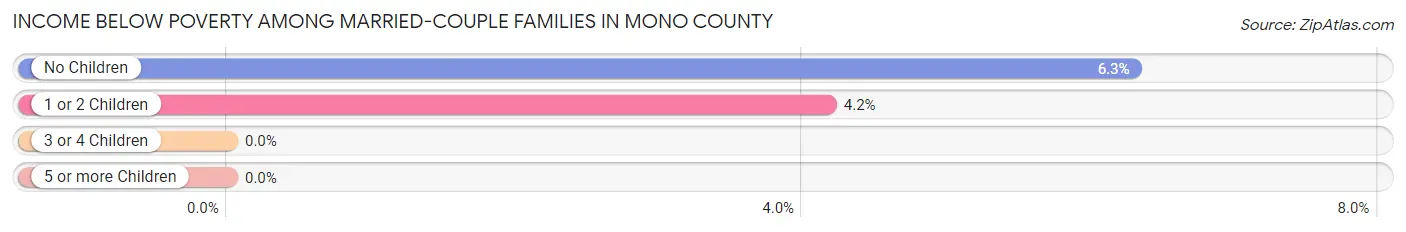
| Children | Above Poverty | Below Poverty |
| No Children | 1,908 (93.7%) | 128 (6.3%) |
| 1 or 2 Children | 666 (95.8%) | 29 (4.2%) |
| 3 or 4 Children | 228 (100.0%) | 0 (0.0%) |
| 5 or more Children | 0 (0.0%) | 0 (0.0%) |
| Total | 2,802 (94.7%) | 157 (5.3%) |
Income Below Poverty Among Single-Parent Households in Mono County
According to the poverty data in Mono County, 37.5% or 106 single-father households and 19.1% or 40 single-mother households are living below the poverty line. Among single-father households, those with 3 or 4 children have the highest poverty rate, with 104 households (100.0%) experiencing poverty. Likewise, among single-mother households, those with 3 or 4 children have the highest poverty rate, with 11 households (24.4%) falling below the poverty line.
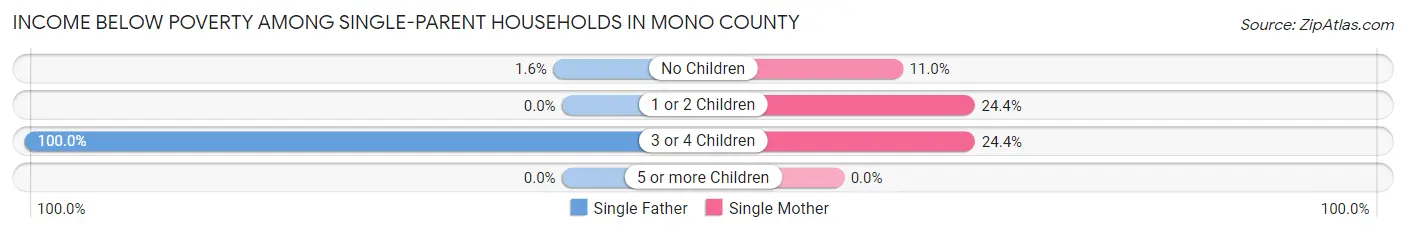
| Children | Single Father | Single Mother |
| No Children | 2 (1.6%) | 9 (11.0%) |
| 1 or 2 Children | 0 (0.0%) | 20 (24.4%) |
| 3 or 4 Children | 104 (100.0%) | 11 (24.4%) |
| 5 or more Children | 0 (0.0%) | 0 (0.0%) |
| Total | 106 (37.5%) | 40 (19.1%) |
Income Below Poverty Among Married-Couple vs Single-Parent Households in Mono County
The poverty data for Mono County shows that 157 of the married-couple family households (5.3%) and 146 of the single-parent households (29.7%) are living below the poverty level. Within the married-couple family households, those with no children have the highest poverty rate, with 128 households (6.3%) falling below the poverty line. Among the single-parent households, those with 3 or 4 children have the highest poverty rate, with 115 household (77.2%) living below poverty.
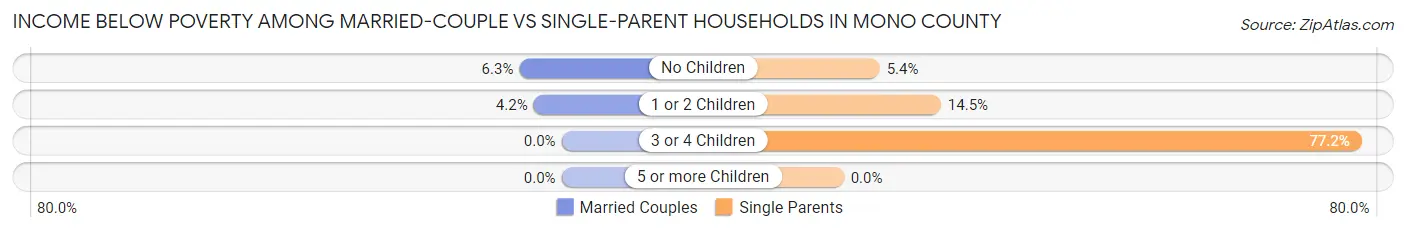
| Children | Married-Couple Families | Single-Parent Households |
| No Children | 128 (6.3%) | 11 (5.4%) |
| 1 or 2 Children | 29 (4.2%) | 20 (14.5%) |
| 3 or 4 Children | 0 (0.0%) | 115 (77.2%) |
| 5 or more Children | 0 (0.0%) | 0 (0.0%) |
| Total | 157 (5.3%) | 146 (29.7%) |
Race in Mono County
The most populous races in Mono County are White / Caucasian (10,437 | 78.9%), Hispanic or Latino (3,582 | 27.1%), and Two or more Races (1,188 | 9.0%).
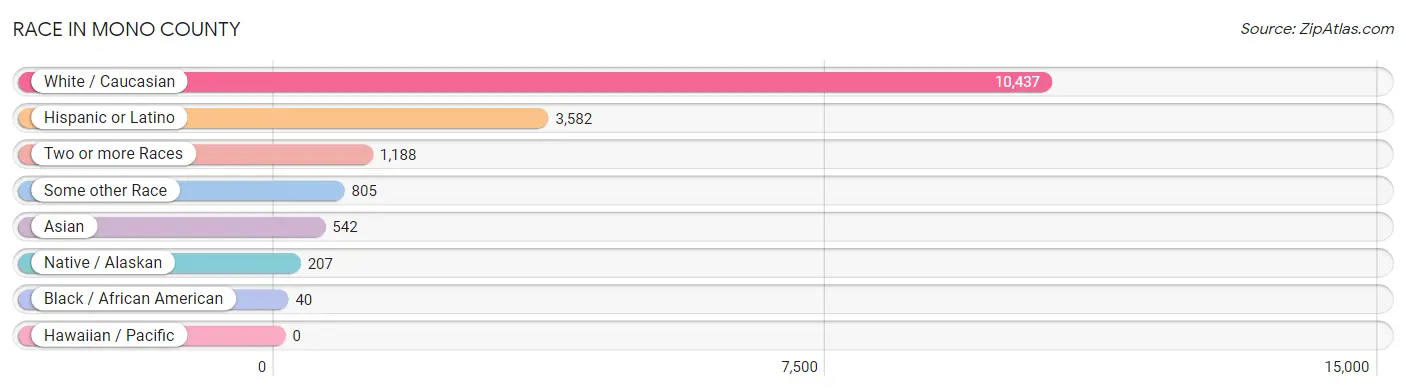
| Race | # Population | % Population |
| Asian | 542 | 4.1% |
| Black / African American | 40 | 0.3% |
| Hawaiian / Pacific | 0 | 0.0% |
| Hispanic or Latino | 3,582 | 27.1% |
| Native / Alaskan | 207 | 1.6% |
| White / Caucasian | 10,437 | 78.9% |
| Two or more Races | 1,188 | 9.0% |
| Some other Race | 805 | 6.1% |
| Total | 13,219 | 100.0% |
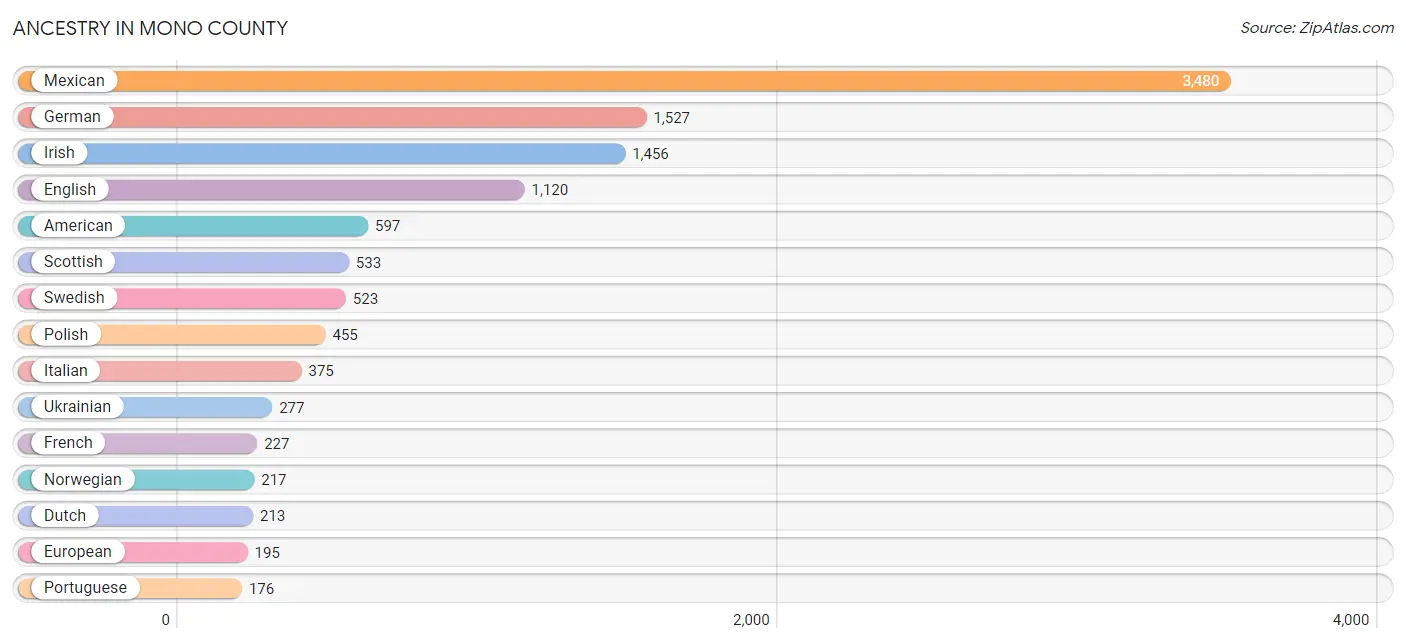
Ancestry in Mono County
The most populous ancestries reported in Mono County are Mexican (3,480 | 26.3%), German (1,527 | 11.6%), Irish (1,456 | 11.0%), English (1,120 | 8.5%), and American (597 | 4.5%), together accounting for 61.9% of all Mono County residents.
| Ancestry | # Population | % Population |
| African | 17 | 0.1% |
| Albanian | 16 | 0.1% |
| American | 597 | 4.5% |
| Apache | 47 | 0.4% |
| Arab | 60 | 0.4% |
| Austrian | 3 | 0.0% |
| Belgian | 3 | 0.0% |
| Bhutanese | 48 | 0.4% |
| British | 70 | 0.5% |
| Canadian | 42 | 0.3% |
| Central American | 23 | 0.2% |
| Cherokee | 41 | 0.3% |
| Chippewa | 6 | 0.1% |
| Costa Rican | 17 | 0.1% |
| Creek | 41 | 0.3% |
| Croatian | 26 | 0.2% |
| Czech | 46 | 0.4% |
| Danish | 9 | 0.1% |
| Dominican | 14 | 0.1% |
| Dutch | 213 | 1.6% |
| Eastern European | 40 | 0.3% |
| Egyptian | 42 | 0.3% |
| English | 1,120 | 8.5% |
| European | 195 | 1.5% |
| Finnish | 108 | 0.8% |
| French | 227 | 1.7% |
| French Canadian | 125 | 0.9% |
| German | 1,527 | 11.6% |
| Greek | 29 | 0.2% |
| Guatemalan | 2 | 0.0% |
| Hungarian | 126 | 0.9% |
| Indian (Asian) | 8 | 0.1% |
| Iranian | 11 | 0.1% |
| Irish | 1,456 | 11.0% |
| Iroquois | 24 | 0.2% |
| Italian | 375 | 2.8% |
| Japanese | 143 | 1.1% |
| Korean | 53 | 0.4% |
| Lebanese | 12 | 0.1% |
| Lithuanian | 4 | 0.0% |
| Macedonian | 1 | 0.0% |
| Mexican | 3,480 | 26.3% |
| Moroccan | 6 | 0.1% |
| Native Hawaiian | 4 | 0.0% |
| New Zealander | 21 | 0.2% |
| Northern European | 25 | 0.2% |
| Norwegian | 217 | 1.6% |
| Paiute | 173 | 1.3% |
| Peruvian | 3 | 0.0% |
| Polish | 455 | 3.4% |
| Portuguese | 176 | 1.3% |
| Russian | 68 | 0.5% |
| Salvadoran | 4 | 0.0% |
| Scandinavian | 60 | 0.4% |
| Scotch-Irish | 27 | 0.2% |
| Scottish | 533 | 4.0% |
| Serbian | 7 | 0.1% |
| Shoshone | 86 | 0.6% |
| South American | 3 | 0.0% |
| Spaniard | 17 | 0.1% |
| Spanish | 5 | 0.0% |
| Sri Lankan | 128 | 1.0% |
| Subsaharan African | 17 | 0.1% |
| Swedish | 523 | 4.0% |
| Swiss | 57 | 0.4% |
| Thai | 2 | 0.0% |
| Ukrainian | 277 | 2.1% |
| Welsh | 156 | 1.2% | View All 68 Rows |
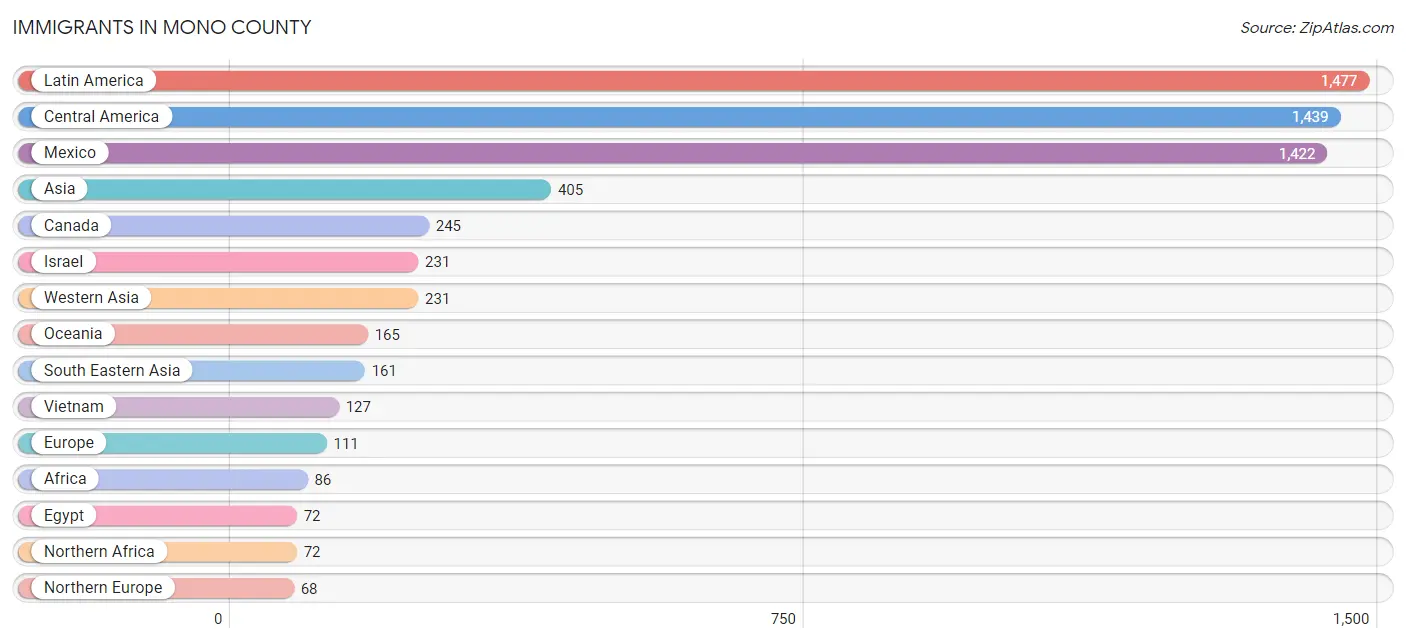
Immigrants in Mono County
The most numerous immigrant groups reported in Mono County came from Latin America (1,477 | 11.2%), Central America (1,439 | 10.9%), Mexico (1,422 | 10.8%), Asia (405 | 3.1%), and Canada (245 | 1.8%), together accounting for 37.7% of all Mono County residents.
| Immigration Origin | # Population | % Population |
| Africa | 86 | 0.6% |
| Albania | 16 | 0.1% |
| Asia | 405 | 3.1% |
| Australia | 19 | 0.1% |
| Belarus | 2 | 0.0% |
| Belgium | 3 | 0.0% |
| Brazil | 3 | 0.0% |
| Cabo Verde | 14 | 0.1% |
| Canada | 245 | 1.8% |
| Central America | 1,439 | 10.9% |
| Chile | 32 | 0.2% |
| China | 2 | 0.0% |
| Costa Rica | 17 | 0.1% |
| Eastern Asia | 2 | 0.0% |
| Eastern Europe | 19 | 0.1% |
| Egypt | 72 | 0.5% |
| England | 14 | 0.1% |
| Europe | 111 | 0.8% |
| Germany | 21 | 0.2% |
| Iran | 11 | 0.1% |
| Israel | 231 | 1.8% |
| Latin America | 1,477 | 11.2% |
| Lithuania | 1 | 0.0% |
| Mexico | 1,422 | 10.8% |
| Northern Africa | 72 | 0.5% |
| Northern Europe | 68 | 0.5% |
| Oceania | 165 | 1.3% |
| Peru | 3 | 0.0% |
| Philippines | 34 | 0.3% |
| South America | 38 | 0.3% |
| South Central Asia | 11 | 0.1% |
| South Eastern Asia | 161 | 1.2% |
| Vietnam | 127 | 1.0% |
| Western Africa | 14 | 0.1% |
| Western Asia | 231 | 1.8% |
| Western Europe | 24 | 0.2% | View All 36 Rows |
Sex and Age in Mono County
Sex and Age in Mono County
The most populous age groups in Mono County are 35 to 39 Years (718 | 9.9%) for men and 30 to 34 Years (521 | 8.8%) for women.
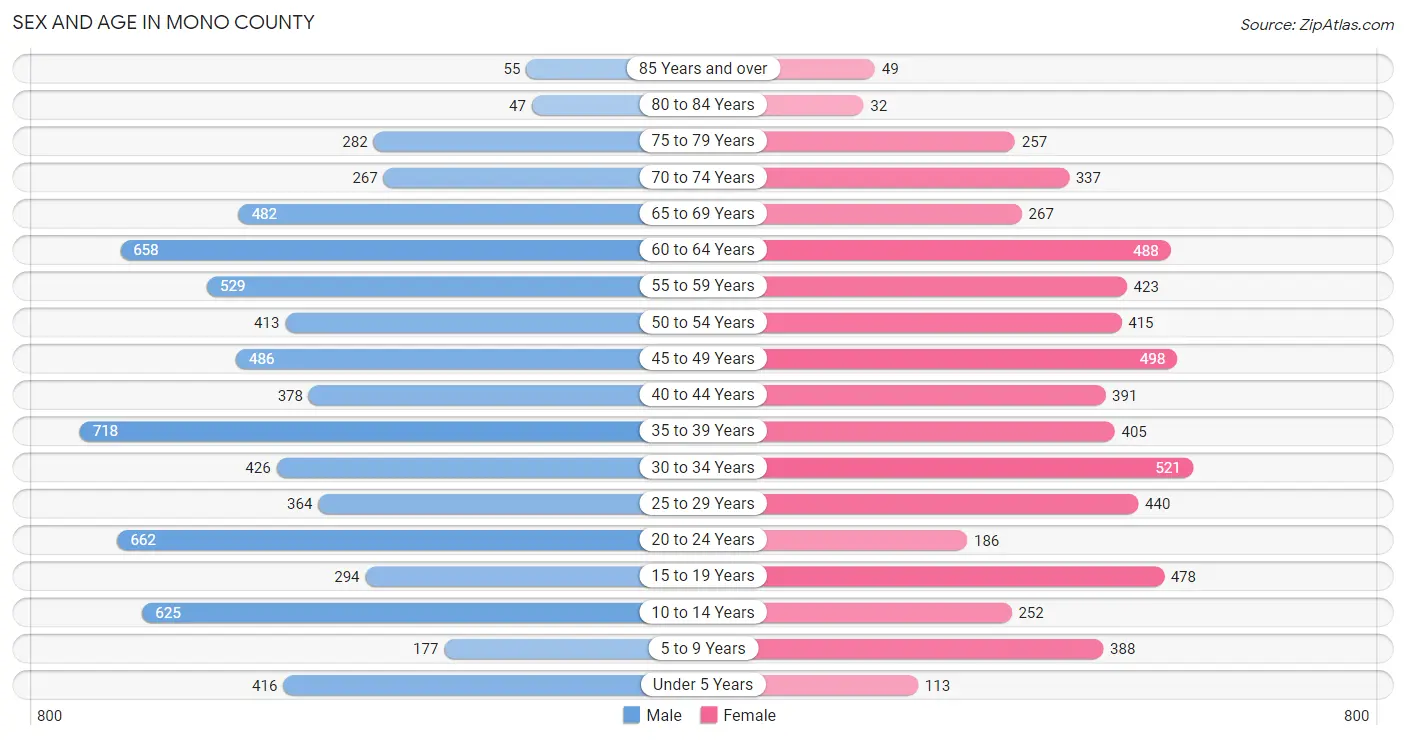
| Age Bracket | Male | Female |
| Under 5 Years | 416 (5.7%) | 113 (1.9%) |
| 5 to 9 Years | 177 (2.4%) | 388 (6.5%) |
| 10 to 14 Years | 625 (8.6%) | 252 (4.2%) |
| 15 to 19 Years | 294 (4.0%) | 478 (8.1%) |
| 20 to 24 Years | 662 (9.1%) | 186 (3.1%) |
| 25 to 29 Years | 364 (5.0%) | 440 (7.4%) |
| 30 to 34 Years | 426 (5.9%) | 521 (8.8%) |
| 35 to 39 Years | 718 (9.9%) | 405 (6.8%) |
| 40 to 44 Years | 378 (5.2%) | 391 (6.6%) |
| 45 to 49 Years | 486 (6.7%) | 498 (8.4%) |
| 50 to 54 Years | 413 (5.7%) | 415 (7.0%) |
| 55 to 59 Years | 529 (7.3%) | 423 (7.1%) |
| 60 to 64 Years | 658 (9.0%) | 488 (8.2%) |
| 65 to 69 Years | 482 (6.6%) | 267 (4.5%) |
| 70 to 74 Years | 267 (3.7%) | 337 (5.7%) |
| 75 to 79 Years | 282 (3.9%) | 257 (4.3%) |
| 80 to 84 Years | 47 (0.6%) | 32 (0.5%) |
| 85 Years and over | 55 (0.8%) | 49 (0.8%) |
| Total | 7,279 (100.0%) | 5,940 (100.0%) |
Families and Households in Mono County
Median Family Size in Mono County
The median family size in Mono County is 2.89 persons per family, with married-couple families (2,959 | 85.7%) accounting for the largest median family size of 2.94 persons per family. On the other hand, single male/father families (283 | 8.2%) represent the smallest median family size with 2.42 persons per family.
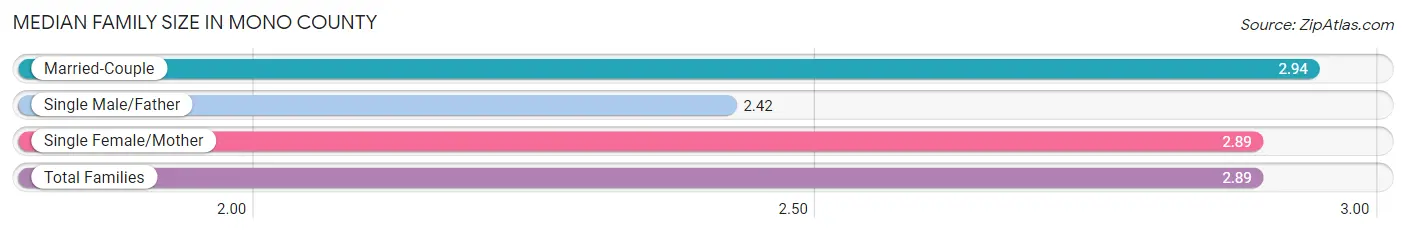
| Family Type | # Families | Family Size |
| Married-Couple | 2,959 (85.7%) | 2.94 |
| Single Male/Father | 283 (8.2%) | 2.42 |
| Single Female/Mother | 209 (6.1%) | 2.89 |
| Total Families | 3,451 (100.0%) | 2.89 |
Median Household Size in Mono County
The median household size in Mono County is 2.33 persons per household, with single female/mother households (209 | 3.8%) accounting for the largest median household size of 3.11 persons per household. non-family households (2,022 | 36.9%) represent the smallest median household size with 1.32 persons per household.
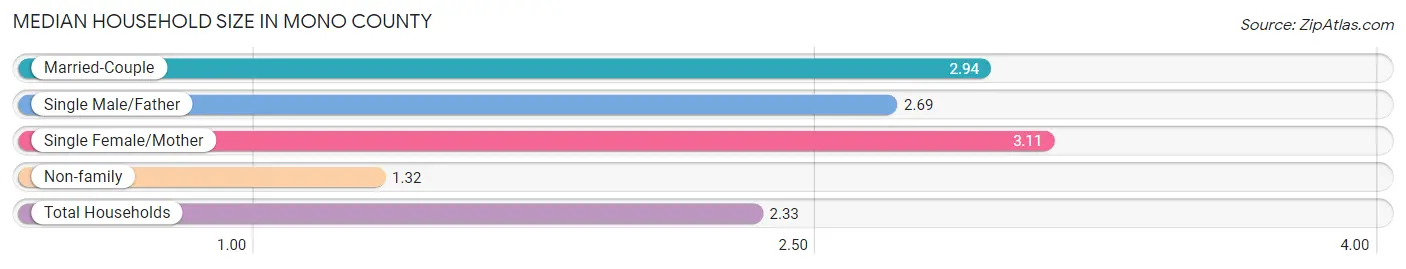
| Household Type | # Households | Household Size |
| Married-Couple | 2,959 (54.1%) | 2.94 |
| Single Male/Father | 283 (5.2%) | 2.69 |
| Single Female/Mother | 209 (3.8%) | 3.11 |
| Non-family | 2,022 (36.9%) | 1.32 |
| Total Households | 5,473 (100.0%) | 2.33 |
Household Size by Marriage Status in Mono County
Out of a total of 5,473 households in Mono County, 3,451 (63.0%) are family households, while 2,022 (36.9%) are nonfamily households. The most numerous type of family households are 2-person households, comprising 1,949, and the most common type of nonfamily households are 1-person households, comprising 1,595.
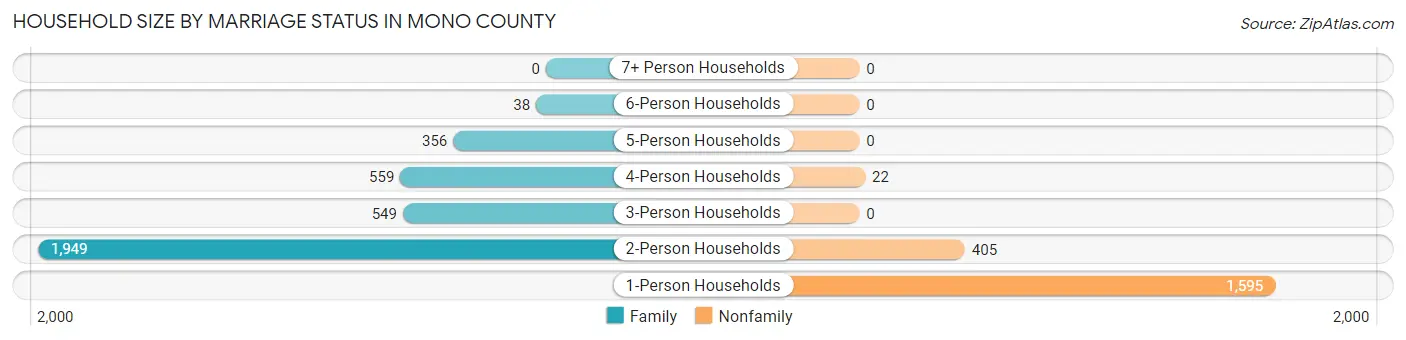
| Household Size | Family Households | Nonfamily Households |
| 1-Person Households | - | 1,595 (29.1%) |
| 2-Person Households | 1,949 (35.6%) | 405 (7.4%) |
| 3-Person Households | 549 (10.0%) | 0 (0.0%) |
| 4-Person Households | 559 (10.2%) | 22 (0.4%) |
| 5-Person Households | 356 (6.5%) | 0 (0.0%) |
| 6-Person Households | 38 (0.7%) | 0 (0.0%) |
| 7+ Person Households | 0 (0.0%) | 0 (0.0%) |
| Total | 3,451 (63.0%) | 2,022 (36.9%) |
Female Fertility in Mono County
Fertility by Age in Mono County
Average fertility rate in Mono County is 51.0 births per 1,000 women. Women in the age bracket of 35 to 50 years have the highest fertility rate with 62.0 births per 1,000 women. Women in the age bracket of 35 to 50 years acount for 57.7% of all women with births.
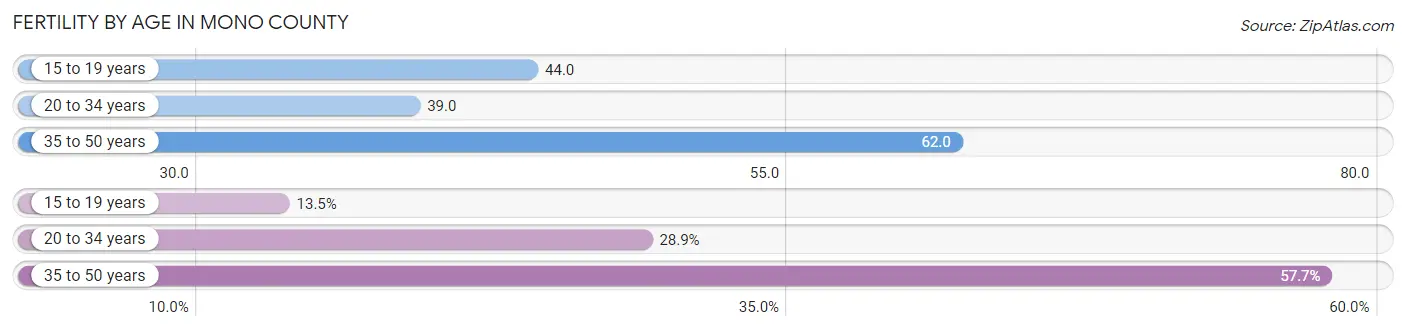
| Age Bracket | Women with Births | Births / 1,000 Women |
| 15 to 19 years | 21 (13.5%) | 44.0 |
| 20 to 34 years | 45 (28.8%) | 39.0 |
| 35 to 50 years | 90 (57.7%) | 62.0 |
| Total | 156 (100.0%) | 51.0 |
Fertility by Age by Marriage Status in Mono County
76.3% of women with births (156) in Mono County are married. The highest percentage of unmarried women with births falls into 15 to 19 years age bracket with 100.0% of them unmarried at the time of birth, while the lowest percentage of unmarried women with births belong to 35 to 50 years age bracket with 0.0% of them unmarried.
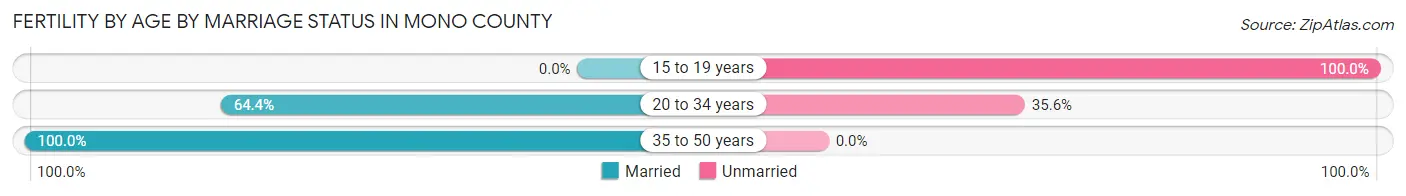
| Age Bracket | Married | Unmarried |
| 15 to 19 years | 0 (0.0%) | 21 (100.0%) |
| 20 to 34 years | 29 (64.4%) | 16 (35.6%) |
| 35 to 50 years | 90 (100.0%) | 0 (0.0%) |
| Total | 119 (76.3%) | 37 (23.7%) |
Fertility by Education in Mono County
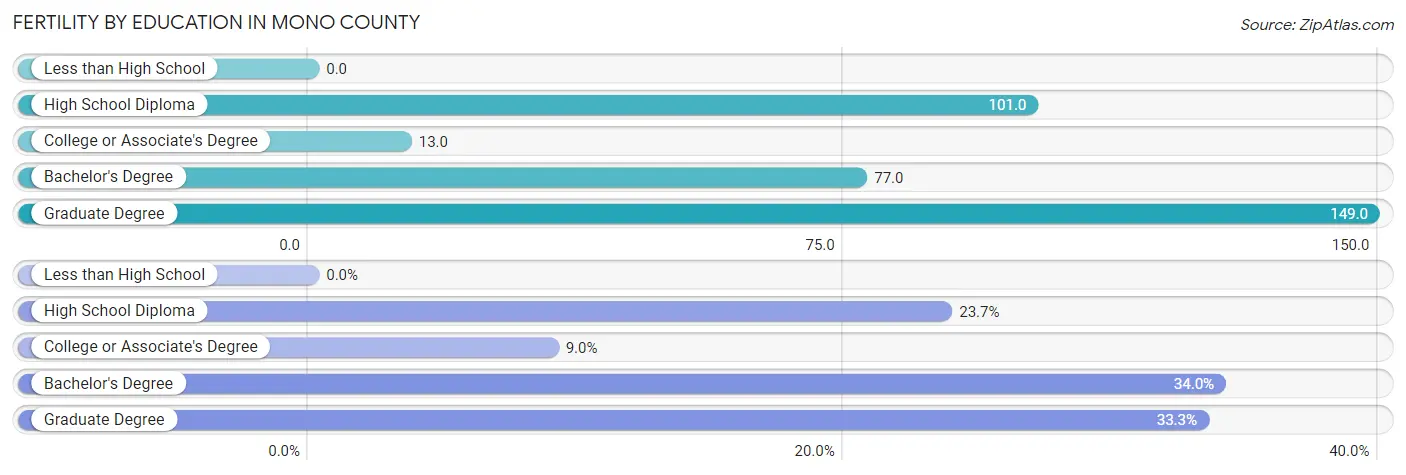
| Educational Attainment | Women with Births | Births / 1,000 Women |
| Less than High School | 0 (0.0%) | 0.0 |
| High School Diploma | 37 (23.7%) | 101.0 |
| College or Associate's Degree | 14 (9.0%) | 13.0 |
| Bachelor's Degree | 53 (34.0%) | 77.0 |
| Graduate Degree | 52 (33.3%) | 149.0 |
| Total | 156 (100.0%) | 51.0 |
Fertility by Education by Marriage Status in Mono County
23.7% of women with births in Mono County are unmarried. Women with the educational attainment of college or associate's degree are most likely to be married with 100.0% of them married at childbirth, while women with the educational attainment of high school diploma are least likely to be married with 100.0% of them unmarried at childbirth.
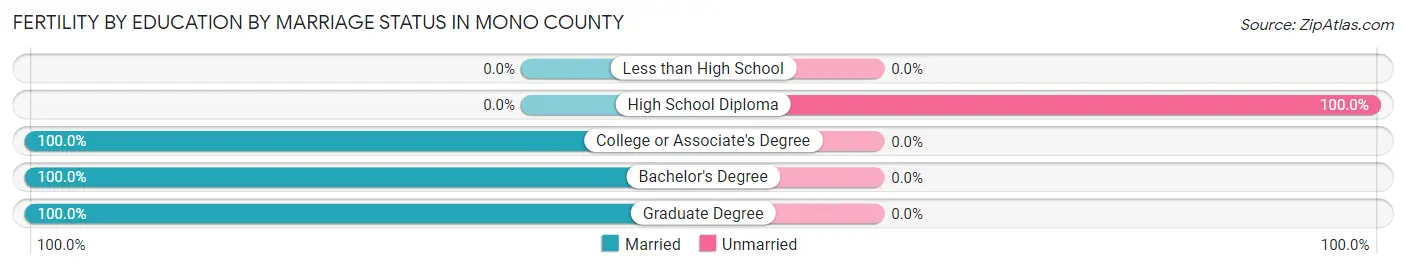
| Educational Attainment | Married | Unmarried |
| Less than High School | 0 (0.0%) | 0 (0.0%) |
| High School Diploma | 0 (0.0%) | 37 (100.0%) |
| College or Associate's Degree | 14 (100.0%) | 0 (0.0%) |
| Bachelor's Degree | 53 (100.0%) | 0 (0.0%) |
| Graduate Degree | 52 (100.0%) | 0 (0.0%) |
| Total | 119 (76.3%) | 37 (23.7%) |
Employment Characteristics in Mono County
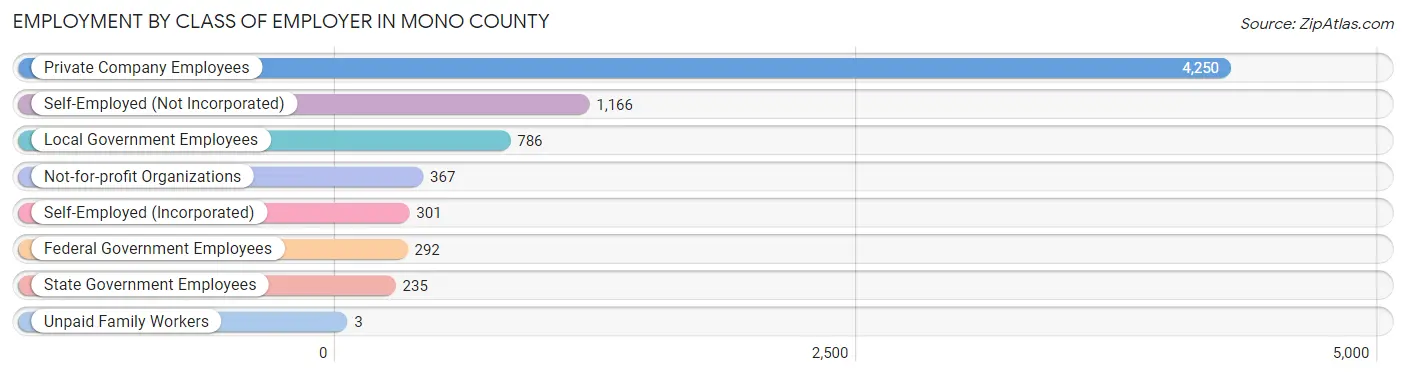
Employment by Class of Employer in Mono County
Among the 7,400 employed individuals in Mono County, private company employees (4,250 | 57.4%), self-employed (not incorporated) (1,166 | 15.8%), and local government employees (786 | 10.6%) make up the most common classes of employment.
| Employer Class | # Employees | % Employees |
| Private Company Employees | 4,250 | 57.4% |
| Self-Employed (Incorporated) | 301 | 4.1% |
| Self-Employed (Not Incorporated) | 1,166 | 15.8% |
| Not-for-profit Organizations | 367 | 5.0% |
| Local Government Employees | 786 | 10.6% |
| State Government Employees | 235 | 3.2% |
| Federal Government Employees | 292 | 4.0% |
| Unpaid Family Workers | 3 | 0.0% |
| Total | 7,400 | 100.0% |
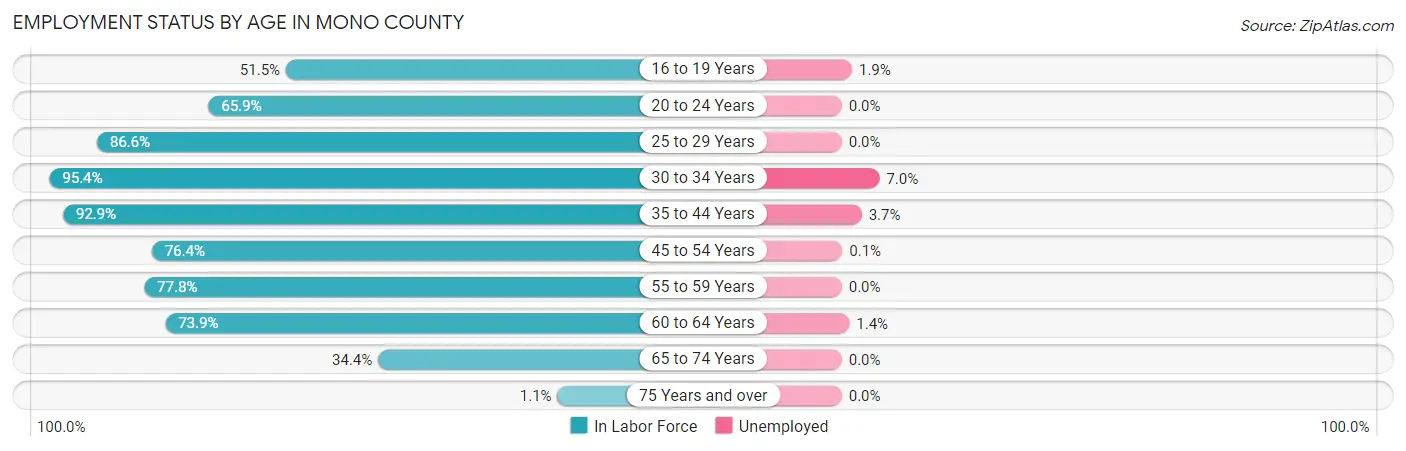
Employment Status by Age in Mono County
According to the labor force statistics for Mono County, out of the total population over 16 years of age (10,907), 69.5% or 7,580 individuals are in the labor force, with 1.9% or 144 of them unemployed. The age group with the highest labor force participation rate is 30 to 34 years, with 95.4% or 903 individuals in the labor force. Within the labor force, the 30 to 34 years age range has the highest percentage of unemployed individuals, with 7.0% or 63 of them being unemployed.
| Age Bracket | In Labor Force | Unemployed |
| 16 to 19 Years | 222 (51.5%) | 4 (1.9%) |
| 20 to 24 Years | 559 (65.9%) | 0 (0.0%) |
| 25 to 29 Years | 696 (86.6%) | 0 (0.0%) |
| 30 to 34 Years | 903 (95.4%) | 63 (7.0%) |
| 35 to 44 Years | 1,758 (92.9%) | 65 (3.7%) |
| 45 to 54 Years | 1,384 (76.4%) | 1 (0.1%) |
| 55 to 59 Years | 741 (77.8%) | 0 (0.0%) |
| 60 to 64 Years | 847 (73.9%) | 12 (1.4%) |
| 65 to 74 Years | 465 (34.4%) | 0 (0.0%) |
| 75 Years and over | 8 (1.1%) | 0 (0.0%) |
| Total | 7,580 (69.5%) | 144 (1.9%) |
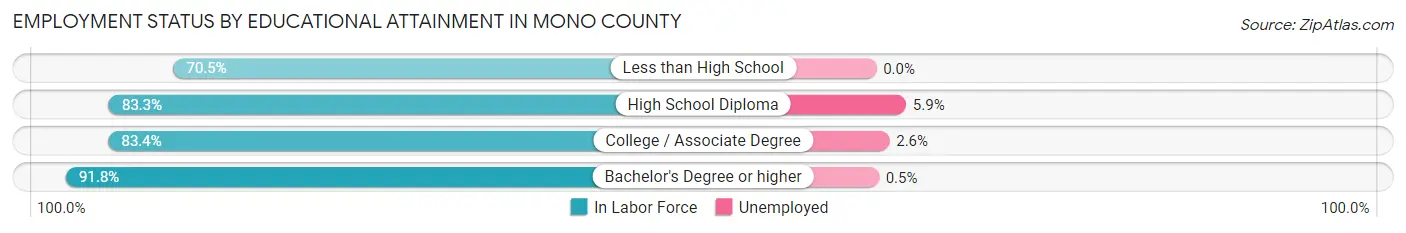
Employment Status by Educational Attainment in Mono County
According to labor force statistics for Mono County, 83.8% of individuals (6,329) out of the total population between 25 and 64 years of age (7,553) are in the labor force, with 2.2% or 139 of them being unemployed. The group with the highest labor force participation rate are those with the educational attainment of bachelor's degree or higher, with 91.8% or 2,002 individuals in the labor force. Within the labor force, individuals with high school diploma education have the highest percentage of unemployment, with 5.9% or 77 of them being unemployed.
| Educational Attainment | In Labor Force | Unemployed |
| Less than High School | 839 (70.5%) | 0 (0.0%) |
| High School Diploma | 1,307 (83.3%) | 93 (5.9%) |
| College / Associate Degree | 2,179 (83.4%) | 68 (2.6%) |
| Bachelor's Degree or higher | 2,002 (91.8%) | 11 (0.5%) |
| Total | 6,329 (83.8%) | 166 (2.2%) |
Employment Occupations by Sex in Mono County
Management, Business, Science and Arts Occupations
The most common Management, Business, Science and Arts occupations in Mono County are Management (1,437 | 19.7%), Community & Social Service (599 | 8.2%), Education Instruction & Library (486 | 6.7%), Computers, Engineering & Science (386 | 5.3%), and Health Diagnosing & Treating (374 | 5.1%).
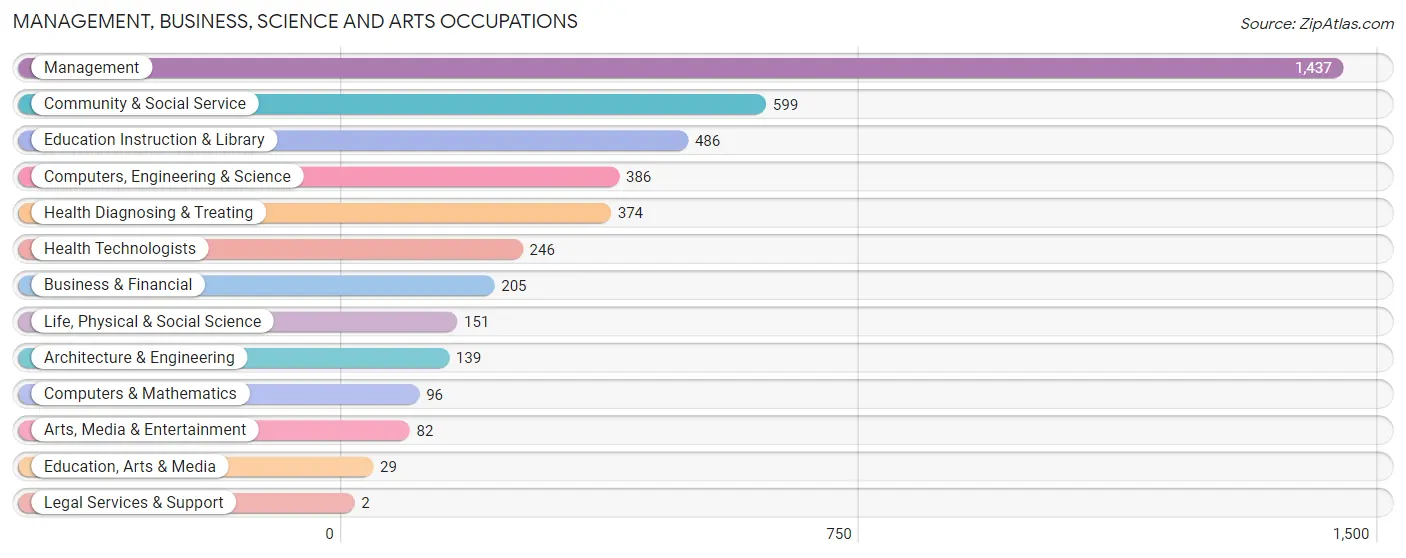
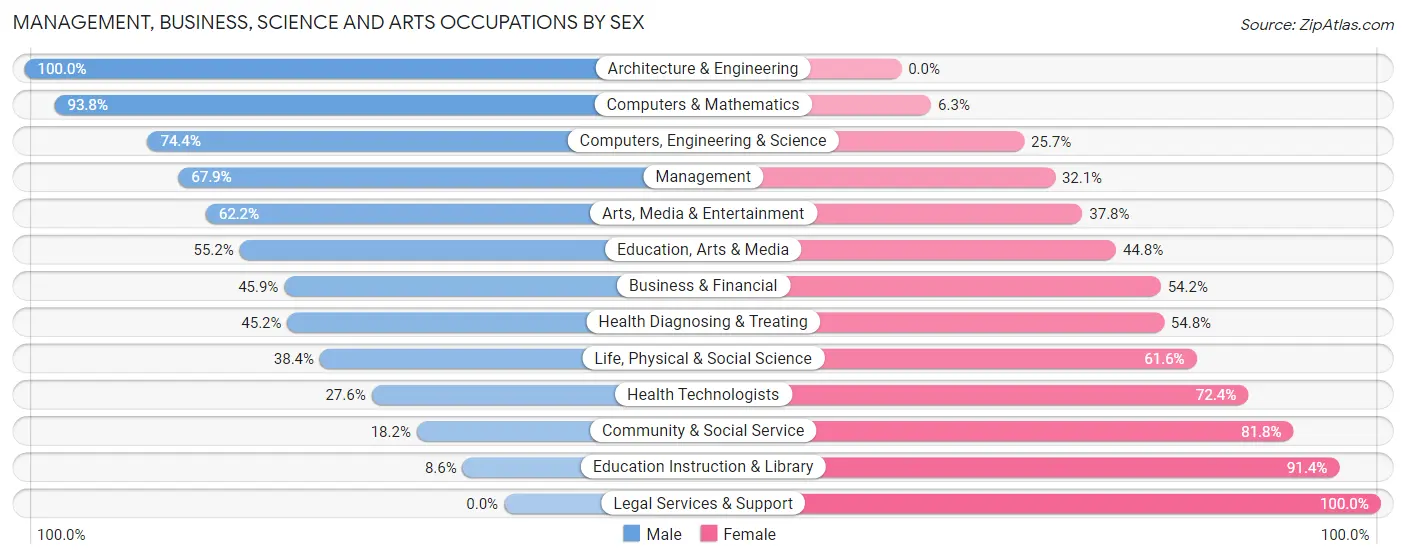
Management, Business, Science and Arts Occupations by Sex
Within the Management, Business, Science and Arts occupations in Mono County, the most male-oriented occupations are Architecture & Engineering (100.0%), Computers & Mathematics (93.8%), and Computers, Engineering & Science (74.4%), while the most female-oriented occupations are Legal Services & Support (100.0%), Education Instruction & Library (91.4%), and Community & Social Service (81.8%).
| Occupation | Male | Female |
| Management | 976 (67.9%) | 461 (32.1%) |
| Business & Financial | 94 (45.9%) | 111 (54.1%) |
| Computers, Engineering & Science | 287 (74.4%) | 99 (25.7%) |
| Computers & Mathematics | 90 (93.8%) | 6 (6.2%) |
| Architecture & Engineering | 139 (100.0%) | 0 (0.0%) |
| Life, Physical & Social Science | 58 (38.4%) | 93 (61.6%) |
| Community & Social Service | 109 (18.2%) | 490 (81.8%) |
| Education, Arts & Media | 16 (55.2%) | 13 (44.8%) |
| Legal Services & Support | 0 (0.0%) | 2 (100.0%) |
| Education Instruction & Library | 42 (8.6%) | 444 (91.4%) |
| Arts, Media & Entertainment | 51 (62.2%) | 31 (37.8%) |
| Health Diagnosing & Treating | 169 (45.2%) | 205 (54.8%) |
| Health Technologists | 68 (27.6%) | 178 (72.4%) |
| Total (Category) | 1,635 (54.5%) | 1,366 (45.5%) |
| Total (Overall) | 4,136 (56.8%) | 3,143 (43.2%) |
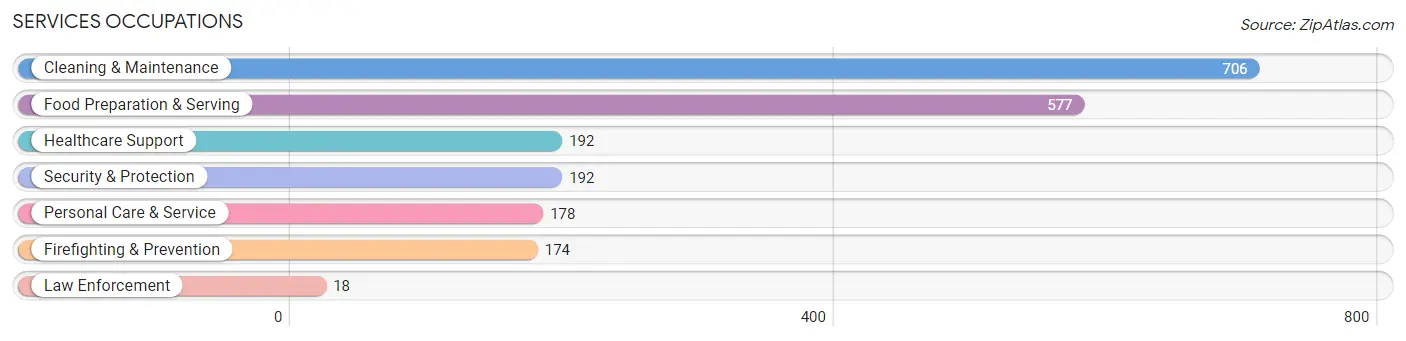
Services Occupations
The most common Services occupations in Mono County are Cleaning & Maintenance (706 | 9.7%), Food Preparation & Serving (577 | 7.9%), Healthcare Support (192 | 2.6%), Security & Protection (192 | 2.6%), and Personal Care & Service (178 | 2.5%).
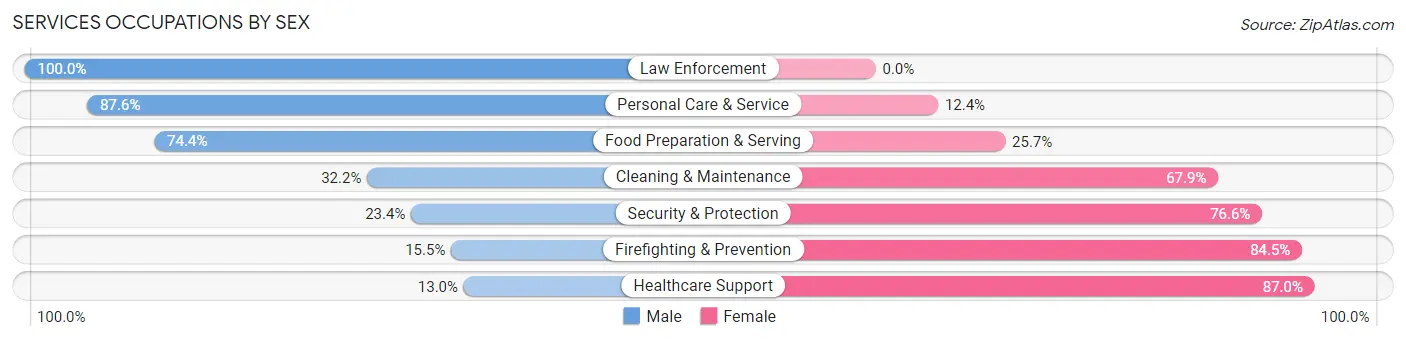
Services Occupations by Sex
Within the Services occupations in Mono County, the most male-oriented occupations are Law Enforcement (100.0%), Personal Care & Service (87.6%), and Food Preparation & Serving (74.4%), while the most female-oriented occupations are Healthcare Support (87.0%), Firefighting & Prevention (84.5%), and Security & Protection (76.6%).
| Occupation | Male | Female |
| Healthcare Support | 25 (13.0%) | 167 (87.0%) |
| Security & Protection | 45 (23.4%) | 147 (76.6%) |
| Firefighting & Prevention | 27 (15.5%) | 147 (84.5%) |
| Law Enforcement | 18 (100.0%) | 0 (0.0%) |
| Food Preparation & Serving | 429 (74.4%) | 148 (25.7%) |
| Cleaning & Maintenance | 227 (32.2%) | 479 (67.8%) |
| Personal Care & Service | 156 (87.6%) | 22 (12.4%) |
| Total (Category) | 882 (47.8%) | 963 (52.2%) |
| Total (Overall) | 4,136 (56.8%) | 3,143 (43.2%) |
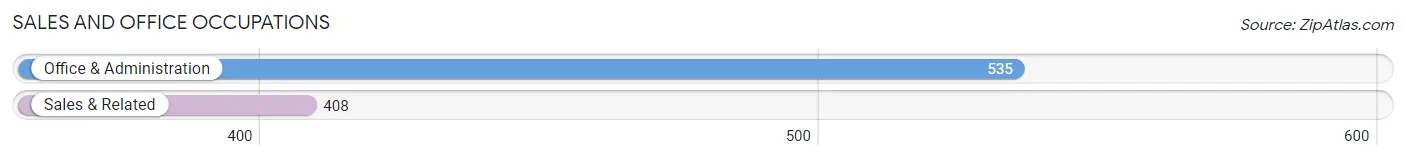
Sales and Office Occupations
The most common Sales and Office occupations in Mono County are Office & Administration (535 | 7.3%), and Sales & Related (408 | 5.6%).
Sales and Office Occupations by Sex
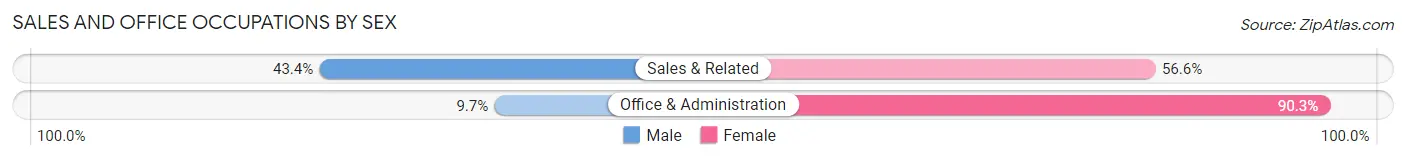
| Occupation | Male | Female |
| Sales & Related | 177 (43.4%) | 231 (56.6%) |
| Office & Administration | 52 (9.7%) | 483 (90.3%) |
| Total (Category) | 229 (24.3%) | 714 (75.7%) |
| Total (Overall) | 4,136 (56.8%) | 3,143 (43.2%) |
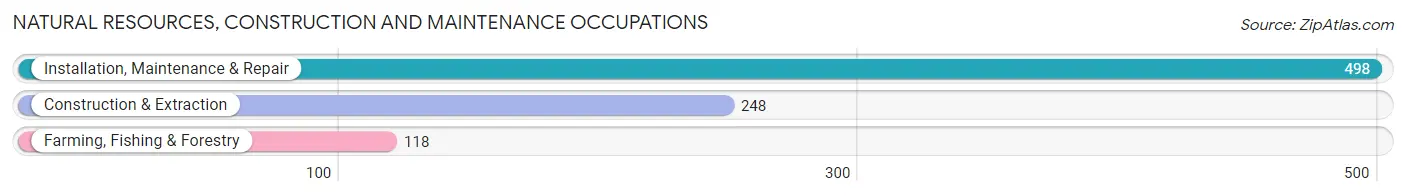
Natural Resources, Construction and Maintenance Occupations
The most common Natural Resources, Construction and Maintenance occupations in Mono County are Installation, Maintenance & Repair (498 | 6.8%), Construction & Extraction (248 | 3.4%), and Farming, Fishing & Forestry (118 | 1.6%).
Natural Resources, Construction and Maintenance Occupations by Sex
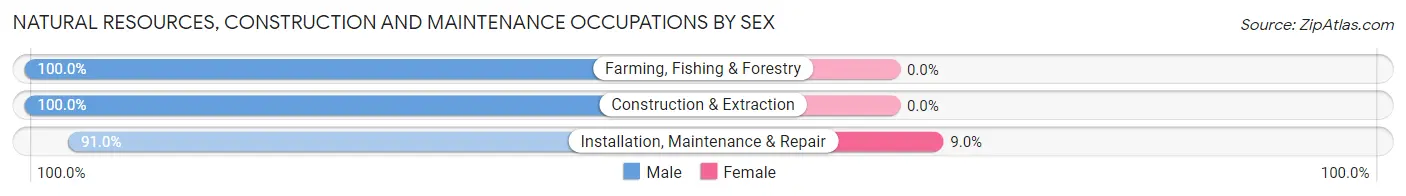
| Occupation | Male | Female |
| Farming, Fishing & Forestry | 118 (100.0%) | 0 (0.0%) |
| Construction & Extraction | 248 (100.0%) | 0 (0.0%) |
| Installation, Maintenance & Repair | 453 (91.0%) | 45 (9.0%) |
| Total (Category) | 819 (94.8%) | 45 (5.2%) |
| Total (Overall) | 4,136 (56.8%) | 3,143 (43.2%) |
Production, Transportation and Moving Occupations
The most common Production, Transportation and Moving occupations in Mono County are Production (395 | 5.4%), Transportation (136 | 1.9%), and Material Moving (95 | 1.3%).
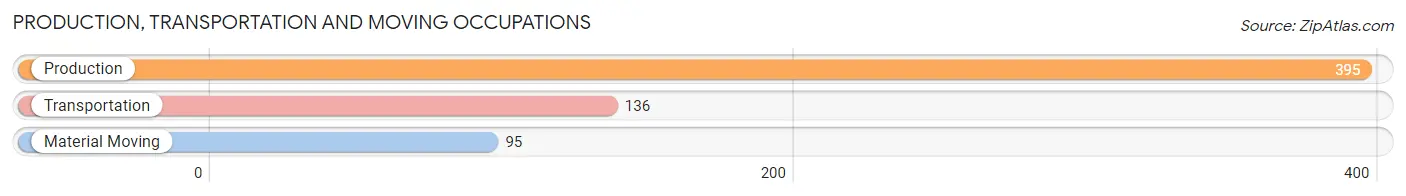
Production, Transportation and Moving Occupations by Sex
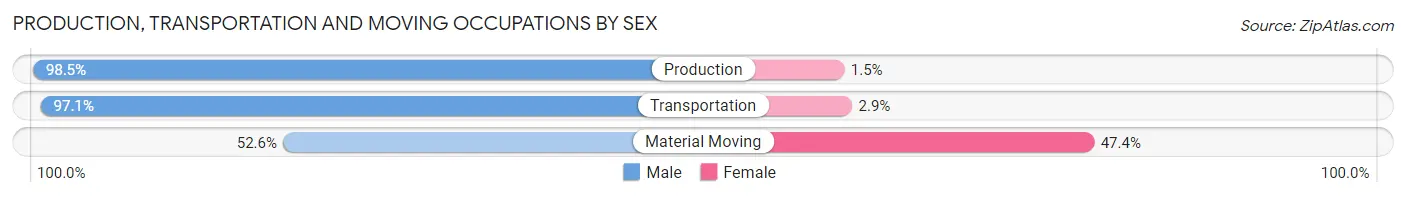
| Occupation | Male | Female |
| Production | 389 (98.5%) | 6 (1.5%) |
| Transportation | 132 (97.1%) | 4 (2.9%) |
| Material Moving | 50 (52.6%) | 45 (47.4%) |
| Total (Category) | 571 (91.2%) | 55 (8.8%) |
| Total (Overall) | 4,136 (56.8%) | 3,143 (43.2%) |
Employment Industries by Sex in Mono County
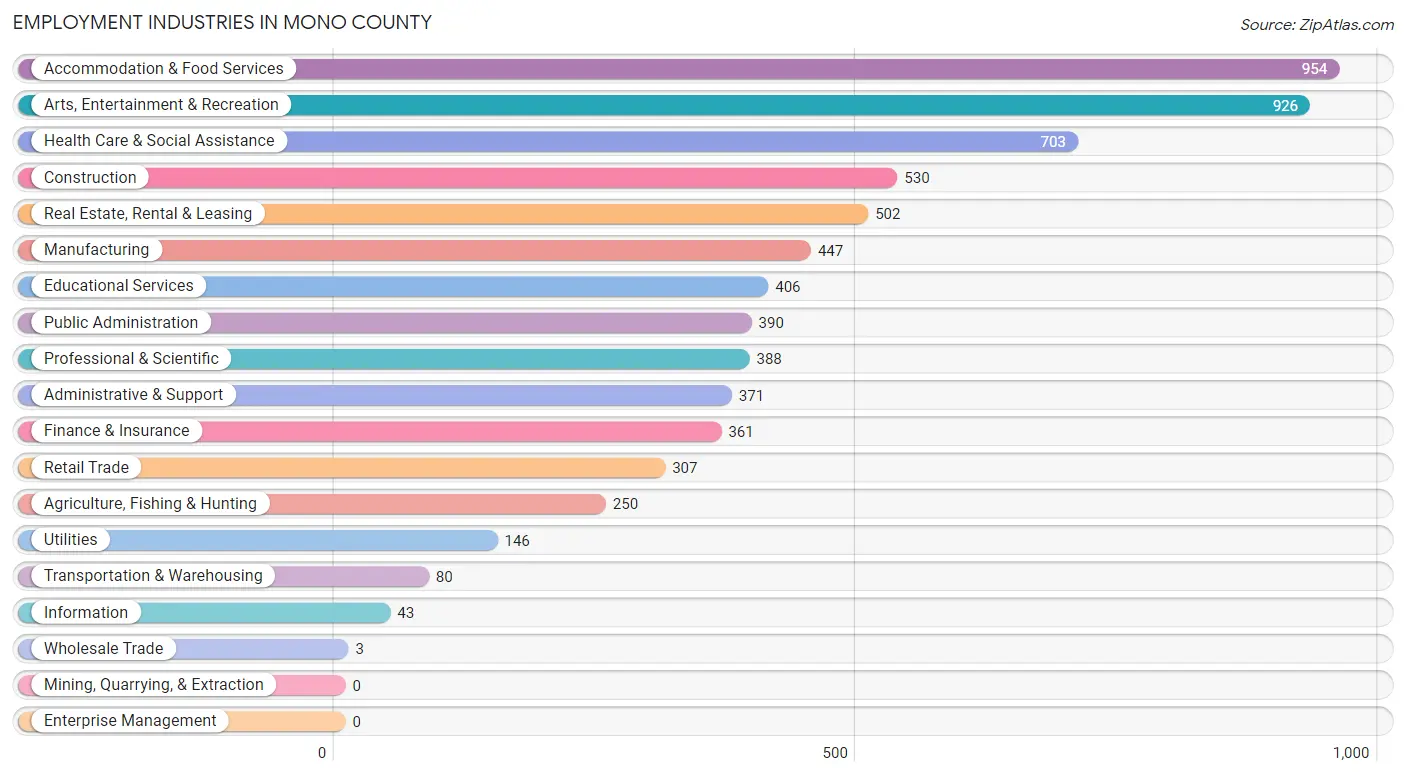
Employment Industries in Mono County
The major employment industries in Mono County include Accommodation & Food Services (954 | 13.1%), Arts, Entertainment & Recreation (926 | 12.7%), Health Care & Social Assistance (703 | 9.7%), Construction (530 | 7.3%), and Real Estate, Rental & Leasing (502 | 6.9%).
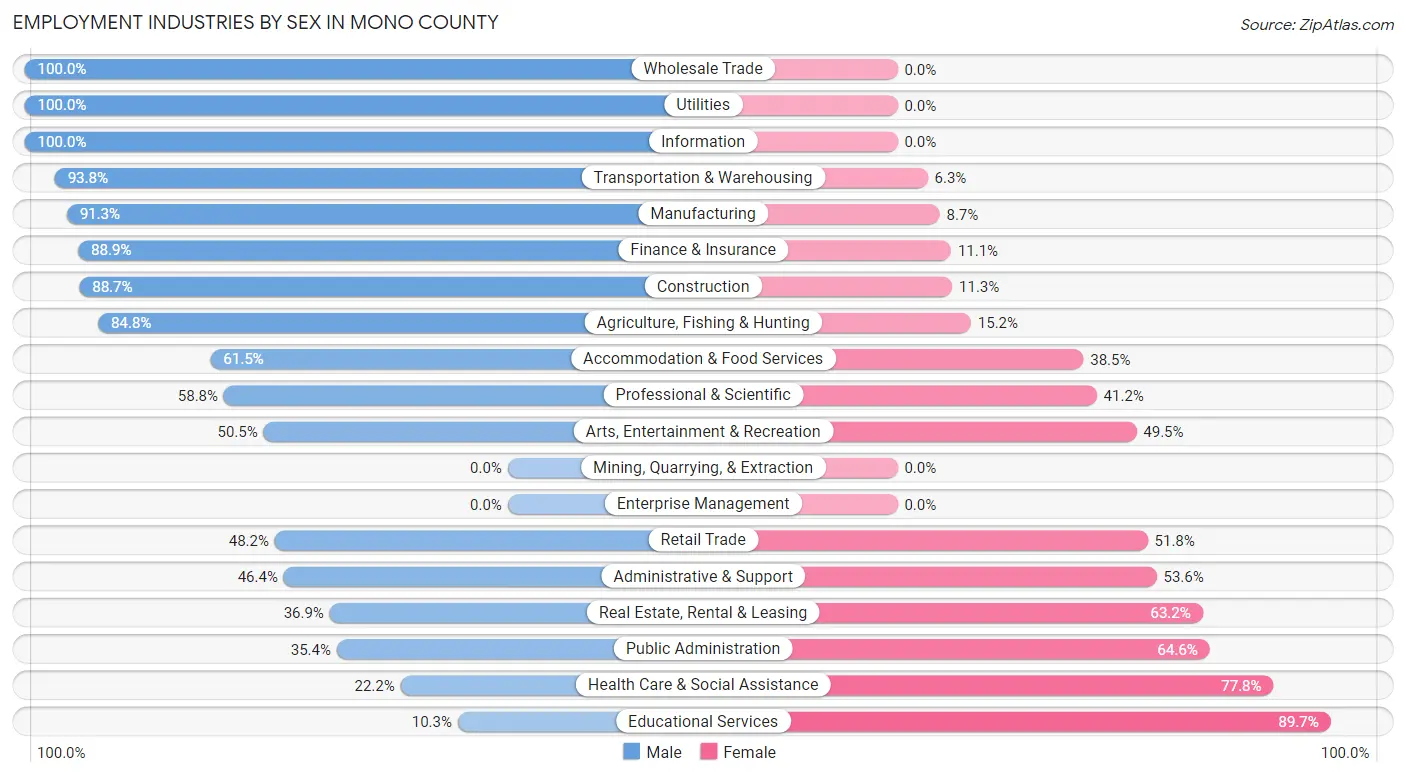
Employment Industries by Sex in Mono County
The Mono County industries that see more men than women are Wholesale Trade (100.0%), Utilities (100.0%), and Information (100.0%), whereas the industries that tend to have a higher number of women are Educational Services (89.7%), Health Care & Social Assistance (77.8%), and Public Administration (64.6%).
| Industry | Male | Female |
| Agriculture, Fishing & Hunting | 212 (84.8%) | 38 (15.2%) |
| Mining, Quarrying, & Extraction | 0 (0.0%) | 0 (0.0%) |
| Construction | 470 (88.7%) | 60 (11.3%) |
| Manufacturing | 408 (91.3%) | 39 (8.7%) |
| Wholesale Trade | 3 (100.0%) | 0 (0.0%) |
| Retail Trade | 148 (48.2%) | 159 (51.8%) |
| Transportation & Warehousing | 75 (93.8%) | 5 (6.2%) |
| Utilities | 146 (100.0%) | 0 (0.0%) |
| Information | 43 (100.0%) | 0 (0.0%) |
| Finance & Insurance | 321 (88.9%) | 40 (11.1%) |
| Real Estate, Rental & Leasing | 185 (36.8%) | 317 (63.1%) |
| Professional & Scientific | 228 (58.8%) | 160 (41.2%) |
| Enterprise Management | 0 (0.0%) | 0 (0.0%) |
| Administrative & Support | 172 (46.4%) | 199 (53.6%) |
| Educational Services | 42 (10.3%) | 364 (89.7%) |
| Health Care & Social Assistance | 156 (22.2%) | 547 (77.8%) |
| Arts, Entertainment & Recreation | 468 (50.5%) | 458 (49.5%) |
| Accommodation & Food Services | 587 (61.5%) | 367 (38.5%) |
| Public Administration | 138 (35.4%) | 252 (64.6%) |
| Total | 4,136 (56.8%) | 3,143 (43.2%) |
Education in Mono County
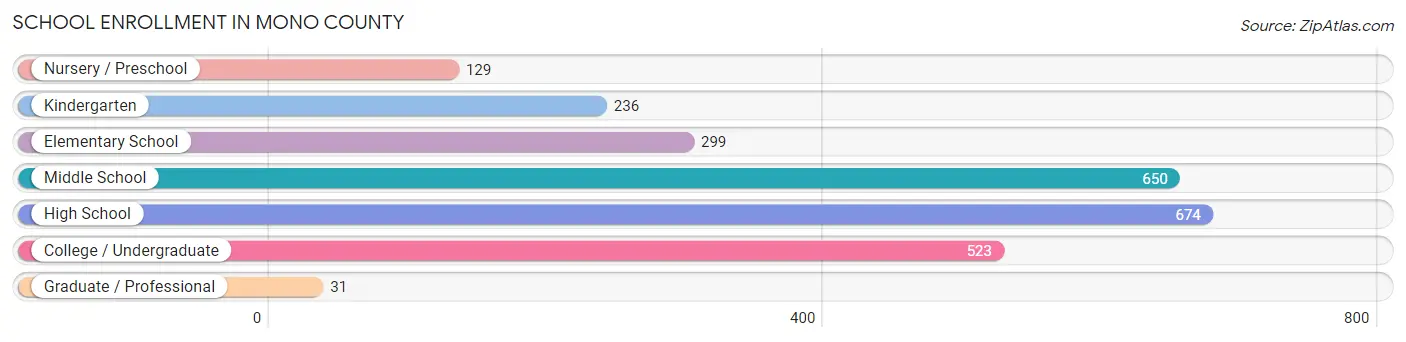
School Enrollment in Mono County
The most common levels of schooling among the 2,542 students in Mono County are high school (674 | 26.5%), middle school (650 | 25.6%), and college / undergraduate (523 | 20.6%).
| School Level | # Students | % Students |
| Nursery / Preschool | 129 | 5.1% |
| Kindergarten | 236 | 9.3% |
| Elementary School | 299 | 11.8% |
| Middle School | 650 | 25.6% |
| High School | 674 | 26.5% |
| College / Undergraduate | 523 | 20.6% |
| Graduate / Professional | 31 | 1.2% |
| Total | 2,542 | 100.0% |
School Enrollment by Age by Funding Source in Mono County
Out of a total of 2,542 students who are enrolled in schools in Mono County, 183 (7.2%) attend a private institution, while the remaining 2,359 (92.8%) are enrolled in public schools. The age group of 35 years and over has the highest likelihood of being enrolled in private schools, with 68 (51.5% in the age bracket) enrolled. Conversely, the age group of 3 to 4 year olds has the lowest likelihood of being enrolled in a private school, with 116 (100.0% in the age bracket) attending a public institution.
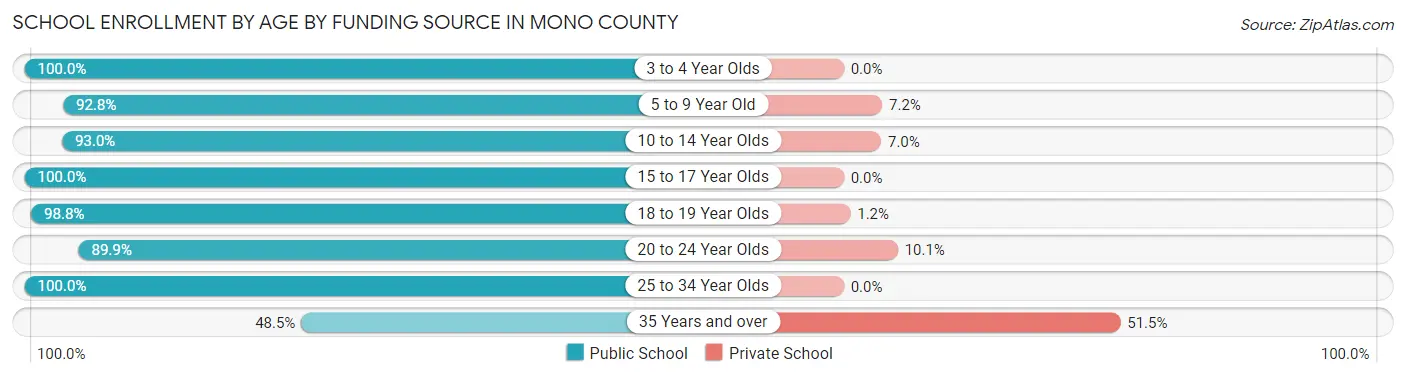
| Age Bracket | Public School | Private School |
| 3 to 4 Year Olds | 116 (100.0%) | 0 (0.0%) |
| 5 to 9 Year Old | 441 (92.8%) | 34 (7.2%) |
| 10 to 14 Year Olds | 816 (93.0%) | 61 (7.0%) |
| 15 to 17 Year Olds | 538 (100.0%) | 0 (0.0%) |
| 18 to 19 Year Olds | 161 (98.8%) | 2 (1.2%) |
| 20 to 24 Year Olds | 161 (89.9%) | 18 (10.1%) |
| 25 to 34 Year Olds | 62 (100.0%) | 0 (0.0%) |
| 35 Years and over | 64 (48.5%) | 68 (51.5%) |
| Total | 2,359 (92.8%) | 183 (7.2%) |
Educational Attainment by Field of Study in Mono County
Business (465 | 14.4%), social sciences (412 | 12.8%), education (338 | 10.5%), liberal arts & history (295 | 9.1%), and computers & mathematics (270 | 8.4%) are the most common fields of study among 3,228 individuals in Mono County who have obtained a bachelor's degree or higher.
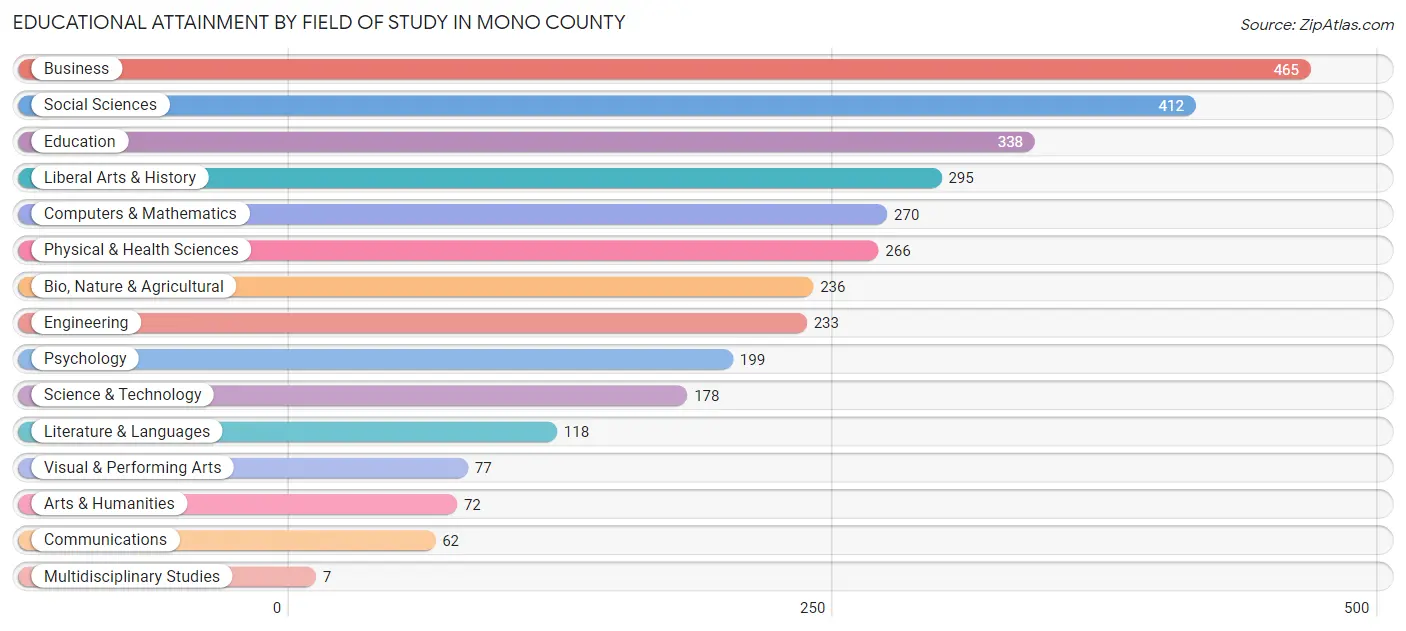
| Field of Study | # Graduates | % Graduates |
| Computers & Mathematics | 270 | 8.4% |
| Bio, Nature & Agricultural | 236 | 7.3% |
| Physical & Health Sciences | 266 | 8.2% |
| Psychology | 199 | 6.2% |
| Social Sciences | 412 | 12.8% |
| Engineering | 233 | 7.2% |
| Multidisciplinary Studies | 7 | 0.2% |
| Science & Technology | 178 | 5.5% |
| Business | 465 | 14.4% |
| Education | 338 | 10.5% |
| Literature & Languages | 118 | 3.7% |
| Liberal Arts & History | 295 | 9.1% |
| Visual & Performing Arts | 77 | 2.4% |
| Communications | 62 | 1.9% |
| Arts & Humanities | 72 | 2.2% |
| Total | 3,228 | 100.0% |
Transportation & Commute in Mono County
Vehicle Availability by Sex in Mono County
The most prevalent vehicle ownership categories in Mono County are males with 3 vehicles (1,312, accounting for 32.4%) and females with 3 vehicles (606, making up 42.6%).
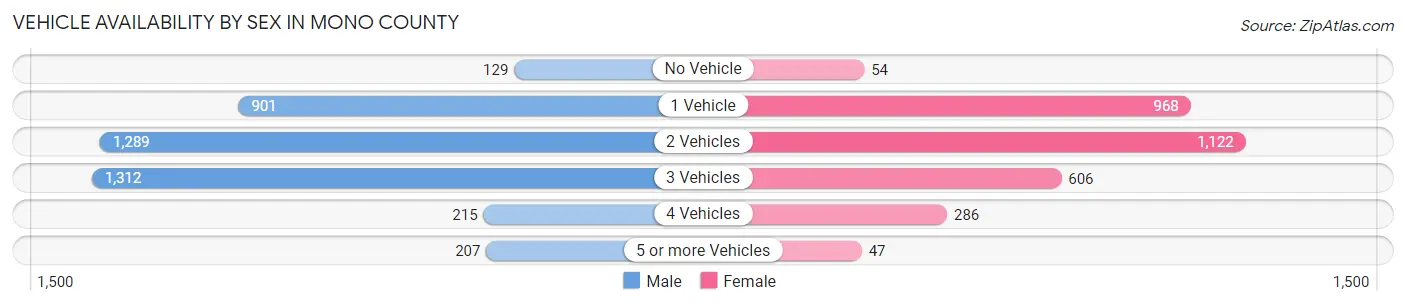
| Vehicles Available | Male | Female |
| No Vehicle | 129 (3.2%) | 54 (1.8%) |
| 1 Vehicle | 901 (22.2%) | 968 (31.4%) |
| 2 Vehicles | 1,289 (31.8%) | 1,122 (36.4%) |
| 3 Vehicles | 1,312 (32.4%) | 606 (19.7%) |
| 4 Vehicles | 215 (5.3%) | 286 (9.3%) |
| 5 or more Vehicles | 207 (5.1%) | 47 (1.5%) |
| Total | 4,053 (100.0%) | 3,083 (100.0%) |
Commute Time in Mono County
The most frequently occuring commute durations in Mono County are 5 to 9 minutes (1,684 commuters, 26.6%), 15 to 19 minutes (1,037 commuters, 16.4%), and 10 to 14 minutes (913 commuters, 14.4%).
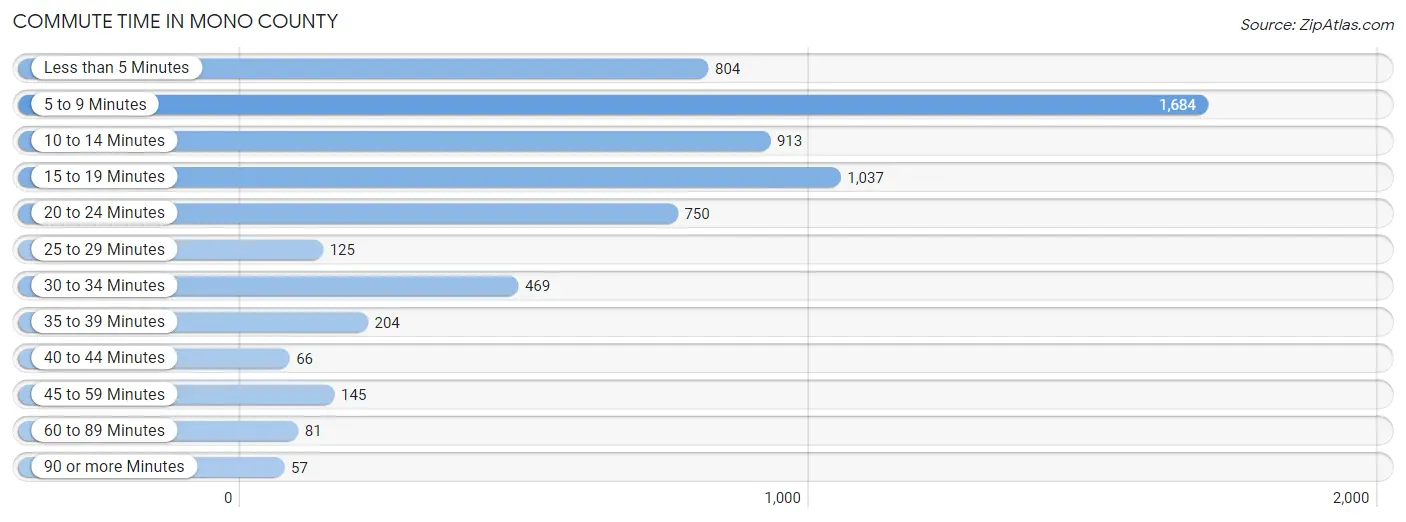
| Commute Time | # Commuters | % Commuters |
| Less than 5 Minutes | 804 | 12.7% |
| 5 to 9 Minutes | 1,684 | 26.6% |
| 10 to 14 Minutes | 913 | 14.4% |
| 15 to 19 Minutes | 1,037 | 16.4% |
| 20 to 24 Minutes | 750 | 11.8% |
| 25 to 29 Minutes | 125 | 2.0% |
| 30 to 34 Minutes | 469 | 7.4% |
| 35 to 39 Minutes | 204 | 3.2% |
| 40 to 44 Minutes | 66 | 1.0% |
| 45 to 59 Minutes | 145 | 2.3% |
| 60 to 89 Minutes | 81 | 1.3% |
| 90 or more Minutes | 57 | 0.9% |
Commute Time by Sex in Mono County
The most common commute times in Mono County are 5 to 9 minutes (897 commuters, 26.3%) for males and 5 to 9 minutes (787 commuters, 27.0%) for females.
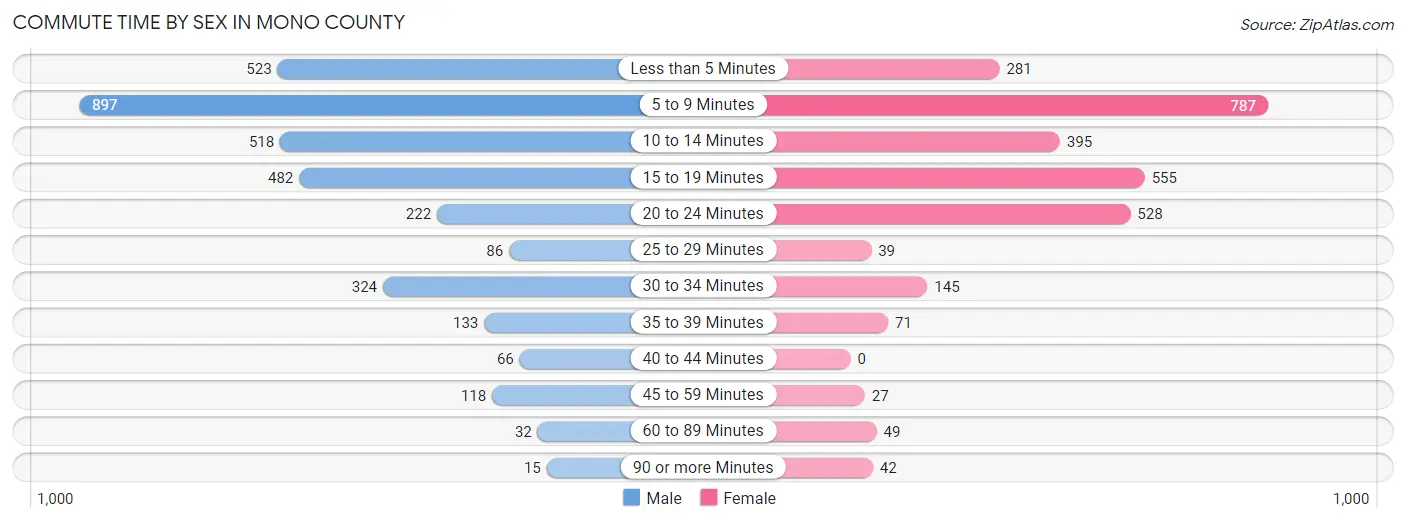
| Commute Time | Male | Female |
| Less than 5 Minutes | 523 (15.3%) | 281 (9.6%) |
| 5 to 9 Minutes | 897 (26.3%) | 787 (27.0%) |
| 10 to 14 Minutes | 518 (15.2%) | 395 (13.5%) |
| 15 to 19 Minutes | 482 (14.1%) | 555 (19.0%) |
| 20 to 24 Minutes | 222 (6.5%) | 528 (18.1%) |
| 25 to 29 Minutes | 86 (2.5%) | 39 (1.3%) |
| 30 to 34 Minutes | 324 (9.5%) | 145 (5.0%) |
| 35 to 39 Minutes | 133 (3.9%) | 71 (2.4%) |
| 40 to 44 Minutes | 66 (1.9%) | 0 (0.0%) |
| 45 to 59 Minutes | 118 (3.5%) | 27 (0.9%) |
| 60 to 89 Minutes | 32 (0.9%) | 49 (1.7%) |
| 90 or more Minutes | 15 (0.4%) | 42 (1.4%) |
Time of Departure to Work by Sex in Mono County
The most frequent times of departure to work in Mono County are 7:00 AM to 7:29 AM (609, 17.8%) for males and 7:30 AM to 7:59 AM (962, 33.0%) for females.
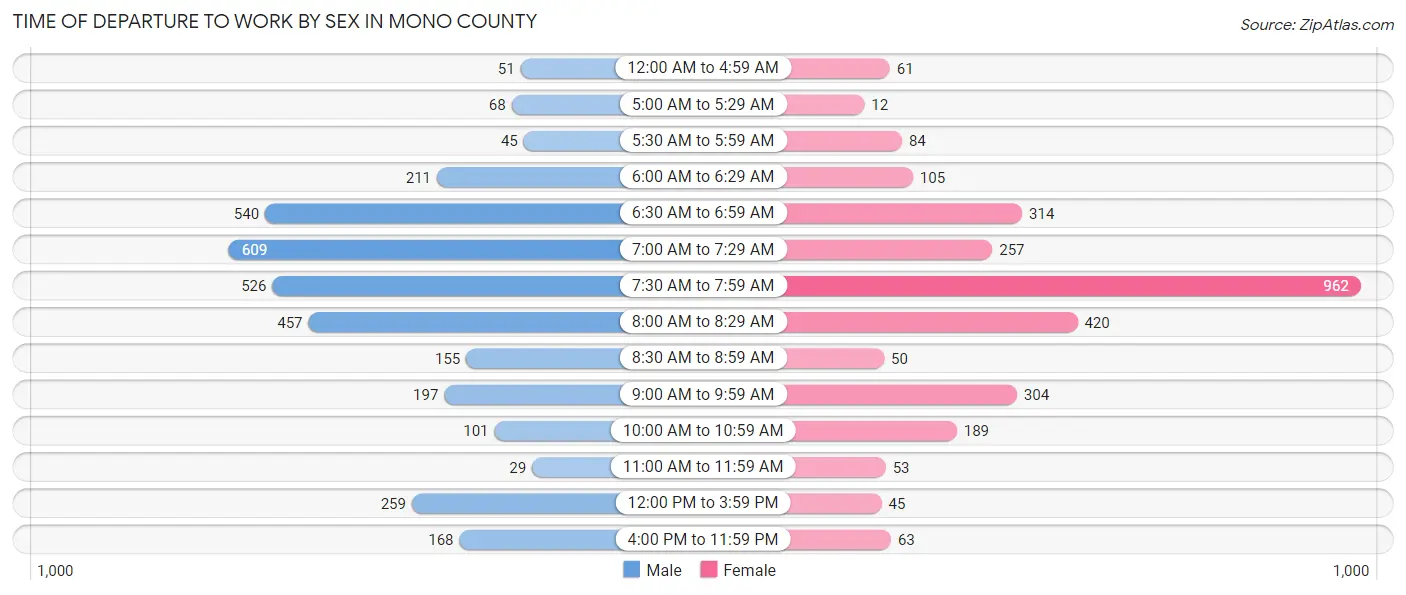
| Time of Departure | Male | Female |
| 12:00 AM to 4:59 AM | 51 (1.5%) | 61 (2.1%) |
| 5:00 AM to 5:29 AM | 68 (2.0%) | 12 (0.4%) |
| 5:30 AM to 5:59 AM | 45 (1.3%) | 84 (2.9%) |
| 6:00 AM to 6:29 AM | 211 (6.2%) | 105 (3.6%) |
| 6:30 AM to 6:59 AM | 540 (15.8%) | 314 (10.8%) |
| 7:00 AM to 7:29 AM | 609 (17.8%) | 257 (8.8%) |
| 7:30 AM to 7:59 AM | 526 (15.4%) | 962 (33.0%) |
| 8:00 AM to 8:29 AM | 457 (13.4%) | 420 (14.4%) |
| 8:30 AM to 8:59 AM | 155 (4.5%) | 50 (1.7%) |
| 9:00 AM to 9:59 AM | 197 (5.8%) | 304 (10.4%) |
| 10:00 AM to 10:59 AM | 101 (3.0%) | 189 (6.5%) |
| 11:00 AM to 11:59 AM | 29 (0.9%) | 53 (1.8%) |
| 12:00 PM to 3:59 PM | 259 (7.6%) | 45 (1.5%) |
| 4:00 PM to 11:59 PM | 168 (4.9%) | 63 (2.2%) |
| Total | 3,416 (100.0%) | 2,919 (100.0%) |
Housing Occupancy in Mono County
Occupancy by Ownership in Mono County
Of the total 5,473 dwellings in Mono County, owner-occupied units account for 3,743 (68.4%), while renter-occupied units make up 1,730 (31.6%).
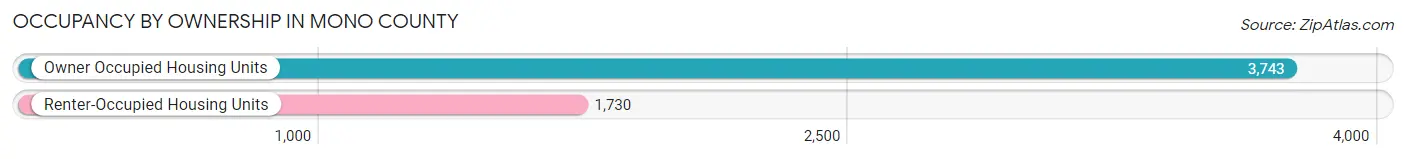
| Occupancy | # Housing Units | % Housing Units |
| Owner Occupied Housing Units | 3,743 | 68.4% |
| Renter-Occupied Housing Units | 1,730 | 31.6% |
| Total Occupied Housing Units | 5,473 | 100.0% |
Occupancy by Household Size in Mono County
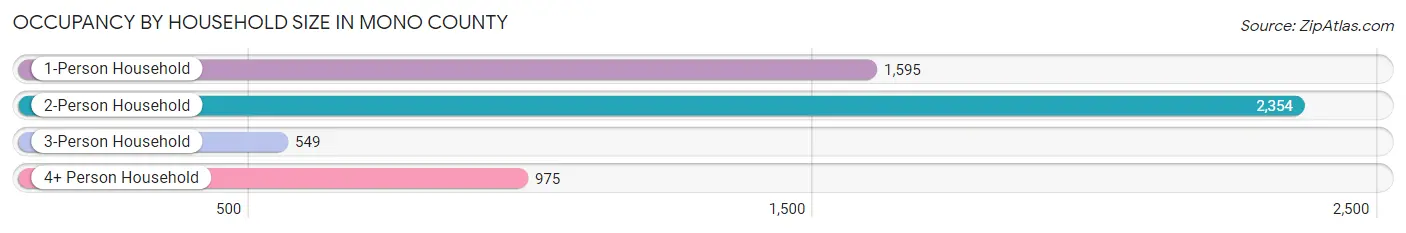
| Household Size | # Housing Units | % Housing Units |
| 1-Person Household | 1,595 | 29.1% |
| 2-Person Household | 2,354 | 43.0% |
| 3-Person Household | 549 | 10.0% |
| 4+ Person Household | 975 | 17.8% |
| Total Housing Units | 5,473 | 100.0% |
Occupancy by Ownership by Household Size in Mono County
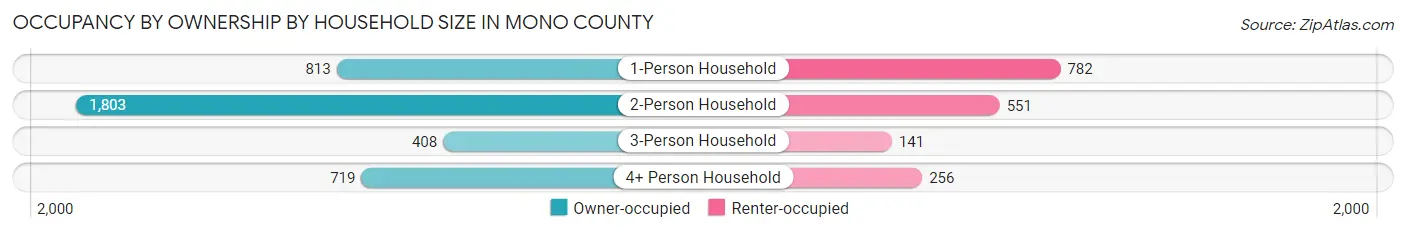
| Household Size | Owner-occupied | Renter-occupied |
| 1-Person Household | 813 (51.0%) | 782 (49.0%) |
| 2-Person Household | 1,803 (76.6%) | 551 (23.4%) |
| 3-Person Household | 408 (74.3%) | 141 (25.7%) |
| 4+ Person Household | 719 (73.7%) | 256 (26.3%) |
| Total Housing Units | 3,743 (68.4%) | 1,730 (31.6%) |
Occupancy by Educational Attainment in Mono County
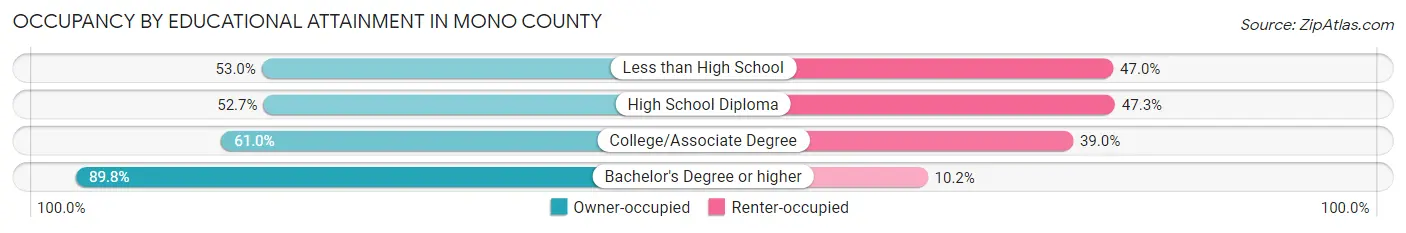
| Household Size | Owner-occupied | Renter-occupied |
| Less than High School | 282 (53.0%) | 250 (47.0%) |
| High School Diploma | 601 (52.7%) | 540 (47.3%) |
| College/Associate Degree | 1,169 (61.0%) | 748 (39.0%) |
| Bachelor's Degree or higher | 1,691 (89.8%) | 192 (10.2%) |
Occupancy by Age of Householder in Mono County
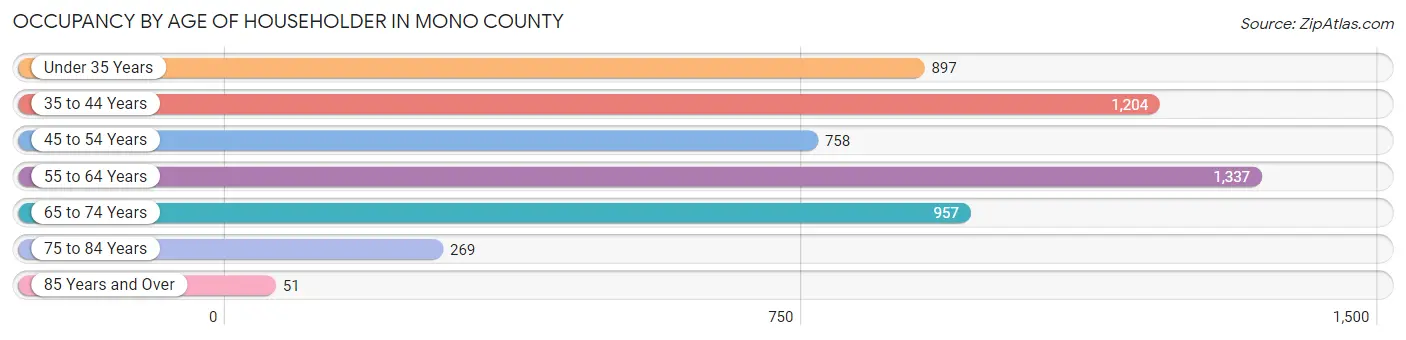
| Age Bracket | # Households | % Households |
| Under 35 Years | 897 | 16.4% |
| 35 to 44 Years | 1,204 | 22.0% |
| 45 to 54 Years | 758 | 13.9% |
| 55 to 64 Years | 1,337 | 24.4% |
| 65 to 74 Years | 957 | 17.5% |
| 75 to 84 Years | 269 | 4.9% |
| 85 Years and Over | 51 | 0.9% |
| Total | 5,473 | 100.0% |
Housing Finances in Mono County
Median Income by Occupancy in Mono County
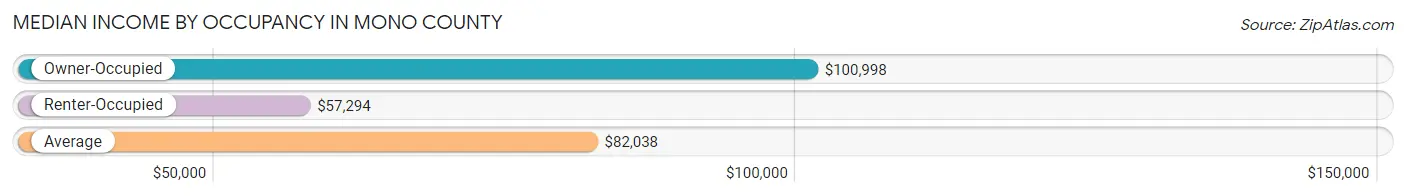
| Occupancy Type | # Households | Median Income |
| Owner-Occupied | 3,743 (68.4%) | $100,998 |
| Renter-Occupied | 1,730 (31.6%) | $57,294 |
| Average | 5,473 (100.0%) | $82,038 |
Occupancy by Householder Income Bracket in Mono County
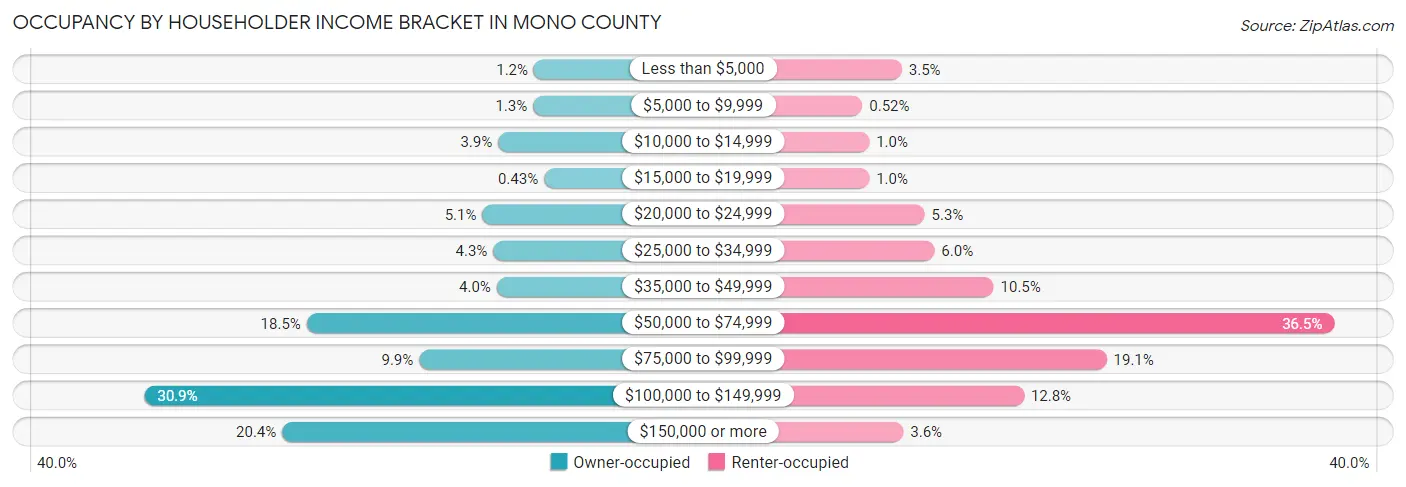
| Income Bracket | Owner-occupied | Renter-occupied |
| Less than $5,000 | 45 (1.2%) | 61 (3.5%) |
| $5,000 to $9,999 | 47 (1.3%) | 9 (0.5%) |
| $10,000 to $14,999 | 147 (3.9%) | 18 (1.0%) |
| $15,000 to $19,999 | 16 (0.4%) | 18 (1.0%) |
| $20,000 to $24,999 | 192 (5.1%) | 91 (5.3%) |
| $25,000 to $34,999 | 161 (4.3%) | 104 (6.0%) |
| $35,000 to $49,999 | 151 (4.0%) | 182 (10.5%) |
| $50,000 to $74,999 | 693 (18.5%) | 631 (36.5%) |
| $75,000 to $99,999 | 372 (9.9%) | 331 (19.1%) |
| $100,000 to $149,999 | 1,156 (30.9%) | 222 (12.8%) |
| $150,000 or more | 763 (20.4%) | 63 (3.6%) |
| Total | 3,743 (100.0%) | 1,730 (100.0%) |
Monthly Housing Cost Tiers in Mono County
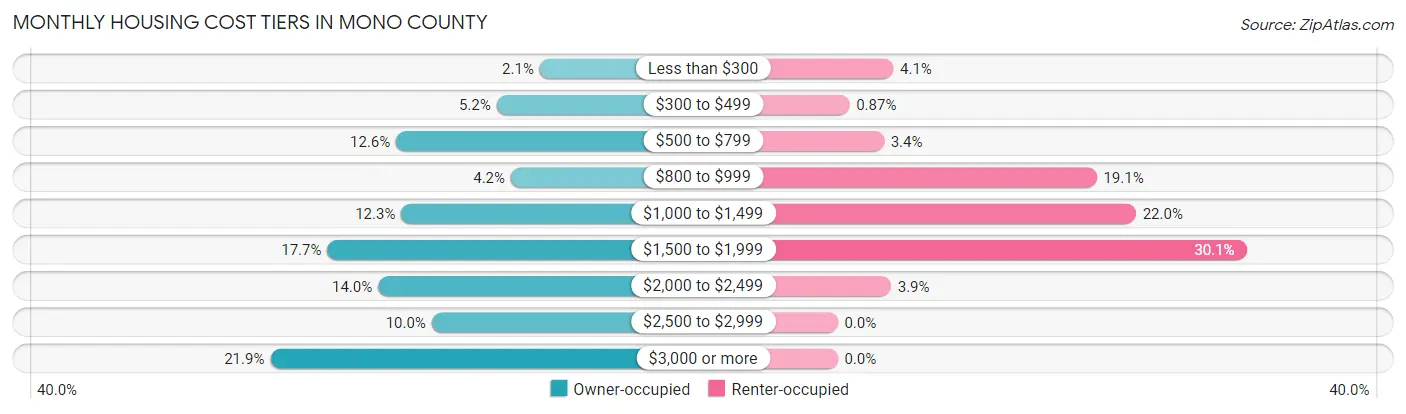
| Monthly Cost | Owner-occupied | Renter-occupied |
| Less than $300 | 77 (2.1%) | 71 (4.1%) |
| $300 to $499 | 196 (5.2%) | 15 (0.9%) |
| $500 to $799 | 473 (12.6%) | 59 (3.4%) |
| $800 to $999 | 157 (4.2%) | 330 (19.1%) |
| $1,000 to $1,499 | 459 (12.3%) | 380 (22.0%) |
| $1,500 to $1,999 | 663 (17.7%) | 521 (30.1%) |
| $2,000 to $2,499 | 523 (14.0%) | 68 (3.9%) |
| $2,500 to $2,999 | 375 (10.0%) | 0 (0.0%) |
| $3,000 or more | 820 (21.9%) | 0 (0.0%) |
| Total | 3,743 (100.0%) | 1,730 (100.0%) |
Physical Housing Characteristics in Mono County
Housing Structures in Mono County
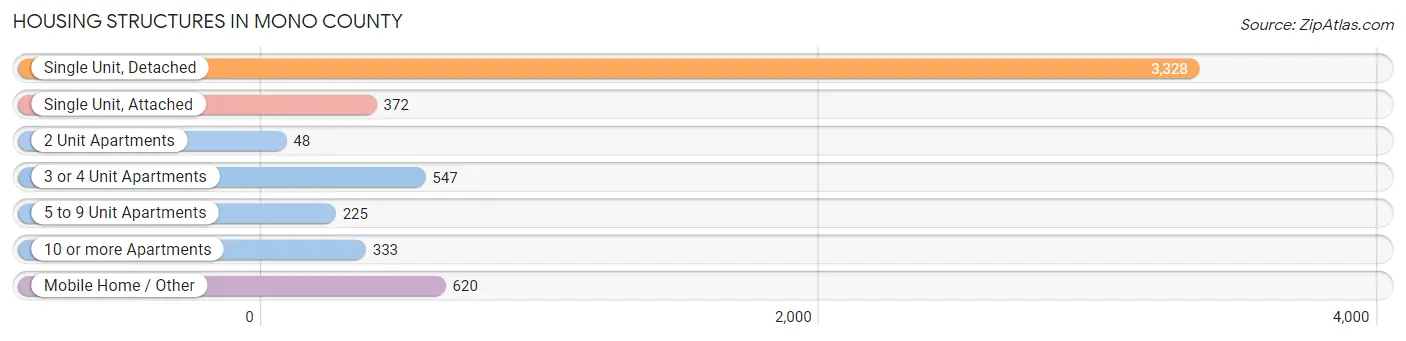
| Structure Type | # Housing Units | % Housing Units |
| Single Unit, Detached | 3,328 | 60.8% |
| Single Unit, Attached | 372 | 6.8% |
| 2 Unit Apartments | 48 | 0.9% |
| 3 or 4 Unit Apartments | 547 | 10.0% |
| 5 to 9 Unit Apartments | 225 | 4.1% |
| 10 or more Apartments | 333 | 6.1% |
| Mobile Home / Other | 620 | 11.3% |
| Total | 5,473 | 100.0% |
Housing Structures by Occupancy in Mono County
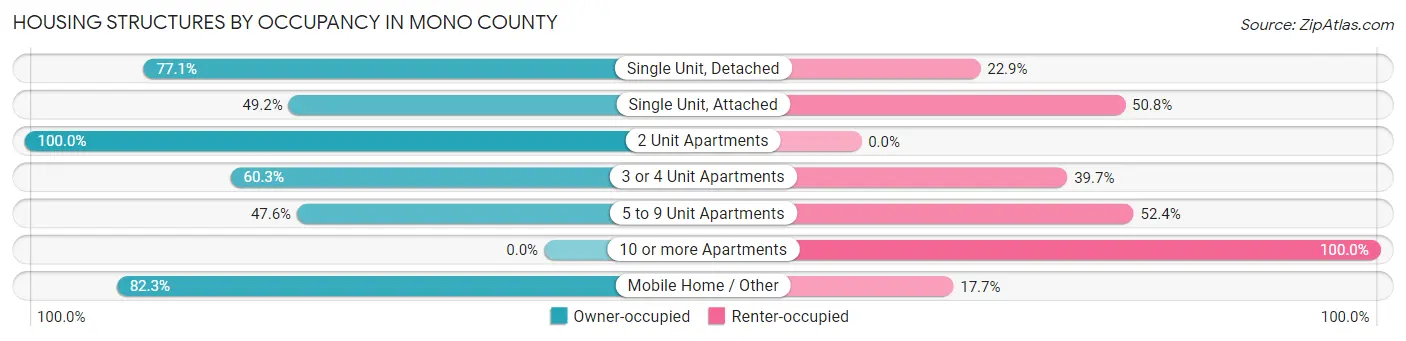
| Structure Type | Owner-occupied | Renter-occupied |
| Single Unit, Detached | 2,565 (77.1%) | 763 (22.9%) |
| Single Unit, Attached | 183 (49.2%) | 189 (50.8%) |
| 2 Unit Apartments | 48 (100.0%) | 0 (0.0%) |
| 3 or 4 Unit Apartments | 330 (60.3%) | 217 (39.7%) |
| 5 to 9 Unit Apartments | 107 (47.6%) | 118 (52.4%) |
| 10 or more Apartments | 0 (0.0%) | 333 (100.0%) |
| Mobile Home / Other | 510 (82.3%) | 110 (17.7%) |
| Total | 3,743 (68.4%) | 1,730 (31.6%) |
Housing Structures by Number of Rooms in Mono County
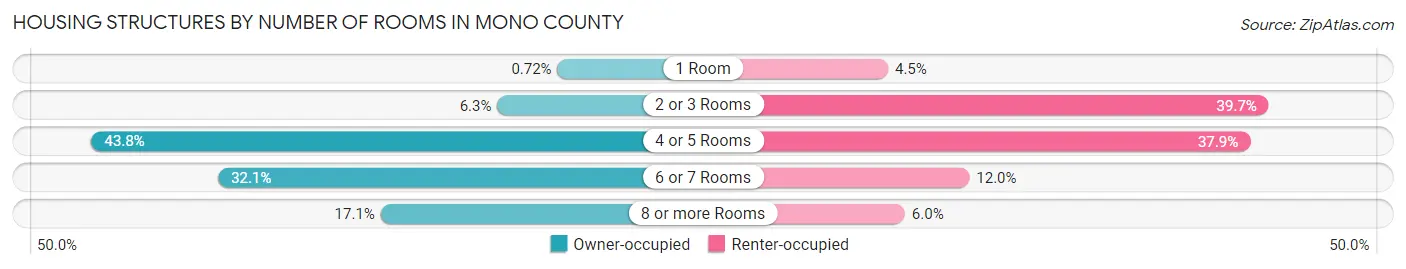
| Number of Rooms | Owner-occupied | Renter-occupied |
| 1 Room | 27 (0.7%) | 77 (4.4%) |
| 2 or 3 Rooms | 235 (6.3%) | 686 (39.7%) |
| 4 or 5 Rooms | 1,640 (43.8%) | 656 (37.9%) |
| 6 or 7 Rooms | 1,202 (32.1%) | 207 (12.0%) |
| 8 or more Rooms | 639 (17.1%) | 104 (6.0%) |
| Total | 3,743 (100.0%) | 1,730 (100.0%) |
Housing Structure by Heating Type in Mono County
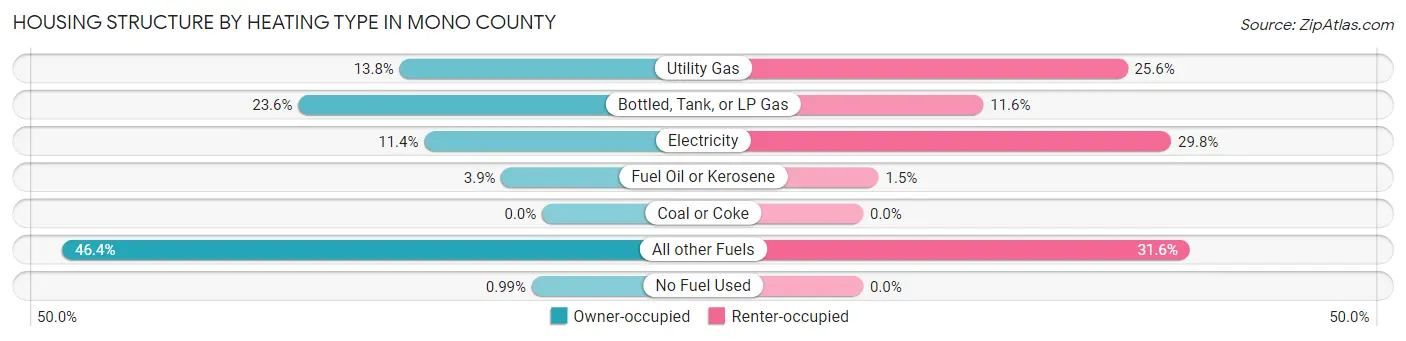
| Heating Type | Owner-occupied | Renter-occupied |
| Utility Gas | 515 (13.8%) | 442 (25.6%) |
| Bottled, Tank, or LP Gas | 882 (23.6%) | 201 (11.6%) |
| Electricity | 426 (11.4%) | 515 (29.8%) |
| Fuel Oil or Kerosene | 147 (3.9%) | 26 (1.5%) |
| Coal or Coke | 0 (0.0%) | 0 (0.0%) |
| All other Fuels | 1,736 (46.4%) | 546 (31.6%) |
| No Fuel Used | 37 (1.0%) | 0 (0.0%) |
| Total | 3,743 (100.0%) | 1,730 (100.0%) |
Household Vehicle Usage in Mono County
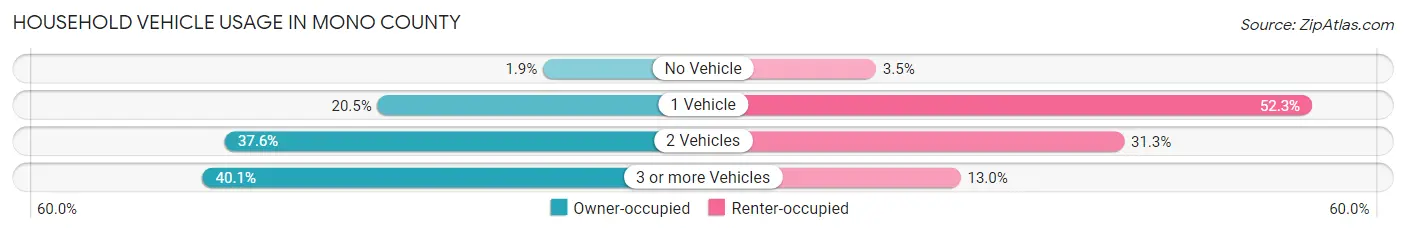
| Vehicles per Household | Owner-occupied | Renter-occupied |
| No Vehicle | 72 (1.9%) | 60 (3.5%) |
| 1 Vehicle | 766 (20.5%) | 905 (52.3%) |
| 2 Vehicles | 1,406 (37.6%) | 541 (31.3%) |
| 3 or more Vehicles | 1,499 (40.1%) | 224 (13.0%) |
| Total | 3,743 (100.0%) | 1,730 (100.0%) |
Real Estate & Mortgages in Mono County
Real Estate and Mortgage Overview in Mono County
| Characteristic | Without Mortgage | With Mortgage |
| Housing Units | 1,212 | 2,531 |
| Median Property Value | $433,800 | $524,400 |
| Median Household Income | $52,917 | $686 |
| Monthly Housing Costs | $672 | $820 |
| Real Estate Taxes | $2,597 | $61 |
Property Value by Mortgage Status in Mono County
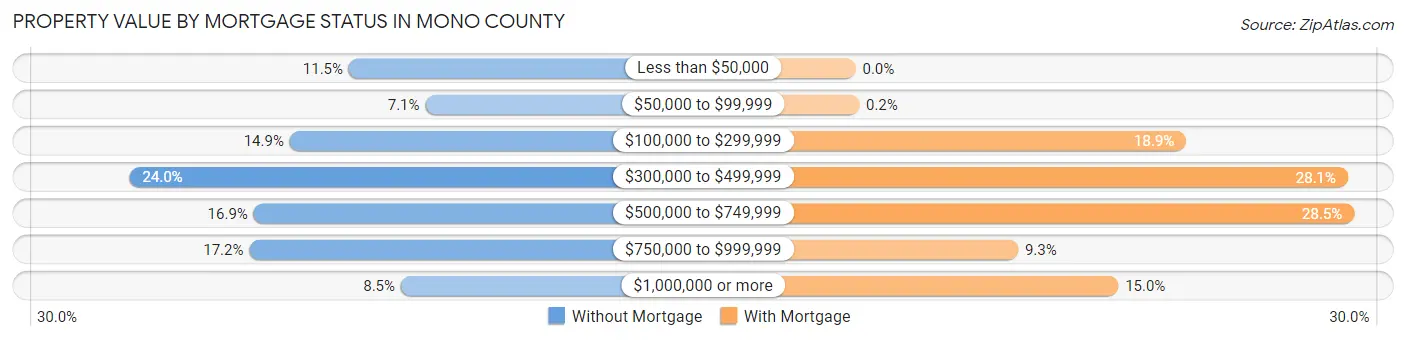
| Property Value | Without Mortgage | With Mortgage |
| Less than $50,000 | 139 (11.5%) | 0 (0.0%) |
| $50,000 to $99,999 | 86 (7.1%) | 5 (0.2%) |
| $100,000 to $299,999 | 180 (14.8%) | 478 (18.9%) |
| $300,000 to $499,999 | 291 (24.0%) | 712 (28.1%) |
| $500,000 to $749,999 | 205 (16.9%) | 721 (28.5%) |
| $750,000 to $999,999 | 208 (17.2%) | 235 (9.3%) |
| $1,000,000 or more | 103 (8.5%) | 380 (15.0%) |
| Total | 1,212 (100.0%) | 2,531 (100.0%) |
Household Income by Mortgage Status in Mono County
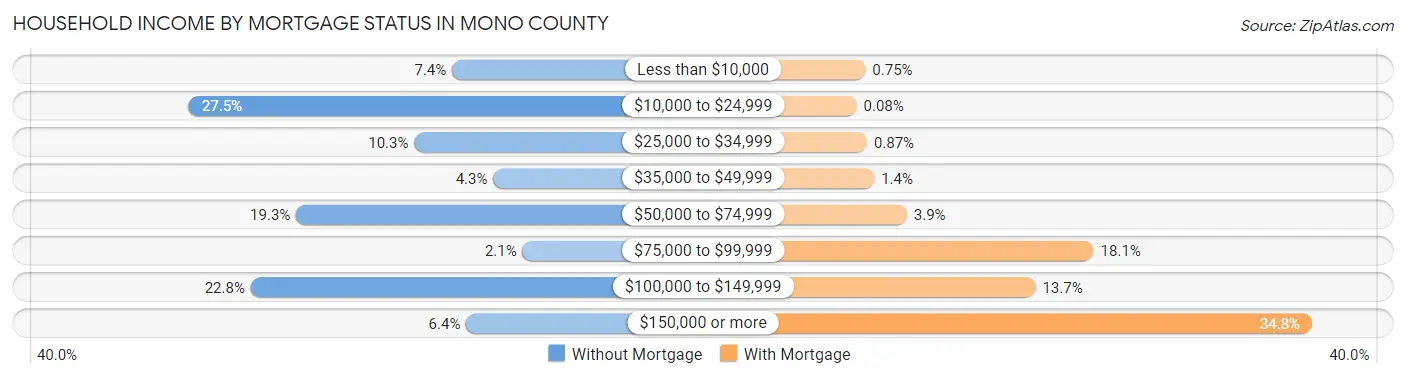
| Household Income | Without Mortgage | With Mortgage |
| Less than $10,000 | 90 (7.4%) | 19 (0.7%) |
| $10,000 to $24,999 | 333 (27.5%) | 2 (0.1%) |
| $25,000 to $34,999 | 125 (10.3%) | 22 (0.9%) |
| $35,000 to $49,999 | 52 (4.3%) | 36 (1.4%) |
| $50,000 to $74,999 | 234 (19.3%) | 99 (3.9%) |
| $75,000 to $99,999 | 25 (2.1%) | 459 (18.1%) |
| $100,000 to $149,999 | 276 (22.8%) | 347 (13.7%) |
| $150,000 or more | 77 (6.4%) | 880 (34.8%) |
| Total | 1,212 (100.0%) | 2,531 (100.0%) |
Property Value to Household Income Ratio in Mono County
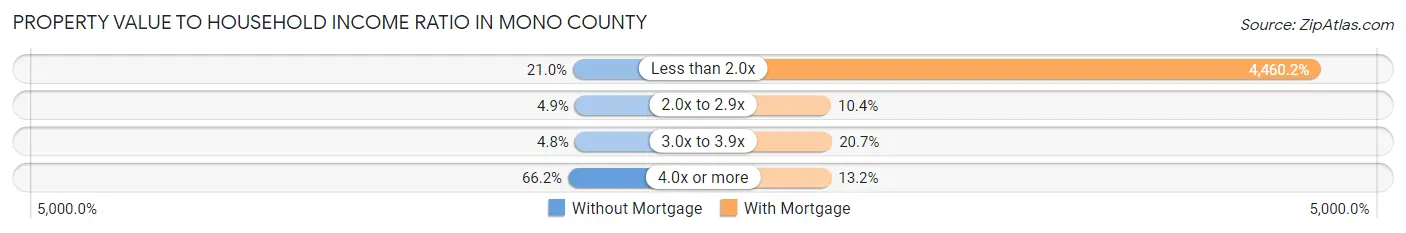
| Value-to-Income Ratio | Without Mortgage | With Mortgage |
| Less than 2.0x | 254 (21.0%) | 112,887 (4,460.2%) |
| 2.0x to 2.9x | 59 (4.9%) | 262 (10.3%) |
| 3.0x to 3.9x | 58 (4.8%) | 525 (20.7%) |
| 4.0x or more | 802 (66.2%) | 333 (13.2%) |
| Total | 1,212 (100.0%) | 2,531 (100.0%) |
Real Estate Taxes by Mortgage Status in Mono County
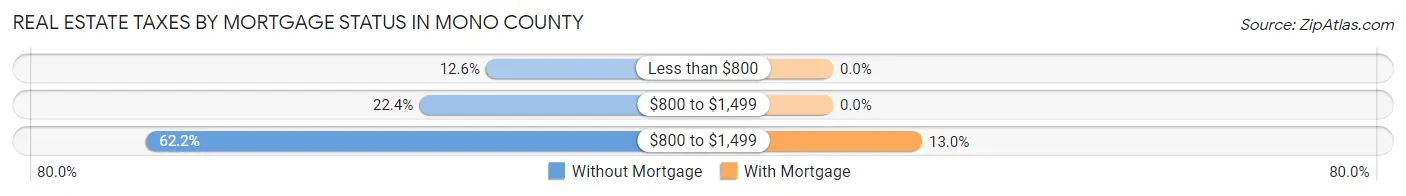
| Property Taxes | Without Mortgage | With Mortgage |
| Less than $800 | 153 (12.6%) | 0 (0.0%) |
| $800 to $1,499 | 271 (22.4%) | 0 (0.0%) |
| $800 to $1,499 | 754 (62.2%) | 329 (13.0%) |
| Total | 1,212 (100.0%) | 2,531 (100.0%) |
Health & Disability in Mono County
Health Insurance Coverage by Age in Mono County
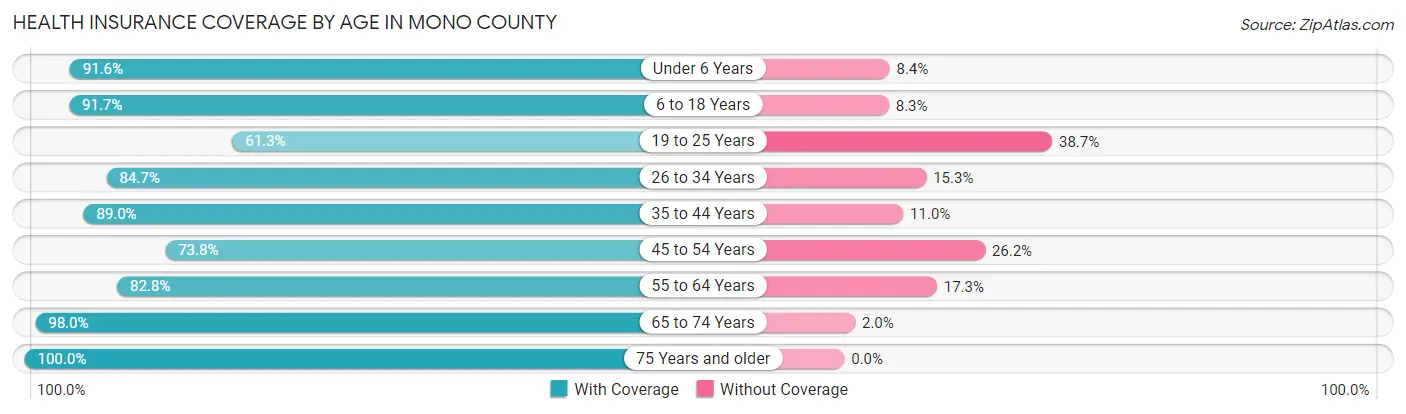
| Age Bracket | With Coverage | Without Coverage |
| Under 6 Years | 738 (91.6%) | 68 (8.4%) |
| 6 to 18 Years | 1,671 (91.7%) | 151 (8.3%) |
| 19 to 25 Years | 623 (61.3%) | 394 (38.7%) |
| 26 to 34 Years | 1,325 (84.7%) | 239 (15.3%) |
| 35 to 44 Years | 1,630 (89.0%) | 201 (11.0%) |
| 45 to 54 Years | 1,333 (73.8%) | 474 (26.2%) |
| 55 to 64 Years | 1,736 (82.8%) | 362 (17.2%) |
| 65 to 74 Years | 1,326 (98.0%) | 27 (2.0%) |
| 75 Years and older | 722 (100.0%) | 0 (0.0%) |
| Total | 11,104 (85.3%) | 1,916 (14.7%) |
Health Insurance Coverage by Citizenship Status in Mono County
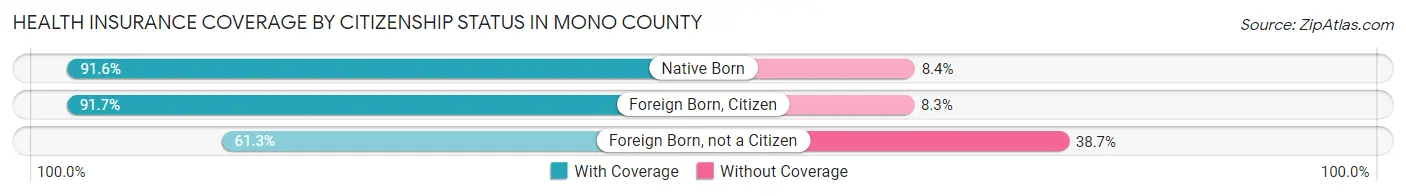
| Citizenship Status | With Coverage | Without Coverage |
| Native Born | 738 (91.6%) | 68 (8.4%) |
| Foreign Born, Citizen | 1,671 (91.7%) | 151 (8.3%) |
| Foreign Born, not a Citizen | 623 (61.3%) | 394 (38.7%) |
Health Insurance Coverage by Household Income in Mono County
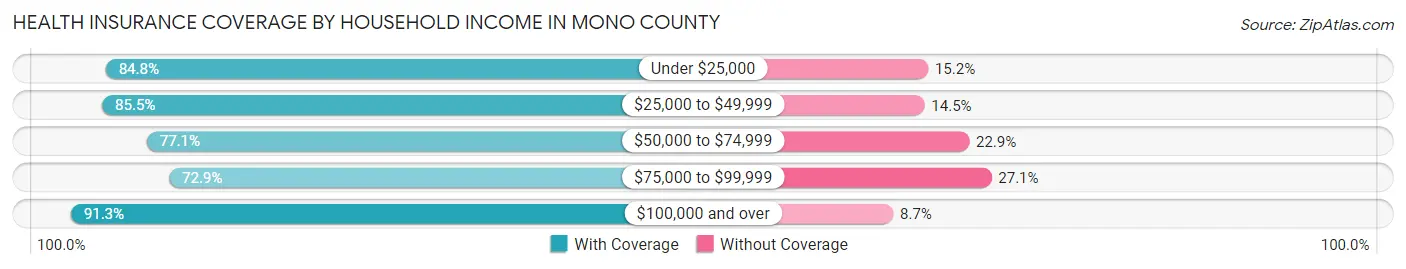
| Household Income | With Coverage | Without Coverage |
| Under $25,000 | 1,148 (84.8%) | 206 (15.2%) |
| $25,000 to $49,999 | 999 (85.5%) | 170 (14.5%) |
| $50,000 to $74,999 | 1,757 (77.1%) | 522 (22.9%) |
| $75,000 to $99,999 | 1,233 (72.9%) | 458 (27.1%) |
| $100,000 and over | 5,638 (91.3%) | 535 (8.7%) |
Public vs Private Health Insurance Coverage by Age in Mono County
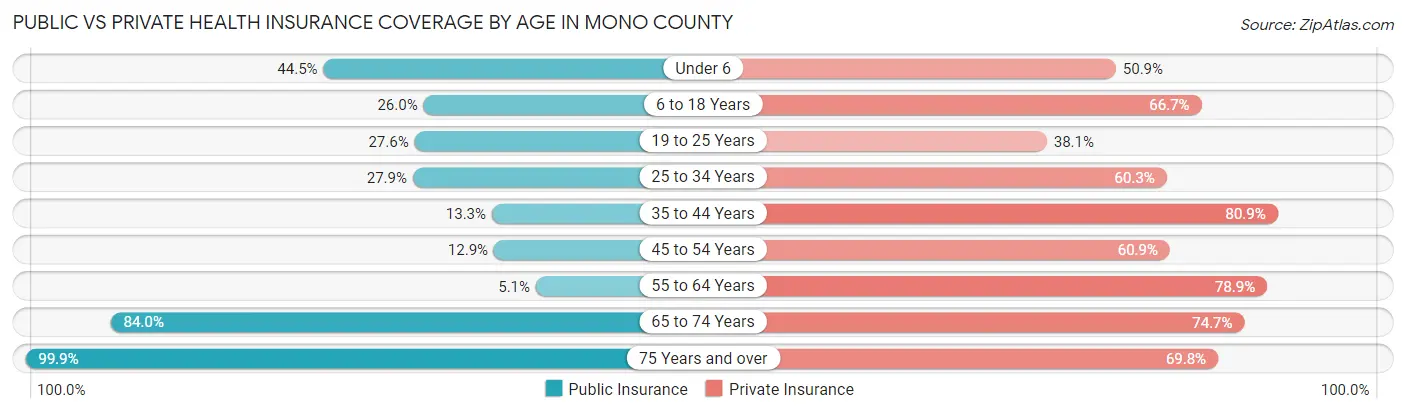
| Age Bracket | Public Insurance | Private Insurance |
| Under 6 | 359 (44.5%) | 410 (50.9%) |
| 6 to 18 Years | 473 (26.0%) | 1,216 (66.7%) |
| 19 to 25 Years | 281 (27.6%) | 387 (38.1%) |
| 25 to 34 Years | 437 (27.9%) | 943 (60.3%) |
| 35 to 44 Years | 243 (13.3%) | 1,481 (80.9%) |
| 45 to 54 Years | 233 (12.9%) | 1,100 (60.9%) |
| 55 to 64 Years | 107 (5.1%) | 1,656 (78.9%) |
| 65 to 74 Years | 1,137 (84.0%) | 1,011 (74.7%) |
| 75 Years and over | 721 (99.9%) | 504 (69.8%) |
| Total | 3,991 (30.6%) | 8,708 (66.9%) |
Disability Status by Sex by Age in Mono County
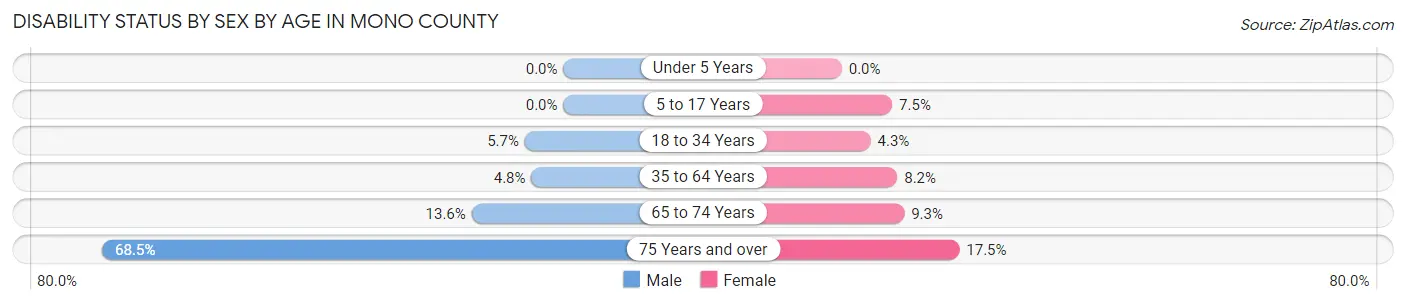
| Age Bracket | Male | Female |
| Under 5 Years | 0 (0.0%) | 0 (0.0%) |
| 5 to 17 Years | 0 (0.0%) | 68 (7.5%) |
| 18 to 34 Years | 77 (5.7%) | 58 (4.3%) |
| 35 to 64 Years | 148 (4.8%) | 216 (8.2%) |
| 65 to 74 Years | 102 (13.6%) | 56 (9.3%) |
| 75 Years and over | 263 (68.5%) | 59 (17.5%) |
Disability Class by Sex by Age in Mono County
Disability Class: Hearing Difficulty
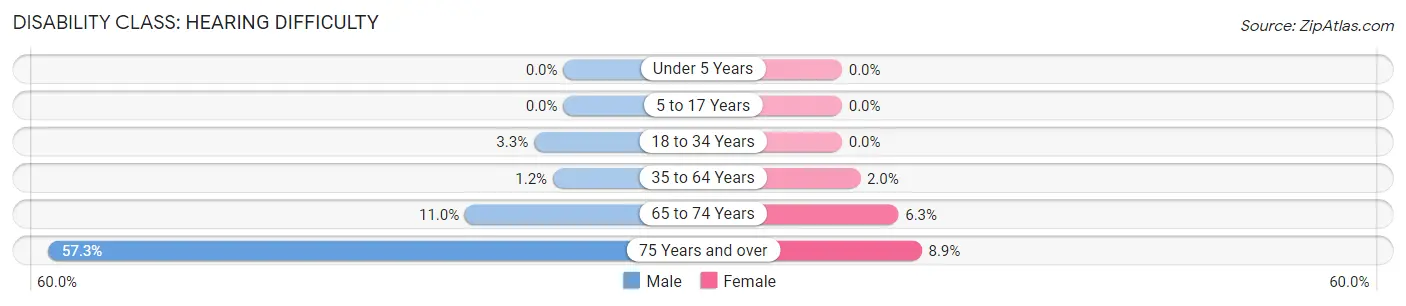
| Age Bracket | Male | Female |
| Under 5 Years | 0 (0.0%) | 0 (0.0%) |
| 5 to 17 Years | 0 (0.0%) | 0 (0.0%) |
| 18 to 34 Years | 44 (3.3%) | 0 (0.0%) |
| 35 to 64 Years | 36 (1.2%) | 53 (2.0%) |
| 65 to 74 Years | 82 (11.0%) | 38 (6.3%) |
| 75 Years and over | 220 (57.3%) | 30 (8.9%) |
Disability Class: Vision Difficulty
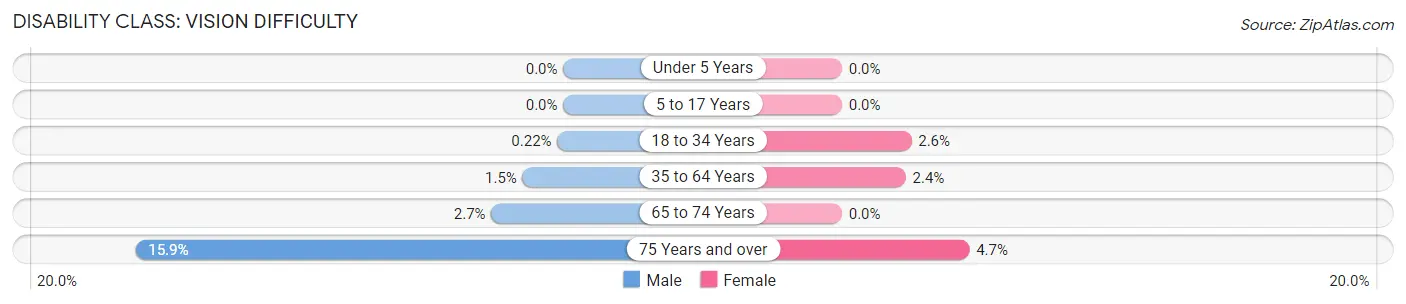
| Age Bracket | Male | Female |
| Under 5 Years | 0 (0.0%) | 0 (0.0%) |
| 5 to 17 Years | 0 (0.0%) | 0 (0.0%) |
| 18 to 34 Years | 3 (0.2%) | 35 (2.6%) |
| 35 to 64 Years | 47 (1.5%) | 62 (2.4%) |
| 65 to 74 Years | 20 (2.7%) | 0 (0.0%) |
| 75 Years and over | 61 (15.9%) | 16 (4.7%) |
Disability Class: Cognitive Difficulty
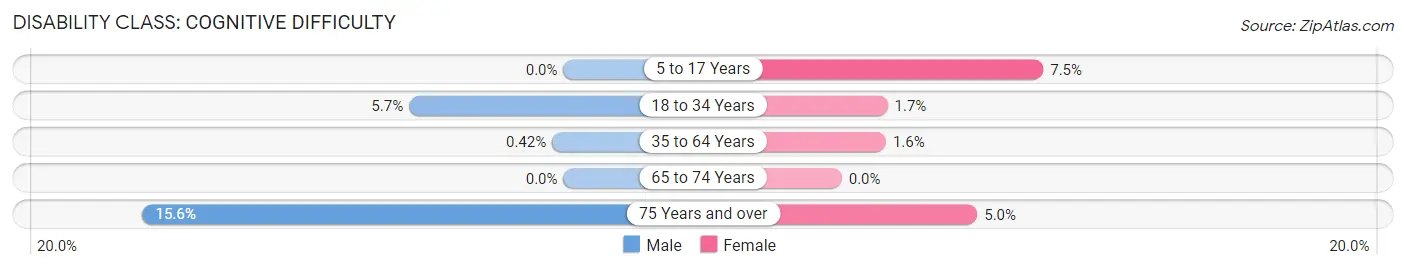
| Age Bracket | Male | Female |
| 5 to 17 Years | 0 (0.0%) | 68 (7.5%) |
| 18 to 34 Years | 77 (5.7%) | 23 (1.7%) |
| 35 to 64 Years | 13 (0.4%) | 43 (1.6%) |
| 65 to 74 Years | 0 (0.0%) | 0 (0.0%) |
| 75 Years and over | 60 (15.6%) | 17 (5.0%) |
Disability Class: Ambulatory Difficulty
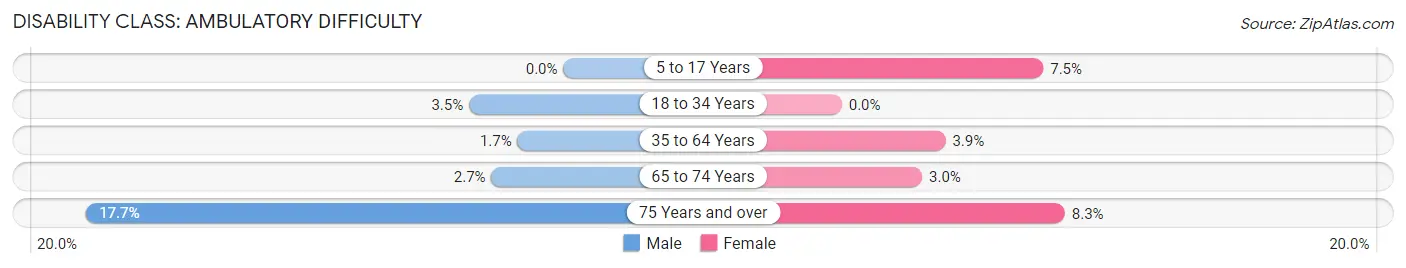
| Age Bracket | Male | Female |
| 5 to 17 Years | 0 (0.0%) | 68 (7.5%) |
| 18 to 34 Years | 47 (3.5%) | 0 (0.0%) |
| 35 to 64 Years | 53 (1.7%) | 101 (3.8%) |
| 65 to 74 Years | 20 (2.7%) | 18 (3.0%) |
| 75 Years and over | 68 (17.7%) | 28 (8.3%) |
Disability Class: Self-Care Difficulty
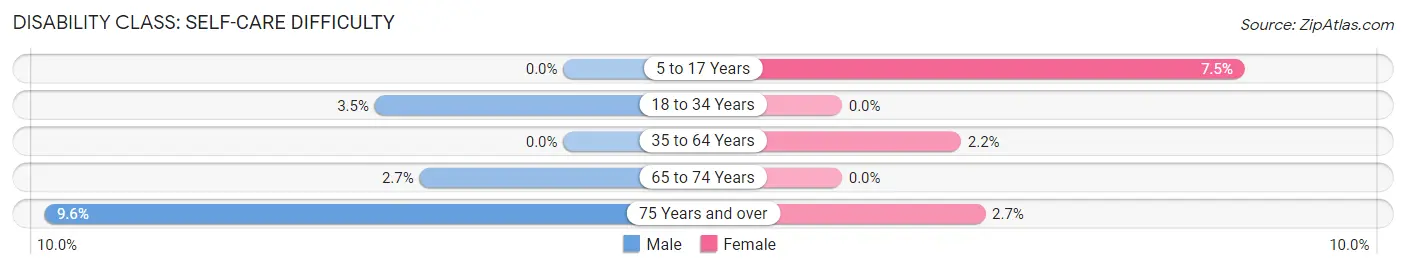
| Age Bracket | Male | Female |
| 5 to 17 Years | 0 (0.0%) | 68 (7.5%) |
| 18 to 34 Years | 47 (3.5%) | 0 (0.0%) |
| 35 to 64 Years | 0 (0.0%) | 58 (2.2%) |
| 65 to 74 Years | 20 (2.7%) | 0 (0.0%) |
| 75 Years and over | 37 (9.6%) | 9 (2.7%) |
Technology Access in Mono County
Computing Device Access in Mono County
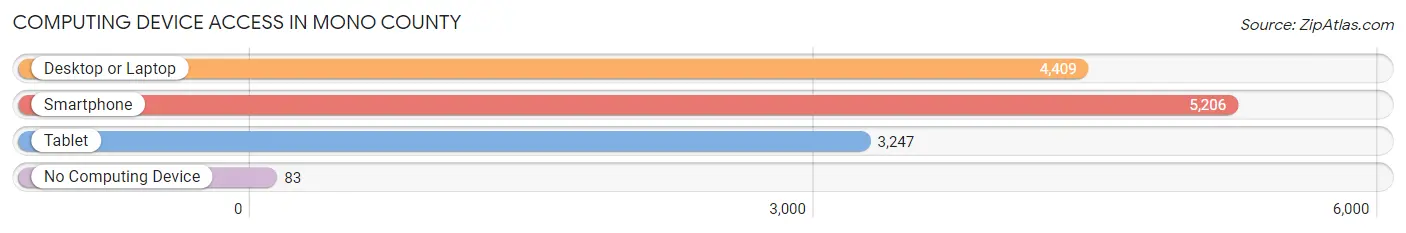
| Device Type | # Households | % Households |
| Desktop or Laptop | 4,409 | 80.6% |
| Smartphone | 5,206 | 95.1% |
| Tablet | 3,247 | 59.3% |
| No Computing Device | 83 | 1.5% |
| Total | 5,473 | 100.0% |
Internet Access in Mono County
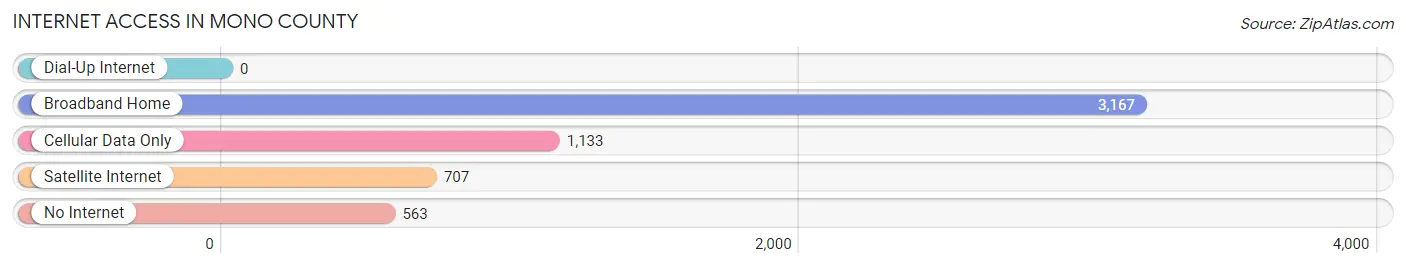
| Internet Type | # Households | % Households |
| Dial-Up Internet | 0 | 0.0% |
| Broadband Home | 3,167 | 57.9% |
| Cellular Data Only | 1,133 | 20.7% |
| Satellite Internet | 707 | 12.9% |
| No Internet | 563 | 10.3% |
| Total | 5,473 | 100.0% |
Mono County Summary
Mono County is a county located in the east-central portion of the U.S. state of California. It is located east of the Sierra Nevada mountain range and is bordered by Inyo County to the south, Alpine County to the north, and Fresno County to the west. Mono County covers an area of 3,132 square miles and has a population of 14,202 as of the 2010 census. The county seat is Bridgeport.
History
Mono County was formed in 1861 from parts of Calaveras and Mariposa counties. It was named after Mono Lake, which was named for the Native American tribe that lived in the area. The county was originally inhabited by the Mono tribe, who were hunter-gatherers and lived in small villages. The first European settlers arrived in the area in the late 1800s, and the county was officially established in 1861.
The county was initially used for ranching and mining, and the town of Bridgeport was established in 1862. The county experienced a population boom in the late 1800s and early 1900s due to the discovery of gold and silver in the area. The county also experienced a population decline in the mid-1900s due to the decline of the mining industry.
Geography
Mono County is located in the east-central portion of California and covers an area of 3,132 square miles. It is bordered by Inyo County to the south, Alpine County to the north, and Fresno County to the west. The county is located in the Sierra Nevada mountain range and is home to several mountain peaks, including Mount Dana, Mount Gibbs, and Mount Lyell. The county is also home to Mono Lake, a large saline lake located in the northern part of the county.
The county is divided into two distinct regions: the western region, which is characterized by rolling hills and valleys, and the eastern region, which is characterized by rugged mountains and canyons. The highest point in the county is White Mountain Peak, which has an elevation of 14,246 feet.
Economy
Mono County’s economy is largely based on tourism, agriculture, and mining. The county is home to several ski resorts, including Mammoth Mountain Ski Area, June Mountain Ski Area, and Bear Valley Ski Area. The county is also home to several national parks and monuments, including Yosemite National Park, Devils Postpile National Monument, and Mono Lake Tufa State Natural Reserve.
Agriculture is also an important part of the county’s economy. The county is home to several large cattle ranches, as well as several smaller farms that produce hay, alfalfa, and other crops.
Mining is also an important part of the county’s economy. The county is home to several gold and silver mines, as well as several other mineral mines.
Demographics
As of the 2010 census, Mono County had a population of 14,202. The racial makeup of the county was 79.2% White, 0.7% African American, 4.2% Native American, 0.7% Asian, 0.1% Pacific Islander, 11.2% from other races, and 4.0% from two or more races. Hispanic or Latino of any race were 22.2% of the population.
The median income for a household in the county was $41,945, and the median income for a family was $48,958. The per capita income for the county was $20,945. About 11.2% of families and 15.2% of the population were below the poverty line, including 20.2% of those under age 18 and 8.2% of those age 65 or over.
Common Questions
What is Per Capita Income in Mono County?
Per Capita income in Mono County is $43,315.
What is the Median Family Income in Mono County?
Median Family Income in Mono County is $99,721.
What is the Median Household income in Mono County?
Median Household Income in Mono County is $82,038.
What is Income or Wage Gap in Mono County?
Income or Wage Gap in Mono County is 2.5%.
Women in Mono County earn 97.5 cents for every dollar earned by a man.
What is Inequality or Gini Index in Mono County?
Inequality or Gini Index in Mono County is 0.41.
What is the Total Population of Mono County?
Total Population of Mono County is 13,219.
What is the Total Male Population of Mono County?
Total Male Population of Mono County is 7,279.
What is the Total Female Population of Mono County?
Total Female Population of Mono County is 5,940.
What is the Ratio of Males per 100 Females in Mono County?
There are 122.54 Males per 100 Females in Mono County.
What is the Ratio of Females per 100 Males in Mono County?
There are 81.60 Females per 100 Males in Mono County.
What is the Median Population Age in Mono County?
Median Population Age in Mono County is 40.5 Years.
What is the Average Family Size in Mono County
Average Family Size in Mono County is 2.9 People.
What is the Average Household Size in Mono County
Average Household Size in Mono County is 2.3 People.
How Large is the Labor Force in Mono County?
There are 7,580 People in the Labor Forcein in Mono County.
What is the Percentage of People in the Labor Force in Mono County?
69.5% of People are in the Labor Force in Mono County.
What is the Unemployment Rate in Mono County?
Unemployment Rate in Mono County is 1.9%.