Merced County, CA Map & Demographics
Merced County Map
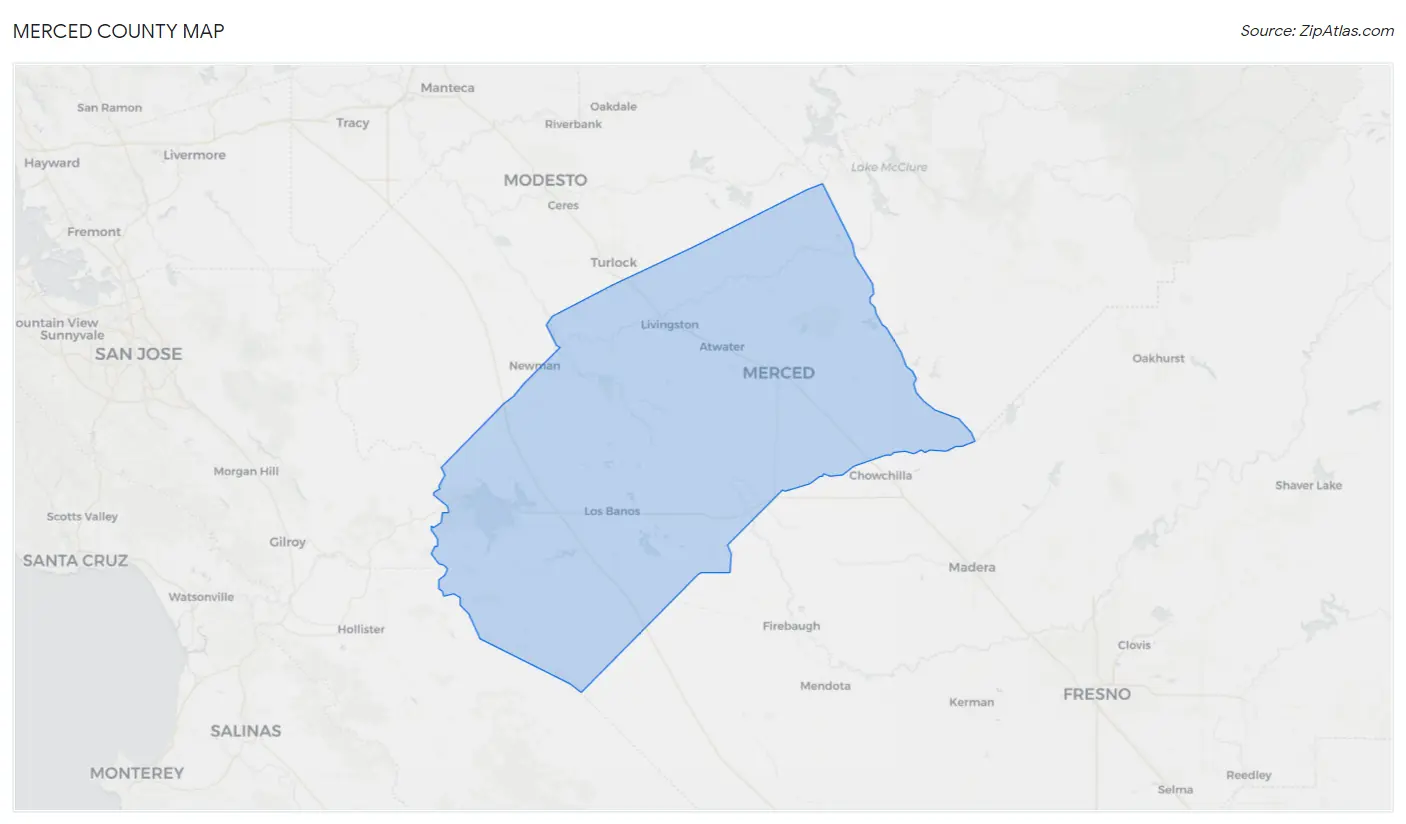
Merced County Overview
$26,869
PER CAPITA INCOME
$70,798
AVG FAMILY INCOME
$64,772
AVG HOUSEHOLD INCOME
34.2%
WAGE / INCOME GAP [ % ]
65.8¢/ $1
WAGE / INCOME GAP [ $ ]
$11,824
FAMILY INCOME DEFICIT
0.46
INEQUALITY / GINI INDEX
282,290
TOTAL POPULATION
143,519
MALE POPULATION
138,771
FEMALE POPULATION
103.42
MALES / 100 FEMALES
96.69
FEMALES / 100 MALES
31.5
MEDIAN AGE
3.8
AVG FAMILY SIZE
3.3
AVG HOUSEHOLD SIZE
124,265
LABOR FORCE [ PEOPLE ]
59.3%
PERCENT IN LABOR FORCE
10.7%
UNEMPLOYMENT RATE
Merced County Area Codes
Income in Merced County
Income Overview in Merced County
Per Capita Income in Merced County is $26,869, while median incomes of families and households are $70,798 and $64,772 respectively.
| Characteristic | Number | Measure |
| Per Capita Income | 282,290 | $26,869 |
| Median Family Income | 63,078 | $70,798 |
| Mean Family Income | 63,078 | $92,815 |
| Median Household Income | 82,760 | $64,772 |
| Mean Household Income | 82,760 | $86,076 |
| Income Deficit | 63,078 | $11,824 |
| Wage / Income Gap (%) | 282,290 | 34.17% |
| Wage / Income Gap ($) | 282,290 | 65.83¢ per $1 |
| Gini / Inequality Index | 282,290 | 0.46 |
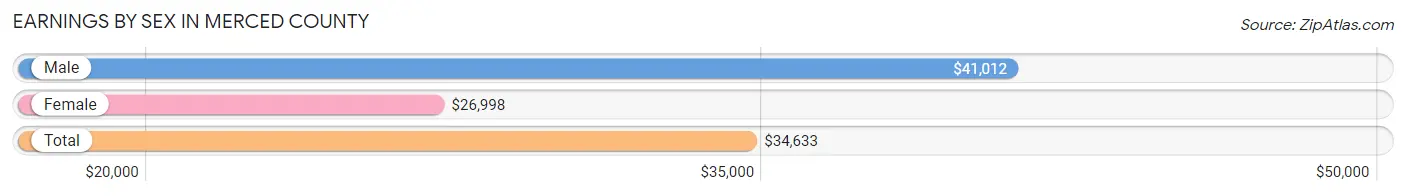
Earnings by Sex in Merced County
Average Earnings in Merced County are $34,633, $41,012 for men and $26,998 for women, a difference of 34.2%.
| Sex | Number | Average Earnings |
| Male | 72,075 (57.5%) | $41,012 |
| Female | 53,198 (42.5%) | $26,998 |
| Total | 125,273 (100.0%) | $34,633 |
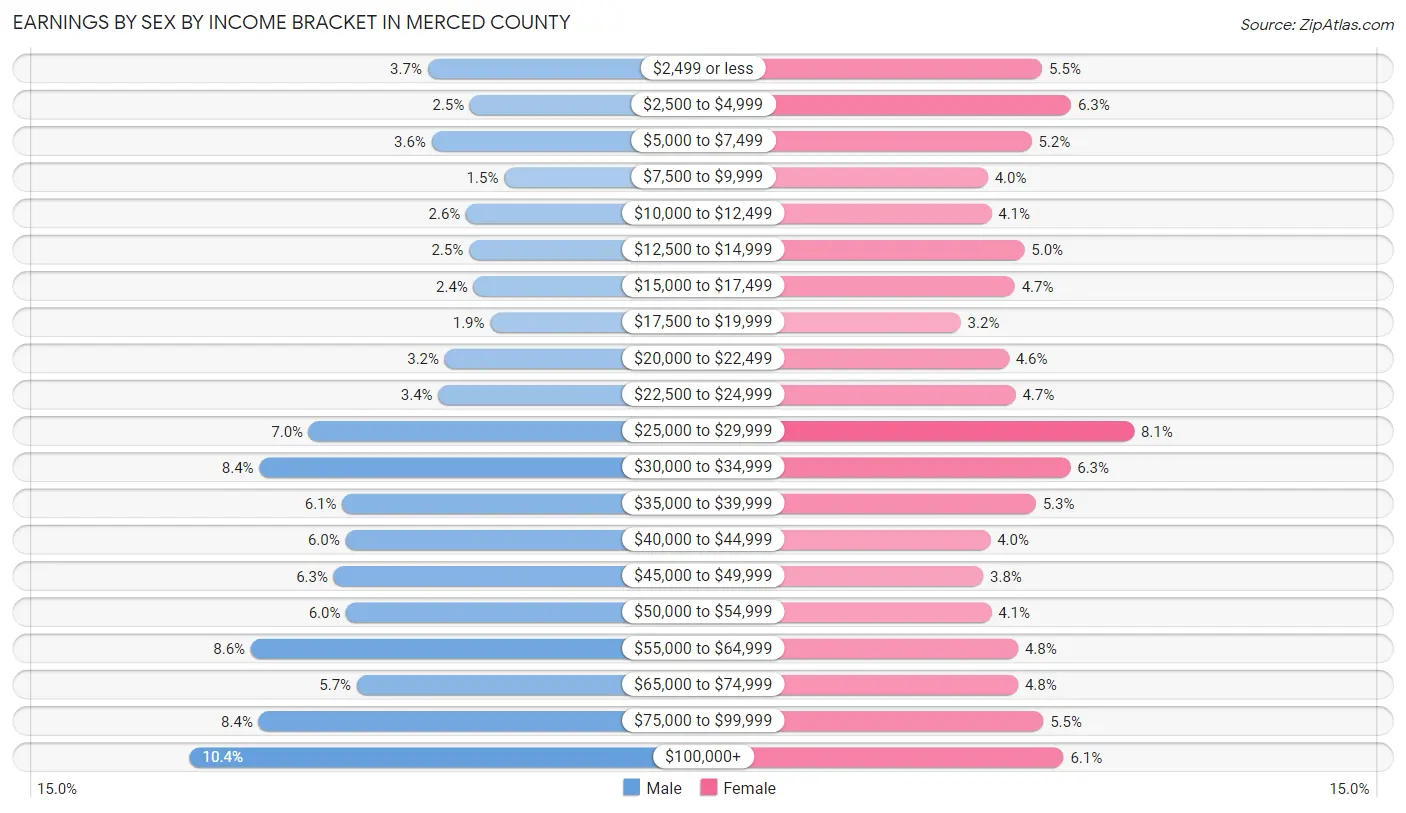
Earnings by Sex by Income Bracket in Merced County
The most common earnings brackets in Merced County are $100,000+ for men (7,469 | 10.4%) and $25,000 to $29,999 for women (4,293 | 8.1%).
| Income | Male | Female |
| $2,499 or less | 2,648 (3.7%) | 2,918 (5.5%) |
| $2,500 to $4,999 | 1,789 (2.5%) | 3,349 (6.3%) |
| $5,000 to $7,499 | 2,568 (3.6%) | 2,760 (5.2%) |
| $7,500 to $9,999 | 1,099 (1.5%) | 2,106 (4.0%) |
| $10,000 to $12,499 | 1,867 (2.6%) | 2,161 (4.1%) |
| $12,500 to $14,999 | 1,810 (2.5%) | 2,656 (5.0%) |
| $15,000 to $17,499 | 1,714 (2.4%) | 2,510 (4.7%) |
| $17,500 to $19,999 | 1,376 (1.9%) | 1,701 (3.2%) |
| $20,000 to $22,499 | 2,299 (3.2%) | 2,421 (4.5%) |
| $22,500 to $24,999 | 2,427 (3.4%) | 2,521 (4.7%) |
| $25,000 to $29,999 | 5,053 (7.0%) | 4,293 (8.1%) |
| $30,000 to $34,999 | 6,053 (8.4%) | 3,342 (6.3%) |
| $35,000 to $39,999 | 4,374 (6.1%) | 2,827 (5.3%) |
| $40,000 to $44,999 | 4,313 (6.0%) | 2,143 (4.0%) |
| $45,000 to $49,999 | 4,547 (6.3%) | 2,037 (3.8%) |
| $50,000 to $54,999 | 4,293 (6.0%) | 2,160 (4.1%) |
| $55,000 to $64,999 | 6,226 (8.6%) | 2,560 (4.8%) |
| $65,000 to $74,999 | 4,081 (5.7%) | 2,557 (4.8%) |
| $75,000 to $99,999 | 6,069 (8.4%) | 2,934 (5.5%) |
| $100,000+ | 7,469 (10.4%) | 3,242 (6.1%) |
| Total | 72,075 (100.0%) | 53,198 (100.0%) |
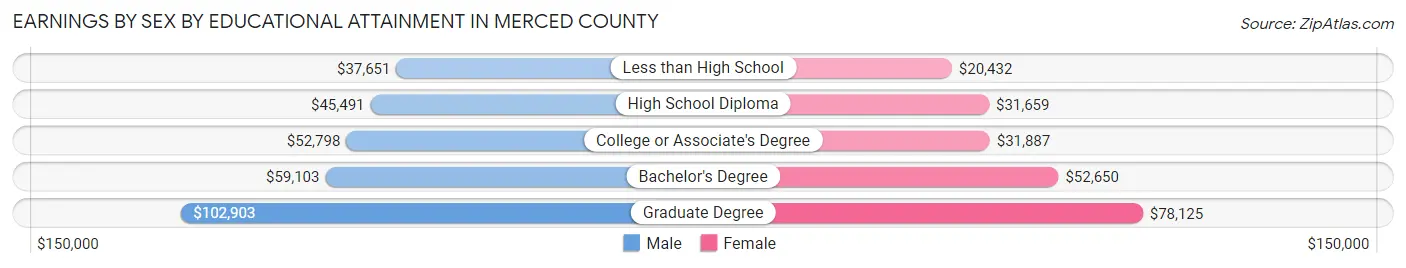
Earnings by Sex by Educational Attainment in Merced County
Average earnings in Merced County are $45,879 for men and $31,216 for women, a difference of 32.0%. Men with an educational attainment of graduate degree enjoy the highest average annual earnings of $102,903, while those with less than high school education earn the least with $37,651. Women with an educational attainment of graduate degree earn the most with the average annual earnings of $78,125, while those with less than high school education have the smallest earnings of $20,432.
| Educational Attainment | Male Income | Female Income |
| Less than High School | $37,651 | $20,432 |
| High School Diploma | $45,491 | $31,659 |
| College or Associate's Degree | $52,798 | $31,887 |
| Bachelor's Degree | $59,103 | $52,650 |
| Graduate Degree | $102,903 | $78,125 |
| Total | $45,879 | $31,216 |
Family Income in Merced County
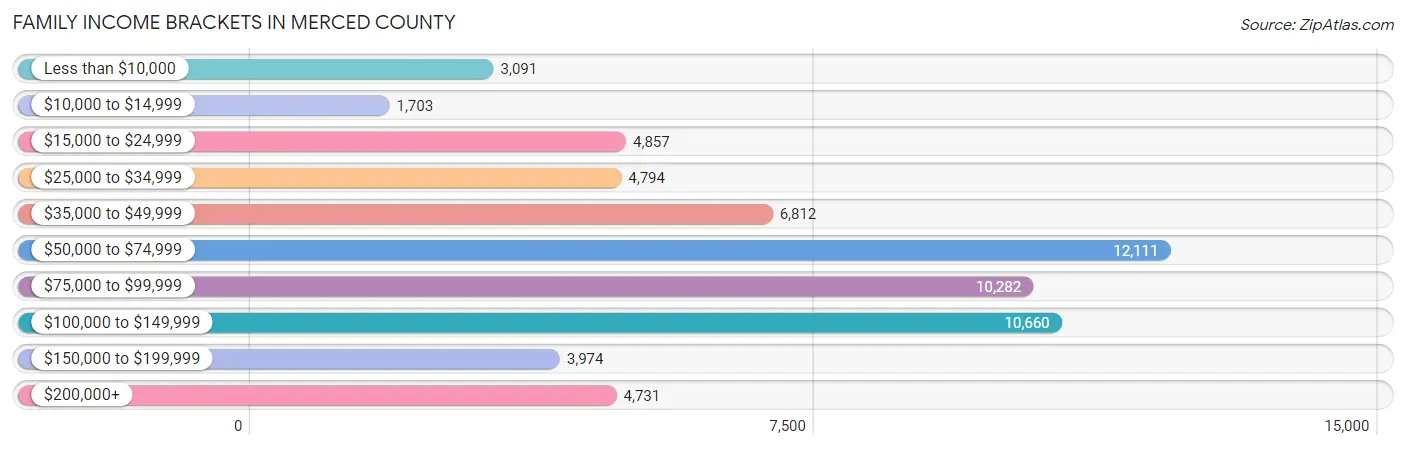
Family Income Brackets in Merced County
According to the Merced County family income data, there are 12,111 families falling into the $50,000 to $74,999 income range, which is the most common income bracket and makes up 19.2% of all families. Conversely, the $10,000 to $14,999 income bracket is the least frequent group with only 1,703 families (2.7%) belonging to this category.
| Income Bracket | # Families | % Families |
| Less than $10,000 | 3,091 | 4.9% |
| $10,000 to $14,999 | 1,703 | 2.7% |
| $15,000 to $24,999 | 4,857 | 7.7% |
| $25,000 to $34,999 | 4,794 | 7.6% |
| $35,000 to $49,999 | 6,812 | 10.8% |
| $50,000 to $74,999 | 12,111 | 19.2% |
| $75,000 to $99,999 | 10,282 | 16.3% |
| $100,000 to $149,999 | 10,660 | 16.9% |
| $150,000 to $199,999 | 3,974 | 6.3% |
| $200,000+ | 4,731 | 7.5% |
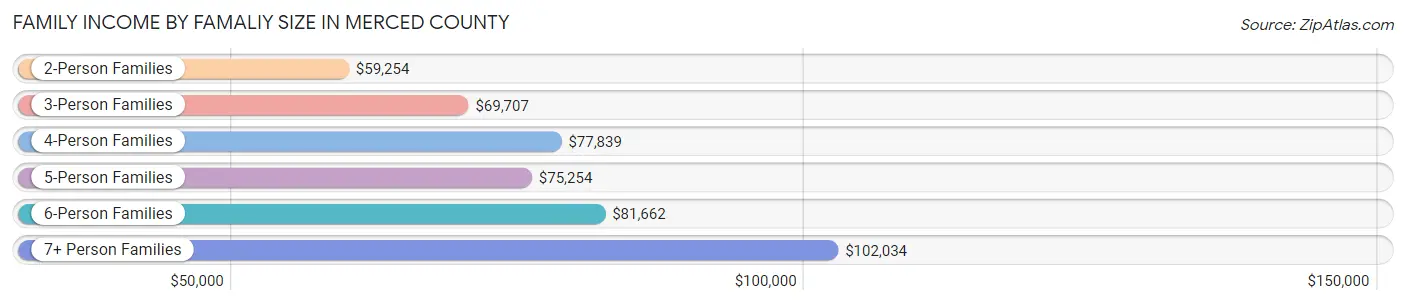
Family Income by Famaliy Size in Merced County
7+ person families (3,239 | 5.1%) account for the highest median family income in Merced County with $102,034 per family, while 2-person families (22,082 | 35.0%) have the highest median income of $29,627 per family member.
| Income Bracket | # Families | Median Income |
| 2-Person Families | 22,082 (35.0%) | $59,254 |
| 3-Person Families | 13,033 (20.7%) | $69,707 |
| 4-Person Families | 12,567 (19.9%) | $77,839 |
| 5-Person Families | 9,036 (14.3%) | $75,254 |
| 6-Person Families | 3,121 (5.0%) | $81,662 |
| 7+ Person Families | 3,239 (5.1%) | $102,034 |
| Total | 63,078 (100.0%) | $70,798 |
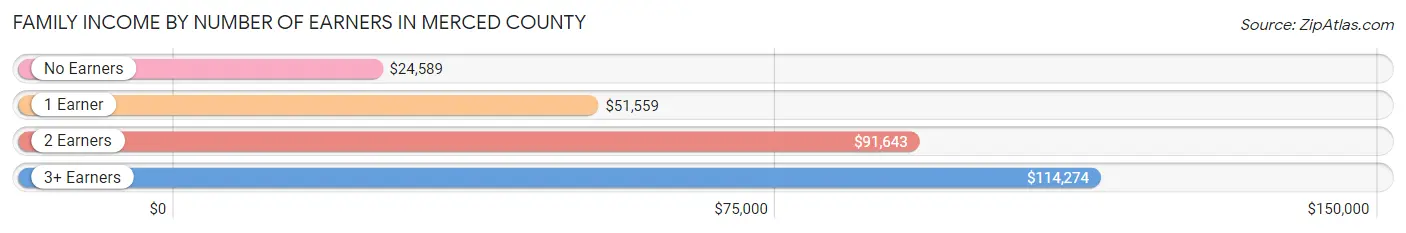
Family Income by Number of Earners in Merced County
The median family income in Merced County is $70,798, with families comprising 3+ earners (8,246) having the highest median family income of $114,274, while families with no earners (9,726) have the lowest median family income of $24,589, accounting for 13.1% and 15.4% of families, respectively.
| Number of Earners | # Families | Median Income |
| No Earners | 9,726 (15.4%) | $24,589 |
| 1 Earner | 23,099 (36.6%) | $51,559 |
| 2 Earners | 22,007 (34.9%) | $91,643 |
| 3+ Earners | 8,246 (13.1%) | $114,274 |
| Total | 63,078 (100.0%) | $70,798 |
Household Income in Merced County
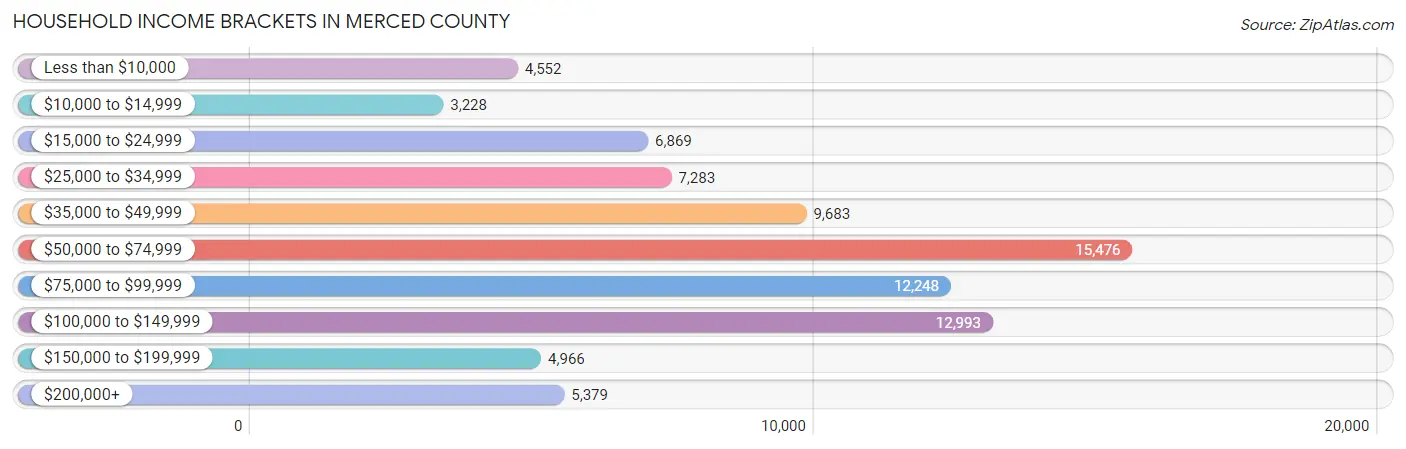
Household Income Brackets in Merced County
With 15,476 households falling in the category, the $50,000 to $74,999 income range is the most frequent in Merced County, accounting for 18.7% of all households. In contrast, only 3,228 households (3.9%) fall into the $10,000 to $14,999 income bracket, making it the least populous group.
| Income Bracket | # Households | % Households |
| Less than $10,000 | 4,552 | 5.5% |
| $10,000 to $14,999 | 3,228 | 3.9% |
| $15,000 to $24,999 | 6,869 | 8.3% |
| $25,000 to $34,999 | 7,283 | 8.8% |
| $35,000 to $49,999 | 9,683 | 11.7% |
| $50,000 to $74,999 | 15,476 | 18.7% |
| $75,000 to $99,999 | 12,248 | 14.8% |
| $100,000 to $149,999 | 12,993 | 15.7% |
| $150,000 to $199,999 | 4,966 | 6.0% |
| $200,000+ | 5,379 | 6.5% |
Household Income by Householder Age in Merced County
The median household income in Merced County is $64,772, with the highest median household income of $75,121 found in the 45 to 64 years age bracket for the primary householder. A total of 30,575 households (36.9%) fall into this category. Meanwhile, the 15 to 24 years age bracket for the primary householder has the lowest median household income of $48,895, with 2,828 households (3.4%) in this group.
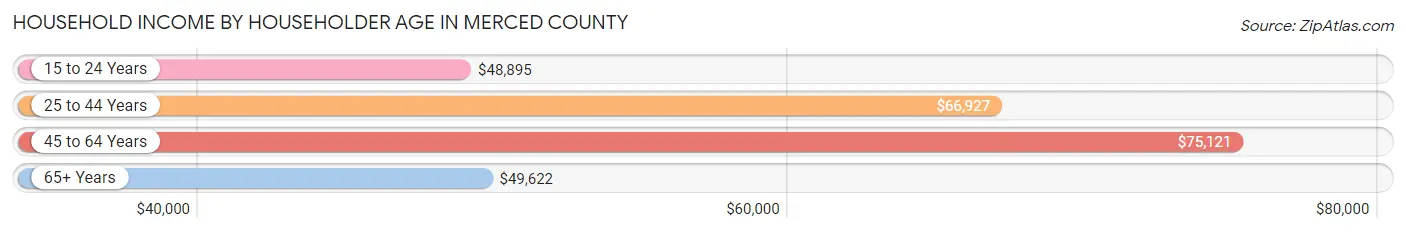
| Income Bracket | # Households | Median Income |
| 15 to 24 Years | 2,828 (3.4%) | $48,895 |
| 25 to 44 Years | 30,907 (37.3%) | $66,927 |
| 45 to 64 Years | 30,575 (36.9%) | $75,121 |
| 65+ Years | 18,450 (22.3%) | $49,622 |
| Total | 82,760 (100.0%) | $64,772 |
Poverty in Merced County
Income Below Poverty by Sex and Age in Merced County
With 16.0% poverty level for males and 21.1% for females among the residents of Merced County, 5 year old males and 15 year old females are the most vulnerable to poverty, with 760 males (32.5%) and 780 females (35.6%) in their respective age groups living below the poverty level.
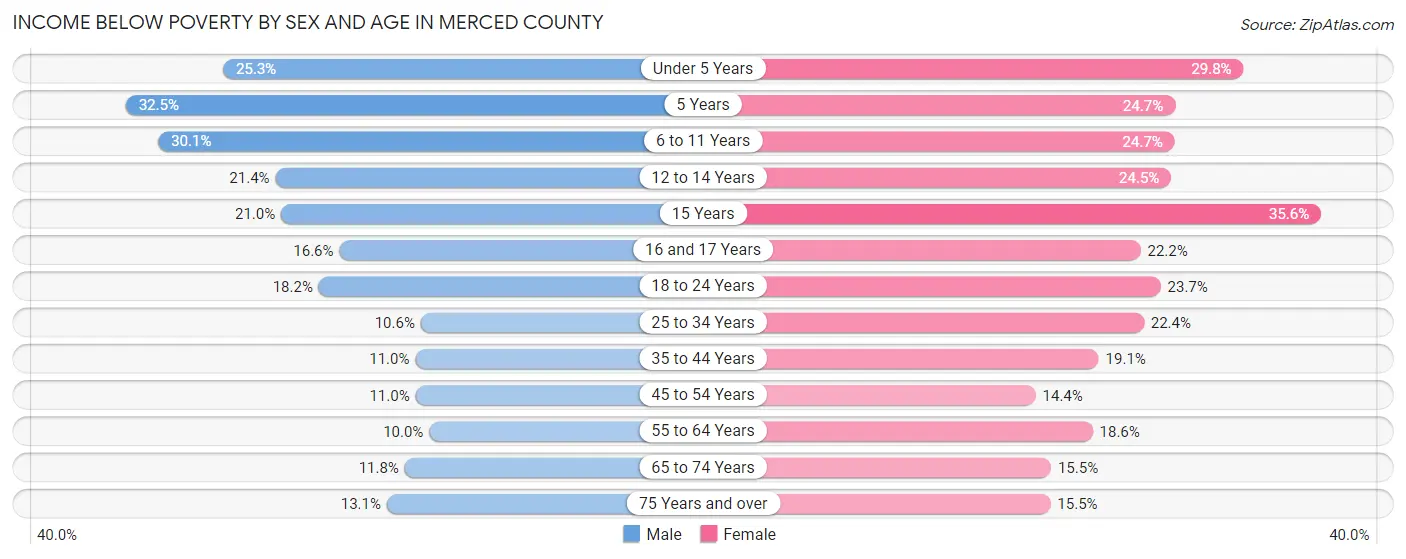
| Age Bracket | Male | Female |
| Under 5 Years | 2,674 (25.3%) | 2,953 (29.8%) |
| 5 Years | 760 (32.5%) | 478 (24.7%) |
| 6 to 11 Years | 4,282 (30.1%) | 3,130 (24.7%) |
| 12 to 14 Years | 1,556 (21.4%) | 1,922 (24.4%) |
| 15 Years | 565 (21.0%) | 780 (35.6%) |
| 16 and 17 Years | 782 (16.6%) | 1,065 (22.2%) |
| 18 to 24 Years | 2,750 (18.2%) | 3,334 (23.7%) |
| 25 to 34 Years | 2,228 (10.6%) | 4,368 (22.4%) |
| 35 to 44 Years | 1,950 (11.0%) | 3,311 (19.1%) |
| 45 to 54 Years | 1,682 (11.0%) | 2,219 (14.4%) |
| 55 to 64 Years | 1,414 (10.0%) | 2,599 (18.6%) |
| 65 to 74 Years | 1,085 (11.8%) | 1,529 (15.5%) |
| 75 Years and over | 718 (13.1%) | 1,138 (15.5%) |
| Total | 22,446 (16.0%) | 28,826 (21.1%) |
Income Above Poverty by Sex and Age in Merced County
According to the poverty statistics in Merced County, males aged 55 to 64 years and females aged 45 to 54 years are the age groups that are most secure financially, with 90.0% of males and 85.6% of females in these age groups living above the poverty line.
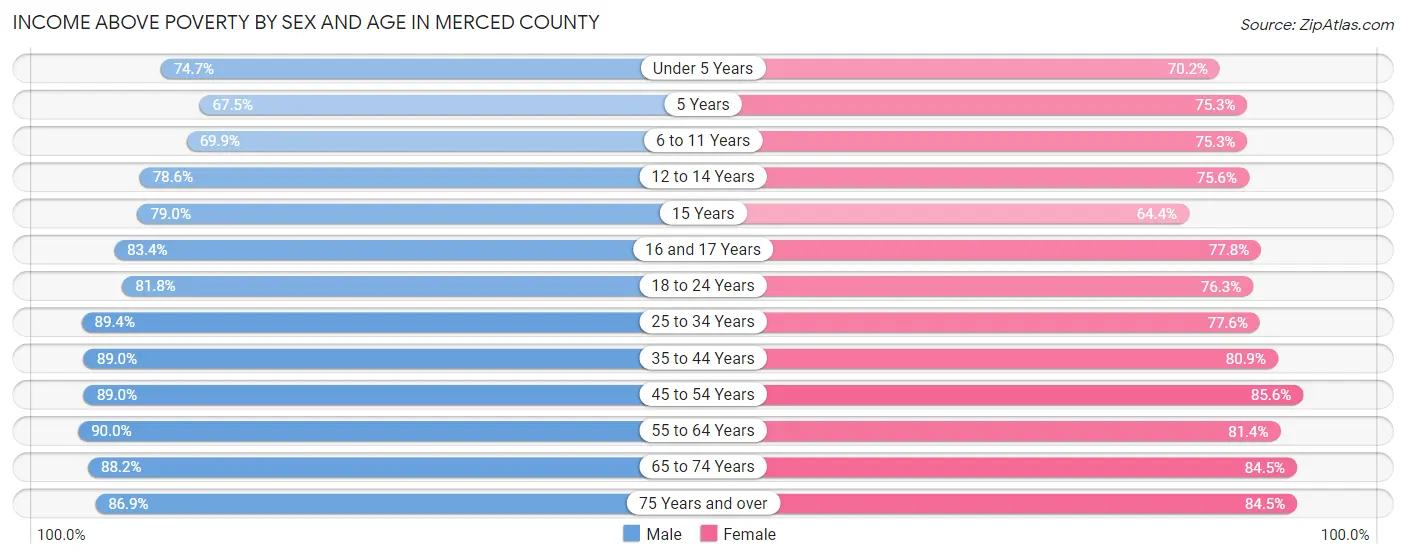
| Age Bracket | Male | Female |
| Under 5 Years | 7,909 (74.7%) | 6,951 (70.2%) |
| 5 Years | 1,579 (67.5%) | 1,454 (75.3%) |
| 6 to 11 Years | 9,950 (69.9%) | 9,536 (75.3%) |
| 12 to 14 Years | 5,722 (78.6%) | 5,940 (75.5%) |
| 15 Years | 2,130 (79.0%) | 1,412 (64.4%) |
| 16 and 17 Years | 3,920 (83.4%) | 3,737 (77.8%) |
| 18 to 24 Years | 12,392 (81.8%) | 10,750 (76.3%) |
| 25 to 34 Years | 18,819 (89.4%) | 15,113 (77.6%) |
| 35 to 44 Years | 15,789 (89.0%) | 14,050 (80.9%) |
| 45 to 54 Years | 13,630 (89.0%) | 13,200 (85.6%) |
| 55 to 64 Years | 12,783 (90.0%) | 11,358 (81.4%) |
| 65 to 74 Years | 8,124 (88.2%) | 8,315 (84.5%) |
| 75 Years and over | 4,758 (86.9%) | 6,210 (84.5%) |
| Total | 117,505 (84.0%) | 108,026 (78.9%) |
Income Below Poverty Among Married-Couple Families in Merced County
The poverty statistics for married-couple families in Merced County show that 8.7% or 3,515 of the total 40,383 families live below the poverty line. Families with 5 or more children have the highest poverty rate of 22.2%, comprising of 171 families. On the other hand, families with no children have the lowest poverty rate of 6.0%, which includes 1,192 families.
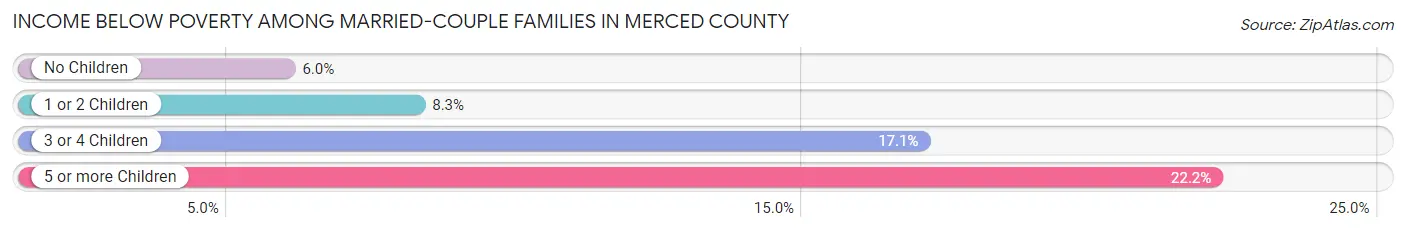
| Children | Above Poverty | Below Poverty |
| No Children | 18,689 (94.0%) | 1,192 (6.0%) |
| 1 or 2 Children | 12,648 (91.7%) | 1,139 (8.3%) |
| 3 or 4 Children | 4,930 (83.0%) | 1,013 (17.1%) |
| 5 or more Children | 601 (77.8%) | 171 (22.2%) |
| Total | 36,868 (91.3%) | 3,515 (8.7%) |
Income Below Poverty Among Single-Parent Households in Merced County
According to the poverty data in Merced County, 13.1% or 1,026 single-father households and 35.1% or 5,208 single-mother households are living below the poverty line. Among single-father households, those with 5 or more children have the highest poverty rate, with 116 households (59.8%) experiencing poverty. Likewise, among single-mother households, those with 5 or more children have the highest poverty rate, with 248 households (88.3%) falling below the poverty line.
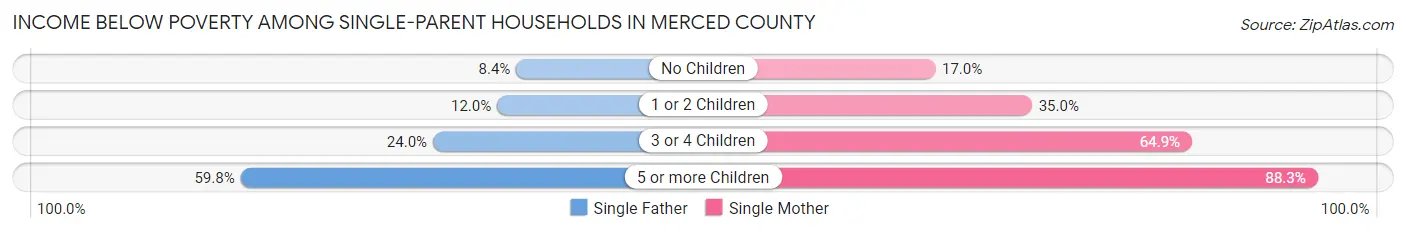
| Children | Single Father | Single Mother |
| No Children | 290 (8.4%) | 751 (17.0%) |
| 1 or 2 Children | 391 (12.0%) | 2,793 (35.0%) |
| 3 or 4 Children | 229 (23.9%) | 1,416 (64.9%) |
| 5 or more Children | 116 (59.8%) | 248 (88.3%) |
| Total | 1,026 (13.1%) | 5,208 (35.1%) |
Income Below Poverty Among Married-Couple vs Single-Parent Households in Merced County
The poverty data for Merced County shows that 3,515 of the married-couple family households (8.7%) and 6,234 of the single-parent households (27.5%) are living below the poverty level. Within the married-couple family households, those with 5 or more children have the highest poverty rate, with 171 households (22.2%) falling below the poverty line. Among the single-parent households, those with 5 or more children have the highest poverty rate, with 364 household (76.6%) living below poverty.
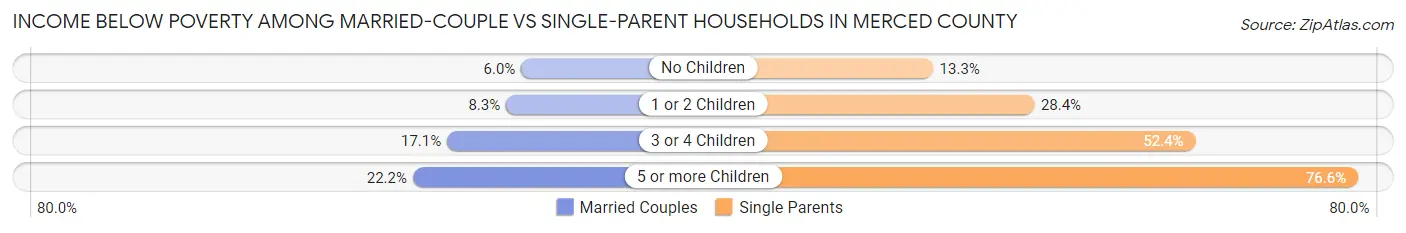
| Children | Married-Couple Families | Single-Parent Households |
| No Children | 1,192 (6.0%) | 1,041 (13.3%) |
| 1 or 2 Children | 1,139 (8.3%) | 3,184 (28.3%) |
| 3 or 4 Children | 1,013 (17.1%) | 1,645 (52.4%) |
| 5 or more Children | 171 (22.2%) | 364 (76.6%) |
| Total | 3,515 (8.7%) | 6,234 (27.5%) |
Race in Merced County
The most populous races in Merced County are Hispanic or Latino (174,732 | 61.9%), White / Caucasian (117,491 | 41.6%), and Some other Race (104,067 | 36.9%).
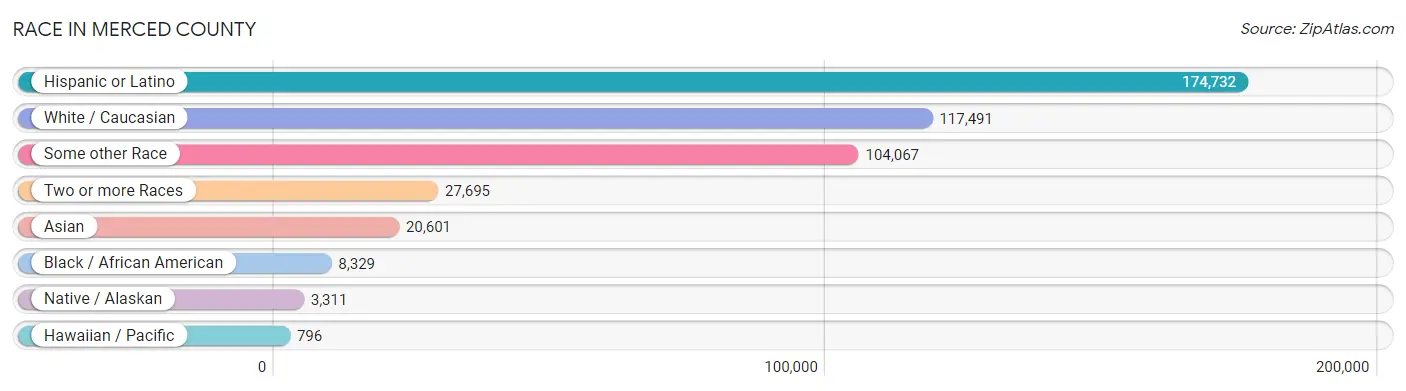
| Race | # Population | % Population |
| Asian | 20,601 | 7.3% |
| Black / African American | 8,329 | 2.9% |
| Hawaiian / Pacific | 796 | 0.3% |
| Hispanic or Latino | 174,732 | 61.9% |
| Native / Alaskan | 3,311 | 1.2% |
| White / Caucasian | 117,491 | 41.6% |
| Two or more Races | 27,695 | 9.8% |
| Some other Race | 104,067 | 36.9% |
| Total | 282,290 | 100.0% |
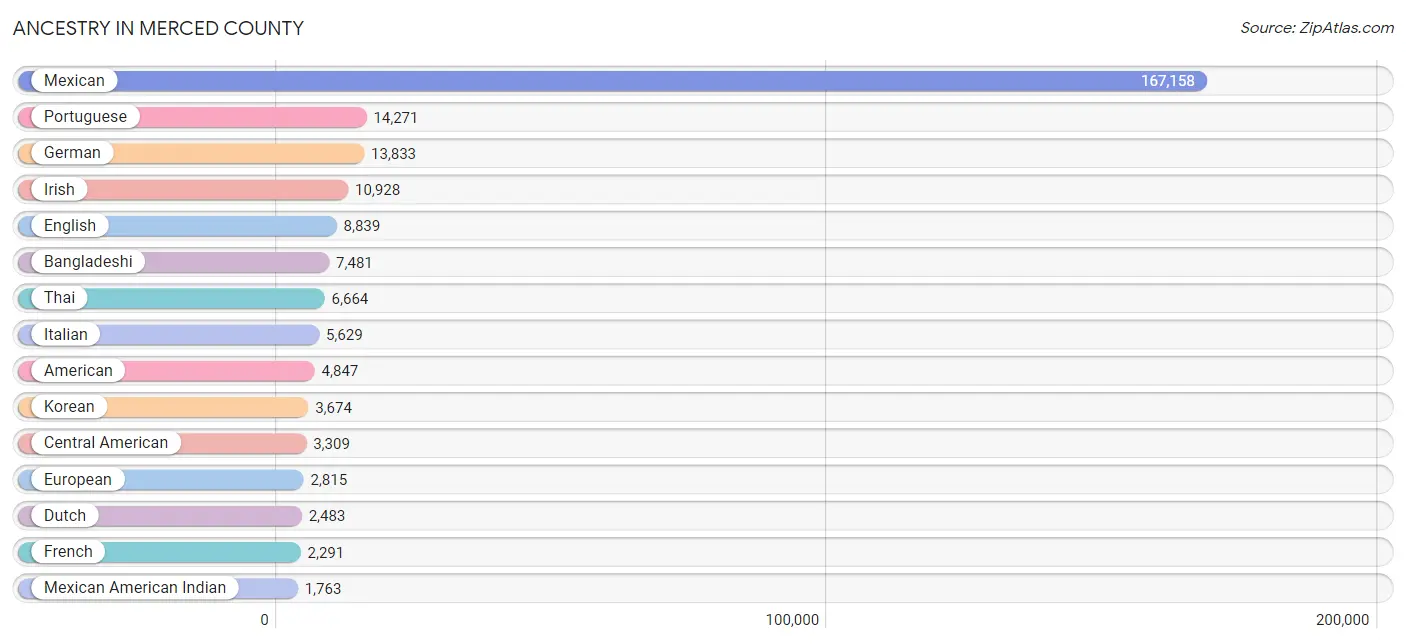
Ancestry in Merced County
The most populous ancestries reported in Merced County are Mexican (167,158 | 59.2%), Portuguese (14,271 | 5.1%), German (13,833 | 4.9%), Irish (10,928 | 3.9%), and English (8,839 | 3.1%), together accounting for 76.2% of all Merced County residents.
| Ancestry | # Population | % Population |
| Afghan | 103 | 0.0% |
| African | 313 | 0.1% |
| Aleut | 11 | 0.0% |
| Alsatian | 23 | 0.0% |
| American | 4,847 | 1.7% |
| Apache | 309 | 0.1% |
| Arab | 797 | 0.3% |
| Argentinean | 64 | 0.0% |
| Armenian | 52 | 0.0% |
| Assyrian / Chaldean / Syriac | 209 | 0.1% |
| Australian | 130 | 0.1% |
| Austrian | 62 | 0.0% |
| Bangladeshi | 7,481 | 2.6% |
| Basque | 83 | 0.0% |
| Belgian | 20 | 0.0% |
| Belizean | 18 | 0.0% |
| Bhutanese | 998 | 0.4% |
| Blackfeet | 77 | 0.0% |
| Bolivian | 32 | 0.0% |
| Brazilian | 124 | 0.0% |
| British | 635 | 0.2% |
| Burmese | 856 | 0.3% |
| Cajun | 23 | 0.0% |
| Cambodian | 21 | 0.0% |
| Canadian | 160 | 0.1% |
| Central American | 3,309 | 1.2% |
| Central American Indian | 473 | 0.2% |
| Cherokee | 950 | 0.3% |
| Cheyenne | 7 | 0.0% |
| Chickasaw | 11 | 0.0% |
| Chilean | 13 | 0.0% |
| Chippewa | 90 | 0.0% |
| Choctaw | 171 | 0.1% |
| Colombian | 171 | 0.1% |
| Comanche | 10 | 0.0% |
| Costa Rican | 419 | 0.2% |
| Creek | 136 | 0.1% |
| Croatian | 54 | 0.0% |
| Cuban | 147 | 0.1% |
| Czech | 88 | 0.0% |
| Czechoslovakian | 147 | 0.1% |
| Danish | 567 | 0.2% |
| Delaware | 2 | 0.0% |
| Dominican | 25 | 0.0% |
| Dutch | 2,483 | 0.9% |
| Dutch West Indian | 56 | 0.0% |
| Eastern European | 140 | 0.1% |
| Ecuadorian | 30 | 0.0% |
| Egyptian | 14 | 0.0% |
| English | 8,839 | 3.1% |
| Ethiopian | 9 | 0.0% |
| European | 2,815 | 1.0% |
| Fijian | 34 | 0.0% |
| Filipino | 230 | 0.1% |
| Finnish | 87 | 0.0% |
| French | 2,291 | 0.8% |
| French Canadian | 282 | 0.1% |
| German | 13,833 | 4.9% |
| German Russian | 52 | 0.0% |
| Greek | 159 | 0.1% |
| Guamanian / Chamorro | 14 | 0.0% |
| Guatemalan | 778 | 0.3% |
| Haitian | 4 | 0.0% |
| Honduran | 472 | 0.2% |
| Hungarian | 199 | 0.1% |
| Indian (Asian) | 1,355 | 0.5% |
| Iranian | 450 | 0.2% |
| Iraqi | 124 | 0.0% |
| Irish | 10,928 | 3.9% |
| Iroquois | 83 | 0.0% |
| Italian | 5,629 | 2.0% |
| Jamaican | 65 | 0.0% |
| Japanese | 150 | 0.1% |
| Jordanian | 2 | 0.0% |
| Korean | 3,674 | 1.3% |
| Laotian | 124 | 0.0% |
| Lebanese | 85 | 0.0% |
| Lithuanian | 87 | 0.0% |
| Malaysian | 609 | 0.2% |
| Mexican | 167,158 | 59.2% |
| Mexican American Indian | 1,763 | 0.6% |
| Mongolian | 10 | 0.0% |
| Native Hawaiian | 176 | 0.1% |
| Navajo | 164 | 0.1% |
| Nepalese | 567 | 0.2% |
| Nicaraguan | 242 | 0.1% |
| Nigerian | 25 | 0.0% |
| Northern European | 215 | 0.1% |
| Norwegian | 1,123 | 0.4% |
| Pakistani | 632 | 0.2% |
| Palestinian | 13 | 0.0% |
| Panamanian | 80 | 0.0% |
| Paraguayan | 2 | 0.0% |
| Pennsylvania German | 19 | 0.0% |
| Peruvian | 251 | 0.1% |
| Polish | 1,156 | 0.4% |
| Portuguese | 14,271 | 5.1% |
| Potawatomi | 42 | 0.0% |
| Pueblo | 75 | 0.0% |
| Puerto Rican | 610 | 0.2% |
| Puget Sound Salish | 46 | 0.0% |
| Romanian | 59 | 0.0% |
| Russian | 515 | 0.2% |
| Salvadoran | 1,311 | 0.5% |
| Samoan | 216 | 0.1% |
| Scandinavian | 237 | 0.1% |
| Scotch-Irish | 647 | 0.2% |
| Scottish | 1,759 | 0.6% |
| Seminole | 6 | 0.0% |
| Serbian | 23 | 0.0% |
| Sioux | 41 | 0.0% |
| Slavic | 3 | 0.0% |
| Slovak | 8 | 0.0% |
| Slovene | 24 | 0.0% |
| Somali | 18 | 0.0% |
| South African | 43 | 0.0% |
| South American | 636 | 0.2% |
| South American Indian | 28 | 0.0% |
| Spaniard | 709 | 0.3% |
| Spanish | 496 | 0.2% |
| Spanish American | 14 | 0.0% |
| Sri Lankan | 843 | 0.3% |
| Subsaharan African | 416 | 0.2% |
| Swedish | 1,305 | 0.5% |
| Swiss | 531 | 0.2% |
| Syrian | 22 | 0.0% |
| Taiwanese | 35 | 0.0% |
| Thai | 6,664 | 2.4% |
| Tohono O'Odham | 7 | 0.0% |
| Tongan | 308 | 0.1% |
| Tsimshian | 3 | 0.0% |
| Turkish | 35 | 0.0% |
| Ukrainian | 110 | 0.0% |
| Uruguayan | 36 | 0.0% |
| Venezuelan | 37 | 0.0% |
| Vietnamese | 2 | 0.0% |
| Welsh | 945 | 0.3% |
| Yaqui | 280 | 0.1% |
| Yugoslavian | 44 | 0.0% |
| Yuman | 22 | 0.0% |
| Yup'ik | 20 | 0.0% | View All 141 Rows |
Immigrants in Merced County
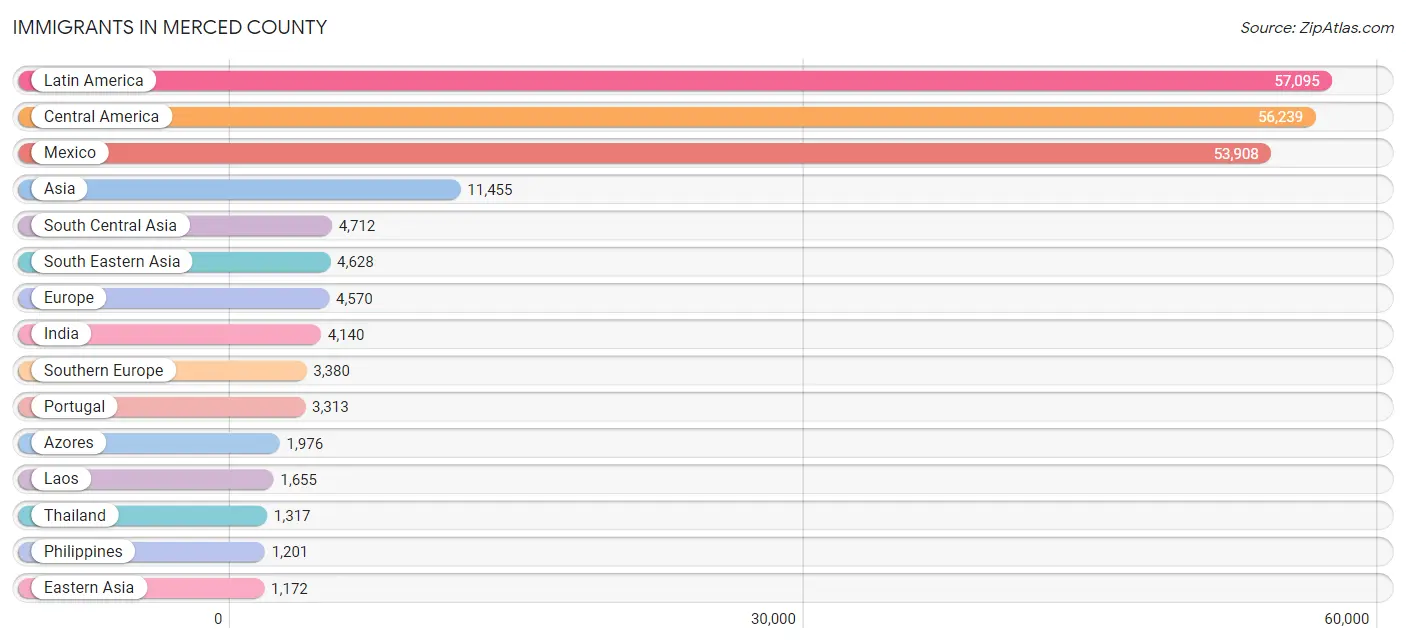
The most numerous immigrant groups reported in Merced County came from Latin America (57,095 | 20.2%), Central America (56,239 | 19.9%), Mexico (53,908 | 19.1%), Asia (11,455 | 4.1%), and South Central Asia (4,712 | 1.7%), together accounting for 65.0% of all Merced County residents.
| Immigration Origin | # Population | % Population |
| Afghanistan | 66 | 0.0% |
| Africa | 407 | 0.1% |
| Argentina | 64 | 0.0% |
| Armenia | 9 | 0.0% |
| Asia | 11,455 | 4.1% |
| Australia | 20 | 0.0% |
| Azores | 1,976 | 0.7% |
| Bangladesh | 83 | 0.0% |
| Belgium | 4 | 0.0% |
| Bolivia | 31 | 0.0% |
| Brazil | 104 | 0.0% |
| Cambodia | 23 | 0.0% |
| Canada | 251 | 0.1% |
| Caribbean | 36 | 0.0% |
| Central America | 56,239 | 19.9% |
| Chile | 17 | 0.0% |
| China | 616 | 0.2% |
| Colombia | 131 | 0.1% |
| Costa Rica | 242 | 0.1% |
| Cuba | 6 | 0.0% |
| Denmark | 5 | 0.0% |
| Eastern Africa | 92 | 0.0% |
| Eastern Asia | 1,172 | 0.4% |
| Eastern Europe | 93 | 0.0% |
| Ecuador | 29 | 0.0% |
| Egypt | 19 | 0.0% |
| El Salvador | 985 | 0.4% |
| England | 451 | 0.2% |
| Europe | 4,570 | 1.6% |
| Fiji | 204 | 0.1% |
| France | 29 | 0.0% |
| Germany | 280 | 0.1% |
| Guatemala | 646 | 0.2% |
| Honduras | 290 | 0.1% |
| Hong Kong | 34 | 0.0% |
| Hungary | 10 | 0.0% |
| India | 4,140 | 1.5% |
| Indonesia | 14 | 0.0% |
| Iran | 183 | 0.1% |
| Iraq | 47 | 0.0% |
| Ireland | 42 | 0.0% |
| Italy | 34 | 0.0% |
| Jamaica | 20 | 0.0% |
| Japan | 150 | 0.1% |
| Jordan | 2 | 0.0% |
| Kenya | 66 | 0.0% |
| Korea | 385 | 0.1% |
| Kuwait | 20 | 0.0% |
| Laos | 1,655 | 0.6% |
| Latin America | 57,095 | 20.2% |
| Latvia | 41 | 0.0% |
| Lebanon | 16 | 0.0% |
| Malaysia | 49 | 0.0% |
| Mexico | 53,908 | 19.1% |
| Middle Africa | 70 | 0.0% |
| Morocco | 11 | 0.0% |
| Netherlands | 51 | 0.0% |
| Nicaragua | 128 | 0.1% |
| Nigeria | 25 | 0.0% |
| Northern Africa | 35 | 0.0% |
| Northern Europe | 726 | 0.3% |
| Oceania | 383 | 0.1% |
| Pakistan | 240 | 0.1% |
| Panama | 40 | 0.0% |
| Peru | 267 | 0.1% |
| Philippines | 1,201 | 0.4% |
| Poland | 13 | 0.0% |
| Portugal | 3,313 | 1.2% |
| Romania | 9 | 0.0% |
| Russia | 8 | 0.0% |
| Scotland | 44 | 0.0% |
| Somalia | 18 | 0.0% |
| South Africa | 37 | 0.0% |
| South America | 820 | 0.3% |
| South Central Asia | 4,712 | 1.7% |
| South Eastern Asia | 4,628 | 1.6% |
| Southern Europe | 3,380 | 1.2% |
| Spain | 33 | 0.0% |
| Sweden | 114 | 0.0% |
| Switzerland | 7 | 0.0% |
| Syria | 103 | 0.0% |
| Taiwan | 111 | 0.0% |
| Thailand | 1,317 | 0.5% |
| Trinidad and Tobago | 10 | 0.0% |
| Turkey | 42 | 0.0% |
| Ukraine | 12 | 0.0% |
| Uruguay | 36 | 0.0% |
| Venezuela | 23 | 0.0% |
| Vietnam | 369 | 0.1% |
| Western Africa | 25 | 0.0% |
| Western Asia | 613 | 0.2% |
| Western Europe | 371 | 0.1% |
| Yemen | 315 | 0.1% |
| Zaire | 6 | 0.0% | View All 94 Rows |
Sex and Age in Merced County
Sex and Age in Merced County
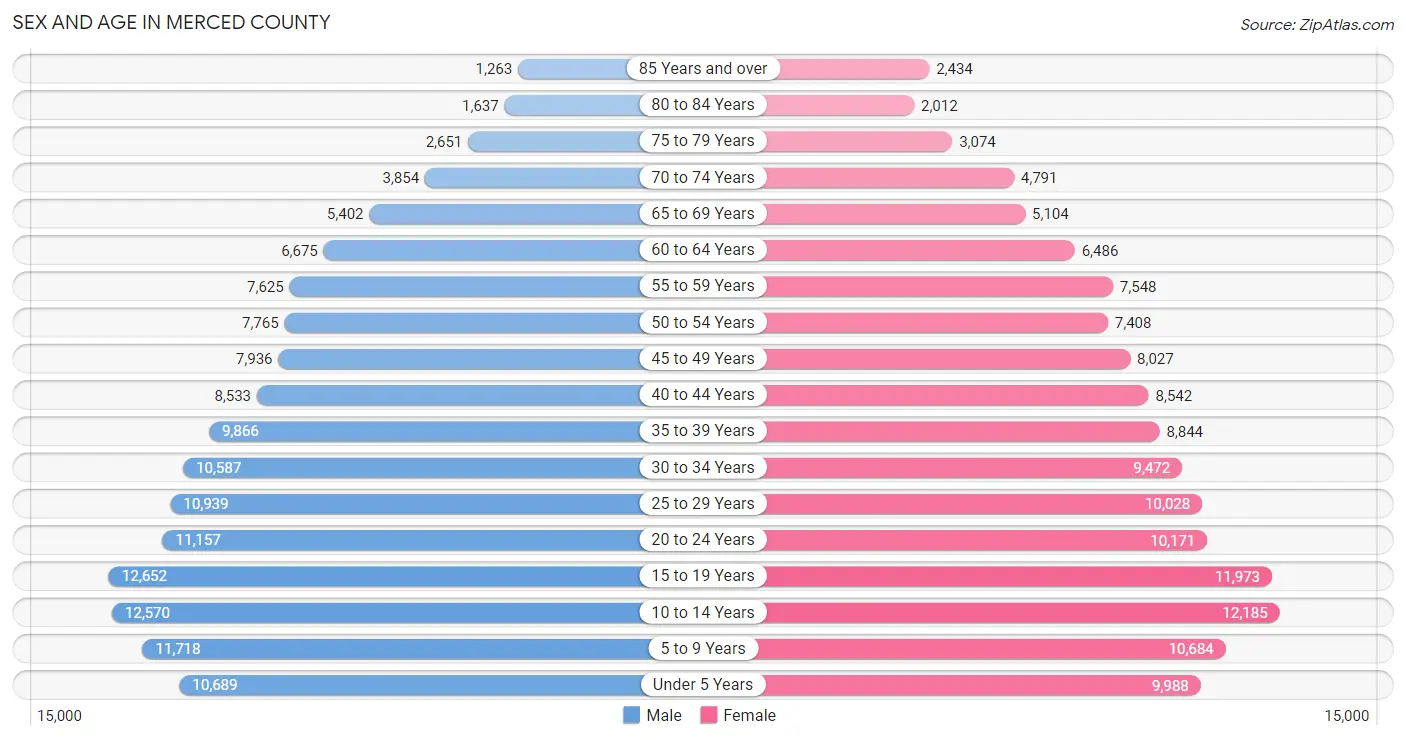
The most populous age groups in Merced County are 15 to 19 Years (12,652 | 8.8%) for men and 10 to 14 Years (12,185 | 8.8%) for women.
| Age Bracket | Male | Female |
| Under 5 Years | 10,689 (7.4%) | 9,988 (7.2%) |
| 5 to 9 Years | 11,718 (8.2%) | 10,684 (7.7%) |
| 10 to 14 Years | 12,570 (8.8%) | 12,185 (8.8%) |
| 15 to 19 Years | 12,652 (8.8%) | 11,973 (8.6%) |
| 20 to 24 Years | 11,157 (7.8%) | 10,171 (7.3%) |
| 25 to 29 Years | 10,939 (7.6%) | 10,028 (7.2%) |
| 30 to 34 Years | 10,587 (7.4%) | 9,472 (6.8%) |
| 35 to 39 Years | 9,866 (6.9%) | 8,844 (6.4%) |
| 40 to 44 Years | 8,533 (5.9%) | 8,542 (6.2%) |
| 45 to 49 Years | 7,936 (5.5%) | 8,027 (5.8%) |
| 50 to 54 Years | 7,765 (5.4%) | 7,408 (5.3%) |
| 55 to 59 Years | 7,625 (5.3%) | 7,548 (5.4%) |
| 60 to 64 Years | 6,675 (4.6%) | 6,486 (4.7%) |
| 65 to 69 Years | 5,402 (3.8%) | 5,104 (3.7%) |
| 70 to 74 Years | 3,854 (2.7%) | 4,791 (3.5%) |
| 75 to 79 Years | 2,651 (1.8%) | 3,074 (2.2%) |
| 80 to 84 Years | 1,637 (1.1%) | 2,012 (1.5%) |
| 85 Years and over | 1,263 (0.9%) | 2,434 (1.8%) |
| Total | 143,519 (100.0%) | 138,771 (100.0%) |
Families and Households in Merced County
Median Family Size in Merced County
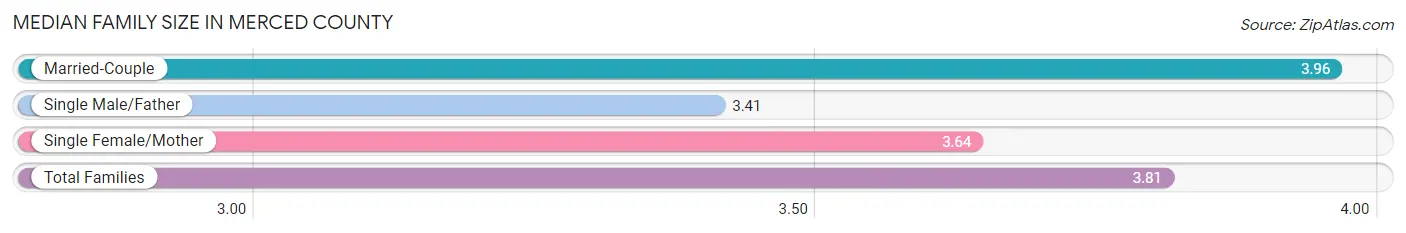
The median family size in Merced County is 3.81 persons per family, with married-couple families (40,383 | 64.0%) accounting for the largest median family size of 3.96 persons per family. On the other hand, single male/father families (7,845 | 12.4%) represent the smallest median family size with 3.41 persons per family.
| Family Type | # Families | Family Size |
| Married-Couple | 40,383 (64.0%) | 3.96 |
| Single Male/Father | 7,845 (12.4%) | 3.41 |
| Single Female/Mother | 14,850 (23.5%) | 3.64 |
| Total Families | 63,078 (100.0%) | 3.81 |
Median Household Size in Merced County
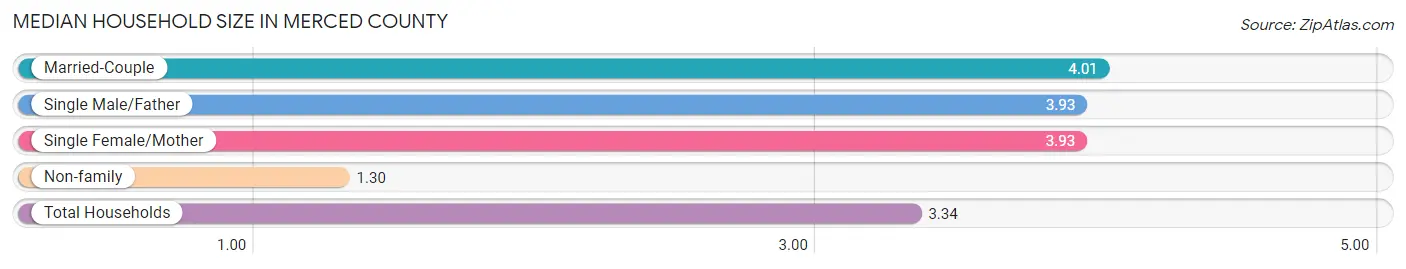
The median household size in Merced County is 3.34 persons per household, with married-couple households (40,383 | 48.8%) accounting for the largest median household size of 4.01 persons per household. non-family households (19,682 | 23.8%) represent the smallest median household size with 1.30 persons per household.
| Household Type | # Households | Household Size |
| Married-Couple | 40,383 (48.8%) | 4.01 |
| Single Male/Father | 7,845 (9.5%) | 3.93 |
| Single Female/Mother | 14,850 (17.9%) | 3.93 |
| Non-family | 19,682 (23.8%) | 1.30 |
| Total Households | 82,760 (100.0%) | 3.34 |
Household Size by Marriage Status in Merced County
Out of a total of 82,760 households in Merced County, 63,078 (76.2%) are family households, while 19,682 (23.8%) are nonfamily households. The most numerous type of family households are 2-person households, comprising 19,085, and the most common type of nonfamily households are 1-person households, comprising 16,063.
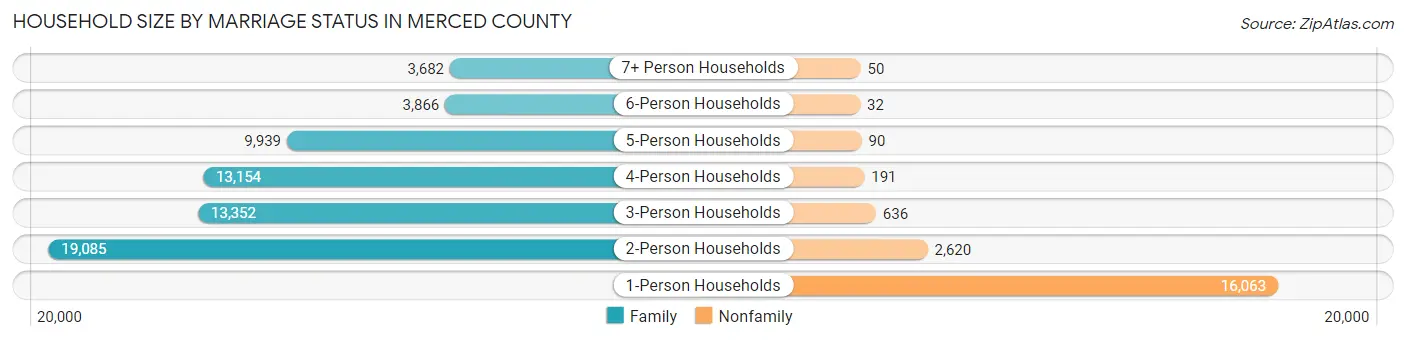
| Household Size | Family Households | Nonfamily Households |
| 1-Person Households | - | 16,063 (19.4%) |
| 2-Person Households | 19,085 (23.1%) | 2,620 (3.2%) |
| 3-Person Households | 13,352 (16.1%) | 636 (0.8%) |
| 4-Person Households | 13,154 (15.9%) | 191 (0.2%) |
| 5-Person Households | 9,939 (12.0%) | 90 (0.1%) |
| 6-Person Households | 3,866 (4.7%) | 32 (0.0%) |
| 7+ Person Households | 3,682 (4.4%) | 50 (0.1%) |
| Total | 63,078 (76.2%) | 19,682 (23.8%) |
Female Fertility in Merced County
Fertility by Age in Merced County
Average fertility rate in Merced County is 58.0 births per 1,000 women. Women in the age bracket of 20 to 34 years have the highest fertility rate with 96.0 births per 1,000 women. Women in the age bracket of 20 to 34 years acount for 71.5% of all women with births.
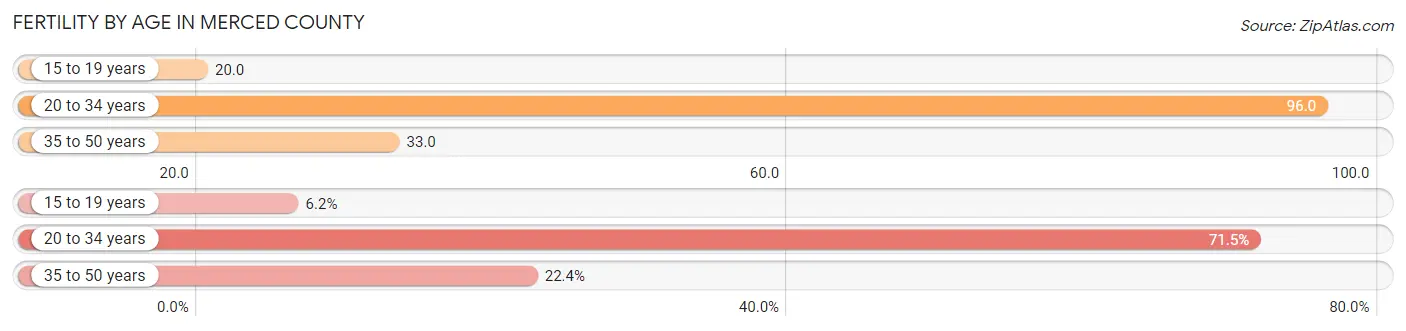
| Age Bracket | Women with Births | Births / 1,000 Women |
| 15 to 19 years | 245 (6.1%) | 20.0 |
| 20 to 34 years | 2,846 (71.5%) | 96.0 |
| 35 to 50 years | 891 (22.4%) | 33.0 |
| Total | 3,982 (100.0%) | 58.0 |
Fertility by Age by Marriage Status in Merced County
55.3% of women with births (3,982) in Merced County are married. The highest percentage of unmarried women with births falls into 15 to 19 years age bracket with 88.6% of them unmarried at the time of birth, while the lowest percentage of unmarried women with births belong to 35 to 50 years age bracket with 27.2% of them unmarried.
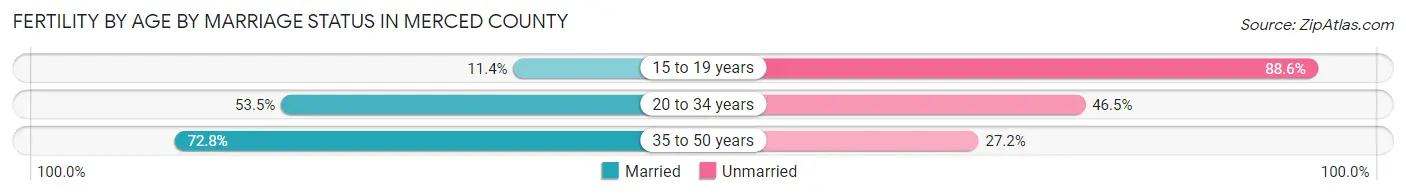
| Age Bracket | Married | Unmarried |
| 15 to 19 years | 28 (11.4%) | 217 (88.6%) |
| 20 to 34 years | 1,523 (53.5%) | 1,323 (46.5%) |
| 35 to 50 years | 649 (72.8%) | 242 (27.2%) |
| Total | 2,202 (55.3%) | 1,780 (44.7%) |
Fertility by Education in Merced County
Average fertility rate in Merced County is 58.0 births per 1,000 women. Women with the education attainment of graduate degree have the highest fertility rate of 79.0 births per 1,000 women, while women with the education attainment of less than high school have the lowest fertility at 30.0 births per 1,000 women. Women with the education attainment of college or associate's degree represent 40.5% of all women with births.
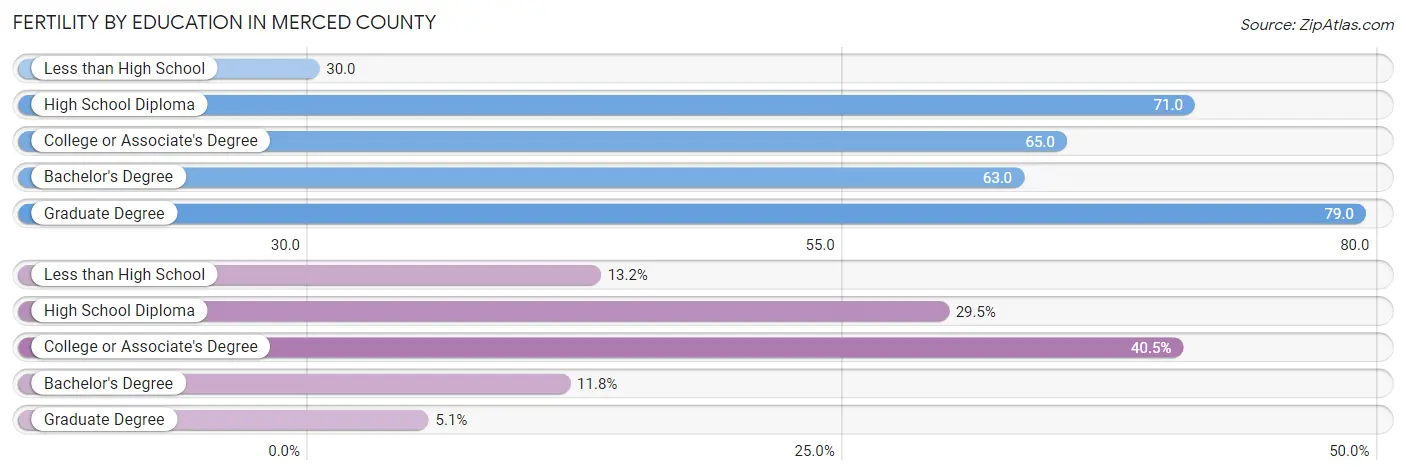
| Educational Attainment | Women with Births | Births / 1,000 Women |
| Less than High School | 525 (13.2%) | 30.0 |
| High School Diploma | 1,174 (29.5%) | 71.0 |
| College or Associate's Degree | 1,611 (40.5%) | 65.0 |
| Bachelor's Degree | 468 (11.7%) | 63.0 |
| Graduate Degree | 204 (5.1%) | 79.0 |
| Total | 3,982 (100.0%) | 58.0 |
Fertility by Education by Marriage Status in Merced County
44.7% of women with births in Merced County are unmarried. Women with the educational attainment of bachelor's degree are most likely to be married with 73.3% of them married at childbirth, while women with the educational attainment of high school diploma are least likely to be married with 54.8% of them unmarried at childbirth.
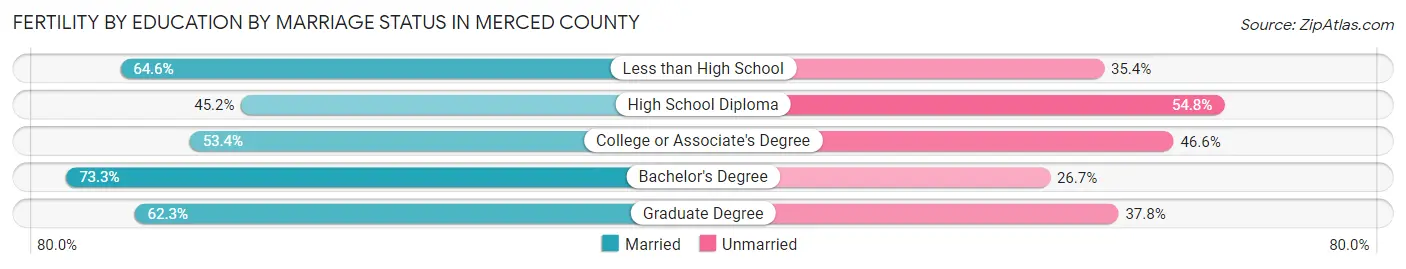
| Educational Attainment | Married | Unmarried |
| Less than High School | 339 (64.6%) | 186 (35.4%) |
| High School Diploma | 531 (45.2%) | 643 (54.8%) |
| College or Associate's Degree | 860 (53.4%) | 751 (46.6%) |
| Bachelor's Degree | 343 (73.3%) | 125 (26.7%) |
| Graduate Degree | 127 (62.3%) | 77 (37.8%) |
| Total | 2,202 (55.3%) | 1,780 (44.7%) |
Employment Characteristics in Merced County
Employment by Class of Employer in Merced County
Among the 106,381 employed individuals in Merced County, private company employees (74,130 | 69.7%), local government employees (12,202 | 11.5%), and self-employed (not incorporated) (6,461 | 6.1%) make up the most common classes of employment.
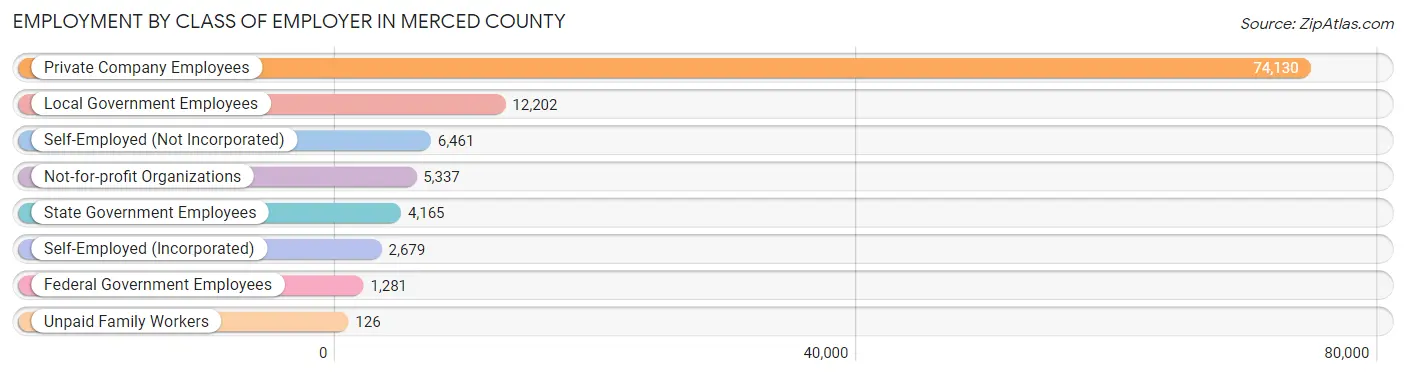
| Employer Class | # Employees | % Employees |
| Private Company Employees | 74,130 | 69.7% |
| Self-Employed (Incorporated) | 2,679 | 2.5% |
| Self-Employed (Not Incorporated) | 6,461 | 6.1% |
| Not-for-profit Organizations | 5,337 | 5.0% |
| Local Government Employees | 12,202 | 11.5% |
| State Government Employees | 4,165 | 3.9% |
| Federal Government Employees | 1,281 | 1.2% |
| Unpaid Family Workers | 126 | 0.1% |
| Total | 106,381 | 100.0% |
Employment Status by Age in Merced County
According to the labor force statistics for Merced County, out of the total population over 16 years of age (209,553), 59.3% or 124,265 individuals are in the labor force, with 10.7% or 13,296 of them unemployed. The age group with the highest labor force participation rate is 25 to 29 years, with 79.0% or 16,564 individuals in the labor force. Within the labor force, the 16 to 19 years age range has the highest percentage of unemployed individuals, with 32.9% or 1,953 of them being unemployed.
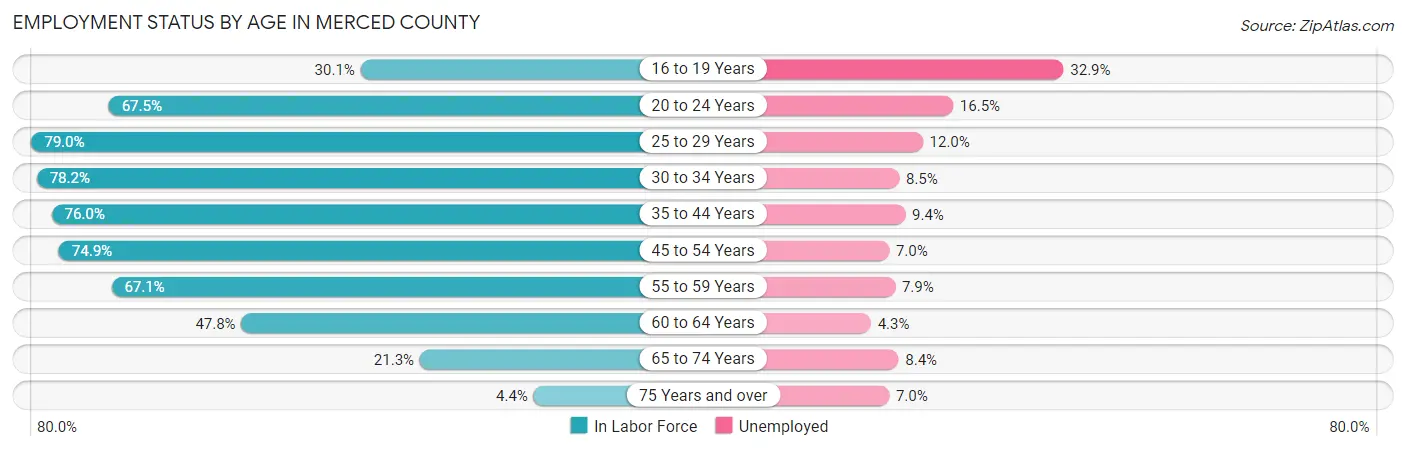
| Age Bracket | In Labor Force | Unemployed |
| 16 to 19 Years | 5,936 (30.1%) | 1,953 (32.9%) |
| 20 to 24 Years | 14,396 (67.5%) | 2,375 (16.5%) |
| 25 to 29 Years | 16,564 (79.0%) | 1,988 (12.0%) |
| 30 to 34 Years | 15,686 (78.2%) | 1,333 (8.5%) |
| 35 to 44 Years | 27,197 (76.0%) | 2,557 (9.4%) |
| 45 to 54 Years | 23,321 (74.9%) | 1,632 (7.0%) |
| 55 to 59 Years | 10,181 (67.1%) | 804 (7.9%) |
| 60 to 64 Years | 6,291 (47.8%) | 271 (4.3%) |
| 65 to 74 Years | 4,079 (21.3%) | 343 (8.4%) |
| 75 Years and over | 575 (4.4%) | 40 (7.0%) |
| Total | 124,265 (59.3%) | 13,296 (10.7%) |
Employment Status by Educational Attainment in Merced County
According to labor force statistics for Merced County, 72.8% of individuals (99,213) out of the total population between 25 and 64 years of age (136,281) are in the labor force, with 8.7% or 8,632 of them being unemployed. The group with the highest labor force participation rate are those with the educational attainment of bachelor's degree or higher, with 84.0% or 16,555 individuals in the labor force. Within the labor force, individuals with less than high school education have the highest percentage of unemployment, with 11.1% or 2,716 of them being unemployed.
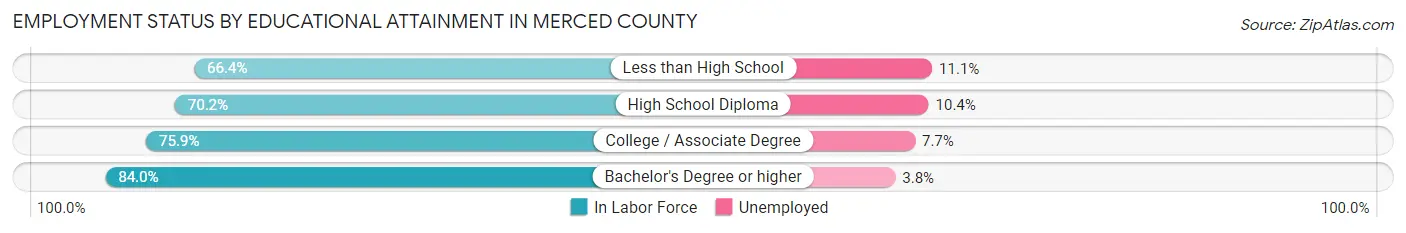
| Educational Attainment | In Labor Force | Unemployed |
| Less than High School | 24,468 (66.4%) | 4,090 (11.1%) |
| High School Diploma | 27,683 (70.2%) | 4,101 (10.4%) |
| College / Associate Degree | 30,580 (75.9%) | 3,102 (7.7%) |
| Bachelor's Degree or higher | 16,555 (84.0%) | 749 (3.8%) |
| Total | 99,213 (72.8%) | 11,856 (8.7%) |
Employment Occupations by Sex in Merced County
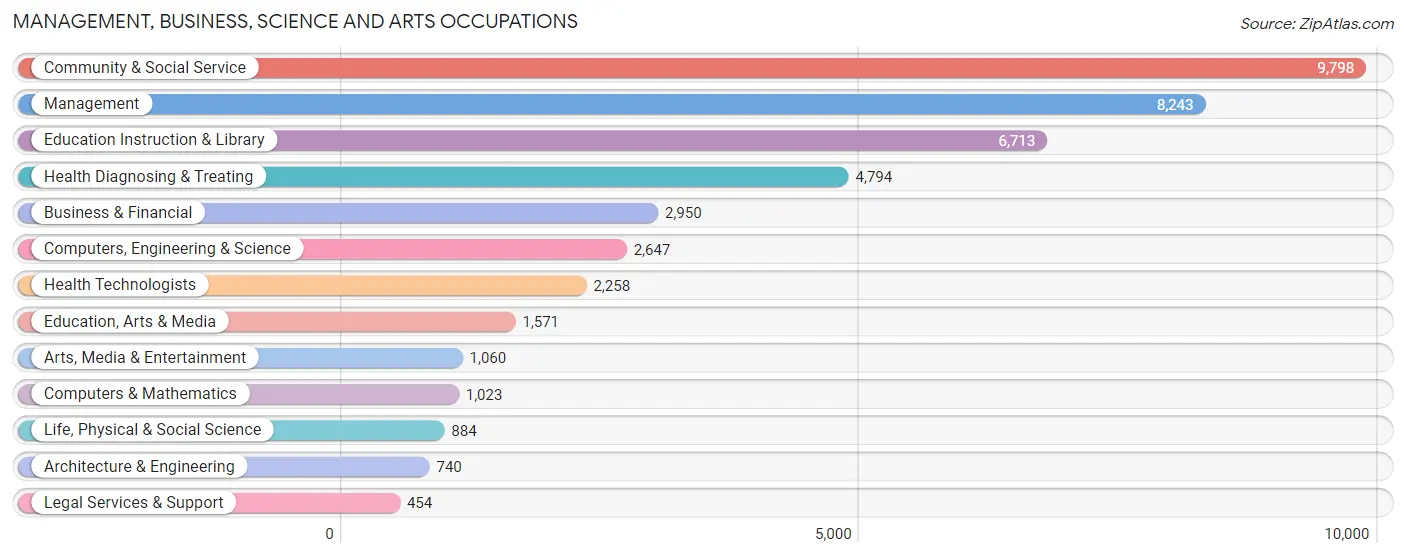
Management, Business, Science and Arts Occupations
The most common Management, Business, Science and Arts occupations in Merced County are Community & Social Service (9,798 | 8.8%), Management (8,243 | 7.4%), Education Instruction & Library (6,713 | 6.1%), Health Diagnosing & Treating (4,794 | 4.3%), and Business & Financial (2,950 | 2.7%).
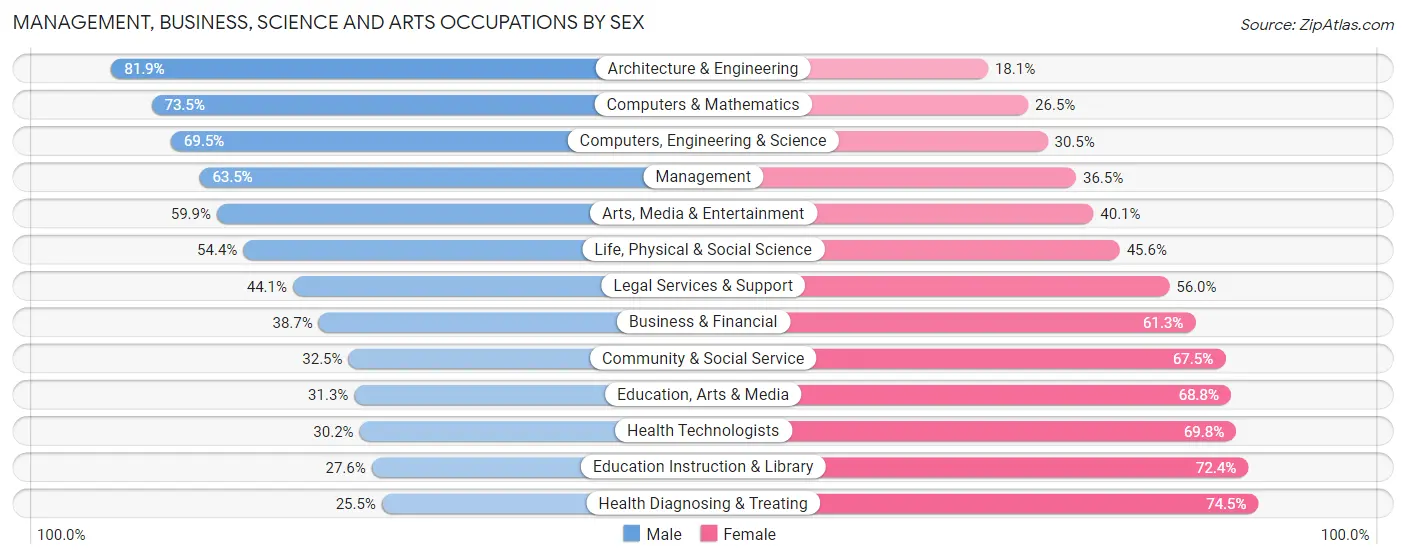
Management, Business, Science and Arts Occupations by Sex
Within the Management, Business, Science and Arts occupations in Merced County, the most male-oriented occupations are Architecture & Engineering (81.9%), Computers & Mathematics (73.5%), and Computers, Engineering & Science (69.5%), while the most female-oriented occupations are Health Diagnosing & Treating (74.5%), Education Instruction & Library (72.4%), and Health Technologists (69.8%).
| Occupation | Male | Female |
| Management | 5,236 (63.5%) | 3,007 (36.5%) |
| Business & Financial | 1,141 (38.7%) | 1,809 (61.3%) |
| Computers, Engineering & Science | 1,839 (69.5%) | 808 (30.5%) |
| Computers & Mathematics | 752 (73.5%) | 271 (26.5%) |
| Architecture & Engineering | 606 (81.9%) | 134 (18.1%) |
| Life, Physical & Social Science | 481 (54.4%) | 403 (45.6%) |
| Community & Social Service | 3,180 (32.5%) | 6,618 (67.5%) |
| Education, Arts & Media | 491 (31.2%) | 1,080 (68.8%) |
| Legal Services & Support | 200 (44.1%) | 254 (55.9%) |
| Education Instruction & Library | 1,854 (27.6%) | 4,859 (72.4%) |
| Arts, Media & Entertainment | 635 (59.9%) | 425 (40.1%) |
| Health Diagnosing & Treating | 1,223 (25.5%) | 3,571 (74.5%) |
| Health Technologists | 681 (30.2%) | 1,577 (69.8%) |
| Total (Category) | 12,619 (44.4%) | 15,813 (55.6%) |
| Total (Overall) | 65,069 (58.8%) | 45,643 (41.2%) |
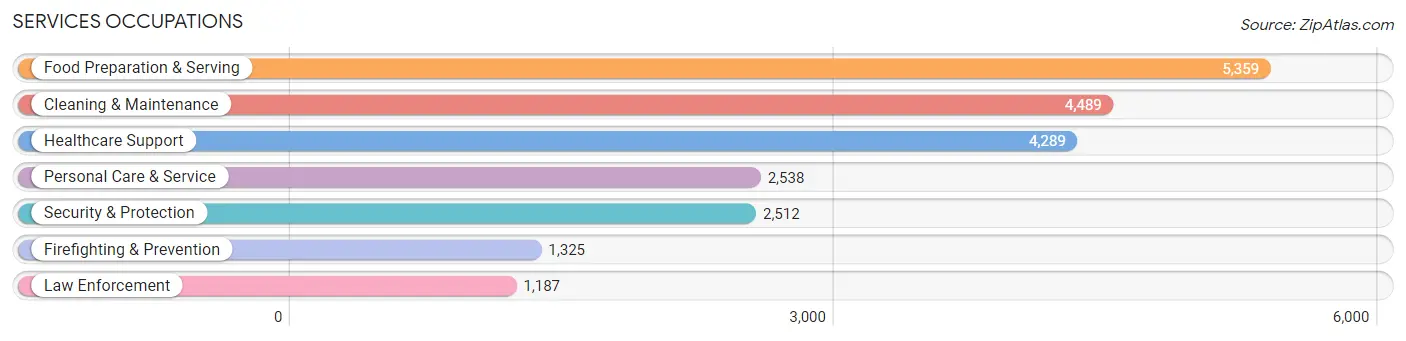
Services Occupations
The most common Services occupations in Merced County are Food Preparation & Serving (5,359 | 4.8%), Cleaning & Maintenance (4,489 | 4.1%), Healthcare Support (4,289 | 3.9%), Personal Care & Service (2,538 | 2.3%), and Security & Protection (2,512 | 2.3%).
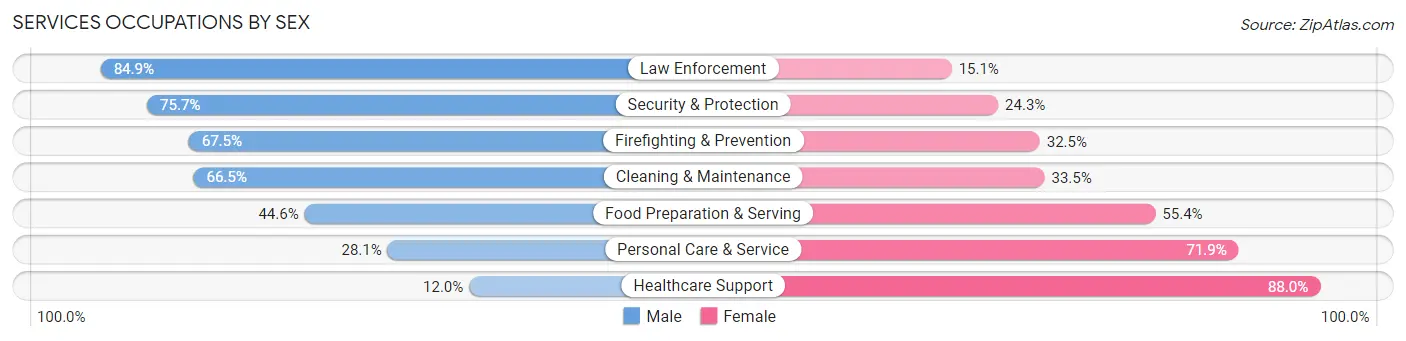
Services Occupations by Sex
Within the Services occupations in Merced County, the most male-oriented occupations are Law Enforcement (84.9%), Security & Protection (75.7%), and Firefighting & Prevention (67.5%), while the most female-oriented occupations are Healthcare Support (88.0%), Personal Care & Service (71.9%), and Food Preparation & Serving (55.4%).
| Occupation | Male | Female |
| Healthcare Support | 514 (12.0%) | 3,775 (88.0%) |
| Security & Protection | 1,902 (75.7%) | 610 (24.3%) |
| Firefighting & Prevention | 894 (67.5%) | 431 (32.5%) |
| Law Enforcement | 1,008 (84.9%) | 179 (15.1%) |
| Food Preparation & Serving | 2,389 (44.6%) | 2,970 (55.4%) |
| Cleaning & Maintenance | 2,987 (66.5%) | 1,502 (33.5%) |
| Personal Care & Service | 714 (28.1%) | 1,824 (71.9%) |
| Total (Category) | 8,506 (44.3%) | 10,681 (55.7%) |
| Total (Overall) | 65,069 (58.8%) | 45,643 (41.2%) |
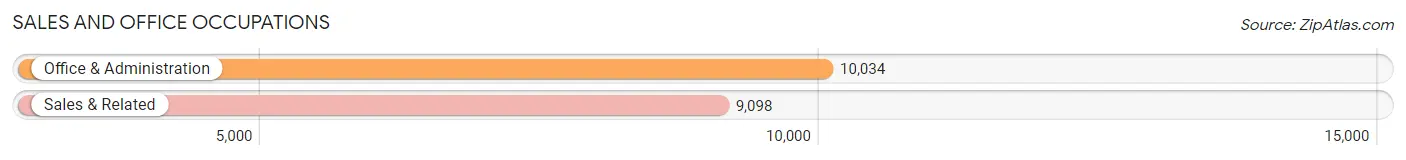
Sales and Office Occupations
The most common Sales and Office occupations in Merced County are Office & Administration (10,034 | 9.1%), and Sales & Related (9,098 | 8.2%).
Sales and Office Occupations by Sex
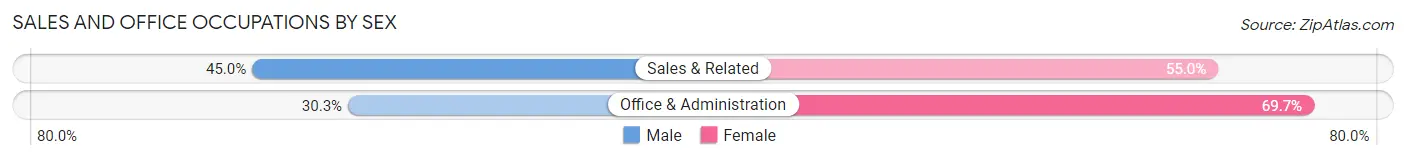
| Occupation | Male | Female |
| Sales & Related | 4,095 (45.0%) | 5,003 (55.0%) |
| Office & Administration | 3,036 (30.3%) | 6,998 (69.7%) |
| Total (Category) | 7,131 (37.3%) | 12,001 (62.7%) |
| Total (Overall) | 65,069 (58.8%) | 45,643 (41.2%) |
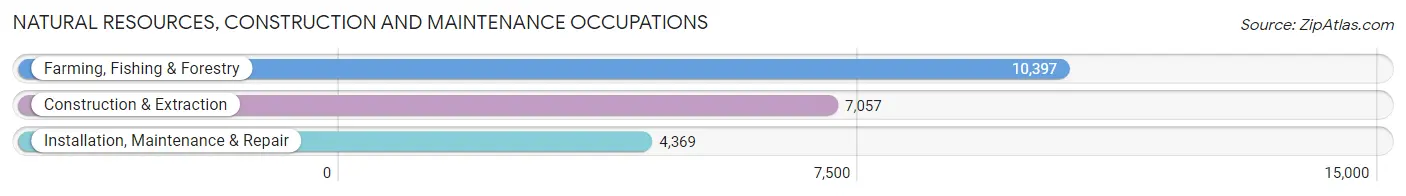
Natural Resources, Construction and Maintenance Occupations
The most common Natural Resources, Construction and Maintenance occupations in Merced County are Farming, Fishing & Forestry (10,397 | 9.4%), Construction & Extraction (7,057 | 6.4%), and Installation, Maintenance & Repair (4,369 | 4.0%).
Natural Resources, Construction and Maintenance Occupations by Sex
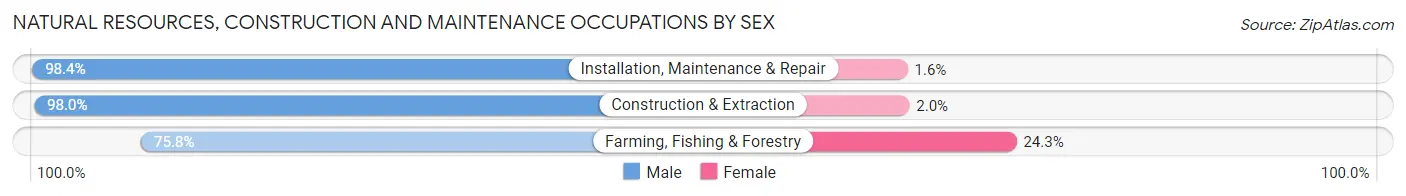
| Occupation | Male | Female |
| Farming, Fishing & Forestry | 7,876 (75.7%) | 2,521 (24.2%) |
| Construction & Extraction | 6,918 (98.0%) | 139 (2.0%) |
| Installation, Maintenance & Repair | 4,299 (98.4%) | 70 (1.6%) |
| Total (Category) | 19,093 (87.5%) | 2,730 (12.5%) |
| Total (Overall) | 65,069 (58.8%) | 45,643 (41.2%) |
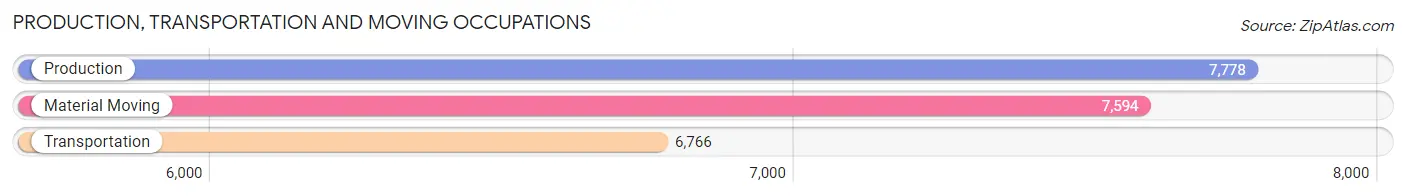
Production, Transportation and Moving Occupations
The most common Production, Transportation and Moving occupations in Merced County are Production (7,778 | 7.0%), Material Moving (7,594 | 6.9%), and Transportation (6,766 | 6.1%).
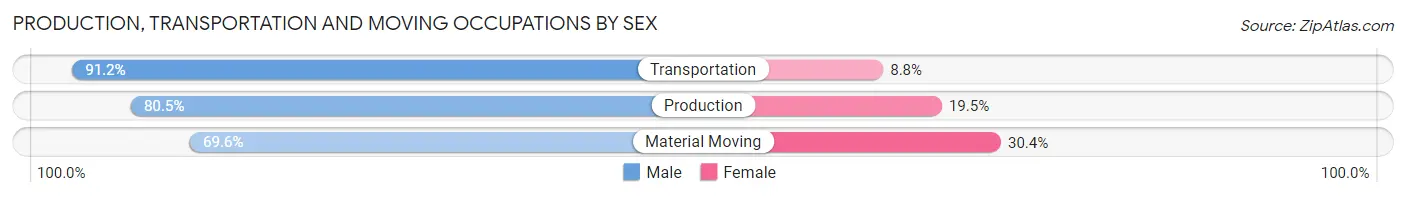
Production, Transportation and Moving Occupations by Sex
| Occupation | Male | Female |
| Production | 6,259 (80.5%) | 1,519 (19.5%) |
| Transportation | 6,173 (91.2%) | 593 (8.8%) |
| Material Moving | 5,288 (69.6%) | 2,306 (30.4%) |
| Total (Category) | 17,720 (80.0%) | 4,418 (20.0%) |
| Total (Overall) | 65,069 (58.8%) | 45,643 (41.2%) |
Employment Industries by Sex in Merced County
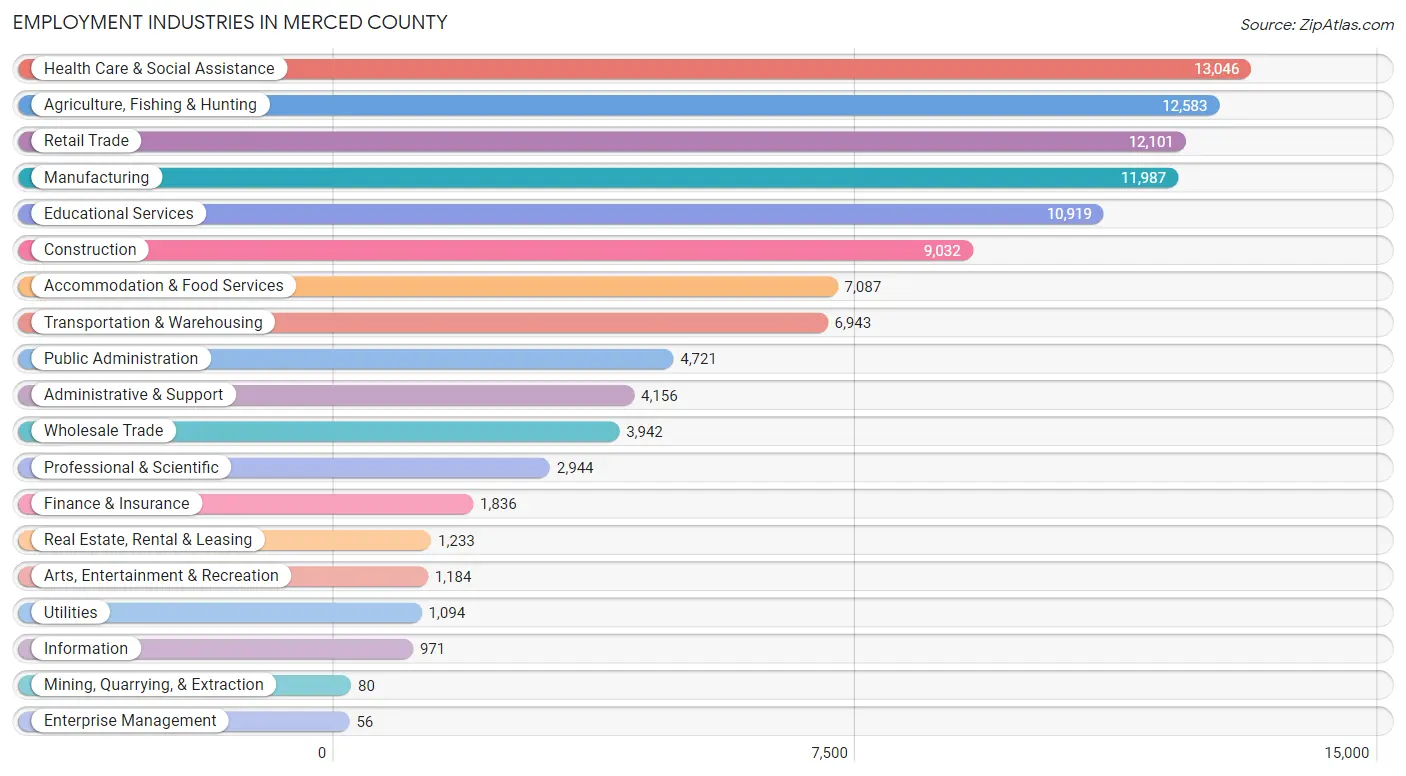
Employment Industries in Merced County
The major employment industries in Merced County include Health Care & Social Assistance (13,046 | 11.8%), Agriculture, Fishing & Hunting (12,583 | 11.4%), Retail Trade (12,101 | 10.9%), Manufacturing (11,987 | 10.8%), and Educational Services (10,919 | 9.9%).
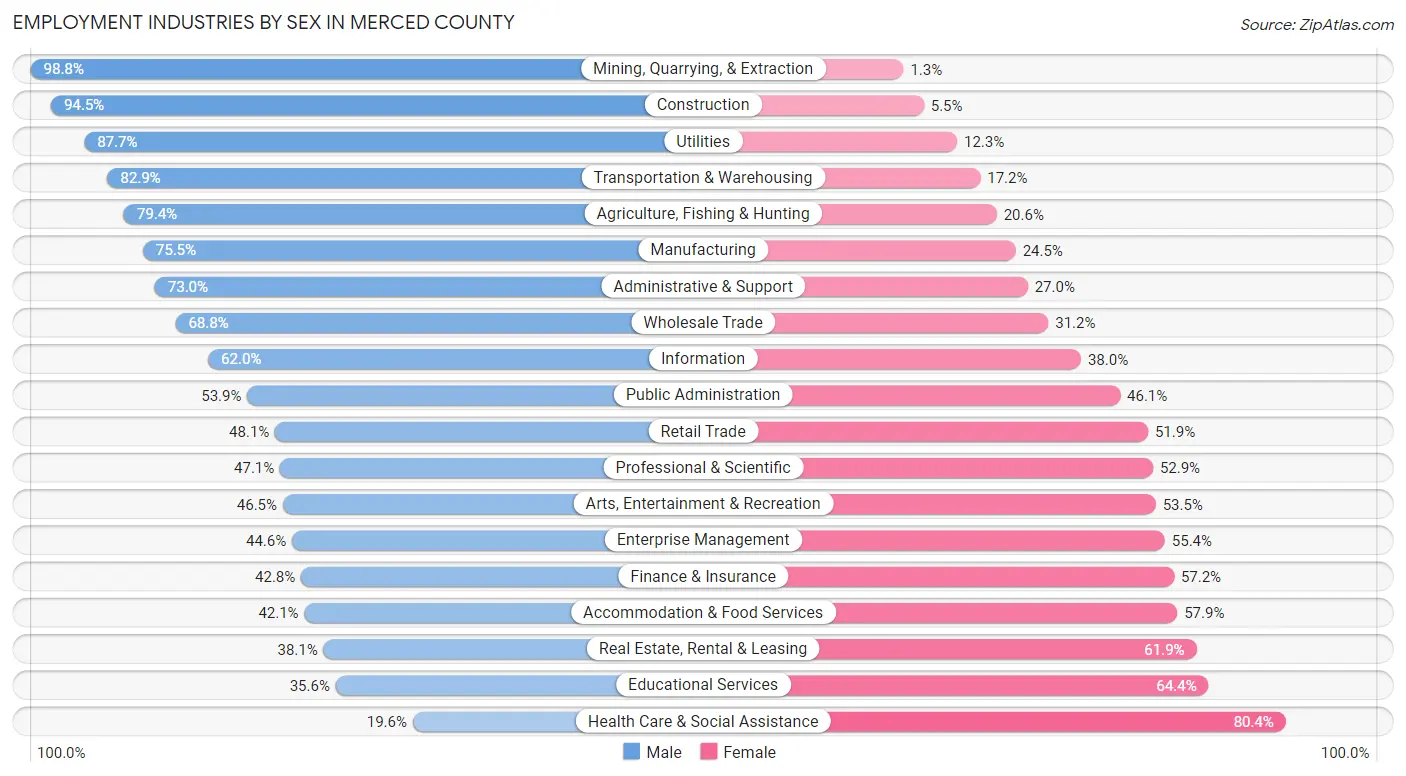
Employment Industries by Sex in Merced County
The Merced County industries that see more men than women are Mining, Quarrying, & Extraction (98.8%), Construction (94.5%), and Utilities (87.7%), whereas the industries that tend to have a higher number of women are Health Care & Social Assistance (80.4%), Educational Services (64.4%), and Real Estate, Rental & Leasing (61.9%).
| Industry | Male | Female |
| Agriculture, Fishing & Hunting | 9,996 (79.4%) | 2,587 (20.6%) |
| Mining, Quarrying, & Extraction | 79 (98.8%) | 1 (1.3%) |
| Construction | 8,539 (94.5%) | 493 (5.5%) |
| Manufacturing | 9,052 (75.5%) | 2,935 (24.5%) |
| Wholesale Trade | 2,711 (68.8%) | 1,231 (31.2%) |
| Retail Trade | 5,825 (48.1%) | 6,276 (51.9%) |
| Transportation & Warehousing | 5,752 (82.9%) | 1,191 (17.2%) |
| Utilities | 959 (87.7%) | 135 (12.3%) |
| Information | 602 (62.0%) | 369 (38.0%) |
| Finance & Insurance | 785 (42.8%) | 1,051 (57.2%) |
| Real Estate, Rental & Leasing | 470 (38.1%) | 763 (61.9%) |
| Professional & Scientific | 1,387 (47.1%) | 1,557 (52.9%) |
| Enterprise Management | 25 (44.6%) | 31 (55.4%) |
| Administrative & Support | 3,035 (73.0%) | 1,121 (27.0%) |
| Educational Services | 3,887 (35.6%) | 7,032 (64.4%) |
| Health Care & Social Assistance | 2,562 (19.6%) | 10,484 (80.4%) |
| Arts, Entertainment & Recreation | 551 (46.5%) | 633 (53.5%) |
| Accommodation & Food Services | 2,982 (42.1%) | 4,105 (57.9%) |
| Public Administration | 2,545 (53.9%) | 2,176 (46.1%) |
| Total | 65,069 (58.8%) | 45,643 (41.2%) |
Education in Merced County
School Enrollment in Merced County
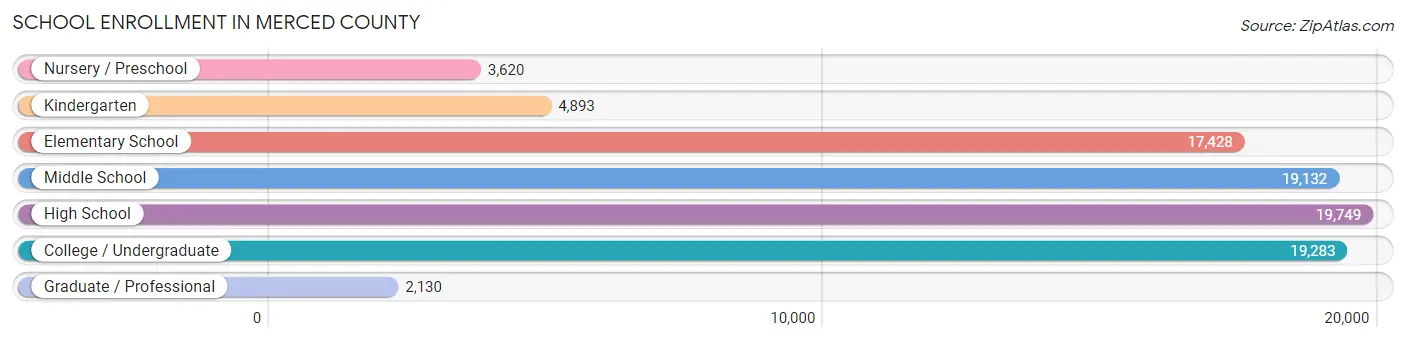
The most common levels of schooling among the 86,235 students in Merced County are high school (19,749 | 22.9%), college / undergraduate (19,283 | 22.4%), and middle school (19,132 | 22.2%).
| School Level | # Students | % Students |
| Nursery / Preschool | 3,620 | 4.2% |
| Kindergarten | 4,893 | 5.7% |
| Elementary School | 17,428 | 20.2% |
| Middle School | 19,132 | 22.2% |
| High School | 19,749 | 22.9% |
| College / Undergraduate | 19,283 | 22.4% |
| Graduate / Professional | 2,130 | 2.5% |
| Total | 86,235 | 100.0% |
School Enrollment by Age by Funding Source in Merced County
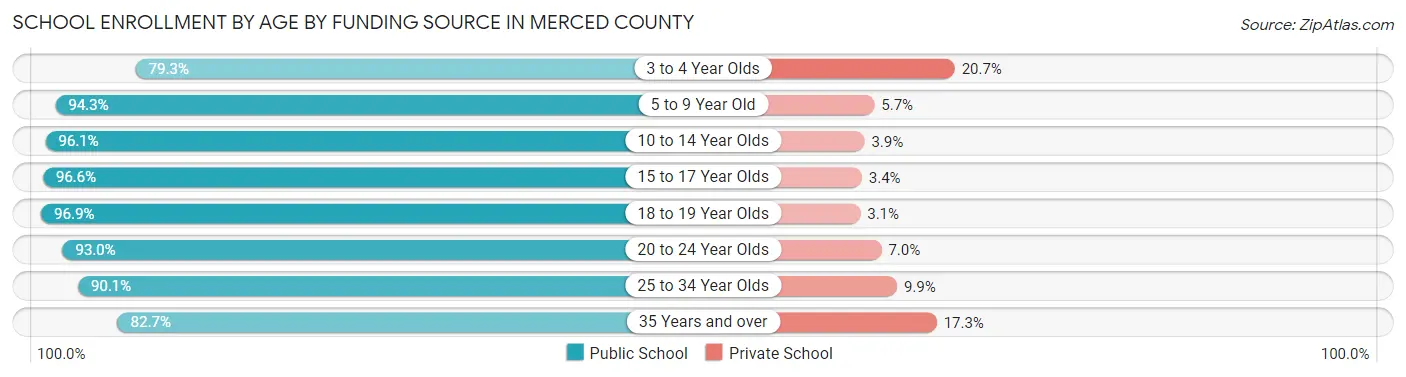
Out of a total of 86,235 students who are enrolled in schools in Merced County, 5,088 (5.9%) attend a private institution, while the remaining 81,147 (94.1%) are enrolled in public schools. The age group of 3 to 4 year olds has the highest likelihood of being enrolled in private schools, with 626 (20.7% in the age bracket) enrolled. Conversely, the age group of 18 to 19 year olds has the lowest likelihood of being enrolled in a private school, with 6,817 (96.9% in the age bracket) attending a public institution.
| Age Bracket | Public School | Private School |
| 3 to 4 Year Olds | 2,401 (79.3%) | 626 (20.7%) |
| 5 to 9 Year Old | 20,233 (94.3%) | 1,228 (5.7%) |
| 10 to 14 Year Olds | 23,477 (96.1%) | 944 (3.9%) |
| 15 to 17 Year Olds | 13,539 (96.6%) | 475 (3.4%) |
| 18 to 19 Year Olds | 6,817 (96.9%) | 217 (3.1%) |
| 20 to 24 Year Olds | 7,921 (93.0%) | 600 (7.0%) |
| 25 to 34 Year Olds | 4,216 (90.1%) | 465 (9.9%) |
| 35 Years and over | 2,543 (82.7%) | 533 (17.3%) |
| Total | 81,147 (94.1%) | 5,088 (5.9%) |
Educational Attainment by Field of Study in Merced County
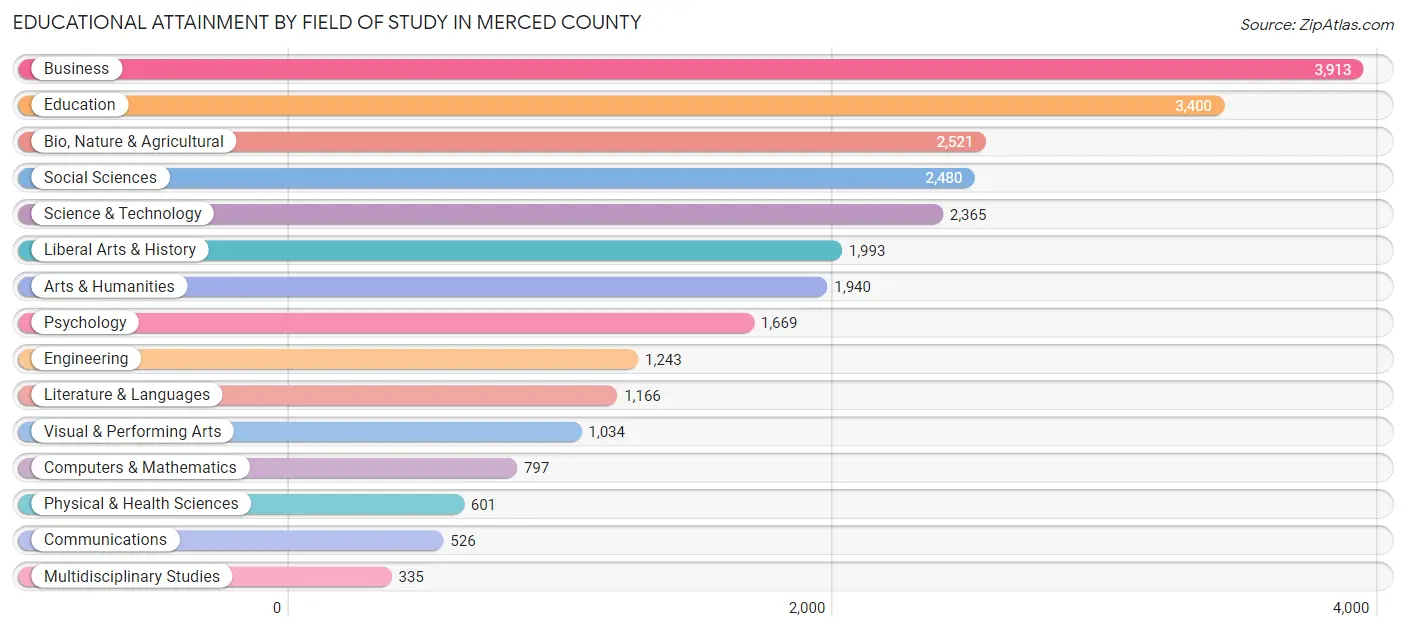
Business (3,913 | 15.1%), education (3,400 | 13.1%), bio, nature & agricultural (2,521 | 9.7%), social sciences (2,480 | 9.5%), and science & technology (2,365 | 9.1%) are the most common fields of study among 25,983 individuals in Merced County who have obtained a bachelor's degree or higher.
| Field of Study | # Graduates | % Graduates |
| Computers & Mathematics | 797 | 3.1% |
| Bio, Nature & Agricultural | 2,521 | 9.7% |
| Physical & Health Sciences | 601 | 2.3% |
| Psychology | 1,669 | 6.4% |
| Social Sciences | 2,480 | 9.5% |
| Engineering | 1,243 | 4.8% |
| Multidisciplinary Studies | 335 | 1.3% |
| Science & Technology | 2,365 | 9.1% |
| Business | 3,913 | 15.1% |
| Education | 3,400 | 13.1% |
| Literature & Languages | 1,166 | 4.5% |
| Liberal Arts & History | 1,993 | 7.7% |
| Visual & Performing Arts | 1,034 | 4.0% |
| Communications | 526 | 2.0% |
| Arts & Humanities | 1,940 | 7.5% |
| Total | 25,983 | 100.0% |
Transportation & Commute in Merced County
Vehicle Availability by Sex in Merced County
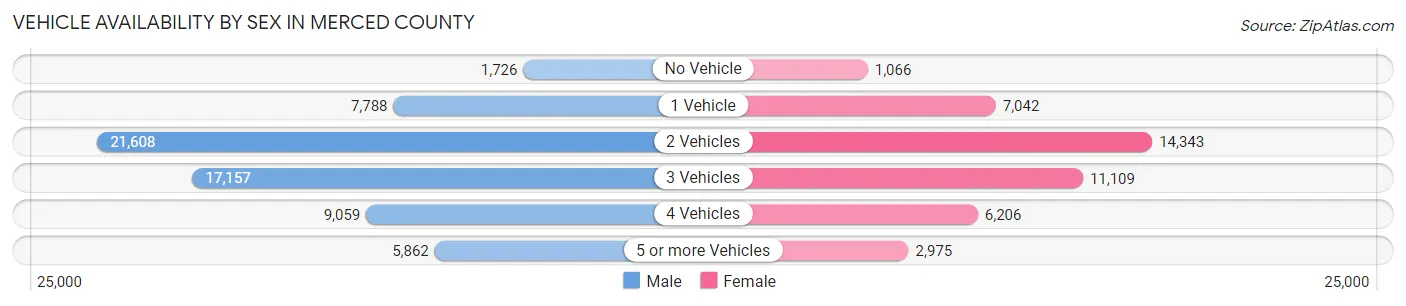
The most prevalent vehicle ownership categories in Merced County are males with 2 vehicles (21,608, accounting for 34.2%) and females with 2 vehicles (14,343, making up 50.6%).
| Vehicles Available | Male | Female |
| No Vehicle | 1,726 (2.7%) | 1,066 (2.5%) |
| 1 Vehicle | 7,788 (12.3%) | 7,042 (16.5%) |
| 2 Vehicles | 21,608 (34.2%) | 14,343 (33.6%) |
| 3 Vehicles | 17,157 (27.2%) | 11,109 (26.0%) |
| 4 Vehicles | 9,059 (14.3%) | 6,206 (14.5%) |
| 5 or more Vehicles | 5,862 (9.3%) | 2,975 (7.0%) |
| Total | 63,200 (100.0%) | 42,741 (100.0%) |
Commute Time in Merced County
The most frequently occuring commute durations in Merced County are 10 to 14 minutes (16,726 commuters, 16.6%), 15 to 19 minutes (15,210 commuters, 15.1%), and 5 to 9 minutes (14,416 commuters, 14.3%).
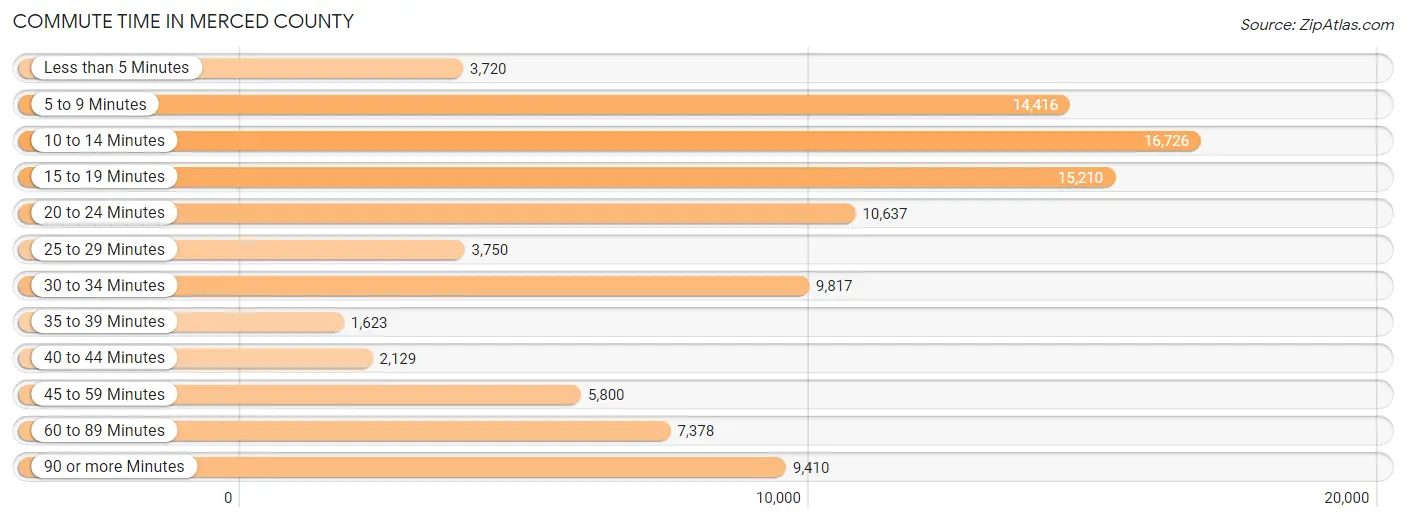
| Commute Time | # Commuters | % Commuters |
| Less than 5 Minutes | 3,720 | 3.7% |
| 5 to 9 Minutes | 14,416 | 14.3% |
| 10 to 14 Minutes | 16,726 | 16.6% |
| 15 to 19 Minutes | 15,210 | 15.1% |
| 20 to 24 Minutes | 10,637 | 10.6% |
| 25 to 29 Minutes | 3,750 | 3.7% |
| 30 to 34 Minutes | 9,817 | 9.8% |
| 35 to 39 Minutes | 1,623 | 1.6% |
| 40 to 44 Minutes | 2,129 | 2.1% |
| 45 to 59 Minutes | 5,800 | 5.8% |
| 60 to 89 Minutes | 7,378 | 7.3% |
| 90 or more Minutes | 9,410 | 9.3% |
Commute Time by Sex in Merced County
The most common commute times in Merced County are 10 to 14 minutes (8,831 commuters, 14.5%) for males and 10 to 14 minutes (7,895 commuters, 20.0%) for females.
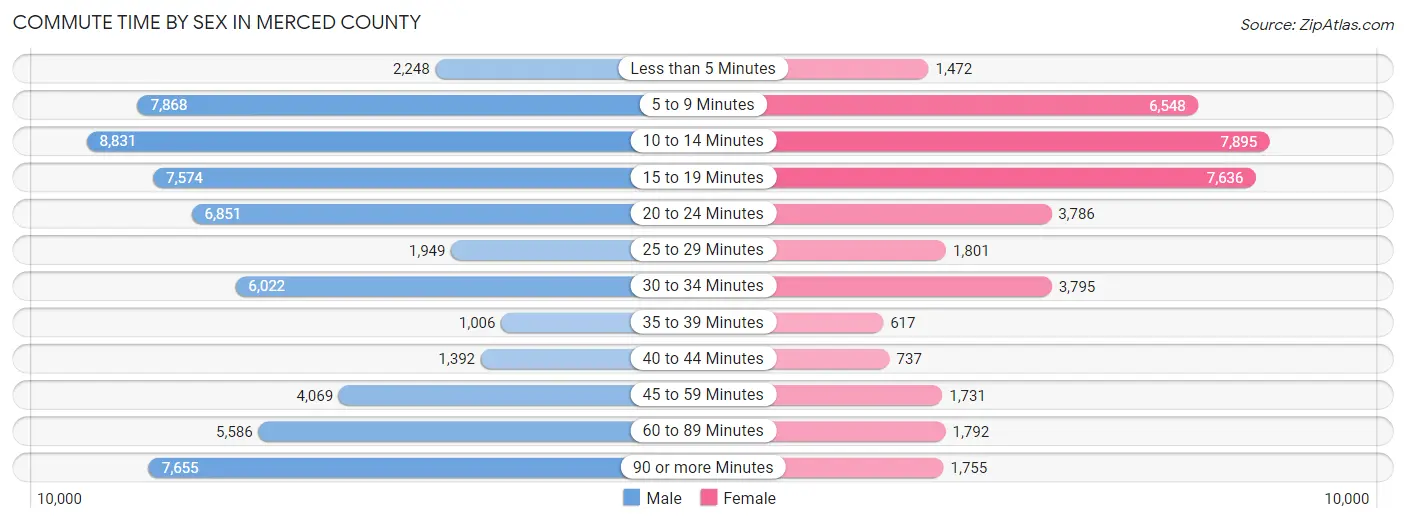
| Commute Time | Male | Female |
| Less than 5 Minutes | 2,248 (3.7%) | 1,472 (3.7%) |
| 5 to 9 Minutes | 7,868 (12.9%) | 6,548 (16.6%) |
| 10 to 14 Minutes | 8,831 (14.5%) | 7,895 (20.0%) |
| 15 to 19 Minutes | 7,574 (12.4%) | 7,636 (19.3%) |
| 20 to 24 Minutes | 6,851 (11.2%) | 3,786 (9.6%) |
| 25 to 29 Minutes | 1,949 (3.2%) | 1,801 (4.5%) |
| 30 to 34 Minutes | 6,022 (9.9%) | 3,795 (9.6%) |
| 35 to 39 Minutes | 1,006 (1.7%) | 617 (1.6%) |
| 40 to 44 Minutes | 1,392 (2.3%) | 737 (1.9%) |
| 45 to 59 Minutes | 4,069 (6.7%) | 1,731 (4.4%) |
| 60 to 89 Minutes | 5,586 (9.1%) | 1,792 (4.5%) |
| 90 or more Minutes | 7,655 (12.5%) | 1,755 (4.4%) |
Time of Departure to Work by Sex in Merced County
The most frequent times of departure to work in Merced County are 12:00 AM to 4:59 AM (11,134, 18.2%) for males and 7:30 AM to 7:59 AM (6,042, 15.3%) for females.
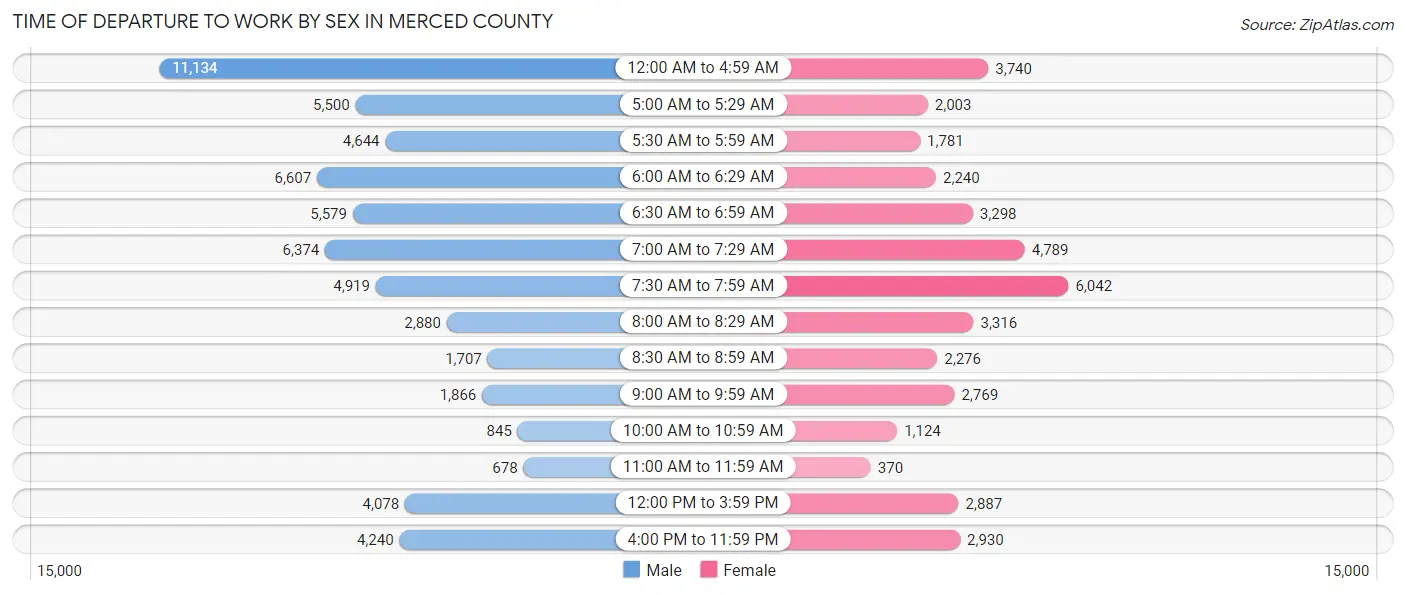
| Time of Departure | Male | Female |
| 12:00 AM to 4:59 AM | 11,134 (18.2%) | 3,740 (9.5%) |
| 5:00 AM to 5:29 AM | 5,500 (9.0%) | 2,003 (5.1%) |
| 5:30 AM to 5:59 AM | 4,644 (7.6%) | 1,781 (4.5%) |
| 6:00 AM to 6:29 AM | 6,607 (10.8%) | 2,240 (5.7%) |
| 6:30 AM to 6:59 AM | 5,579 (9.1%) | 3,298 (8.3%) |
| 7:00 AM to 7:29 AM | 6,374 (10.4%) | 4,789 (12.1%) |
| 7:30 AM to 7:59 AM | 4,919 (8.1%) | 6,042 (15.3%) |
| 8:00 AM to 8:29 AM | 2,880 (4.7%) | 3,316 (8.4%) |
| 8:30 AM to 8:59 AM | 1,707 (2.8%) | 2,276 (5.8%) |
| 9:00 AM to 9:59 AM | 1,866 (3.1%) | 2,769 (7.0%) |
| 10:00 AM to 10:59 AM | 845 (1.4%) | 1,124 (2.8%) |
| 11:00 AM to 11:59 AM | 678 (1.1%) | 370 (0.9%) |
| 12:00 PM to 3:59 PM | 4,078 (6.7%) | 2,887 (7.3%) |
| 4:00 PM to 11:59 PM | 4,240 (7.0%) | 2,930 (7.4%) |
| Total | 61,051 (100.0%) | 39,565 (100.0%) |
Housing Occupancy in Merced County
Occupancy by Ownership in Merced County
Of the total 82,760 dwellings in Merced County, owner-occupied units account for 44,156 (53.3%), while renter-occupied units make up 38,604 (46.7%).
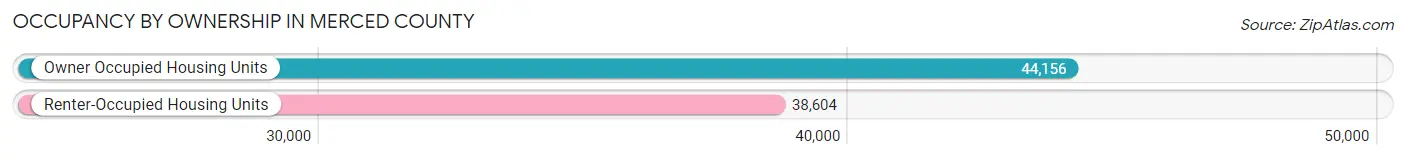
| Occupancy | # Housing Units | % Housing Units |
| Owner Occupied Housing Units | 44,156 | 53.3% |
| Renter-Occupied Housing Units | 38,604 | 46.7% |
| Total Occupied Housing Units | 82,760 | 100.0% |
Occupancy by Household Size in Merced County
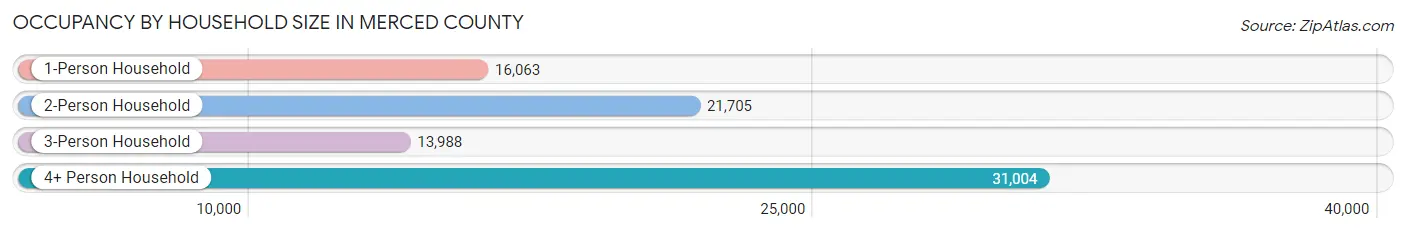
| Household Size | # Housing Units | % Housing Units |
| 1-Person Household | 16,063 | 19.4% |
| 2-Person Household | 21,705 | 26.2% |
| 3-Person Household | 13,988 | 16.9% |
| 4+ Person Household | 31,004 | 37.5% |
| Total Housing Units | 82,760 | 100.0% |
Occupancy by Ownership by Household Size in Merced County
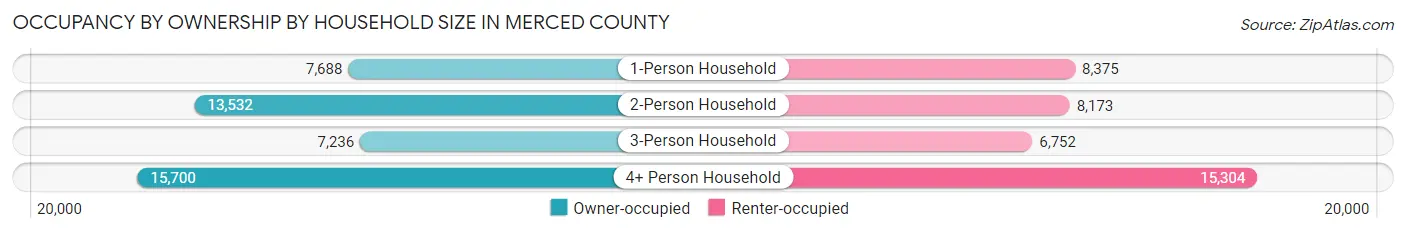
| Household Size | Owner-occupied | Renter-occupied |
| 1-Person Household | 7,688 (47.9%) | 8,375 (52.1%) |
| 2-Person Household | 13,532 (62.4%) | 8,173 (37.7%) |
| 3-Person Household | 7,236 (51.7%) | 6,752 (48.3%) |
| 4+ Person Household | 15,700 (50.6%) | 15,304 (49.4%) |
| Total Housing Units | 44,156 (53.3%) | 38,604 (46.7%) |
Occupancy by Educational Attainment in Merced County
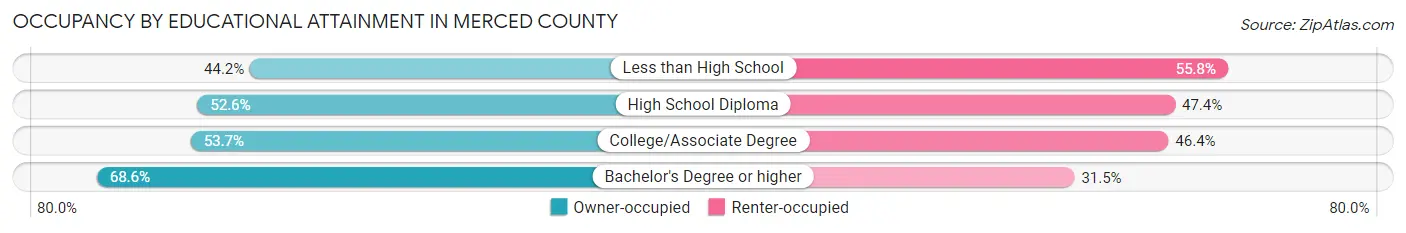
| Household Size | Owner-occupied | Renter-occupied |
| Less than High School | 9,568 (44.2%) | 12,066 (55.8%) |
| High School Diploma | 10,628 (52.6%) | 9,582 (47.4%) |
| College/Associate Degree | 14,724 (53.6%) | 12,719 (46.4%) |
| Bachelor's Degree or higher | 9,236 (68.5%) | 4,237 (31.5%) |
Occupancy by Age of Householder in Merced County
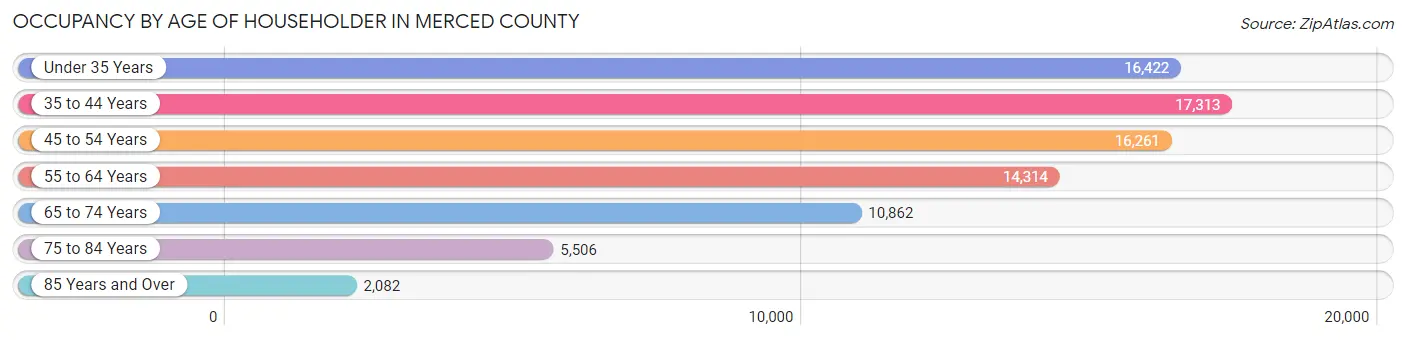
| Age Bracket | # Households | % Households |
| Under 35 Years | 16,422 | 19.8% |
| 35 to 44 Years | 17,313 | 20.9% |
| 45 to 54 Years | 16,261 | 19.7% |
| 55 to 64 Years | 14,314 | 17.3% |
| 65 to 74 Years | 10,862 | 13.1% |
| 75 to 84 Years | 5,506 | 6.7% |
| 85 Years and Over | 2,082 | 2.5% |
| Total | 82,760 | 100.0% |
Housing Finances in Merced County
Median Income by Occupancy in Merced County
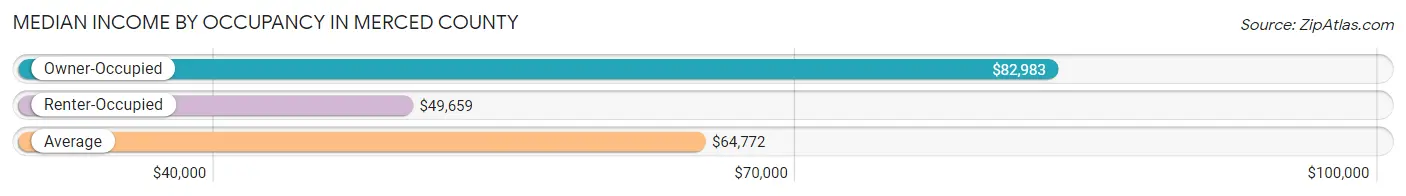
| Occupancy Type | # Households | Median Income |
| Owner-Occupied | 44,156 (53.3%) | $82,983 |
| Renter-Occupied | 38,604 (46.7%) | $49,659 |
| Average | 82,760 (100.0%) | $64,772 |
Occupancy by Householder Income Bracket in Merced County
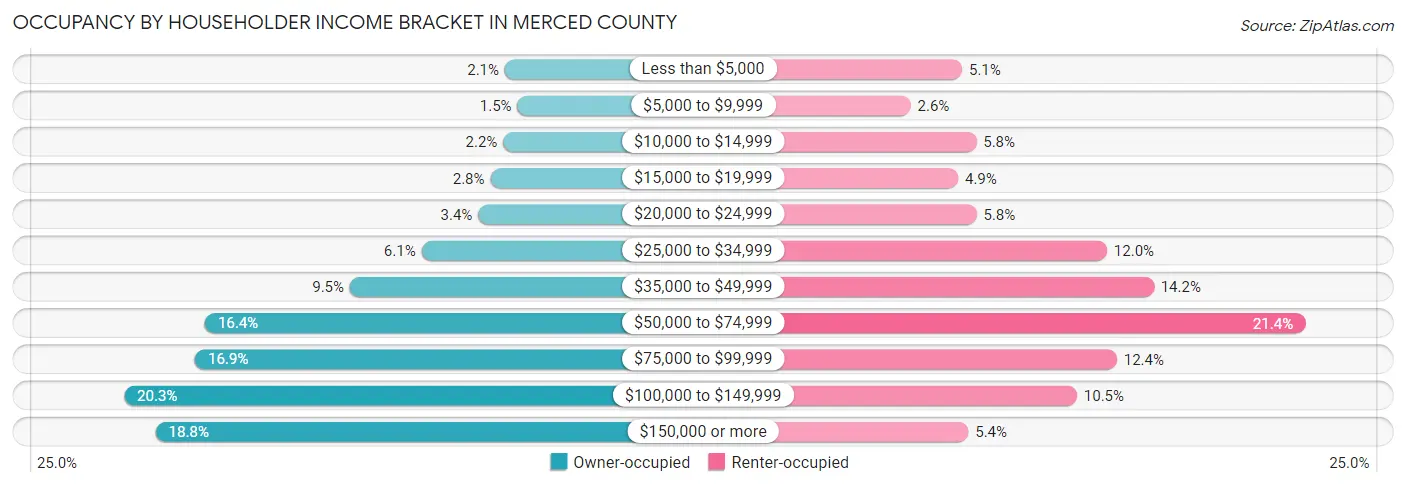
| Income Bracket | Owner-occupied | Renter-occupied |
| Less than $5,000 | 940 (2.1%) | 1,958 (5.1%) |
| $5,000 to $9,999 | 674 (1.5%) | 1,012 (2.6%) |
| $10,000 to $14,999 | 978 (2.2%) | 2,219 (5.8%) |
| $15,000 to $19,999 | 1,247 (2.8%) | 1,883 (4.9%) |
| $20,000 to $24,999 | 1,501 (3.4%) | 2,224 (5.8%) |
| $25,000 to $34,999 | 2,692 (6.1%) | 4,621 (12.0%) |
| $35,000 to $49,999 | 4,198 (9.5%) | 5,480 (14.2%) |
| $50,000 to $74,999 | 7,244 (16.4%) | 8,262 (21.4%) |
| $75,000 to $99,999 | 7,452 (16.9%) | 4,803 (12.4%) |
| $100,000 to $149,999 | 8,948 (20.3%) | 4,069 (10.5%) |
| $150,000 or more | 8,282 (18.8%) | 2,073 (5.4%) |
| Total | 44,156 (100.0%) | 38,604 (100.0%) |
Monthly Housing Cost Tiers in Merced County
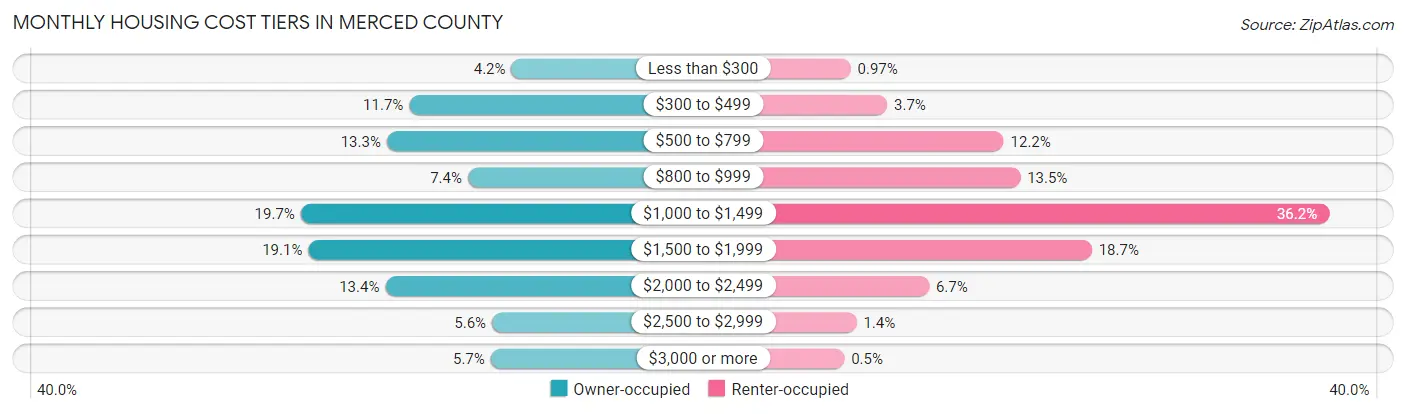
| Monthly Cost | Owner-occupied | Renter-occupied |
| Less than $300 | 1,833 (4.2%) | 373 (1.0%) |
| $300 to $499 | 5,159 (11.7%) | 1,414 (3.7%) |
| $500 to $799 | 5,886 (13.3%) | 4,725 (12.2%) |
| $800 to $999 | 3,248 (7.4%) | 5,196 (13.5%) |
| $1,000 to $1,499 | 8,684 (19.7%) | 13,975 (36.2%) |
| $1,500 to $1,999 | 8,440 (19.1%) | 7,230 (18.7%) |
| $2,000 to $2,499 | 5,933 (13.4%) | 2,601 (6.7%) |
| $2,500 to $2,999 | 2,463 (5.6%) | 542 (1.4%) |
| $3,000 or more | 2,510 (5.7%) | 192 (0.5%) |
| Total | 44,156 (100.0%) | 38,604 (100.0%) |
Physical Housing Characteristics in Merced County
Housing Structures in Merced County
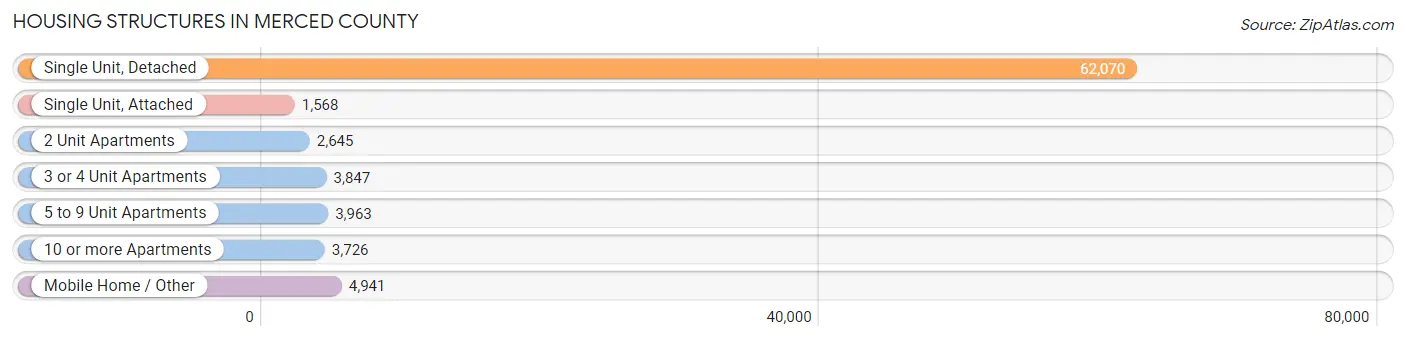
| Structure Type | # Housing Units | % Housing Units |
| Single Unit, Detached | 62,070 | 75.0% |
| Single Unit, Attached | 1,568 | 1.9% |
| 2 Unit Apartments | 2,645 | 3.2% |
| 3 or 4 Unit Apartments | 3,847 | 4.6% |
| 5 to 9 Unit Apartments | 3,963 | 4.8% |
| 10 or more Apartments | 3,726 | 4.5% |
| Mobile Home / Other | 4,941 | 6.0% |
| Total | 82,760 | 100.0% |
Housing Structures by Occupancy in Merced County
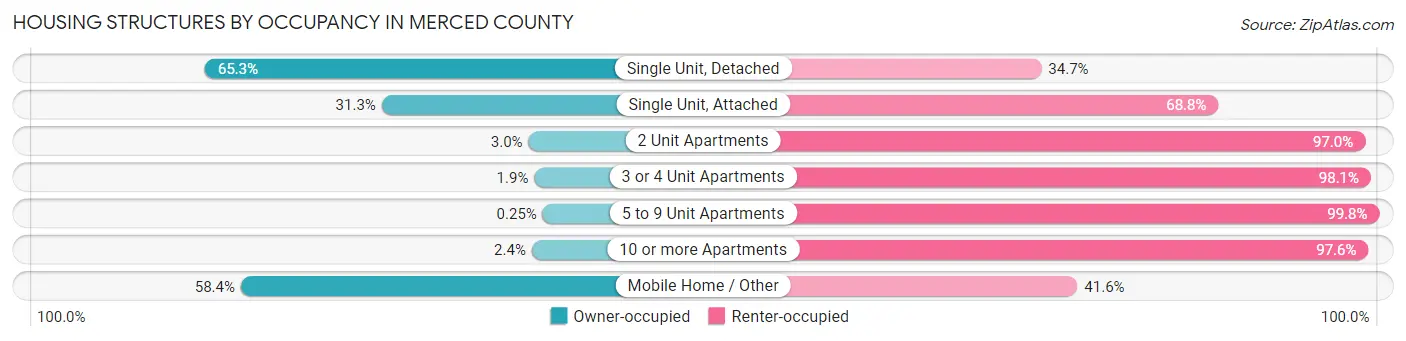
| Structure Type | Owner-occupied | Renter-occupied |
| Single Unit, Detached | 40,533 (65.3%) | 21,537 (34.7%) |
| Single Unit, Attached | 490 (31.2%) | 1,078 (68.8%) |
| 2 Unit Apartments | 79 (3.0%) | 2,566 (97.0%) |
| 3 or 4 Unit Apartments | 72 (1.9%) | 3,775 (98.1%) |
| 5 to 9 Unit Apartments | 10 (0.3%) | 3,953 (99.8%) |
| 10 or more Apartments | 88 (2.4%) | 3,638 (97.6%) |
| Mobile Home / Other | 2,884 (58.4%) | 2,057 (41.6%) |
| Total | 44,156 (53.3%) | 38,604 (46.7%) |
Housing Structures by Number of Rooms in Merced County
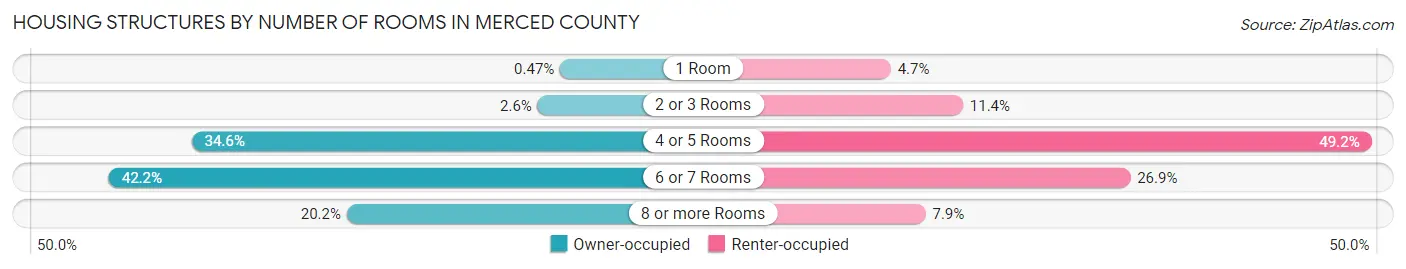
| Number of Rooms | Owner-occupied | Renter-occupied |
| 1 Room | 208 (0.5%) | 1,816 (4.7%) |
| 2 or 3 Rooms | 1,126 (2.5%) | 4,389 (11.4%) |
| 4 or 5 Rooms | 15,262 (34.6%) | 18,977 (49.2%) |
| 6 or 7 Rooms | 18,640 (42.2%) | 10,366 (26.9%) |
| 8 or more Rooms | 8,920 (20.2%) | 3,056 (7.9%) |
| Total | 44,156 (100.0%) | 38,604 (100.0%) |
Housing Structure by Heating Type in Merced County
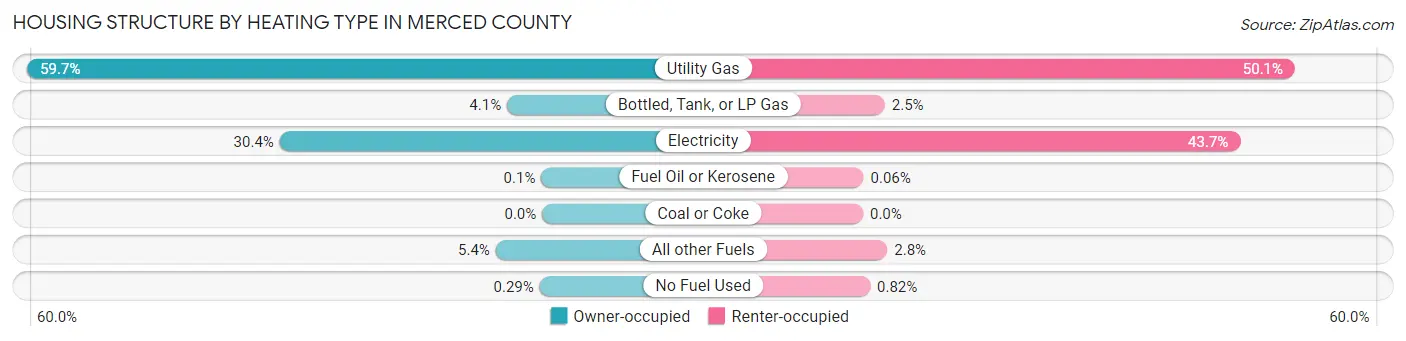
| Heating Type | Owner-occupied | Renter-occupied |
| Utility Gas | 26,372 (59.7%) | 19,326 (50.1%) |
| Bottled, Tank, or LP Gas | 1,798 (4.1%) | 975 (2.5%) |
| Electricity | 13,438 (30.4%) | 16,877 (43.7%) |
| Fuel Oil or Kerosene | 46 (0.1%) | 22 (0.1%) |
| Coal or Coke | 0 (0.0%) | 0 (0.0%) |
| All other Fuels | 2,375 (5.4%) | 1,087 (2.8%) |
| No Fuel Used | 127 (0.3%) | 317 (0.8%) |
| Total | 44,156 (100.0%) | 38,604 (100.0%) |
Household Vehicle Usage in Merced County
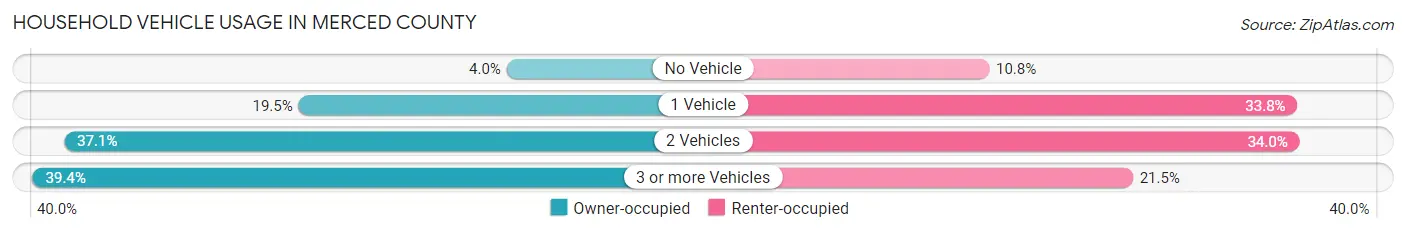
| Vehicles per Household | Owner-occupied | Renter-occupied |
| No Vehicle | 1,765 (4.0%) | 4,153 (10.8%) |
| 1 Vehicle | 8,627 (19.5%) | 13,046 (33.8%) |
| 2 Vehicles | 16,361 (37.0%) | 13,108 (34.0%) |
| 3 or more Vehicles | 17,403 (39.4%) | 8,297 (21.5%) |
| Total | 44,156 (100.0%) | 38,604 (100.0%) |
Real Estate & Mortgages in Merced County
Real Estate and Mortgage Overview in Merced County
| Characteristic | Without Mortgage | With Mortgage |
| Housing Units | 15,318 | 28,838 |
| Median Property Value | $313,800 | $355,400 |
| Median Household Income | $64,686 | $6,383 |
| Monthly Housing Costs | $540 | $2,464 |
| Real Estate Taxes | $1,687 | $774 |
Property Value by Mortgage Status in Merced County

| Property Value | Without Mortgage | With Mortgage |
| Less than $50,000 | 1,494 (9.8%) | 418 (1.5%) |
| $50,000 to $99,999 | 860 (5.6%) | 281 (1.0%) |
| $100,000 to $299,999 | 4,759 (31.1%) | 8,978 (31.1%) |
| $300,000 to $499,999 | 5,791 (37.8%) | 14,040 (48.7%) |
| $500,000 to $749,999 | 1,329 (8.7%) | 3,567 (12.4%) |
| $750,000 to $999,999 | 522 (3.4%) | 905 (3.1%) |
| $1,000,000 or more | 563 (3.7%) | 649 (2.2%) |
| Total | 15,318 (100.0%) | 28,838 (100.0%) |
Household Income by Mortgage Status in Merced County
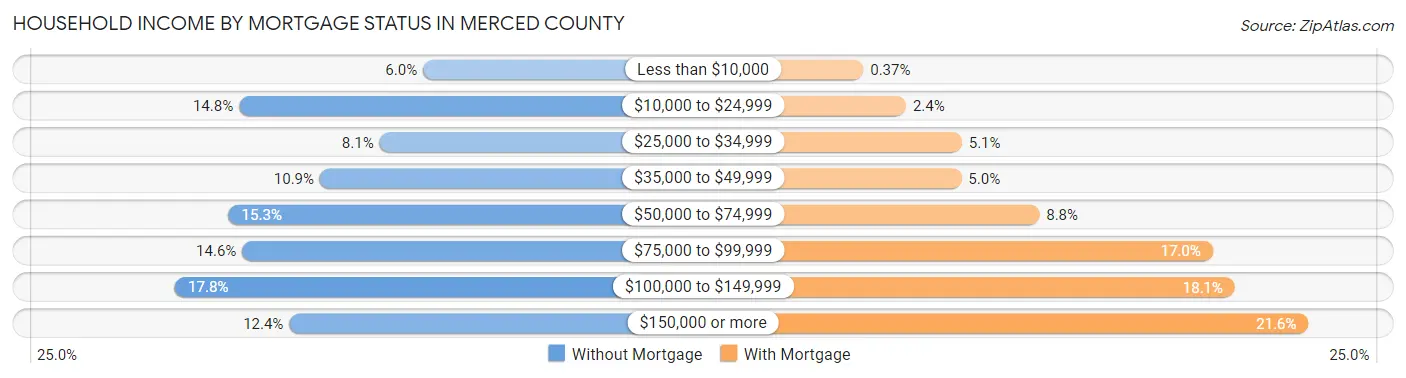
| Household Income | Without Mortgage | With Mortgage |
| Less than $10,000 | 923 (6.0%) | 107 (0.4%) |
| $10,000 to $24,999 | 2,266 (14.8%) | 691 (2.4%) |
| $25,000 to $34,999 | 1,240 (8.1%) | 1,460 (5.1%) |
| $35,000 to $49,999 | 1,676 (10.9%) | 1,452 (5.0%) |
| $50,000 to $74,999 | 2,340 (15.3%) | 2,522 (8.7%) |
| $75,000 to $99,999 | 2,243 (14.6%) | 4,904 (17.0%) |
| $100,000 to $149,999 | 2,731 (17.8%) | 5,209 (18.1%) |
| $150,000 or more | 1,899 (12.4%) | 6,217 (21.6%) |
| Total | 15,318 (100.0%) | 28,838 (100.0%) |
Property Value to Household Income Ratio in Merced County
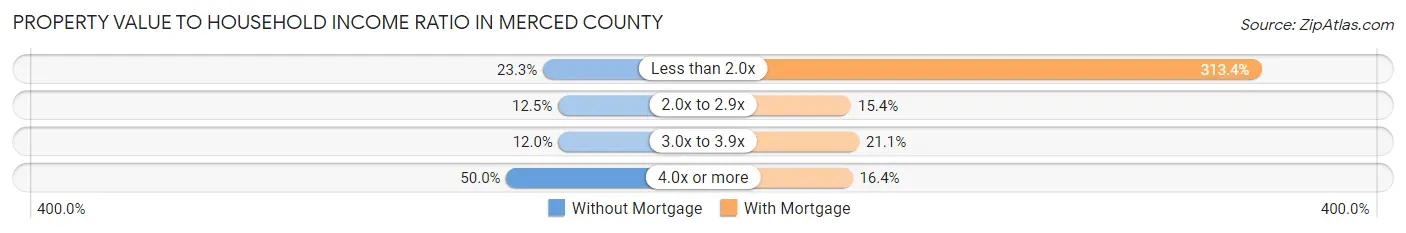
| Value-to-Income Ratio | Without Mortgage | With Mortgage |
| Less than 2.0x | 3,575 (23.3%) | 90,382 (313.4%) |
| 2.0x to 2.9x | 1,908 (12.5%) | 4,426 (15.3%) |
| 3.0x to 3.9x | 1,840 (12.0%) | 6,092 (21.1%) |
| 4.0x or more | 7,661 (50.0%) | 4,716 (16.4%) |
| Total | 15,318 (100.0%) | 28,838 (100.0%) |
Real Estate Taxes by Mortgage Status in Merced County
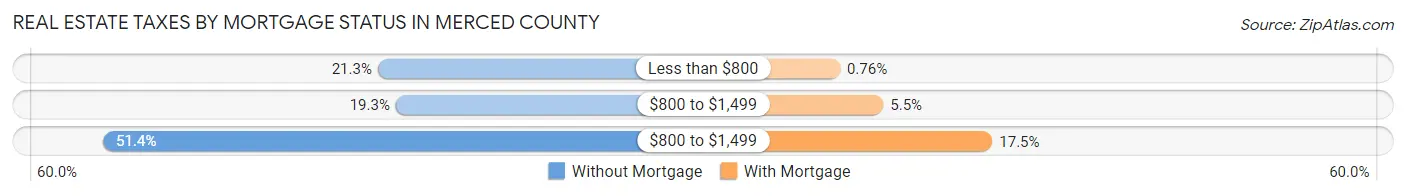
| Property Taxes | Without Mortgage | With Mortgage |
| Less than $800 | 3,262 (21.3%) | 218 (0.8%) |
| $800 to $1,499 | 2,961 (19.3%) | 1,589 (5.5%) |
| $800 to $1,499 | 7,874 (51.4%) | 5,034 (17.5%) |
| Total | 15,318 (100.0%) | 28,838 (100.0%) |
Health & Disability in Merced County
Health Insurance Coverage by Age in Merced County
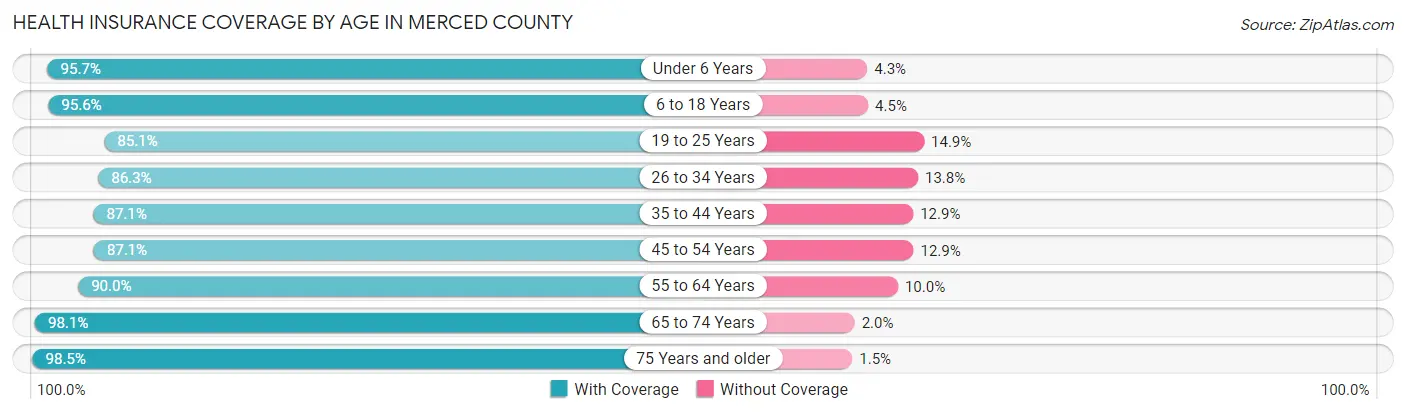
| Age Bracket | With Coverage | Without Coverage |
| Under 6 Years | 24,032 (95.7%) | 1,081 (4.3%) |
| 6 to 18 Years | 59,429 (95.6%) | 2,771 (4.4%) |
| 19 to 25 Years | 25,439 (85.1%) | 4,447 (14.9%) |
| 26 to 34 Years | 31,665 (86.3%) | 5,049 (13.8%) |
| 35 to 44 Years | 30,554 (87.1%) | 4,508 (12.9%) |
| 45 to 54 Years | 26,755 (87.1%) | 3,969 (12.9%) |
| 55 to 64 Years | 25,337 (90.0%) | 2,817 (10.0%) |
| 65 to 74 Years | 18,681 (98.1%) | 372 (1.9%) |
| 75 Years and older | 12,632 (98.5%) | 192 (1.5%) |
| Total | 254,524 (91.0%) | 25,206 (9.0%) |
Health Insurance Coverage by Citizenship Status in Merced County
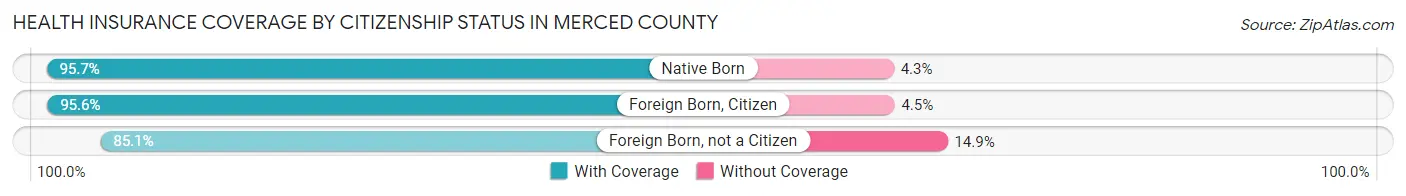
| Citizenship Status | With Coverage | Without Coverage |
| Native Born | 24,032 (95.7%) | 1,081 (4.3%) |
| Foreign Born, Citizen | 59,429 (95.6%) | 2,771 (4.4%) |
| Foreign Born, not a Citizen | 25,439 (85.1%) | 4,447 (14.9%) |
Health Insurance Coverage by Household Income in Merced County
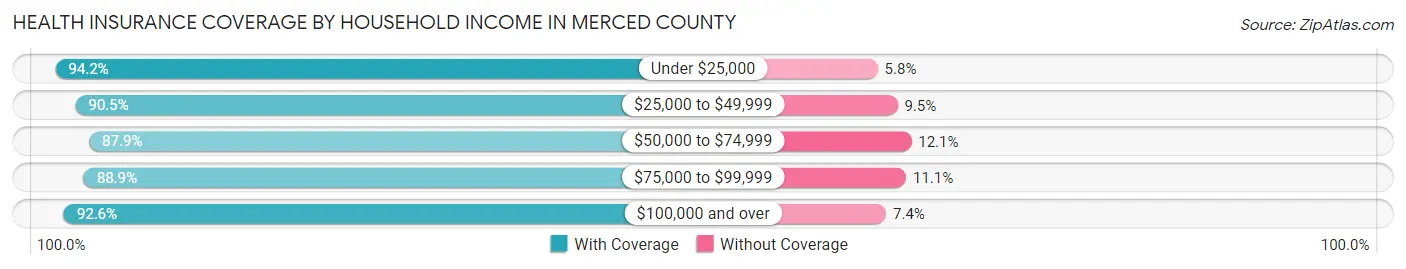
| Household Income | With Coverage | Without Coverage |
| Under $25,000 | 32,208 (94.2%) | 1,976 (5.8%) |
| $25,000 to $49,999 | 44,610 (90.5%) | 4,683 (9.5%) |
| $50,000 to $74,999 | 45,919 (87.9%) | 6,317 (12.1%) |
| $75,000 to $99,999 | 41,455 (88.9%) | 5,177 (11.1%) |
| $100,000 and over | 87,222 (92.6%) | 6,925 (7.4%) |
Public vs Private Health Insurance Coverage by Age in Merced County
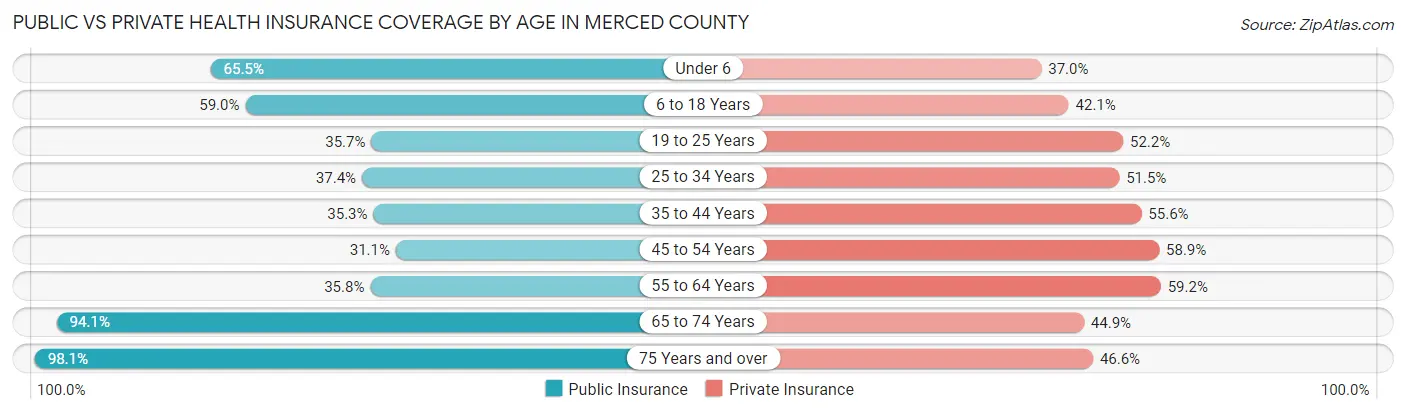
| Age Bracket | Public Insurance | Private Insurance |
| Under 6 | 16,442 (65.5%) | 9,299 (37.0%) |
| 6 to 18 Years | 36,719 (59.0%) | 26,187 (42.1%) |
| 19 to 25 Years | 10,654 (35.6%) | 15,602 (52.2%) |
| 25 to 34 Years | 13,726 (37.4%) | 18,905 (51.5%) |
| 35 to 44 Years | 12,364 (35.3%) | 19,497 (55.6%) |
| 45 to 54 Years | 9,554 (31.1%) | 18,095 (58.9%) |
| 55 to 64 Years | 10,090 (35.8%) | 16,668 (59.2%) |
| 65 to 74 Years | 17,922 (94.1%) | 8,563 (44.9%) |
| 75 Years and over | 12,580 (98.1%) | 5,979 (46.6%) |
| Total | 140,051 (50.1%) | 138,795 (49.6%) |
Disability Status by Sex by Age in Merced County
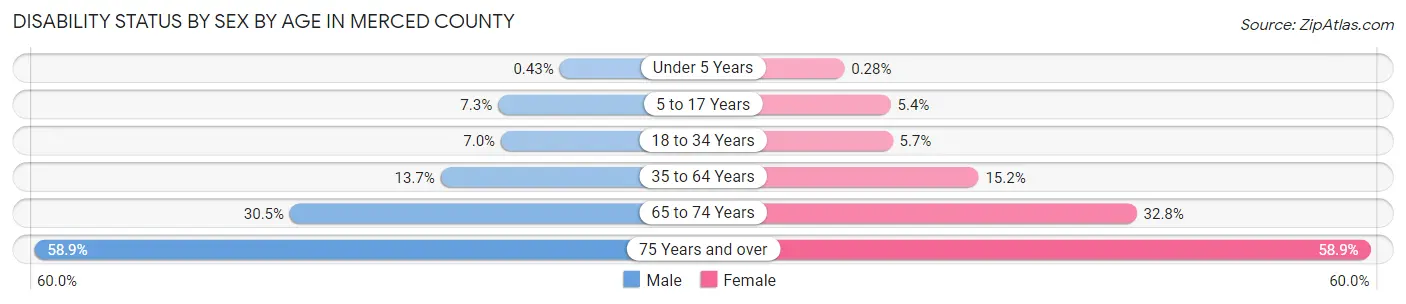
| Age Bracket | Male | Female |
| Under 5 Years | 46 (0.4%) | 28 (0.3%) |
| 5 to 17 Years | 2,308 (7.3%) | 1,626 (5.4%) |
| 18 to 34 Years | 2,581 (7.0%) | 1,950 (5.7%) |
| 35 to 64 Years | 6,455 (13.7%) | 7,113 (15.2%) |
| 65 to 74 Years | 2,805 (30.5%) | 3,232 (32.8%) |
| 75 Years and over | 3,226 (58.9%) | 4,326 (58.9%) |
Disability Class by Sex by Age in Merced County
Disability Class: Hearing Difficulty
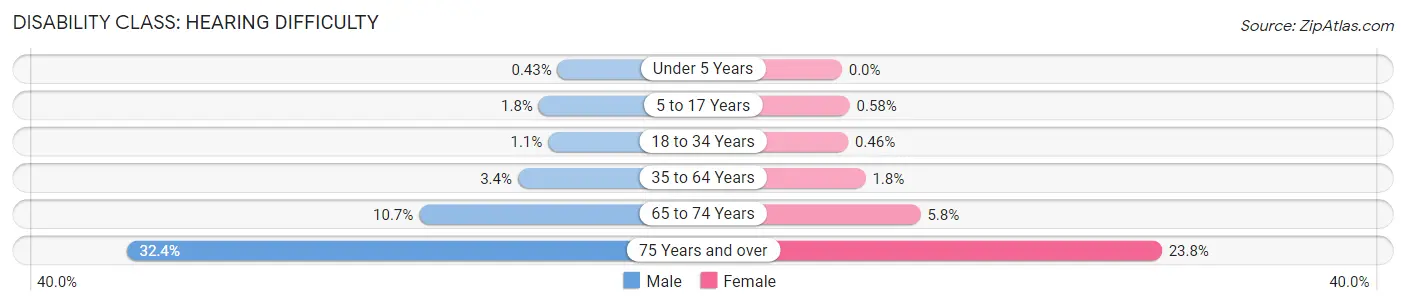
| Age Bracket | Male | Female |
| Under 5 Years | 46 (0.4%) | 0 (0.0%) |
| 5 to 17 Years | 580 (1.8%) | 173 (0.6%) |
| 18 to 34 Years | 419 (1.1%) | 160 (0.5%) |
| 35 to 64 Years | 1,597 (3.4%) | 822 (1.8%) |
| 65 to 74 Years | 986 (10.7%) | 575 (5.8%) |
| 75 Years and over | 1,776 (32.4%) | 1,745 (23.7%) |
Disability Class: Vision Difficulty
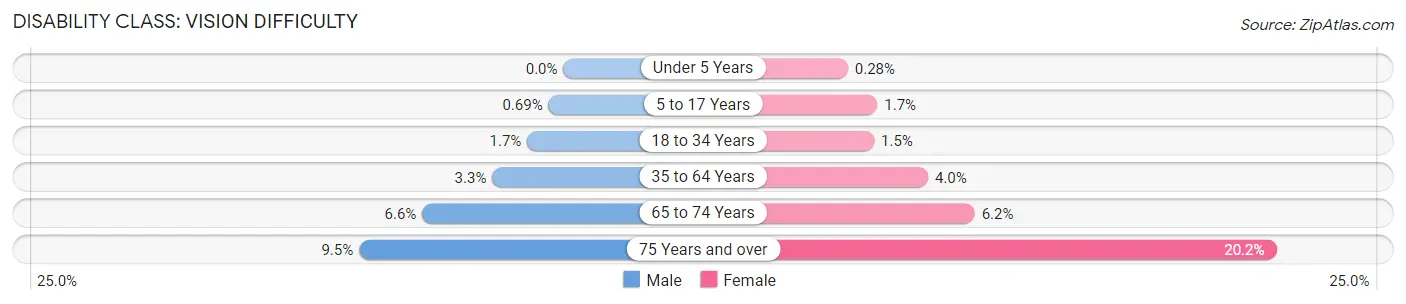
| Age Bracket | Male | Female |
| Under 5 Years | 0 (0.0%) | 28 (0.3%) |
| 5 to 17 Years | 219 (0.7%) | 493 (1.7%) |
| 18 to 34 Years | 625 (1.7%) | 519 (1.5%) |
| 35 to 64 Years | 1,558 (3.3%) | 1,871 (4.0%) |
| 65 to 74 Years | 603 (6.6%) | 607 (6.2%) |
| 75 Years and over | 519 (9.5%) | 1,481 (20.2%) |
Disability Class: Cognitive Difficulty
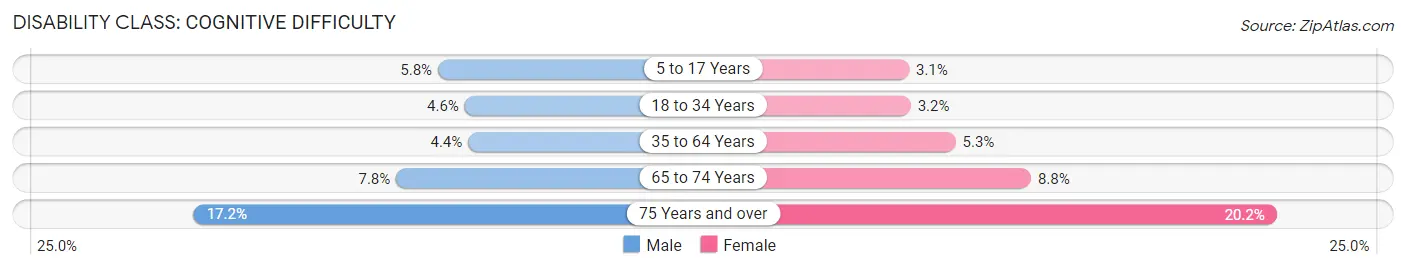
| Age Bracket | Male | Female |
| 5 to 17 Years | 1,844 (5.8%) | 933 (3.1%) |
| 18 to 34 Years | 1,702 (4.6%) | 1,105 (3.2%) |
| 35 to 64 Years | 2,085 (4.4%) | 2,468 (5.3%) |
| 65 to 74 Years | 715 (7.8%) | 864 (8.8%) |
| 75 Years and over | 939 (17.2%) | 1,483 (20.2%) |
Disability Class: Ambulatory Difficulty
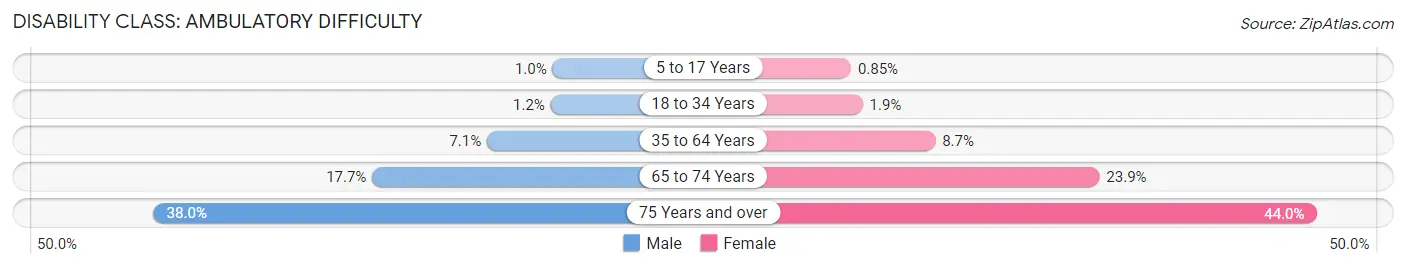
| Age Bracket | Male | Female |
| 5 to 17 Years | 316 (1.0%) | 254 (0.9%) |
| 18 to 34 Years | 437 (1.2%) | 667 (1.9%) |
| 35 to 64 Years | 3,344 (7.1%) | 4,052 (8.7%) |
| 65 to 74 Years | 1,634 (17.7%) | 2,354 (23.9%) |
| 75 Years and over | 2,082 (38.0%) | 3,236 (44.0%) |
Disability Class: Self-Care Difficulty
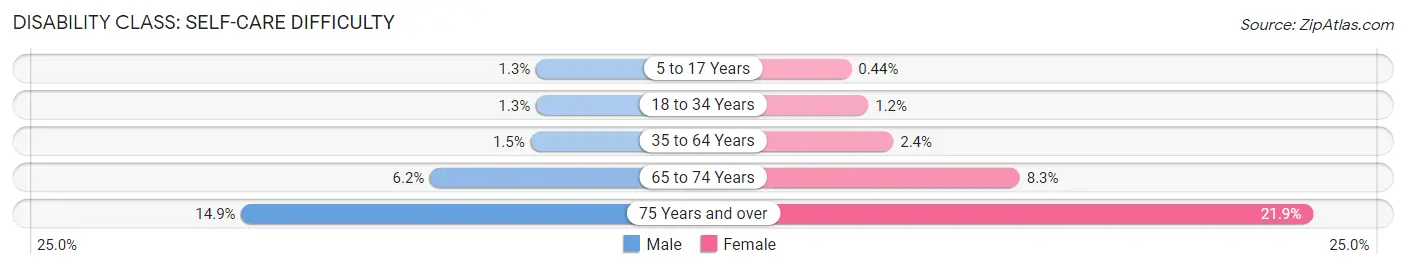
| Age Bracket | Male | Female |
| 5 to 17 Years | 398 (1.3%) | 133 (0.4%) |
| 18 to 34 Years | 470 (1.3%) | 426 (1.2%) |
| 35 to 64 Years | 717 (1.5%) | 1,115 (2.4%) |
| 65 to 74 Years | 569 (6.2%) | 813 (8.3%) |
| 75 Years and over | 818 (14.9%) | 1,607 (21.9%) |
Technology Access in Merced County
Computing Device Access in Merced County
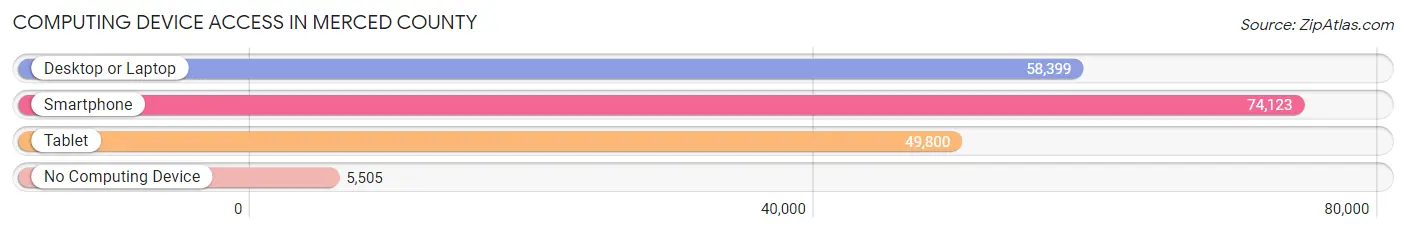
| Device Type | # Households | % Households |
| Desktop or Laptop | 58,399 | 70.6% |
| Smartphone | 74,123 | 89.6% |
| Tablet | 49,800 | 60.2% |
| No Computing Device | 5,505 | 6.7% |
| Total | 82,760 | 100.0% |
Internet Access in Merced County
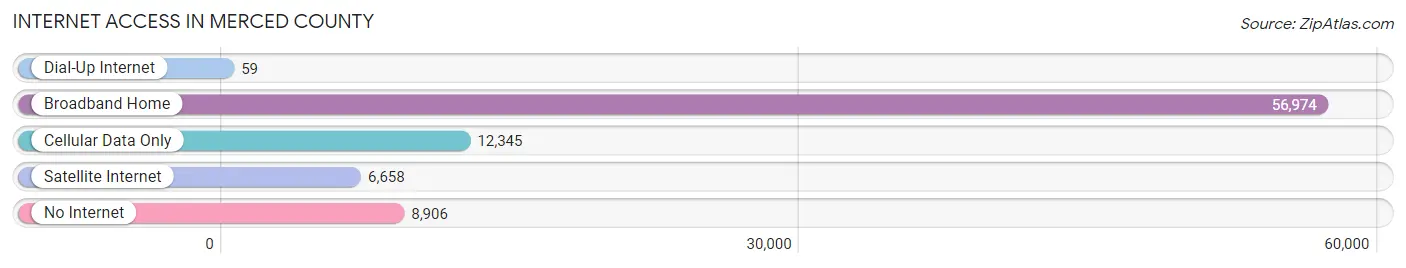
| Internet Type | # Households | % Households |
| Dial-Up Internet | 59 | 0.1% |
| Broadband Home | 56,974 | 68.8% |
| Cellular Data Only | 12,345 | 14.9% |
| Satellite Internet | 6,658 | 8.0% |
| No Internet | 8,906 | 10.8% |
| Total | 82,760 | 100.0% |
Merced County Summary
Merced County is located in the Central Valley of California, and is part of the San Joaquin Valley region. It is bordered by Stanislaus County to the north, Madera County to the east, Fresno County to the southeast, and San Joaquin County to the south. The county seat is Merced, and the county has a population of approximately 255,793 as of the 2010 census.
Geography
Merced County covers an area of 1,955 square miles, making it the fourth-largest county in California by area. The county is located in the Central Valley of California, and is part of the San Joaquin Valley region. It is bordered by Stanislaus County to the north, Madera County to the east, Fresno County to the southeast, and San Joaquin County to the south. The county is divided into two distinct regions: the northern portion is part of the Sierra Nevada foothills, while the southern portion is part of the San Joaquin Valley. The county is home to several mountain ranges, including the Diablo Range, the San Emigdio Mountains, and the Tehachapi Mountains. The highest point in the county is Mount Bullion, which has an elevation of 8,717 feet.
The county is home to several rivers and streams, including the Merced River, the San Joaquin River, and the Tuolumne River. The county also contains several reservoirs, including Lake McClure, Lake McSwain, and Lake Don Pedro.
History
Merced County was formed in 1855 from parts of Mariposa County and Stanislaus County. The county was named after the Merced River, which was named by Spanish explorer Gabriel Moraga in 1806. The county was initially populated by Native American tribes, including the Yokuts, Miwok, and Paiute.
The county experienced rapid growth during the California Gold Rush, as thousands of miners flocked to the area in search of gold. The county was also home to several large ranches, which were used to raise cattle and sheep.
In the late 19th century, the county began to experience a population boom as immigrants from Europe and Asia began to settle in the area. The county also experienced a surge in agricultural production, as farmers began to cultivate crops such as wheat, barley, and alfalfa.
Economy
Merced County has a diverse economy, with a variety of industries providing employment opportunities. The county’s largest employers are the University of California, Merced, the Merced County Office of Education, and the Merced County government. Other major employers include the Merced Union High School District, Mercy Medical Center, and the Merced County Sheriff’s Office.
Agriculture is a major industry in the county, with crops such as almonds, grapes, tomatoes, and cotton being grown in the area. The county is also home to several food processing plants, which process and package products such as canned fruits and vegetables, frozen foods, and dairy products.
The county is home to several manufacturing companies, which produce a variety of products, including furniture, electronics, and medical equipment. The county is also home to several technology companies, which provide software development and other services.
Demographics
As of the 2010 census, Merced County had a population of 255,793. The racial makeup of the county was 57.2% White, 4.2% African American, 1.3% Native American, 8.2% Asian, 0.3% Pacific Islander, 25.2% from other races, and 3.7% from two or more races. Hispanic or Latino of any race were 44.3% of the population.
The median household income in the county was $45,919, and the median family income was $51,818. The per capita income was $20,845. About 17.2% of the population was below the poverty line.
Common Questions
What is Per Capita Income in Merced County?
Per Capita income in Merced County is $26,869.
What is the Median Family Income in Merced County?
Median Family Income in Merced County is $70,798.
What is the Median Household income in Merced County?
Median Household Income in Merced County is $64,772.
What is Income or Wage Gap in Merced County?
Income or Wage Gap in Merced County is 34.2%.
Women in Merced County earn 65.8 cents for every dollar earned by a man.
What is Family Income Deficit in Merced County?
Family Income Deficit in Merced County is $11,824.
Families that are below poverty line in Merced County earn $11,824 less on average than the poverty threshold level.
What is Inequality or Gini Index in Merced County?
Inequality or Gini Index in Merced County is 0.46.
What is the Total Population of Merced County?
Total Population of Merced County is 282,290.
What is the Total Male Population of Merced County?
Total Male Population of Merced County is 143,519.
What is the Total Female Population of Merced County?
Total Female Population of Merced County is 138,771.
What is the Ratio of Males per 100 Females in Merced County?
There are 103.42 Males per 100 Females in Merced County.
What is the Ratio of Females per 100 Males in Merced County?
There are 96.69 Females per 100 Males in Merced County.
What is the Median Population Age in Merced County?
Median Population Age in Merced County is 31.5 Years.
What is the Average Family Size in Merced County
Average Family Size in Merced County is 3.8 People.
What is the Average Household Size in Merced County
Average Household Size in Merced County is 3.3 People.
How Large is the Labor Force in Merced County?
There are 124,265 People in the Labor Forcein in Merced County.
What is the Percentage of People in the Labor Force in Merced County?
59.3% of People are in the Labor Force in Merced County.
What is the Unemployment Rate in Merced County?
Unemployment Rate in Merced County is 10.7%.