Mariposa County, CA Map & Demographics
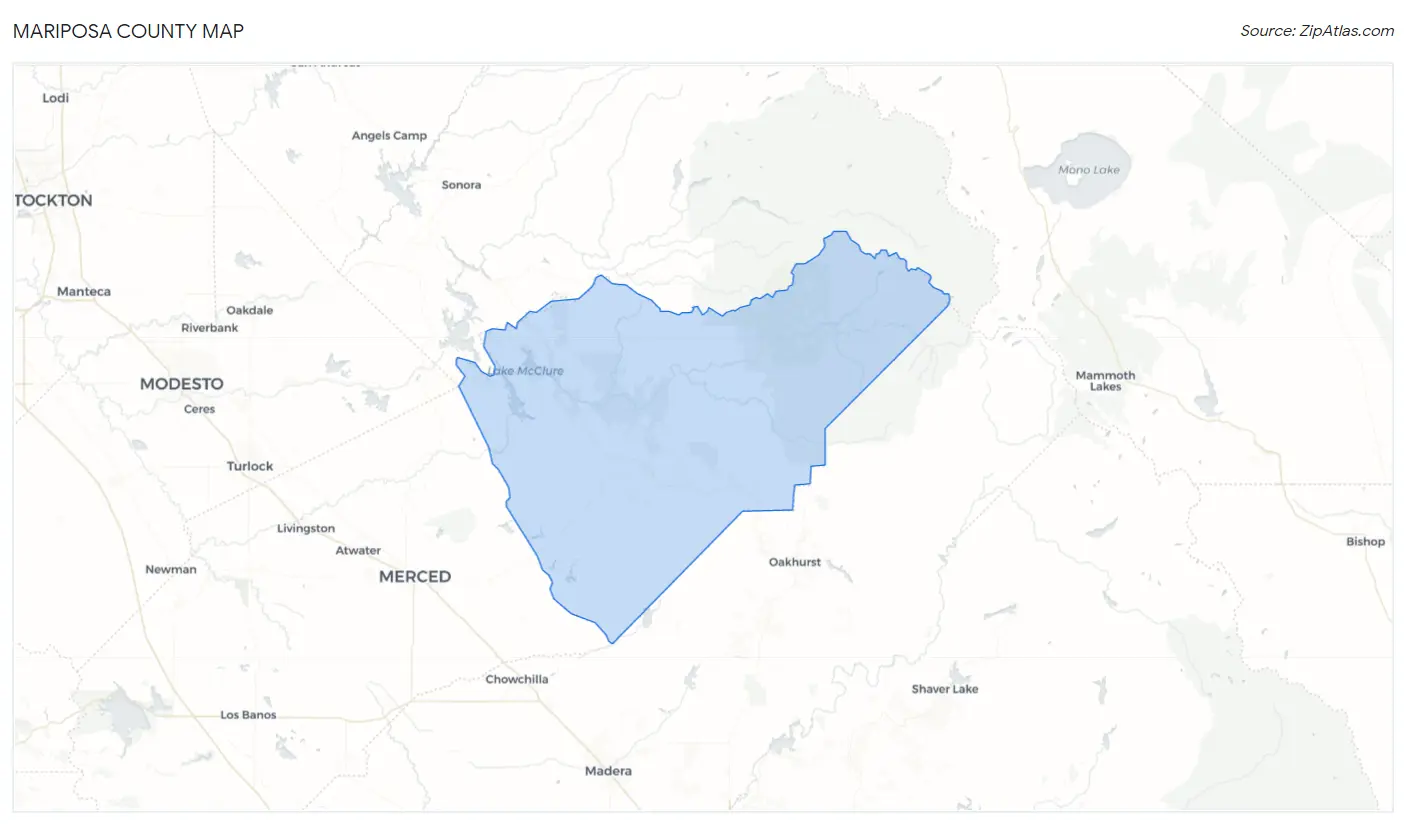
Mariposa County Map
Mariposa County Overview
$36,106
PER CAPITA INCOME
$71,667
AVG FAMILY INCOME
$60,021
AVG HOUSEHOLD INCOME
18.1%
WAGE / INCOME GAP [ % ]
81.9¢/ $1
WAGE / INCOME GAP [ $ ]
0.44
INEQUALITY / GINI INDEX
17,130
TOTAL POPULATION
8,635
MALE POPULATION
8,495
FEMALE POPULATION
101.65
MALES / 100 FEMALES
98.38
FEMALES / 100 MALES
51.6
MEDIAN AGE
2.6
AVG FAMILY SIZE
2.0
AVG HOUSEHOLD SIZE
7,734
LABOR FORCE [ PEOPLE ]
53.0%
PERCENT IN LABOR FORCE
6.2%
UNEMPLOYMENT RATE
Mariposa County Area Codes
Income in Mariposa County
Income Overview in Mariposa County
Per Capita Income in Mariposa County is $36,106, while median incomes of families and households are $71,667 and $60,021 respectively.
| Characteristic | Number | Measure |
| Per Capita Income | 17,130 | $36,106 |
| Median Family Income | 4,524 | $71,667 |
| Mean Family Income | 4,524 | $96,153 |
| Median Household Income | 7,597 | $60,021 |
| Mean Household Income | 7,597 | $79,433 |
| Income Deficit | 4,524 | $0 |
| Wage / Income Gap (%) | 17,130 | 18.15% |
| Wage / Income Gap ($) | 17,130 | 81.85¢ per $1 |
| Gini / Inequality Index | 17,130 | 0.44 |
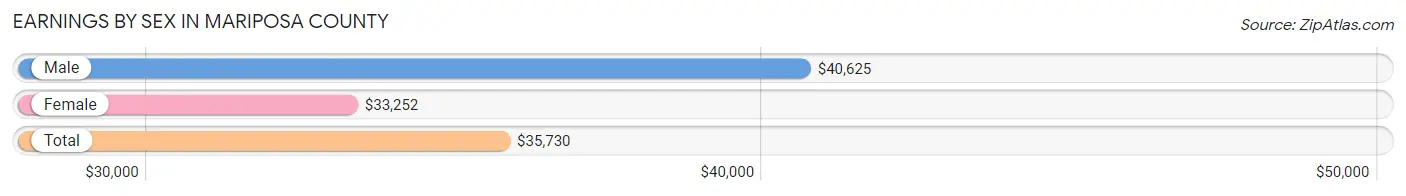
Earnings by Sex in Mariposa County
Average Earnings in Mariposa County are $35,730, $40,625 for men and $33,252 for women, a difference of 18.1%.
| Sex | Number | Average Earnings |
| Male | 4,391 (53.5%) | $40,625 |
| Female | 3,813 (46.5%) | $33,252 |
| Total | 8,204 (100.0%) | $35,730 |
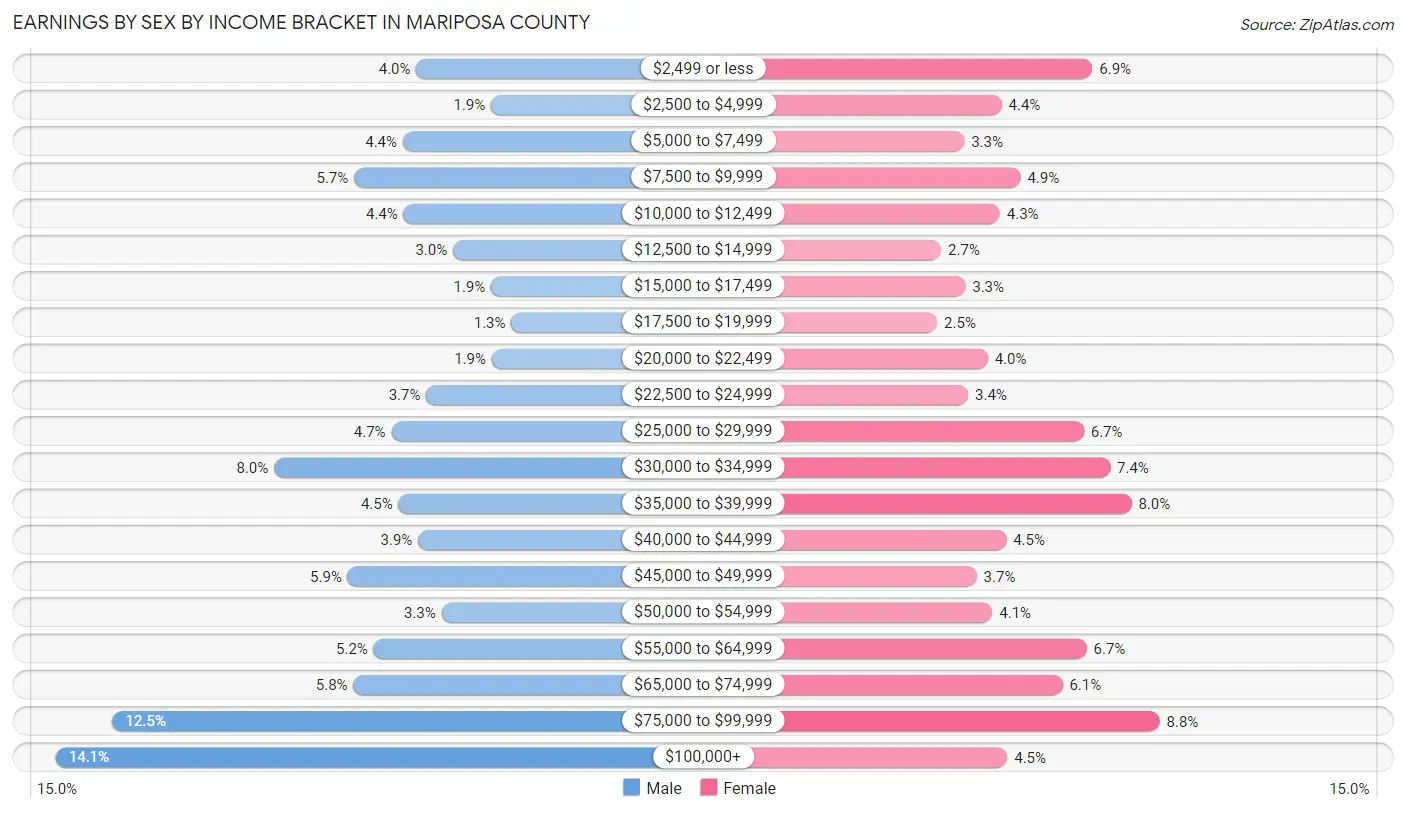
Earnings by Sex by Income Bracket in Mariposa County
The most common earnings brackets in Mariposa County are $100,000+ for men (620 | 14.1%) and $75,000 to $99,999 for women (335 | 8.8%).
| Income | Male | Female |
| $2,499 or less | 175 (4.0%) | 263 (6.9%) |
| $2,500 to $4,999 | 83 (1.9%) | 166 (4.3%) |
| $5,000 to $7,499 | 192 (4.4%) | 126 (3.3%) |
| $7,500 to $9,999 | 252 (5.7%) | 186 (4.9%) |
| $10,000 to $12,499 | 191 (4.3%) | 164 (4.3%) |
| $12,500 to $14,999 | 130 (3.0%) | 101 (2.6%) |
| $15,000 to $17,499 | 83 (1.9%) | 127 (3.3%) |
| $17,500 to $19,999 | 58 (1.3%) | 97 (2.5%) |
| $20,000 to $22,499 | 82 (1.9%) | 151 (4.0%) |
| $22,500 to $24,999 | 163 (3.7%) | 130 (3.4%) |
| $25,000 to $29,999 | 206 (4.7%) | 254 (6.7%) |
| $30,000 to $34,999 | 351 (8.0%) | 282 (7.4%) |
| $35,000 to $39,999 | 197 (4.5%) | 305 (8.0%) |
| $40,000 to $44,999 | 173 (3.9%) | 171 (4.5%) |
| $45,000 to $49,999 | 260 (5.9%) | 139 (3.6%) |
| $50,000 to $54,999 | 144 (3.3%) | 156 (4.1%) |
| $55,000 to $64,999 | 228 (5.2%) | 257 (6.7%) |
| $65,000 to $74,999 | 253 (5.8%) | 231 (6.1%) |
| $75,000 to $99,999 | 550 (12.5%) | 335 (8.8%) |
| $100,000+ | 620 (14.1%) | 172 (4.5%) |
| Total | 4,391 (100.0%) | 3,813 (100.0%) |
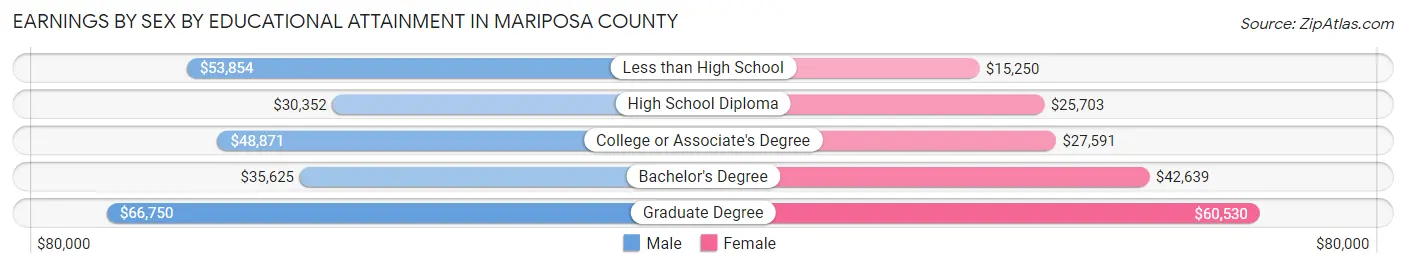
Earnings by Sex by Educational Attainment in Mariposa County
Average earnings in Mariposa County are $45,305 for men and $34,946 for women, a difference of 22.9%. Men with an educational attainment of graduate degree enjoy the highest average annual earnings of $66,750, while those with high school diploma education earn the least with $30,352. Women with an educational attainment of graduate degree earn the most with the average annual earnings of $60,530, while those with less than high school education have the smallest earnings of $15,250.
| Educational Attainment | Male Income | Female Income |
| Less than High School | $53,854 | $15,250 |
| High School Diploma | $30,352 | $25,703 |
| College or Associate's Degree | $48,871 | $27,591 |
| Bachelor's Degree | $35,625 | $42,639 |
| Graduate Degree | $66,750 | $60,530 |
| Total | $45,305 | $34,946 |
Family Income in Mariposa County
Family Income Brackets in Mariposa County
According to the Mariposa County family income data, there are 1,072 families falling into the $50,000 to $74,999 income range, which is the most common income bracket and makes up 23.7% of all families. Conversely, the $10,000 to $14,999 income bracket is the least frequent group with only 18 families (0.4%) belonging to this category.
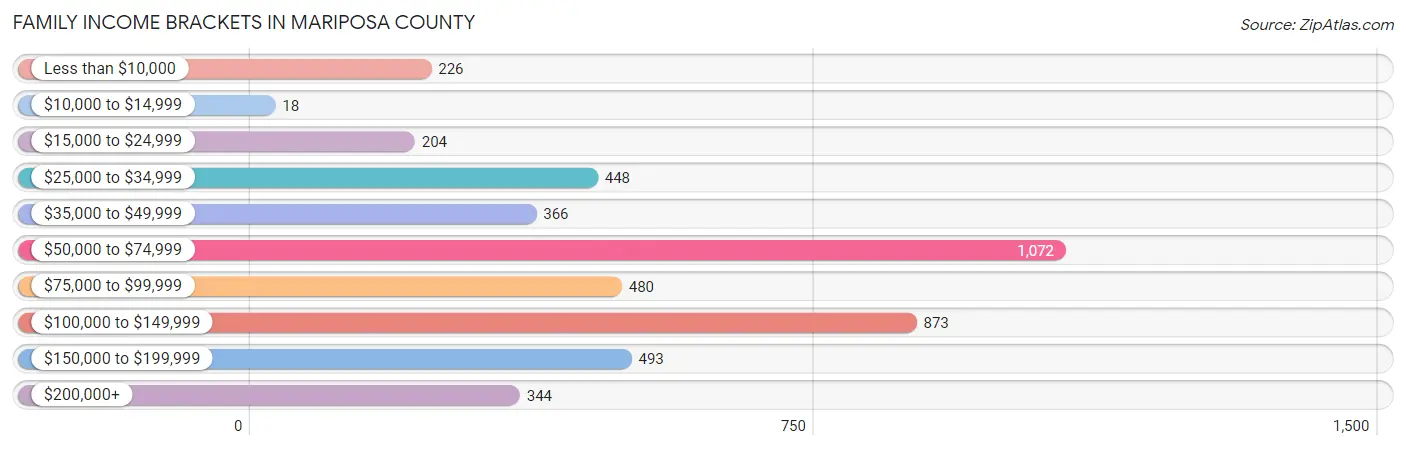
| Income Bracket | # Families | % Families |
| Less than $10,000 | 226 | 5.0% |
| $10,000 to $14,999 | 18 | 0.4% |
| $15,000 to $24,999 | 204 | 4.5% |
| $25,000 to $34,999 | 448 | 9.9% |
| $35,000 to $49,999 | 366 | 8.1% |
| $50,000 to $74,999 | 1,072 | 23.7% |
| $75,000 to $99,999 | 480 | 10.6% |
| $100,000 to $149,999 | 873 | 19.3% |
| $150,000 to $199,999 | 493 | 10.9% |
| $200,000+ | 344 | 7.6% |
Family Income by Famaliy Size in Mariposa County
5-person families (343 | 7.6%) account for the highest median family income in Mariposa County with $142,702 per family, while 2-person families (2,575 | 56.9%) have the highest median income of $32,949 per family member.
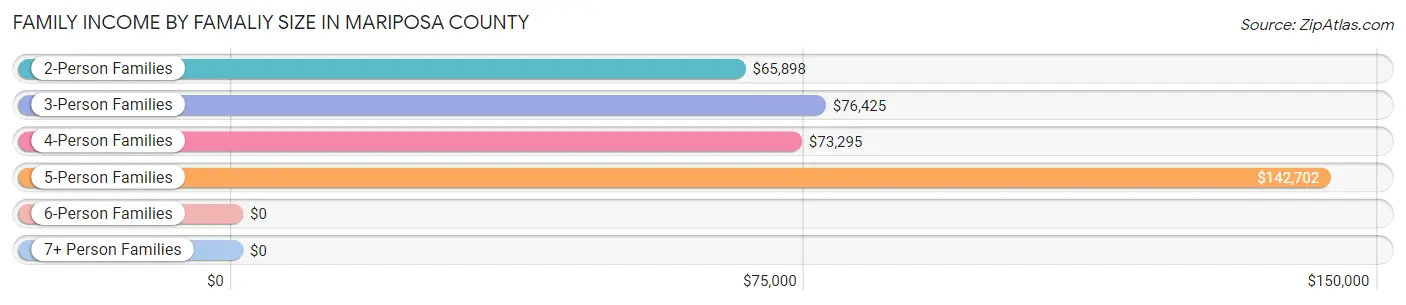
| Income Bracket | # Families | Median Income |
| 2-Person Families | 2,575 (56.9%) | $65,898 |
| 3-Person Families | 835 (18.5%) | $76,425 |
| 4-Person Families | 620 (13.7%) | $73,295 |
| 5-Person Families | 343 (7.6%) | $142,702 |
| 6-Person Families | 80 (1.8%) | $0 |
| 7+ Person Families | 71 (1.6%) | $0 |
| Total | 4,524 (100.0%) | $71,667 |
Family Income by Number of Earners in Mariposa County
The median family income in Mariposa County is $71,667, with families comprising 3+ earners (349) having the highest median family income of $193,188, while families with no earners (1,335) have the lowest median family income of $55,275, accounting for 7.7% and 29.5% of families, respectively.
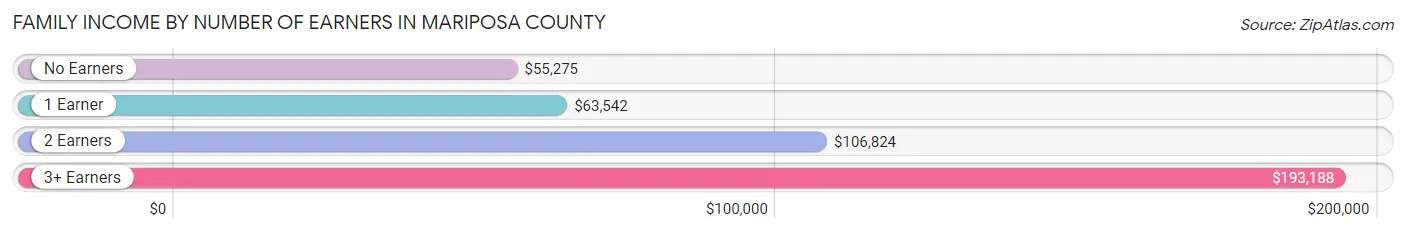
| Number of Earners | # Families | Median Income |
| No Earners | 1,335 (29.5%) | $55,275 |
| 1 Earner | 1,580 (34.9%) | $63,542 |
| 2 Earners | 1,260 (27.9%) | $106,824 |
| 3+ Earners | 349 (7.7%) | $193,188 |
| Total | 4,524 (100.0%) | $71,667 |
Household Income in Mariposa County
Household Income Brackets in Mariposa County
With 1,550 households falling in the category, the $50,000 to $74,999 income range is the most frequent in Mariposa County, accounting for 20.4% of all households. In contrast, only 349 households (4.6%) fall into the $10,000 to $14,999 income bracket, making it the least populous group.
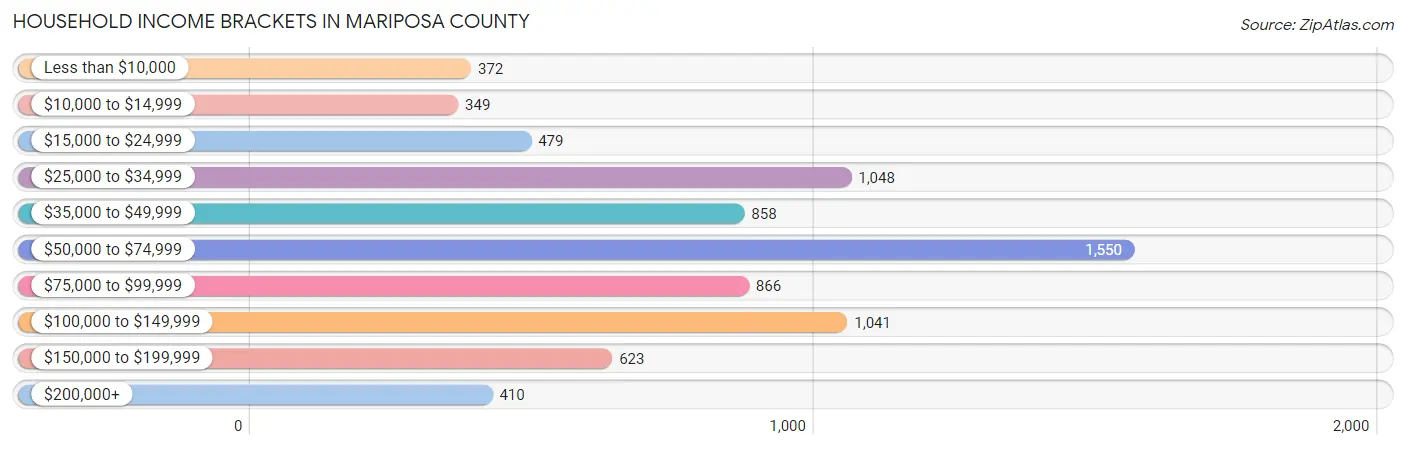
| Income Bracket | # Households | % Households |
| Less than $10,000 | 372 | 4.9% |
| $10,000 to $14,999 | 349 | 4.6% |
| $15,000 to $24,999 | 479 | 6.3% |
| $25,000 to $34,999 | 1,048 | 13.8% |
| $35,000 to $49,999 | 858 | 11.3% |
| $50,000 to $74,999 | 1,550 | 20.4% |
| $75,000 to $99,999 | 866 | 11.4% |
| $100,000 to $149,999 | 1,041 | 13.7% |
| $150,000 to $199,999 | 623 | 8.2% |
| $200,000+ | 410 | 5.4% |
Household Income by Householder Age in Mariposa County
The median household income in Mariposa County is $60,021, with the highest median household income of $68,382 found in the 15 to 24 years age bracket for the primary householder. A total of 132 households (1.7%) fall into this category. Meanwhile, the 65+ years age bracket for the primary householder has the lowest median household income of $55,185, with 3,163 households (41.6%) in this group.
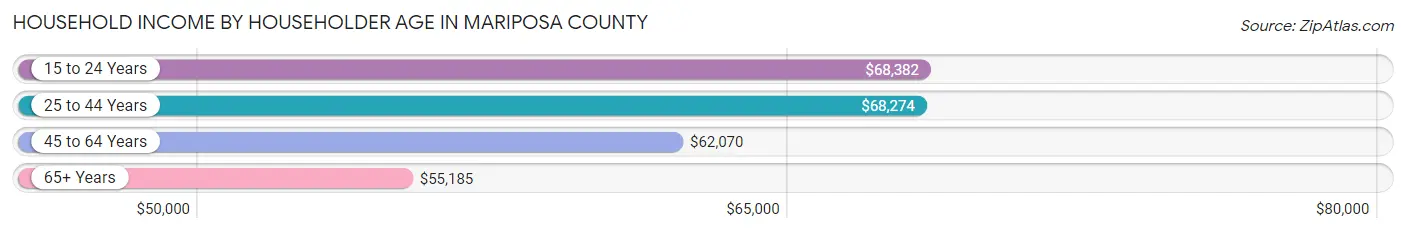
| Income Bracket | # Households | Median Income |
| 15 to 24 Years | 132 (1.7%) | $68,382 |
| 25 to 44 Years | 1,541 (20.3%) | $68,274 |
| 45 to 64 Years | 2,761 (36.3%) | $62,070 |
| 65+ Years | 3,163 (41.6%) | $55,185 |
| Total | 7,597 (100.0%) | $60,021 |
Poverty in Mariposa County
Income Below Poverty by Sex and Age in Mariposa County
With 17.4% poverty level for males and 14.6% for females among the residents of Mariposa County, 18 to 24 year old males and under 5 year old females are the most vulnerable to poverty, with 239 males (47.4%) and 148 females (43.1%) in their respective age groups living below the poverty level.
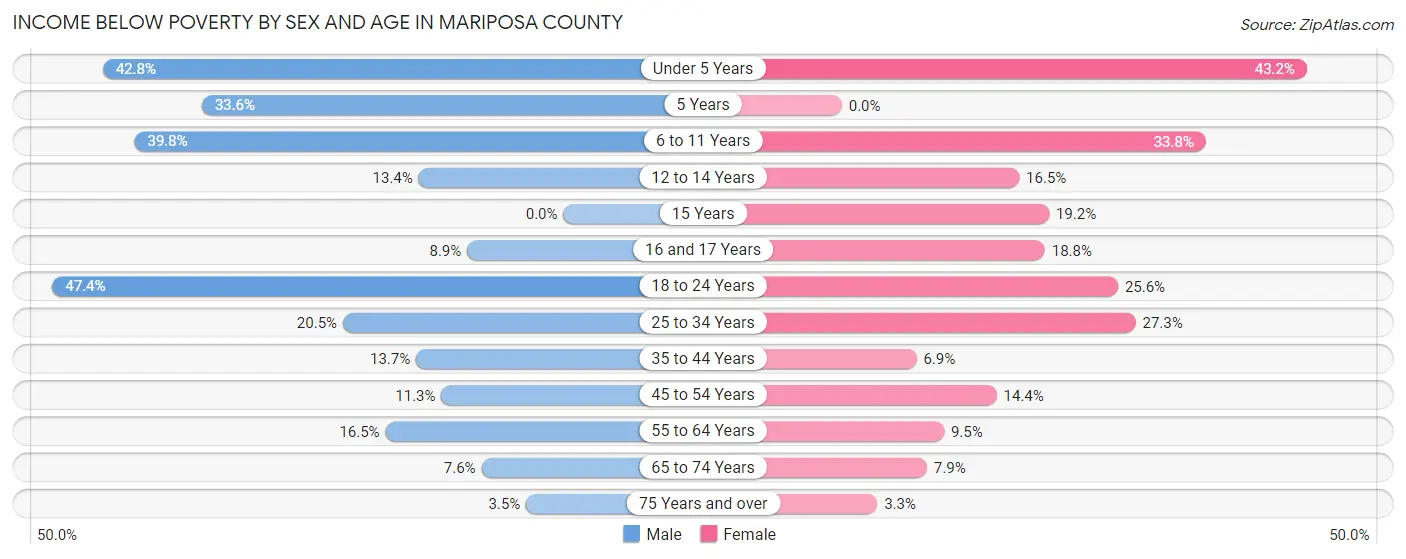
| Age Bracket | Male | Female |
| Under 5 Years | 109 (42.7%) | 148 (43.1%) |
| 5 Years | 50 (33.6%) | 0 (0.0%) |
| 6 to 11 Years | 264 (39.8%) | 180 (33.8%) |
| 12 to 14 Years | 18 (13.4%) | 39 (16.5%) |
| 15 Years | 0 (0.0%) | 10 (19.2%) |
| 16 and 17 Years | 10 (8.9%) | 52 (18.8%) |
| 18 to 24 Years | 239 (47.4%) | 81 (25.6%) |
| 25 to 34 Years | 196 (20.5%) | 250 (27.3%) |
| 35 to 44 Years | 114 (13.7%) | 61 (6.9%) |
| 45 to 54 Years | 107 (11.3%) | 123 (14.4%) |
| 55 to 64 Years | 229 (16.5%) | 139 (9.5%) |
| 65 to 74 Years | 109 (7.6%) | 111 (7.9%) |
| 75 Years and over | 37 (3.5%) | 36 (3.3%) |
| Total | 1,482 (17.4%) | 1,230 (14.6%) |
Income Above Poverty by Sex and Age in Mariposa County
According to the poverty statistics in Mariposa County, males aged 15 years and females aged 5 years are the age groups that are most secure financially, with 100.0% of males and 100.0% of females in these age groups living above the poverty line.
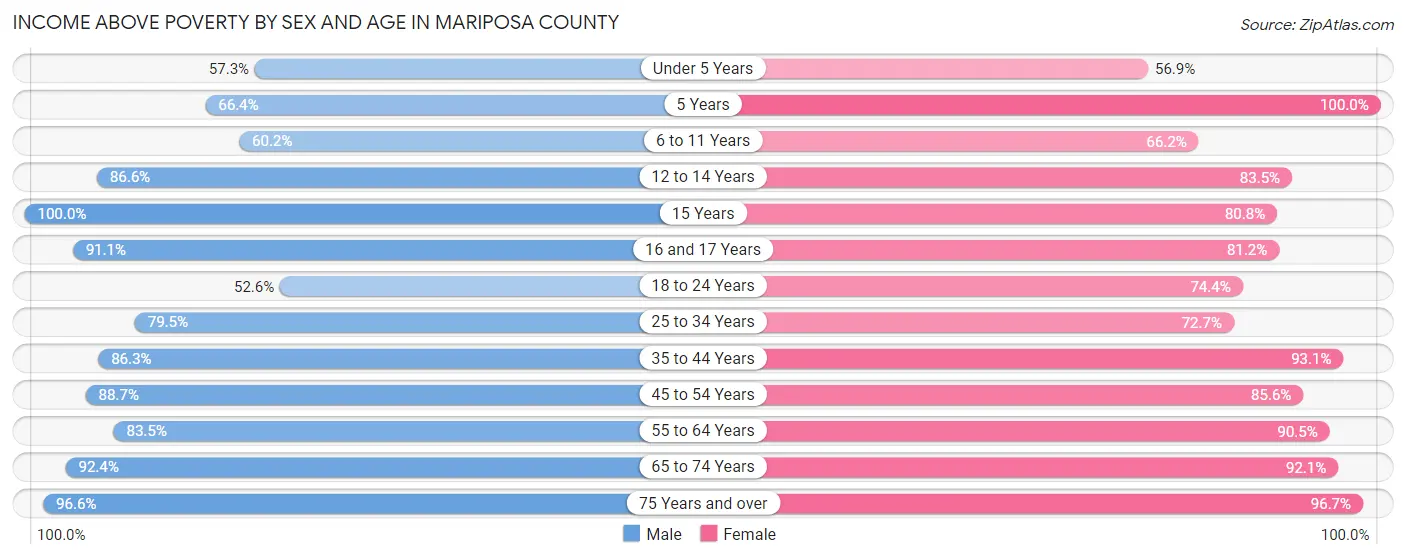
| Age Bracket | Male | Female |
| Under 5 Years | 146 (57.3%) | 195 (56.9%) |
| 5 Years | 99 (66.4%) | 56 (100.0%) |
| 6 to 11 Years | 399 (60.2%) | 353 (66.2%) |
| 12 to 14 Years | 116 (86.6%) | 198 (83.5%) |
| 15 Years | 80 (100.0%) | 42 (80.8%) |
| 16 and 17 Years | 102 (91.1%) | 224 (81.2%) |
| 18 to 24 Years | 265 (52.6%) | 235 (74.4%) |
| 25 to 34 Years | 762 (79.5%) | 667 (72.7%) |
| 35 to 44 Years | 720 (86.3%) | 819 (93.1%) |
| 45 to 54 Years | 838 (88.7%) | 733 (85.6%) |
| 55 to 64 Years | 1,158 (83.5%) | 1,328 (90.5%) |
| 65 to 74 Years | 1,326 (92.4%) | 1,294 (92.1%) |
| 75 Years and over | 1,036 (96.6%) | 1,057 (96.7%) |
| Total | 7,047 (82.6%) | 7,201 (85.4%) |
Income Below Poverty Among Married-Couple Families in Mariposa County
The poverty statistics for married-couple families in Mariposa County show that 4.8% or 170 of the total 3,521 families live below the poverty line. Families with 3 or 4 children have the highest poverty rate of 36.1%, comprising of 30 families. On the other hand, families with no children have the lowest poverty rate of 3.2%, which includes 83 families.
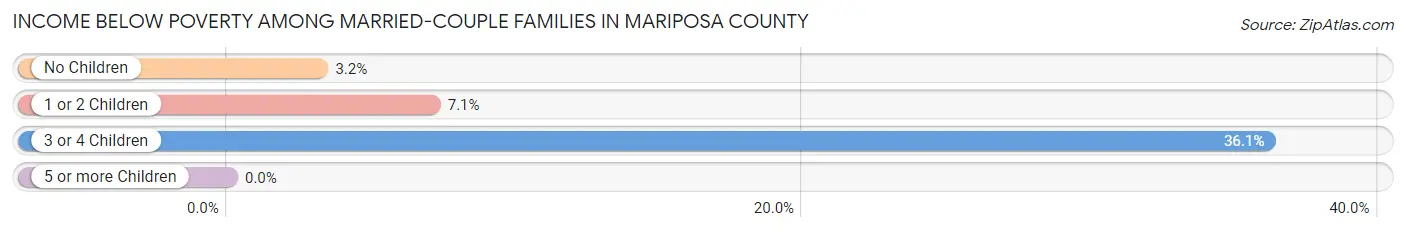
| Children | Above Poverty | Below Poverty |
| No Children | 2,548 (96.9%) | 83 (3.2%) |
| 1 or 2 Children | 750 (92.9%) | 57 (7.1%) |
| 3 or 4 Children | 53 (63.9%) | 30 (36.1%) |
| 5 or more Children | 0 (0.0%) | 0 (0.0%) |
| Total | 3,351 (95.2%) | 170 (4.8%) |
Income Below Poverty Among Single-Parent Households in Mariposa County
According to the poverty data in Mariposa County, 33.1% or 89 single-father households and 21.2% or 156 single-mother households are living below the poverty line. Among single-father households, those with 3 or 4 children have the highest poverty rate, with 89 households (100.0%) experiencing poverty. Likewise, among single-mother households, those with 3 or 4 children have the highest poverty rate, with 32 households (100.0%) falling below the poverty line.
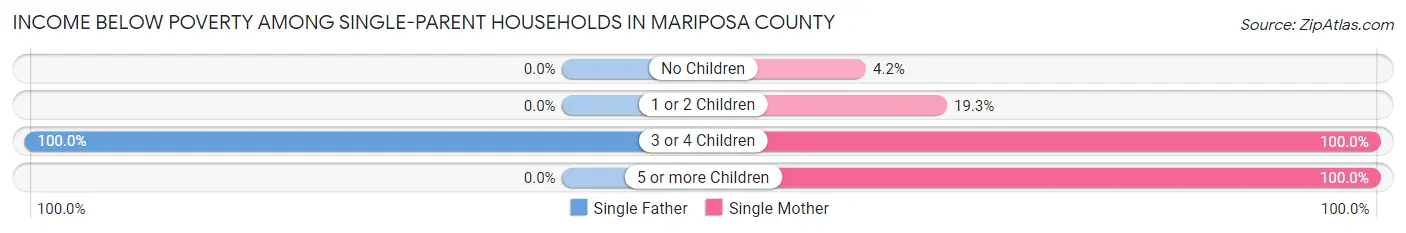
| Children | Single Father | Single Mother |
| No Children | 0 (0.0%) | 10 (4.2%) |
| 1 or 2 Children | 0 (0.0%) | 83 (19.3%) |
| 3 or 4 Children | 89 (100.0%) | 32 (100.0%) |
| 5 or more Children | 0 (0.0%) | 31 (100.0%) |
| Total | 89 (33.1%) | 156 (21.2%) |
Income Below Poverty Among Married-Couple vs Single-Parent Households in Mariposa County
The poverty data for Mariposa County shows that 170 of the married-couple family households (4.8%) and 245 of the single-parent households (24.4%) are living below the poverty level. Within the married-couple family households, those with 3 or 4 children have the highest poverty rate, with 30 households (36.1%) falling below the poverty line. Among the single-parent households, those with 3 or 4 children have the highest poverty rate, with 121 household (100.0%) living below poverty.
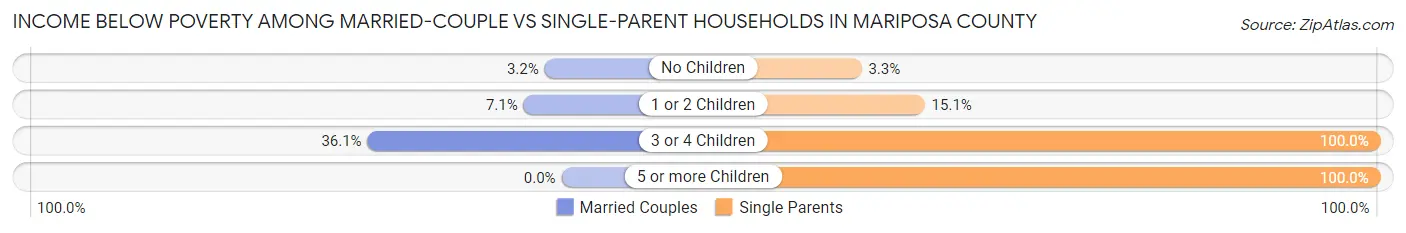
| Children | Married-Couple Families | Single-Parent Households |
| No Children | 83 (3.2%) | 10 (3.3%) |
| 1 or 2 Children | 57 (7.1%) | 83 (15.1%) |
| 3 or 4 Children | 30 (36.1%) | 121 (100.0%) |
| 5 or more Children | 0 (0.0%) | 31 (100.0%) |
| Total | 170 (4.8%) | 245 (24.4%) |
Race in Mariposa County
The most populous races in Mariposa County are White / Caucasian (14,043 | 82.0%), Hispanic or Latino (2,223 | 13.0%), and Two or more Races (1,535 | 9.0%).
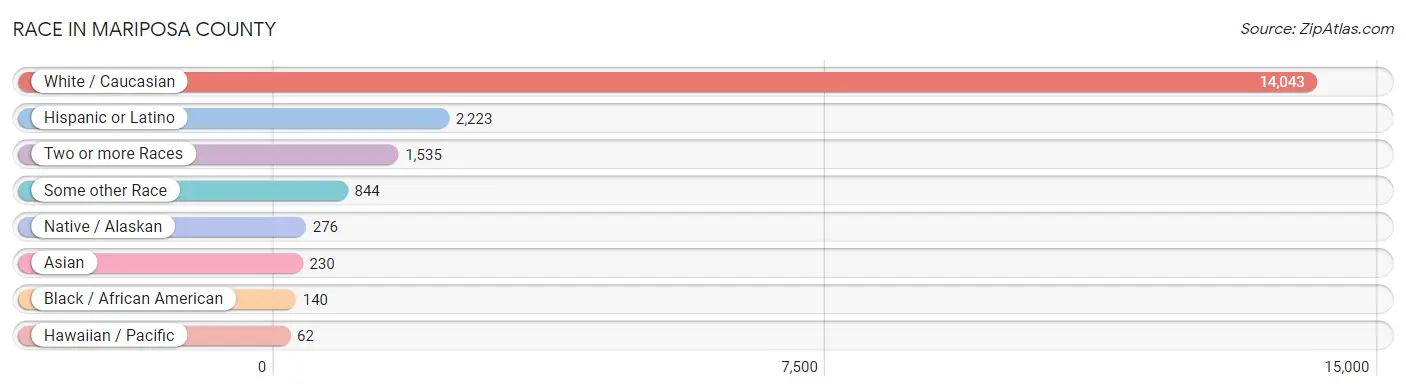
| Race | # Population | % Population |
| Asian | 230 | 1.3% |
| Black / African American | 140 | 0.8% |
| Hawaiian / Pacific | 62 | 0.4% |
| Hispanic or Latino | 2,223 | 13.0% |
| Native / Alaskan | 276 | 1.6% |
| White / Caucasian | 14,043 | 82.0% |
| Two or more Races | 1,535 | 9.0% |
| Some other Race | 844 | 4.9% |
| Total | 17,130 | 100.0% |
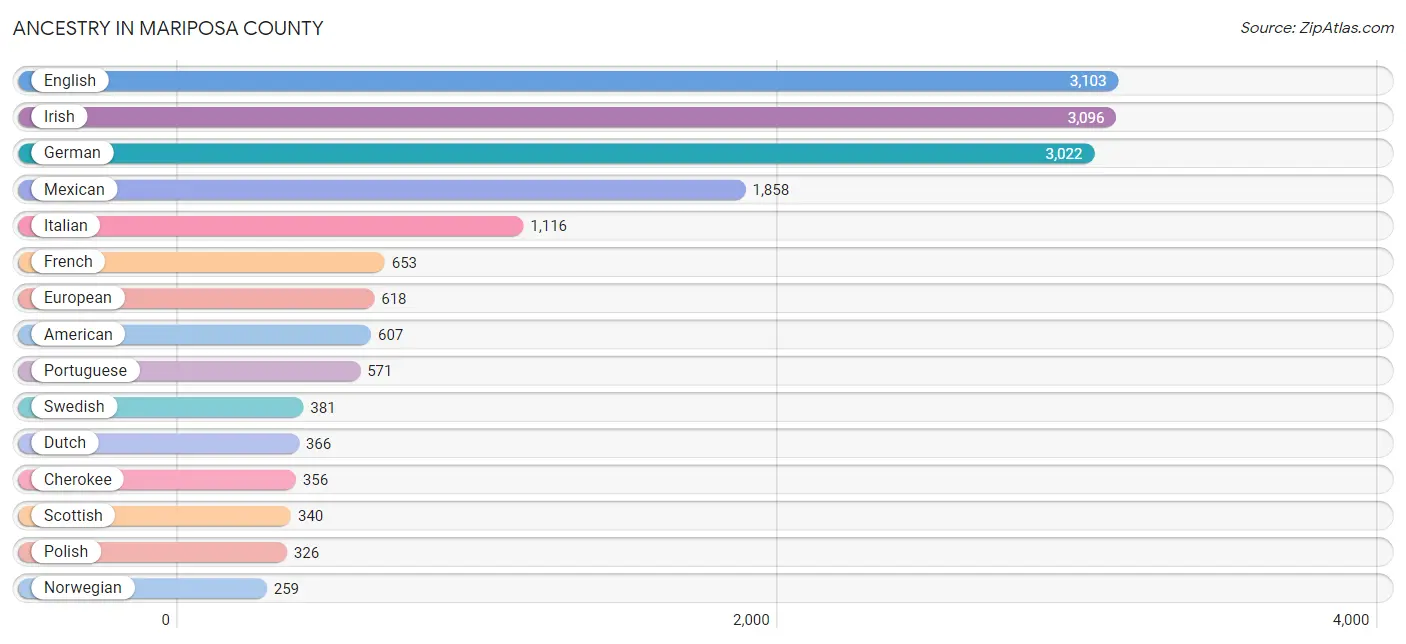
Ancestry in Mariposa County
The most populous ancestries reported in Mariposa County are English (3,103 | 18.1%), Irish (3,096 | 18.1%), German (3,022 | 17.6%), Mexican (1,858 | 10.8%), and Italian (1,116 | 6.5%), together accounting for 71.2% of all Mariposa County residents.
| Ancestry | # Population | % Population |
| African | 30 | 0.2% |
| American | 607 | 3.5% |
| Apache | 48 | 0.3% |
| Arab | 154 | 0.9% |
| Armenian | 46 | 0.3% |
| Australian | 32 | 0.2% |
| Austrian | 30 | 0.2% |
| Bangladeshi | 8 | 0.1% |
| Belgian | 25 | 0.2% |
| Bhutanese | 45 | 0.3% |
| Blackfeet | 55 | 0.3% |
| Brazilian | 36 | 0.2% |
| British | 158 | 0.9% |
| Burmese | 43 | 0.3% |
| Canadian | 21 | 0.1% |
| Celtic | 9 | 0.1% |
| Central American | 48 | 0.3% |
| Cherokee | 356 | 2.1% |
| Chickasaw | 21 | 0.1% |
| Chilean | 4 | 0.0% |
| Chippewa | 128 | 0.7% |
| Choctaw | 32 | 0.2% |
| Colombian | 45 | 0.3% |
| Creek | 9 | 0.1% |
| Croatian | 27 | 0.2% |
| Cuban | 8 | 0.1% |
| Czech | 25 | 0.2% |
| Czechoslovakian | 19 | 0.1% |
| Danish | 42 | 0.3% |
| Dutch | 366 | 2.1% |
| Dutch West Indian | 12 | 0.1% |
| Eastern European | 42 | 0.3% |
| Ecuadorian | 9 | 0.1% |
| Egyptian | 40 | 0.2% |
| English | 3,103 | 18.1% |
| Estonian | 14 | 0.1% |
| European | 618 | 3.6% |
| Finnish | 65 | 0.4% |
| French | 653 | 3.8% |
| French Canadian | 50 | 0.3% |
| German | 3,022 | 17.6% |
| Greek | 53 | 0.3% |
| Guamanian / Chamorro | 44 | 0.3% |
| Guatemalan | 12 | 0.1% |
| Haitian | 44 | 0.3% |
| Honduran | 13 | 0.1% |
| Houma | 7 | 0.0% |
| Hungarian | 109 | 0.6% |
| Indian (Asian) | 107 | 0.6% |
| Iranian | 30 | 0.2% |
| Iraqi | 39 | 0.2% |
| Irish | 3,096 | 18.1% |
| Italian | 1,116 | 6.5% |
| Kenyan | 30 | 0.2% |
| Korean | 112 | 0.6% |
| Lithuanian | 15 | 0.1% |
| Luxembourger | 4 | 0.0% |
| Malaysian | 35 | 0.2% |
| Mexican | 1,858 | 10.8% |
| Mexican American Indian | 33 | 0.2% |
| Native Hawaiian | 17 | 0.1% |
| Navajo | 15 | 0.1% |
| Nicaraguan | 23 | 0.1% |
| Northern European | 45 | 0.3% |
| Norwegian | 259 | 1.5% |
| Paiute | 28 | 0.2% |
| Pakistani | 22 | 0.1% |
| Pennsylvania German | 8 | 0.1% |
| Peruvian | 4 | 0.0% |
| Polish | 326 | 1.9% |
| Portuguese | 571 | 3.3% |
| Puerto Rican | 76 | 0.4% |
| Russian | 173 | 1.0% |
| Scandinavian | 79 | 0.5% |
| Scotch-Irish | 184 | 1.1% |
| Scottish | 340 | 2.0% |
| Sioux | 18 | 0.1% |
| Slovak | 11 | 0.1% |
| South American | 62 | 0.4% |
| Spaniard | 27 | 0.2% |
| Spanish | 37 | 0.2% |
| Sri Lankan | 42 | 0.3% |
| Subsaharan African | 30 | 0.2% |
| Swedish | 381 | 2.2% |
| Swiss | 18 | 0.1% |
| Tohono O'Odham | 103 | 0.6% |
| Ukrainian | 8 | 0.1% |
| Welsh | 97 | 0.6% |
| Yaqui | 13 | 0.1% |
| Yugoslavian | 24 | 0.1% | View All 90 Rows |
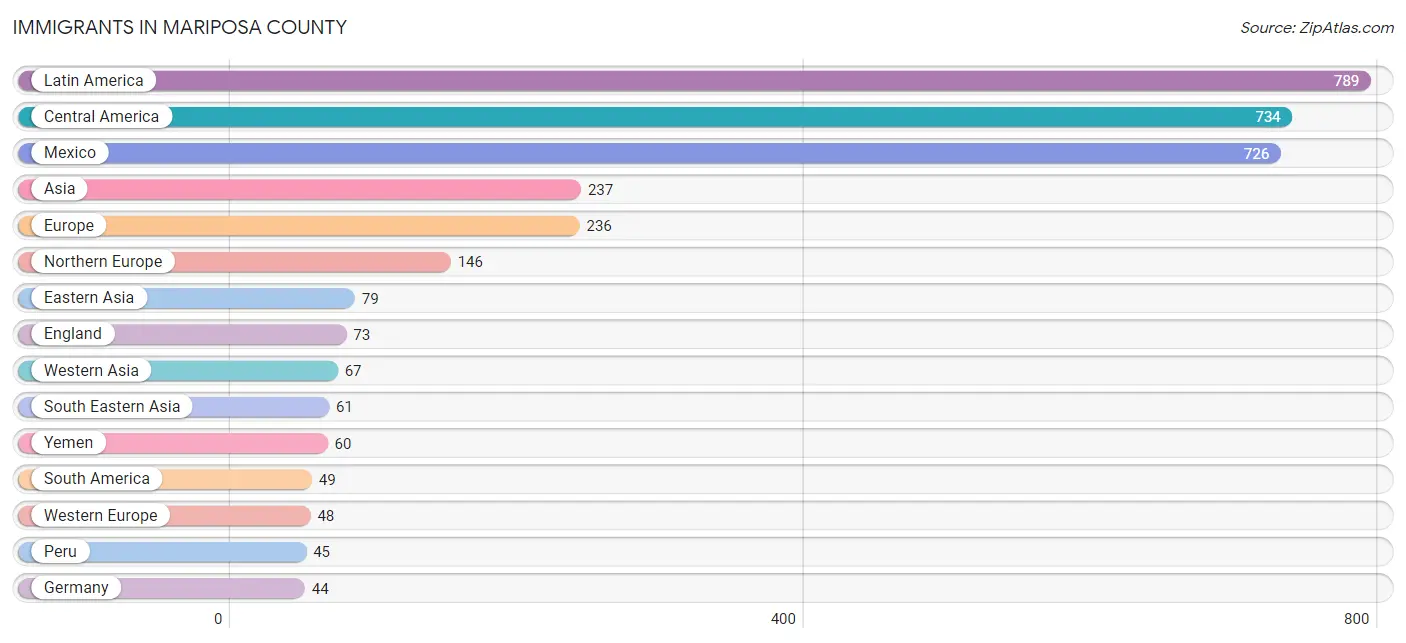
Immigrants in Mariposa County
The most numerous immigrant groups reported in Mariposa County came from Latin America (789 | 4.6%), Central America (734 | 4.3%), Mexico (726 | 4.2%), Asia (237 | 1.4%), and Europe (236 | 1.4%), together accounting for 15.9% of all Mariposa County residents.
| Immigration Origin | # Population | % Population |
| Africa | 30 | 0.2% |
| Asia | 237 | 1.4% |
| Australia | 23 | 0.1% |
| Canada | 38 | 0.2% |
| Caribbean | 6 | 0.0% |
| Central America | 734 | 4.3% |
| Chile | 4 | 0.0% |
| China | 15 | 0.1% |
| Cuba | 6 | 0.0% |
| Eastern Africa | 30 | 0.2% |
| Eastern Asia | 79 | 0.5% |
| Eastern Europe | 14 | 0.1% |
| England | 73 | 0.4% |
| Europe | 236 | 1.4% |
| Germany | 44 | 0.3% |
| Guatemala | 2 | 0.0% |
| Hong Kong | 5 | 0.0% |
| Iran | 30 | 0.2% |
| Italy | 6 | 0.0% |
| Japan | 35 | 0.2% |
| Kenya | 30 | 0.2% |
| Korea | 29 | 0.2% |
| Laos | 22 | 0.1% |
| Latin America | 789 | 4.6% |
| Mexico | 726 | 4.2% |
| Netherlands | 4 | 0.0% |
| Nicaragua | 6 | 0.0% |
| Northern Europe | 146 | 0.9% |
| Oceania | 23 | 0.1% |
| Peru | 45 | 0.3% |
| Philippines | 20 | 0.1% |
| Portugal | 22 | 0.1% |
| Singapore | 1 | 0.0% |
| South America | 49 | 0.3% |
| South Central Asia | 30 | 0.2% |
| South Eastern Asia | 61 | 0.4% |
| Southern Europe | 28 | 0.2% |
| Sweden | 11 | 0.1% |
| Syria | 7 | 0.0% |
| Thailand | 8 | 0.1% |
| Vietnam | 4 | 0.0% |
| Western Asia | 67 | 0.4% |
| Western Europe | 48 | 0.3% |
| Yemen | 60 | 0.4% | View All 44 Rows |
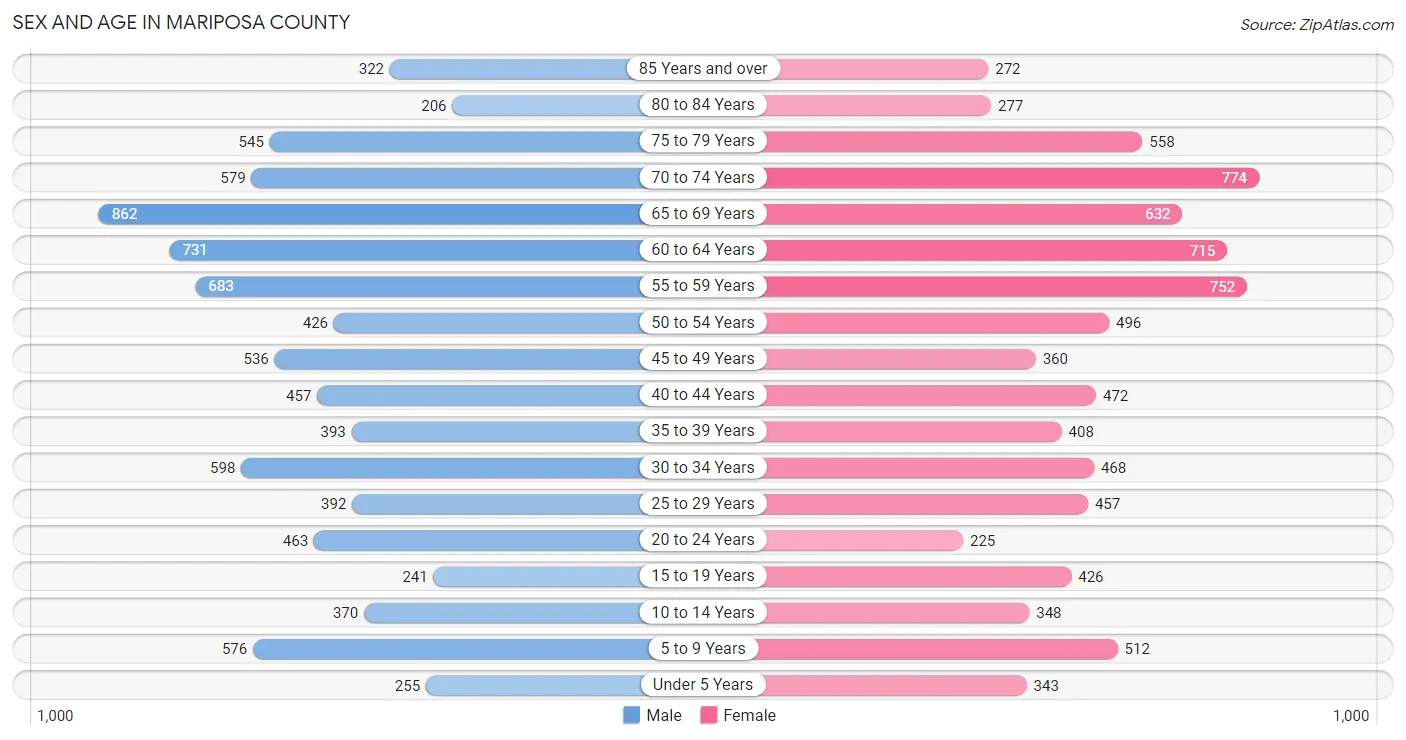
Sex and Age in Mariposa County
Sex and Age in Mariposa County
The most populous age groups in Mariposa County are 65 to 69 Years (862 | 10.0%) for men and 70 to 74 Years (774 | 9.1%) for women.
| Age Bracket | Male | Female |
| Under 5 Years | 255 (2.9%) | 343 (4.0%) |
| 5 to 9 Years | 576 (6.7%) | 512 (6.0%) |
| 10 to 14 Years | 370 (4.3%) | 348 (4.1%) |
| 15 to 19 Years | 241 (2.8%) | 426 (5.0%) |
| 20 to 24 Years | 463 (5.4%) | 225 (2.6%) |
| 25 to 29 Years | 392 (4.5%) | 457 (5.4%) |
| 30 to 34 Years | 598 (6.9%) | 468 (5.5%) |
| 35 to 39 Years | 393 (4.5%) | 408 (4.8%) |
| 40 to 44 Years | 457 (5.3%) | 472 (5.6%) |
| 45 to 49 Years | 536 (6.2%) | 360 (4.2%) |
| 50 to 54 Years | 426 (4.9%) | 496 (5.8%) |
| 55 to 59 Years | 683 (7.9%) | 752 (8.8%) |
| 60 to 64 Years | 731 (8.5%) | 715 (8.4%) |
| 65 to 69 Years | 862 (10.0%) | 632 (7.4%) |
| 70 to 74 Years | 579 (6.7%) | 774 (9.1%) |
| 75 to 79 Years | 545 (6.3%) | 558 (6.6%) |
| 80 to 84 Years | 206 (2.4%) | 277 (3.3%) |
| 85 Years and over | 322 (3.7%) | 272 (3.2%) |
| Total | 8,635 (100.0%) | 8,495 (100.0%) |
Families and Households in Mariposa County
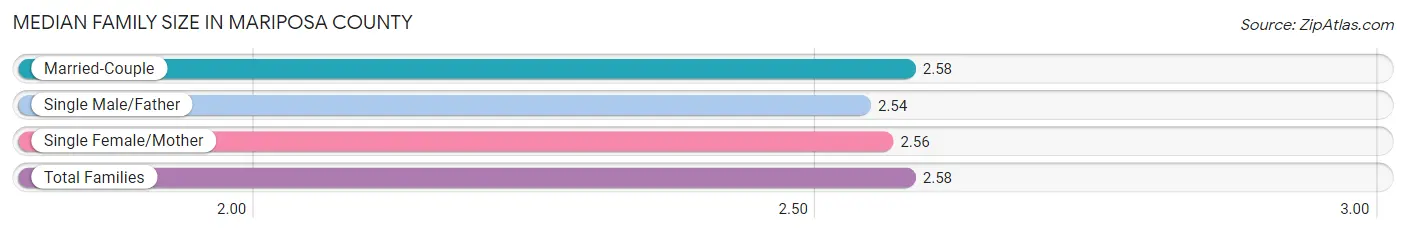
Median Family Size in Mariposa County
The median family size in Mariposa County is 2.58 persons per family, with married-couple families (3,521 | 77.8%) accounting for the largest median family size of 2.58 persons per family. On the other hand, single male/father families (269 | 5.9%) represent the smallest median family size with 2.54 persons per family.
| Family Type | # Families | Family Size |
| Married-Couple | 3,521 (77.8%) | 2.58 |
| Single Male/Father | 269 (5.9%) | 2.54 |
| Single Female/Mother | 734 (16.2%) | 2.56 |
| Total Families | 4,524 (100.0%) | 2.58 |
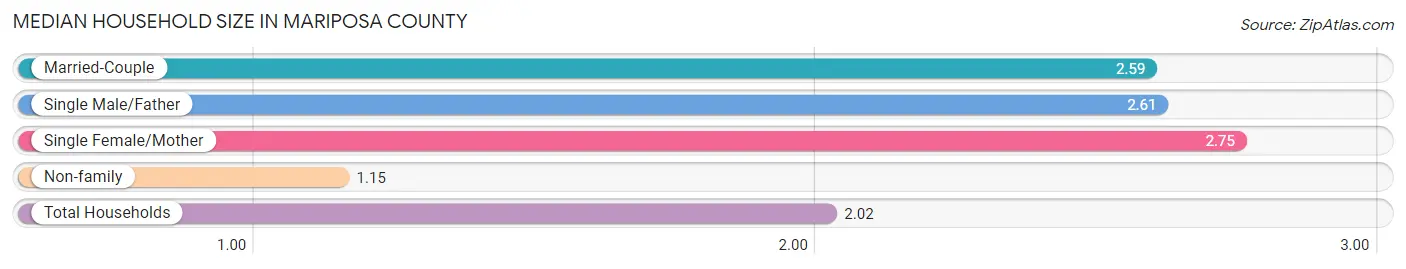
Median Household Size in Mariposa County
The median household size in Mariposa County is 2.02 persons per household, with single female/mother households (734 | 9.7%) accounting for the largest median household size of 2.75 persons per household. non-family households (3,073 | 40.5%) represent the smallest median household size with 1.15 persons per household.
| Household Type | # Households | Household Size |
| Married-Couple | 3,521 (46.4%) | 2.59 |
| Single Male/Father | 269 (3.5%) | 2.61 |
| Single Female/Mother | 734 (9.7%) | 2.75 |
| Non-family | 3,073 (40.5%) | 1.15 |
| Total Households | 7,597 (100.0%) | 2.02 |
Household Size by Marriage Status in Mariposa County
Out of a total of 7,597 households in Mariposa County, 4,524 (59.6%) are family households, while 3,073 (40.5%) are nonfamily households. The most numerous type of family households are 2-person households, comprising 2,487, and the most common type of nonfamily households are 1-person households, comprising 2,491.
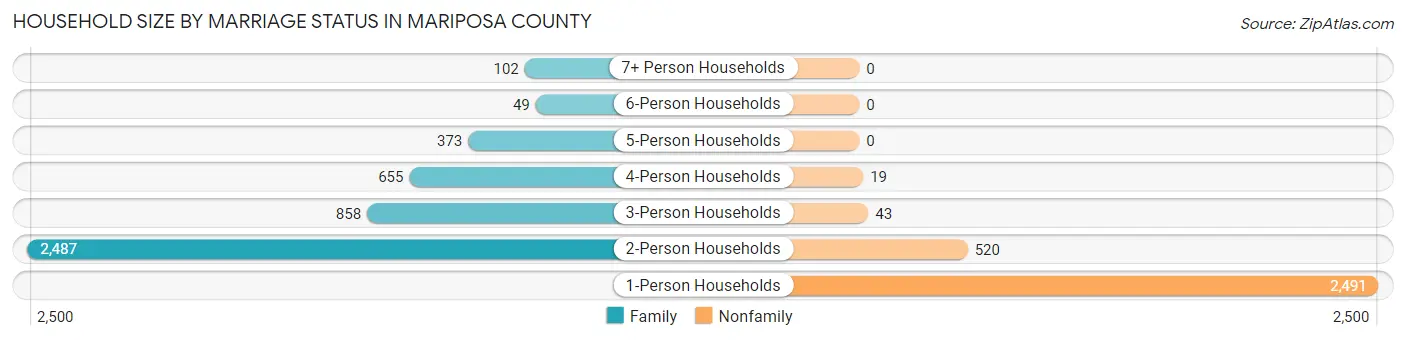
| Household Size | Family Households | Nonfamily Households |
| 1-Person Households | - | 2,491 (32.8%) |
| 2-Person Households | 2,487 (32.7%) | 520 (6.8%) |
| 3-Person Households | 858 (11.3%) | 43 (0.6%) |
| 4-Person Households | 655 (8.6%) | 19 (0.3%) |
| 5-Person Households | 373 (4.9%) | 0 (0.0%) |
| 6-Person Households | 49 (0.6%) | 0 (0.0%) |
| 7+ Person Households | 102 (1.3%) | 0 (0.0%) |
| Total | 4,524 (59.6%) | 3,073 (40.5%) |
Female Fertility in Mariposa County
Fertility by Age in Mariposa County
Average fertility rate in Mariposa County is 13.0 births per 1,000 women. Women in the age bracket of 20 to 34 years have the highest fertility rate with 17.0 births per 1,000 women. Women in the age bracket of 20 to 34 years acount for 52.8% of all women with births.
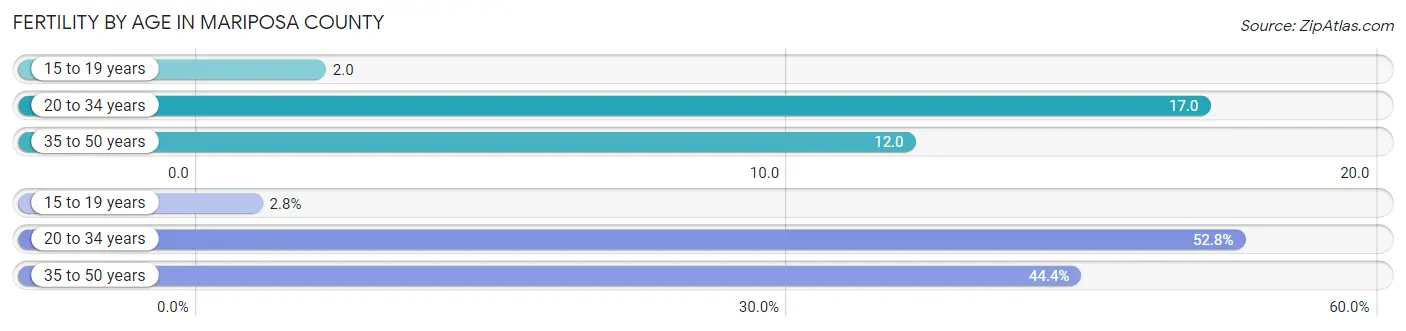
| Age Bracket | Women with Births | Births / 1,000 Women |
| 15 to 19 years | 1 (2.8%) | 2.0 |
| 20 to 34 years | 19 (52.8%) | 17.0 |
| 35 to 50 years | 16 (44.4%) | 12.0 |
| Total | 36 (100.0%) | 13.0 |
Fertility by Age by Marriage Status in Mariposa County
97.2% of women with births (36) in Mariposa County are married. The highest percentage of unmarried women with births falls into 15 to 19 years age bracket with 100.0% of them unmarried at the time of birth, while the lowest percentage of unmarried women with births belong to 20 to 34 years age bracket with 0.0% of them unmarried.
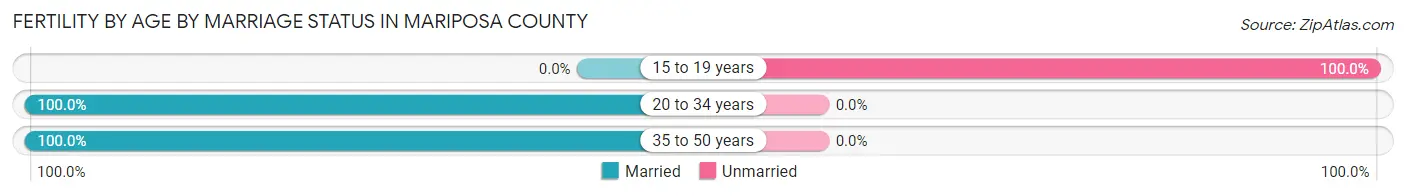
| Age Bracket | Married | Unmarried |
| 15 to 19 years | 0 (0.0%) | 1 (100.0%) |
| 20 to 34 years | 19 (100.0%) | 0 (0.0%) |
| 35 to 50 years | 16 (100.0%) | 0 (0.0%) |
| Total | 35 (97.2%) | 1 (2.8%) |
Fertility by Education in Mariposa County
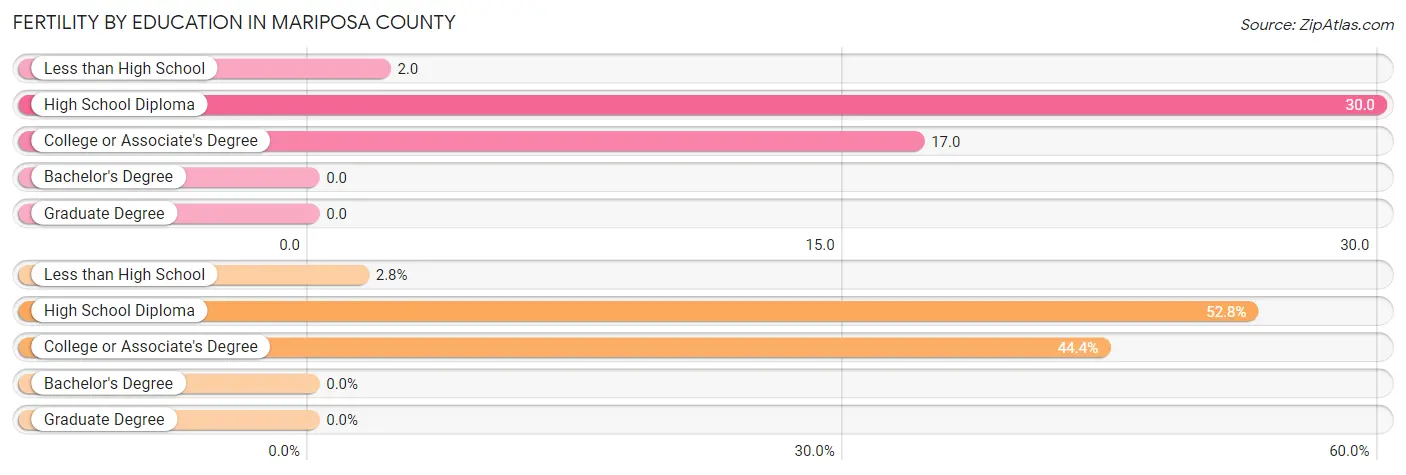
| Educational Attainment | Women with Births | Births / 1,000 Women |
| Less than High School | 1 (2.8%) | 2.0 |
| High School Diploma | 19 (52.8%) | 30.0 |
| College or Associate's Degree | 16 (44.4%) | 17.0 |
| Bachelor's Degree | 0 (0.0%) | 0.0 |
| Graduate Degree | 0 (0.0%) | 0.0 |
| Total | 36 (100.0%) | 13.0 |
Fertility by Education by Marriage Status in Mariposa County
2.8% of women with births in Mariposa County are unmarried. Women with the educational attainment of high school diploma are most likely to be married with 100.0% of them married at childbirth, while women with the educational attainment of less than high school are least likely to be married with 100.0% of them unmarried at childbirth.
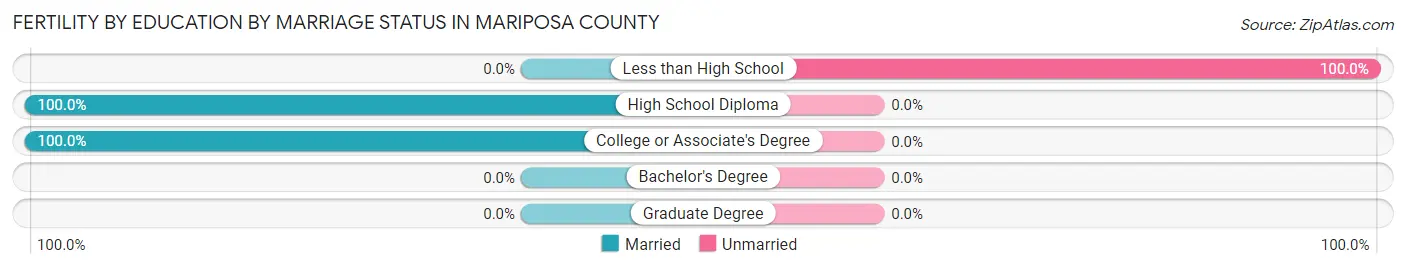
| Educational Attainment | Married | Unmarried |
| Less than High School | 0 (0.0%) | 1 (100.0%) |
| High School Diploma | 19 (100.0%) | 0 (0.0%) |
| College or Associate's Degree | 16 (100.0%) | 0 (0.0%) |
| Bachelor's Degree | 0 (0.0%) | 0 (0.0%) |
| Graduate Degree | 0 (0.0%) | 0 (0.0%) |
| Total | 35 (97.2%) | 1 (2.8%) |
Employment Characteristics in Mariposa County
Employment by Class of Employer in Mariposa County
Among the 7,072 employed individuals in Mariposa County, private company employees (3,390 | 47.9%), local government employees (1,087 | 15.4%), and not-for-profit organizations (698 | 9.9%) make up the most common classes of employment.
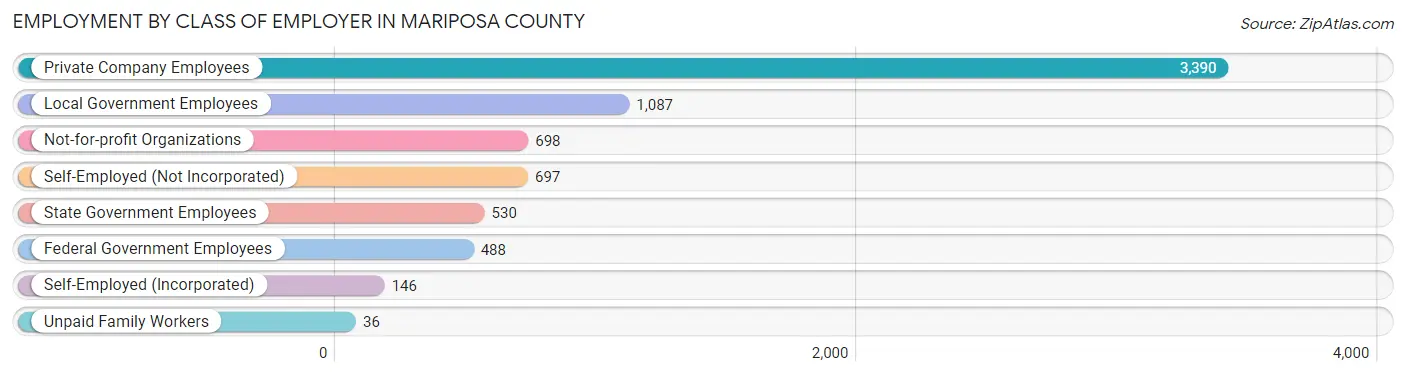
| Employer Class | # Employees | % Employees |
| Private Company Employees | 3,390 | 47.9% |
| Self-Employed (Incorporated) | 146 | 2.1% |
| Self-Employed (Not Incorporated) | 697 | 9.9% |
| Not-for-profit Organizations | 698 | 9.9% |
| Local Government Employees | 1,087 | 15.4% |
| State Government Employees | 530 | 7.5% |
| Federal Government Employees | 488 | 6.9% |
| Unpaid Family Workers | 36 | 0.5% |
| Total | 7,072 | 100.0% |
Employment Status by Age in Mariposa County
According to the labor force statistics for Mariposa County, out of the total population over 16 years of age (14,593), 53.0% or 7,734 individuals are in the labor force, with 6.2% or 480 of them unemployed. The age group with the highest labor force participation rate is 25 to 29 years, with 86.8% or 737 individuals in the labor force. Within the labor force, the 16 to 19 years age range has the highest percentage of unemployed individuals, with 22.8% or 49 of them being unemployed.
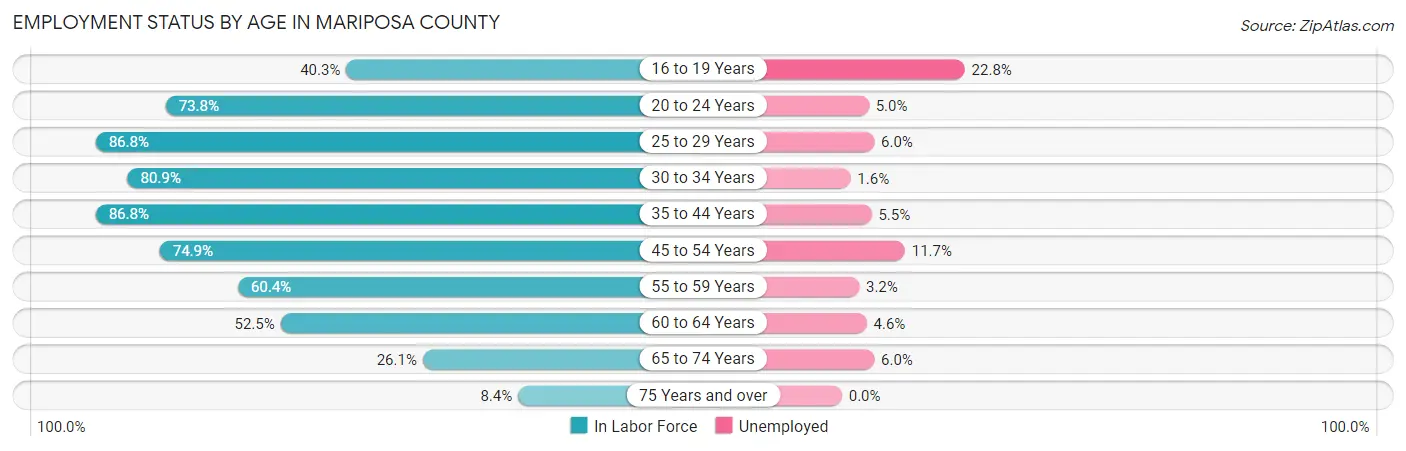
| Age Bracket | In Labor Force | Unemployed |
| 16 to 19 Years | 215 (40.3%) | 49 (22.8%) |
| 20 to 24 Years | 508 (73.8%) | 25 (5.0%) |
| 25 to 29 Years | 737 (86.8%) | 44 (6.0%) |
| 30 to 34 Years | 862 (80.9%) | 14 (1.6%) |
| 35 to 44 Years | 1,502 (86.8%) | 83 (5.5%) |
| 45 to 54 Years | 1,362 (74.9%) | 159 (11.7%) |
| 55 to 59 Years | 867 (60.4%) | 28 (3.2%) |
| 60 to 64 Years | 759 (52.5%) | 35 (4.6%) |
| 65 to 74 Years | 743 (26.1%) | 45 (6.0%) |
| 75 Years and over | 183 (8.4%) | 0 (0.0%) |
| Total | 7,734 (53.0%) | 480 (6.2%) |
Employment Status by Educational Attainment in Mariposa County
According to labor force statistics for Mariposa County, 73.0% of individuals (6,091) out of the total population between 25 and 64 years of age (8,344) are in the labor force, with 6.0% or 365 of them being unemployed. The group with the highest labor force participation rate are those with the educational attainment of bachelor's degree or higher, with 82.7% or 2,065 individuals in the labor force. Within the labor force, individuals with less than high school education have the highest percentage of unemployment, with 8.6% or 23 of them being unemployed.
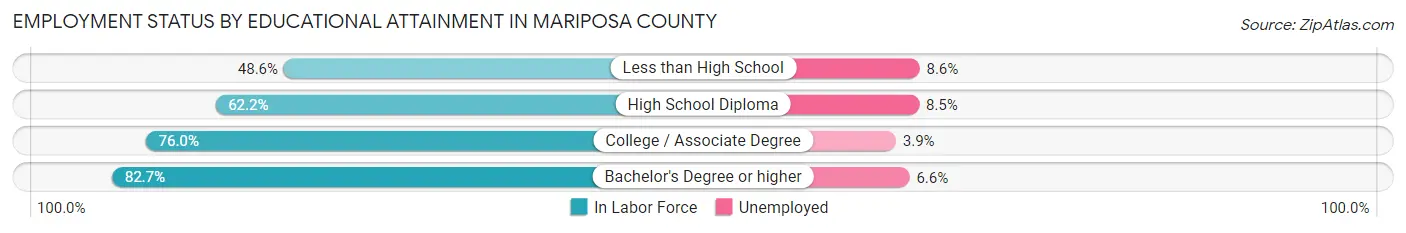
| Educational Attainment | In Labor Force | Unemployed |
| Less than High School | 269 (48.6%) | 48 (8.6%) |
| High School Diploma | 1,217 (62.2%) | 166 (8.5%) |
| College / Associate Degree | 2,535 (76.0%) | 130 (3.9%) |
| Bachelor's Degree or higher | 2,065 (82.7%) | 165 (6.6%) |
| Total | 6,091 (73.0%) | 501 (6.0%) |
Employment Occupations by Sex in Mariposa County
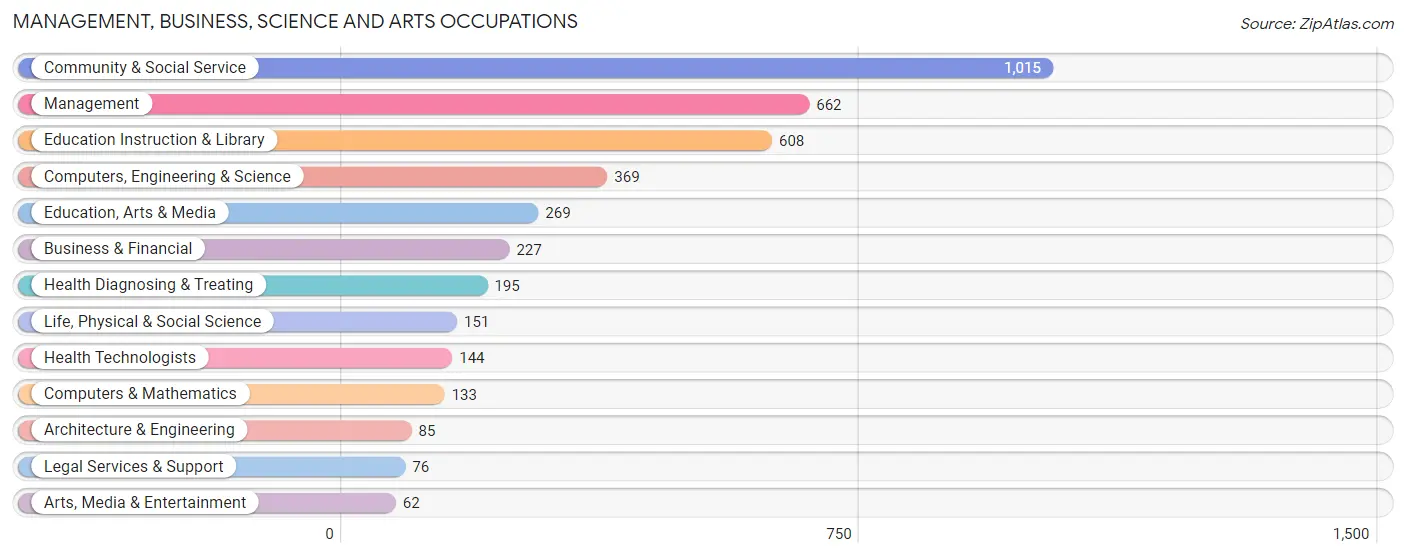
Management, Business, Science and Arts Occupations
The most common Management, Business, Science and Arts occupations in Mariposa County are Community & Social Service (1,015 | 14.0%), Management (662 | 9.1%), Education Instruction & Library (608 | 8.4%), Computers, Engineering & Science (369 | 5.1%), and Education, Arts & Media (269 | 3.7%).
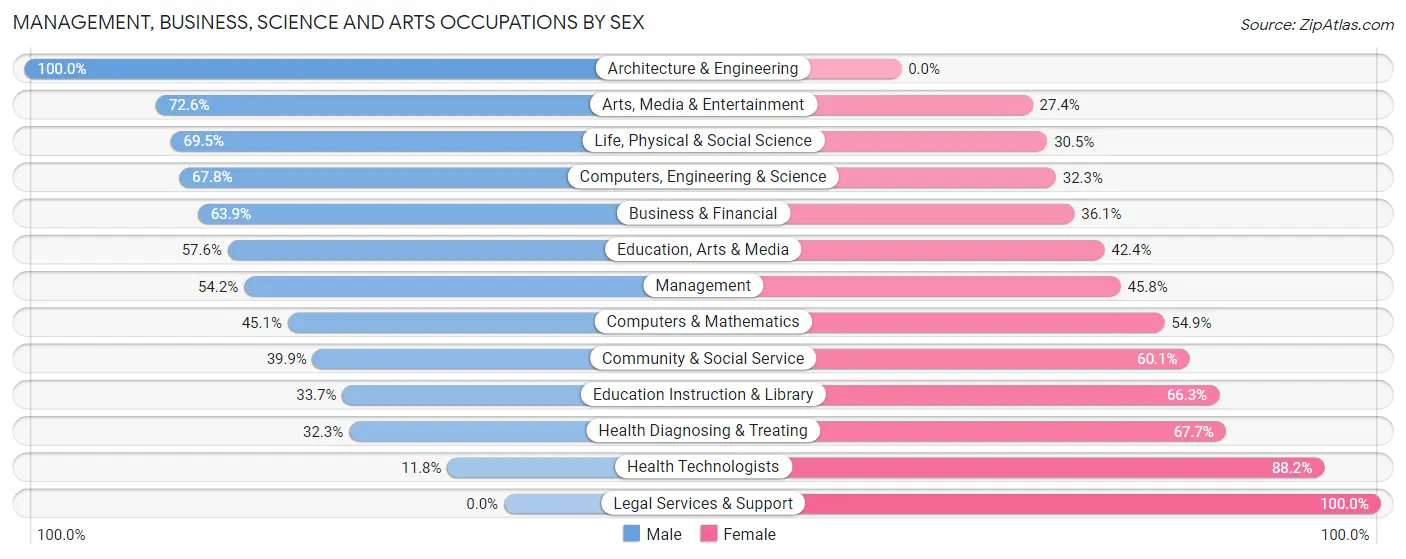
Management, Business, Science and Arts Occupations by Sex
Within the Management, Business, Science and Arts occupations in Mariposa County, the most male-oriented occupations are Architecture & Engineering (100.0%), Arts, Media & Entertainment (72.6%), and Life, Physical & Social Science (69.5%), while the most female-oriented occupations are Legal Services & Support (100.0%), Health Technologists (88.2%), and Health Diagnosing & Treating (67.7%).
| Occupation | Male | Female |
| Management | 359 (54.2%) | 303 (45.8%) |
| Business & Financial | 145 (63.9%) | 82 (36.1%) |
| Computers, Engineering & Science | 250 (67.7%) | 119 (32.3%) |
| Computers & Mathematics | 60 (45.1%) | 73 (54.9%) |
| Architecture & Engineering | 85 (100.0%) | 0 (0.0%) |
| Life, Physical & Social Science | 105 (69.5%) | 46 (30.5%) |
| Community & Social Service | 405 (39.9%) | 610 (60.1%) |
| Education, Arts & Media | 155 (57.6%) | 114 (42.4%) |
| Legal Services & Support | 0 (0.0%) | 76 (100.0%) |
| Education Instruction & Library | 205 (33.7%) | 403 (66.3%) |
| Arts, Media & Entertainment | 45 (72.6%) | 17 (27.4%) |
| Health Diagnosing & Treating | 63 (32.3%) | 132 (67.7%) |
| Health Technologists | 17 (11.8%) | 127 (88.2%) |
| Total (Category) | 1,222 (49.5%) | 1,246 (50.5%) |
| Total (Overall) | 3,934 (54.2%) | 3,318 (45.8%) |
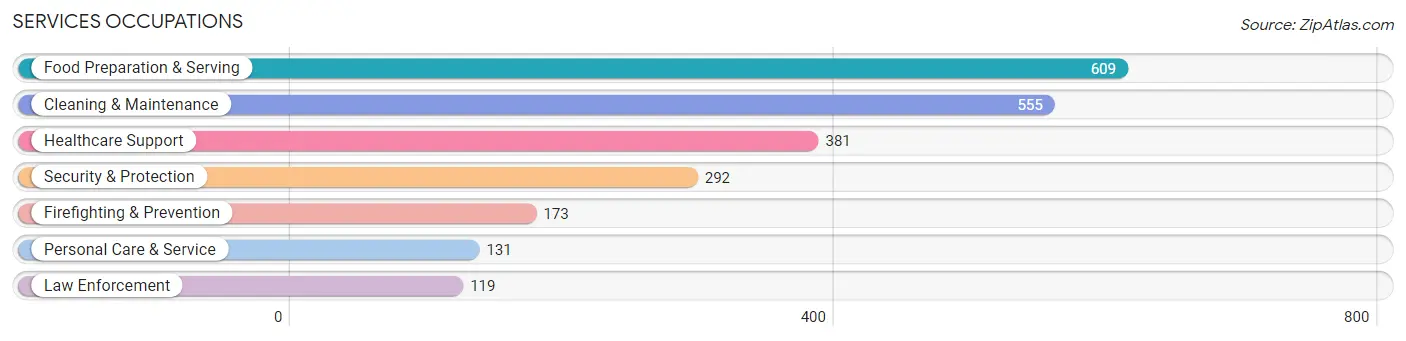
Services Occupations
The most common Services occupations in Mariposa County are Food Preparation & Serving (609 | 8.4%), Cleaning & Maintenance (555 | 7.6%), Healthcare Support (381 | 5.2%), Security & Protection (292 | 4.0%), and Firefighting & Prevention (173 | 2.4%).
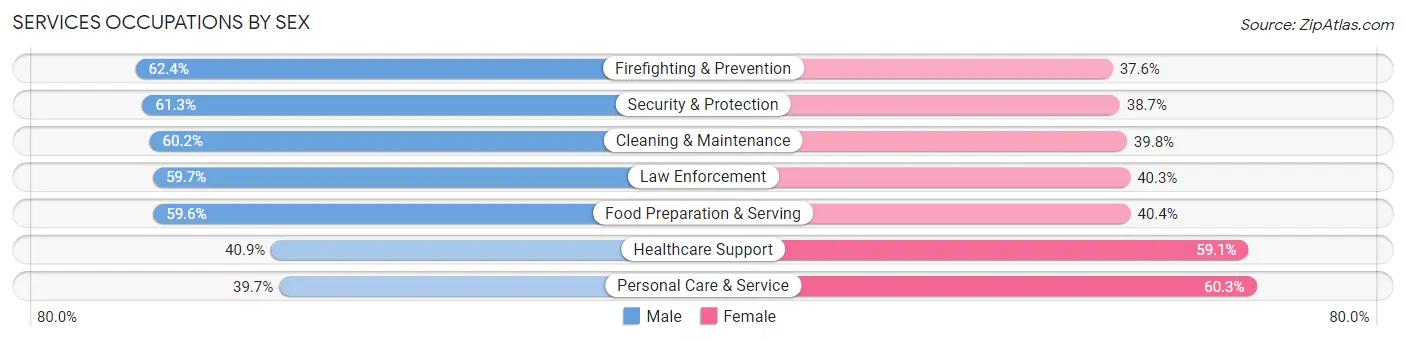
Services Occupations by Sex
Within the Services occupations in Mariposa County, the most male-oriented occupations are Firefighting & Prevention (62.4%), Security & Protection (61.3%), and Cleaning & Maintenance (60.2%), while the most female-oriented occupations are Personal Care & Service (60.3%), Healthcare Support (59.1%), and Food Preparation & Serving (40.4%).
| Occupation | Male | Female |
| Healthcare Support | 156 (40.9%) | 225 (59.1%) |
| Security & Protection | 179 (61.3%) | 113 (38.7%) |
| Firefighting & Prevention | 108 (62.4%) | 65 (37.6%) |
| Law Enforcement | 71 (59.7%) | 48 (40.3%) |
| Food Preparation & Serving | 363 (59.6%) | 246 (40.4%) |
| Cleaning & Maintenance | 334 (60.2%) | 221 (39.8%) |
| Personal Care & Service | 52 (39.7%) | 79 (60.3%) |
| Total (Category) | 1,084 (55.1%) | 884 (44.9%) |
| Total (Overall) | 3,934 (54.2%) | 3,318 (45.8%) |
Sales and Office Occupations
The most common Sales and Office occupations in Mariposa County are Office & Administration (731 | 10.1%), and Sales & Related (675 | 9.3%).
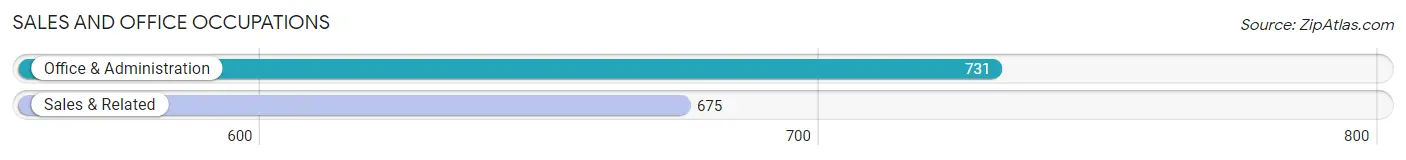
Sales and Office Occupations by Sex
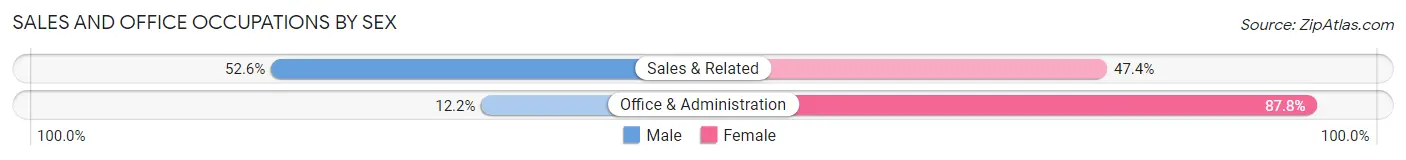
| Occupation | Male | Female |
| Sales & Related | 355 (52.6%) | 320 (47.4%) |
| Office & Administration | 89 (12.2%) | 642 (87.8%) |
| Total (Category) | 444 (31.6%) | 962 (68.4%) |
| Total (Overall) | 3,934 (54.2%) | 3,318 (45.8%) |
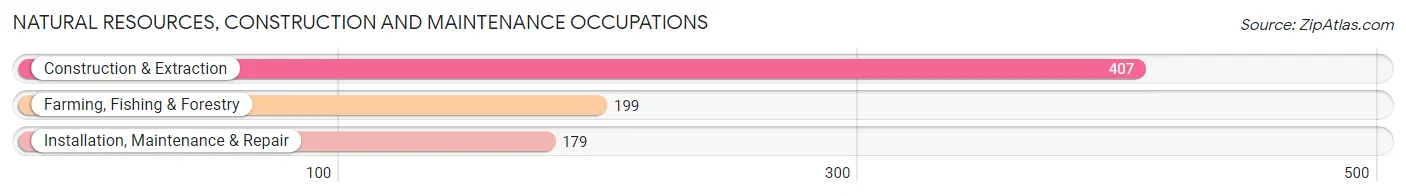
Natural Resources, Construction and Maintenance Occupations
The most common Natural Resources, Construction and Maintenance occupations in Mariposa County are Construction & Extraction (407 | 5.6%), Farming, Fishing & Forestry (199 | 2.7%), and Installation, Maintenance & Repair (179 | 2.5%).
Natural Resources, Construction and Maintenance Occupations by Sex
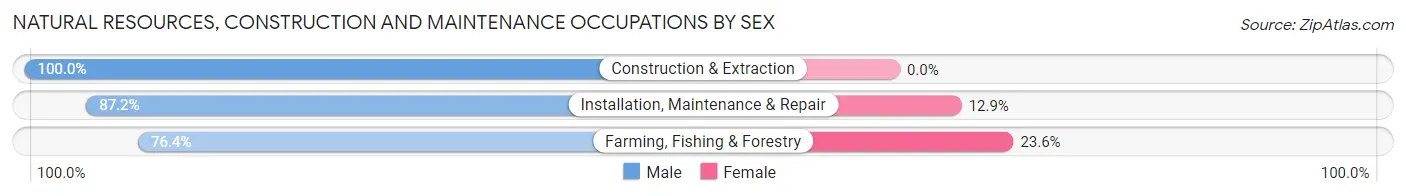
| Occupation | Male | Female |
| Farming, Fishing & Forestry | 152 (76.4%) | 47 (23.6%) |
| Construction & Extraction | 407 (100.0%) | 0 (0.0%) |
| Installation, Maintenance & Repair | 156 (87.2%) | 23 (12.9%) |
| Total (Category) | 715 (91.1%) | 70 (8.9%) |
| Total (Overall) | 3,934 (54.2%) | 3,318 (45.8%) |
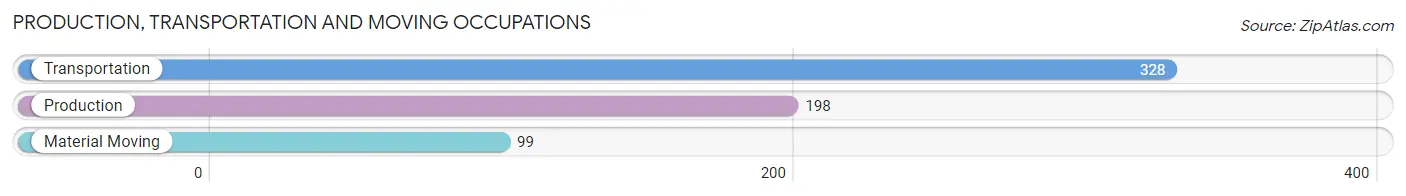
Production, Transportation and Moving Occupations
The most common Production, Transportation and Moving occupations in Mariposa County are Transportation (328 | 4.5%), Production (198 | 2.7%), and Material Moving (99 | 1.4%).
Production, Transportation and Moving Occupations by Sex
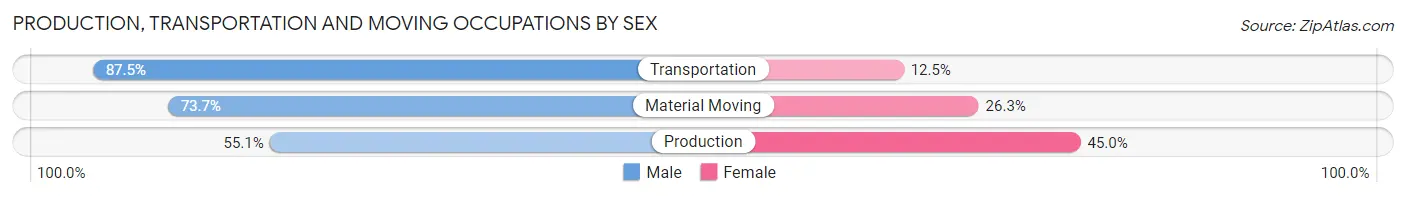
| Occupation | Male | Female |
| Production | 109 (55.0%) | 89 (45.0%) |
| Transportation | 287 (87.5%) | 41 (12.5%) |
| Material Moving | 73 (73.7%) | 26 (26.3%) |
| Total (Category) | 469 (75.0%) | 156 (25.0%) |
| Total (Overall) | 3,934 (54.2%) | 3,318 (45.8%) |
Employment Industries by Sex in Mariposa County
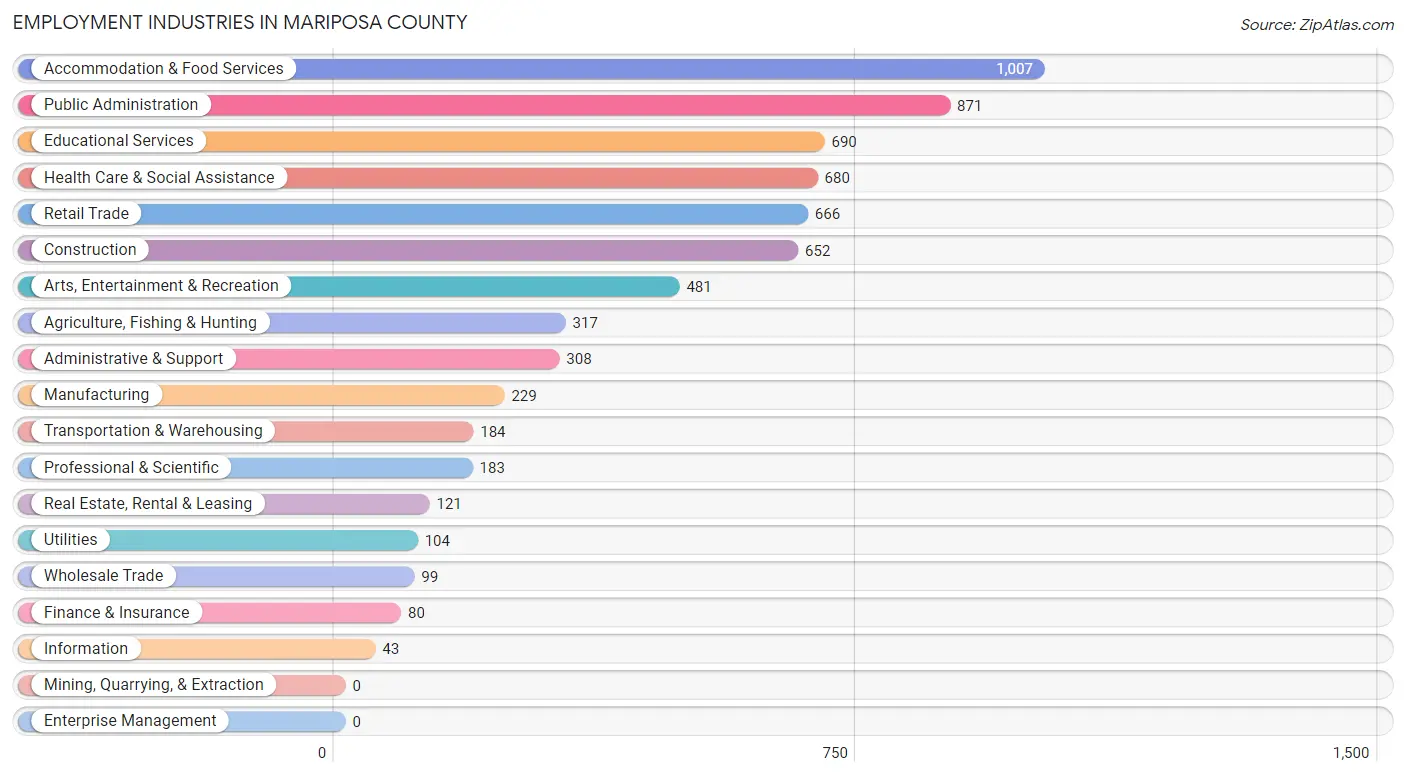
Employment Industries in Mariposa County
The major employment industries in Mariposa County include Accommodation & Food Services (1,007 | 13.9%), Public Administration (871 | 12.0%), Educational Services (690 | 9.5%), Health Care & Social Assistance (680 | 9.4%), and Retail Trade (666 | 9.2%).
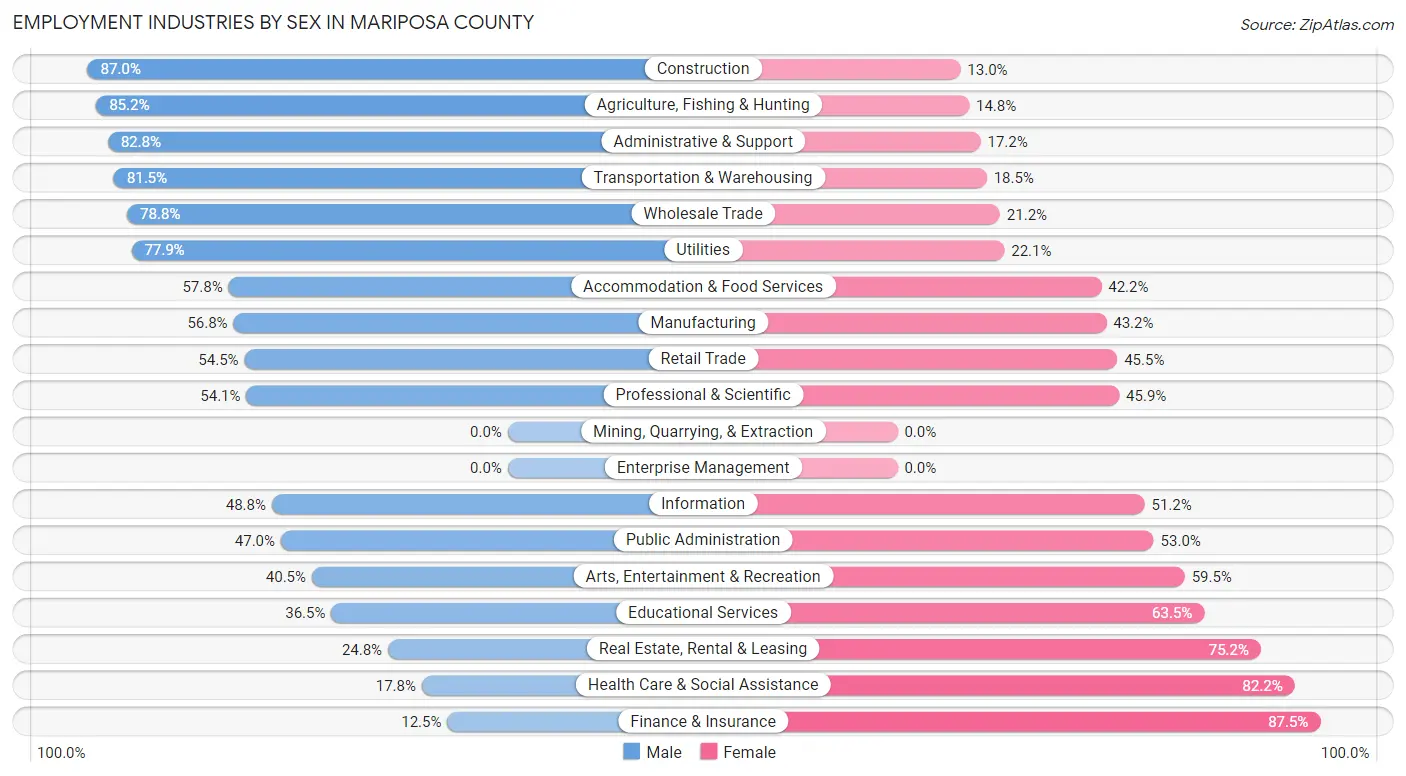
Employment Industries by Sex in Mariposa County
The Mariposa County industries that see more men than women are Construction (87.0%), Agriculture, Fishing & Hunting (85.2%), and Administrative & Support (82.8%), whereas the industries that tend to have a higher number of women are Finance & Insurance (87.5%), Health Care & Social Assistance (82.2%), and Real Estate, Rental & Leasing (75.2%).
| Industry | Male | Female |
| Agriculture, Fishing & Hunting | 270 (85.2%) | 47 (14.8%) |
| Mining, Quarrying, & Extraction | 0 (0.0%) | 0 (0.0%) |
| Construction | 567 (87.0%) | 85 (13.0%) |
| Manufacturing | 130 (56.8%) | 99 (43.2%) |
| Wholesale Trade | 78 (78.8%) | 21 (21.2%) |
| Retail Trade | 363 (54.5%) | 303 (45.5%) |
| Transportation & Warehousing | 150 (81.5%) | 34 (18.5%) |
| Utilities | 81 (77.9%) | 23 (22.1%) |
| Information | 21 (48.8%) | 22 (51.2%) |
| Finance & Insurance | 10 (12.5%) | 70 (87.5%) |
| Real Estate, Rental & Leasing | 30 (24.8%) | 91 (75.2%) |
| Professional & Scientific | 99 (54.1%) | 84 (45.9%) |
| Enterprise Management | 0 (0.0%) | 0 (0.0%) |
| Administrative & Support | 255 (82.8%) | 53 (17.2%) |
| Educational Services | 252 (36.5%) | 438 (63.5%) |
| Health Care & Social Assistance | 121 (17.8%) | 559 (82.2%) |
| Arts, Entertainment & Recreation | 195 (40.5%) | 286 (59.5%) |
| Accommodation & Food Services | 582 (57.8%) | 425 (42.2%) |
| Public Administration | 409 (47.0%) | 462 (53.0%) |
| Total | 3,934 (54.2%) | 3,318 (45.8%) |
Education in Mariposa County
School Enrollment in Mariposa County
The most common levels of schooling among the 3,068 students in Mariposa County are elementary school (809 | 26.4%), high school (651 | 21.2%), and middle school (620 | 20.2%).
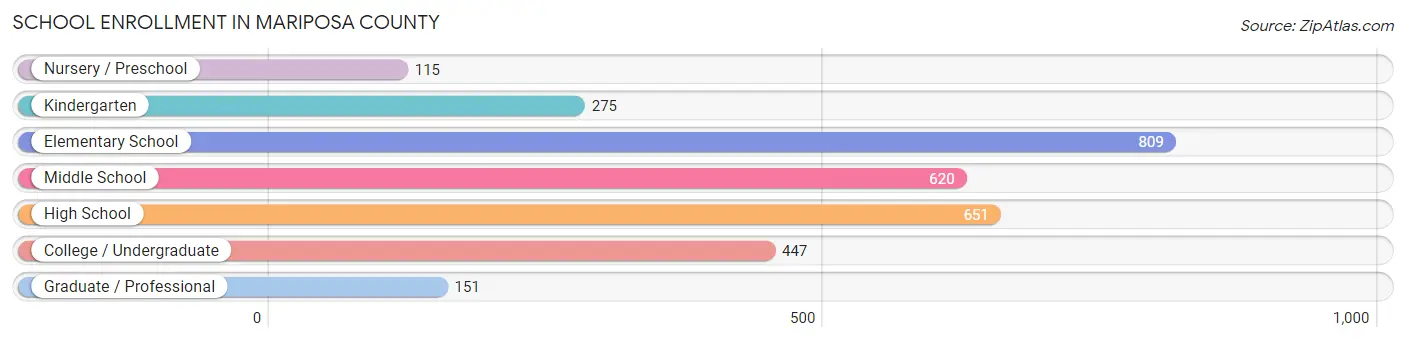
| School Level | # Students | % Students |
| Nursery / Preschool | 115 | 3.7% |
| Kindergarten | 275 | 9.0% |
| Elementary School | 809 | 26.4% |
| Middle School | 620 | 20.2% |
| High School | 651 | 21.2% |
| College / Undergraduate | 447 | 14.6% |
| Graduate / Professional | 151 | 4.9% |
| Total | 3,068 | 100.0% |
School Enrollment by Age by Funding Source in Mariposa County
Out of a total of 3,068 students who are enrolled in schools in Mariposa County, 494 (16.1%) attend a private institution, while the remaining 2,574 (83.9%) are enrolled in public schools. The age group of 25 to 34 year olds has the highest likelihood of being enrolled in private schools, with 69 (51.5% in the age bracket) enrolled. Conversely, the age group of 15 to 17 year olds has the lowest likelihood of being enrolled in a private school, with 509 (97.3% in the age bracket) attending a public institution.
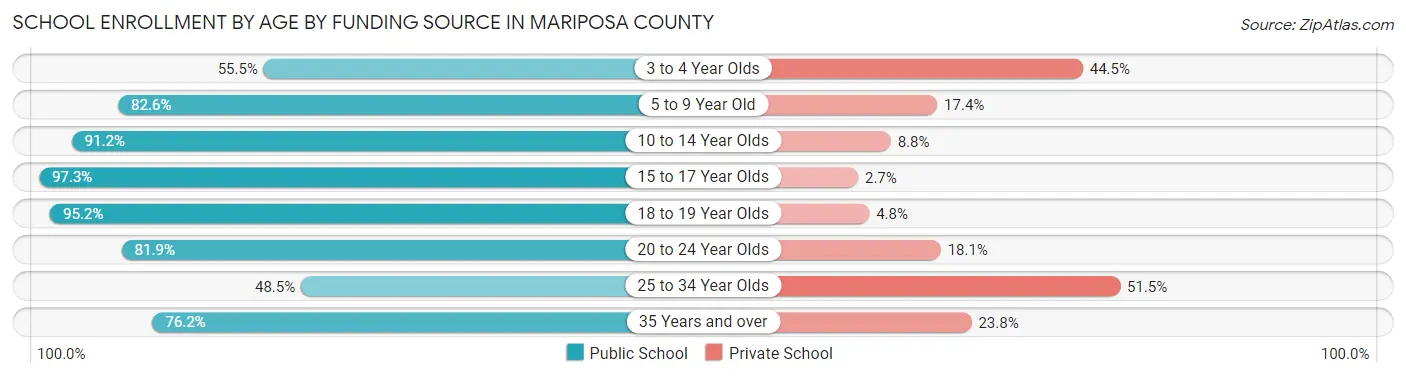
| Age Bracket | Public School | Private School |
| 3 to 4 Year Olds | 66 (55.5%) | 53 (44.5%) |
| 5 to 9 Year Old | 868 (82.6%) | 183 (17.4%) |
| 10 to 14 Year Olds | 655 (91.2%) | 63 (8.8%) |
| 15 to 17 Year Olds | 509 (97.3%) | 14 (2.7%) |
| 18 to 19 Year Olds | 20 (95.2%) | 1 (4.8%) |
| 20 to 24 Year Olds | 136 (81.9%) | 30 (18.1%) |
| 25 to 34 Year Olds | 65 (48.5%) | 69 (51.5%) |
| 35 Years and over | 256 (76.2%) | 80 (23.8%) |
| Total | 2,574 (83.9%) | 494 (16.1%) |
Educational Attainment by Field of Study in Mariposa County
Bio, nature & agricultural (509 | 11.8%), education (488 | 11.3%), social sciences (461 | 10.7%), business (458 | 10.6%), and science & technology (434 | 10.0%) are the most common fields of study among 4,323 individuals in Mariposa County who have obtained a bachelor's degree or higher.
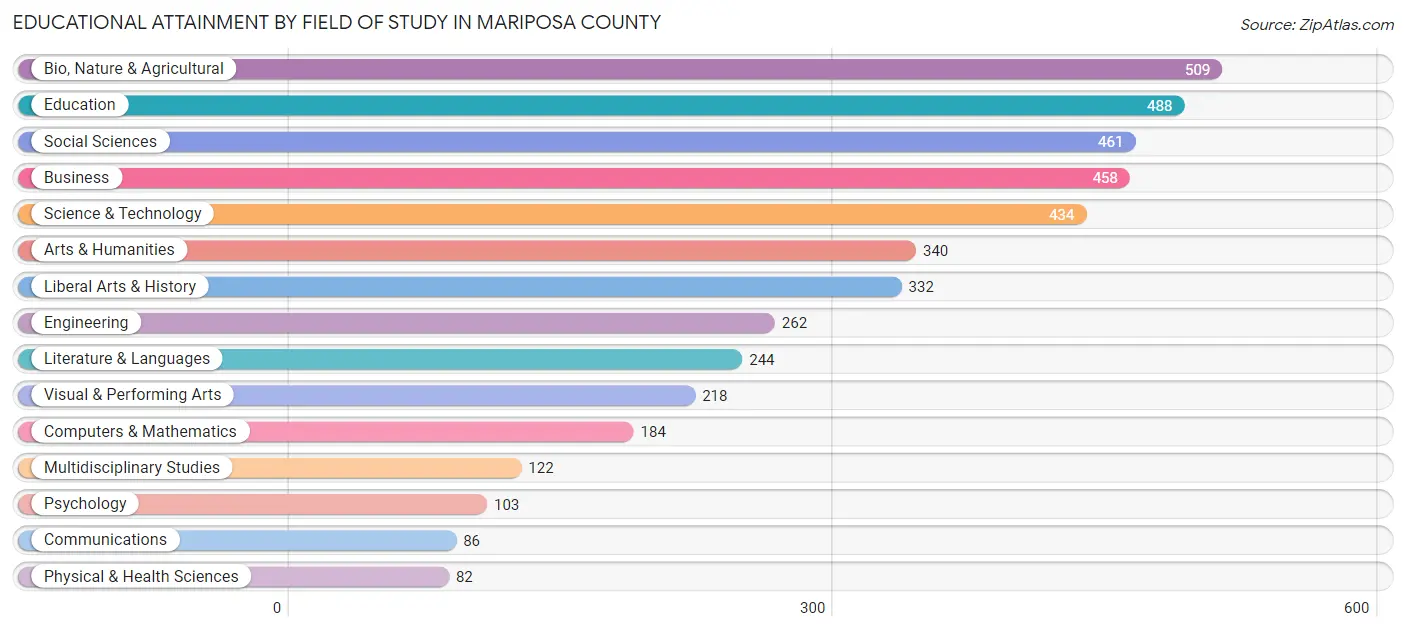
| Field of Study | # Graduates | % Graduates |
| Computers & Mathematics | 184 | 4.3% |
| Bio, Nature & Agricultural | 509 | 11.8% |
| Physical & Health Sciences | 82 | 1.9% |
| Psychology | 103 | 2.4% |
| Social Sciences | 461 | 10.7% |
| Engineering | 262 | 6.1% |
| Multidisciplinary Studies | 122 | 2.8% |
| Science & Technology | 434 | 10.0% |
| Business | 458 | 10.6% |
| Education | 488 | 11.3% |
| Literature & Languages | 244 | 5.6% |
| Liberal Arts & History | 332 | 7.7% |
| Visual & Performing Arts | 218 | 5.0% |
| Communications | 86 | 2.0% |
| Arts & Humanities | 340 | 7.9% |
| Total | 4,323 | 100.0% |
Transportation & Commute in Mariposa County
Vehicle Availability by Sex in Mariposa County
The most prevalent vehicle ownership categories in Mariposa County are males with 2 vehicles (975, accounting for 33.7%) and females with 2 vehicles (992, making up 33.6%).
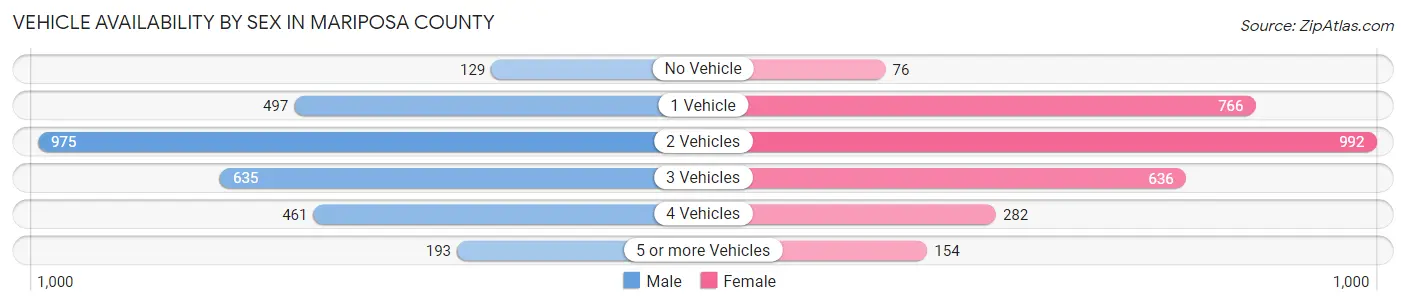
| Vehicles Available | Male | Female |
| No Vehicle | 129 (4.5%) | 76 (2.6%) |
| 1 Vehicle | 497 (17.2%) | 766 (26.4%) |
| 2 Vehicles | 975 (33.7%) | 992 (34.1%) |
| 3 Vehicles | 635 (22.0%) | 636 (21.9%) |
| 4 Vehicles | 461 (16.0%) | 282 (9.7%) |
| 5 or more Vehicles | 193 (6.7%) | 154 (5.3%) |
| Total | 2,890 (100.0%) | 2,906 (100.0%) |
Commute Time in Mariposa County
The most frequently occuring commute durations in Mariposa County are 15 to 19 minutes (919 commuters, 15.4%), 5 to 9 minutes (829 commuters, 13.9%), and 10 to 14 minutes (734 commuters, 12.3%).
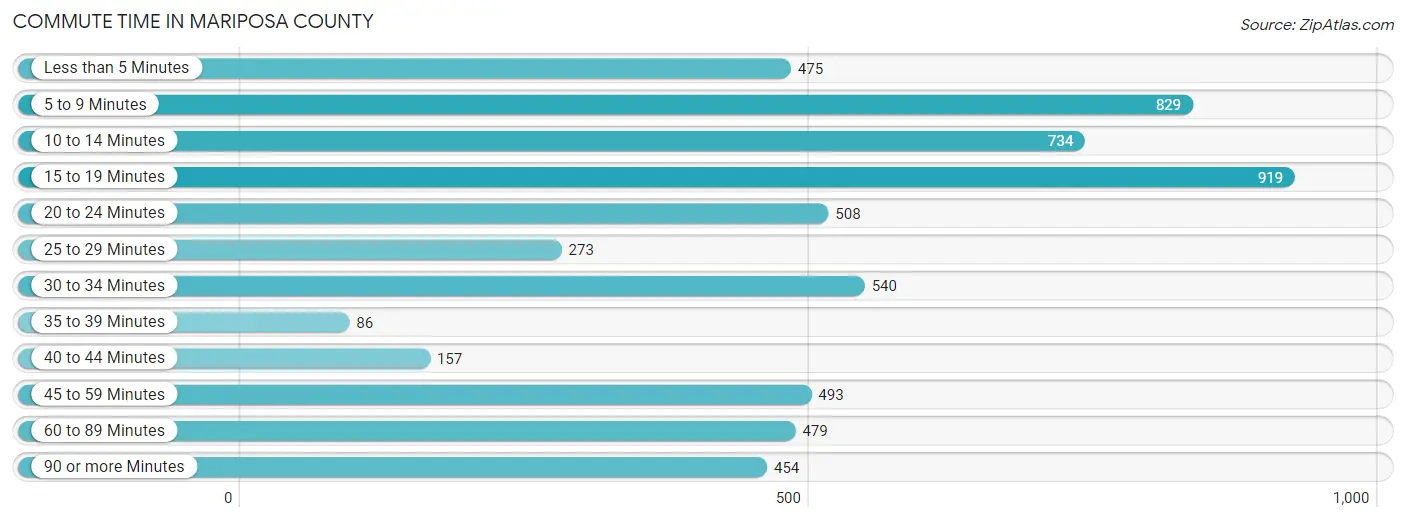
| Commute Time | # Commuters | % Commuters |
| Less than 5 Minutes | 475 | 8.0% |
| 5 to 9 Minutes | 829 | 13.9% |
| 10 to 14 Minutes | 734 | 12.3% |
| 15 to 19 Minutes | 919 | 15.4% |
| 20 to 24 Minutes | 508 | 8.5% |
| 25 to 29 Minutes | 273 | 4.6% |
| 30 to 34 Minutes | 540 | 9.1% |
| 35 to 39 Minutes | 86 | 1.5% |
| 40 to 44 Minutes | 157 | 2.6% |
| 45 to 59 Minutes | 493 | 8.3% |
| 60 to 89 Minutes | 479 | 8.1% |
| 90 or more Minutes | 454 | 7.6% |
Commute Time by Sex in Mariposa County
The most common commute times in Mariposa County are 15 to 19 minutes (533 commuters, 16.6%) for males and 5 to 9 minutes (511 commuters, 18.7%) for females.
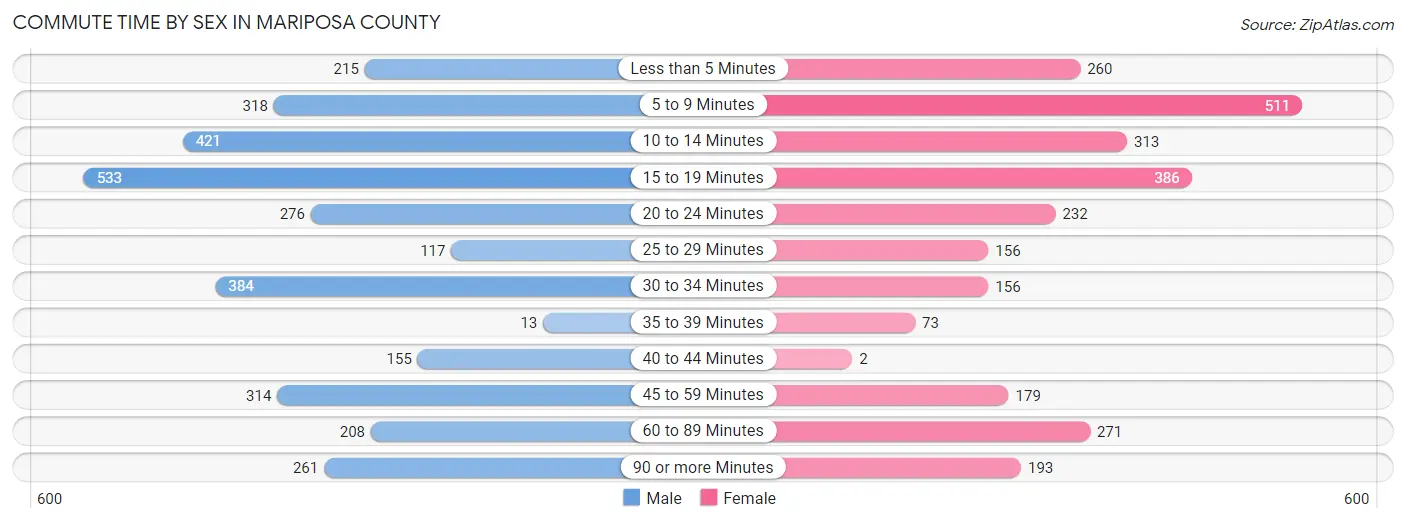
| Commute Time | Male | Female |
| Less than 5 Minutes | 215 (6.7%) | 260 (9.5%) |
| 5 to 9 Minutes | 318 (9.9%) | 511 (18.7%) |
| 10 to 14 Minutes | 421 (13.1%) | 313 (11.5%) |
| 15 to 19 Minutes | 533 (16.6%) | 386 (14.1%) |
| 20 to 24 Minutes | 276 (8.6%) | 232 (8.5%) |
| 25 to 29 Minutes | 117 (3.6%) | 156 (5.7%) |
| 30 to 34 Minutes | 384 (11.9%) | 156 (5.7%) |
| 35 to 39 Minutes | 13 (0.4%) | 73 (2.7%) |
| 40 to 44 Minutes | 155 (4.8%) | 2 (0.1%) |
| 45 to 59 Minutes | 314 (9.8%) | 179 (6.6%) |
| 60 to 89 Minutes | 208 (6.5%) | 271 (9.9%) |
| 90 or more Minutes | 261 (8.1%) | 193 (7.1%) |
Time of Departure to Work by Sex in Mariposa County
The most frequent times of departure to work in Mariposa County are 6:00 AM to 6:29 AM (539, 16.8%) for males and 8:00 AM to 8:29 AM (482, 17.6%) for females.
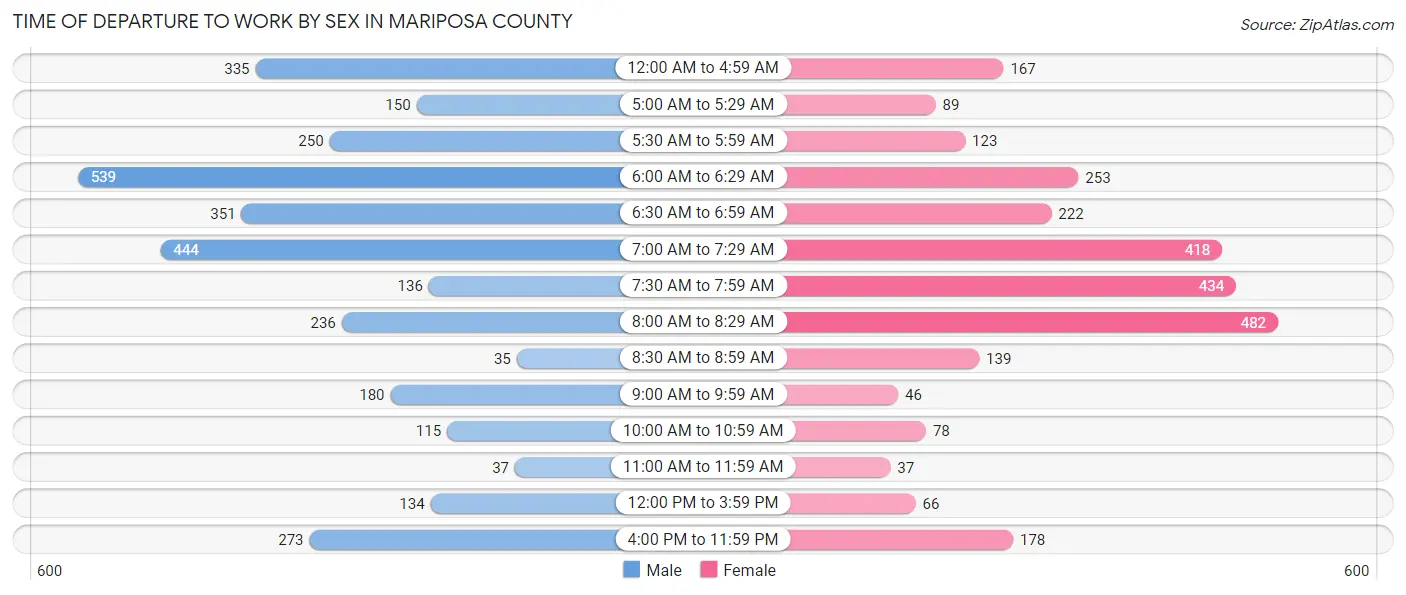
| Time of Departure | Male | Female |
| 12:00 AM to 4:59 AM | 335 (10.4%) | 167 (6.1%) |
| 5:00 AM to 5:29 AM | 150 (4.7%) | 89 (3.3%) |
| 5:30 AM to 5:59 AM | 250 (7.8%) | 123 (4.5%) |
| 6:00 AM to 6:29 AM | 539 (16.8%) | 253 (9.3%) |
| 6:30 AM to 6:59 AM | 351 (10.9%) | 222 (8.1%) |
| 7:00 AM to 7:29 AM | 444 (13.8%) | 418 (15.3%) |
| 7:30 AM to 7:59 AM | 136 (4.2%) | 434 (15.9%) |
| 8:00 AM to 8:29 AM | 236 (7.3%) | 482 (17.6%) |
| 8:30 AM to 8:59 AM | 35 (1.1%) | 139 (5.1%) |
| 9:00 AM to 9:59 AM | 180 (5.6%) | 46 (1.7%) |
| 10:00 AM to 10:59 AM | 115 (3.6%) | 78 (2.9%) |
| 11:00 AM to 11:59 AM | 37 (1.1%) | 37 (1.3%) |
| 12:00 PM to 3:59 PM | 134 (4.2%) | 66 (2.4%) |
| 4:00 PM to 11:59 PM | 273 (8.5%) | 178 (6.5%) |
| Total | 3,215 (100.0%) | 2,732 (100.0%) |
Housing Occupancy in Mariposa County
Occupancy by Ownership in Mariposa County
Of the total 7,597 dwellings in Mariposa County, owner-occupied units account for 5,604 (73.8%), while renter-occupied units make up 1,993 (26.2%).
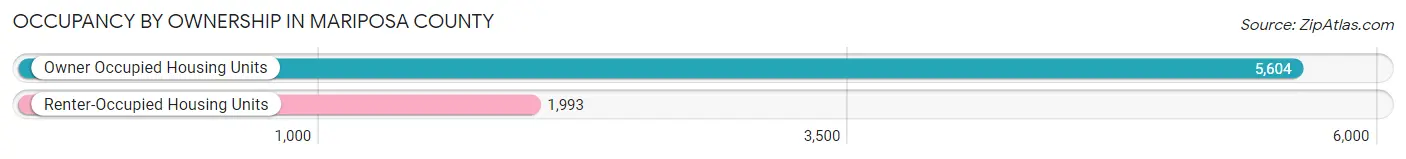
| Occupancy | # Housing Units | % Housing Units |
| Owner Occupied Housing Units | 5,604 | 73.8% |
| Renter-Occupied Housing Units | 1,993 | 26.2% |
| Total Occupied Housing Units | 7,597 | 100.0% |
Occupancy by Household Size in Mariposa County
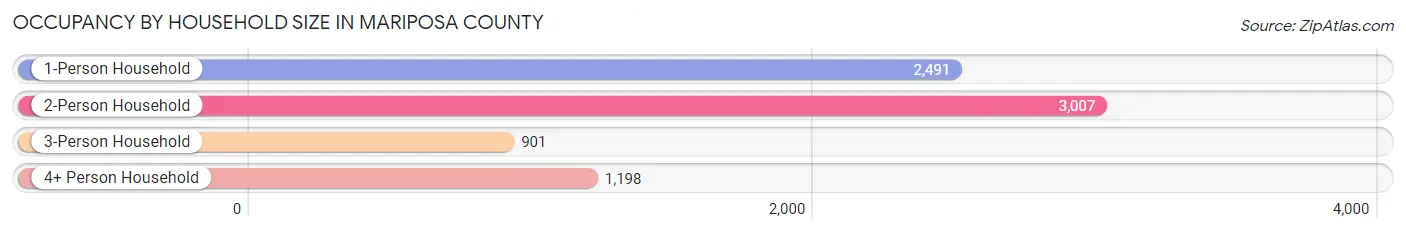
| Household Size | # Housing Units | % Housing Units |
| 1-Person Household | 2,491 | 32.8% |
| 2-Person Household | 3,007 | 39.6% |
| 3-Person Household | 901 | 11.9% |
| 4+ Person Household | 1,198 | 15.8% |
| Total Housing Units | 7,597 | 100.0% |
Occupancy by Ownership by Household Size in Mariposa County
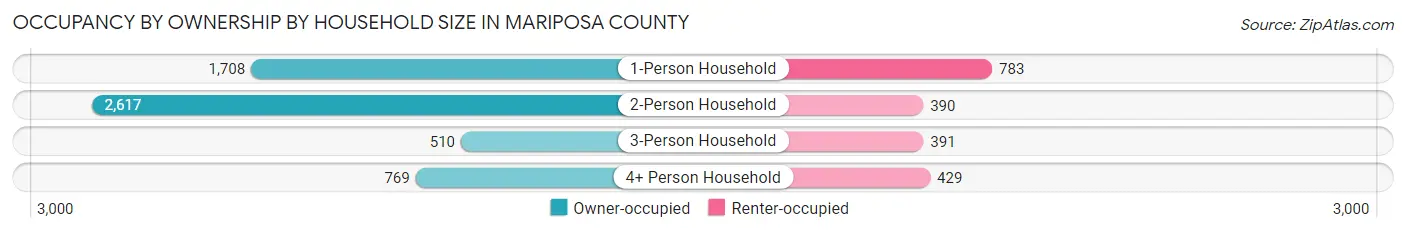
| Household Size | Owner-occupied | Renter-occupied |
| 1-Person Household | 1,708 (68.6%) | 783 (31.4%) |
| 2-Person Household | 2,617 (87.0%) | 390 (13.0%) |
| 3-Person Household | 510 (56.6%) | 391 (43.4%) |
| 4+ Person Household | 769 (64.2%) | 429 (35.8%) |
| Total Housing Units | 5,604 (73.8%) | 1,993 (26.2%) |
Occupancy by Educational Attainment in Mariposa County
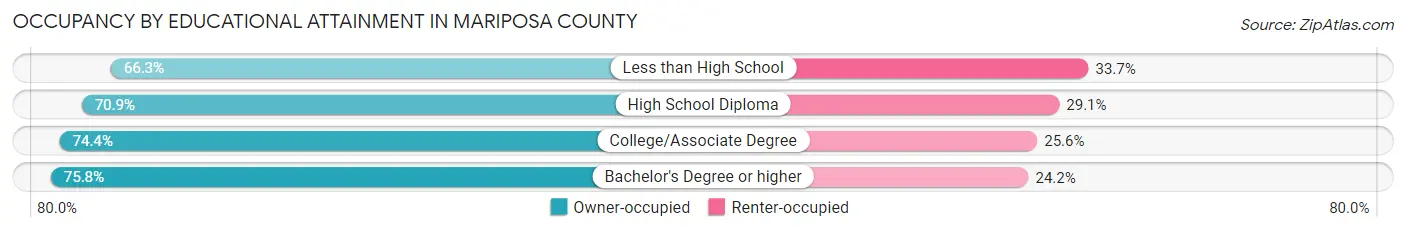
| Household Size | Owner-occupied | Renter-occupied |
| Less than High School | 311 (66.3%) | 158 (33.7%) |
| High School Diploma | 952 (70.9%) | 390 (29.1%) |
| College/Associate Degree | 2,484 (74.4%) | 853 (25.6%) |
| Bachelor's Degree or higher | 1,857 (75.8%) | 592 (24.2%) |
Occupancy by Age of Householder in Mariposa County
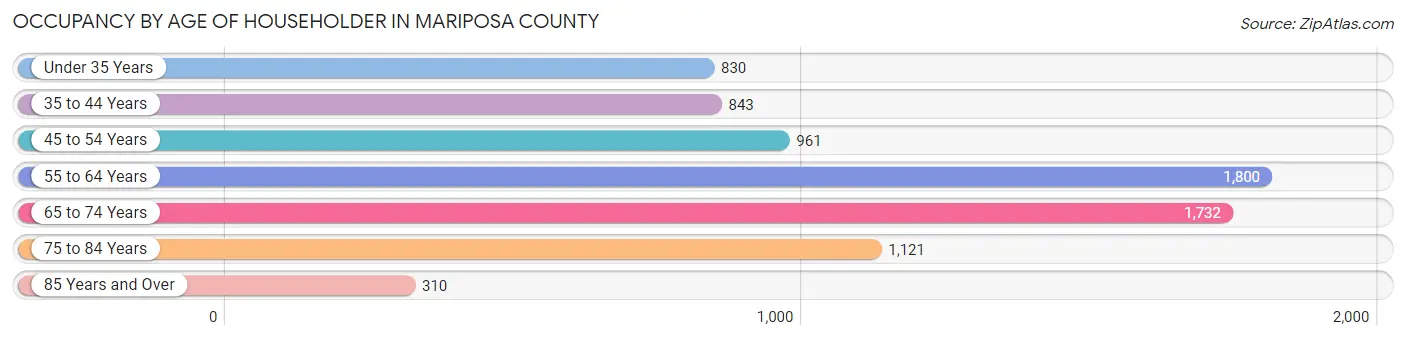
| Age Bracket | # Households | % Households |
| Under 35 Years | 830 | 10.9% |
| 35 to 44 Years | 843 | 11.1% |
| 45 to 54 Years | 961 | 12.7% |
| 55 to 64 Years | 1,800 | 23.7% |
| 65 to 74 Years | 1,732 | 22.8% |
| 75 to 84 Years | 1,121 | 14.8% |
| 85 Years and Over | 310 | 4.1% |
| Total | 7,597 | 100.0% |
Housing Finances in Mariposa County
Median Income by Occupancy in Mariposa County
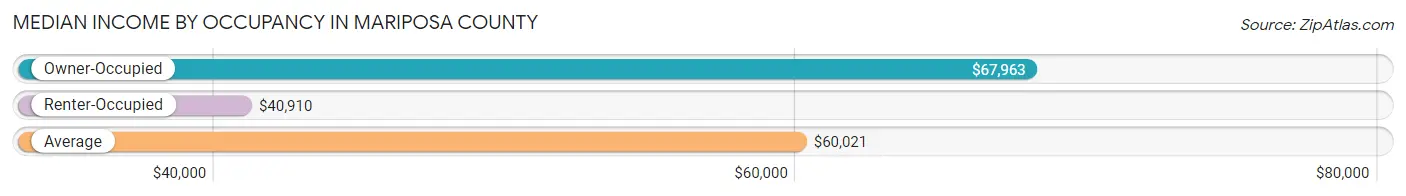
| Occupancy Type | # Households | Median Income |
| Owner-Occupied | 5,604 (73.8%) | $67,963 |
| Renter-Occupied | 1,993 (26.2%) | $40,910 |
| Average | 7,597 (100.0%) | $60,021 |
Occupancy by Householder Income Bracket in Mariposa County
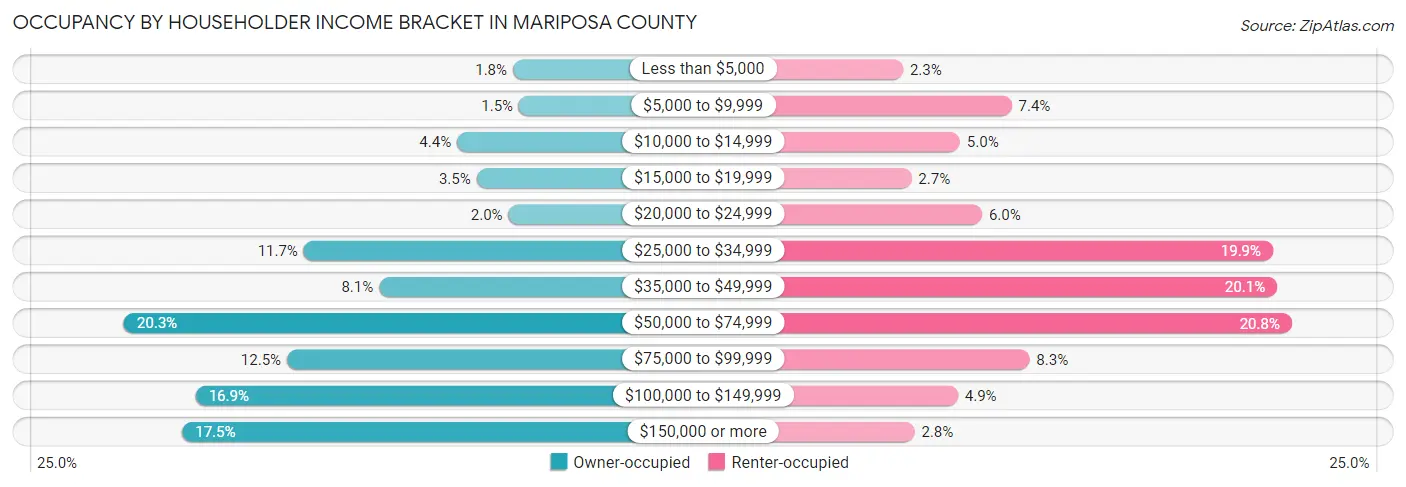
| Income Bracket | Owner-occupied | Renter-occupied |
| Less than $5,000 | 98 (1.8%) | 45 (2.3%) |
| $5,000 to $9,999 | 82 (1.5%) | 148 (7.4%) |
| $10,000 to $14,999 | 247 (4.4%) | 99 (5.0%) |
| $15,000 to $19,999 | 195 (3.5%) | 53 (2.7%) |
| $20,000 to $24,999 | 110 (2.0%) | 120 (6.0%) |
| $25,000 to $34,999 | 656 (11.7%) | 396 (19.9%) |
| $35,000 to $49,999 | 455 (8.1%) | 400 (20.1%) |
| $50,000 to $74,999 | 1,136 (20.3%) | 414 (20.8%) |
| $75,000 to $99,999 | 701 (12.5%) | 165 (8.3%) |
| $100,000 to $149,999 | 944 (16.9%) | 97 (4.9%) |
| $150,000 or more | 980 (17.5%) | 56 (2.8%) |
| Total | 5,604 (100.0%) | 1,993 (100.0%) |
Monthly Housing Cost Tiers in Mariposa County
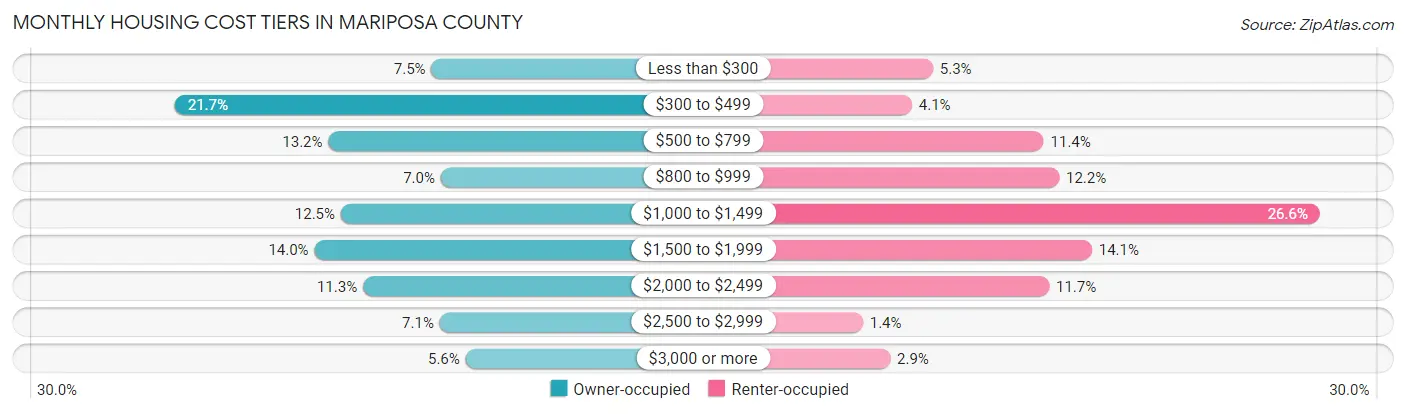
| Monthly Cost | Owner-occupied | Renter-occupied |
| Less than $300 | 422 (7.5%) | 105 (5.3%) |
| $300 to $499 | 1,216 (21.7%) | 82 (4.1%) |
| $500 to $799 | 741 (13.2%) | 227 (11.4%) |
| $800 to $999 | 393 (7.0%) | 244 (12.2%) |
| $1,000 to $1,499 | 702 (12.5%) | 531 (26.6%) |
| $1,500 to $1,999 | 784 (14.0%) | 280 (14.1%) |
| $2,000 to $2,499 | 634 (11.3%) | 233 (11.7%) |
| $2,500 to $2,999 | 396 (7.1%) | 28 (1.4%) |
| $3,000 or more | 316 (5.6%) | 58 (2.9%) |
| Total | 5,604 (100.0%) | 1,993 (100.0%) |
Physical Housing Characteristics in Mariposa County
Housing Structures in Mariposa County
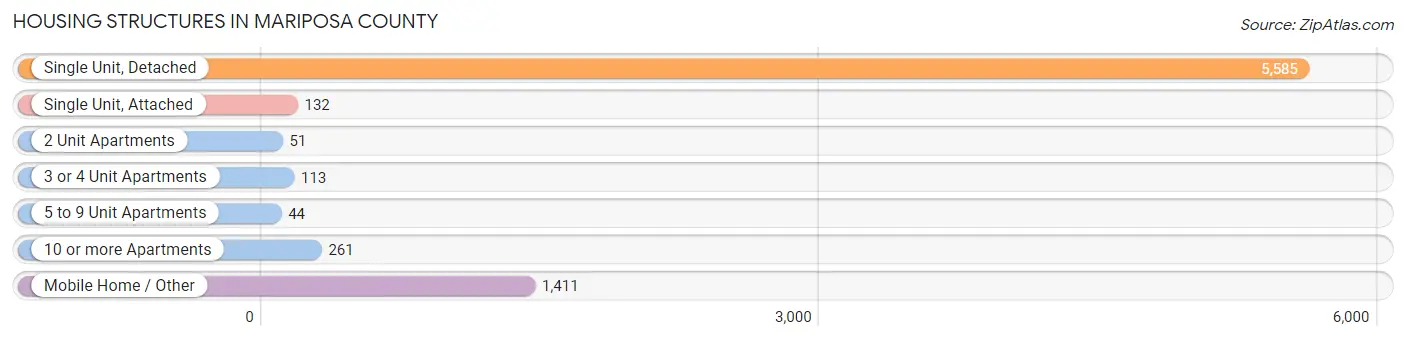
| Structure Type | # Housing Units | % Housing Units |
| Single Unit, Detached | 5,585 | 73.5% |
| Single Unit, Attached | 132 | 1.7% |
| 2 Unit Apartments | 51 | 0.7% |
| 3 or 4 Unit Apartments | 113 | 1.5% |
| 5 to 9 Unit Apartments | 44 | 0.6% |
| 10 or more Apartments | 261 | 3.4% |
| Mobile Home / Other | 1,411 | 18.6% |
| Total | 7,597 | 100.0% |
Housing Structures by Occupancy in Mariposa County
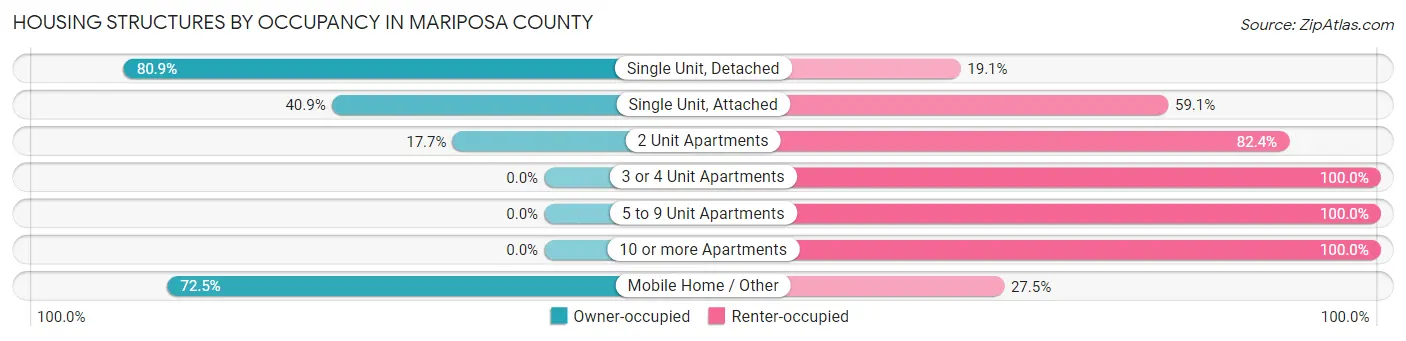
| Structure Type | Owner-occupied | Renter-occupied |
| Single Unit, Detached | 4,518 (80.9%) | 1,067 (19.1%) |
| Single Unit, Attached | 54 (40.9%) | 78 (59.1%) |
| 2 Unit Apartments | 9 (17.6%) | 42 (82.4%) |
| 3 or 4 Unit Apartments | 0 (0.0%) | 113 (100.0%) |
| 5 to 9 Unit Apartments | 0 (0.0%) | 44 (100.0%) |
| 10 or more Apartments | 0 (0.0%) | 261 (100.0%) |
| Mobile Home / Other | 1,023 (72.5%) | 388 (27.5%) |
| Total | 5,604 (73.8%) | 1,993 (26.2%) |
Housing Structures by Number of Rooms in Mariposa County
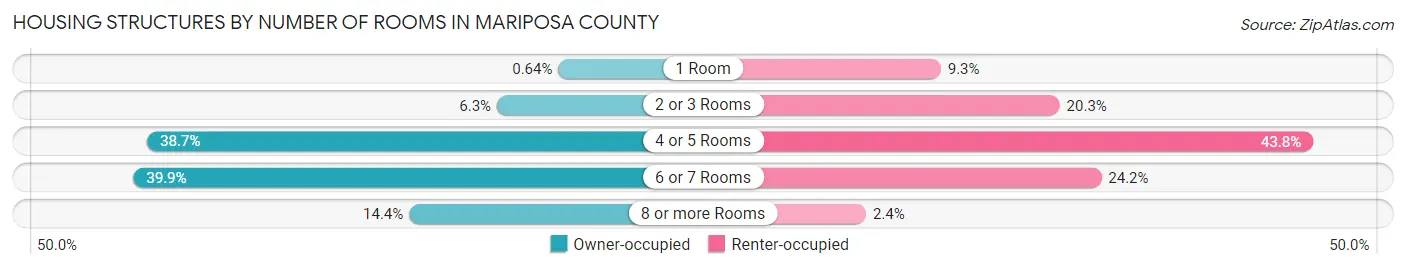
| Number of Rooms | Owner-occupied | Renter-occupied |
| 1 Room | 36 (0.6%) | 186 (9.3%) |
| 2 or 3 Rooms | 354 (6.3%) | 405 (20.3%) |
| 4 or 5 Rooms | 2,167 (38.7%) | 872 (43.8%) |
| 6 or 7 Rooms | 2,238 (39.9%) | 482 (24.2%) |
| 8 or more Rooms | 809 (14.4%) | 48 (2.4%) |
| Total | 5,604 (100.0%) | 1,993 (100.0%) |
Housing Structure by Heating Type in Mariposa County
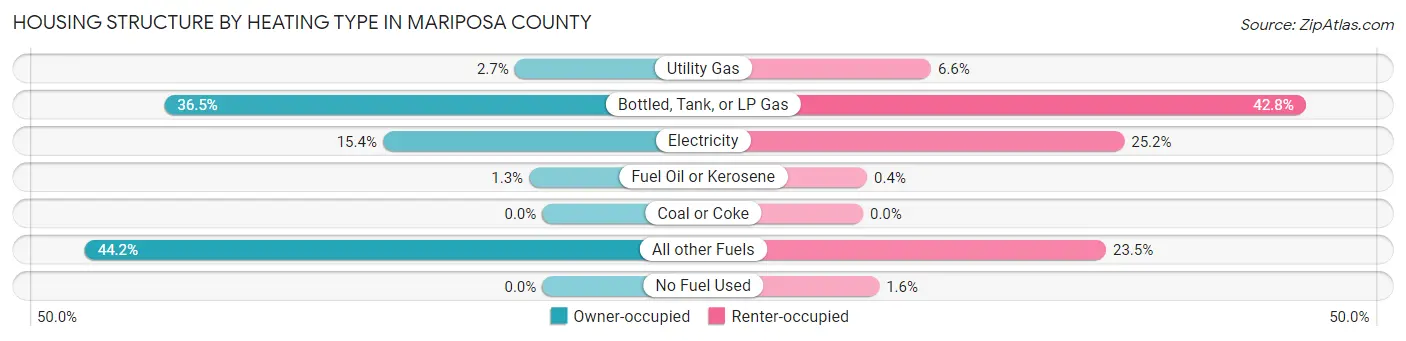
| Heating Type | Owner-occupied | Renter-occupied |
| Utility Gas | 149 (2.7%) | 131 (6.6%) |
| Bottled, Tank, or LP Gas | 2,045 (36.5%) | 852 (42.7%) |
| Electricity | 863 (15.4%) | 503 (25.2%) |
| Fuel Oil or Kerosene | 71 (1.3%) | 8 (0.4%) |
| Coal or Coke | 0 (0.0%) | 0 (0.0%) |
| All other Fuels | 2,476 (44.2%) | 468 (23.5%) |
| No Fuel Used | 0 (0.0%) | 31 (1.6%) |
| Total | 5,604 (100.0%) | 1,993 (100.0%) |
Household Vehicle Usage in Mariposa County
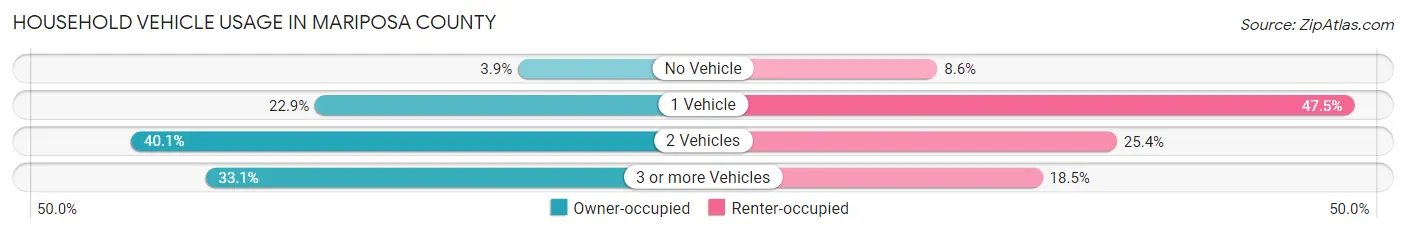
| Vehicles per Household | Owner-occupied | Renter-occupied |
| No Vehicle | 221 (3.9%) | 172 (8.6%) |
| 1 Vehicle | 1,282 (22.9%) | 947 (47.5%) |
| 2 Vehicles | 2,245 (40.1%) | 506 (25.4%) |
| 3 or more Vehicles | 1,856 (33.1%) | 368 (18.5%) |
| Total | 5,604 (100.0%) | 1,993 (100.0%) |
Real Estate & Mortgages in Mariposa County
Real Estate and Mortgage Overview in Mariposa County
| Characteristic | Without Mortgage | With Mortgage |
| Housing Units | 2,796 | 2,808 |
| Median Property Value | $276,000 | $371,200 |
| Median Household Income | $51,250 | $688 |
| Monthly Housing Costs | $455 | $316 |
| Real Estate Taxes | $1,755 | $102 |
Property Value by Mortgage Status in Mariposa County
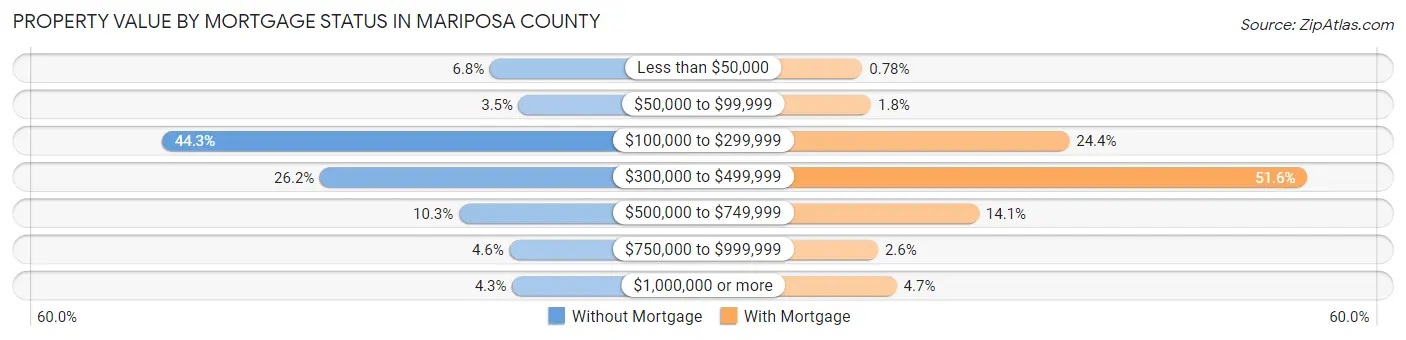
| Property Value | Without Mortgage | With Mortgage |
| Less than $50,000 | 190 (6.8%) | 22 (0.8%) |
| $50,000 to $99,999 | 98 (3.5%) | 50 (1.8%) |
| $100,000 to $299,999 | 1,239 (44.3%) | 686 (24.4%) |
| $300,000 to $499,999 | 733 (26.2%) | 1,450 (51.6%) |
| $500,000 to $749,999 | 289 (10.3%) | 396 (14.1%) |
| $750,000 to $999,999 | 128 (4.6%) | 72 (2.6%) |
| $1,000,000 or more | 119 (4.3%) | 132 (4.7%) |
| Total | 2,796 (100.0%) | 2,808 (100.0%) |
Household Income by Mortgage Status in Mariposa County
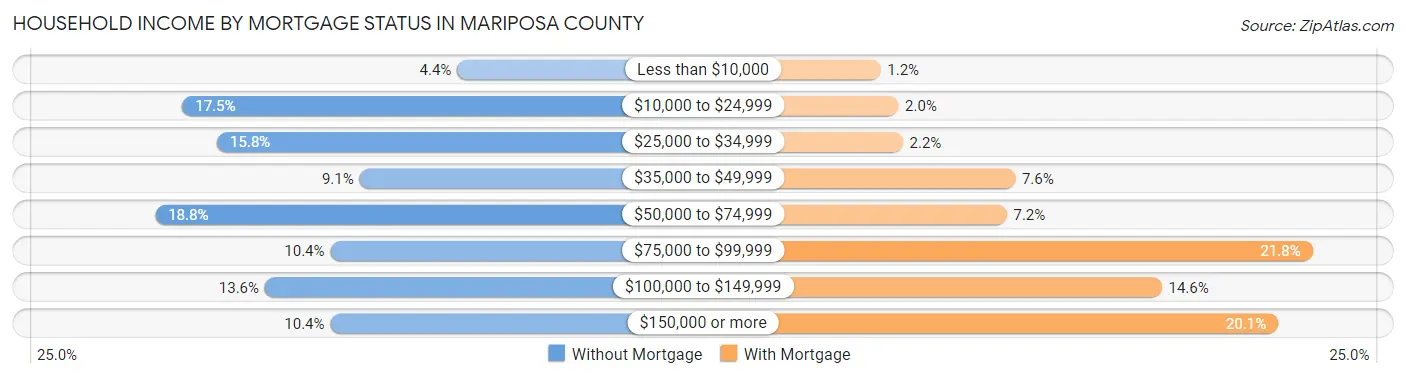
| Household Income | Without Mortgage | With Mortgage |
| Less than $10,000 | 123 (4.4%) | 33 (1.2%) |
| $10,000 to $24,999 | 489 (17.5%) | 57 (2.0%) |
| $25,000 to $34,999 | 443 (15.8%) | 63 (2.2%) |
| $35,000 to $49,999 | 253 (9.0%) | 213 (7.6%) |
| $50,000 to $74,999 | 525 (18.8%) | 202 (7.2%) |
| $75,000 to $99,999 | 292 (10.4%) | 611 (21.8%) |
| $100,000 to $149,999 | 379 (13.6%) | 409 (14.6%) |
| $150,000 or more | 292 (10.4%) | 565 (20.1%) |
| Total | 2,796 (100.0%) | 2,808 (100.0%) |
Property Value to Household Income Ratio in Mariposa County
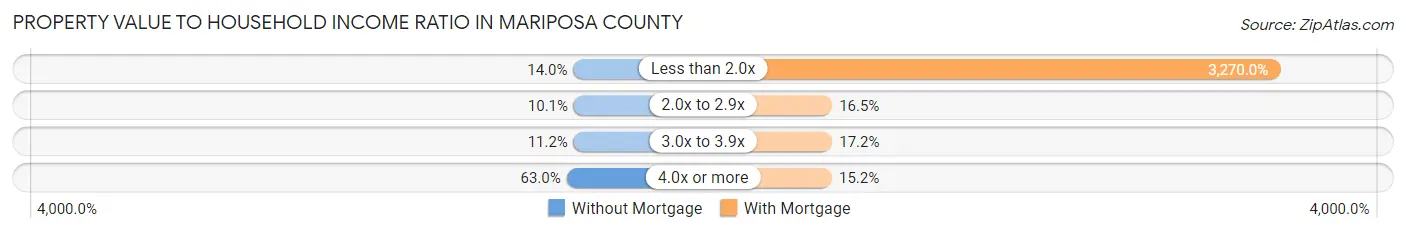
| Value-to-Income Ratio | Without Mortgage | With Mortgage |
| Less than 2.0x | 391 (14.0%) | 91,822 (3,270.0%) |
| 2.0x to 2.9x | 281 (10.1%) | 464 (16.5%) |
| 3.0x to 3.9x | 313 (11.2%) | 484 (17.2%) |
| 4.0x or more | 1,761 (63.0%) | 427 (15.2%) |
| Total | 2,796 (100.0%) | 2,808 (100.0%) |
Real Estate Taxes by Mortgage Status in Mariposa County
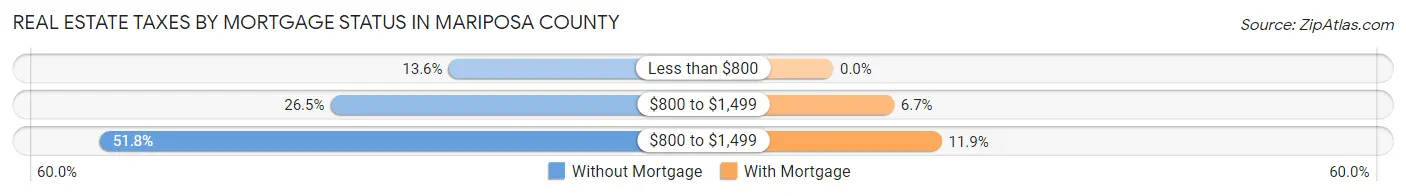
| Property Taxes | Without Mortgage | With Mortgage |
| Less than $800 | 379 (13.6%) | 0 (0.0%) |
| $800 to $1,499 | 741 (26.5%) | 187 (6.7%) |
| $800 to $1,499 | 1,447 (51.7%) | 334 (11.9%) |
| Total | 2,796 (100.0%) | 2,808 (100.0%) |
Health & Disability in Mariposa County
Health Insurance Coverage by Age in Mariposa County
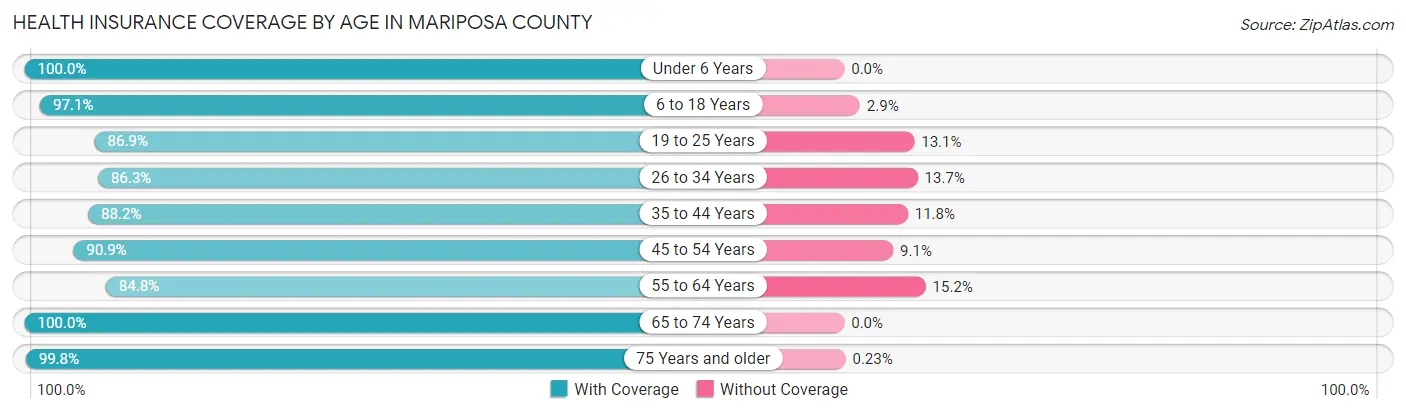
| Age Bracket | With Coverage | Without Coverage |
| Under 6 Years | 803 (100.0%) | 0 (0.0%) |
| 6 to 18 Years | 2,071 (97.1%) | 62 (2.9%) |
| 19 to 25 Years | 779 (86.9%) | 117 (13.1%) |
| 26 to 34 Years | 1,539 (86.3%) | 244 (13.7%) |
| 35 to 44 Years | 1,511 (88.2%) | 203 (11.8%) |
| 45 to 54 Years | 1,637 (90.9%) | 164 (9.1%) |
| 55 to 64 Years | 2,421 (84.8%) | 433 (15.2%) |
| 65 to 74 Years | 2,840 (100.0%) | 0 (0.0%) |
| 75 Years and older | 2,161 (99.8%) | 5 (0.2%) |
| Total | 15,762 (92.8%) | 1,228 (7.2%) |
Health Insurance Coverage by Citizenship Status in Mariposa County
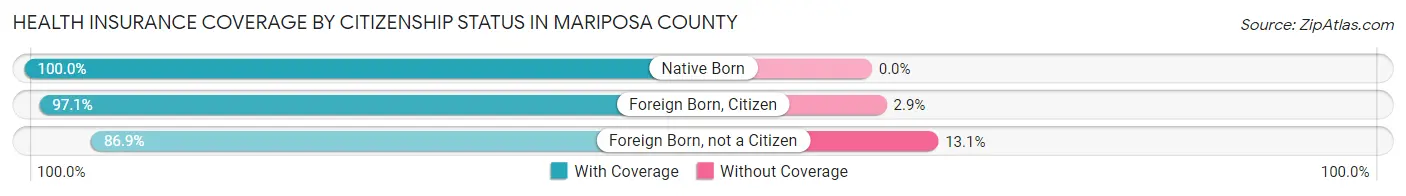
| Citizenship Status | With Coverage | Without Coverage |
| Native Born | 803 (100.0%) | 0 (0.0%) |
| Foreign Born, Citizen | 2,071 (97.1%) | 62 (2.9%) |
| Foreign Born, not a Citizen | 779 (86.9%) | 117 (13.1%) |
Health Insurance Coverage by Household Income in Mariposa County
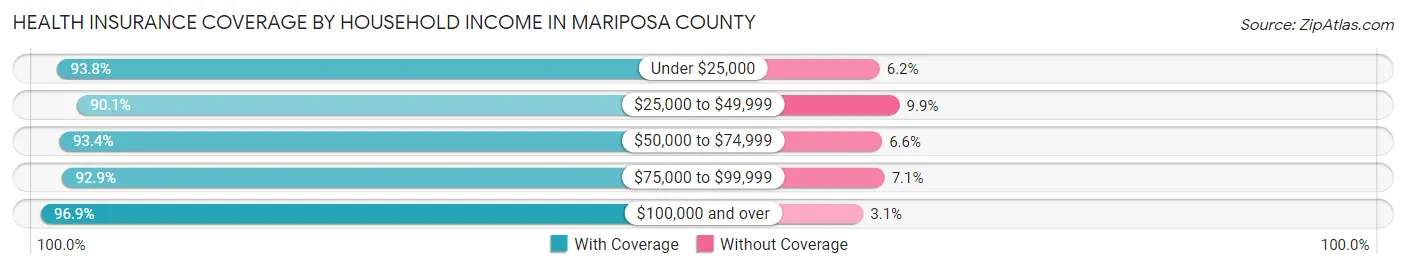
| Household Income | With Coverage | Without Coverage |
| Under $25,000 | 1,837 (93.8%) | 121 (6.2%) |
| $25,000 to $49,999 | 3,231 (90.1%) | 355 (9.9%) |
| $50,000 to $74,999 | 2,783 (93.4%) | 198 (6.6%) |
| $75,000 to $99,999 | 1,478 (92.9%) | 113 (7.1%) |
| $100,000 and over | 5,099 (96.9%) | 163 (3.1%) |
Public vs Private Health Insurance Coverage by Age in Mariposa County
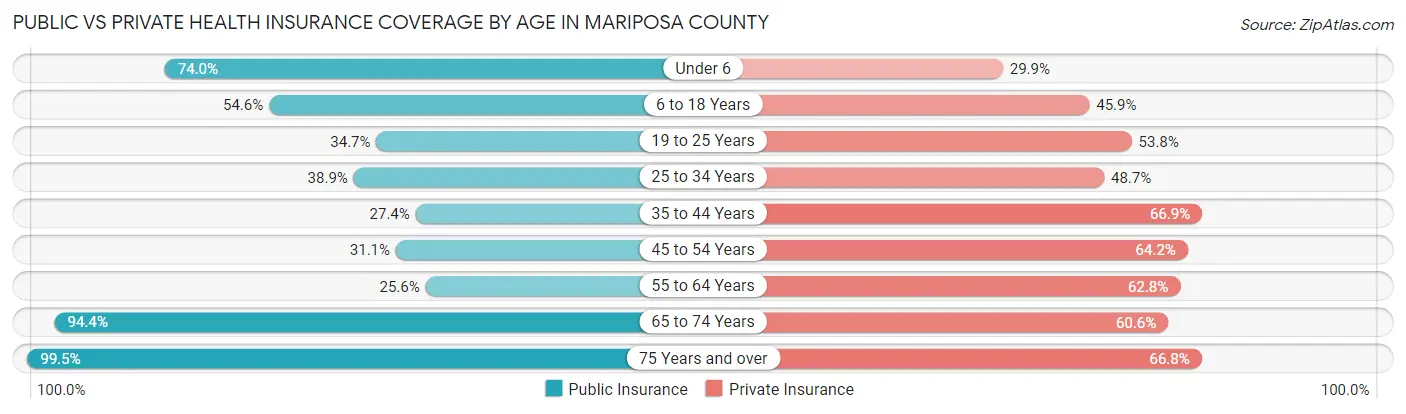
| Age Bracket | Public Insurance | Private Insurance |
| Under 6 | 594 (74.0%) | 240 (29.9%) |
| 6 to 18 Years | 1,165 (54.6%) | 980 (45.9%) |
| 19 to 25 Years | 311 (34.7%) | 482 (53.8%) |
| 25 to 34 Years | 694 (38.9%) | 868 (48.7%) |
| 35 to 44 Years | 470 (27.4%) | 1,146 (66.9%) |
| 45 to 54 Years | 560 (31.1%) | 1,156 (64.2%) |
| 55 to 64 Years | 730 (25.6%) | 1,792 (62.8%) |
| 65 to 74 Years | 2,682 (94.4%) | 1,720 (60.6%) |
| 75 Years and over | 2,155 (99.5%) | 1,446 (66.8%) |
| Total | 9,361 (55.1%) | 9,830 (57.9%) |
Disability Status by Sex by Age in Mariposa County
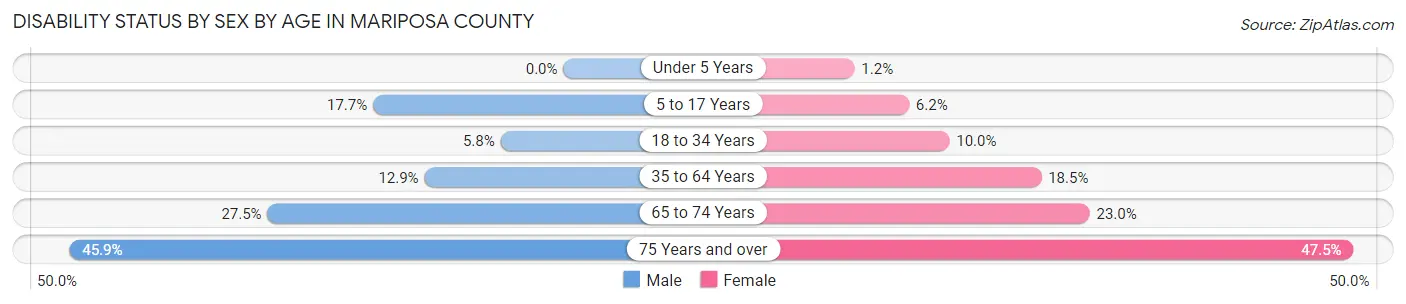
| Age Bracket | Male | Female |
| Under 5 Years | 0 (0.0%) | 4 (1.2%) |
| 5 to 17 Years | 201 (17.7%) | 74 (6.2%) |
| 18 to 34 Years | 85 (5.8%) | 123 (10.0%) |
| 35 to 64 Years | 408 (12.9%) | 593 (18.5%) |
| 65 to 74 Years | 394 (27.5%) | 323 (23.0%) |
| 75 Years and over | 492 (45.9%) | 519 (47.5%) |
Disability Class by Sex by Age in Mariposa County
Disability Class: Hearing Difficulty
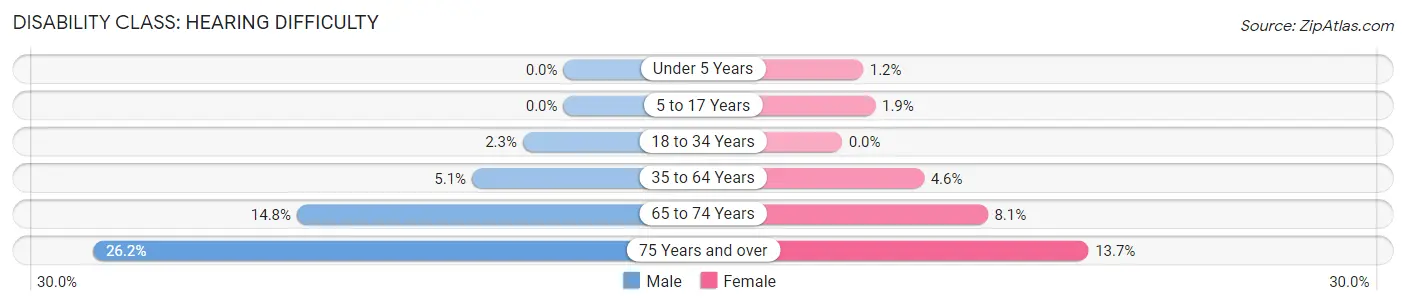
| Age Bracket | Male | Female |
| Under 5 Years | 0 (0.0%) | 4 (1.2%) |
| 5 to 17 Years | 0 (0.0%) | 22 (1.8%) |
| 18 to 34 Years | 33 (2.3%) | 0 (0.0%) |
| 35 to 64 Years | 161 (5.1%) | 146 (4.6%) |
| 65 to 74 Years | 213 (14.8%) | 114 (8.1%) |
| 75 Years and over | 281 (26.2%) | 150 (13.7%) |
Disability Class: Vision Difficulty
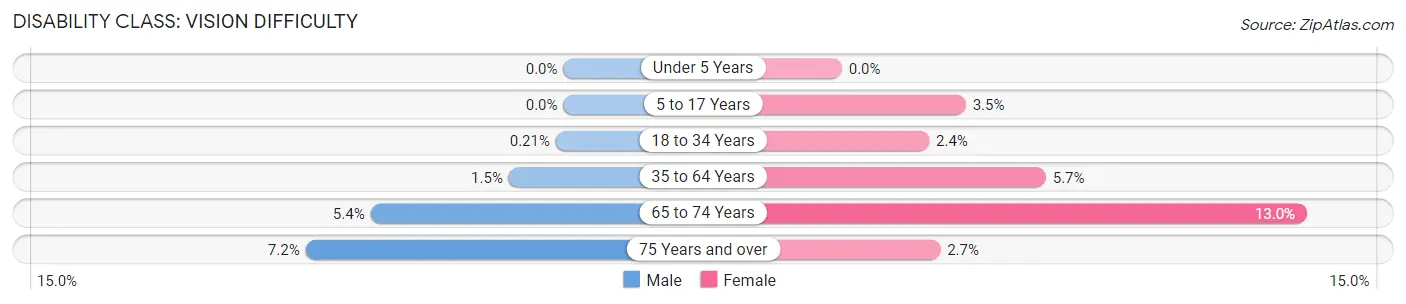
| Age Bracket | Male | Female |
| Under 5 Years | 0 (0.0%) | 0 (0.0%) |
| 5 to 17 Years | 0 (0.0%) | 41 (3.5%) |
| 18 to 34 Years | 3 (0.2%) | 30 (2.4%) |
| 35 to 64 Years | 48 (1.5%) | 182 (5.7%) |
| 65 to 74 Years | 77 (5.4%) | 182 (13.0%) |
| 75 Years and over | 77 (7.2%) | 30 (2.7%) |
Disability Class: Cognitive Difficulty
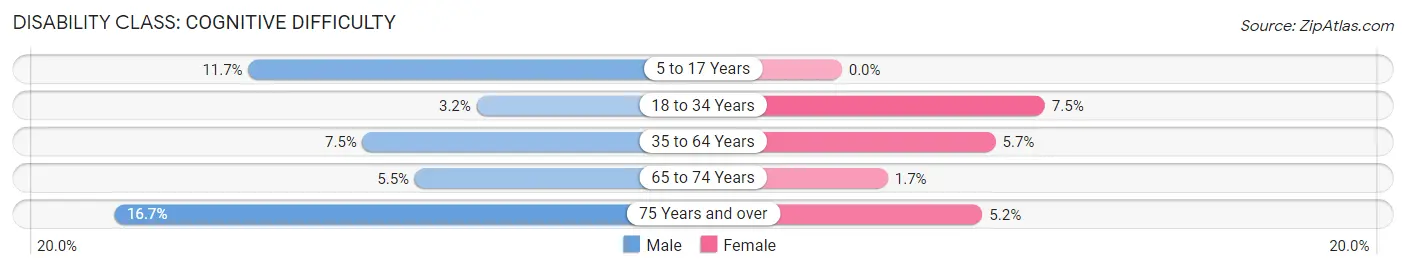
| Age Bracket | Male | Female |
| 5 to 17 Years | 133 (11.7%) | 0 (0.0%) |
| 18 to 34 Years | 47 (3.2%) | 93 (7.5%) |
| 35 to 64 Years | 236 (7.4%) | 183 (5.7%) |
| 65 to 74 Years | 79 (5.5%) | 24 (1.7%) |
| 75 Years and over | 179 (16.7%) | 57 (5.2%) |
Disability Class: Ambulatory Difficulty
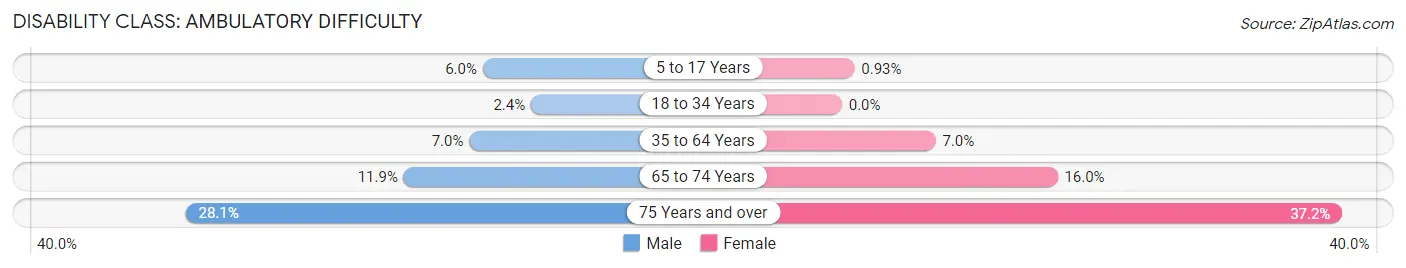
| Age Bracket | Male | Female |
| 5 to 17 Years | 68 (6.0%) | 11 (0.9%) |
| 18 to 34 Years | 35 (2.4%) | 0 (0.0%) |
| 35 to 64 Years | 221 (7.0%) | 223 (7.0%) |
| 65 to 74 Years | 170 (11.8%) | 225 (16.0%) |
| 75 Years and over | 301 (28.1%) | 406 (37.1%) |
Disability Class: Self-Care Difficulty
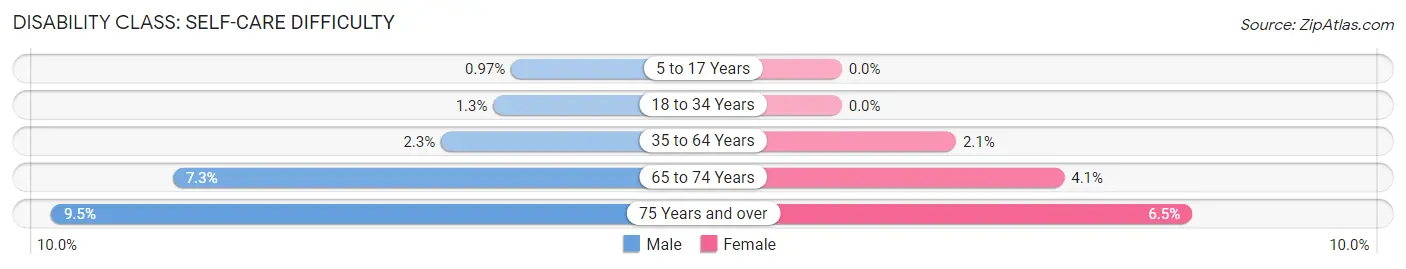
| Age Bracket | Male | Female |
| 5 to 17 Years | 11 (1.0%) | 0 (0.0%) |
| 18 to 34 Years | 19 (1.3%) | 0 (0.0%) |
| 35 to 64 Years | 72 (2.3%) | 68 (2.1%) |
| 65 to 74 Years | 104 (7.2%) | 58 (4.1%) |
| 75 Years and over | 102 (9.5%) | 71 (6.5%) |
Technology Access in Mariposa County
Computing Device Access in Mariposa County
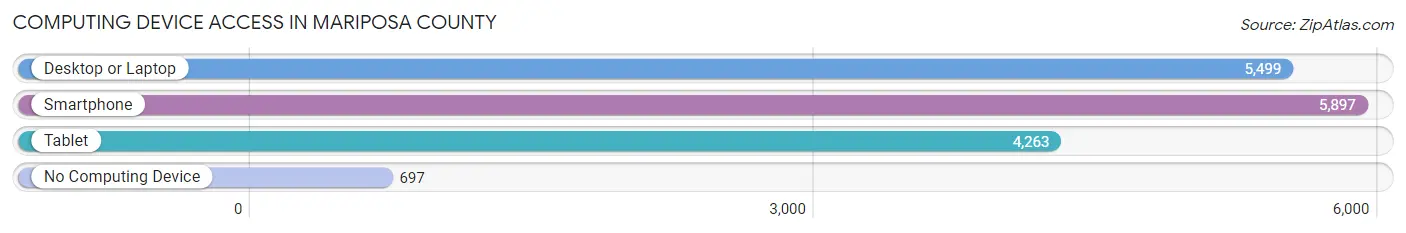
| Device Type | # Households | % Households |
| Desktop or Laptop | 5,499 | 72.4% |
| Smartphone | 5,897 | 77.6% |
| Tablet | 4,263 | 56.1% |
| No Computing Device | 697 | 9.2% |
| Total | 7,597 | 100.0% |
Internet Access in Mariposa County
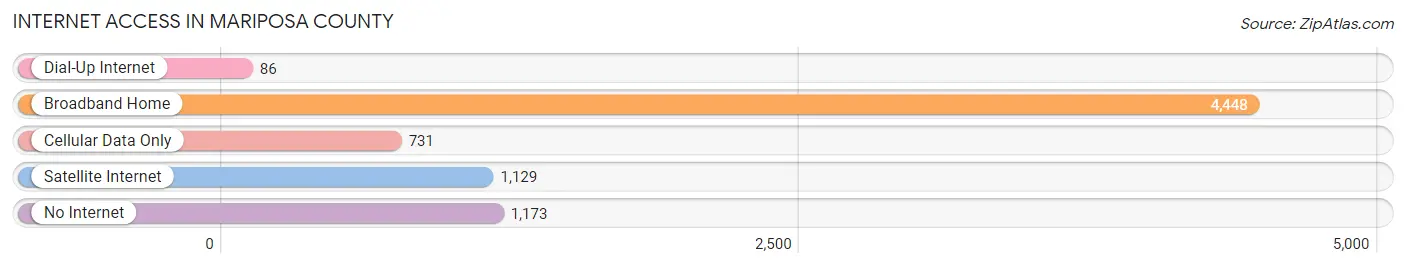
| Internet Type | # Households | % Households |
| Dial-Up Internet | 86 | 1.1% |
| Broadband Home | 4,448 | 58.6% |
| Cellular Data Only | 731 | 9.6% |
| Satellite Internet | 1,129 | 14.9% |
| No Internet | 1,173 | 15.4% |
| Total | 7,597 | 100.0% |
Mariposa County Summary
Mariposa County is located in the Central Valley of California, and is bordered by Tuolumne County to the north, Madera County to the east, Merced County to the south, and Stanislaus County to the west. The county seat is Mariposa, and the county has a total area of 1,463 square miles. Mariposa County is home to Yosemite National Park, which is one of the most popular tourist destinations in the United States.
Mariposa County was established in 1850, and was named after the Spanish word for “butterfly”. The county was originally part of the state of Mariposa, which was created in 1851. The county was later divided into two parts, with the western portion becoming Mariposa County and the eastern portion becoming Merced County.
Mariposa County has a population of 18,251, according to the 2020 census. The population is spread out across the county, with the largest population centers being Mariposa, Midpines, and Catheys Valley. The county is predominantly white, with the largest racial group being non-Hispanic whites, making up 79.3% of the population. The next largest racial group is Hispanic or Latino, making up 16.2% of the population. The median household income in Mariposa County is $50,845, and the median home value is $269,400.
Mariposa County is home to a variety of industries, including agriculture, tourism, and mining. Agriculture is the largest industry in the county, with the majority of the agricultural production coming from cattle, hay, and apples. Tourism is also a major industry in the county, with Yosemite National Park being the main attraction. Mining is also an important industry in the county, with gold being the primary mineral mined.
Mariposa County is home to a variety of attractions, including Yosemite National Park, the Mariposa County Museum, and the Mariposa County Fair. The county is also home to a variety of outdoor activities, such as hiking, camping, fishing, and hunting. Mariposa County is also home to a variety of historic sites, including the Mariposa County Courthouse, the Mariposa County Jail, and the Mariposa County Historical Society.
Mariposa County is a beautiful and diverse county, with a rich history and a variety of attractions. The county is home to a variety of industries, attractions, and outdoor activities, making it a great place to live and visit. Mariposa County is a great place to explore and experience the beauty of California.
Common Questions
What is Per Capita Income in Mariposa County?
Per Capita income in Mariposa County is $36,106.
What is the Median Family Income in Mariposa County?
Median Family Income in Mariposa County is $71,667.
What is the Median Household income in Mariposa County?
Median Household Income in Mariposa County is $60,021.
What is Income or Wage Gap in Mariposa County?
Income or Wage Gap in Mariposa County is 18.1%.
Women in Mariposa County earn 81.9 cents for every dollar earned by a man.
What is Inequality or Gini Index in Mariposa County?
Inequality or Gini Index in Mariposa County is 0.44.
What is the Total Population of Mariposa County?
Total Population of Mariposa County is 17,130.
What is the Total Male Population of Mariposa County?
Total Male Population of Mariposa County is 8,635.
What is the Total Female Population of Mariposa County?
Total Female Population of Mariposa County is 8,495.
What is the Ratio of Males per 100 Females in Mariposa County?
There are 101.65 Males per 100 Females in Mariposa County.
What is the Ratio of Females per 100 Males in Mariposa County?
There are 98.38 Females per 100 Males in Mariposa County.
What is the Median Population Age in Mariposa County?
Median Population Age in Mariposa County is 51.6 Years.
What is the Average Family Size in Mariposa County
Average Family Size in Mariposa County is 2.6 People.
What is the Average Household Size in Mariposa County
Average Household Size in Mariposa County is 2.0 People.
How Large is the Labor Force in Mariposa County?
There are 7,734 People in the Labor Forcein in Mariposa County.
What is the Percentage of People in the Labor Force in Mariposa County?
53.0% of People are in the Labor Force in Mariposa County.
What is the Unemployment Rate in Mariposa County?
Unemployment Rate in Mariposa County is 6.2%.