Madera County, CA Map & Demographics
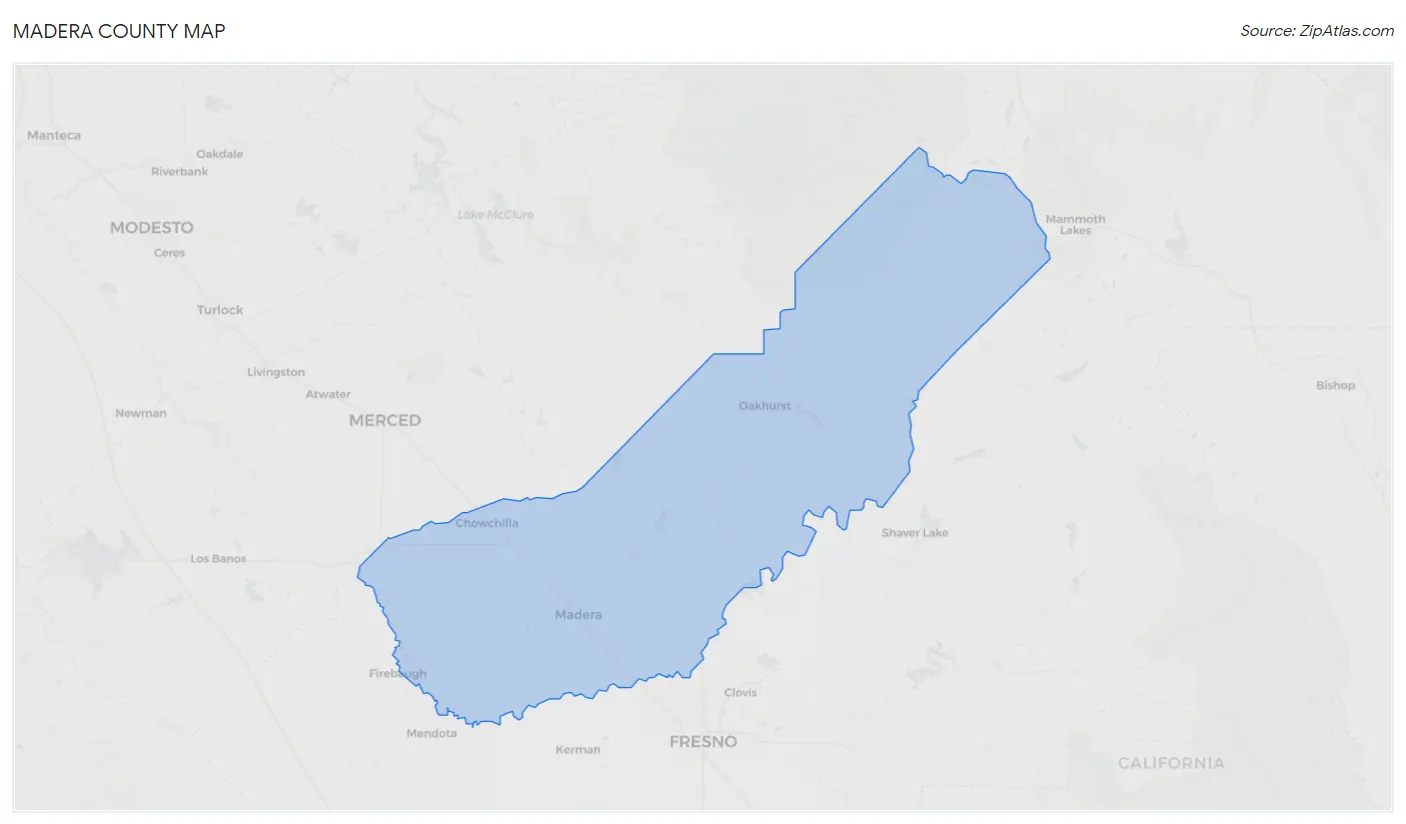
Madera County Map
Madera County Overview
$28,158
PER CAPITA INCOME
$79,066
AVG FAMILY INCOME
$73,543
AVG HOUSEHOLD INCOME
30.5%
WAGE / INCOME GAP [ % ]
69.5¢/ $1
WAGE / INCOME GAP [ $ ]
$11,438
FAMILY INCOME DEFICIT
0.45
INEQUALITY / GINI INDEX
157,243
TOTAL POPULATION
77,200
MALE POPULATION
80,043
FEMALE POPULATION
96.45
MALES / 100 FEMALES
103.68
FEMALES / 100 MALES
34.4
MEDIAN AGE
3.8
AVG FAMILY SIZE
3.4
AVG HOUSEHOLD SIZE
67,497
LABOR FORCE [ PEOPLE ]
56.5%
PERCENT IN LABOR FORCE
11.1%
UNEMPLOYMENT RATE
Income in Madera County
Income Overview in Madera County
Per Capita Income in Madera County is $28,158, while median incomes of families and households are $79,066 and $73,543 respectively.
| Characteristic | Number | Measure |
| Per Capita Income | 157,243 | $28,158 |
| Median Family Income | 34,124 | $79,066 |
| Mean Family Income | 34,124 | $100,275 |
| Median Household Income | 43,857 | $73,543 |
| Mean Household Income | 43,857 | $94,764 |
| Income Deficit | 34,124 | $11,438 |
| Wage / Income Gap (%) | 157,243 | 30.47% |
| Wage / Income Gap ($) | 157,243 | 69.53¢ per $1 |
| Gini / Inequality Index | 157,243 | 0.45 |
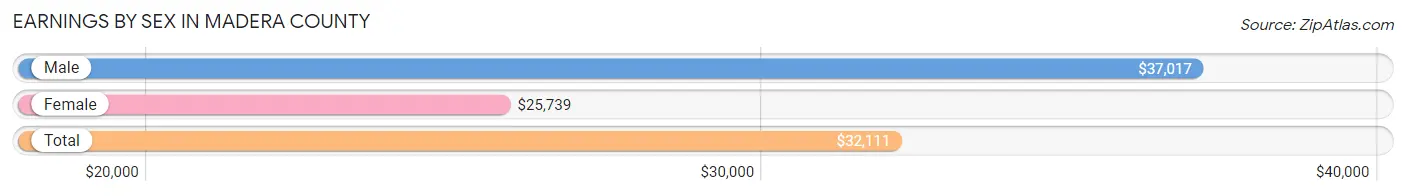
Earnings by Sex in Madera County
Average Earnings in Madera County are $32,111, $37,017 for men and $25,739 for women, a difference of 30.5%.
| Sex | Number | Average Earnings |
| Male | 37,742 (53.4%) | $37,017 |
| Female | 32,931 (46.6%) | $25,739 |
| Total | 70,673 (100.0%) | $32,111 |
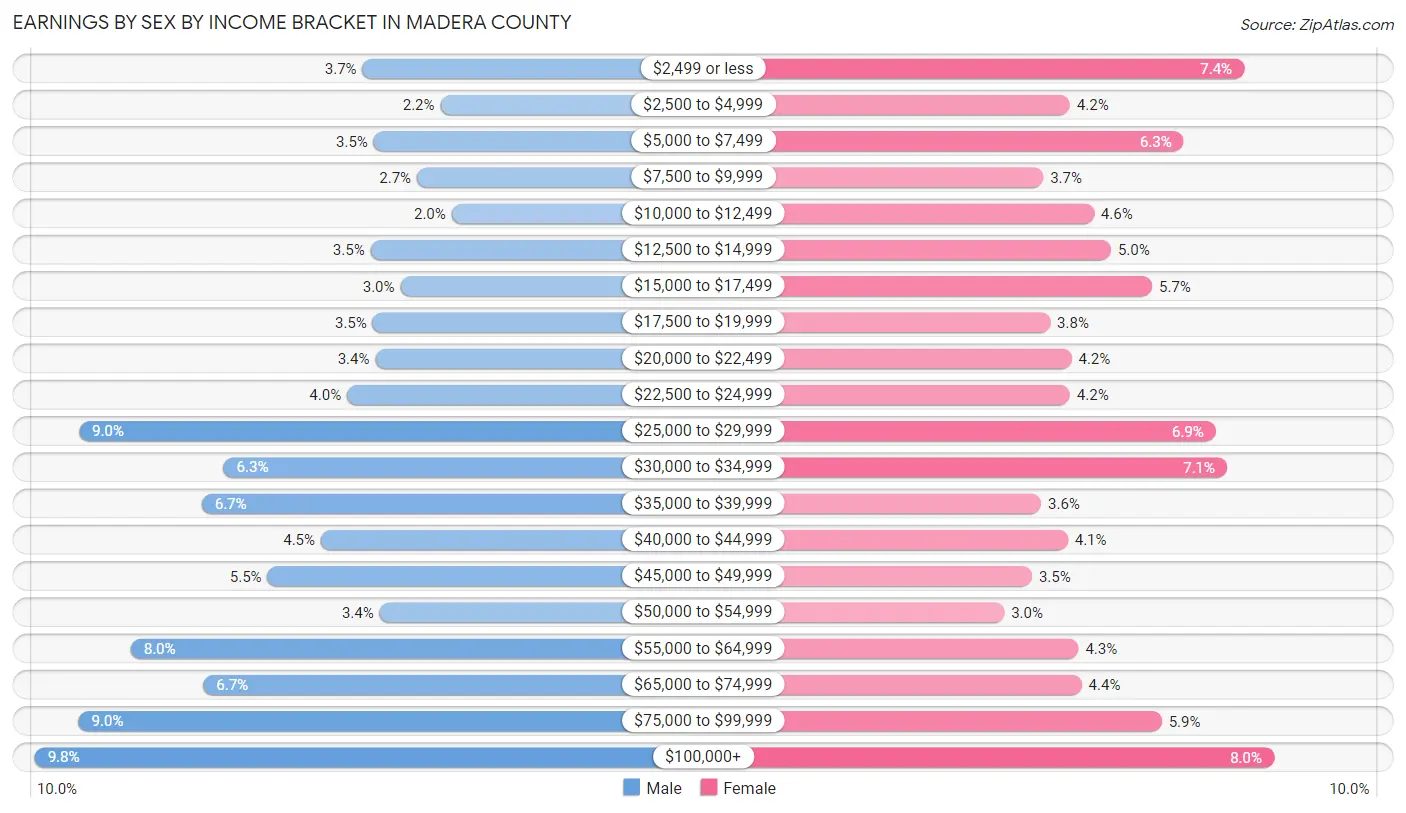
Earnings by Sex by Income Bracket in Madera County
The most common earnings brackets in Madera County are $100,000+ for men (3,702 | 9.8%) and $100,000+ for women (2,636 | 8.0%).
| Income | Male | Female |
| $2,499 or less | 1,385 (3.7%) | 2,451 (7.4%) |
| $2,500 to $4,999 | 834 (2.2%) | 1,377 (4.2%) |
| $5,000 to $7,499 | 1,307 (3.5%) | 2,078 (6.3%) |
| $7,500 to $9,999 | 1,001 (2.6%) | 1,212 (3.7%) |
| $10,000 to $12,499 | 755 (2.0%) | 1,526 (4.6%) |
| $12,500 to $14,999 | 1,328 (3.5%) | 1,629 (5.0%) |
| $15,000 to $17,499 | 1,119 (3.0%) | 1,885 (5.7%) |
| $17,500 to $19,999 | 1,315 (3.5%) | 1,255 (3.8%) |
| $20,000 to $22,499 | 1,295 (3.4%) | 1,386 (4.2%) |
| $22,500 to $24,999 | 1,494 (4.0%) | 1,378 (4.2%) |
| $25,000 to $29,999 | 3,391 (9.0%) | 2,277 (6.9%) |
| $30,000 to $34,999 | 2,366 (6.3%) | 2,346 (7.1%) |
| $35,000 to $39,999 | 2,520 (6.7%) | 1,200 (3.6%) |
| $40,000 to $44,999 | 1,680 (4.4%) | 1,364 (4.1%) |
| $45,000 to $49,999 | 2,056 (5.4%) | 1,143 (3.5%) |
| $50,000 to $54,999 | 1,265 (3.4%) | 970 (2.9%) |
| $55,000 to $64,999 | 3,024 (8.0%) | 1,428 (4.3%) |
| $65,000 to $74,999 | 2,511 (6.7%) | 1,448 (4.4%) |
| $75,000 to $99,999 | 3,394 (9.0%) | 1,942 (5.9%) |
| $100,000+ | 3,702 (9.8%) | 2,636 (8.0%) |
| Total | 37,742 (100.0%) | 32,931 (100.0%) |
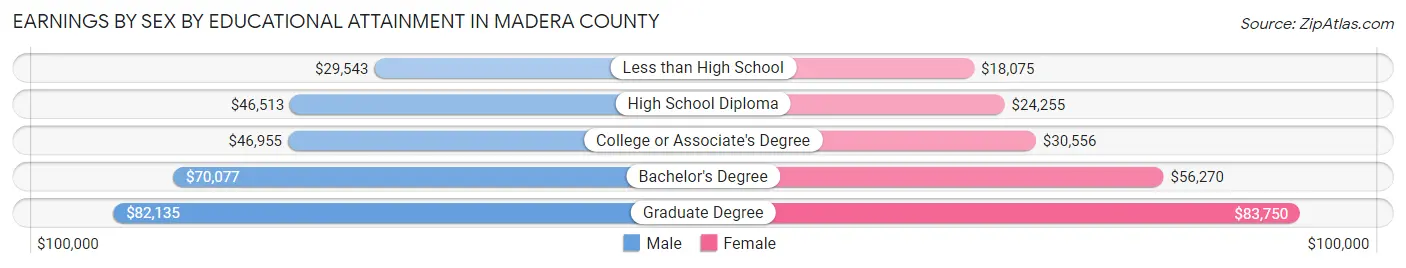
Earnings by Sex by Educational Attainment in Madera County
Average earnings in Madera County are $41,834 for men and $30,293 for women, a difference of 27.6%. Men with an educational attainment of graduate degree enjoy the highest average annual earnings of $82,135, while those with less than high school education earn the least with $29,543. Women with an educational attainment of graduate degree earn the most with the average annual earnings of $83,750, while those with less than high school education have the smallest earnings of $18,075.
| Educational Attainment | Male Income | Female Income |
| Less than High School | $29,543 | $18,075 |
| High School Diploma | $46,513 | $24,255 |
| College or Associate's Degree | $46,955 | $30,556 |
| Bachelor's Degree | $70,077 | $56,270 |
| Graduate Degree | $82,135 | $83,750 |
| Total | $41,834 | $30,293 |
Family Income in Madera County
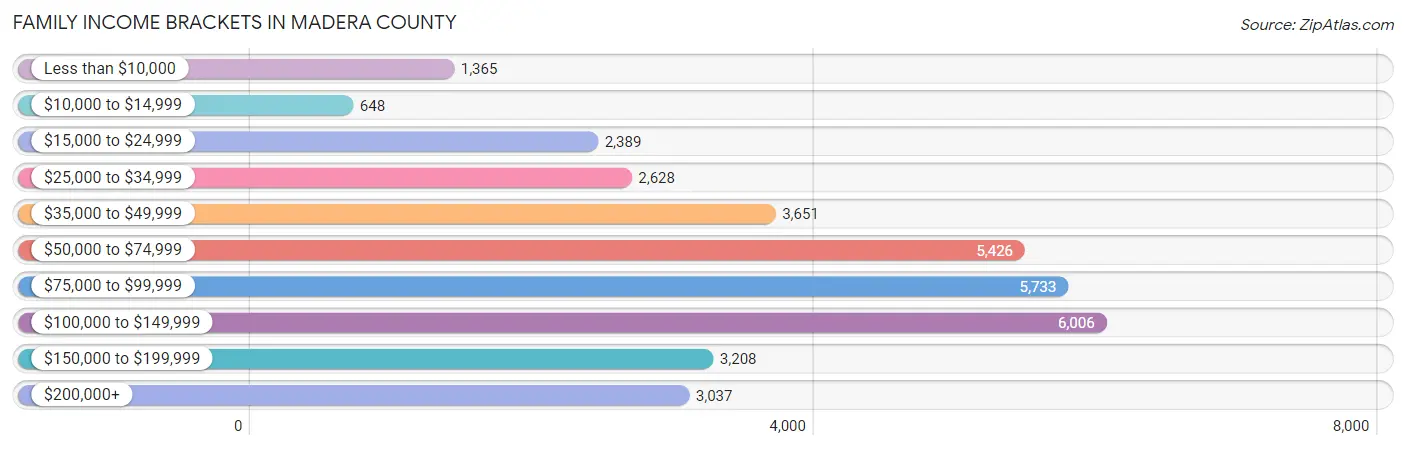
Family Income Brackets in Madera County
According to the Madera County family income data, there are 6,006 families falling into the $100,000 to $149,999 income range, which is the most common income bracket and makes up 17.6% of all families. Conversely, the $10,000 to $14,999 income bracket is the least frequent group with only 648 families (1.9%) belonging to this category.
| Income Bracket | # Families | % Families |
| Less than $10,000 | 1,365 | 4.0% |
| $10,000 to $14,999 | 648 | 1.9% |
| $15,000 to $24,999 | 2,389 | 7.0% |
| $25,000 to $34,999 | 2,628 | 7.7% |
| $35,000 to $49,999 | 3,651 | 10.7% |
| $50,000 to $74,999 | 5,426 | 15.9% |
| $75,000 to $99,999 | 5,733 | 16.8% |
| $100,000 to $149,999 | 6,006 | 17.6% |
| $150,000 to $199,999 | 3,208 | 9.4% |
| $200,000+ | 3,037 | 8.9% |
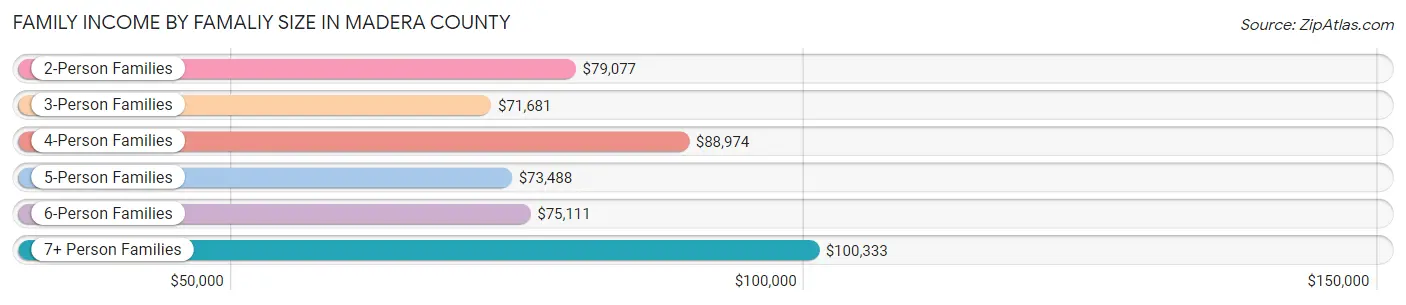
Family Income by Famaliy Size in Madera County
7+ person families (1,982 | 5.8%) account for the highest median family income in Madera County with $100,333 per family, while 2-person families (12,107 | 35.5%) have the highest median income of $39,538 per family member.
| Income Bracket | # Families | Median Income |
| 2-Person Families | 12,107 (35.5%) | $79,077 |
| 3-Person Families | 6,916 (20.3%) | $71,681 |
| 4-Person Families | 6,560 (19.2%) | $88,974 |
| 5-Person Families | 3,986 (11.7%) | $73,488 |
| 6-Person Families | 2,573 (7.5%) | $75,111 |
| 7+ Person Families | 1,982 (5.8%) | $100,333 |
| Total | 34,124 (100.0%) | $79,066 |
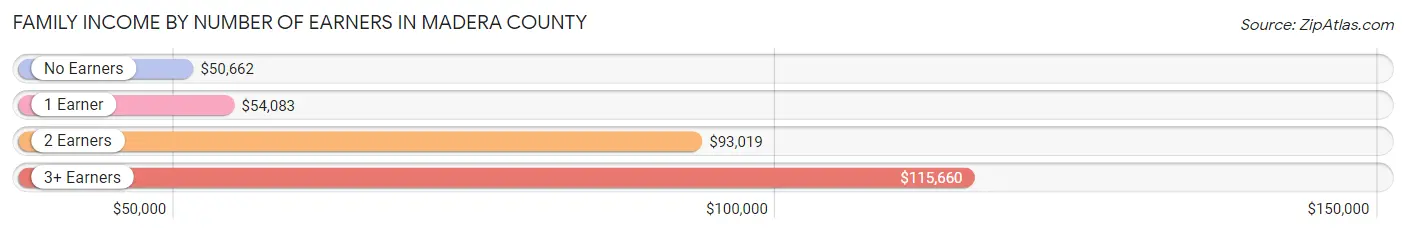
Family Income by Number of Earners in Madera County
The median family income in Madera County is $79,066, with families comprising 3+ earners (5,017) having the highest median family income of $115,660, while families with no earners (5,447) have the lowest median family income of $50,662, accounting for 14.7% and 16.0% of families, respectively.
| Number of Earners | # Families | Median Income |
| No Earners | 5,447 (16.0%) | $50,662 |
| 1 Earner | 11,909 (34.9%) | $54,083 |
| 2 Earners | 11,751 (34.4%) | $93,019 |
| 3+ Earners | 5,017 (14.7%) | $115,660 |
| Total | 34,124 (100.0%) | $79,066 |
Household Income in Madera County
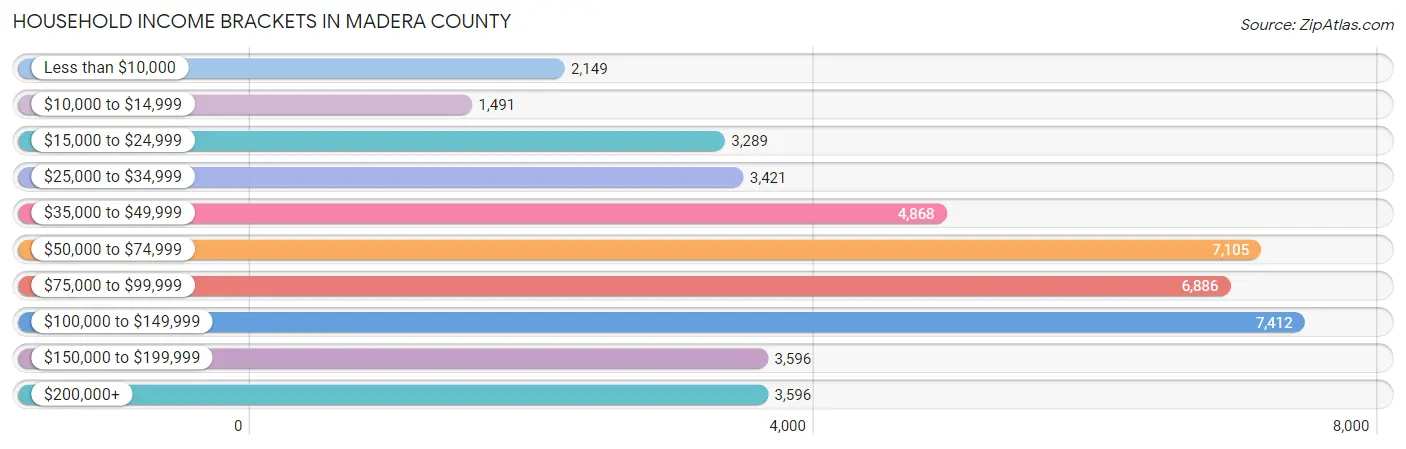
Household Income Brackets in Madera County
With 7,412 households falling in the category, the $100,000 to $149,999 income range is the most frequent in Madera County, accounting for 16.9% of all households. In contrast, only 1,491 households (3.4%) fall into the $10,000 to $14,999 income bracket, making it the least populous group.
| Income Bracket | # Households | % Households |
| Less than $10,000 | 2,149 | 4.9% |
| $10,000 to $14,999 | 1,491 | 3.4% |
| $15,000 to $24,999 | 3,289 | 7.5% |
| $25,000 to $34,999 | 3,421 | 7.8% |
| $35,000 to $49,999 | 4,868 | 11.1% |
| $50,000 to $74,999 | 7,105 | 16.2% |
| $75,000 to $99,999 | 6,886 | 15.7% |
| $100,000 to $149,999 | 7,412 | 16.9% |
| $150,000 to $199,999 | 3,596 | 8.2% |
| $200,000+ | 3,596 | 8.2% |
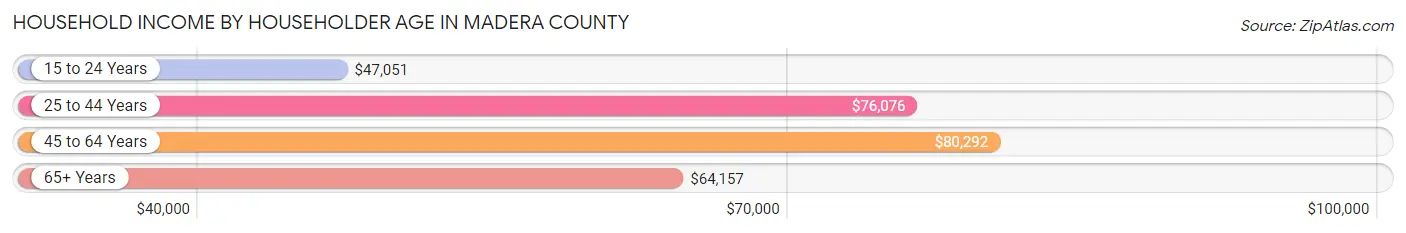
Household Income by Householder Age in Madera County
The median household income in Madera County is $73,543, with the highest median household income of $80,292 found in the 45 to 64 years age bracket for the primary householder. A total of 16,463 households (37.5%) fall into this category. Meanwhile, the 15 to 24 years age bracket for the primary householder has the lowest median household income of $47,051, with 734 households (1.7%) in this group.
| Income Bracket | # Households | Median Income |
| 15 to 24 Years | 734 (1.7%) | $47,051 |
| 25 to 44 Years | 14,534 (33.1%) | $76,076 |
| 45 to 64 Years | 16,463 (37.5%) | $80,292 |
| 65+ Years | 12,126 (27.7%) | $64,157 |
| Total | 43,857 (100.0%) | $73,543 |
Poverty in Madera County
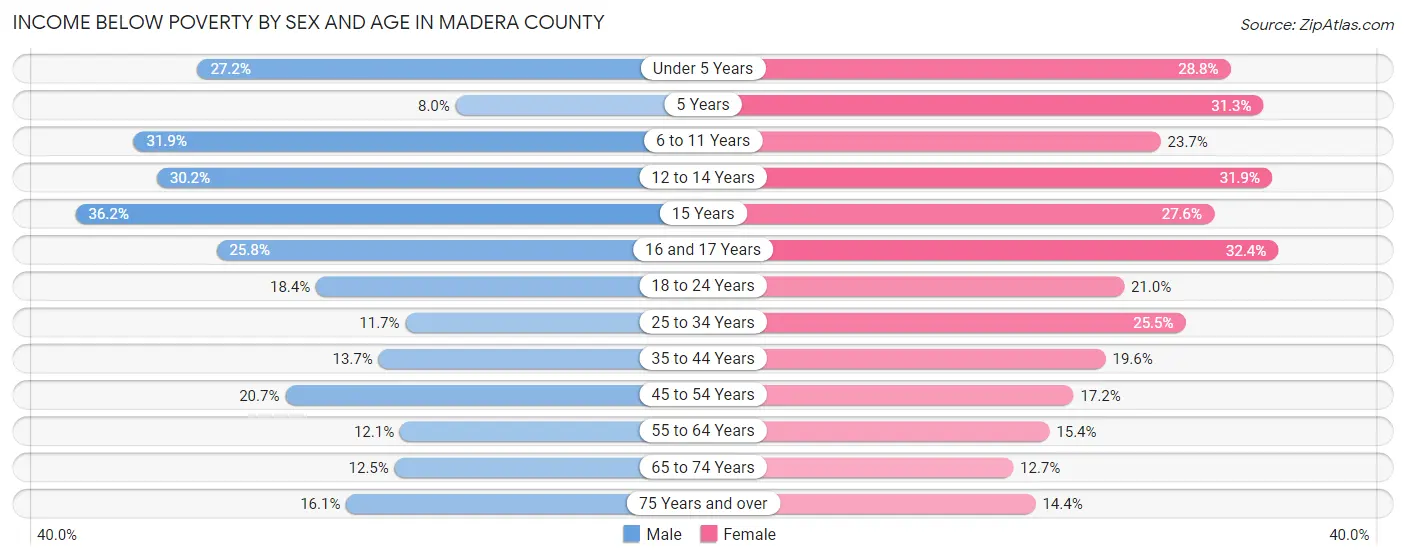
Income Below Poverty by Sex and Age in Madera County
With 19.0% poverty level for males and 21.1% for females among the residents of Madera County, 15 year old males and 16 and 17 year old females are the most vulnerable to poverty, with 456 males (36.2%) and 837 females (32.4%) in their respective age groups living below the poverty level.
| Age Bracket | Male | Female |
| Under 5 Years | 1,533 (27.2%) | 1,462 (28.8%) |
| 5 Years | 81 (8.0%) | 404 (31.3%) |
| 6 to 11 Years | 2,315 (31.9%) | 1,701 (23.7%) |
| 12 to 14 Years | 1,262 (30.2%) | 1,083 (31.9%) |
| 15 Years | 456 (36.2%) | 282 (27.6%) |
| 16 and 17 Years | 639 (25.8%) | 837 (32.4%) |
| 18 to 24 Years | 1,333 (18.4%) | 1,562 (20.9%) |
| 25 to 34 Years | 1,133 (11.7%) | 2,558 (25.5%) |
| 35 to 44 Years | 1,271 (13.7%) | 1,964 (19.6%) |
| 45 to 54 Years | 1,644 (20.6%) | 1,454 (17.2%) |
| 55 to 64 Years | 957 (12.1%) | 1,267 (15.4%) |
| 65 to 74 Years | 805 (12.5%) | 869 (12.7%) |
| 75 Years and over | 617 (16.1%) | 665 (14.4%) |
| Total | 14,046 (19.0%) | 16,108 (21.1%) |
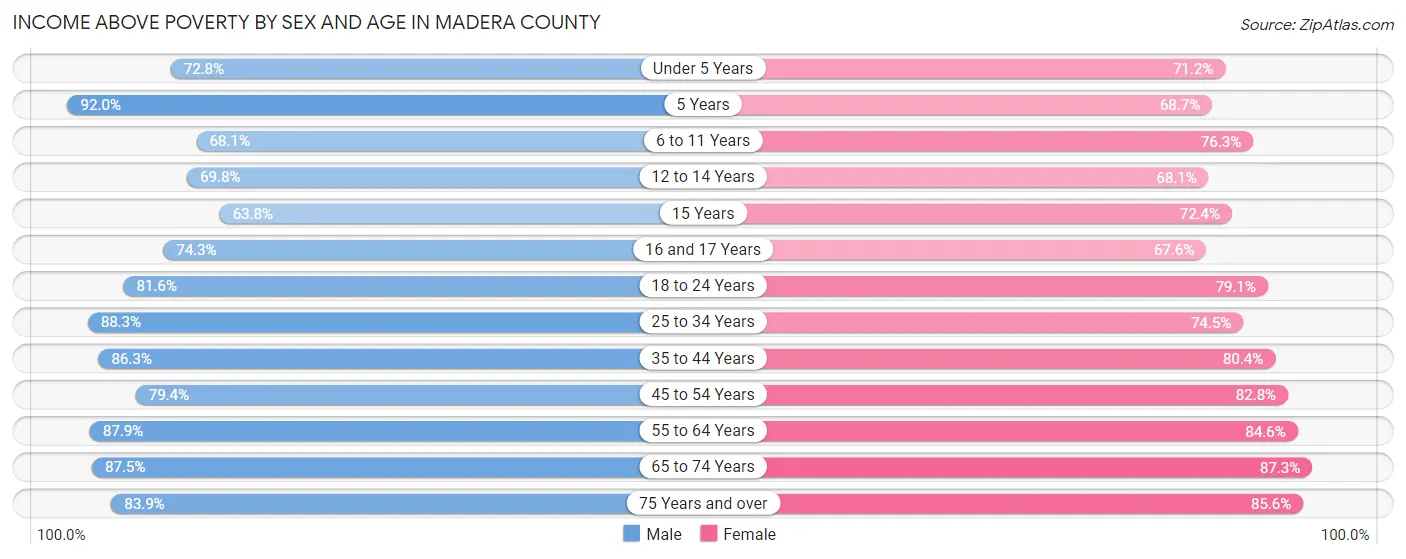
Income Above Poverty by Sex and Age in Madera County
According to the poverty statistics in Madera County, males aged 5 years and females aged 65 to 74 years are the age groups that are most secure financially, with 92.0% of males and 87.3% of females in these age groups living above the poverty line.
| Age Bracket | Male | Female |
| Under 5 Years | 4,111 (72.8%) | 3,608 (71.2%) |
| 5 Years | 932 (92.0%) | 887 (68.7%) |
| 6 to 11 Years | 4,939 (68.1%) | 5,484 (76.3%) |
| 12 to 14 Years | 2,920 (69.8%) | 2,310 (68.1%) |
| 15 Years | 803 (63.8%) | 739 (72.4%) |
| 16 and 17 Years | 1,843 (74.3%) | 1,747 (67.6%) |
| 18 to 24 Years | 5,928 (81.6%) | 5,893 (79.0%) |
| 25 to 34 Years | 8,527 (88.3%) | 7,474 (74.5%) |
| 35 to 44 Years | 7,991 (86.3%) | 8,066 (80.4%) |
| 45 to 54 Years | 6,317 (79.3%) | 7,001 (82.8%) |
| 55 to 64 Years | 6,932 (87.9%) | 6,955 (84.6%) |
| 65 to 74 Years | 5,621 (87.5%) | 5,961 (87.3%) |
| 75 Years and over | 3,210 (83.9%) | 3,961 (85.6%) |
| Total | 60,074 (81.0%) | 60,086 (78.9%) |
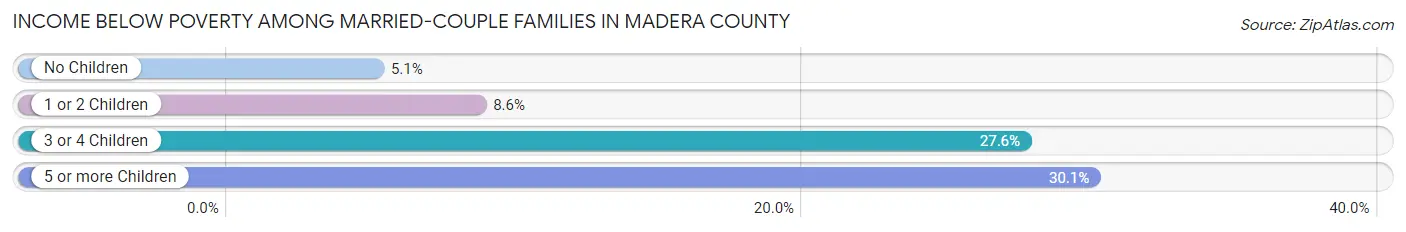
Income Below Poverty Among Married-Couple Families in Madera County
The poverty statistics for married-couple families in Madera County show that 10.3% or 2,443 of the total 23,686 families live below the poverty line. Families with 5 or more children have the highest poverty rate of 30.0%, comprising of 165 families. On the other hand, families with no children have the lowest poverty rate of 5.1%, which includes 613 families.
| Children | Above Poverty | Below Poverty |
| No Children | 11,456 (94.9%) | 613 (5.1%) |
| 1 or 2 Children | 6,704 (91.4%) | 634 (8.6%) |
| 3 or 4 Children | 2,699 (72.4%) | 1,031 (27.6%) |
| 5 or more Children | 384 (70.0%) | 165 (30.0%) |
| Total | 21,243 (89.7%) | 2,443 (10.3%) |
Income Below Poverty Among Single-Parent Households in Madera County
According to the poverty data in Madera County, 22.3% or 796 single-father households and 29.9% or 2,052 single-mother households are living below the poverty line. Among single-father households, those with 3 or 4 children have the highest poverty rate, with 265 households (44.1%) experiencing poverty. Likewise, among single-mother households, those with 3 or 4 children have the highest poverty rate, with 594 households (55.3%) falling below the poverty line.
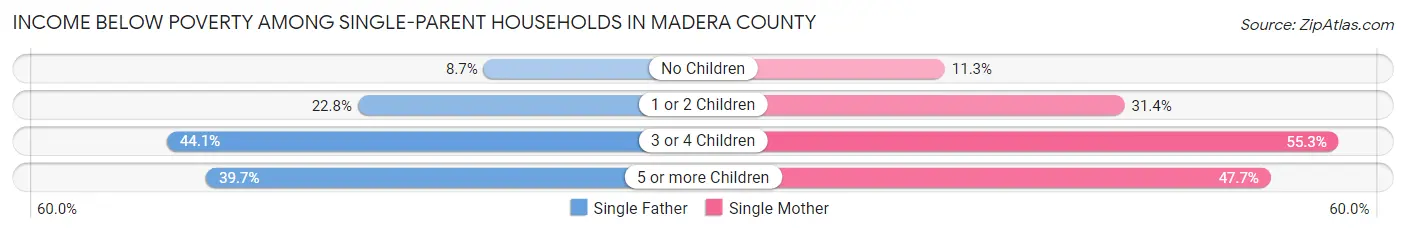
| Children | Single Father | Single Mother |
| No Children | 104 (8.7%) | 238 (11.3%) |
| 1 or 2 Children | 371 (22.8%) | 1,042 (31.4%) |
| 3 or 4 Children | 265 (44.1%) | 594 (55.3%) |
| 5 or more Children | 56 (39.7%) | 178 (47.7%) |
| Total | 796 (22.3%) | 2,052 (29.9%) |
Income Below Poverty Among Married-Couple vs Single-Parent Households in Madera County
The poverty data for Madera County shows that 2,443 of the married-couple family households (10.3%) and 2,848 of the single-parent households (27.3%) are living below the poverty level. Within the married-couple family households, those with 5 or more children have the highest poverty rate, with 165 households (30.0%) falling below the poverty line. Among the single-parent households, those with 3 or 4 children have the highest poverty rate, with 859 household (51.3%) living below poverty.
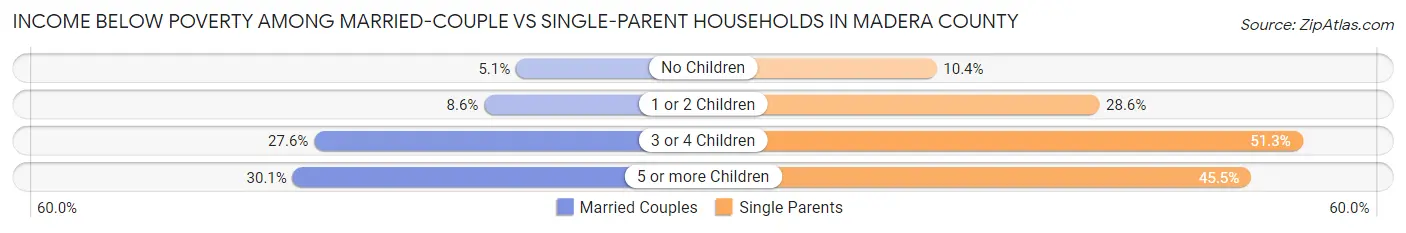
| Children | Married-Couple Families | Single-Parent Households |
| No Children | 613 (5.1%) | 342 (10.4%) |
| 1 or 2 Children | 634 (8.6%) | 1,413 (28.5%) |
| 3 or 4 Children | 1,031 (27.6%) | 859 (51.3%) |
| 5 or more Children | 165 (30.0%) | 234 (45.5%) |
| Total | 2,443 (10.3%) | 2,848 (27.3%) |
Race in Madera County
The most populous races in Madera County are Hispanic or Latino (93,855 | 59.7%), White / Caucasian (77,220 | 49.1%), and Some other Race (46,527 | 29.6%).
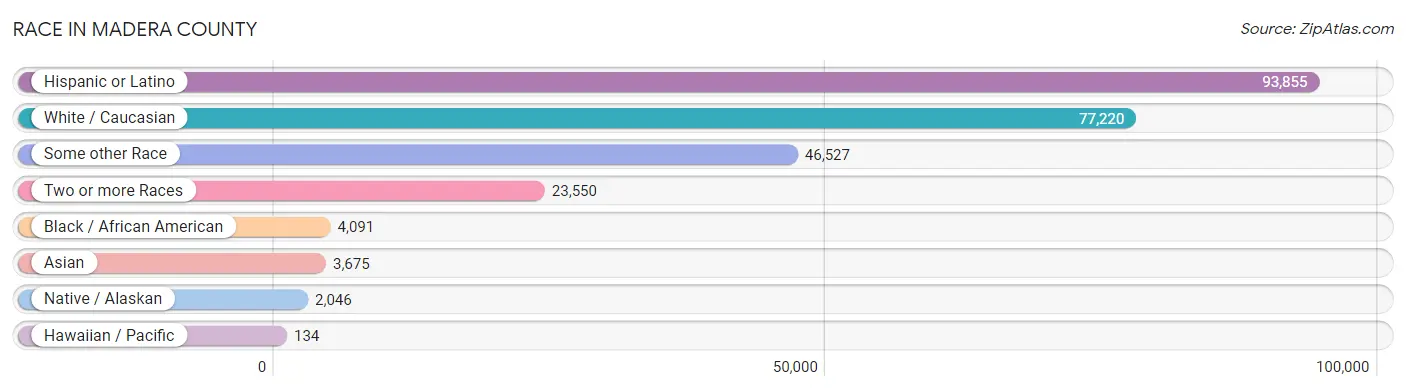
| Race | # Population | % Population |
| Asian | 3,675 | 2.3% |
| Black / African American | 4,091 | 2.6% |
| Hawaiian / Pacific | 134 | 0.1% |
| Hispanic or Latino | 93,855 | 59.7% |
| Native / Alaskan | 2,046 | 1.3% |
| White / Caucasian | 77,220 | 49.1% |
| Two or more Races | 23,550 | 15.0% |
| Some other Race | 46,527 | 29.6% |
| Total | 157,243 | 100.0% |
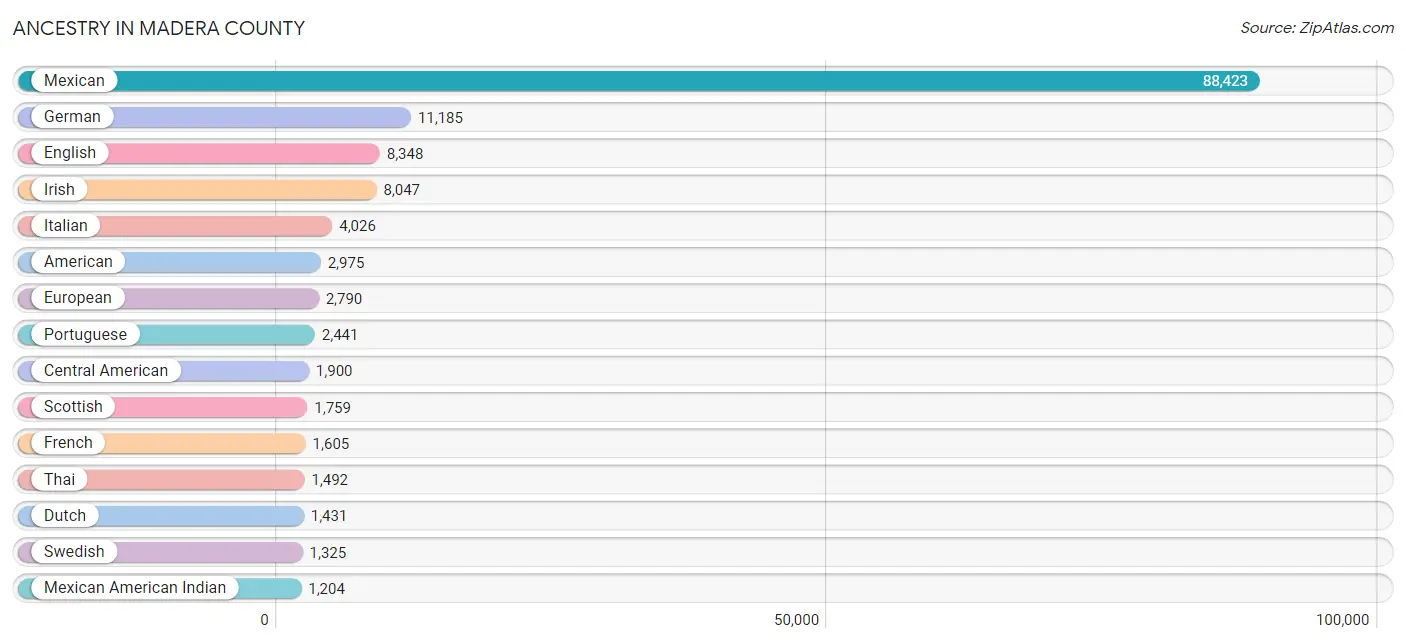
Ancestry in Madera County
The most populous ancestries reported in Madera County are Mexican (88,423 | 56.2%), German (11,185 | 7.1%), English (8,348 | 5.3%), Irish (8,047 | 5.1%), and Italian (4,026 | 2.6%), together accounting for 76.3% of all Madera County residents.
| Ancestry | # Population | % Population |
| African | 629 | 0.4% |
| Alaskan Athabascan | 11 | 0.0% |
| Albanian | 3 | 0.0% |
| American | 2,975 | 1.9% |
| Apache | 167 | 0.1% |
| Arab | 484 | 0.3% |
| Arapaho | 17 | 0.0% |
| Argentinean | 13 | 0.0% |
| Armenian | 368 | 0.2% |
| Assyrian / Chaldean / Syriac | 10 | 0.0% |
| Australian | 12 | 0.0% |
| Austrian | 62 | 0.0% |
| Bahamian | 21 | 0.0% |
| Bangladeshi | 270 | 0.2% |
| Basque | 311 | 0.2% |
| Belgian | 127 | 0.1% |
| Belizean | 5 | 0.0% |
| Bhutanese | 271 | 0.2% |
| Blackfeet | 427 | 0.3% |
| Brazilian | 54 | 0.0% |
| British | 384 | 0.2% |
| Bulgarian | 7 | 0.0% |
| Burmese | 87 | 0.1% |
| Canadian | 282 | 0.2% |
| Celtic | 97 | 0.1% |
| Central American | 1,900 | 1.2% |
| Central American Indian | 132 | 0.1% |
| Cherokee | 468 | 0.3% |
| Cheyenne | 3 | 0.0% |
| Chickasaw | 97 | 0.1% |
| Chilean | 49 | 0.0% |
| Chippewa | 58 | 0.0% |
| Choctaw | 47 | 0.0% |
| Colombian | 288 | 0.2% |
| Costa Rican | 97 | 0.1% |
| Cree | 2 | 0.0% |
| Creek | 131 | 0.1% |
| Croatian | 10 | 0.0% |
| Cuban | 76 | 0.1% |
| Czech | 186 | 0.1% |
| Czechoslovakian | 61 | 0.0% |
| Danish | 543 | 0.4% |
| Delaware | 2 | 0.0% |
| Dominican | 54 | 0.0% |
| Dutch | 1,431 | 0.9% |
| Eastern European | 122 | 0.1% |
| Ecuadorian | 45 | 0.0% |
| Egyptian | 6 | 0.0% |
| English | 8,348 | 5.3% |
| Estonian | 4 | 0.0% |
| Ethiopian | 2 | 0.0% |
| European | 2,790 | 1.8% |
| Finnish | 180 | 0.1% |
| French | 1,605 | 1.0% |
| French Canadian | 188 | 0.1% |
| German | 11,185 | 7.1% |
| Greek | 369 | 0.2% |
| Guamanian / Chamorro | 94 | 0.1% |
| Guatemalan | 575 | 0.4% |
| Haitian | 94 | 0.1% |
| Honduran | 135 | 0.1% |
| Hungarian | 69 | 0.0% |
| Icelander | 23 | 0.0% |
| Indian (Asian) | 1,169 | 0.7% |
| Indonesian | 22 | 0.0% |
| Inupiat | 20 | 0.0% |
| Iranian | 28 | 0.0% |
| Iraqi | 5 | 0.0% |
| Irish | 8,047 | 5.1% |
| Iroquois | 57 | 0.0% |
| Italian | 4,026 | 2.6% |
| Jamaican | 7 | 0.0% |
| Japanese | 42 | 0.0% |
| Korean | 789 | 0.5% |
| Lebanese | 143 | 0.1% |
| Lithuanian | 110 | 0.1% |
| Malaysian | 70 | 0.0% |
| Mexican | 88,423 | 56.2% |
| Mexican American Indian | 1,204 | 0.8% |
| Mongolian | 5 | 0.0% |
| Native Hawaiian | 219 | 0.1% |
| Navajo | 110 | 0.1% |
| Nepalese | 64 | 0.0% |
| Northern European | 113 | 0.1% |
| Norwegian | 1,118 | 0.7% |
| Paiute | 19 | 0.0% |
| Pakistani | 46 | 0.0% |
| Palestinian | 291 | 0.2% |
| Panamanian | 5 | 0.0% |
| Peruvian | 19 | 0.0% |
| Pima | 18 | 0.0% |
| Polish | 990 | 0.6% |
| Portuguese | 2,441 | 1.5% |
| Pueblo | 18 | 0.0% |
| Puerto Rican | 516 | 0.3% |
| Puget Sound Salish | 25 | 0.0% |
| Romanian | 222 | 0.1% |
| Russian | 543 | 0.4% |
| Salvadoran | 1,088 | 0.7% |
| Samoan | 65 | 0.0% |
| Scandinavian | 127 | 0.1% |
| Scotch-Irish | 697 | 0.4% |
| Scottish | 1,759 | 1.1% |
| Seminole | 37 | 0.0% |
| Shoshone | 21 | 0.0% |
| Sioux | 115 | 0.1% |
| Slavic | 5 | 0.0% |
| Slovene | 59 | 0.0% |
| South African | 14 | 0.0% |
| South American | 420 | 0.3% |
| South American Indian | 17 | 0.0% |
| Spaniard | 757 | 0.5% |
| Spanish | 320 | 0.2% |
| Spanish American Indian | 12 | 0.0% |
| Sri Lankan | 482 | 0.3% |
| Subsaharan African | 691 | 0.4% |
| Swedish | 1,325 | 0.8% |
| Swiss | 176 | 0.1% |
| Thai | 1,492 | 0.9% |
| Tohono O'Odham | 5 | 0.0% |
| Tongan | 16 | 0.0% |
| Turkish | 60 | 0.0% |
| Ukrainian | 130 | 0.1% |
| Venezuelan | 6 | 0.0% |
| Welsh | 339 | 0.2% |
| Yaqui | 132 | 0.1% |
| Yugoslavian | 64 | 0.0% |
| Yuman | 6 | 0.0% | View All 128 Rows |
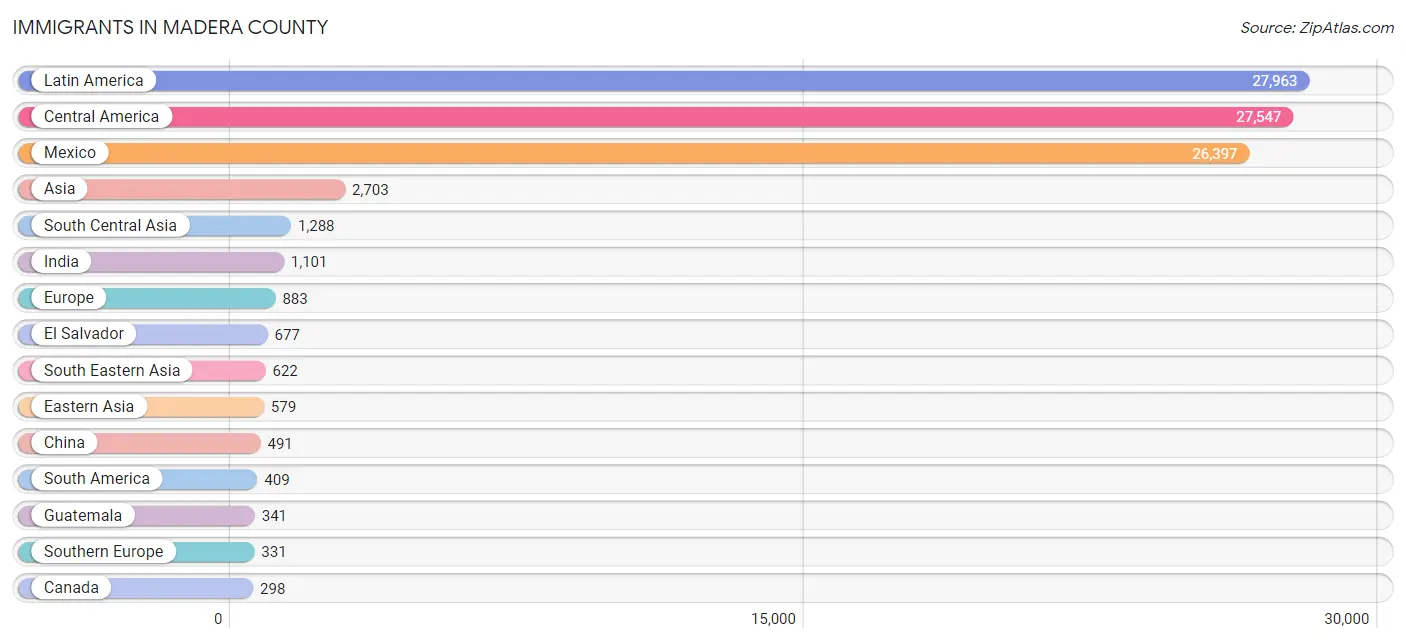
Immigrants in Madera County
The most numerous immigrant groups reported in Madera County came from Latin America (27,963 | 17.8%), Central America (27,547 | 17.5%), Mexico (26,397 | 16.8%), Asia (2,703 | 1.7%), and South Central Asia (1,288 | 0.8%), together accounting for 54.6% of all Madera County residents.
| Immigration Origin | # Population | % Population |
| Afghanistan | 3 | 0.0% |
| Africa | 88 | 0.1% |
| Asia | 2,703 | 1.7% |
| Azores | 107 | 0.1% |
| Belgium | 28 | 0.0% |
| Brazil | 42 | 0.0% |
| Cambodia | 18 | 0.0% |
| Canada | 298 | 0.2% |
| Caribbean | 7 | 0.0% |
| Central America | 27,547 | 17.5% |
| Chile | 134 | 0.1% |
| China | 491 | 0.3% |
| Colombia | 188 | 0.1% |
| Costa Rica | 9 | 0.0% |
| Czechoslovakia | 11 | 0.0% |
| Denmark | 11 | 0.0% |
| Eastern Africa | 42 | 0.0% |
| Eastern Asia | 579 | 0.4% |
| Eastern Europe | 132 | 0.1% |
| Ecuador | 35 | 0.0% |
| Egypt | 6 | 0.0% |
| El Salvador | 677 | 0.4% |
| England | 55 | 0.0% |
| Eritrea | 2 | 0.0% |
| Europe | 883 | 0.6% |
| Fiji | 17 | 0.0% |
| Germany | 192 | 0.1% |
| Greece | 8 | 0.0% |
| Guatemala | 341 | 0.2% |
| Honduras | 110 | 0.1% |
| Hong Kong | 22 | 0.0% |
| India | 1,101 | 0.7% |
| Indonesia | 25 | 0.0% |
| Iran | 35 | 0.0% |
| Iraq | 15 | 0.0% |
| Israel | 8 | 0.0% |
| Italy | 81 | 0.1% |
| Jamaica | 7 | 0.0% |
| Japan | 3 | 0.0% |
| Jordan | 9 | 0.0% |
| Kenya | 32 | 0.0% |
| Korea | 85 | 0.1% |
| Laos | 68 | 0.0% |
| Latin America | 27,963 | 17.8% |
| Lebanon | 56 | 0.0% |
| Lithuania | 12 | 0.0% |
| Malaysia | 5 | 0.0% |
| Mexico | 26,397 | 16.8% |
| Moldova | 4 | 0.0% |
| Netherlands | 63 | 0.0% |
| Nicaragua | 13 | 0.0% |
| Northern Africa | 6 | 0.0% |
| Northern Europe | 137 | 0.1% |
| Oceania | 23 | 0.0% |
| Pakistan | 149 | 0.1% |
| Peru | 10 | 0.0% |
| Philippines | 212 | 0.1% |
| Portugal | 228 | 0.1% |
| Romania | 27 | 0.0% |
| Saudi Arabia | 52 | 0.0% |
| Serbia | 8 | 0.0% |
| Sierra Leone | 17 | 0.0% |
| Somalia | 8 | 0.0% |
| South Africa | 23 | 0.0% |
| South America | 409 | 0.3% |
| South Central Asia | 1,288 | 0.8% |
| South Eastern Asia | 622 | 0.4% |
| Southern Europe | 331 | 0.2% |
| Spain | 14 | 0.0% |
| Syria | 22 | 0.0% |
| Taiwan | 4 | 0.0% |
| Thailand | 58 | 0.0% |
| Turkey | 28 | 0.0% |
| Ukraine | 12 | 0.0% |
| Vietnam | 214 | 0.1% |
| Western Africa | 17 | 0.0% |
| Western Asia | 190 | 0.1% |
| Western Europe | 283 | 0.2% | View All 78 Rows |
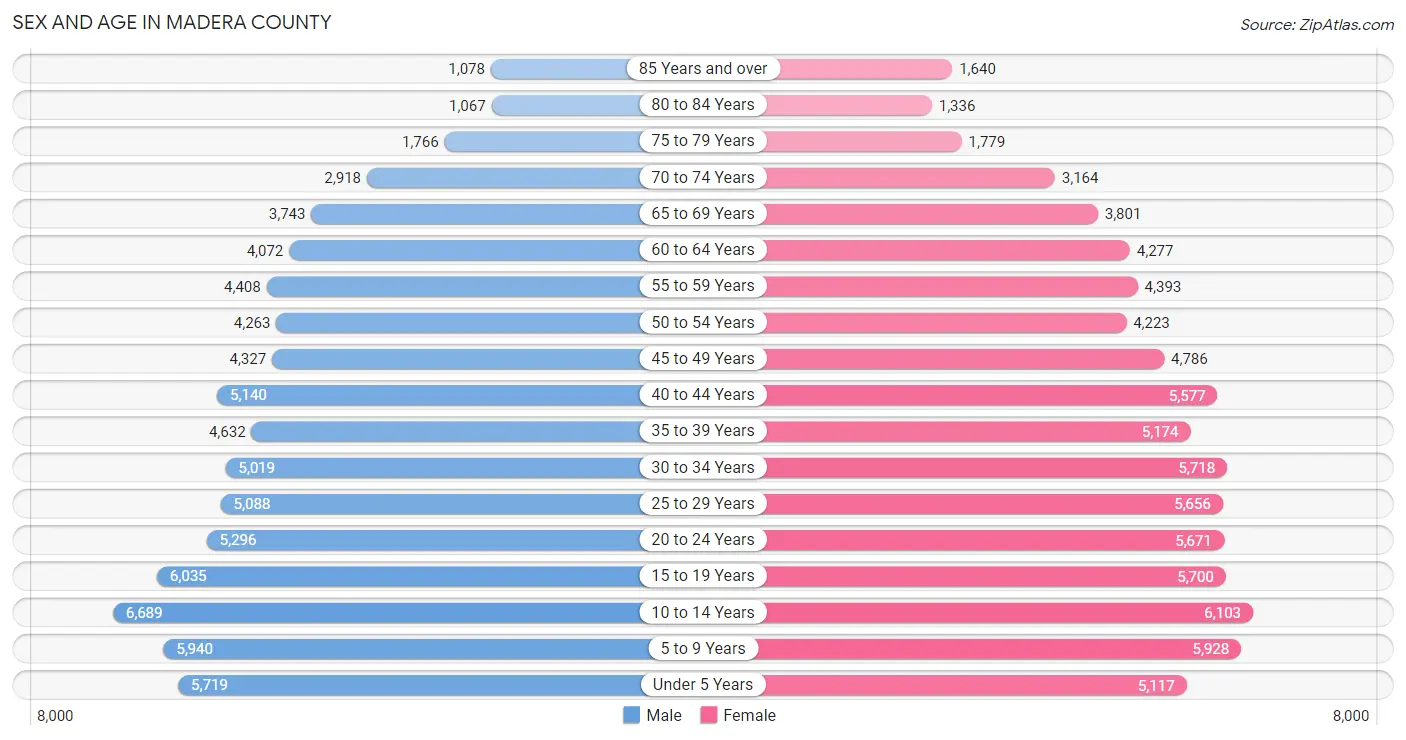
Sex and Age in Madera County
Sex and Age in Madera County
The most populous age groups in Madera County are 10 to 14 Years (6,689 | 8.7%) for men and 10 to 14 Years (6,103 | 7.6%) for women.
| Age Bracket | Male | Female |
| Under 5 Years | 5,719 (7.4%) | 5,117 (6.4%) |
| 5 to 9 Years | 5,940 (7.7%) | 5,928 (7.4%) |
| 10 to 14 Years | 6,689 (8.7%) | 6,103 (7.6%) |
| 15 to 19 Years | 6,035 (7.8%) | 5,700 (7.1%) |
| 20 to 24 Years | 5,296 (6.9%) | 5,671 (7.1%) |
| 25 to 29 Years | 5,088 (6.6%) | 5,656 (7.1%) |
| 30 to 34 Years | 5,019 (6.5%) | 5,718 (7.1%) |
| 35 to 39 Years | 4,632 (6.0%) | 5,174 (6.5%) |
| 40 to 44 Years | 5,140 (6.7%) | 5,577 (7.0%) |
| 45 to 49 Years | 4,327 (5.6%) | 4,786 (6.0%) |
| 50 to 54 Years | 4,263 (5.5%) | 4,223 (5.3%) |
| 55 to 59 Years | 4,408 (5.7%) | 4,393 (5.5%) |
| 60 to 64 Years | 4,072 (5.3%) | 4,277 (5.3%) |
| 65 to 69 Years | 3,743 (4.9%) | 3,801 (4.8%) |
| 70 to 74 Years | 2,918 (3.8%) | 3,164 (4.0%) |
| 75 to 79 Years | 1,766 (2.3%) | 1,779 (2.2%) |
| 80 to 84 Years | 1,067 (1.4%) | 1,336 (1.7%) |
| 85 Years and over | 1,078 (1.4%) | 1,640 (2.1%) |
| Total | 77,200 (100.0%) | 80,043 (100.0%) |
Families and Households in Madera County
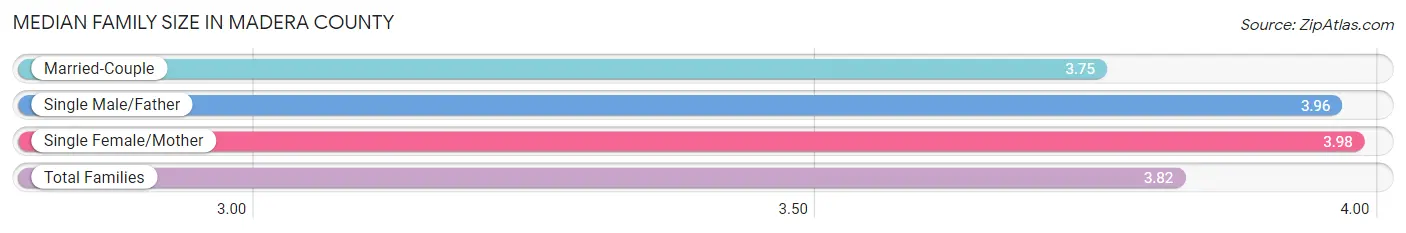
Median Family Size in Madera County
The median family size in Madera County is 3.82 persons per family, with single female/mother families (6,871 | 20.1%) accounting for the largest median family size of 3.98 persons per family. On the other hand, married-couple families (23,686 | 69.4%) represent the smallest median family size with 3.75 persons per family.
| Family Type | # Families | Family Size |
| Married-Couple | 23,686 (69.4%) | 3.75 |
| Single Male/Father | 3,567 (10.4%) | 3.96 |
| Single Female/Mother | 6,871 (20.1%) | 3.98 |
| Total Families | 34,124 (100.0%) | 3.82 |
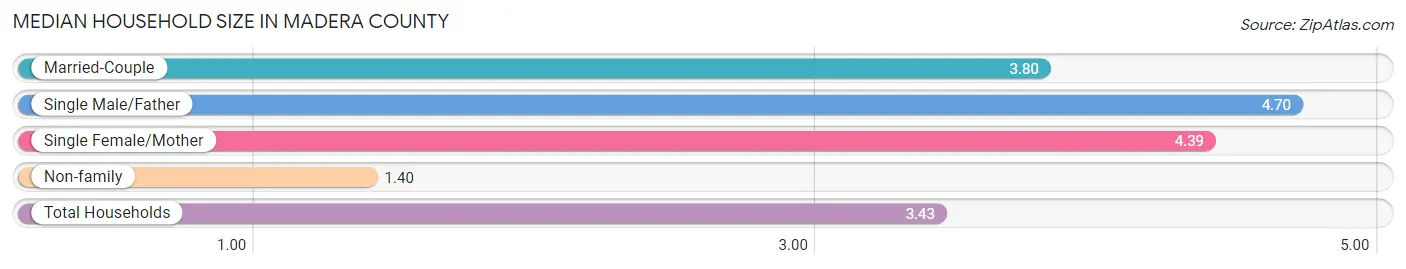
Median Household Size in Madera County
The median household size in Madera County is 3.43 persons per household, with single male/father households (3,567 | 8.1%) accounting for the largest median household size of 4.7 persons per household. non-family households (9,733 | 22.2%) represent the smallest median household size with 1.40 persons per household.
| Household Type | # Households | Household Size |
| Married-Couple | 23,686 (54.0%) | 3.80 |
| Single Male/Father | 3,567 (8.1%) | 4.70 |
| Single Female/Mother | 6,871 (15.7%) | 4.39 |
| Non-family | 9,733 (22.2%) | 1.40 |
| Total Households | 43,857 (100.0%) | 3.43 |
Household Size by Marriage Status in Madera County
Out of a total of 43,857 households in Madera County, 34,124 (77.8%) are family households, while 9,733 (22.2%) are nonfamily households. The most numerous type of family households are 2-person households, comprising 10,982, and the most common type of nonfamily households are 1-person households, comprising 7,335.
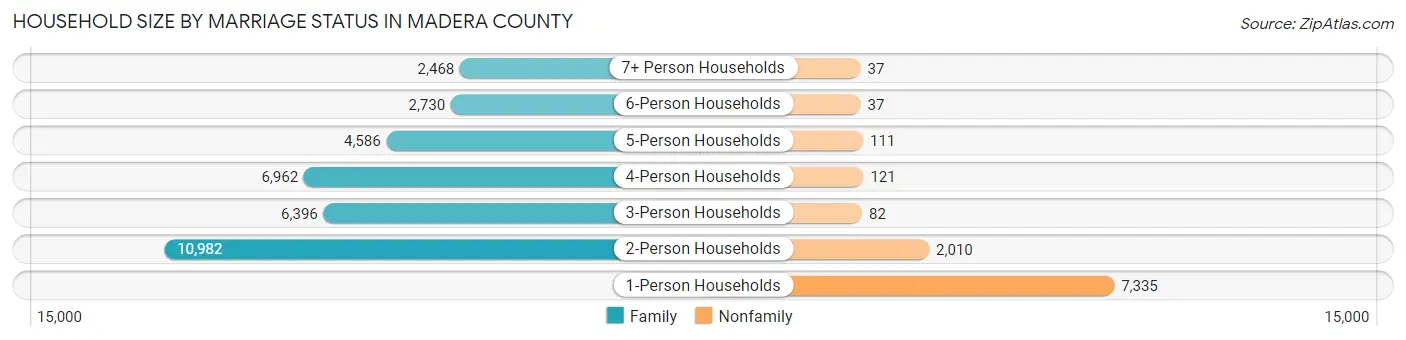
| Household Size | Family Households | Nonfamily Households |
| 1-Person Households | - | 7,335 (16.7%) |
| 2-Person Households | 10,982 (25.0%) | 2,010 (4.6%) |
| 3-Person Households | 6,396 (14.6%) | 82 (0.2%) |
| 4-Person Households | 6,962 (15.9%) | 121 (0.3%) |
| 5-Person Households | 4,586 (10.5%) | 111 (0.3%) |
| 6-Person Households | 2,730 (6.2%) | 37 (0.1%) |
| 7+ Person Households | 2,468 (5.6%) | 37 (0.1%) |
| Total | 34,124 (77.8%) | 9,733 (22.2%) |
Female Fertility in Madera County
Fertility by Age in Madera County
Average fertility rate in Madera County is 65.0 births per 1,000 women. Women in the age bracket of 20 to 34 years have the highest fertility rate with 115.0 births per 1,000 women. Women in the age bracket of 20 to 34 years acount for 76.5% of all women with births.
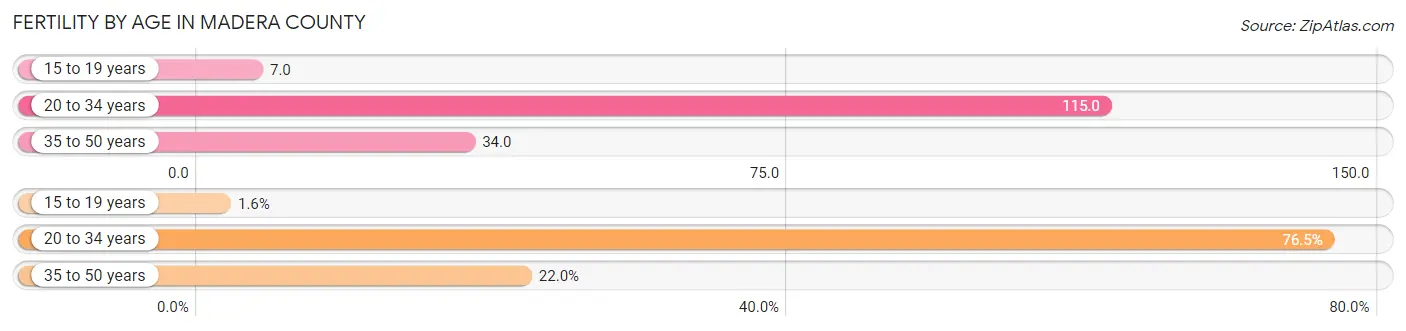
| Age Bracket | Women with Births | Births / 1,000 Women |
| 15 to 19 years | 40 (1.6%) | 7.0 |
| 20 to 34 years | 1,959 (76.5%) | 115.0 |
| 35 to 50 years | 563 (22.0%) | 34.0 |
| Total | 2,562 (100.0%) | 65.0 |
Fertility by Age by Marriage Status in Madera County
64.9% of women with births (2,562) in Madera County are married. The highest percentage of unmarried women with births falls into 15 to 19 years age bracket with 100.0% of them unmarried at the time of birth, while the lowest percentage of unmarried women with births belong to 35 to 50 years age bracket with 22.2% of them unmarried.
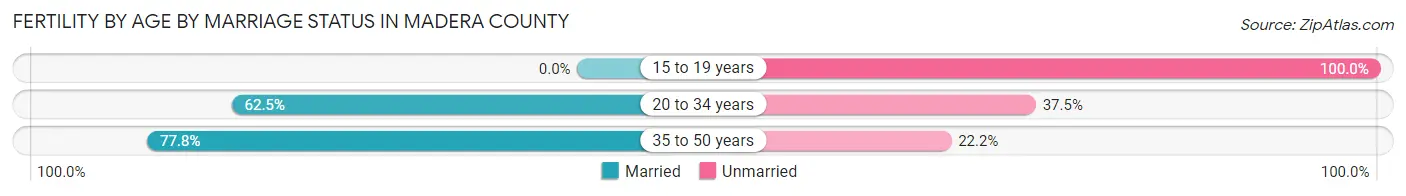
| Age Bracket | Married | Unmarried |
| 15 to 19 years | 0 (0.0%) | 40 (100.0%) |
| 20 to 34 years | 1,224 (62.5%) | 735 (37.5%) |
| 35 to 50 years | 438 (77.8%) | 125 (22.2%) |
| Total | 1,663 (64.9%) | 899 (35.1%) |
Fertility by Education in Madera County
Average fertility rate in Madera County is 65.0 births per 1,000 women. Women with the education attainment of high school diploma have the highest fertility rate of 81.0 births per 1,000 women, while women with the education attainment of graduate degree have the lowest fertility at 13.0 births per 1,000 women. Women with the education attainment of college or associate's degree represent 37.9% of all women with births.
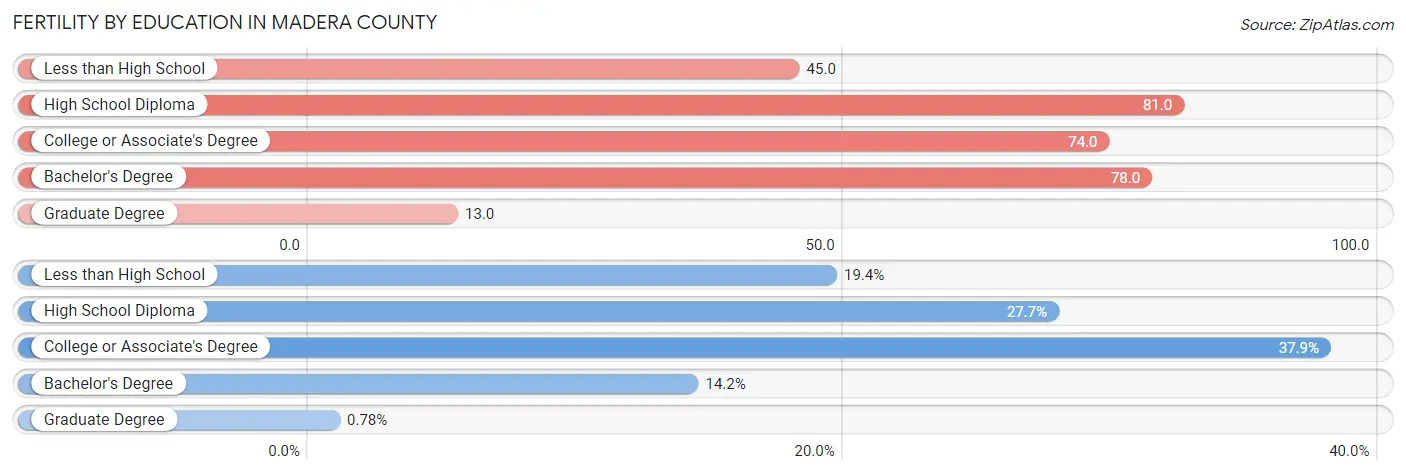
| Educational Attainment | Women with Births | Births / 1,000 Women |
| Less than High School | 497 (19.4%) | 45.0 |
| High School Diploma | 710 (27.7%) | 81.0 |
| College or Associate's Degree | 971 (37.9%) | 74.0 |
| Bachelor's Degree | 364 (14.2%) | 78.0 |
| Graduate Degree | 20 (0.8%) | 13.0 |
| Total | 2,562 (100.0%) | 65.0 |
Fertility by Education by Marriage Status in Madera County
35.1% of women with births in Madera County are unmarried. Women with the educational attainment of graduate degree are most likely to be married with 100.0% of them married at childbirth, while women with the educational attainment of high school diploma are least likely to be married with 44.5% of them unmarried at childbirth.
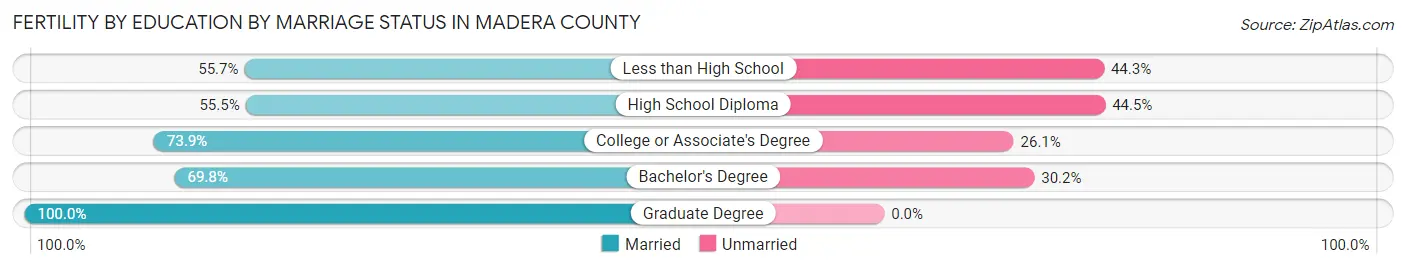
| Educational Attainment | Married | Unmarried |
| Less than High School | 277 (55.7%) | 220 (44.3%) |
| High School Diploma | 394 (55.5%) | 316 (44.5%) |
| College or Associate's Degree | 718 (73.9%) | 253 (26.1%) |
| Bachelor's Degree | 254 (69.8%) | 110 (30.2%) |
| Graduate Degree | 20 (100.0%) | 0 (0.0%) |
| Total | 1,663 (64.9%) | 899 (35.1%) |
Employment Characteristics in Madera County
Employment by Class of Employer in Madera County
Among the 57,706 employed individuals in Madera County, private company employees (37,367 | 64.7%), local government employees (5,829 | 10.1%), and self-employed (not incorporated) (4,545 | 7.9%) make up the most common classes of employment.
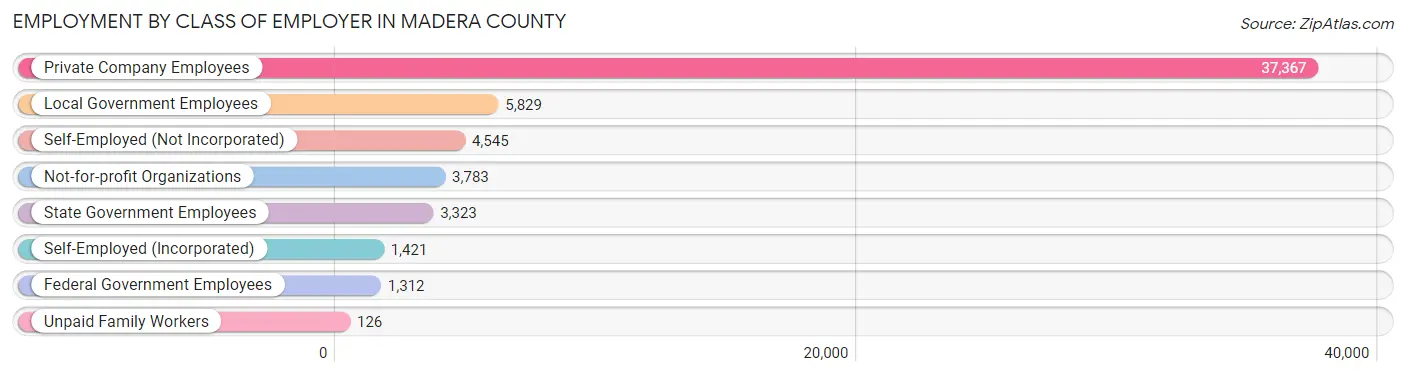
| Employer Class | # Employees | % Employees |
| Private Company Employees | 37,367 | 64.7% |
| Self-Employed (Incorporated) | 1,421 | 2.5% |
| Self-Employed (Not Incorporated) | 4,545 | 7.9% |
| Not-for-profit Organizations | 3,783 | 6.6% |
| Local Government Employees | 5,829 | 10.1% |
| State Government Employees | 3,323 | 5.8% |
| Federal Government Employees | 1,312 | 2.3% |
| Unpaid Family Workers | 126 | 0.2% |
| Total | 57,706 | 100.0% |
Employment Status by Age in Madera County
According to the labor force statistics for Madera County, out of the total population over 16 years of age (119,464), 56.5% or 67,497 individuals are in the labor force, with 11.1% or 7,492 of them unemployed. The age group with the highest labor force participation rate is 35 to 44 years, with 75.7% or 15,536 individuals in the labor force. Within the labor force, the 16 to 19 years age range has the highest percentage of unemployed individuals, with 38.0% or 1,171 of them being unemployed.
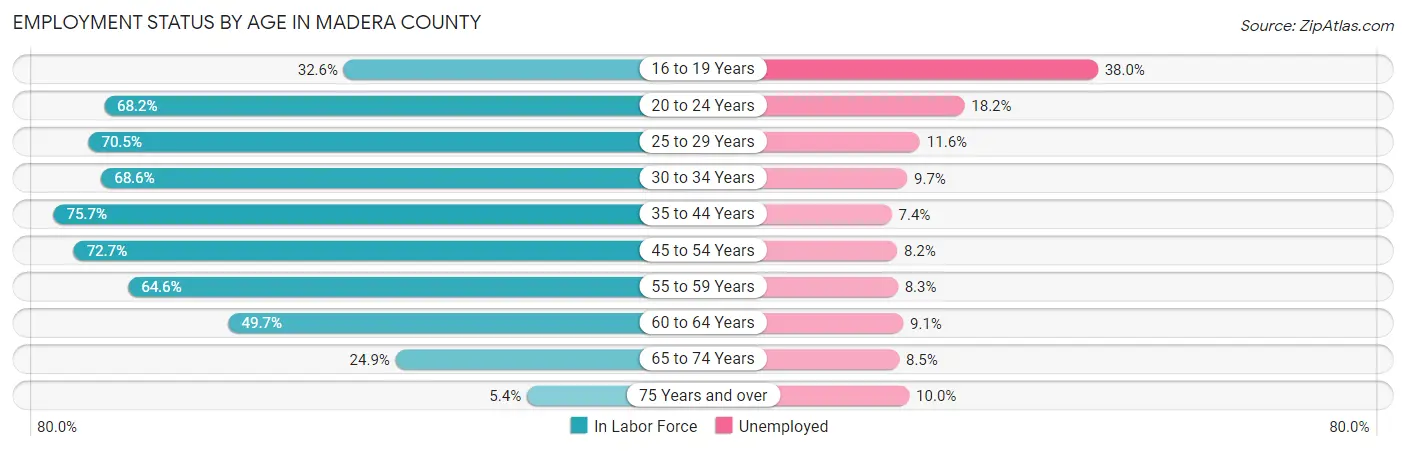
| Age Bracket | In Labor Force | Unemployed |
| 16 to 19 Years | 3,081 (32.6%) | 1,171 (38.0%) |
| 20 to 24 Years | 7,479 (68.2%) | 1,361 (18.2%) |
| 25 to 29 Years | 7,575 (70.5%) | 879 (11.6%) |
| 30 to 34 Years | 7,366 (68.6%) | 715 (9.7%) |
| 35 to 44 Years | 15,536 (75.7%) | 1,150 (7.4%) |
| 45 to 54 Years | 12,794 (72.7%) | 1,049 (8.2%) |
| 55 to 59 Years | 5,685 (64.6%) | 472 (8.3%) |
| 60 to 64 Years | 4,149 (49.7%) | 378 (9.1%) |
| 65 to 74 Years | 3,393 (24.9%) | 288 (8.5%) |
| 75 Years and over | 468 (5.4%) | 47 (10.0%) |
| Total | 67,497 (56.5%) | 7,492 (11.1%) |
Employment Status by Educational Attainment in Madera County
According to labor force statistics for Madera County, 69.2% of individuals (53,113) out of the total population between 25 and 64 years of age (76,753) are in the labor force, with 8.8% or 4,674 of them being unemployed. The group with the highest labor force participation rate are those with the educational attainment of bachelor's degree or higher, with 84.6% or 10,456 individuals in the labor force. Within the labor force, individuals with less than high school education have the highest percentage of unemployment, with 12.9% or 1,751 of them being unemployed.
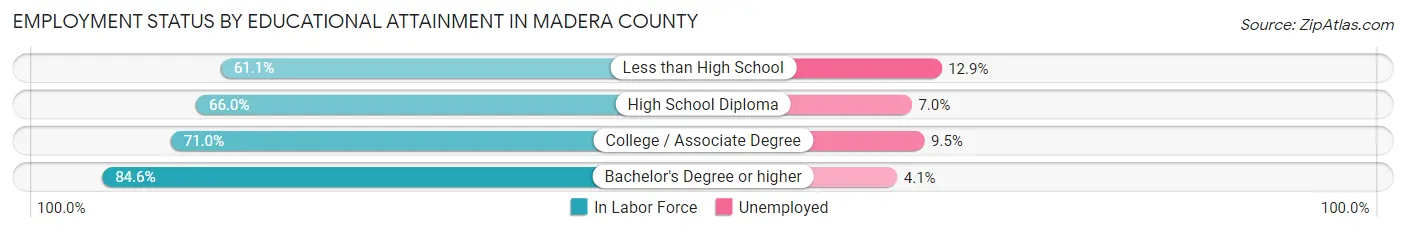
| Educational Attainment | In Labor Force | Unemployed |
| Less than High School | 13,577 (61.1%) | 2,867 (12.9%) |
| High School Diploma | 11,718 (66.0%) | 1,243 (7.0%) |
| College / Associate Degree | 17,337 (71.0%) | 2,320 (9.5%) |
| Bachelor's Degree or higher | 10,456 (84.6%) | 507 (4.1%) |
| Total | 53,113 (69.2%) | 6,754 (8.8%) |
Employment Occupations by Sex in Madera County
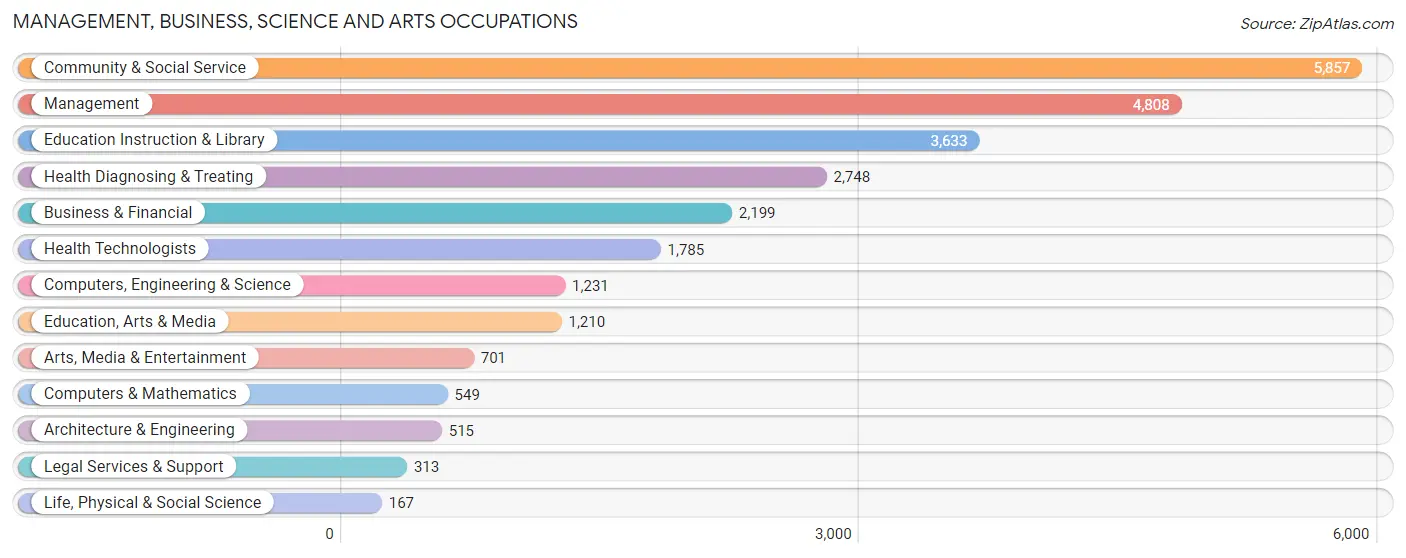
Management, Business, Science and Arts Occupations
The most common Management, Business, Science and Arts occupations in Madera County are Community & Social Service (5,857 | 9.8%), Management (4,808 | 8.0%), Education Instruction & Library (3,633 | 6.1%), Health Diagnosing & Treating (2,748 | 4.6%), and Business & Financial (2,199 | 3.7%).
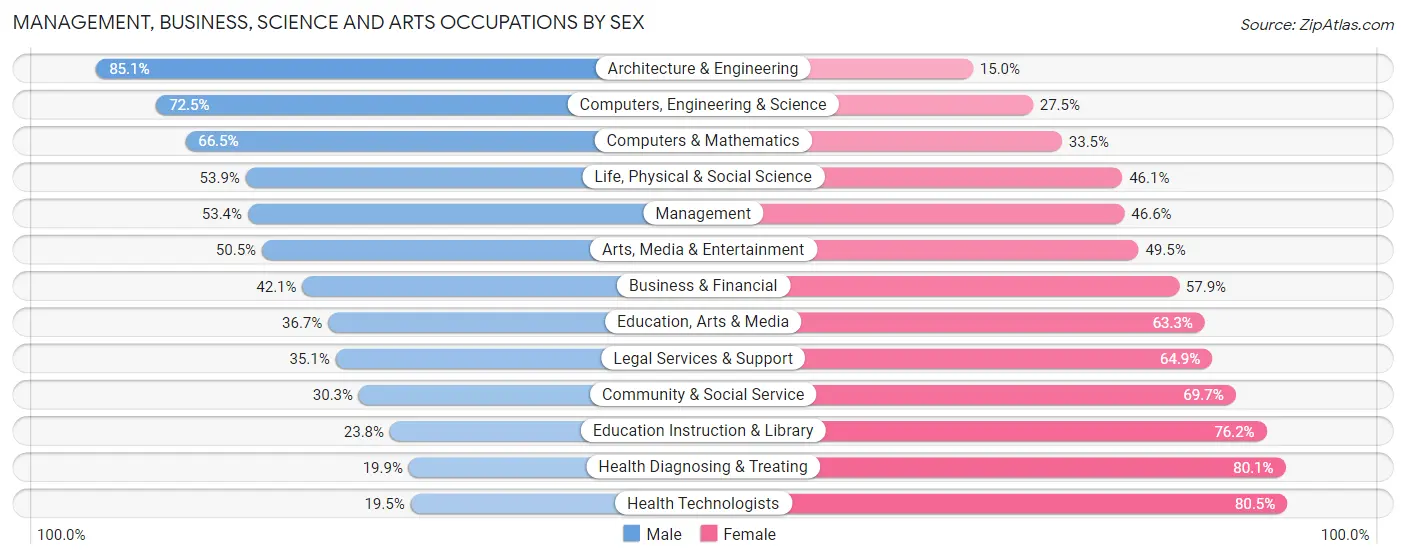
Management, Business, Science and Arts Occupations by Sex
Within the Management, Business, Science and Arts occupations in Madera County, the most male-oriented occupations are Architecture & Engineering (85.1%), Computers, Engineering & Science (72.5%), and Computers & Mathematics (66.5%), while the most female-oriented occupations are Health Technologists (80.5%), Health Diagnosing & Treating (80.1%), and Education Instruction & Library (76.2%).
| Occupation | Male | Female |
| Management | 2,569 (53.4%) | 2,239 (46.6%) |
| Business & Financial | 925 (42.1%) | 1,274 (57.9%) |
| Computers, Engineering & Science | 893 (72.5%) | 338 (27.5%) |
| Computers & Mathematics | 365 (66.5%) | 184 (33.5%) |
| Architecture & Engineering | 438 (85.1%) | 77 (14.9%) |
| Life, Physical & Social Science | 90 (53.9%) | 77 (46.1%) |
| Community & Social Service | 1,773 (30.3%) | 4,084 (69.7%) |
| Education, Arts & Media | 444 (36.7%) | 766 (63.3%) |
| Legal Services & Support | 110 (35.1%) | 203 (64.9%) |
| Education Instruction & Library | 865 (23.8%) | 2,768 (76.2%) |
| Arts, Media & Entertainment | 354 (50.5%) | 347 (49.5%) |
| Health Diagnosing & Treating | 546 (19.9%) | 2,202 (80.1%) |
| Health Technologists | 348 (19.5%) | 1,437 (80.5%) |
| Total (Category) | 6,706 (39.8%) | 10,137 (60.2%) |
| Total (Overall) | 32,352 (54.1%) | 27,474 (45.9%) |
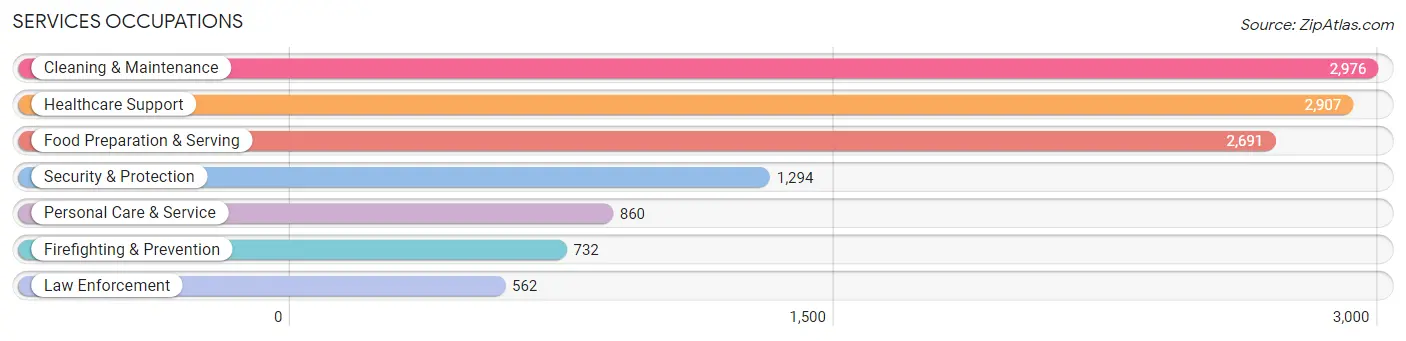
Services Occupations
The most common Services occupations in Madera County are Cleaning & Maintenance (2,976 | 5.0%), Healthcare Support (2,907 | 4.9%), Food Preparation & Serving (2,691 | 4.5%), Security & Protection (1,294 | 2.2%), and Personal Care & Service (860 | 1.4%).
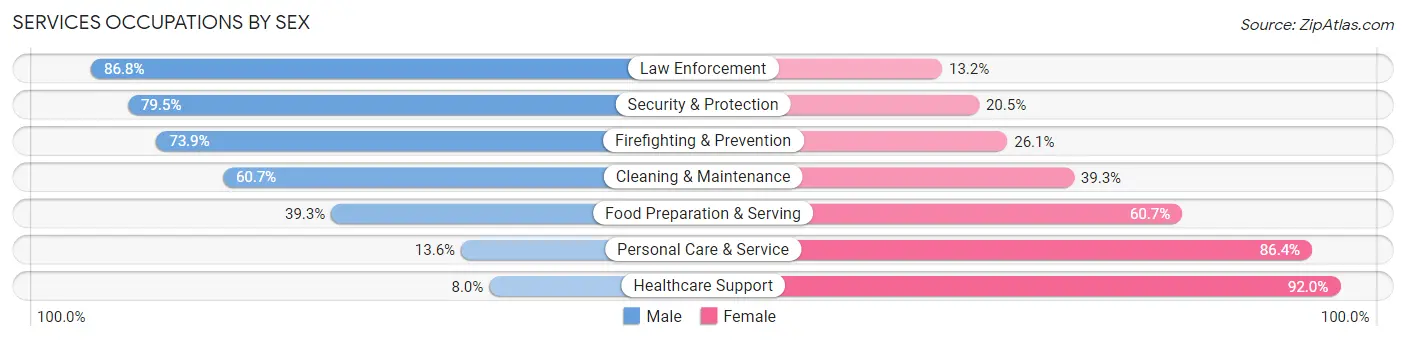
Services Occupations by Sex
Within the Services occupations in Madera County, the most male-oriented occupations are Law Enforcement (86.8%), Security & Protection (79.5%), and Firefighting & Prevention (73.9%), while the most female-oriented occupations are Healthcare Support (92.0%), Personal Care & Service (86.4%), and Food Preparation & Serving (60.7%).
| Occupation | Male | Female |
| Healthcare Support | 233 (8.0%) | 2,674 (92.0%) |
| Security & Protection | 1,029 (79.5%) | 265 (20.5%) |
| Firefighting & Prevention | 541 (73.9%) | 191 (26.1%) |
| Law Enforcement | 488 (86.8%) | 74 (13.2%) |
| Food Preparation & Serving | 1,058 (39.3%) | 1,633 (60.7%) |
| Cleaning & Maintenance | 1,807 (60.7%) | 1,169 (39.3%) |
| Personal Care & Service | 117 (13.6%) | 743 (86.4%) |
| Total (Category) | 4,244 (39.6%) | 6,484 (60.4%) |
| Total (Overall) | 32,352 (54.1%) | 27,474 (45.9%) |
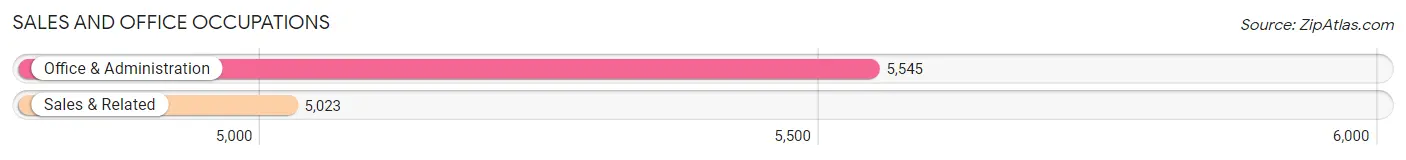
Sales and Office Occupations
The most common Sales and Office occupations in Madera County are Office & Administration (5,545 | 9.3%), and Sales & Related (5,023 | 8.4%).
Sales and Office Occupations by Sex
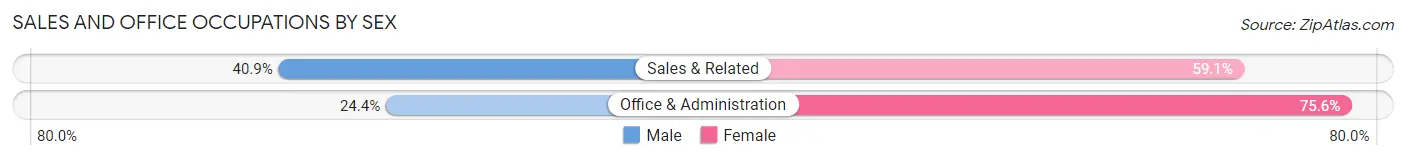
| Occupation | Male | Female |
| Sales & Related | 2,056 (40.9%) | 2,967 (59.1%) |
| Office & Administration | 1,353 (24.4%) | 4,192 (75.6%) |
| Total (Category) | 3,409 (32.3%) | 7,159 (67.7%) |
| Total (Overall) | 32,352 (54.1%) | 27,474 (45.9%) |
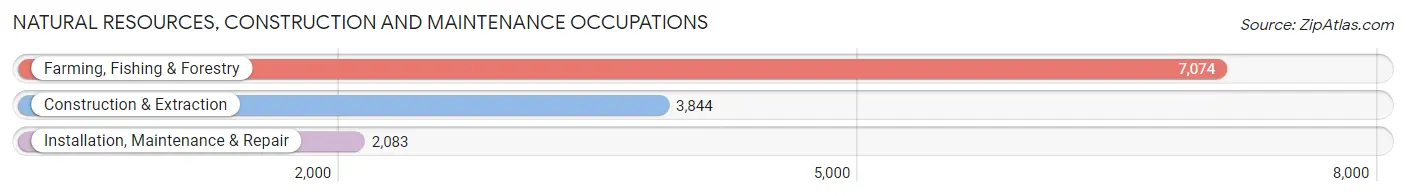
Natural Resources, Construction and Maintenance Occupations
The most common Natural Resources, Construction and Maintenance occupations in Madera County are Farming, Fishing & Forestry (7,074 | 11.8%), Construction & Extraction (3,844 | 6.4%), and Installation, Maintenance & Repair (2,083 | 3.5%).
Natural Resources, Construction and Maintenance Occupations by Sex
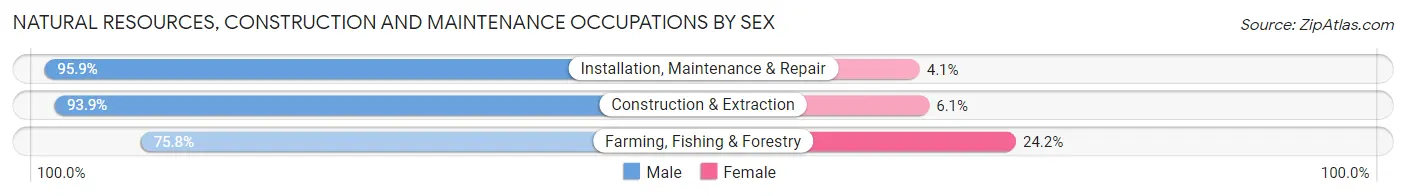
| Occupation | Male | Female |
| Farming, Fishing & Forestry | 5,364 (75.8%) | 1,710 (24.2%) |
| Construction & Extraction | 3,609 (93.9%) | 235 (6.1%) |
| Installation, Maintenance & Repair | 1,997 (95.9%) | 86 (4.1%) |
| Total (Category) | 10,970 (84.4%) | 2,031 (15.6%) |
| Total (Overall) | 32,352 (54.1%) | 27,474 (45.9%) |
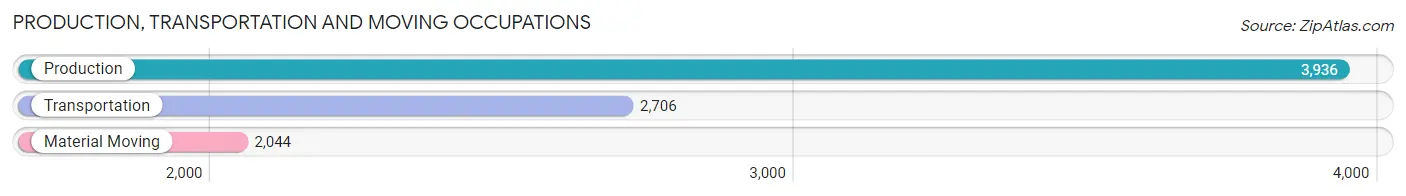
Production, Transportation and Moving Occupations
The most common Production, Transportation and Moving occupations in Madera County are Production (3,936 | 6.6%), Transportation (2,706 | 4.5%), and Material Moving (2,044 | 3.4%).
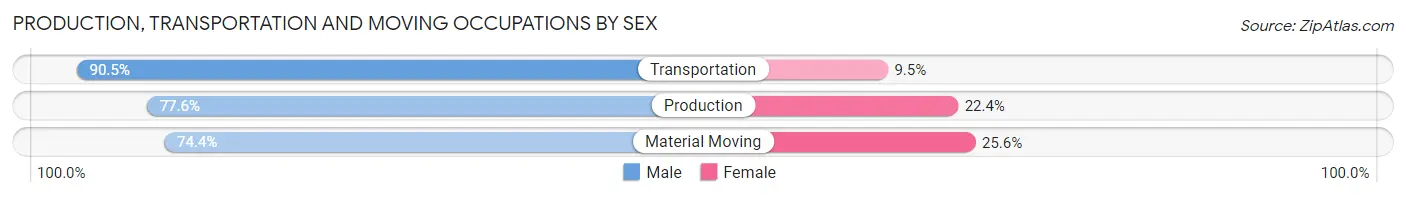
Production, Transportation and Moving Occupations by Sex
| Occupation | Male | Female |
| Production | 3,054 (77.6%) | 882 (22.4%) |
| Transportation | 2,448 (90.5%) | 258 (9.5%) |
| Material Moving | 1,521 (74.4%) | 523 (25.6%) |
| Total (Category) | 7,023 (80.8%) | 1,663 (19.2%) |
| Total (Overall) | 32,352 (54.1%) | 27,474 (45.9%) |
Employment Industries by Sex in Madera County
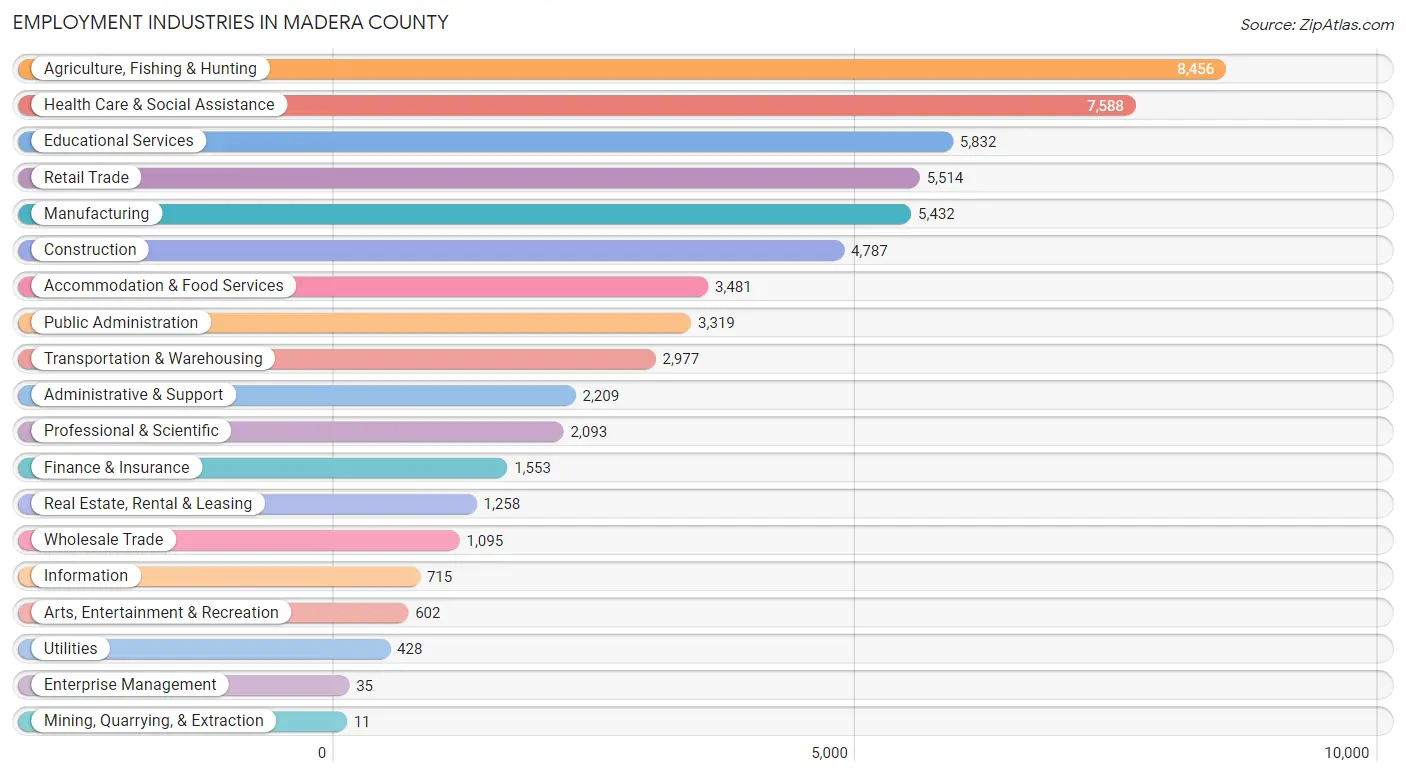
Employment Industries in Madera County
The major employment industries in Madera County include Agriculture, Fishing & Hunting (8,456 | 14.1%), Health Care & Social Assistance (7,588 | 12.7%), Educational Services (5,832 | 9.8%), Retail Trade (5,514 | 9.2%), and Manufacturing (5,432 | 9.1%).
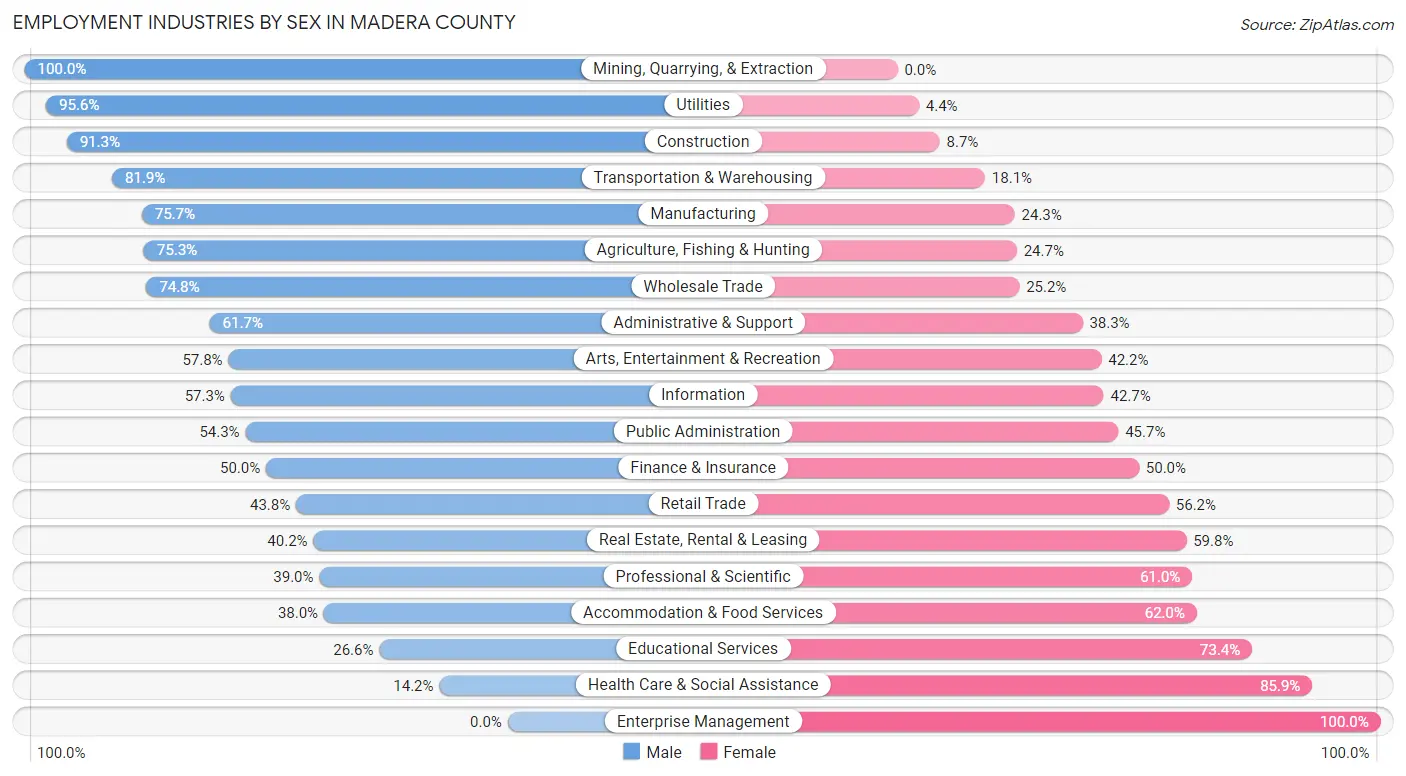
Employment Industries by Sex in Madera County
The Madera County industries that see more men than women are Mining, Quarrying, & Extraction (100.0%), Utilities (95.6%), and Construction (91.3%), whereas the industries that tend to have a higher number of women are Enterprise Management (100.0%), Health Care & Social Assistance (85.9%), and Educational Services (73.4%).
| Industry | Male | Female |
| Agriculture, Fishing & Hunting | 6,367 (75.3%) | 2,089 (24.7%) |
| Mining, Quarrying, & Extraction | 11 (100.0%) | 0 (0.0%) |
| Construction | 4,369 (91.3%) | 418 (8.7%) |
| Manufacturing | 4,114 (75.7%) | 1,318 (24.3%) |
| Wholesale Trade | 819 (74.8%) | 276 (25.2%) |
| Retail Trade | 2,416 (43.8%) | 3,098 (56.2%) |
| Transportation & Warehousing | 2,438 (81.9%) | 539 (18.1%) |
| Utilities | 409 (95.6%) | 19 (4.4%) |
| Information | 410 (57.3%) | 305 (42.7%) |
| Finance & Insurance | 777 (50.0%) | 776 (50.0%) |
| Real Estate, Rental & Leasing | 506 (40.2%) | 752 (59.8%) |
| Professional & Scientific | 816 (39.0%) | 1,277 (61.0%) |
| Enterprise Management | 0 (0.0%) | 35 (100.0%) |
| Administrative & Support | 1,363 (61.7%) | 846 (38.3%) |
| Educational Services | 1,551 (26.6%) | 4,281 (73.4%) |
| Health Care & Social Assistance | 1,074 (14.1%) | 6,514 (85.9%) |
| Arts, Entertainment & Recreation | 348 (57.8%) | 254 (42.2%) |
| Accommodation & Food Services | 1,324 (38.0%) | 2,157 (62.0%) |
| Public Administration | 1,802 (54.3%) | 1,517 (45.7%) |
| Total | 32,352 (54.1%) | 27,474 (45.9%) |
Education in Madera County
School Enrollment in Madera County
The most common levels of schooling among the 47,837 students in Madera County are high school (12,718 | 26.6%), college / undergraduate (10,035 | 21.0%), and middle school (9,726 | 20.3%).
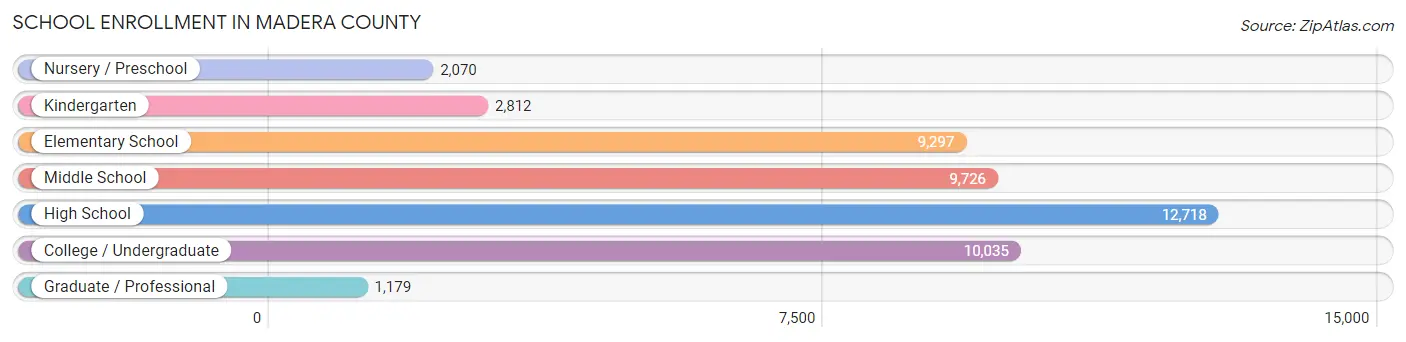
| School Level | # Students | % Students |
| Nursery / Preschool | 2,070 | 4.3% |
| Kindergarten | 2,812 | 5.9% |
| Elementary School | 9,297 | 19.4% |
| Middle School | 9,726 | 20.3% |
| High School | 12,718 | 26.6% |
| College / Undergraduate | 10,035 | 21.0% |
| Graduate / Professional | 1,179 | 2.5% |
| Total | 47,837 | 100.0% |
School Enrollment by Age by Funding Source in Madera County
Out of a total of 47,837 students who are enrolled in schools in Madera County, 4,305 (9.0%) attend a private institution, while the remaining 43,532 (91.0%) are enrolled in public schools. The age group of 25 to 34 year olds has the highest likelihood of being enrolled in private schools, with 666 (22.1% in the age bracket) enrolled. Conversely, the age group of 15 to 17 year olds has the lowest likelihood of being enrolled in a private school, with 6,957 (97.2% in the age bracket) attending a public institution.
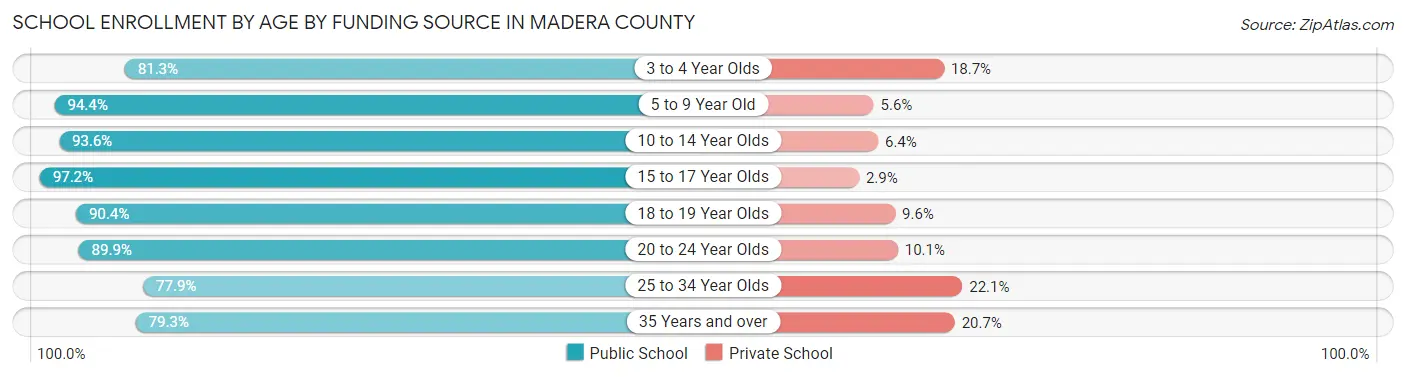
| Age Bracket | Public School | Private School |
| 3 to 4 Year Olds | 1,358 (81.3%) | 312 (18.7%) |
| 5 to 9 Year Old | 10,875 (94.4%) | 643 (5.6%) |
| 10 to 14 Year Olds | 11,577 (93.6%) | 791 (6.4%) |
| 15 to 17 Year Olds | 6,957 (97.2%) | 204 (2.9%) |
| 18 to 19 Year Olds | 2,717 (90.4%) | 288 (9.6%) |
| 20 to 24 Year Olds | 3,977 (89.9%) | 446 (10.1%) |
| 25 to 34 Year Olds | 2,349 (77.9%) | 666 (22.1%) |
| 35 Years and over | 3,710 (79.3%) | 967 (20.7%) |
| Total | 43,532 (91.0%) | 4,305 (9.0%) |
Educational Attainment by Field of Study in Madera County
Business (3,754 | 21.0%), education (1,924 | 10.8%), liberal arts & history (1,765 | 9.9%), science & technology (1,539 | 8.6%), and bio, nature & agricultural (1,458 | 8.2%) are the most common fields of study among 17,865 individuals in Madera County who have obtained a bachelor's degree or higher.
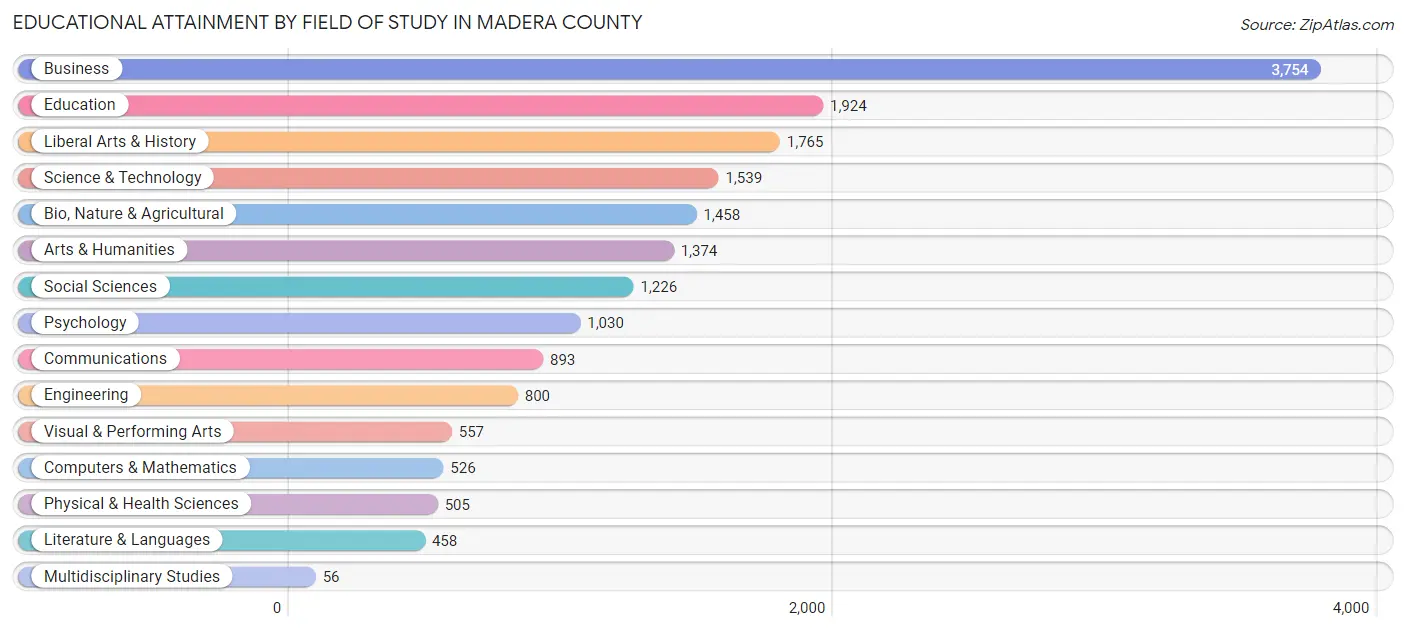
| Field of Study | # Graduates | % Graduates |
| Computers & Mathematics | 526 | 2.9% |
| Bio, Nature & Agricultural | 1,458 | 8.2% |
| Physical & Health Sciences | 505 | 2.8% |
| Psychology | 1,030 | 5.8% |
| Social Sciences | 1,226 | 6.9% |
| Engineering | 800 | 4.5% |
| Multidisciplinary Studies | 56 | 0.3% |
| Science & Technology | 1,539 | 8.6% |
| Business | 3,754 | 21.0% |
| Education | 1,924 | 10.8% |
| Literature & Languages | 458 | 2.6% |
| Liberal Arts & History | 1,765 | 9.9% |
| Visual & Performing Arts | 557 | 3.1% |
| Communications | 893 | 5.0% |
| Arts & Humanities | 1,374 | 7.7% |
| Total | 17,865 | 100.0% |
Transportation & Commute in Madera County
Vehicle Availability by Sex in Madera County
The most prevalent vehicle ownership categories in Madera County are males with 2 vehicles (11,317, accounting for 35.9%) and females with 2 vehicles (8,480, making up 43.3%).
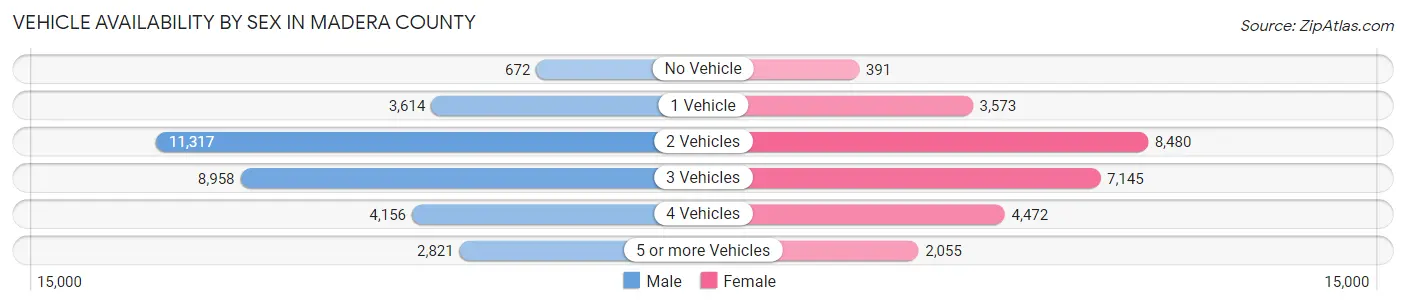
| Vehicles Available | Male | Female |
| No Vehicle | 672 (2.1%) | 391 (1.5%) |
| 1 Vehicle | 3,614 (11.5%) | 3,573 (13.7%) |
| 2 Vehicles | 11,317 (35.9%) | 8,480 (32.5%) |
| 3 Vehicles | 8,958 (28.4%) | 7,145 (27.4%) |
| 4 Vehicles | 4,156 (13.2%) | 4,472 (17.1%) |
| 5 or more Vehicles | 2,821 (8.9%) | 2,055 (7.9%) |
| Total | 31,538 (100.0%) | 26,116 (100.0%) |
Commute Time in Madera County
The most frequently occuring commute durations in Madera County are 30 to 34 minutes (8,260 commuters, 15.5%), 10 to 14 minutes (7,133 commuters, 13.4%), and 5 to 9 minutes (6,193 commuters, 11.6%).
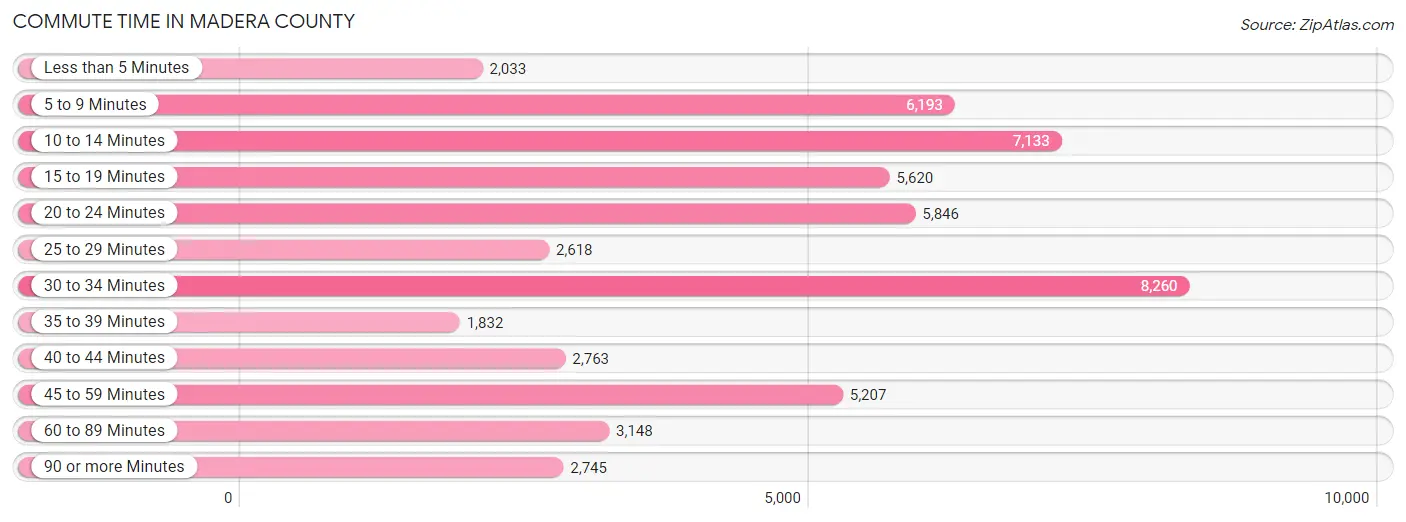
| Commute Time | # Commuters | % Commuters |
| Less than 5 Minutes | 2,033 | 3.8% |
| 5 to 9 Minutes | 6,193 | 11.6% |
| 10 to 14 Minutes | 7,133 | 13.4% |
| 15 to 19 Minutes | 5,620 | 10.5% |
| 20 to 24 Minutes | 5,846 | 11.0% |
| 25 to 29 Minutes | 2,618 | 4.9% |
| 30 to 34 Minutes | 8,260 | 15.5% |
| 35 to 39 Minutes | 1,832 | 3.4% |
| 40 to 44 Minutes | 2,763 | 5.2% |
| 45 to 59 Minutes | 5,207 | 9.8% |
| 60 to 89 Minutes | 3,148 | 5.9% |
| 90 or more Minutes | 2,745 | 5.1% |
Commute Time by Sex in Madera County
The most common commute times in Madera County are 30 to 34 minutes (4,711 commuters, 15.8%) for males and 10 to 14 minutes (4,032 commuters, 17.1%) for females.
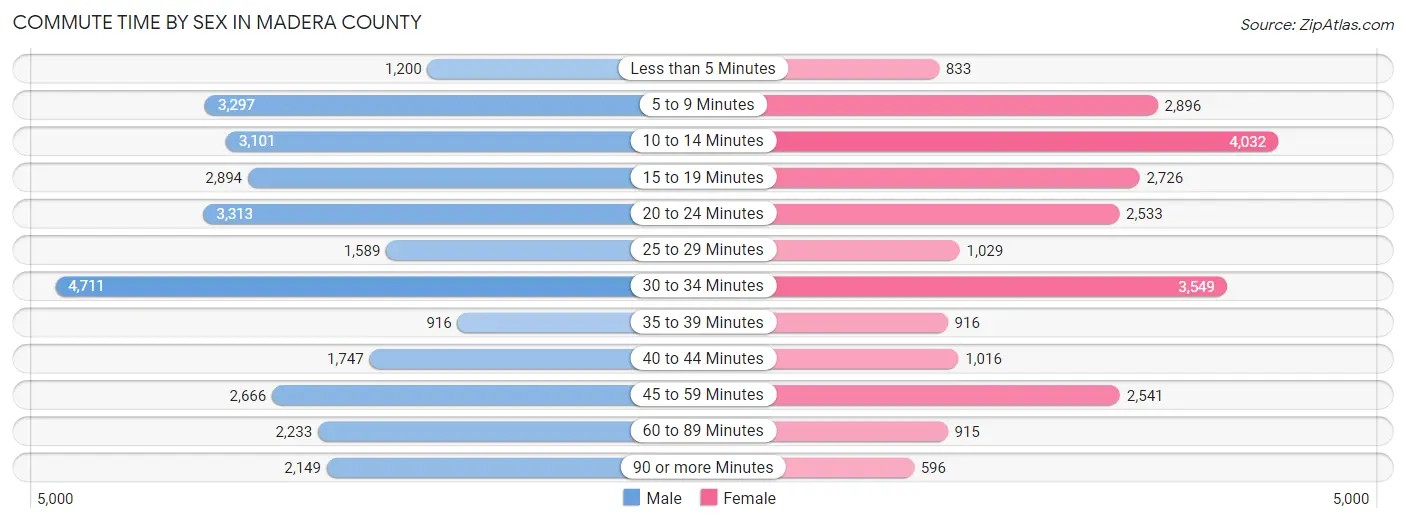
| Commute Time | Male | Female |
| Less than 5 Minutes | 1,200 (4.0%) | 833 (3.5%) |
| 5 to 9 Minutes | 3,297 (11.1%) | 2,896 (12.3%) |
| 10 to 14 Minutes | 3,101 (10.4%) | 4,032 (17.1%) |
| 15 to 19 Minutes | 2,894 (9.7%) | 2,726 (11.6%) |
| 20 to 24 Minutes | 3,313 (11.1%) | 2,533 (10.7%) |
| 25 to 29 Minutes | 1,589 (5.3%) | 1,029 (4.4%) |
| 30 to 34 Minutes | 4,711 (15.8%) | 3,549 (15.0%) |
| 35 to 39 Minutes | 916 (3.1%) | 916 (3.9%) |
| 40 to 44 Minutes | 1,747 (5.9%) | 1,016 (4.3%) |
| 45 to 59 Minutes | 2,666 (8.9%) | 2,541 (10.8%) |
| 60 to 89 Minutes | 2,233 (7.5%) | 915 (3.9%) |
| 90 or more Minutes | 2,149 (7.2%) | 596 (2.5%) |
Time of Departure to Work by Sex in Madera County
The most frequent times of departure to work in Madera County are 12:00 AM to 4:59 AM (4,499, 15.1%) for males and 7:00 AM to 7:29 AM (3,988, 16.9%) for females.
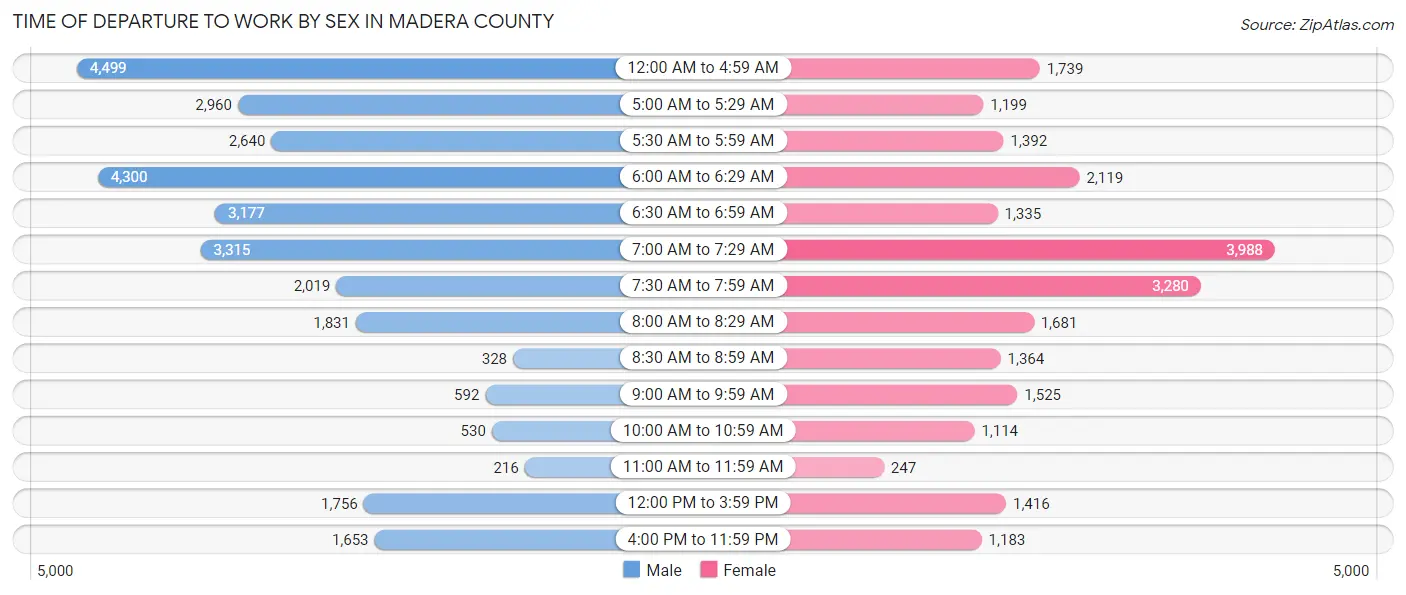
| Time of Departure | Male | Female |
| 12:00 AM to 4:59 AM | 4,499 (15.1%) | 1,739 (7.4%) |
| 5:00 AM to 5:29 AM | 2,960 (9.9%) | 1,199 (5.1%) |
| 5:30 AM to 5:59 AM | 2,640 (8.8%) | 1,392 (5.9%) |
| 6:00 AM to 6:29 AM | 4,300 (14.4%) | 2,119 (9.0%) |
| 6:30 AM to 6:59 AM | 3,177 (10.7%) | 1,335 (5.7%) |
| 7:00 AM to 7:29 AM | 3,315 (11.1%) | 3,988 (16.9%) |
| 7:30 AM to 7:59 AM | 2,019 (6.8%) | 3,280 (13.9%) |
| 8:00 AM to 8:29 AM | 1,831 (6.1%) | 1,681 (7.1%) |
| 8:30 AM to 8:59 AM | 328 (1.1%) | 1,364 (5.8%) |
| 9:00 AM to 9:59 AM | 592 (2.0%) | 1,525 (6.5%) |
| 10:00 AM to 10:59 AM | 530 (1.8%) | 1,114 (4.7%) |
| 11:00 AM to 11:59 AM | 216 (0.7%) | 247 (1.1%) |
| 12:00 PM to 3:59 PM | 1,756 (5.9%) | 1,416 (6.0%) |
| 4:00 PM to 11:59 PM | 1,653 (5.5%) | 1,183 (5.0%) |
| Total | 29,816 (100.0%) | 23,582 (100.0%) |
Housing Occupancy in Madera County
Occupancy by Ownership in Madera County
Of the total 43,857 dwellings in Madera County, owner-occupied units account for 28,719 (65.5%), while renter-occupied units make up 15,138 (34.5%).
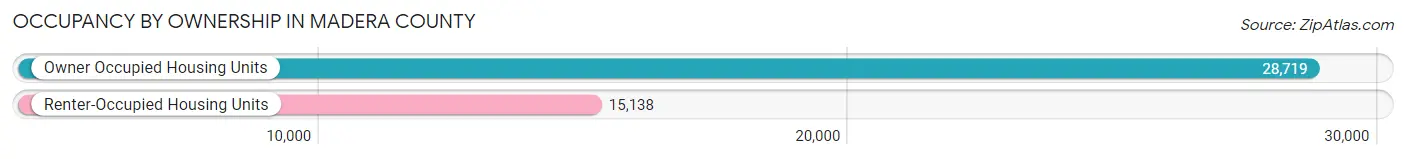
| Occupancy | # Housing Units | % Housing Units |
| Owner Occupied Housing Units | 28,719 | 65.5% |
| Renter-Occupied Housing Units | 15,138 | 34.5% |
| Total Occupied Housing Units | 43,857 | 100.0% |
Occupancy by Household Size in Madera County
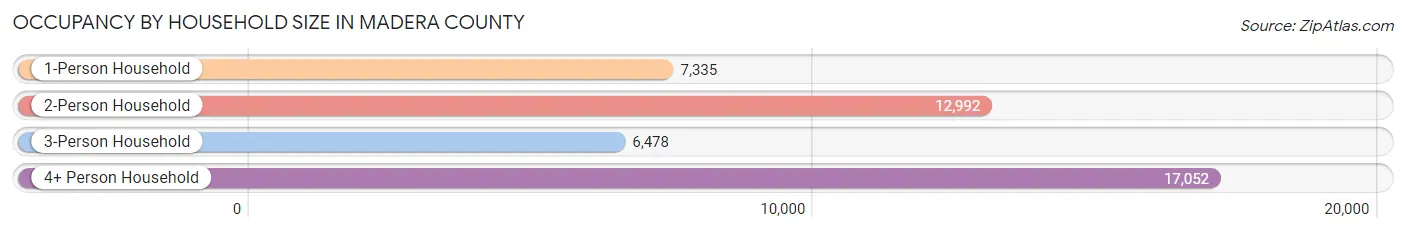
| Household Size | # Housing Units | % Housing Units |
| 1-Person Household | 7,335 | 16.7% |
| 2-Person Household | 12,992 | 29.6% |
| 3-Person Household | 6,478 | 14.8% |
| 4+ Person Household | 17,052 | 38.9% |
| Total Housing Units | 43,857 | 100.0% |
Occupancy by Ownership by Household Size in Madera County
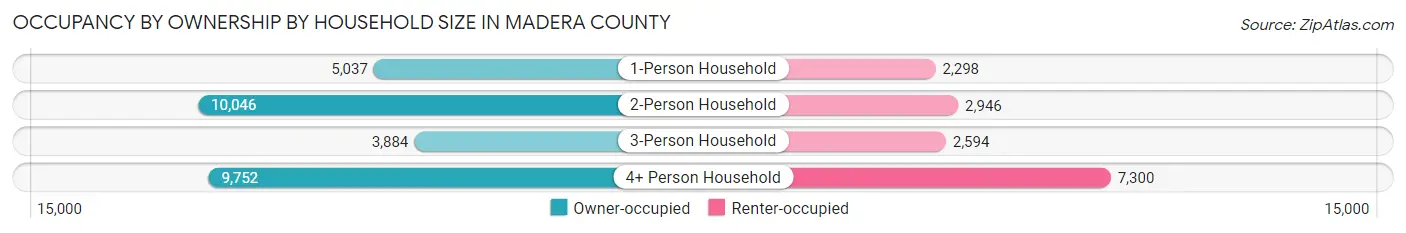
| Household Size | Owner-occupied | Renter-occupied |
| 1-Person Household | 5,037 (68.7%) | 2,298 (31.3%) |
| 2-Person Household | 10,046 (77.3%) | 2,946 (22.7%) |
| 3-Person Household | 3,884 (60.0%) | 2,594 (40.0%) |
| 4+ Person Household | 9,752 (57.2%) | 7,300 (42.8%) |
| Total Housing Units | 28,719 (65.5%) | 15,138 (34.5%) |
Occupancy by Educational Attainment in Madera County
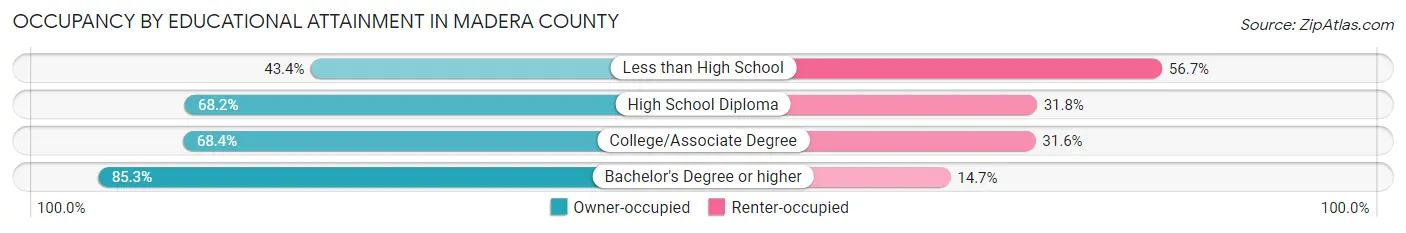
| Household Size | Owner-occupied | Renter-occupied |
| Less than High School | 4,739 (43.3%) | 6,193 (56.7%) |
| High School Diploma | 6,574 (68.2%) | 3,070 (31.8%) |
| College/Associate Degree | 9,943 (68.4%) | 4,588 (31.6%) |
| Bachelor's Degree or higher | 7,463 (85.3%) | 1,287 (14.7%) |
Occupancy by Age of Householder in Madera County
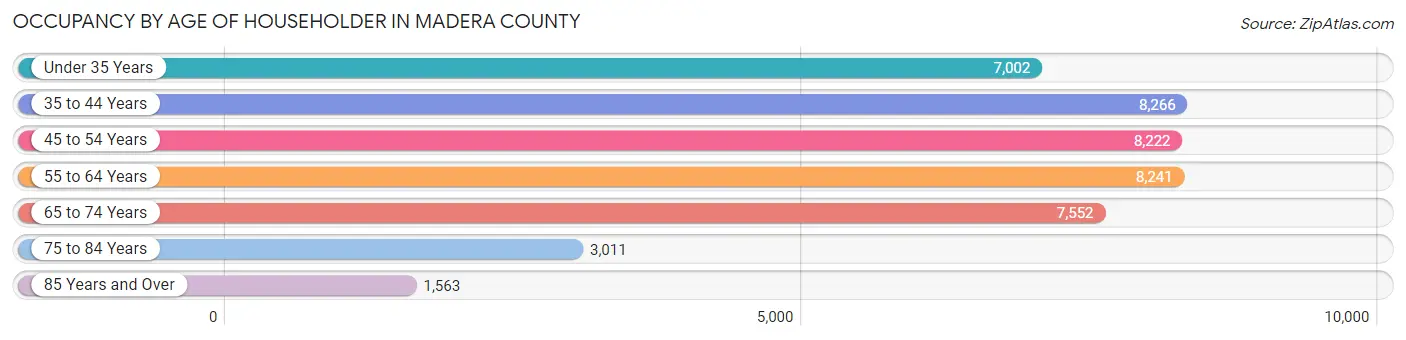
| Age Bracket | # Households | % Households |
| Under 35 Years | 7,002 | 16.0% |
| 35 to 44 Years | 8,266 | 18.9% |
| 45 to 54 Years | 8,222 | 18.8% |
| 55 to 64 Years | 8,241 | 18.8% |
| 65 to 74 Years | 7,552 | 17.2% |
| 75 to 84 Years | 3,011 | 6.9% |
| 85 Years and Over | 1,563 | 3.6% |
| Total | 43,857 | 100.0% |
Housing Finances in Madera County
Median Income by Occupancy in Madera County
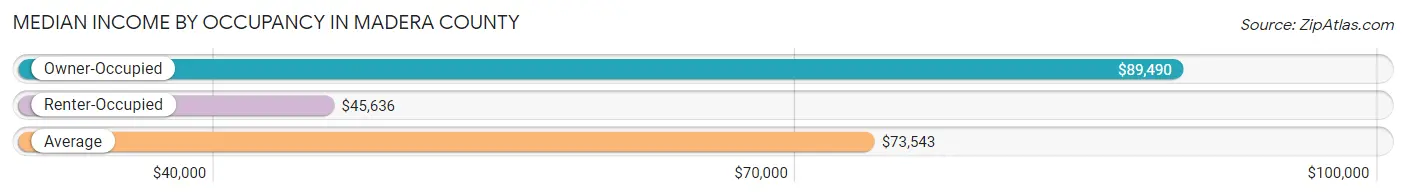
| Occupancy Type | # Households | Median Income |
| Owner-Occupied | 28,719 (65.5%) | $89,490 |
| Renter-Occupied | 15,138 (34.5%) | $45,636 |
| Average | 43,857 (100.0%) | $73,543 |
Occupancy by Householder Income Bracket in Madera County
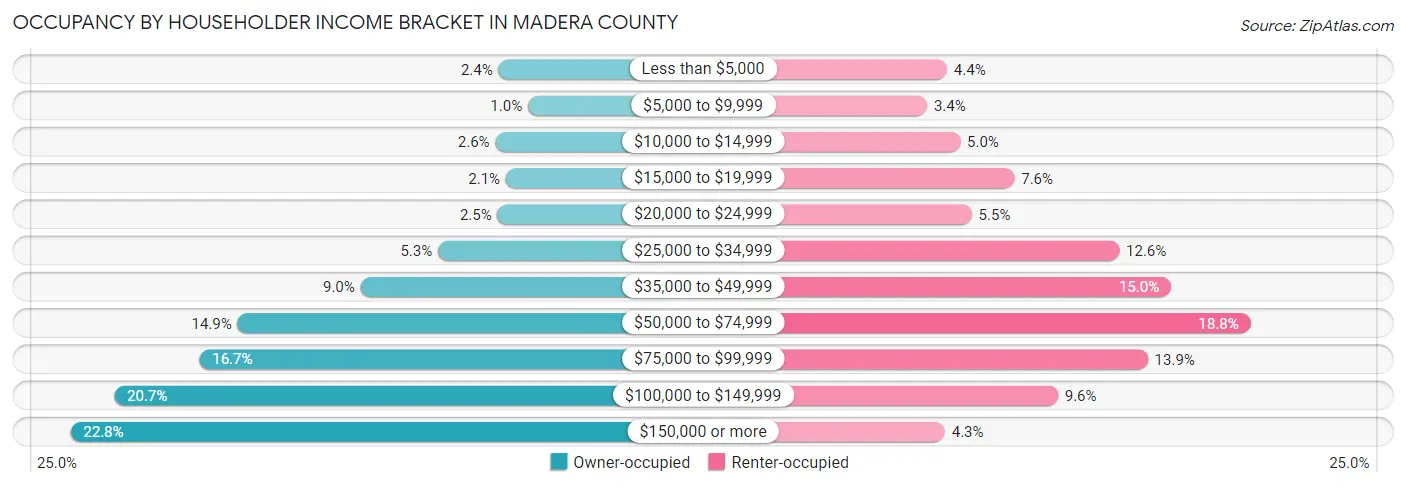
| Income Bracket | Owner-occupied | Renter-occupied |
| Less than $5,000 | 698 (2.4%) | 659 (4.3%) |
| $5,000 to $9,999 | 295 (1.0%) | 515 (3.4%) |
| $10,000 to $14,999 | 740 (2.6%) | 754 (5.0%) |
| $15,000 to $19,999 | 598 (2.1%) | 1,144 (7.6%) |
| $20,000 to $24,999 | 712 (2.5%) | 837 (5.5%) |
| $25,000 to $34,999 | 1,524 (5.3%) | 1,900 (12.6%) |
| $35,000 to $49,999 | 2,584 (9.0%) | 2,274 (15.0%) |
| $50,000 to $74,999 | 4,269 (14.9%) | 2,848 (18.8%) |
| $75,000 to $99,999 | 4,791 (16.7%) | 2,106 (13.9%) |
| $100,000 to $149,999 | 5,955 (20.7%) | 1,458 (9.6%) |
| $150,000 or more | 6,553 (22.8%) | 643 (4.3%) |
| Total | 28,719 (100.0%) | 15,138 (100.0%) |
Monthly Housing Cost Tiers in Madera County
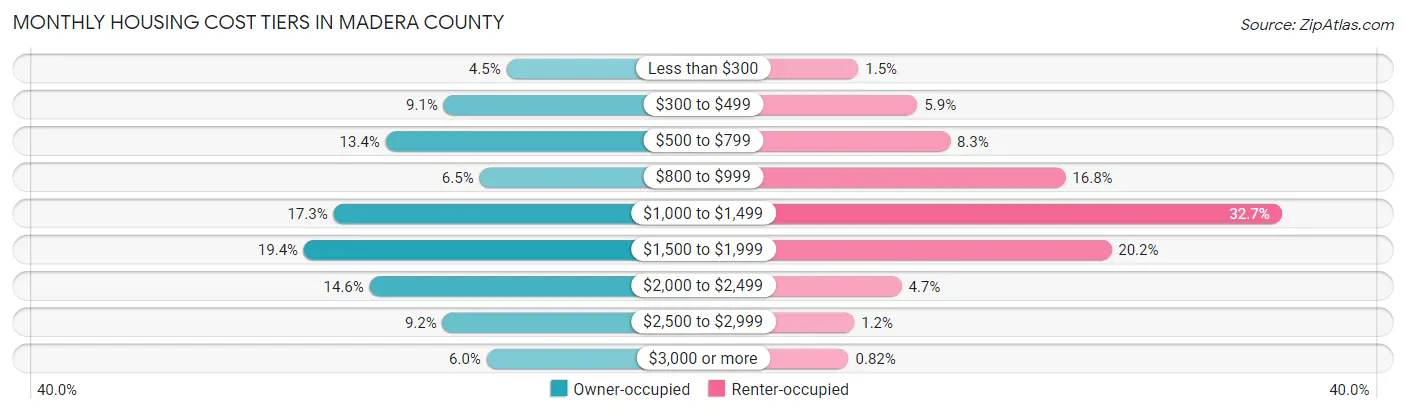
| Monthly Cost | Owner-occupied | Renter-occupied |
| Less than $300 | 1,295 (4.5%) | 233 (1.5%) |
| $300 to $499 | 2,621 (9.1%) | 892 (5.9%) |
| $500 to $799 | 3,850 (13.4%) | 1,255 (8.3%) |
| $800 to $999 | 1,866 (6.5%) | 2,542 (16.8%) |
| $1,000 to $1,499 | 4,955 (17.2%) | 4,950 (32.7%) |
| $1,500 to $1,999 | 5,579 (19.4%) | 3,054 (20.2%) |
| $2,000 to $2,499 | 4,190 (14.6%) | 714 (4.7%) |
| $2,500 to $2,999 | 2,648 (9.2%) | 187 (1.2%) |
| $3,000 or more | 1,715 (6.0%) | 124 (0.8%) |
| Total | 28,719 (100.0%) | 15,138 (100.0%) |
Physical Housing Characteristics in Madera County
Housing Structures in Madera County
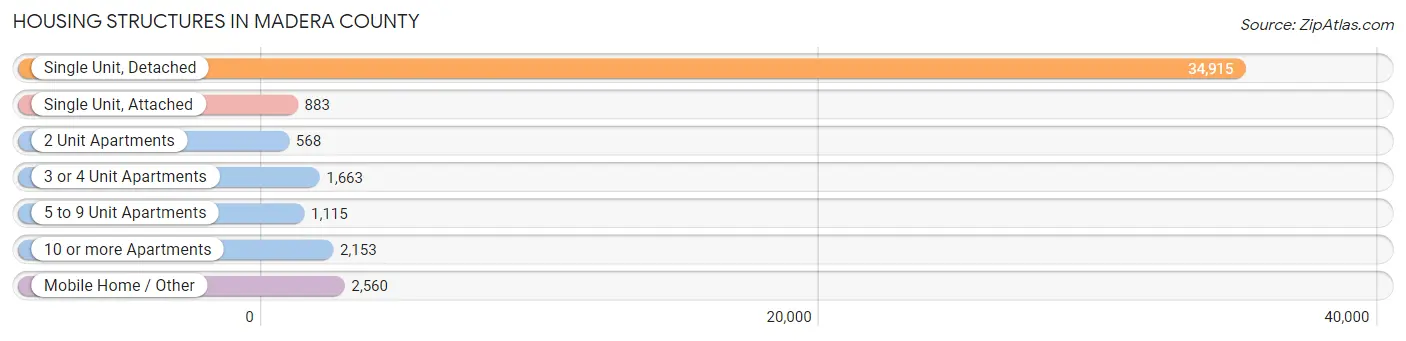
| Structure Type | # Housing Units | % Housing Units |
| Single Unit, Detached | 34,915 | 79.6% |
| Single Unit, Attached | 883 | 2.0% |
| 2 Unit Apartments | 568 | 1.3% |
| 3 or 4 Unit Apartments | 1,663 | 3.8% |
| 5 to 9 Unit Apartments | 1,115 | 2.5% |
| 10 or more Apartments | 2,153 | 4.9% |
| Mobile Home / Other | 2,560 | 5.8% |
| Total | 43,857 | 100.0% |
Housing Structures by Occupancy in Madera County
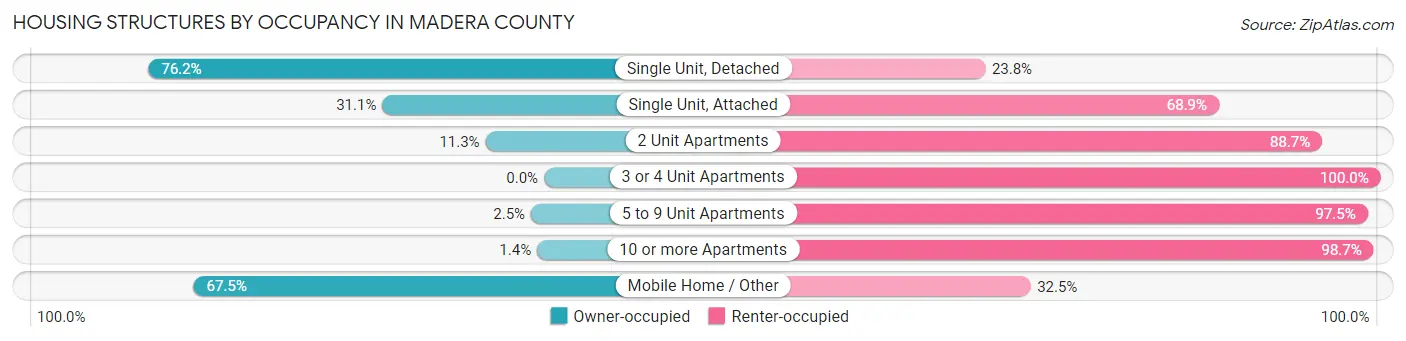
| Structure Type | Owner-occupied | Renter-occupied |
| Single Unit, Detached | 26,596 (76.2%) | 8,319 (23.8%) |
| Single Unit, Attached | 275 (31.1%) | 608 (68.9%) |
| 2 Unit Apartments | 64 (11.3%) | 504 (88.7%) |
| 3 or 4 Unit Apartments | 0 (0.0%) | 1,663 (100.0%) |
| 5 to 9 Unit Apartments | 28 (2.5%) | 1,087 (97.5%) |
| 10 or more Apartments | 29 (1.3%) | 2,124 (98.7%) |
| Mobile Home / Other | 1,727 (67.5%) | 833 (32.5%) |
| Total | 28,719 (65.5%) | 15,138 (34.5%) |
Housing Structures by Number of Rooms in Madera County
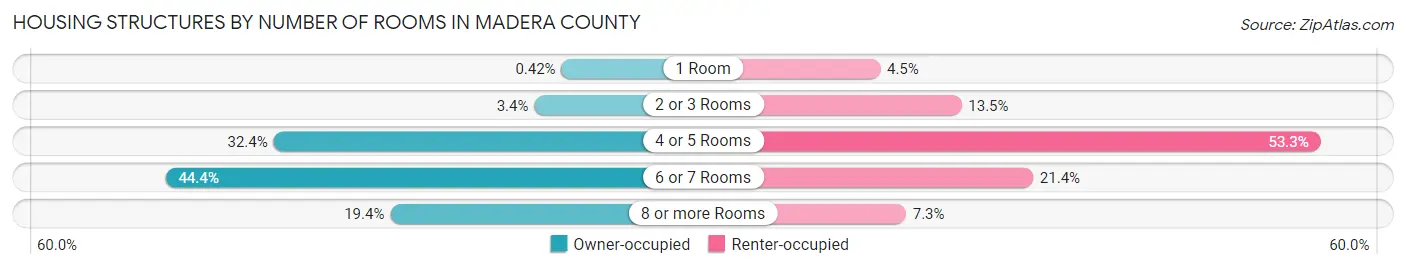
| Number of Rooms | Owner-occupied | Renter-occupied |
| 1 Room | 121 (0.4%) | 674 (4.4%) |
| 2 or 3 Rooms | 985 (3.4%) | 2,041 (13.5%) |
| 4 or 5 Rooms | 9,296 (32.4%) | 8,075 (53.3%) |
| 6 or 7 Rooms | 12,739 (44.4%) | 3,242 (21.4%) |
| 8 or more Rooms | 5,578 (19.4%) | 1,106 (7.3%) |
| Total | 28,719 (100.0%) | 15,138 (100.0%) |
Housing Structure by Heating Type in Madera County
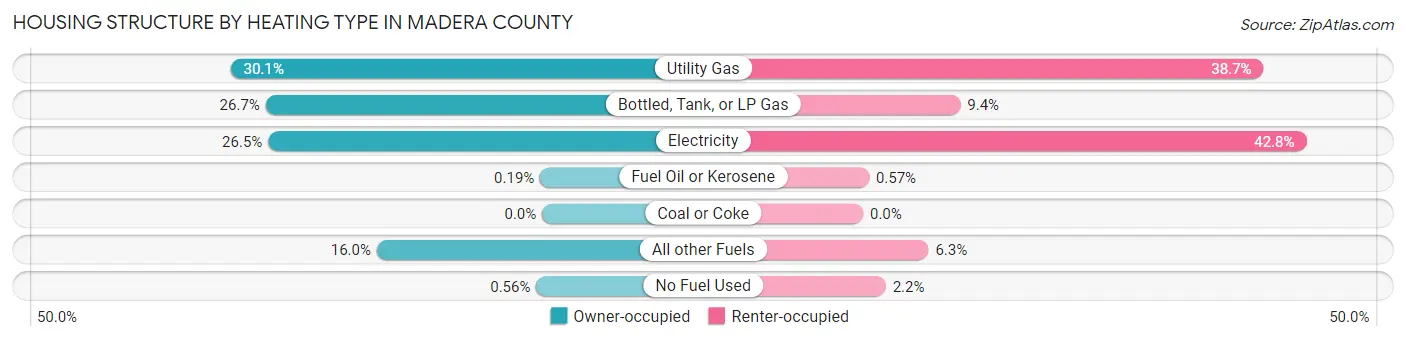
| Heating Type | Owner-occupied | Renter-occupied |
| Utility Gas | 8,644 (30.1%) | 5,856 (38.7%) |
| Bottled, Tank, or LP Gas | 7,671 (26.7%) | 1,423 (9.4%) |
| Electricity | 7,603 (26.5%) | 6,484 (42.8%) |
| Fuel Oil or Kerosene | 54 (0.2%) | 86 (0.6%) |
| Coal or Coke | 0 (0.0%) | 0 (0.0%) |
| All other Fuels | 4,585 (16.0%) | 957 (6.3%) |
| No Fuel Used | 162 (0.6%) | 332 (2.2%) |
| Total | 28,719 (100.0%) | 15,138 (100.0%) |
Household Vehicle Usage in Madera County
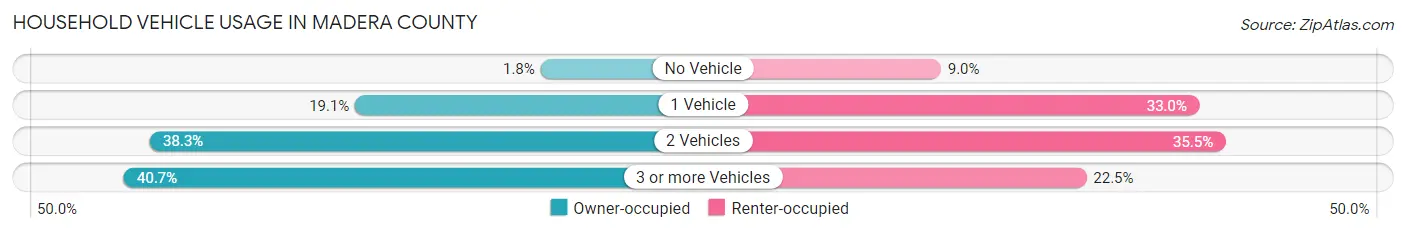
| Vehicles per Household | Owner-occupied | Renter-occupied |
| No Vehicle | 526 (1.8%) | 1,355 (8.9%) |
| 1 Vehicle | 5,496 (19.1%) | 5,000 (33.0%) |
| 2 Vehicles | 11,000 (38.3%) | 5,371 (35.5%) |
| 3 or more Vehicles | 11,697 (40.7%) | 3,412 (22.5%) |
| Total | 28,719 (100.0%) | 15,138 (100.0%) |
Real Estate & Mortgages in Madera County
Real Estate and Mortgage Overview in Madera County
| Characteristic | Without Mortgage | With Mortgage |
| Housing Units | 9,510 | 19,209 |
| Median Property Value | $323,500 | $345,400 |
| Median Household Income | $76,727 | $4,786 |
| Monthly Housing Costs | $575 | $1,660 |
| Real Estate Taxes | $2,009 | $418 |
Property Value by Mortgage Status in Madera County
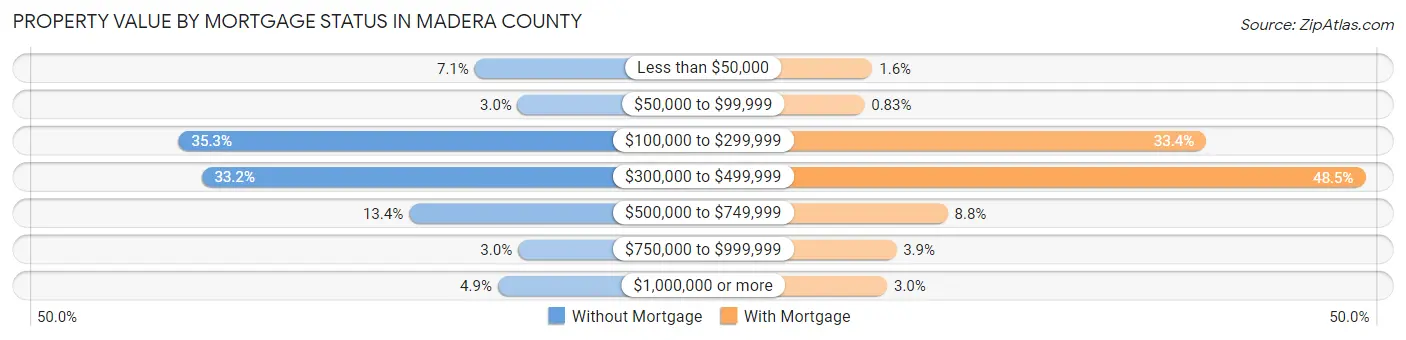
| Property Value | Without Mortgage | With Mortgage |
| Less than $50,000 | 679 (7.1%) | 308 (1.6%) |
| $50,000 to $99,999 | 289 (3.0%) | 160 (0.8%) |
| $100,000 to $299,999 | 3,360 (35.3%) | 6,412 (33.4%) |
| $300,000 to $499,999 | 3,153 (33.2%) | 9,325 (48.5%) |
| $500,000 to $749,999 | 1,273 (13.4%) | 1,685 (8.8%) |
| $750,000 to $999,999 | 286 (3.0%) | 743 (3.9%) |
| $1,000,000 or more | 470 (4.9%) | 576 (3.0%) |
| Total | 9,510 (100.0%) | 19,209 (100.0%) |
Household Income by Mortgage Status in Madera County
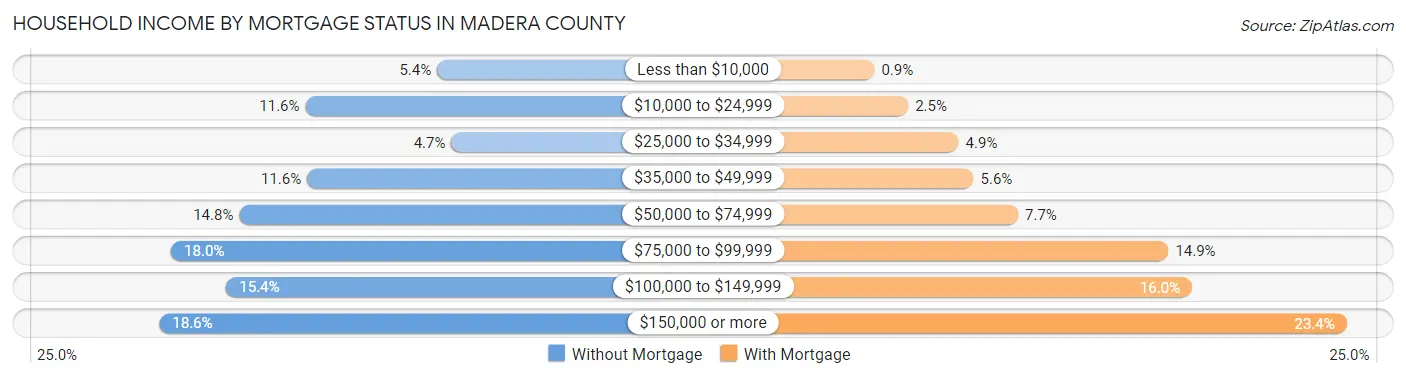
| Household Income | Without Mortgage | With Mortgage |
| Less than $10,000 | 510 (5.4%) | 173 (0.9%) |
| $10,000 to $24,999 | 1,106 (11.6%) | 483 (2.5%) |
| $25,000 to $34,999 | 445 (4.7%) | 944 (4.9%) |
| $35,000 to $49,999 | 1,098 (11.6%) | 1,079 (5.6%) |
| $50,000 to $74,999 | 1,406 (14.8%) | 1,486 (7.7%) |
| $75,000 to $99,999 | 1,714 (18.0%) | 2,863 (14.9%) |
| $100,000 to $149,999 | 1,464 (15.4%) | 3,077 (16.0%) |
| $150,000 or more | 1,767 (18.6%) | 4,491 (23.4%) |
| Total | 9,510 (100.0%) | 19,209 (100.0%) |
Property Value to Household Income Ratio in Madera County
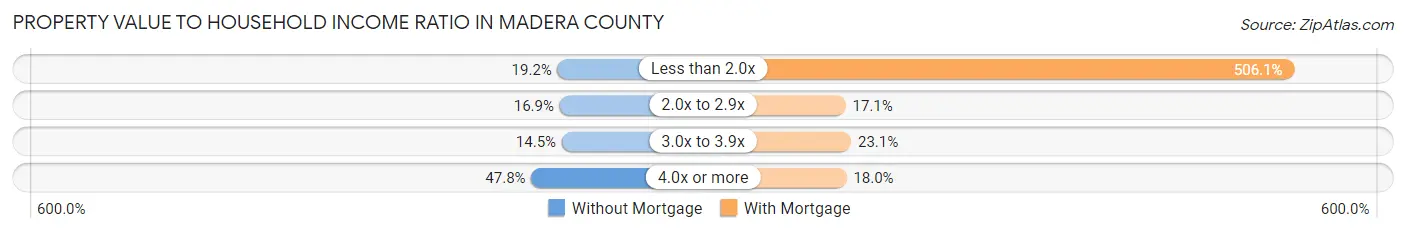
| Value-to-Income Ratio | Without Mortgage | With Mortgage |
| Less than 2.0x | 1,822 (19.2%) | 97,217 (506.1%) |
| 2.0x to 2.9x | 1,602 (16.9%) | 3,291 (17.1%) |
| 3.0x to 3.9x | 1,379 (14.5%) | 4,432 (23.1%) |
| 4.0x or more | 4,541 (47.7%) | 3,455 (18.0%) |
| Total | 9,510 (100.0%) | 19,209 (100.0%) |
Real Estate Taxes by Mortgage Status in Madera County
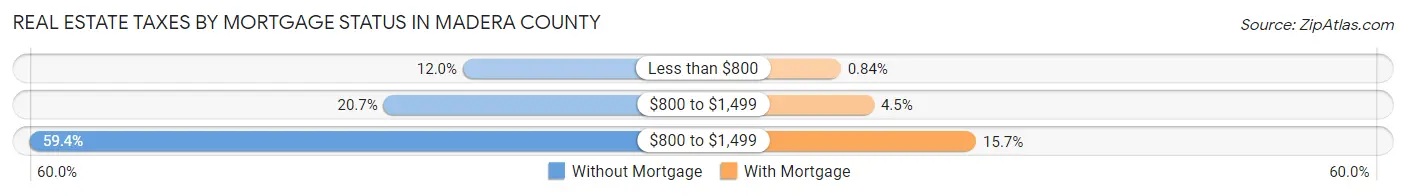
| Property Taxes | Without Mortgage | With Mortgage |
| Less than $800 | 1,138 (12.0%) | 162 (0.8%) |
| $800 to $1,499 | 1,965 (20.7%) | 861 (4.5%) |
| $800 to $1,499 | 5,651 (59.4%) | 3,012 (15.7%) |
| Total | 9,510 (100.0%) | 19,209 (100.0%) |
Health & Disability in Madera County
Health Insurance Coverage by Age in Madera County
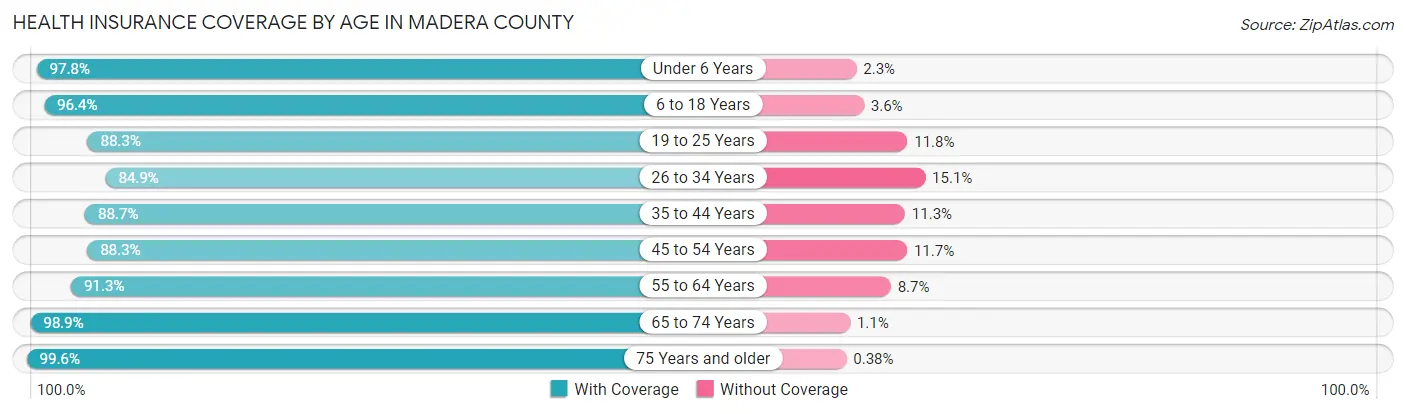
| Age Bracket | With Coverage | Without Coverage |
| Under 6 Years | 12,843 (97.8%) | 296 (2.2%) |
| 6 to 18 Years | 30,800 (96.4%) | 1,165 (3.6%) |
| 19 to 25 Years | 12,868 (88.2%) | 1,713 (11.7%) |
| 26 to 34 Years | 14,784 (84.9%) | 2,625 (15.1%) |
| 35 to 44 Years | 17,074 (88.7%) | 2,176 (11.3%) |
| 45 to 54 Years | 14,488 (88.3%) | 1,917 (11.7%) |
| 55 to 64 Years | 14,716 (91.3%) | 1,395 (8.7%) |
| 65 to 74 Years | 13,116 (98.9%) | 140 (1.1%) |
| 75 Years and older | 8,421 (99.6%) | 32 (0.4%) |
| Total | 139,110 (92.4%) | 11,459 (7.6%) |
Health Insurance Coverage by Citizenship Status in Madera County
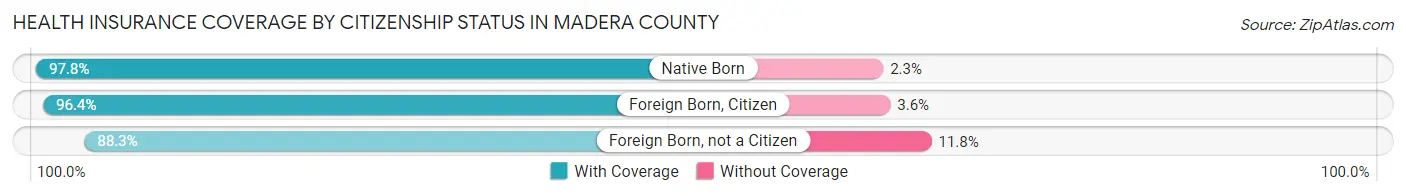
| Citizenship Status | With Coverage | Without Coverage |
| Native Born | 12,843 (97.8%) | 296 (2.2%) |
| Foreign Born, Citizen | 30,800 (96.4%) | 1,165 (3.6%) |
| Foreign Born, not a Citizen | 12,868 (88.2%) | 1,713 (11.7%) |
Health Insurance Coverage by Household Income in Madera County
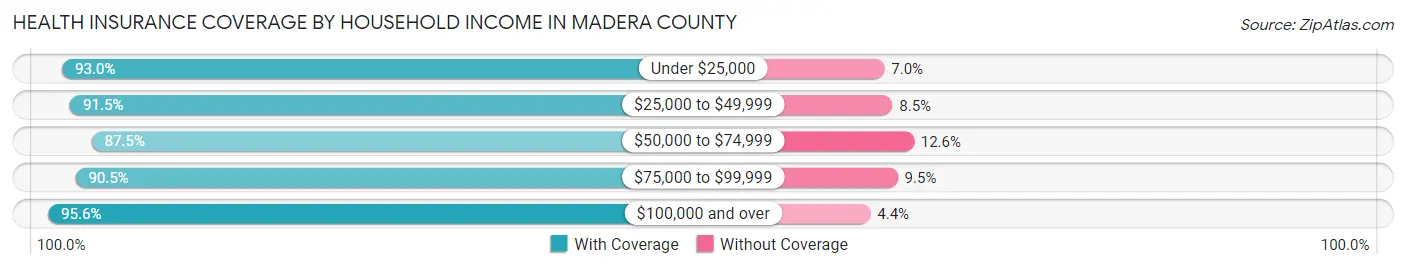
| Household Income | With Coverage | Without Coverage |
| Under $25,000 | 16,567 (93.0%) | 1,255 (7.0%) |
| $25,000 to $49,999 | 24,808 (91.5%) | 2,317 (8.5%) |
| $50,000 to $74,999 | 19,962 (87.5%) | 2,864 (12.6%) |
| $75,000 to $99,999 | 23,841 (90.5%) | 2,512 (9.5%) |
| $100,000 and over | 53,693 (95.6%) | 2,483 (4.4%) |
Public vs Private Health Insurance Coverage by Age in Madera County
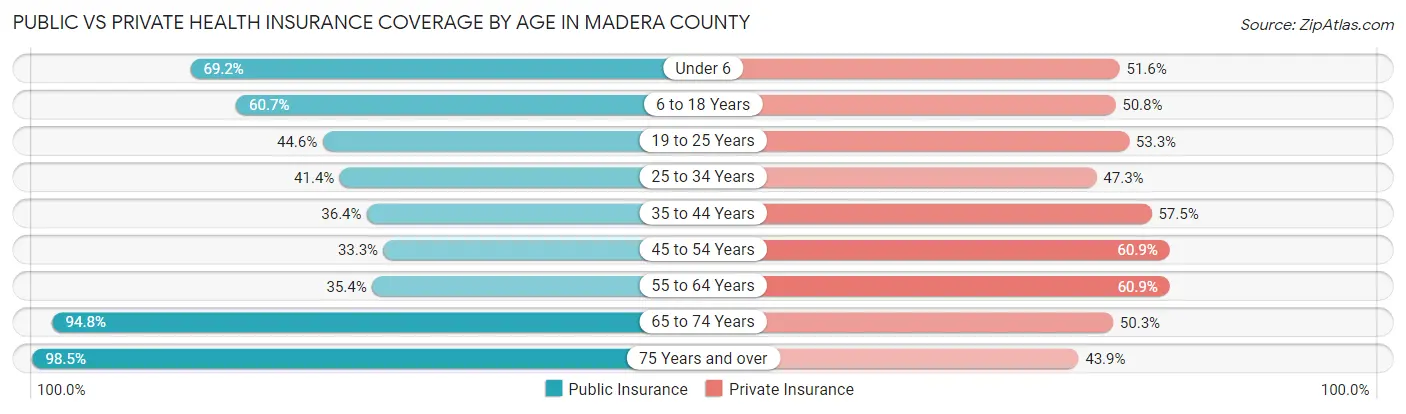
| Age Bracket | Public Insurance | Private Insurance |
| Under 6 | 9,094 (69.2%) | 6,774 (51.6%) |
| 6 to 18 Years | 19,411 (60.7%) | 16,225 (50.8%) |
| 19 to 25 Years | 6,504 (44.6%) | 7,770 (53.3%) |
| 25 to 34 Years | 7,213 (41.4%) | 8,228 (47.3%) |
| 35 to 44 Years | 7,004 (36.4%) | 11,064 (57.5%) |
| 45 to 54 Years | 5,463 (33.3%) | 9,982 (60.9%) |
| 55 to 64 Years | 5,707 (35.4%) | 9,805 (60.9%) |
| 65 to 74 Years | 12,565 (94.8%) | 6,671 (50.3%) |
| 75 Years and over | 8,329 (98.5%) | 3,711 (43.9%) |
| Total | 81,290 (54.0%) | 80,230 (53.3%) |
Disability Status by Sex by Age in Madera County
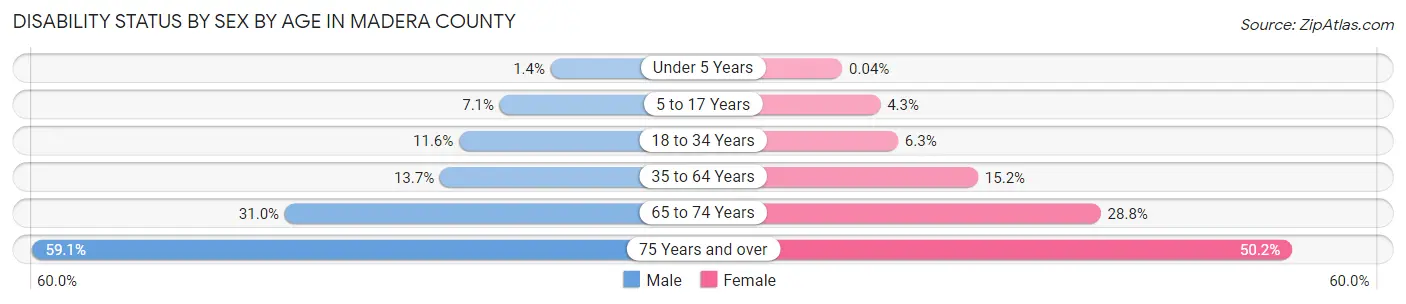
| Age Bracket | Male | Female |
| Under 5 Years | 80 (1.4%) | 2 (0.0%) |
| 5 to 17 Years | 1,157 (7.1%) | 669 (4.3%) |
| 18 to 34 Years | 1,957 (11.6%) | 1,089 (6.2%) |
| 35 to 64 Years | 3,443 (13.7%) | 4,049 (15.2%) |
| 65 to 74 Years | 1,993 (31.0%) | 1,969 (28.8%) |
| 75 Years and over | 2,262 (59.1%) | 2,320 (50.1%) |
Disability Class by Sex by Age in Madera County
Disability Class: Hearing Difficulty
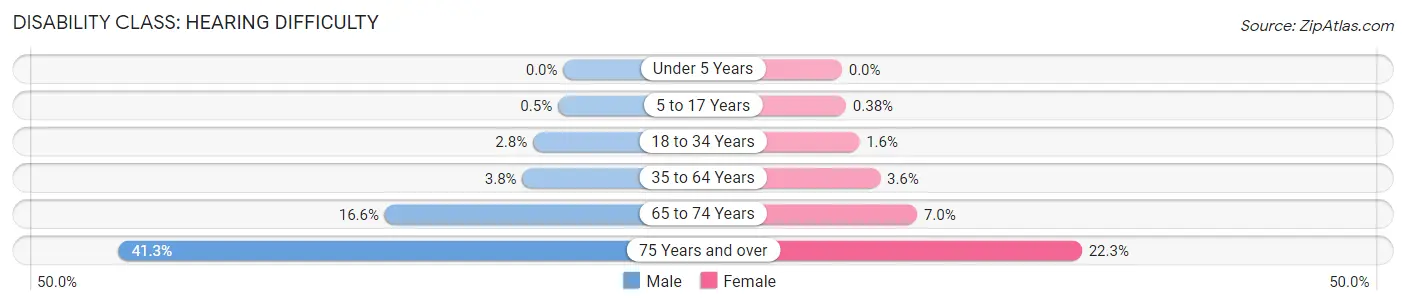
| Age Bracket | Male | Female |
| Under 5 Years | 0 (0.0%) | 0 (0.0%) |
| 5 to 17 Years | 81 (0.5%) | 60 (0.4%) |
| 18 to 34 Years | 476 (2.8%) | 282 (1.6%) |
| 35 to 64 Years | 953 (3.8%) | 947 (3.5%) |
| 65 to 74 Years | 1,065 (16.6%) | 477 (7.0%) |
| 75 Years and over | 1,579 (41.3%) | 1,030 (22.3%) |
Disability Class: Vision Difficulty
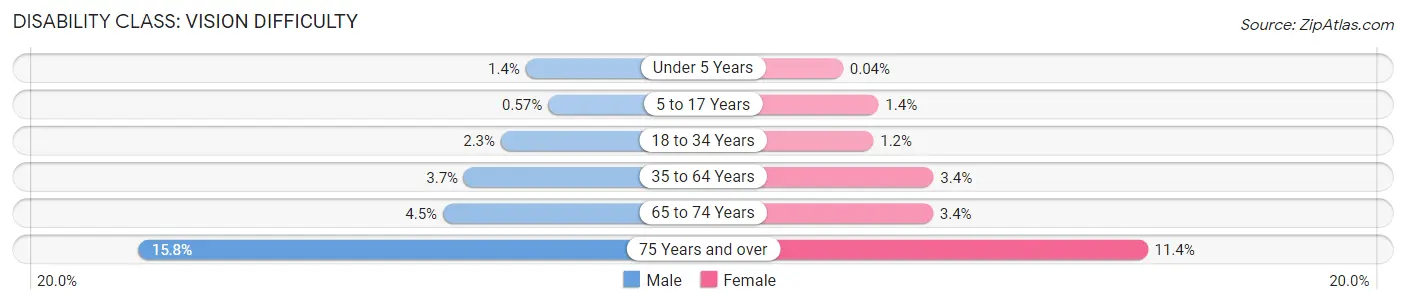
| Age Bracket | Male | Female |
| Under 5 Years | 80 (1.4%) | 2 (0.0%) |
| 5 to 17 Years | 93 (0.6%) | 213 (1.4%) |
| 18 to 34 Years | 391 (2.3%) | 203 (1.2%) |
| 35 to 64 Years | 925 (3.7%) | 908 (3.4%) |
| 65 to 74 Years | 287 (4.5%) | 231 (3.4%) |
| 75 Years and over | 603 (15.8%) | 525 (11.4%) |
Disability Class: Cognitive Difficulty
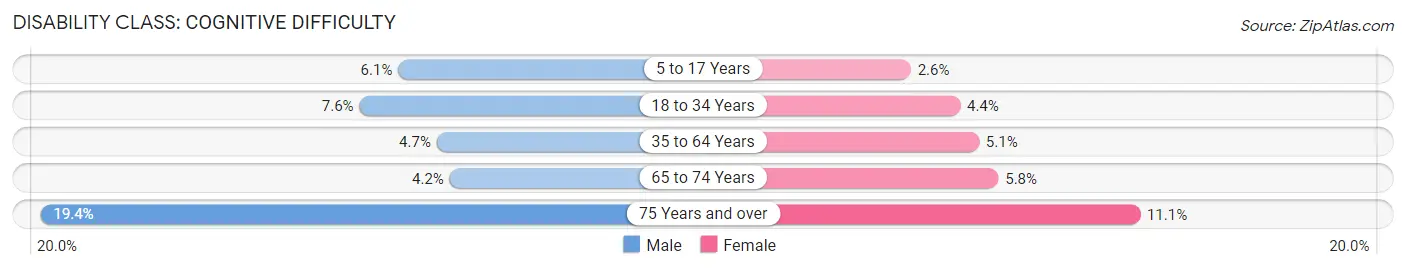
| Age Bracket | Male | Female |
| 5 to 17 Years | 1,002 (6.1%) | 400 (2.6%) |
| 18 to 34 Years | 1,276 (7.6%) | 764 (4.4%) |
| 35 to 64 Years | 1,177 (4.7%) | 1,360 (5.1%) |
| 65 to 74 Years | 271 (4.2%) | 397 (5.8%) |
| 75 Years and over | 743 (19.4%) | 512 (11.1%) |
Disability Class: Ambulatory Difficulty
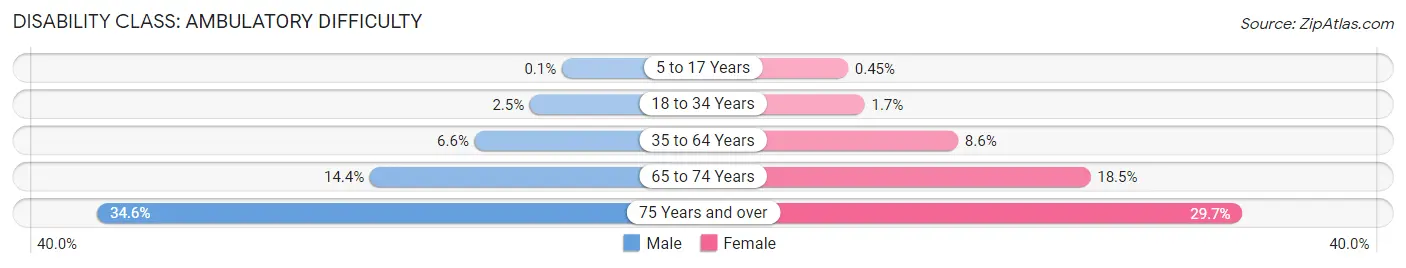
| Age Bracket | Male | Female |
| 5 to 17 Years | 16 (0.1%) | 70 (0.4%) |
| 18 to 34 Years | 416 (2.5%) | 295 (1.7%) |
| 35 to 64 Years | 1,649 (6.6%) | 2,301 (8.6%) |
| 65 to 74 Years | 922 (14.3%) | 1,260 (18.4%) |
| 75 Years and over | 1,325 (34.6%) | 1,376 (29.7%) |
Disability Class: Self-Care Difficulty
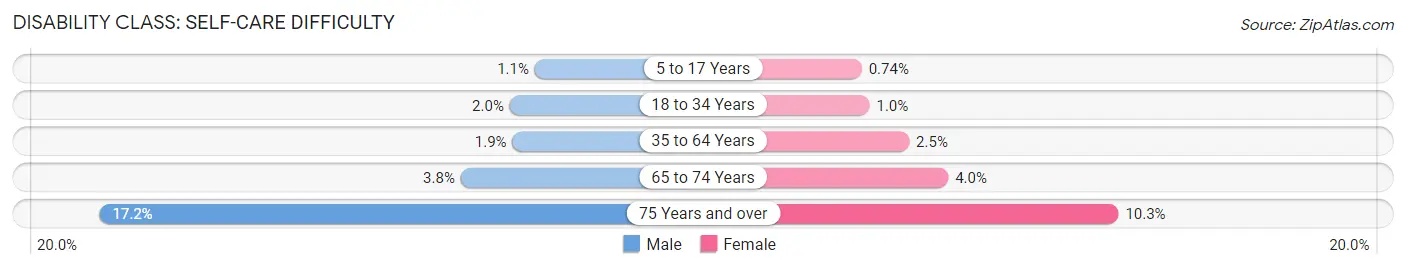
| Age Bracket | Male | Female |
| 5 to 17 Years | 174 (1.1%) | 115 (0.7%) |
| 18 to 34 Years | 336 (2.0%) | 180 (1.0%) |
| 35 to 64 Years | 473 (1.9%) | 668 (2.5%) |
| 65 to 74 Years | 245 (3.8%) | 270 (4.0%) |
| 75 Years and over | 659 (17.2%) | 475 (10.3%) |
Technology Access in Madera County
Computing Device Access in Madera County
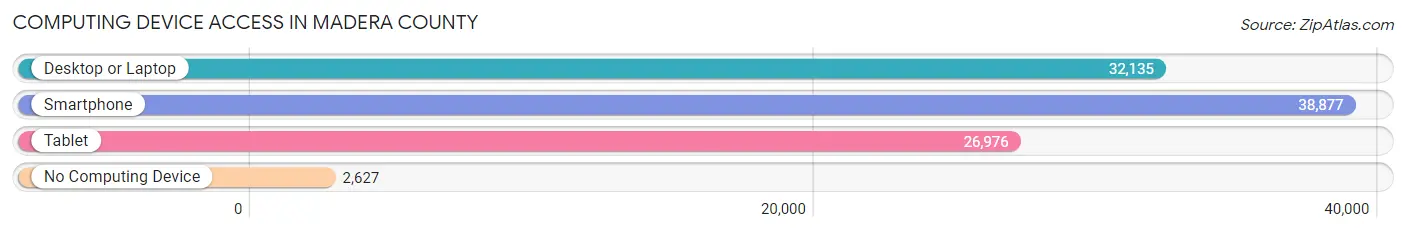
| Device Type | # Households | % Households |
| Desktop or Laptop | 32,135 | 73.3% |
| Smartphone | 38,877 | 88.6% |
| Tablet | 26,976 | 61.5% |
| No Computing Device | 2,627 | 6.0% |
| Total | 43,857 | 100.0% |
Internet Access in Madera County
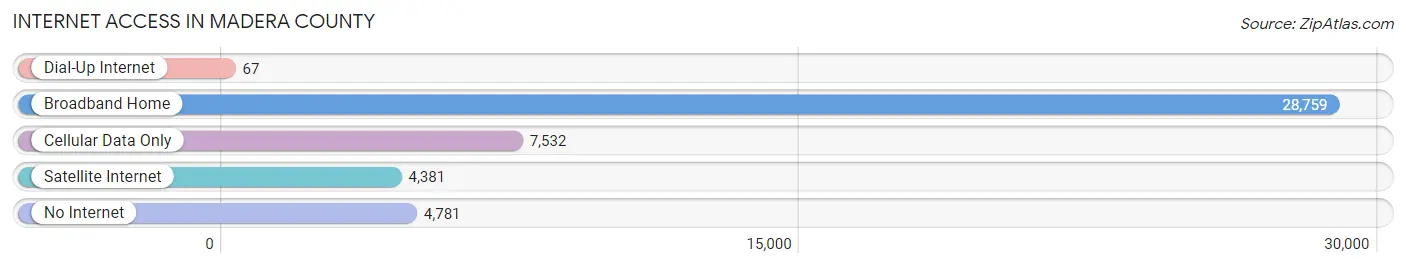
| Internet Type | # Households | % Households |
| Dial-Up Internet | 67 | 0.2% |
| Broadband Home | 28,759 | 65.6% |
| Cellular Data Only | 7,532 | 17.2% |
| Satellite Internet | 4,381 | 10.0% |
| No Internet | 4,781 | 10.9% |
| Total | 43,857 | 100.0% |
Madera County Summary
Madera County is located in the Central Valley of California, and is bordered by Fresno County to the south, Merced County to the north, Mariposa County to the west, and Mono County to the east. The county seat is Madera, and the county has a population of approximately 150,000 people.
Geography
Madera County is located in the Central Valley of California, and is bordered by Fresno County to the south, Merced County to the north, Mariposa County to the west, and Mono County to the east. The county is approximately 4,000 square miles in size, and is divided into two distinct regions: the Sierra Nevada Mountains to the east, and the San Joaquin Valley to the west. The Sierra Nevada Mountains are home to Yosemite National Park, and the San Joaquin Valley is home to the cities of Madera, Chowchilla, and Oakhurst. The county is also home to several rivers, including the San Joaquin, Kings, and Merced Rivers.
History
Madera County was established in 1893, and was named after the Spanish word for “wood” due to the abundance of timber in the area. The county was originally inhabited by the Yokuts and Miwok Native American tribes, and was later settled by Spanish and Mexican settlers. The county was an important agricultural center during the Gold Rush, and was home to several large ranches and farms. In the late 19th century, the county was home to several large lumber mills, and the timber industry was a major source of income for the county.
In the early 20th century, the county experienced a population boom due to the construction of the Madera Canal, which provided irrigation for the area. The county also experienced a surge in population due to the construction of the Madera Sugar Pine Railroad, which connected the county to the rest of the Central Valley.
Economy
Madera County’s economy is largely based on agriculture, and the county is home to several large farms and ranches. The county is also home to several large wineries, and is a major producer of wine grapes. The county is also home to several large manufacturing companies, including a large food processing plant and a large furniture manufacturing plant. The county is also home to several large retail stores, including Walmart and Target.
Demographics
As of the 2010 census, the population of Madera County was 150,865. The racial makeup of the county was 68.2% White, 1.7% African American, 1.3% Native American, 0.7% Asian, 0.2% Pacific Islander, 24.7% from other races, and 3.2% from two or more races. Hispanic or Latino of any race were 44.3% of the population.
The median income for a household in the county was $41,845, and the median income for a family was $48,919. The per capita income for the county was $19,845. About 17.2% of families and 21.7% of the population were below the poverty line, including 28.3% of those under age 18 and 11.2% of those age 65 or over.
Madera County is a diverse and vibrant county with a rich history and a strong economy. The county is home to several large farms and ranches, as well as several large manufacturing companies and retail stores. The county is also home to a large Hispanic population, and is a major producer of wine grapes. Madera County is an important part of the Central Valley, and is an important contributor to the state’s economy.
Common Questions
What is Per Capita Income in Madera County?
Per Capita income in Madera County is $28,158.
What is the Median Family Income in Madera County?
Median Family Income in Madera County is $79,066.
What is the Median Household income in Madera County?
Median Household Income in Madera County is $73,543.
What is Income or Wage Gap in Madera County?
Income or Wage Gap in Madera County is 30.5%.
Women in Madera County earn 69.5 cents for every dollar earned by a man.
What is Family Income Deficit in Madera County?
Family Income Deficit in Madera County is $11,438.
Families that are below poverty line in Madera County earn $11,438 less on average than the poverty threshold level.
What is Inequality or Gini Index in Madera County?
Inequality or Gini Index in Madera County is 0.45.
What is the Total Population of Madera County?
Total Population of Madera County is 157,243.
What is the Total Male Population of Madera County?
Total Male Population of Madera County is 77,200.
What is the Total Female Population of Madera County?
Total Female Population of Madera County is 80,043.
What is the Ratio of Males per 100 Females in Madera County?
There are 96.45 Males per 100 Females in Madera County.
What is the Ratio of Females per 100 Males in Madera County?
There are 103.68 Females per 100 Males in Madera County.
What is the Median Population Age in Madera County?
Median Population Age in Madera County is 34.4 Years.
What is the Average Family Size in Madera County
Average Family Size in Madera County is 3.8 People.
What is the Average Household Size in Madera County
Average Household Size in Madera County is 3.4 People.
How Large is the Labor Force in Madera County?
There are 67,497 People in the Labor Forcein in Madera County.
What is the Percentage of People in the Labor Force in Madera County?
56.5% of People are in the Labor Force in Madera County.
What is the Unemployment Rate in Madera County?
Unemployment Rate in Madera County is 11.1%.