Inyo County, CA Map & Demographics
Inyo County Map
Inyo County Overview
$36,673
PER CAPITA INCOME
$80,504
AVG FAMILY INCOME
$63,417
AVG HOUSEHOLD INCOME
7.5%
WAGE / INCOME GAP [ % ]
92.5¢/ $1
WAGE / INCOME GAP [ $ ]
$12,197
FAMILY INCOME DEFICIT
0.45
INEQUALITY / GINI INDEX
18,829
TOTAL POPULATION
9,617
MALE POPULATION
9,212
FEMALE POPULATION
104.40
MALES / 100 FEMALES
95.79
FEMALES / 100 MALES
44.6
MEDIAN AGE
3.1
AVG FAMILY SIZE
2.3
AVG HOUSEHOLD SIZE
8,714
LABOR FORCE [ PEOPLE ]
57.1%
PERCENT IN LABOR FORCE
4.9%
UNEMPLOYMENT RATE
Income in Inyo County
Income Overview in Inyo County
Per Capita Income in Inyo County is $36,673, while median incomes of families and households are $80,504 and $63,417 respectively.
| Characteristic | Number | Measure |
| Per Capita Income | 18,829 | $36,673 |
| Median Family Income | 4,367 | $80,504 |
| Mean Family Income | 4,367 | $101,983 |
| Median Household Income | 7,849 | $63,417 |
| Mean Household Income | 7,849 | $83,422 |
| Income Deficit | 4,367 | $12,197 |
| Wage / Income Gap (%) | 18,829 | 7.47% |
| Wage / Income Gap ($) | 18,829 | 92.53¢ per $1 |
| Gini / Inequality Index | 18,829 | 0.45 |
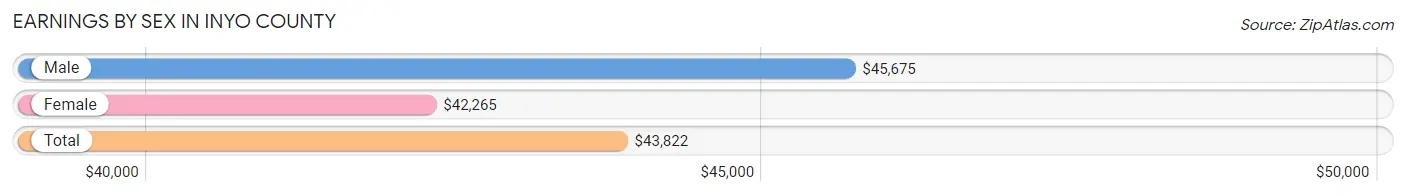
Earnings by Sex in Inyo County
Average Earnings in Inyo County are $43,822, $45,675 for men and $42,265 for women, a difference of 7.5%.
| Sex | Number | Average Earnings |
| Male | 4,691 (51.2%) | $45,675 |
| Female | 4,475 (48.8%) | $42,265 |
| Total | 9,166 (100.0%) | $43,822 |
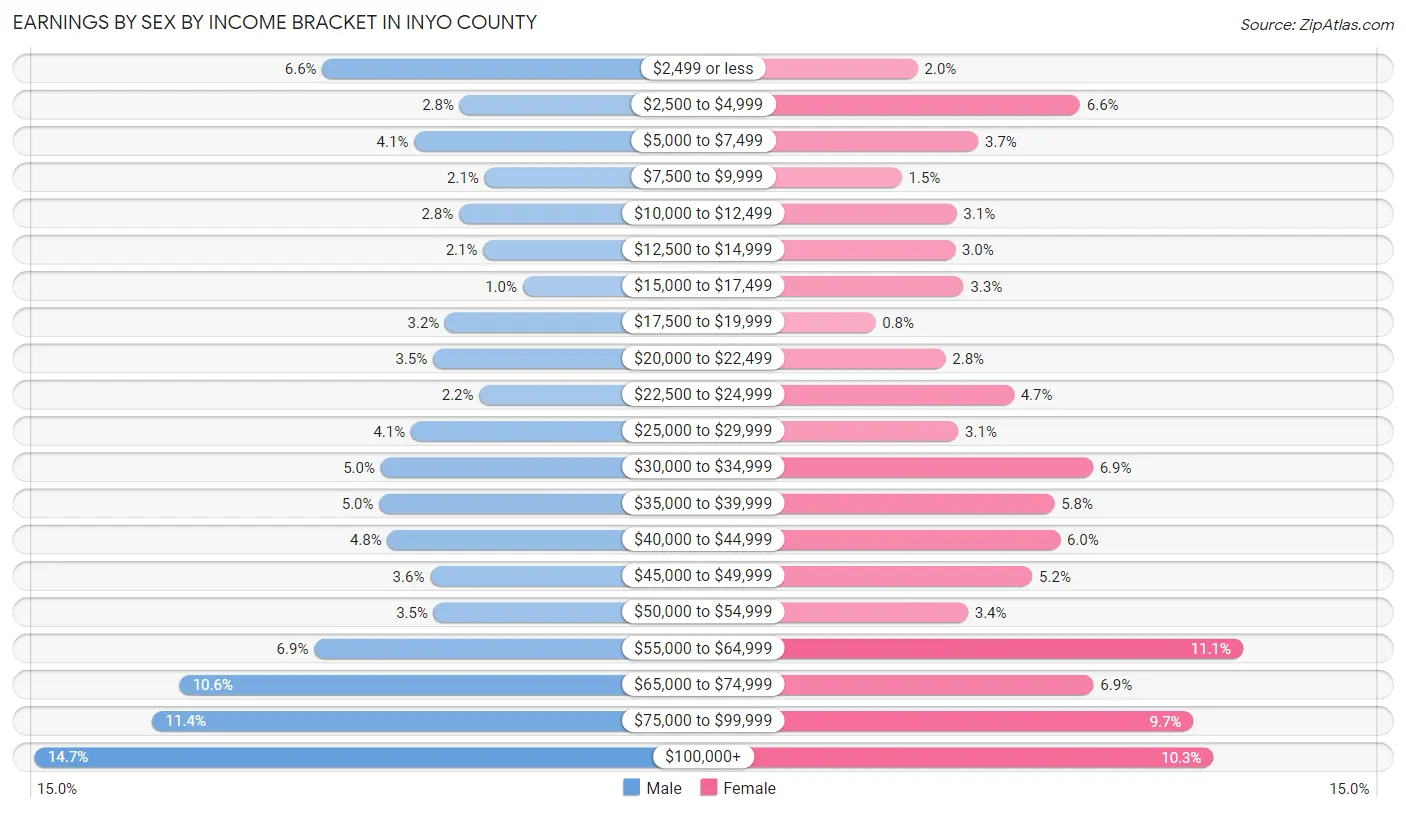
Earnings by Sex by Income Bracket in Inyo County
The most common earnings brackets in Inyo County are $100,000+ for men (690 | 14.7%) and $55,000 to $64,999 for women (498 | 11.1%).
| Income | Male | Female |
| $2,499 or less | 311 (6.6%) | 89 (2.0%) |
| $2,500 to $4,999 | 130 (2.8%) | 293 (6.6%) |
| $5,000 to $7,499 | 190 (4.1%) | 165 (3.7%) |
| $7,500 to $9,999 | 97 (2.1%) | 69 (1.5%) |
| $10,000 to $12,499 | 131 (2.8%) | 138 (3.1%) |
| $12,500 to $14,999 | 99 (2.1%) | 136 (3.0%) |
| $15,000 to $17,499 | 47 (1.0%) | 147 (3.3%) |
| $17,500 to $19,999 | 149 (3.2%) | 36 (0.8%) |
| $20,000 to $22,499 | 165 (3.5%) | 124 (2.8%) |
| $22,500 to $24,999 | 104 (2.2%) | 210 (4.7%) |
| $25,000 to $29,999 | 194 (4.1%) | 140 (3.1%) |
| $30,000 to $34,999 | 234 (5.0%) | 309 (6.9%) |
| $35,000 to $39,999 | 236 (5.0%) | 261 (5.8%) |
| $40,000 to $44,999 | 225 (4.8%) | 268 (6.0%) |
| $45,000 to $49,999 | 169 (3.6%) | 233 (5.2%) |
| $50,000 to $54,999 | 164 (3.5%) | 152 (3.4%) |
| $55,000 to $64,999 | 322 (6.9%) | 498 (11.1%) |
| $65,000 to $74,999 | 499 (10.6%) | 310 (6.9%) |
| $75,000 to $99,999 | 535 (11.4%) | 436 (9.7%) |
| $100,000+ | 690 (14.7%) | 461 (10.3%) |
| Total | 4,691 (100.0%) | 4,475 (100.0%) |
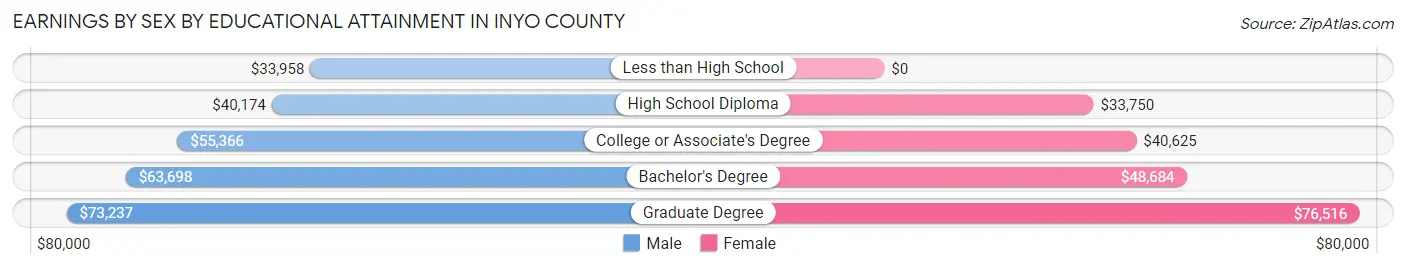
Earnings by Sex by Educational Attainment in Inyo County
Average earnings in Inyo County are $53,622 for men and $42,572 for women, a difference of 20.6%. Men with an educational attainment of graduate degree enjoy the highest average annual earnings of $73,237, while those with less than high school education earn the least with $33,958. Women with an educational attainment of graduate degree earn the most with the average annual earnings of $76,516, while those with high school diploma education have the smallest earnings of $33,750.
| Educational Attainment | Male Income | Female Income |
| Less than High School | $33,958 | $0 |
| High School Diploma | $40,174 | $33,750 |
| College or Associate's Degree | $55,366 | $40,625 |
| Bachelor's Degree | $63,698 | $48,684 |
| Graduate Degree | $73,237 | $76,516 |
| Total | $53,622 | $42,572 |
Family Income in Inyo County
Family Income Brackets in Inyo County
According to the Inyo County family income data, there are 694 families falling into the $100,000 to $149,999 income range, which is the most common income bracket and makes up 15.9% of all families. Conversely, the $10,000 to $14,999 income bracket is the least frequent group with only 122 families (2.8%) belonging to this category.
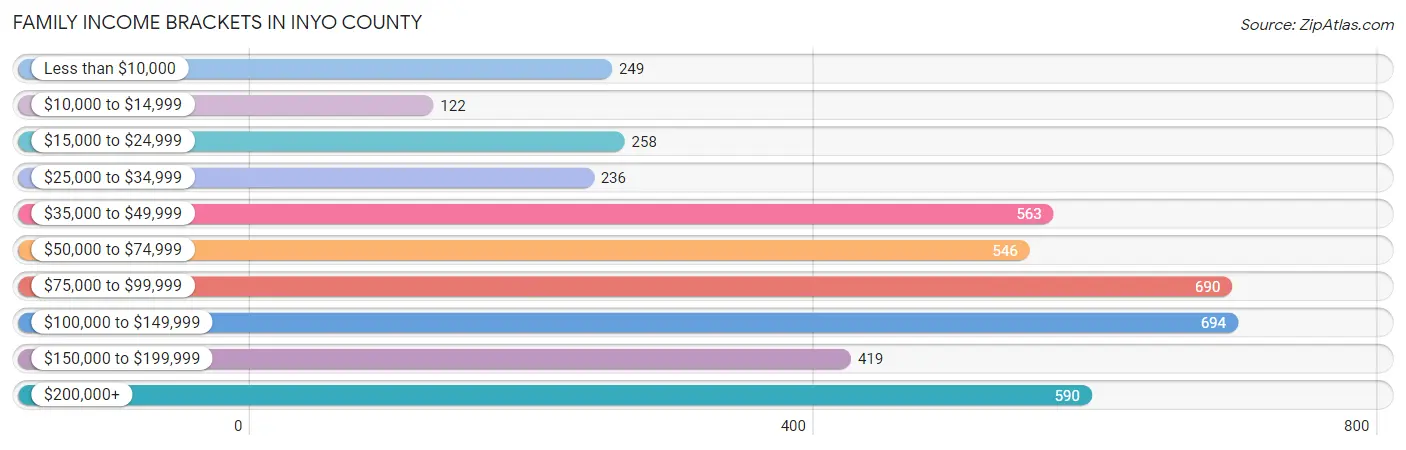
| Income Bracket | # Families | % Families |
| Less than $10,000 | 249 | 5.7% |
| $10,000 to $14,999 | 122 | 2.8% |
| $15,000 to $24,999 | 258 | 5.9% |
| $25,000 to $34,999 | 236 | 5.4% |
| $35,000 to $49,999 | 563 | 12.9% |
| $50,000 to $74,999 | 546 | 12.5% |
| $75,000 to $99,999 | 690 | 15.8% |
| $100,000 to $149,999 | 694 | 15.9% |
| $150,000 to $199,999 | 419 | 9.6% |
| $200,000+ | 590 | 13.5% |
Family Income by Famaliy Size in Inyo County
4-person families (496 | 11.4%) account for the highest median family income in Inyo County with $153,049 per family, while 2-person families (2,653 | 60.8%) have the highest median income of $38,504 per family member.
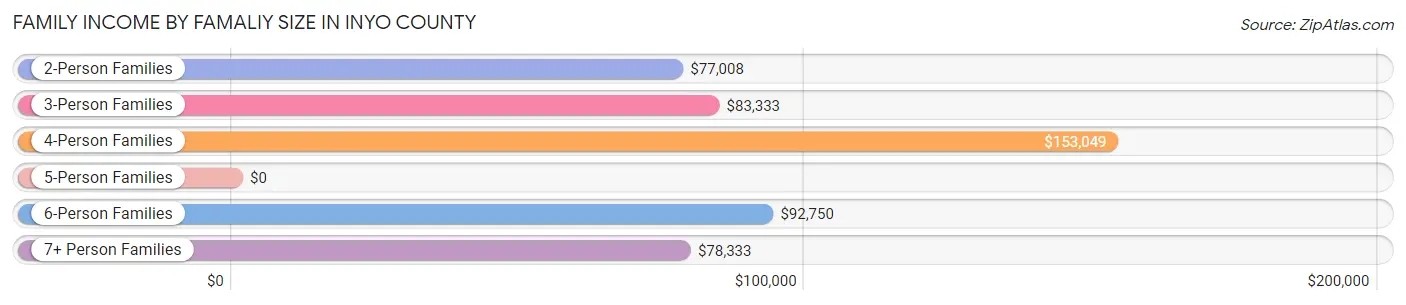
| Income Bracket | # Families | Median Income |
| 2-Person Families | 2,653 (60.8%) | $77,008 |
| 3-Person Families | 852 (19.5%) | $83,333 |
| 4-Person Families | 496 (11.4%) | $153,049 |
| 5-Person Families | 249 (5.7%) | $0 |
| 6-Person Families | 95 (2.2%) | $92,750 |
| 7+ Person Families | 22 (0.5%) | $78,333 |
| Total | 4,367 (100.0%) | $80,504 |
Family Income by Number of Earners in Inyo County
The median family income in Inyo County is $80,504, with families comprising 3+ earners (294) having the highest median family income of $175,313, while families with no earners (1,131) have the lowest median family income of $39,438, accounting for 6.7% and 25.9% of families, respectively.
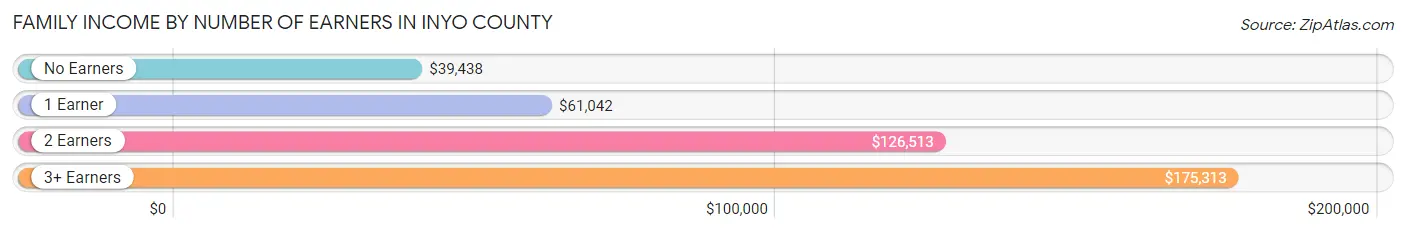
| Number of Earners | # Families | Median Income |
| No Earners | 1,131 (25.9%) | $39,438 |
| 1 Earner | 1,350 (30.9%) | $61,042 |
| 2 Earners | 1,592 (36.5%) | $126,513 |
| 3+ Earners | 294 (6.7%) | $175,313 |
| Total | 4,367 (100.0%) | $80,504 |
Household Income in Inyo County
Household Income Brackets in Inyo County
With 1,264 households falling in the category, the $50,000 to $74,999 income range is the most frequent in Inyo County, accounting for 16.1% of all households. In contrast, only 424 households (5.4%) fall into the $10,000 to $14,999 income bracket, making it the least populous group.
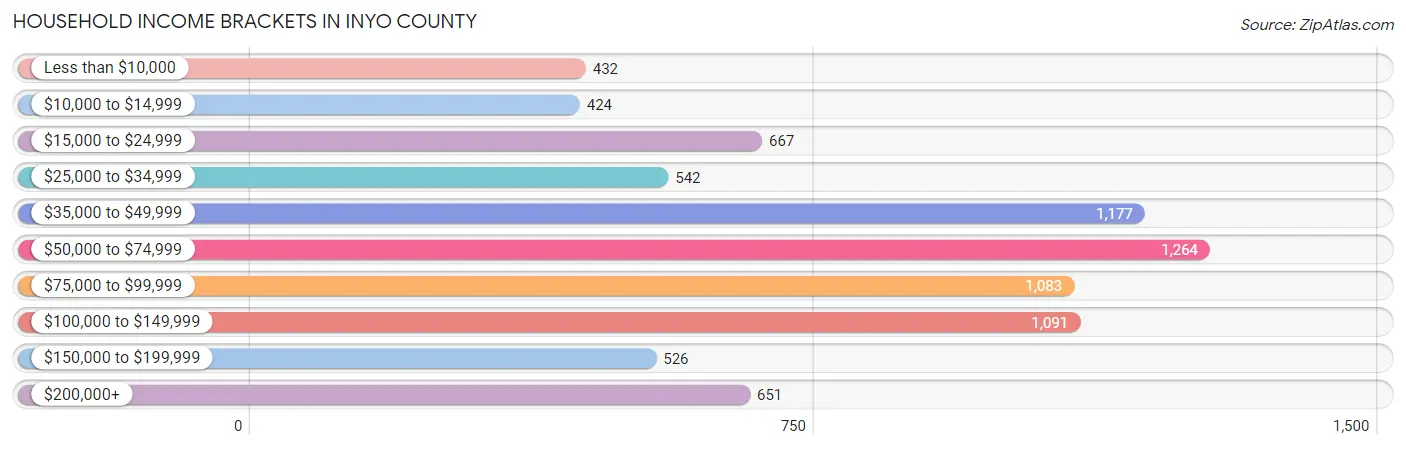
| Income Bracket | # Households | % Households |
| Less than $10,000 | 432 | 5.5% |
| $10,000 to $14,999 | 424 | 5.4% |
| $15,000 to $24,999 | 667 | 8.5% |
| $25,000 to $34,999 | 542 | 6.9% |
| $35,000 to $49,999 | 1,177 | 15.0% |
| $50,000 to $74,999 | 1,264 | 16.1% |
| $75,000 to $99,999 | 1,083 | 13.8% |
| $100,000 to $149,999 | 1,091 | 13.9% |
| $150,000 to $199,999 | 526 | 6.7% |
| $200,000+ | 651 | 8.3% |
Household Income by Householder Age in Inyo County
The median household income in Inyo County is $63,417, with the highest median household income of $77,209 found in the 25 to 44 years age bracket for the primary householder. A total of 2,068 households (26.4%) fall into this category. Meanwhile, the 15 to 24 years age bracket for the primary householder has the lowest median household income of $0, with 103 households (1.3%) in this group.
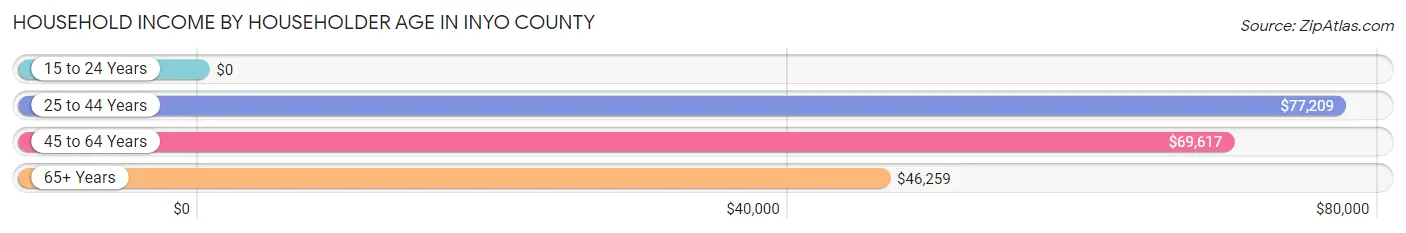
| Income Bracket | # Households | Median Income |
| 15 to 24 Years | 103 (1.3%) | $0 |
| 25 to 44 Years | 2,068 (26.4%) | $77,209 |
| 45 to 64 Years | 2,857 (36.4%) | $69,617 |
| 65+ Years | 2,821 (35.9%) | $46,259 |
| Total | 7,849 (100.0%) | $63,417 |
Poverty in Inyo County
Income Below Poverty by Sex and Age in Inyo County
With 12.8% poverty level for males and 11.0% for females among the residents of Inyo County, 18 to 24 year old males and 35 to 44 year old females are the most vulnerable to poverty, with 143 males (22.7%) and 259 females (22.8%) in their respective age groups living below the poverty level.
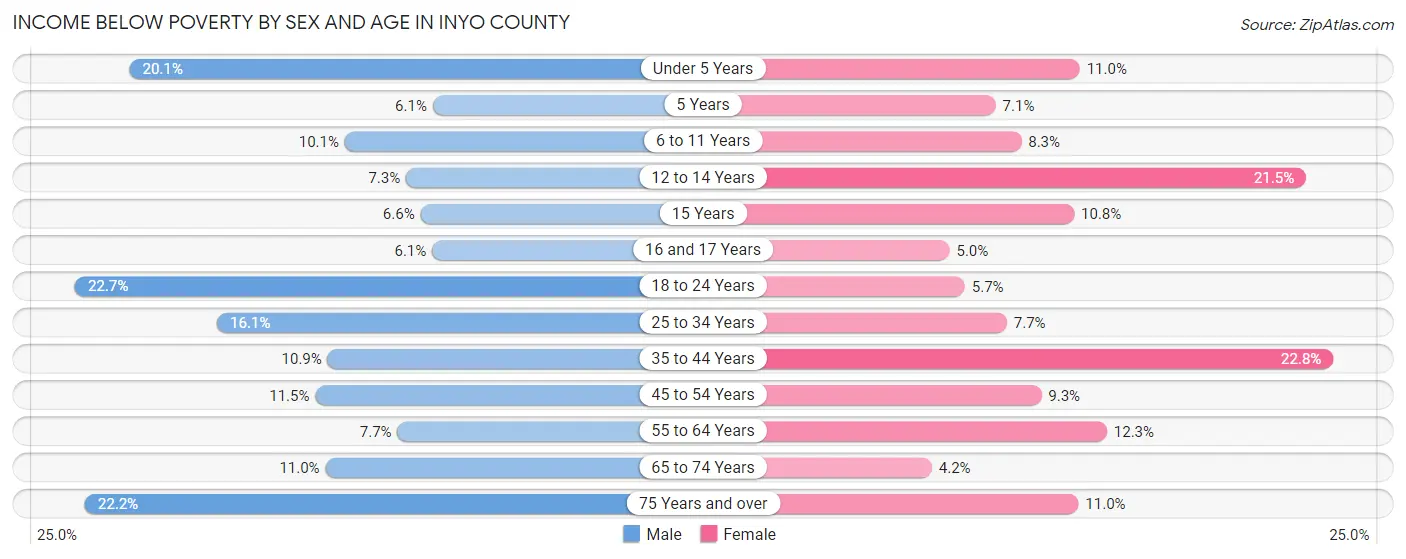
| Age Bracket | Male | Female |
| Under 5 Years | 94 (20.1%) | 51 (11.0%) |
| 5 Years | 2 (6.1%) | 14 (7.1%) |
| 6 to 11 Years | 74 (10.1%) | 56 (8.3%) |
| 12 to 14 Years | 27 (7.3%) | 70 (21.5%) |
| 15 Years | 13 (6.6%) | 11 (10.8%) |
| 16 and 17 Years | 14 (6.1%) | 2 (5.0%) |
| 18 to 24 Years | 143 (22.7%) | 25 (5.7%) |
| 25 to 34 Years | 121 (16.1%) | 88 (7.7%) |
| 35 to 44 Years | 152 (10.9%) | 259 (22.8%) |
| 45 to 54 Years | 107 (11.5%) | 89 (9.3%) |
| 55 to 64 Years | 110 (7.7%) | 173 (12.3%) |
| 65 to 74 Years | 139 (11.0%) | 49 (4.2%) |
| 75 Years and over | 200 (22.2%) | 116 (11.0%) |
| Total | 1,196 (12.8%) | 1,003 (11.0%) |
Income Above Poverty by Sex and Age in Inyo County
According to the poverty statistics in Inyo County, males aged 5 years and females aged 65 to 74 years are the age groups that are most secure financially, with 93.9% of males and 95.8% of females in these age groups living above the poverty line.
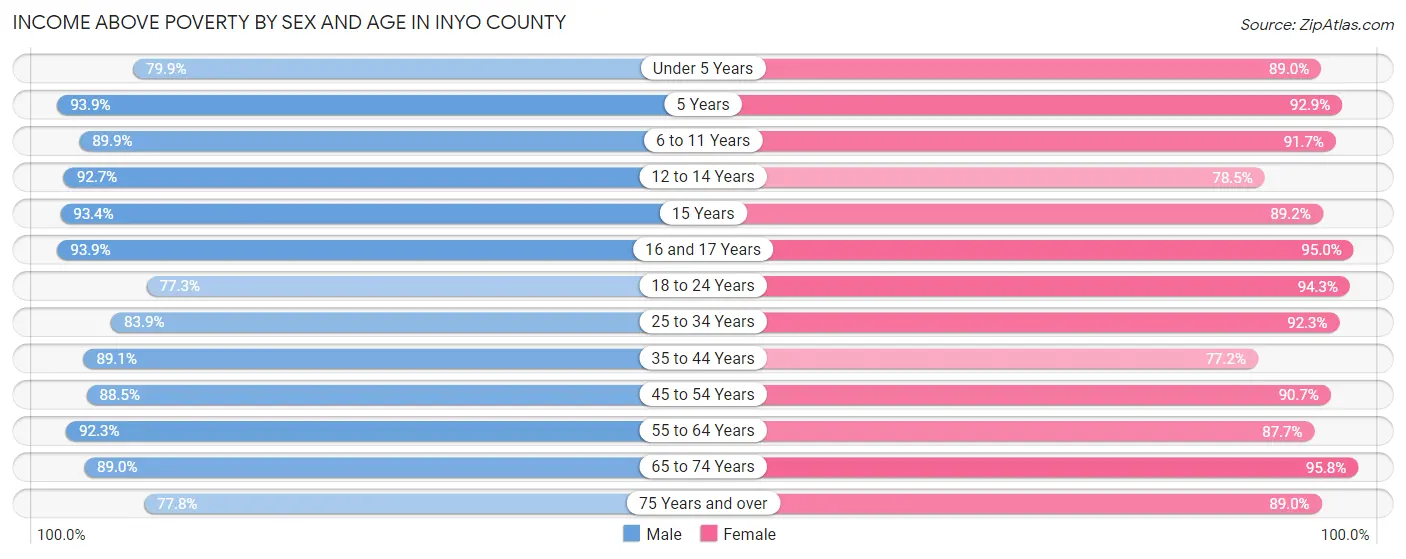
| Age Bracket | Male | Female |
| Under 5 Years | 373 (79.9%) | 411 (89.0%) |
| 5 Years | 31 (93.9%) | 182 (92.9%) |
| 6 to 11 Years | 656 (89.9%) | 616 (91.7%) |
| 12 to 14 Years | 343 (92.7%) | 255 (78.5%) |
| 15 Years | 183 (93.4%) | 91 (89.2%) |
| 16 and 17 Years | 216 (93.9%) | 38 (95.0%) |
| 18 to 24 Years | 488 (77.3%) | 413 (94.3%) |
| 25 to 34 Years | 632 (83.9%) | 1,061 (92.3%) |
| 35 to 44 Years | 1,237 (89.1%) | 877 (77.2%) |
| 45 to 54 Years | 823 (88.5%) | 872 (90.7%) |
| 55 to 64 Years | 1,318 (92.3%) | 1,234 (87.7%) |
| 65 to 74 Years | 1,120 (89.0%) | 1,124 (95.8%) |
| 75 Years and over | 701 (77.8%) | 940 (89.0%) |
| Total | 8,121 (87.2%) | 8,114 (89.0%) |
Income Below Poverty Among Married-Couple Families in Inyo County
The poverty statistics for married-couple families in Inyo County show that 7.4% or 244 of the total 3,304 families live below the poverty line. Families with no children have the highest poverty rate of 7.6%, comprising of 178 families. On the other hand, families with 5 or more children have the lowest poverty rate of 0.0%, which includes 0 families.
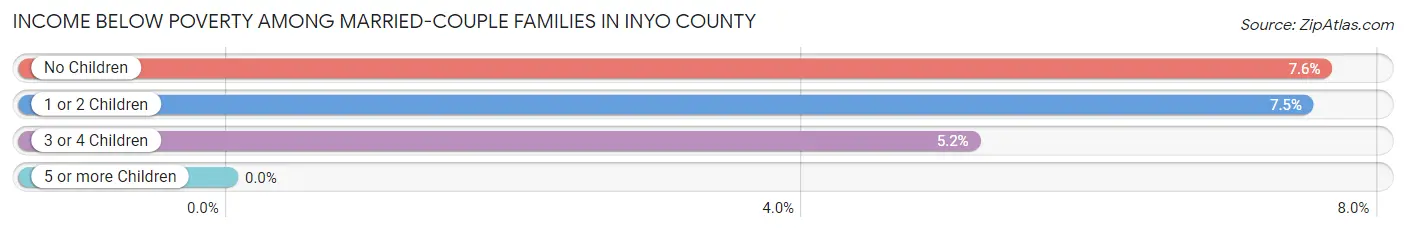
| Children | Above Poverty | Below Poverty |
| No Children | 2,157 (92.4%) | 178 (7.6%) |
| 1 or 2 Children | 642 (92.5%) | 52 (7.5%) |
| 3 or 4 Children | 257 (94.8%) | 14 (5.2%) |
| 5 or more Children | 4 (100.0%) | 0 (0.0%) |
| Total | 3,060 (92.6%) | 244 (7.4%) |
Income Below Poverty Among Single-Parent Households in Inyo County
According to the poverty data in Inyo County, 9.5% or 18 single-father households and 23.7% or 207 single-mother households are living below the poverty line. Among single-father households, those with 1 or 2 children have the highest poverty rate, with 14 households (15.0%) experiencing poverty. Likewise, among single-mother households, those with 3 or 4 children have the highest poverty rate, with 48 households (72.7%) falling below the poverty line.
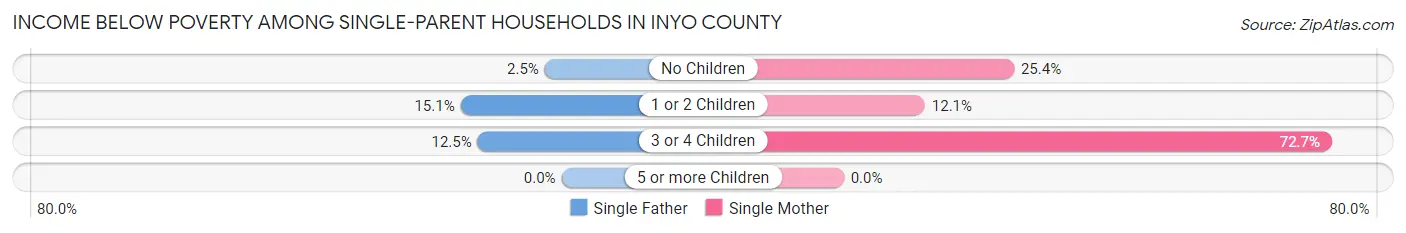
| Children | Single Father | Single Mother |
| No Children | 2 (2.5%) | 117 (25.4%) |
| 1 or 2 Children | 14 (15.0%) | 42 (12.1%) |
| 3 or 4 Children | 2 (12.5%) | 48 (72.7%) |
| 5 or more Children | 0 (0.0%) | 0 (0.0%) |
| Total | 18 (9.5%) | 207 (23.7%) |
Income Below Poverty Among Married-Couple vs Single-Parent Households in Inyo County
The poverty data for Inyo County shows that 244 of the married-couple family households (7.4%) and 225 of the single-parent households (21.2%) are living below the poverty level. Within the married-couple family households, those with no children have the highest poverty rate, with 178 households (7.6%) falling below the poverty line. Among the single-parent households, those with 3 or 4 children have the highest poverty rate, with 50 household (61.0%) living below poverty.
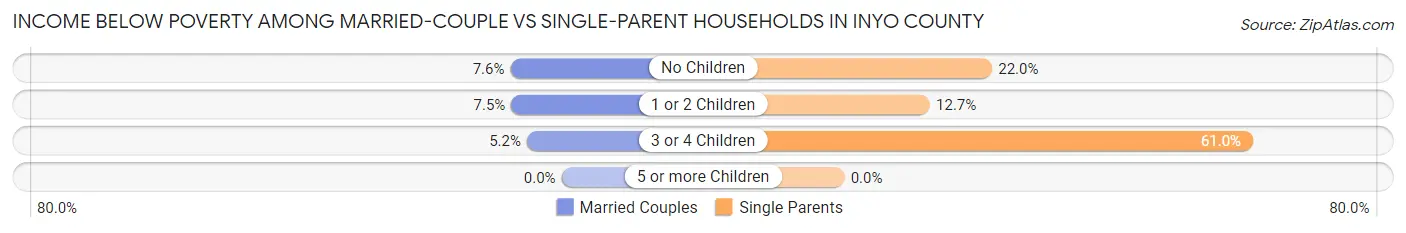
| Children | Married-Couple Families | Single-Parent Households |
| No Children | 178 (7.6%) | 119 (22.0%) |
| 1 or 2 Children | 52 (7.5%) | 56 (12.7%) |
| 3 or 4 Children | 14 (5.2%) | 50 (61.0%) |
| 5 or more Children | 0 (0.0%) | 0 (0.0%) |
| Total | 244 (7.4%) | 225 (21.2%) |
Race in Inyo County
The most populous races in Inyo County are White / Caucasian (12,980 | 68.9%), Hispanic or Latino (4,500 | 23.9%), and Two or more Races (2,402 | 12.8%).
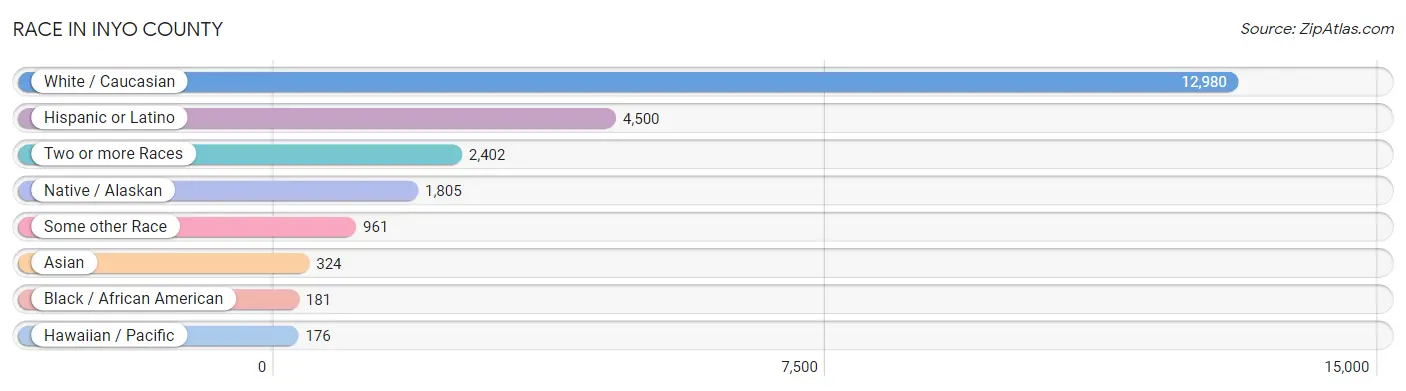
| Race | # Population | % Population |
| Asian | 324 | 1.7% |
| Black / African American | 181 | 1.0% |
| Hawaiian / Pacific | 176 | 0.9% |
| Hispanic or Latino | 4,500 | 23.9% |
| Native / Alaskan | 1,805 | 9.6% |
| White / Caucasian | 12,980 | 68.9% |
| Two or more Races | 2,402 | 12.8% |
| Some other Race | 961 | 5.1% |
| Total | 18,829 | 100.0% |
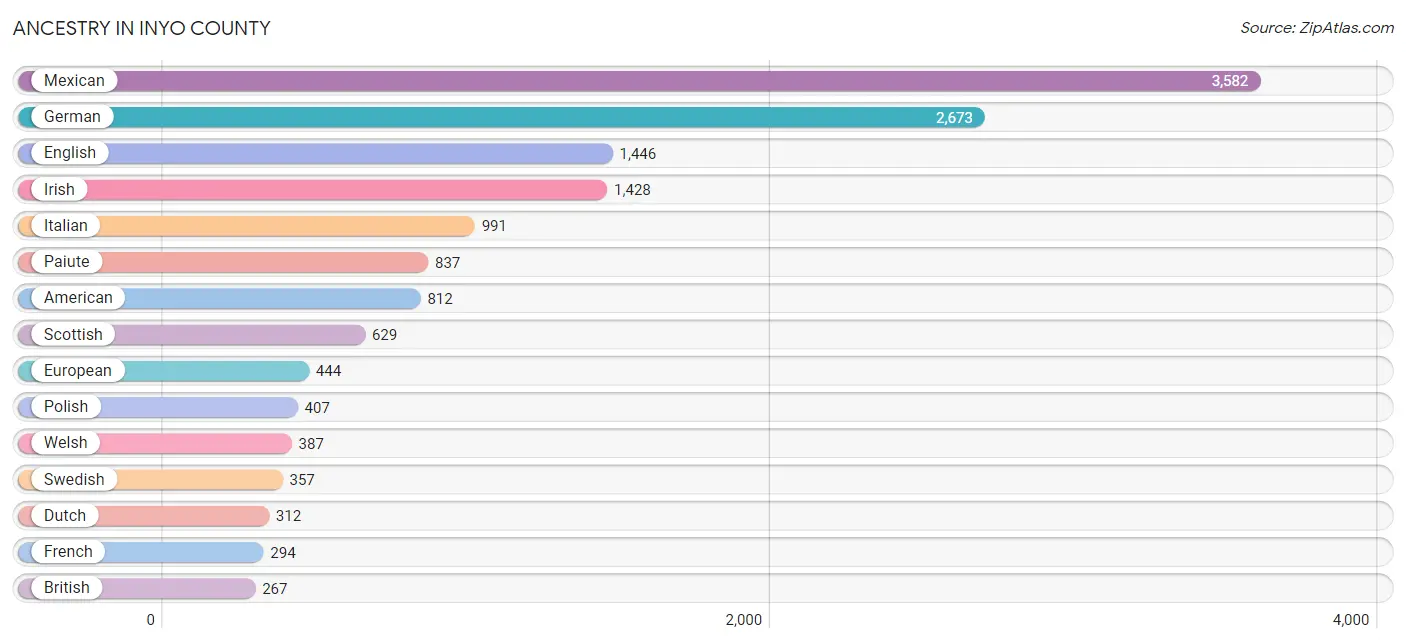
Ancestry in Inyo County
The most populous ancestries reported in Inyo County are Mexican (3,582 | 19.0%), German (2,673 | 14.2%), English (1,446 | 7.7%), Irish (1,428 | 7.6%), and Italian (991 | 5.3%), together accounting for 53.7% of all Inyo County residents.
| Ancestry | # Population | % Population |
| African | 1 | 0.0% |
| American | 812 | 4.3% |
| Apache | 6 | 0.0% |
| Arab | 28 | 0.2% |
| Argentinean | 18 | 0.1% |
| Armenian | 26 | 0.1% |
| Austrian | 36 | 0.2% |
| Bangladeshi | 8 | 0.0% |
| Basque | 2 | 0.0% |
| Belgian | 14 | 0.1% |
| Bhutanese | 71 | 0.4% |
| Blackfeet | 5 | 0.0% |
| British | 267 | 1.4% |
| Burmese | 38 | 0.2% |
| Canadian | 25 | 0.1% |
| Celtic | 6 | 0.0% |
| Central American | 33 | 0.2% |
| Central American Indian | 29 | 0.2% |
| Cherokee | 84 | 0.4% |
| Chippewa | 16 | 0.1% |
| Choctaw | 83 | 0.4% |
| Colombian | 89 | 0.5% |
| Comanche | 3 | 0.0% |
| Creek | 1 | 0.0% |
| Croatian | 4 | 0.0% |
| Cuban | 60 | 0.3% |
| Czech | 53 | 0.3% |
| Czechoslovakian | 7 | 0.0% |
| Danish | 169 | 0.9% |
| Delaware | 13 | 0.1% |
| Dutch | 312 | 1.7% |
| Eastern European | 97 | 0.5% |
| English | 1,446 | 7.7% |
| Estonian | 78 | 0.4% |
| European | 444 | 2.4% |
| Finnish | 32 | 0.2% |
| French | 294 | 1.6% |
| French American Indian | 2 | 0.0% |
| French Canadian | 24 | 0.1% |
| German | 2,673 | 14.2% |
| Greek | 40 | 0.2% |
| Guamanian / Chamorro | 40 | 0.2% |
| Guatemalan | 7 | 0.0% |
| Hungarian | 76 | 0.4% |
| Indian (Asian) | 52 | 0.3% |
| Irish | 1,428 | 7.6% |
| Italian | 991 | 5.3% |
| Japanese | 16 | 0.1% |
| Korean | 250 | 1.3% |
| Laotian | 4 | 0.0% |
| Latvian | 22 | 0.1% |
| Lithuanian | 26 | 0.1% |
| Mexican | 3,582 | 19.0% |
| Mexican American Indian | 173 | 0.9% |
| Native Hawaiian | 129 | 0.7% |
| Navajo | 13 | 0.1% |
| Nicaraguan | 1 | 0.0% |
| Northern European | 80 | 0.4% |
| Norwegian | 241 | 1.3% |
| Paiute | 837 | 4.4% |
| Pennsylvania German | 26 | 0.1% |
| Pima | 2 | 0.0% |
| Polish | 407 | 2.2% |
| Portuguese | 82 | 0.4% |
| Potawatomi | 5 | 0.0% |
| Pueblo | 3 | 0.0% |
| Puerto Rican | 113 | 0.6% |
| Romanian | 11 | 0.1% |
| Russian | 87 | 0.5% |
| Salvadoran | 25 | 0.1% |
| Samoan | 76 | 0.4% |
| Scandinavian | 51 | 0.3% |
| Scotch-Irish | 102 | 0.5% |
| Scottish | 629 | 3.3% |
| Serbian | 9 | 0.1% |
| Shoshone | 86 | 0.5% |
| Sioux | 34 | 0.2% |
| Slavic | 2 | 0.0% |
| Slovak | 17 | 0.1% |
| South American | 107 | 0.6% |
| Spaniard | 118 | 0.6% |
| Spanish | 125 | 0.7% |
| Sri Lankan | 13 | 0.1% |
| Subsaharan African | 83 | 0.4% |
| Swedish | 357 | 1.9% |
| Swiss | 206 | 1.1% |
| Syrian | 23 | 0.1% |
| Thai | 52 | 0.3% |
| Ukrainian | 135 | 0.7% |
| Welsh | 387 | 2.1% |
| Yugoslavian | 124 | 0.7% |
| Yuman | 21 | 0.1% |
| Yup'ik | 17 | 0.1% | View All 93 Rows |
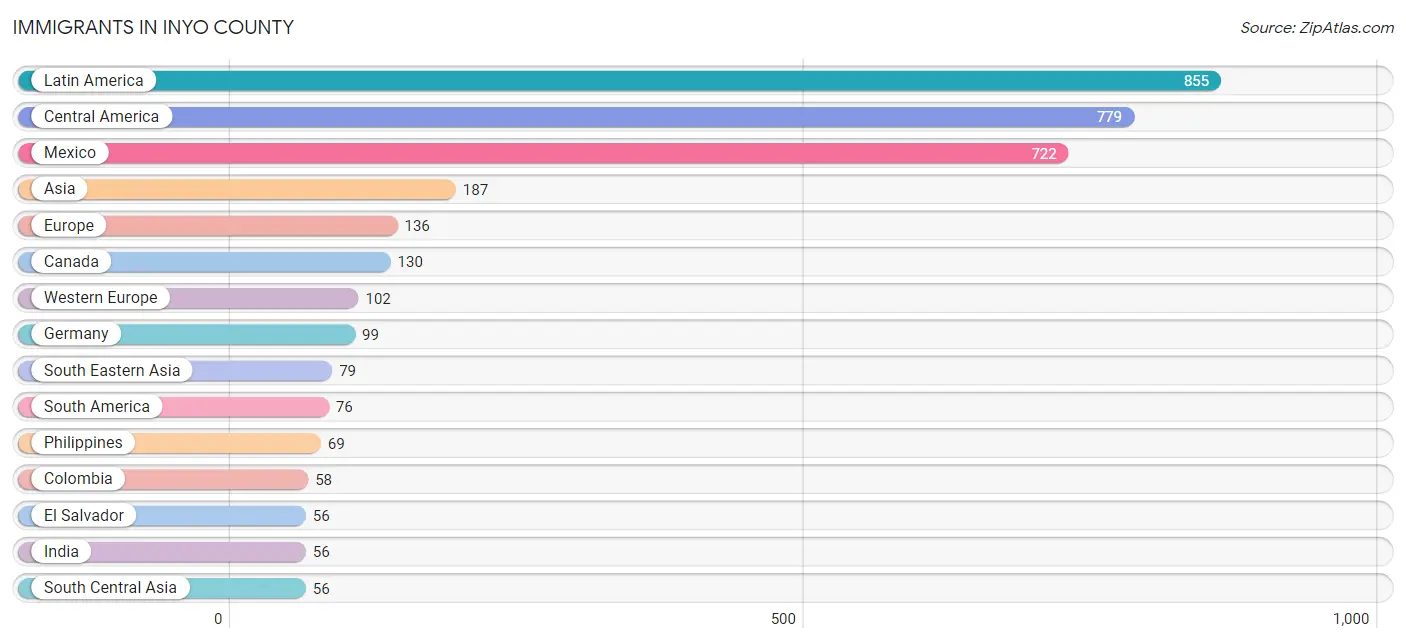
Immigrants in Inyo County
The most numerous immigrant groups reported in Inyo County came from Latin America (855 | 4.5%), Central America (779 | 4.1%), Mexico (722 | 3.8%), Asia (187 | 1.0%), and Europe (136 | 0.7%), together accounting for 14.2% of all Inyo County residents.
| Immigration Origin | # Population | % Population |
| Argentina | 18 | 0.1% |
| Asia | 187 | 1.0% |
| Australia | 10 | 0.1% |
| Belarus | 1 | 0.0% |
| Canada | 130 | 0.7% |
| Central America | 779 | 4.1% |
| China | 21 | 0.1% |
| Colombia | 58 | 0.3% |
| Eastern Asia | 49 | 0.3% |
| Eastern Europe | 11 | 0.1% |
| El Salvador | 56 | 0.3% |
| England | 5 | 0.0% |
| Europe | 136 | 0.7% |
| Germany | 99 | 0.5% |
| Hungary | 6 | 0.0% |
| India | 56 | 0.3% |
| Jordan | 3 | 0.0% |
| Korea | 28 | 0.2% |
| Latin America | 855 | 4.5% |
| Mexico | 722 | 3.8% |
| Nicaragua | 1 | 0.0% |
| Northern Europe | 23 | 0.1% |
| Oceania | 38 | 0.2% |
| Philippines | 69 | 0.4% |
| South America | 76 | 0.4% |
| South Central Asia | 56 | 0.3% |
| South Eastern Asia | 79 | 0.4% |
| Sweden | 3 | 0.0% |
| Switzerland | 3 | 0.0% |
| Taiwan | 21 | 0.1% |
| Ukraine | 4 | 0.0% |
| Vietnam | 10 | 0.1% |
| Western Asia | 3 | 0.0% |
| Western Europe | 102 | 0.5% | View All 34 Rows |
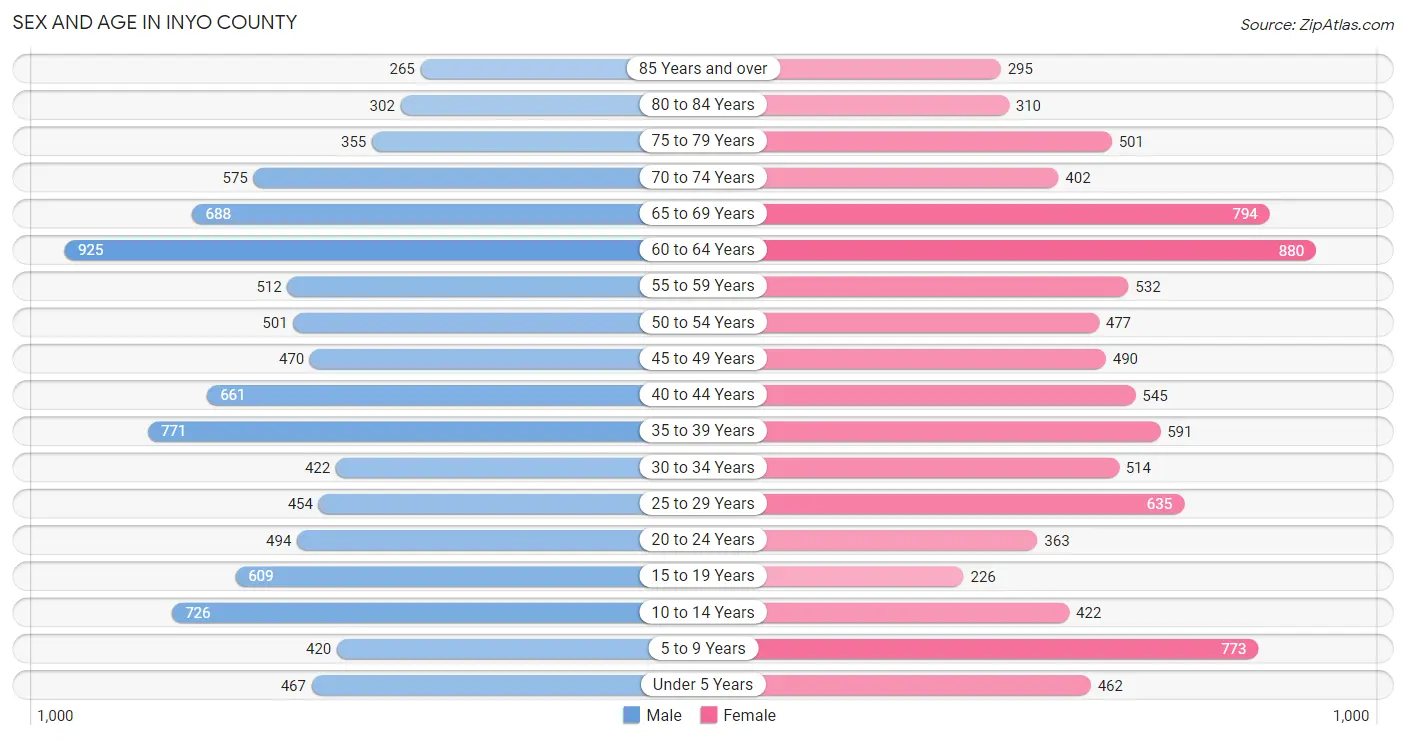
Sex and Age in Inyo County
Sex and Age in Inyo County
The most populous age groups in Inyo County are 60 to 64 Years (925 | 9.6%) for men and 60 to 64 Years (880 | 9.6%) for women.
| Age Bracket | Male | Female |
| Under 5 Years | 467 (4.9%) | 462 (5.0%) |
| 5 to 9 Years | 420 (4.4%) | 773 (8.4%) |
| 10 to 14 Years | 726 (7.5%) | 422 (4.6%) |
| 15 to 19 Years | 609 (6.3%) | 226 (2.5%) |
| 20 to 24 Years | 494 (5.1%) | 363 (3.9%) |
| 25 to 29 Years | 454 (4.7%) | 635 (6.9%) |
| 30 to 34 Years | 422 (4.4%) | 514 (5.6%) |
| 35 to 39 Years | 771 (8.0%) | 591 (6.4%) |
| 40 to 44 Years | 661 (6.9%) | 545 (5.9%) |
| 45 to 49 Years | 470 (4.9%) | 490 (5.3%) |
| 50 to 54 Years | 501 (5.2%) | 477 (5.2%) |
| 55 to 59 Years | 512 (5.3%) | 532 (5.8%) |
| 60 to 64 Years | 925 (9.6%) | 880 (9.6%) |
| 65 to 69 Years | 688 (7.1%) | 794 (8.6%) |
| 70 to 74 Years | 575 (6.0%) | 402 (4.4%) |
| 75 to 79 Years | 355 (3.7%) | 501 (5.4%) |
| 80 to 84 Years | 302 (3.1%) | 310 (3.4%) |
| 85 Years and over | 265 (2.8%) | 295 (3.2%) |
| Total | 9,617 (100.0%) | 9,212 (100.0%) |
Families and Households in Inyo County
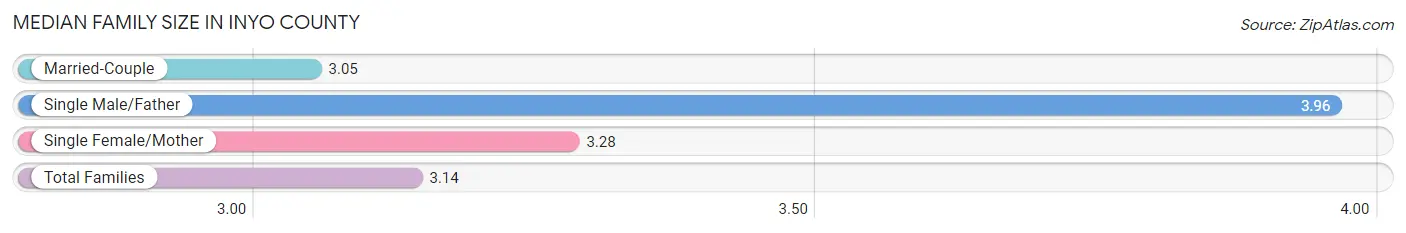
Median Family Size in Inyo County
The median family size in Inyo County is 3.14 persons per family, with single male/father families (189 | 4.3%) accounting for the largest median family size of 3.96 persons per family. On the other hand, married-couple families (3,304 | 75.7%) represent the smallest median family size with 3.05 persons per family.
| Family Type | # Families | Family Size |
| Married-Couple | 3,304 (75.7%) | 3.05 |
| Single Male/Father | 189 (4.3%) | 3.96 |
| Single Female/Mother | 874 (20.0%) | 3.28 |
| Total Families | 4,367 (100.0%) | 3.14 |
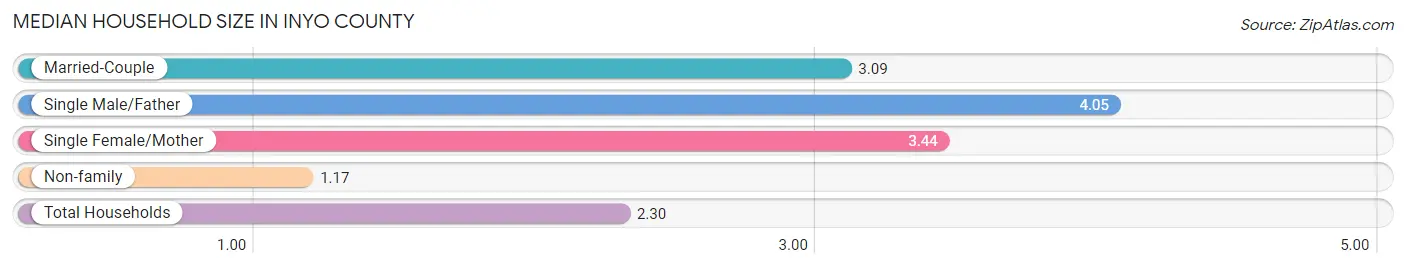
Median Household Size in Inyo County
The median household size in Inyo County is 2.30 persons per household, with single male/father households (189 | 2.4%) accounting for the largest median household size of 4.05 persons per household. non-family households (3,482 | 44.4%) represent the smallest median household size with 1.17 persons per household.
| Household Type | # Households | Household Size |
| Married-Couple | 3,304 (42.1%) | 3.09 |
| Single Male/Father | 189 (2.4%) | 4.05 |
| Single Female/Mother | 874 (11.1%) | 3.44 |
| Non-family | 3,482 (44.4%) | 1.17 |
| Total Households | 7,849 (100.0%) | 2.30 |
Household Size by Marriage Status in Inyo County
Out of a total of 7,849 households in Inyo County, 4,367 (55.6%) are family households, while 3,482 (44.4%) are nonfamily households. The most numerous type of family households are 2-person households, comprising 2,593, and the most common type of nonfamily households are 1-person households, comprising 2,883.
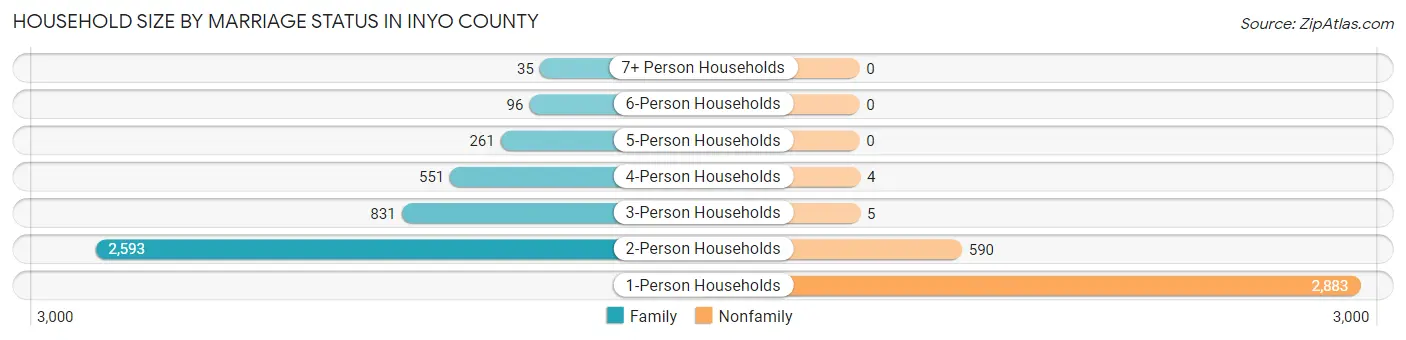
| Household Size | Family Households | Nonfamily Households |
| 1-Person Households | - | 2,883 (36.7%) |
| 2-Person Households | 2,593 (33.0%) | 590 (7.5%) |
| 3-Person Households | 831 (10.6%) | 5 (0.1%) |
| 4-Person Households | 551 (7.0%) | 4 (0.1%) |
| 5-Person Households | 261 (3.3%) | 0 (0.0%) |
| 6-Person Households | 96 (1.2%) | 0 (0.0%) |
| 7+ Person Households | 35 (0.4%) | 0 (0.0%) |
| Total | 4,367 (55.6%) | 3,482 (44.4%) |
Female Fertility in Inyo County
Fertility by Age in Inyo County
Average fertility rate in Inyo County is 13.0 births per 1,000 women. Women in the age bracket of 20 to 34 years have the highest fertility rate with 18.0 births per 1,000 women. Women in the age bracket of 20 to 34 years acount for 60.0% of all women with births.
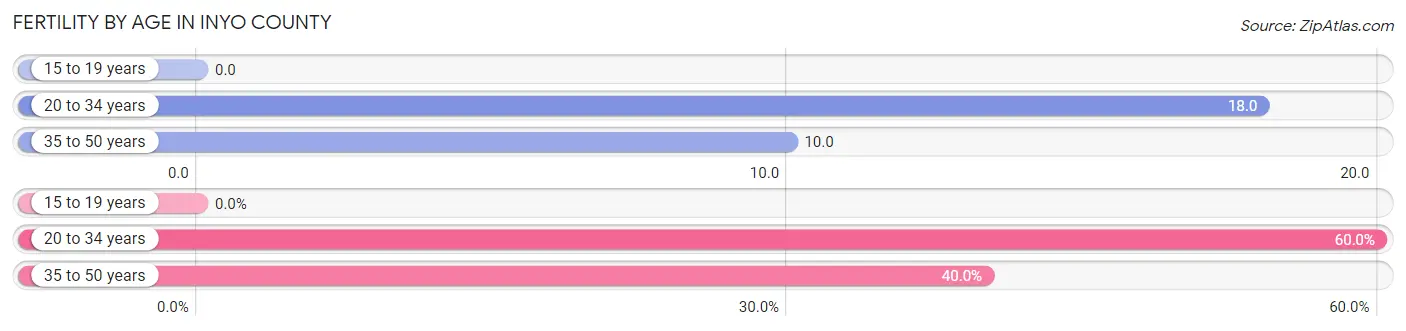
| Age Bracket | Women with Births | Births / 1,000 Women |
| 15 to 19 years | 0 (0.0%) | 0.0 |
| 20 to 34 years | 27 (60.0%) | 18.0 |
| 35 to 50 years | 18 (40.0%) | 10.0 |
| Total | 45 (100.0%) | 13.0 |
Fertility by Age by Marriage Status in Inyo County
73.3% of women with births (45) in Inyo County are married. The highest percentage of unmarried women with births falls into 20 to 34 years age bracket with 44.4% of them unmarried at the time of birth, while the lowest percentage of unmarried women with births belong to 35 to 50 years age bracket with 0.0% of them unmarried.
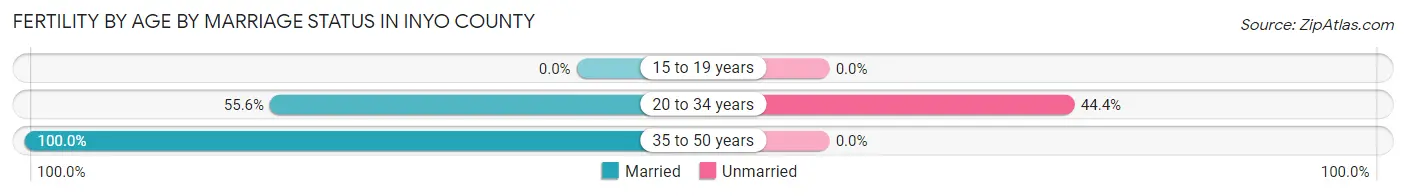
| Age Bracket | Married | Unmarried |
| 15 to 19 years | 0 (0.0%) | 0 (0.0%) |
| 20 to 34 years | 15 (55.6%) | 12 (44.4%) |
| 35 to 50 years | 18 (100.0%) | 0 (0.0%) |
| Total | 33 (73.3%) | 12 (26.7%) |
Fertility by Education in Inyo County
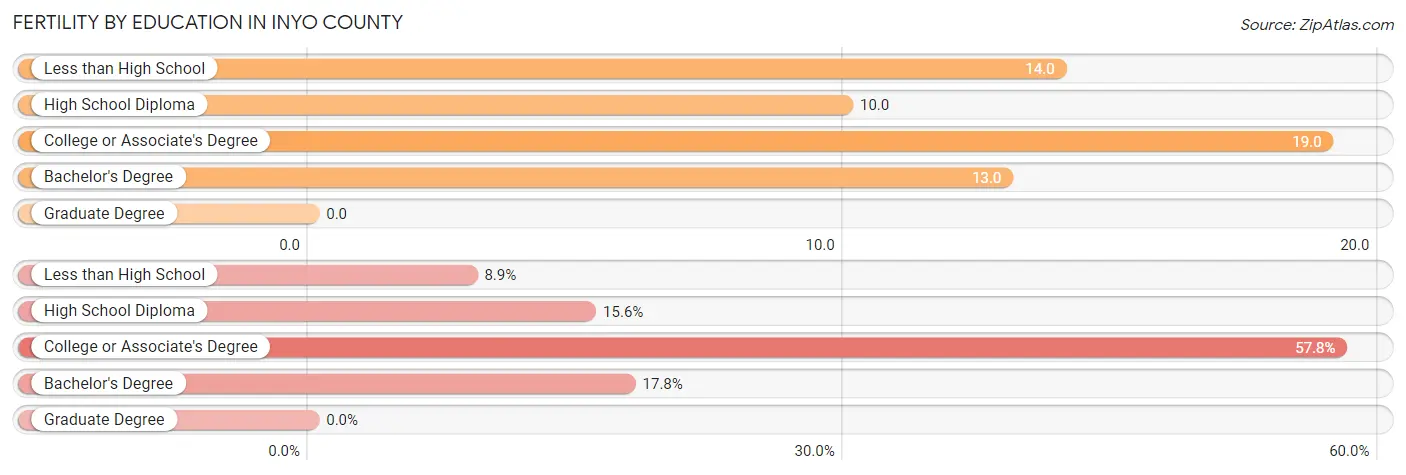
| Educational Attainment | Women with Births | Births / 1,000 Women |
| Less than High School | 4 (8.9%) | 14.0 |
| High School Diploma | 7 (15.6%) | 10.0 |
| College or Associate's Degree | 26 (57.8%) | 19.0 |
| Bachelor's Degree | 8 (17.8%) | 13.0 |
| Graduate Degree | 0 (0.0%) | 0.0 |
| Total | 45 (100.0%) | 13.0 |
Fertility by Education by Marriage Status in Inyo County
26.7% of women with births in Inyo County are unmarried. Women with the educational attainment of college or associate's degree are most likely to be married with 100.0% of them married at childbirth, while women with the educational attainment of less than high school are least likely to be married with 100.0% of them unmarried at childbirth.
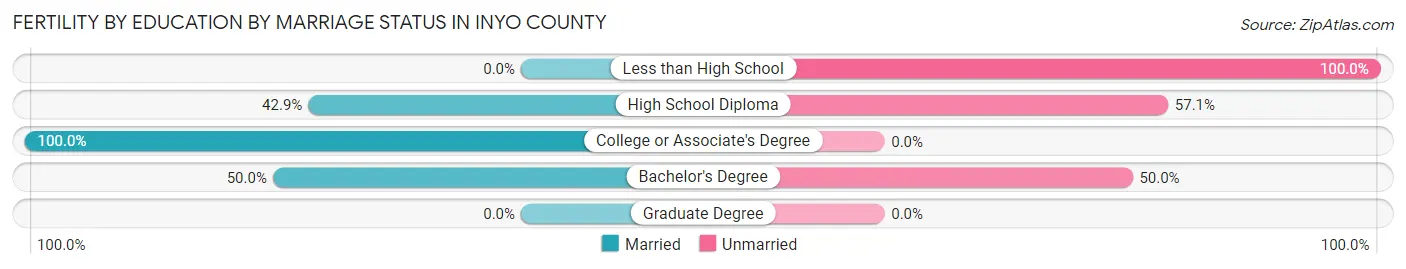
| Educational Attainment | Married | Unmarried |
| Less than High School | 0 (0.0%) | 4 (100.0%) |
| High School Diploma | 3 (42.9%) | 4 (57.1%) |
| College or Associate's Degree | 26 (100.0%) | 0 (0.0%) |
| Bachelor's Degree | 4 (50.0%) | 4 (50.0%) |
| Graduate Degree | 0 (0.0%) | 0 (0.0%) |
| Total | 33 (73.3%) | 12 (26.7%) |
Employment Characteristics in Inyo County
Employment by Class of Employer in Inyo County
Among the 8,094 employed individuals in Inyo County, private company employees (3,396 | 42.0%), local government employees (1,922 | 23.7%), and not-for-profit organizations (734 | 9.1%) make up the most common classes of employment.
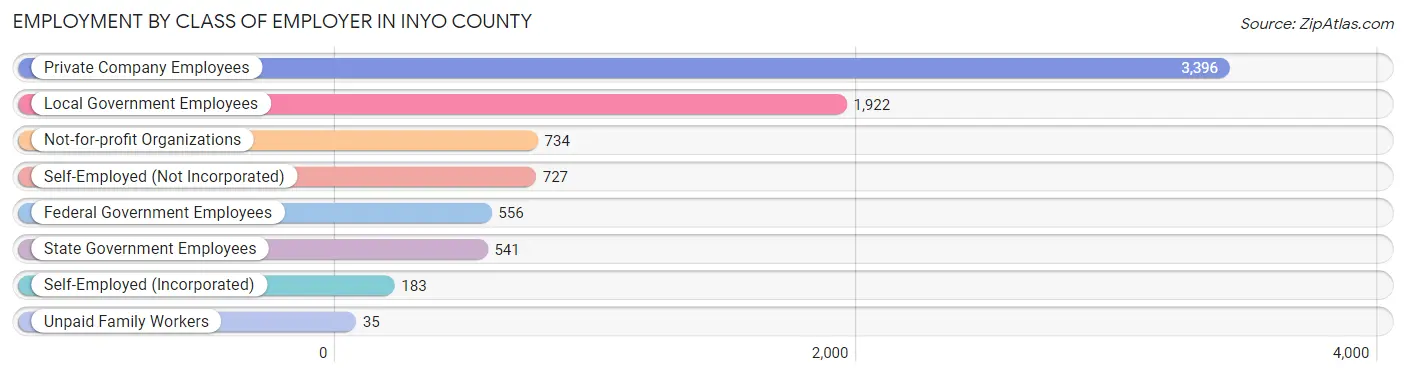
| Employer Class | # Employees | % Employees |
| Private Company Employees | 3,396 | 42.0% |
| Self-Employed (Incorporated) | 183 | 2.3% |
| Self-Employed (Not Incorporated) | 727 | 9.0% |
| Not-for-profit Organizations | 734 | 9.1% |
| Local Government Employees | 1,922 | 23.7% |
| State Government Employees | 541 | 6.7% |
| Federal Government Employees | 556 | 6.9% |
| Unpaid Family Workers | 35 | 0.4% |
| Total | 8,094 | 100.0% |
Employment Status by Age in Inyo County
According to the labor force statistics for Inyo County, out of the total population over 16 years of age (15,261), 57.1% or 8,714 individuals are in the labor force, with 4.9% or 427 of them unemployed. The age group with the highest labor force participation rate is 30 to 34 years, with 90.5% or 847 individuals in the labor force. Within the labor force, the 20 to 24 years age range has the highest percentage of unemployed individuals, with 19.3% or 127 of them being unemployed.
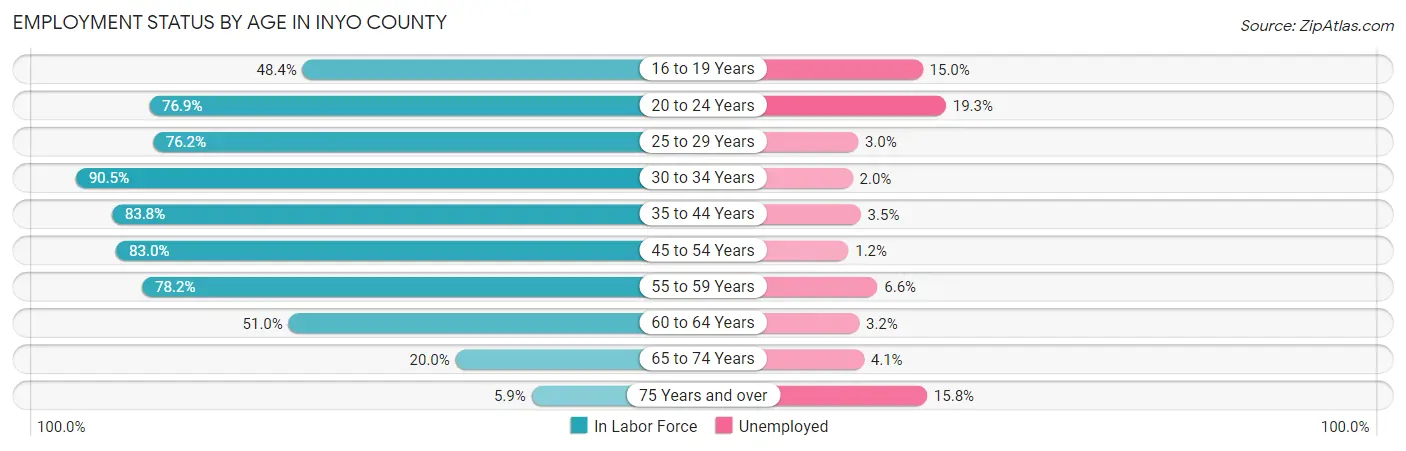
| Age Bracket | In Labor Force | Unemployed |
| 16 to 19 Years | 260 (48.4%) | 39 (15.0%) |
| 20 to 24 Years | 659 (76.9%) | 127 (19.3%) |
| 25 to 29 Years | 830 (76.2%) | 25 (3.0%) |
| 30 to 34 Years | 847 (90.5%) | 17 (2.0%) |
| 35 to 44 Years | 2,152 (83.8%) | 75 (3.5%) |
| 45 to 54 Years | 1,609 (83.0%) | 19 (1.2%) |
| 55 to 59 Years | 816 (78.2%) | 54 (6.6%) |
| 60 to 64 Years | 921 (51.0%) | 29 (3.2%) |
| 65 to 74 Years | 492 (20.0%) | 20 (4.1%) |
| 75 Years and over | 120 (5.9%) | 19 (15.8%) |
| Total | 8,714 (57.1%) | 427 (4.9%) |
Employment Status by Educational Attainment in Inyo County
According to labor force statistics for Inyo County, 76.5% of individuals (7,176) out of the total population between 25 and 64 years of age (9,380) are in the labor force, with 3.1% or 222 of them being unemployed. The group with the highest labor force participation rate are those with the educational attainment of bachelor's degree or higher, with 87.4% or 2,442 individuals in the labor force. Within the labor force, individuals with less than high school education have the highest percentage of unemployment, with 6.2% or 26 of them being unemployed.
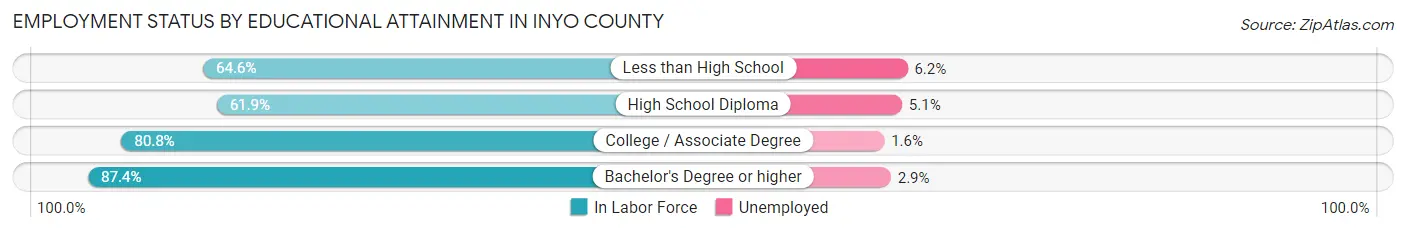
| Educational Attainment | In Labor Force | Unemployed |
| Less than High School | 422 (64.6%) | 40 (6.2%) |
| High School Diploma | 1,590 (61.9%) | 131 (5.1%) |
| College / Associate Degree | 2,719 (80.8%) | 54 (1.6%) |
| Bachelor's Degree or higher | 2,442 (87.4%) | 81 (2.9%) |
| Total | 7,176 (76.5%) | 291 (3.1%) |
Employment Occupations by Sex in Inyo County
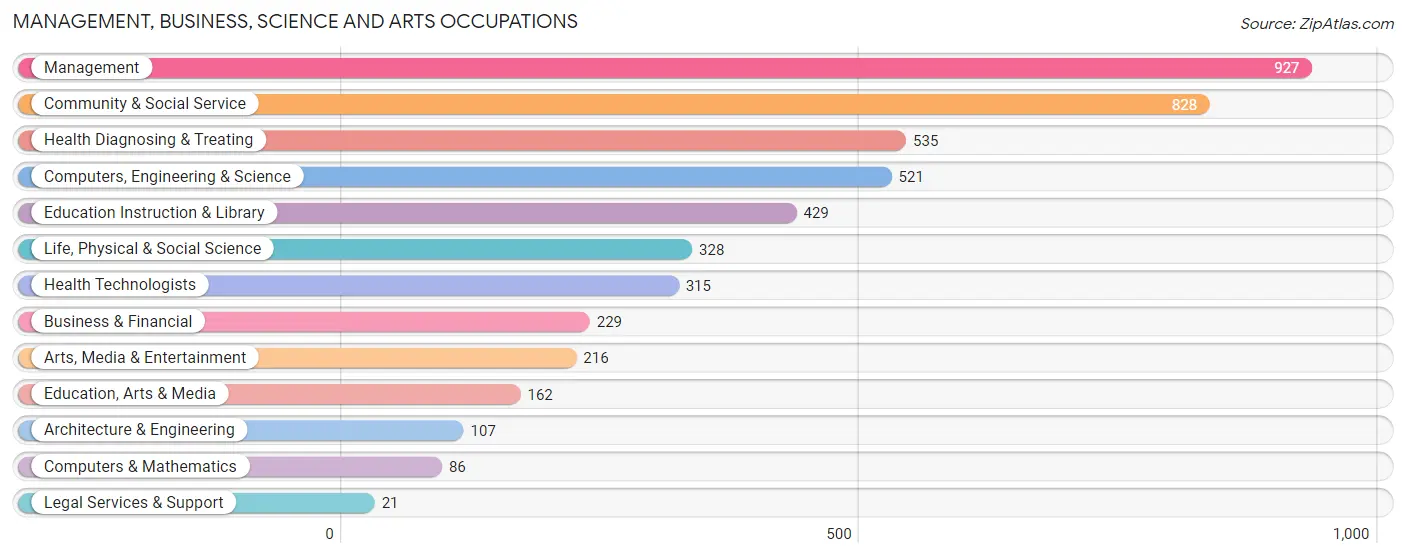
Management, Business, Science and Arts Occupations
The most common Management, Business, Science and Arts occupations in Inyo County are Management (927 | 11.2%), Community & Social Service (828 | 10.0%), Health Diagnosing & Treating (535 | 6.5%), Computers, Engineering & Science (521 | 6.3%), and Education Instruction & Library (429 | 5.2%).
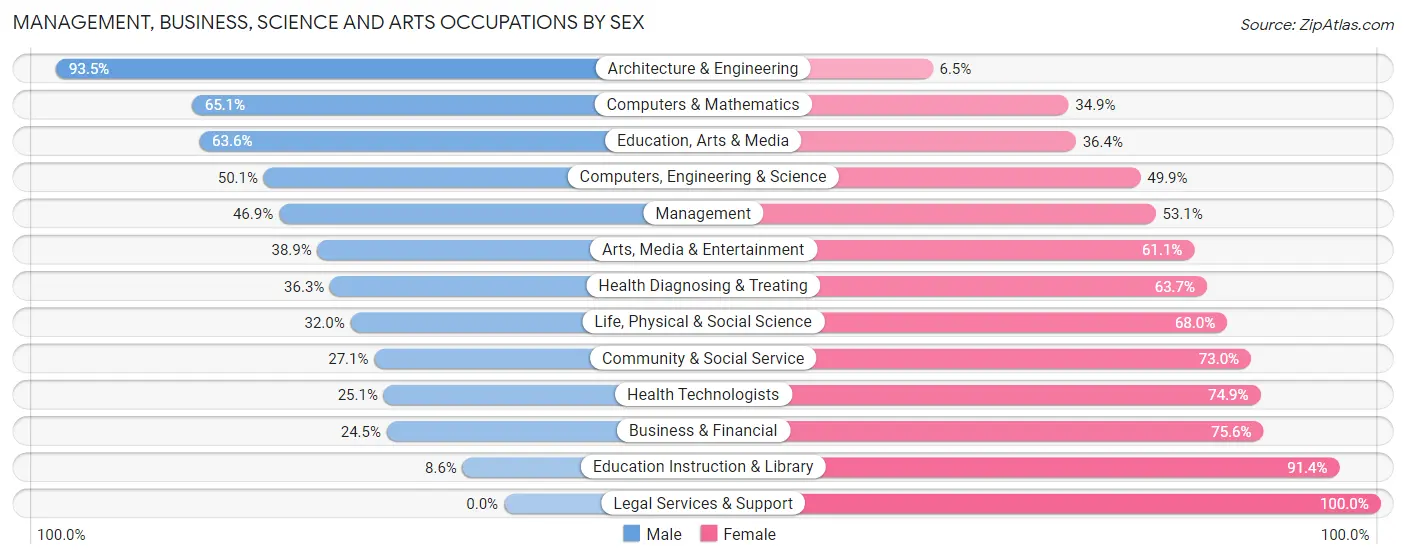
Management, Business, Science and Arts Occupations by Sex
Within the Management, Business, Science and Arts occupations in Inyo County, the most male-oriented occupations are Architecture & Engineering (93.5%), Computers & Mathematics (65.1%), and Education, Arts & Media (63.6%), while the most female-oriented occupations are Legal Services & Support (100.0%), Education Instruction & Library (91.4%), and Business & Financial (75.5%).
| Occupation | Male | Female |
| Management | 435 (46.9%) | 492 (53.1%) |
| Business & Financial | 56 (24.4%) | 173 (75.5%) |
| Computers, Engineering & Science | 261 (50.1%) | 260 (49.9%) |
| Computers & Mathematics | 56 (65.1%) | 30 (34.9%) |
| Architecture & Engineering | 100 (93.5%) | 7 (6.5%) |
| Life, Physical & Social Science | 105 (32.0%) | 223 (68.0%) |
| Community & Social Service | 224 (27.1%) | 604 (73.0%) |
| Education, Arts & Media | 103 (63.6%) | 59 (36.4%) |
| Legal Services & Support | 0 (0.0%) | 21 (100.0%) |
| Education Instruction & Library | 37 (8.6%) | 392 (91.4%) |
| Arts, Media & Entertainment | 84 (38.9%) | 132 (61.1%) |
| Health Diagnosing & Treating | 194 (36.3%) | 341 (63.7%) |
| Health Technologists | 79 (25.1%) | 236 (74.9%) |
| Total (Category) | 1,170 (38.5%) | 1,870 (61.5%) |
| Total (Overall) | 4,033 (48.7%) | 4,248 (51.3%) |
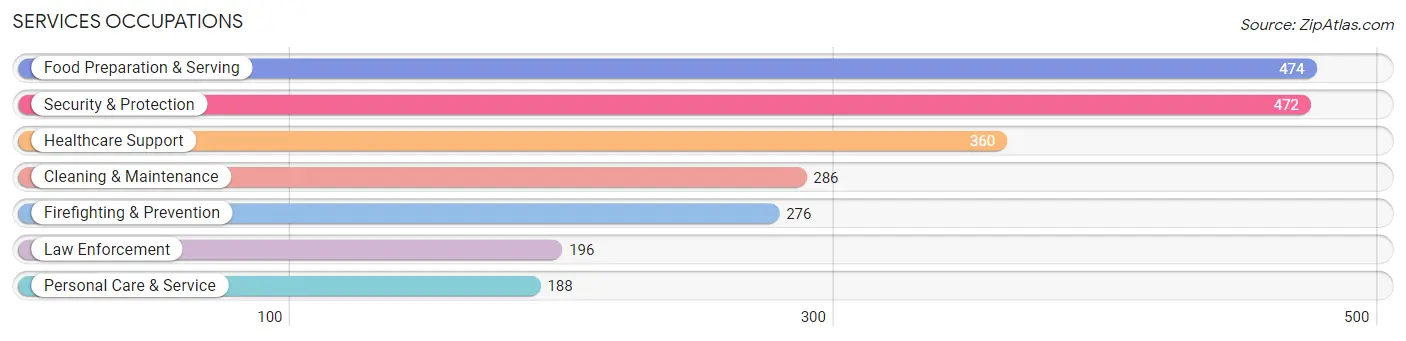
Services Occupations
The most common Services occupations in Inyo County are Food Preparation & Serving (474 | 5.7%), Security & Protection (472 | 5.7%), Healthcare Support (360 | 4.3%), Cleaning & Maintenance (286 | 3.5%), and Firefighting & Prevention (276 | 3.3%).
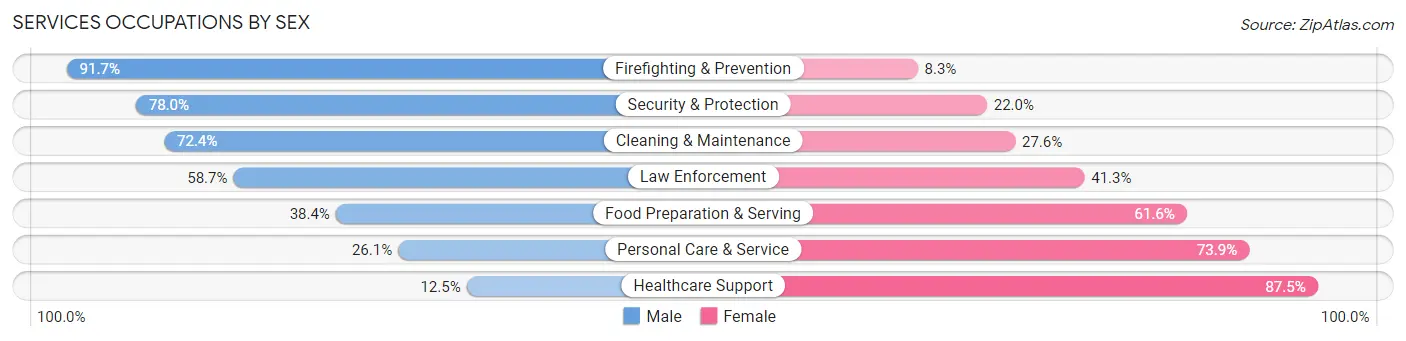
Services Occupations by Sex
Within the Services occupations in Inyo County, the most male-oriented occupations are Firefighting & Prevention (91.7%), Security & Protection (78.0%), and Cleaning & Maintenance (72.4%), while the most female-oriented occupations are Healthcare Support (87.5%), Personal Care & Service (73.9%), and Food Preparation & Serving (61.6%).
| Occupation | Male | Female |
| Healthcare Support | 45 (12.5%) | 315 (87.5%) |
| Security & Protection | 368 (78.0%) | 104 (22.0%) |
| Firefighting & Prevention | 253 (91.7%) | 23 (8.3%) |
| Law Enforcement | 115 (58.7%) | 81 (41.3%) |
| Food Preparation & Serving | 182 (38.4%) | 292 (61.6%) |
| Cleaning & Maintenance | 207 (72.4%) | 79 (27.6%) |
| Personal Care & Service | 49 (26.1%) | 139 (73.9%) |
| Total (Category) | 851 (47.8%) | 929 (52.2%) |
| Total (Overall) | 4,033 (48.7%) | 4,248 (51.3%) |
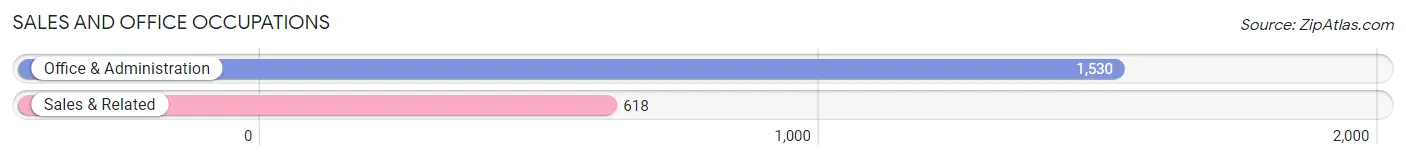
Sales and Office Occupations
The most common Sales and Office occupations in Inyo County are Office & Administration (1,530 | 18.5%), and Sales & Related (618 | 7.5%).
Sales and Office Occupations by Sex
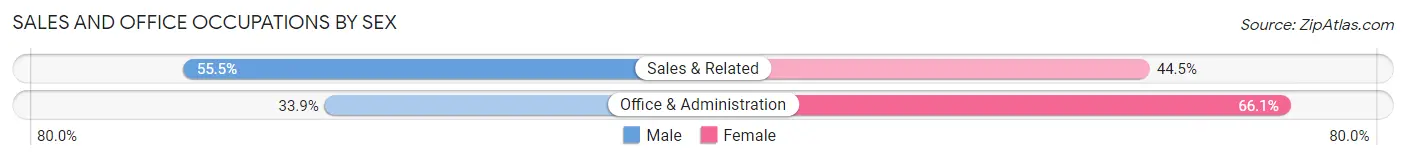
| Occupation | Male | Female |
| Sales & Related | 343 (55.5%) | 275 (44.5%) |
| Office & Administration | 518 (33.9%) | 1,012 (66.1%) |
| Total (Category) | 861 (40.1%) | 1,287 (59.9%) |
| Total (Overall) | 4,033 (48.7%) | 4,248 (51.3%) |
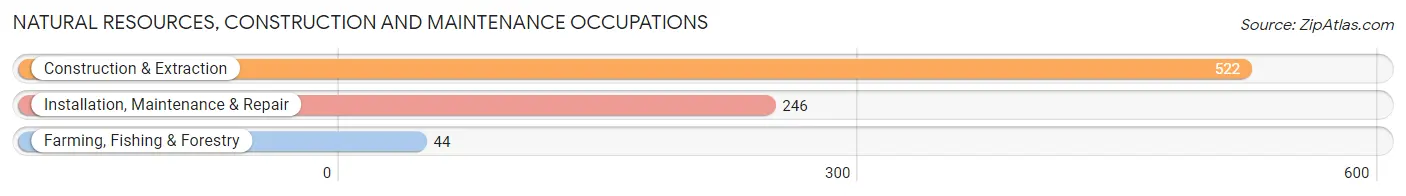
Natural Resources, Construction and Maintenance Occupations
The most common Natural Resources, Construction and Maintenance occupations in Inyo County are Construction & Extraction (522 | 6.3%), Installation, Maintenance & Repair (246 | 3.0%), and Farming, Fishing & Forestry (44 | 0.5%).
Natural Resources, Construction and Maintenance Occupations by Sex
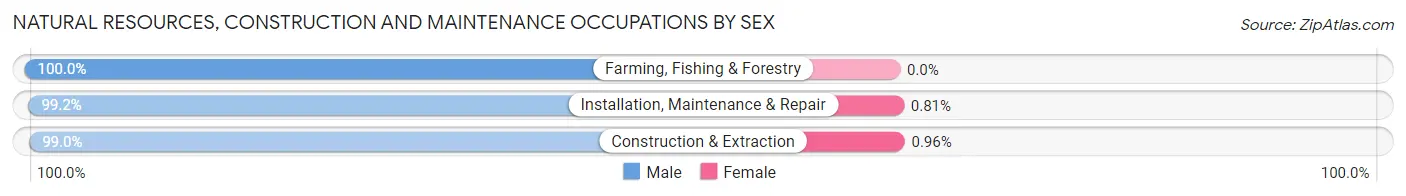
| Occupation | Male | Female |
| Farming, Fishing & Forestry | 44 (100.0%) | 0 (0.0%) |
| Construction & Extraction | 517 (99.0%) | 5 (1.0%) |
| Installation, Maintenance & Repair | 244 (99.2%) | 2 (0.8%) |
| Total (Category) | 805 (99.1%) | 7 (0.9%) |
| Total (Overall) | 4,033 (48.7%) | 4,248 (51.3%) |
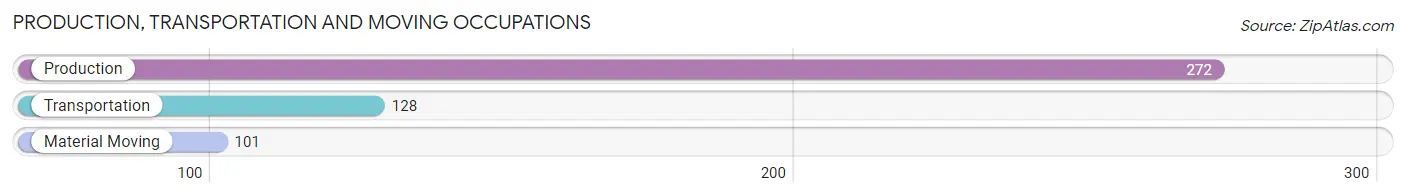
Production, Transportation and Moving Occupations
The most common Production, Transportation and Moving occupations in Inyo County are Production (272 | 3.3%), Transportation (128 | 1.5%), and Material Moving (101 | 1.2%).
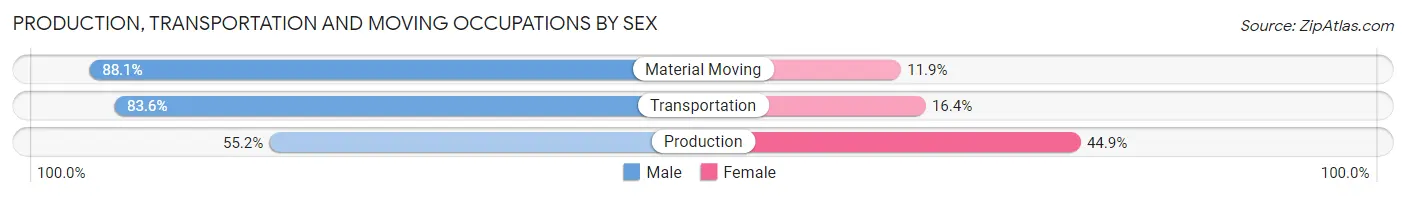
Production, Transportation and Moving Occupations by Sex
| Occupation | Male | Female |
| Production | 150 (55.1%) | 122 (44.9%) |
| Transportation | 107 (83.6%) | 21 (16.4%) |
| Material Moving | 89 (88.1%) | 12 (11.9%) |
| Total (Category) | 346 (69.1%) | 155 (30.9%) |
| Total (Overall) | 4,033 (48.7%) | 4,248 (51.3%) |
Employment Industries by Sex in Inyo County
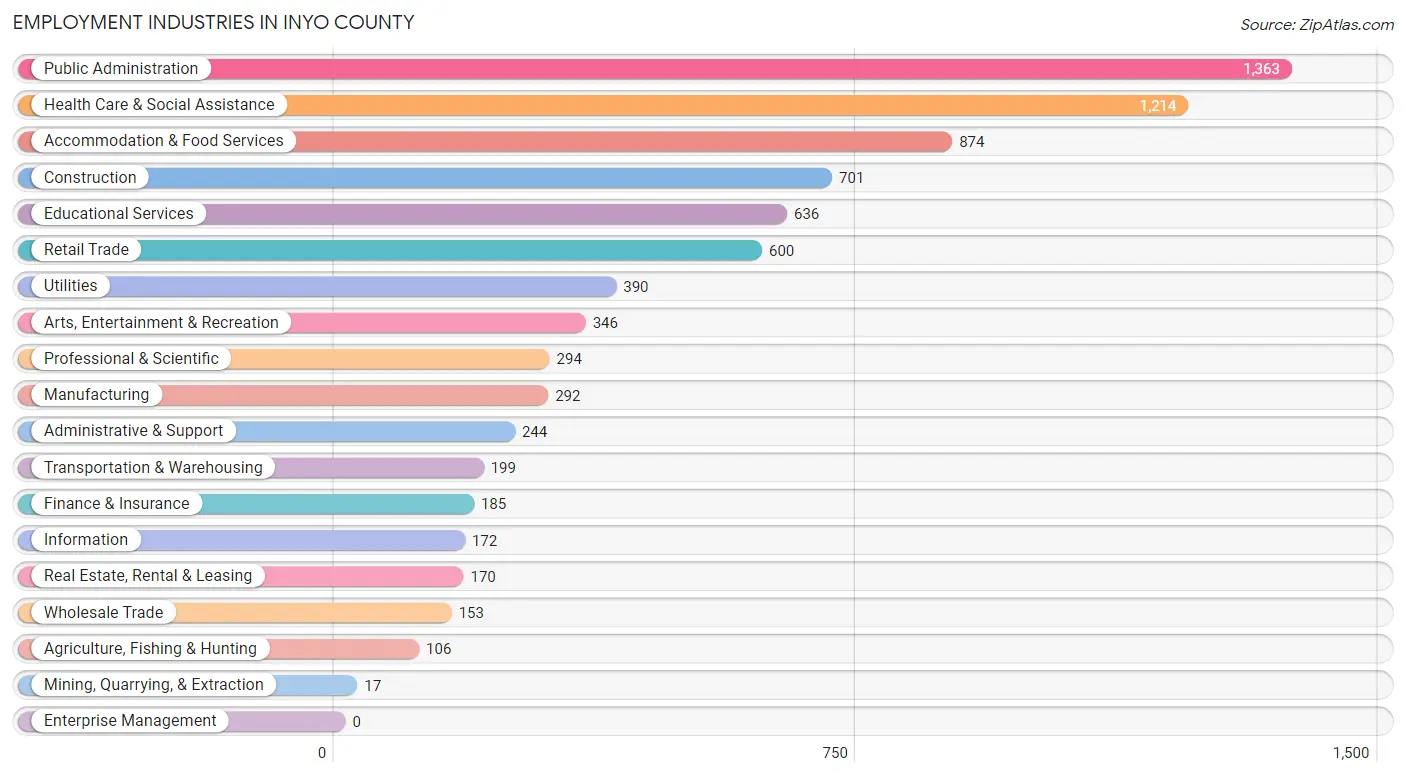
Employment Industries in Inyo County
The major employment industries in Inyo County include Public Administration (1,363 | 16.5%), Health Care & Social Assistance (1,214 | 14.7%), Accommodation & Food Services (874 | 10.5%), Construction (701 | 8.5%), and Educational Services (636 | 7.7%).
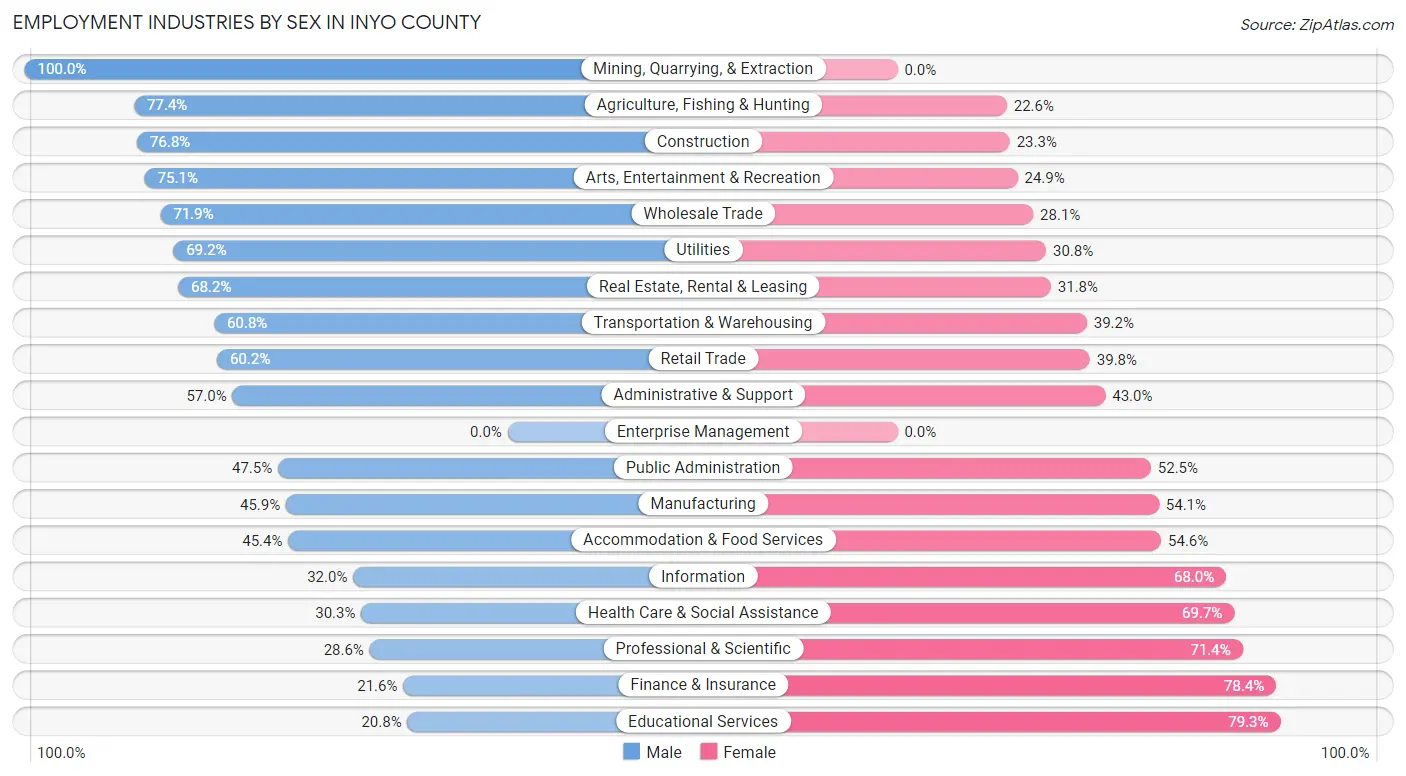
Employment Industries by Sex in Inyo County
The Inyo County industries that see more men than women are Mining, Quarrying, & Extraction (100.0%), Agriculture, Fishing & Hunting (77.4%), and Construction (76.7%), whereas the industries that tend to have a higher number of women are Educational Services (79.2%), Finance & Insurance (78.4%), and Professional & Scientific (71.4%).
| Industry | Male | Female |
| Agriculture, Fishing & Hunting | 82 (77.4%) | 24 (22.6%) |
| Mining, Quarrying, & Extraction | 17 (100.0%) | 0 (0.0%) |
| Construction | 538 (76.7%) | 163 (23.3%) |
| Manufacturing | 134 (45.9%) | 158 (54.1%) |
| Wholesale Trade | 110 (71.9%) | 43 (28.1%) |
| Retail Trade | 361 (60.2%) | 239 (39.8%) |
| Transportation & Warehousing | 121 (60.8%) | 78 (39.2%) |
| Utilities | 270 (69.2%) | 120 (30.8%) |
| Information | 55 (32.0%) | 117 (68.0%) |
| Finance & Insurance | 40 (21.6%) | 145 (78.4%) |
| Real Estate, Rental & Leasing | 116 (68.2%) | 54 (31.8%) |
| Professional & Scientific | 84 (28.6%) | 210 (71.4%) |
| Enterprise Management | 0 (0.0%) | 0 (0.0%) |
| Administrative & Support | 139 (57.0%) | 105 (43.0%) |
| Educational Services | 132 (20.7%) | 504 (79.2%) |
| Health Care & Social Assistance | 368 (30.3%) | 846 (69.7%) |
| Arts, Entertainment & Recreation | 260 (75.1%) | 86 (24.9%) |
| Accommodation & Food Services | 397 (45.4%) | 477 (54.6%) |
| Public Administration | 648 (47.5%) | 715 (52.5%) |
| Total | 4,033 (48.7%) | 4,248 (51.3%) |
Education in Inyo County
School Enrollment in Inyo County
The most common levels of schooling among the 3,730 students in Inyo County are elementary school (976 | 26.2%), middle school (950 | 25.5%), and high school (781 | 20.9%).
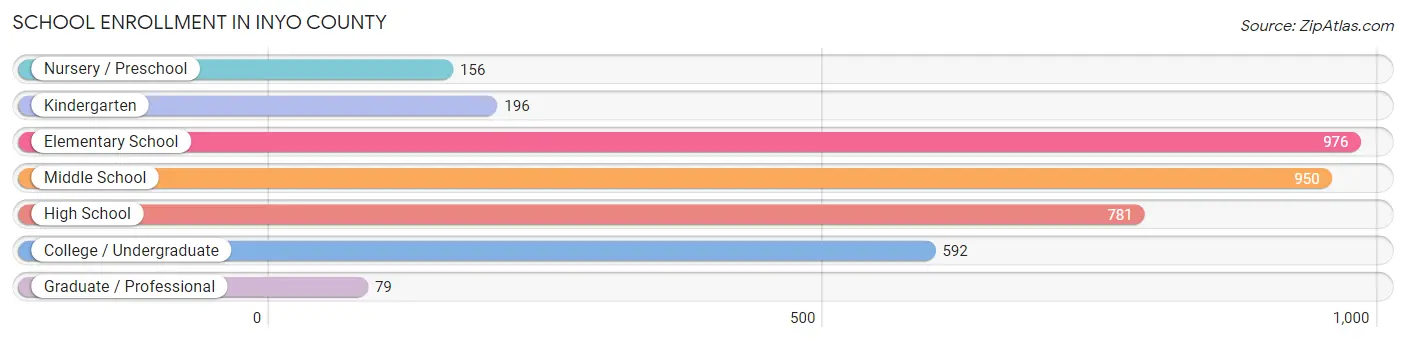
| School Level | # Students | % Students |
| Nursery / Preschool | 156 | 4.2% |
| Kindergarten | 196 | 5.2% |
| Elementary School | 976 | 26.2% |
| Middle School | 950 | 25.5% |
| High School | 781 | 20.9% |
| College / Undergraduate | 592 | 15.9% |
| Graduate / Professional | 79 | 2.1% |
| Total | 3,730 | 100.0% |
School Enrollment by Age by Funding Source in Inyo County
Out of a total of 3,730 students who are enrolled in schools in Inyo County, 526 (14.1%) attend a private institution, while the remaining 3,204 (85.9%) are enrolled in public schools. The age group of 3 to 4 year olds has the highest likelihood of being enrolled in private schools, with 52 (33.8% in the age bracket) enrolled. Conversely, the age group of 15 to 17 year olds has the lowest likelihood of being enrolled in a private school, with 562 (100.0% in the age bracket) attending a public institution.
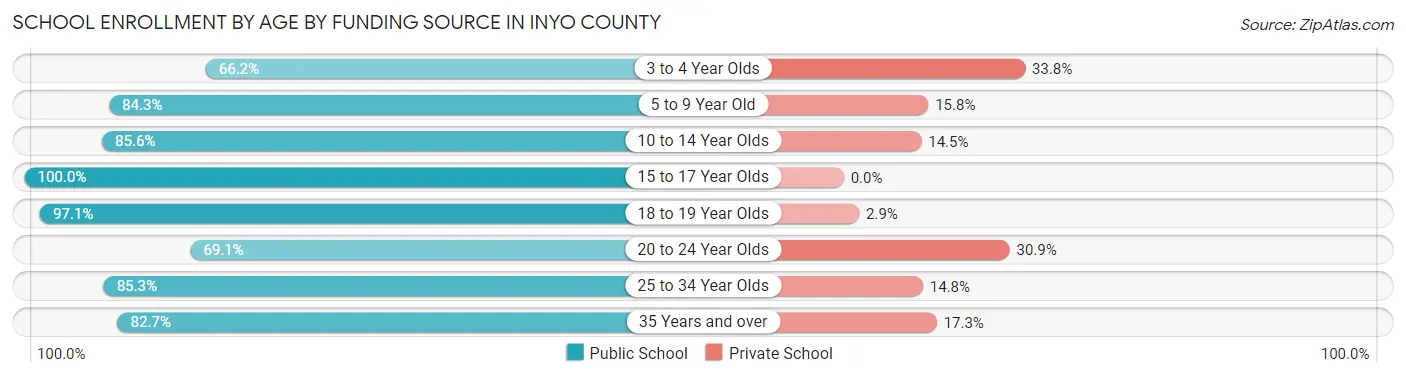
| Age Bracket | Public School | Private School |
| 3 to 4 Year Olds | 102 (66.2%) | 52 (33.8%) |
| 5 to 9 Year Old | 931 (84.3%) | 174 (15.8%) |
| 10 to 14 Year Olds | 971 (85.6%) | 164 (14.4%) |
| 15 to 17 Year Olds | 562 (100.0%) | 0 (0.0%) |
| 18 to 19 Year Olds | 169 (97.1%) | 5 (2.9%) |
| 20 to 24 Year Olds | 161 (69.1%) | 72 (30.9%) |
| 25 to 34 Year Olds | 185 (85.3%) | 32 (14.7%) |
| 35 Years and over | 124 (82.7%) | 26 (17.3%) |
| Total | 3,204 (85.9%) | 526 (14.1%) |
Educational Attainment by Field of Study in Inyo County
Social sciences (711 | 16.0%), bio, nature & agricultural (608 | 13.7%), science & technology (474 | 10.7%), business (454 | 10.2%), and literature & languages (396 | 8.9%) are the most common fields of study among 4,441 individuals in Inyo County who have obtained a bachelor's degree or higher.
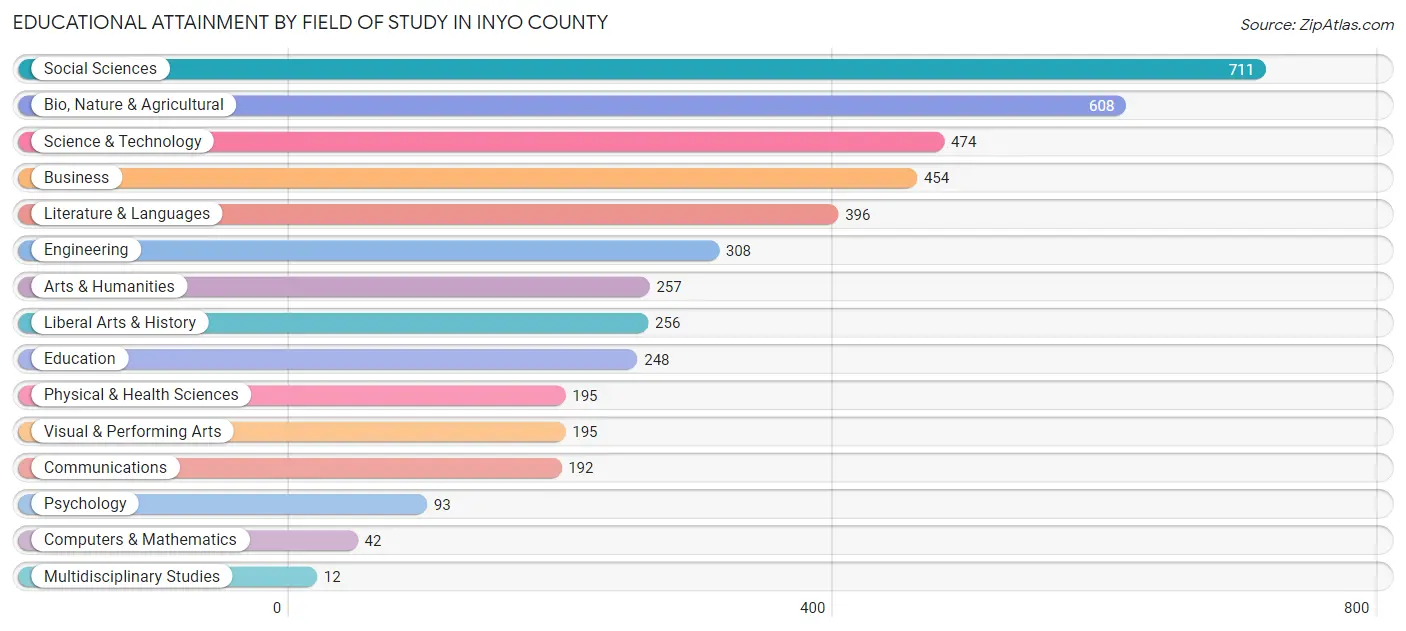
| Field of Study | # Graduates | % Graduates |
| Computers & Mathematics | 42 | 0.9% |
| Bio, Nature & Agricultural | 608 | 13.7% |
| Physical & Health Sciences | 195 | 4.4% |
| Psychology | 93 | 2.1% |
| Social Sciences | 711 | 16.0% |
| Engineering | 308 | 6.9% |
| Multidisciplinary Studies | 12 | 0.3% |
| Science & Technology | 474 | 10.7% |
| Business | 454 | 10.2% |
| Education | 248 | 5.6% |
| Literature & Languages | 396 | 8.9% |
| Liberal Arts & History | 256 | 5.8% |
| Visual & Performing Arts | 195 | 4.4% |
| Communications | 192 | 4.3% |
| Arts & Humanities | 257 | 5.8% |
| Total | 4,441 | 100.0% |
Transportation & Commute in Inyo County
Vehicle Availability by Sex in Inyo County
The most prevalent vehicle ownership categories in Inyo County are males with 2 vehicles (1,183, accounting for 31.6%) and females with 2 vehicles (1,199, making up 28.6%).
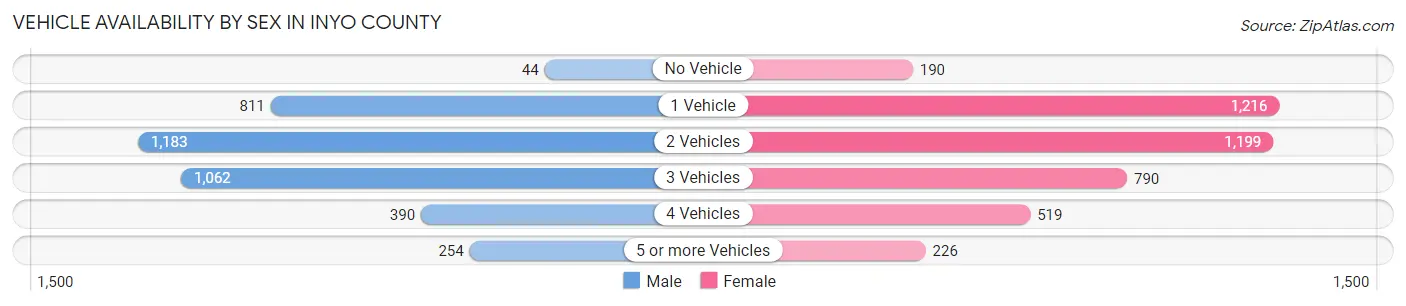
| Vehicles Available | Male | Female |
| No Vehicle | 44 (1.2%) | 190 (4.6%) |
| 1 Vehicle | 811 (21.7%) | 1,216 (29.4%) |
| 2 Vehicles | 1,183 (31.6%) | 1,199 (29.0%) |
| 3 Vehicles | 1,062 (28.4%) | 790 (19.1%) |
| 4 Vehicles | 390 (10.4%) | 519 (12.5%) |
| 5 or more Vehicles | 254 (6.8%) | 226 (5.5%) |
| Total | 3,744 (100.0%) | 4,140 (100.0%) |
Commute Time in Inyo County
The most frequently occuring commute durations in Inyo County are 5 to 9 minutes (2,027 commuters, 27.8%), 10 to 14 minutes (1,251 commuters, 17.1%), and less than 5 minutes (1,190 commuters, 16.3%).
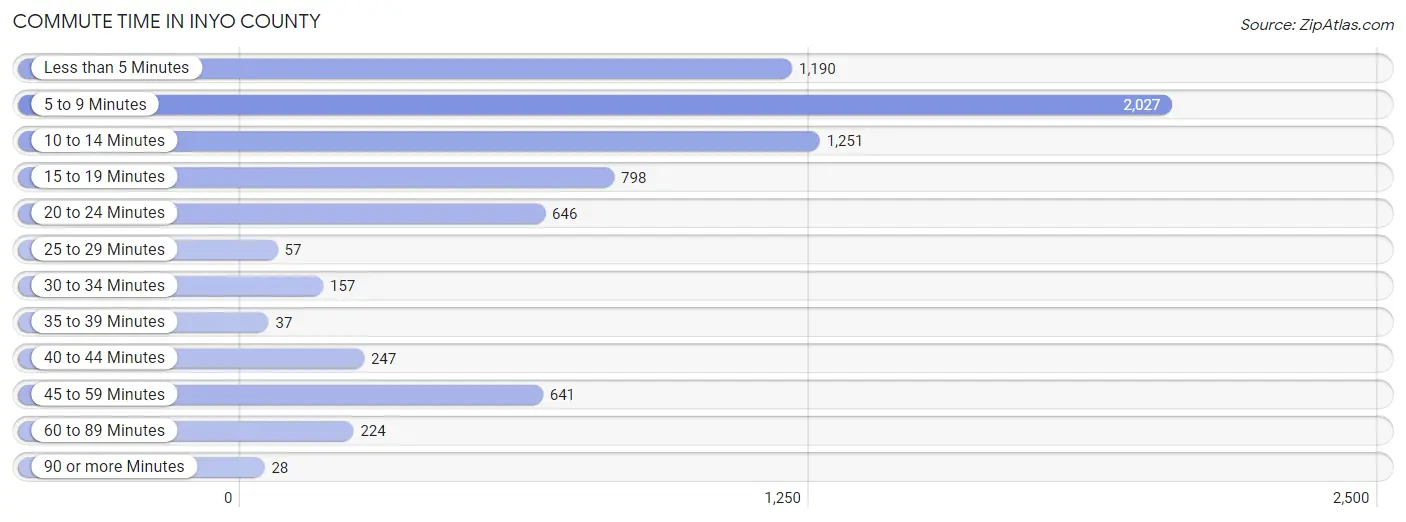
| Commute Time | # Commuters | % Commuters |
| Less than 5 Minutes | 1,190 | 16.3% |
| 5 to 9 Minutes | 2,027 | 27.8% |
| 10 to 14 Minutes | 1,251 | 17.1% |
| 15 to 19 Minutes | 798 | 10.9% |
| 20 to 24 Minutes | 646 | 8.8% |
| 25 to 29 Minutes | 57 | 0.8% |
| 30 to 34 Minutes | 157 | 2.1% |
| 35 to 39 Minutes | 37 | 0.5% |
| 40 to 44 Minutes | 247 | 3.4% |
| 45 to 59 Minutes | 641 | 8.8% |
| 60 to 89 Minutes | 224 | 3.1% |
| 90 or more Minutes | 28 | 0.4% |
Commute Time by Sex in Inyo County
The most common commute times in Inyo County are 5 to 9 minutes (872 commuters, 25.0%) for males and 5 to 9 minutes (1,155 commuters, 30.2%) for females.
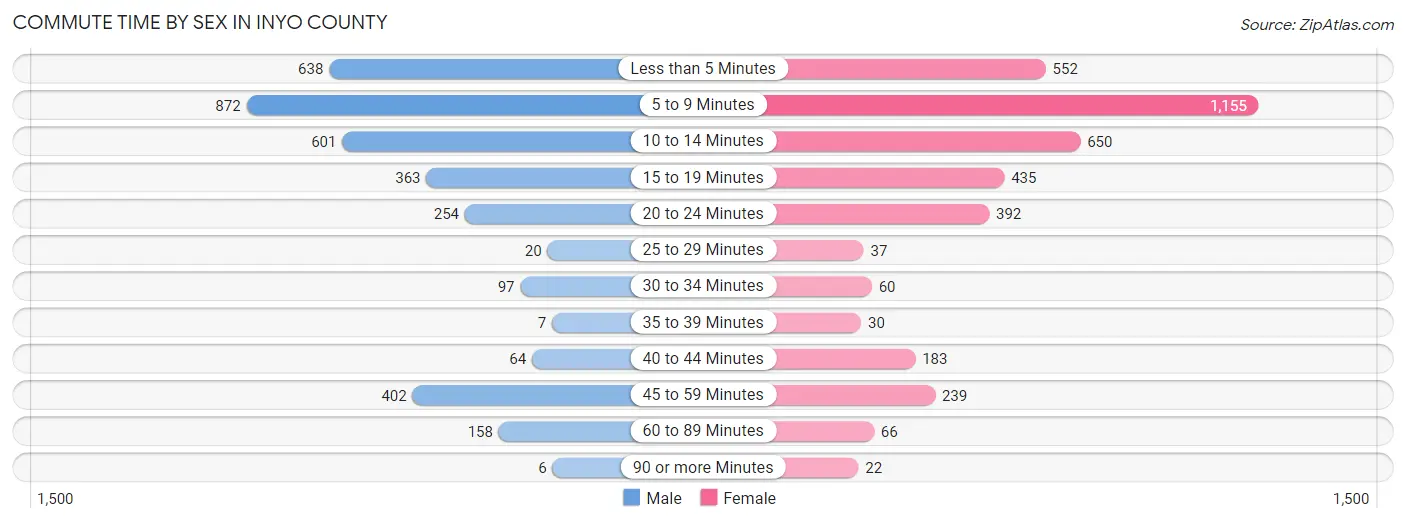
| Commute Time | Male | Female |
| Less than 5 Minutes | 638 (18.3%) | 552 (14.4%) |
| 5 to 9 Minutes | 872 (25.0%) | 1,155 (30.2%) |
| 10 to 14 Minutes | 601 (17.3%) | 650 (17.0%) |
| 15 to 19 Minutes | 363 (10.4%) | 435 (11.4%) |
| 20 to 24 Minutes | 254 (7.3%) | 392 (10.3%) |
| 25 to 29 Minutes | 20 (0.6%) | 37 (1.0%) |
| 30 to 34 Minutes | 97 (2.8%) | 60 (1.6%) |
| 35 to 39 Minutes | 7 (0.2%) | 30 (0.8%) |
| 40 to 44 Minutes | 64 (1.8%) | 183 (4.8%) |
| 45 to 59 Minutes | 402 (11.6%) | 239 (6.2%) |
| 60 to 89 Minutes | 158 (4.5%) | 66 (1.7%) |
| 90 or more Minutes | 6 (0.2%) | 22 (0.6%) |
Time of Departure to Work by Sex in Inyo County
The most frequent times of departure to work in Inyo County are 7:30 AM to 7:59 AM (569, 16.3%) for males and 7:30 AM to 7:59 AM (932, 24.4%) for females.
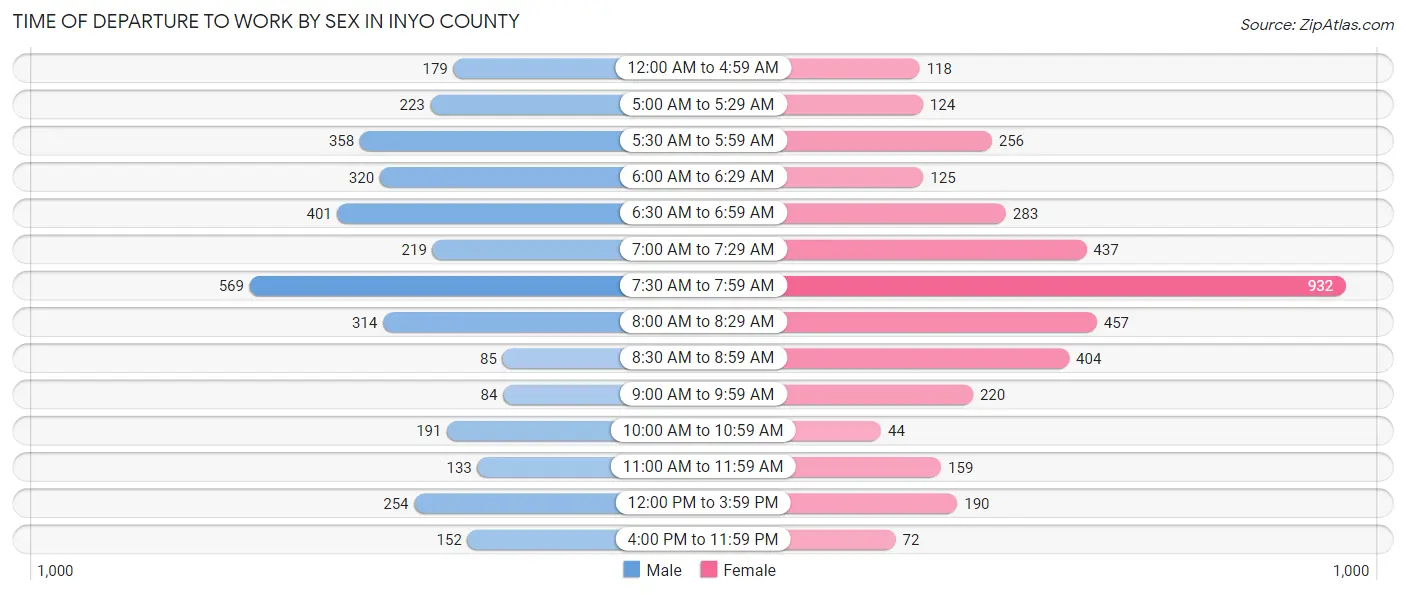
| Time of Departure | Male | Female |
| 12:00 AM to 4:59 AM | 179 (5.1%) | 118 (3.1%) |
| 5:00 AM to 5:29 AM | 223 (6.4%) | 124 (3.3%) |
| 5:30 AM to 5:59 AM | 358 (10.3%) | 256 (6.7%) |
| 6:00 AM to 6:29 AM | 320 (9.2%) | 125 (3.3%) |
| 6:30 AM to 6:59 AM | 401 (11.5%) | 283 (7.4%) |
| 7:00 AM to 7:29 AM | 219 (6.3%) | 437 (11.4%) |
| 7:30 AM to 7:59 AM | 569 (16.3%) | 932 (24.4%) |
| 8:00 AM to 8:29 AM | 314 (9.0%) | 457 (12.0%) |
| 8:30 AM to 8:59 AM | 85 (2.4%) | 404 (10.6%) |
| 9:00 AM to 9:59 AM | 84 (2.4%) | 220 (5.8%) |
| 10:00 AM to 10:59 AM | 191 (5.5%) | 44 (1.1%) |
| 11:00 AM to 11:59 AM | 133 (3.8%) | 159 (4.2%) |
| 12:00 PM to 3:59 PM | 254 (7.3%) | 190 (5.0%) |
| 4:00 PM to 11:59 PM | 152 (4.4%) | 72 (1.9%) |
| Total | 3,482 (100.0%) | 3,821 (100.0%) |
Housing Occupancy in Inyo County
Occupancy by Ownership in Inyo County
Of the total 7,849 dwellings in Inyo County, owner-occupied units account for 5,178 (66.0%), while renter-occupied units make up 2,671 (34.0%).
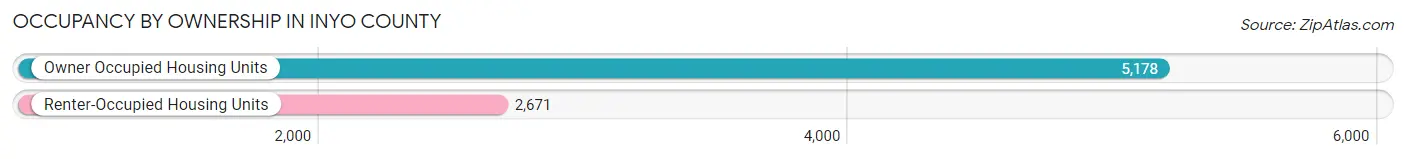
| Occupancy | # Housing Units | % Housing Units |
| Owner Occupied Housing Units | 5,178 | 66.0% |
| Renter-Occupied Housing Units | 2,671 | 34.0% |
| Total Occupied Housing Units | 7,849 | 100.0% |
Occupancy by Household Size in Inyo County
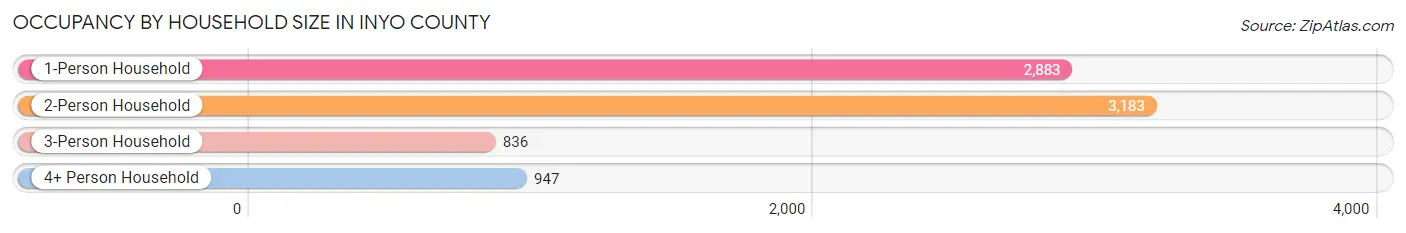
| Household Size | # Housing Units | % Housing Units |
| 1-Person Household | 2,883 | 36.7% |
| 2-Person Household | 3,183 | 40.6% |
| 3-Person Household | 836 | 10.6% |
| 4+ Person Household | 947 | 12.1% |
| Total Housing Units | 7,849 | 100.0% |
Occupancy by Ownership by Household Size in Inyo County
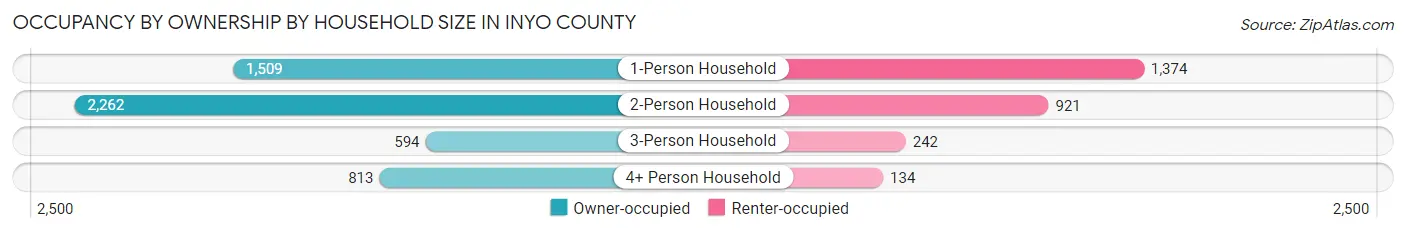
| Household Size | Owner-occupied | Renter-occupied |
| 1-Person Household | 1,509 (52.3%) | 1,374 (47.7%) |
| 2-Person Household | 2,262 (71.1%) | 921 (28.9%) |
| 3-Person Household | 594 (71.1%) | 242 (28.9%) |
| 4+ Person Household | 813 (85.9%) | 134 (14.1%) |
| Total Housing Units | 5,178 (66.0%) | 2,671 (34.0%) |
Occupancy by Educational Attainment in Inyo County
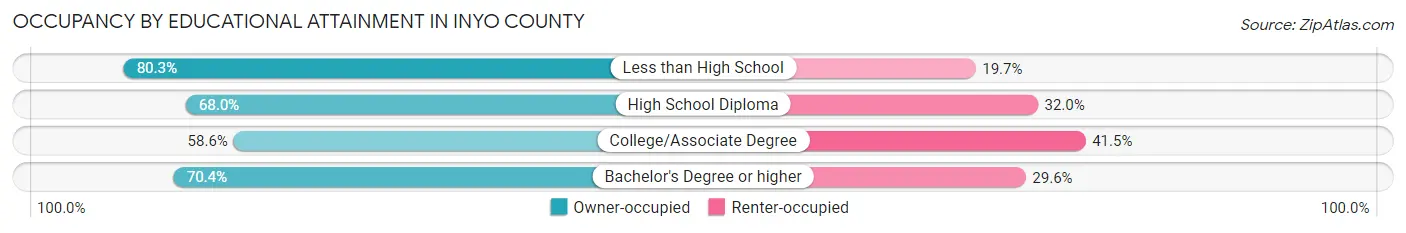
| Household Size | Owner-occupied | Renter-occupied |
| Less than High School | 335 (80.3%) | 82 (19.7%) |
| High School Diploma | 1,301 (68.0%) | 612 (32.0%) |
| College/Associate Degree | 1,698 (58.6%) | 1,202 (41.4%) |
| Bachelor's Degree or higher | 1,844 (70.4%) | 775 (29.6%) |
Occupancy by Age of Householder in Inyo County
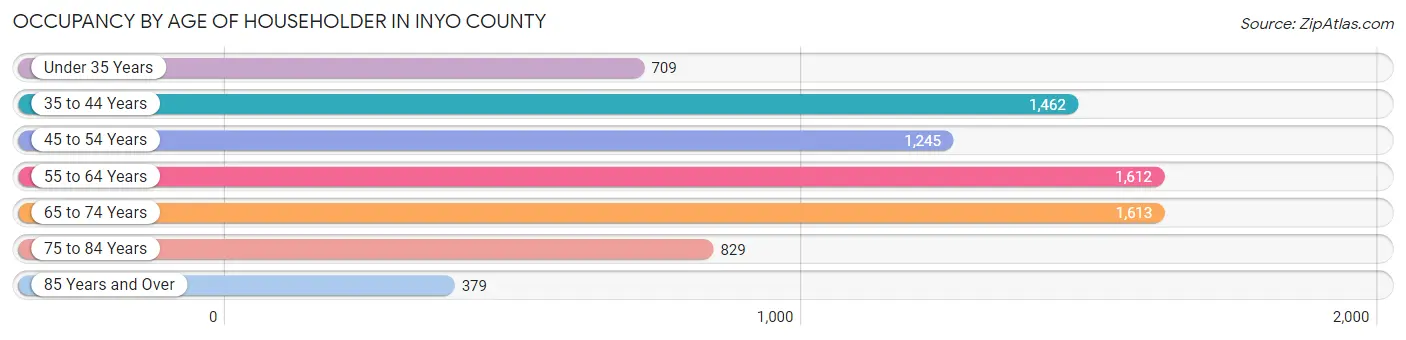
| Age Bracket | # Households | % Households |
| Under 35 Years | 709 | 9.0% |
| 35 to 44 Years | 1,462 | 18.6% |
| 45 to 54 Years | 1,245 | 15.9% |
| 55 to 64 Years | 1,612 | 20.5% |
| 65 to 74 Years | 1,613 | 20.5% |
| 75 to 84 Years | 829 | 10.6% |
| 85 Years and Over | 379 | 4.8% |
| Total | 7,849 | 100.0% |
Housing Finances in Inyo County
Median Income by Occupancy in Inyo County
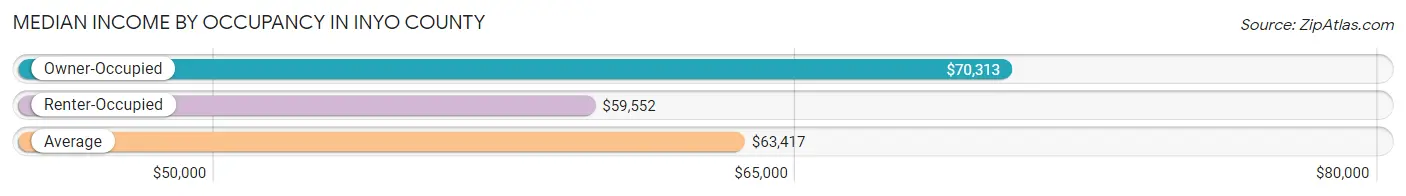
| Occupancy Type | # Households | Median Income |
| Owner-Occupied | 5,178 (66.0%) | $70,313 |
| Renter-Occupied | 2,671 (34.0%) | $59,552 |
| Average | 7,849 (100.0%) | $63,417 |
Occupancy by Householder Income Bracket in Inyo County
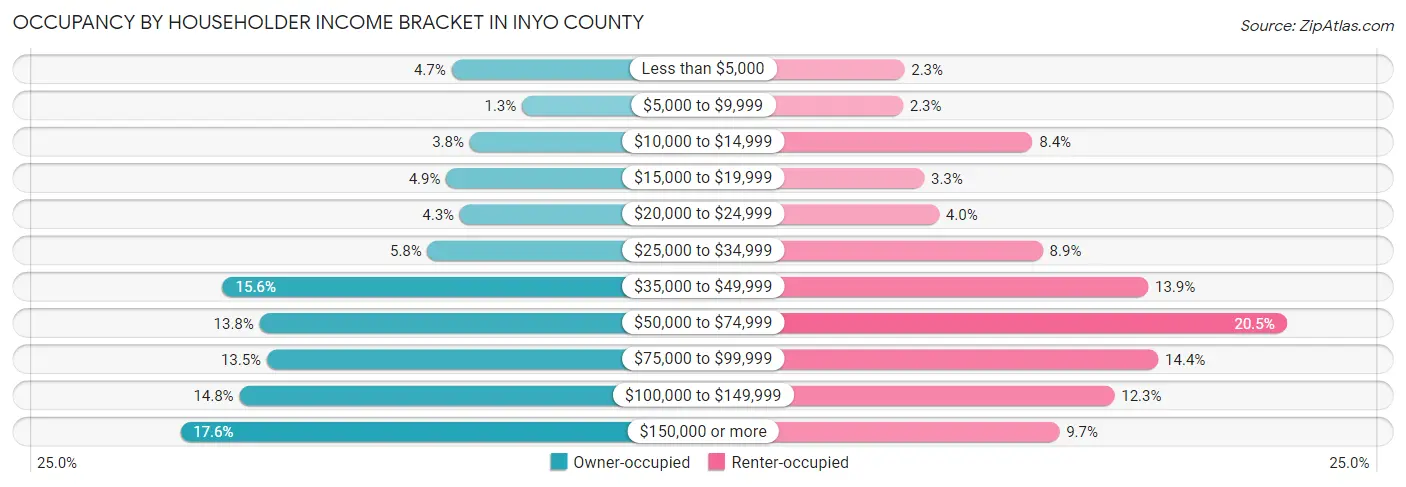
| Income Bracket | Owner-occupied | Renter-occupied |
| Less than $5,000 | 242 (4.7%) | 62 (2.3%) |
| $5,000 to $9,999 | 68 (1.3%) | 60 (2.2%) |
| $10,000 to $14,999 | 197 (3.8%) | 225 (8.4%) |
| $15,000 to $19,999 | 255 (4.9%) | 87 (3.3%) |
| $20,000 to $24,999 | 221 (4.3%) | 106 (4.0%) |
| $25,000 to $34,999 | 301 (5.8%) | 238 (8.9%) |
| $35,000 to $49,999 | 806 (15.6%) | 372 (13.9%) |
| $50,000 to $74,999 | 715 (13.8%) | 548 (20.5%) |
| $75,000 to $99,999 | 697 (13.5%) | 385 (14.4%) |
| $100,000 to $149,999 | 765 (14.8%) | 329 (12.3%) |
| $150,000 or more | 911 (17.6%) | 259 (9.7%) |
| Total | 5,178 (100.0%) | 2,671 (100.0%) |
Monthly Housing Cost Tiers in Inyo County
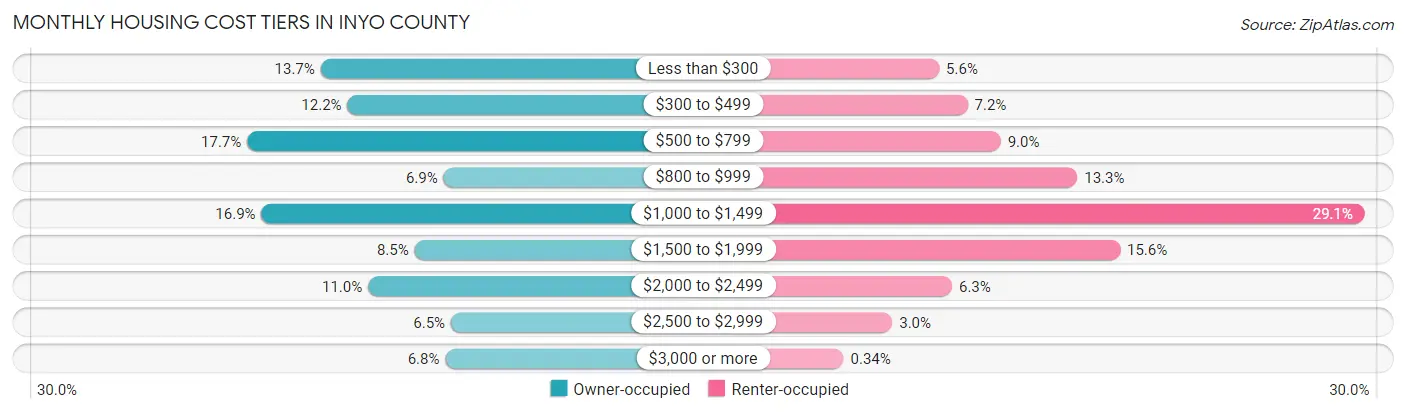
| Monthly Cost | Owner-occupied | Renter-occupied |
| Less than $300 | 707 (13.7%) | 150 (5.6%) |
| $300 to $499 | 630 (12.2%) | 192 (7.2%) |
| $500 to $799 | 917 (17.7%) | 241 (9.0%) |
| $800 to $999 | 355 (6.9%) | 354 (13.3%) |
| $1,000 to $1,499 | 876 (16.9%) | 778 (29.1%) |
| $1,500 to $1,999 | 438 (8.5%) | 417 (15.6%) |
| $2,000 to $2,499 | 571 (11.0%) | 169 (6.3%) |
| $2,500 to $2,999 | 334 (6.5%) | 81 (3.0%) |
| $3,000 or more | 350 (6.8%) | 9 (0.3%) |
| Total | 5,178 (100.0%) | 2,671 (100.0%) |
Physical Housing Characteristics in Inyo County
Housing Structures in Inyo County
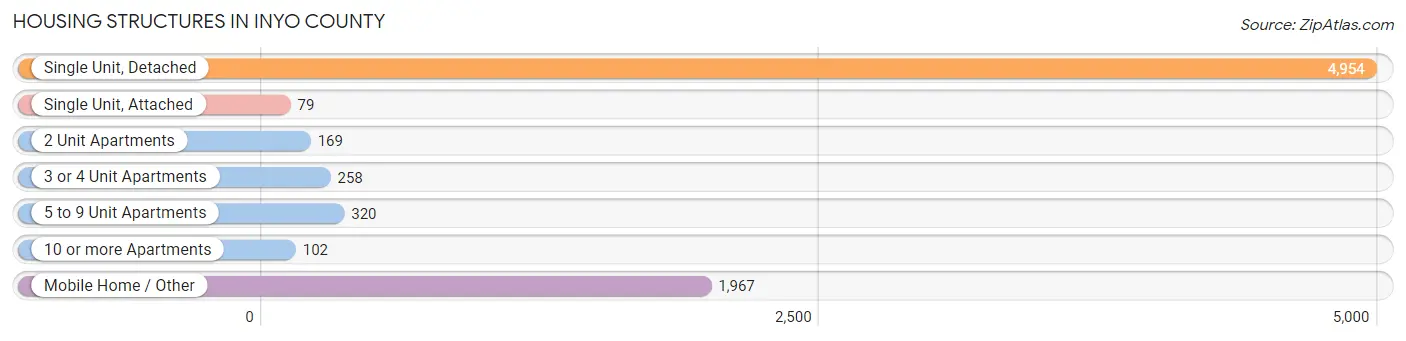
| Structure Type | # Housing Units | % Housing Units |
| Single Unit, Detached | 4,954 | 63.1% |
| Single Unit, Attached | 79 | 1.0% |
| 2 Unit Apartments | 169 | 2.1% |
| 3 or 4 Unit Apartments | 258 | 3.3% |
| 5 to 9 Unit Apartments | 320 | 4.1% |
| 10 or more Apartments | 102 | 1.3% |
| Mobile Home / Other | 1,967 | 25.1% |
| Total | 7,849 | 100.0% |
Housing Structures by Occupancy in Inyo County
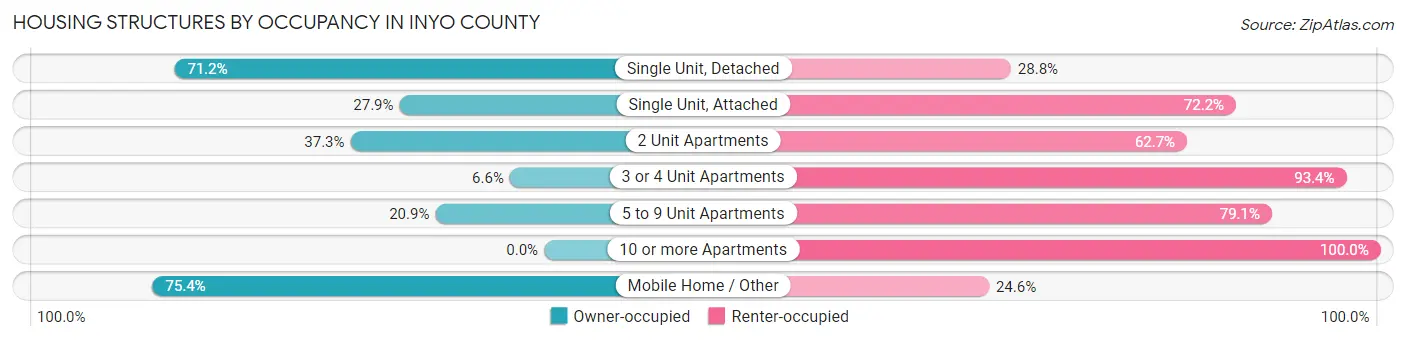
| Structure Type | Owner-occupied | Renter-occupied |
| Single Unit, Detached | 3,526 (71.2%) | 1,428 (28.8%) |
| Single Unit, Attached | 22 (27.9%) | 57 (72.2%) |
| 2 Unit Apartments | 63 (37.3%) | 106 (62.7%) |
| 3 or 4 Unit Apartments | 17 (6.6%) | 241 (93.4%) |
| 5 to 9 Unit Apartments | 67 (20.9%) | 253 (79.1%) |
| 10 or more Apartments | 0 (0.0%) | 102 (100.0%) |
| Mobile Home / Other | 1,483 (75.4%) | 484 (24.6%) |
| Total | 5,178 (66.0%) | 2,671 (34.0%) |
Housing Structures by Number of Rooms in Inyo County
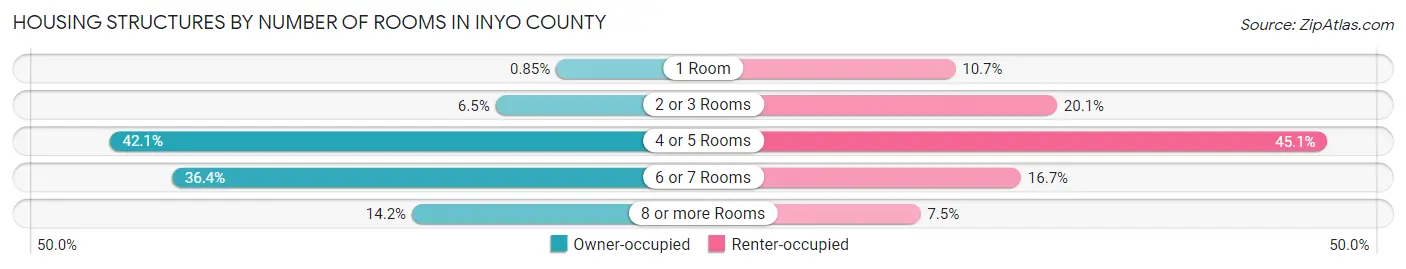
| Number of Rooms | Owner-occupied | Renter-occupied |
| 1 Room | 44 (0.9%) | 285 (10.7%) |
| 2 or 3 Rooms | 334 (6.5%) | 536 (20.1%) |
| 4 or 5 Rooms | 2,182 (42.1%) | 1,204 (45.1%) |
| 6 or 7 Rooms | 1,884 (36.4%) | 447 (16.7%) |
| 8 or more Rooms | 734 (14.2%) | 199 (7.4%) |
| Total | 5,178 (100.0%) | 2,671 (100.0%) |
Housing Structure by Heating Type in Inyo County
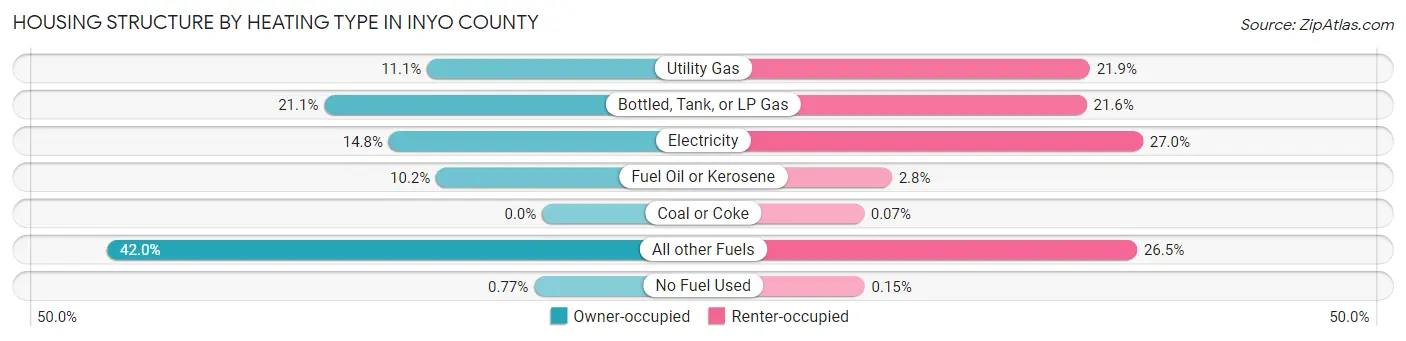
| Heating Type | Owner-occupied | Renter-occupied |
| Utility Gas | 575 (11.1%) | 585 (21.9%) |
| Bottled, Tank, or LP Gas | 1,090 (21.0%) | 577 (21.6%) |
| Electricity | 767 (14.8%) | 722 (27.0%) |
| Fuel Oil or Kerosene | 530 (10.2%) | 74 (2.8%) |
| Coal or Coke | 0 (0.0%) | 2 (0.1%) |
| All other Fuels | 2,176 (42.0%) | 707 (26.5%) |
| No Fuel Used | 40 (0.8%) | 4 (0.2%) |
| Total | 5,178 (100.0%) | 2,671 (100.0%) |
Household Vehicle Usage in Inyo County
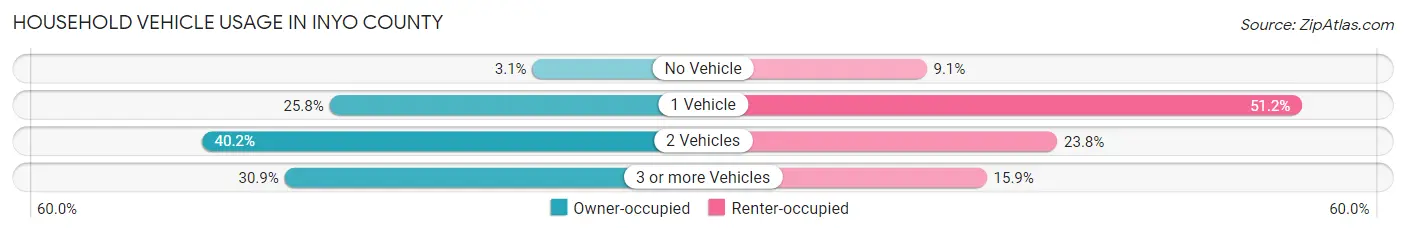
| Vehicles per Household | Owner-occupied | Renter-occupied |
| No Vehicle | 161 (3.1%) | 244 (9.1%) |
| 1 Vehicle | 1,338 (25.8%) | 1,368 (51.2%) |
| 2 Vehicles | 2,080 (40.2%) | 635 (23.8%) |
| 3 or more Vehicles | 1,599 (30.9%) | 424 (15.9%) |
| Total | 5,178 (100.0%) | 2,671 (100.0%) |
Real Estate & Mortgages in Inyo County
Real Estate and Mortgage Overview in Inyo County
| Characteristic | Without Mortgage | With Mortgage |
| Housing Units | 3,065 | 2,113 |
| Median Property Value | $225,100 | $423,000 |
| Median Household Income | $46,995 | $681 |
| Monthly Housing Costs | $569 | $350 |
| Real Estate Taxes | $1,550 | $189 |
Property Value by Mortgage Status in Inyo County
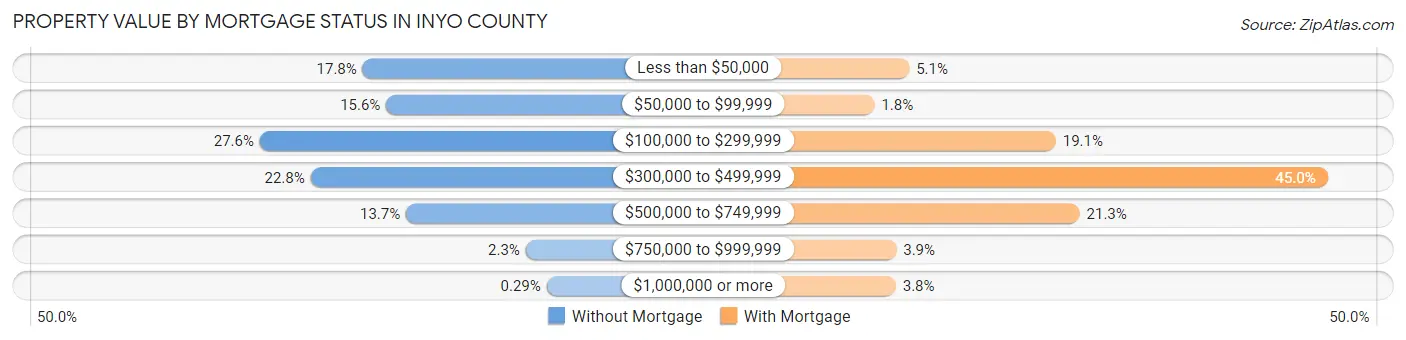
| Property Value | Without Mortgage | With Mortgage |
| Less than $50,000 | 546 (17.8%) | 108 (5.1%) |
| $50,000 to $99,999 | 477 (15.6%) | 38 (1.8%) |
| $100,000 to $299,999 | 846 (27.6%) | 403 (19.1%) |
| $300,000 to $499,999 | 698 (22.8%) | 950 (45.0%) |
| $500,000 to $749,999 | 419 (13.7%) | 451 (21.3%) |
| $750,000 to $999,999 | 70 (2.3%) | 82 (3.9%) |
| $1,000,000 or more | 9 (0.3%) | 81 (3.8%) |
| Total | 3,065 (100.0%) | 2,113 (100.0%) |
Household Income by Mortgage Status in Inyo County
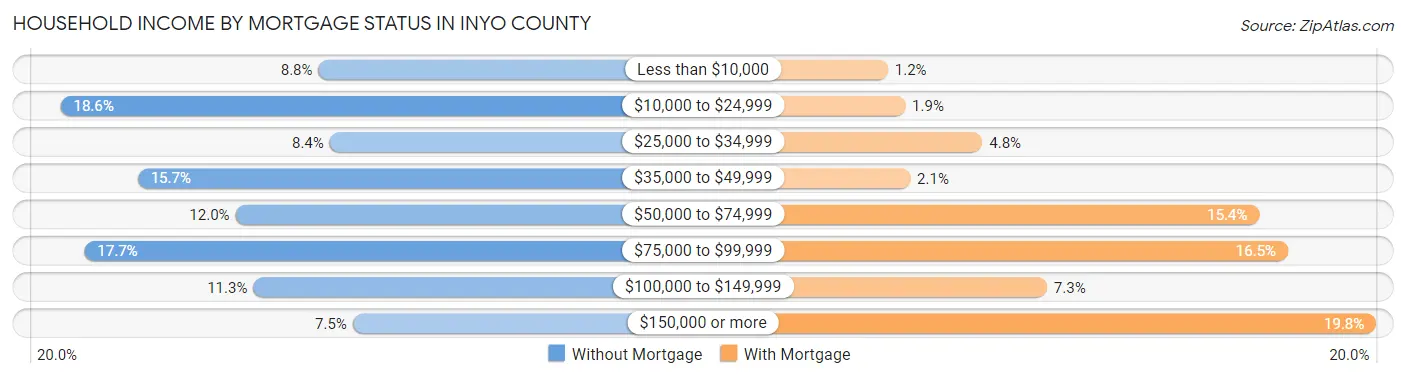
| Household Income | Without Mortgage | With Mortgage |
| Less than $10,000 | 270 (8.8%) | 26 (1.2%) |
| $10,000 to $24,999 | 571 (18.6%) | 40 (1.9%) |
| $25,000 to $34,999 | 257 (8.4%) | 102 (4.8%) |
| $35,000 to $49,999 | 481 (15.7%) | 44 (2.1%) |
| $50,000 to $74,999 | 367 (12.0%) | 325 (15.4%) |
| $75,000 to $99,999 | 543 (17.7%) | 348 (16.5%) |
| $100,000 to $149,999 | 346 (11.3%) | 154 (7.3%) |
| $150,000 or more | 230 (7.5%) | 419 (19.8%) |
| Total | 3,065 (100.0%) | 2,113 (100.0%) |
Property Value to Household Income Ratio in Inyo County
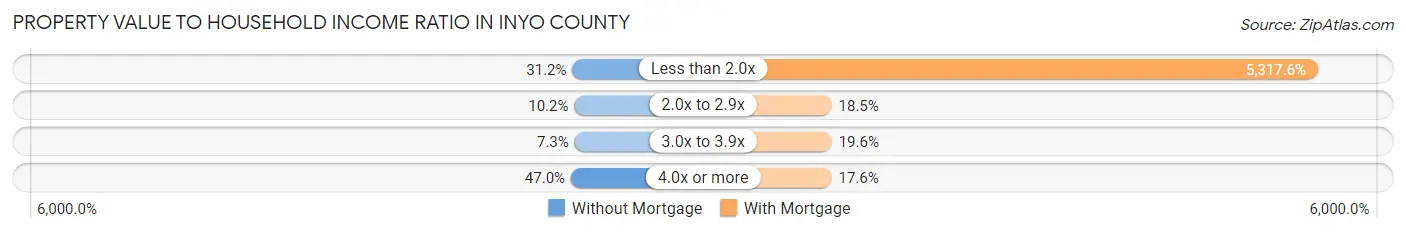
| Value-to-Income Ratio | Without Mortgage | With Mortgage |
| Less than 2.0x | 957 (31.2%) | 112,361 (5,317.6%) |
| 2.0x to 2.9x | 311 (10.2%) | 391 (18.5%) |
| 3.0x to 3.9x | 223 (7.3%) | 415 (19.6%) |
| 4.0x or more | 1,439 (46.9%) | 371 (17.6%) |
| Total | 3,065 (100.0%) | 2,113 (100.0%) |
Real Estate Taxes by Mortgage Status in Inyo County
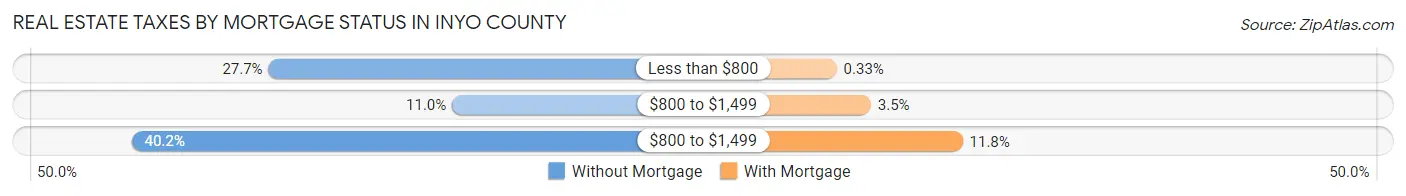
| Property Taxes | Without Mortgage | With Mortgage |
| Less than $800 | 850 (27.7%) | 7 (0.3%) |
| $800 to $1,499 | 336 (11.0%) | 73 (3.5%) |
| $800 to $1,499 | 1,233 (40.2%) | 250 (11.8%) |
| Total | 3,065 (100.0%) | 2,113 (100.0%) |
Health & Disability in Inyo County
Health Insurance Coverage by Age in Inyo County
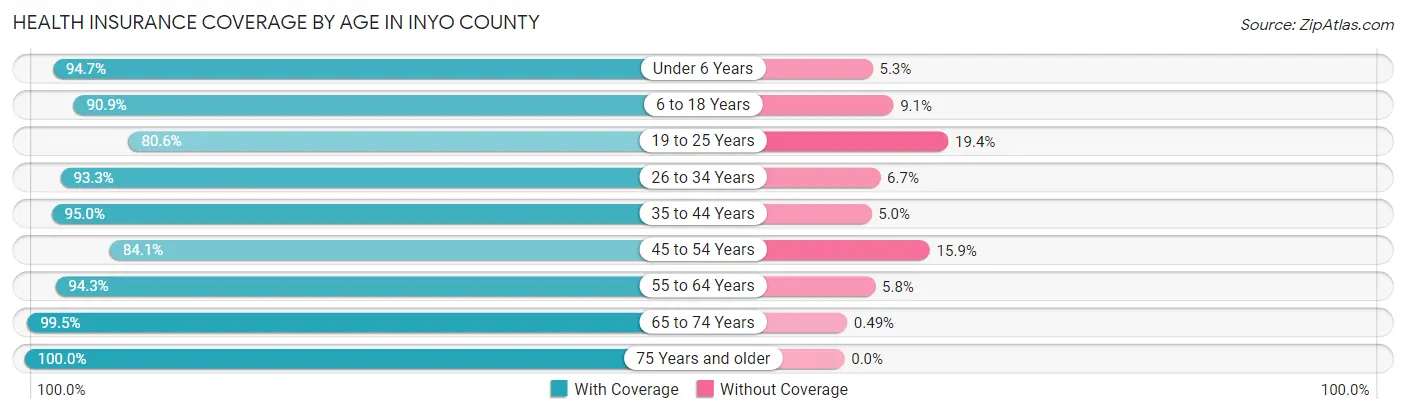
| Age Bracket | With Coverage | Without Coverage |
| Under 6 Years | 1,097 (94.7%) | 61 (5.3%) |
| 6 to 18 Years | 2,641 (90.9%) | 265 (9.1%) |
| 19 to 25 Years | 795 (80.6%) | 191 (19.4%) |
| 26 to 34 Years | 1,646 (93.3%) | 118 (6.7%) |
| 35 to 44 Years | 2,398 (95.0%) | 127 (5.0%) |
| 45 to 54 Years | 1,590 (84.1%) | 301 (15.9%) |
| 55 to 64 Years | 2,672 (94.3%) | 163 (5.8%) |
| 65 to 74 Years | 2,420 (99.5%) | 12 (0.5%) |
| 75 Years and older | 1,957 (100.0%) | 0 (0.0%) |
| Total | 17,216 (93.3%) | 1,238 (6.7%) |
Health Insurance Coverage by Citizenship Status in Inyo County
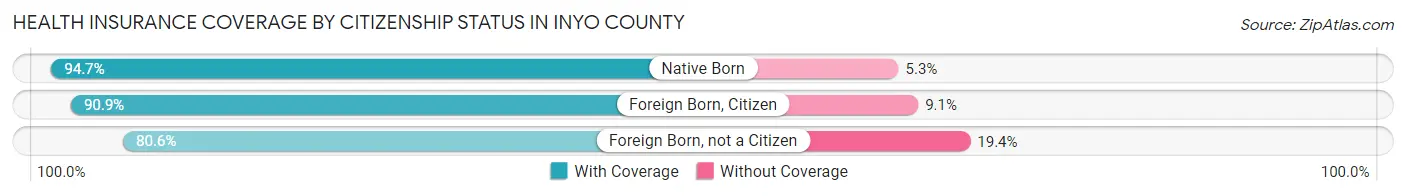
| Citizenship Status | With Coverage | Without Coverage |
| Native Born | 1,097 (94.7%) | 61 (5.3%) |
| Foreign Born, Citizen | 2,641 (90.9%) | 265 (9.1%) |
| Foreign Born, not a Citizen | 795 (80.6%) | 191 (19.4%) |
Health Insurance Coverage by Household Income in Inyo County
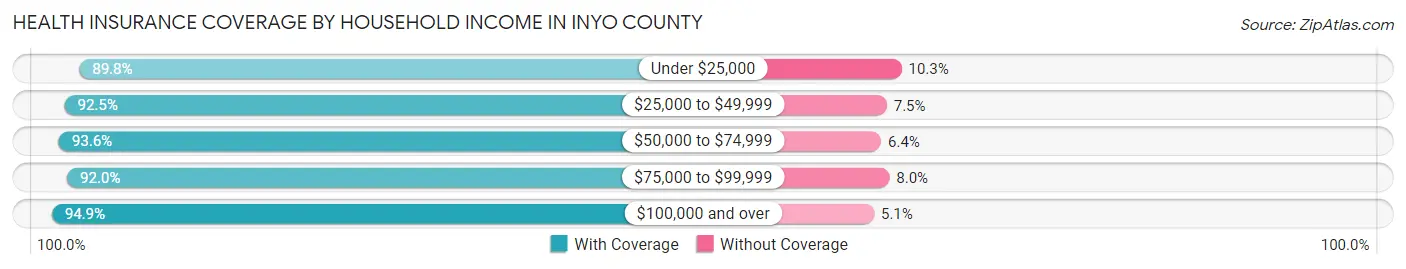
| Household Income | With Coverage | Without Coverage |
| Under $25,000 | 2,171 (89.7%) | 248 (10.2%) |
| $25,000 to $49,999 | 3,064 (92.5%) | 248 (7.5%) |
| $50,000 to $74,999 | 2,763 (93.6%) | 190 (6.4%) |
| $75,000 to $99,999 | 2,414 (92.0%) | 209 (8.0%) |
| $100,000 and over | 6,379 (94.9%) | 343 (5.1%) |
Public vs Private Health Insurance Coverage by Age in Inyo County
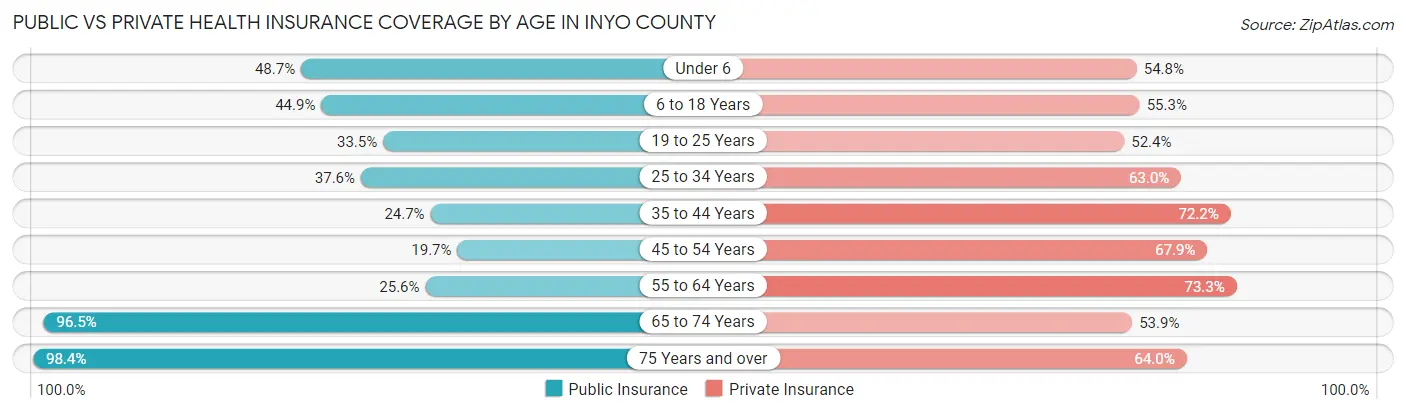
| Age Bracket | Public Insurance | Private Insurance |
| Under 6 | 564 (48.7%) | 634 (54.7%) |
| 6 to 18 Years | 1,306 (44.9%) | 1,607 (55.3%) |
| 19 to 25 Years | 330 (33.5%) | 517 (52.4%) |
| 25 to 34 Years | 663 (37.6%) | 1,111 (63.0%) |
| 35 to 44 Years | 623 (24.7%) | 1,822 (72.2%) |
| 45 to 54 Years | 372 (19.7%) | 1,283 (67.8%) |
| 55 to 64 Years | 726 (25.6%) | 2,077 (73.3%) |
| 65 to 74 Years | 2,347 (96.5%) | 1,311 (53.9%) |
| 75 Years and over | 1,926 (98.4%) | 1,252 (64.0%) |
| Total | 8,857 (48.0%) | 11,614 (62.9%) |
Disability Status by Sex by Age in Inyo County
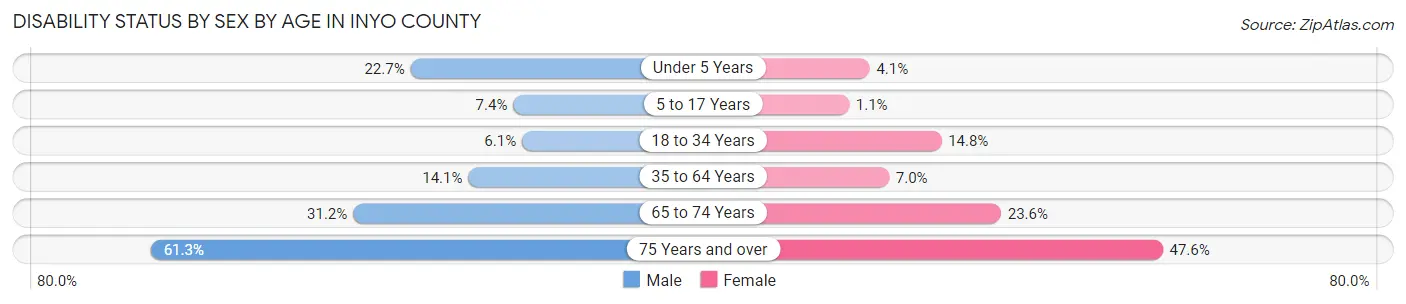
| Age Bracket | Male | Female |
| Under 5 Years | 106 (22.7%) | 19 (4.1%) |
| 5 to 17 Years | 117 (7.4%) | 14 (1.1%) |
| 18 to 34 Years | 85 (6.1%) | 235 (14.8%) |
| 35 to 64 Years | 529 (14.1%) | 245 (7.0%) |
| 65 to 74 Years | 393 (31.2%) | 277 (23.6%) |
| 75 Years and over | 552 (61.3%) | 503 (47.6%) |
Disability Class by Sex by Age in Inyo County
Disability Class: Hearing Difficulty
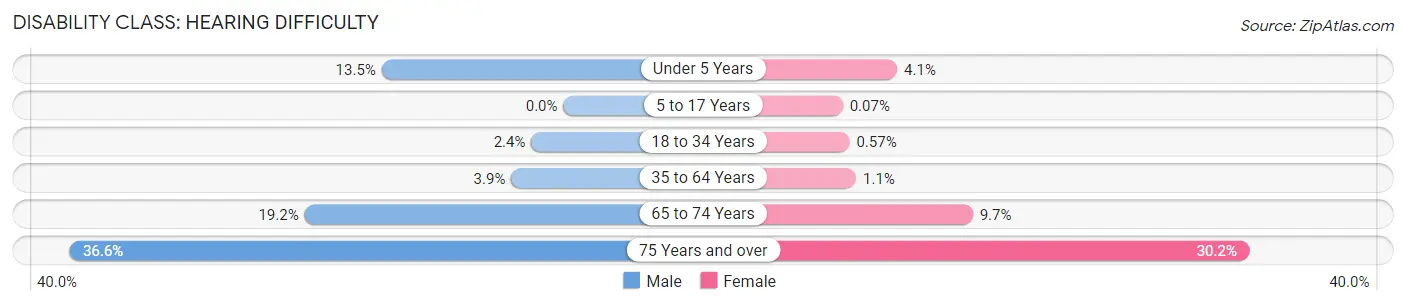
| Age Bracket | Male | Female |
| Under 5 Years | 63 (13.5%) | 19 (4.1%) |
| 5 to 17 Years | 0 (0.0%) | 1 (0.1%) |
| 18 to 34 Years | 33 (2.4%) | 9 (0.6%) |
| 35 to 64 Years | 145 (3.9%) | 37 (1.1%) |
| 65 to 74 Years | 242 (19.2%) | 114 (9.7%) |
| 75 Years and over | 330 (36.6%) | 319 (30.2%) |
Disability Class: Vision Difficulty
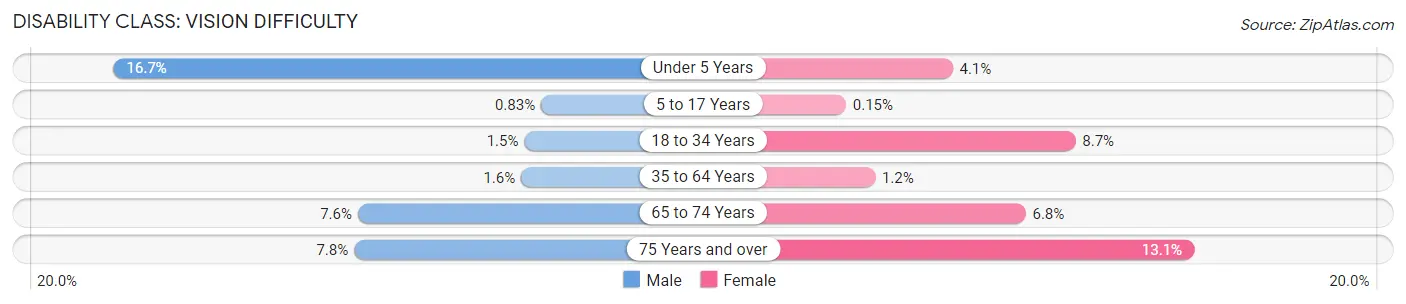
| Age Bracket | Male | Female |
| Under 5 Years | 78 (16.7%) | 19 (4.1%) |
| 5 to 17 Years | 13 (0.8%) | 2 (0.2%) |
| 18 to 34 Years | 20 (1.5%) | 138 (8.7%) |
| 35 to 64 Years | 59 (1.6%) | 43 (1.2%) |
| 65 to 74 Years | 96 (7.6%) | 80 (6.8%) |
| 75 Years and over | 70 (7.8%) | 138 (13.1%) |
Disability Class: Cognitive Difficulty
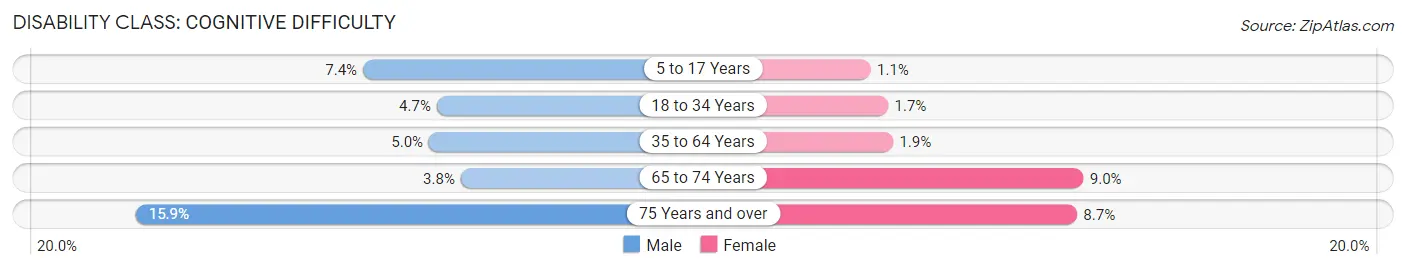
| Age Bracket | Male | Female |
| 5 to 17 Years | 117 (7.4%) | 14 (1.1%) |
| 18 to 34 Years | 65 (4.7%) | 27 (1.7%) |
| 35 to 64 Years | 187 (5.0%) | 66 (1.9%) |
| 65 to 74 Years | 48 (3.8%) | 105 (8.9%) |
| 75 Years and over | 143 (15.9%) | 92 (8.7%) |
Disability Class: Ambulatory Difficulty
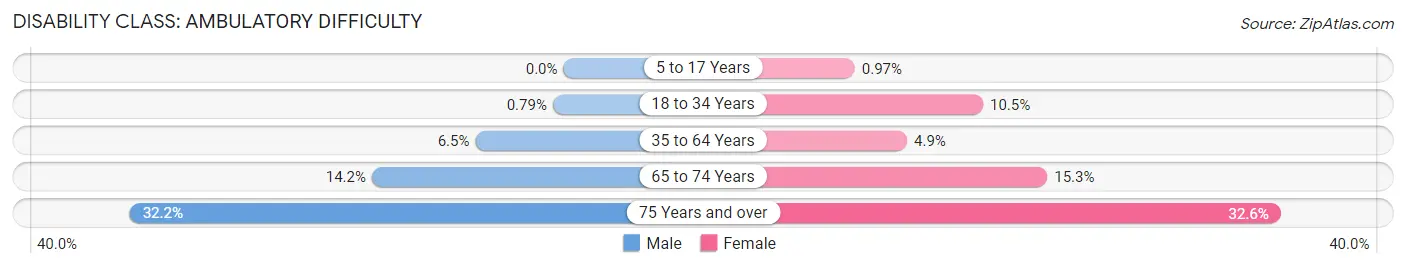
| Age Bracket | Male | Female |
| 5 to 17 Years | 0 (0.0%) | 13 (1.0%) |
| 18 to 34 Years | 11 (0.8%) | 167 (10.5%) |
| 35 to 64 Years | 245 (6.5%) | 170 (4.9%) |
| 65 to 74 Years | 179 (14.2%) | 179 (15.3%) |
| 75 Years and over | 290 (32.2%) | 344 (32.6%) |
Disability Class: Self-Care Difficulty
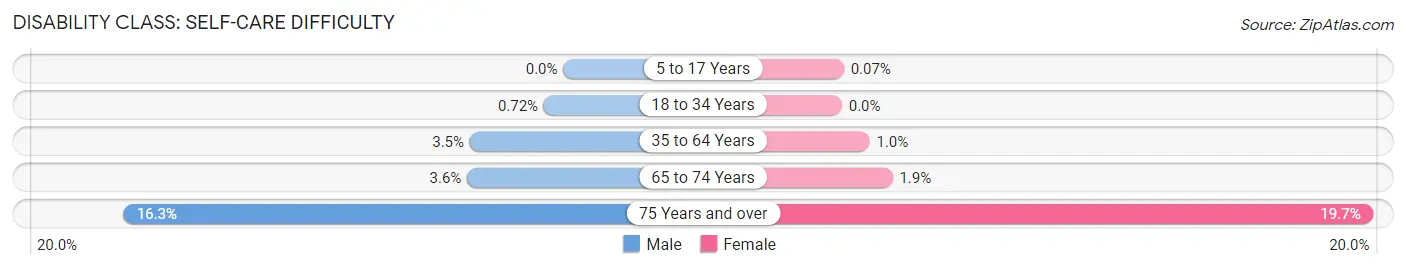
| Age Bracket | Male | Female |
| 5 to 17 Years | 0 (0.0%) | 1 (0.1%) |
| 18 to 34 Years | 10 (0.7%) | 0 (0.0%) |
| 35 to 64 Years | 130 (3.5%) | 36 (1.0%) |
| 65 to 74 Years | 45 (3.6%) | 22 (1.9%) |
| 75 Years and over | 147 (16.3%) | 208 (19.7%) |
Technology Access in Inyo County
Computing Device Access in Inyo County
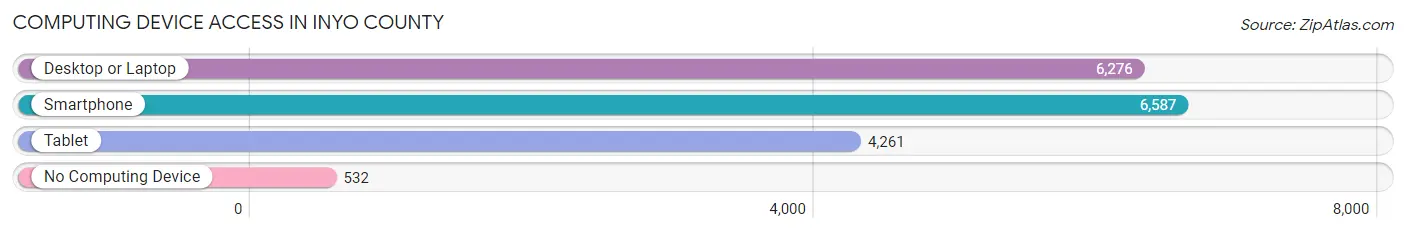
| Device Type | # Households | % Households |
| Desktop or Laptop | 6,276 | 80.0% |
| Smartphone | 6,587 | 83.9% |
| Tablet | 4,261 | 54.3% |
| No Computing Device | 532 | 6.8% |
| Total | 7,849 | 100.0% |
Internet Access in Inyo County
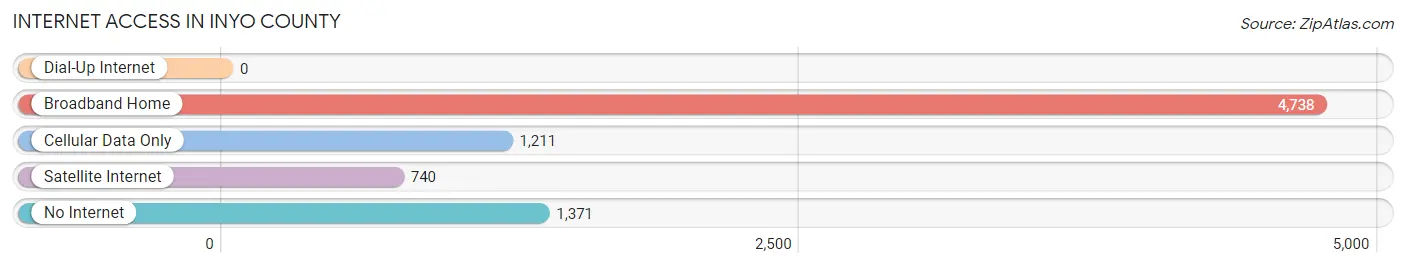
| Internet Type | # Households | % Households |
| Dial-Up Internet | 0 | 0.0% |
| Broadband Home | 4,738 | 60.4% |
| Cellular Data Only | 1,211 | 15.4% |
| Satellite Internet | 740 | 9.4% |
| No Internet | 1,371 | 17.5% |
| Total | 7,849 | 100.0% |
Inyo County Summary
Inyo County is a county located in the eastern part of the U.S. state of California. It is the second-largest county by area in the state, and the third-least populous. The county seat is Independence, and the largest city is Bishop. The county is named after the Inyo Mountains, which are located in the county.
History
Inyo County was formed in 1866 from the northern part of Mono County. It is named after the Inyo Mountains, which were named by the Paiute people who lived in the area. The name Inyo comes from the Paiute word meaning “dwelling place of the great spirit.”
The county was originally inhabited by Native Americans, including the Paiute, Shoshone, and Mono tribes. The first Europeans to explore the area were the Spanish, who arrived in the late 1700s. The area was later explored by American trappers and traders, and in 1864, the area was annexed by the United States.
Geography
Inyo County is located in the eastern part of California, and is bordered by Mono County to the north, Kern County to the south, and San Bernardino County to the east. It covers an area of 10,192 square miles, making it the second-largest county in California by area. The county is located in the Great Basin Desert, and is home to the highest peak in the contiguous United States, Mount Whitney, which has an elevation of 14,505 feet.
The county is home to several mountain ranges, including the White Mountains, the Inyo Mountains, and the Sierra Nevada. The Owens Valley, which is located in the county, is a major source of water for the state of California. The county is also home to Death Valley National Park, which is the lowest point in the United States.
Economy
Inyo County has a diverse economy, with the largest industries being tourism, agriculture, and mining. Tourism is the largest industry in the county, with visitors coming to the area to visit Death Valley National Park, the Sierra Nevada, and other attractions. Agriculture is also an important industry in the county, with crops such as alfalfa, hay, and cotton being grown in the area. Mining is also an important industry in the county, with gold, silver, and other minerals being mined in the area.
Demographics
As of the 2010 census, Inyo County had a population of 18,546. The population was spread out, with 11.3% under the age of 18, 4.2% from 18 to 24, 22.2% from 25 to 44, 33.2% from 45 to 64, and 29.1% who were 65 years of age or older. The median age was 48.4 years.
The racial makeup of the county was 87.2% White, 0.7% African American, 2.3% Native American, 0.5% Asian, 0.1% Pacific Islander, 6.2% from other races, and 3.1% from two or more races. Hispanic or Latino of any race were 11.3% of the population.
In terms of education, the county had a high school graduation rate of 79.2%, and a bachelor's degree or higher rate of 18.2%. The median household income was $41,945, and the median family income was $50,919. The per capita income was $22,845. About 11.2% of the population was below the poverty line.
Common Questions
What is Per Capita Income in Inyo County?
Per Capita income in Inyo County is $36,673.
What is the Median Family Income in Inyo County?
Median Family Income in Inyo County is $80,504.
What is the Median Household income in Inyo County?
Median Household Income in Inyo County is $63,417.
What is Income or Wage Gap in Inyo County?
Income or Wage Gap in Inyo County is 7.5%.
Women in Inyo County earn 92.5 cents for every dollar earned by a man.
What is Family Income Deficit in Inyo County?
Family Income Deficit in Inyo County is $12,197.
Families that are below poverty line in Inyo County earn $12,197 less on average than the poverty threshold level.
What is Inequality or Gini Index in Inyo County?
Inequality or Gini Index in Inyo County is 0.45.
What is the Total Population of Inyo County?
Total Population of Inyo County is 18,829.
What is the Total Male Population of Inyo County?
Total Male Population of Inyo County is 9,617.
What is the Total Female Population of Inyo County?
Total Female Population of Inyo County is 9,212.
What is the Ratio of Males per 100 Females in Inyo County?
There are 104.40 Males per 100 Females in Inyo County.
What is the Ratio of Females per 100 Males in Inyo County?
There are 95.79 Females per 100 Males in Inyo County.
What is the Median Population Age in Inyo County?
Median Population Age in Inyo County is 44.6 Years.
What is the Average Family Size in Inyo County
Average Family Size in Inyo County is 3.1 People.
What is the Average Household Size in Inyo County
Average Household Size in Inyo County is 2.3 People.
How Large is the Labor Force in Inyo County?
There are 8,714 People in the Labor Forcein in Inyo County.
What is the Percentage of People in the Labor Force in Inyo County?
57.1% of People are in the Labor Force in Inyo County.
What is the Unemployment Rate in Inyo County?
Unemployment Rate in Inyo County is 4.9%.