Imperial County, CA Map & Demographics
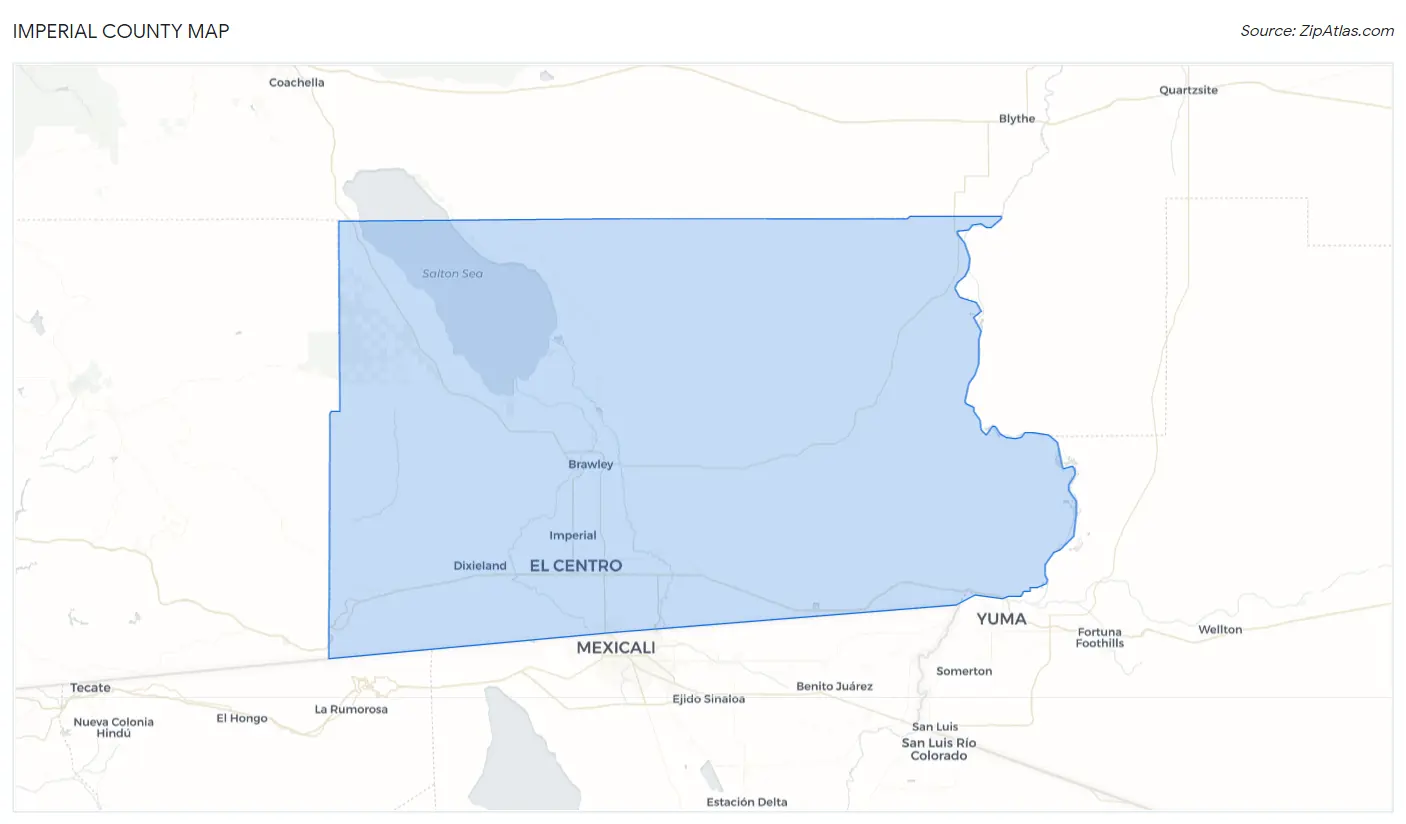
Imperial County Map
Imperial County Overview
$21,216
PER CAPITA INCOME
$60,776
AVG FAMILY INCOME
$53,847
AVG HOUSEHOLD INCOME
35.3%
WAGE / INCOME GAP [ % ]
64.7¢/ $1
WAGE / INCOME GAP [ $ ]
$11,678
FAMILY INCOME DEFICIT
0.46
INEQUALITY / GINI INDEX
179,578
TOTAL POPULATION
92,430
MALE POPULATION
87,148
FEMALE POPULATION
106.06
MALES / 100 FEMALES
94.29
FEMALES / 100 MALES
32.6
MEDIAN AGE
4.4
AVG FAMILY SIZE
3.6
AVG HOUSEHOLD SIZE
70,050
LABOR FORCE [ PEOPLE ]
52.3%
PERCENT IN LABOR FORCE
13.2%
UNEMPLOYMENT RATE
Income in Imperial County
Income Overview in Imperial County
Per Capita Income in Imperial County is $21,216, while median incomes of families and households are $60,776 and $53,847 respectively.
| Characteristic | Number | Measure |
| Per Capita Income | 179,578 | $21,216 |
| Median Family Income | 34,862 | $60,776 |
| Mean Family Income | 34,862 | $80,038 |
| Median Household Income | 47,024 | $53,847 |
| Mean Household Income | 47,024 | $72,923 |
| Income Deficit | 34,862 | $11,678 |
| Wage / Income Gap (%) | 179,578 | 35.33% |
| Wage / Income Gap ($) | 179,578 | 64.67¢ per $1 |
| Gini / Inequality Index | 179,578 | 0.46 |
Earnings by Sex in Imperial County
Average Earnings in Imperial County are $30,547, $37,169 for men and $24,038 for women, a difference of 35.3%.
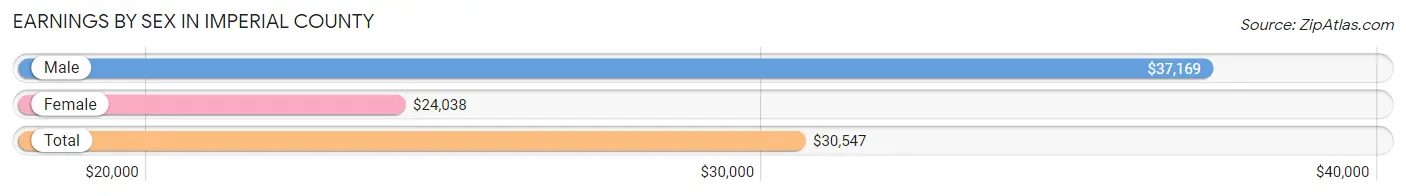
| Sex | Number | Average Earnings |
| Male | 38,938 (55.8%) | $37,169 |
| Female | 30,811 (44.2%) | $24,038 |
| Total | 69,749 (100.0%) | $30,547 |
Earnings by Sex by Income Bracket in Imperial County
The most common earnings brackets in Imperial County are $100,000+ for men (4,794 | 12.3%) and $15,000 to $17,499 for women (2,526 | 8.2%).
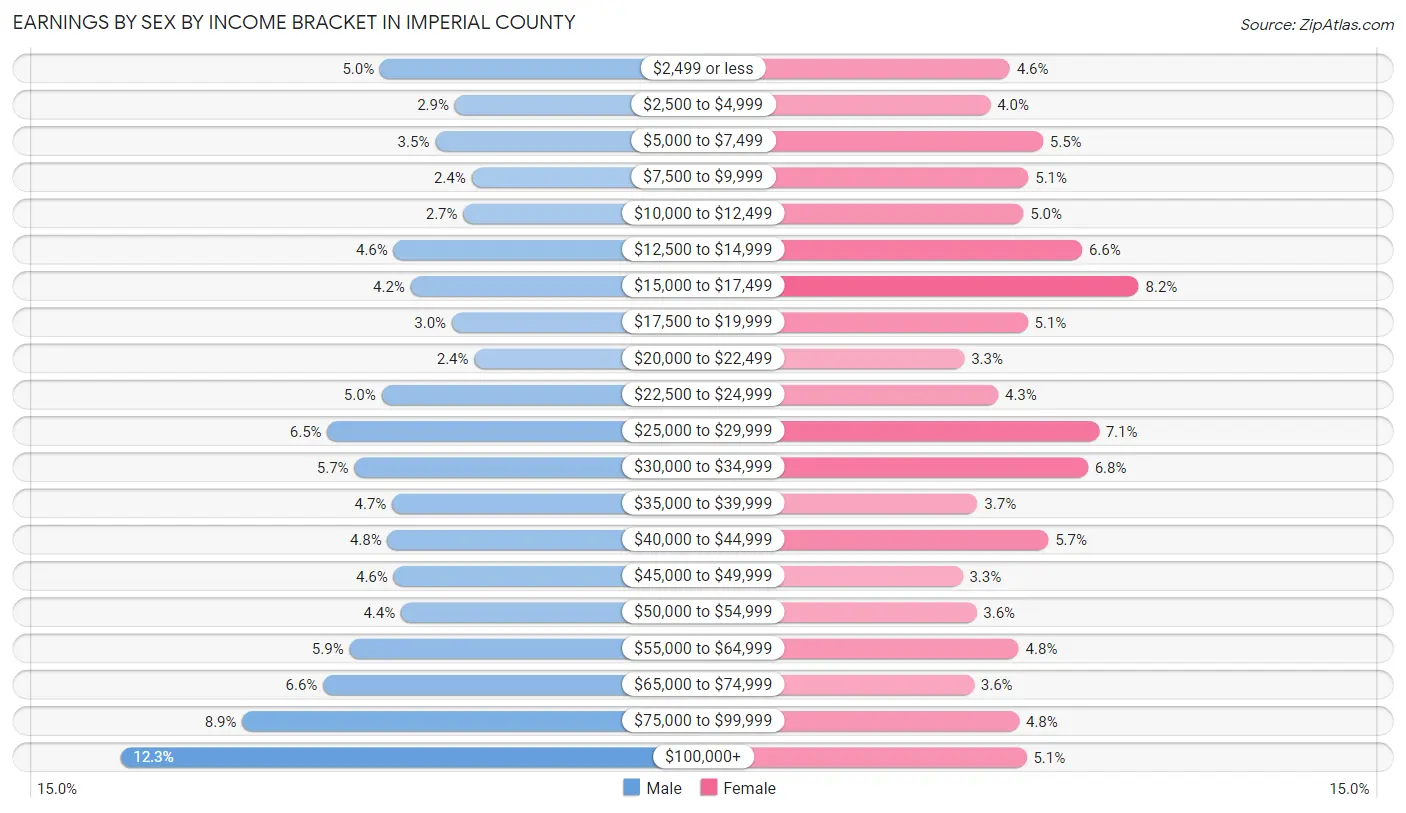
| Income | Male | Female |
| $2,499 or less | 1,949 (5.0%) | 1,410 (4.6%) |
| $2,500 to $4,999 | 1,134 (2.9%) | 1,243 (4.0%) |
| $5,000 to $7,499 | 1,347 (3.5%) | 1,699 (5.5%) |
| $7,500 to $9,999 | 949 (2.4%) | 1,572 (5.1%) |
| $10,000 to $12,499 | 1,041 (2.7%) | 1,528 (5.0%) |
| $12,500 to $14,999 | 1,803 (4.6%) | 2,038 (6.6%) |
| $15,000 to $17,499 | 1,615 (4.2%) | 2,526 (8.2%) |
| $17,500 to $19,999 | 1,165 (3.0%) | 1,565 (5.1%) |
| $20,000 to $22,499 | 919 (2.4%) | 1,018 (3.3%) |
| $22,500 to $24,999 | 1,934 (5.0%) | 1,311 (4.3%) |
| $25,000 to $29,999 | 2,528 (6.5%) | 2,180 (7.1%) |
| $30,000 to $34,999 | 2,232 (5.7%) | 2,087 (6.8%) |
| $35,000 to $39,999 | 1,818 (4.7%) | 1,131 (3.7%) |
| $40,000 to $44,999 | 1,868 (4.8%) | 1,745 (5.7%) |
| $45,000 to $49,999 | 1,803 (4.6%) | 1,001 (3.3%) |
| $50,000 to $54,999 | 1,720 (4.4%) | 1,122 (3.6%) |
| $55,000 to $64,999 | 2,287 (5.9%) | 1,488 (4.8%) |
| $65,000 to $74,999 | 2,573 (6.6%) | 1,100 (3.6%) |
| $75,000 to $99,999 | 3,459 (8.9%) | 1,491 (4.8%) |
| $100,000+ | 4,794 (12.3%) | 1,556 (5.1%) |
| Total | 38,938 (100.0%) | 30,811 (100.0%) |
Earnings by Sex by Educational Attainment in Imperial County
Average earnings in Imperial County are $42,306 for men and $27,065 for women, a difference of 36.0%. Men with an educational attainment of graduate degree enjoy the highest average annual earnings of $86,657, while those with less than high school education earn the least with $28,530. Women with an educational attainment of graduate degree earn the most with the average annual earnings of $72,289, while those with less than high school education have the smallest earnings of $15,983.

| Educational Attainment | Male Income | Female Income |
| Less than High School | $28,530 | $15,983 |
| High School Diploma | $39,969 | $21,806 |
| College or Associate's Degree | $49,369 | $32,537 |
| Bachelor's Degree | $68,513 | $42,050 |
| Graduate Degree | $86,657 | $72,289 |
| Total | $42,306 | $27,065 |
Family Income in Imperial County
Family Income Brackets in Imperial County
According to the Imperial County family income data, there are 6,763 families falling into the $100,000 to $149,999 income range, which is the most common income bracket and makes up 19.4% of all families. Conversely, the $10,000 to $14,999 income bracket is the least frequent group with only 976 families (2.8%) belonging to this category.
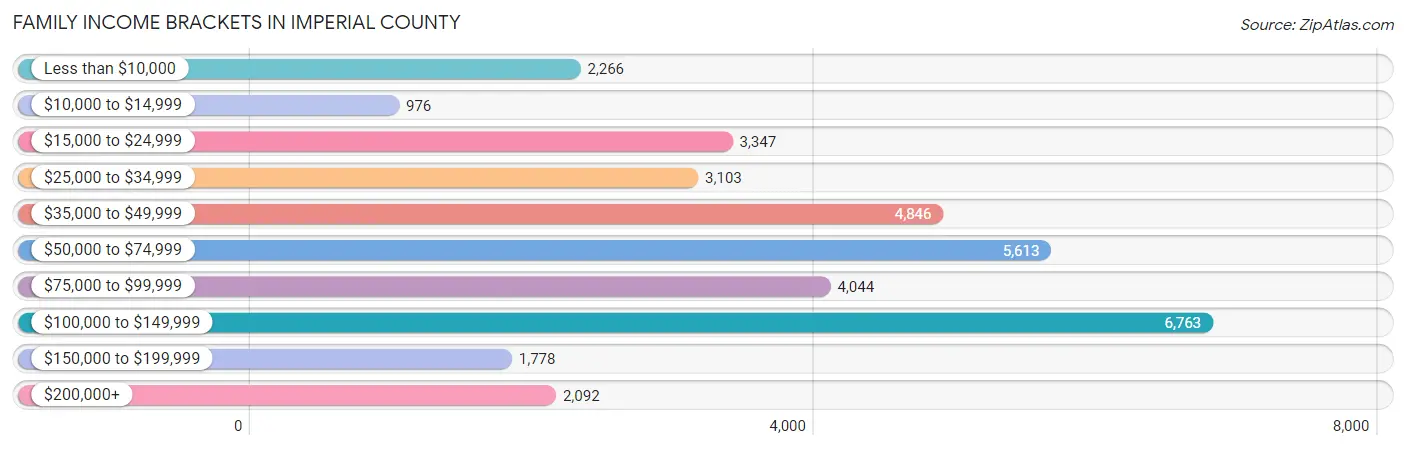
| Income Bracket | # Families | % Families |
| Less than $10,000 | 2,266 | 6.5% |
| $10,000 to $14,999 | 976 | 2.8% |
| $15,000 to $24,999 | 3,347 | 9.6% |
| $25,000 to $34,999 | 3,103 | 8.9% |
| $35,000 to $49,999 | 4,846 | 13.9% |
| $50,000 to $74,999 | 5,613 | 16.1% |
| $75,000 to $99,999 | 4,044 | 11.6% |
| $100,000 to $149,999 | 6,763 | 19.4% |
| $150,000 to $199,999 | 1,778 | 5.1% |
| $200,000+ | 2,092 | 6.0% |
Family Income by Famaliy Size in Imperial County
7+ person families (1,465 | 4.2%) account for the highest median family income in Imperial County with $110,358 per family, while 2-person families (11,561 | 33.2%) have the highest median income of $23,694 per family member.
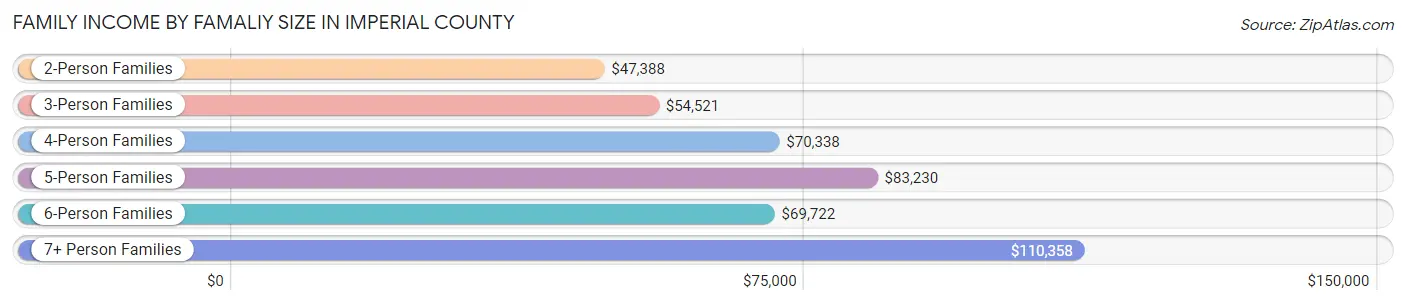
| Income Bracket | # Families | Median Income |
| 2-Person Families | 11,561 (33.2%) | $47,388 |
| 3-Person Families | 7,505 (21.5%) | $54,521 |
| 4-Person Families | 7,498 (21.5%) | $70,338 |
| 5-Person Families | 4,595 (13.2%) | $83,230 |
| 6-Person Families | 2,238 (6.4%) | $69,722 |
| 7+ Person Families | 1,465 (4.2%) | $110,358 |
| Total | 34,862 (100.0%) | $60,776 |
Family Income by Number of Earners in Imperial County
The median family income in Imperial County is $60,776, with families comprising 3+ earners (4,047) having the highest median family income of $116,512, while families with no earners (5,863) have the lowest median family income of $22,364, accounting for 11.6% and 16.8% of families, respectively.
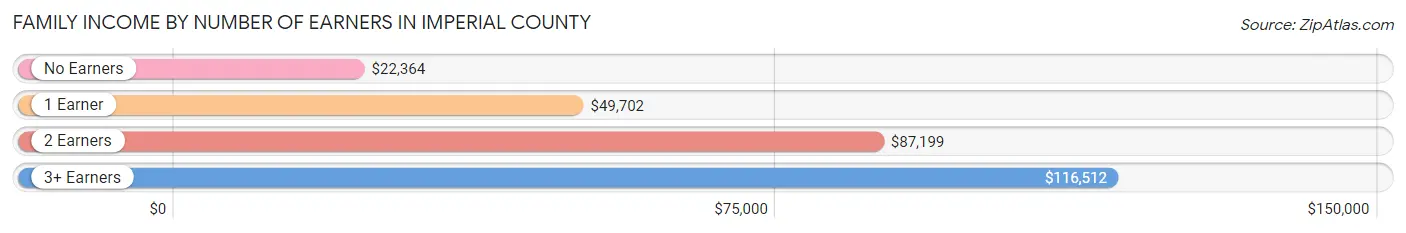
| Number of Earners | # Families | Median Income |
| No Earners | 5,863 (16.8%) | $22,364 |
| 1 Earner | 13,526 (38.8%) | $49,702 |
| 2 Earners | 11,426 (32.8%) | $87,199 |
| 3+ Earners | 4,047 (11.6%) | $116,512 |
| Total | 34,862 (100.0%) | $60,776 |
Household Income in Imperial County
Household Income Brackets in Imperial County
With 8,088 households falling in the category, the $100,000 to $149,999 income range is the most frequent in Imperial County, accounting for 17.2% of all households. In contrast, only 2,022 households (4.3%) fall into the $150,000 to $199,999 income bracket, making it the least populous group.
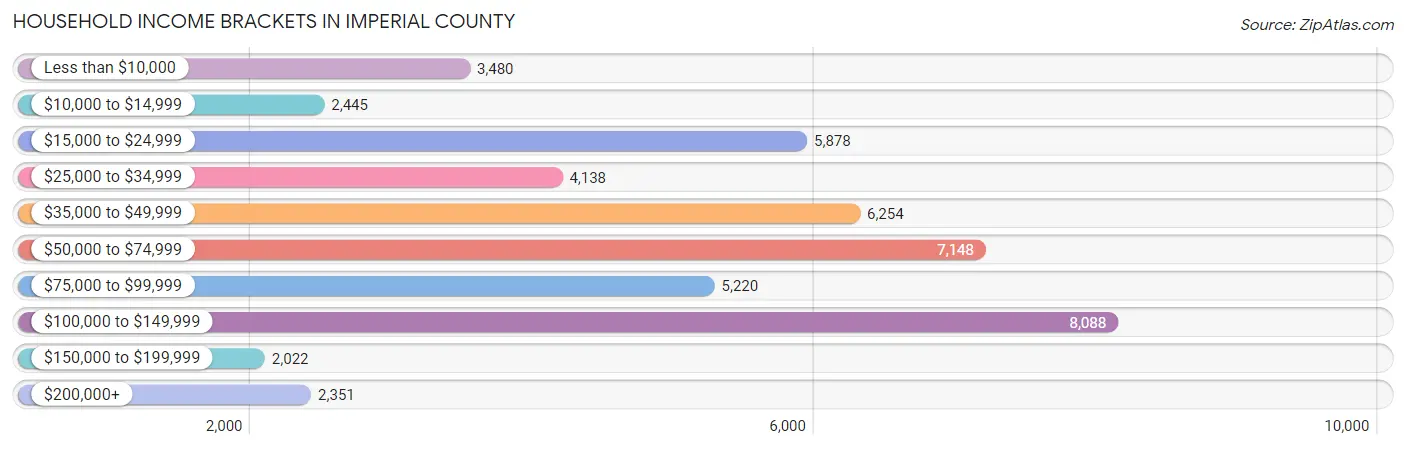
| Income Bracket | # Households | % Households |
| Less than $10,000 | 3,480 | 7.4% |
| $10,000 to $14,999 | 2,445 | 5.2% |
| $15,000 to $24,999 | 5,878 | 12.5% |
| $25,000 to $34,999 | 4,138 | 8.8% |
| $35,000 to $49,999 | 6,254 | 13.3% |
| $50,000 to $74,999 | 7,148 | 15.2% |
| $75,000 to $99,999 | 5,220 | 11.1% |
| $100,000 to $149,999 | 8,088 | 17.2% |
| $150,000 to $199,999 | 2,022 | 4.3% |
| $200,000+ | 2,351 | 5.0% |
Household Income by Householder Age in Imperial County
The median household income in Imperial County is $53,847, with the highest median household income of $61,502 found in the 45 to 64 years age bracket for the primary householder. A total of 18,195 households (38.7%) fall into this category. Meanwhile, the 15 to 24 years age bracket for the primary householder has the lowest median household income of $34,203, with 1,163 households (2.5%) in this group.
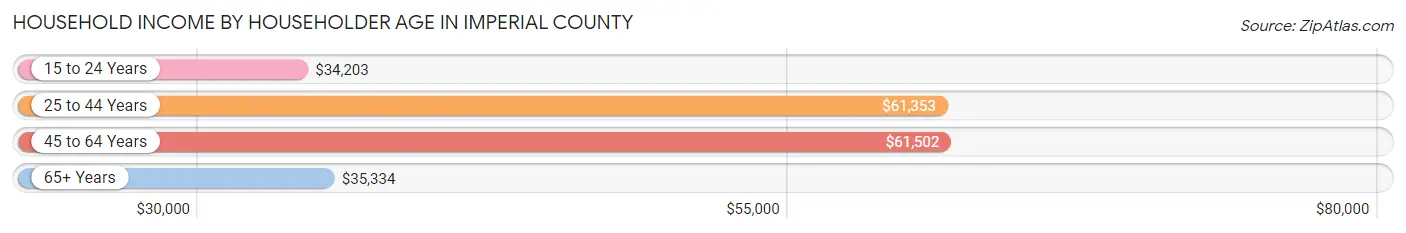
| Income Bracket | # Households | Median Income |
| 15 to 24 Years | 1,163 (2.5%) | $34,203 |
| 25 to 44 Years | 15,710 (33.4%) | $61,353 |
| 45 to 64 Years | 18,195 (38.7%) | $61,502 |
| 65+ Years | 11,956 (25.4%) | $35,334 |
| Total | 47,024 (100.0%) | $53,847 |
Poverty in Imperial County
Income Below Poverty by Sex and Age in Imperial County
With 18.8% poverty level for males and 23.3% for females among the residents of Imperial County, under 5 year old males and 5 year old females are the most vulnerable to poverty, with 2,308 males (34.6%) and 463 females (33.3%) in their respective age groups living below the poverty level.
| Age Bracket | Male | Female |
| Under 5 Years | 2,308 (34.6%) | 1,898 (28.8%) |
| 5 Years | 149 (13.5%) | 463 (33.3%) |
| 6 to 11 Years | 2,015 (22.6%) | 2,485 (30.2%) |
| 12 to 14 Years | 1,104 (24.0%) | 1,283 (27.7%) |
| 15 Years | 414 (29.4%) | 542 (31.8%) |
| 16 and 17 Years | 915 (30.6%) | 600 (24.9%) |
| 18 to 24 Years | 1,732 (19.2%) | 2,064 (24.8%) |
| 25 to 34 Years | 1,950 (16.6%) | 2,258 (19.6%) |
| 35 to 44 Years | 1,103 (11.2%) | 2,052 (20.1%) |
| 45 to 54 Years | 1,427 (15.4%) | 1,962 (20.6%) |
| 55 to 64 Years | 1,096 (12.7%) | 1,728 (18.6%) |
| 65 to 74 Years | 906 (14.2%) | 1,440 (20.1%) |
| 75 Years and over | 795 (19.1%) | 1,403 (24.4%) |
| Total | 15,914 (18.8%) | 20,178 (23.3%) |
Income Above Poverty by Sex and Age in Imperial County
According to the poverty statistics in Imperial County, males aged 35 to 44 years and females aged 55 to 64 years are the age groups that are most secure financially, with 88.8% of males and 81.4% of females in these age groups living above the poverty line.
| Age Bracket | Male | Female |
| Under 5 Years | 4,361 (65.4%) | 4,696 (71.2%) |
| 5 Years | 955 (86.5%) | 927 (66.7%) |
| 6 to 11 Years | 6,903 (77.4%) | 5,750 (69.8%) |
| 12 to 14 Years | 3,501 (76.0%) | 3,352 (72.3%) |
| 15 Years | 995 (70.6%) | 1,164 (68.2%) |
| 16 and 17 Years | 2,077 (69.4%) | 1,814 (75.1%) |
| 18 to 24 Years | 7,271 (80.8%) | 6,243 (75.1%) |
| 25 to 34 Years | 9,787 (83.4%) | 9,240 (80.4%) |
| 35 to 44 Years | 8,718 (88.8%) | 8,182 (79.9%) |
| 45 to 54 Years | 7,851 (84.6%) | 7,556 (79.4%) |
| 55 to 64 Years | 7,521 (87.3%) | 7,566 (81.4%) |
| 65 to 74 Years | 5,475 (85.8%) | 5,738 (79.9%) |
| 75 Years and over | 3,364 (80.9%) | 4,351 (75.6%) |
| Total | 68,779 (81.2%) | 66,579 (76.7%) |
Income Below Poverty Among Married-Couple Families in Imperial County
The poverty statistics for married-couple families in Imperial County show that 10.4% or 2,326 of the total 22,278 families live below the poverty line. Families with 5 or more children have the highest poverty rate of 48.4%, comprising of 77 families. On the other hand, families with no children have the lowest poverty rate of 8.5%, which includes 963 families.
| Children | Above Poverty | Below Poverty |
| No Children | 10,334 (91.5%) | 963 (8.5%) |
| 1 or 2 Children | 6,909 (89.9%) | 778 (10.1%) |
| 3 or 4 Children | 2,627 (83.8%) | 508 (16.2%) |
| 5 or more Children | 82 (51.6%) | 77 (48.4%) |
| Total | 19,952 (89.6%) | 2,326 (10.4%) |
Income Below Poverty Among Single-Parent Households in Imperial County
According to the poverty data in Imperial County, 14.5% or 519 single-father households and 38.6% or 3,478 single-mother households are living below the poverty line. Among single-father households, those with 3 or 4 children have the highest poverty rate, with 65 households (35.1%) experiencing poverty. Likewise, among single-mother households, those with 5 or more children have the highest poverty rate, with 127 households (97.0%) falling below the poverty line.
| Children | Single Father | Single Mother |
| No Children | 152 (8.3%) | 729 (22.2%) |
| 1 or 2 Children | 302 (19.8%) | 1,962 (45.0%) |
| 3 or 4 Children | 65 (35.1%) | 660 (53.5%) |
| 5 or more Children | 0 (0.0%) | 127 (97.0%) |
| Total | 519 (14.5%) | 3,478 (38.6%) |
Income Below Poverty Among Married-Couple vs Single-Parent Households in Imperial County
The poverty data for Imperial County shows that 2,326 of the married-couple family households (10.4%) and 3,997 of the single-parent households (31.8%) are living below the poverty level. Within the married-couple family households, those with 5 or more children have the highest poverty rate, with 77 households (48.4%) falling below the poverty line. Among the single-parent households, those with 5 or more children have the highest poverty rate, with 127 household (76.0%) living below poverty.
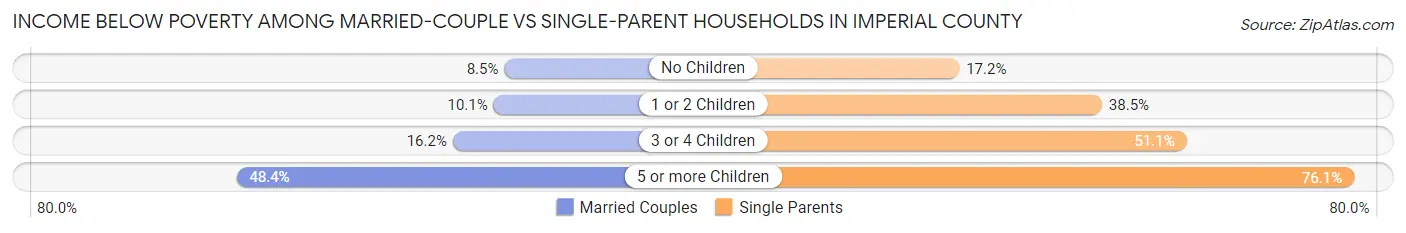
| Children | Married-Couple Families | Single-Parent Households |
| No Children | 963 (8.5%) | 881 (17.2%) |
| 1 or 2 Children | 778 (10.1%) | 2,264 (38.5%) |
| 3 or 4 Children | 508 (16.2%) | 725 (51.1%) |
| 5 or more Children | 77 (48.4%) | 127 (76.0%) |
| Total | 2,326 (10.4%) | 3,997 (31.8%) |
Race in Imperial County
The most populous races in Imperial County are Hispanic or Latino (153,382 | 85.4%), White / Caucasian (70,860 | 39.5%), and Some other Race (62,551 | 34.8%).
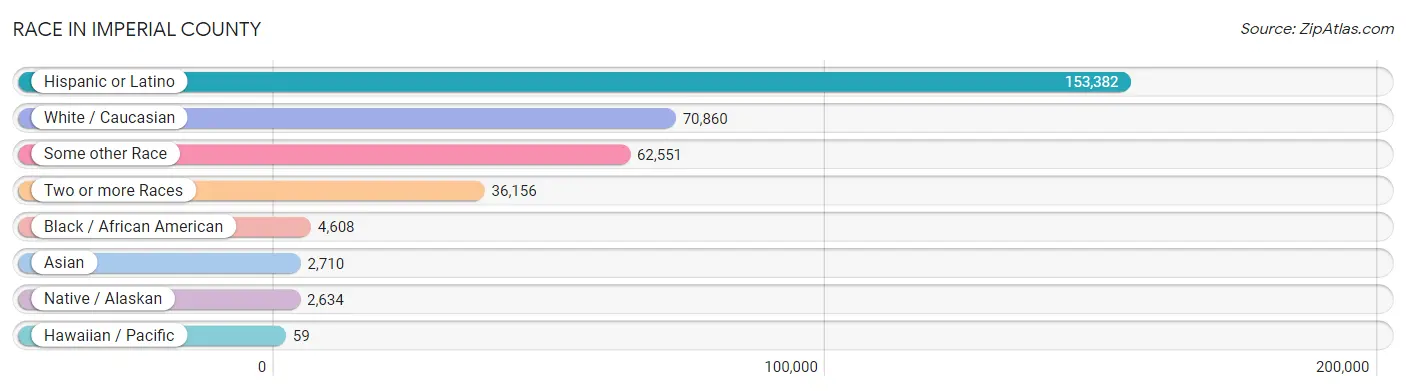
| Race | # Population | % Population |
| Asian | 2,710 | 1.5% |
| Black / African American | 4,608 | 2.6% |
| Hawaiian / Pacific | 59 | 0.0% |
| Hispanic or Latino | 153,382 | 85.4% |
| Native / Alaskan | 2,634 | 1.5% |
| White / Caucasian | 70,860 | 39.5% |
| Two or more Races | 36,156 | 20.1% |
| Some other Race | 62,551 | 34.8% |
| Total | 179,578 | 100.0% |
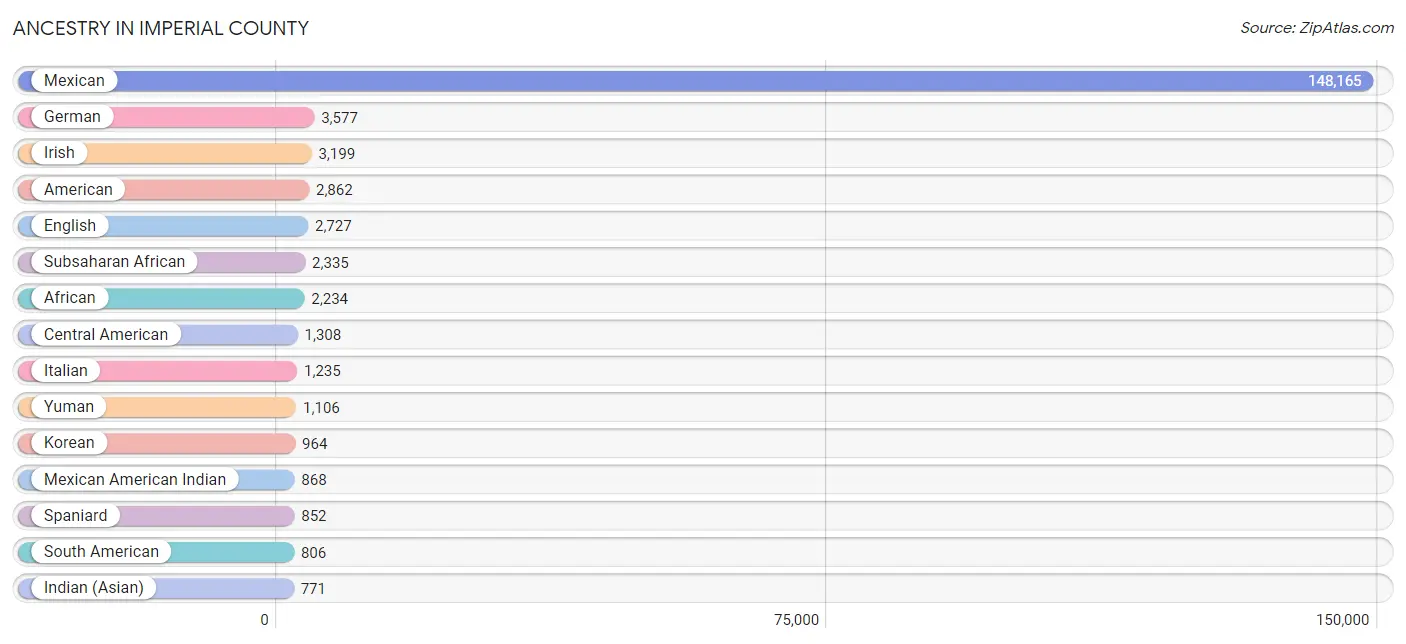
Ancestry in Imperial County
The most populous ancestries reported in Imperial County are Mexican (148,165 | 82.5%), German (3,577 | 2.0%), Irish (3,199 | 1.8%), American (2,862 | 1.6%), and English (2,727 | 1.5%), together accounting for 89.4% of all Imperial County residents.
| Ancestry | # Population | % Population |
| African | 2,234 | 1.2% |
| Alaskan Athabascan | 15 | 0.0% |
| Alsatian | 56 | 0.0% |
| American | 2,862 | 1.6% |
| Apache | 159 | 0.1% |
| Arab | 320 | 0.2% |
| Argentinean | 116 | 0.1% |
| Armenian | 28 | 0.0% |
| Austrian | 82 | 0.1% |
| Bangladeshi | 34 | 0.0% |
| Basque | 25 | 0.0% |
| Belgian | 27 | 0.0% |
| Belizean | 15 | 0.0% |
| Bhutanese | 293 | 0.2% |
| Blackfeet | 62 | 0.0% |
| Bolivian | 33 | 0.0% |
| Brazilian | 19 | 0.0% |
| British | 218 | 0.1% |
| British West Indian | 6 | 0.0% |
| Burmese | 706 | 0.4% |
| Canadian | 10 | 0.0% |
| Cape Verdean | 27 | 0.0% |
| Central American | 1,308 | 0.7% |
| Central American Indian | 271 | 0.2% |
| Cherokee | 237 | 0.1% |
| Chilean | 173 | 0.1% |
| Chippewa | 4 | 0.0% |
| Choctaw | 66 | 0.0% |
| Colombian | 238 | 0.1% |
| Comanche | 5 | 0.0% |
| Croatian | 15 | 0.0% |
| Cuban | 50 | 0.0% |
| Czech | 30 | 0.0% |
| Czechoslovakian | 2 | 0.0% |
| Danish | 115 | 0.1% |
| Dominican | 76 | 0.0% |
| Dutch | 198 | 0.1% |
| Dutch West Indian | 12 | 0.0% |
| Eastern European | 27 | 0.0% |
| Egyptian | 19 | 0.0% |
| English | 2,727 | 1.5% |
| Ethiopian | 29 | 0.0% |
| European | 514 | 0.3% |
| Filipino | 48 | 0.0% |
| Finnish | 12 | 0.0% |
| French | 708 | 0.4% |
| French Canadian | 238 | 0.1% |
| German | 3,577 | 2.0% |
| Greek | 36 | 0.0% |
| Guamanian / Chamorro | 36 | 0.0% |
| Guatemalan | 356 | 0.2% |
| Guyanese | 9 | 0.0% |
| Haitian | 1 | 0.0% |
| Honduran | 116 | 0.1% |
| Hopi | 14 | 0.0% |
| Hungarian | 97 | 0.1% |
| Indian (Asian) | 771 | 0.4% |
| Iranian | 83 | 0.1% |
| Irish | 3,199 | 1.8% |
| Iroquois | 17 | 0.0% |
| Israeli | 67 | 0.0% |
| Italian | 1,235 | 0.7% |
| Jamaican | 183 | 0.1% |
| Japanese | 141 | 0.1% |
| Jordanian | 35 | 0.0% |
| Korean | 964 | 0.5% |
| Lebanese | 32 | 0.0% |
| Lithuanian | 42 | 0.0% |
| Malaysian | 11 | 0.0% |
| Mexican | 148,165 | 82.5% |
| Mexican American Indian | 868 | 0.5% |
| Native Hawaiian | 41 | 0.0% |
| Navajo | 80 | 0.0% |
| Nicaraguan | 193 | 0.1% |
| Nigerian | 45 | 0.0% |
| Northern European | 202 | 0.1% |
| Norwegian | 275 | 0.2% |
| Paiute | 41 | 0.0% |
| Pakistani | 3 | 0.0% |
| Panamanian | 40 | 0.0% |
| Peruvian | 53 | 0.0% |
| Pima | 35 | 0.0% |
| Polish | 267 | 0.2% |
| Portuguese | 291 | 0.2% |
| Pueblo | 3 | 0.0% |
| Puerto Rican | 446 | 0.3% |
| Romanian | 10 | 0.0% |
| Russian | 87 | 0.1% |
| Salvadoran | 603 | 0.3% |
| Samoan | 533 | 0.3% |
| Scandinavian | 76 | 0.0% |
| Scotch-Irish | 191 | 0.1% |
| Scottish | 538 | 0.3% |
| Sioux | 30 | 0.0% |
| Slovene | 31 | 0.0% |
| South American | 806 | 0.4% |
| South American Indian | 7 | 0.0% |
| Spaniard | 852 | 0.5% |
| Spanish | 323 | 0.2% |
| Sri Lankan | 170 | 0.1% |
| Subsaharan African | 2,335 | 1.3% |
| Swedish | 229 | 0.1% |
| Swiss | 267 | 0.2% |
| Thai | 405 | 0.2% |
| Tohono O'Odham | 39 | 0.0% |
| Tongan | 18 | 0.0% |
| Turkish | 37 | 0.0% |
| Ukrainian | 11 | 0.0% |
| Venezuelan | 193 | 0.1% |
| Welsh | 111 | 0.1% |
| West Indian | 147 | 0.1% |
| Yaqui | 152 | 0.1% |
| Yuman | 1,106 | 0.6% | View All 113 Rows |
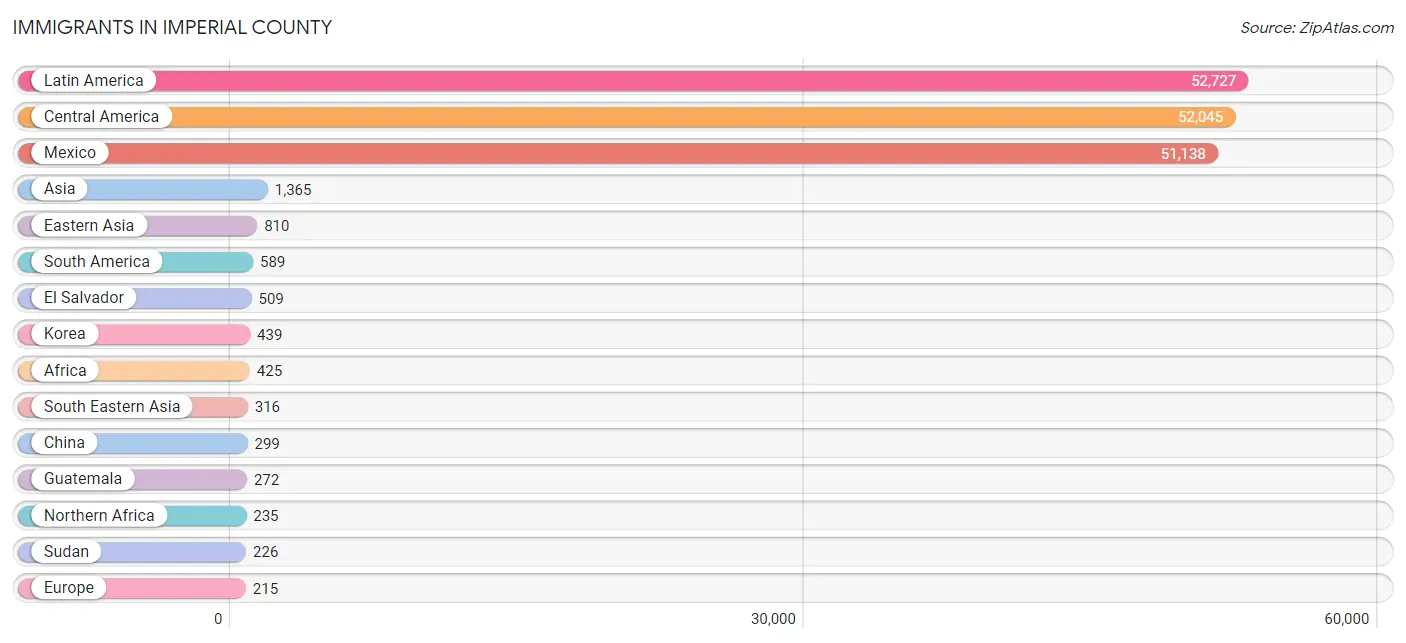
Immigrants in Imperial County
The most numerous immigrant groups reported in Imperial County came from Latin America (52,727 | 29.4%), Central America (52,045 | 29.0%), Mexico (51,138 | 28.5%), Asia (1,365 | 0.8%), and Eastern Asia (810 | 0.4%), together accounting for 88.0% of all Imperial County residents.
| Immigration Origin | # Population | % Population |
| Africa | 425 | 0.2% |
| Argentina | 66 | 0.0% |
| Asia | 1,365 | 0.8% |
| Australia | 19 | 0.0% |
| Belgium | 8 | 0.0% |
| Bolivia | 33 | 0.0% |
| Brazil | 15 | 0.0% |
| Cambodia | 40 | 0.0% |
| Cameroon | 3 | 0.0% |
| Canada | 104 | 0.1% |
| Caribbean | 93 | 0.1% |
| Central America | 52,045 | 29.0% |
| Chile | 169 | 0.1% |
| China | 299 | 0.2% |
| Colombia | 102 | 0.1% |
| Cuba | 7 | 0.0% |
| Czechoslovakia | 22 | 0.0% |
| Eastern Africa | 117 | 0.1% |
| Eastern Asia | 810 | 0.4% |
| Eastern Europe | 44 | 0.0% |
| Egypt | 9 | 0.0% |
| El Salvador | 509 | 0.3% |
| England | 39 | 0.0% |
| Europe | 215 | 0.1% |
| France | 12 | 0.0% |
| Germany | 52 | 0.0% |
| Ghana | 15 | 0.0% |
| Guatemala | 272 | 0.2% |
| Guyana | 9 | 0.0% |
| Honduras | 87 | 0.1% |
| Hong Kong | 7 | 0.0% |
| Hungary | 6 | 0.0% |
| India | 164 | 0.1% |
| Indonesia | 4 | 0.0% |
| Iran | 14 | 0.0% |
| Ireland | 23 | 0.0% |
| Italy | 31 | 0.0% |
| Jamaica | 7 | 0.0% |
| Japan | 49 | 0.0% |
| Kenya | 63 | 0.0% |
| Korea | 439 | 0.2% |
| Laos | 1 | 0.0% |
| Latin America | 52,727 | 29.4% |
| Malaysia | 14 | 0.0% |
| Mexico | 51,138 | 28.5% |
| Middle Africa | 58 | 0.0% |
| Nicaragua | 27 | 0.0% |
| Northern Africa | 235 | 0.1% |
| Northern Europe | 68 | 0.0% |
| Oceania | 23 | 0.0% |
| Pakistan | 6 | 0.0% |
| Panama | 12 | 0.0% |
| Peru | 19 | 0.0% |
| Philippines | 191 | 0.1% |
| Russia | 4 | 0.0% |
| Scotland | 4 | 0.0% |
| South America | 589 | 0.3% |
| South Central Asia | 196 | 0.1% |
| South Eastern Asia | 316 | 0.2% |
| Southern Europe | 31 | 0.0% |
| Sri Lanka | 12 | 0.0% |
| Sudan | 226 | 0.1% |
| Taiwan | 23 | 0.0% |
| Thailand | 3 | 0.0% |
| Turkey | 43 | 0.0% |
| Uganda | 42 | 0.0% |
| Ukraine | 12 | 0.0% |
| Venezuela | 176 | 0.1% |
| Vietnam | 63 | 0.0% |
| Western Africa | 15 | 0.0% |
| Western Asia | 43 | 0.0% |
| Western Europe | 72 | 0.0% | View All 72 Rows |
Sex and Age in Imperial County
Sex and Age in Imperial County
The most populous age groups in Imperial County are 10 to 14 Years (8,335 | 9.0%) for men and 10 to 14 Years (7,495 | 8.6%) for women.
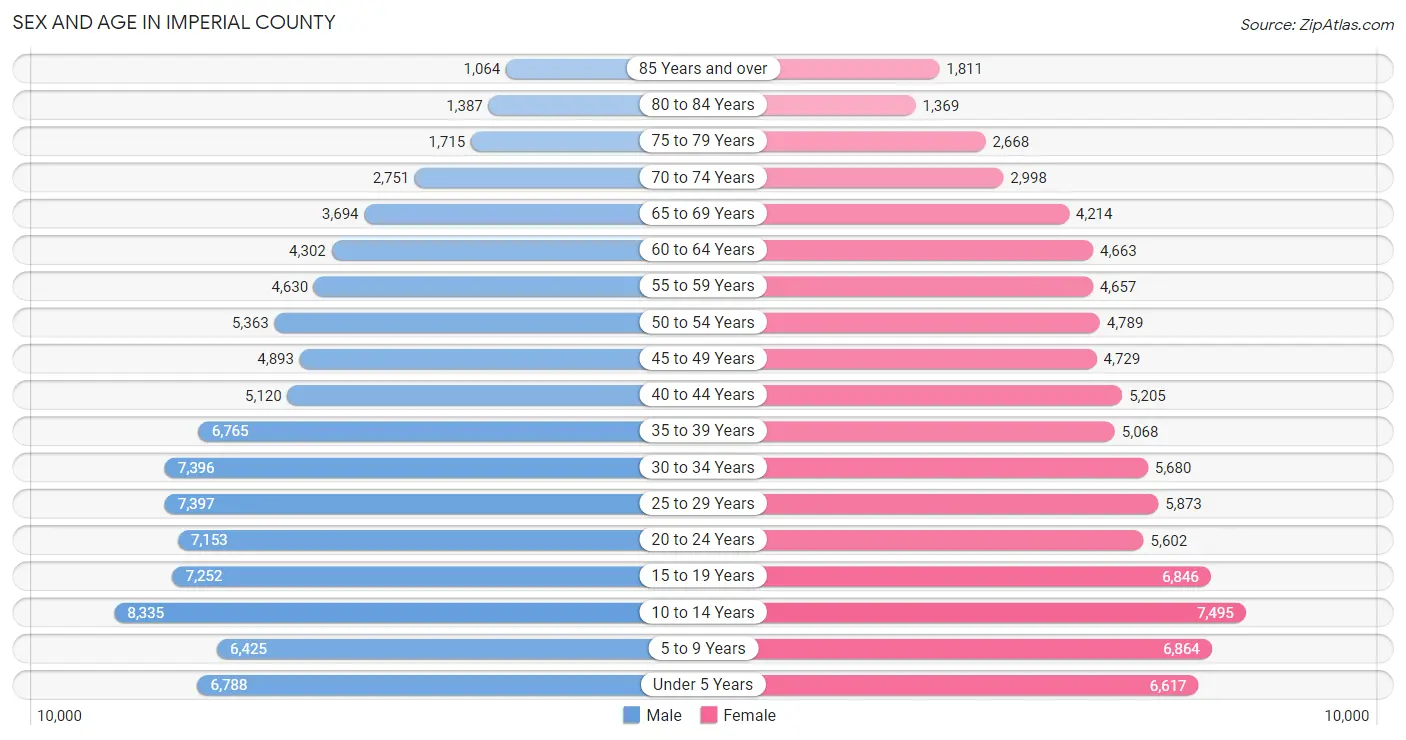
| Age Bracket | Male | Female |
| Under 5 Years | 6,788 (7.3%) | 6,617 (7.6%) |
| 5 to 9 Years | 6,425 (7.0%) | 6,864 (7.9%) |
| 10 to 14 Years | 8,335 (9.0%) | 7,495 (8.6%) |
| 15 to 19 Years | 7,252 (7.9%) | 6,846 (7.9%) |
| 20 to 24 Years | 7,153 (7.7%) | 5,602 (6.4%) |
| 25 to 29 Years | 7,397 (8.0%) | 5,873 (6.7%) |
| 30 to 34 Years | 7,396 (8.0%) | 5,680 (6.5%) |
| 35 to 39 Years | 6,765 (7.3%) | 5,068 (5.8%) |
| 40 to 44 Years | 5,120 (5.5%) | 5,205 (6.0%) |
| 45 to 49 Years | 4,893 (5.3%) | 4,729 (5.4%) |
| 50 to 54 Years | 5,363 (5.8%) | 4,789 (5.5%) |
| 55 to 59 Years | 4,630 (5.0%) | 4,657 (5.3%) |
| 60 to 64 Years | 4,302 (4.6%) | 4,663 (5.3%) |
| 65 to 69 Years | 3,694 (4.0%) | 4,214 (4.8%) |
| 70 to 74 Years | 2,751 (3.0%) | 2,998 (3.4%) |
| 75 to 79 Years | 1,715 (1.9%) | 2,668 (3.1%) |
| 80 to 84 Years | 1,387 (1.5%) | 1,369 (1.6%) |
| 85 Years and over | 1,064 (1.1%) | 1,811 (2.1%) |
| Total | 92,430 (100.0%) | 87,148 (100.0%) |
Families and Households in Imperial County
Median Family Size in Imperial County
The median family size in Imperial County is 4.36 persons per family, with single female/mother families (9,008 | 25.8%) accounting for the largest median family size of 4.68 persons per family. On the other hand, single male/father families (3,576 | 10.3%) represent the smallest median family size with 3.71 persons per family.
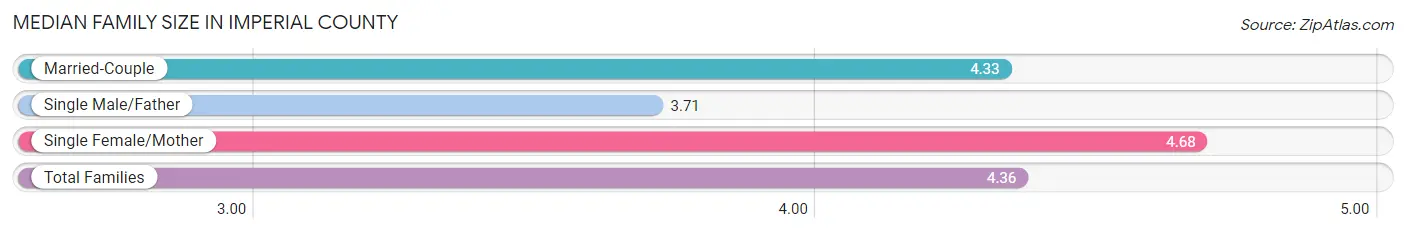
| Family Type | # Families | Family Size |
| Married-Couple | 22,278 (63.9%) | 4.33 |
| Single Male/Father | 3,576 (10.3%) | 3.71 |
| Single Female/Mother | 9,008 (25.8%) | 4.68 |
| Total Families | 34,862 (100.0%) | 4.36 |
Median Household Size in Imperial County
The median household size in Imperial County is 3.65 persons per household, with single female/mother households (9,008 | 19.2%) accounting for the largest median household size of 4.91 persons per household. non-family households (12,162 | 25.9%) represent the smallest median household size with 1.23 persons per household.
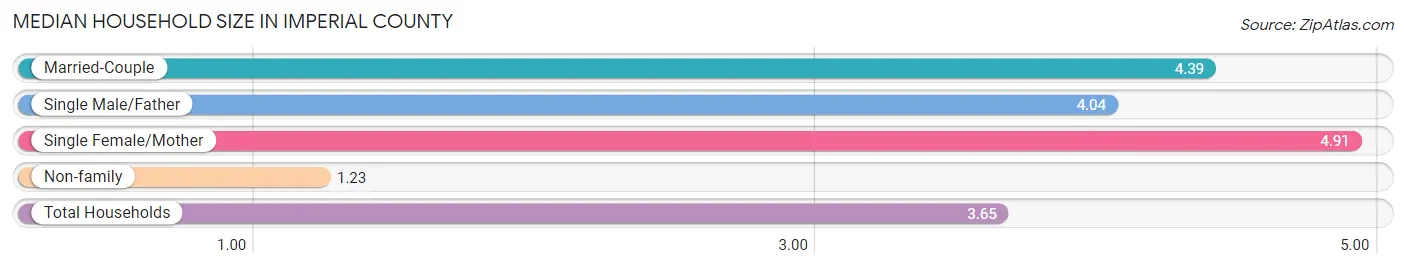
| Household Type | # Households | Household Size |
| Married-Couple | 22,278 (47.4%) | 4.39 |
| Single Male/Father | 3,576 (7.6%) | 4.04 |
| Single Female/Mother | 9,008 (19.2%) | 4.91 |
| Non-family | 12,162 (25.9%) | 1.23 |
| Total Households | 47,024 (100.0%) | 3.65 |
Household Size by Marriage Status in Imperial County
Out of a total of 47,024 households in Imperial County, 34,862 (74.1%) are family households, while 12,162 (25.9%) are nonfamily households. The most numerous type of family households are 2-person households, comprising 10,786, and the most common type of nonfamily households are 1-person households, comprising 10,622.
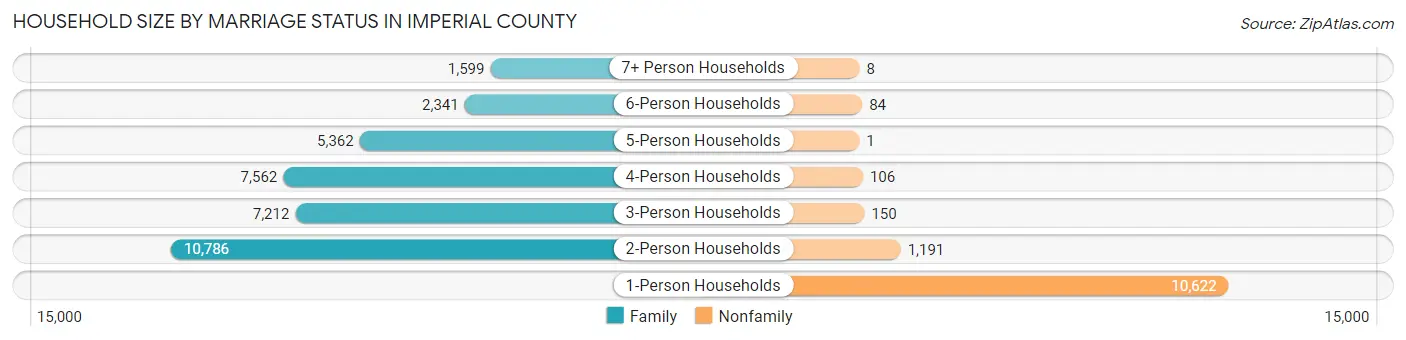
| Household Size | Family Households | Nonfamily Households |
| 1-Person Households | - | 10,622 (22.6%) |
| 2-Person Households | 10,786 (22.9%) | 1,191 (2.5%) |
| 3-Person Households | 7,212 (15.3%) | 150 (0.3%) |
| 4-Person Households | 7,562 (16.1%) | 106 (0.2%) |
| 5-Person Households | 5,362 (11.4%) | 1 (0.0%) |
| 6-Person Households | 2,341 (5.0%) | 84 (0.2%) |
| 7+ Person Households | 1,599 (3.4%) | 8 (0.0%) |
| Total | 34,862 (74.1%) | 12,162 (25.9%) |
Female Fertility in Imperial County
Fertility by Age in Imperial County
Average fertility rate in Imperial County is 60.0 births per 1,000 women. Women in the age bracket of 20 to 34 years have the highest fertility rate with 108.0 births per 1,000 women. Women in the age bracket of 20 to 34 years acount for 77.5% of all women with births.
| Age Bracket | Women with Births | Births / 1,000 Women |
| 15 to 19 years | 188 (7.9%) | 27.0 |
| 20 to 34 years | 1,854 (77.5%) | 108.0 |
| 35 to 50 years | 349 (14.6%) | 22.0 |
| Total | 2,391 (100.0%) | 60.0 |
Fertility by Age by Marriage Status in Imperial County
40.6% of women with births (2,391) in Imperial County are married. The highest percentage of unmarried women with births falls into 15 to 19 years age bracket with 100.0% of them unmarried at the time of birth, while the lowest percentage of unmarried women with births belong to 35 to 50 years age bracket with 24.6% of them unmarried.
| Age Bracket | Married | Unmarried |
| 15 to 19 years | 0 (0.0%) | 188 (100.0%) |
| 20 to 34 years | 706 (38.1%) | 1,148 (61.9%) |
| 35 to 50 years | 263 (75.4%) | 86 (24.6%) |
| Total | 971 (40.6%) | 1,420 (59.4%) |
Fertility by Education in Imperial County
Average fertility rate in Imperial County is 60.0 births per 1,000 women. Women with the education attainment of less than high school have the highest fertility rate of 77.0 births per 1,000 women, while women with the education attainment of graduate degree have the lowest fertility at 31.0 births per 1,000 women. Women with the education attainment of less than high school represent 30.0% of all women with births.
| Educational Attainment | Women with Births | Births / 1,000 Women |
| Less than High School | 718 (30.0%) | 77.0 |
| High School Diploma | 583 (24.4%) | 68.0 |
| College or Associate's Degree | 633 (26.5%) | 42.0 |
| Bachelor's Degree | 414 (17.3%) | 74.0 |
| Graduate Degree | 43 (1.8%) | 31.0 |
| Total | 2,391 (100.0%) | 60.0 |
Fertility by Education by Marriage Status in Imperial County
59.4% of women with births in Imperial County are unmarried. Women with the educational attainment of graduate degree are most likely to be married with 100.0% of them married at childbirth, while women with the educational attainment of high school diploma are least likely to be married with 68.4% of them unmarried at childbirth.
| Educational Attainment | Married | Unmarried |
| Less than High School | 287 (40.0%) | 431 (60.0%) |
| High School Diploma | 184 (31.6%) | 399 (68.4%) |
| College or Associate's Degree | 317 (50.1%) | 316 (49.9%) |
| Bachelor's Degree | 139 (33.6%) | 275 (66.4%) |
| Graduate Degree | 43 (100.0%) | 0 (0.0%) |
| Total | 971 (40.6%) | 1,420 (59.4%) |
Employment Characteristics in Imperial County
Employment by Class of Employer in Imperial County
Among the 59,335 employed individuals in Imperial County, private company employees (37,249 | 62.8%), local government employees (7,837 | 13.2%), and state government employees (4,491 | 7.6%) make up the most common classes of employment.
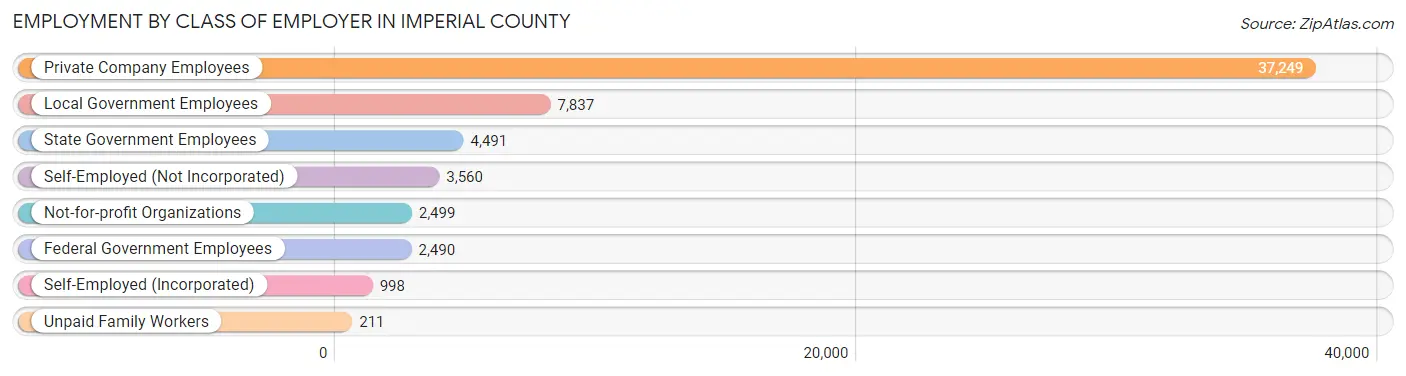
| Employer Class | # Employees | % Employees |
| Private Company Employees | 37,249 | 62.8% |
| Self-Employed (Incorporated) | 998 | 1.7% |
| Self-Employed (Not Incorporated) | 3,560 | 6.0% |
| Not-for-profit Organizations | 2,499 | 4.2% |
| Local Government Employees | 7,837 | 13.2% |
| State Government Employees | 4,491 | 7.6% |
| Federal Government Employees | 2,490 | 4.2% |
| Unpaid Family Workers | 211 | 0.4% |
| Total | 59,335 | 100.0% |
Employment Status by Age in Imperial County
According to the labor force statistics for Imperial County, out of the total population over 16 years of age (133,938), 52.3% or 70,050 individuals are in the labor force, with 13.2% or 9,247 of them unemployed. The age group with the highest labor force participation rate is 35 to 44 years, with 73.6% or 16,308 individuals in the labor force. Within the labor force, the 20 to 24 years age range has the highest percentage of unemployed individuals, with 25.7% or 1,823 of them being unemployed.
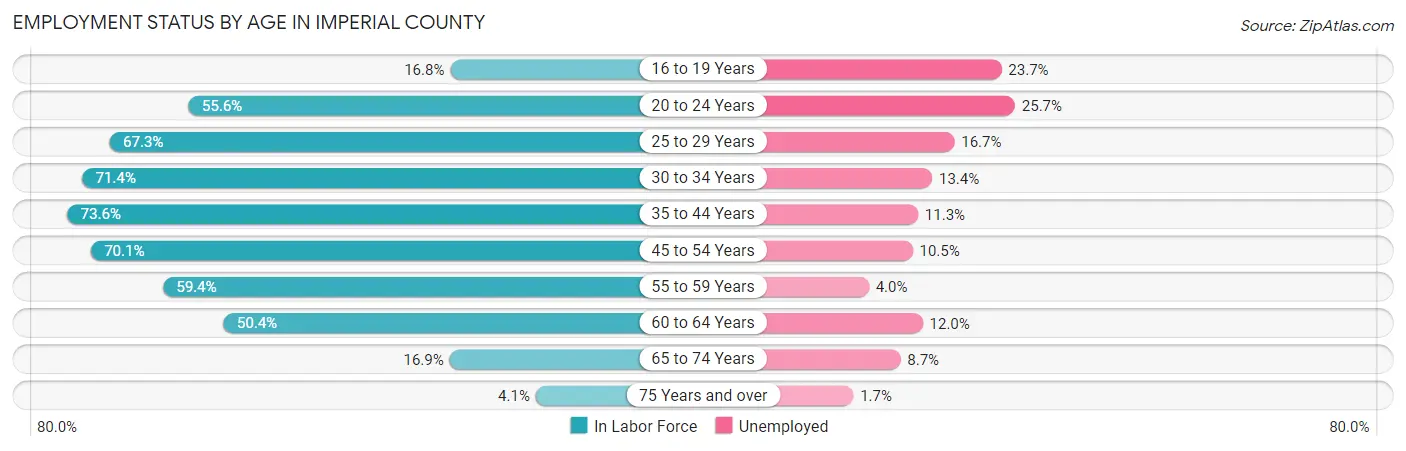
| Age Bracket | In Labor Force | Unemployed |
| 16 to 19 Years | 1,845 (16.8%) | 437 (23.7%) |
| 20 to 24 Years | 7,092 (55.6%) | 1,823 (25.7%) |
| 25 to 29 Years | 8,931 (67.3%) | 1,491 (16.7%) |
| 30 to 34 Years | 9,336 (71.4%) | 1,251 (13.4%) |
| 35 to 44 Years | 16,308 (73.6%) | 1,843 (11.3%) |
| 45 to 54 Years | 13,862 (70.1%) | 1,456 (10.5%) |
| 55 to 59 Years | 5,516 (59.4%) | 221 (4.0%) |
| 60 to 64 Years | 4,518 (50.4%) | 542 (12.0%) |
| 65 to 74 Years | 2,308 (16.9%) | 201 (8.7%) |
| 75 Years and over | 411 (4.1%) | 7 (1.7%) |
| Total | 70,050 (52.3%) | 9,247 (13.2%) |
Employment Status by Educational Attainment in Imperial County
According to labor force statistics for Imperial County, 67.6% of individuals (58,494) out of the total population between 25 and 64 years of age (86,530) are in the labor force, with 11.6% or 6,785 of them being unemployed. The group with the highest labor force participation rate are those with the educational attainment of bachelor's degree or higher, with 83.2% or 12,504 individuals in the labor force. Within the labor force, individuals with less than high school education have the highest percentage of unemployment, with 19.3% or 1,945 of them being unemployed.
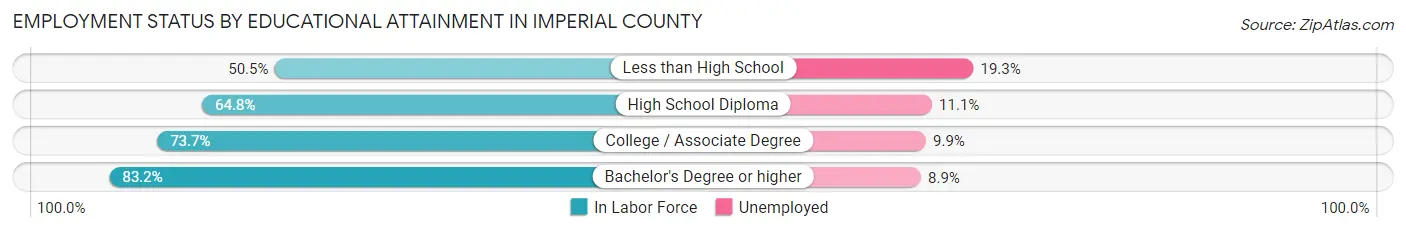
| Educational Attainment | In Labor Force | Unemployed |
| Less than High School | 10,079 (50.5%) | 3,852 (19.3%) |
| High School Diploma | 15,174 (64.8%) | 2,599 (11.1%) |
| College / Associate Degree | 20,730 (73.7%) | 2,785 (9.9%) |
| Bachelor's Degree or higher | 12,504 (83.2%) | 1,338 (8.9%) |
| Total | 58,494 (67.6%) | 10,037 (11.6%) |
Employment Occupations by Sex in Imperial County
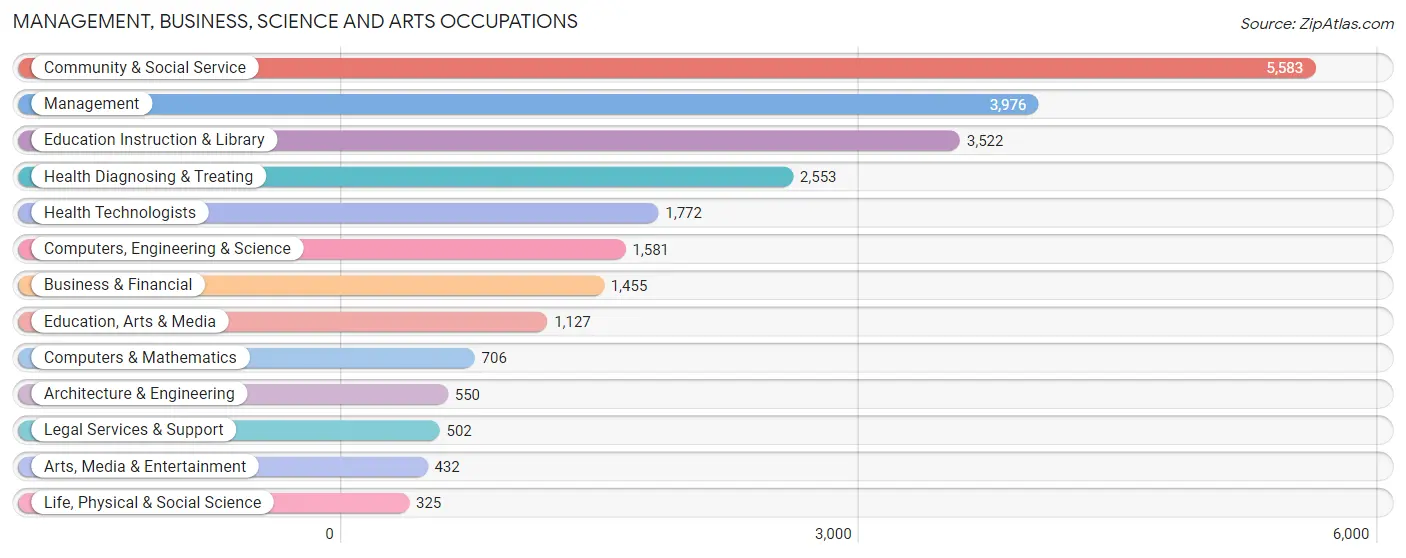
Management, Business, Science and Arts Occupations
The most common Management, Business, Science and Arts occupations in Imperial County are Community & Social Service (5,583 | 9.2%), Management (3,976 | 6.6%), Education Instruction & Library (3,522 | 5.8%), Health Diagnosing & Treating (2,553 | 4.2%), and Health Technologists (1,772 | 2.9%).
Management, Business, Science and Arts Occupations by Sex
Within the Management, Business, Science and Arts occupations in Imperial County, the most male-oriented occupations are Architecture & Engineering (88.5%), Computers & Mathematics (81.9%), and Computers, Engineering & Science (81.6%), while the most female-oriented occupations are Health Diagnosing & Treating (74.2%), Health Technologists (70.4%), and Education Instruction & Library (69.6%).
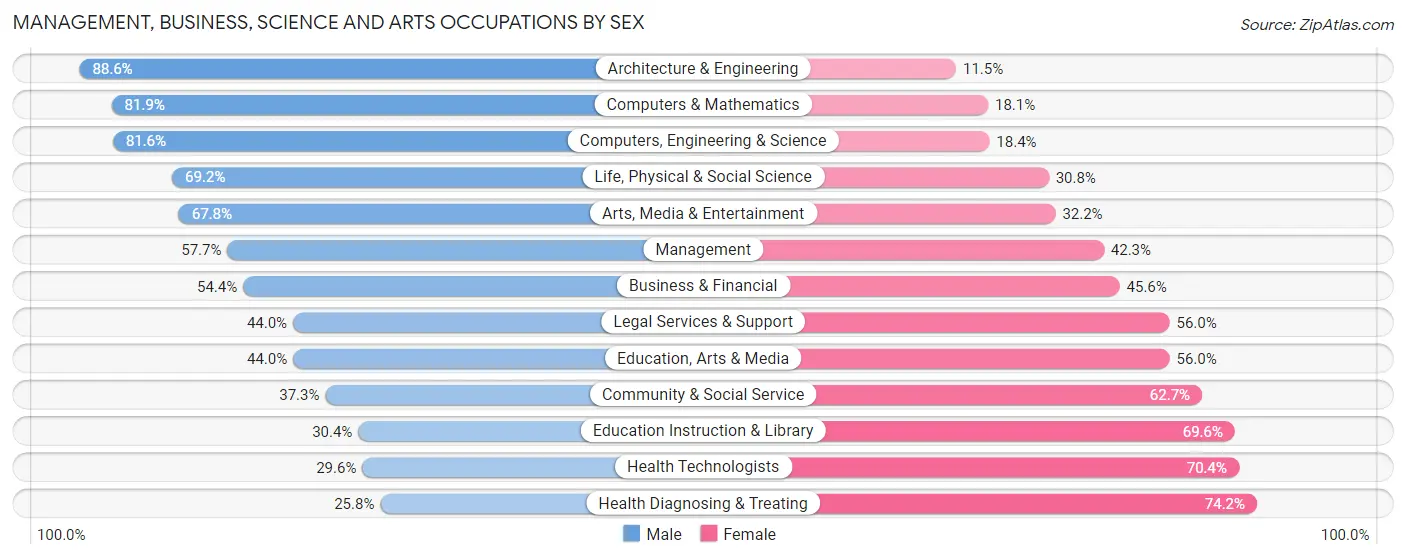
| Occupation | Male | Female |
| Management | 2,295 (57.7%) | 1,681 (42.3%) |
| Business & Financial | 792 (54.4%) | 663 (45.6%) |
| Computers, Engineering & Science | 1,290 (81.6%) | 291 (18.4%) |
| Computers & Mathematics | 578 (81.9%) | 128 (18.1%) |
| Architecture & Engineering | 487 (88.5%) | 63 (11.5%) |
| Life, Physical & Social Science | 225 (69.2%) | 100 (30.8%) |
| Community & Social Service | 2,081 (37.3%) | 3,502 (62.7%) |
| Education, Arts & Media | 496 (44.0%) | 631 (56.0%) |
| Legal Services & Support | 221 (44.0%) | 281 (56.0%) |
| Education Instruction & Library | 1,071 (30.4%) | 2,451 (69.6%) |
| Arts, Media & Entertainment | 293 (67.8%) | 139 (32.2%) |
| Health Diagnosing & Treating | 659 (25.8%) | 1,894 (74.2%) |
| Health Technologists | 524 (29.6%) | 1,248 (70.4%) |
| Total (Category) | 7,117 (47.0%) | 8,031 (53.0%) |
| Total (Overall) | 33,415 (55.2%) | 27,122 (44.8%) |
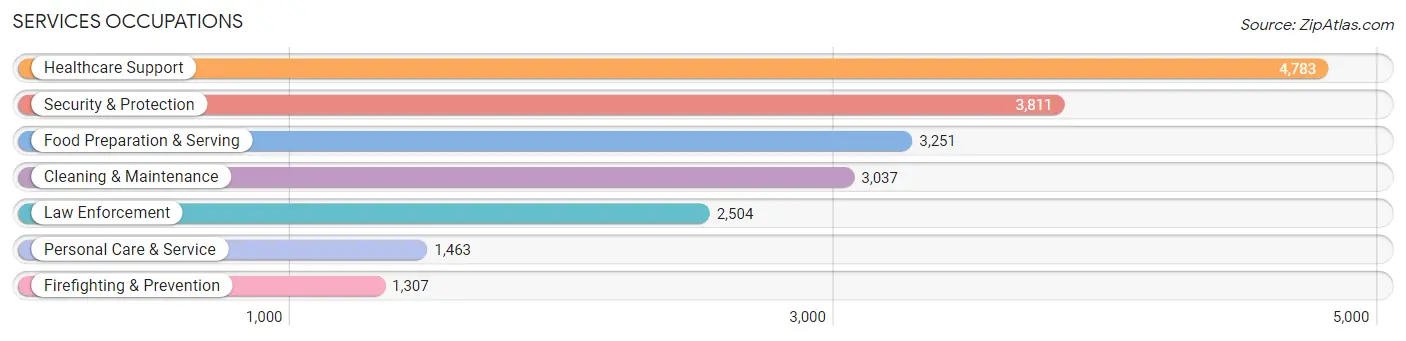
Services Occupations
The most common Services occupations in Imperial County are Healthcare Support (4,783 | 7.9%), Security & Protection (3,811 | 6.3%), Food Preparation & Serving (3,251 | 5.4%), Cleaning & Maintenance (3,037 | 5.0%), and Law Enforcement (2,504 | 4.1%).
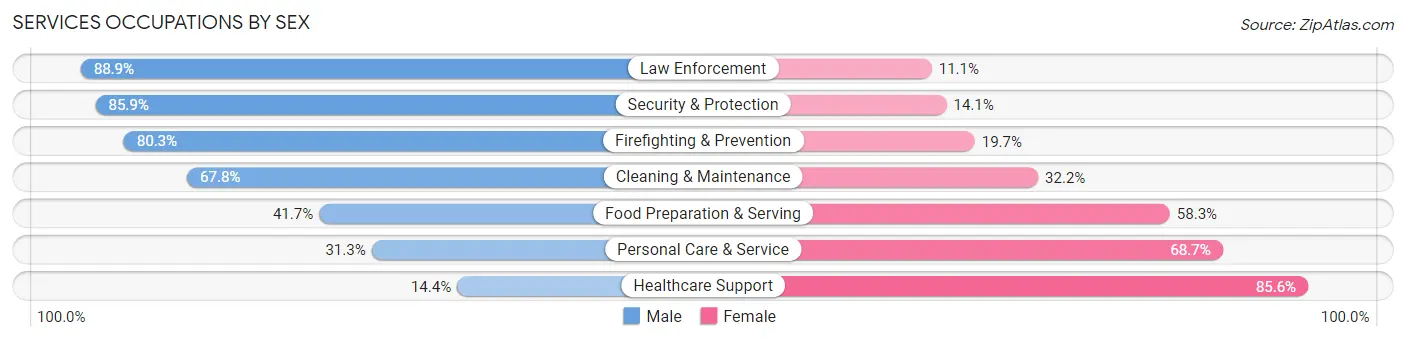
Services Occupations by Sex
Within the Services occupations in Imperial County, the most male-oriented occupations are Law Enforcement (88.9%), Security & Protection (85.9%), and Firefighting & Prevention (80.3%), while the most female-oriented occupations are Healthcare Support (85.6%), Personal Care & Service (68.7%), and Food Preparation & Serving (58.3%).
| Occupation | Male | Female |
| Healthcare Support | 688 (14.4%) | 4,095 (85.6%) |
| Security & Protection | 3,275 (85.9%) | 536 (14.1%) |
| Firefighting & Prevention | 1,050 (80.3%) | 257 (19.7%) |
| Law Enforcement | 2,225 (88.9%) | 279 (11.1%) |
| Food Preparation & Serving | 1,356 (41.7%) | 1,895 (58.3%) |
| Cleaning & Maintenance | 2,059 (67.8%) | 978 (32.2%) |
| Personal Care & Service | 458 (31.3%) | 1,005 (68.7%) |
| Total (Category) | 7,836 (47.9%) | 8,509 (52.1%) |
| Total (Overall) | 33,415 (55.2%) | 27,122 (44.8%) |
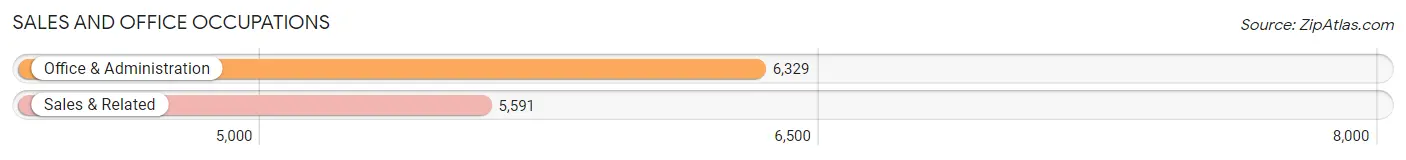
Sales and Office Occupations
The most common Sales and Office occupations in Imperial County are Office & Administration (6,329 | 10.4%), and Sales & Related (5,591 | 9.2%).
Sales and Office Occupations by Sex
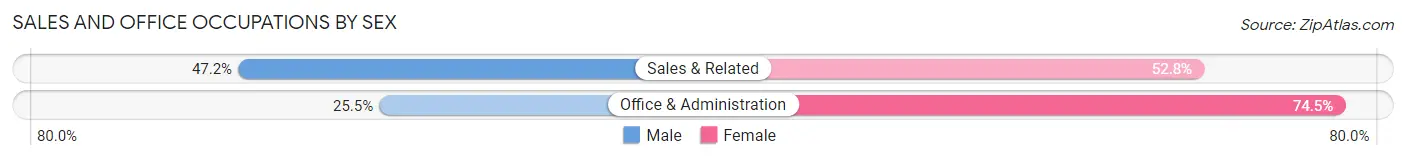
| Occupation | Male | Female |
| Sales & Related | 2,638 (47.2%) | 2,953 (52.8%) |
| Office & Administration | 1,612 (25.5%) | 4,717 (74.5%) |
| Total (Category) | 4,250 (35.6%) | 7,670 (64.3%) |
| Total (Overall) | 33,415 (55.2%) | 27,122 (44.8%) |
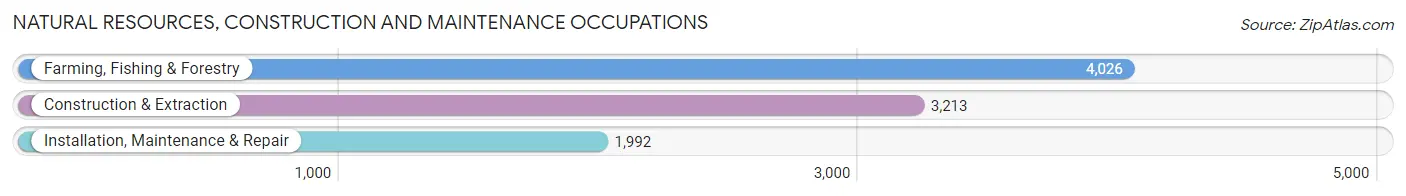
Natural Resources, Construction and Maintenance Occupations
The most common Natural Resources, Construction and Maintenance occupations in Imperial County are Farming, Fishing & Forestry (4,026 | 6.7%), Construction & Extraction (3,213 | 5.3%), and Installation, Maintenance & Repair (1,992 | 3.3%).
Natural Resources, Construction and Maintenance Occupations by Sex
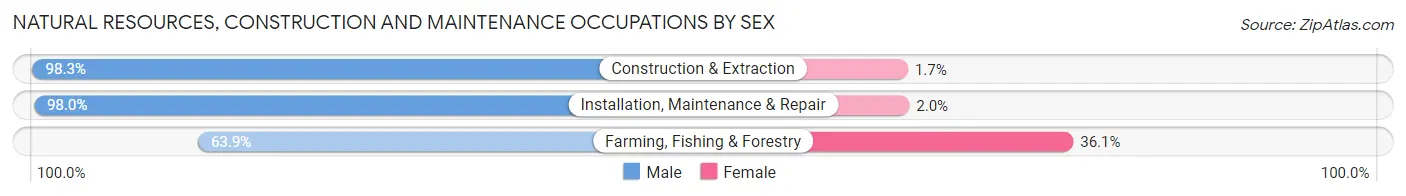
| Occupation | Male | Female |
| Farming, Fishing & Forestry | 2,574 (63.9%) | 1,452 (36.1%) |
| Construction & Extraction | 3,159 (98.3%) | 54 (1.7%) |
| Installation, Maintenance & Repair | 1,953 (98.0%) | 39 (2.0%) |
| Total (Category) | 7,686 (83.3%) | 1,545 (16.7%) |
| Total (Overall) | 33,415 (55.2%) | 27,122 (44.8%) |
Production, Transportation and Moving Occupations
The most common Production, Transportation and Moving occupations in Imperial County are Material Moving (2,989 | 4.9%), Transportation (2,674 | 4.4%), and Production (2,230 | 3.7%).
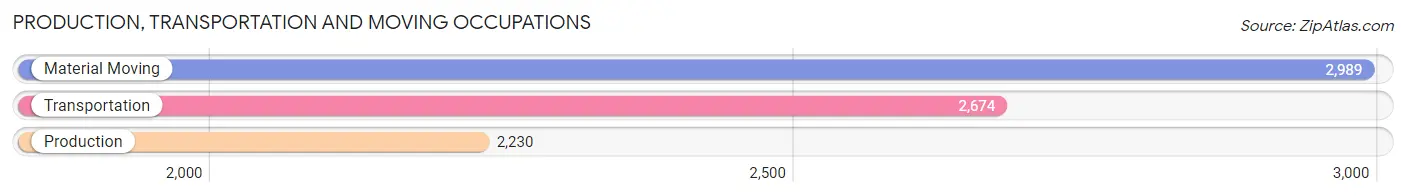
Production, Transportation and Moving Occupations by Sex
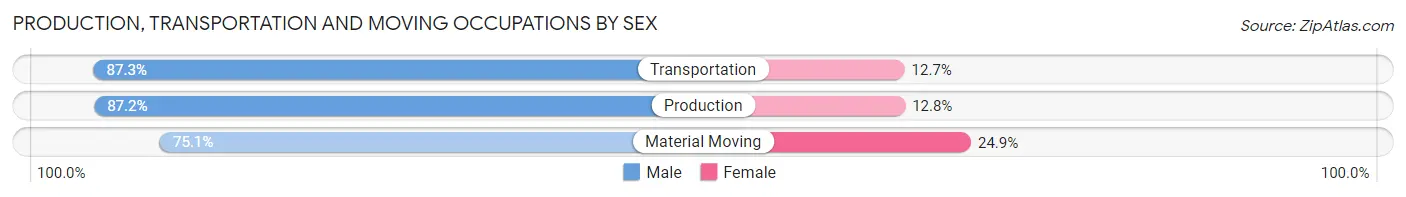
| Occupation | Male | Female |
| Production | 1,945 (87.2%) | 285 (12.8%) |
| Transportation | 2,335 (87.3%) | 339 (12.7%) |
| Material Moving | 2,246 (75.1%) | 743 (24.9%) |
| Total (Category) | 6,526 (82.7%) | 1,367 (17.3%) |
| Total (Overall) | 33,415 (55.2%) | 27,122 (44.8%) |
Employment Industries by Sex in Imperial County
Employment Industries in Imperial County
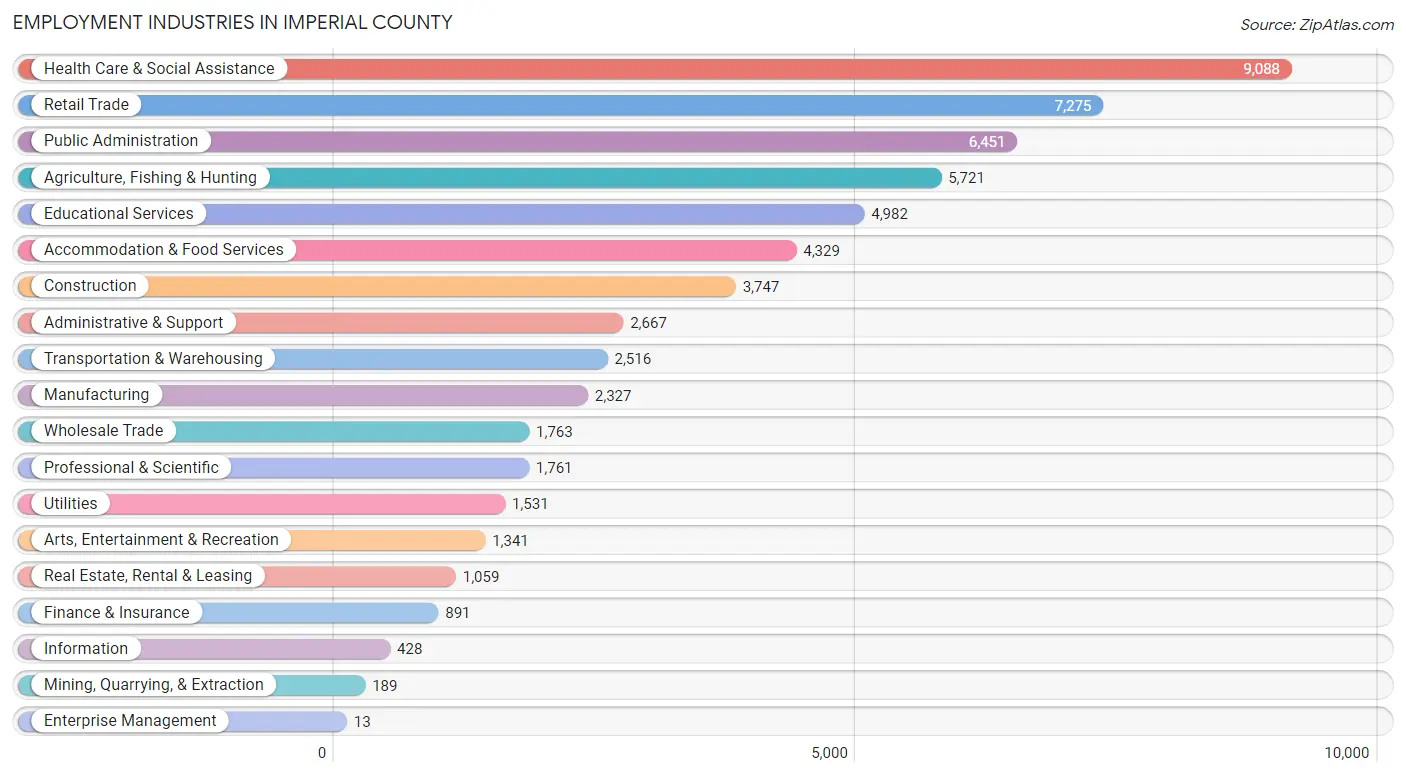
The major employment industries in Imperial County include Health Care & Social Assistance (9,088 | 15.0%), Retail Trade (7,275 | 12.0%), Public Administration (6,451 | 10.7%), Agriculture, Fishing & Hunting (5,721 | 9.5%), and Educational Services (4,982 | 8.2%).
Employment Industries by Sex in Imperial County
The Imperial County industries that see more men than women are Mining, Quarrying, & Extraction (100.0%), Construction (92.4%), and Utilities (85.3%), whereas the industries that tend to have a higher number of women are Enterprise Management (100.0%), Health Care & Social Assistance (80.6%), and Educational Services (64.1%).
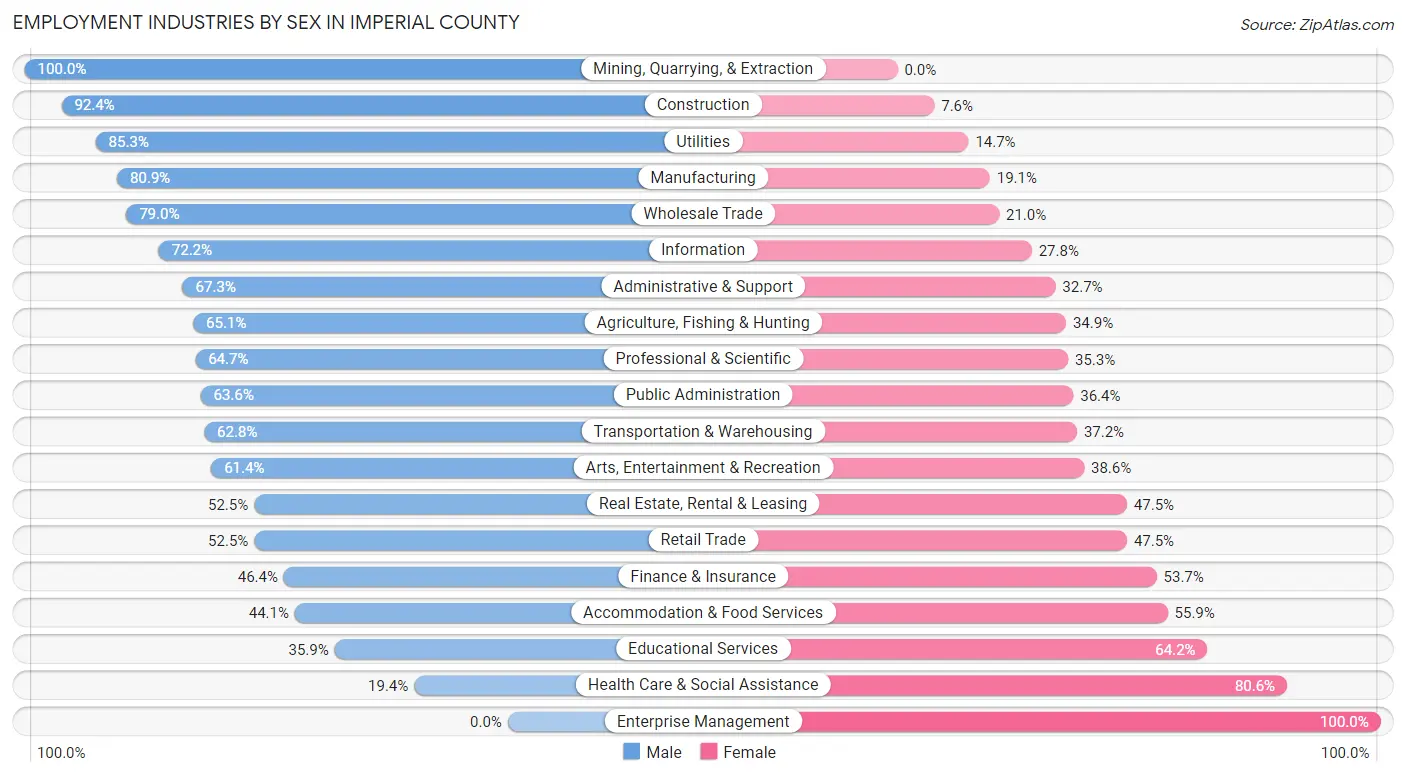
| Industry | Male | Female |
| Agriculture, Fishing & Hunting | 3,725 (65.1%) | 1,996 (34.9%) |
| Mining, Quarrying, & Extraction | 189 (100.0%) | 0 (0.0%) |
| Construction | 3,461 (92.4%) | 286 (7.6%) |
| Manufacturing | 1,882 (80.9%) | 445 (19.1%) |
| Wholesale Trade | 1,392 (79.0%) | 371 (21.0%) |
| Retail Trade | 3,819 (52.5%) | 3,456 (47.5%) |
| Transportation & Warehousing | 1,581 (62.8%) | 935 (37.2%) |
| Utilities | 1,306 (85.3%) | 225 (14.7%) |
| Information | 309 (72.2%) | 119 (27.8%) |
| Finance & Insurance | 413 (46.4%) | 478 (53.6%) |
| Real Estate, Rental & Leasing | 556 (52.5%) | 503 (47.5%) |
| Professional & Scientific | 1,139 (64.7%) | 622 (35.3%) |
| Enterprise Management | 0 (0.0%) | 13 (100.0%) |
| Administrative & Support | 1,795 (67.3%) | 872 (32.7%) |
| Educational Services | 1,786 (35.8%) | 3,196 (64.1%) |
| Health Care & Social Assistance | 1,761 (19.4%) | 7,327 (80.6%) |
| Arts, Entertainment & Recreation | 823 (61.4%) | 518 (38.6%) |
| Accommodation & Food Services | 1,908 (44.1%) | 2,421 (55.9%) |
| Public Administration | 4,102 (63.6%) | 2,349 (36.4%) |
| Total | 33,415 (55.2%) | 27,122 (44.8%) |
Education in Imperial County
School Enrollment in Imperial County
The most common levels of schooling among the 54,972 students in Imperial County are high school (14,226 | 25.9%), middle school (11,706 | 21.3%), and college / undergraduate (11,569 | 21.0%).
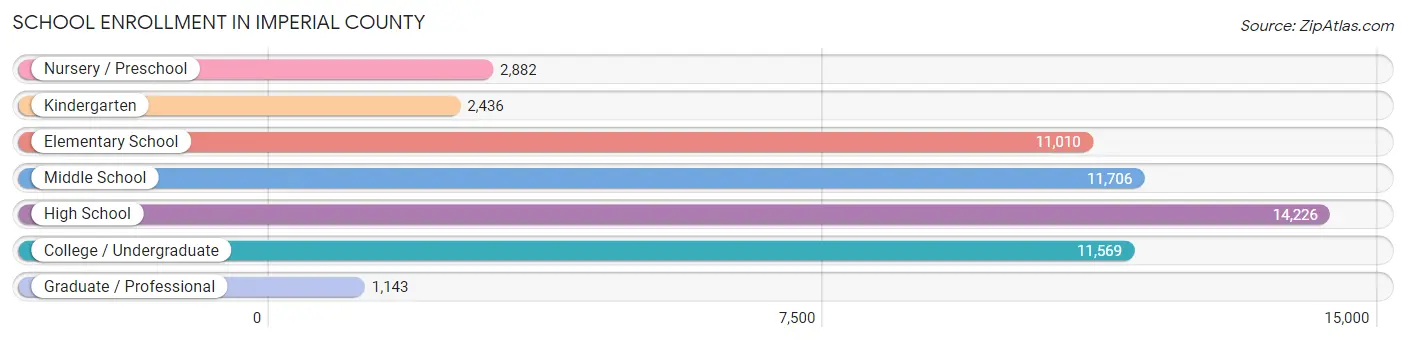
| School Level | # Students | % Students |
| Nursery / Preschool | 2,882 | 5.2% |
| Kindergarten | 2,436 | 4.4% |
| Elementary School | 11,010 | 20.0% |
| Middle School | 11,706 | 21.3% |
| High School | 14,226 | 25.9% |
| College / Undergraduate | 11,569 | 21.0% |
| Graduate / Professional | 1,143 | 2.1% |
| Total | 54,972 | 100.0% |
School Enrollment by Age by Funding Source in Imperial County
Out of a total of 54,972 students who are enrolled in schools in Imperial County, 1,869 (3.4%) attend a private institution, while the remaining 53,103 (96.6%) are enrolled in public schools. The age group of 3 to 4 year olds has the highest likelihood of being enrolled in private schools, with 482 (20.7% in the age bracket) enrolled. Conversely, the age group of 18 to 19 year olds has the lowest likelihood of being enrolled in a private school, with 4,414 (99.4% in the age bracket) attending a public institution.
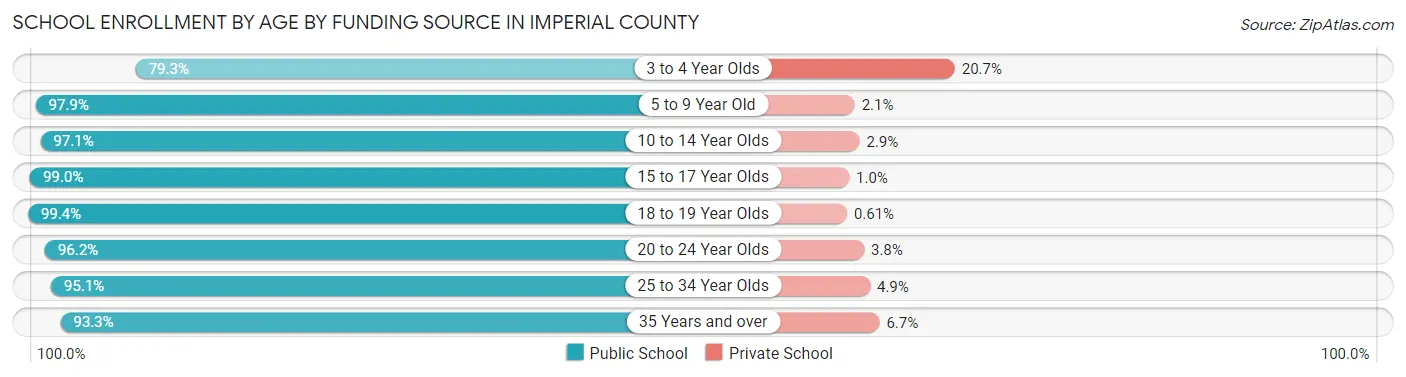
| Age Bracket | Public School | Private School |
| 3 to 4 Year Olds | 1,847 (79.3%) | 482 (20.7%) |
| 5 to 9 Year Old | 12,243 (97.9%) | 258 (2.1%) |
| 10 to 14 Year Olds | 15,134 (97.1%) | 458 (2.9%) |
| 15 to 17 Year Olds | 8,327 (99.0%) | 85 (1.0%) |
| 18 to 19 Year Olds | 4,414 (99.4%) | 27 (0.6%) |
| 20 to 24 Year Olds | 4,389 (96.2%) | 173 (3.8%) |
| 25 to 34 Year Olds | 3,818 (95.1%) | 197 (4.9%) |
| 35 Years and over | 2,912 (93.3%) | 208 (6.7%) |
| Total | 53,103 (96.6%) | 1,869 (3.4%) |
Educational Attainment by Field of Study in Imperial County
Business (2,823 | 15.4%), education (2,749 | 15.0%), arts & humanities (1,895 | 10.4%), psychology (1,851 | 10.1%), and science & technology (1,624 | 8.9%) are the most common fields of study among 18,266 individuals in Imperial County who have obtained a bachelor's degree or higher.
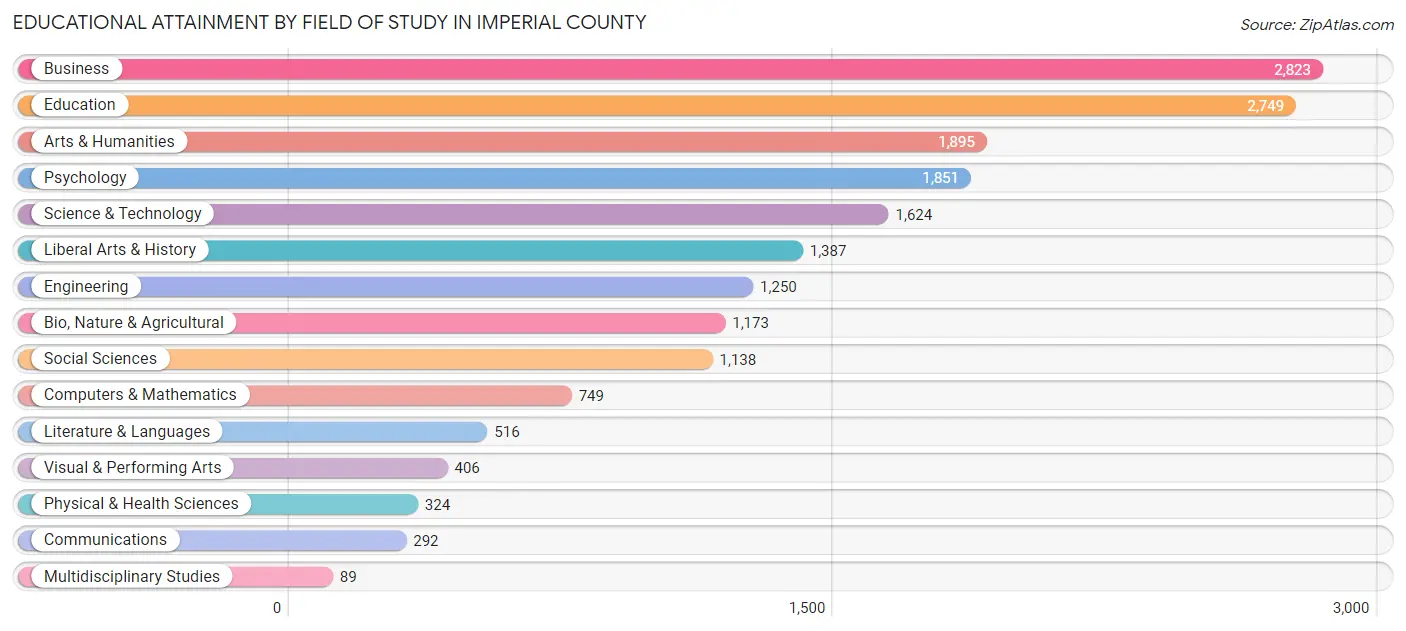
| Field of Study | # Graduates | % Graduates |
| Computers & Mathematics | 749 | 4.1% |
| Bio, Nature & Agricultural | 1,173 | 6.4% |
| Physical & Health Sciences | 324 | 1.8% |
| Psychology | 1,851 | 10.1% |
| Social Sciences | 1,138 | 6.2% |
| Engineering | 1,250 | 6.8% |
| Multidisciplinary Studies | 89 | 0.5% |
| Science & Technology | 1,624 | 8.9% |
| Business | 2,823 | 15.4% |
| Education | 2,749 | 15.0% |
| Literature & Languages | 516 | 2.8% |
| Liberal Arts & History | 1,387 | 7.6% |
| Visual & Performing Arts | 406 | 2.2% |
| Communications | 292 | 1.6% |
| Arts & Humanities | 1,895 | 10.4% |
| Total | 18,266 | 100.0% |
Transportation & Commute in Imperial County
Vehicle Availability by Sex in Imperial County
The most prevalent vehicle ownership categories in Imperial County are males with 2 vehicles (12,674, accounting for 38.6%) and females with 2 vehicles (9,286, making up 48.5%).
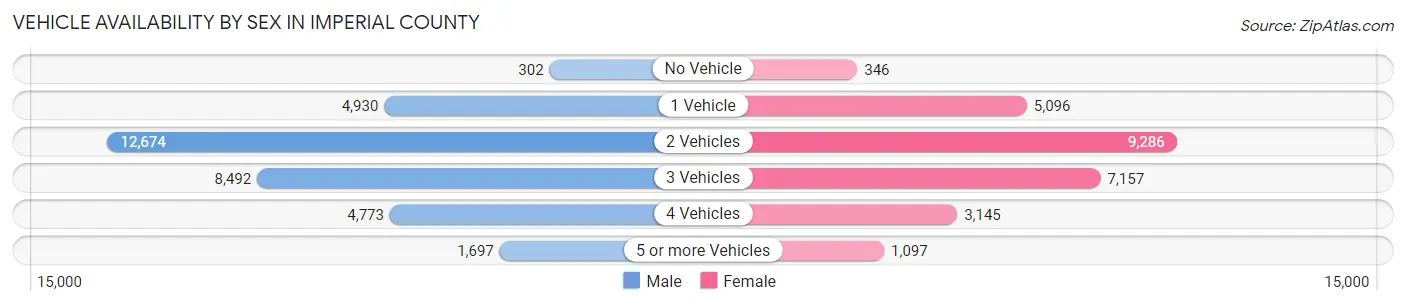
| Vehicles Available | Male | Female |
| No Vehicle | 302 (0.9%) | 346 (1.3%) |
| 1 Vehicle | 4,930 (15.0%) | 5,096 (19.5%) |
| 2 Vehicles | 12,674 (38.6%) | 9,286 (35.5%) |
| 3 Vehicles | 8,492 (25.8%) | 7,157 (27.4%) |
| 4 Vehicles | 4,773 (14.5%) | 3,145 (12.0%) |
| 5 or more Vehicles | 1,697 (5.2%) | 1,097 (4.2%) |
| Total | 32,868 (100.0%) | 26,127 (100.0%) |
Commute Time in Imperial County
The most frequently occuring commute durations in Imperial County are 15 to 19 minutes (10,401 commuters, 18.6%), 10 to 14 minutes (9,843 commuters, 17.6%), and 20 to 24 minutes (8,469 commuters, 15.2%).
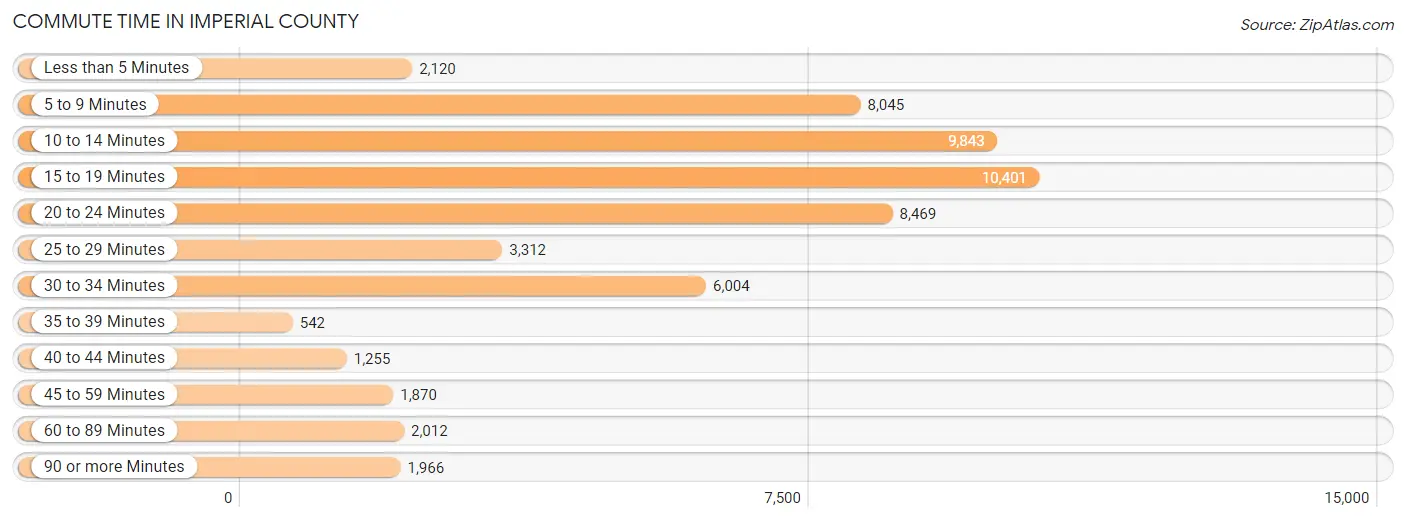
| Commute Time | # Commuters | % Commuters |
| Less than 5 Minutes | 2,120 | 3.8% |
| 5 to 9 Minutes | 8,045 | 14.4% |
| 10 to 14 Minutes | 9,843 | 17.6% |
| 15 to 19 Minutes | 10,401 | 18.6% |
| 20 to 24 Minutes | 8,469 | 15.2% |
| 25 to 29 Minutes | 3,312 | 5.9% |
| 30 to 34 Minutes | 6,004 | 10.7% |
| 35 to 39 Minutes | 542 | 1.0% |
| 40 to 44 Minutes | 1,255 | 2.2% |
| 45 to 59 Minutes | 1,870 | 3.4% |
| 60 to 89 Minutes | 2,012 | 3.6% |
| 90 or more Minutes | 1,966 | 3.5% |
Commute Time by Sex in Imperial County
The most common commute times in Imperial County are 15 to 19 minutes (5,725 commuters, 18.1%) for males and 10 to 14 minutes (5,032 commuters, 20.8%) for females.
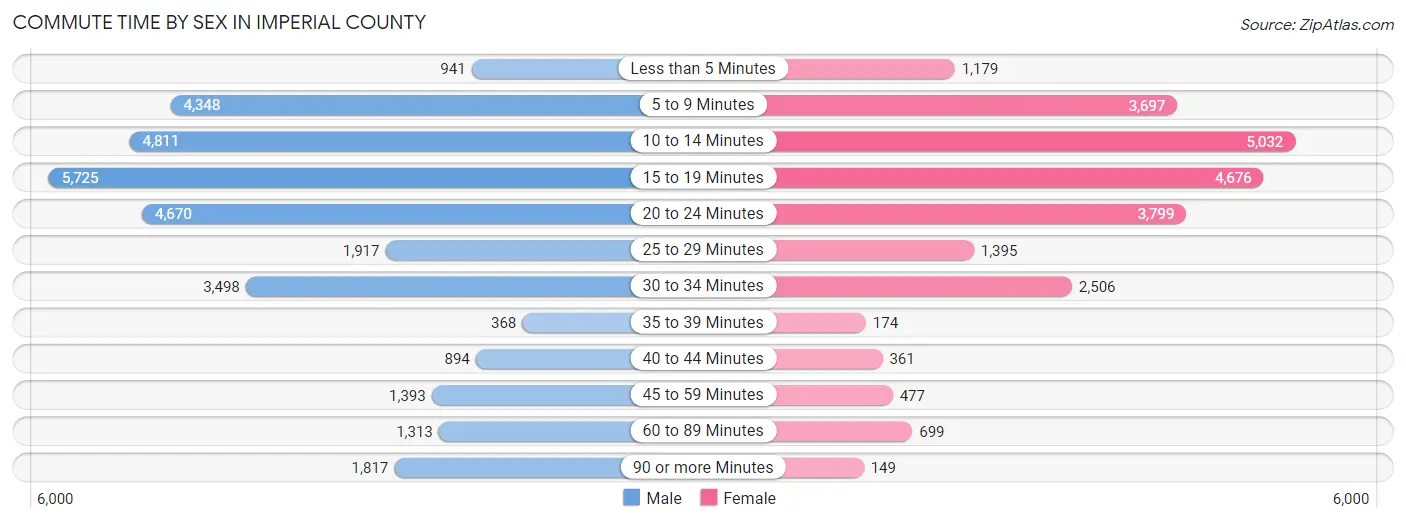
| Commute Time | Male | Female |
| Less than 5 Minutes | 941 (3.0%) | 1,179 (4.9%) |
| 5 to 9 Minutes | 4,348 (13.7%) | 3,697 (15.3%) |
| 10 to 14 Minutes | 4,811 (15.2%) | 5,032 (20.8%) |
| 15 to 19 Minutes | 5,725 (18.1%) | 4,676 (19.4%) |
| 20 to 24 Minutes | 4,670 (14.7%) | 3,799 (15.7%) |
| 25 to 29 Minutes | 1,917 (6.0%) | 1,395 (5.8%) |
| 30 to 34 Minutes | 3,498 (11.0%) | 2,506 (10.4%) |
| 35 to 39 Minutes | 368 (1.2%) | 174 (0.7%) |
| 40 to 44 Minutes | 894 (2.8%) | 361 (1.5%) |
| 45 to 59 Minutes | 1,393 (4.4%) | 477 (2.0%) |
| 60 to 89 Minutes | 1,313 (4.1%) | 699 (2.9%) |
| 90 or more Minutes | 1,817 (5.7%) | 149 (0.6%) |
Time of Departure to Work by Sex in Imperial County
The most frequent times of departure to work in Imperial County are 12:00 AM to 4:59 AM (5,070, 16.0%) for males and 7:30 AM to 7:59 AM (4,927, 20.4%) for females.
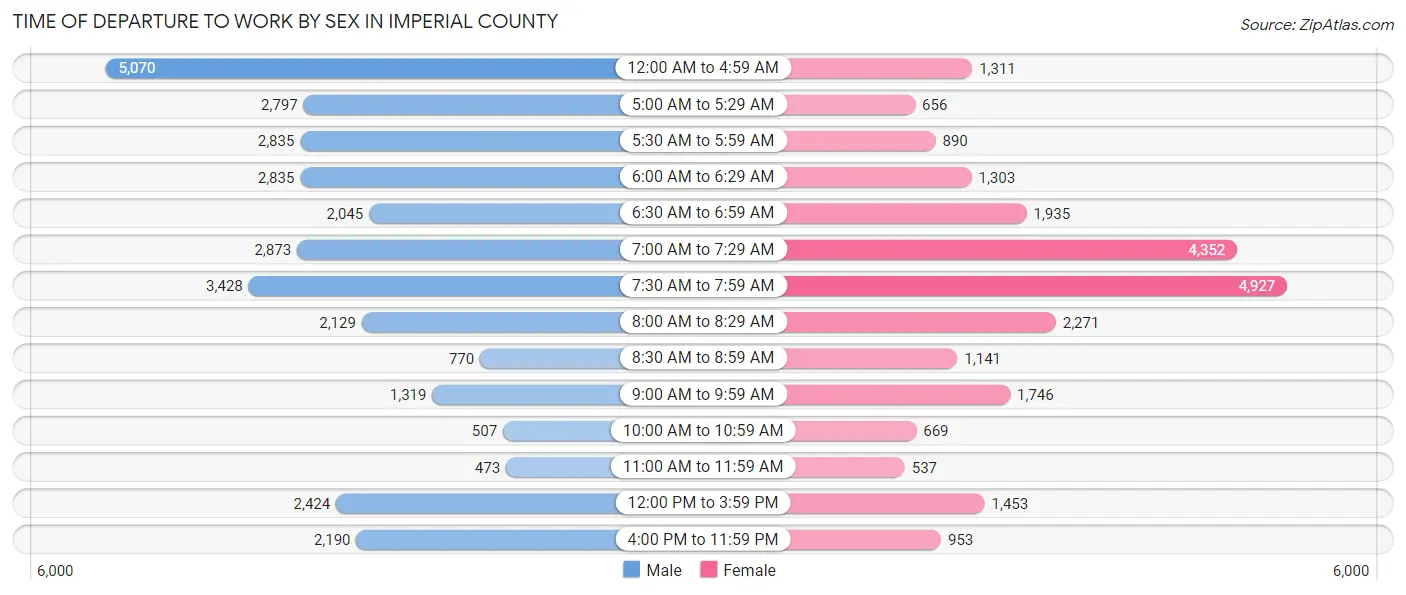
| Time of Departure | Male | Female |
| 12:00 AM to 4:59 AM | 5,070 (16.0%) | 1,311 (5.4%) |
| 5:00 AM to 5:29 AM | 2,797 (8.8%) | 656 (2.7%) |
| 5:30 AM to 5:59 AM | 2,835 (8.9%) | 890 (3.7%) |
| 6:00 AM to 6:29 AM | 2,835 (8.9%) | 1,303 (5.4%) |
| 6:30 AM to 6:59 AM | 2,045 (6.5%) | 1,935 (8.0%) |
| 7:00 AM to 7:29 AM | 2,873 (9.1%) | 4,352 (18.0%) |
| 7:30 AM to 7:59 AM | 3,428 (10.8%) | 4,927 (20.4%) |
| 8:00 AM to 8:29 AM | 2,129 (6.7%) | 2,271 (9.4%) |
| 8:30 AM to 8:59 AM | 770 (2.4%) | 1,141 (4.7%) |
| 9:00 AM to 9:59 AM | 1,319 (4.2%) | 1,746 (7.2%) |
| 10:00 AM to 10:59 AM | 507 (1.6%) | 669 (2.8%) |
| 11:00 AM to 11:59 AM | 473 (1.5%) | 537 (2.2%) |
| 12:00 PM to 3:59 PM | 2,424 (7.6%) | 1,453 (6.0%) |
| 4:00 PM to 11:59 PM | 2,190 (6.9%) | 953 (4.0%) |
| Total | 31,695 (100.0%) | 24,144 (100.0%) |
Housing Occupancy in Imperial County
Occupancy by Ownership in Imperial County
Of the total 47,024 dwellings in Imperial County, owner-occupied units account for 27,122 (57.7%), while renter-occupied units make up 19,902 (42.3%).
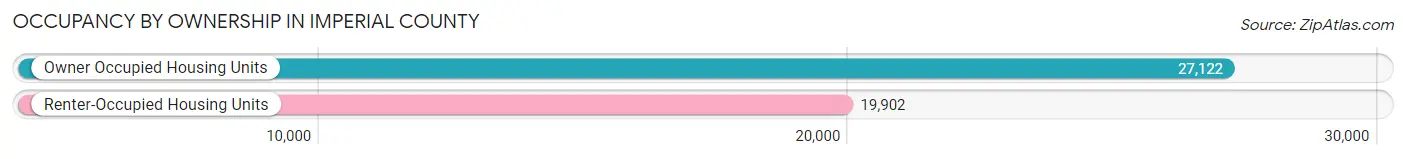
| Occupancy | # Housing Units | % Housing Units |
| Owner Occupied Housing Units | 27,122 | 57.7% |
| Renter-Occupied Housing Units | 19,902 | 42.3% |
| Total Occupied Housing Units | 47,024 | 100.0% |
Occupancy by Household Size in Imperial County
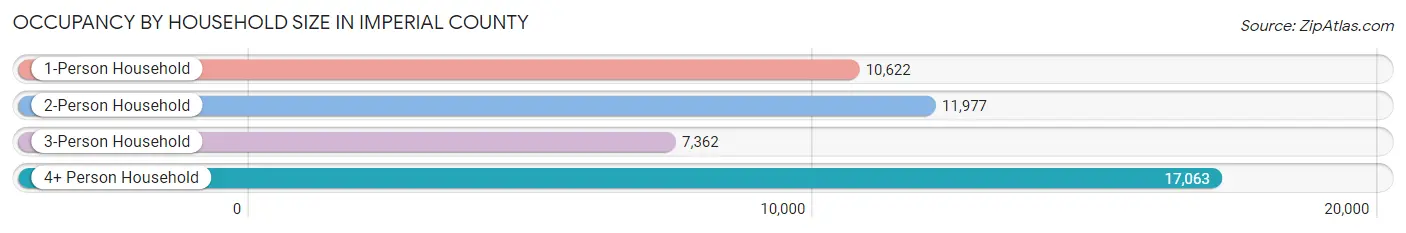
| Household Size | # Housing Units | % Housing Units |
| 1-Person Household | 10,622 | 22.6% |
| 2-Person Household | 11,977 | 25.5% |
| 3-Person Household | 7,362 | 15.7% |
| 4+ Person Household | 17,063 | 36.3% |
| Total Housing Units | 47,024 | 100.0% |
Occupancy by Ownership by Household Size in Imperial County
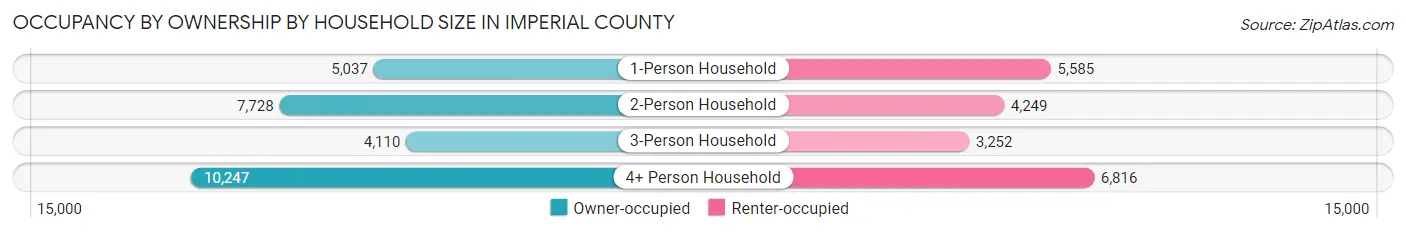
| Household Size | Owner-occupied | Renter-occupied |
| 1-Person Household | 5,037 (47.4%) | 5,585 (52.6%) |
| 2-Person Household | 7,728 (64.5%) | 4,249 (35.5%) |
| 3-Person Household | 4,110 (55.8%) | 3,252 (44.2%) |
| 4+ Person Household | 10,247 (60.1%) | 6,816 (40.0%) |
| Total Housing Units | 27,122 (57.7%) | 19,902 (42.3%) |
Occupancy by Educational Attainment in Imperial County
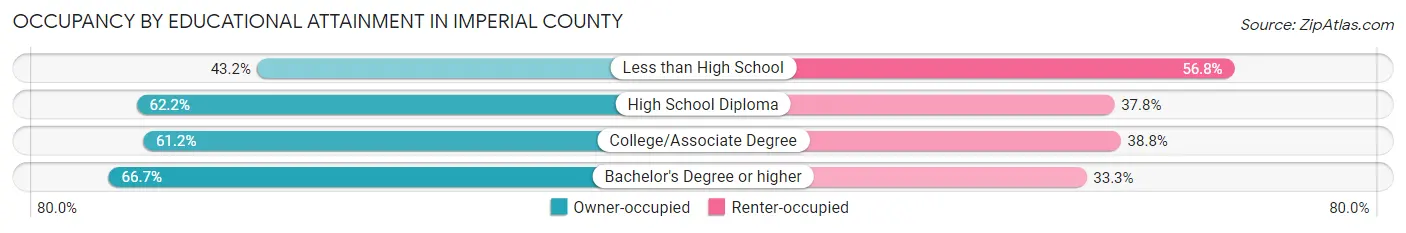
| Household Size | Owner-occupied | Renter-occupied |
| Less than High School | 5,382 (43.2%) | 7,082 (56.8%) |
| High School Diploma | 6,736 (62.2%) | 4,087 (37.8%) |
| College/Associate Degree | 9,217 (61.2%) | 5,839 (38.8%) |
| Bachelor's Degree or higher | 5,787 (66.7%) | 2,894 (33.3%) |
Occupancy by Age of Householder in Imperial County
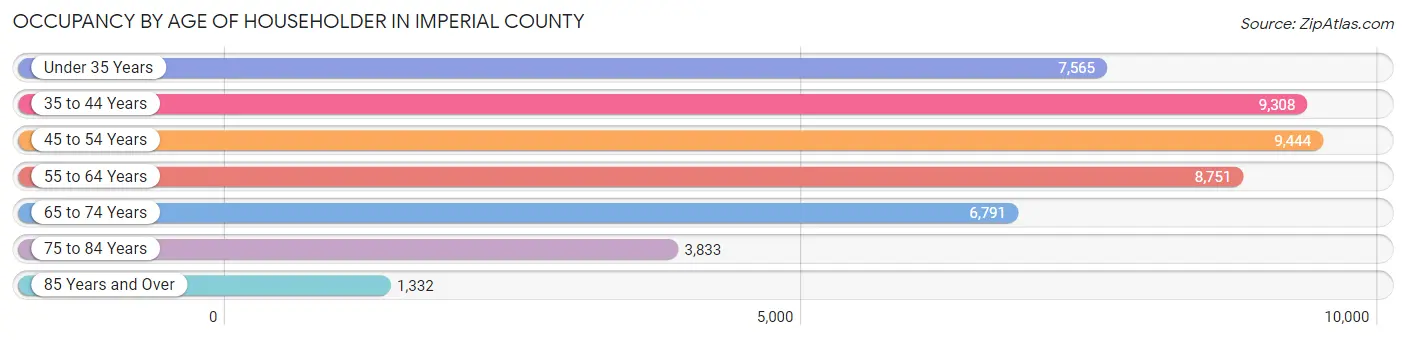
| Age Bracket | # Households | % Households |
| Under 35 Years | 7,565 | 16.1% |
| 35 to 44 Years | 9,308 | 19.8% |
| 45 to 54 Years | 9,444 | 20.1% |
| 55 to 64 Years | 8,751 | 18.6% |
| 65 to 74 Years | 6,791 | 14.4% |
| 75 to 84 Years | 3,833 | 8.2% |
| 85 Years and Over | 1,332 | 2.8% |
| Total | 47,024 | 100.0% |
Housing Finances in Imperial County
Median Income by Occupancy in Imperial County
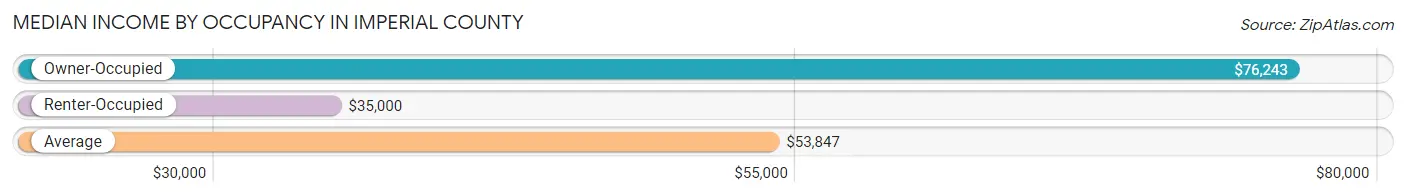
| Occupancy Type | # Households | Median Income |
| Owner-Occupied | 27,122 (57.7%) | $76,243 |
| Renter-Occupied | 19,902 (42.3%) | $35,000 |
| Average | 47,024 (100.0%) | $53,847 |
Occupancy by Householder Income Bracket in Imperial County
| Income Bracket | Owner-occupied | Renter-occupied |
| Less than $5,000 | 536 (2.0%) | 1,007 (5.1%) |
| $5,000 to $9,999 | 452 (1.7%) | 1,498 (7.5%) |
| $10,000 to $14,999 | 668 (2.5%) | 1,772 (8.9%) |
| $15,000 to $19,999 | 1,066 (3.9%) | 2,156 (10.8%) |
| $20,000 to $24,999 | 1,295 (4.8%) | 1,356 (6.8%) |
| $25,000 to $34,999 | 1,955 (7.2%) | 2,162 (10.9%) |
| $35,000 to $49,999 | 2,986 (11.0%) | 3,266 (16.4%) |
| $50,000 to $74,999 | 4,429 (16.3%) | 2,726 (13.7%) |
| $75,000 to $99,999 | 3,660 (13.5%) | 1,561 (7.8%) |
| $100,000 to $149,999 | 6,285 (23.2%) | 1,821 (9.1%) |
| $150,000 or more | 3,790 (14.0%) | 577 (2.9%) |
| Total | 27,122 (100.0%) | 19,902 (100.0%) |
Monthly Housing Cost Tiers in Imperial County
| Monthly Cost | Owner-occupied | Renter-occupied |
| Less than $300 | 1,665 (6.1%) | 426 (2.1%) |
| $300 to $499 | 3,467 (12.8%) | 1,980 (10.0%) |
| $500 to $799 | 4,508 (16.6%) | 4,055 (20.4%) |
| $800 to $999 | 1,772 (6.5%) | 3,762 (18.9%) |
| $1,000 to $1,499 | 5,676 (20.9%) | 5,641 (28.3%) |
| $1,500 to $1,999 | 5,039 (18.6%) | 2,427 (12.2%) |
| $2,000 to $2,499 | 2,985 (11.0%) | 496 (2.5%) |
| $2,500 to $2,999 | 1,020 (3.8%) | 19 (0.1%) |
| $3,000 or more | 990 (3.6%) | 117 (0.6%) |
| Total | 27,122 (100.0%) | 19,902 (100.0%) |
Physical Housing Characteristics in Imperial County
Housing Structures in Imperial County
| Structure Type | # Housing Units | % Housing Units |
| Single Unit, Detached | 31,332 | 66.6% |
| Single Unit, Attached | 969 | 2.1% |
| 2 Unit Apartments | 1,275 | 2.7% |
| 3 or 4 Unit Apartments | 3,118 | 6.6% |
| 5 to 9 Unit Apartments | 3,071 | 6.5% |
| 10 or more Apartments | 3,288 | 7.0% |
| Mobile Home / Other | 3,971 | 8.4% |
| Total | 47,024 | 100.0% |
Housing Structures by Occupancy in Imperial County
| Structure Type | Owner-occupied | Renter-occupied |
| Single Unit, Detached | 23,882 (76.2%) | 7,450 (23.8%) |
| Single Unit, Attached | 355 (36.6%) | 614 (63.4%) |
| 2 Unit Apartments | 160 (12.6%) | 1,115 (87.5%) |
| 3 or 4 Unit Apartments | 127 (4.1%) | 2,991 (95.9%) |
| 5 to 9 Unit Apartments | 0 (0.0%) | 3,071 (100.0%) |
| 10 or more Apartments | 20 (0.6%) | 3,268 (99.4%) |
| Mobile Home / Other | 2,578 (64.9%) | 1,393 (35.1%) |
| Total | 27,122 (57.7%) | 19,902 (42.3%) |
Housing Structures by Number of Rooms in Imperial County
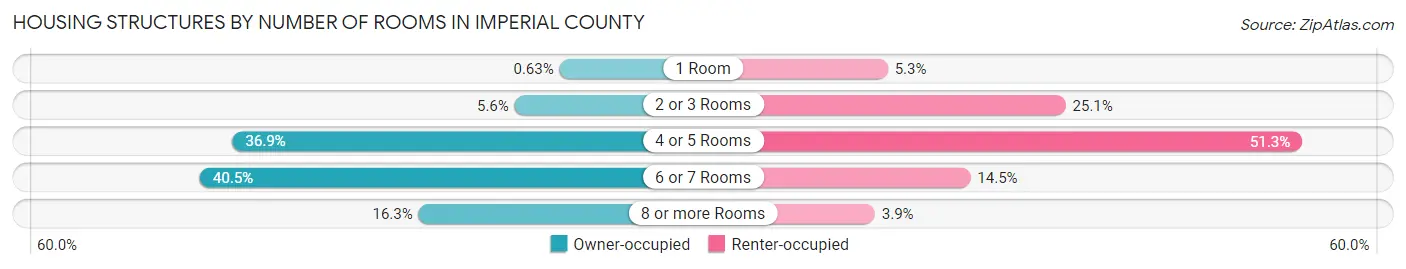
| Number of Rooms | Owner-occupied | Renter-occupied |
| 1 Room | 172 (0.6%) | 1,055 (5.3%) |
| 2 or 3 Rooms | 1,523 (5.6%) | 4,986 (25.1%) |
| 4 or 5 Rooms | 10,017 (36.9%) | 10,207 (51.3%) |
| 6 or 7 Rooms | 10,995 (40.5%) | 2,881 (14.5%) |
| 8 or more Rooms | 4,415 (16.3%) | 773 (3.9%) |
| Total | 27,122 (100.0%) | 19,902 (100.0%) |
Housing Structure by Heating Type in Imperial County
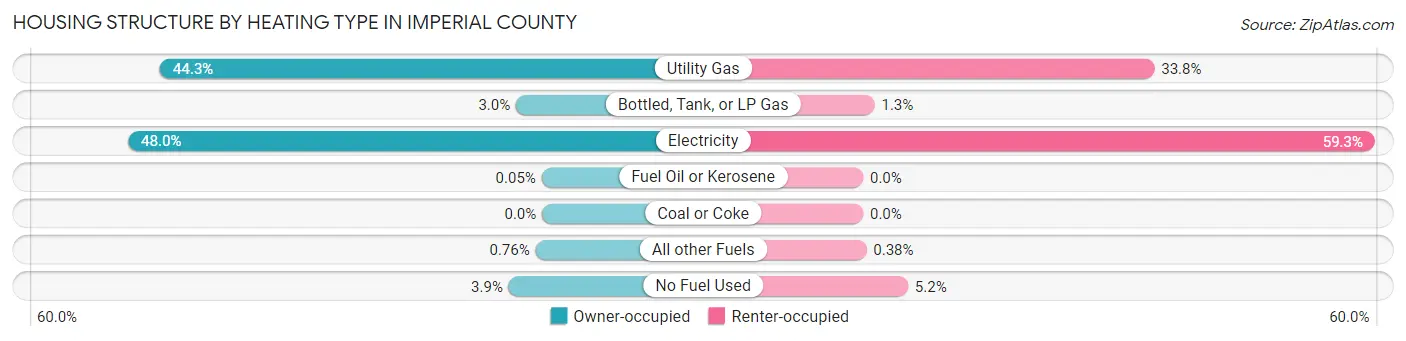
| Heating Type | Owner-occupied | Renter-occupied |
| Utility Gas | 12,017 (44.3%) | 6,721 (33.8%) |
| Bottled, Tank, or LP Gas | 820 (3.0%) | 264 (1.3%) |
| Electricity | 13,016 (48.0%) | 11,808 (59.3%) |
| Fuel Oil or Kerosene | 13 (0.1%) | 0 (0.0%) |
| Coal or Coke | 0 (0.0%) | 0 (0.0%) |
| All other Fuels | 207 (0.8%) | 75 (0.4%) |
| No Fuel Used | 1,049 (3.9%) | 1,034 (5.2%) |
| Total | 27,122 (100.0%) | 19,902 (100.0%) |
Household Vehicle Usage in Imperial County
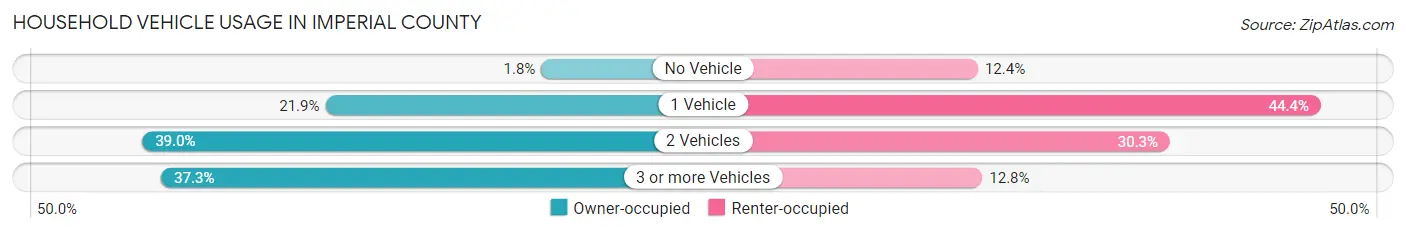
| Vehicles per Household | Owner-occupied | Renter-occupied |
| No Vehicle | 484 (1.8%) | 2,471 (12.4%) |
| 1 Vehicle | 5,948 (21.9%) | 8,841 (44.4%) |
| 2 Vehicles | 10,584 (39.0%) | 6,037 (30.3%) |
| 3 or more Vehicles | 10,106 (37.3%) | 2,553 (12.8%) |
| Total | 27,122 (100.0%) | 19,902 (100.0%) |
Real Estate & Mortgages in Imperial County
Real Estate and Mortgage Overview in Imperial County
| Characteristic | Without Mortgage | With Mortgage |
| Housing Units | 10,758 | 16,364 |
| Median Property Value | $194,200 | $278,600 |
| Median Household Income | $55,324 | $2,584 |
| Monthly Housing Costs | $520 | $990 |
| Real Estate Taxes | $1,492 | $401 |
Property Value by Mortgage Status in Imperial County
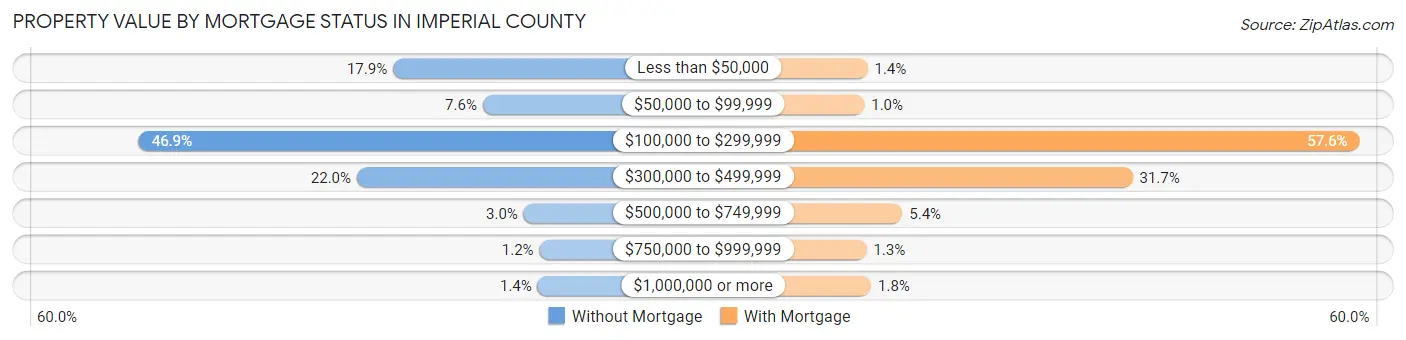
| Property Value | Without Mortgage | With Mortgage |
| Less than $50,000 | 1,926 (17.9%) | 224 (1.4%) |
| $50,000 to $99,999 | 822 (7.6%) | 163 (1.0%) |
| $100,000 to $299,999 | 5,050 (46.9%) | 9,423 (57.6%) |
| $300,000 to $499,999 | 2,370 (22.0%) | 5,181 (31.7%) |
| $500,000 to $749,999 | 318 (3.0%) | 876 (5.3%) |
| $750,000 to $999,999 | 125 (1.2%) | 205 (1.3%) |
| $1,000,000 or more | 147 (1.4%) | 292 (1.8%) |
| Total | 10,758 (100.0%) | 16,364 (100.0%) |
Household Income by Mortgage Status in Imperial County
| Household Income | Without Mortgage | With Mortgage |
| Less than $10,000 | 438 (4.1%) | 190 (1.2%) |
| $10,000 to $24,999 | 2,031 (18.9%) | 550 (3.4%) |
| $25,000 to $34,999 | 1,052 (9.8%) | 998 (6.1%) |
| $35,000 to $49,999 | 1,309 (12.2%) | 903 (5.5%) |
| $50,000 to $74,999 | 1,955 (18.2%) | 1,677 (10.2%) |
| $75,000 to $99,999 | 1,229 (11.4%) | 2,474 (15.1%) |
| $100,000 to $149,999 | 1,538 (14.3%) | 2,431 (14.9%) |
| $150,000 or more | 1,206 (11.2%) | 4,747 (29.0%) |
| Total | 10,758 (100.0%) | 16,364 (100.0%) |
Property Value to Household Income Ratio in Imperial County
| Value-to-Income Ratio | Without Mortgage | With Mortgage |
| Less than 2.0x | 3,778 (35.1%) | 90,875 (555.3%) |
| 2.0x to 2.9x | 1,873 (17.4%) | 3,063 (18.7%) |
| 3.0x to 3.9x | 1,160 (10.8%) | 4,354 (26.6%) |
| 4.0x or more | 3,847 (35.8%) | 2,381 (14.5%) |
| Total | 10,758 (100.0%) | 16,364 (100.0%) |
Real Estate Taxes by Mortgage Status in Imperial County
| Property Taxes | Without Mortgage | With Mortgage |
| Less than $800 | 2,241 (20.8%) | 71 (0.4%) |
| $800 to $1,499 | 2,432 (22.6%) | 1,038 (6.3%) |
| $800 to $1,499 | 4,616 (42.9%) | 2,120 (13.0%) |
| Total | 10,758 (100.0%) | 16,364 (100.0%) |
Health & Disability in Imperial County
Health Insurance Coverage by Age in Imperial County
| Age Bracket | With Coverage | Without Coverage |
| Under 6 Years | 15,624 (98.2%) | 283 (1.8%) |
| 6 to 18 Years | 37,212 (97.2%) | 1,059 (2.8%) |
| 19 to 25 Years | 14,438 (89.7%) | 1,654 (10.3%) |
| 26 to 34 Years | 18,408 (86.7%) | 2,815 (13.3%) |
| 35 to 44 Years | 18,210 (90.9%) | 1,825 (9.1%) |
| 45 to 54 Years | 16,723 (89.1%) | 2,051 (10.9%) |
| 55 to 64 Years | 16,020 (89.4%) | 1,891 (10.6%) |
| 65 to 74 Years | 13,480 (99.4%) | 79 (0.6%) |
| 75 Years and older | 9,839 (99.3%) | 74 (0.7%) |
| Total | 159,954 (93.2%) | 11,731 (6.8%) |
Health Insurance Coverage by Citizenship Status in Imperial County
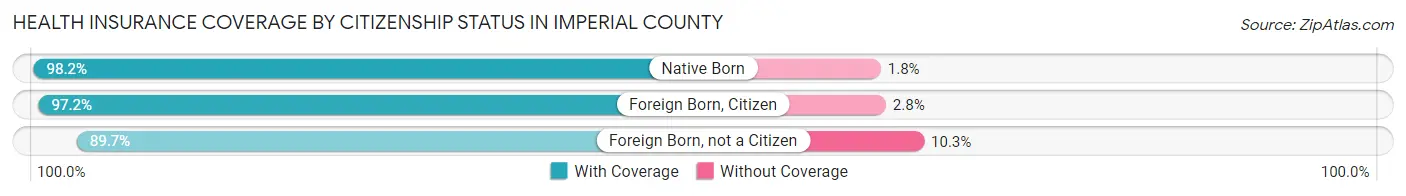
| Citizenship Status | With Coverage | Without Coverage |
| Native Born | 15,624 (98.2%) | 283 (1.8%) |
| Foreign Born, Citizen | 37,212 (97.2%) | 1,059 (2.8%) |
| Foreign Born, not a Citizen | 14,438 (89.7%) | 1,654 (10.3%) |
Health Insurance Coverage by Household Income in Imperial County
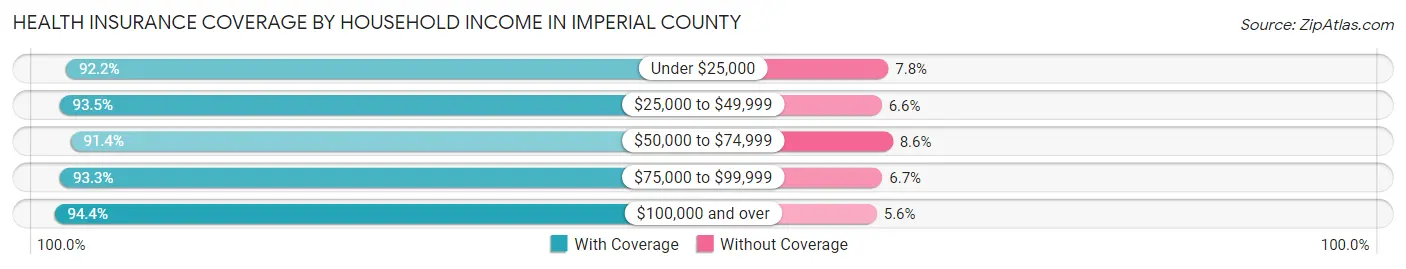
| Household Income | With Coverage | Without Coverage |
| Under $25,000 | 27,912 (92.2%) | 2,358 (7.8%) |
| $25,000 to $49,999 | 33,401 (93.4%) | 2,343 (6.6%) |
| $50,000 to $74,999 | 25,578 (91.4%) | 2,409 (8.6%) |
| $75,000 to $99,999 | 19,142 (93.3%) | 1,366 (6.7%) |
| $100,000 and over | 53,566 (94.4%) | 3,190 (5.6%) |
Public vs Private Health Insurance Coverage by Age in Imperial County
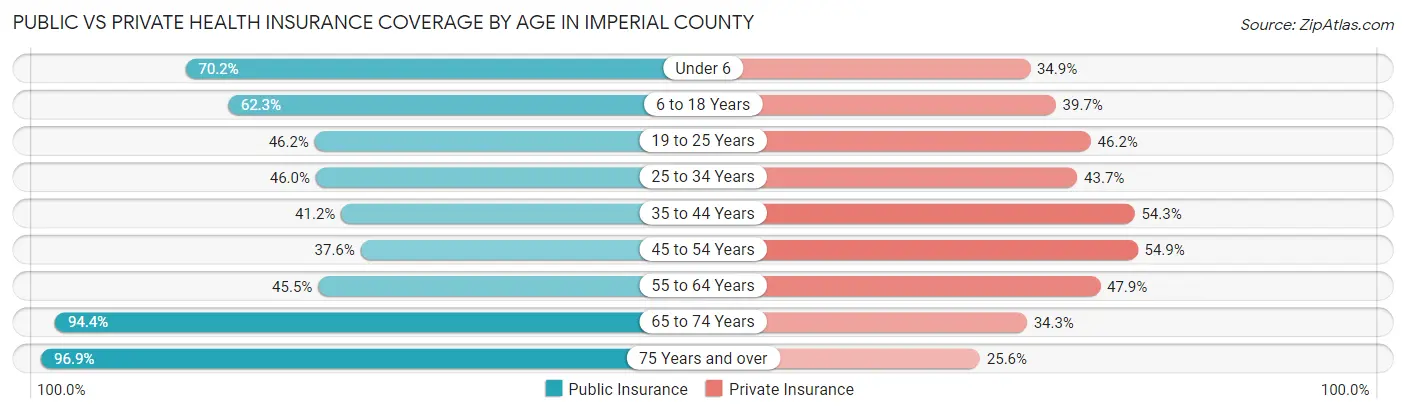
| Age Bracket | Public Insurance | Private Insurance |
| Under 6 | 11,158 (70.2%) | 5,557 (34.9%) |
| 6 to 18 Years | 23,836 (62.3%) | 15,195 (39.7%) |
| 19 to 25 Years | 7,427 (46.2%) | 7,433 (46.2%) |
| 25 to 34 Years | 9,751 (46.0%) | 9,273 (43.7%) |
| 35 to 44 Years | 8,263 (41.2%) | 10,886 (54.3%) |
| 45 to 54 Years | 7,064 (37.6%) | 10,307 (54.9%) |
| 55 to 64 Years | 8,151 (45.5%) | 8,587 (47.9%) |
| 65 to 74 Years | 12,794 (94.4%) | 4,654 (34.3%) |
| 75 Years and over | 9,608 (96.9%) | 2,541 (25.6%) |
| Total | 98,052 (57.1%) | 74,433 (43.3%) |
Disability Status by Sex by Age in Imperial County
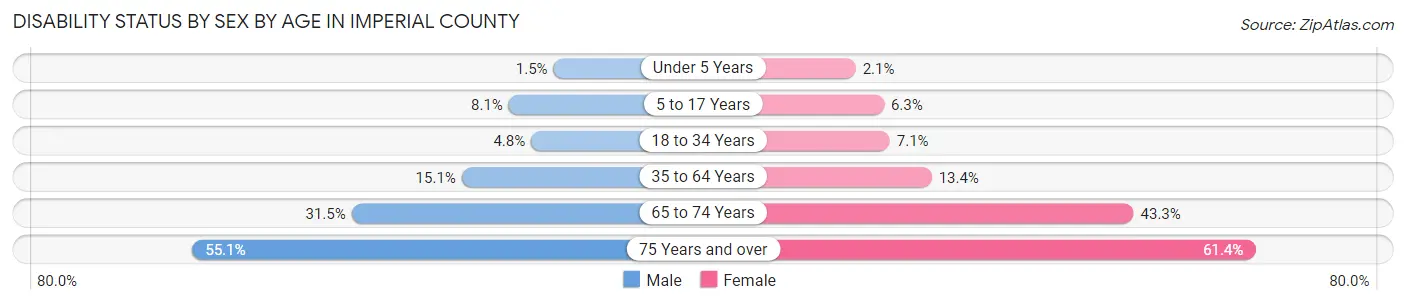
| Age Bracket | Male | Female |
| Under 5 Years | 100 (1.5%) | 137 (2.1%) |
| 5 to 17 Years | 1,556 (8.1%) | 1,157 (6.3%) |
| 18 to 34 Years | 992 (4.8%) | 1,413 (7.1%) |
| 35 to 64 Years | 4,180 (15.1%) | 3,877 (13.4%) |
| 65 to 74 Years | 2,007 (31.5%) | 3,110 (43.3%) |
| 75 Years and over | 2,291 (55.1%) | 3,532 (61.4%) |
Disability Class by Sex by Age in Imperial County
Disability Class: Hearing Difficulty
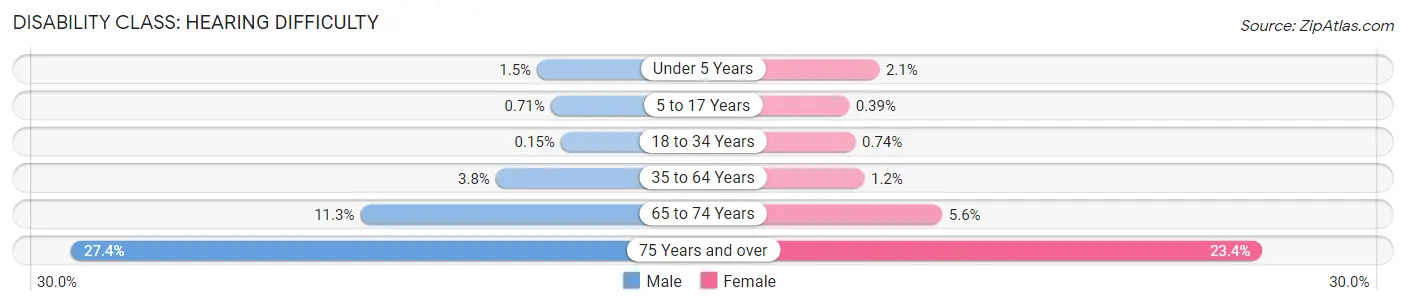
| Age Bracket | Male | Female |
| Under 5 Years | 100 (1.5%) | 137 (2.1%) |
| 5 to 17 Years | 136 (0.7%) | 72 (0.4%) |
| 18 to 34 Years | 31 (0.2%) | 147 (0.7%) |
| 35 to 64 Years | 1,043 (3.8%) | 360 (1.2%) |
| 65 to 74 Years | 722 (11.3%) | 400 (5.6%) |
| 75 Years and over | 1,140 (27.4%) | 1,347 (23.4%) |
Disability Class: Vision Difficulty
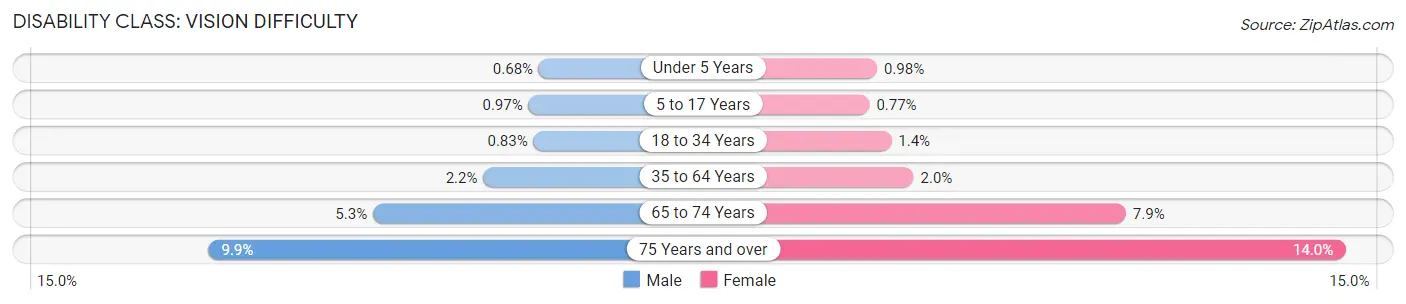
| Age Bracket | Male | Female |
| Under 5 Years | 46 (0.7%) | 65 (1.0%) |
| 5 to 17 Years | 186 (1.0%) | 143 (0.8%) |
| 18 to 34 Years | 172 (0.8%) | 273 (1.4%) |
| 35 to 64 Years | 617 (2.2%) | 581 (2.0%) |
| 65 to 74 Years | 338 (5.3%) | 568 (7.9%) |
| 75 Years and over | 411 (9.9%) | 806 (14.0%) |
Disability Class: Cognitive Difficulty
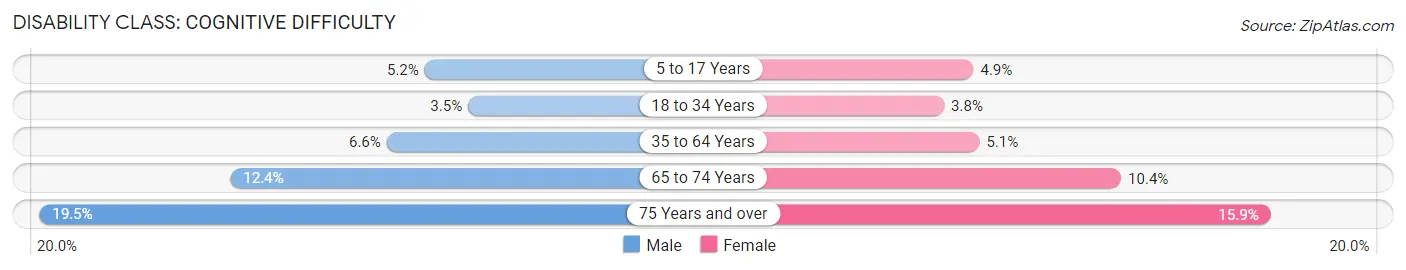
| Age Bracket | Male | Female |
| 5 to 17 Years | 986 (5.1%) | 904 (4.9%) |
| 18 to 34 Years | 731 (3.5%) | 752 (3.8%) |
| 35 to 64 Years | 1,814 (6.6%) | 1,484 (5.1%) |
| 65 to 74 Years | 789 (12.4%) | 744 (10.4%) |
| 75 Years and over | 809 (19.5%) | 916 (15.9%) |
Disability Class: Ambulatory Difficulty
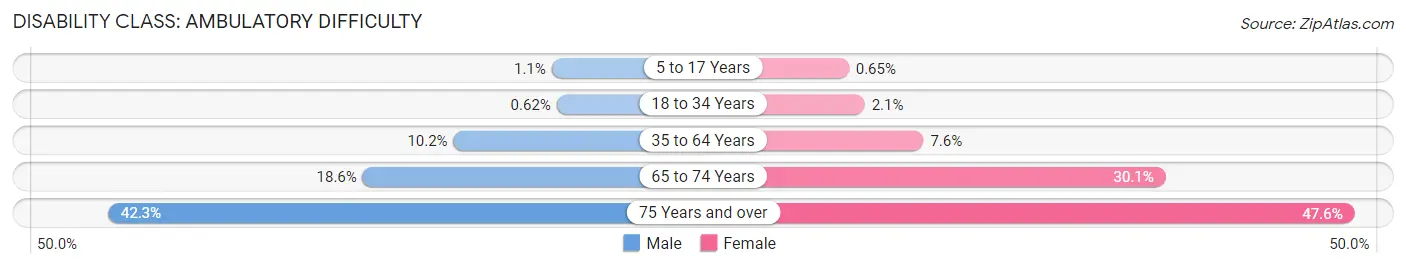
| Age Bracket | Male | Female |
| 5 to 17 Years | 208 (1.1%) | 121 (0.6%) |
| 18 to 34 Years | 128 (0.6%) | 421 (2.1%) |
| 35 to 64 Years | 2,823 (10.2%) | 2,201 (7.6%) |
| 65 to 74 Years | 1,189 (18.6%) | 2,157 (30.0%) |
| 75 Years and over | 1,758 (42.3%) | 2,738 (47.6%) |
Disability Class: Self-Care Difficulty
| Age Bracket | Male | Female |
| 5 to 17 Years | 242 (1.3%) | 154 (0.8%) |
| 18 to 34 Years | 169 (0.8%) | 254 (1.3%) |
| 35 to 64 Years | 1,117 (4.0%) | 777 (2.7%) |
| 65 to 74 Years | 556 (8.7%) | 935 (13.0%) |
| 75 Years and over | 807 (19.4%) | 1,728 (30.0%) |
Technology Access in Imperial County
Computing Device Access in Imperial County
| Device Type | # Households | % Households |
| Desktop or Laptop | 32,506 | 69.1% |
| Smartphone | 41,761 | 88.8% |
| Tablet | 27,697 | 58.9% |
| No Computing Device | 3,289 | 7.0% |
| Total | 47,024 | 100.0% |
Internet Access in Imperial County
| Internet Type | # Households | % Households |
| Dial-Up Internet | 54 | 0.1% |
| Broadband Home | 31,660 | 67.3% |
| Cellular Data Only | 7,258 | 15.4% |
| Satellite Internet | 4,506 | 9.6% |
| No Internet | 5,865 | 12.5% |
| Total | 47,024 | 100.0% |
Imperial County Summary
Imperial County is located in the southeastern corner of California, bordering Mexico and Arizona. It is the largest county in the state by area, covering 4,570 square miles. The county seat is El Centro, and the largest city is Calexico. Imperial County is part of the Imperial Valley, a region known for its agricultural production.
History
Imperial County was created in 1907 from the eastern portion of San Diego County. The county was named after the Imperial Valley, which was named by the Imperial Land Company in 1906. The Imperial Valley was originally part of Mexico, but was ceded to the United States in 1848 as part of the Treaty of Guadalupe Hidalgo.
The Imperial Valley was initially used for cattle ranching, but in the early 1900s, the area was developed for agriculture. The Imperial Irrigation District was formed in 1911 to manage the water resources of the valley. The All-American Canal was built in the 1930s to bring water from the Colorado River to the Imperial Valley.
Geography
Imperial County is located in the southeastern corner of California, bordering Mexico and Arizona. It is the largest county in the state by area, covering 4,570 square miles. The county is mostly desert, with the Salton Sea located in the southern part of the county. The county is divided into two distinct regions: the Imperial Valley in the east and the Colorado Desert in the west.
The Imperial Valley is a fertile agricultural region, with the All-American Canal providing irrigation water from the Colorado River. The Colorado Desert is a sparsely populated region, with the only major city being El Centro.
Economy
Imperial County has a diverse economy, with agriculture, tourism, and manufacturing being the main industries. Agriculture is the largest industry in the county, with the Imperial Valley producing a variety of crops, including cotton, alfalfa, and vegetables. Tourism is also an important industry, with the Salton Sea and the Imperial Sand Dunes being popular destinations. Manufacturing is also an important part of the economy, with companies such as Nestle and Frito-Lay having factories in the county.
Demographics
As of the 2010 census, Imperial County had a population of 174,528. The population is mostly Hispanic, with over 80% of the population identifying as Hispanic or Latino. The median household income is $41,845, and the poverty rate is 28.2%. The largest cities in the county are El Centro, Calexico, and Brawley.
Conclusion
Imperial County is a large and diverse county located in the southeastern corner of California. It is known for its agricultural production, with the Imperial Valley being a major producer of crops. The county also has a diverse economy, with agriculture, tourism, and manufacturing being the main industries. The population is mostly Hispanic, with over 80% of the population identifying as Hispanic or Latino. Imperial County is an important part of California’s economy and culture.
Common Questions
What is Per Capita Income in Imperial County?
Per Capita income in Imperial County is $21,216.
What is the Median Family Income in Imperial County?
Median Family Income in Imperial County is $60,776.
What is the Median Household income in Imperial County?
Median Household Income in Imperial County is $53,847.
What is Income or Wage Gap in Imperial County?
Income or Wage Gap in Imperial County is 35.3%.
Women in Imperial County earn 64.7 cents for every dollar earned by a man.
What is Family Income Deficit in Imperial County?
Family Income Deficit in Imperial County is $11,678.
Families that are below poverty line in Imperial County earn $11,678 less on average than the poverty threshold level.
What is Inequality or Gini Index in Imperial County?
Inequality or Gini Index in Imperial County is 0.46.
What is the Total Population of Imperial County?
Total Population of Imperial County is 179,578.
What is the Total Male Population of Imperial County?
Total Male Population of Imperial County is 92,430.
What is the Total Female Population of Imperial County?
Total Female Population of Imperial County is 87,148.
What is the Ratio of Males per 100 Females in Imperial County?
There are 106.06 Males per 100 Females in Imperial County.
What is the Ratio of Females per 100 Males in Imperial County?
There are 94.29 Females per 100 Males in Imperial County.
What is the Median Population Age in Imperial County?
Median Population Age in Imperial County is 32.6 Years.
What is the Average Family Size in Imperial County
Average Family Size in Imperial County is 4.4 People.
What is the Average Household Size in Imperial County
Average Household Size in Imperial County is 3.6 People.
How Large is the Labor Force in Imperial County?
There are 70,050 People in the Labor Forcein in Imperial County.
What is the Percentage of People in the Labor Force in Imperial County?
52.3% of People are in the Labor Force in Imperial County.
What is the Unemployment Rate in Imperial County?
Unemployment Rate in Imperial County is 13.2%.