El Dorado County, CA Map & Demographics
El Dorado County Map
El Dorado County Overview
$55,455
PER CAPITA INCOME
$122,465
AVG FAMILY INCOME
$99,246
AVG HOUSEHOLD INCOME
30.2%
WAGE / INCOME GAP [ % ]
69.8¢/ $1
WAGE / INCOME GAP [ $ ]
$9,114
FAMILY INCOME DEFICIT
0.48
INEQUALITY / GINI INDEX
191,713
TOTAL POPULATION
96,045
MALE POPULATION
95,668
FEMALE POPULATION
100.39
MALES / 100 FEMALES
99.61
FEMALES / 100 MALES
46.2
MEDIAN AGE
3.0
AVG FAMILY SIZE
2.5
AVG HOUSEHOLD SIZE
92,504
LABOR FORCE [ PEOPLE ]
58.2%
PERCENT IN LABOR FORCE
4.6%
UNEMPLOYMENT RATE
Income in El Dorado County
Income Overview in El Dorado County
Per Capita Income in El Dorado County is $55,455, while median incomes of families and households are $122,465 and $99,246 respectively.
| Characteristic | Number | Measure |
| Per Capita Income | 191,713 | $55,455 |
| Median Family Income | 52,217 | $122,465 |
| Mean Family Income | 52,217 | $163,584 |
| Median Household Income | 75,190 | $99,246 |
| Mean Household Income | 75,190 | $139,272 |
| Income Deficit | 52,217 | $9,114 |
| Wage / Income Gap (%) | 191,713 | 30.18% |
| Wage / Income Gap ($) | 191,713 | 69.82¢ per $1 |
| Gini / Inequality Index | 191,713 | 0.48 |
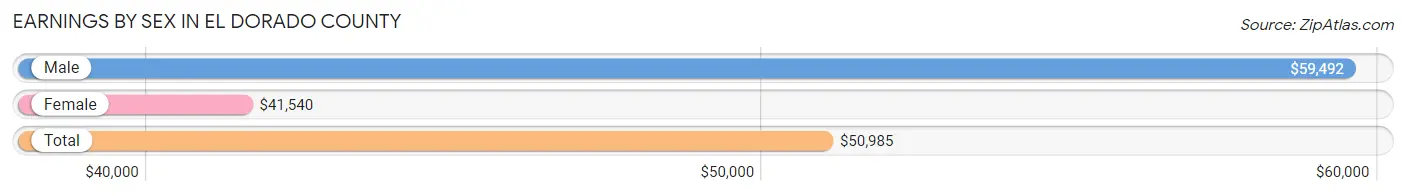
Earnings by Sex in El Dorado County
Average Earnings in El Dorado County are $50,985, $59,492 for men and $41,540 for women, a difference of 30.2%.
| Sex | Number | Average Earnings |
| Male | 52,340 (54.0%) | $59,492 |
| Female | 44,489 (46.0%) | $41,540 |
| Total | 96,829 (100.0%) | $50,985 |
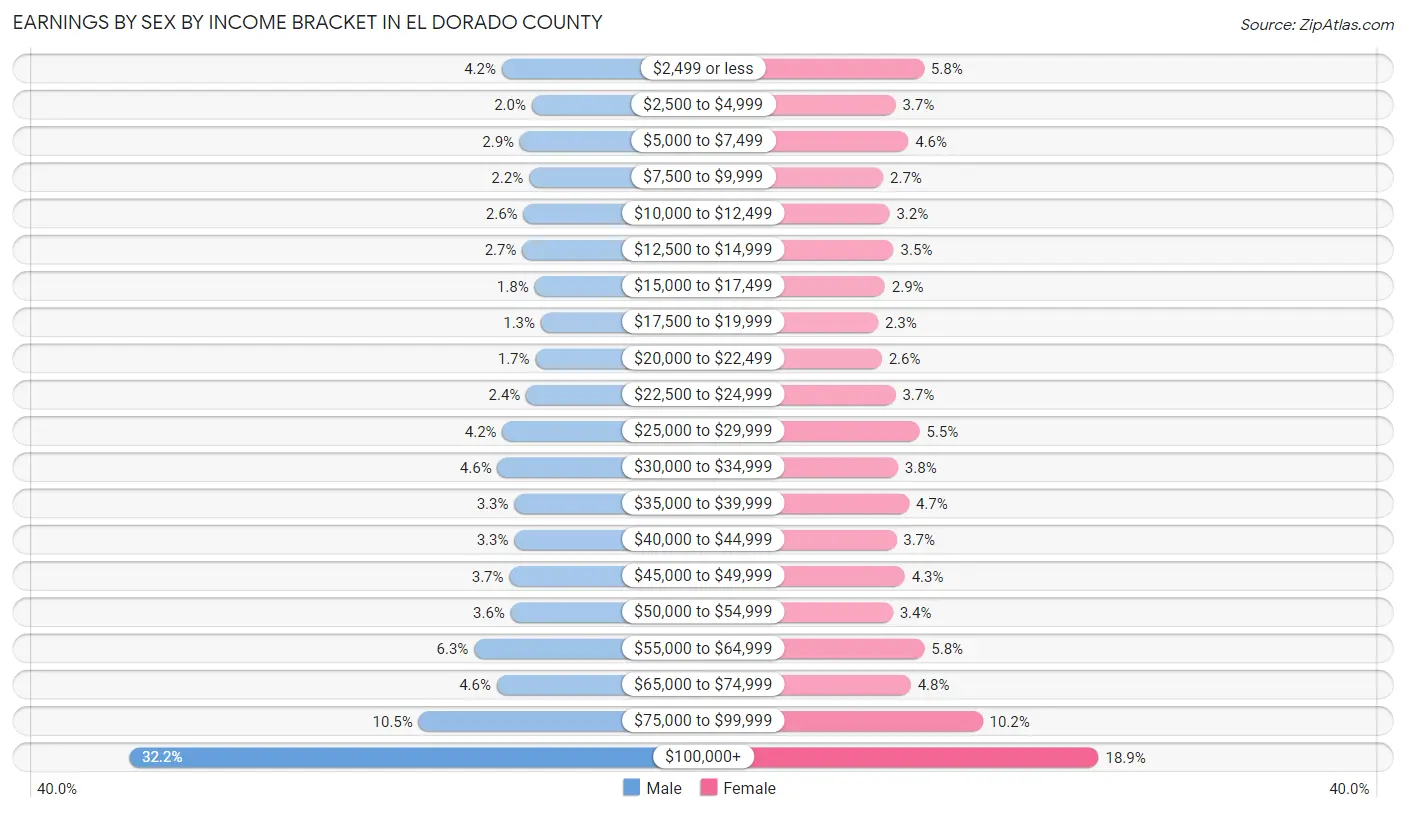
Earnings by Sex by Income Bracket in El Dorado County
The most common earnings brackets in El Dorado County are $100,000+ for men (16,840 | 32.2%) and $100,000+ for women (8,396 | 18.9%).
| Income | Male | Female |
| $2,499 or less | 2,220 (4.2%) | 2,571 (5.8%) |
| $2,500 to $4,999 | 1,040 (2.0%) | 1,625 (3.6%) |
| $5,000 to $7,499 | 1,507 (2.9%) | 2,049 (4.6%) |
| $7,500 to $9,999 | 1,150 (2.2%) | 1,210 (2.7%) |
| $10,000 to $12,499 | 1,373 (2.6%) | 1,425 (3.2%) |
| $12,500 to $14,999 | 1,412 (2.7%) | 1,563 (3.5%) |
| $15,000 to $17,499 | 935 (1.8%) | 1,266 (2.9%) |
| $17,500 to $19,999 | 688 (1.3%) | 1,043 (2.3%) |
| $20,000 to $22,499 | 898 (1.7%) | 1,164 (2.6%) |
| $22,500 to $24,999 | 1,262 (2.4%) | 1,626 (3.6%) |
| $25,000 to $29,999 | 2,191 (4.2%) | 2,424 (5.4%) |
| $30,000 to $34,999 | 2,385 (4.6%) | 1,706 (3.8%) |
| $35,000 to $39,999 | 1,727 (3.3%) | 2,073 (4.7%) |
| $40,000 to $44,999 | 1,726 (3.3%) | 1,649 (3.7%) |
| $45,000 to $49,999 | 1,922 (3.7%) | 1,931 (4.3%) |
| $50,000 to $54,999 | 1,870 (3.6%) | 1,529 (3.4%) |
| $55,000 to $64,999 | 3,303 (6.3%) | 2,583 (5.8%) |
| $65,000 to $74,999 | 2,411 (4.6%) | 2,133 (4.8%) |
| $75,000 to $99,999 | 5,480 (10.5%) | 4,523 (10.2%) |
| $100,000+ | 16,840 (32.2%) | 8,396 (18.9%) |
| Total | 52,340 (100.0%) | 44,489 (100.0%) |
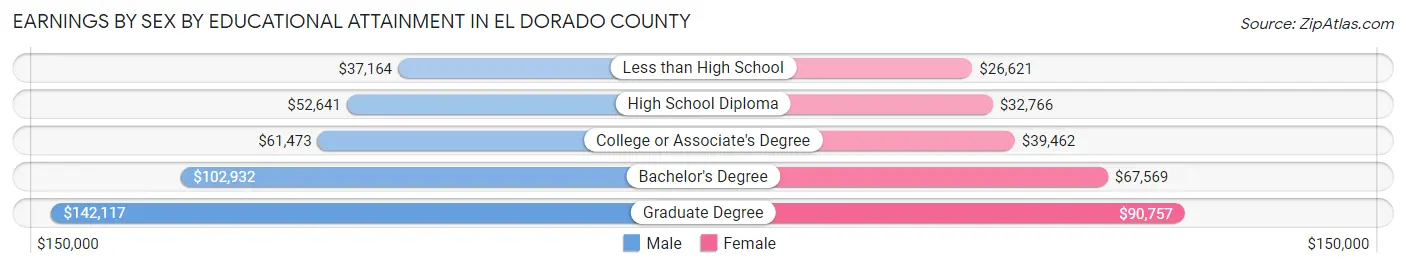
Earnings by Sex by Educational Attainment in El Dorado County
Average earnings in El Dorado County are $71,940 for men and $48,378 for women, a difference of 32.8%. Men with an educational attainment of graduate degree enjoy the highest average annual earnings of $142,117, while those with less than high school education earn the least with $37,164. Women with an educational attainment of graduate degree earn the most with the average annual earnings of $90,757, while those with less than high school education have the smallest earnings of $26,621.
| Educational Attainment | Male Income | Female Income |
| Less than High School | $37,164 | $26,621 |
| High School Diploma | $52,641 | $32,766 |
| College or Associate's Degree | $61,473 | $39,462 |
| Bachelor's Degree | $102,932 | $67,569 |
| Graduate Degree | $142,117 | $90,757 |
| Total | $71,940 | $48,378 |
Family Income in El Dorado County
Family Income Brackets in El Dorado County
According to the El Dorado County family income data, there are 13,263 families falling into the $200,000+ income range, which is the most common income bracket and makes up 25.4% of all families. Conversely, the $10,000 to $14,999 income bracket is the least frequent group with only 470 families (0.9%) belonging to this category.
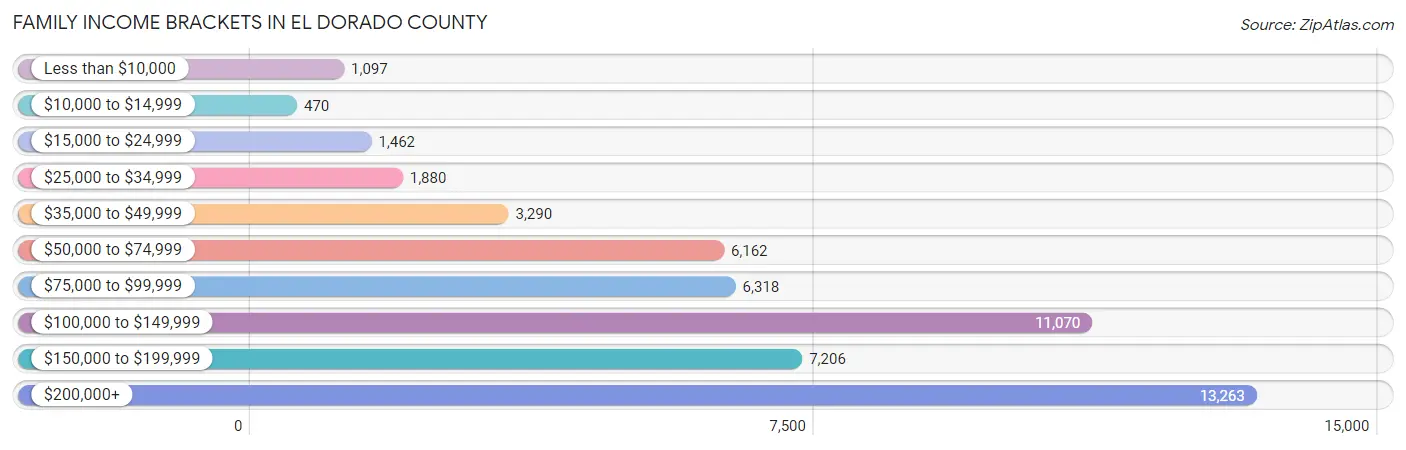
| Income Bracket | # Families | % Families |
| Less than $10,000 | 1,097 | 2.1% |
| $10,000 to $14,999 | 470 | 0.9% |
| $15,000 to $24,999 | 1,462 | 2.8% |
| $25,000 to $34,999 | 1,880 | 3.6% |
| $35,000 to $49,999 | 3,290 | 6.3% |
| $50,000 to $74,999 | 6,162 | 11.8% |
| $75,000 to $99,999 | 6,318 | 12.1% |
| $100,000 to $149,999 | 11,070 | 21.2% |
| $150,000 to $199,999 | 7,206 | 13.8% |
| $200,000+ | 13,263 | 25.4% |
Family Income by Famaliy Size in El Dorado County
6-person families (1,205 | 2.3%) account for the highest median family income in El Dorado County with $158,021 per family, while 2-person families (27,716 | 53.1%) have the highest median income of $52,272 per family member.
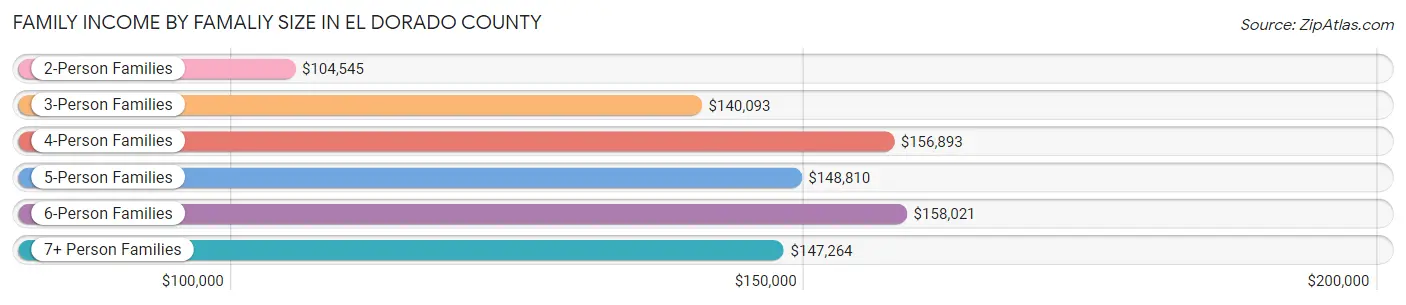
| Income Bracket | # Families | Median Income |
| 2-Person Families | 27,716 (53.1%) | $104,545 |
| 3-Person Families | 10,043 (19.2%) | $140,093 |
| 4-Person Families | 8,834 (16.9%) | $156,893 |
| 5-Person Families | 3,728 (7.1%) | $148,810 |
| 6-Person Families | 1,205 (2.3%) | $158,021 |
| 7+ Person Families | 691 (1.3%) | $147,264 |
| Total | 52,217 (100.0%) | $122,465 |
Family Income by Number of Earners in El Dorado County
The median family income in El Dorado County is $122,465, with families comprising 3+ earners (5,577) having the highest median family income of $185,773, while families with no earners (11,007) have the lowest median family income of $80,163, accounting for 10.7% and 21.1% of families, respectively.
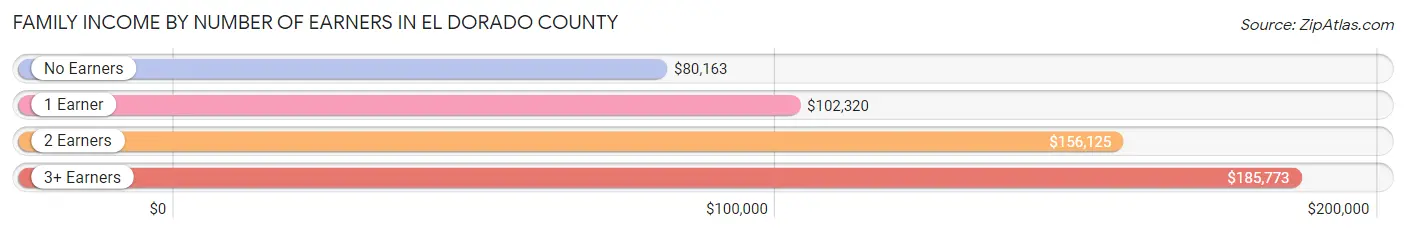
| Number of Earners | # Families | Median Income |
| No Earners | 11,007 (21.1%) | $80,163 |
| 1 Earner | 15,850 (30.3%) | $102,320 |
| 2 Earners | 19,783 (37.9%) | $156,125 |
| 3+ Earners | 5,577 (10.7%) | $185,773 |
| Total | 52,217 (100.0%) | $122,465 |
Household Income in El Dorado County
Household Income Brackets in El Dorado County
With 15,188 households falling in the category, the $200,000+ income range is the most frequent in El Dorado County, accounting for 20.2% of all households. In contrast, only 1,955 households (2.6%) fall into the $10,000 to $14,999 income bracket, making it the least populous group.
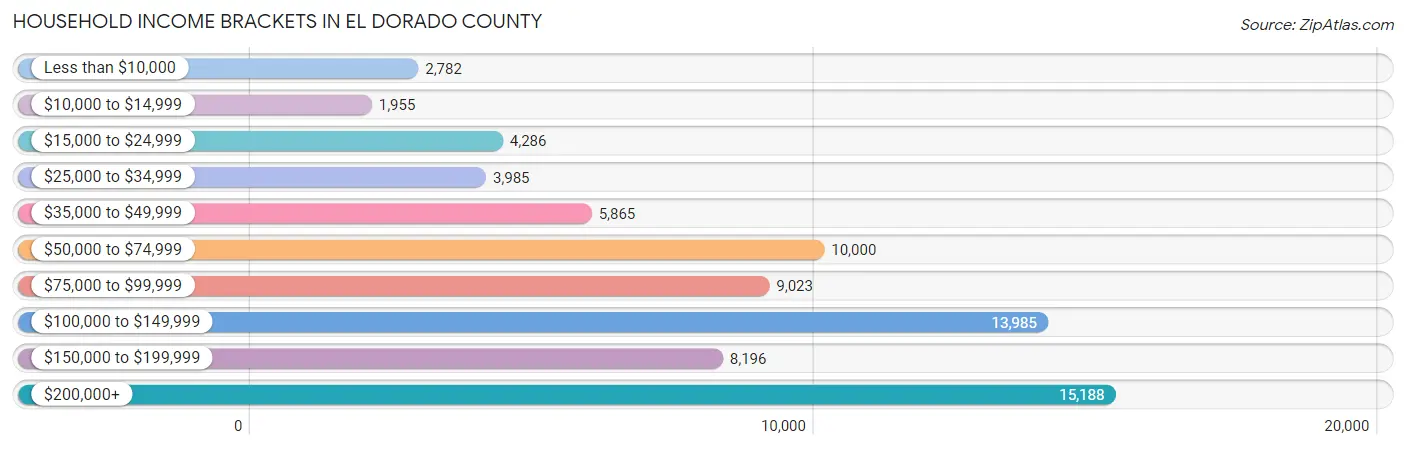
| Income Bracket | # Households | % Households |
| Less than $10,000 | 2,782 | 3.7% |
| $10,000 to $14,999 | 1,955 | 2.6% |
| $15,000 to $24,999 | 4,286 | 5.7% |
| $25,000 to $34,999 | 3,985 | 5.3% |
| $35,000 to $49,999 | 5,865 | 7.8% |
| $50,000 to $74,999 | 10,000 | 13.3% |
| $75,000 to $99,999 | 9,023 | 12.0% |
| $100,000 to $149,999 | 13,985 | 18.6% |
| $150,000 to $199,999 | 8,196 | 10.9% |
| $200,000+ | 15,188 | 20.2% |
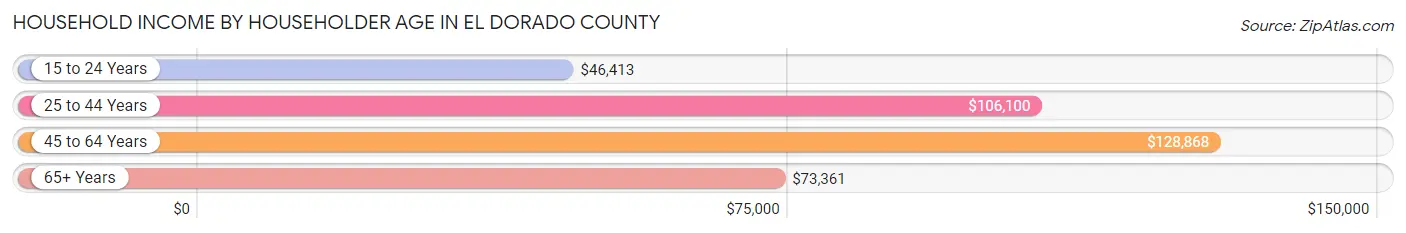
Household Income by Householder Age in El Dorado County
The median household income in El Dorado County is $99,246, with the highest median household income of $128,868 found in the 45 to 64 years age bracket for the primary householder. A total of 29,366 households (39.1%) fall into this category. Meanwhile, the 15 to 24 years age bracket for the primary householder has the lowest median household income of $46,413, with 1,028 households (1.4%) in this group.
| Income Bracket | # Households | Median Income |
| 15 to 24 Years | 1,028 (1.4%) | $46,413 |
| 25 to 44 Years | 18,785 (25.0%) | $106,100 |
| 45 to 64 Years | 29,366 (39.1%) | $128,868 |
| 65+ Years | 26,011 (34.6%) | $73,361 |
| Total | 75,190 (100.0%) | $99,246 |
Poverty in El Dorado County
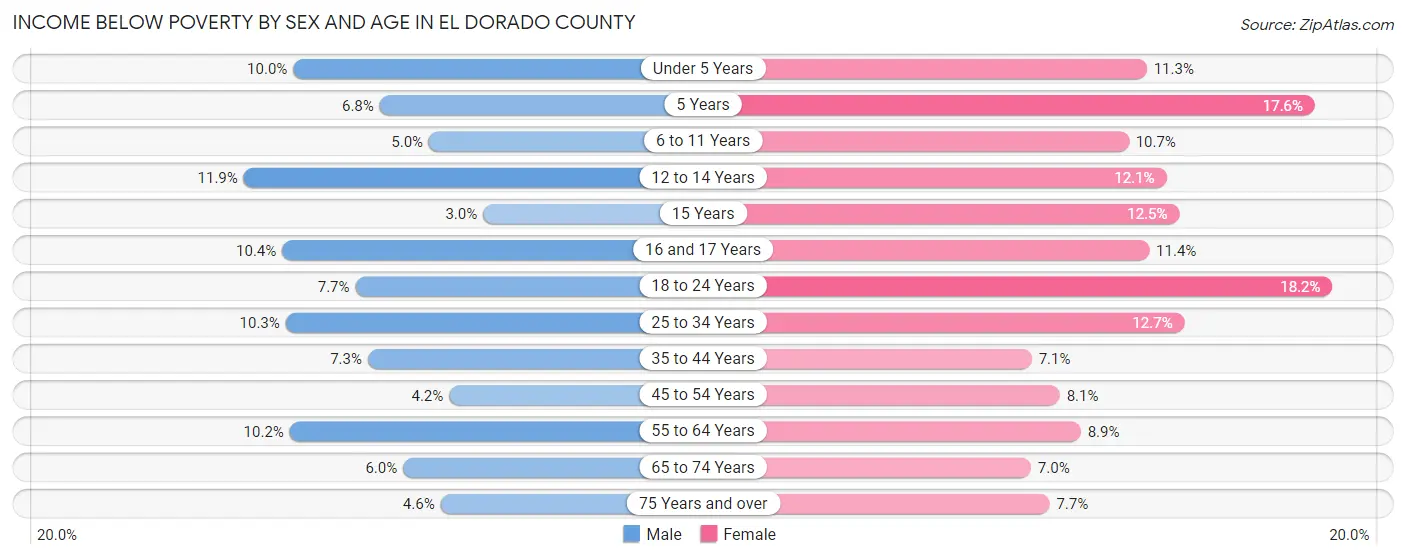
Income Below Poverty by Sex and Age in El Dorado County
With 7.5% poverty level for males and 9.7% for females among the residents of El Dorado County, 12 to 14 year old males and 18 to 24 year old females are the most vulnerable to poverty, with 396 males (11.9%) and 1,149 females (18.2%) in their respective age groups living below the poverty level.
| Age Bracket | Male | Female |
| Under 5 Years | 429 (10.0%) | 471 (11.3%) |
| 5 Years | 62 (6.8%) | 184 (17.6%) |
| 6 to 11 Years | 334 (5.0%) | 649 (10.6%) |
| 12 to 14 Years | 396 (11.9%) | 400 (12.0%) |
| 15 Years | 32 (3.0%) | 163 (12.5%) |
| 16 and 17 Years | 278 (10.4%) | 255 (11.4%) |
| 18 to 24 Years | 530 (7.7%) | 1,149 (18.2%) |
| 25 to 34 Years | 1,014 (10.3%) | 1,199 (12.7%) |
| 35 to 44 Years | 834 (7.3%) | 795 (7.0%) |
| 45 to 54 Years | 519 (4.2%) | 972 (8.1%) |
| 55 to 64 Years | 1,569 (10.2%) | 1,414 (8.9%) |
| 65 to 74 Years | 781 (5.9%) | 932 (7.0%) |
| 75 Years and over | 332 (4.6%) | 671 (7.7%) |
| Total | 7,110 (7.5%) | 9,254 (9.7%) |
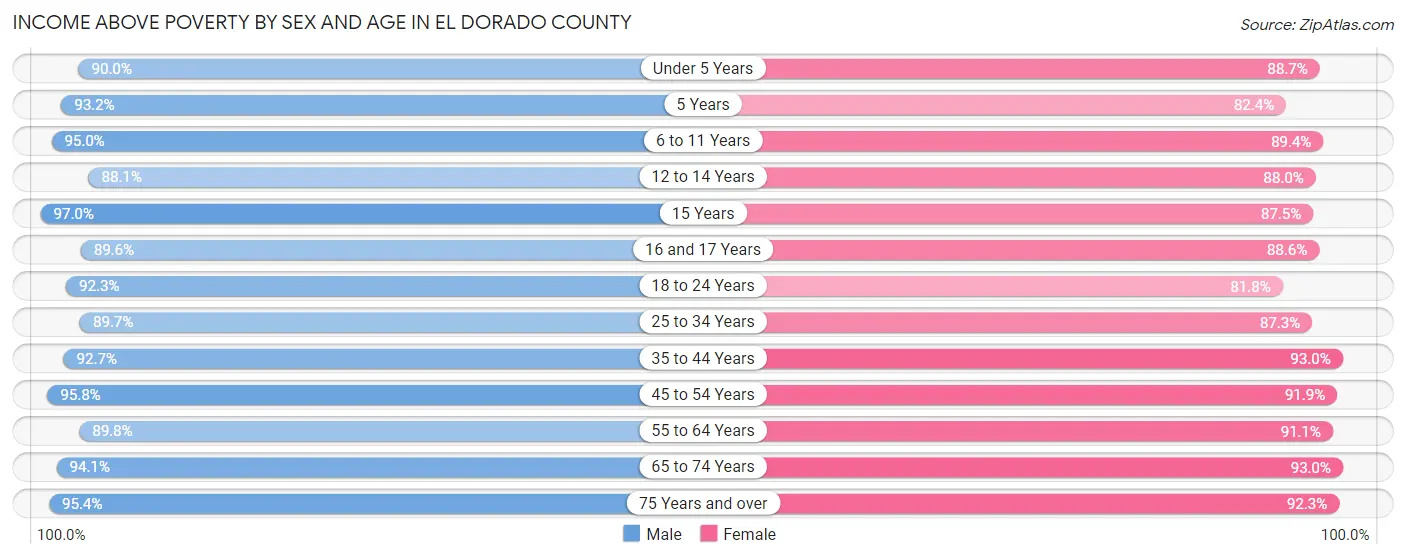
Income Above Poverty by Sex and Age in El Dorado County
According to the poverty statistics in El Dorado County, males aged 15 years and females aged 65 to 74 years are the age groups that are most secure financially, with 97.0% of males and 93.0% of females in these age groups living above the poverty line.
| Age Bracket | Male | Female |
| Under 5 Years | 3,847 (90.0%) | 3,690 (88.7%) |
| 5 Years | 847 (93.2%) | 864 (82.4%) |
| 6 to 11 Years | 6,356 (95.0%) | 5,445 (89.3%) |
| 12 to 14 Years | 2,939 (88.1%) | 2,919 (87.9%) |
| 15 Years | 1,041 (97.0%) | 1,138 (87.5%) |
| 16 and 17 Years | 2,384 (89.6%) | 1,980 (88.6%) |
| 18 to 24 Years | 6,332 (92.3%) | 5,159 (81.8%) |
| 25 to 34 Years | 8,825 (89.7%) | 8,226 (87.3%) |
| 35 to 44 Years | 10,656 (92.7%) | 10,488 (92.9%) |
| 45 to 54 Years | 11,728 (95.8%) | 11,042 (91.9%) |
| 55 to 64 Years | 13,876 (89.8%) | 14,532 (91.1%) |
| 65 to 74 Years | 12,335 (94.1%) | 12,341 (93.0%) |
| 75 Years and over | 6,942 (95.4%) | 8,030 (92.3%) |
| Total | 88,108 (92.5%) | 85,854 (90.3%) |
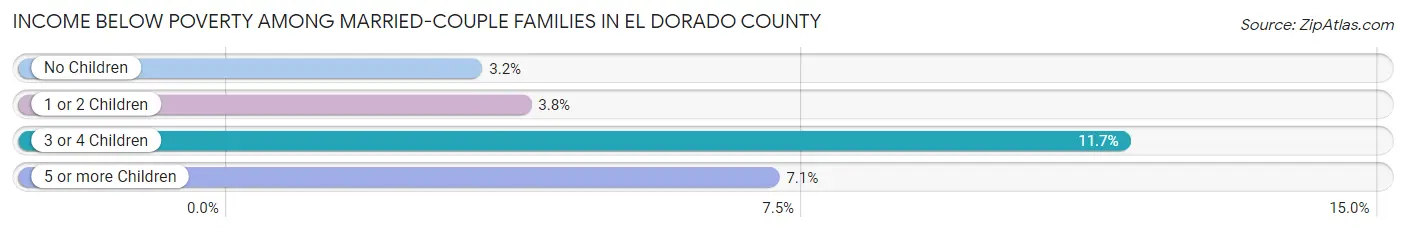
Income Below Poverty Among Married-Couple Families in El Dorado County
The poverty statistics for married-couple families in El Dorado County show that 4.0% or 1,696 of the total 42,953 families live below the poverty line. Families with 3 or 4 children have the highest poverty rate of 11.7%, comprising of 323 families. On the other hand, families with no children have the lowest poverty rate of 3.2%, which includes 875 families.
| Children | Above Poverty | Below Poverty |
| No Children | 26,556 (96.8%) | 875 (3.2%) |
| 1 or 2 Children | 11,988 (96.2%) | 478 (3.8%) |
| 3 or 4 Children | 2,450 (88.3%) | 323 (11.7%) |
| 5 or more Children | 263 (92.9%) | 20 (7.1%) |
| Total | 41,257 (96.1%) | 1,696 (4.0%) |
Income Below Poverty Among Single-Parent Households in El Dorado County
According to the poverty data in El Dorado County, 8.9% or 279 single-father households and 17.8% or 1,087 single-mother households are living below the poverty line. Among single-father households, those with 1 or 2 children have the highest poverty rate, with 146 households (10.2%) experiencing poverty. Likewise, among single-mother households, those with 5 or more children have the highest poverty rate, with 17 households (100.0%) falling below the poverty line.
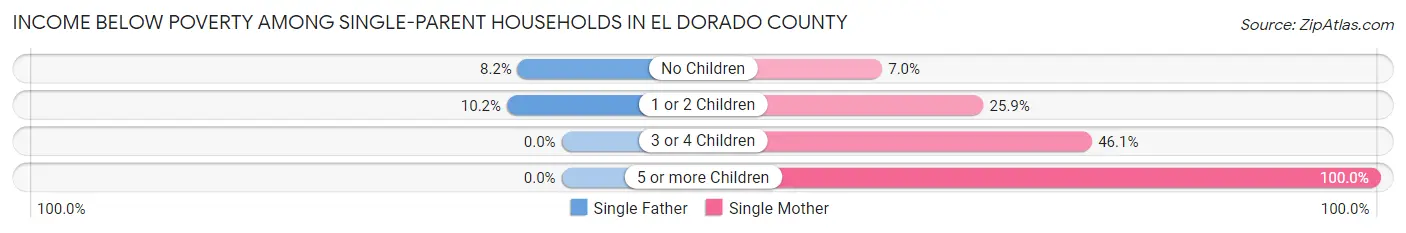
| Children | Single Father | Single Mother |
| No Children | 133 (8.2%) | 213 (7.0%) |
| 1 or 2 Children | 146 (10.2%) | 709 (25.9%) |
| 3 or 4 Children | 0 (0.0%) | 148 (46.1%) |
| 5 or more Children | 0 (0.0%) | 17 (100.0%) |
| Total | 279 (8.9%) | 1,087 (17.8%) |
Income Below Poverty Among Married-Couple vs Single-Parent Households in El Dorado County
The poverty data for El Dorado County shows that 1,696 of the married-couple family households (4.0%) and 1,366 of the single-parent households (14.7%) are living below the poverty level. Within the married-couple family households, those with 3 or 4 children have the highest poverty rate, with 323 households (11.7%) falling below the poverty line. Among the single-parent households, those with 5 or more children have the highest poverty rate, with 17 household (80.9%) living below poverty.
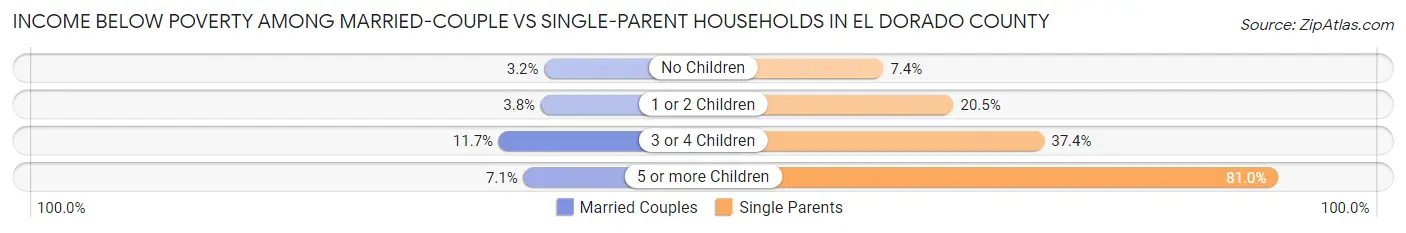
| Children | Married-Couple Families | Single-Parent Households |
| No Children | 875 (3.2%) | 346 (7.4%) |
| 1 or 2 Children | 478 (3.8%) | 855 (20.5%) |
| 3 or 4 Children | 323 (11.7%) | 148 (37.4%) |
| 5 or more Children | 20 (7.1%) | 17 (80.9%) |
| Total | 1,696 (4.0%) | 1,366 (14.7%) |
Race in El Dorado County
The most populous races in El Dorado County are White / Caucasian (158,083 | 82.5%), Hispanic or Latino (25,930 | 13.5%), and Two or more Races (14,534 | 7.6%).
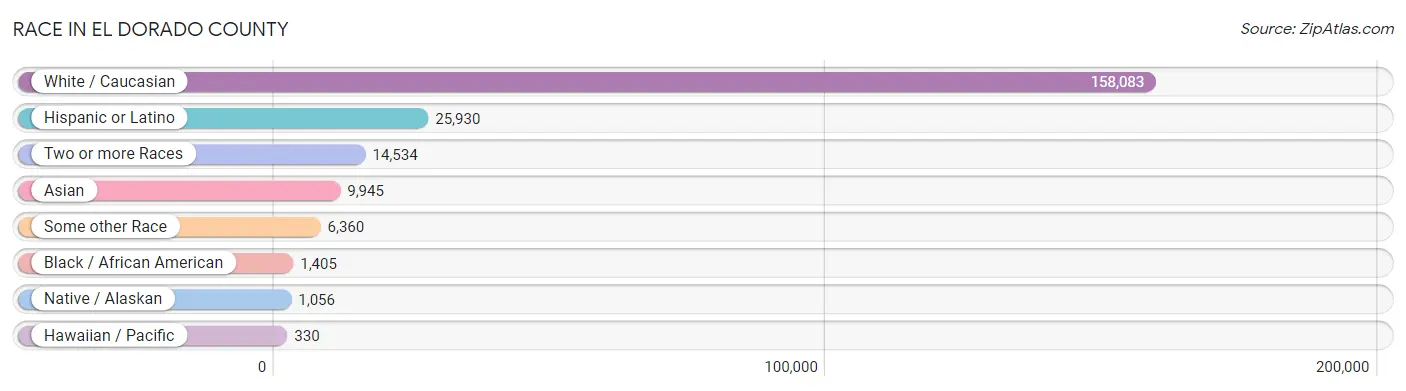
| Race | # Population | % Population |
| Asian | 9,945 | 5.2% |
| Black / African American | 1,405 | 0.7% |
| Hawaiian / Pacific | 330 | 0.2% |
| Hispanic or Latino | 25,930 | 13.5% |
| Native / Alaskan | 1,056 | 0.5% |
| White / Caucasian | 158,083 | 82.5% |
| Two or more Races | 14,534 | 7.6% |
| Some other Race | 6,360 | 3.3% |
| Total | 191,713 | 100.0% |
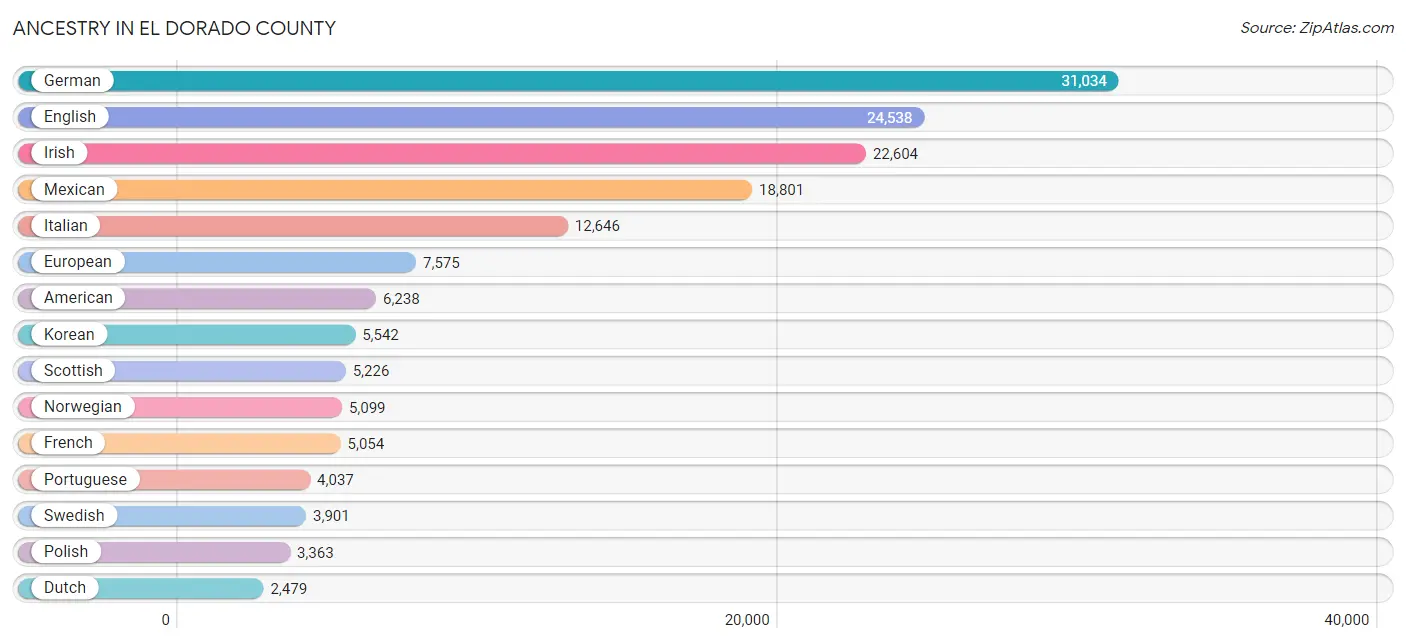
Ancestry in El Dorado County
The most populous ancestries reported in El Dorado County are German (31,034 | 16.2%), English (24,538 | 12.8%), Irish (22,604 | 11.8%), Mexican (18,801 | 9.8%), and Italian (12,646 | 6.6%), together accounting for 57.2% of all El Dorado County residents.
| Ancestry | # Population | % Population |
| Afghan | 16 | 0.0% |
| African | 35 | 0.0% |
| Aleut | 23 | 0.0% |
| American | 6,238 | 3.3% |
| Apache | 188 | 0.1% |
| Arab | 543 | 0.3% |
| Argentinean | 117 | 0.1% |
| Armenian | 250 | 0.1% |
| Assyrian / Chaldean / Syriac | 118 | 0.1% |
| Australian | 224 | 0.1% |
| Austrian | 525 | 0.3% |
| Bangladeshi | 34 | 0.0% |
| Barbadian | 10 | 0.0% |
| Basque | 172 | 0.1% |
| Belgian | 191 | 0.1% |
| Belizean | 1 | 0.0% |
| Bhutanese | 1,555 | 0.8% |
| Blackfeet | 147 | 0.1% |
| Bolivian | 61 | 0.0% |
| Brazilian | 72 | 0.0% |
| British | 2,284 | 1.2% |
| Bulgarian | 186 | 0.1% |
| Burmese | 902 | 0.5% |
| Cajun | 53 | 0.0% |
| Canadian | 495 | 0.3% |
| Cape Verdean | 30 | 0.0% |
| Carpatho Rusyn | 38 | 0.0% |
| Celtic | 24 | 0.0% |
| Central American | 2,002 | 1.0% |
| Central American Indian | 135 | 0.1% |
| Cherokee | 944 | 0.5% |
| Cheyenne | 25 | 0.0% |
| Chickasaw | 31 | 0.0% |
| Chilean | 108 | 0.1% |
| Chippewa | 18 | 0.0% |
| Choctaw | 262 | 0.1% |
| Colombian | 141 | 0.1% |
| Costa Rican | 119 | 0.1% |
| Creek | 7 | 0.0% |
| Croatian | 386 | 0.2% |
| Cuban | 162 | 0.1% |
| Czech | 568 | 0.3% |
| Czechoslovakian | 315 | 0.2% |
| Danish | 1,811 | 0.9% |
| Dutch | 2,479 | 1.3% |
| Eastern European | 587 | 0.3% |
| Egyptian | 14 | 0.0% |
| English | 24,538 | 12.8% |
| Estonian | 114 | 0.1% |
| Ethiopian | 4 | 0.0% |
| European | 7,575 | 4.0% |
| Filipino | 112 | 0.1% |
| Finnish | 764 | 0.4% |
| French | 5,054 | 2.6% |
| French American Indian | 58 | 0.0% |
| French Canadian | 1,264 | 0.7% |
| German | 31,034 | 16.2% |
| Greek | 870 | 0.4% |
| Guamanian / Chamorro | 14 | 0.0% |
| Guatemalan | 97 | 0.1% |
| Haitian | 36 | 0.0% |
| Honduran | 153 | 0.1% |
| Hungarian | 843 | 0.4% |
| Icelander | 58 | 0.0% |
| Indian (Asian) | 2,271 | 1.2% |
| Indonesian | 50 | 0.0% |
| Inupiat | 8 | 0.0% |
| Iranian | 487 | 0.3% |
| Irish | 22,604 | 11.8% |
| Iroquois | 40 | 0.0% |
| Israeli | 74 | 0.0% |
| Italian | 12,646 | 6.6% |
| Jamaican | 14 | 0.0% |
| Japanese | 317 | 0.2% |
| Jordanian | 14 | 0.0% |
| Kenyan | 5 | 0.0% |
| Korean | 5,542 | 2.9% |
| Laotian | 213 | 0.1% |
| Latvian | 42 | 0.0% |
| Lebanese | 99 | 0.1% |
| Lithuanian | 194 | 0.1% |
| Luxembourger | 11 | 0.0% |
| Macedonian | 22 | 0.0% |
| Malaysian | 37 | 0.0% |
| Maltese | 22 | 0.0% |
| Marshallese | 22 | 0.0% |
| Mexican | 18,801 | 9.8% |
| Mexican American Indian | 238 | 0.1% |
| Moroccan | 67 | 0.0% |
| Native Hawaiian | 894 | 0.5% |
| Navajo | 150 | 0.1% |
| New Zealander | 77 | 0.0% |
| Nicaraguan | 227 | 0.1% |
| Nigerian | 22 | 0.0% |
| Northern European | 950 | 0.5% |
| Norwegian | 5,099 | 2.7% |
| Okinawan | 37 | 0.0% |
| Paiute | 10 | 0.0% |
| Pakistani | 177 | 0.1% |
| Palestinian | 55 | 0.0% |
| Panamanian | 11 | 0.0% |
| Paraguayan | 14 | 0.0% |
| Pennsylvania German | 57 | 0.0% |
| Peruvian | 261 | 0.1% |
| Pima | 20 | 0.0% |
| Polish | 3,363 | 1.8% |
| Portuguese | 4,037 | 2.1% |
| Potawatomi | 82 | 0.0% |
| Puerto Rican | 1,081 | 0.6% |
| Puget Sound Salish | 36 | 0.0% |
| Romanian | 333 | 0.2% |
| Russian | 1,794 | 0.9% |
| Salvadoran | 1,381 | 0.7% |
| Samoan | 133 | 0.1% |
| Scandinavian | 856 | 0.4% |
| Scotch-Irish | 2,320 | 1.2% |
| Scottish | 5,226 | 2.7% |
| Seminole | 31 | 0.0% |
| Senegalese | 8 | 0.0% |
| Serbian | 29 | 0.0% |
| Shoshone | 10 | 0.0% |
| Sioux | 368 | 0.2% |
| Slavic | 53 | 0.0% |
| Slovak | 311 | 0.2% |
| Slovene | 131 | 0.1% |
| South African | 45 | 0.0% |
| South American | 863 | 0.4% |
| Spaniard | 785 | 0.4% |
| Spanish | 1,553 | 0.8% |
| Spanish American Indian | 59 | 0.0% |
| Sri Lankan | 920 | 0.5% |
| Subsaharan African | 156 | 0.1% |
| Swedish | 3,901 | 2.0% |
| Swiss | 1,106 | 0.6% |
| Syrian | 78 | 0.0% |
| Thai | 2,025 | 1.1% |
| Tlingit-Haida | 78 | 0.0% |
| Trinidadian and Tobagonian | 10 | 0.0% |
| Turkish | 91 | 0.1% |
| Ukrainian | 525 | 0.3% |
| Uruguayan | 10 | 0.0% |
| Venezuelan | 151 | 0.1% |
| Welsh | 1,884 | 1.0% |
| West Indian | 11 | 0.0% |
| Yaqui | 59 | 0.0% |
| Yugoslavian | 220 | 0.1% | View All 146 Rows |
Immigrants in El Dorado County
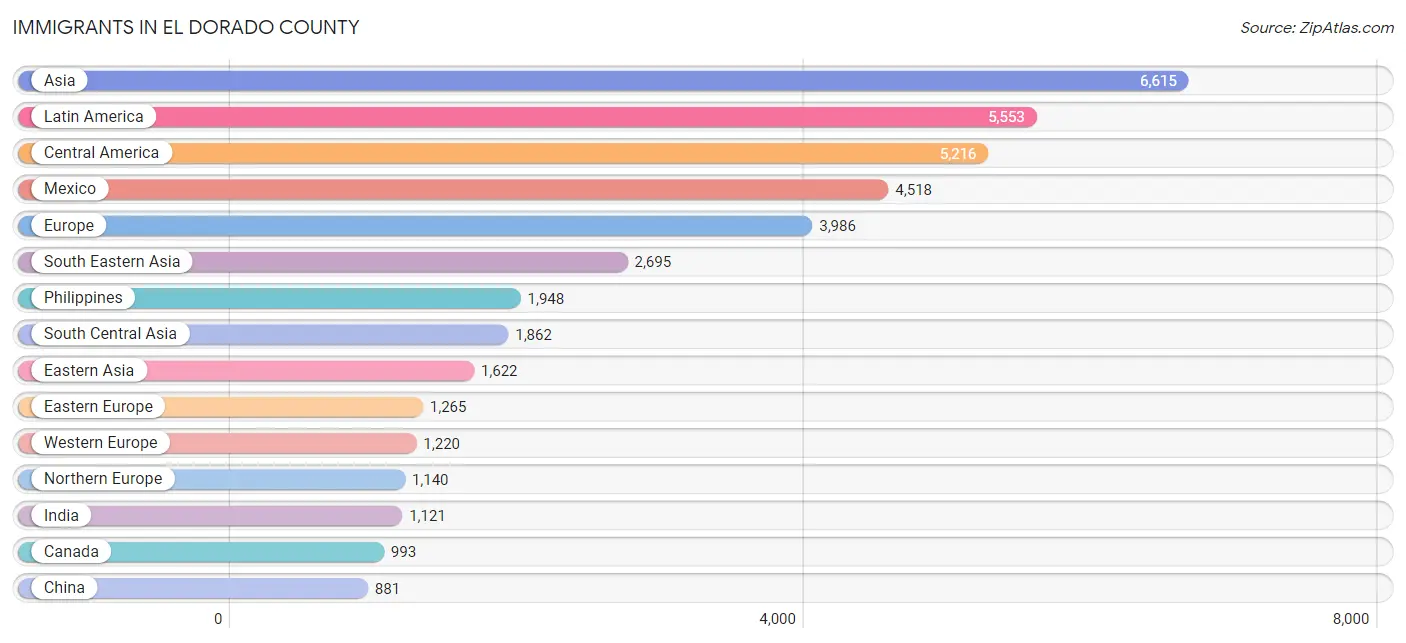
The most numerous immigrant groups reported in El Dorado County came from Asia (6,615 | 3.5%), Latin America (5,553 | 2.9%), Central America (5,216 | 2.7%), Mexico (4,518 | 2.4%), and Europe (3,986 | 2.1%), together accounting for 13.5% of all El Dorado County residents.
| Immigration Origin | # Population | % Population |
| Afghanistan | 54 | 0.0% |
| Africa | 240 | 0.1% |
| Argentina | 57 | 0.0% |
| Asia | 6,615 | 3.5% |
| Australia | 175 | 0.1% |
| Austria | 114 | 0.1% |
| Azores | 17 | 0.0% |
| Belarus | 114 | 0.1% |
| Bolivia | 29 | 0.0% |
| Brazil | 49 | 0.0% |
| Bulgaria | 133 | 0.1% |
| Cambodia | 27 | 0.0% |
| Canada | 993 | 0.5% |
| Caribbean | 25 | 0.0% |
| Central America | 5,216 | 2.7% |
| Chile | 20 | 0.0% |
| China | 881 | 0.5% |
| Colombia | 35 | 0.0% |
| Costa Rica | 60 | 0.0% |
| Cuba | 8 | 0.0% |
| Czechoslovakia | 117 | 0.1% |
| Eastern Africa | 21 | 0.0% |
| Eastern Asia | 1,622 | 0.9% |
| Eastern Europe | 1,265 | 0.7% |
| Ecuador | 16 | 0.0% |
| Egypt | 26 | 0.0% |
| El Salvador | 395 | 0.2% |
| England | 460 | 0.2% |
| Eritrea | 4 | 0.0% |
| Europe | 3,986 | 2.1% |
| Fiji | 164 | 0.1% |
| France | 195 | 0.1% |
| Germany | 748 | 0.4% |
| Greece | 8 | 0.0% |
| Guatemala | 39 | 0.0% |
| Honduras | 136 | 0.1% |
| Hong Kong | 13 | 0.0% |
| Hungary | 128 | 0.1% |
| India | 1,121 | 0.6% |
| Indonesia | 127 | 0.1% |
| Iran | 499 | 0.3% |
| Iraq | 24 | 0.0% |
| Ireland | 95 | 0.1% |
| Israel | 85 | 0.0% |
| Italy | 94 | 0.1% |
| Japan | 171 | 0.1% |
| Jordan | 3 | 0.0% |
| Kazakhstan | 6 | 0.0% |
| Kenya | 17 | 0.0% |
| Korea | 570 | 0.3% |
| Kuwait | 4 | 0.0% |
| Laos | 9 | 0.0% |
| Latin America | 5,553 | 2.9% |
| Lebanon | 137 | 0.1% |
| Lithuania | 25 | 0.0% |
| Mexico | 4,518 | 2.4% |
| Micronesia | 14 | 0.0% |
| Middle Africa | 15 | 0.0% |
| Morocco | 53 | 0.0% |
| Nepal | 15 | 0.0% |
| Netherlands | 118 | 0.1% |
| Nicaragua | 68 | 0.0% |
| Nigeria | 8 | 0.0% |
| North Macedonia | 22 | 0.0% |
| Northern Africa | 124 | 0.1% |
| Northern Europe | 1,140 | 0.6% |
| Norway | 44 | 0.0% |
| Oceania | 482 | 0.3% |
| Pakistan | 66 | 0.0% |
| Peru | 36 | 0.0% |
| Philippines | 1,948 | 1.0% |
| Poland | 184 | 0.1% |
| Portugal | 29 | 0.0% |
| Romania | 15 | 0.0% |
| Russia | 199 | 0.1% |
| Saudi Arabia | 19 | 0.0% |
| Scotland | 4 | 0.0% |
| Serbia | 18 | 0.0% |
| Singapore | 37 | 0.0% |
| South Africa | 71 | 0.0% |
| South America | 312 | 0.2% |
| South Central Asia | 1,862 | 1.0% |
| South Eastern Asia | 2,695 | 1.4% |
| Southern Europe | 361 | 0.2% |
| Spain | 107 | 0.1% |
| Sri Lanka | 101 | 0.1% |
| Sweden | 97 | 0.1% |
| Switzerland | 45 | 0.0% |
| Taiwan | 73 | 0.0% |
| Thailand | 83 | 0.0% |
| Trinidad and Tobago | 17 | 0.0% |
| Turkey | 72 | 0.0% |
| Ukraine | 228 | 0.1% |
| Uruguay | 10 | 0.0% |
| Venezuela | 60 | 0.0% |
| Vietnam | 402 | 0.2% |
| Western Africa | 8 | 0.0% |
| Western Asia | 344 | 0.2% |
| Western Europe | 1,220 | 0.6% |
| Zaire | 15 | 0.0% | View All 100 Rows |
Sex and Age in El Dorado County
Sex and Age in El Dorado County
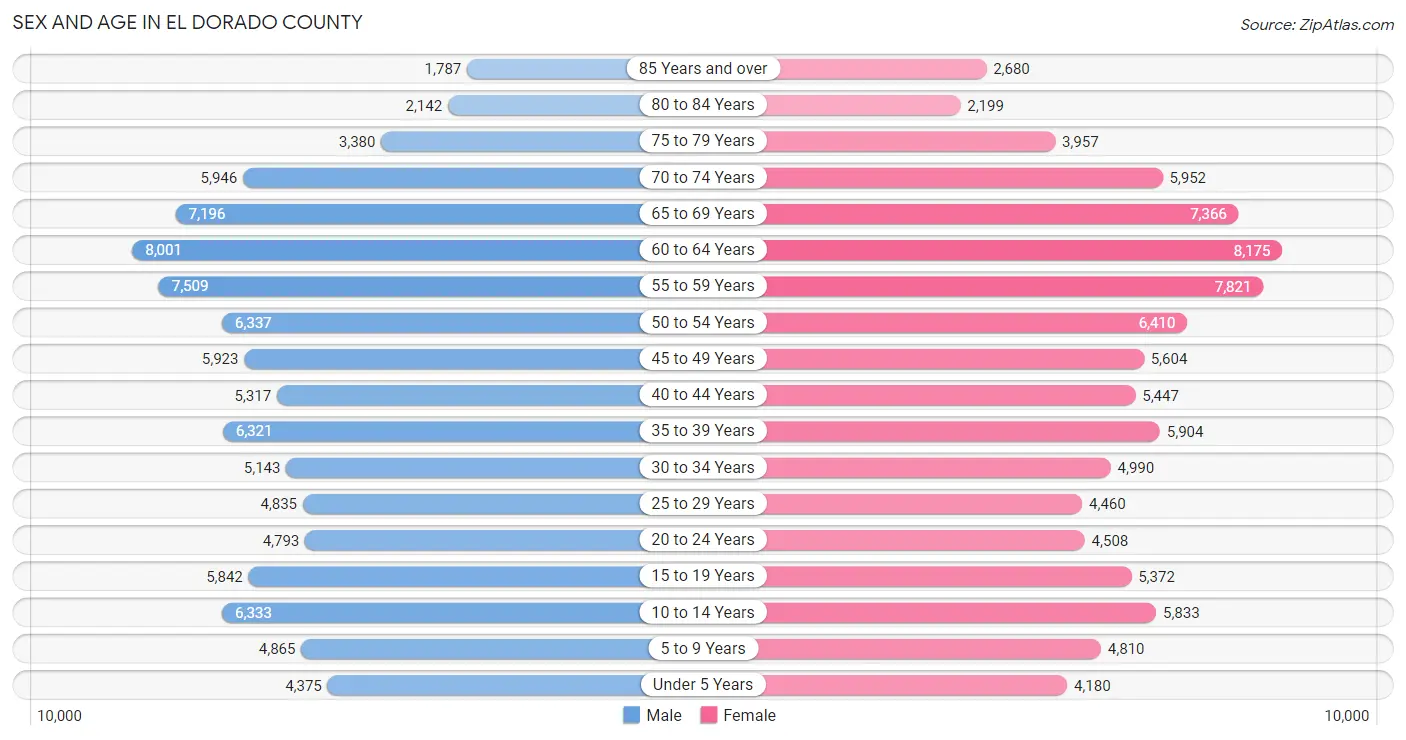
The most populous age groups in El Dorado County are 60 to 64 Years (8,001 | 8.3%) for men and 60 to 64 Years (8,175 | 8.6%) for women.
| Age Bracket | Male | Female |
| Under 5 Years | 4,375 (4.6%) | 4,180 (4.4%) |
| 5 to 9 Years | 4,865 (5.1%) | 4,810 (5.0%) |
| 10 to 14 Years | 6,333 (6.6%) | 5,833 (6.1%) |
| 15 to 19 Years | 5,842 (6.1%) | 5,372 (5.6%) |
| 20 to 24 Years | 4,793 (5.0%) | 4,508 (4.7%) |
| 25 to 29 Years | 4,835 (5.0%) | 4,460 (4.7%) |
| 30 to 34 Years | 5,143 (5.3%) | 4,990 (5.2%) |
| 35 to 39 Years | 6,321 (6.6%) | 5,904 (6.2%) |
| 40 to 44 Years | 5,317 (5.5%) | 5,447 (5.7%) |
| 45 to 49 Years | 5,923 (6.2%) | 5,604 (5.9%) |
| 50 to 54 Years | 6,337 (6.6%) | 6,410 (6.7%) |
| 55 to 59 Years | 7,509 (7.8%) | 7,821 (8.2%) |
| 60 to 64 Years | 8,001 (8.3%) | 8,175 (8.6%) |
| 65 to 69 Years | 7,196 (7.5%) | 7,366 (7.7%) |
| 70 to 74 Years | 5,946 (6.2%) | 5,952 (6.2%) |
| 75 to 79 Years | 3,380 (3.5%) | 3,957 (4.1%) |
| 80 to 84 Years | 2,142 (2.2%) | 2,199 (2.3%) |
| 85 Years and over | 1,787 (1.9%) | 2,680 (2.8%) |
| Total | 96,045 (100.0%) | 95,668 (100.0%) |
Families and Households in El Dorado County
Median Family Size in El Dorado County
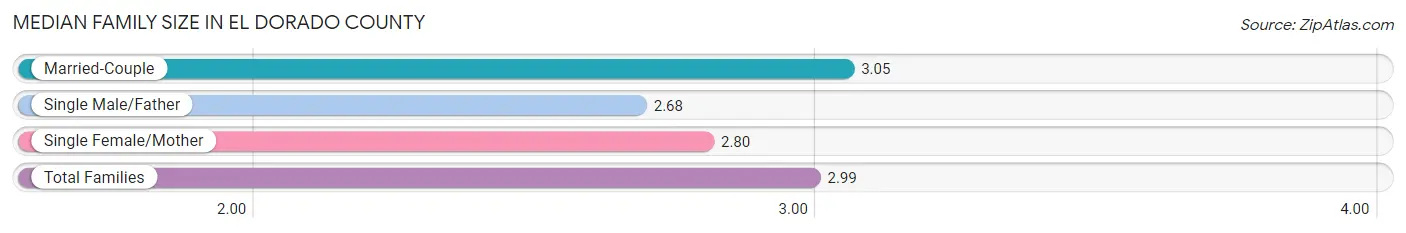
The median family size in El Dorado County is 2.99 persons per family, with married-couple families (42,953 | 82.3%) accounting for the largest median family size of 3.05 persons per family. On the other hand, single male/father families (3,145 | 6.0%) represent the smallest median family size with 2.68 persons per family.
| Family Type | # Families | Family Size |
| Married-Couple | 42,953 (82.3%) | 3.05 |
| Single Male/Father | 3,145 (6.0%) | 2.68 |
| Single Female/Mother | 6,119 (11.7%) | 2.80 |
| Total Families | 52,217 (100.0%) | 2.99 |
Median Household Size in El Dorado County
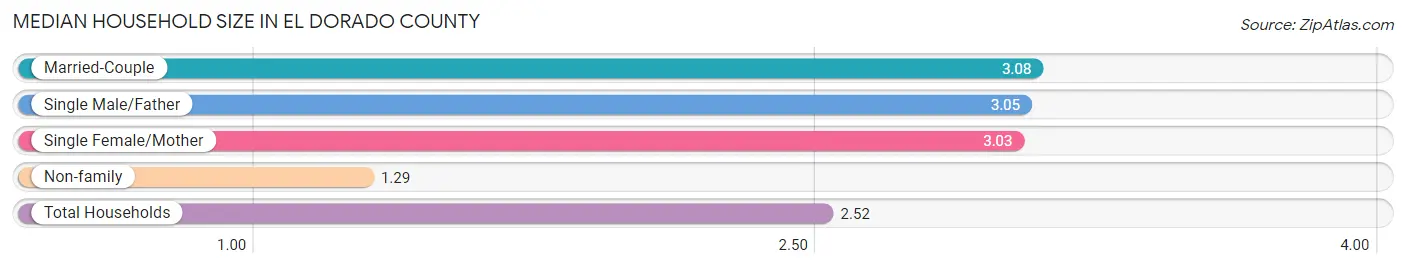
The median household size in El Dorado County is 2.52 persons per household, with married-couple households (42,953 | 57.1%) accounting for the largest median household size of 3.08 persons per household. non-family households (22,973 | 30.5%) represent the smallest median household size with 1.29 persons per household.
| Household Type | # Households | Household Size |
| Married-Couple | 42,953 (57.1%) | 3.08 |
| Single Male/Father | 3,145 (4.2%) | 3.05 |
| Single Female/Mother | 6,119 (8.1%) | 3.03 |
| Non-family | 22,973 (30.5%) | 1.29 |
| Total Households | 75,190 (100.0%) | 2.52 |
Household Size by Marriage Status in El Dorado County
Out of a total of 75,190 households in El Dorado County, 52,217 (69.5%) are family households, while 22,973 (30.5%) are nonfamily households. The most numerous type of family households are 2-person households, comprising 26,247, and the most common type of nonfamily households are 1-person households, comprising 17,830.
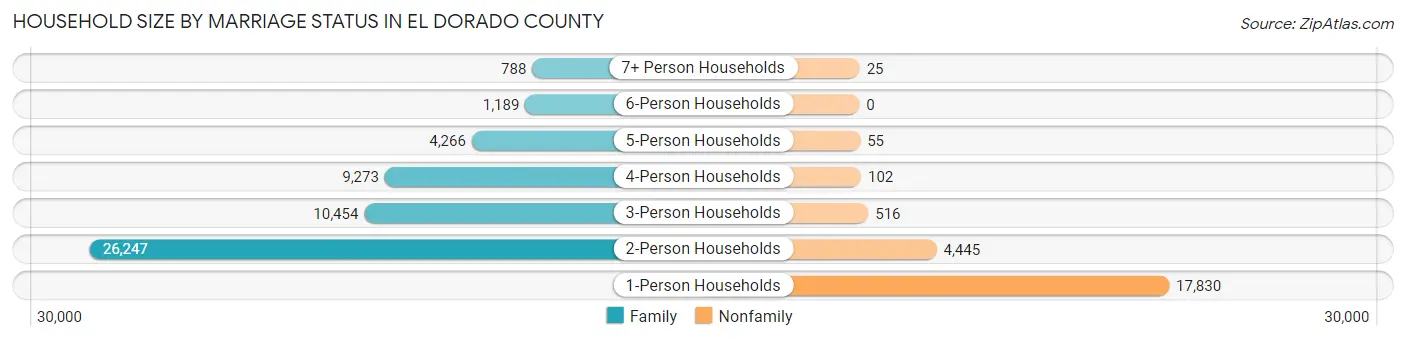
| Household Size | Family Households | Nonfamily Households |
| 1-Person Households | - | 17,830 (23.7%) |
| 2-Person Households | 26,247 (34.9%) | 4,445 (5.9%) |
| 3-Person Households | 10,454 (13.9%) | 516 (0.7%) |
| 4-Person Households | 9,273 (12.3%) | 102 (0.1%) |
| 5-Person Households | 4,266 (5.7%) | 55 (0.1%) |
| 6-Person Households | 1,189 (1.6%) | 0 (0.0%) |
| 7+ Person Households | 788 (1.1%) | 25 (0.0%) |
| Total | 52,217 (69.5%) | 22,973 (30.5%) |
Female Fertility in El Dorado County
Fertility by Age in El Dorado County
Average fertility rate in El Dorado County is 45.0 births per 1,000 women. Women in the age bracket of 20 to 34 years have the highest fertility rate with 77.0 births per 1,000 women. Women in the age bracket of 20 to 34 years acount for 64.5% of all women with births.
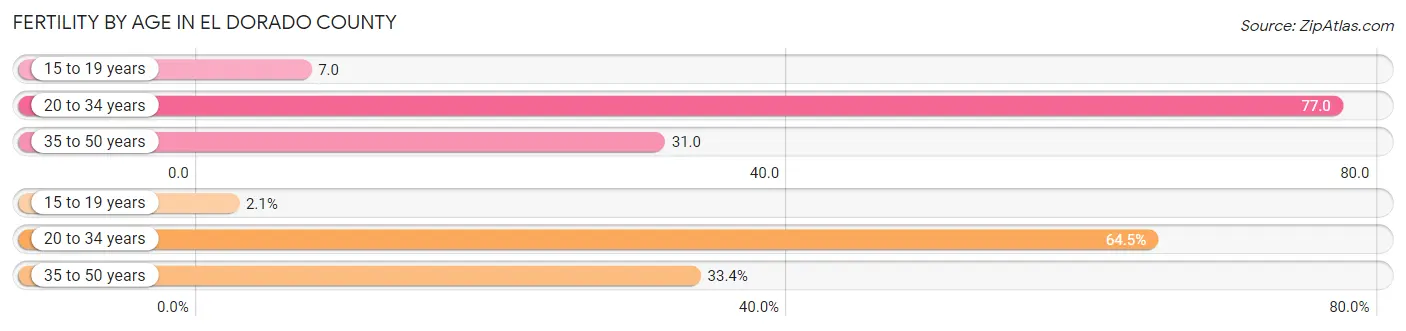
| Age Bracket | Women with Births | Births / 1,000 Women |
| 15 to 19 years | 35 (2.1%) | 7.0 |
| 20 to 34 years | 1,076 (64.5%) | 77.0 |
| 35 to 50 years | 558 (33.4%) | 31.0 |
| Total | 1,669 (100.0%) | 45.0 |
Fertility by Age by Marriage Status in El Dorado County
73.0% of women with births (1,669) in El Dorado County are married. The highest percentage of unmarried women with births falls into 15 to 19 years age bracket with 100.0% of them unmarried at the time of birth, while the lowest percentage of unmarried women with births belong to 20 to 34 years age bracket with 25.3% of them unmarried.
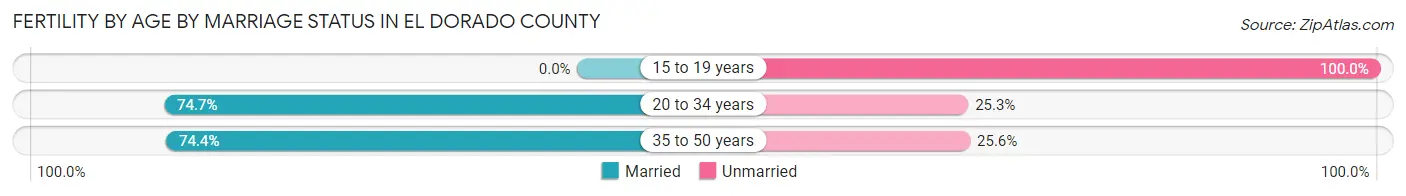
| Age Bracket | Married | Unmarried |
| 15 to 19 years | 0 (0.0%) | 35 (100.0%) |
| 20 to 34 years | 804 (74.7%) | 272 (25.3%) |
| 35 to 50 years | 415 (74.4%) | 143 (25.6%) |
| Total | 1,218 (73.0%) | 451 (27.0%) |
Fertility by Education in El Dorado County
Average fertility rate in El Dorado County is 45.0 births per 1,000 women. Women with the education attainment of bachelor's degree have the highest fertility rate of 64.0 births per 1,000 women, while women with the education attainment of less than high school have the lowest fertility at 7.0 births per 1,000 women. Women with the education attainment of bachelor's degree represent 35.8% of all women with births.
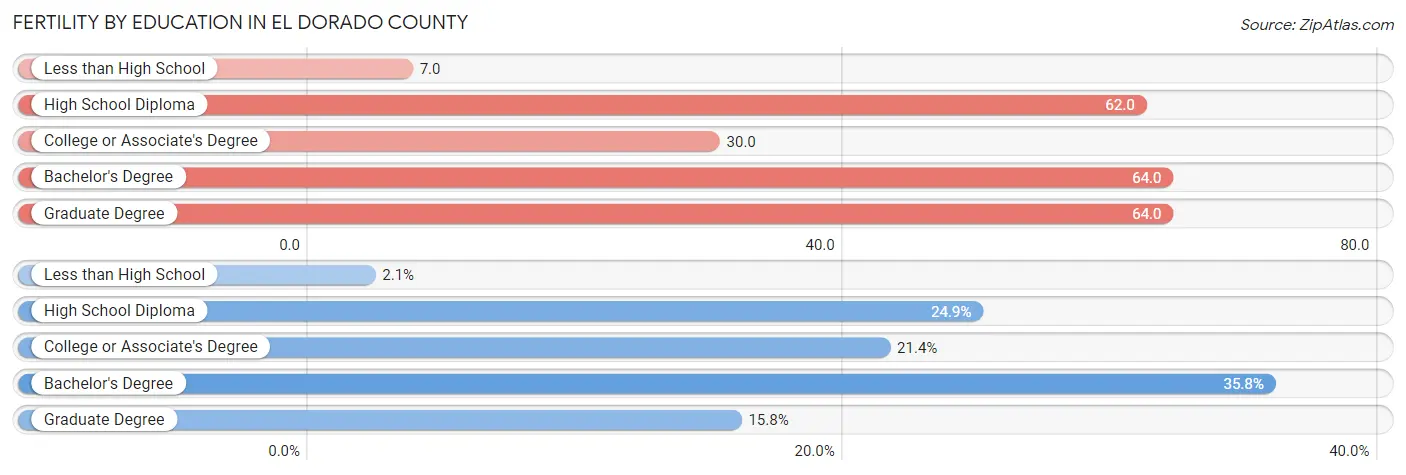
| Educational Attainment | Women with Births | Births / 1,000 Women |
| Less than High School | 35 (2.1%) | 7.0 |
| High School Diploma | 415 (24.9%) | 62.0 |
| College or Associate's Degree | 357 (21.4%) | 30.0 |
| Bachelor's Degree | 598 (35.8%) | 64.0 |
| Graduate Degree | 264 (15.8%) | 64.0 |
| Total | 1,669 (100.0%) | 45.0 |
Fertility by Education by Marriage Status in El Dorado County
27.0% of women with births in El Dorado County are unmarried. Women with the educational attainment of college or associate's degree are most likely to be married with 93.6% of them married at childbirth, while women with the educational attainment of less than high school are least likely to be married with 100.0% of them unmarried at childbirth.
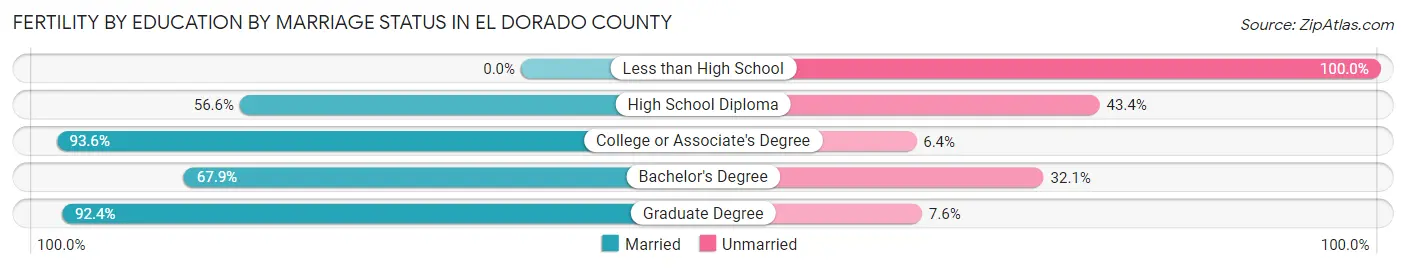
| Educational Attainment | Married | Unmarried |
| Less than High School | 0 (0.0%) | 35 (100.0%) |
| High School Diploma | 235 (56.6%) | 180 (43.4%) |
| College or Associate's Degree | 334 (93.6%) | 23 (6.4%) |
| Bachelor's Degree | 406 (67.9%) | 192 (32.1%) |
| Graduate Degree | 244 (92.4%) | 20 (7.6%) |
| Total | 1,218 (73.0%) | 451 (27.0%) |
Employment Characteristics in El Dorado County
Employment by Class of Employer in El Dorado County
Among the 86,127 employed individuals in El Dorado County, private company employees (50,724 | 58.9%), local government employees (8,523 | 9.9%), and not-for-profit organizations (8,440 | 9.8%) make up the most common classes of employment.
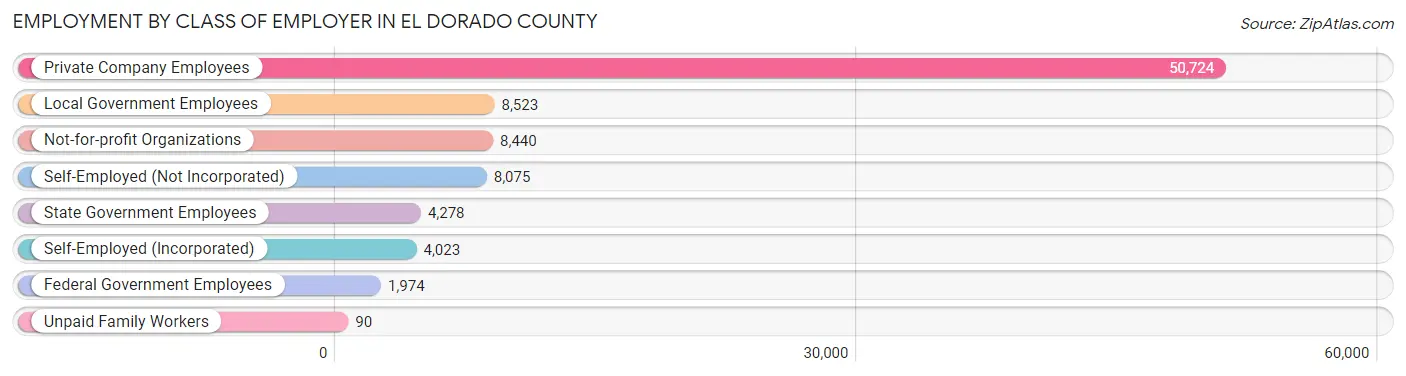
| Employer Class | # Employees | % Employees |
| Private Company Employees | 50,724 | 58.9% |
| Self-Employed (Incorporated) | 4,023 | 4.7% |
| Self-Employed (Not Incorporated) | 8,075 | 9.4% |
| Not-for-profit Organizations | 8,440 | 9.8% |
| Local Government Employees | 8,523 | 9.9% |
| State Government Employees | 4,278 | 5.0% |
| Federal Government Employees | 1,974 | 2.3% |
| Unpaid Family Workers | 90 | 0.1% |
| Total | 86,127 | 100.0% |
Employment Status by Age in El Dorado County
According to the labor force statistics for El Dorado County, out of the total population over 16 years of age (158,941), 58.2% or 92,504 individuals are in the labor force, with 4.6% or 4,255 of them unemployed. The age group with the highest labor force participation rate is 45 to 54 years, with 83.2% or 20,196 individuals in the labor force. Within the labor force, the 25 to 29 years age range has the highest percentage of unemployed individuals, with 8.9% or 639 of them being unemployed.
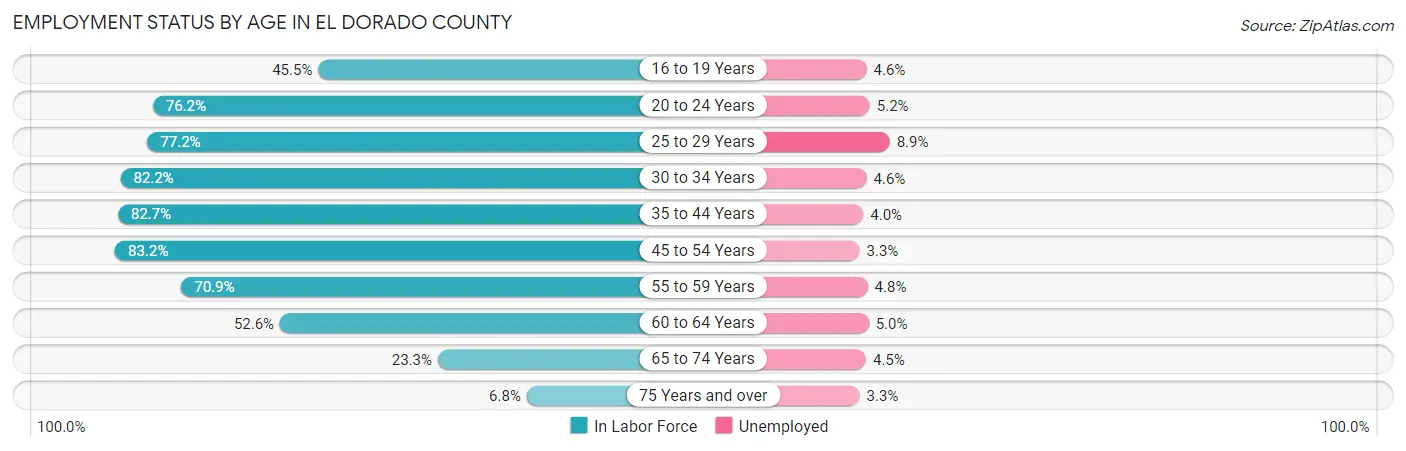
| Age Bracket | In Labor Force | Unemployed |
| 16 to 19 Years | 4,021 (45.5%) | 185 (4.6%) |
| 20 to 24 Years | 7,087 (76.2%) | 369 (5.2%) |
| 25 to 29 Years | 7,176 (77.2%) | 639 (8.9%) |
| 30 to 34 Years | 8,329 (82.2%) | 383 (4.6%) |
| 35 to 44 Years | 19,012 (82.7%) | 760 (4.0%) |
| 45 to 54 Years | 20,196 (83.2%) | 666 (3.3%) |
| 55 to 59 Years | 10,869 (70.9%) | 522 (4.8%) |
| 60 to 64 Years | 8,509 (52.6%) | 425 (5.0%) |
| 65 to 74 Years | 6,165 (23.3%) | 277 (4.5%) |
| 75 Years and over | 1,098 (6.8%) | 36 (3.3%) |
| Total | 92,504 (58.2%) | 4,255 (4.6%) |
Employment Status by Educational Attainment in El Dorado County
According to labor force statistics for El Dorado County, 75.4% of individuals (74,041) out of the total population between 25 and 64 years of age (98,197) are in the labor force, with 4.6% or 3,406 of them being unemployed. The group with the highest labor force participation rate are those with the educational attainment of bachelor's degree or higher, with 81.9% or 31,717 individuals in the labor force. Within the labor force, individuals with less than high school education have the highest percentage of unemployment, with 7.1% or 236 of them being unemployed.
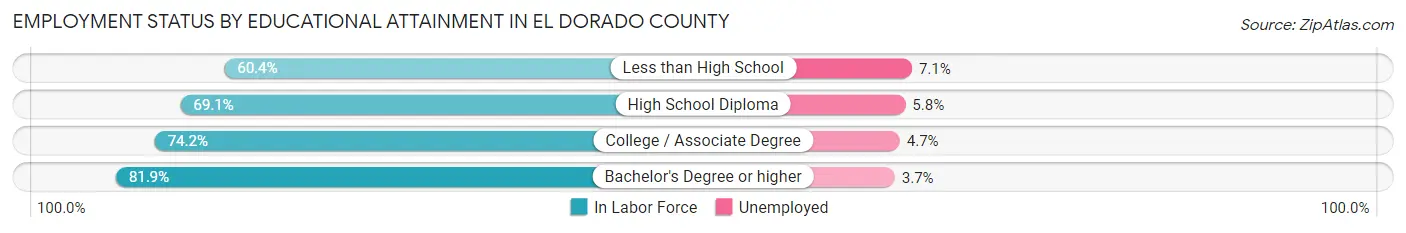
| Educational Attainment | In Labor Force | Unemployed |
| Less than High School | 3,320 (60.4%) | 390 (7.1%) |
| High School Diploma | 13,410 (69.1%) | 1,126 (5.8%) |
| College / Associate Degree | 25,649 (74.2%) | 1,625 (4.7%) |
| Bachelor's Degree or higher | 31,717 (81.9%) | 1,433 (3.7%) |
| Total | 74,041 (75.4%) | 4,517 (4.6%) |
Employment Occupations by Sex in El Dorado County
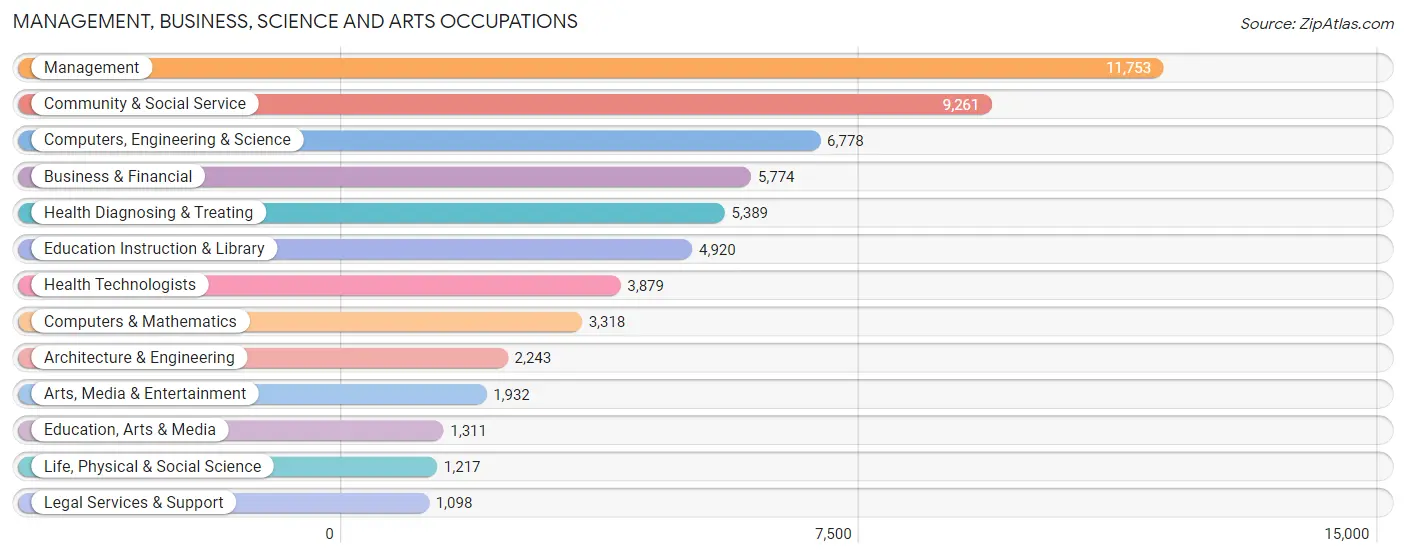
Management, Business, Science and Arts Occupations
The most common Management, Business, Science and Arts occupations in El Dorado County are Management (11,753 | 13.4%), Community & Social Service (9,261 | 10.5%), Computers, Engineering & Science (6,778 | 7.7%), Business & Financial (5,774 | 6.6%), and Health Diagnosing & Treating (5,389 | 6.1%).
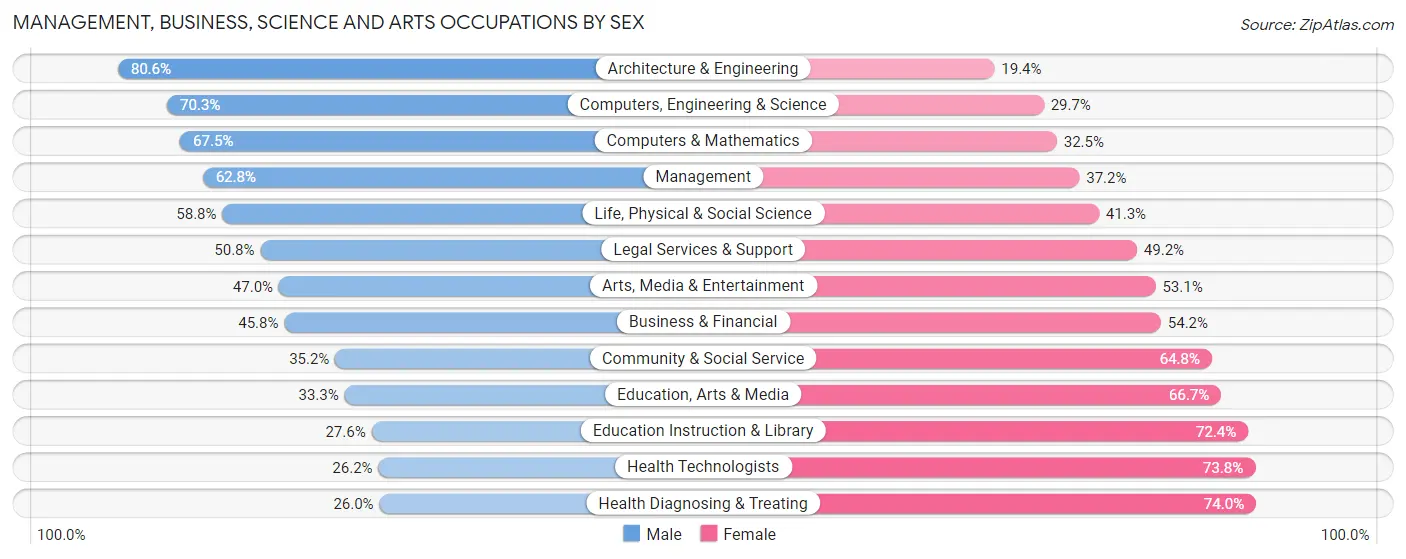
Management, Business, Science and Arts Occupations by Sex
Within the Management, Business, Science and Arts occupations in El Dorado County, the most male-oriented occupations are Architecture & Engineering (80.6%), Computers, Engineering & Science (70.3%), and Computers & Mathematics (67.5%), while the most female-oriented occupations are Health Diagnosing & Treating (74.0%), Health Technologists (73.8%), and Education Instruction & Library (72.4%).
| Occupation | Male | Female |
| Management | 7,385 (62.8%) | 4,368 (37.2%) |
| Business & Financial | 2,646 (45.8%) | 3,128 (54.2%) |
| Computers, Engineering & Science | 4,763 (70.3%) | 2,015 (29.7%) |
| Computers & Mathematics | 2,241 (67.5%) | 1,077 (32.5%) |
| Architecture & Engineering | 1,807 (80.6%) | 436 (19.4%) |
| Life, Physical & Social Science | 715 (58.8%) | 502 (41.2%) |
| Community & Social Service | 3,261 (35.2%) | 6,000 (64.8%) |
| Education, Arts & Media | 436 (33.3%) | 875 (66.7%) |
| Legal Services & Support | 558 (50.8%) | 540 (49.2%) |
| Education Instruction & Library | 1,360 (27.6%) | 3,560 (72.4%) |
| Arts, Media & Entertainment | 907 (46.9%) | 1,025 (53.0%) |
| Health Diagnosing & Treating | 1,400 (26.0%) | 3,989 (74.0%) |
| Health Technologists | 1,016 (26.2%) | 2,863 (73.8%) |
| Total (Category) | 19,455 (49.9%) | 19,500 (50.1%) |
| Total (Overall) | 47,916 (54.5%) | 40,043 (45.5%) |
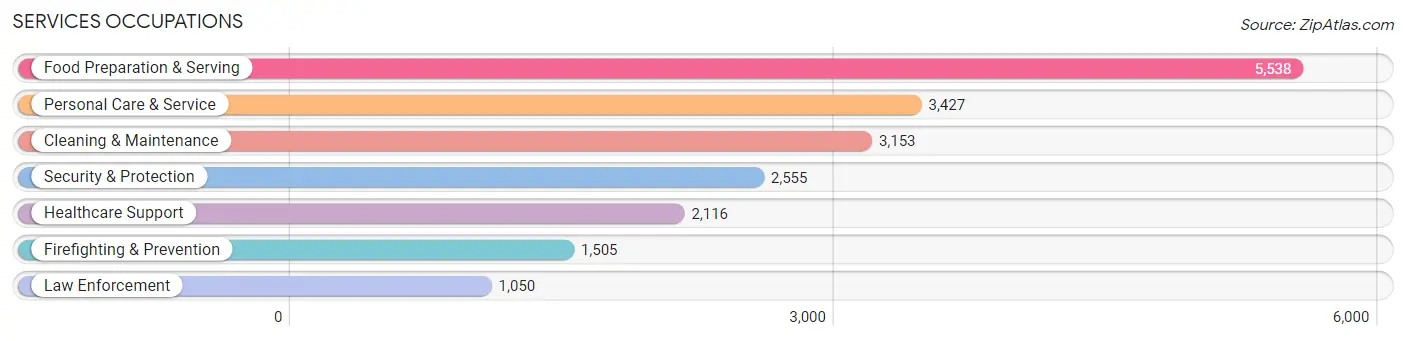
Services Occupations
The most common Services occupations in El Dorado County are Food Preparation & Serving (5,538 | 6.3%), Personal Care & Service (3,427 | 3.9%), Cleaning & Maintenance (3,153 | 3.6%), Security & Protection (2,555 | 2.9%), and Healthcare Support (2,116 | 2.4%).
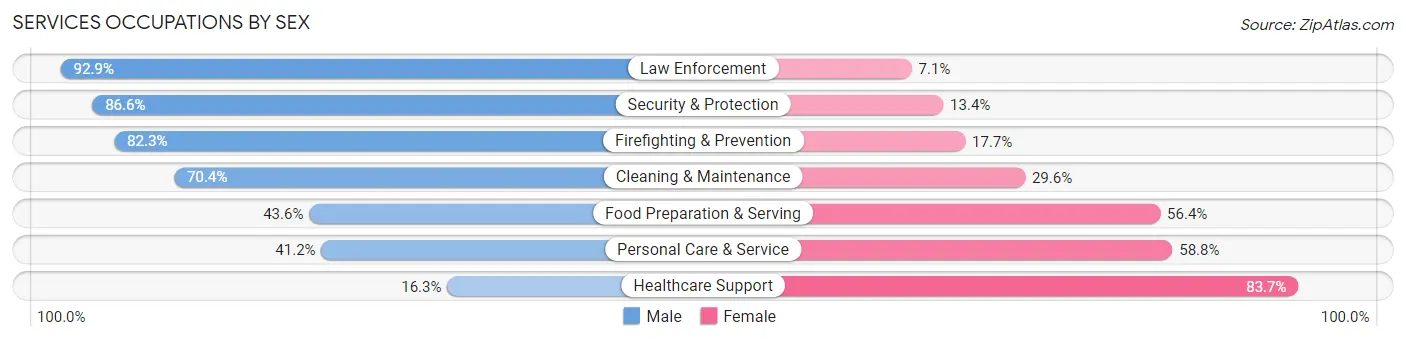
Services Occupations by Sex
Within the Services occupations in El Dorado County, the most male-oriented occupations are Law Enforcement (92.9%), Security & Protection (86.6%), and Firefighting & Prevention (82.3%), while the most female-oriented occupations are Healthcare Support (83.7%), Personal Care & Service (58.8%), and Food Preparation & Serving (56.4%).
| Occupation | Male | Female |
| Healthcare Support | 345 (16.3%) | 1,771 (83.7%) |
| Security & Protection | 2,213 (86.6%) | 342 (13.4%) |
| Firefighting & Prevention | 1,238 (82.3%) | 267 (17.7%) |
| Law Enforcement | 975 (92.9%) | 75 (7.1%) |
| Food Preparation & Serving | 2,417 (43.6%) | 3,121 (56.4%) |
| Cleaning & Maintenance | 2,220 (70.4%) | 933 (29.6%) |
| Personal Care & Service | 1,413 (41.2%) | 2,014 (58.8%) |
| Total (Category) | 8,608 (51.3%) | 8,181 (48.7%) |
| Total (Overall) | 47,916 (54.5%) | 40,043 (45.5%) |
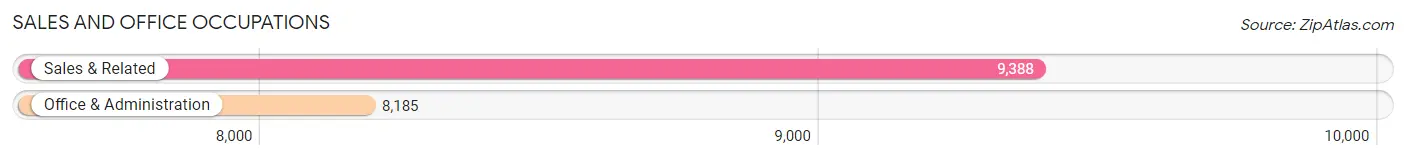
Sales and Office Occupations
The most common Sales and Office occupations in El Dorado County are Sales & Related (9,388 | 10.7%), and Office & Administration (8,185 | 9.3%).
Sales and Office Occupations by Sex
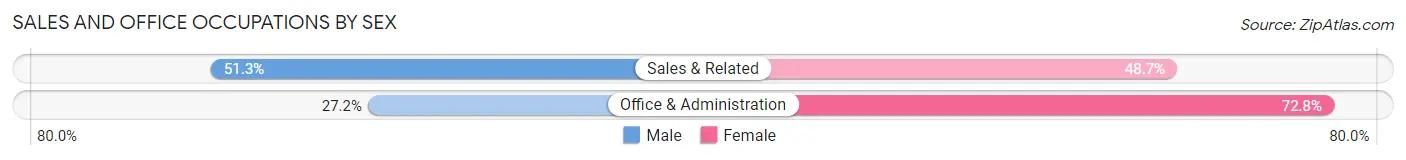
| Occupation | Male | Female |
| Sales & Related | 4,819 (51.3%) | 4,569 (48.7%) |
| Office & Administration | 2,226 (27.2%) | 5,959 (72.8%) |
| Total (Category) | 7,045 (40.1%) | 10,528 (59.9%) |
| Total (Overall) | 47,916 (54.5%) | 40,043 (45.5%) |
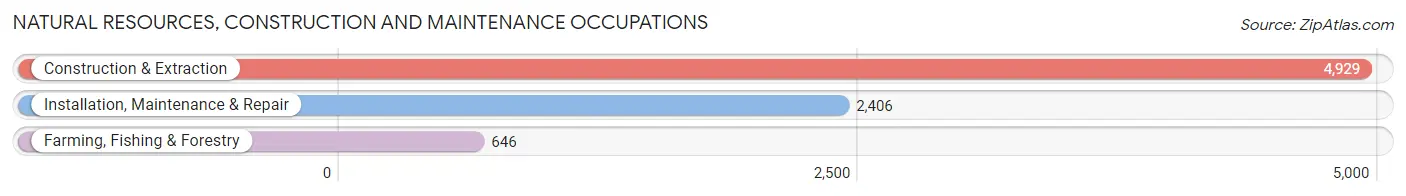
Natural Resources, Construction and Maintenance Occupations
The most common Natural Resources, Construction and Maintenance occupations in El Dorado County are Construction & Extraction (4,929 | 5.6%), Installation, Maintenance & Repair (2,406 | 2.7%), and Farming, Fishing & Forestry (646 | 0.7%).
Natural Resources, Construction and Maintenance Occupations by Sex
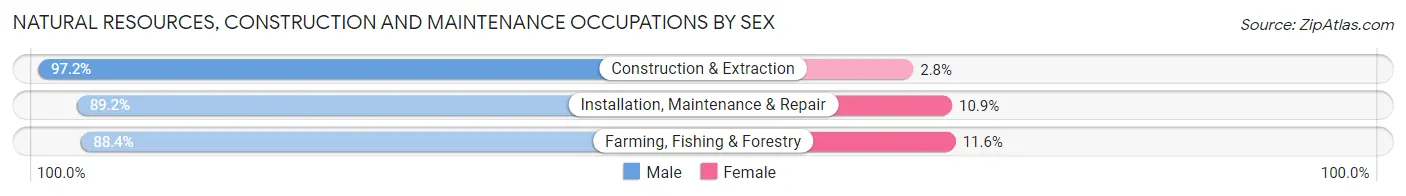
| Occupation | Male | Female |
| Farming, Fishing & Forestry | 571 (88.4%) | 75 (11.6%) |
| Construction & Extraction | 4,792 (97.2%) | 137 (2.8%) |
| Installation, Maintenance & Repair | 2,145 (89.1%) | 261 (10.8%) |
| Total (Category) | 7,508 (94.1%) | 473 (5.9%) |
| Total (Overall) | 47,916 (54.5%) | 40,043 (45.5%) |
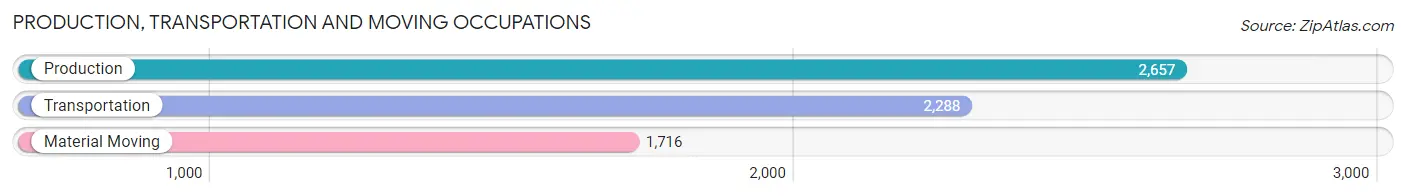
Production, Transportation and Moving Occupations
The most common Production, Transportation and Moving occupations in El Dorado County are Production (2,657 | 3.0%), Transportation (2,288 | 2.6%), and Material Moving (1,716 | 1.9%).
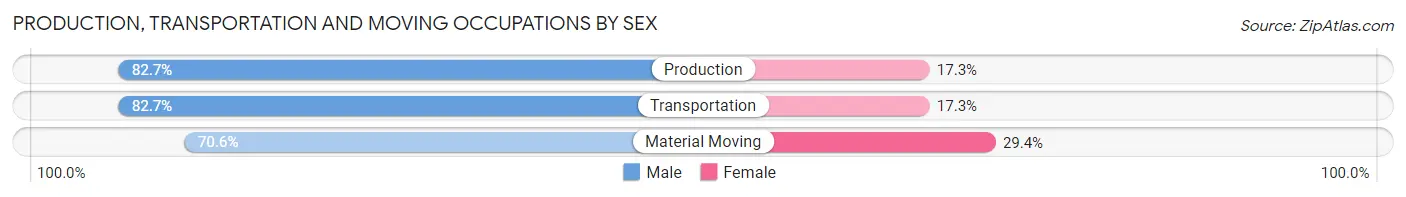
Production, Transportation and Moving Occupations by Sex
| Occupation | Male | Female |
| Production | 2,197 (82.7%) | 460 (17.3%) |
| Transportation | 1,892 (82.7%) | 396 (17.3%) |
| Material Moving | 1,211 (70.6%) | 505 (29.4%) |
| Total (Category) | 5,300 (79.6%) | 1,361 (20.4%) |
| Total (Overall) | 47,916 (54.5%) | 40,043 (45.5%) |
Employment Industries by Sex in El Dorado County
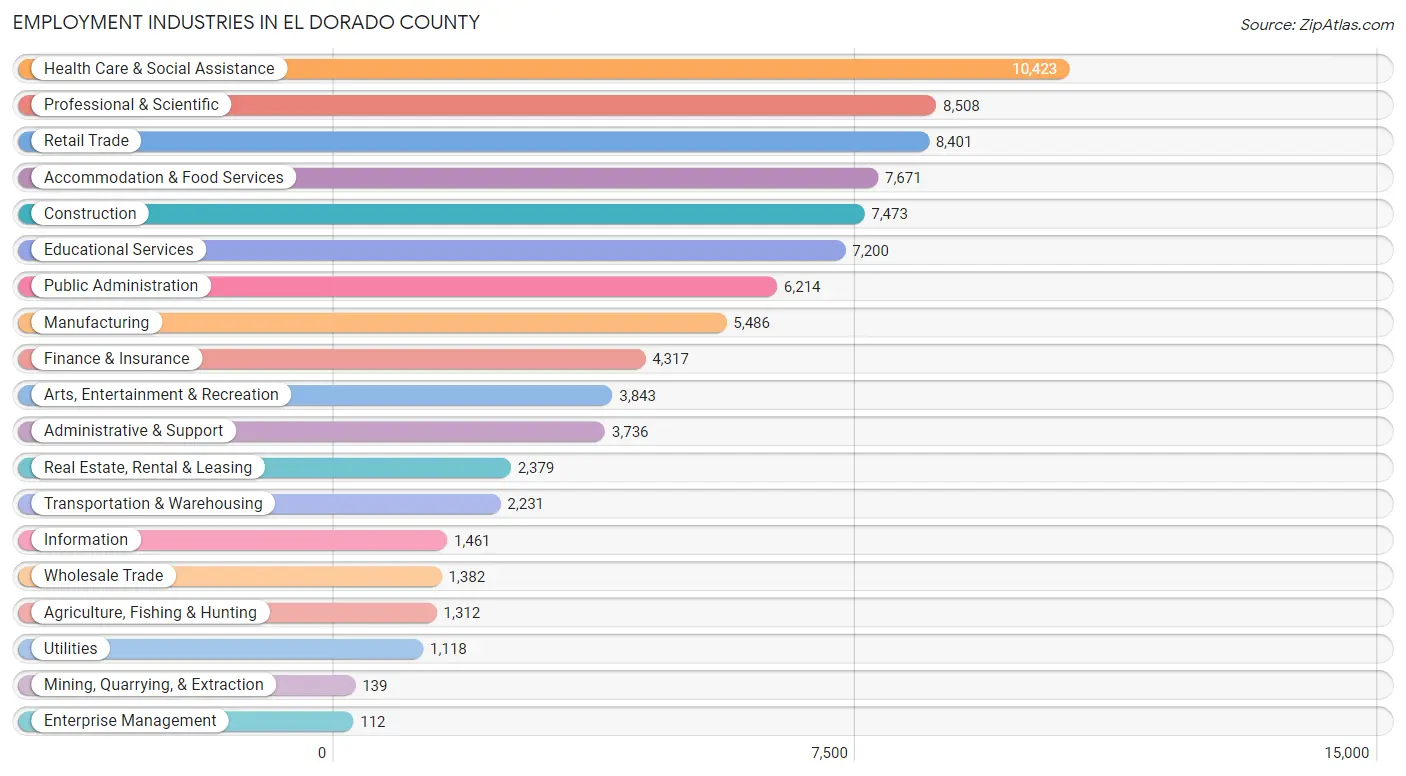
Employment Industries in El Dorado County
The major employment industries in El Dorado County include Health Care & Social Assistance (10,423 | 11.8%), Professional & Scientific (8,508 | 9.7%), Retail Trade (8,401 | 9.6%), Accommodation & Food Services (7,671 | 8.7%), and Construction (7,473 | 8.5%).
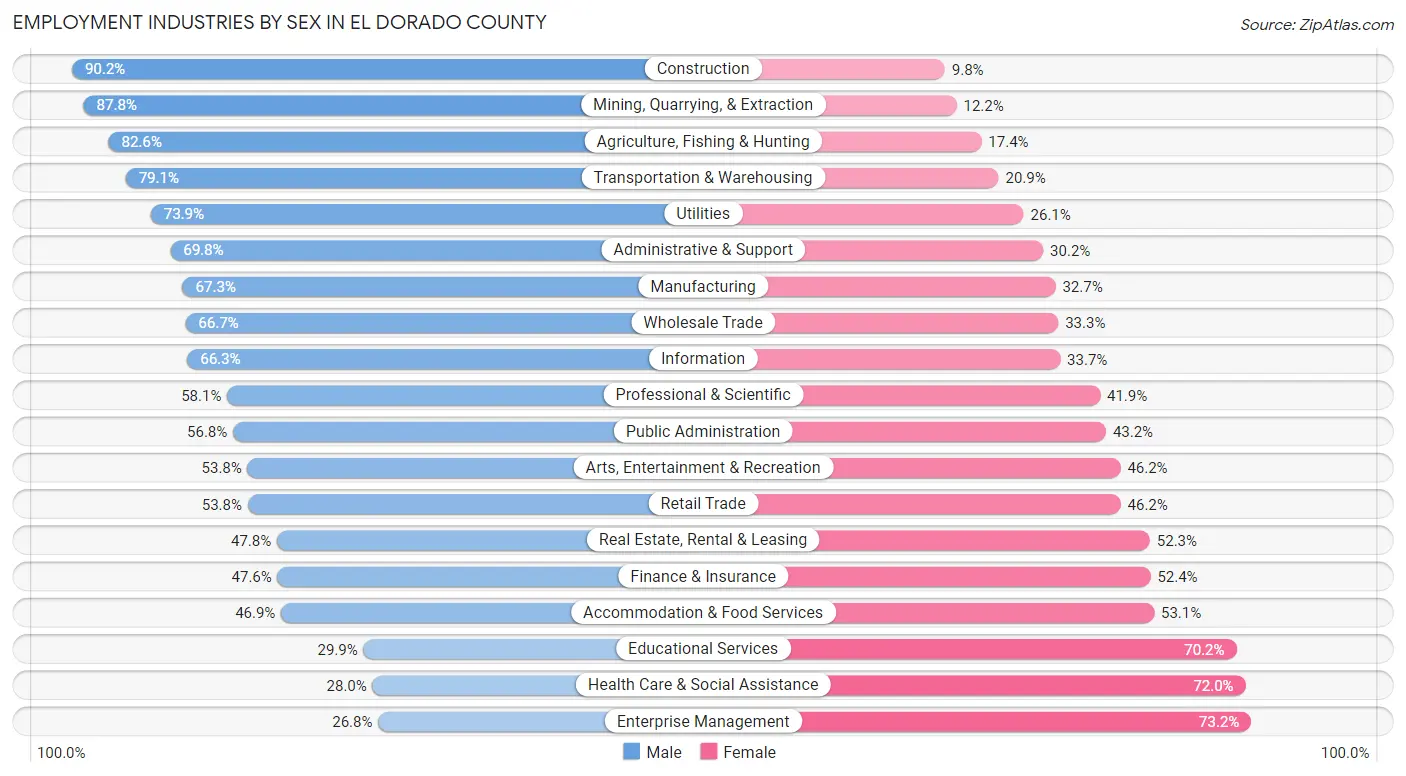
Employment Industries by Sex in El Dorado County
The El Dorado County industries that see more men than women are Construction (90.2%), Mining, Quarrying, & Extraction (87.8%), and Agriculture, Fishing & Hunting (82.6%), whereas the industries that tend to have a higher number of women are Enterprise Management (73.2%), Health Care & Social Assistance (72.0%), and Educational Services (70.2%).
| Industry | Male | Female |
| Agriculture, Fishing & Hunting | 1,084 (82.6%) | 228 (17.4%) |
| Mining, Quarrying, & Extraction | 122 (87.8%) | 17 (12.2%) |
| Construction | 6,740 (90.2%) | 733 (9.8%) |
| Manufacturing | 3,691 (67.3%) | 1,795 (32.7%) |
| Wholesale Trade | 922 (66.7%) | 460 (33.3%) |
| Retail Trade | 4,520 (53.8%) | 3,881 (46.2%) |
| Transportation & Warehousing | 1,764 (79.1%) | 467 (20.9%) |
| Utilities | 826 (73.9%) | 292 (26.1%) |
| Information | 969 (66.3%) | 492 (33.7%) |
| Finance & Insurance | 2,056 (47.6%) | 2,261 (52.4%) |
| Real Estate, Rental & Leasing | 1,136 (47.7%) | 1,243 (52.2%) |
| Professional & Scientific | 4,940 (58.1%) | 3,568 (41.9%) |
| Enterprise Management | 30 (26.8%) | 82 (73.2%) |
| Administrative & Support | 2,609 (69.8%) | 1,127 (30.2%) |
| Educational Services | 2,149 (29.8%) | 5,051 (70.2%) |
| Health Care & Social Assistance | 2,915 (28.0%) | 7,508 (72.0%) |
| Arts, Entertainment & Recreation | 2,069 (53.8%) | 1,774 (46.2%) |
| Accommodation & Food Services | 3,597 (46.9%) | 4,074 (53.1%) |
| Public Administration | 3,532 (56.8%) | 2,682 (43.2%) |
| Total | 47,916 (54.5%) | 40,043 (45.5%) |
Education in El Dorado County
School Enrollment in El Dorado County
The most common levels of schooling among the 41,149 students in El Dorado County are high school (10,014 | 24.3%), middle school (8,481 | 20.6%), and college / undergraduate (8,174 | 19.9%).
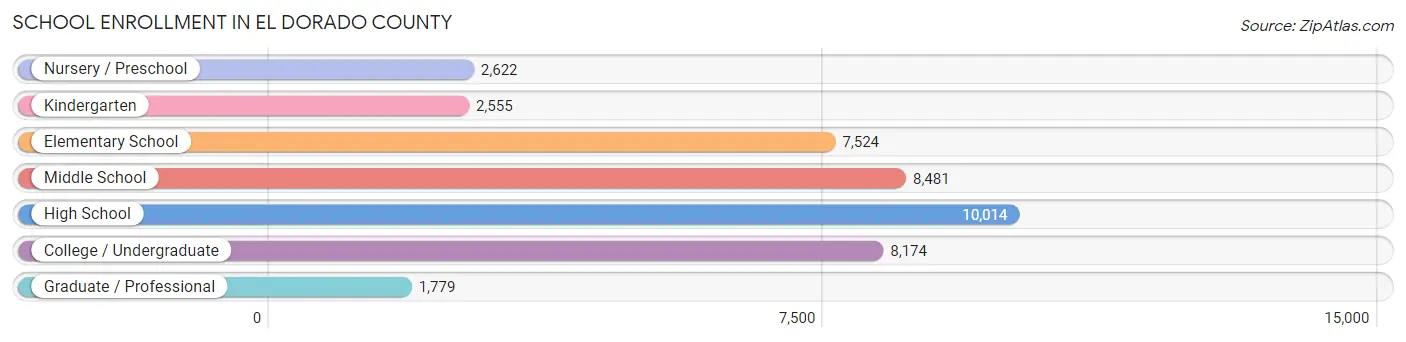
| School Level | # Students | % Students |
| Nursery / Preschool | 2,622 | 6.4% |
| Kindergarten | 2,555 | 6.2% |
| Elementary School | 7,524 | 18.3% |
| Middle School | 8,481 | 20.6% |
| High School | 10,014 | 24.3% |
| College / Undergraduate | 8,174 | 19.9% |
| Graduate / Professional | 1,779 | 4.3% |
| Total | 41,149 | 100.0% |
School Enrollment by Age by Funding Source in El Dorado County
Out of a total of 41,149 students who are enrolled in schools in El Dorado County, 5,596 (13.6%) attend a private institution, while the remaining 35,553 (86.4%) are enrolled in public schools. The age group of 3 to 4 year olds has the highest likelihood of being enrolled in private schools, with 1,276 (57.1% in the age bracket) enrolled. Conversely, the age group of 18 to 19 year olds has the lowest likelihood of being enrolled in a private school, with 2,519 (95.5% in the age bracket) attending a public institution.
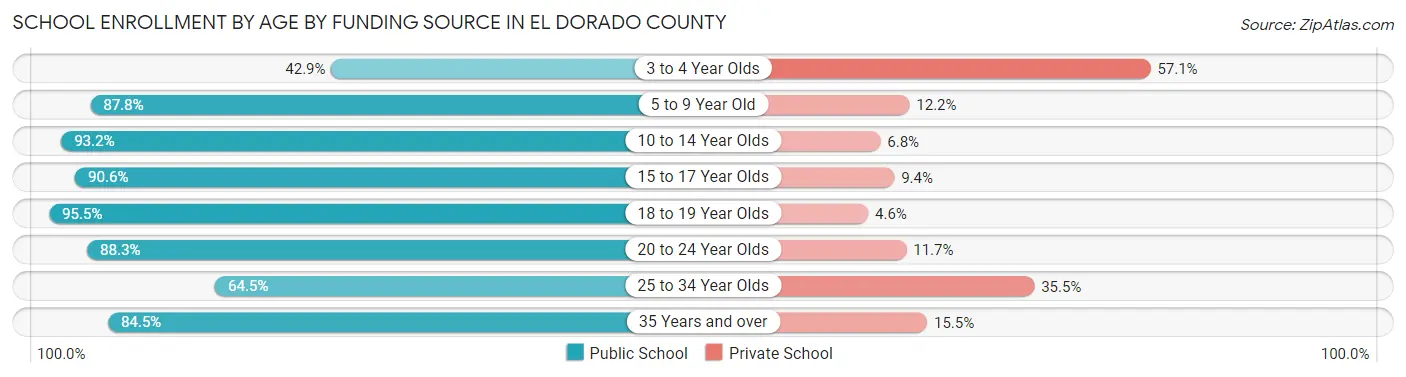
| Age Bracket | Public School | Private School |
| 3 to 4 Year Olds | 957 (42.9%) | 1,276 (57.1%) |
| 5 to 9 Year Old | 8,015 (87.8%) | 1,118 (12.2%) |
| 10 to 14 Year Olds | 10,648 (93.2%) | 780 (6.8%) |
| 15 to 17 Year Olds | 6,336 (90.6%) | 659 (9.4%) |
| 18 to 19 Year Olds | 2,519 (95.5%) | 120 (4.5%) |
| 20 to 24 Year Olds | 3,280 (88.3%) | 433 (11.7%) |
| 25 to 34 Year Olds | 1,349 (64.5%) | 742 (35.5%) |
| 35 Years and over | 2,464 (84.5%) | 453 (15.5%) |
| Total | 35,553 (86.4%) | 5,596 (13.6%) |
Educational Attainment by Field of Study in El Dorado County
Business (11,222 | 19.7%), social sciences (5,422 | 9.5%), engineering (5,094 | 8.9%), bio, nature & agricultural (4,894 | 8.6%), and science & technology (4,792 | 8.4%) are the most common fields of study among 56,928 individuals in El Dorado County who have obtained a bachelor's degree or higher.
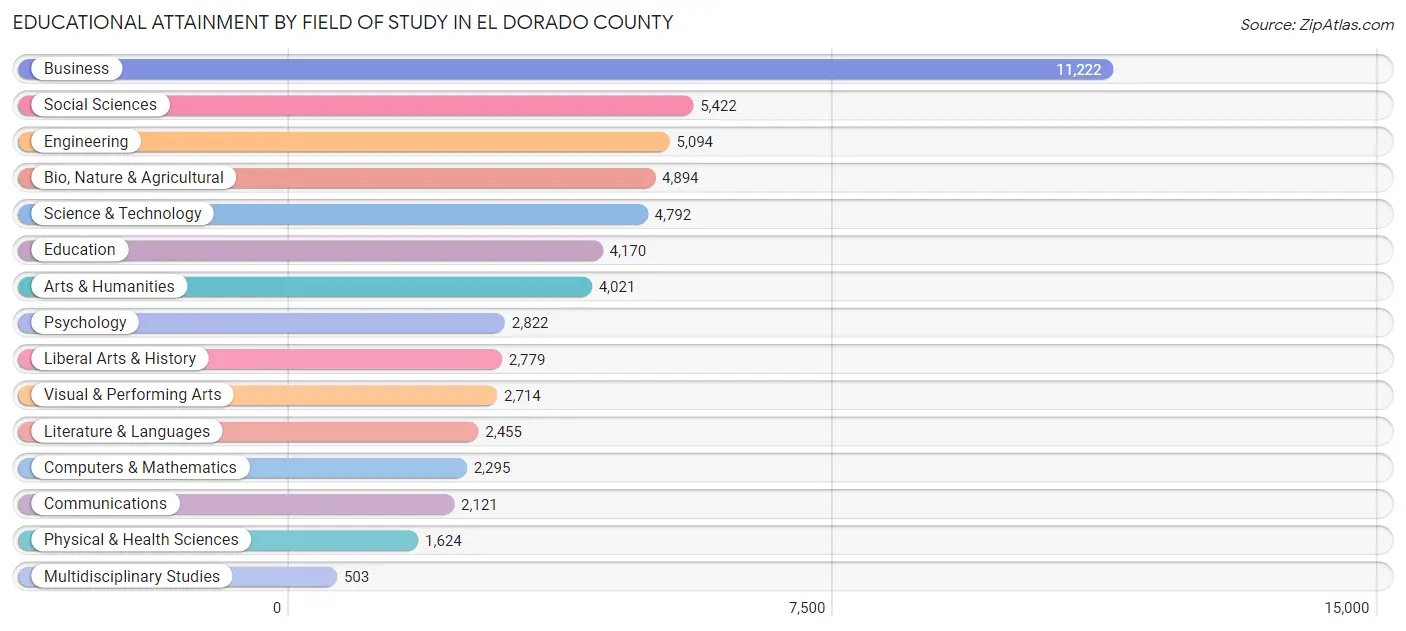
| Field of Study | # Graduates | % Graduates |
| Computers & Mathematics | 2,295 | 4.0% |
| Bio, Nature & Agricultural | 4,894 | 8.6% |
| Physical & Health Sciences | 1,624 | 2.9% |
| Psychology | 2,822 | 5.0% |
| Social Sciences | 5,422 | 9.5% |
| Engineering | 5,094 | 8.9% |
| Multidisciplinary Studies | 503 | 0.9% |
| Science & Technology | 4,792 | 8.4% |
| Business | 11,222 | 19.7% |
| Education | 4,170 | 7.3% |
| Literature & Languages | 2,455 | 4.3% |
| Liberal Arts & History | 2,779 | 4.9% |
| Visual & Performing Arts | 2,714 | 4.8% |
| Communications | 2,121 | 3.7% |
| Arts & Humanities | 4,021 | 7.1% |
| Total | 56,928 | 100.0% |
Transportation & Commute in El Dorado County
Vehicle Availability by Sex in El Dorado County
The most prevalent vehicle ownership categories in El Dorado County are males with 2 vehicles (17,483, accounting for 37.2%) and females with 2 vehicles (13,345, making up 45.1%).
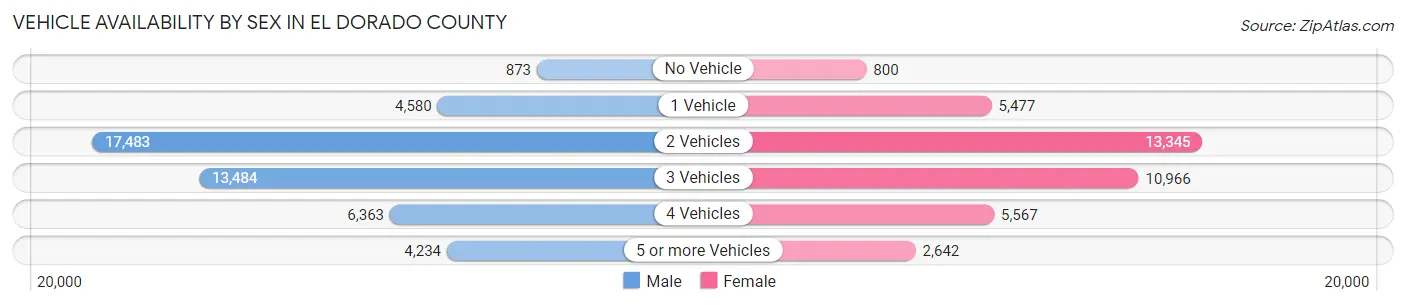
| Vehicles Available | Male | Female |
| No Vehicle | 873 (1.9%) | 800 (2.1%) |
| 1 Vehicle | 4,580 (9.7%) | 5,477 (14.1%) |
| 2 Vehicles | 17,483 (37.2%) | 13,345 (34.4%) |
| 3 Vehicles | 13,484 (28.7%) | 10,966 (28.3%) |
| 4 Vehicles | 6,363 (13.5%) | 5,567 (14.3%) |
| 5 or more Vehicles | 4,234 (9.0%) | 2,642 (6.8%) |
| Total | 47,017 (100.0%) | 38,797 (100.0%) |
Commute Time in El Dorado County
The most frequently occuring commute durations in El Dorado County are 10 to 14 minutes (11,283 commuters, 15.9%), 15 to 19 minutes (9,613 commuters, 13.5%), and 20 to 24 minutes (8,920 commuters, 12.6%).
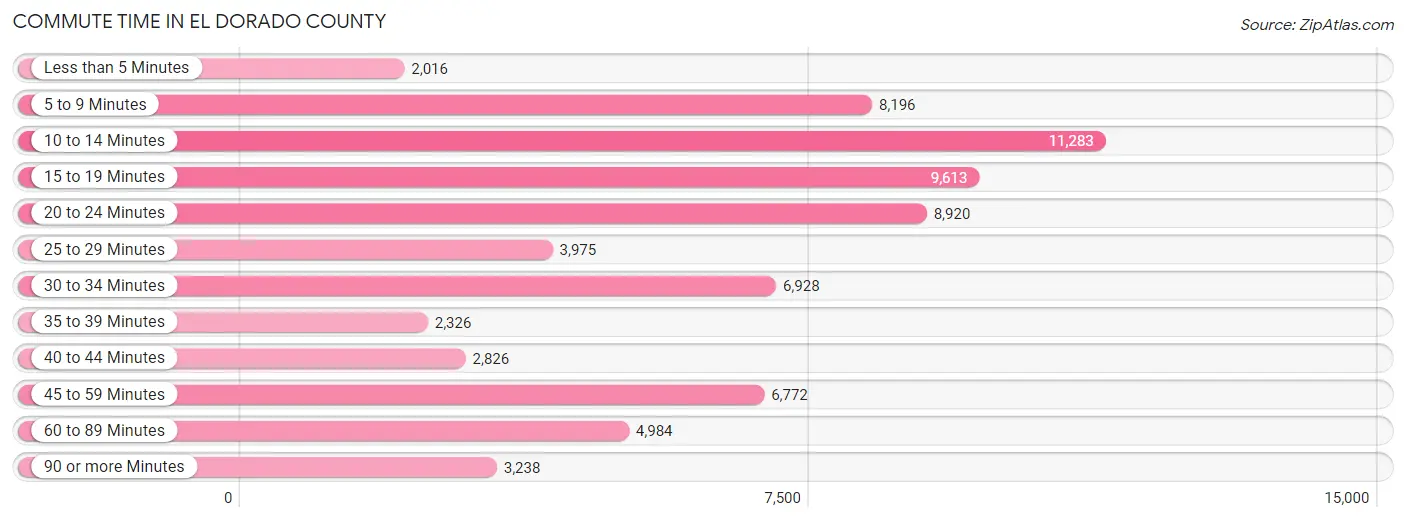
| Commute Time | # Commuters | % Commuters |
| Less than 5 Minutes | 2,016 | 2.8% |
| 5 to 9 Minutes | 8,196 | 11.5% |
| 10 to 14 Minutes | 11,283 | 15.9% |
| 15 to 19 Minutes | 9,613 | 13.5% |
| 20 to 24 Minutes | 8,920 | 12.6% |
| 25 to 29 Minutes | 3,975 | 5.6% |
| 30 to 34 Minutes | 6,928 | 9.8% |
| 35 to 39 Minutes | 2,326 | 3.3% |
| 40 to 44 Minutes | 2,826 | 4.0% |
| 45 to 59 Minutes | 6,772 | 9.5% |
| 60 to 89 Minutes | 4,984 | 7.0% |
| 90 or more Minutes | 3,238 | 4.6% |
Commute Time by Sex in El Dorado County
The most common commute times in El Dorado County are 10 to 14 minutes (5,790 commuters, 14.7%) for males and 10 to 14 minutes (5,493 commuters, 17.4%) for females.
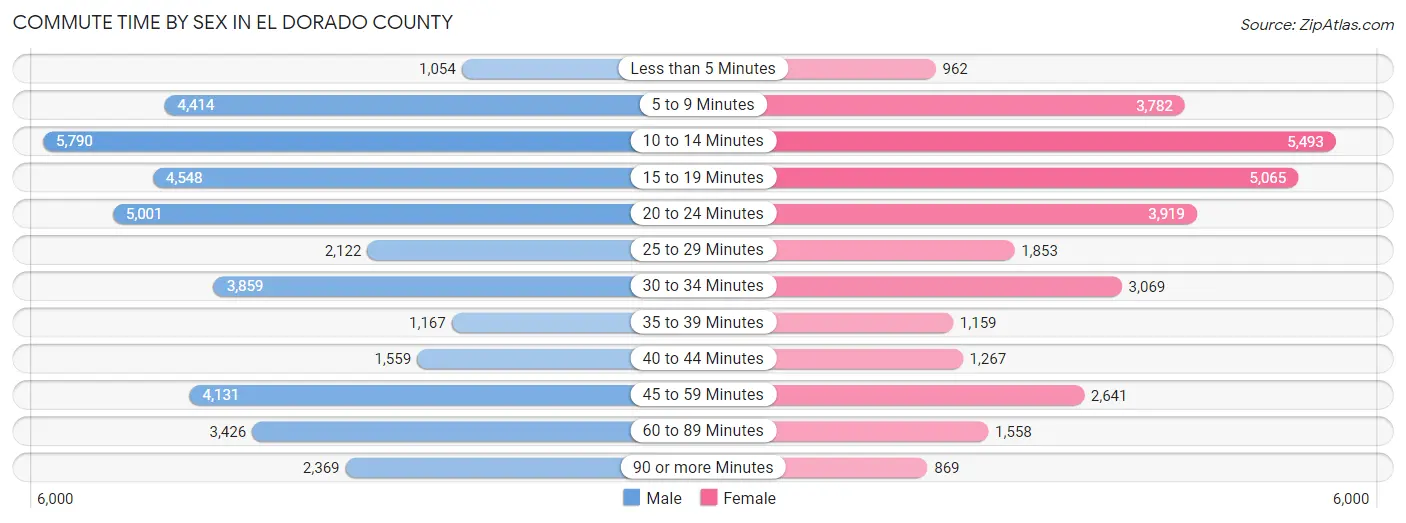
| Commute Time | Male | Female |
| Less than 5 Minutes | 1,054 (2.7%) | 962 (3.0%) |
| 5 to 9 Minutes | 4,414 (11.2%) | 3,782 (11.9%) |
| 10 to 14 Minutes | 5,790 (14.7%) | 5,493 (17.4%) |
| 15 to 19 Minutes | 4,548 (11.5%) | 5,065 (16.0%) |
| 20 to 24 Minutes | 5,001 (12.7%) | 3,919 (12.4%) |
| 25 to 29 Minutes | 2,122 (5.4%) | 1,853 (5.9%) |
| 30 to 34 Minutes | 3,859 (9.8%) | 3,069 (9.7%) |
| 35 to 39 Minutes | 1,167 (3.0%) | 1,159 (3.7%) |
| 40 to 44 Minutes | 1,559 (4.0%) | 1,267 (4.0%) |
| 45 to 59 Minutes | 4,131 (10.5%) | 2,641 (8.4%) |
| 60 to 89 Minutes | 3,426 (8.7%) | 1,558 (4.9%) |
| 90 or more Minutes | 2,369 (6.0%) | 869 (2.8%) |
Time of Departure to Work by Sex in El Dorado County
The most frequent times of departure to work in El Dorado County are 7:00 AM to 7:29 AM (4,569, 11.6%) for males and 7:30 AM to 7:59 AM (4,775, 15.1%) for females.
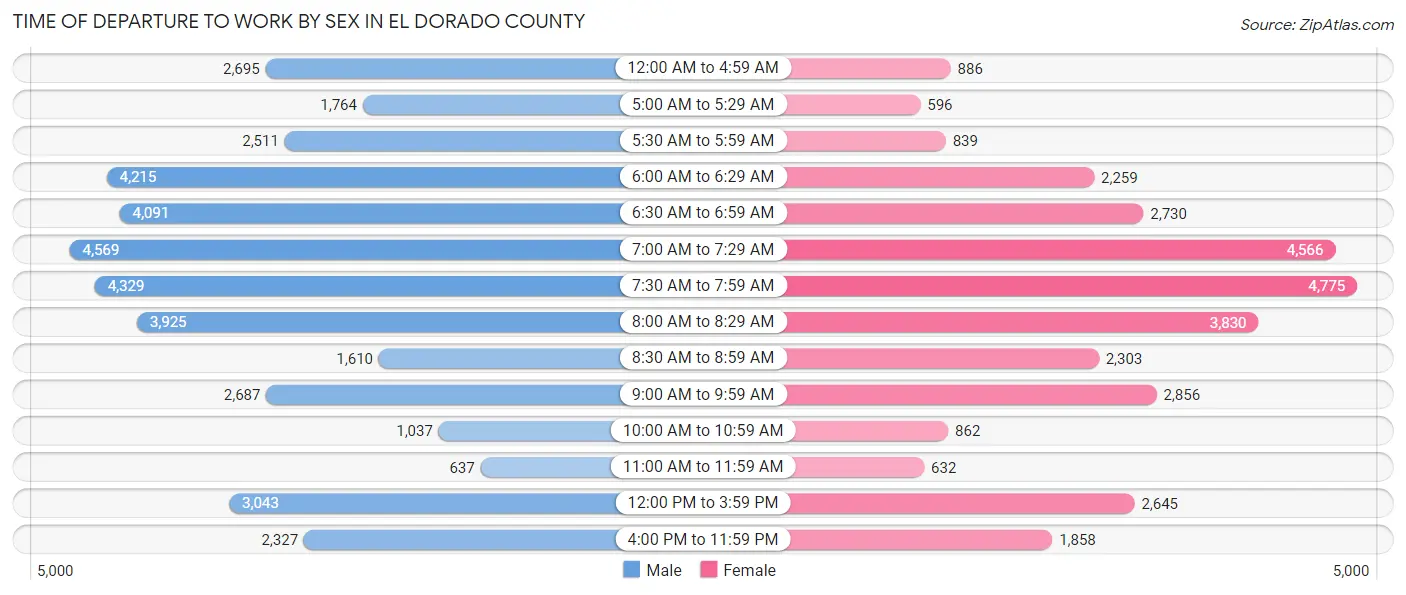
| Time of Departure | Male | Female |
| 12:00 AM to 4:59 AM | 2,695 (6.8%) | 886 (2.8%) |
| 5:00 AM to 5:29 AM | 1,764 (4.5%) | 596 (1.9%) |
| 5:30 AM to 5:59 AM | 2,511 (6.4%) | 839 (2.6%) |
| 6:00 AM to 6:29 AM | 4,215 (10.7%) | 2,259 (7.1%) |
| 6:30 AM to 6:59 AM | 4,091 (10.4%) | 2,730 (8.6%) |
| 7:00 AM to 7:29 AM | 4,569 (11.6%) | 4,566 (14.4%) |
| 7:30 AM to 7:59 AM | 4,329 (11.0%) | 4,775 (15.1%) |
| 8:00 AM to 8:29 AM | 3,925 (10.0%) | 3,830 (12.1%) |
| 8:30 AM to 8:59 AM | 1,610 (4.1%) | 2,303 (7.3%) |
| 9:00 AM to 9:59 AM | 2,687 (6.8%) | 2,856 (9.0%) |
| 10:00 AM to 10:59 AM | 1,037 (2.6%) | 862 (2.7%) |
| 11:00 AM to 11:59 AM | 637 (1.6%) | 632 (2.0%) |
| 12:00 PM to 3:59 PM | 3,043 (7.7%) | 2,645 (8.4%) |
| 4:00 PM to 11:59 PM | 2,327 (5.9%) | 1,858 (5.9%) |
| Total | 39,440 (100.0%) | 31,637 (100.0%) |
Housing Occupancy in El Dorado County
Occupancy by Ownership in El Dorado County
Of the total 75,190 dwellings in El Dorado County, owner-occupied units account for 57,235 (76.1%), while renter-occupied units make up 17,955 (23.9%).
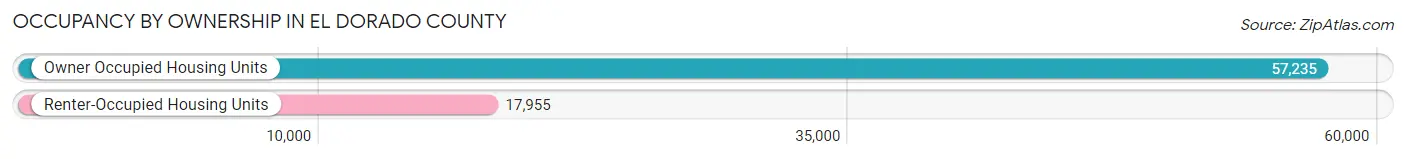
| Occupancy | # Housing Units | % Housing Units |
| Owner Occupied Housing Units | 57,235 | 76.1% |
| Renter-Occupied Housing Units | 17,955 | 23.9% |
| Total Occupied Housing Units | 75,190 | 100.0% |
Occupancy by Household Size in El Dorado County
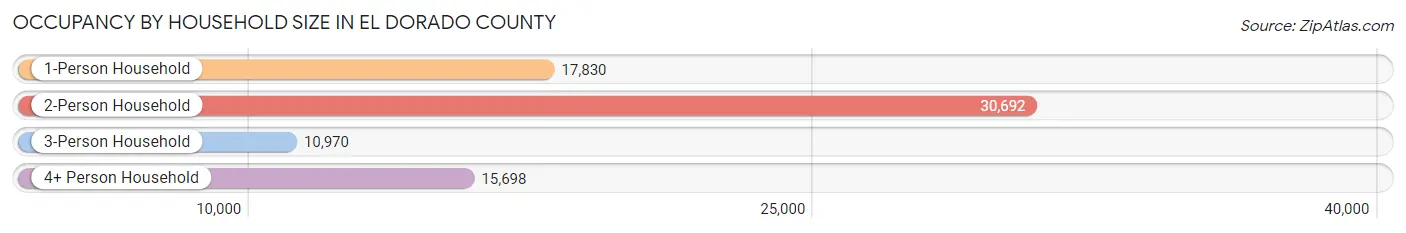
| Household Size | # Housing Units | % Housing Units |
| 1-Person Household | 17,830 | 23.7% |
| 2-Person Household | 30,692 | 40.8% |
| 3-Person Household | 10,970 | 14.6% |
| 4+ Person Household | 15,698 | 20.9% |
| Total Housing Units | 75,190 | 100.0% |
Occupancy by Ownership by Household Size in El Dorado County
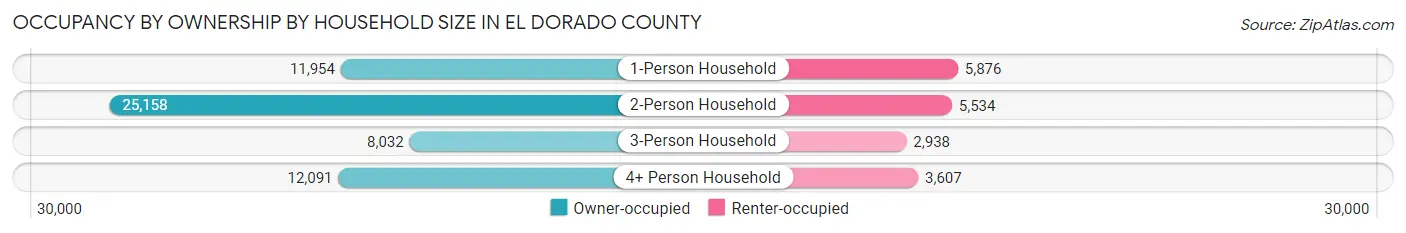
| Household Size | Owner-occupied | Renter-occupied |
| 1-Person Household | 11,954 (67.0%) | 5,876 (33.0%) |
| 2-Person Household | 25,158 (82.0%) | 5,534 (18.0%) |
| 3-Person Household | 8,032 (73.2%) | 2,938 (26.8%) |
| 4+ Person Household | 12,091 (77.0%) | 3,607 (23.0%) |
| Total Housing Units | 57,235 (76.1%) | 17,955 (23.9%) |
Occupancy by Educational Attainment in El Dorado County
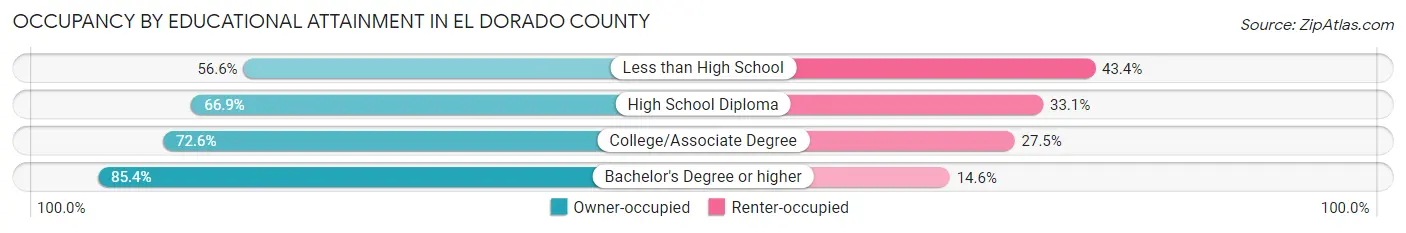
| Household Size | Owner-occupied | Renter-occupied |
| Less than High School | 1,883 (56.6%) | 1,443 (43.4%) |
| High School Diploma | 8,643 (66.9%) | 4,272 (33.1%) |
| College/Associate Degree | 20,532 (72.6%) | 7,767 (27.5%) |
| Bachelor's Degree or higher | 26,177 (85.4%) | 4,473 (14.6%) |
Occupancy by Age of Householder in El Dorado County
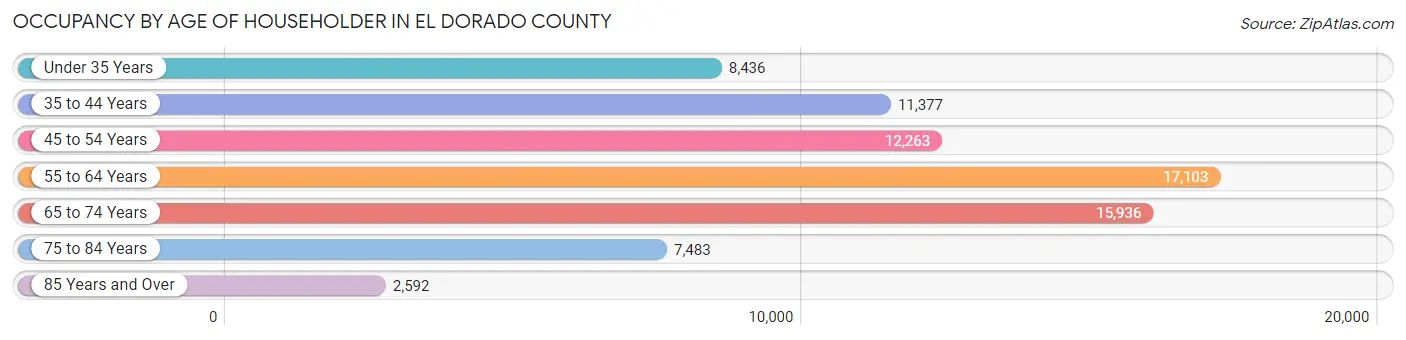
| Age Bracket | # Households | % Households |
| Under 35 Years | 8,436 | 11.2% |
| 35 to 44 Years | 11,377 | 15.1% |
| 45 to 54 Years | 12,263 | 16.3% |
| 55 to 64 Years | 17,103 | 22.8% |
| 65 to 74 Years | 15,936 | 21.2% |
| 75 to 84 Years | 7,483 | 10.0% |
| 85 Years and Over | 2,592 | 3.5% |
| Total | 75,190 | 100.0% |
Housing Finances in El Dorado County
Median Income by Occupancy in El Dorado County
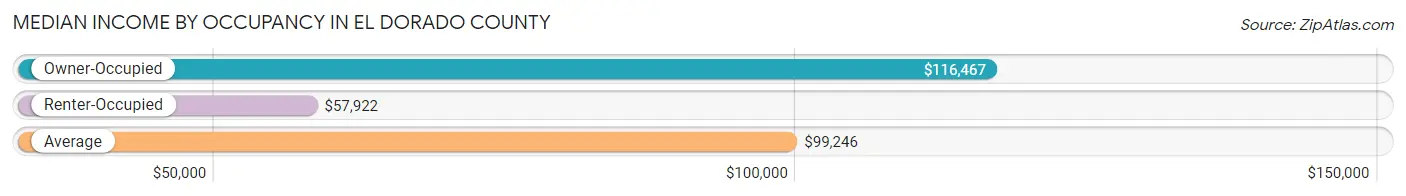
| Occupancy Type | # Households | Median Income |
| Owner-Occupied | 57,235 (76.1%) | $116,467 |
| Renter-Occupied | 17,955 (23.9%) | $57,922 |
| Average | 75,190 (100.0%) | $99,246 |
Occupancy by Householder Income Bracket in El Dorado County
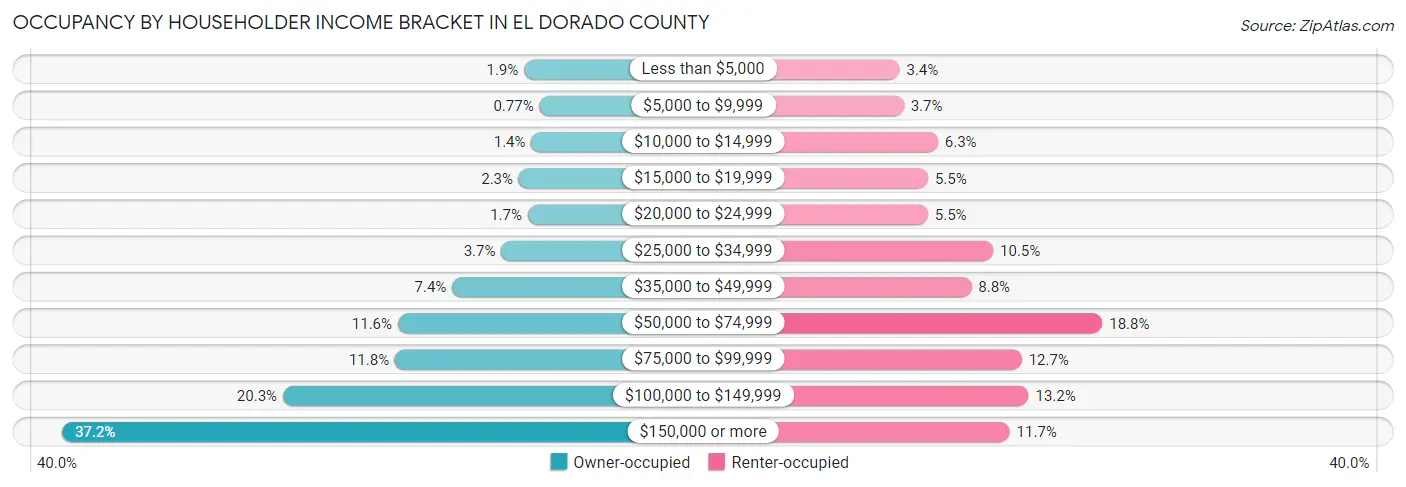
| Income Bracket | Owner-occupied | Renter-occupied |
| Less than $5,000 | 1,108 (1.9%) | 602 (3.4%) |
| $5,000 to $9,999 | 439 (0.8%) | 659 (3.7%) |
| $10,000 to $14,999 | 794 (1.4%) | 1,125 (6.3%) |
| $15,000 to $19,999 | 1,339 (2.3%) | 992 (5.5%) |
| $20,000 to $24,999 | 950 (1.7%) | 990 (5.5%) |
| $25,000 to $34,999 | 2,107 (3.7%) | 1,882 (10.5%) |
| $35,000 to $49,999 | 4,248 (7.4%) | 1,583 (8.8%) |
| $50,000 to $74,999 | 6,618 (11.6%) | 3,375 (18.8%) |
| $75,000 to $99,999 | 6,742 (11.8%) | 2,273 (12.7%) |
| $100,000 to $149,999 | 11,630 (20.3%) | 2,366 (13.2%) |
| $150,000 or more | 21,260 (37.1%) | 2,108 (11.7%) |
| Total | 57,235 (100.0%) | 17,955 (100.0%) |
Monthly Housing Cost Tiers in El Dorado County
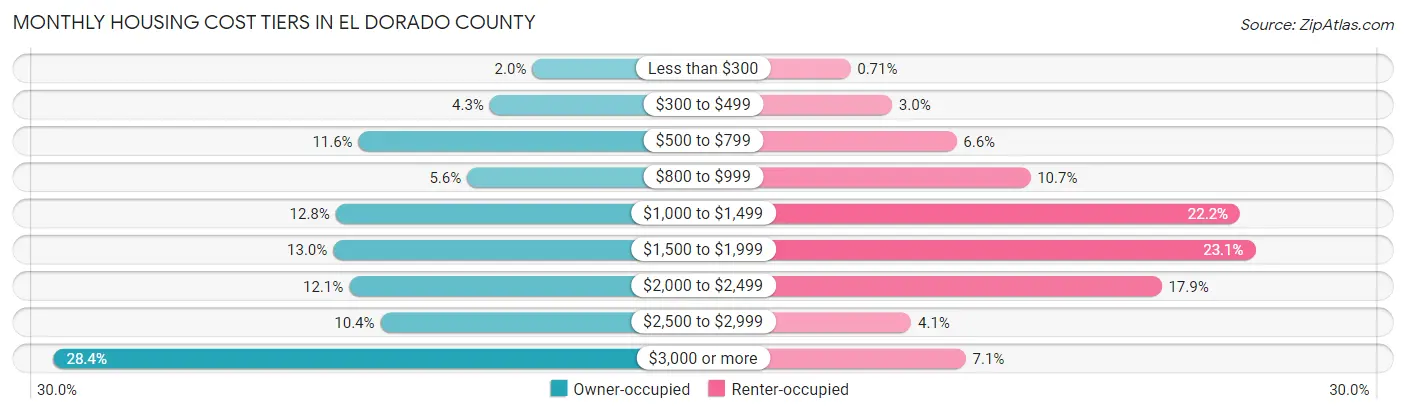
| Monthly Cost | Owner-occupied | Renter-occupied |
| Less than $300 | 1,121 (2.0%) | 128 (0.7%) |
| $300 to $499 | 2,467 (4.3%) | 540 (3.0%) |
| $500 to $799 | 6,617 (11.6%) | 1,179 (6.6%) |
| $800 to $999 | 3,182 (5.6%) | 1,912 (10.6%) |
| $1,000 to $1,499 | 7,340 (12.8%) | 3,992 (22.2%) |
| $1,500 to $1,999 | 7,419 (13.0%) | 4,144 (23.1%) |
| $2,000 to $2,499 | 6,912 (12.1%) | 3,214 (17.9%) |
| $2,500 to $2,999 | 5,921 (10.3%) | 731 (4.1%) |
| $3,000 or more | 16,256 (28.4%) | 1,272 (7.1%) |
| Total | 57,235 (100.0%) | 17,955 (100.0%) |
Physical Housing Characteristics in El Dorado County
Housing Structures in El Dorado County
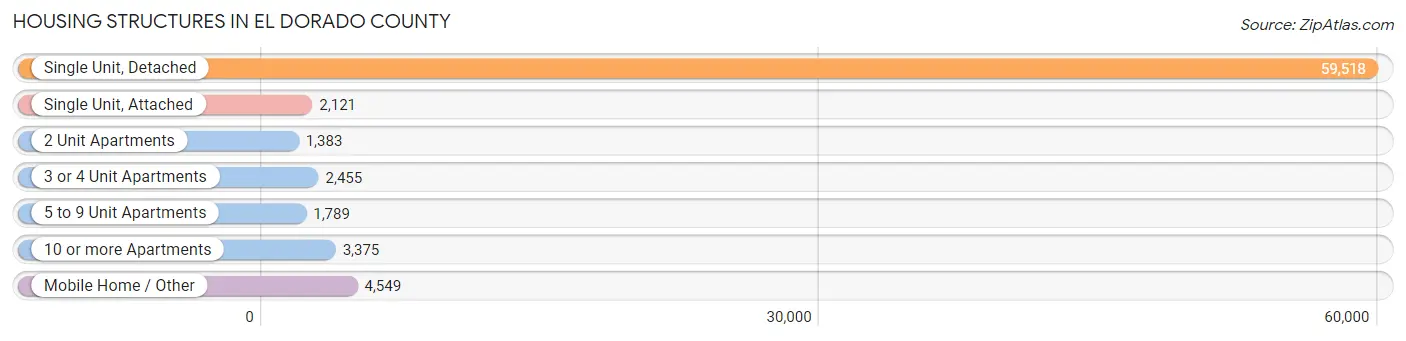
| Structure Type | # Housing Units | % Housing Units |
| Single Unit, Detached | 59,518 | 79.2% |
| Single Unit, Attached | 2,121 | 2.8% |
| 2 Unit Apartments | 1,383 | 1.8% |
| 3 or 4 Unit Apartments | 2,455 | 3.3% |
| 5 to 9 Unit Apartments | 1,789 | 2.4% |
| 10 or more Apartments | 3,375 | 4.5% |
| Mobile Home / Other | 4,549 | 6.0% |
| Total | 75,190 | 100.0% |
Housing Structures by Occupancy in El Dorado County
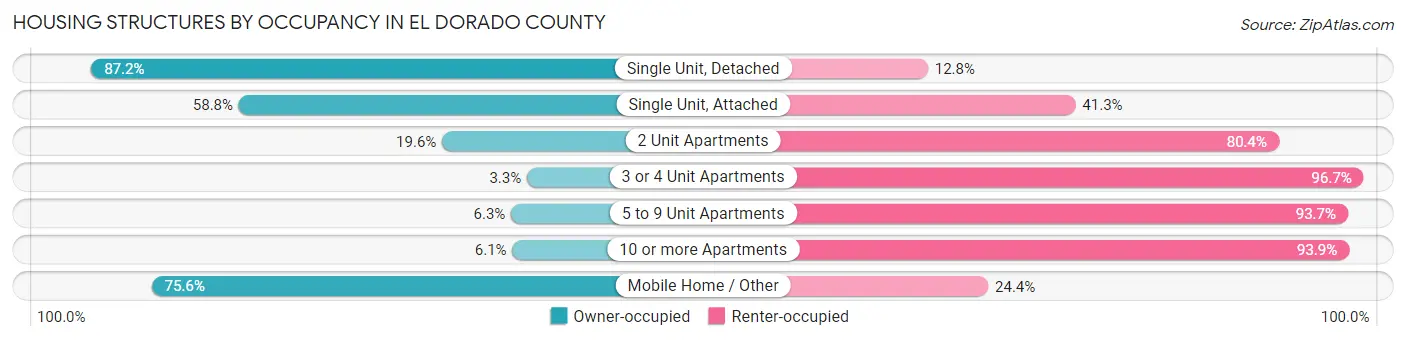
| Structure Type | Owner-occupied | Renter-occupied |
| Single Unit, Detached | 51,883 (87.2%) | 7,635 (12.8%) |
| Single Unit, Attached | 1,246 (58.8%) | 875 (41.2%) |
| 2 Unit Apartments | 271 (19.6%) | 1,112 (80.4%) |
| 3 or 4 Unit Apartments | 80 (3.3%) | 2,375 (96.7%) |
| 5 to 9 Unit Apartments | 113 (6.3%) | 1,676 (93.7%) |
| 10 or more Apartments | 205 (6.1%) | 3,170 (93.9%) |
| Mobile Home / Other | 3,437 (75.6%) | 1,112 (24.4%) |
| Total | 57,235 (76.1%) | 17,955 (23.9%) |
Housing Structures by Number of Rooms in El Dorado County
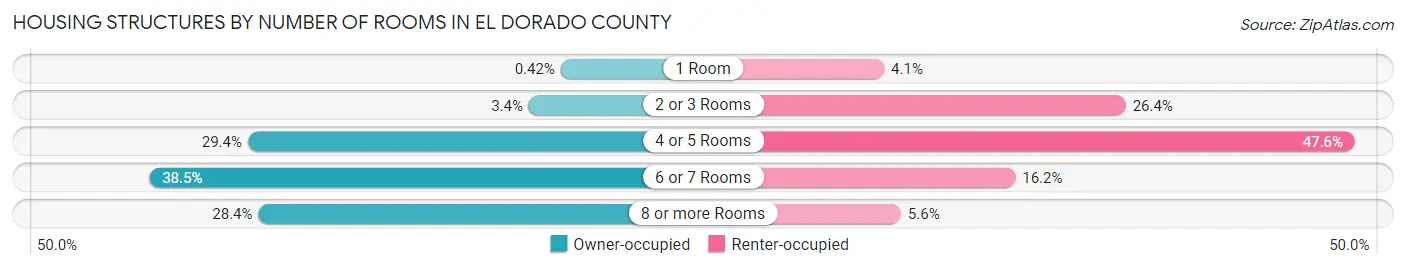
| Number of Rooms | Owner-occupied | Renter-occupied |
| 1 Room | 241 (0.4%) | 734 (4.1%) |
| 2 or 3 Rooms | 1,930 (3.4%) | 4,746 (26.4%) |
| 4 or 5 Rooms | 16,806 (29.4%) | 8,550 (47.6%) |
| 6 or 7 Rooms | 22,017 (38.5%) | 2,913 (16.2%) |
| 8 or more Rooms | 16,241 (28.4%) | 1,012 (5.6%) |
| Total | 57,235 (100.0%) | 17,955 (100.0%) |
Housing Structure by Heating Type in El Dorado County
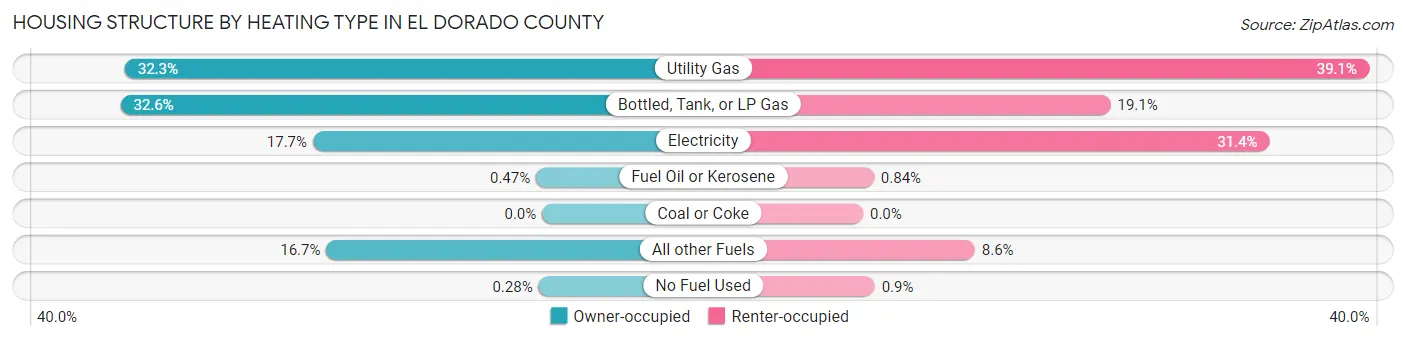
| Heating Type | Owner-occupied | Renter-occupied |
| Utility Gas | 18,461 (32.3%) | 7,018 (39.1%) |
| Bottled, Tank, or LP Gas | 18,654 (32.6%) | 3,434 (19.1%) |
| Electricity | 10,142 (17.7%) | 5,639 (31.4%) |
| Fuel Oil or Kerosene | 268 (0.5%) | 150 (0.8%) |
| Coal or Coke | 0 (0.0%) | 0 (0.0%) |
| All other Fuels | 9,547 (16.7%) | 1,552 (8.6%) |
| No Fuel Used | 163 (0.3%) | 162 (0.9%) |
| Total | 57,235 (100.0%) | 17,955 (100.0%) |
Household Vehicle Usage in El Dorado County
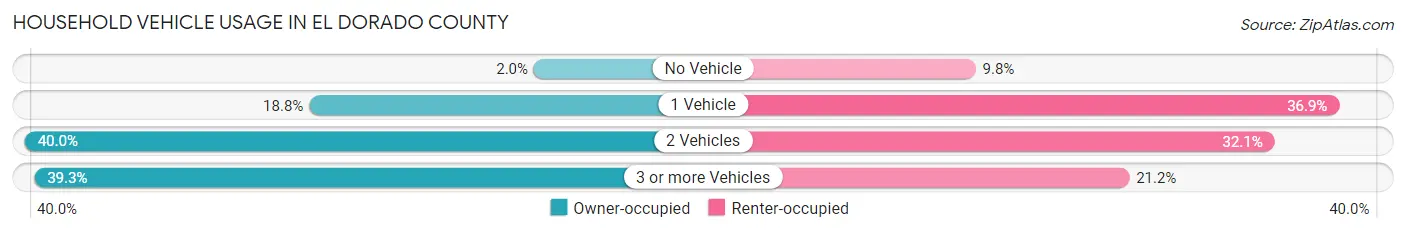
| Vehicles per Household | Owner-occupied | Renter-occupied |
| No Vehicle | 1,128 (2.0%) | 1,753 (9.8%) |
| 1 Vehicle | 10,734 (18.8%) | 6,628 (36.9%) |
| 2 Vehicles | 22,890 (40.0%) | 5,762 (32.1%) |
| 3 or more Vehicles | 22,483 (39.3%) | 3,812 (21.2%) |
| Total | 57,235 (100.0%) | 17,955 (100.0%) |
Real Estate & Mortgages in El Dorado County
Real Estate and Mortgage Overview in El Dorado County
| Characteristic | Without Mortgage | With Mortgage |
| Housing Units | 18,792 | 38,443 |
| Median Property Value | $539,700 | $622,300 |
| Median Household Income | $80,219 | $17,133 |
| Monthly Housing Costs | $790 | $16,121 |
| Real Estate Taxes | $3,319 | $488 |
Property Value by Mortgage Status in El Dorado County
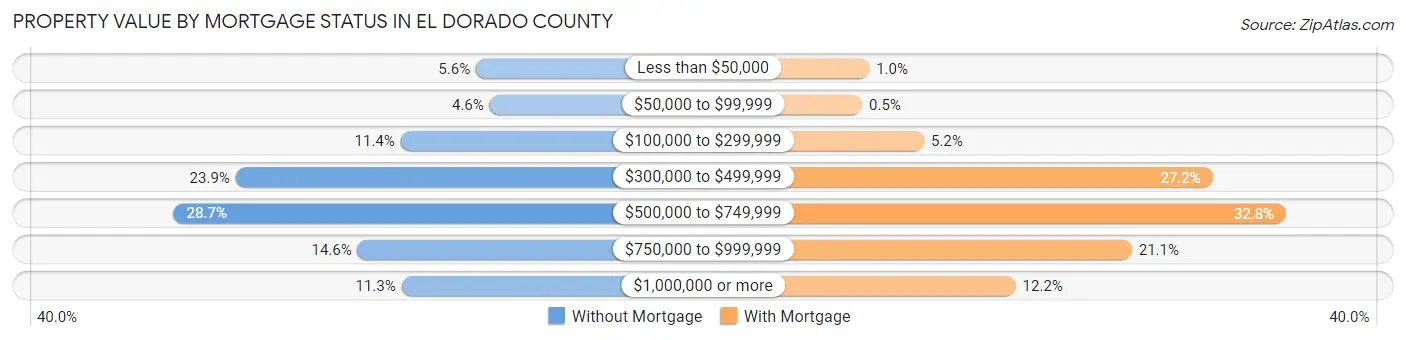
| Property Value | Without Mortgage | With Mortgage |
| Less than $50,000 | 1,054 (5.6%) | 400 (1.0%) |
| $50,000 to $99,999 | 859 (4.6%) | 192 (0.5%) |
| $100,000 to $299,999 | 2,132 (11.4%) | 2,005 (5.2%) |
| $300,000 to $499,999 | 4,495 (23.9%) | 10,456 (27.2%) |
| $500,000 to $749,999 | 5,384 (28.6%) | 12,607 (32.8%) |
| $750,000 to $999,999 | 2,749 (14.6%) | 8,094 (21.0%) |
| $1,000,000 or more | 2,119 (11.3%) | 4,689 (12.2%) |
| Total | 18,792 (100.0%) | 38,443 (100.0%) |
Household Income by Mortgage Status in El Dorado County
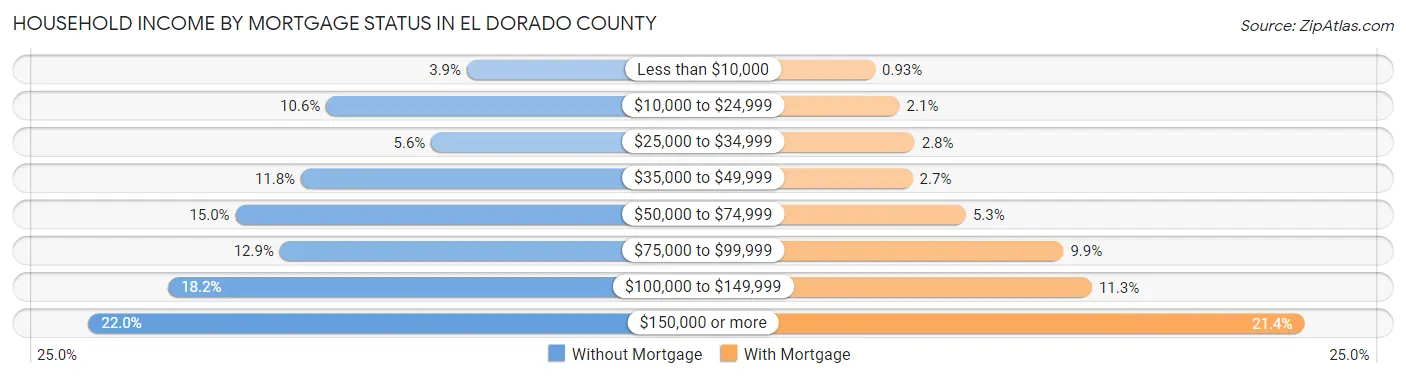
| Household Income | Without Mortgage | With Mortgage |
| Less than $10,000 | 741 (3.9%) | 359 (0.9%) |
| $10,000 to $24,999 | 1,999 (10.6%) | 806 (2.1%) |
| $25,000 to $34,999 | 1,060 (5.6%) | 1,084 (2.8%) |
| $35,000 to $49,999 | 2,225 (11.8%) | 1,047 (2.7%) |
| $50,000 to $74,999 | 2,812 (15.0%) | 2,023 (5.3%) |
| $75,000 to $99,999 | 2,415 (12.9%) | 3,806 (9.9%) |
| $100,000 to $149,999 | 3,413 (18.2%) | 4,327 (11.3%) |
| $150,000 or more | 4,127 (22.0%) | 8,217 (21.4%) |
| Total | 18,792 (100.0%) | 38,443 (100.0%) |
Property Value to Household Income Ratio in El Dorado County
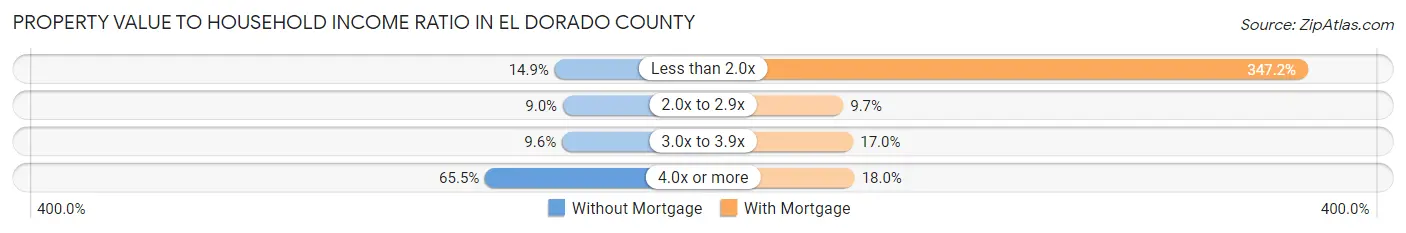
| Value-to-Income Ratio | Without Mortgage | With Mortgage |
| Less than 2.0x | 2,802 (14.9%) | 133,481 (347.2%) |
| 2.0x to 2.9x | 1,682 (8.9%) | 3,732 (9.7%) |
| 3.0x to 3.9x | 1,808 (9.6%) | 6,522 (17.0%) |
| 4.0x or more | 12,299 (65.4%) | 6,918 (18.0%) |
| Total | 18,792 (100.0%) | 38,443 (100.0%) |
Real Estate Taxes by Mortgage Status in El Dorado County
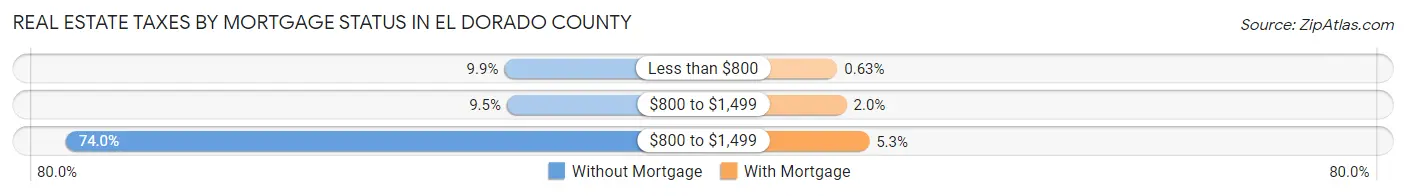
| Property Taxes | Without Mortgage | With Mortgage |
| Less than $800 | 1,864 (9.9%) | 242 (0.6%) |
| $800 to $1,499 | 1,792 (9.5%) | 762 (2.0%) |
| $800 to $1,499 | 13,901 (74.0%) | 2,032 (5.3%) |
| Total | 18,792 (100.0%) | 38,443 (100.0%) |
Health & Disability in El Dorado County
Health Insurance Coverage by Age in El Dorado County
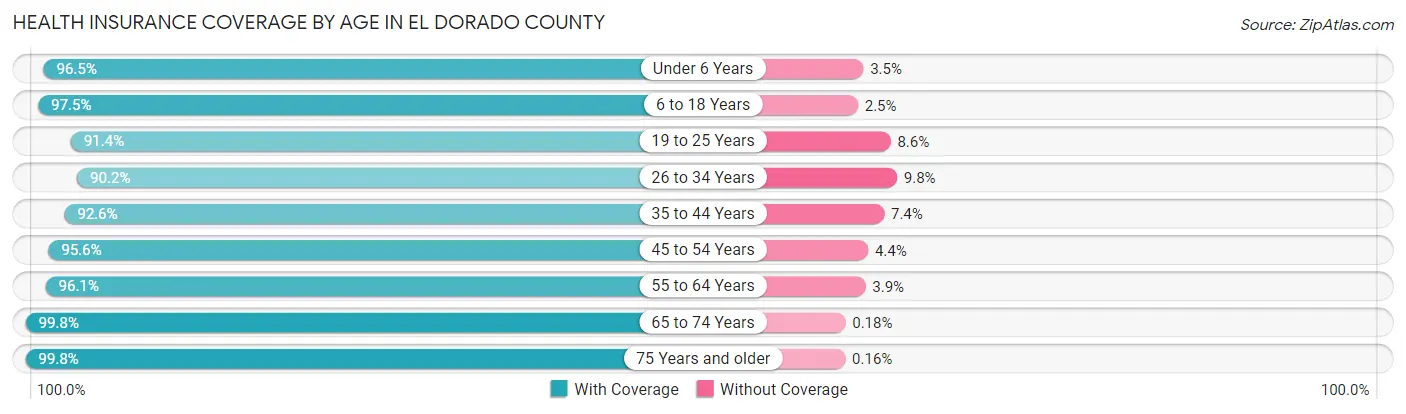
| Age Bracket | With Coverage | Without Coverage |
| Under 6 Years | 10,179 (96.5%) | 372 (3.5%) |
| 6 to 18 Years | 28,436 (97.5%) | 734 (2.5%) |
| 19 to 25 Years | 11,638 (91.4%) | 1,096 (8.6%) |
| 26 to 34 Years | 15,806 (90.2%) | 1,717 (9.8%) |
| 35 to 44 Years | 21,054 (92.6%) | 1,684 (7.4%) |
| 45 to 54 Years | 23,119 (95.6%) | 1,069 (4.4%) |
| 55 to 64 Years | 30,160 (96.1%) | 1,231 (3.9%) |
| 65 to 74 Years | 26,342 (99.8%) | 47 (0.2%) |
| 75 Years and older | 15,949 (99.8%) | 26 (0.2%) |
| Total | 182,683 (95.8%) | 7,976 (4.2%) |
Health Insurance Coverage by Citizenship Status in El Dorado County
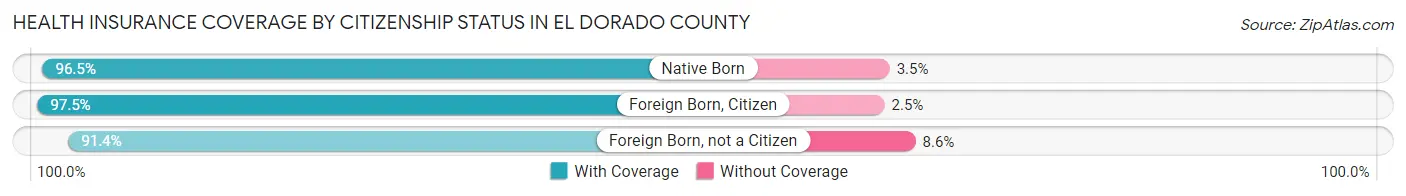
| Citizenship Status | With Coverage | Without Coverage |
| Native Born | 10,179 (96.5%) | 372 (3.5%) |
| Foreign Born, Citizen | 28,436 (97.5%) | 734 (2.5%) |
| Foreign Born, not a Citizen | 11,638 (91.4%) | 1,096 (8.6%) |
Health Insurance Coverage by Household Income in El Dorado County
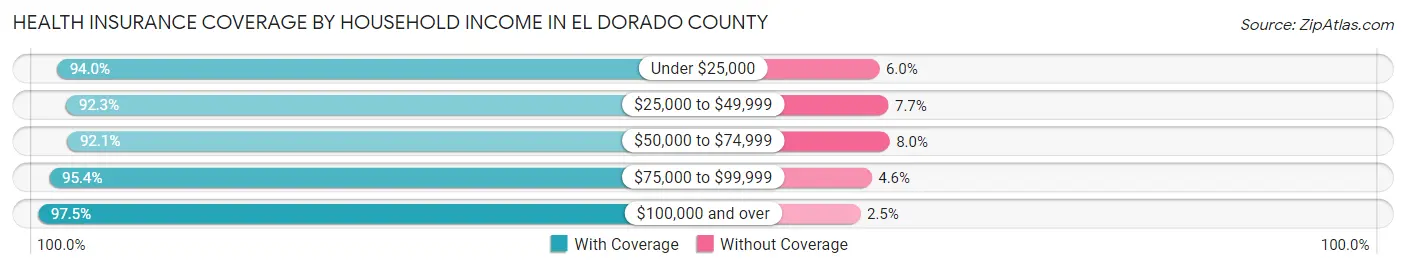
| Household Income | With Coverage | Without Coverage |
| Under $25,000 | 13,175 (94.0%) | 844 (6.0%) |
| $25,000 to $49,999 | 17,662 (92.3%) | 1,480 (7.7%) |
| $50,000 to $74,999 | 20,902 (92.0%) | 1,806 (8.0%) |
| $75,000 to $99,999 | 21,365 (95.4%) | 1,027 (4.6%) |
| $100,000 and over | 108,551 (97.5%) | 2,764 (2.5%) |
Public vs Private Health Insurance Coverage by Age in El Dorado County
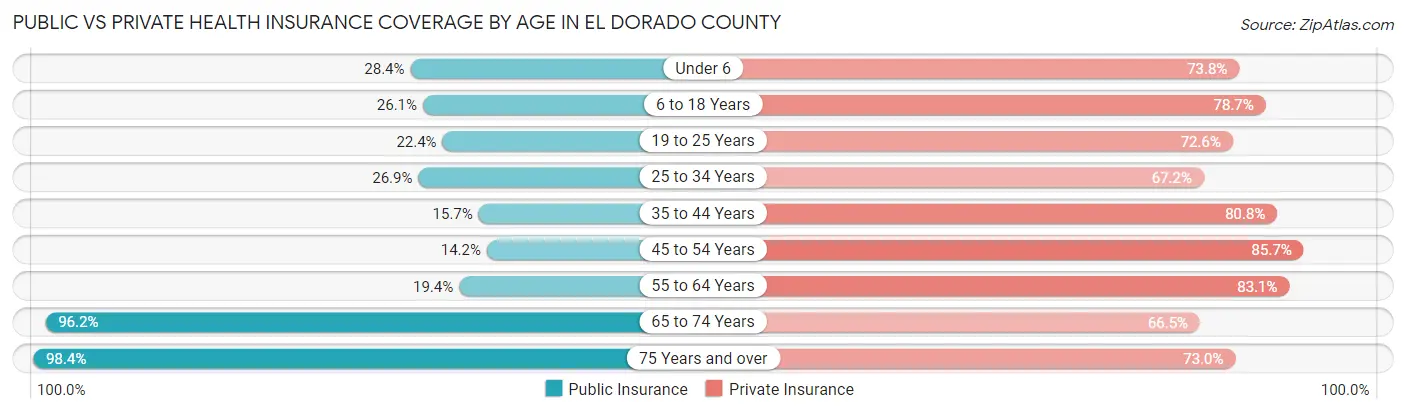
| Age Bracket | Public Insurance | Private Insurance |
| Under 6 | 2,997 (28.4%) | 7,782 (73.8%) |
| 6 to 18 Years | 7,607 (26.1%) | 22,944 (78.7%) |
| 19 to 25 Years | 2,857 (22.4%) | 9,240 (72.6%) |
| 25 to 34 Years | 4,718 (26.9%) | 11,773 (67.2%) |
| 35 to 44 Years | 3,577 (15.7%) | 18,376 (80.8%) |
| 45 to 54 Years | 3,437 (14.2%) | 20,735 (85.7%) |
| 55 to 64 Years | 6,078 (19.4%) | 26,078 (83.1%) |
| 65 to 74 Years | 25,379 (96.2%) | 17,540 (66.5%) |
| 75 Years and over | 15,726 (98.4%) | 11,668 (73.0%) |
| Total | 72,376 (38.0%) | 146,136 (76.6%) |
Disability Status by Sex by Age in El Dorado County
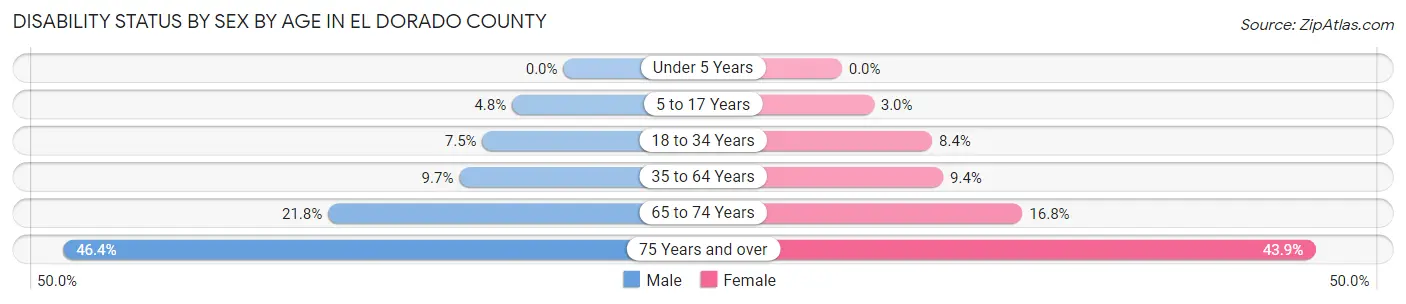
| Age Bracket | Male | Female |
| Under 5 Years | 0 (0.0%) | 0 (0.0%) |
| 5 to 17 Years | 710 (4.8%) | 421 (3.0%) |
| 18 to 34 Years | 1,252 (7.5%) | 1,313 (8.4%) |
| 35 to 64 Years | 3,774 (9.7%) | 3,687 (9.4%) |
| 65 to 74 Years | 2,865 (21.8%) | 2,225 (16.8%) |
| 75 Years and over | 3,376 (46.4%) | 3,821 (43.9%) |
Disability Class by Sex by Age in El Dorado County
Disability Class: Hearing Difficulty
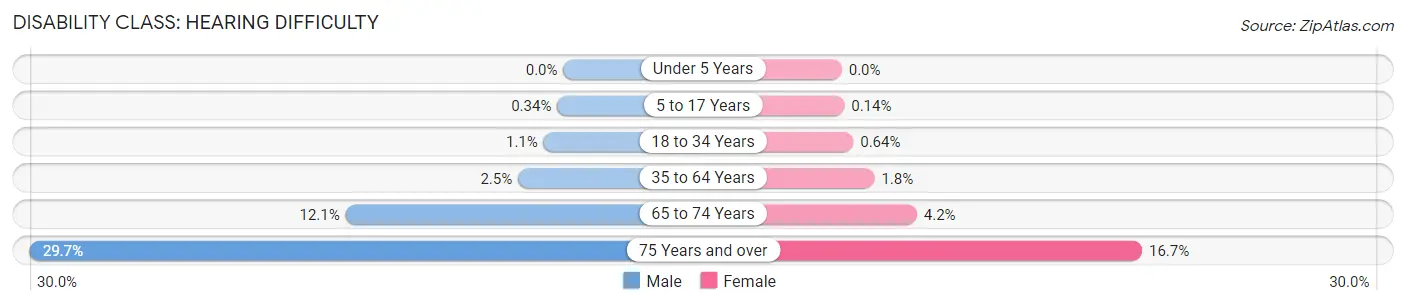
| Age Bracket | Male | Female |
| Under 5 Years | 0 (0.0%) | 0 (0.0%) |
| 5 to 17 Years | 50 (0.3%) | 20 (0.1%) |
| 18 to 34 Years | 184 (1.1%) | 100 (0.6%) |
| 35 to 64 Years | 983 (2.5%) | 715 (1.8%) |
| 65 to 74 Years | 1,591 (12.1%) | 555 (4.2%) |
| 75 Years and over | 2,161 (29.7%) | 1,455 (16.7%) |
Disability Class: Vision Difficulty
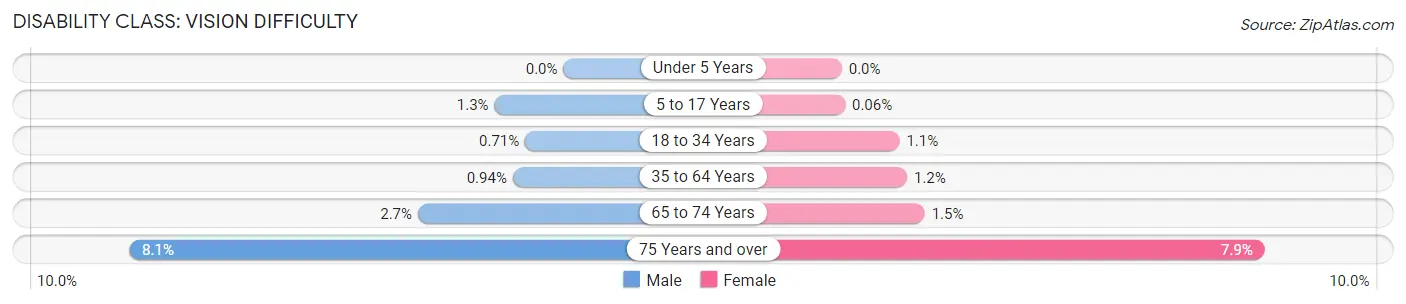
| Age Bracket | Male | Female |
| Under 5 Years | 0 (0.0%) | 0 (0.0%) |
| 5 to 17 Years | 191 (1.3%) | 9 (0.1%) |
| 18 to 34 Years | 119 (0.7%) | 168 (1.1%) |
| 35 to 64 Years | 367 (0.9%) | 475 (1.2%) |
| 65 to 74 Years | 354 (2.7%) | 204 (1.5%) |
| 75 Years and over | 586 (8.1%) | 683 (7.9%) |
Disability Class: Cognitive Difficulty
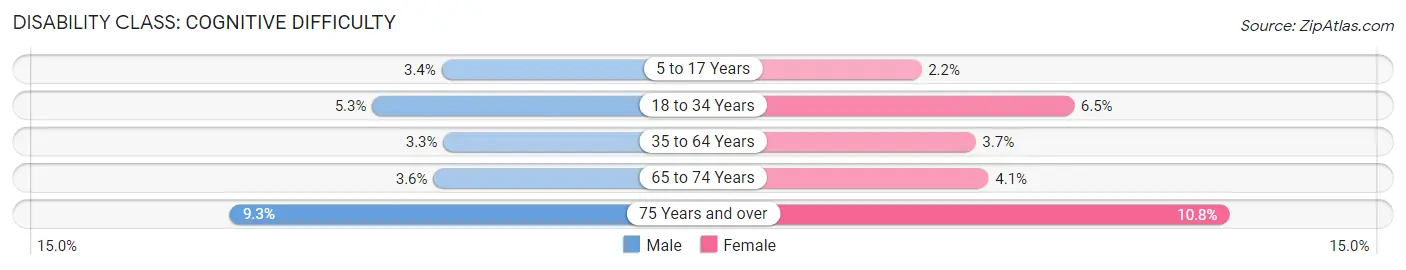
| Age Bracket | Male | Female |
| 5 to 17 Years | 506 (3.4%) | 313 (2.2%) |
| 18 to 34 Years | 886 (5.3%) | 1,011 (6.5%) |
| 35 to 64 Years | 1,306 (3.3%) | 1,460 (3.7%) |
| 65 to 74 Years | 475 (3.6%) | 542 (4.1%) |
| 75 Years and over | 675 (9.3%) | 939 (10.8%) |
Disability Class: Ambulatory Difficulty
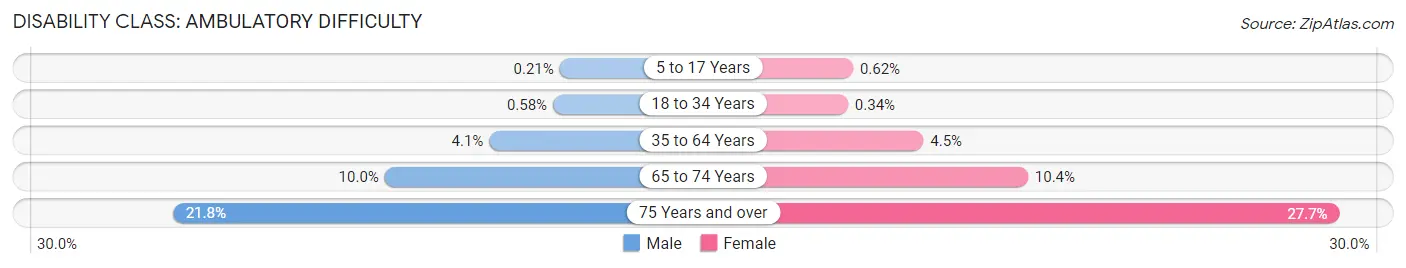
| Age Bracket | Male | Female |
| 5 to 17 Years | 31 (0.2%) | 88 (0.6%) |
| 18 to 34 Years | 96 (0.6%) | 54 (0.3%) |
| 35 to 64 Years | 1,612 (4.1%) | 1,780 (4.5%) |
| 65 to 74 Years | 1,305 (10.0%) | 1,375 (10.4%) |
| 75 Years and over | 1,582 (21.7%) | 2,411 (27.7%) |
Disability Class: Self-Care Difficulty
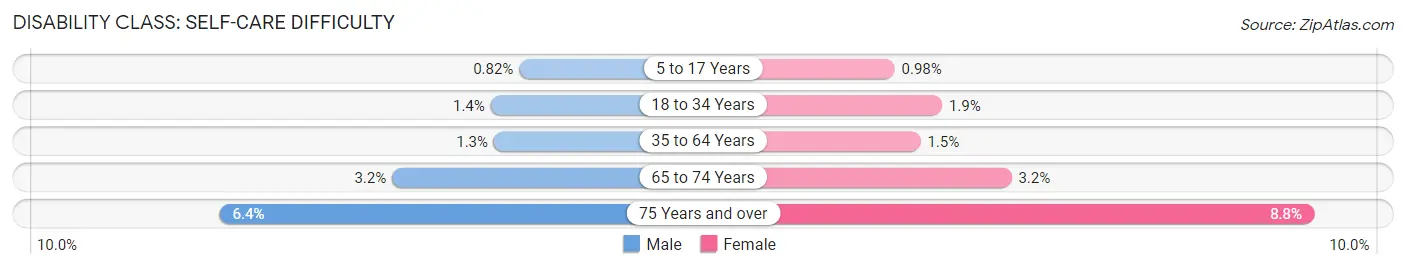
| Age Bracket | Male | Female |
| 5 to 17 Years | 123 (0.8%) | 139 (1.0%) |
| 18 to 34 Years | 225 (1.3%) | 291 (1.9%) |
| 35 to 64 Years | 504 (1.3%) | 571 (1.5%) |
| 65 to 74 Years | 417 (3.2%) | 418 (3.2%) |
| 75 Years and over | 464 (6.4%) | 762 (8.8%) |
Technology Access in El Dorado County
Computing Device Access in El Dorado County
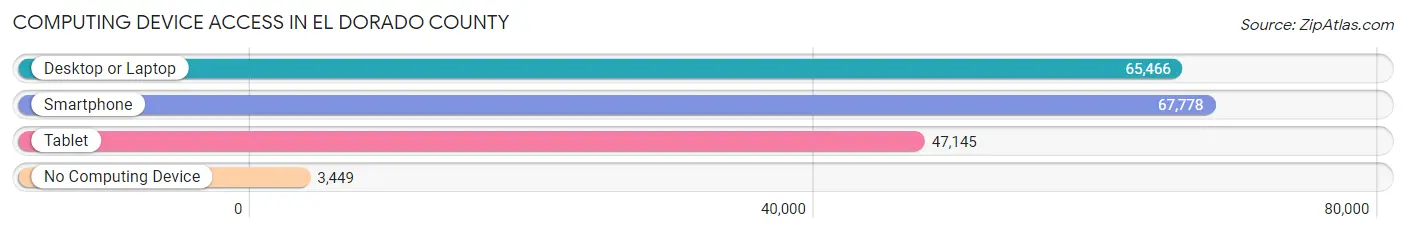
| Device Type | # Households | % Households |
| Desktop or Laptop | 65,466 | 87.1% |
| Smartphone | 67,778 | 90.1% |
| Tablet | 47,145 | 62.7% |
| No Computing Device | 3,449 | 4.6% |
| Total | 75,190 | 100.0% |
Internet Access in El Dorado County
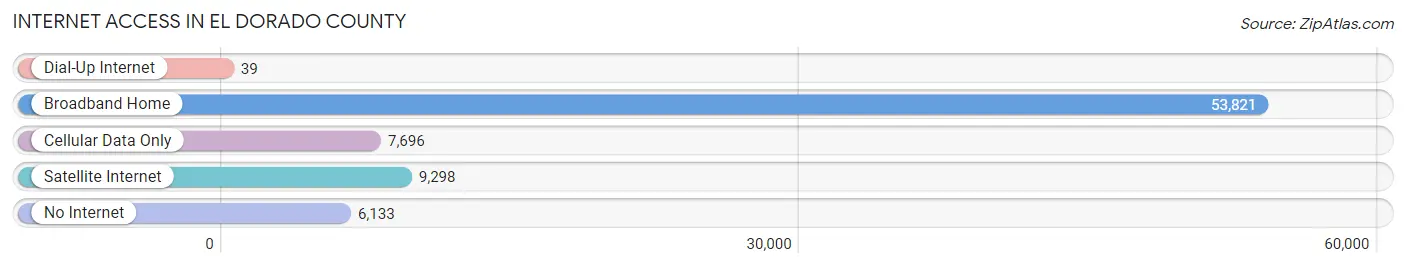
| Internet Type | # Households | % Households |
| Dial-Up Internet | 39 | 0.1% |
| Broadband Home | 53,821 | 71.6% |
| Cellular Data Only | 7,696 | 10.2% |
| Satellite Internet | 9,298 | 12.4% |
| No Internet | 6,133 | 8.2% |
| Total | 75,190 | 100.0% |
El Dorado County Summary
El Dorado County is a county located in the Sierra Nevada region of California. It is bordered by Placer County to the north, Amador County to the east, Calaveras County to the southeast, and Sacramento County to the south. The county seat is Placerville, which is located in the foothills of the Sierra Nevada Mountains. El Dorado County is known for its natural beauty, outdoor recreation, and historic gold mining towns.
History
El Dorado County was formed in 1850 from parts of Placer and Sutter counties. The county was named after the mythical city of El Dorado, which was said to be located somewhere in the area. The county was originally inhabited by the Miwok and Maidu Native American tribes. In the late 1840s, the area was explored by John C. Fremont and Kit Carson, who were looking for a route to the Pacific Ocean.
In 1848, gold was discovered in the area, and the California Gold Rush began. Thousands of miners flocked to the area, and many of the towns in El Dorado County were founded during this time. Placerville, the county seat, was founded in 1849. Other towns, such as Georgetown, Coloma, and Shingle Springs, were also founded during this time.
The gold rush eventually ended, but El Dorado County continued to grow. In the late 19th century, the county became a popular destination for tourists, who came to enjoy the area’s natural beauty and outdoor recreation. The county also became a popular destination for retirees, who came to enjoy the mild climate and relaxed lifestyle.
Geography
El Dorado County covers an area of 1,786 square miles. The county is located in the Sierra Nevada region of California, and is bordered by Placer County to the north, Amador County to the east, Calaveras County to the southeast, and Sacramento County to the south. The county is divided into two distinct regions: the western foothills and the eastern Sierra Nevada Mountains.
The western foothills are characterized by rolling hills and oak woodlands. The eastern Sierra Nevada Mountains are characterized by rugged peaks and deep canyons. The highest point in the county is Freel Peak, which has an elevation of 10,881 feet.
The county is home to several rivers and streams, including the American River, the Rubicon River, and the South Fork of the American River. The county also contains several lakes, including Lake Tahoe, Fallen Leaf Lake, and Union Valley Reservoir.
Economy
El Dorado County has a diverse economy. The county’s largest industries are tourism, government, and agriculture. The county is home to several ski resorts, including Heavenly Mountain Resort and Sierra-at-Tahoe. The county is also home to several wineries, including the El Dorado Winery and the Fenton Winery.
The county’s government sector is the largest employer in the county. The county government employs over 4,000 people. The county is also home to several state parks, including the El Dorado National Forest and the Desolation Wilderness.
Agriculture is also an important part of the county’s economy. The county is home to several farms, which produce a variety of crops, including apples, pears, peaches, and walnuts. The county is also home to several cattle ranches, which produce beef and dairy products.
Demographics
As of the 2010 census, El Dorado County had a population of 181,058. The population was spread out, with 24.3% under the age of 18, 8.2% from 18 to 24, 28.2% from 25 to 44, 28.2% from 45 to 64, and 11.1% who were 65 years of age or older. The median age was 38.4 years.
The racial makeup of the county was 87.2% White, 1.3% African American, 0.7% Native American, 4.2% Asian, 0.2% Pacific Islander, 3.7% from other races, and 2.7% from two or more races. Hispanic or Latino of any race were 11.2% of the population.
The median income for a household in the county was $63,845, and the median income for a family was $76,845. The per capita income for the county was $32,945. About 8.2% of families and 11.2% of the population were below the poverty line, including 15.2% of those under age 18 and 5.2% of those age 65 or over.
Common Questions
What is Per Capita Income in El Dorado County?
Per Capita income in El Dorado County is $55,455.
What is the Median Family Income in El Dorado County?
Median Family Income in El Dorado County is $122,465.
What is the Median Household income in El Dorado County?
Median Household Income in El Dorado County is $99,246.
What is Income or Wage Gap in El Dorado County?
Income or Wage Gap in El Dorado County is 30.2%.
Women in El Dorado County earn 69.8 cents for every dollar earned by a man.
What is Family Income Deficit in El Dorado County?
Family Income Deficit in El Dorado County is $9,114.
Families that are below poverty line in El Dorado County earn $9,114 less on average than the poverty threshold level.
What is Inequality or Gini Index in El Dorado County?
Inequality or Gini Index in El Dorado County is 0.48.
What is the Total Population of El Dorado County?
Total Population of El Dorado County is 191,713.
What is the Total Male Population of El Dorado County?
Total Male Population of El Dorado County is 96,045.
What is the Total Female Population of El Dorado County?
Total Female Population of El Dorado County is 95,668.
What is the Ratio of Males per 100 Females in El Dorado County?
There are 100.39 Males per 100 Females in El Dorado County.
What is the Ratio of Females per 100 Males in El Dorado County?
There are 99.61 Females per 100 Males in El Dorado County.
What is the Median Population Age in El Dorado County?
Median Population Age in El Dorado County is 46.2 Years.
What is the Average Family Size in El Dorado County
Average Family Size in El Dorado County is 3.0 People.
What is the Average Household Size in El Dorado County
Average Household Size in El Dorado County is 2.5 People.
How Large is the Labor Force in El Dorado County?
There are 92,504 People in the Labor Forcein in El Dorado County.
What is the Percentage of People in the Labor Force in El Dorado County?
58.2% of People are in the Labor Force in El Dorado County.
What is the Unemployment Rate in El Dorado County?
Unemployment Rate in El Dorado County is 4.6%.