Calaveras County, CA Map & Demographics
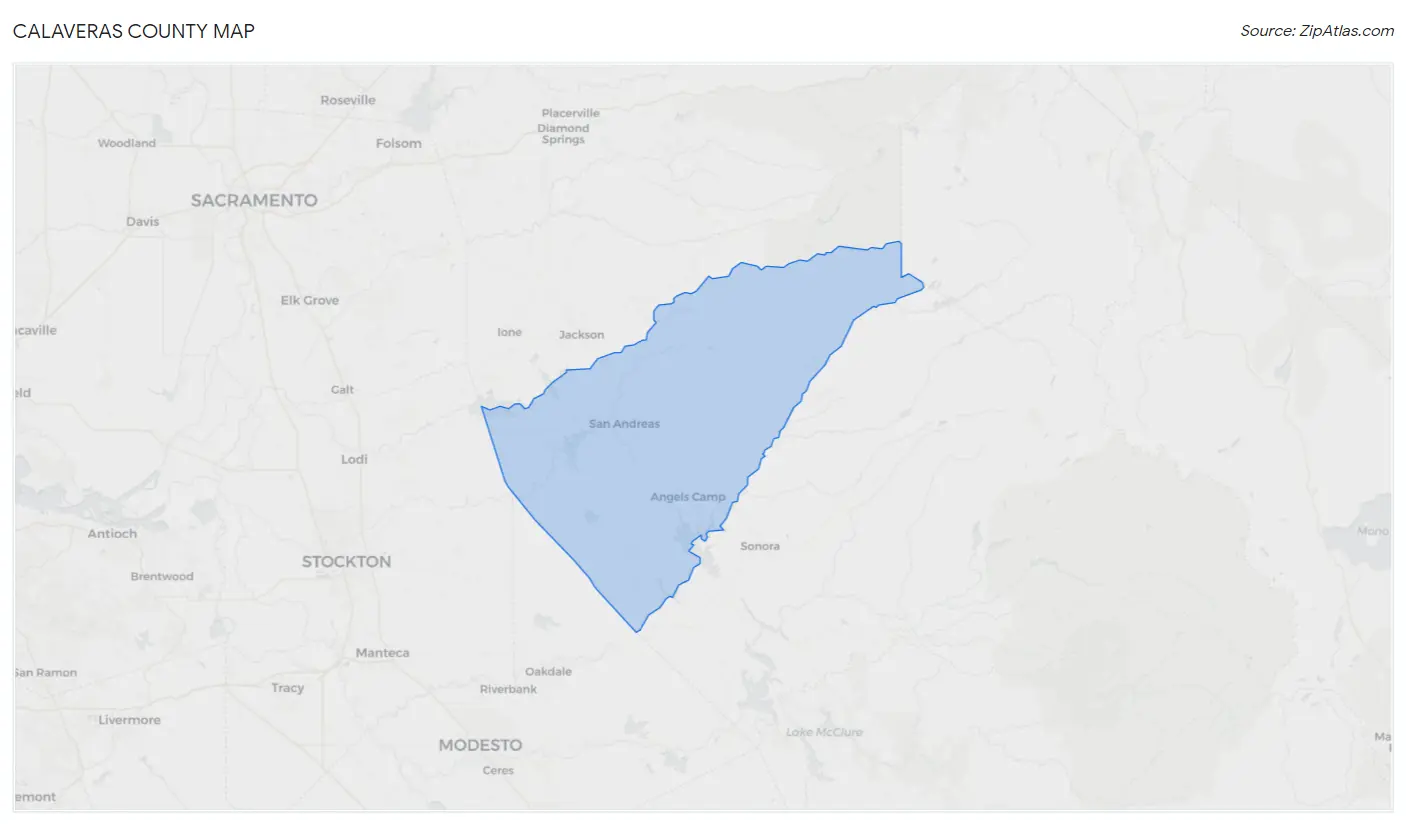
Calaveras County Map
Calaveras County Overview
$37,935
PER CAPITA INCOME
$89,134
AVG FAMILY INCOME
$77,526
AVG HOUSEHOLD INCOME
33.0%
WAGE / INCOME GAP [ % ]
67.0¢/ $1
WAGE / INCOME GAP [ $ ]
$11,091
FAMILY INCOME DEFICIT
0.43
INEQUALITY / GINI INDEX
45,674
TOTAL POPULATION
22,749
MALE POPULATION
22,925
FEMALE POPULATION
99.23
MALES / 100 FEMALES
100.77
FEMALES / 100 MALES
52.1
MEDIAN AGE
3.0
AVG FAMILY SIZE
2.6
AVG HOUSEHOLD SIZE
18,521
LABOR FORCE [ PEOPLE ]
47.4%
PERCENT IN LABOR FORCE
6.2%
UNEMPLOYMENT RATE
Calaveras County Area Codes
Income in Calaveras County
Income Overview in Calaveras County
Per Capita Income in Calaveras County is $37,935, while median incomes of families and households are $89,134 and $77,526 respectively.
| Characteristic | Number | Measure |
| Per Capita Income | 45,674 | $37,935 |
| Median Family Income | 12,533 | $89,134 |
| Mean Family Income | 12,533 | $109,071 |
| Median Household Income | 17,198 | $77,526 |
| Mean Household Income | 17,198 | $97,040 |
| Income Deficit | 12,533 | $11,091 |
| Wage / Income Gap (%) | 45,674 | 33.04% |
| Wage / Income Gap ($) | 45,674 | 66.96¢ per $1 |
| Gini / Inequality Index | 45,674 | 0.43 |
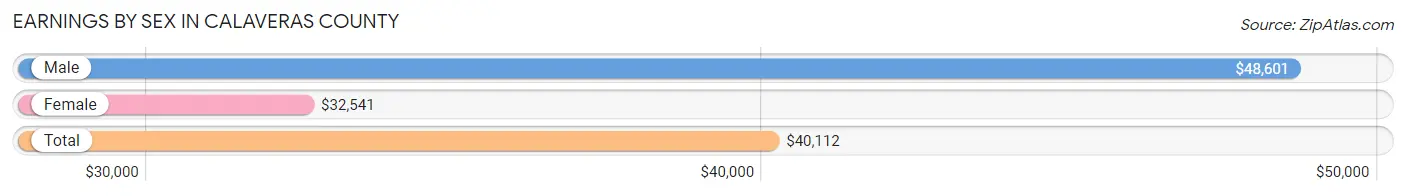
Earnings by Sex in Calaveras County
Average Earnings in Calaveras County are $40,112, $48,601 for men and $32,541 for women, a difference of 33.0%.
| Sex | Number | Average Earnings |
| Male | 10,085 (51.7%) | $48,601 |
| Female | 9,428 (48.3%) | $32,541 |
| Total | 19,513 (100.0%) | $40,112 |
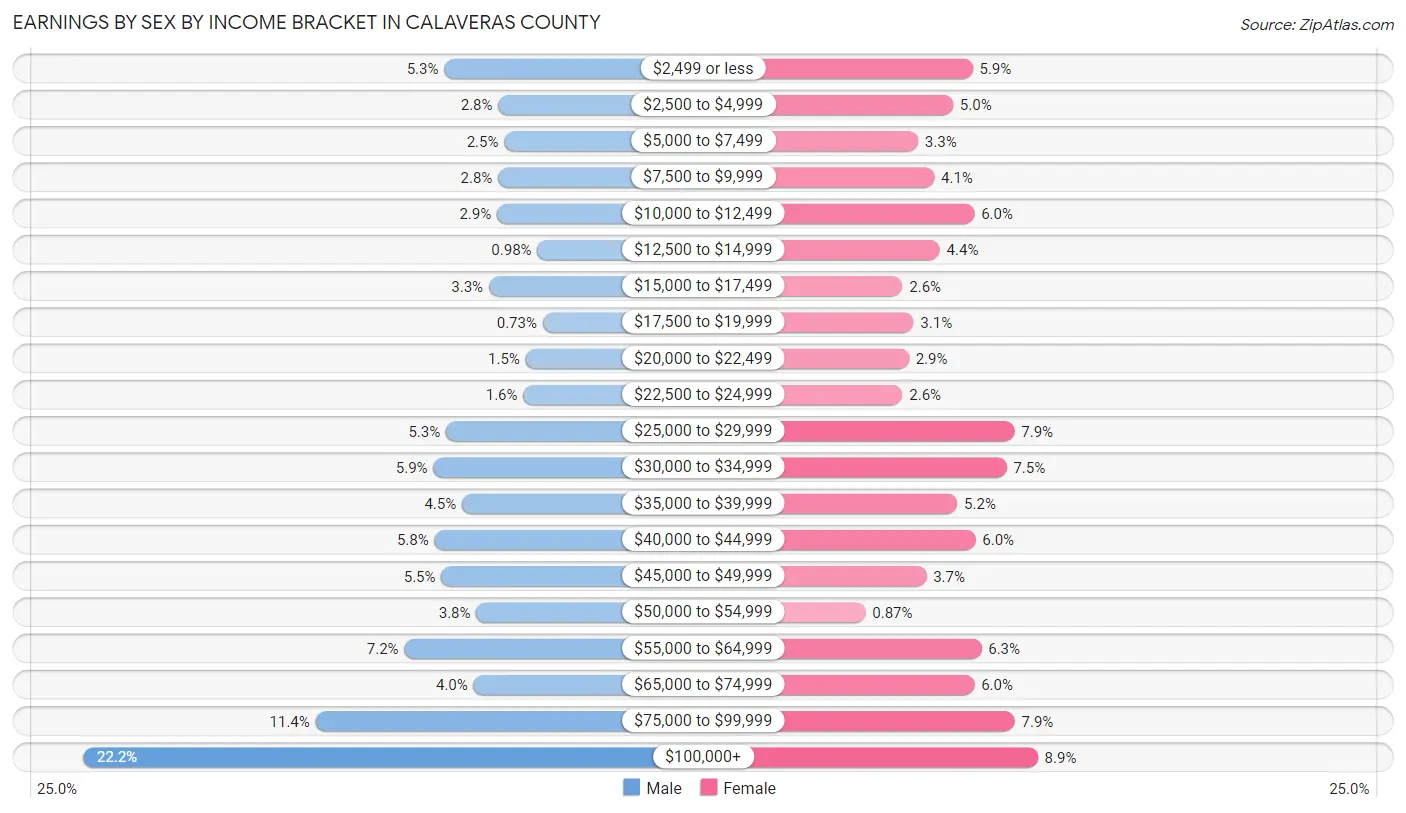
Earnings by Sex by Income Bracket in Calaveras County
The most common earnings brackets in Calaveras County are $100,000+ for men (2,241 | 22.2%) and $100,000+ for women (843 | 8.9%).
| Income | Male | Female |
| $2,499 or less | 539 (5.3%) | 555 (5.9%) |
| $2,500 to $4,999 | 283 (2.8%) | 469 (5.0%) |
| $5,000 to $7,499 | 255 (2.5%) | 314 (3.3%) |
| $7,500 to $9,999 | 284 (2.8%) | 386 (4.1%) |
| $10,000 to $12,499 | 289 (2.9%) | 563 (6.0%) |
| $12,500 to $14,999 | 99 (1.0%) | 410 (4.3%) |
| $15,000 to $17,499 | 328 (3.3%) | 245 (2.6%) |
| $17,500 to $19,999 | 74 (0.7%) | 294 (3.1%) |
| $20,000 to $22,499 | 154 (1.5%) | 273 (2.9%) |
| $22,500 to $24,999 | 165 (1.6%) | 245 (2.6%) |
| $25,000 to $29,999 | 530 (5.3%) | 740 (7.9%) |
| $30,000 to $34,999 | 590 (5.9%) | 705 (7.5%) |
| $35,000 to $39,999 | 455 (4.5%) | 487 (5.2%) |
| $40,000 to $44,999 | 585 (5.8%) | 568 (6.0%) |
| $45,000 to $49,999 | 553 (5.5%) | 351 (3.7%) |
| $50,000 to $54,999 | 387 (3.8%) | 82 (0.9%) |
| $55,000 to $64,999 | 727 (7.2%) | 594 (6.3%) |
| $65,000 to $74,999 | 400 (4.0%) | 563 (6.0%) |
| $75,000 to $99,999 | 1,147 (11.4%) | 741 (7.9%) |
| $100,000+ | 2,241 (22.2%) | 843 (8.9%) |
| Total | 10,085 (100.0%) | 9,428 (100.0%) |
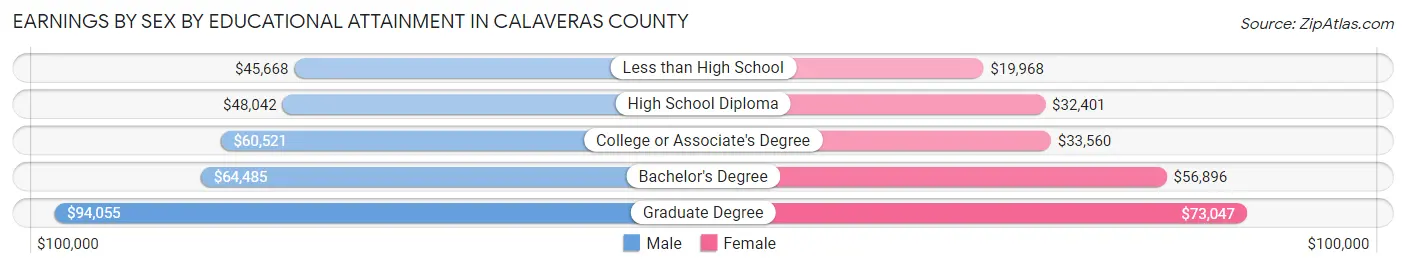
Earnings by Sex by Educational Attainment in Calaveras County
Average earnings in Calaveras County are $55,239 for men and $34,802 for women, a difference of 37.0%. Men with an educational attainment of graduate degree enjoy the highest average annual earnings of $94,055, while those with less than high school education earn the least with $45,668. Women with an educational attainment of graduate degree earn the most with the average annual earnings of $73,047, while those with less than high school education have the smallest earnings of $19,968.
| Educational Attainment | Male Income | Female Income |
| Less than High School | $45,668 | $19,968 |
| High School Diploma | $48,042 | $32,401 |
| College or Associate's Degree | $60,521 | $33,560 |
| Bachelor's Degree | $64,485 | $56,896 |
| Graduate Degree | $94,055 | $73,047 |
| Total | $55,239 | $34,802 |
Family Income in Calaveras County
Family Income Brackets in Calaveras County
According to the Calaveras County family income data, there are 2,406 families falling into the $100,000 to $149,999 income range, which is the most common income bracket and makes up 19.2% of all families. Conversely, the $10,000 to $14,999 income bracket is the least frequent group with only 175 families (1.4%) belonging to this category.
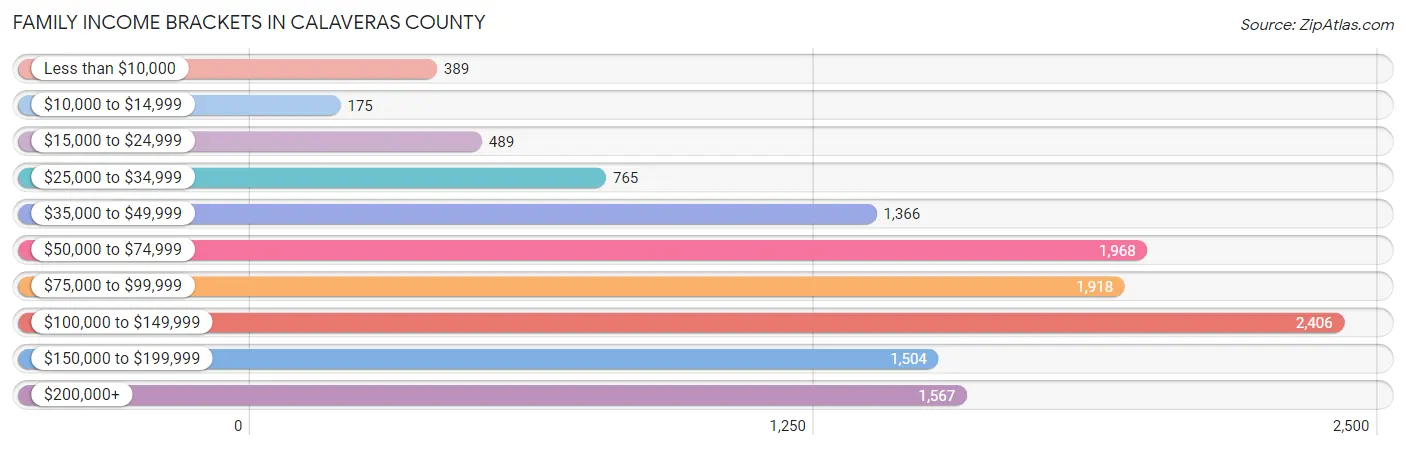
| Income Bracket | # Families | % Families |
| Less than $10,000 | 389 | 3.1% |
| $10,000 to $14,999 | 175 | 1.4% |
| $15,000 to $24,999 | 489 | 3.9% |
| $25,000 to $34,999 | 765 | 6.1% |
| $35,000 to $49,999 | 1,366 | 10.9% |
| $50,000 to $74,999 | 1,968 | 15.7% |
| $75,000 to $99,999 | 1,918 | 15.3% |
| $100,000 to $149,999 | 2,406 | 19.2% |
| $150,000 to $199,999 | 1,504 | 12.0% |
| $200,000+ | 1,567 | 12.5% |
Family Income by Famaliy Size in Calaveras County
5-person families (796 | 6.4%) account for the highest median family income in Calaveras County with $109,167 per family, while 2-person families (7,524 | 60.0%) have the highest median income of $41,940 per family member.
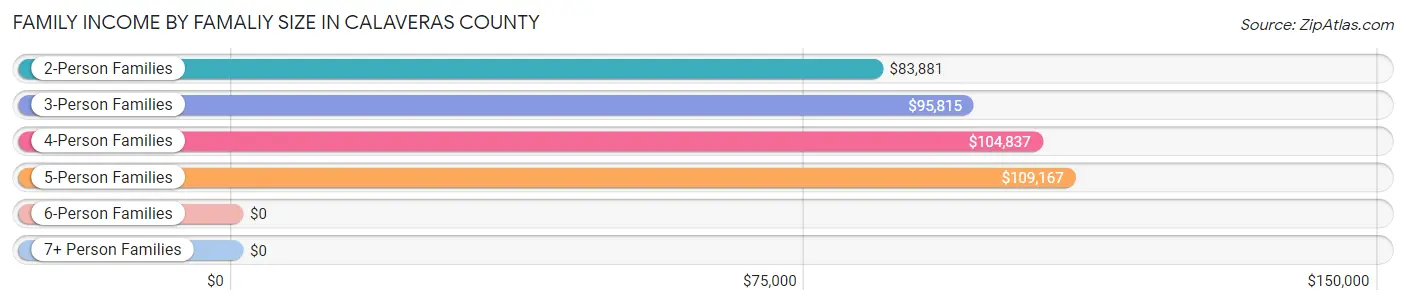
| Income Bracket | # Families | Median Income |
| 2-Person Families | 7,524 (60.0%) | $83,881 |
| 3-Person Families | 2,440 (19.5%) | $95,815 |
| 4-Person Families | 1,473 (11.7%) | $104,837 |
| 5-Person Families | 796 (6.4%) | $109,167 |
| 6-Person Families | 219 (1.8%) | $0 |
| 7+ Person Families | 81 (0.6%) | $0 |
| Total | 12,533 (100.0%) | $89,134 |
Family Income by Number of Earners in Calaveras County
The median family income in Calaveras County is $89,134, with families comprising 3+ earners (907) having the highest median family income of $135,685, while families with no earners (3,614) have the lowest median family income of $62,531, accounting for 7.2% and 28.8% of families, respectively.
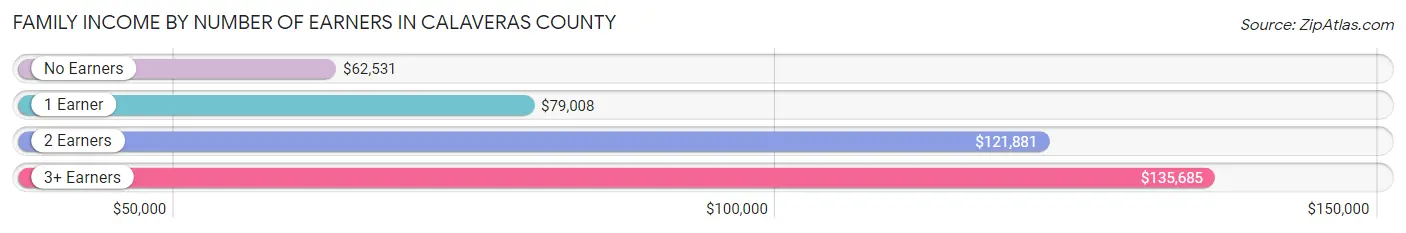
| Number of Earners | # Families | Median Income |
| No Earners | 3,614 (28.8%) | $62,531 |
| 1 Earner | 4,160 (33.2%) | $79,008 |
| 2 Earners | 3,852 (30.7%) | $121,881 |
| 3+ Earners | 907 (7.2%) | $135,685 |
| Total | 12,533 (100.0%) | $89,134 |
Household Income in Calaveras County
Household Income Brackets in Calaveras County
With 2,924 households falling in the category, the $100,000 to $149,999 income range is the most frequent in Calaveras County, accounting for 17.0% of all households. In contrast, only 516 households (3.0%) fall into the $10,000 to $14,999 income bracket, making it the least populous group.
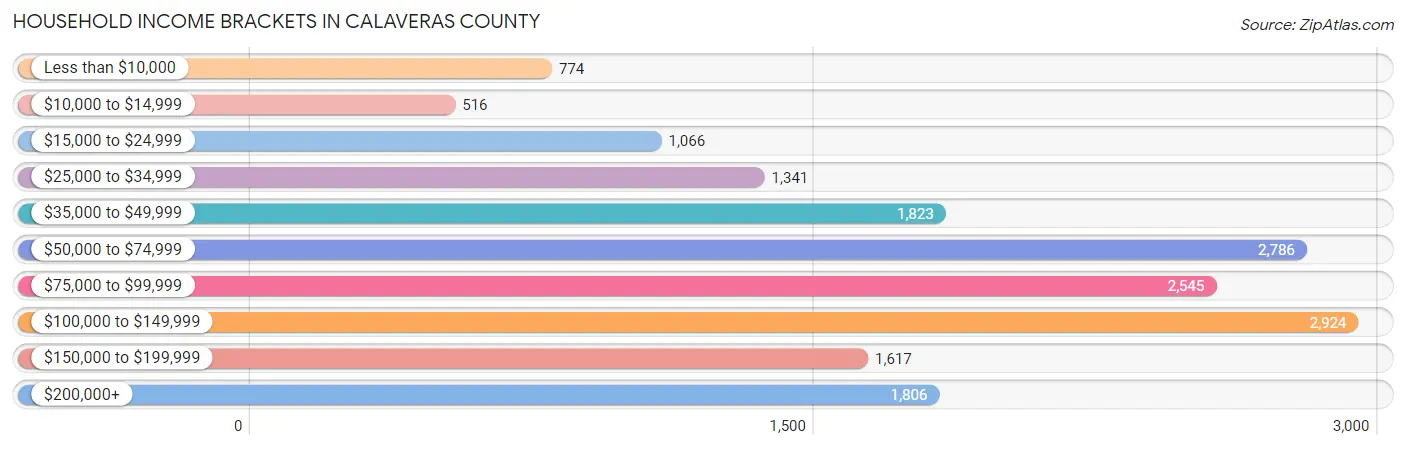
| Income Bracket | # Households | % Households |
| Less than $10,000 | 774 | 4.5% |
| $10,000 to $14,999 | 516 | 3.0% |
| $15,000 to $24,999 | 1,066 | 6.2% |
| $25,000 to $34,999 | 1,341 | 7.8% |
| $35,000 to $49,999 | 1,823 | 10.6% |
| $50,000 to $74,999 | 2,786 | 16.2% |
| $75,000 to $99,999 | 2,545 | 14.8% |
| $100,000 to $149,999 | 2,924 | 17.0% |
| $150,000 to $199,999 | 1,617 | 9.4% |
| $200,000+ | 1,806 | 10.5% |
Household Income by Householder Age in Calaveras County
The median household income in Calaveras County is $77,526, with the highest median household income of $98,149 found in the 45 to 64 years age bracket for the primary householder. A total of 6,646 households (38.6%) fall into this category. Meanwhile, the 65+ years age bracket for the primary householder has the lowest median household income of $58,822, with 7,136 households (41.5%) in this group.
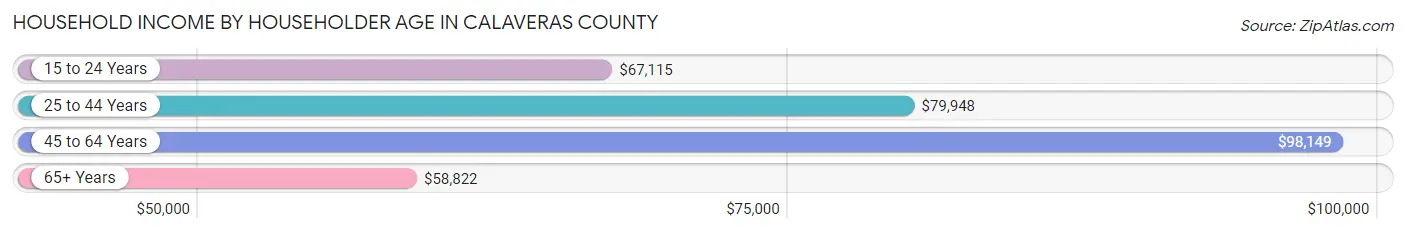
| Income Bracket | # Households | Median Income |
| 15 to 24 Years | 170 (1.0%) | $67,115 |
| 25 to 44 Years | 3,246 (18.9%) | $79,948 |
| 45 to 64 Years | 6,646 (38.6%) | $98,149 |
| 65+ Years | 7,136 (41.5%) | $58,822 |
| Total | 17,198 (100.0%) | $77,526 |
Poverty in Calaveras County
Income Below Poverty by Sex and Age in Calaveras County
With 13.3% poverty level for males and 12.9% for females among the residents of Calaveras County, 15 year old males and 5 year old females are the most vulnerable to poverty, with 52 males (37.1%) and 114 females (59.4%) in their respective age groups living below the poverty level.
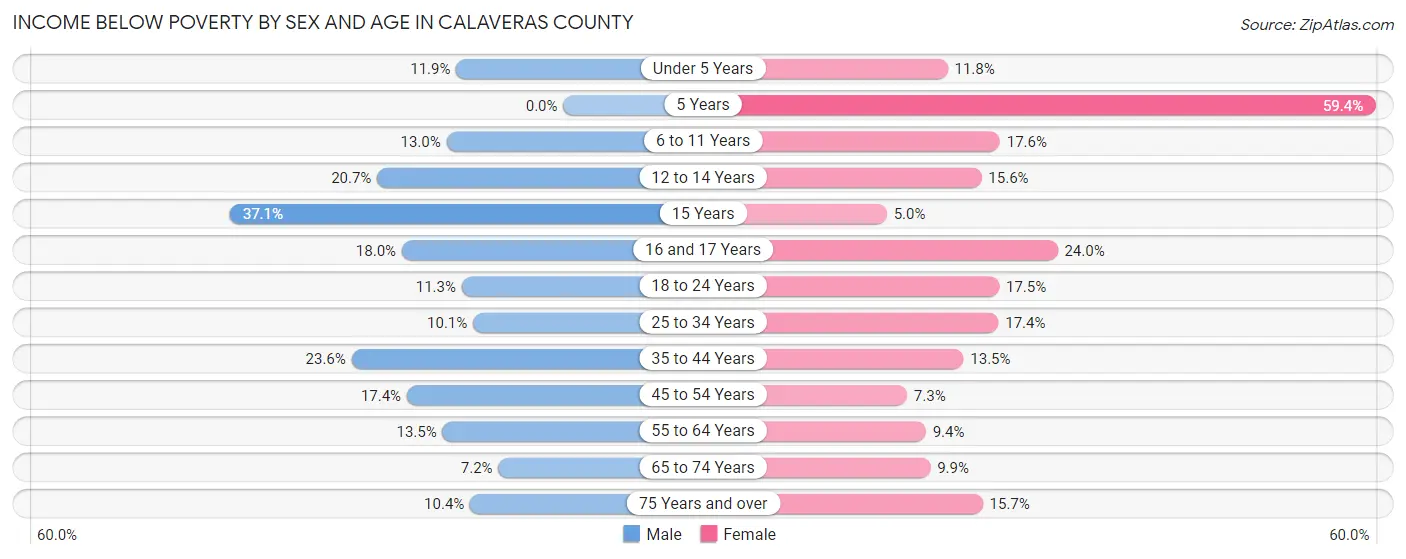
| Age Bracket | Male | Female |
| Under 5 Years | 118 (11.9%) | 100 (11.8%) |
| 5 Years | 0 (0.0%) | 114 (59.4%) |
| 6 to 11 Years | 177 (13.0%) | 216 (17.6%) |
| 12 to 14 Years | 85 (20.7%) | 121 (15.5%) |
| 15 Years | 52 (37.1%) | 15 (5.0%) |
| 16 and 17 Years | 105 (18.0%) | 110 (24.0%) |
| 18 to 24 Years | 151 (11.3%) | 214 (17.5%) |
| 25 to 34 Years | 230 (10.1%) | 340 (17.4%) |
| 35 to 44 Years | 576 (23.6%) | 313 (13.5%) |
| 45 to 54 Years | 442 (17.4%) | 199 (7.2%) |
| 55 to 64 Years | 498 (13.5%) | 386 (9.3%) |
| 65 to 74 Years | 276 (7.2%) | 402 (9.9%) |
| 75 Years and over | 266 (10.4%) | 409 (15.7%) |
| Total | 2,976 (13.3%) | 2,939 (12.9%) |
Income Above Poverty by Sex and Age in Calaveras County
According to the poverty statistics in Calaveras County, males aged 5 years and females aged 15 years are the age groups that are most secure financially, with 100.0% of males and 95.0% of females in these age groups living above the poverty line.
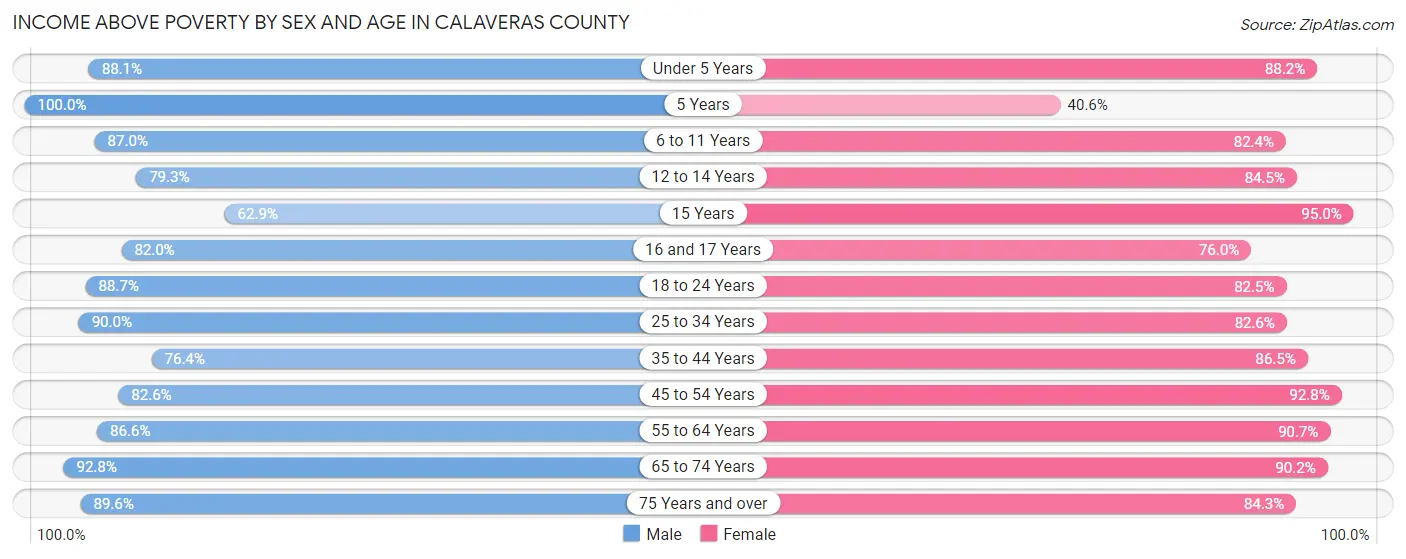
| Age Bracket | Male | Female |
| Under 5 Years | 872 (88.1%) | 749 (88.2%) |
| 5 Years | 198 (100.0%) | 78 (40.6%) |
| 6 to 11 Years | 1,184 (87.0%) | 1,011 (82.4%) |
| 12 to 14 Years | 325 (79.3%) | 657 (84.5%) |
| 15 Years | 88 (62.9%) | 285 (95.0%) |
| 16 and 17 Years | 479 (82.0%) | 348 (76.0%) |
| 18 to 24 Years | 1,184 (88.7%) | 1,008 (82.5%) |
| 25 to 34 Years | 2,058 (89.9%) | 1,611 (82.6%) |
| 35 to 44 Years | 1,867 (76.4%) | 1,998 (86.5%) |
| 45 to 54 Years | 2,096 (82.6%) | 2,546 (92.7%) |
| 55 to 64 Years | 3,205 (86.6%) | 3,743 (90.6%) |
| 65 to 74 Years | 3,543 (92.8%) | 3,678 (90.1%) |
| 75 Years and over | 2,297 (89.6%) | 2,200 (84.3%) |
| Total | 19,396 (86.7%) | 19,912 (87.1%) |
Income Below Poverty Among Married-Couple Families in Calaveras County
The poverty statistics for married-couple families in Calaveras County show that 5.1% or 533 of the total 10,343 families live below the poverty line. Families with 3 or 4 children have the highest poverty rate of 21.3%, comprising of 131 families. On the other hand, families with no children have the lowest poverty rate of 4.1%, which includes 320 families.
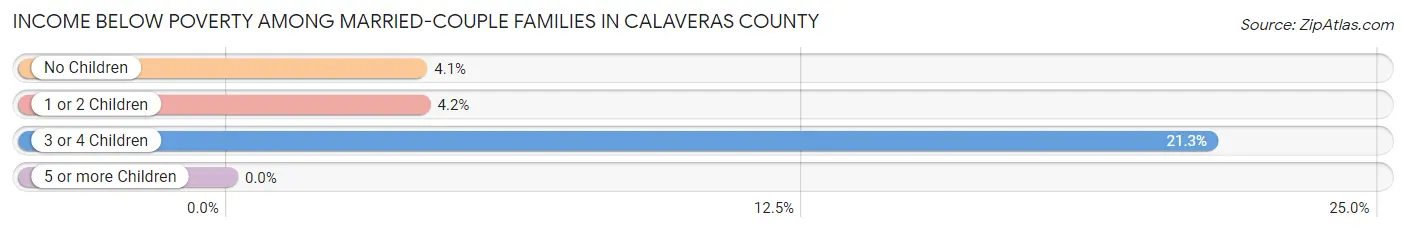
| Children | Above Poverty | Below Poverty |
| No Children | 7,452 (95.9%) | 320 (4.1%) |
| 1 or 2 Children | 1,875 (95.8%) | 82 (4.2%) |
| 3 or 4 Children | 483 (78.7%) | 131 (21.3%) |
| 5 or more Children | 0 (0.0%) | 0 (0.0%) |
| Total | 9,810 (94.9%) | 533 (5.1%) |
Income Below Poverty Among Single-Parent Households in Calaveras County
According to the poverty data in Calaveras County, 22.0% or 195 single-father households and 22.7% or 296 single-mother households are living below the poverty line. Among single-father households, those with 3 or 4 children have the highest poverty rate, with 18 households (78.3%) experiencing poverty. Likewise, among single-mother households, those with 3 or 4 children have the highest poverty rate, with 68 households (44.2%) falling below the poverty line.
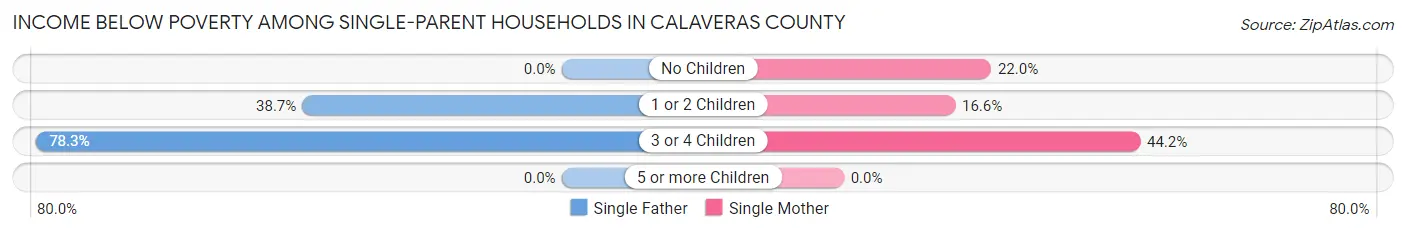
| Children | Single Father | Single Mother |
| No Children | 0 (0.0%) | 153 (22.0%) |
| 1 or 2 Children | 177 (38.7%) | 75 (16.6%) |
| 3 or 4 Children | 18 (78.3%) | 68 (44.2%) |
| 5 or more Children | 0 (0.0%) | 0 (0.0%) |
| Total | 195 (22.0%) | 296 (22.7%) |
Income Below Poverty Among Married-Couple vs Single-Parent Households in Calaveras County
The poverty data for Calaveras County shows that 533 of the married-couple family households (5.1%) and 491 of the single-parent households (22.4%) are living below the poverty level. Within the married-couple family households, those with 3 or 4 children have the highest poverty rate, with 131 households (21.3%) falling below the poverty line. Among the single-parent households, those with 3 or 4 children have the highest poverty rate, with 86 household (48.6%) living below poverty.
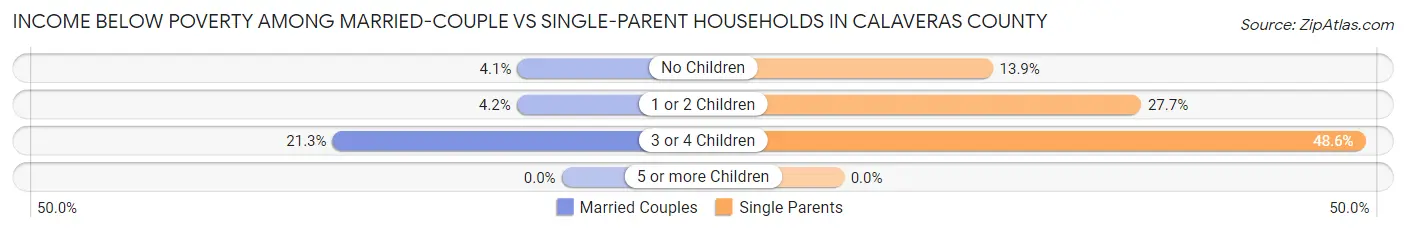
| Children | Married-Couple Families | Single-Parent Households |
| No Children | 320 (4.1%) | 153 (13.9%) |
| 1 or 2 Children | 82 (4.2%) | 252 (27.7%) |
| 3 or 4 Children | 131 (21.3%) | 86 (48.6%) |
| 5 or more Children | 0 (0.0%) | 0 (0.0%) |
| Total | 533 (5.1%) | 491 (22.4%) |
Race in Calaveras County
The most populous races in Calaveras County are White / Caucasian (37,974 | 83.1%), Hispanic or Latino (6,197 | 13.6%), and Two or more Races (4,196 | 9.2%).
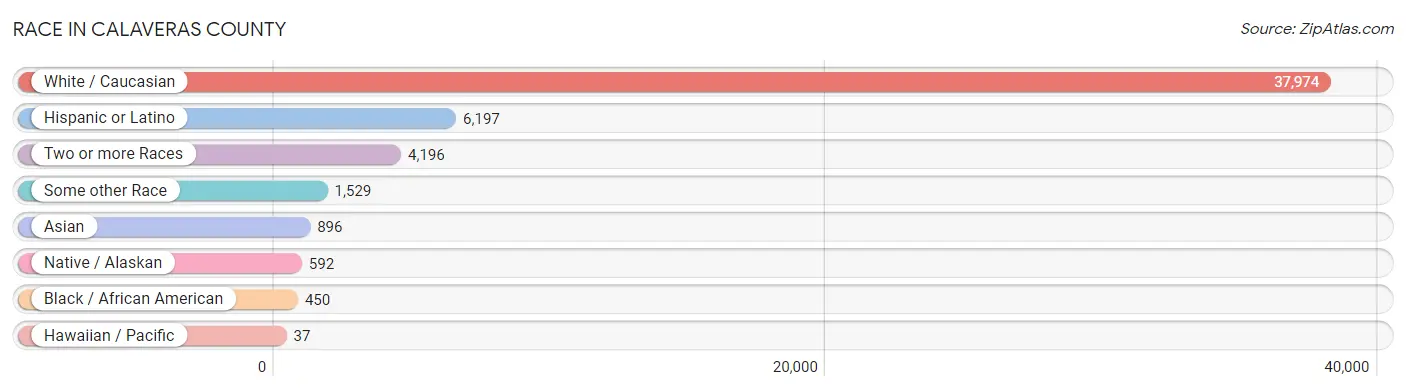
| Race | # Population | % Population |
| Asian | 896 | 2.0% |
| Black / African American | 450 | 1.0% |
| Hawaiian / Pacific | 37 | 0.1% |
| Hispanic or Latino | 6,197 | 13.6% |
| Native / Alaskan | 592 | 1.3% |
| White / Caucasian | 37,974 | 83.1% |
| Two or more Races | 4,196 | 9.2% |
| Some other Race | 1,529 | 3.4% |
| Total | 45,674 | 100.0% |
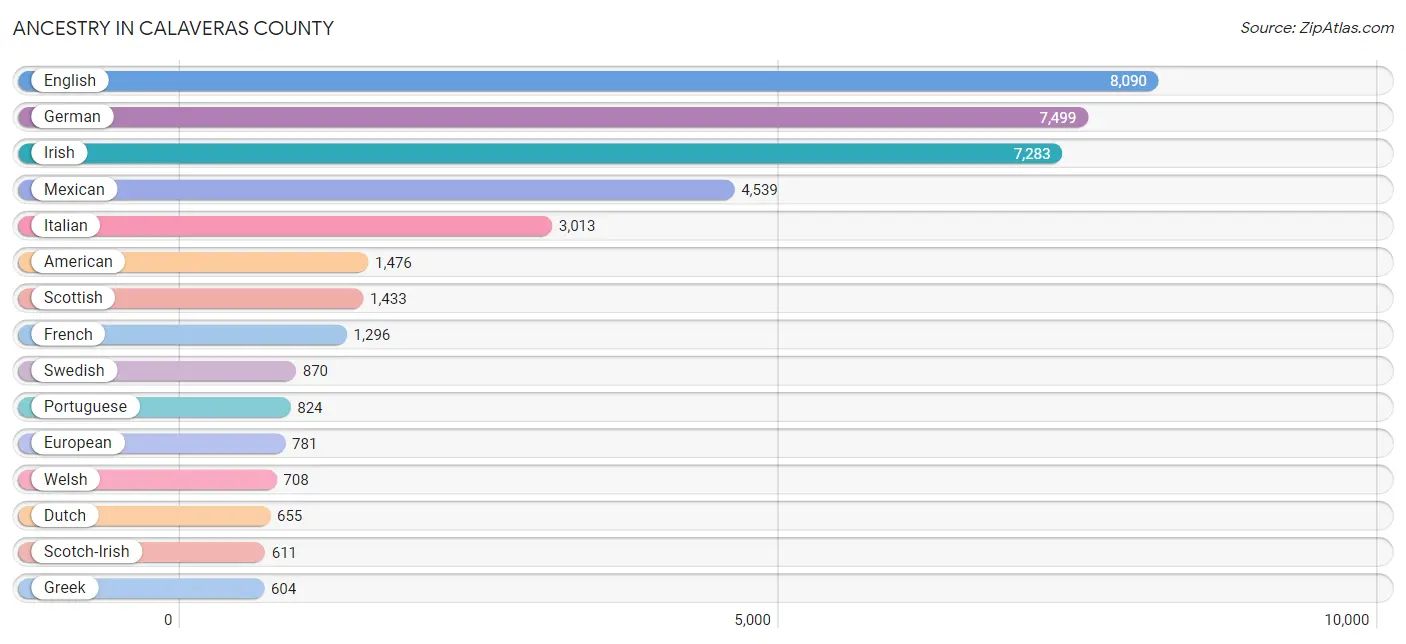
Ancestry in Calaveras County
The most populous ancestries reported in Calaveras County are English (8,090 | 17.7%), German (7,499 | 16.4%), Irish (7,283 | 16.0%), Mexican (4,539 | 9.9%), and Italian (3,013 | 6.6%), together accounting for 66.6% of all Calaveras County residents.
| Ancestry | # Population | % Population |
| African | 110 | 0.2% |
| American | 1,476 | 3.2% |
| Apache | 33 | 0.1% |
| Arab | 275 | 0.6% |
| Argentinean | 17 | 0.0% |
| Australian | 13 | 0.0% |
| Austrian | 45 | 0.1% |
| Basque | 95 | 0.2% |
| Belgian | 42 | 0.1% |
| Bhutanese | 197 | 0.4% |
| Blackfeet | 3 | 0.0% |
| British | 253 | 0.5% |
| Burmese | 148 | 0.3% |
| Cajun | 19 | 0.0% |
| Canadian | 93 | 0.2% |
| Celtic | 18 | 0.0% |
| Central American | 120 | 0.3% |
| Cherokee | 277 | 0.6% |
| Chippewa | 27 | 0.1% |
| Choctaw | 97 | 0.2% |
| Colombian | 29 | 0.1% |
| Costa Rican | 29 | 0.1% |
| Croatian | 75 | 0.2% |
| Cuban | 29 | 0.1% |
| Czech | 12 | 0.0% |
| Danish | 291 | 0.6% |
| Dutch | 655 | 1.4% |
| Eastern European | 120 | 0.3% |
| English | 8,090 | 17.7% |
| European | 781 | 1.7% |
| Filipino | 148 | 0.3% |
| Finnish | 60 | 0.1% |
| French | 1,296 | 2.8% |
| French American Indian | 5 | 0.0% |
| French Canadian | 125 | 0.3% |
| German | 7,499 | 16.4% |
| German Russian | 17 | 0.0% |
| Greek | 604 | 1.3% |
| Guatemalan | 5 | 0.0% |
| Hopi | 12 | 0.0% |
| Hungarian | 116 | 0.3% |
| Indian (Asian) | 275 | 0.6% |
| Iranian | 8 | 0.0% |
| Irish | 7,283 | 16.0% |
| Israeli | 23 | 0.1% |
| Italian | 3,013 | 6.6% |
| Korean | 572 | 1.3% |
| Lebanese | 201 | 0.4% |
| Lithuanian | 112 | 0.3% |
| Malaysian | 125 | 0.3% |
| Maltese | 8 | 0.0% |
| Mexican | 4,539 | 9.9% |
| Mexican American Indian | 68 | 0.2% |
| Moroccan | 8 | 0.0% |
| Native Hawaiian | 256 | 0.6% |
| Northern European | 197 | 0.4% |
| Norwegian | 515 | 1.1% |
| Pennsylvania German | 10 | 0.0% |
| Polish | 497 | 1.1% |
| Portuguese | 824 | 1.8% |
| Puerto Rican | 328 | 0.7% |
| Romanian | 27 | 0.1% |
| Russian | 160 | 0.4% |
| Salvadoran | 86 | 0.2% |
| Samoan | 2 | 0.0% |
| Scandinavian | 187 | 0.4% |
| Scotch-Irish | 611 | 1.3% |
| Scottish | 1,433 | 3.1% |
| Serbian | 63 | 0.1% |
| Sioux | 97 | 0.2% |
| Slavic | 62 | 0.1% |
| Slovene | 37 | 0.1% |
| South American | 46 | 0.1% |
| Soviet Union | 7 | 0.0% |
| Spaniard | 517 | 1.1% |
| Spanish | 437 | 1.0% |
| Spanish American Indian | 19 | 0.0% |
| Sri Lankan | 32 | 0.1% |
| Subsaharan African | 110 | 0.2% |
| Swedish | 870 | 1.9% |
| Swiss | 55 | 0.1% |
| Syrian | 35 | 0.1% |
| Thai | 2 | 0.0% |
| Tongan | 8 | 0.0% |
| Turkish | 42 | 0.1% |
| Ukrainian | 19 | 0.0% |
| Welsh | 708 | 1.5% |
| Yaqui | 87 | 0.2% |
| Yugoslavian | 42 | 0.1% | View All 89 Rows |
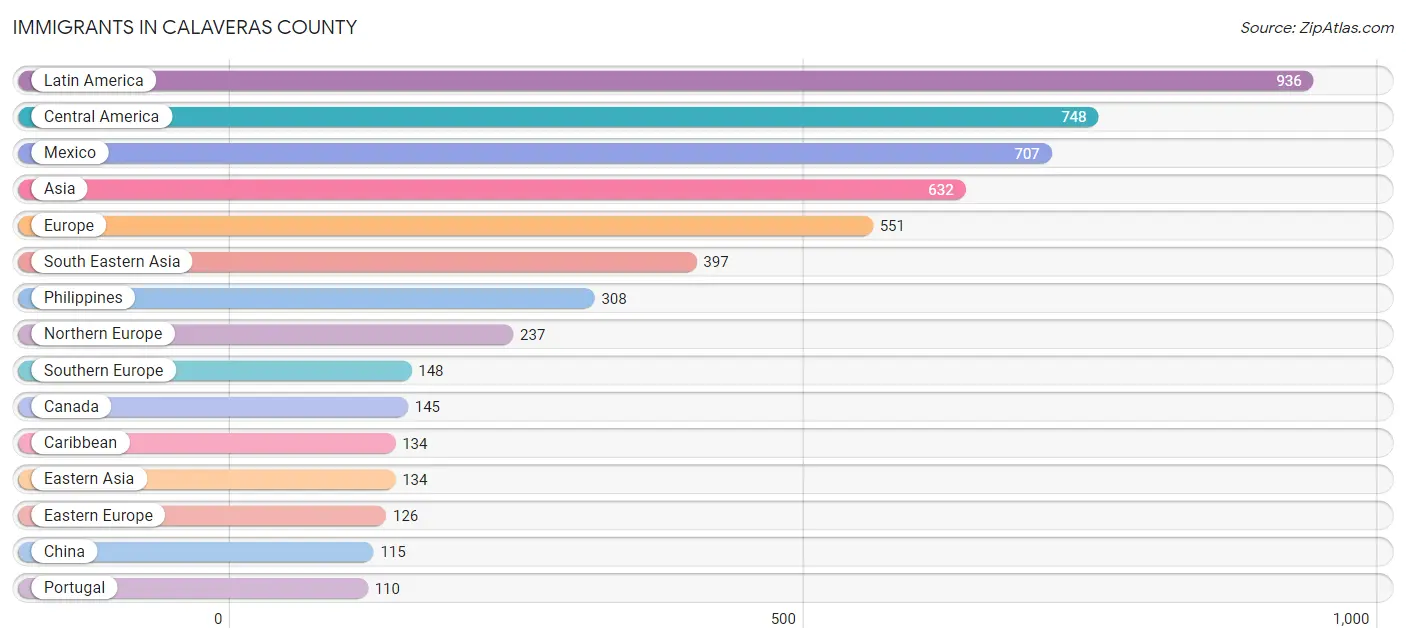
Immigrants in Calaveras County
The most numerous immigrant groups reported in Calaveras County came from Latin America (936 | 2.1%), Central America (748 | 1.6%), Mexico (707 | 1.5%), Asia (632 | 1.4%), and Europe (551 | 1.2%), together accounting for 7.8% of all Calaveras County residents.
| Immigration Origin | # Population | % Population |
| Africa | 29 | 0.1% |
| Asia | 632 | 1.4% |
| Australia | 70 | 0.2% |
| Barbados | 103 | 0.2% |
| Bosnia and Herzegovina | 8 | 0.0% |
| Canada | 145 | 0.3% |
| Caribbean | 134 | 0.3% |
| Central America | 748 | 1.6% |
| Chile | 25 | 0.1% |
| China | 115 | 0.3% |
| Colombia | 29 | 0.1% |
| Croatia | 41 | 0.1% |
| Eastern Asia | 134 | 0.3% |
| Eastern Europe | 126 | 0.3% |
| El Salvador | 36 | 0.1% |
| England | 102 | 0.2% |
| Europe | 551 | 1.2% |
| Germany | 39 | 0.1% |
| Greece | 8 | 0.0% |
| Guatemala | 5 | 0.0% |
| Hong Kong | 14 | 0.0% |
| Indonesia | 6 | 0.0% |
| Iran | 15 | 0.0% |
| Ireland | 57 | 0.1% |
| Israel | 44 | 0.1% |
| Italy | 22 | 0.1% |
| Korea | 19 | 0.0% |
| Laos | 37 | 0.1% |
| Latin America | 936 | 2.1% |
| Malaysia | 14 | 0.0% |
| Mexico | 707 | 1.5% |
| Morocco | 8 | 0.0% |
| Northern Africa | 8 | 0.0% |
| Northern Europe | 237 | 0.5% |
| Oceania | 86 | 0.2% |
| Philippines | 308 | 0.7% |
| Poland | 22 | 0.1% |
| Portugal | 110 | 0.2% |
| Romania | 16 | 0.0% |
| Russia | 8 | 0.0% |
| Serbia | 9 | 0.0% |
| South Africa | 21 | 0.1% |
| South America | 54 | 0.1% |
| South Central Asia | 15 | 0.0% |
| South Eastern Asia | 397 | 0.9% |
| Southern Europe | 148 | 0.3% |
| Switzerland | 1 | 0.0% |
| Taiwan | 20 | 0.0% |
| Turkey | 42 | 0.1% |
| Ukraine | 22 | 0.1% |
| Vietnam | 32 | 0.1% |
| Western Asia | 86 | 0.2% |
| Western Europe | 40 | 0.1% | View All 53 Rows |
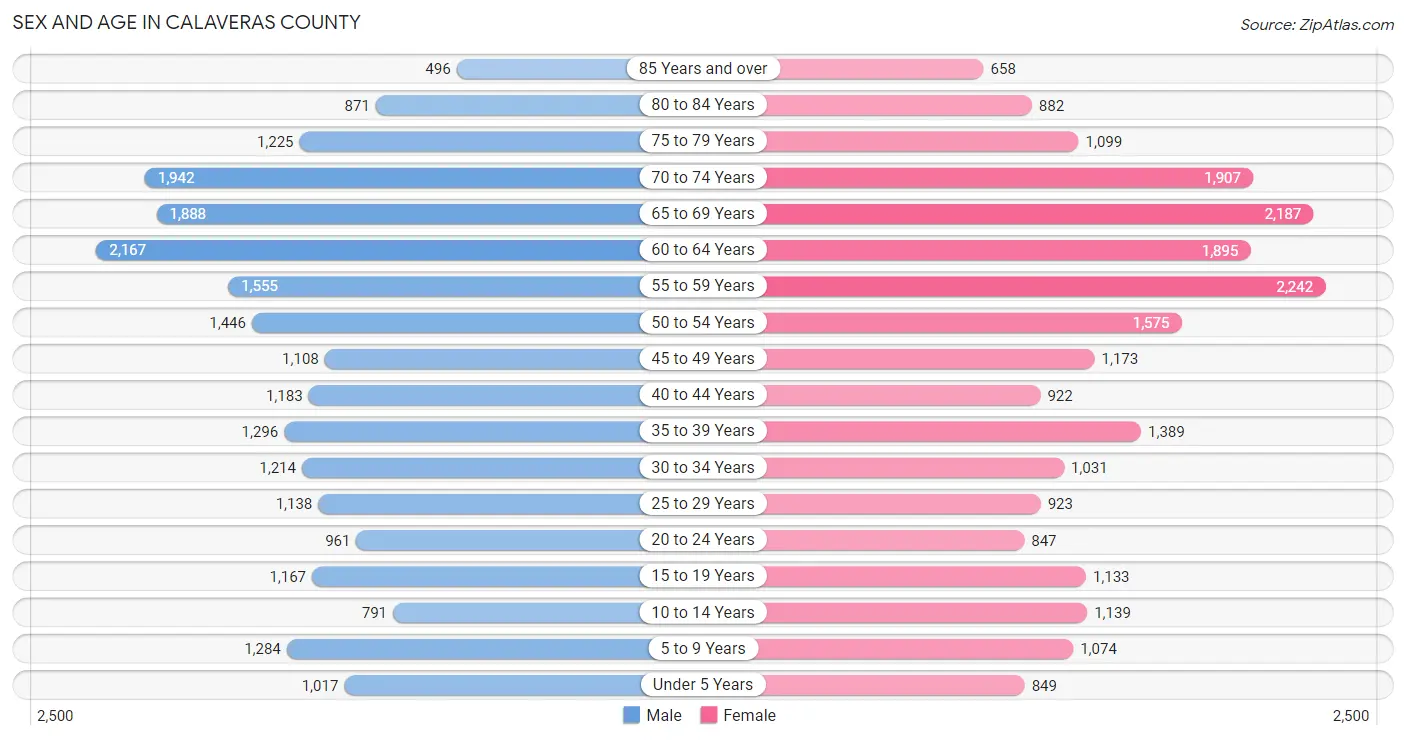
Sex and Age in Calaveras County
Sex and Age in Calaveras County
The most populous age groups in Calaveras County are 60 to 64 Years (2,167 | 9.5%) for men and 55 to 59 Years (2,242 | 9.8%) for women.
| Age Bracket | Male | Female |
| Under 5 Years | 1,017 (4.5%) | 849 (3.7%) |
| 5 to 9 Years | 1,284 (5.6%) | 1,074 (4.7%) |
| 10 to 14 Years | 791 (3.5%) | 1,139 (5.0%) |
| 15 to 19 Years | 1,167 (5.1%) | 1,133 (4.9%) |
| 20 to 24 Years | 961 (4.2%) | 847 (3.7%) |
| 25 to 29 Years | 1,138 (5.0%) | 923 (4.0%) |
| 30 to 34 Years | 1,214 (5.3%) | 1,031 (4.5%) |
| 35 to 39 Years | 1,296 (5.7%) | 1,389 (6.1%) |
| 40 to 44 Years | 1,183 (5.2%) | 922 (4.0%) |
| 45 to 49 Years | 1,108 (4.9%) | 1,173 (5.1%) |
| 50 to 54 Years | 1,446 (6.4%) | 1,575 (6.9%) |
| 55 to 59 Years | 1,555 (6.8%) | 2,242 (9.8%) |
| 60 to 64 Years | 2,167 (9.5%) | 1,895 (8.3%) |
| 65 to 69 Years | 1,888 (8.3%) | 2,187 (9.5%) |
| 70 to 74 Years | 1,942 (8.5%) | 1,907 (8.3%) |
| 75 to 79 Years | 1,225 (5.4%) | 1,099 (4.8%) |
| 80 to 84 Years | 871 (3.8%) | 882 (3.8%) |
| 85 Years and over | 496 (2.2%) | 658 (2.9%) |
| Total | 22,749 (100.0%) | 22,925 (100.0%) |
Families and Households in Calaveras County
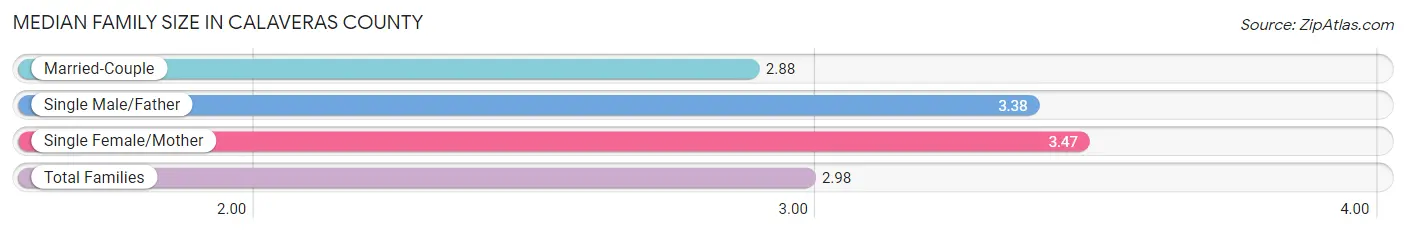
Median Family Size in Calaveras County
The median family size in Calaveras County is 2.98 persons per family, with single female/mother families (1,303 | 10.4%) accounting for the largest median family size of 3.47 persons per family. On the other hand, married-couple families (10,343 | 82.5%) represent the smallest median family size with 2.88 persons per family.
| Family Type | # Families | Family Size |
| Married-Couple | 10,343 (82.5%) | 2.88 |
| Single Male/Father | 887 (7.1%) | 3.38 |
| Single Female/Mother | 1,303 (10.4%) | 3.47 |
| Total Families | 12,533 (100.0%) | 2.98 |
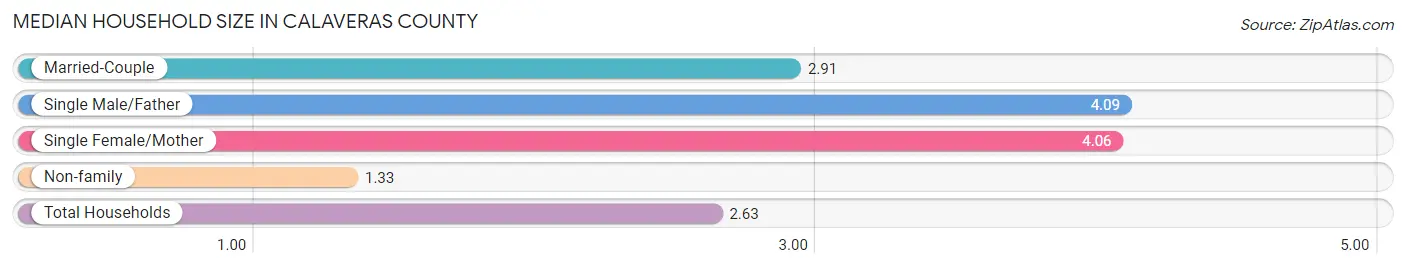
Median Household Size in Calaveras County
The median household size in Calaveras County is 2.63 persons per household, with single male/father households (887 | 5.2%) accounting for the largest median household size of 4.09 persons per household. non-family households (4,665 | 27.1%) represent the smallest median household size with 1.33 persons per household.
| Household Type | # Households | Household Size |
| Married-Couple | 10,343 (60.1%) | 2.91 |
| Single Male/Father | 887 (5.2%) | 4.09 |
| Single Female/Mother | 1,303 (7.6%) | 4.06 |
| Non-family | 4,665 (27.1%) | 1.33 |
| Total Households | 17,198 (100.0%) | 2.63 |
Household Size by Marriage Status in Calaveras County
Out of a total of 17,198 households in Calaveras County, 12,533 (72.9%) are family households, while 4,665 (27.1%) are nonfamily households. The most numerous type of family households are 2-person households, comprising 7,102, and the most common type of nonfamily households are 1-person households, comprising 3,883.
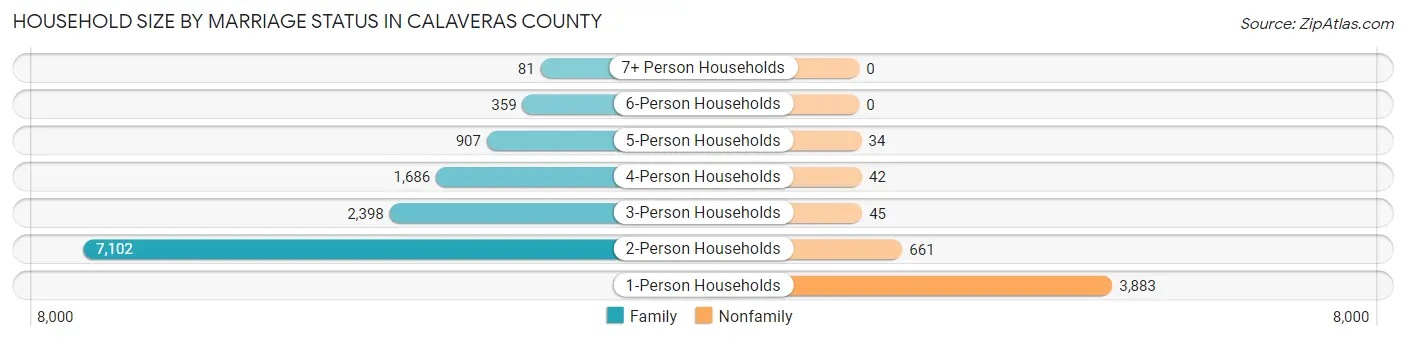
| Household Size | Family Households | Nonfamily Households |
| 1-Person Households | - | 3,883 (22.6%) |
| 2-Person Households | 7,102 (41.3%) | 661 (3.8%) |
| 3-Person Households | 2,398 (13.9%) | 45 (0.3%) |
| 4-Person Households | 1,686 (9.8%) | 42 (0.2%) |
| 5-Person Households | 907 (5.3%) | 34 (0.2%) |
| 6-Person Households | 359 (2.1%) | 0 (0.0%) |
| 7+ Person Households | 81 (0.5%) | 0 (0.0%) |
| Total | 12,533 (72.9%) | 4,665 (27.1%) |
Female Fertility in Calaveras County
Fertility by Age in Calaveras County
Average fertility rate in Calaveras County is 82.0 births per 1,000 women. Women in the age bracket of 20 to 34 years have the highest fertility rate with 135.0 births per 1,000 women. Women in the age bracket of 20 to 34 years acount for 61.0% of all women with births.
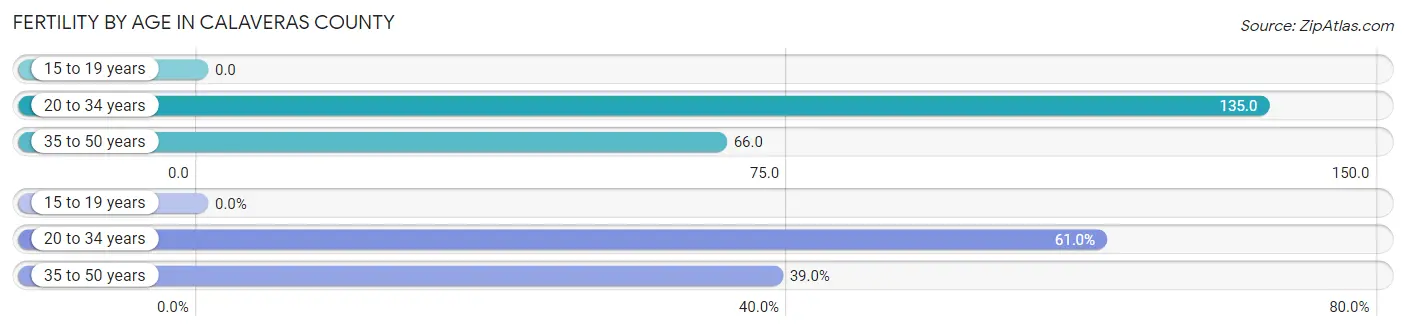
| Age Bracket | Women with Births | Births / 1,000 Women |
| 15 to 19 years | 0 (0.0%) | 0.0 |
| 20 to 34 years | 377 (61.0%) | 135.0 |
| 35 to 50 years | 241 (39.0%) | 66.0 |
| Total | 618 (100.0%) | 82.0 |
Fertility by Age by Marriage Status in Calaveras County
76.4% of women with births (618) in Calaveras County are married. The highest percentage of unmarried women with births falls into 35 to 50 years age bracket with 34.0% of them unmarried at the time of birth, while the lowest percentage of unmarried women with births belong to 20 to 34 years age bracket with 17.0% of them unmarried.
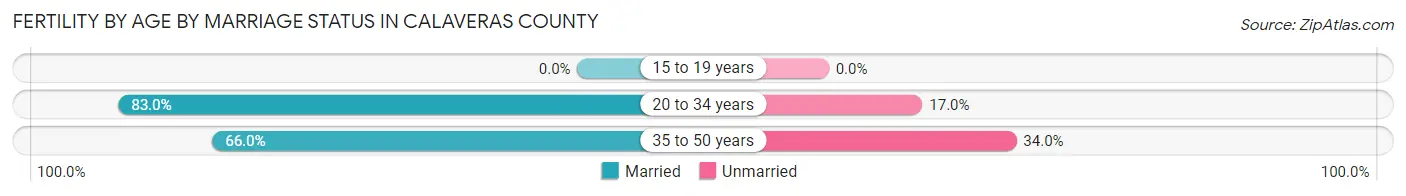
| Age Bracket | Married | Unmarried |
| 15 to 19 years | 0 (0.0%) | 0 (0.0%) |
| 20 to 34 years | 313 (83.0%) | 64 (17.0%) |
| 35 to 50 years | 159 (66.0%) | 82 (34.0%) |
| Total | 472 (76.4%) | 146 (23.6%) |
Fertility by Education in Calaveras County
Average fertility rate in Calaveras County is 82.0 births per 1,000 women. Women with the education attainment of bachelor's degree have the highest fertility rate of 148.0 births per 1,000 women, while women with the education attainment of high school diploma have the lowest fertility at 34.0 births per 1,000 women. Women with the education attainment of college or associate's degree represent 46.1% of all women with births.
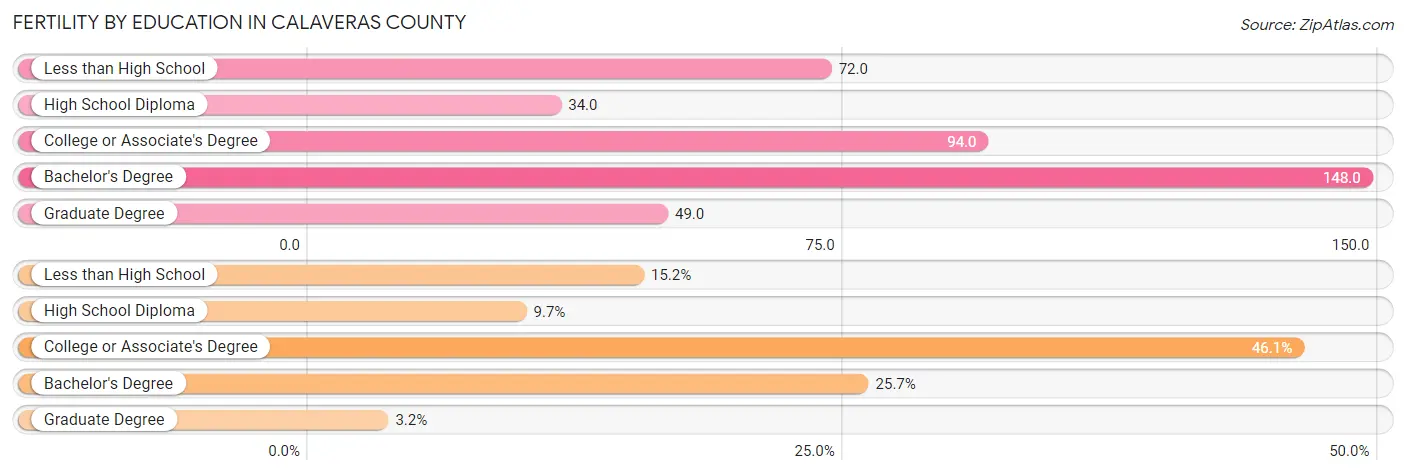
| Educational Attainment | Women with Births | Births / 1,000 Women |
| Less than High School | 94 (15.2%) | 72.0 |
| High School Diploma | 60 (9.7%) | 34.0 |
| College or Associate's Degree | 285 (46.1%) | 94.0 |
| Bachelor's Degree | 159 (25.7%) | 148.0 |
| Graduate Degree | 20 (3.2%) | 49.0 |
| Total | 618 (100.0%) | 82.0 |
Fertility by Education by Marriage Status in Calaveras County
23.6% of women with births in Calaveras County are unmarried. Women with the educational attainment of bachelor's degree are most likely to be married with 100.0% of them married at childbirth, while women with the educational attainment of less than high school are least likely to be married with 62.8% of them unmarried at childbirth.
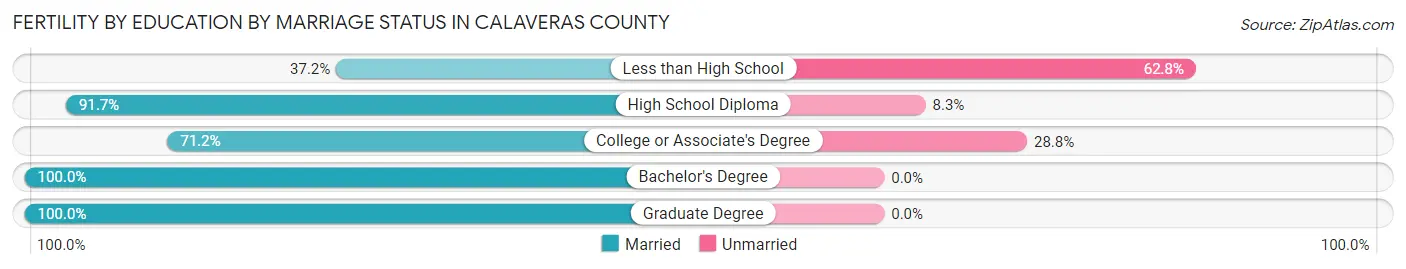
| Educational Attainment | Married | Unmarried |
| Less than High School | 35 (37.2%) | 59 (62.8%) |
| High School Diploma | 55 (91.7%) | 5 (8.3%) |
| College or Associate's Degree | 203 (71.2%) | 82 (28.8%) |
| Bachelor's Degree | 159 (100.0%) | 0 (0.0%) |
| Graduate Degree | 20 (100.0%) | 0 (0.0%) |
| Total | 472 (76.4%) | 146 (23.6%) |
Employment Characteristics in Calaveras County
Employment by Class of Employer in Calaveras County
Among the 17,014 employed individuals in Calaveras County, private company employees (9,722 | 57.1%), local government employees (2,366 | 13.9%), and self-employed (not incorporated) (1,891 | 11.1%) make up the most common classes of employment.
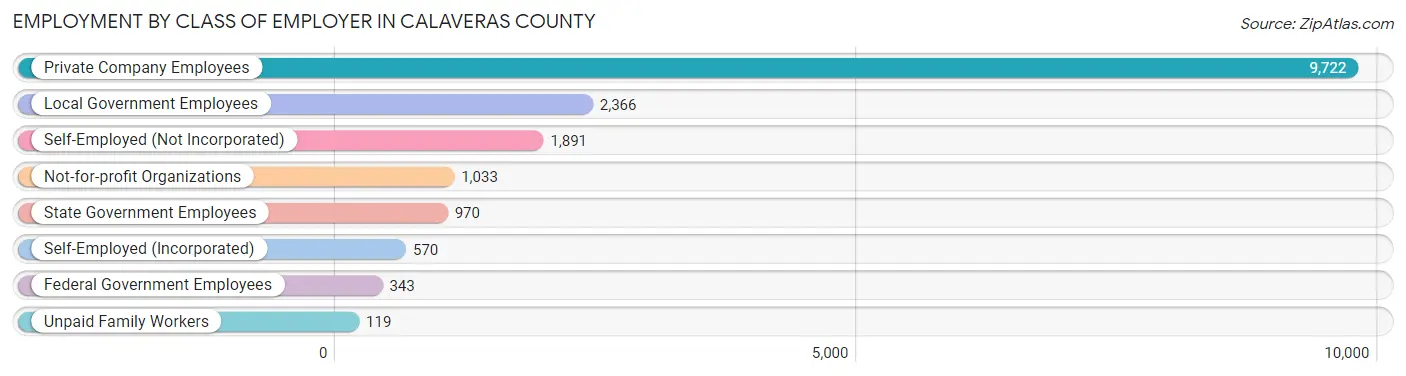
| Employer Class | # Employees | % Employees |
| Private Company Employees | 9,722 | 57.1% |
| Self-Employed (Incorporated) | 570 | 3.4% |
| Self-Employed (Not Incorporated) | 1,891 | 11.1% |
| Not-for-profit Organizations | 1,033 | 6.1% |
| Local Government Employees | 2,366 | 13.9% |
| State Government Employees | 970 | 5.7% |
| Federal Government Employees | 343 | 2.0% |
| Unpaid Family Workers | 119 | 0.7% |
| Total | 17,014 | 100.0% |
Employment Status by Age in Calaveras County
According to the labor force statistics for Calaveras County, out of the total population over 16 years of age (39,074), 47.4% or 18,521 individuals are in the labor force, with 6.2% or 1,148 of them unemployed. The age group with the highest labor force participation rate is 30 to 34 years, with 78.0% or 1,751 individuals in the labor force. Within the labor force, the 25 to 29 years age range has the highest percentage of unemployed individuals, with 15.4% or 219 of them being unemployed.
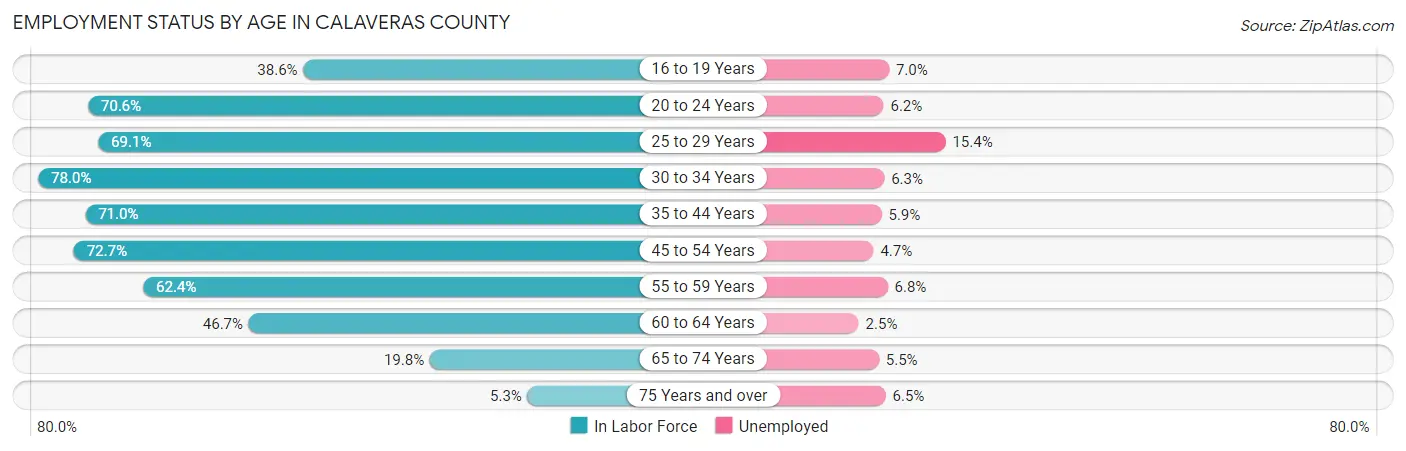
| Age Bracket | In Labor Force | Unemployed |
| 16 to 19 Years | 716 (38.6%) | 50 (7.0%) |
| 20 to 24 Years | 1,276 (70.6%) | 79 (6.2%) |
| 25 to 29 Years | 1,424 (69.1%) | 219 (15.4%) |
| 30 to 34 Years | 1,751 (78.0%) | 110 (6.3%) |
| 35 to 44 Years | 3,401 (71.0%) | 201 (5.9%) |
| 45 to 54 Years | 3,855 (72.7%) | 181 (4.7%) |
| 55 to 59 Years | 2,369 (62.4%) | 161 (6.8%) |
| 60 to 64 Years | 1,897 (46.7%) | 47 (2.5%) |
| 65 to 74 Years | 1,569 (19.8%) | 86 (5.5%) |
| 75 Years and over | 277 (5.3%) | 18 (6.5%) |
| Total | 18,521 (47.4%) | 1,148 (6.2%) |
Employment Status by Educational Attainment in Calaveras County
According to labor force statistics for Calaveras County, 66.0% of individuals (14,690) out of the total population between 25 and 64 years of age (22,257) are in the labor force, with 6.2% or 911 of them being unemployed. The group with the highest labor force participation rate are those with the educational attainment of bachelor's degree or higher, with 77.1% or 3,469 individuals in the labor force. Within the labor force, individuals with bachelor's degree or higher education have the highest percentage of unemployment, with 7.6% or 264 of them being unemployed.
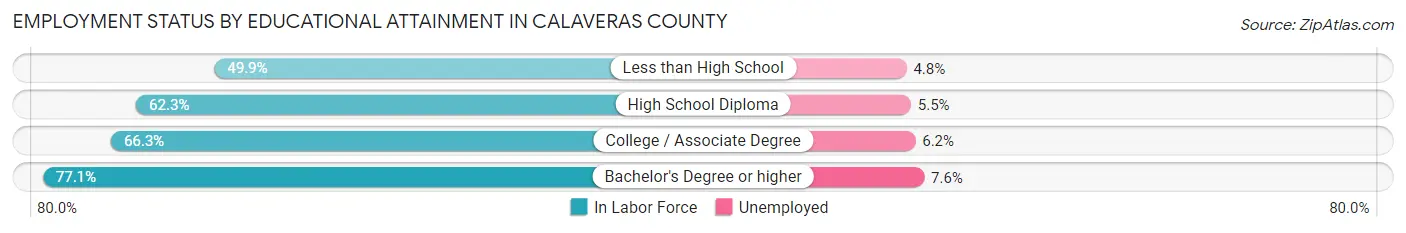
| Educational Attainment | In Labor Force | Unemployed |
| Less than High School | 786 (49.9%) | 76 (4.8%) |
| High School Diploma | 4,600 (62.3%) | 406 (5.5%) |
| College / Associate Degree | 5,834 (66.3%) | 546 (6.2%) |
| Bachelor's Degree or higher | 3,469 (77.1%) | 342 (7.6%) |
| Total | 14,690 (66.0%) | 1,380 (6.2%) |
Employment Occupations by Sex in Calaveras County
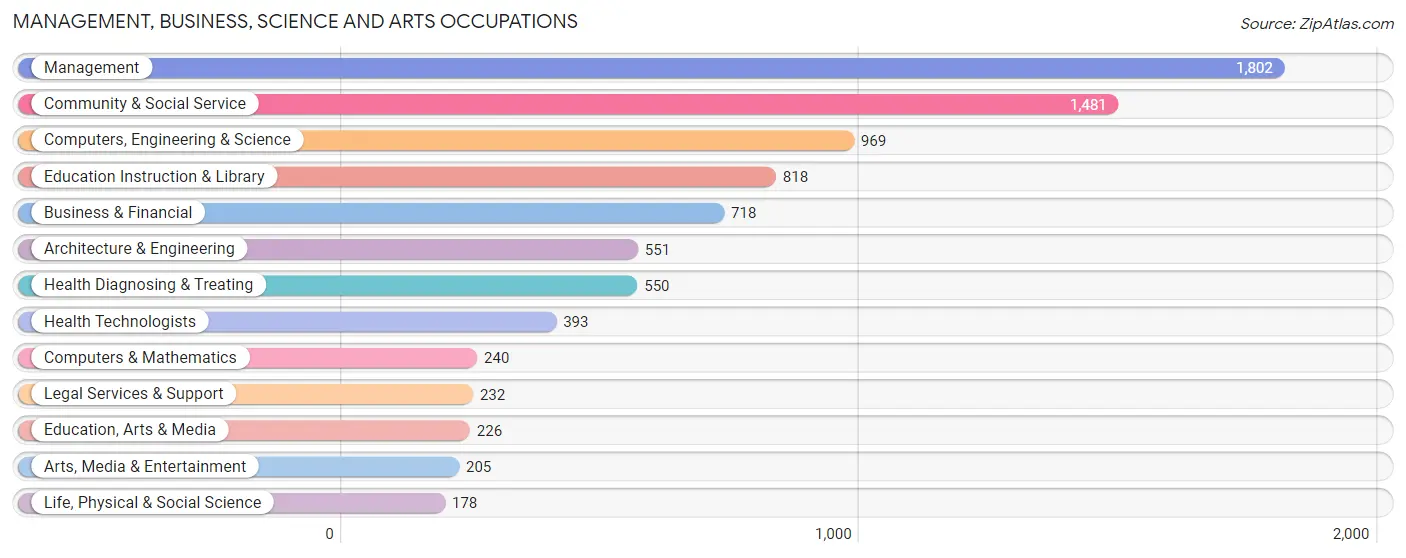
Management, Business, Science and Arts Occupations
The most common Management, Business, Science and Arts occupations in Calaveras County are Management (1,802 | 10.4%), Community & Social Service (1,481 | 8.5%), Computers, Engineering & Science (969 | 5.6%), Education Instruction & Library (818 | 4.7%), and Business & Financial (718 | 4.1%).
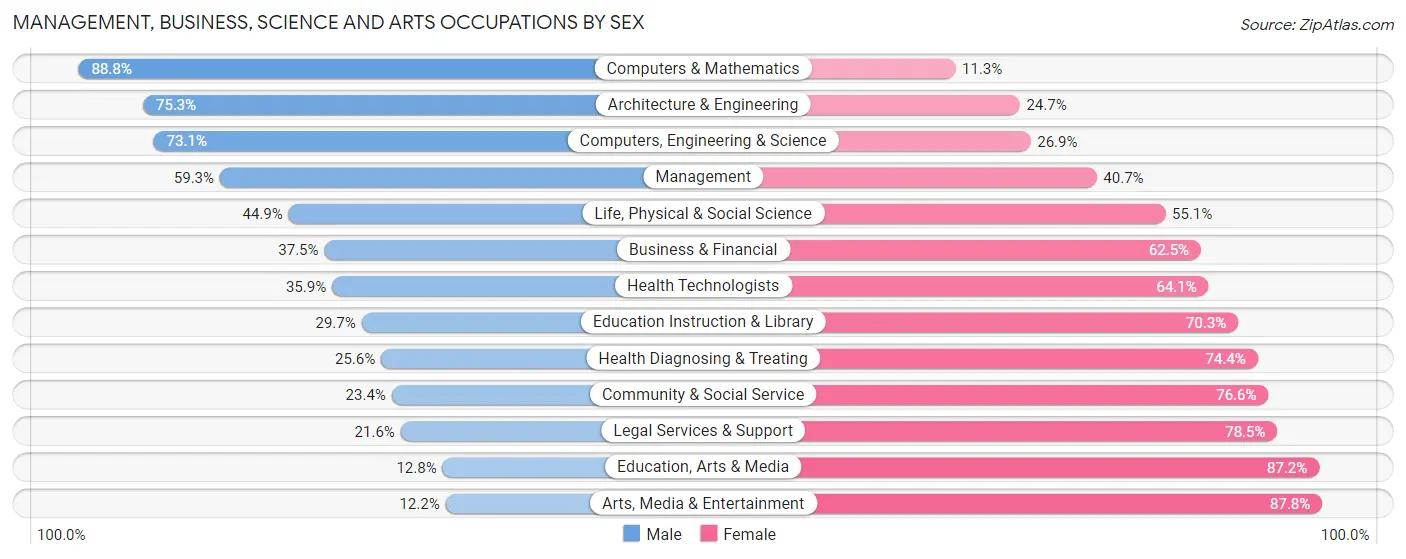
Management, Business, Science and Arts Occupations by Sex
Within the Management, Business, Science and Arts occupations in Calaveras County, the most male-oriented occupations are Computers & Mathematics (88.7%), Architecture & Engineering (75.3%), and Computers, Engineering & Science (73.1%), while the most female-oriented occupations are Arts, Media & Entertainment (87.8%), Education, Arts & Media (87.2%), and Legal Services & Support (78.4%).
| Occupation | Male | Female |
| Management | 1,068 (59.3%) | 734 (40.7%) |
| Business & Financial | 269 (37.5%) | 449 (62.5%) |
| Computers, Engineering & Science | 708 (73.1%) | 261 (26.9%) |
| Computers & Mathematics | 213 (88.7%) | 27 (11.3%) |
| Architecture & Engineering | 415 (75.3%) | 136 (24.7%) |
| Life, Physical & Social Science | 80 (44.9%) | 98 (55.1%) |
| Community & Social Service | 347 (23.4%) | 1,134 (76.6%) |
| Education, Arts & Media | 29 (12.8%) | 197 (87.2%) |
| Legal Services & Support | 50 (21.5%) | 182 (78.4%) |
| Education Instruction & Library | 243 (29.7%) | 575 (70.3%) |
| Arts, Media & Entertainment | 25 (12.2%) | 180 (87.8%) |
| Health Diagnosing & Treating | 141 (25.6%) | 409 (74.4%) |
| Health Technologists | 141 (35.9%) | 252 (64.1%) |
| Total (Category) | 2,533 (45.9%) | 2,987 (54.1%) |
| Total (Overall) | 8,850 (51.0%) | 8,512 (49.0%) |
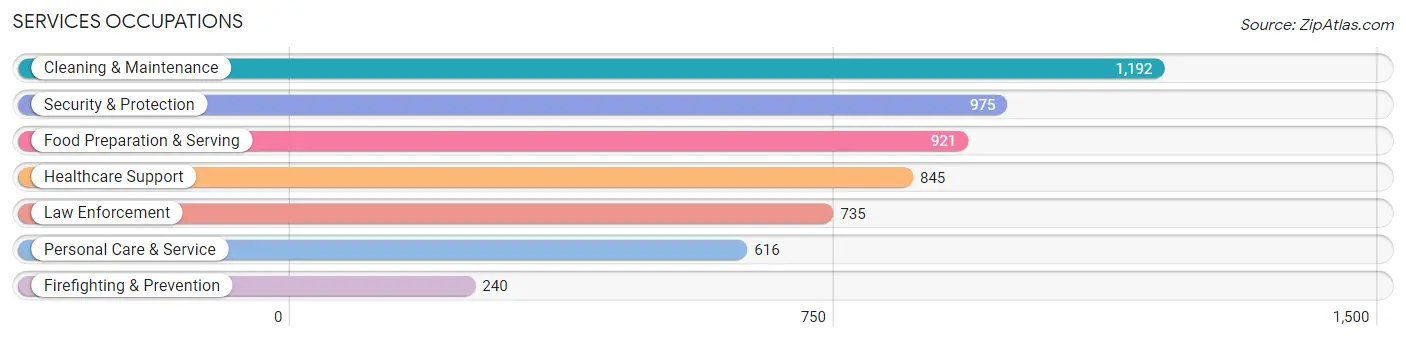
Services Occupations
The most common Services occupations in Calaveras County are Cleaning & Maintenance (1,192 | 6.9%), Security & Protection (975 | 5.6%), Food Preparation & Serving (921 | 5.3%), Healthcare Support (845 | 4.9%), and Law Enforcement (735 | 4.2%).
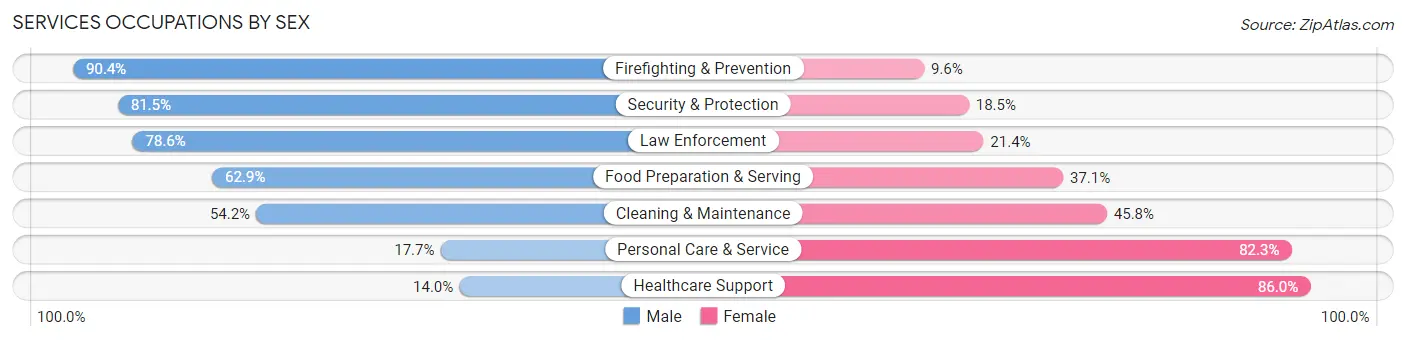
Services Occupations by Sex
Within the Services occupations in Calaveras County, the most male-oriented occupations are Firefighting & Prevention (90.4%), Security & Protection (81.5%), and Law Enforcement (78.6%), while the most female-oriented occupations are Healthcare Support (86.0%), Personal Care & Service (82.3%), and Cleaning & Maintenance (45.8%).
| Occupation | Male | Female |
| Healthcare Support | 118 (14.0%) | 727 (86.0%) |
| Security & Protection | 795 (81.5%) | 180 (18.5%) |
| Firefighting & Prevention | 217 (90.4%) | 23 (9.6%) |
| Law Enforcement | 578 (78.6%) | 157 (21.4%) |
| Food Preparation & Serving | 579 (62.9%) | 342 (37.1%) |
| Cleaning & Maintenance | 646 (54.2%) | 546 (45.8%) |
| Personal Care & Service | 109 (17.7%) | 507 (82.3%) |
| Total (Category) | 2,247 (49.4%) | 2,302 (50.6%) |
| Total (Overall) | 8,850 (51.0%) | 8,512 (49.0%) |
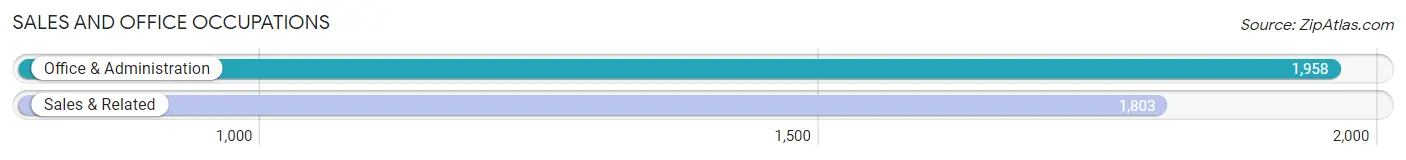
Sales and Office Occupations
The most common Sales and Office occupations in Calaveras County are Office & Administration (1,958 | 11.3%), and Sales & Related (1,803 | 10.4%).
Sales and Office Occupations by Sex
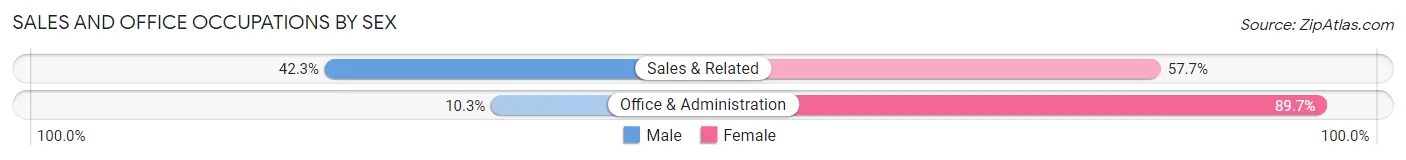
| Occupation | Male | Female |
| Sales & Related | 762 (42.3%) | 1,041 (57.7%) |
| Office & Administration | 201 (10.3%) | 1,757 (89.7%) |
| Total (Category) | 963 (25.6%) | 2,798 (74.4%) |
| Total (Overall) | 8,850 (51.0%) | 8,512 (49.0%) |
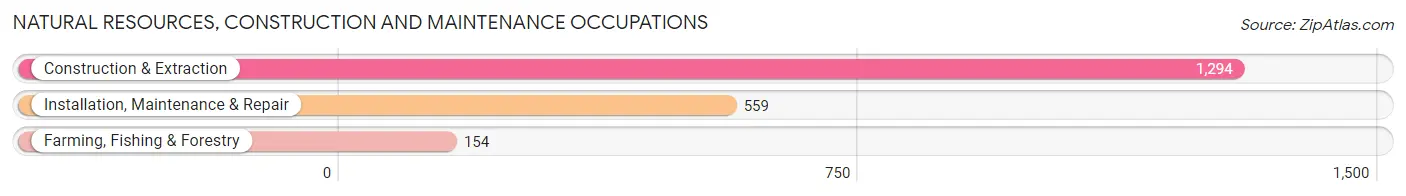
Natural Resources, Construction and Maintenance Occupations
The most common Natural Resources, Construction and Maintenance occupations in Calaveras County are Construction & Extraction (1,294 | 7.4%), Installation, Maintenance & Repair (559 | 3.2%), and Farming, Fishing & Forestry (154 | 0.9%).
Natural Resources, Construction and Maintenance Occupations by Sex
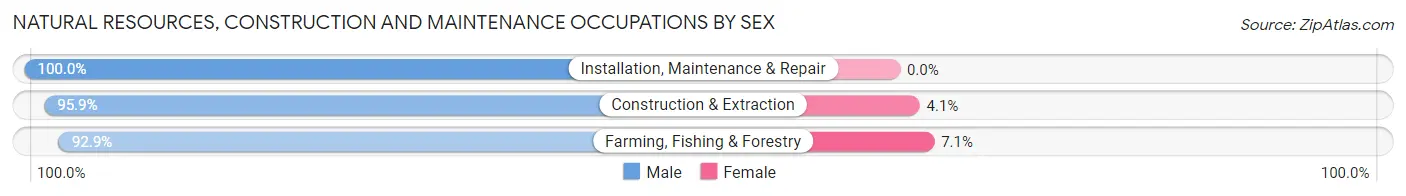
| Occupation | Male | Female |
| Farming, Fishing & Forestry | 143 (92.9%) | 11 (7.1%) |
| Construction & Extraction | 1,241 (95.9%) | 53 (4.1%) |
| Installation, Maintenance & Repair | 559 (100.0%) | 0 (0.0%) |
| Total (Category) | 1,943 (96.8%) | 64 (3.2%) |
| Total (Overall) | 8,850 (51.0%) | 8,512 (49.0%) |
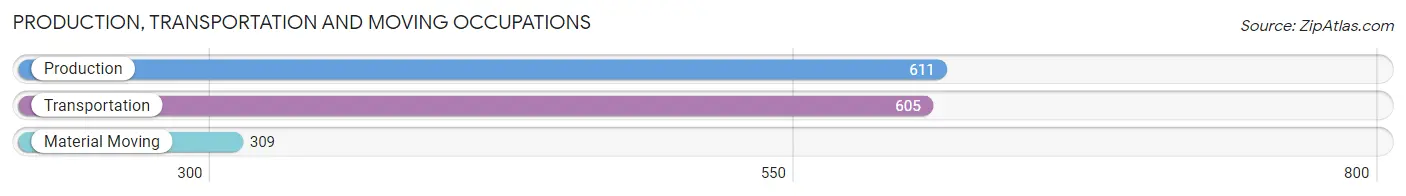
Production, Transportation and Moving Occupations
The most common Production, Transportation and Moving occupations in Calaveras County are Production (611 | 3.5%), Transportation (605 | 3.5%), and Material Moving (309 | 1.8%).
Production, Transportation and Moving Occupations by Sex
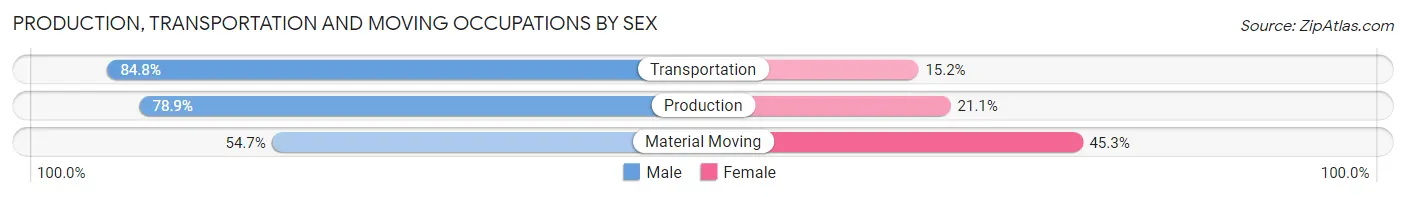
| Occupation | Male | Female |
| Production | 482 (78.9%) | 129 (21.1%) |
| Transportation | 513 (84.8%) | 92 (15.2%) |
| Material Moving | 169 (54.7%) | 140 (45.3%) |
| Total (Category) | 1,164 (76.3%) | 361 (23.7%) |
| Total (Overall) | 8,850 (51.0%) | 8,512 (49.0%) |
Employment Industries by Sex in Calaveras County
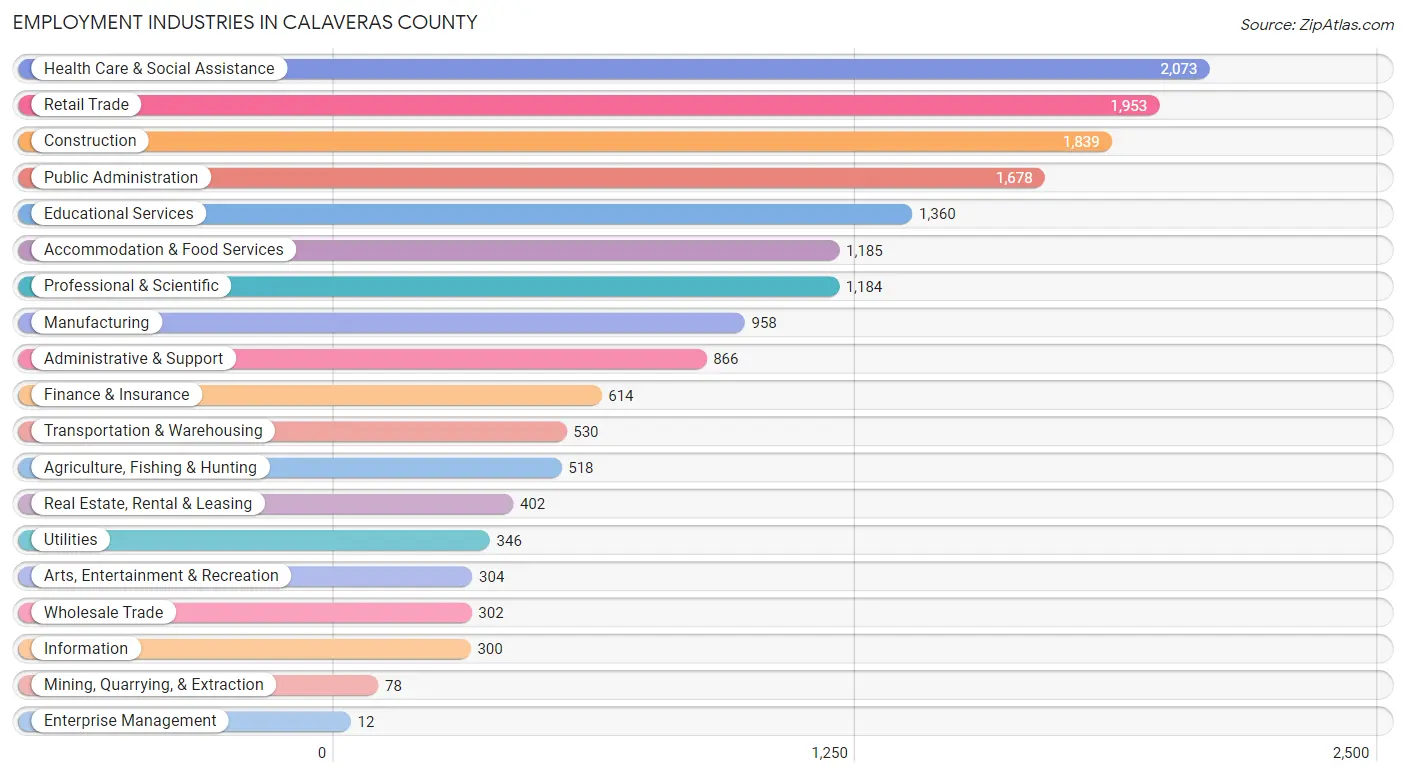
Employment Industries in Calaveras County
The major employment industries in Calaveras County include Health Care & Social Assistance (2,073 | 11.9%), Retail Trade (1,953 | 11.3%), Construction (1,839 | 10.6%), Public Administration (1,678 | 9.7%), and Educational Services (1,360 | 7.8%).
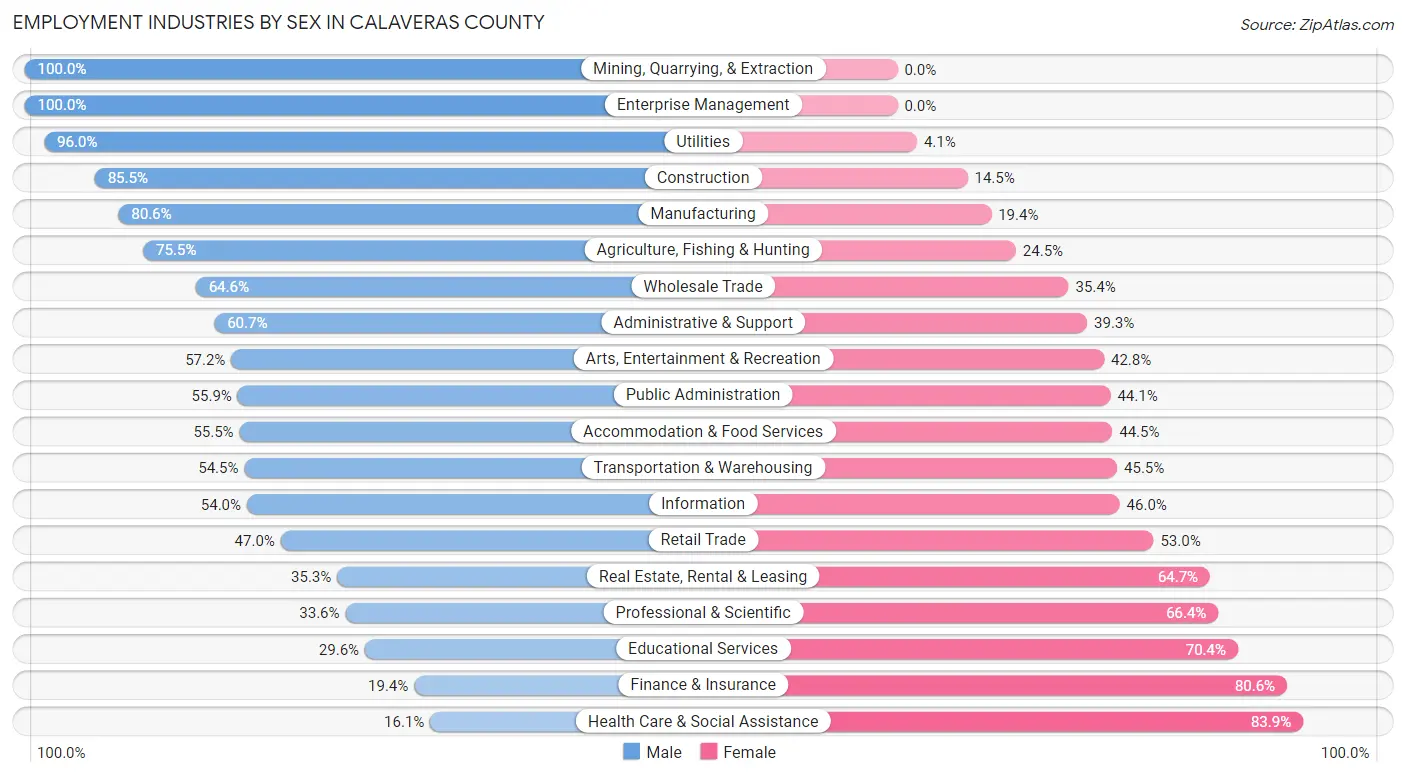
Employment Industries by Sex in Calaveras County
The Calaveras County industries that see more men than women are Mining, Quarrying, & Extraction (100.0%), Enterprise Management (100.0%), and Utilities (96.0%), whereas the industries that tend to have a higher number of women are Health Care & Social Assistance (83.9%), Finance & Insurance (80.6%), and Educational Services (70.4%).
| Industry | Male | Female |
| Agriculture, Fishing & Hunting | 391 (75.5%) | 127 (24.5%) |
| Mining, Quarrying, & Extraction | 78 (100.0%) | 0 (0.0%) |
| Construction | 1,572 (85.5%) | 267 (14.5%) |
| Manufacturing | 772 (80.6%) | 186 (19.4%) |
| Wholesale Trade | 195 (64.6%) | 107 (35.4%) |
| Retail Trade | 918 (47.0%) | 1,035 (53.0%) |
| Transportation & Warehousing | 289 (54.5%) | 241 (45.5%) |
| Utilities | 332 (96.0%) | 14 (4.1%) |
| Information | 162 (54.0%) | 138 (46.0%) |
| Finance & Insurance | 119 (19.4%) | 495 (80.6%) |
| Real Estate, Rental & Leasing | 142 (35.3%) | 260 (64.7%) |
| Professional & Scientific | 398 (33.6%) | 786 (66.4%) |
| Enterprise Management | 12 (100.0%) | 0 (0.0%) |
| Administrative & Support | 526 (60.7%) | 340 (39.3%) |
| Educational Services | 402 (29.6%) | 958 (70.4%) |
| Health Care & Social Assistance | 333 (16.1%) | 1,740 (83.9%) |
| Arts, Entertainment & Recreation | 174 (57.2%) | 130 (42.8%) |
| Accommodation & Food Services | 658 (55.5%) | 527 (44.5%) |
| Public Administration | 938 (55.9%) | 740 (44.1%) |
| Total | 8,850 (51.0%) | 8,512 (49.0%) |
Education in Calaveras County
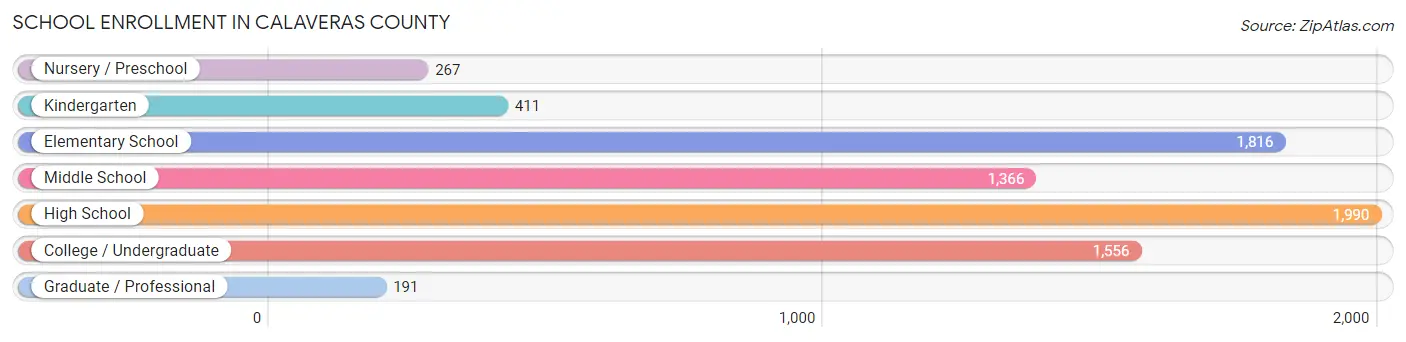
School Enrollment in Calaveras County
The most common levels of schooling among the 7,597 students in Calaveras County are high school (1,990 | 26.2%), elementary school (1,816 | 23.9%), and college / undergraduate (1,556 | 20.5%).
| School Level | # Students | % Students |
| Nursery / Preschool | 267 | 3.5% |
| Kindergarten | 411 | 5.4% |
| Elementary School | 1,816 | 23.9% |
| Middle School | 1,366 | 18.0% |
| High School | 1,990 | 26.2% |
| College / Undergraduate | 1,556 | 20.5% |
| Graduate / Professional | 191 | 2.5% |
| Total | 7,597 | 100.0% |
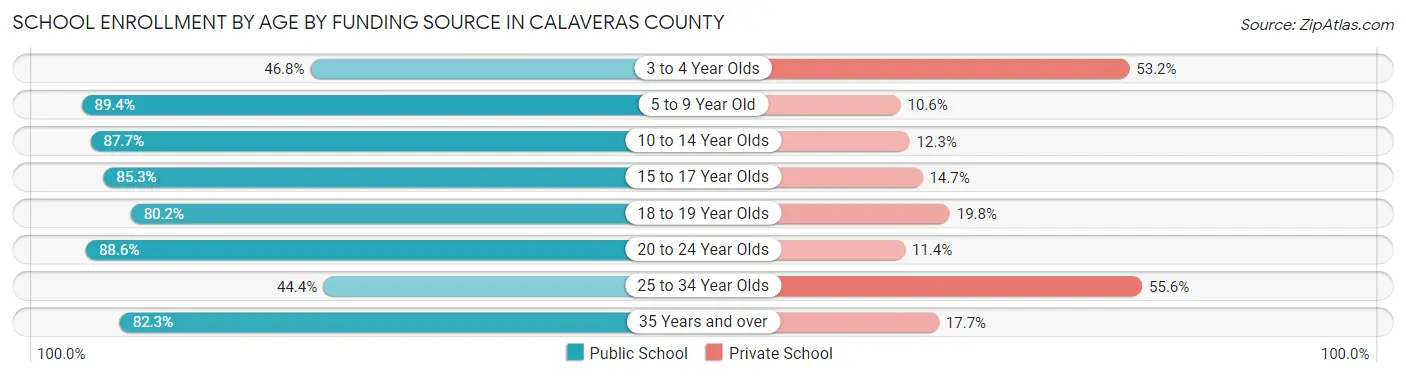
School Enrollment by Age by Funding Source in Calaveras County
Out of a total of 7,597 students who are enrolled in schools in Calaveras County, 1,216 (16.0%) attend a private institution, while the remaining 6,381 (84.0%) are enrolled in public schools. The age group of 25 to 34 year olds has the highest likelihood of being enrolled in private schools, with 174 (55.6% in the age bracket) enrolled. Conversely, the age group of 5 to 9 year old has the lowest likelihood of being enrolled in a private school, with 1,937 (89.4% in the age bracket) attending a public institution.
| Age Bracket | Public School | Private School |
| 3 to 4 Year Olds | 102 (46.8%) | 116 (53.2%) |
| 5 to 9 Year Old | 1,937 (89.4%) | 230 (10.6%) |
| 10 to 14 Year Olds | 1,634 (87.7%) | 229 (12.3%) |
| 15 to 17 Year Olds | 1,186 (85.3%) | 204 (14.7%) |
| 18 to 19 Year Olds | 418 (80.2%) | 103 (19.8%) |
| 20 to 24 Year Olds | 542 (88.6%) | 70 (11.4%) |
| 25 to 34 Year Olds | 139 (44.4%) | 174 (55.6%) |
| 35 Years and over | 422 (82.3%) | 91 (17.7%) |
| Total | 6,381 (84.0%) | 1,216 (16.0%) |
Educational Attainment by Field of Study in Calaveras County
Business (1,524 | 19.1%), bio, nature & agricultural (857 | 10.7%), education (721 | 9.0%), social sciences (691 | 8.6%), and arts & humanities (652 | 8.2%) are the most common fields of study among 7,984 individuals in Calaveras County who have obtained a bachelor's degree or higher.
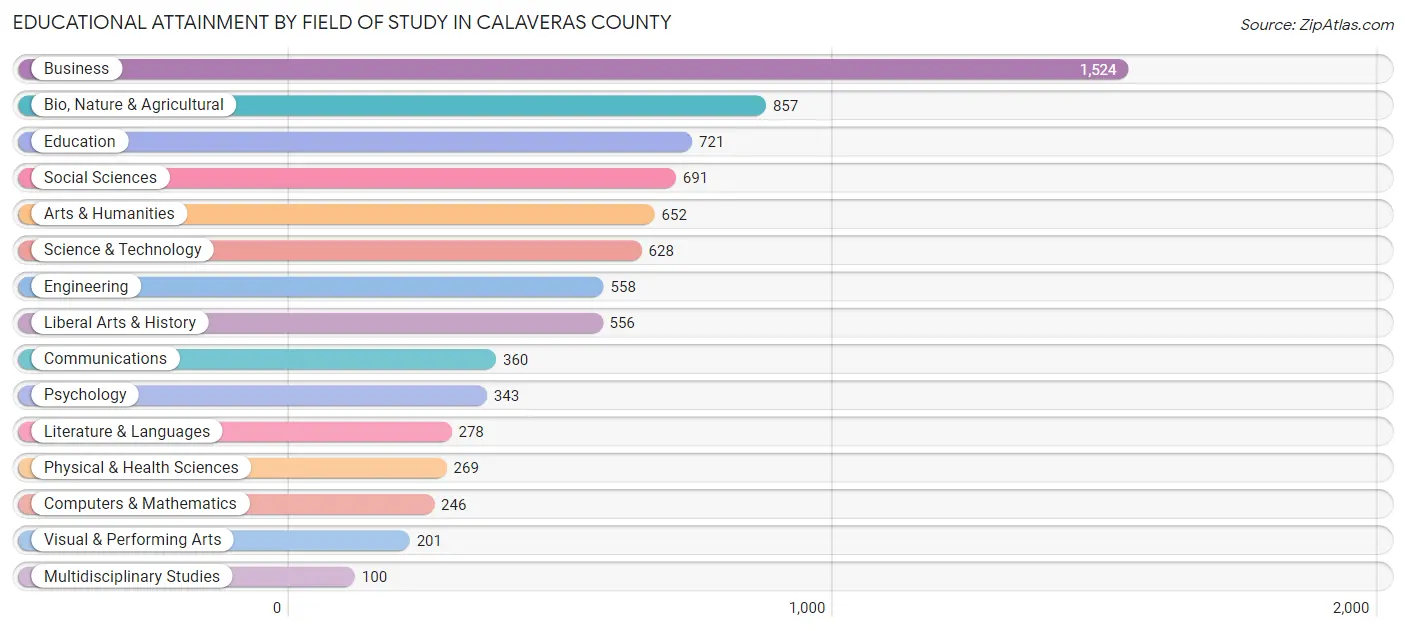
| Field of Study | # Graduates | % Graduates |
| Computers & Mathematics | 246 | 3.1% |
| Bio, Nature & Agricultural | 857 | 10.7% |
| Physical & Health Sciences | 269 | 3.4% |
| Psychology | 343 | 4.3% |
| Social Sciences | 691 | 8.6% |
| Engineering | 558 | 7.0% |
| Multidisciplinary Studies | 100 | 1.3% |
| Science & Technology | 628 | 7.9% |
| Business | 1,524 | 19.1% |
| Education | 721 | 9.0% |
| Literature & Languages | 278 | 3.5% |
| Liberal Arts & History | 556 | 7.0% |
| Visual & Performing Arts | 201 | 2.5% |
| Communications | 360 | 4.5% |
| Arts & Humanities | 652 | 8.2% |
| Total | 7,984 | 100.0% |
Transportation & Commute in Calaveras County
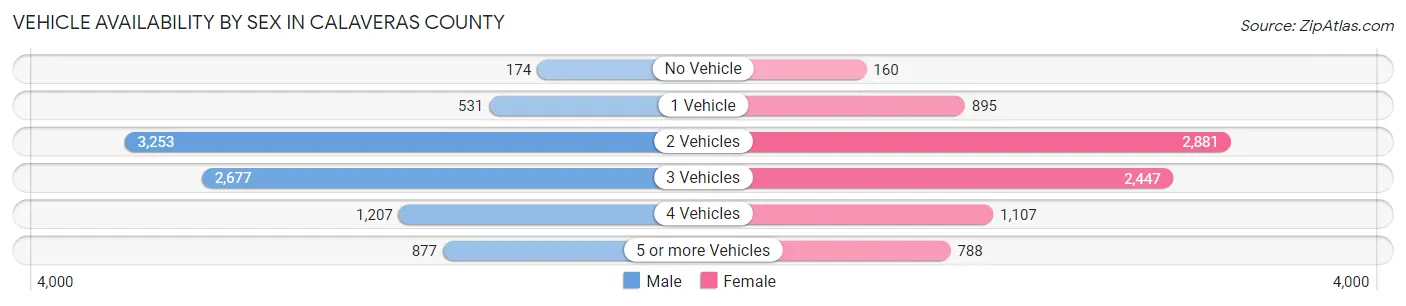
Vehicle Availability by Sex in Calaveras County
The most prevalent vehicle ownership categories in Calaveras County are males with 2 vehicles (3,253, accounting for 37.3%) and females with 2 vehicles (2,881, making up 39.3%).
| Vehicles Available | Male | Female |
| No Vehicle | 174 (2.0%) | 160 (1.9%) |
| 1 Vehicle | 531 (6.1%) | 895 (10.8%) |
| 2 Vehicles | 3,253 (37.3%) | 2,881 (34.8%) |
| 3 Vehicles | 2,677 (30.7%) | 2,447 (29.6%) |
| 4 Vehicles | 1,207 (13.8%) | 1,107 (13.4%) |
| 5 or more Vehicles | 877 (10.1%) | 788 (9.5%) |
| Total | 8,719 (100.0%) | 8,278 (100.0%) |
Commute Time in Calaveras County
The most frequently occuring commute durations in Calaveras County are 45 to 59 minutes (1,900 commuters, 12.9%), 60 to 89 minutes (1,805 commuters, 12.3%), and 5 to 9 minutes (1,778 commuters, 12.1%).
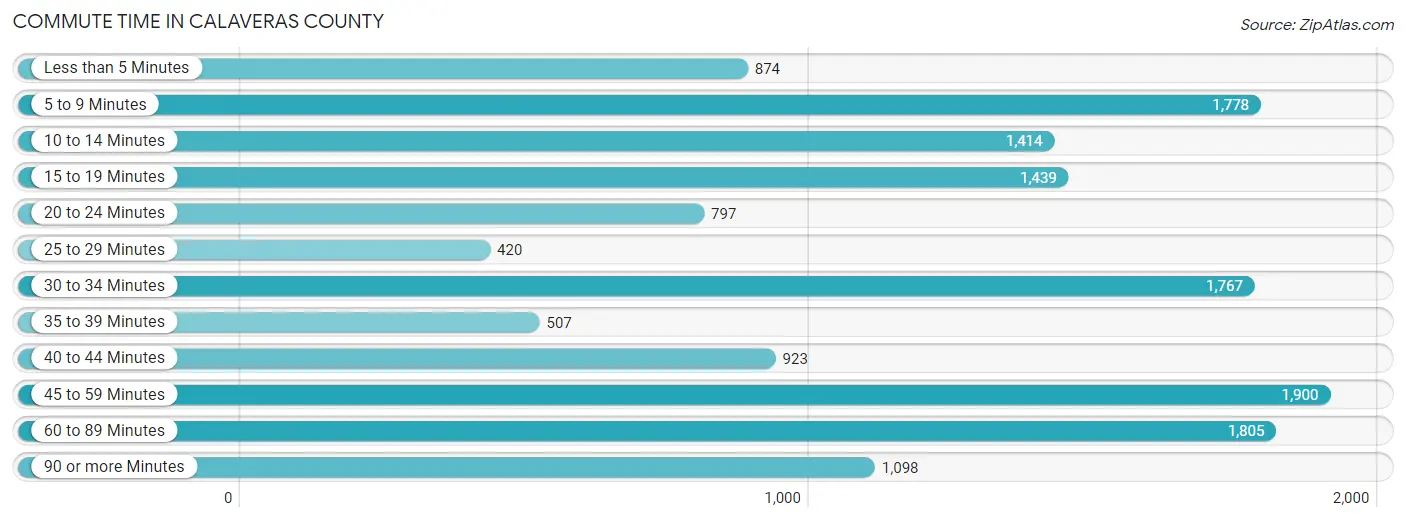
| Commute Time | # Commuters | % Commuters |
| Less than 5 Minutes | 874 | 5.9% |
| 5 to 9 Minutes | 1,778 | 12.1% |
| 10 to 14 Minutes | 1,414 | 9.6% |
| 15 to 19 Minutes | 1,439 | 9.8% |
| 20 to 24 Minutes | 797 | 5.4% |
| 25 to 29 Minutes | 420 | 2.9% |
| 30 to 34 Minutes | 1,767 | 12.0% |
| 35 to 39 Minutes | 507 | 3.4% |
| 40 to 44 Minutes | 923 | 6.3% |
| 45 to 59 Minutes | 1,900 | 12.9% |
| 60 to 89 Minutes | 1,805 | 12.3% |
| 90 or more Minutes | 1,098 | 7.5% |
Commute Time by Sex in Calaveras County
The most common commute times in Calaveras County are 60 to 89 minutes (1,226 commuters, 15.5%) for males and 5 to 9 minutes (1,006 commuters, 14.8%) for females.
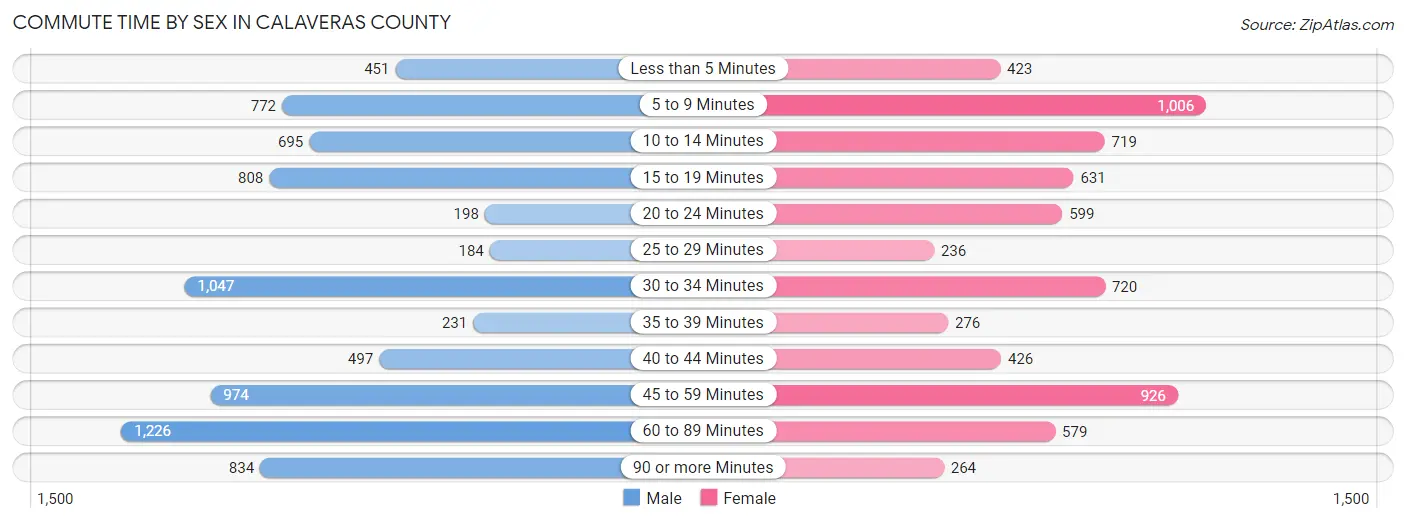
| Commute Time | Male | Female |
| Less than 5 Minutes | 451 (5.7%) | 423 (6.2%) |
| 5 to 9 Minutes | 772 (9.8%) | 1,006 (14.8%) |
| 10 to 14 Minutes | 695 (8.8%) | 719 (10.6%) |
| 15 to 19 Minutes | 808 (10.2%) | 631 (9.3%) |
| 20 to 24 Minutes | 198 (2.5%) | 599 (8.8%) |
| 25 to 29 Minutes | 184 (2.3%) | 236 (3.5%) |
| 30 to 34 Minutes | 1,047 (13.2%) | 720 (10.6%) |
| 35 to 39 Minutes | 231 (2.9%) | 276 (4.1%) |
| 40 to 44 Minutes | 497 (6.3%) | 426 (6.3%) |
| 45 to 59 Minutes | 974 (12.3%) | 926 (13.6%) |
| 60 to 89 Minutes | 1,226 (15.5%) | 579 (8.5%) |
| 90 or more Minutes | 834 (10.5%) | 264 (3.9%) |
Time of Departure to Work by Sex in Calaveras County
The most frequent times of departure to work in Calaveras County are 12:00 AM to 4:59 AM (1,443, 18.2%) for males and 7:00 AM to 7:29 AM (1,488, 21.9%) for females.
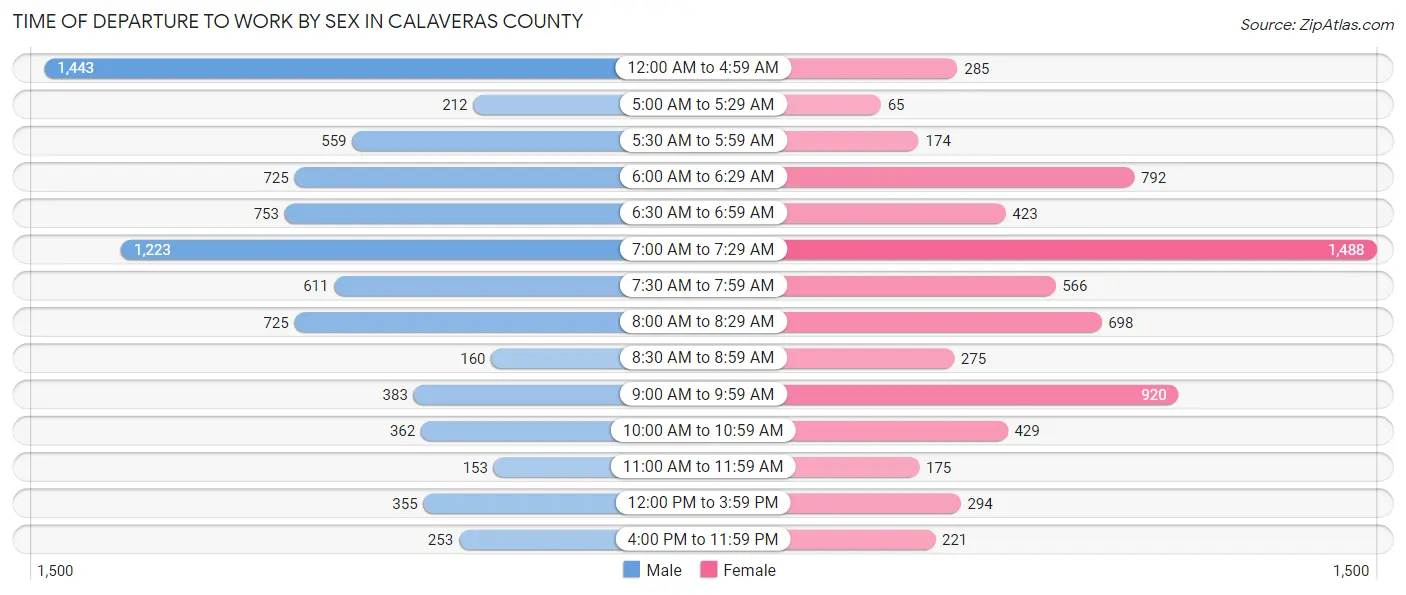
| Time of Departure | Male | Female |
| 12:00 AM to 4:59 AM | 1,443 (18.2%) | 285 (4.2%) |
| 5:00 AM to 5:29 AM | 212 (2.7%) | 65 (1.0%) |
| 5:30 AM to 5:59 AM | 559 (7.1%) | 174 (2.6%) |
| 6:00 AM to 6:29 AM | 725 (9.2%) | 792 (11.6%) |
| 6:30 AM to 6:59 AM | 753 (9.5%) | 423 (6.2%) |
| 7:00 AM to 7:29 AM | 1,223 (15.4%) | 1,488 (21.9%) |
| 7:30 AM to 7:59 AM | 611 (7.7%) | 566 (8.3%) |
| 8:00 AM to 8:29 AM | 725 (9.2%) | 698 (10.3%) |
| 8:30 AM to 8:59 AM | 160 (2.0%) | 275 (4.0%) |
| 9:00 AM to 9:59 AM | 383 (4.8%) | 920 (13.5%) |
| 10:00 AM to 10:59 AM | 362 (4.6%) | 429 (6.3%) |
| 11:00 AM to 11:59 AM | 153 (1.9%) | 175 (2.6%) |
| 12:00 PM to 3:59 PM | 355 (4.5%) | 294 (4.3%) |
| 4:00 PM to 11:59 PM | 253 (3.2%) | 221 (3.3%) |
| Total | 7,917 (100.0%) | 6,805 (100.0%) |
Housing Occupancy in Calaveras County
Occupancy by Ownership in Calaveras County
Of the total 17,198 dwellings in Calaveras County, owner-occupied units account for 14,114 (82.1%), while renter-occupied units make up 3,084 (17.9%).
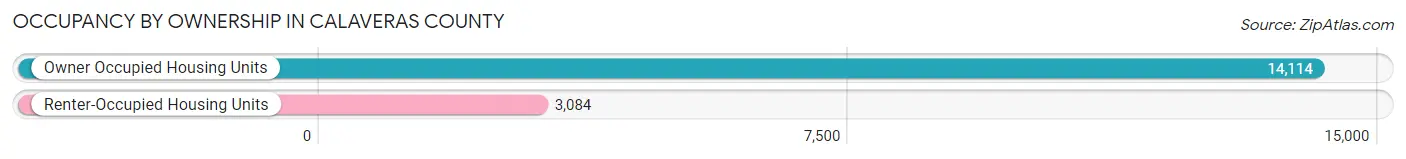
| Occupancy | # Housing Units | % Housing Units |
| Owner Occupied Housing Units | 14,114 | 82.1% |
| Renter-Occupied Housing Units | 3,084 | 17.9% |
| Total Occupied Housing Units | 17,198 | 100.0% |
Occupancy by Household Size in Calaveras County
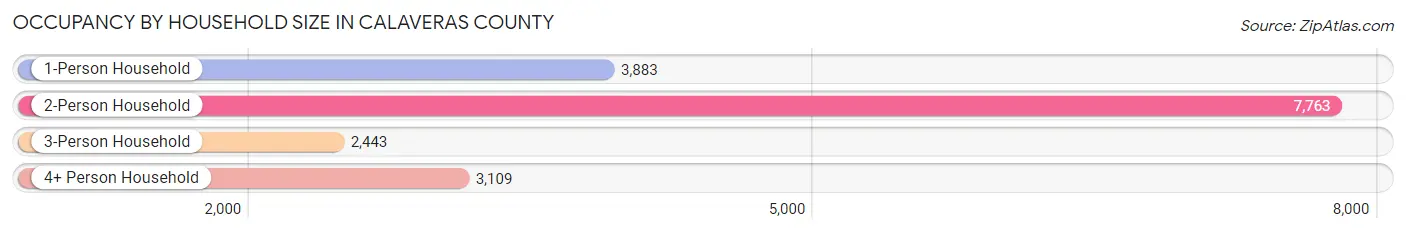
| Household Size | # Housing Units | % Housing Units |
| 1-Person Household | 3,883 | 22.6% |
| 2-Person Household | 7,763 | 45.1% |
| 3-Person Household | 2,443 | 14.2% |
| 4+ Person Household | 3,109 | 18.1% |
| Total Housing Units | 17,198 | 100.0% |
Occupancy by Ownership by Household Size in Calaveras County
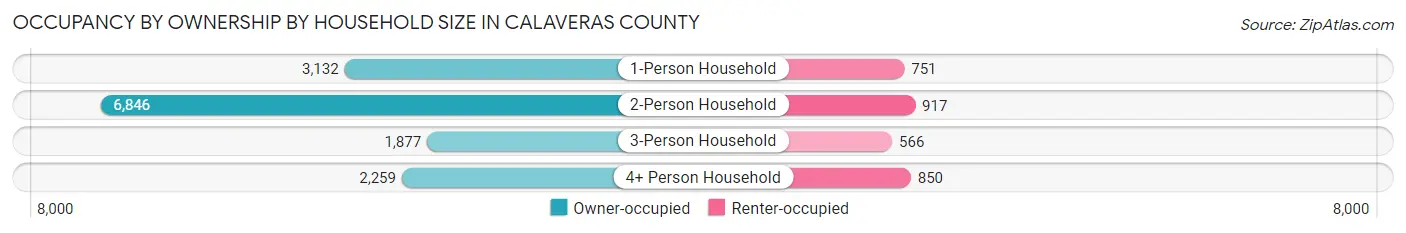
| Household Size | Owner-occupied | Renter-occupied |
| 1-Person Household | 3,132 (80.7%) | 751 (19.3%) |
| 2-Person Household | 6,846 (88.2%) | 917 (11.8%) |
| 3-Person Household | 1,877 (76.8%) | 566 (23.2%) |
| 4+ Person Household | 2,259 (72.7%) | 850 (27.3%) |
| Total Housing Units | 14,114 (82.1%) | 3,084 (17.9%) |
Occupancy by Educational Attainment in Calaveras County
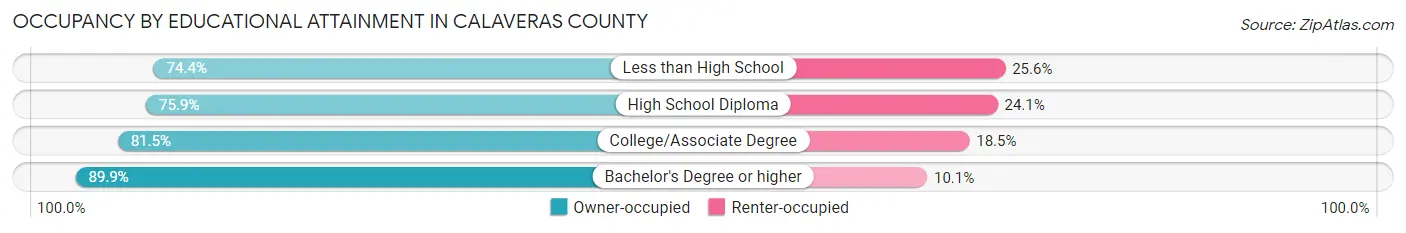
| Household Size | Owner-occupied | Renter-occupied |
| Less than High School | 666 (74.4%) | 229 (25.6%) |
| High School Diploma | 2,954 (75.9%) | 937 (24.1%) |
| College/Associate Degree | 6,484 (81.5%) | 1,468 (18.5%) |
| Bachelor's Degree or higher | 4,010 (89.9%) | 450 (10.1%) |
Occupancy by Age of Householder in Calaveras County
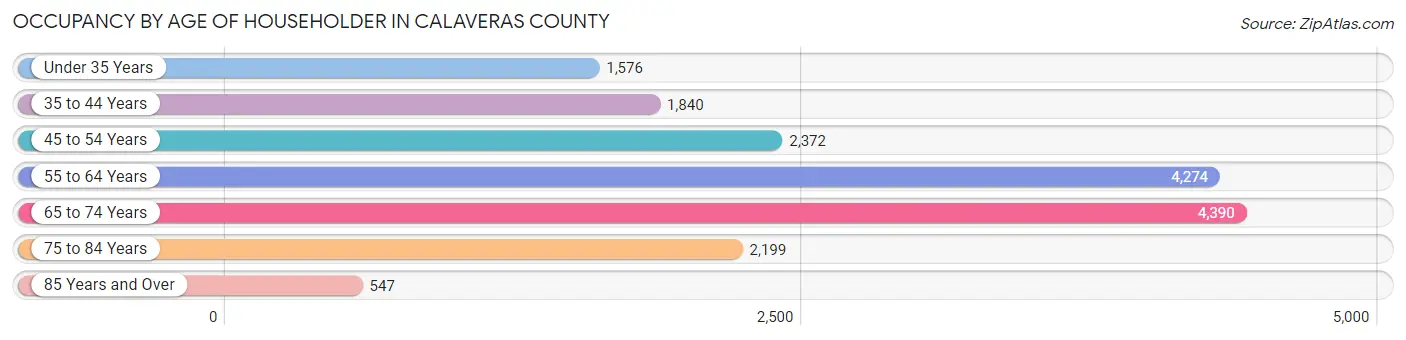
| Age Bracket | # Households | % Households |
| Under 35 Years | 1,576 | 9.2% |
| 35 to 44 Years | 1,840 | 10.7% |
| 45 to 54 Years | 2,372 | 13.8% |
| 55 to 64 Years | 4,274 | 24.8% |
| 65 to 74 Years | 4,390 | 25.5% |
| 75 to 84 Years | 2,199 | 12.8% |
| 85 Years and Over | 547 | 3.2% |
| Total | 17,198 | 100.0% |
Housing Finances in Calaveras County
Median Income by Occupancy in Calaveras County
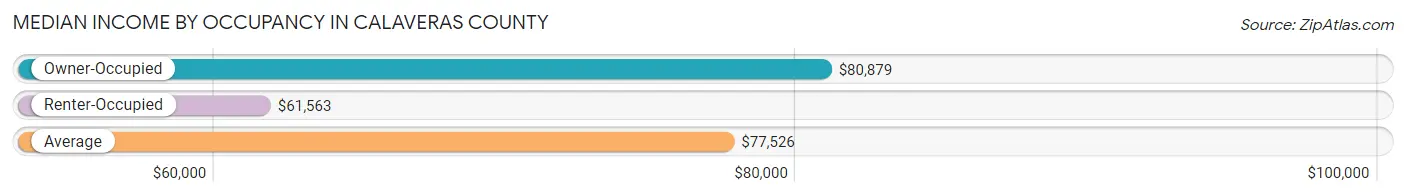
| Occupancy Type | # Households | Median Income |
| Owner-Occupied | 14,114 (82.1%) | $80,879 |
| Renter-Occupied | 3,084 (17.9%) | $61,563 |
| Average | 17,198 (100.0%) | $77,526 |
Occupancy by Householder Income Bracket in Calaveras County
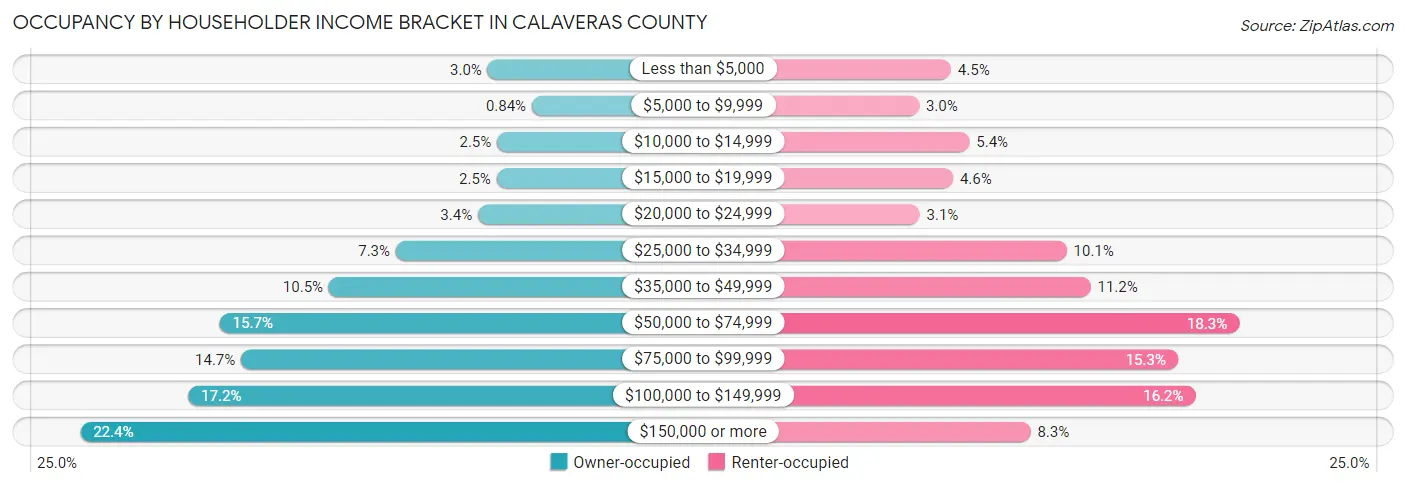
| Income Bracket | Owner-occupied | Renter-occupied |
| Less than $5,000 | 417 (2.9%) | 140 (4.5%) |
| $5,000 to $9,999 | 118 (0.8%) | 93 (3.0%) |
| $10,000 to $14,999 | 353 (2.5%) | 167 (5.4%) |
| $15,000 to $19,999 | 355 (2.5%) | 143 (4.6%) |
| $20,000 to $24,999 | 481 (3.4%) | 94 (3.0%) |
| $25,000 to $34,999 | 1,033 (7.3%) | 310 (10.1%) |
| $35,000 to $49,999 | 1,483 (10.5%) | 345 (11.2%) |
| $50,000 to $74,999 | 2,217 (15.7%) | 563 (18.3%) |
| $75,000 to $99,999 | 2,073 (14.7%) | 473 (15.3%) |
| $100,000 to $149,999 | 2,429 (17.2%) | 499 (16.2%) |
| $150,000 or more | 3,155 (22.4%) | 257 (8.3%) |
| Total | 14,114 (100.0%) | 3,084 (100.0%) |
Monthly Housing Cost Tiers in Calaveras County
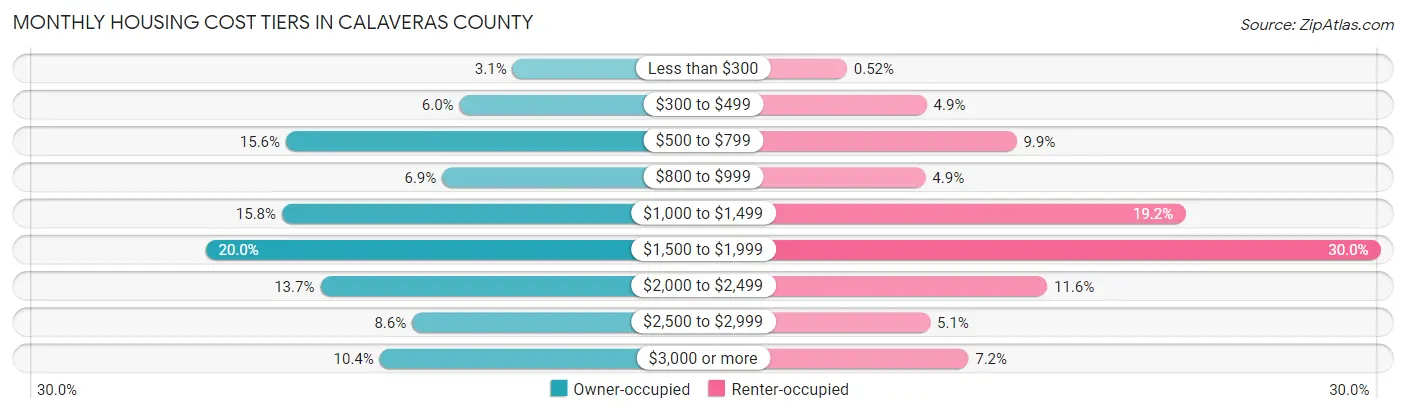
| Monthly Cost | Owner-occupied | Renter-occupied |
| Less than $300 | 430 (3.0%) | 16 (0.5%) |
| $300 to $499 | 844 (6.0%) | 152 (4.9%) |
| $500 to $799 | 2,197 (15.6%) | 305 (9.9%) |
| $800 to $999 | 980 (6.9%) | 150 (4.9%) |
| $1,000 to $1,499 | 2,228 (15.8%) | 592 (19.2%) |
| $1,500 to $1,999 | 2,824 (20.0%) | 925 (30.0%) |
| $2,000 to $2,499 | 1,930 (13.7%) | 357 (11.6%) |
| $2,500 to $2,999 | 1,214 (8.6%) | 158 (5.1%) |
| $3,000 or more | 1,467 (10.4%) | 223 (7.2%) |
| Total | 14,114 (100.0%) | 3,084 (100.0%) |
Physical Housing Characteristics in Calaveras County
Housing Structures in Calaveras County
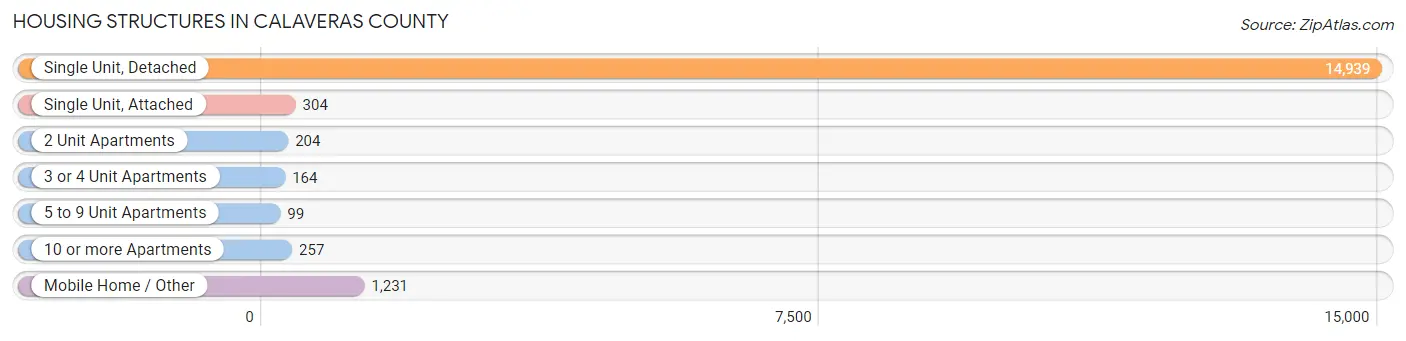
| Structure Type | # Housing Units | % Housing Units |
| Single Unit, Detached | 14,939 | 86.9% |
| Single Unit, Attached | 304 | 1.8% |
| 2 Unit Apartments | 204 | 1.2% |
| 3 or 4 Unit Apartments | 164 | 0.9% |
| 5 to 9 Unit Apartments | 99 | 0.6% |
| 10 or more Apartments | 257 | 1.5% |
| Mobile Home / Other | 1,231 | 7.2% |
| Total | 17,198 | 100.0% |
Housing Structures by Occupancy in Calaveras County
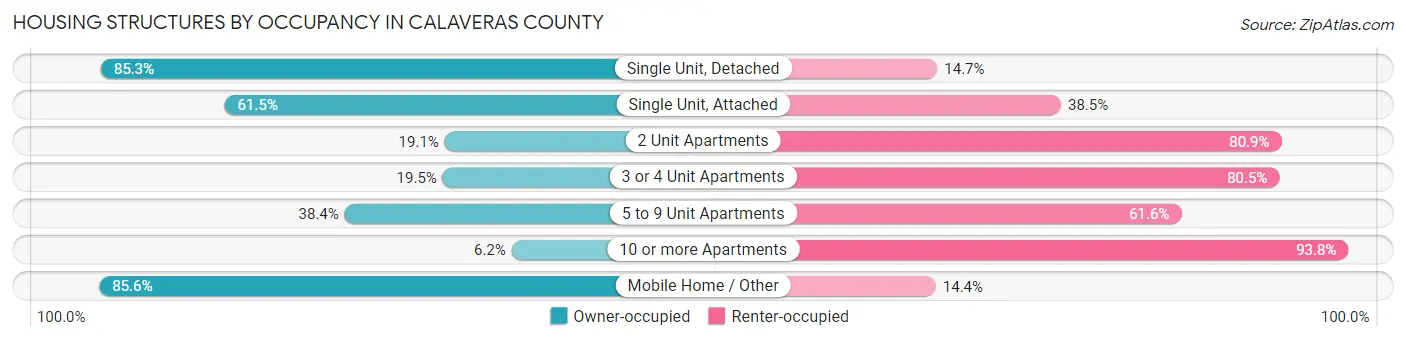
| Structure Type | Owner-occupied | Renter-occupied |
| Single Unit, Detached | 12,748 (85.3%) | 2,191 (14.7%) |
| Single Unit, Attached | 187 (61.5%) | 117 (38.5%) |
| 2 Unit Apartments | 39 (19.1%) | 165 (80.9%) |
| 3 or 4 Unit Apartments | 32 (19.5%) | 132 (80.5%) |
| 5 to 9 Unit Apartments | 38 (38.4%) | 61 (61.6%) |
| 10 or more Apartments | 16 (6.2%) | 241 (93.8%) |
| Mobile Home / Other | 1,054 (85.6%) | 177 (14.4%) |
| Total | 14,114 (82.1%) | 3,084 (17.9%) |
Housing Structures by Number of Rooms in Calaveras County
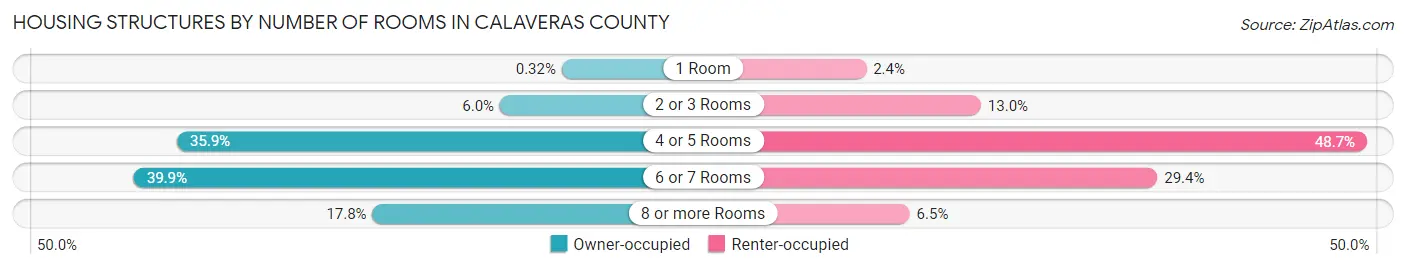
| Number of Rooms | Owner-occupied | Renter-occupied |
| 1 Room | 45 (0.3%) | 75 (2.4%) |
| 2 or 3 Rooms | 852 (6.0%) | 402 (13.0%) |
| 4 or 5 Rooms | 5,069 (35.9%) | 1,503 (48.7%) |
| 6 or 7 Rooms | 5,632 (39.9%) | 905 (29.3%) |
| 8 or more Rooms | 2,516 (17.8%) | 199 (6.5%) |
| Total | 14,114 (100.0%) | 3,084 (100.0%) |
Housing Structure by Heating Type in Calaveras County
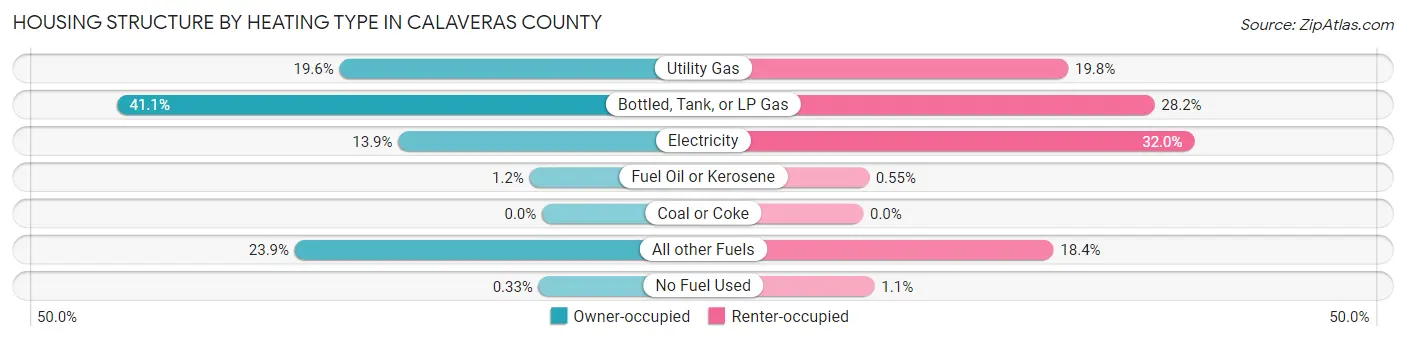
| Heating Type | Owner-occupied | Renter-occupied |
| Utility Gas | 2,762 (19.6%) | 611 (19.8%) |
| Bottled, Tank, or LP Gas | 5,802 (41.1%) | 868 (28.1%) |
| Electricity | 1,961 (13.9%) | 987 (32.0%) |
| Fuel Oil or Kerosene | 170 (1.2%) | 17 (0.5%) |
| Coal or Coke | 0 (0.0%) | 0 (0.0%) |
| All other Fuels | 3,372 (23.9%) | 567 (18.4%) |
| No Fuel Used | 47 (0.3%) | 34 (1.1%) |
| Total | 14,114 (100.0%) | 3,084 (100.0%) |
Household Vehicle Usage in Calaveras County
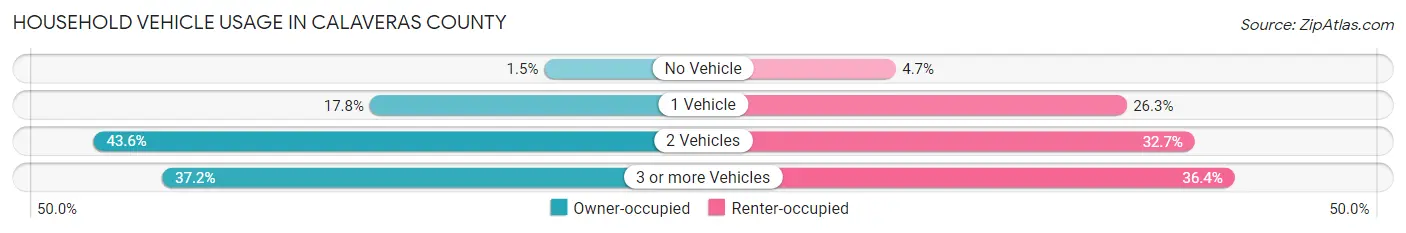
| Vehicles per Household | Owner-occupied | Renter-occupied |
| No Vehicle | 210 (1.5%) | 145 (4.7%) |
| 1 Vehicle | 2,510 (17.8%) | 810 (26.3%) |
| 2 Vehicles | 6,149 (43.6%) | 1,007 (32.7%) |
| 3 or more Vehicles | 5,245 (37.2%) | 1,122 (36.4%) |
| Total | 14,114 (100.0%) | 3,084 (100.0%) |
Real Estate & Mortgages in Calaveras County
Real Estate and Mortgage Overview in Calaveras County
| Characteristic | Without Mortgage | With Mortgage |
| Housing Units | 5,805 | 8,309 |
| Median Property Value | $401,600 | $406,200 |
| Median Household Income | $55,883 | $2,202 |
| Monthly Housing Costs | $729 | $1,454 |
| Real Estate Taxes | $2,687 | $116 |
Property Value by Mortgage Status in Calaveras County
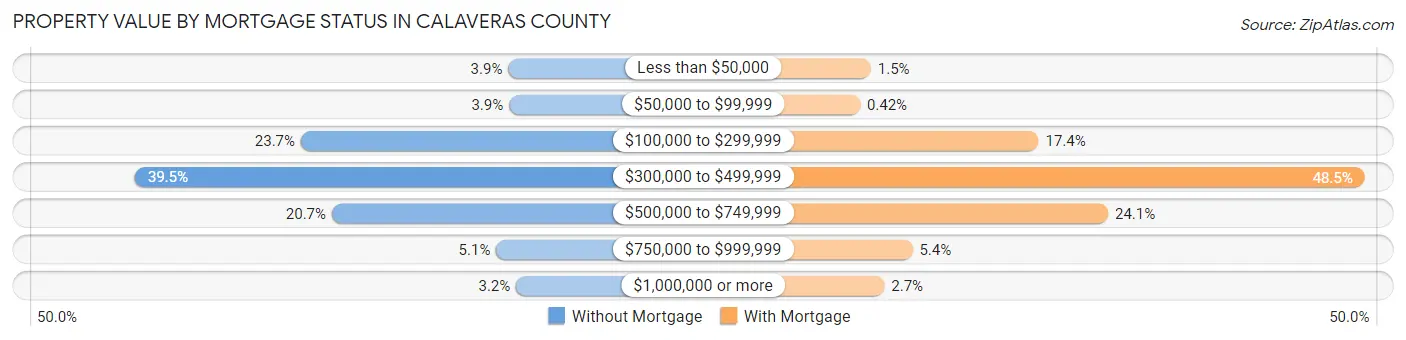
| Property Value | Without Mortgage | With Mortgage |
| Less than $50,000 | 229 (3.9%) | 121 (1.5%) |
| $50,000 to $99,999 | 224 (3.9%) | 35 (0.4%) |
| $100,000 to $299,999 | 1,375 (23.7%) | 1,448 (17.4%) |
| $300,000 to $499,999 | 2,293 (39.5%) | 4,029 (48.5%) |
| $500,000 to $749,999 | 1,204 (20.7%) | 1,998 (24.0%) |
| $750,000 to $999,999 | 295 (5.1%) | 450 (5.4%) |
| $1,000,000 or more | 185 (3.2%) | 228 (2.7%) |
| Total | 5,805 (100.0%) | 8,309 (100.0%) |
Household Income by Mortgage Status in Calaveras County
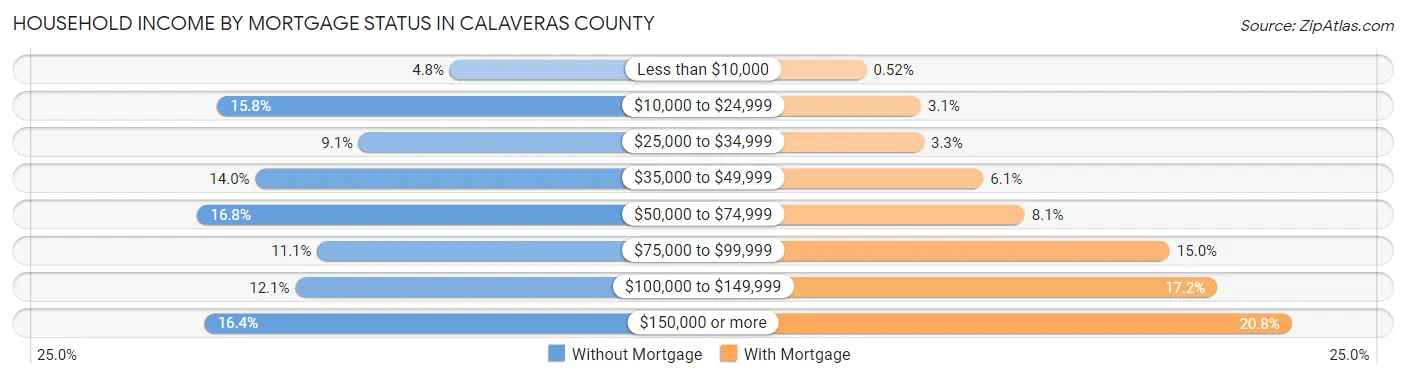
| Household Income | Without Mortgage | With Mortgage |
| Less than $10,000 | 276 (4.8%) | 43 (0.5%) |
| $10,000 to $24,999 | 918 (15.8%) | 259 (3.1%) |
| $25,000 to $34,999 | 527 (9.1%) | 271 (3.3%) |
| $35,000 to $49,999 | 813 (14.0%) | 506 (6.1%) |
| $50,000 to $74,999 | 973 (16.8%) | 670 (8.1%) |
| $75,000 to $99,999 | 642 (11.1%) | 1,244 (15.0%) |
| $100,000 to $149,999 | 703 (12.1%) | 1,431 (17.2%) |
| $150,000 or more | 953 (16.4%) | 1,726 (20.8%) |
| Total | 5,805 (100.0%) | 8,309 (100.0%) |
Property Value to Household Income Ratio in Calaveras County
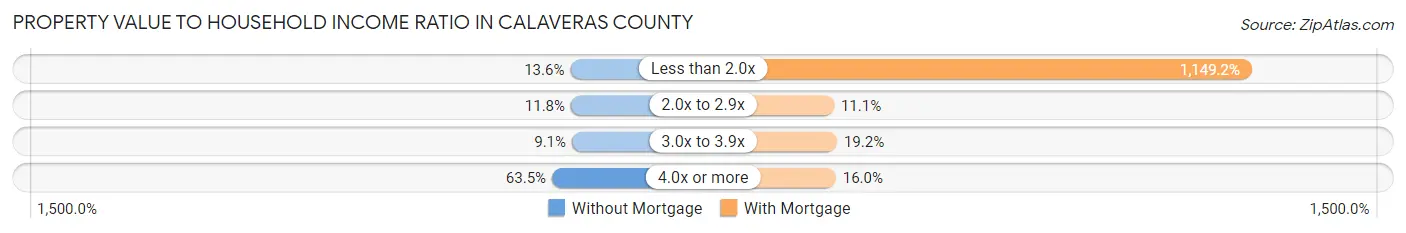
| Value-to-Income Ratio | Without Mortgage | With Mortgage |
| Less than 2.0x | 787 (13.6%) | 95,486 (1,149.2%) |
| 2.0x to 2.9x | 687 (11.8%) | 918 (11.1%) |
| 3.0x to 3.9x | 528 (9.1%) | 1,597 (19.2%) |
| 4.0x or more | 3,688 (63.5%) | 1,328 (16.0%) |
| Total | 5,805 (100.0%) | 8,309 (100.0%) |
Real Estate Taxes by Mortgage Status in Calaveras County
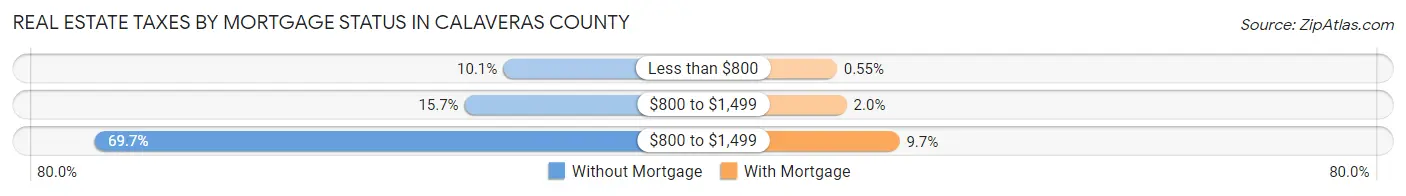
| Property Taxes | Without Mortgage | With Mortgage |
| Less than $800 | 585 (10.1%) | 46 (0.5%) |
| $800 to $1,499 | 913 (15.7%) | 165 (2.0%) |
| $800 to $1,499 | 4,046 (69.7%) | 807 (9.7%) |
| Total | 5,805 (100.0%) | 8,309 (100.0%) |
Health & Disability in Calaveras County
Health Insurance Coverage by Age in Calaveras County
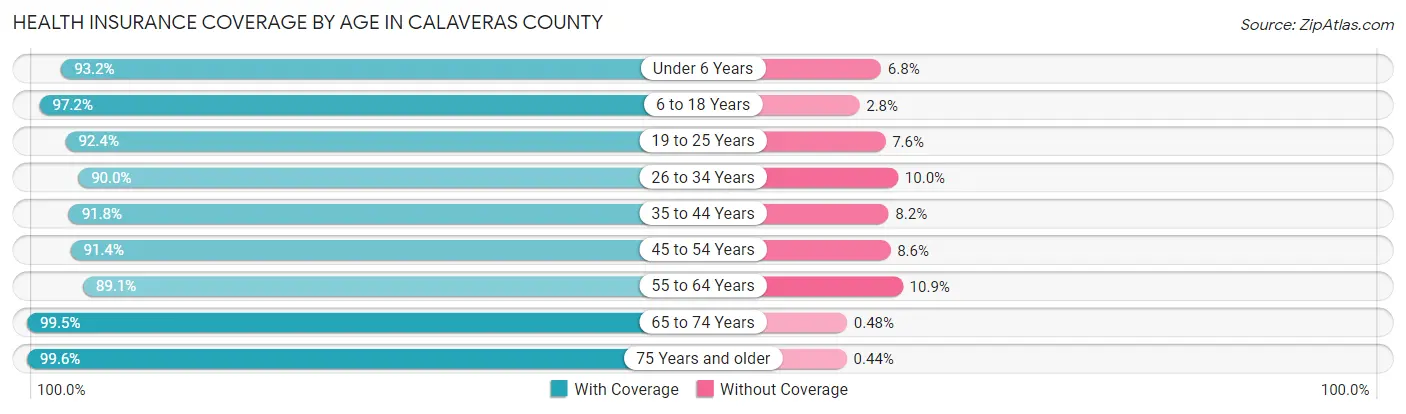
| Age Bracket | With Coverage | Without Coverage |
| Under 6 Years | 2,102 (93.2%) | 154 (6.8%) |
| 6 to 18 Years | 5,688 (97.2%) | 164 (2.8%) |
| 19 to 25 Years | 2,094 (92.4%) | 173 (7.6%) |
| 26 to 34 Years | 3,637 (90.0%) | 404 (10.0%) |
| 35 to 44 Years | 4,349 (91.8%) | 390 (8.2%) |
| 45 to 54 Years | 4,831 (91.4%) | 452 (8.6%) |
| 55 to 64 Years | 6,980 (89.1%) | 852 (10.9%) |
| 65 to 74 Years | 7,861 (99.5%) | 38 (0.5%) |
| 75 Years and older | 5,149 (99.6%) | 23 (0.4%) |
| Total | 42,691 (94.2%) | 2,650 (5.8%) |
Health Insurance Coverage by Citizenship Status in Calaveras County
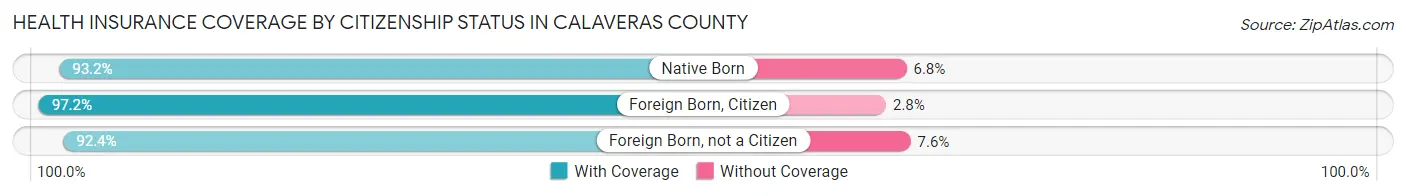
| Citizenship Status | With Coverage | Without Coverage |
| Native Born | 2,102 (93.2%) | 154 (6.8%) |
| Foreign Born, Citizen | 5,688 (97.2%) | 164 (2.8%) |
| Foreign Born, not a Citizen | 2,094 (92.4%) | 173 (7.6%) |
Health Insurance Coverage by Household Income in Calaveras County
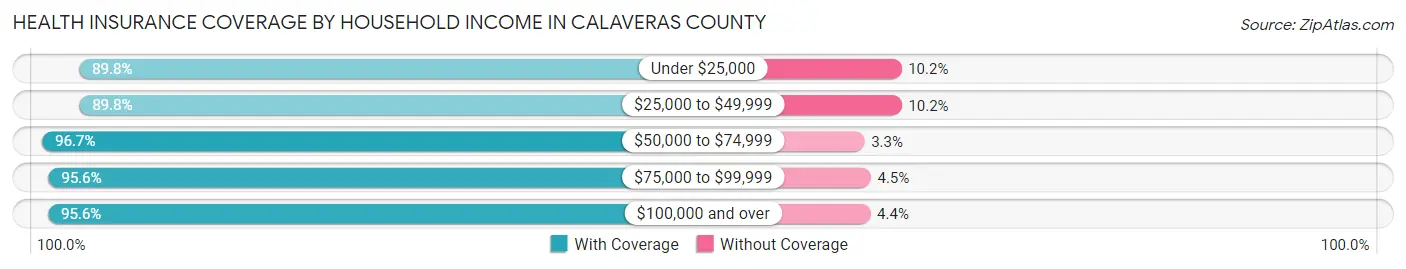
| Household Income | With Coverage | Without Coverage |
| Under $25,000 | 3,944 (89.8%) | 448 (10.2%) |
| $25,000 to $49,999 | 7,011 (89.8%) | 800 (10.2%) |
| $50,000 to $74,999 | 6,842 (96.7%) | 231 (3.3%) |
| $75,000 to $99,999 | 6,276 (95.6%) | 292 (4.4%) |
| $100,000 and over | 18,457 (95.6%) | 846 (4.4%) |
Public vs Private Health Insurance Coverage by Age in Calaveras County
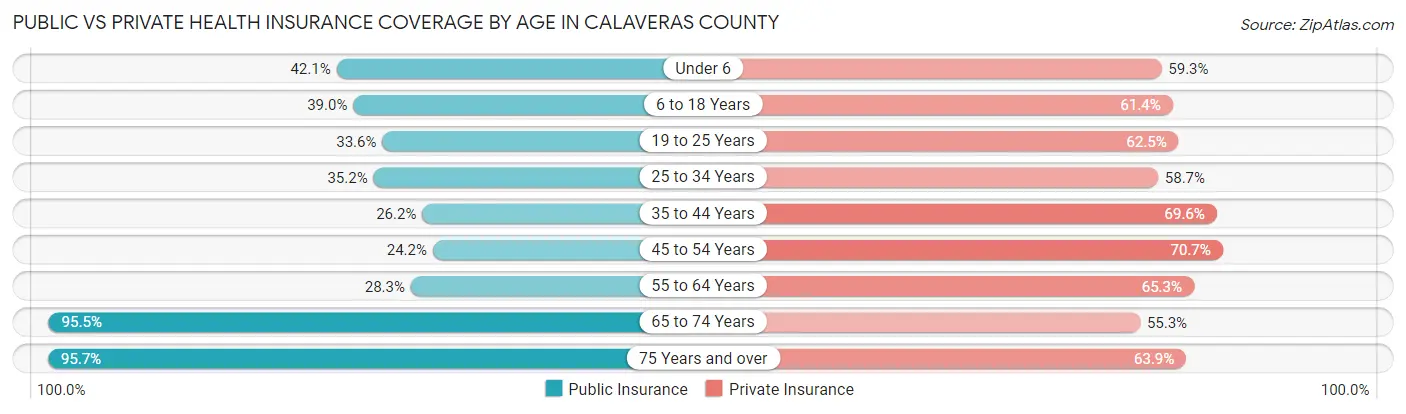
| Age Bracket | Public Insurance | Private Insurance |
| Under 6 | 950 (42.1%) | 1,338 (59.3%) |
| 6 to 18 Years | 2,282 (39.0%) | 3,593 (61.4%) |
| 19 to 25 Years | 762 (33.6%) | 1,417 (62.5%) |
| 25 to 34 Years | 1,424 (35.2%) | 2,371 (58.7%) |
| 35 to 44 Years | 1,241 (26.2%) | 3,297 (69.6%) |
| 45 to 54 Years | 1,280 (24.2%) | 3,734 (70.7%) |
| 55 to 64 Years | 2,218 (28.3%) | 5,117 (65.3%) |
| 65 to 74 Years | 7,546 (95.5%) | 4,371 (55.3%) |
| 75 Years and over | 4,948 (95.7%) | 3,305 (63.9%) |
| Total | 22,651 (50.0%) | 28,543 (62.9%) |
Disability Status by Sex by Age in Calaveras County
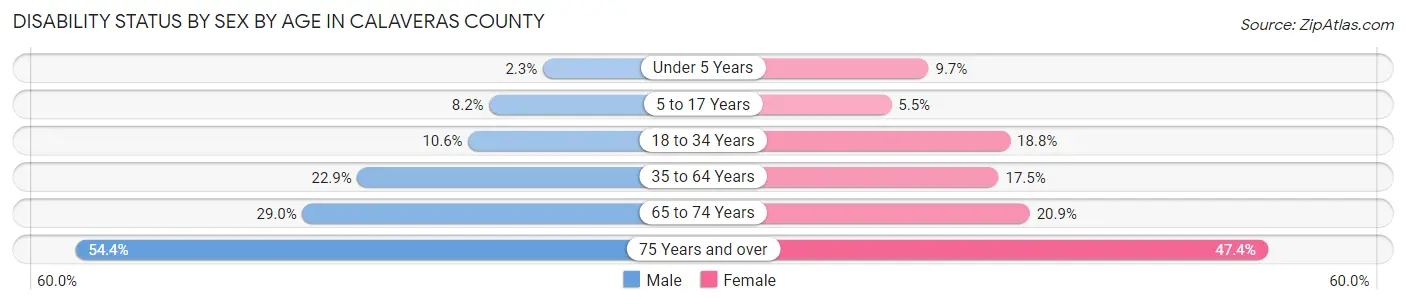
| Age Bracket | Male | Female |
| Under 5 Years | 23 (2.3%) | 82 (9.7%) |
| 5 to 17 Years | 230 (8.2%) | 164 (5.5%) |
| 18 to 34 Years | 382 (10.6%) | 595 (18.8%) |
| 35 to 64 Years | 1,987 (22.9%) | 1,604 (17.5%) |
| 65 to 74 Years | 1,109 (29.0%) | 854 (20.9%) |
| 75 Years and over | 1,393 (54.3%) | 1,237 (47.4%) |
Disability Class by Sex by Age in Calaveras County
Disability Class: Hearing Difficulty
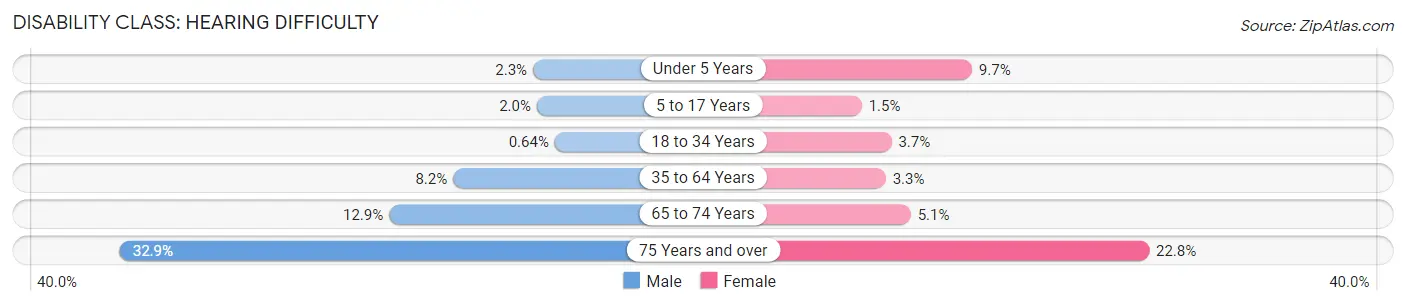
| Age Bracket | Male | Female |
| Under 5 Years | 23 (2.3%) | 82 (9.7%) |
| 5 to 17 Years | 55 (2.0%) | 44 (1.5%) |
| 18 to 34 Years | 23 (0.6%) | 117 (3.7%) |
| 35 to 64 Years | 710 (8.2%) | 299 (3.3%) |
| 65 to 74 Years | 494 (12.9%) | 209 (5.1%) |
| 75 Years and over | 844 (32.9%) | 595 (22.8%) |
Disability Class: Vision Difficulty
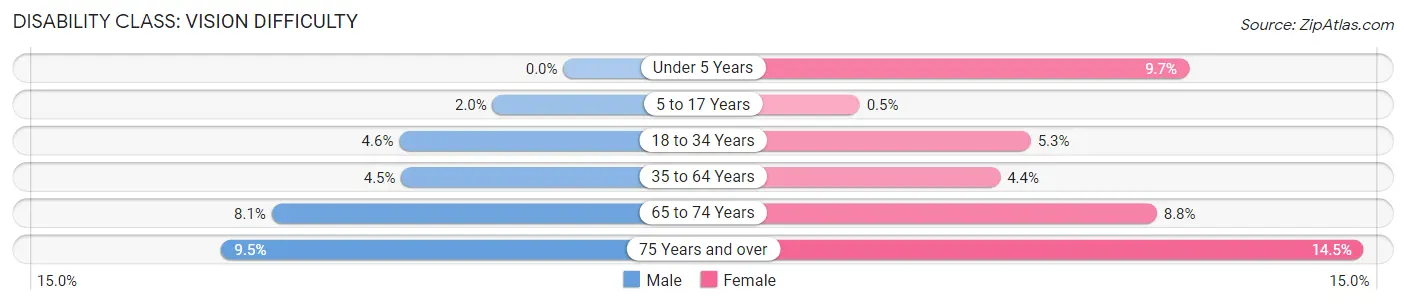
| Age Bracket | Male | Female |
| Under 5 Years | 0 (0.0%) | 82 (9.7%) |
| 5 to 17 Years | 55 (2.0%) | 15 (0.5%) |
| 18 to 34 Years | 165 (4.6%) | 167 (5.3%) |
| 35 to 64 Years | 391 (4.5%) | 405 (4.4%) |
| 65 to 74 Years | 310 (8.1%) | 358 (8.8%) |
| 75 Years and over | 244 (9.5%) | 379 (14.5%) |
Disability Class: Cognitive Difficulty
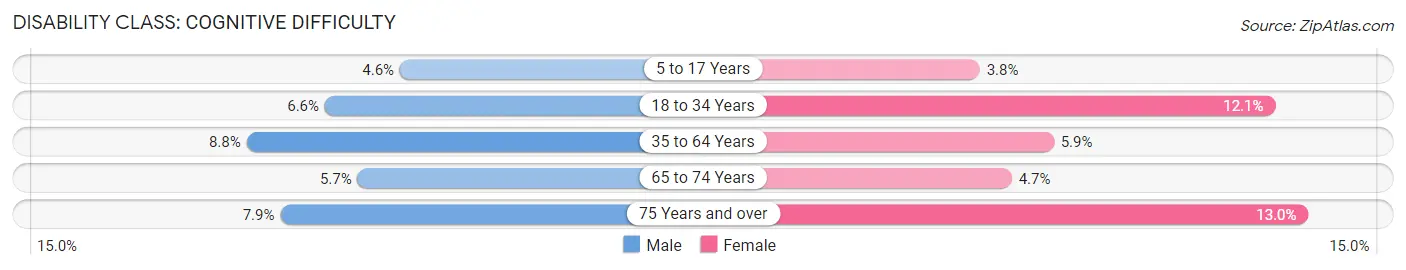
| Age Bracket | Male | Female |
| 5 to 17 Years | 127 (4.5%) | 114 (3.8%) |
| 18 to 34 Years | 240 (6.6%) | 383 (12.1%) |
| 35 to 64 Years | 765 (8.8%) | 542 (5.9%) |
| 65 to 74 Years | 219 (5.7%) | 193 (4.7%) |
| 75 Years and over | 202 (7.9%) | 339 (13.0%) |
Disability Class: Ambulatory Difficulty
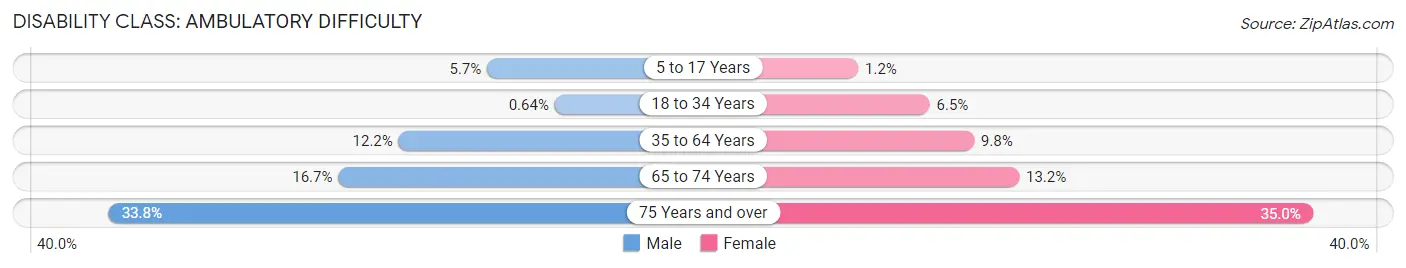
| Age Bracket | Male | Female |
| 5 to 17 Years | 158 (5.7%) | 36 (1.2%) |
| 18 to 34 Years | 23 (0.6%) | 207 (6.5%) |
| 35 to 64 Years | 1,060 (12.2%) | 901 (9.8%) |
| 65 to 74 Years | 638 (16.7%) | 537 (13.2%) |
| 75 Years and over | 865 (33.8%) | 912 (35.0%) |
Disability Class: Self-Care Difficulty
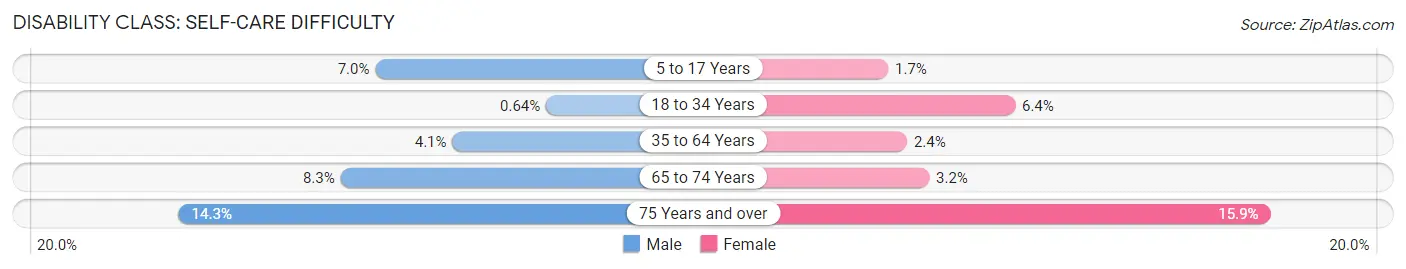
| Age Bracket | Male | Female |
| 5 to 17 Years | 195 (7.0%) | 51 (1.7%) |
| 18 to 34 Years | 23 (0.6%) | 204 (6.4%) |
| 35 to 64 Years | 357 (4.1%) | 222 (2.4%) |
| 65 to 74 Years | 316 (8.3%) | 132 (3.2%) |
| 75 Years and over | 366 (14.3%) | 415 (15.9%) |
Technology Access in Calaveras County
Computing Device Access in Calaveras County
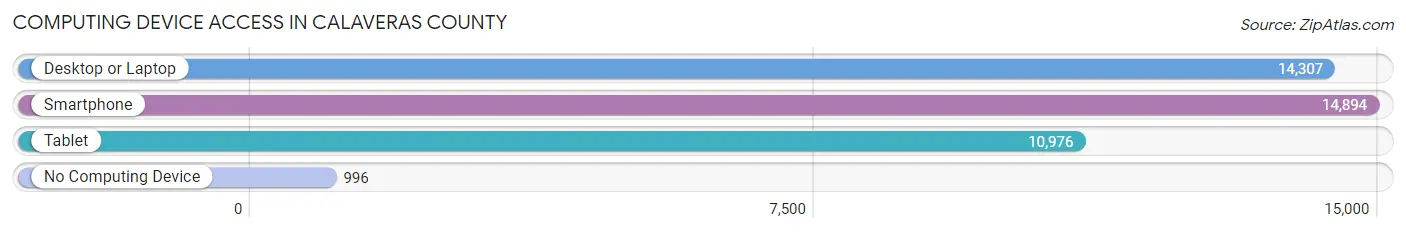
| Device Type | # Households | % Households |
| Desktop or Laptop | 14,307 | 83.2% |
| Smartphone | 14,894 | 86.6% |
| Tablet | 10,976 | 63.8% |
| No Computing Device | 996 | 5.8% |
| Total | 17,198 | 100.0% |
Internet Access in Calaveras County
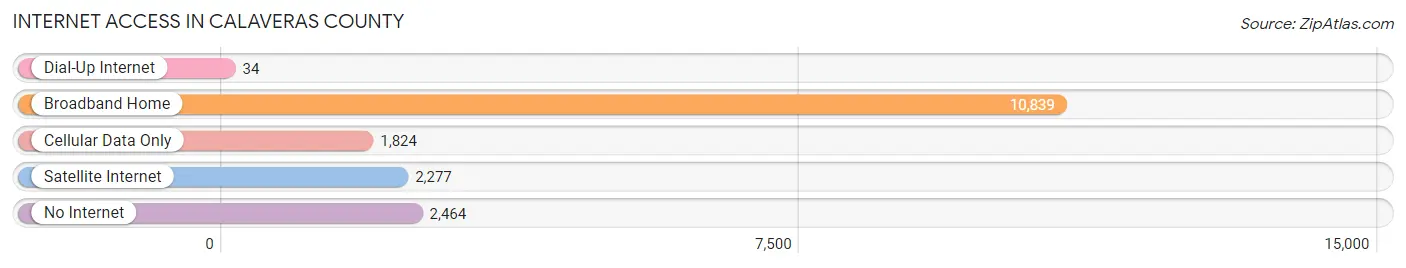
| Internet Type | # Households | % Households |
| Dial-Up Internet | 34 | 0.2% |
| Broadband Home | 10,839 | 63.0% |
| Cellular Data Only | 1,824 | 10.6% |
| Satellite Internet | 2,277 | 13.2% |
| No Internet | 2,464 | 14.3% |
| Total | 17,198 | 100.0% |
Calaveras County Summary
Calaveras County is a county located in the northern part of the Central Valley region of California. It is bordered by Tuolumne County to the north, Amador County to the east, San Joaquin County to the south, and Stanislaus County to the west. The county seat is San Andreas, and the largest city is Angels Camp. The county has a total area of 1,020 square miles, of which 1,006 square miles is land and 14 square miles is water.
History
Calaveras County was one of the original counties of California, created in 1850 at the time of statehood. The county was named after the Calaveras River, which was named by Spanish explorer Gabriel Moraga for the many skulls of Native Americans found along its banks. The county was originally populated by Native Americans, including the Miwok, Maidu, and Yokut tribes.
The first European settlers in the area were miners who arrived in the late 1840s during the California Gold Rush. The county quickly became a major mining center, with gold, silver, and other minerals being mined in the area. The county also became a major agricultural center, with cattle ranching, wheat farming, and fruit orchards being established.
Geography
Calaveras County is located in the northern part of the Central Valley region of California. It is bordered by Tuolumne County to the north, Amador County to the east, San Joaquin County to the south, and Stanislaus County to the west. The county has a total area of 1,020 square miles, of which 1,006 square miles is land and 14 square miles is water.
The county is divided into two distinct geographic regions. The western portion of the county is mountainous and heavily forested, with the Sierra Nevada mountain range running through it. The eastern portion of the county is more flat and is home to the majority of the county's population.
The highest point in the county is the summit of Mount Reba, which has an elevation of 8,717 feet. The lowest point in the county is the San Joaquin River, which has an elevation of only 20 feet.
Economy
Calaveras County has a diverse economy, with a mix of industries including agriculture, mining, manufacturing, tourism, and government services.
Agriculture is a major part of the county's economy, with cattle ranching, wheat farming, and fruit orchards being the main agricultural activities. The county is also home to several wineries and vineyards.
Mining is also an important part of the county's economy, with gold, silver, and other minerals being mined in the area.
Manufacturing is also an important part of the county's economy, with several companies producing a variety of products, including furniture, clothing, and electronics.
Tourism is also an important part of the county's economy, with the county being home to several popular tourist attractions, including the Calaveras Big Trees State Park, the Moaning Caverns, and the Angels Camp Museum.
Government services are also an important part of the county's economy, with the county government providing a variety of services to its citizens.
Demographics
As of the 2010 census, the population of Calaveras County was 45,578. The racial makeup of the county was 79.2% White, 0.7% African American, 1.3% Native American, 0.7% Asian, 0.1% Pacific Islander, 14.3% from other races, and 3.7% from two or more races. Hispanic or Latino of any race were 24.3% of the population.
The median household income in the county was $45,818, and the median family income was $51,818. The per capita income in the county was $22,845. About 13.2% of the population was below the poverty line.
Common Questions
What is Per Capita Income in Calaveras County?
Per Capita income in Calaveras County is $37,935.
What is the Median Family Income in Calaveras County?
Median Family Income in Calaveras County is $89,134.
What is the Median Household income in Calaveras County?
Median Household Income in Calaveras County is $77,526.
What is Income or Wage Gap in Calaveras County?
Income or Wage Gap in Calaveras County is 33.0%.
Women in Calaveras County earn 67.0 cents for every dollar earned by a man.
What is Family Income Deficit in Calaveras County?
Family Income Deficit in Calaveras County is $11,091.
Families that are below poverty line in Calaveras County earn $11,091 less on average than the poverty threshold level.
What is Inequality or Gini Index in Calaveras County?
Inequality or Gini Index in Calaveras County is 0.43.
What is the Total Population of Calaveras County?
Total Population of Calaveras County is 45,674.
What is the Total Male Population of Calaveras County?
Total Male Population of Calaveras County is 22,749.
What is the Total Female Population of Calaveras County?
Total Female Population of Calaveras County is 22,925.
What is the Ratio of Males per 100 Females in Calaveras County?
There are 99.23 Males per 100 Females in Calaveras County.
What is the Ratio of Females per 100 Males in Calaveras County?
There are 100.77 Females per 100 Males in Calaveras County.
What is the Median Population Age in Calaveras County?
Median Population Age in Calaveras County is 52.1 Years.
What is the Average Family Size in Calaveras County
Average Family Size in Calaveras County is 3.0 People.
What is the Average Household Size in Calaveras County
Average Household Size in Calaveras County is 2.6 People.
How Large is the Labor Force in Calaveras County?
There are 18,521 People in the Labor Forcein in Calaveras County.
What is the Percentage of People in the Labor Force in Calaveras County?
47.4% of People are in the Labor Force in Calaveras County.
What is the Unemployment Rate in Calaveras County?
Unemployment Rate in Calaveras County is 6.2%.