Amador County, CA Map & Demographics
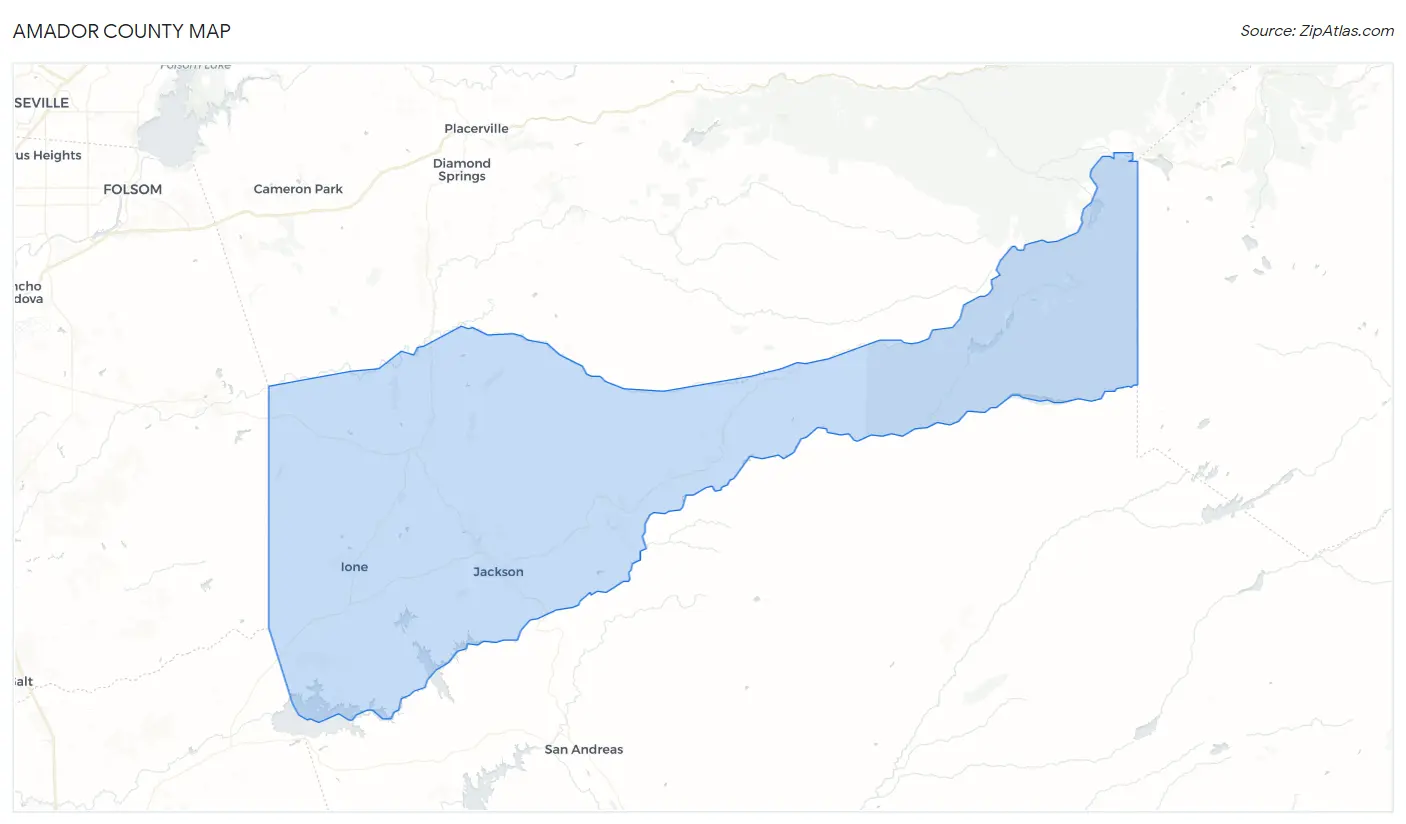
Amador County Map
Amador County Overview
$40,379
PER CAPITA INCOME
$95,970
AVG FAMILY INCOME
$74,853
AVG HOUSEHOLD INCOME
29.8%
WAGE / INCOME GAP [ % ]
70.2¢/ $1
WAGE / INCOME GAP [ $ ]
$9,906
FAMILY INCOME DEFICIT
0.46
INEQUALITY / GINI INDEX
40,577
TOTAL POPULATION
22,007
MALE POPULATION
18,570
FEMALE POPULATION
118.51
MALES / 100 FEMALES
84.38
FEMALES / 100 MALES
49.6
MEDIAN AGE
2.9
AVG FAMILY SIZE
2.4
AVG HOUSEHOLD SIZE
16,910
LABOR FORCE [ PEOPLE ]
48.1%
PERCENT IN LABOR FORCE
6.0%
UNEMPLOYMENT RATE
Income in Amador County
Income Overview in Amador County
Per Capita Income in Amador County is $40,379, while median incomes of families and households are $95,970 and $74,853 respectively.
| Characteristic | Number | Measure |
| Per Capita Income | 40,577 | $40,379 |
| Median Family Income | 10,299 | $95,970 |
| Mean Family Income | 10,299 | $120,208 |
| Median Household Income | 15,745 | $74,853 |
| Mean Household Income | 15,745 | $99,147 |
| Income Deficit | 10,299 | $9,906 |
| Wage / Income Gap (%) | 40,577 | 29.84% |
| Wage / Income Gap ($) | 40,577 | 70.16¢ per $1 |
| Gini / Inequality Index | 40,577 | 0.46 |
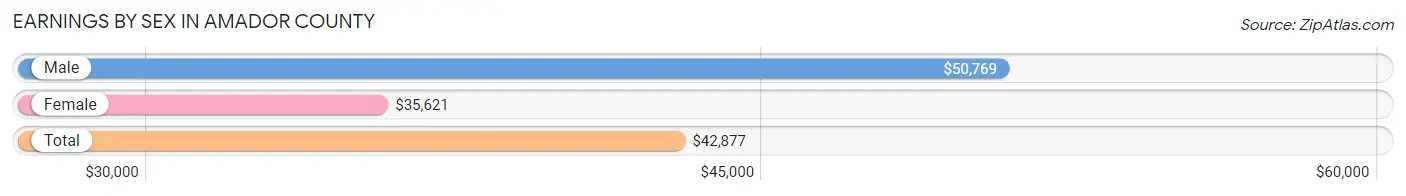
Earnings by Sex in Amador County
Average Earnings in Amador County are $42,877, $50,769 for men and $35,621 for women, a difference of 29.8%.
| Sex | Number | Average Earnings |
| Male | 10,088 (56.3%) | $50,769 |
| Female | 7,828 (43.7%) | $35,621 |
| Total | 17,916 (100.0%) | $42,877 |
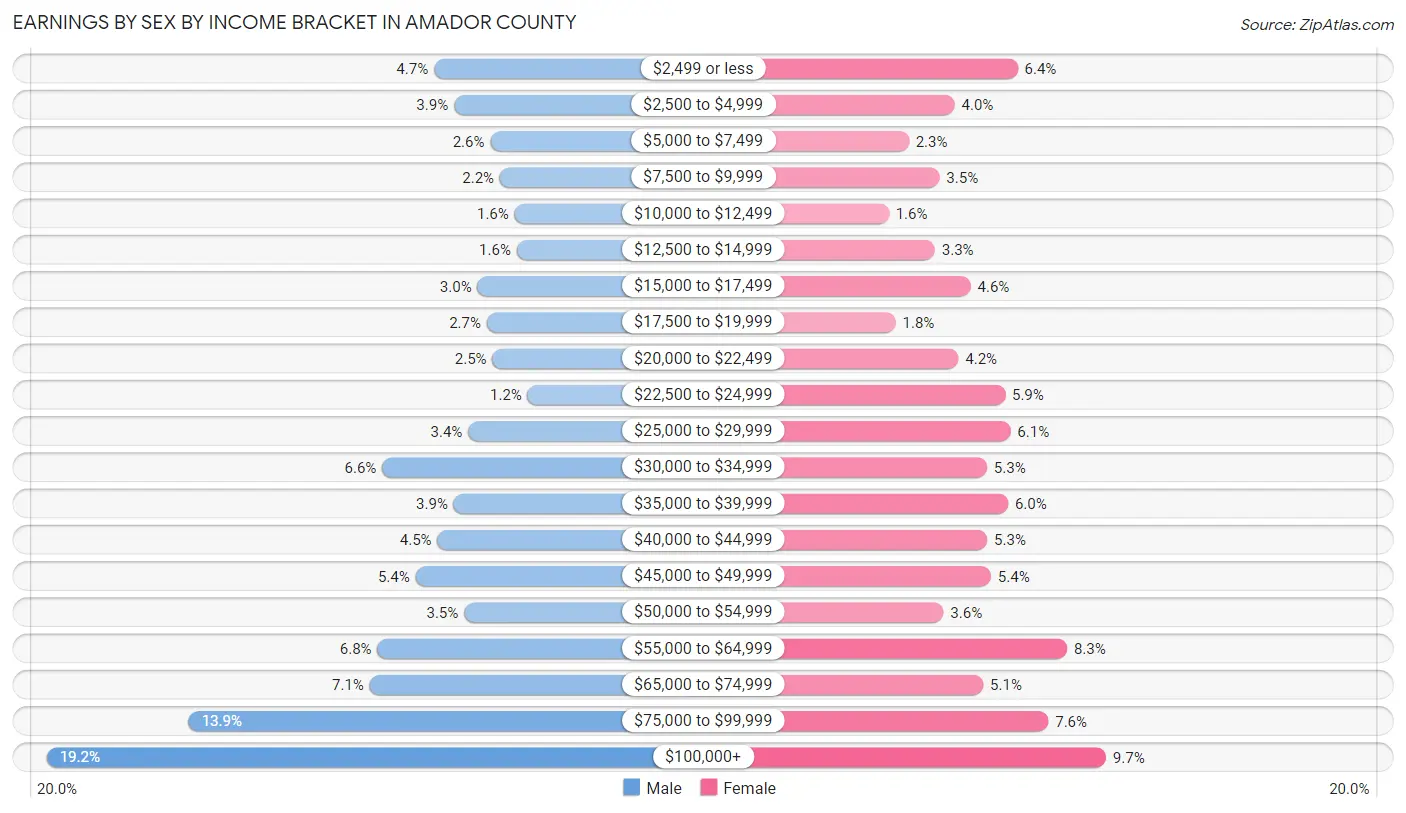
Earnings by Sex by Income Bracket in Amador County
The most common earnings brackets in Amador County are $100,000+ for men (1,934 | 19.2%) and $100,000+ for women (760 | 9.7%).
| Income | Male | Female |
| $2,499 or less | 470 (4.7%) | 501 (6.4%) |
| $2,500 to $4,999 | 394 (3.9%) | 316 (4.0%) |
| $5,000 to $7,499 | 257 (2.5%) | 182 (2.3%) |
| $7,500 to $9,999 | 221 (2.2%) | 272 (3.5%) |
| $10,000 to $12,499 | 165 (1.6%) | 123 (1.6%) |
| $12,500 to $14,999 | 157 (1.6%) | 258 (3.3%) |
| $15,000 to $17,499 | 306 (3.0%) | 363 (4.6%) |
| $17,500 to $19,999 | 270 (2.7%) | 143 (1.8%) |
| $20,000 to $22,499 | 249 (2.5%) | 327 (4.2%) |
| $22,500 to $24,999 | 116 (1.1%) | 464 (5.9%) |
| $25,000 to $29,999 | 341 (3.4%) | 480 (6.1%) |
| $30,000 to $34,999 | 666 (6.6%) | 411 (5.2%) |
| $35,000 to $39,999 | 395 (3.9%) | 473 (6.0%) |
| $40,000 to $44,999 | 457 (4.5%) | 412 (5.3%) |
| $45,000 to $49,999 | 540 (5.3%) | 423 (5.4%) |
| $50,000 to $54,999 | 356 (3.5%) | 283 (3.6%) |
| $55,000 to $64,999 | 684 (6.8%) | 646 (8.3%) |
| $65,000 to $74,999 | 713 (7.1%) | 400 (5.1%) |
| $75,000 to $99,999 | 1,397 (13.9%) | 591 (7.5%) |
| $100,000+ | 1,934 (19.2%) | 760 (9.7%) |
| Total | 10,088 (100.0%) | 7,828 (100.0%) |
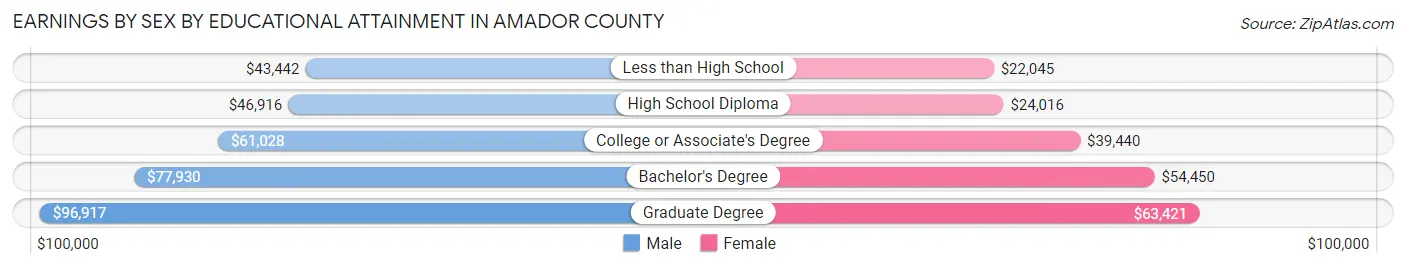
Earnings by Sex by Educational Attainment in Amador County
Average earnings in Amador County are $57,789 for men and $40,967 for women, a difference of 29.1%. Men with an educational attainment of graduate degree enjoy the highest average annual earnings of $96,917, while those with less than high school education earn the least with $43,442. Women with an educational attainment of graduate degree earn the most with the average annual earnings of $63,421, while those with less than high school education have the smallest earnings of $22,045.
| Educational Attainment | Male Income | Female Income |
| Less than High School | $43,442 | $22,045 |
| High School Diploma | $46,916 | $24,016 |
| College or Associate's Degree | $61,028 | $39,440 |
| Bachelor's Degree | $77,930 | $54,450 |
| Graduate Degree | $96,917 | $63,421 |
| Total | $57,789 | $40,967 |
Family Income in Amador County
Family Income Brackets in Amador County
According to the Amador County family income data, there are 2,225 families falling into the $100,000 to $149,999 income range, which is the most common income bracket and makes up 21.6% of all families. Conversely, the $10,000 to $14,999 income bracket is the least frequent group with only 103 families (1.0%) belonging to this category.
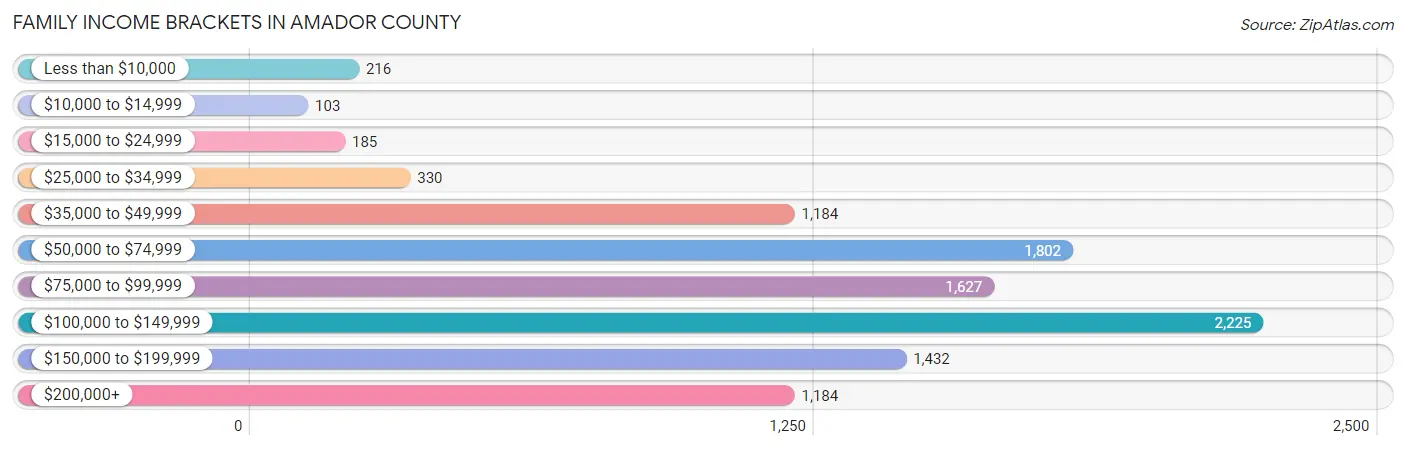
| Income Bracket | # Families | % Families |
| Less than $10,000 | 216 | 2.1% |
| $10,000 to $14,999 | 103 | 1.0% |
| $15,000 to $24,999 | 185 | 1.8% |
| $25,000 to $34,999 | 330 | 3.2% |
| $35,000 to $49,999 | 1,184 | 11.5% |
| $50,000 to $74,999 | 1,802 | 17.5% |
| $75,000 to $99,999 | 1,627 | 15.8% |
| $100,000 to $149,999 | 2,225 | 21.6% |
| $150,000 to $199,999 | 1,432 | 13.9% |
| $200,000+ | 1,184 | 11.5% |
Family Income by Famaliy Size in Amador County
5-person families (751 | 7.3%) account for the highest median family income in Amador County with $176,397 per family, while 2-person families (5,754 | 55.9%) have the highest median income of $43,316 per family member.
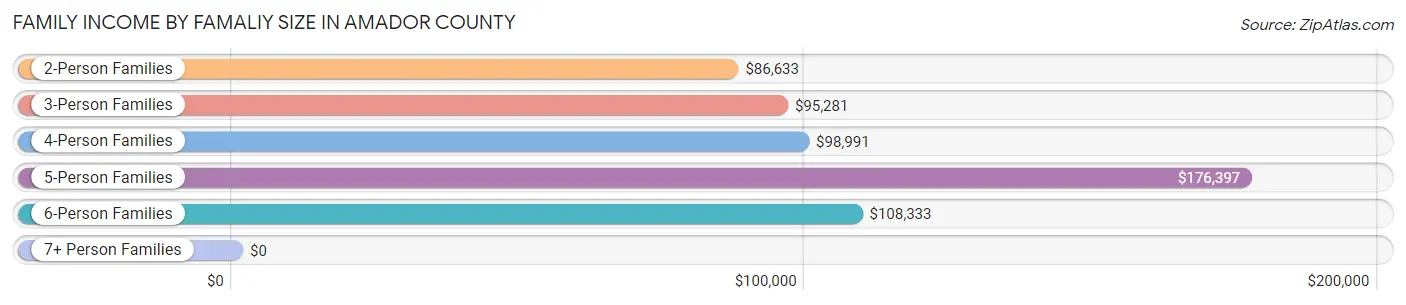
| Income Bracket | # Families | Median Income |
| 2-Person Families | 5,754 (55.9%) | $86,633 |
| 3-Person Families | 1,893 (18.4%) | $95,281 |
| 4-Person Families | 1,600 (15.5%) | $98,991 |
| 5-Person Families | 751 (7.3%) | $176,397 |
| 6-Person Families | 174 (1.7%) | $108,333 |
| 7+ Person Families | 127 (1.2%) | $0 |
| Total | 10,299 (100.0%) | $95,970 |
Family Income by Number of Earners in Amador County
The median family income in Amador County is $95,970, with families comprising 3+ earners (860) having the highest median family income of $158,125, while families with no earners (2,903) have the lowest median family income of $65,913, accounting for 8.4% and 28.2% of families, respectively.
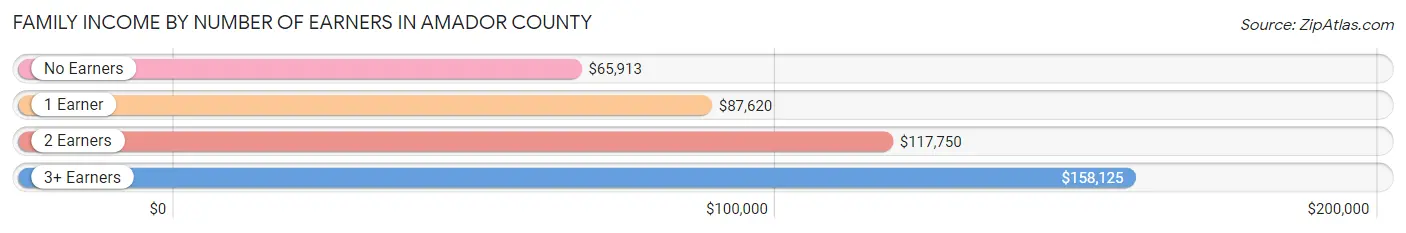
| Number of Earners | # Families | Median Income |
| No Earners | 2,903 (28.2%) | $65,913 |
| 1 Earner | 2,848 (27.7%) | $87,620 |
| 2 Earners | 3,688 (35.8%) | $117,750 |
| 3+ Earners | 860 (8.4%) | $158,125 |
| Total | 10,299 (100.0%) | $95,970 |
Household Income in Amador County
Household Income Brackets in Amador County
With 2,708 households falling in the category, the $50,000 to $74,999 income range is the most frequent in Amador County, accounting for 17.2% of all households. In contrast, only 488 households (3.1%) fall into the $10,000 to $14,999 income bracket, making it the least populous group.
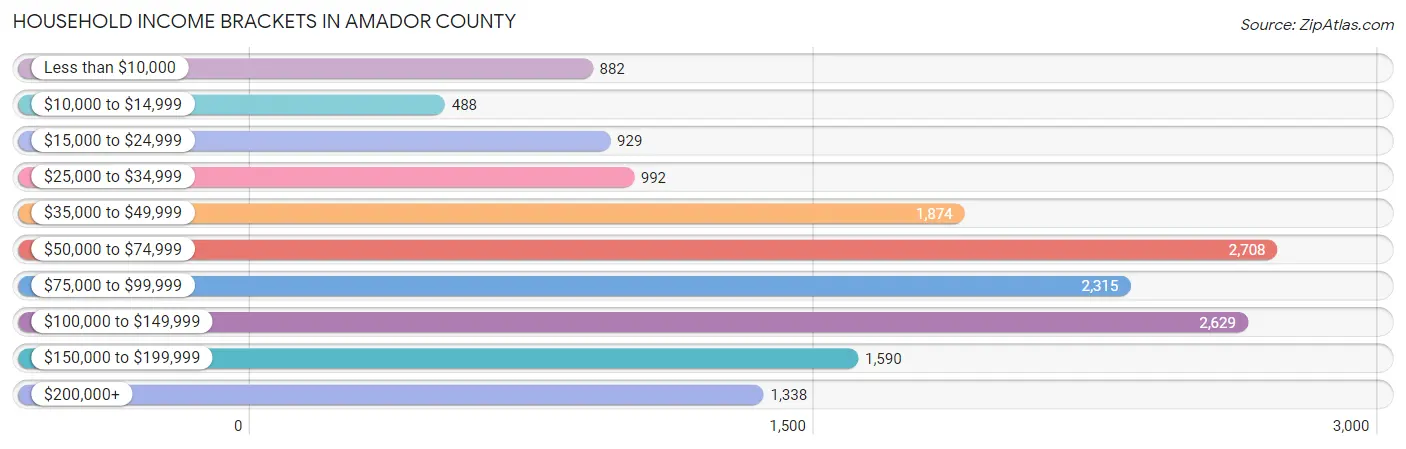
| Income Bracket | # Households | % Households |
| Less than $10,000 | 882 | 5.6% |
| $10,000 to $14,999 | 488 | 3.1% |
| $15,000 to $24,999 | 929 | 5.9% |
| $25,000 to $34,999 | 992 | 6.3% |
| $35,000 to $49,999 | 1,874 | 11.9% |
| $50,000 to $74,999 | 2,708 | 17.2% |
| $75,000 to $99,999 | 2,315 | 14.7% |
| $100,000 to $149,999 | 2,629 | 16.7% |
| $150,000 to $199,999 | 1,590 | 10.1% |
| $200,000+ | 1,338 | 8.5% |
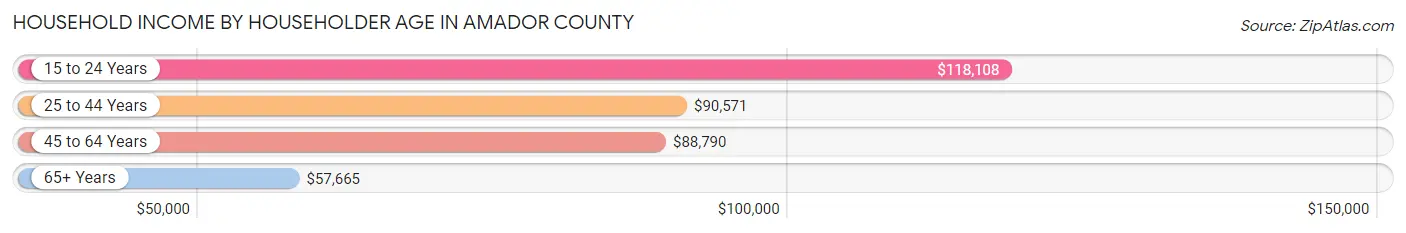
Household Income by Householder Age in Amador County
The median household income in Amador County is $74,853, with the highest median household income of $118,108 found in the 15 to 24 years age bracket for the primary householder. A total of 300 households (1.9%) fall into this category. Meanwhile, the 65+ years age bracket for the primary householder has the lowest median household income of $57,665, with 6,588 households (41.8%) in this group.
| Income Bracket | # Households | Median Income |
| 15 to 24 Years | 300 (1.9%) | $118,108 |
| 25 to 44 Years | 3,399 (21.6%) | $90,571 |
| 45 to 64 Years | 5,458 (34.7%) | $88,790 |
| 65+ Years | 6,588 (41.8%) | $57,665 |
| Total | 15,745 (100.0%) | $74,853 |
Poverty in Amador County
Income Below Poverty by Sex and Age in Amador County
With 7.1% poverty level for males and 8.6% for females among the residents of Amador County, 12 to 14 year old males and 45 to 54 year old females are the most vulnerable to poverty, with 65 males (12.3%) and 260 females (13.3%) in their respective age groups living below the poverty level.
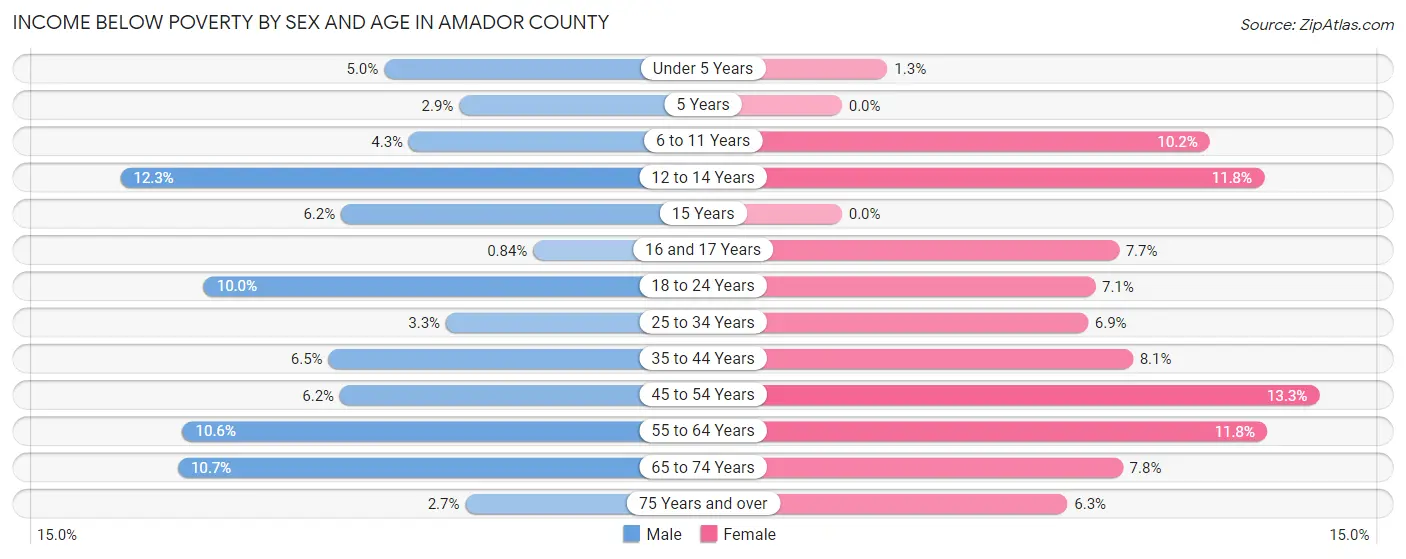
| Age Bracket | Male | Female |
| Under 5 Years | 40 (5.0%) | 9 (1.3%) |
| 5 Years | 6 (2.9%) | 0 (0.0%) |
| 6 to 11 Years | 43 (4.3%) | 105 (10.2%) |
| 12 to 14 Years | 65 (12.3%) | 53 (11.7%) |
| 15 Years | 12 (6.2%) | 0 (0.0%) |
| 16 and 17 Years | 3 (0.8%) | 27 (7.7%) |
| 18 to 24 Years | 132 (10.0%) | 70 (7.0%) |
| 25 to 34 Years | 65 (3.3%) | 124 (6.9%) |
| 35 to 44 Years | 164 (6.5%) | 148 (8.1%) |
| 45 to 54 Years | 146 (6.2%) | 260 (13.3%) |
| 55 to 64 Years | 323 (10.6%) | 375 (11.8%) |
| 65 to 74 Years | 310 (10.7%) | 270 (7.8%) |
| 75 Years and over | 52 (2.7%) | 143 (6.3%) |
| Total | 1,361 (7.1%) | 1,584 (8.6%) |
Income Above Poverty by Sex and Age in Amador County
According to the poverty statistics in Amador County, males aged 16 and 17 years and females aged 5 years are the age groups that are most secure financially, with 99.2% of males and 100.0% of females in these age groups living above the poverty line.
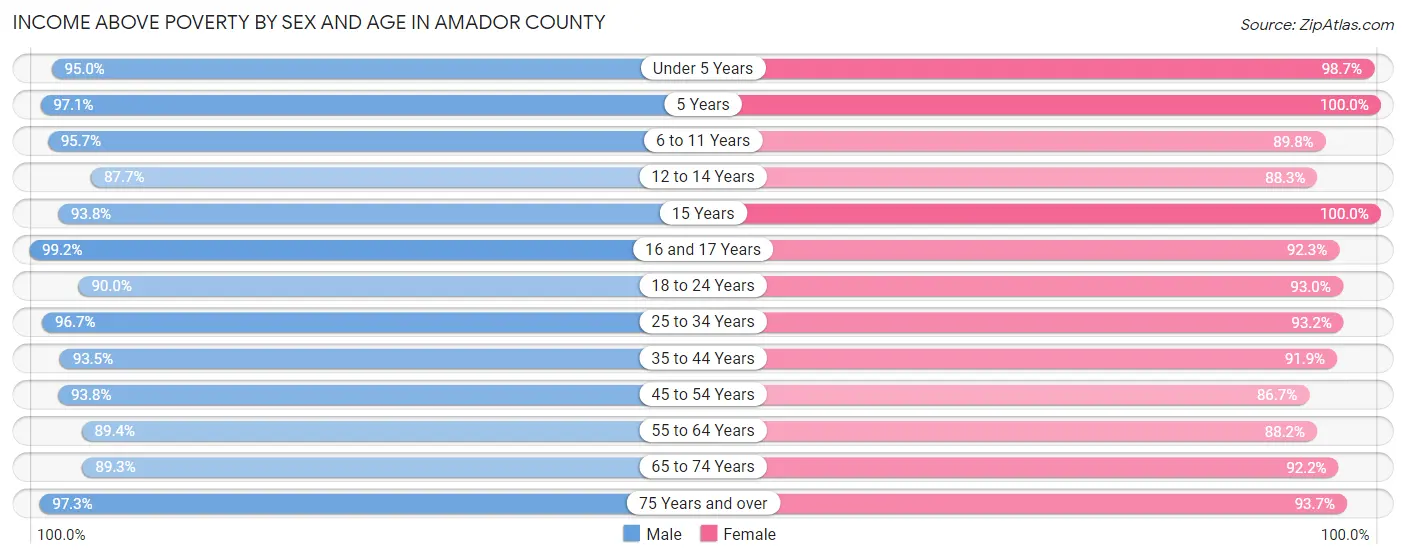
| Age Bracket | Male | Female |
| Under 5 Years | 762 (95.0%) | 700 (98.7%) |
| 5 Years | 201 (97.1%) | 278 (100.0%) |
| 6 to 11 Years | 958 (95.7%) | 920 (89.8%) |
| 12 to 14 Years | 462 (87.7%) | 398 (88.2%) |
| 15 Years | 182 (93.8%) | 174 (100.0%) |
| 16 and 17 Years | 356 (99.2%) | 323 (92.3%) |
| 18 to 24 Years | 1,187 (90.0%) | 923 (92.9%) |
| 25 to 34 Years | 1,924 (96.7%) | 1,686 (93.1%) |
| 35 to 44 Years | 2,342 (93.5%) | 1,680 (91.9%) |
| 45 to 54 Years | 2,200 (93.8%) | 1,696 (86.7%) |
| 55 to 64 Years | 2,725 (89.4%) | 2,796 (88.2%) |
| 65 to 74 Years | 2,580 (89.3%) | 3,184 (92.2%) |
| 75 Years and over | 1,854 (97.3%) | 2,135 (93.7%) |
| Total | 17,733 (92.9%) | 16,893 (91.4%) |
Income Below Poverty Among Married-Couple Families in Amador County
The poverty statistics for married-couple families in Amador County show that 2.0% or 165 of the total 8,158 families live below the poverty line. Families with no children have the highest poverty rate of 2.5%, comprising of 136 families. On the other hand, families with 5 or more children have the lowest poverty rate of 0.0%, which includes 0 families.
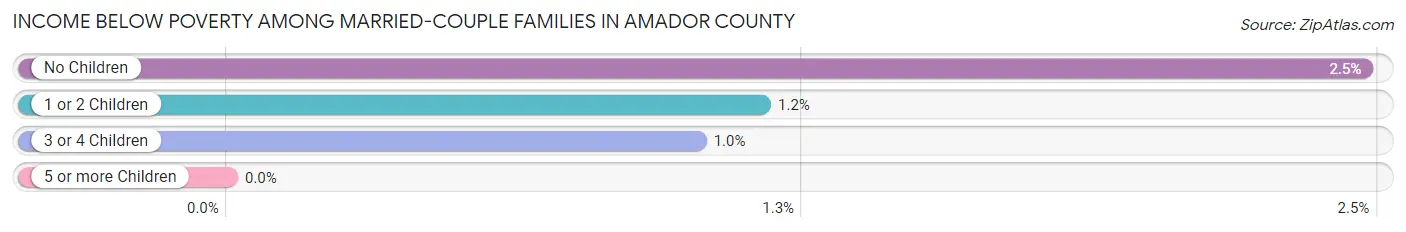
| Children | Above Poverty | Below Poverty |
| No Children | 5,373 (97.5%) | 136 (2.5%) |
| 1 or 2 Children | 1,968 (98.8%) | 23 (1.2%) |
| 3 or 4 Children | 585 (99.0%) | 6 (1.0%) |
| 5 or more Children | 67 (100.0%) | 0 (0.0%) |
| Total | 7,993 (98.0%) | 165 (2.0%) |
Income Below Poverty Among Single-Parent Households in Amador County
According to the poverty data in Amador County, 10.2% or 73 single-father households and 14.2% or 203 single-mother households are living below the poverty line. Among single-father households, those with 1 or 2 children have the highest poverty rate, with 53 households (18.3%) experiencing poverty. Likewise, among single-mother households, those with 1 or 2 children have the highest poverty rate, with 168 households (25.3%) falling below the poverty line.
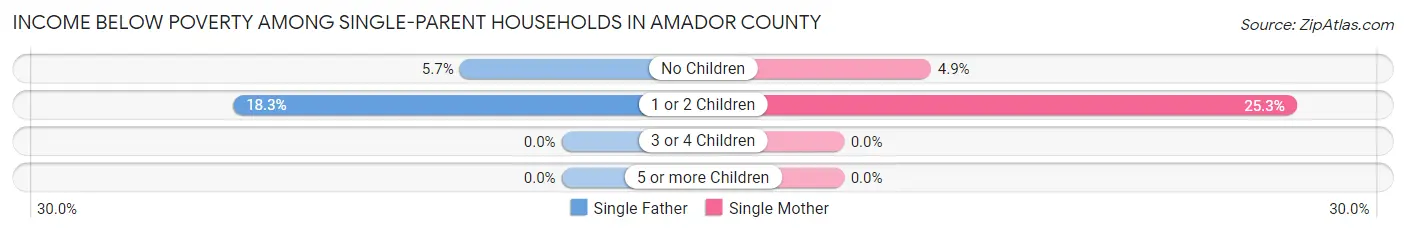
| Children | Single Father | Single Mother |
| No Children | 20 (5.7%) | 35 (4.9%) |
| 1 or 2 Children | 53 (18.3%) | 168 (25.3%) |
| 3 or 4 Children | 0 (0.0%) | 0 (0.0%) |
| 5 or more Children | 0 (0.0%) | 0 (0.0%) |
| Total | 73 (10.2%) | 203 (14.2%) |
Income Below Poverty Among Married-Couple vs Single-Parent Households in Amador County
The poverty data for Amador County shows that 165 of the married-couple family households (2.0%) and 276 of the single-parent households (12.9%) are living below the poverty level. Within the married-couple family households, those with no children have the highest poverty rate, with 136 households (2.5%) falling below the poverty line. Among the single-parent households, those with 1 or 2 children have the highest poverty rate, with 221 household (23.2%) living below poverty.
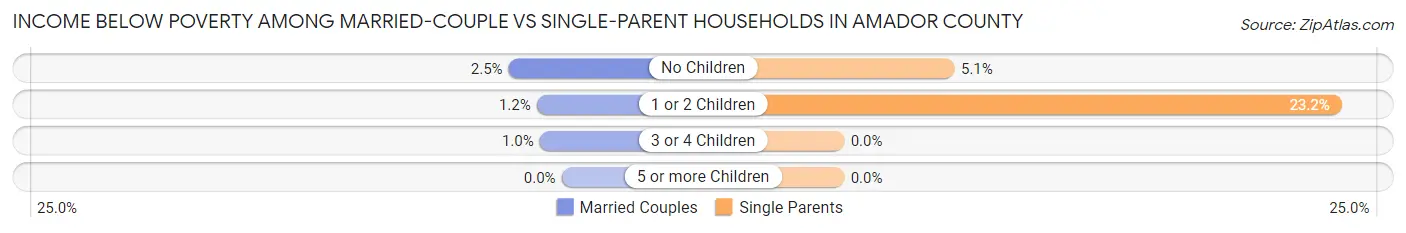
| Children | Married-Couple Families | Single-Parent Households |
| No Children | 136 (2.5%) | 55 (5.1%) |
| 1 or 2 Children | 23 (1.2%) | 221 (23.2%) |
| 3 or 4 Children | 6 (1.0%) | 0 (0.0%) |
| 5 or more Children | 0 (0.0%) | 0 (0.0%) |
| Total | 165 (2.0%) | 276 (12.9%) |
Race in Amador County
The most populous races in Amador County are White / Caucasian (32,583 | 80.3%), Hispanic or Latino (6,140 | 15.1%), and Two or more Races (4,179 | 10.3%).
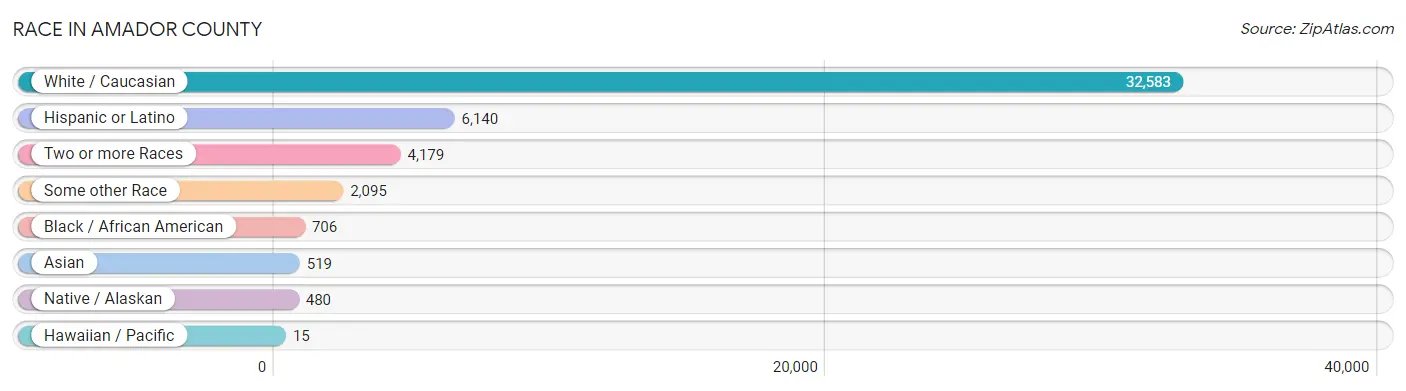
| Race | # Population | % Population |
| Asian | 519 | 1.3% |
| Black / African American | 706 | 1.7% |
| Hawaiian / Pacific | 15 | 0.0% |
| Hispanic or Latino | 6,140 | 15.1% |
| Native / Alaskan | 480 | 1.2% |
| White / Caucasian | 32,583 | 80.3% |
| Two or more Races | 4,179 | 10.3% |
| Some other Race | 2,095 | 5.2% |
| Total | 40,577 | 100.0% |
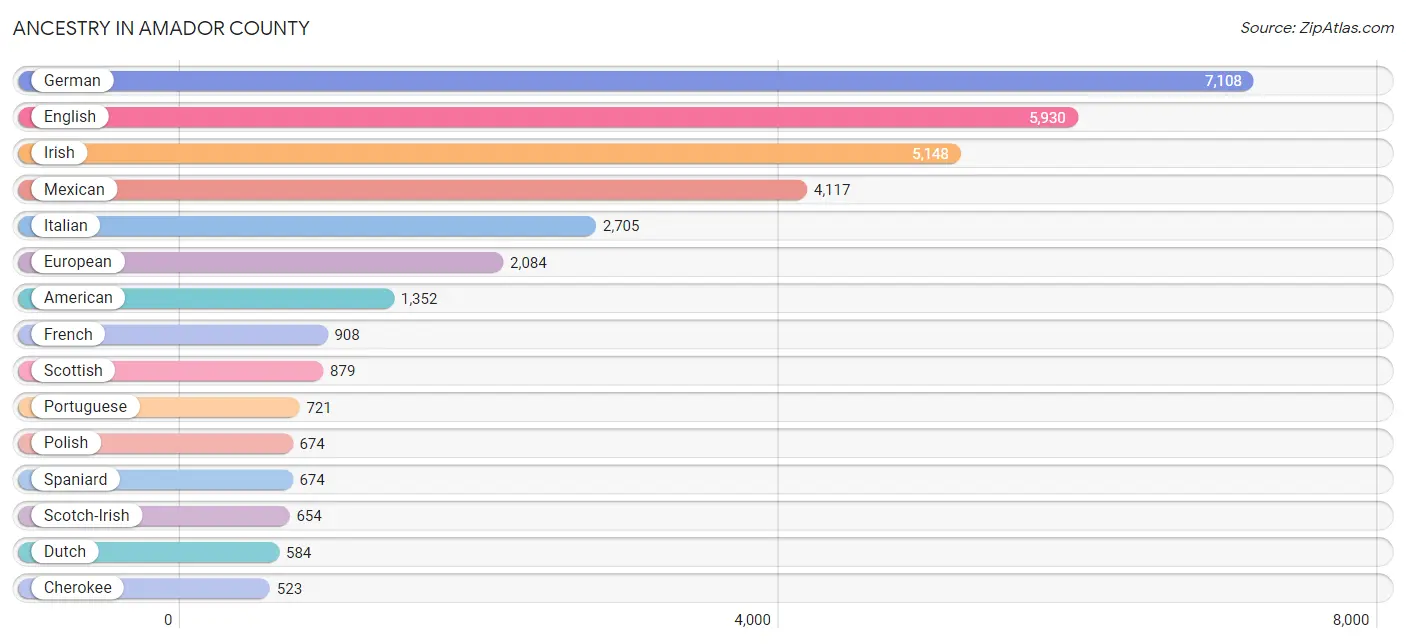
Ancestry in Amador County
The most populous ancestries reported in Amador County are German (7,108 | 17.5%), English (5,930 | 14.6%), Irish (5,148 | 12.7%), Mexican (4,117 | 10.2%), and Italian (2,705 | 6.7%), together accounting for 61.6% of all Amador County residents.
| Ancestry | # Population | % Population |
| African | 24 | 0.1% |
| American | 1,352 | 3.3% |
| Apache | 77 | 0.2% |
| Arab | 153 | 0.4% |
| Argentinean | 15 | 0.0% |
| Armenian | 180 | 0.4% |
| Assyrian / Chaldean / Syriac | 14 | 0.0% |
| Australian | 43 | 0.1% |
| Austrian | 42 | 0.1% |
| Belgian | 56 | 0.1% |
| Belizean | 36 | 0.1% |
| Bhutanese | 205 | 0.5% |
| Blackfeet | 109 | 0.3% |
| Brazilian | 6 | 0.0% |
| British | 271 | 0.7% |
| Burmese | 89 | 0.2% |
| Canadian | 74 | 0.2% |
| Cape Verdean | 22 | 0.1% |
| Celtic | 15 | 0.0% |
| Central American | 76 | 0.2% |
| Central American Indian | 18 | 0.0% |
| Cherokee | 523 | 1.3% |
| Cheyenne | 36 | 0.1% |
| Chickasaw | 17 | 0.0% |
| Chinese | 10 | 0.0% |
| Choctaw | 45 | 0.1% |
| Colombian | 18 | 0.0% |
| Comanche | 41 | 0.1% |
| Creek | 17 | 0.0% |
| Croatian | 95 | 0.2% |
| Cuban | 135 | 0.3% |
| Czech | 144 | 0.4% |
| Czechoslovakian | 22 | 0.1% |
| Danish | 342 | 0.8% |
| Dominican | 10 | 0.0% |
| Dutch | 584 | 1.4% |
| Eastern European | 51 | 0.1% |
| English | 5,930 | 14.6% |
| Ethiopian | 32 | 0.1% |
| European | 2,084 | 5.1% |
| Finnish | 117 | 0.3% |
| French | 908 | 2.2% |
| French Canadian | 289 | 0.7% |
| German | 7,108 | 17.5% |
| Greek | 310 | 0.8% |
| Guamanian / Chamorro | 45 | 0.1% |
| Guatemalan | 28 | 0.1% |
| Haitian | 18 | 0.0% |
| Honduran | 16 | 0.0% |
| Hopi | 23 | 0.1% |
| Hungarian | 216 | 0.5% |
| Icelander | 4 | 0.0% |
| Indian (Asian) | 316 | 0.8% |
| Irish | 5,148 | 12.7% |
| Iroquois | 47 | 0.1% |
| Italian | 2,705 | 6.7% |
| Jamaican | 14 | 0.0% |
| Japanese | 96 | 0.2% |
| Korean | 498 | 1.2% |
| Laotian | 29 | 0.1% |
| Lebanese | 20 | 0.1% |
| Lithuanian | 10 | 0.0% |
| Mexican | 4,117 | 10.2% |
| Mexican American Indian | 28 | 0.1% |
| Native Hawaiian | 122 | 0.3% |
| Navajo | 7 | 0.0% |
| Nicaraguan | 11 | 0.0% |
| Nigerian | 3 | 0.0% |
| Northern European | 162 | 0.4% |
| Norwegian | 510 | 1.3% |
| Osage | 3 | 0.0% |
| Pennsylvania German | 4 | 0.0% |
| Peruvian | 129 | 0.3% |
| Polish | 674 | 1.7% |
| Portuguese | 721 | 1.8% |
| Potawatomi | 52 | 0.1% |
| Puerto Rican | 146 | 0.4% |
| Russian | 228 | 0.6% |
| Salvadoran | 21 | 0.1% |
| Samoan | 11 | 0.0% |
| Scandinavian | 360 | 0.9% |
| Scotch-Irish | 654 | 1.6% |
| Scottish | 879 | 2.2% |
| Seminole | 7 | 0.0% |
| Serbian | 16 | 0.0% |
| Shoshone | 48 | 0.1% |
| Sioux | 13 | 0.0% |
| Slavic | 13 | 0.0% |
| South American | 259 | 0.6% |
| Spaniard | 674 | 1.7% |
| Spanish | 431 | 1.1% |
| Sri Lankan | 44 | 0.1% |
| Subsaharan African | 87 | 0.2% |
| Sudanese | 3 | 0.0% |
| Swedish | 420 | 1.0% |
| Swiss | 264 | 0.6% |
| Thai | 48 | 0.1% |
| Tongan | 12 | 0.0% |
| Trinidadian and Tobagonian | 5 | 0.0% |
| Ukrainian | 183 | 0.4% |
| Venezuelan | 97 | 0.2% |
| Welsh | 221 | 0.5% |
| Yaqui | 19 | 0.1% |
| Yugoslavian | 67 | 0.2% |
| Zimbabwean | 3 | 0.0% | View All 105 Rows |
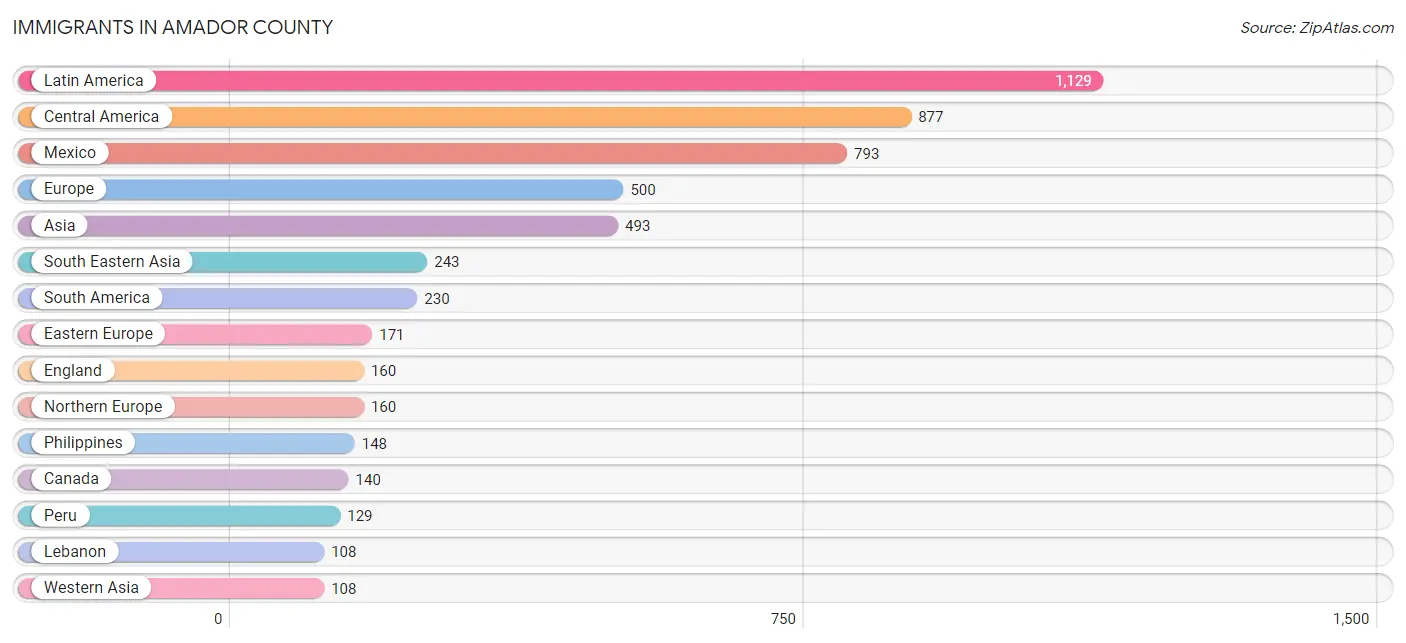
Immigrants in Amador County
The most numerous immigrant groups reported in Amador County came from Latin America (1,129 | 2.8%), Central America (877 | 2.2%), Mexico (793 | 1.9%), Europe (500 | 1.2%), and Asia (493 | 1.2%), together accounting for 9.3% of all Amador County residents.
| Immigration Origin | # Population | % Population |
| Afghanistan | 64 | 0.2% |
| Africa | 43 | 0.1% |
| Asia | 493 | 1.2% |
| Australia | 27 | 0.1% |
| Austria | 22 | 0.1% |
| Barbados | 3 | 0.0% |
| Brazil | 6 | 0.0% |
| Cambodia | 58 | 0.1% |
| Canada | 140 | 0.4% |
| Caribbean | 22 | 0.1% |
| Central America | 877 | 2.2% |
| China | 29 | 0.1% |
| Colombia | 18 | 0.0% |
| Croatia | 33 | 0.1% |
| Cuba | 19 | 0.1% |
| Eastern Africa | 21 | 0.1% |
| Eastern Asia | 63 | 0.2% |
| Eastern Europe | 171 | 0.4% |
| Ecuador | 2 | 0.0% |
| Egypt | 22 | 0.1% |
| El Salvador | 22 | 0.1% |
| England | 160 | 0.4% |
| Ethiopia | 18 | 0.0% |
| Europe | 500 | 1.2% |
| Fiji | 9 | 0.0% |
| Germany | 24 | 0.1% |
| Greece | 45 | 0.1% |
| Guatemala | 34 | 0.1% |
| Honduras | 28 | 0.1% |
| India | 7 | 0.0% |
| Iran | 8 | 0.0% |
| Italy | 8 | 0.0% |
| Japan | 21 | 0.1% |
| Korea | 13 | 0.0% |
| Latin America | 1,129 | 2.8% |
| Lebanon | 108 | 0.3% |
| Mexico | 793 | 1.9% |
| Moldova | 7 | 0.0% |
| Netherlands | 53 | 0.1% |
| Northern Africa | 22 | 0.1% |
| Northern Europe | 160 | 0.4% |
| Oceania | 36 | 0.1% |
| Peru | 129 | 0.3% |
| Philippines | 148 | 0.4% |
| Poland | 5 | 0.0% |
| Portugal | 17 | 0.0% |
| Romania | 7 | 0.0% |
| Russia | 40 | 0.1% |
| Serbia | 5 | 0.0% |
| South America | 230 | 0.6% |
| South Central Asia | 79 | 0.2% |
| South Eastern Asia | 243 | 0.6% |
| Southern Europe | 70 | 0.2% |
| Taiwan | 25 | 0.1% |
| Ukraine | 41 | 0.1% |
| Venezuela | 75 | 0.2% |
| Vietnam | 37 | 0.1% |
| Western Asia | 108 | 0.3% |
| Western Europe | 99 | 0.2% |
| Zimbabwe | 3 | 0.0% | View All 60 Rows |
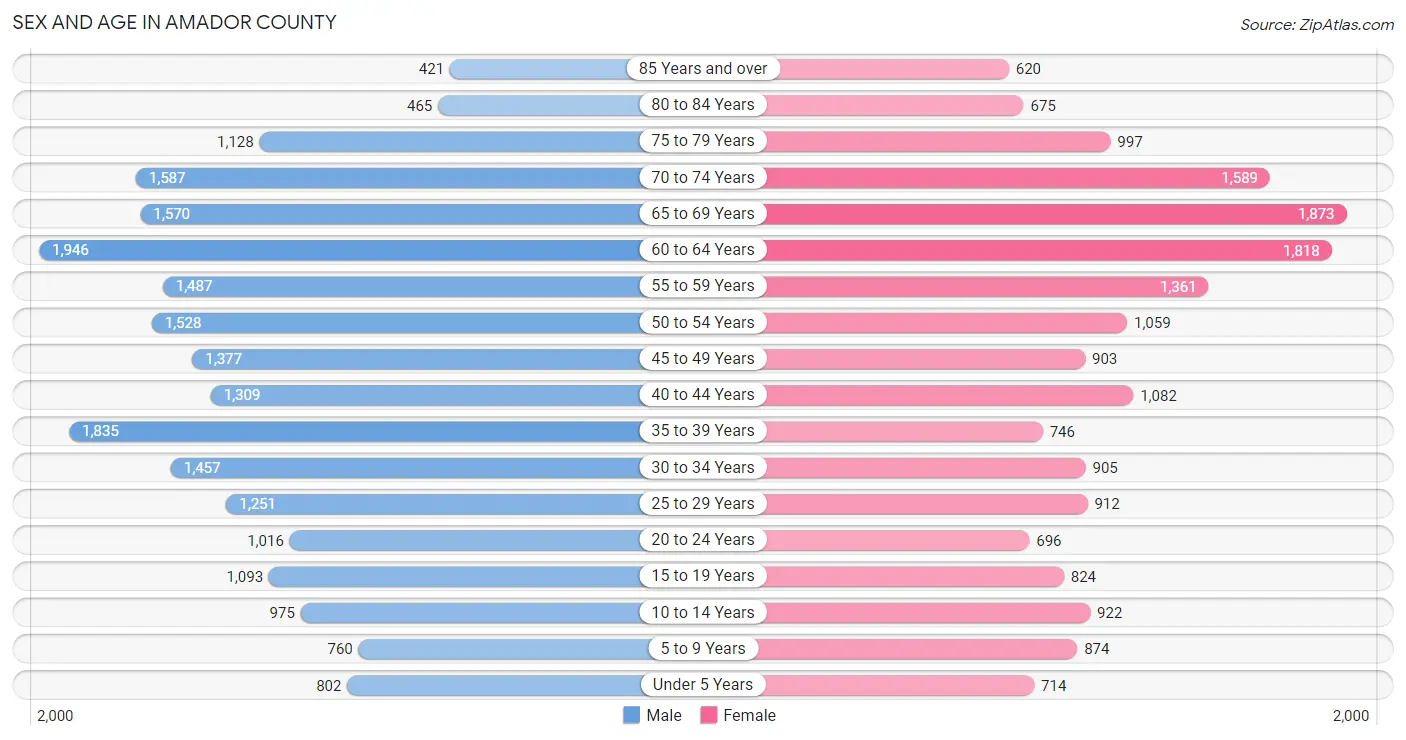
Sex and Age in Amador County
Sex and Age in Amador County
The most populous age groups in Amador County are 60 to 64 Years (1,946 | 8.8%) for men and 65 to 69 Years (1,873 | 10.1%) for women.
| Age Bracket | Male | Female |
| Under 5 Years | 802 (3.6%) | 714 (3.8%) |
| 5 to 9 Years | 760 (3.5%) | 874 (4.7%) |
| 10 to 14 Years | 975 (4.4%) | 922 (5.0%) |
| 15 to 19 Years | 1,093 (5.0%) | 824 (4.4%) |
| 20 to 24 Years | 1,016 (4.6%) | 696 (3.7%) |
| 25 to 29 Years | 1,251 (5.7%) | 912 (4.9%) |
| 30 to 34 Years | 1,457 (6.6%) | 905 (4.9%) |
| 35 to 39 Years | 1,835 (8.3%) | 746 (4.0%) |
| 40 to 44 Years | 1,309 (5.9%) | 1,082 (5.8%) |
| 45 to 49 Years | 1,377 (6.3%) | 903 (4.9%) |
| 50 to 54 Years | 1,528 (6.9%) | 1,059 (5.7%) |
| 55 to 59 Years | 1,487 (6.8%) | 1,361 (7.3%) |
| 60 to 64 Years | 1,946 (8.8%) | 1,818 (9.8%) |
| 65 to 69 Years | 1,570 (7.1%) | 1,873 (10.1%) |
| 70 to 74 Years | 1,587 (7.2%) | 1,589 (8.6%) |
| 75 to 79 Years | 1,128 (5.1%) | 997 (5.4%) |
| 80 to 84 Years | 465 (2.1%) | 675 (3.6%) |
| 85 Years and over | 421 (1.9%) | 620 (3.3%) |
| Total | 22,007 (100.0%) | 18,570 (100.0%) |
Families and Households in Amador County
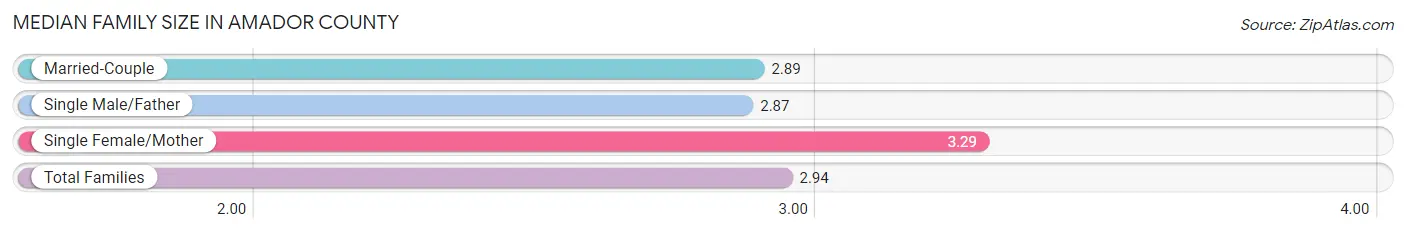
Median Family Size in Amador County
The median family size in Amador County is 2.94 persons per family, with single female/mother families (1,426 | 13.9%) accounting for the largest median family size of 3.29 persons per family. On the other hand, single male/father families (715 | 6.9%) represent the smallest median family size with 2.87 persons per family.
| Family Type | # Families | Family Size |
| Married-Couple | 8,158 (79.2%) | 2.89 |
| Single Male/Father | 715 (6.9%) | 2.87 |
| Single Female/Mother | 1,426 (13.9%) | 3.29 |
| Total Families | 10,299 (100.0%) | 2.94 |
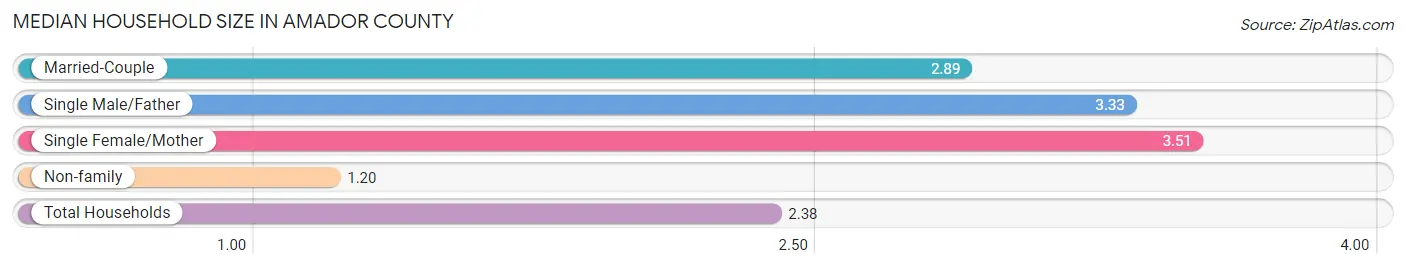
Median Household Size in Amador County
The median household size in Amador County is 2.38 persons per household, with single female/mother households (1,426 | 9.1%) accounting for the largest median household size of 3.51 persons per household. non-family households (5,446 | 34.6%) represent the smallest median household size with 1.20 persons per household.
| Household Type | # Households | Household Size |
| Married-Couple | 8,158 (51.8%) | 2.89 |
| Single Male/Father | 715 (4.5%) | 3.33 |
| Single Female/Mother | 1,426 (9.1%) | 3.51 |
| Non-family | 5,446 (34.6%) | 1.20 |
| Total Households | 15,745 (100.0%) | 2.38 |
Household Size by Marriage Status in Amador County
Out of a total of 15,745 households in Amador County, 10,299 (65.4%) are family households, while 5,446 (34.6%) are nonfamily households. The most numerous type of family households are 2-person households, comprising 5,520, and the most common type of nonfamily households are 1-person households, comprising 4,638.
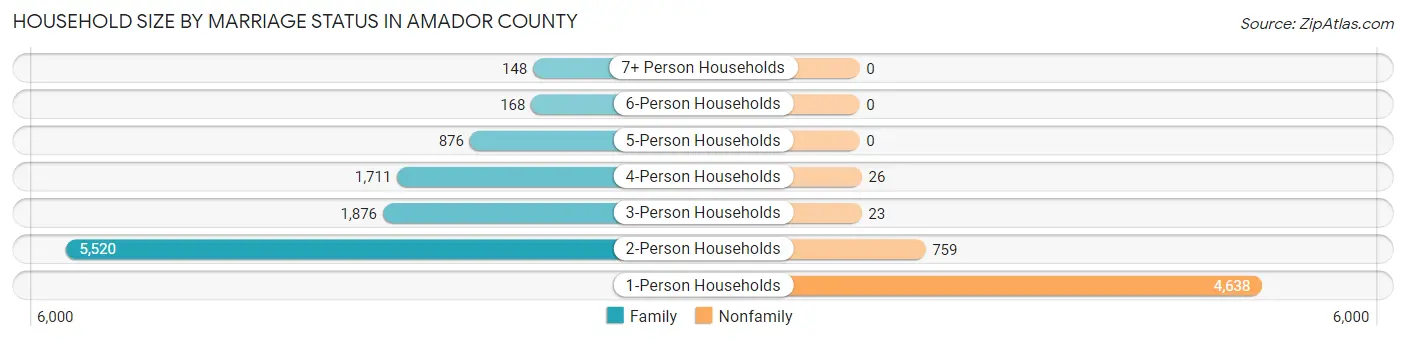
| Household Size | Family Households | Nonfamily Households |
| 1-Person Households | - | 4,638 (29.5%) |
| 2-Person Households | 5,520 (35.1%) | 759 (4.8%) |
| 3-Person Households | 1,876 (11.9%) | 23 (0.2%) |
| 4-Person Households | 1,711 (10.9%) | 26 (0.2%) |
| 5-Person Households | 876 (5.6%) | 0 (0.0%) |
| 6-Person Households | 168 (1.1%) | 0 (0.0%) |
| 7+ Person Households | 148 (0.9%) | 0 (0.0%) |
| Total | 10,299 (65.4%) | 5,446 (34.6%) |
Female Fertility in Amador County
Fertility by Age in Amador County
Average fertility rate in Amador County is 56.0 births per 1,000 women. Women in the age bracket of 20 to 34 years have the highest fertility rate with 74.0 births per 1,000 women. Women in the age bracket of 20 to 34 years acount for 53.2% of all women with births.
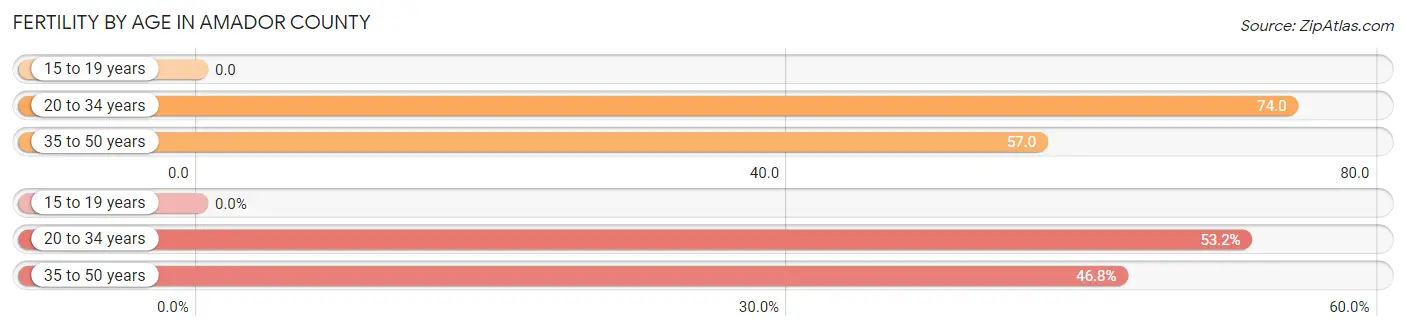
| Age Bracket | Women with Births | Births / 1,000 Women |
| 15 to 19 years | 0 (0.0%) | 0.0 |
| 20 to 34 years | 185 (53.2%) | 74.0 |
| 35 to 50 years | 163 (46.8%) | 57.0 |
| Total | 348 (100.0%) | 56.0 |
Fertility by Age by Marriage Status in Amador County
98.6% of women with births (348) in Amador County are married. The highest percentage of unmarried women with births falls into 20 to 34 years age bracket with 2.7% of them unmarried at the time of birth, while the lowest percentage of unmarried women with births belong to 35 to 50 years age bracket with 0.0% of them unmarried.
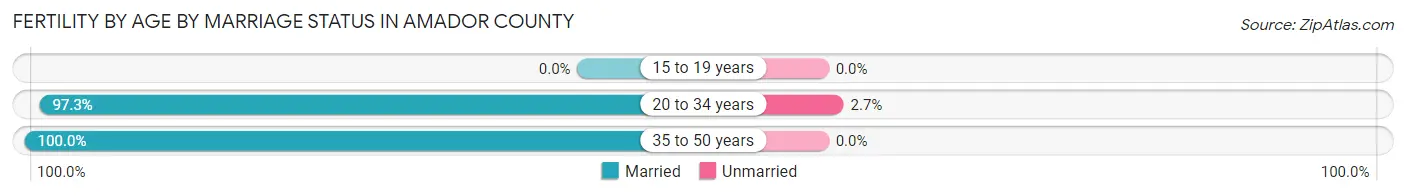
| Age Bracket | Married | Unmarried |
| 15 to 19 years | 0 (0.0%) | 0 (0.0%) |
| 20 to 34 years | 180 (97.3%) | 5 (2.7%) |
| 35 to 50 years | 163 (100.0%) | 0 (0.0%) |
| Total | 343 (98.6%) | 5 (1.4%) |
Fertility by Education in Amador County
Average fertility rate in Amador County is 56.0 births per 1,000 women. Women with the education attainment of graduate degree have the highest fertility rate of 87.0 births per 1,000 women, while women with the education attainment of high school diploma have the lowest fertility at 18.0 births per 1,000 women. Women with the education attainment of college or associate's degree represent 56.3% of all women with births.
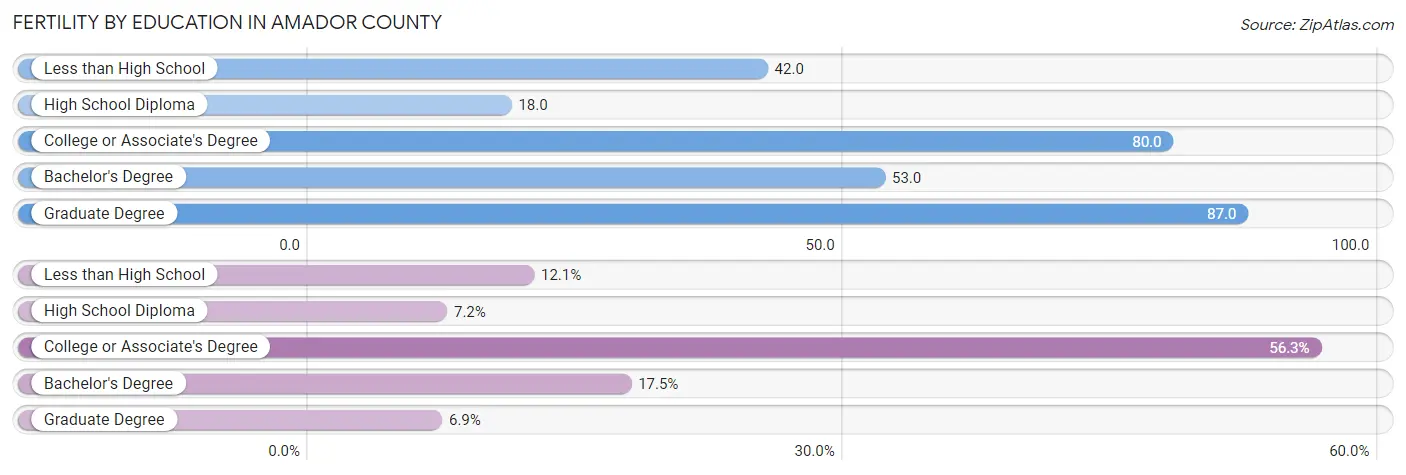
| Educational Attainment | Women with Births | Births / 1,000 Women |
| Less than High School | 42 (12.1%) | 42.0 |
| High School Diploma | 25 (7.2%) | 18.0 |
| College or Associate's Degree | 196 (56.3%) | 80.0 |
| Bachelor's Degree | 61 (17.5%) | 53.0 |
| Graduate Degree | 24 (6.9%) | 87.0 |
| Total | 348 (100.0%) | 56.0 |
Fertility by Education by Marriage Status in Amador County
1.4% of women with births in Amador County are unmarried. Women with the educational attainment of less than high school are most likely to be married with 100.0% of them married at childbirth, while women with the educational attainment of college or associate's degree are least likely to be married with 2.5% of them unmarried at childbirth.
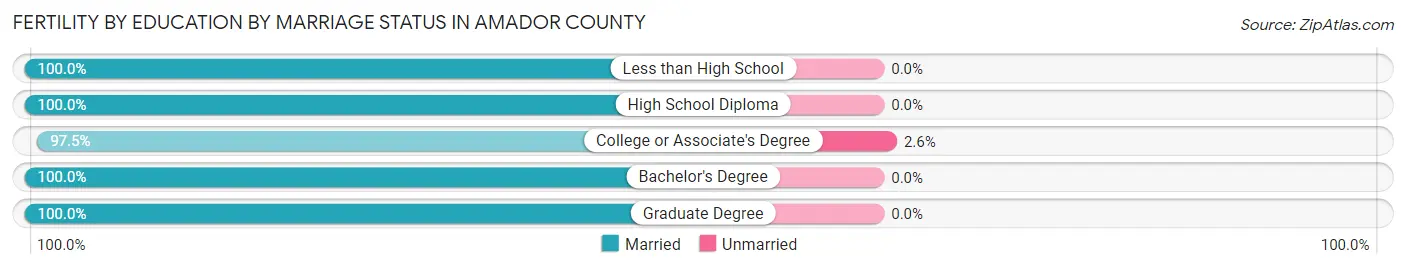
| Educational Attainment | Married | Unmarried |
| Less than High School | 42 (100.0%) | 0 (0.0%) |
| High School Diploma | 25 (100.0%) | 0 (0.0%) |
| College or Associate's Degree | 191 (97.5%) | 5 (2.5%) |
| Bachelor's Degree | 61 (100.0%) | 0 (0.0%) |
| Graduate Degree | 24 (100.0%) | 0 (0.0%) |
| Total | 343 (98.6%) | 5 (1.4%) |
Employment Characteristics in Amador County
Employment by Class of Employer in Amador County
Among the 15,508 employed individuals in Amador County, private company employees (8,686 | 56.0%), self-employed (not incorporated) (1,896 | 12.2%), and local government employees (1,683 | 10.8%) make up the most common classes of employment.
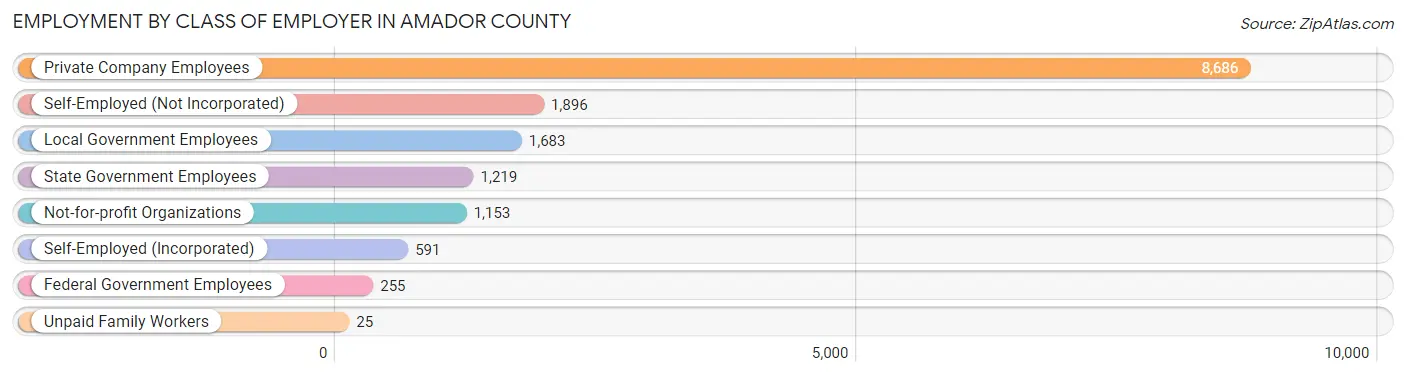
| Employer Class | # Employees | % Employees |
| Private Company Employees | 8,686 | 56.0% |
| Self-Employed (Incorporated) | 591 | 3.8% |
| Self-Employed (Not Incorporated) | 1,896 | 12.2% |
| Not-for-profit Organizations | 1,153 | 7.4% |
| Local Government Employees | 1,683 | 10.8% |
| State Government Employees | 1,219 | 7.9% |
| Federal Government Employees | 255 | 1.6% |
| Unpaid Family Workers | 25 | 0.2% |
| Total | 15,508 | 100.0% |
Employment Status by Age in Amador County
According to the labor force statistics for Amador County, out of the total population over 16 years of age (35,155), 48.1% or 16,910 individuals are in the labor force, with 6.0% or 1,015 of them unemployed. The age group with the highest labor force participation rate is 20 to 24 years, with 85.6% or 1,465 individuals in the labor force. Within the labor force, the 20 to 24 years age range has the highest percentage of unemployed individuals, with 10.0% or 146 of them being unemployed.
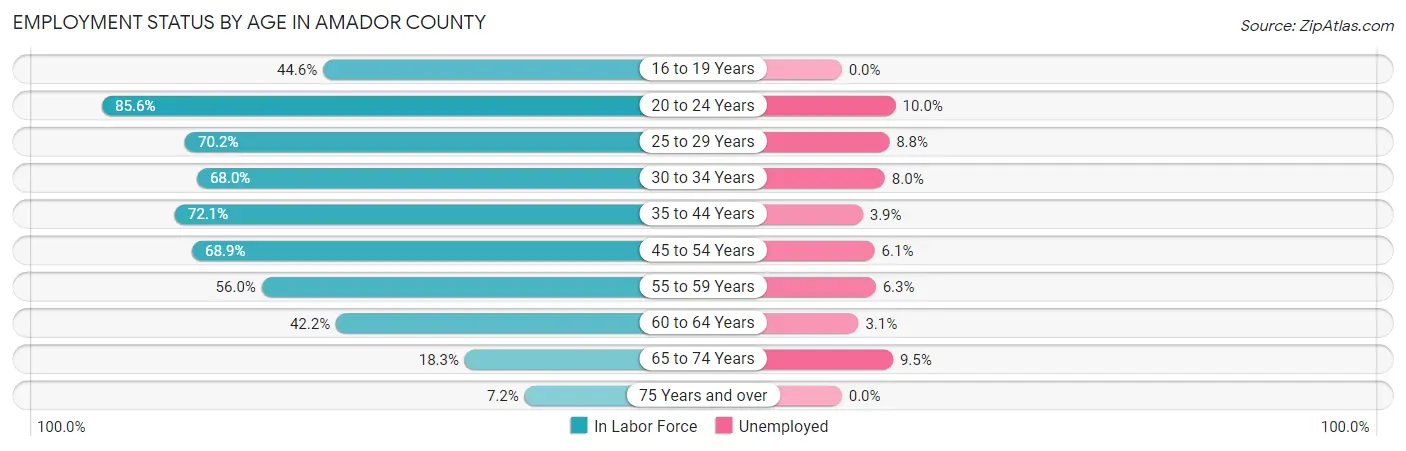
| Age Bracket | In Labor Force | Unemployed |
| 16 to 19 Years | 688 (44.6%) | 0 (0.0%) |
| 20 to 24 Years | 1,465 (85.6%) | 146 (10.0%) |
| 25 to 29 Years | 1,518 (70.2%) | 134 (8.8%) |
| 30 to 34 Years | 1,606 (68.0%) | 128 (8.0%) |
| 35 to 44 Years | 3,585 (72.1%) | 140 (3.9%) |
| 45 to 54 Years | 3,353 (68.9%) | 205 (6.1%) |
| 55 to 59 Years | 1,595 (56.0%) | 100 (6.3%) |
| 60 to 64 Years | 1,588 (42.2%) | 49 (3.1%) |
| 65 to 74 Years | 1,211 (18.3%) | 115 (9.5%) |
| 75 Years and over | 310 (7.2%) | 0 (0.0%) |
| Total | 16,910 (48.1%) | 1,015 (6.0%) |
Employment Status by Educational Attainment in Amador County
According to labor force statistics for Amador County, 63.2% of individuals (13,257) out of the total population between 25 and 64 years of age (20,976) are in the labor force, with 5.7% or 756 of them being unemployed. The group with the highest labor force participation rate are those with the educational attainment of bachelor's degree or higher, with 84.1% or 3,570 individuals in the labor force. Within the labor force, individuals with bachelor's degree or higher education have the highest percentage of unemployment, with 6.3% or 225 of them being unemployed.
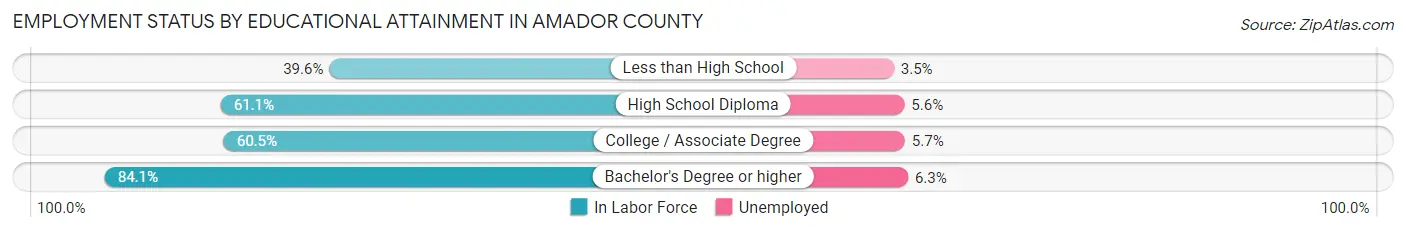
| Educational Attainment | In Labor Force | Unemployed |
| Less than High School | 903 (39.6%) | 80 (3.5%) |
| High School Diploma | 3,633 (61.1%) | 333 (5.6%) |
| College / Associate Degree | 5,146 (60.5%) | 485 (5.7%) |
| Bachelor's Degree or higher | 3,570 (84.1%) | 267 (6.3%) |
| Total | 13,257 (63.2%) | 1,196 (5.7%) |
Employment Occupations by Sex in Amador County
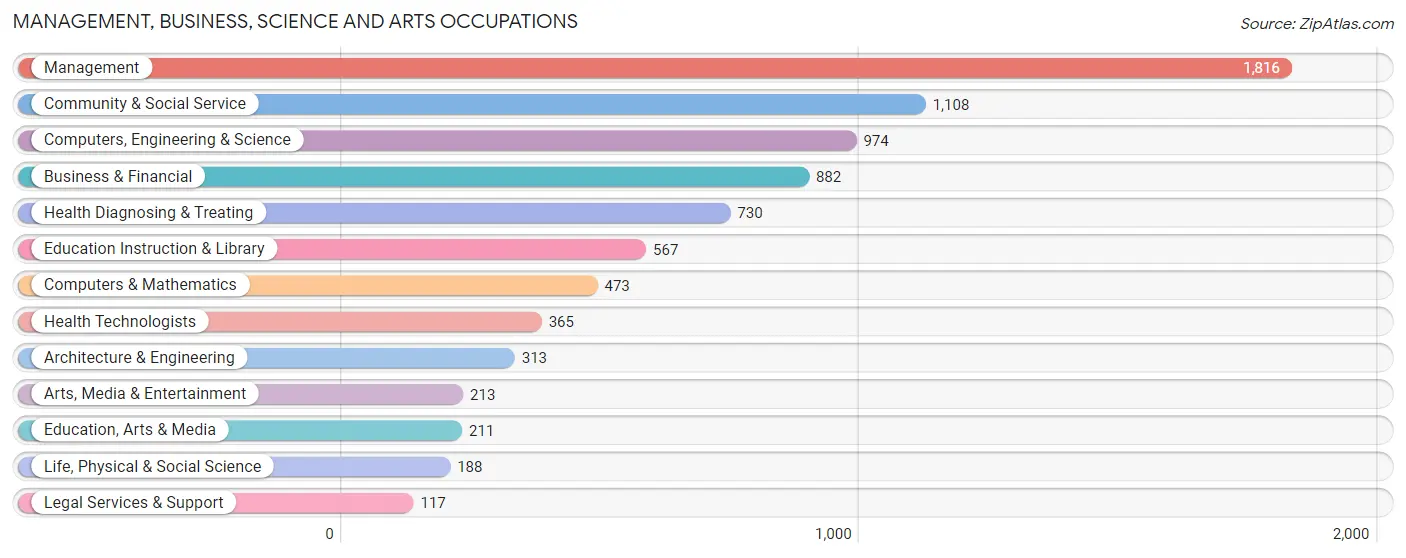
Management, Business, Science and Arts Occupations
The most common Management, Business, Science and Arts occupations in Amador County are Management (1,816 | 11.4%), Community & Social Service (1,108 | 7.0%), Computers, Engineering & Science (974 | 6.1%), Business & Financial (882 | 5.6%), and Health Diagnosing & Treating (730 | 4.6%).
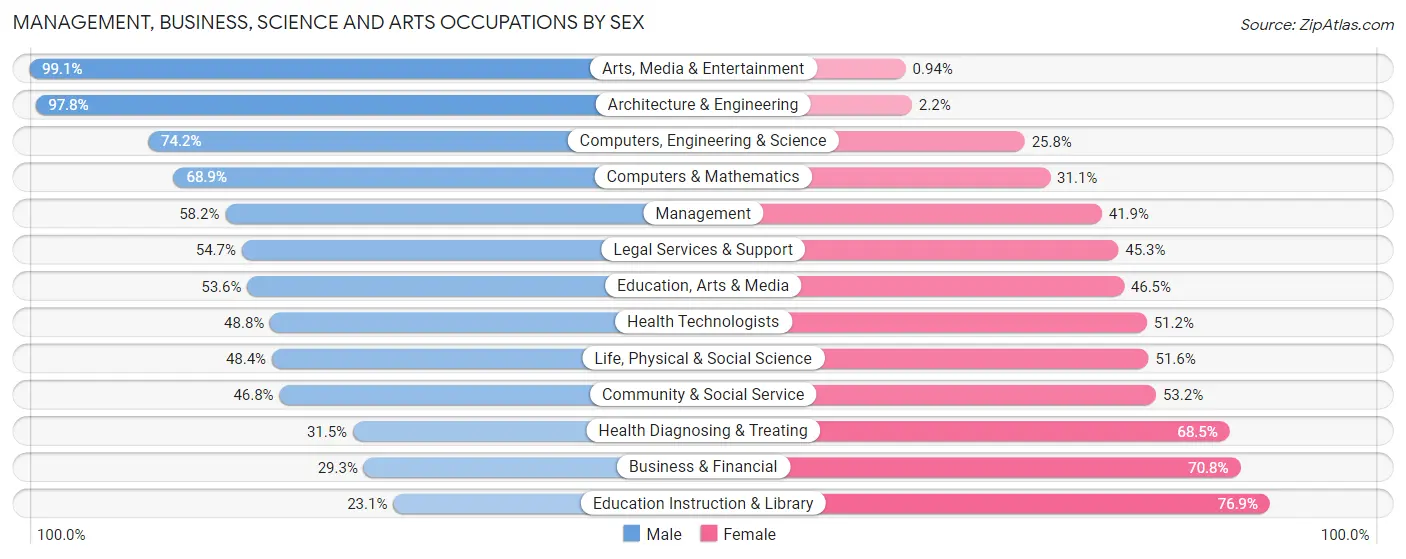
Management, Business, Science and Arts Occupations by Sex
Within the Management, Business, Science and Arts occupations in Amador County, the most male-oriented occupations are Arts, Media & Entertainment (99.1%), Architecture & Engineering (97.8%), and Computers, Engineering & Science (74.2%), while the most female-oriented occupations are Education Instruction & Library (76.9%), Business & Financial (70.8%), and Health Diagnosing & Treating (68.5%).
| Occupation | Male | Female |
| Management | 1,056 (58.2%) | 760 (41.8%) |
| Business & Financial | 258 (29.2%) | 624 (70.8%) |
| Computers, Engineering & Science | 723 (74.2%) | 251 (25.8%) |
| Computers & Mathematics | 326 (68.9%) | 147 (31.1%) |
| Architecture & Engineering | 306 (97.8%) | 7 (2.2%) |
| Life, Physical & Social Science | 91 (48.4%) | 97 (51.6%) |
| Community & Social Service | 519 (46.8%) | 589 (53.2%) |
| Education, Arts & Media | 113 (53.5%) | 98 (46.5%) |
| Legal Services & Support | 64 (54.7%) | 53 (45.3%) |
| Education Instruction & Library | 131 (23.1%) | 436 (76.9%) |
| Arts, Media & Entertainment | 211 (99.1%) | 2 (0.9%) |
| Health Diagnosing & Treating | 230 (31.5%) | 500 (68.5%) |
| Health Technologists | 178 (48.8%) | 187 (51.2%) |
| Total (Category) | 2,786 (50.6%) | 2,724 (49.4%) |
| Total (Overall) | 9,004 (56.7%) | 6,873 (43.3%) |
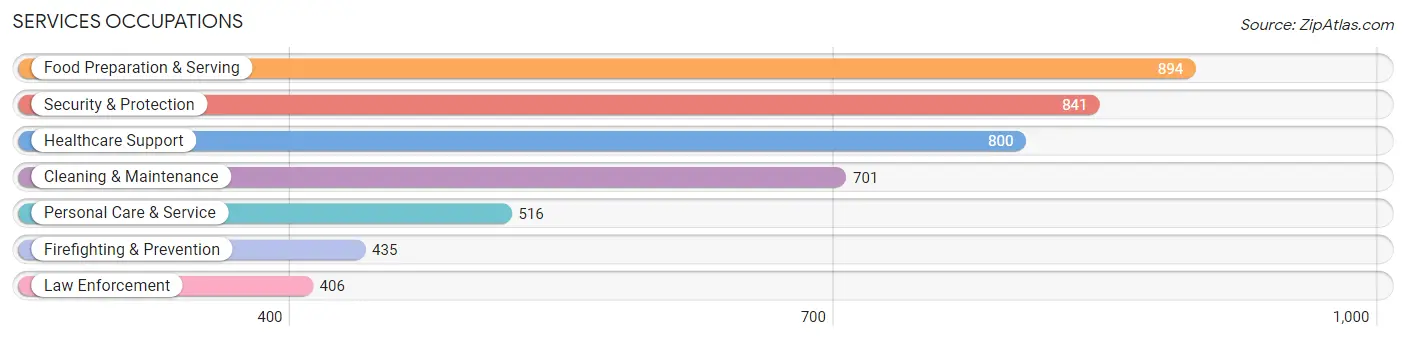
Services Occupations
The most common Services occupations in Amador County are Food Preparation & Serving (894 | 5.6%), Security & Protection (841 | 5.3%), Healthcare Support (800 | 5.0%), Cleaning & Maintenance (701 | 4.4%), and Personal Care & Service (516 | 3.3%).
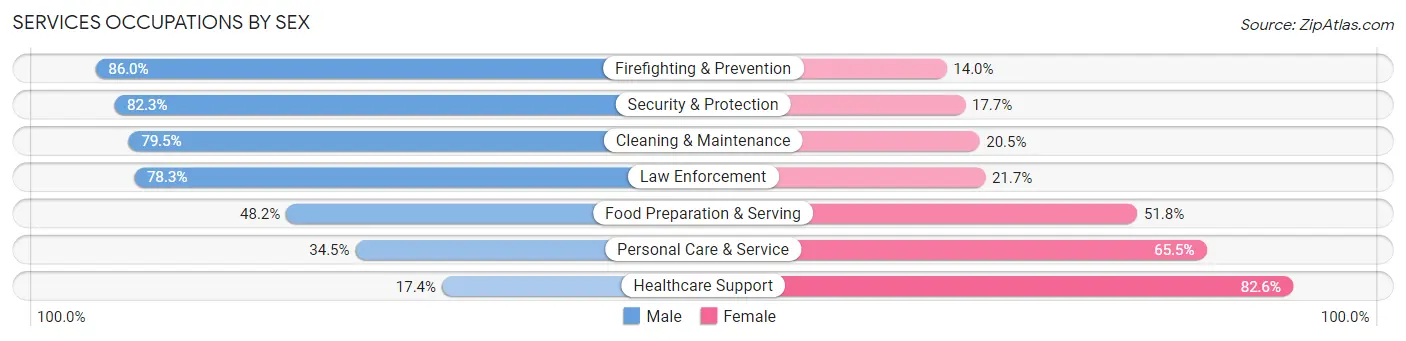
Services Occupations by Sex
Within the Services occupations in Amador County, the most male-oriented occupations are Firefighting & Prevention (86.0%), Security & Protection (82.3%), and Cleaning & Maintenance (79.5%), while the most female-oriented occupations are Healthcare Support (82.6%), Personal Care & Service (65.5%), and Food Preparation & Serving (51.8%).
| Occupation | Male | Female |
| Healthcare Support | 139 (17.4%) | 661 (82.6%) |
| Security & Protection | 692 (82.3%) | 149 (17.7%) |
| Firefighting & Prevention | 374 (86.0%) | 61 (14.0%) |
| Law Enforcement | 318 (78.3%) | 88 (21.7%) |
| Food Preparation & Serving | 431 (48.2%) | 463 (51.8%) |
| Cleaning & Maintenance | 557 (79.5%) | 144 (20.5%) |
| Personal Care & Service | 178 (34.5%) | 338 (65.5%) |
| Total (Category) | 1,997 (53.2%) | 1,755 (46.8%) |
| Total (Overall) | 9,004 (56.7%) | 6,873 (43.3%) |
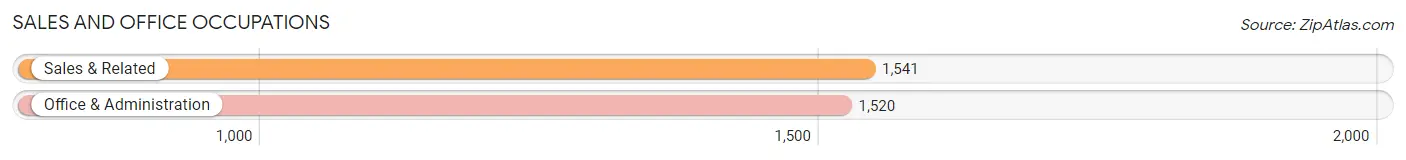
Sales and Office Occupations
The most common Sales and Office occupations in Amador County are Sales & Related (1,541 | 9.7%), and Office & Administration (1,520 | 9.6%).
Sales and Office Occupations by Sex
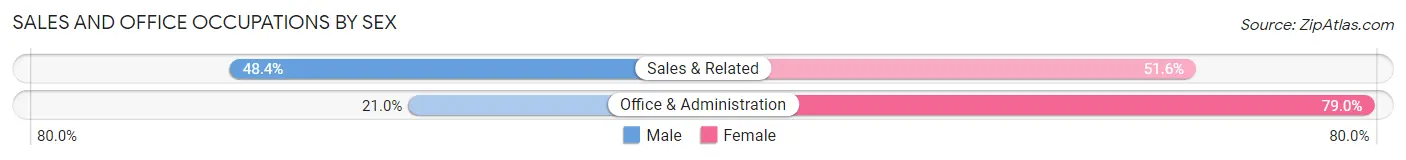
| Occupation | Male | Female |
| Sales & Related | 746 (48.4%) | 795 (51.6%) |
| Office & Administration | 319 (21.0%) | 1,201 (79.0%) |
| Total (Category) | 1,065 (34.8%) | 1,996 (65.2%) |
| Total (Overall) | 9,004 (56.7%) | 6,873 (43.3%) |
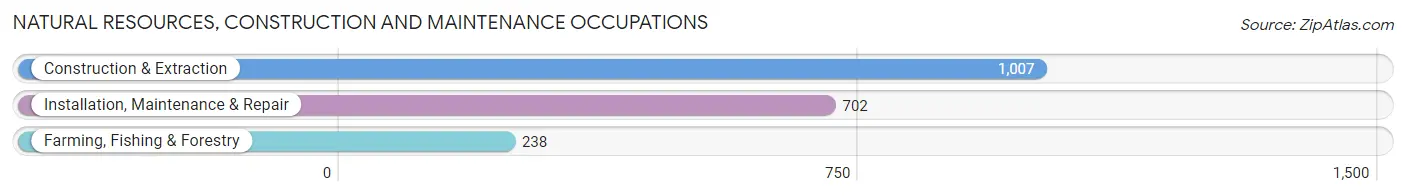
Natural Resources, Construction and Maintenance Occupations
The most common Natural Resources, Construction and Maintenance occupations in Amador County are Construction & Extraction (1,007 | 6.3%), Installation, Maintenance & Repair (702 | 4.4%), and Farming, Fishing & Forestry (238 | 1.5%).
Natural Resources, Construction and Maintenance Occupations by Sex
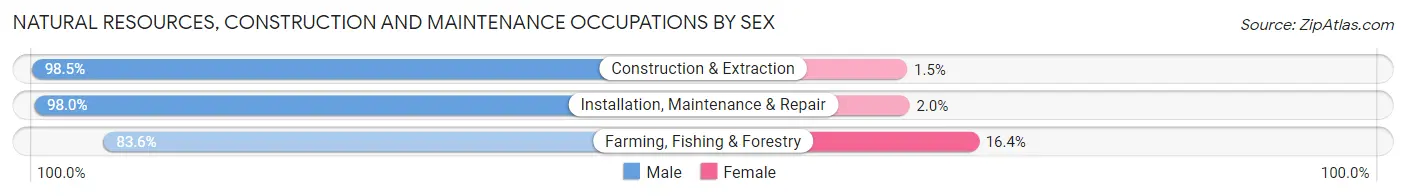
| Occupation | Male | Female |
| Farming, Fishing & Forestry | 199 (83.6%) | 39 (16.4%) |
| Construction & Extraction | 992 (98.5%) | 15 (1.5%) |
| Installation, Maintenance & Repair | 688 (98.0%) | 14 (2.0%) |
| Total (Category) | 1,879 (96.5%) | 68 (3.5%) |
| Total (Overall) | 9,004 (56.7%) | 6,873 (43.3%) |
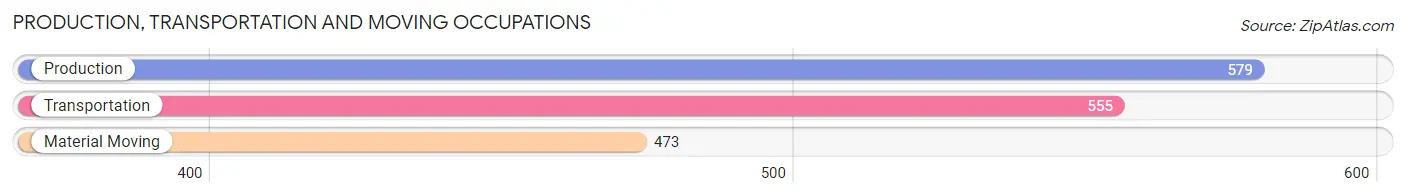
Production, Transportation and Moving Occupations
The most common Production, Transportation and Moving occupations in Amador County are Production (579 | 3.6%), Transportation (555 | 3.5%), and Material Moving (473 | 3.0%).
Production, Transportation and Moving Occupations by Sex
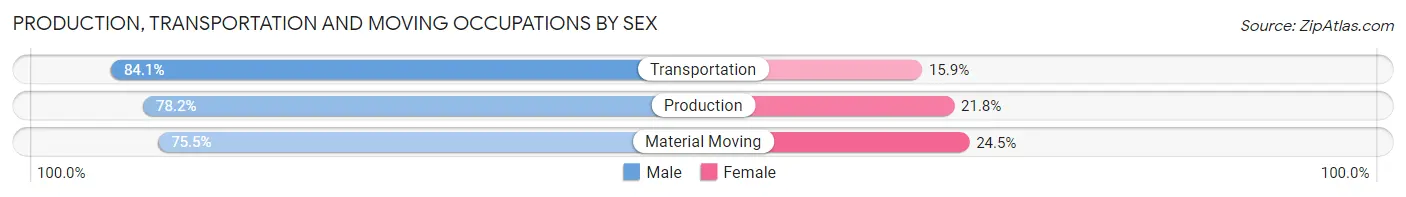
| Occupation | Male | Female |
| Production | 453 (78.2%) | 126 (21.8%) |
| Transportation | 467 (84.1%) | 88 (15.9%) |
| Material Moving | 357 (75.5%) | 116 (24.5%) |
| Total (Category) | 1,277 (79.5%) | 330 (20.5%) |
| Total (Overall) | 9,004 (56.7%) | 6,873 (43.3%) |
Employment Industries by Sex in Amador County
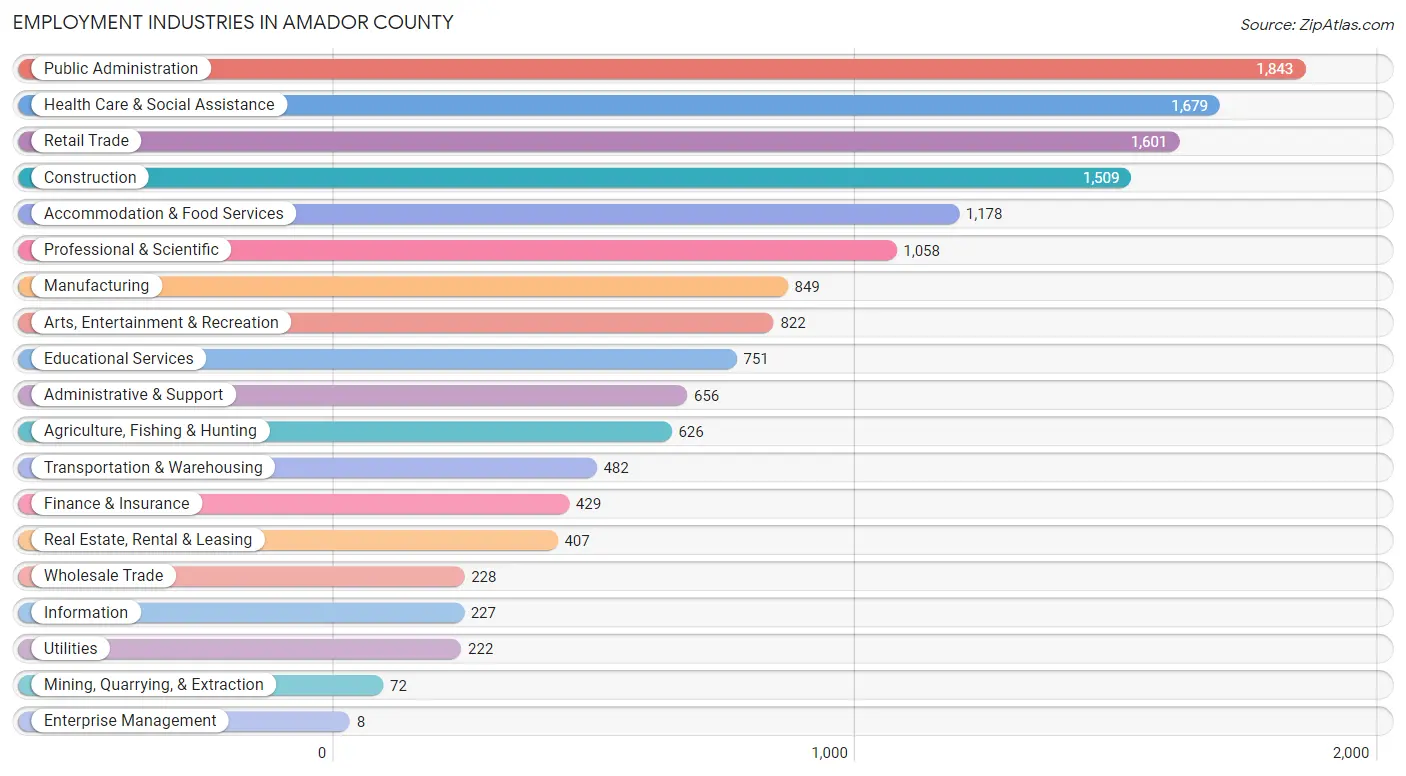
Employment Industries in Amador County
The major employment industries in Amador County include Public Administration (1,843 | 11.6%), Health Care & Social Assistance (1,679 | 10.6%), Retail Trade (1,601 | 10.1%), Construction (1,509 | 9.5%), and Accommodation & Food Services (1,178 | 7.4%).
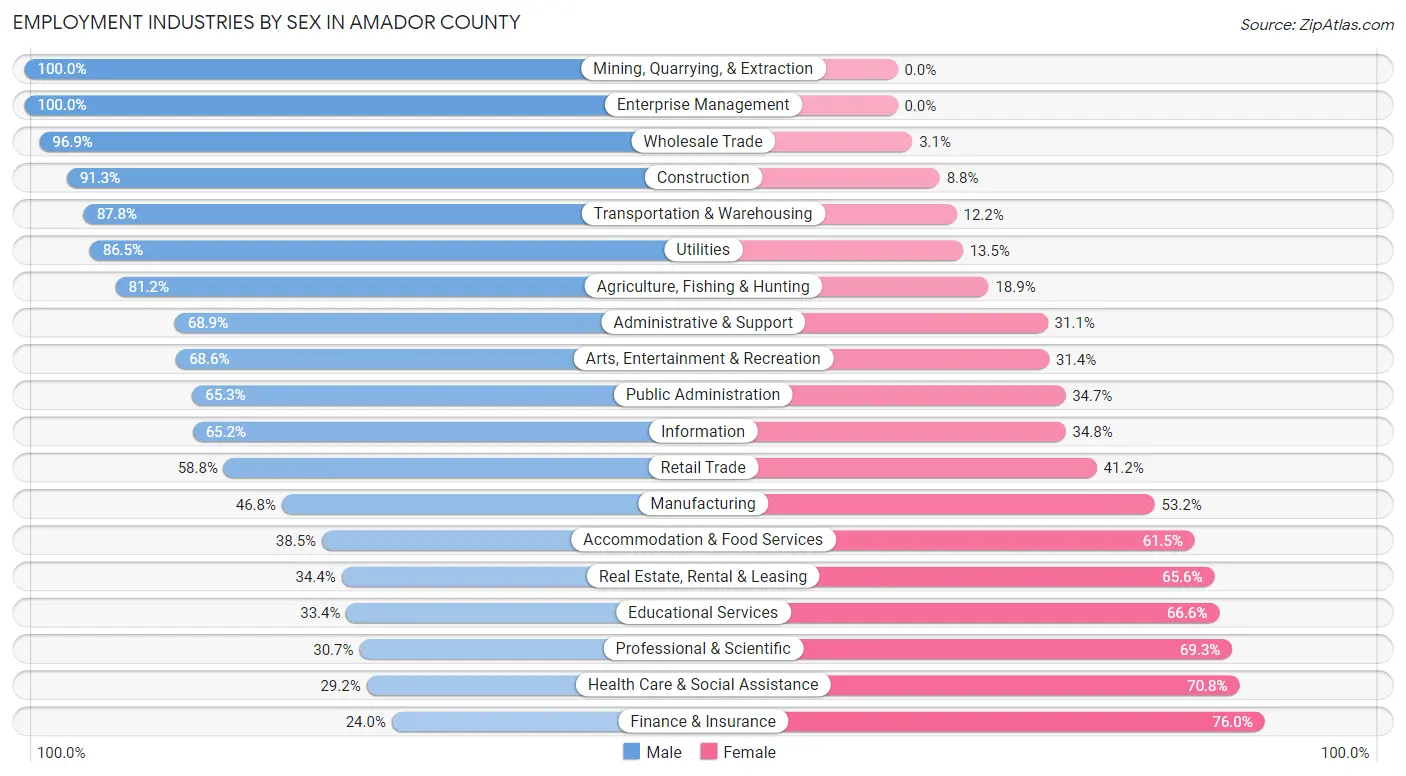
Employment Industries by Sex in Amador County
The Amador County industries that see more men than women are Mining, Quarrying, & Extraction (100.0%), Enterprise Management (100.0%), and Wholesale Trade (96.9%), whereas the industries that tend to have a higher number of women are Finance & Insurance (76.0%), Health Care & Social Assistance (70.8%), and Professional & Scientific (69.3%).
| Industry | Male | Female |
| Agriculture, Fishing & Hunting | 508 (81.1%) | 118 (18.9%) |
| Mining, Quarrying, & Extraction | 72 (100.0%) | 0 (0.0%) |
| Construction | 1,377 (91.2%) | 132 (8.7%) |
| Manufacturing | 397 (46.8%) | 452 (53.2%) |
| Wholesale Trade | 221 (96.9%) | 7 (3.1%) |
| Retail Trade | 941 (58.8%) | 660 (41.2%) |
| Transportation & Warehousing | 423 (87.8%) | 59 (12.2%) |
| Utilities | 192 (86.5%) | 30 (13.5%) |
| Information | 148 (65.2%) | 79 (34.8%) |
| Finance & Insurance | 103 (24.0%) | 326 (76.0%) |
| Real Estate, Rental & Leasing | 140 (34.4%) | 267 (65.6%) |
| Professional & Scientific | 325 (30.7%) | 733 (69.3%) |
| Enterprise Management | 8 (100.0%) | 0 (0.0%) |
| Administrative & Support | 452 (68.9%) | 204 (31.1%) |
| Educational Services | 251 (33.4%) | 500 (66.6%) |
| Health Care & Social Assistance | 491 (29.2%) | 1,188 (70.8%) |
| Arts, Entertainment & Recreation | 564 (68.6%) | 258 (31.4%) |
| Accommodation & Food Services | 453 (38.5%) | 725 (61.5%) |
| Public Administration | 1,203 (65.3%) | 640 (34.7%) |
| Total | 9,004 (56.7%) | 6,873 (43.3%) |
Education in Amador County
School Enrollment in Amador County
The most common levels of schooling among the 8,002 students in Amador County are high school (2,245 | 28.1%), college / undergraduate (2,199 | 27.5%), and elementary school (1,333 | 16.7%).
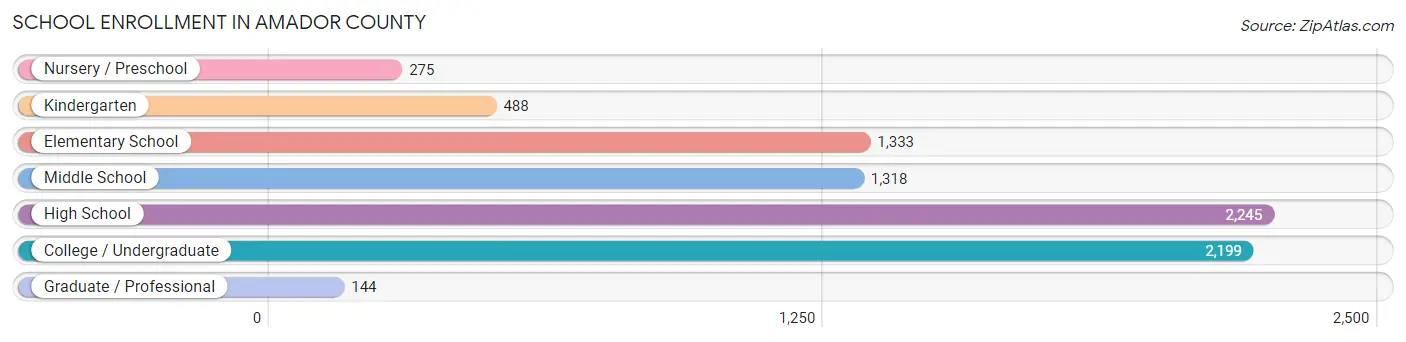
| School Level | # Students | % Students |
| Nursery / Preschool | 275 | 3.4% |
| Kindergarten | 488 | 6.1% |
| Elementary School | 1,333 | 16.7% |
| Middle School | 1,318 | 16.5% |
| High School | 2,245 | 28.1% |
| College / Undergraduate | 2,199 | 27.5% |
| Graduate / Professional | 144 | 1.8% |
| Total | 8,002 | 100.0% |
School Enrollment by Age by Funding Source in Amador County
Out of a total of 8,002 students who are enrolled in schools in Amador County, 1,648 (20.6%) attend a private institution, while the remaining 6,354 (79.4%) are enrolled in public schools. The age group of 25 to 34 year olds has the highest likelihood of being enrolled in private schools, with 446 (47.5% in the age bracket) enrolled. Conversely, the age group of 18 to 19 year olds has the lowest likelihood of being enrolled in a private school, with 472 (96.1% in the age bracket) attending a public institution.
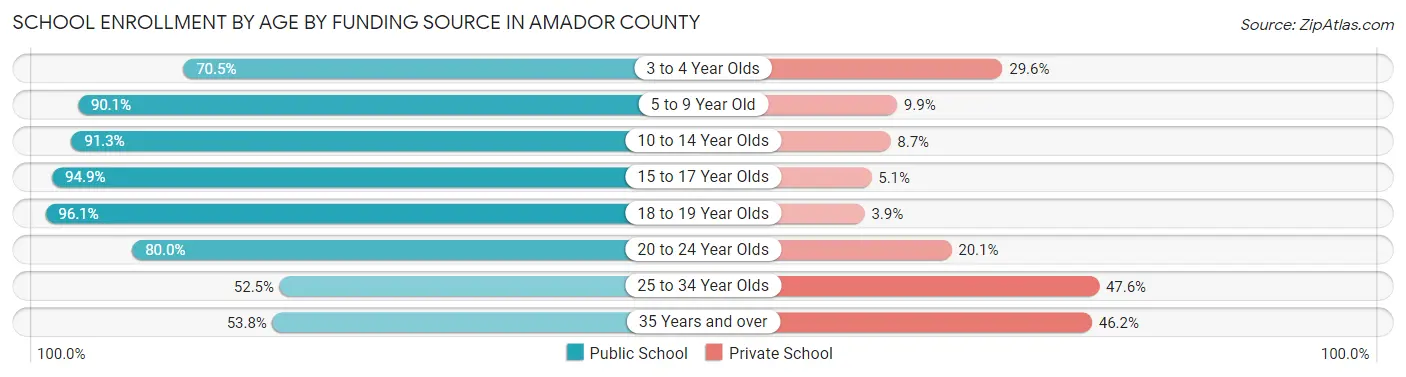
| Age Bracket | Public School | Private School |
| 3 to 4 Year Olds | 205 (70.5%) | 86 (29.5%) |
| 5 to 9 Year Old | 1,281 (90.1%) | 141 (9.9%) |
| 10 to 14 Year Olds | 1,732 (91.3%) | 165 (8.7%) |
| 15 to 17 Year Olds | 1,071 (94.9%) | 58 (5.1%) |
| 18 to 19 Year Olds | 472 (96.1%) | 19 (3.9%) |
| 20 to 24 Year Olds | 347 (79.9%) | 87 (20.1%) |
| 25 to 34 Year Olds | 492 (52.4%) | 446 (47.5%) |
| 35 Years and over | 753 (53.8%) | 647 (46.2%) |
| Total | 6,354 (79.4%) | 1,648 (20.6%) |
Educational Attainment by Field of Study in Amador County
Business (1,127 | 15.7%), bio, nature & agricultural (955 | 13.3%), social sciences (748 | 10.4%), education (661 | 9.2%), and science & technology (620 | 8.6%) are the most common fields of study among 7,171 individuals in Amador County who have obtained a bachelor's degree or higher.
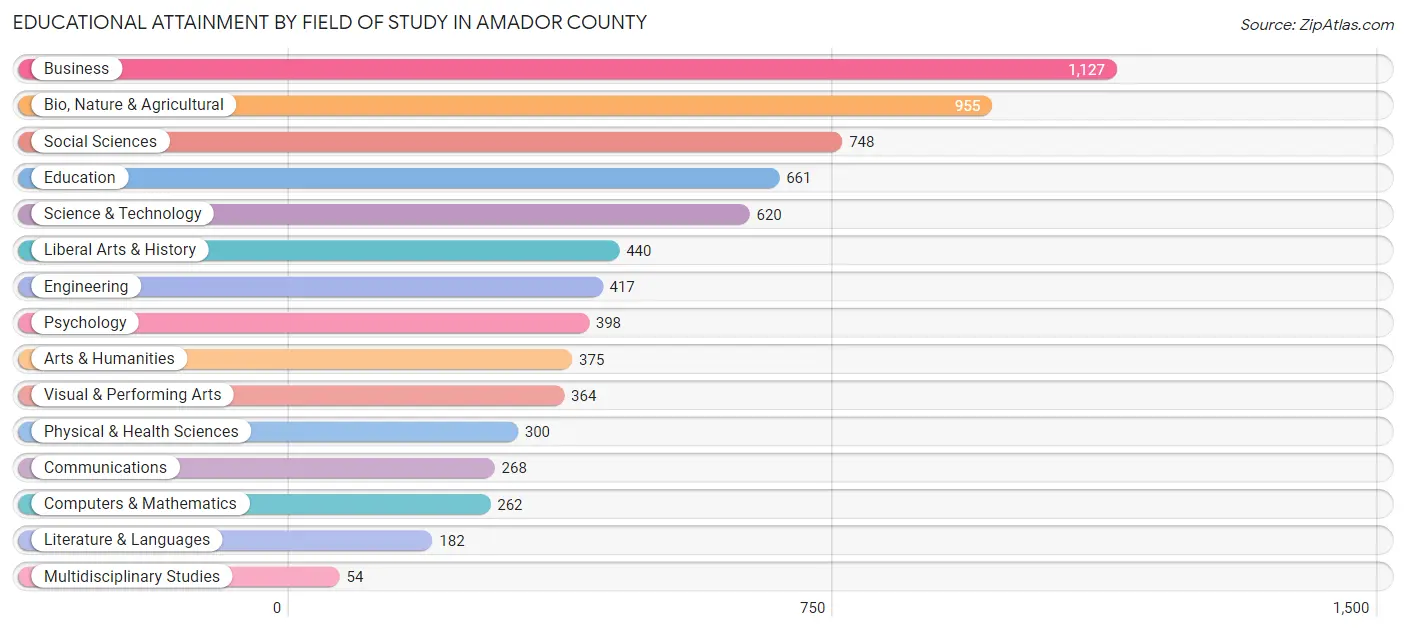
| Field of Study | # Graduates | % Graduates |
| Computers & Mathematics | 262 | 3.6% |
| Bio, Nature & Agricultural | 955 | 13.3% |
| Physical & Health Sciences | 300 | 4.2% |
| Psychology | 398 | 5.6% |
| Social Sciences | 748 | 10.4% |
| Engineering | 417 | 5.8% |
| Multidisciplinary Studies | 54 | 0.7% |
| Science & Technology | 620 | 8.6% |
| Business | 1,127 | 15.7% |
| Education | 661 | 9.2% |
| Literature & Languages | 182 | 2.5% |
| Liberal Arts & History | 440 | 6.1% |
| Visual & Performing Arts | 364 | 5.1% |
| Communications | 268 | 3.7% |
| Arts & Humanities | 375 | 5.2% |
| Total | 7,171 | 100.0% |
Transportation & Commute in Amador County
Vehicle Availability by Sex in Amador County
The most prevalent vehicle ownership categories in Amador County are males with 2 vehicles (2,882, accounting for 32.7%) and females with 2 vehicles (2,684, making up 43.1%).
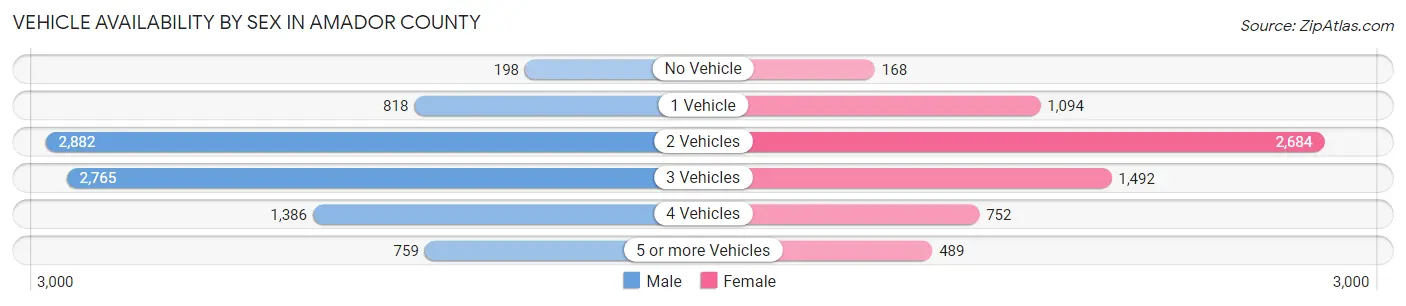
| Vehicles Available | Male | Female |
| No Vehicle | 198 (2.2%) | 168 (2.5%) |
| 1 Vehicle | 818 (9.3%) | 1,094 (16.4%) |
| 2 Vehicles | 2,882 (32.7%) | 2,684 (40.2%) |
| 3 Vehicles | 2,765 (31.4%) | 1,492 (22.3%) |
| 4 Vehicles | 1,386 (15.7%) | 752 (11.3%) |
| 5 or more Vehicles | 759 (8.6%) | 489 (7.3%) |
| Total | 8,808 (100.0%) | 6,679 (100.0%) |
Commute Time in Amador County
The most frequently occuring commute durations in Amador County are 15 to 19 minutes (1,979 commuters, 14.7%), 5 to 9 minutes (1,757 commuters, 13.1%), and 45 to 59 minutes (1,691 commuters, 12.6%).
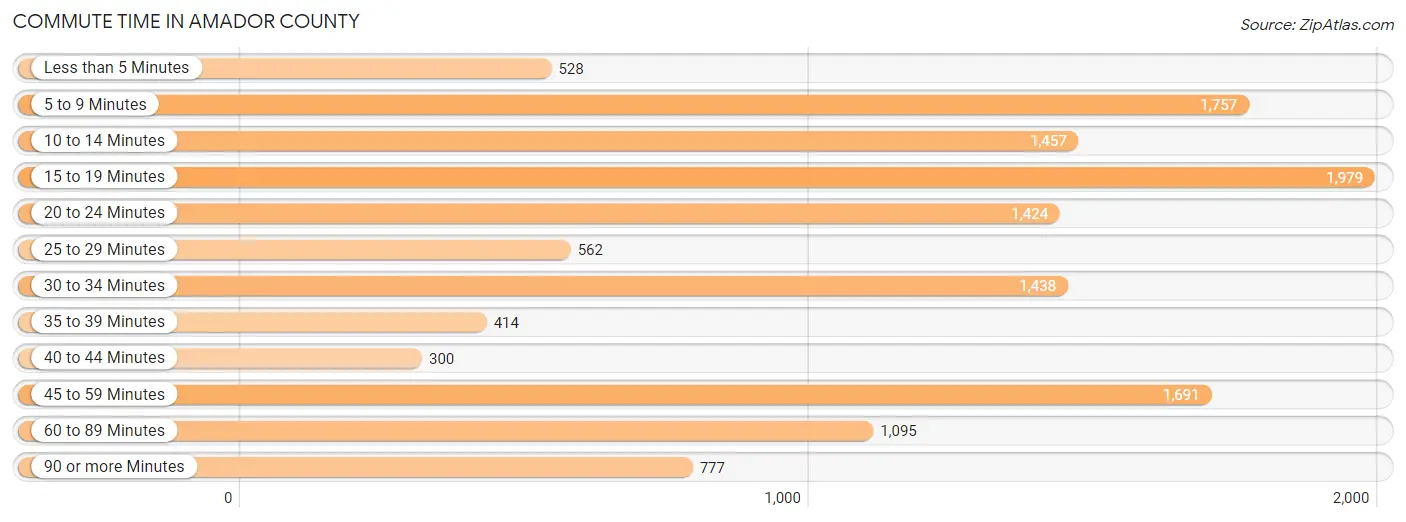
| Commute Time | # Commuters | % Commuters |
| Less than 5 Minutes | 528 | 3.9% |
| 5 to 9 Minutes | 1,757 | 13.1% |
| 10 to 14 Minutes | 1,457 | 10.9% |
| 15 to 19 Minutes | 1,979 | 14.7% |
| 20 to 24 Minutes | 1,424 | 10.6% |
| 25 to 29 Minutes | 562 | 4.2% |
| 30 to 34 Minutes | 1,438 | 10.7% |
| 35 to 39 Minutes | 414 | 3.1% |
| 40 to 44 Minutes | 300 | 2.2% |
| 45 to 59 Minutes | 1,691 | 12.6% |
| 60 to 89 Minutes | 1,095 | 8.2% |
| 90 or more Minutes | 777 | 5.8% |
Commute Time by Sex in Amador County
The most common commute times in Amador County are 45 to 59 minutes (1,198 commuters, 15.4%) for males and 5 to 9 minutes (1,102 commuters, 19.5%) for females.
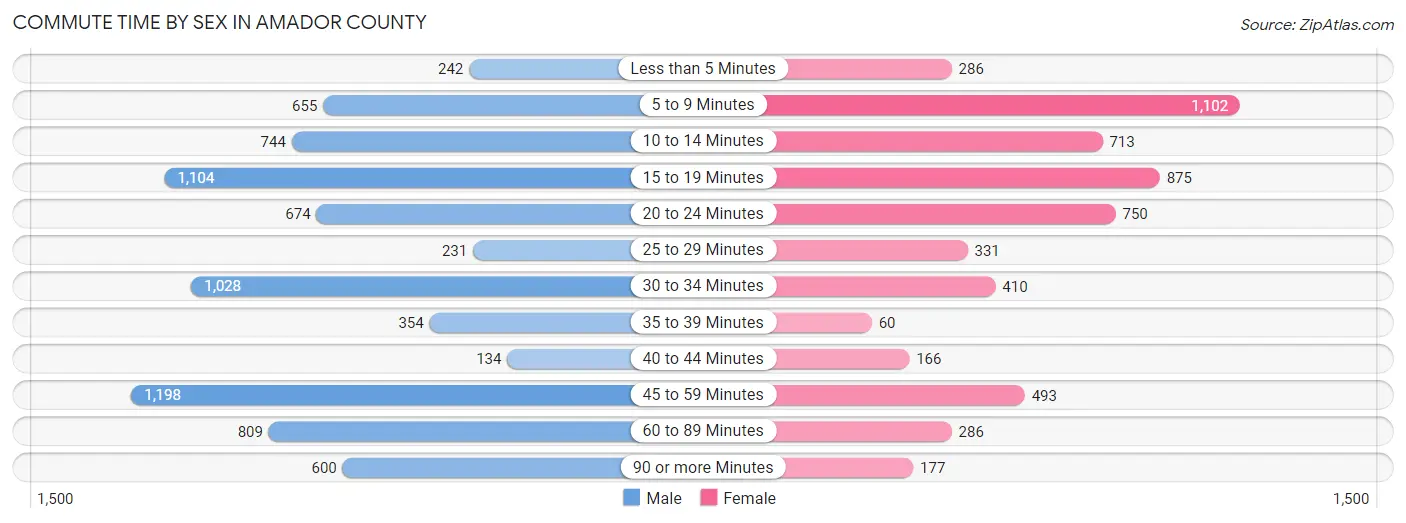
| Commute Time | Male | Female |
| Less than 5 Minutes | 242 (3.1%) | 286 (5.1%) |
| 5 to 9 Minutes | 655 (8.4%) | 1,102 (19.5%) |
| 10 to 14 Minutes | 744 (9.6%) | 713 (12.6%) |
| 15 to 19 Minutes | 1,104 (14.2%) | 875 (15.5%) |
| 20 to 24 Minutes | 674 (8.7%) | 750 (13.3%) |
| 25 to 29 Minutes | 231 (3.0%) | 331 (5.9%) |
| 30 to 34 Minutes | 1,028 (13.2%) | 410 (7.3%) |
| 35 to 39 Minutes | 354 (4.5%) | 60 (1.1%) |
| 40 to 44 Minutes | 134 (1.7%) | 166 (2.9%) |
| 45 to 59 Minutes | 1,198 (15.4%) | 493 (8.7%) |
| 60 to 89 Minutes | 809 (10.4%) | 286 (5.1%) |
| 90 or more Minutes | 600 (7.7%) | 177 (3.1%) |
Time of Departure to Work by Sex in Amador County
The most frequent times of departure to work in Amador County are 7:00 AM to 7:29 AM (1,587, 20.4%) for males and 7:00 AM to 7:29 AM (1,160, 20.5%) for females.
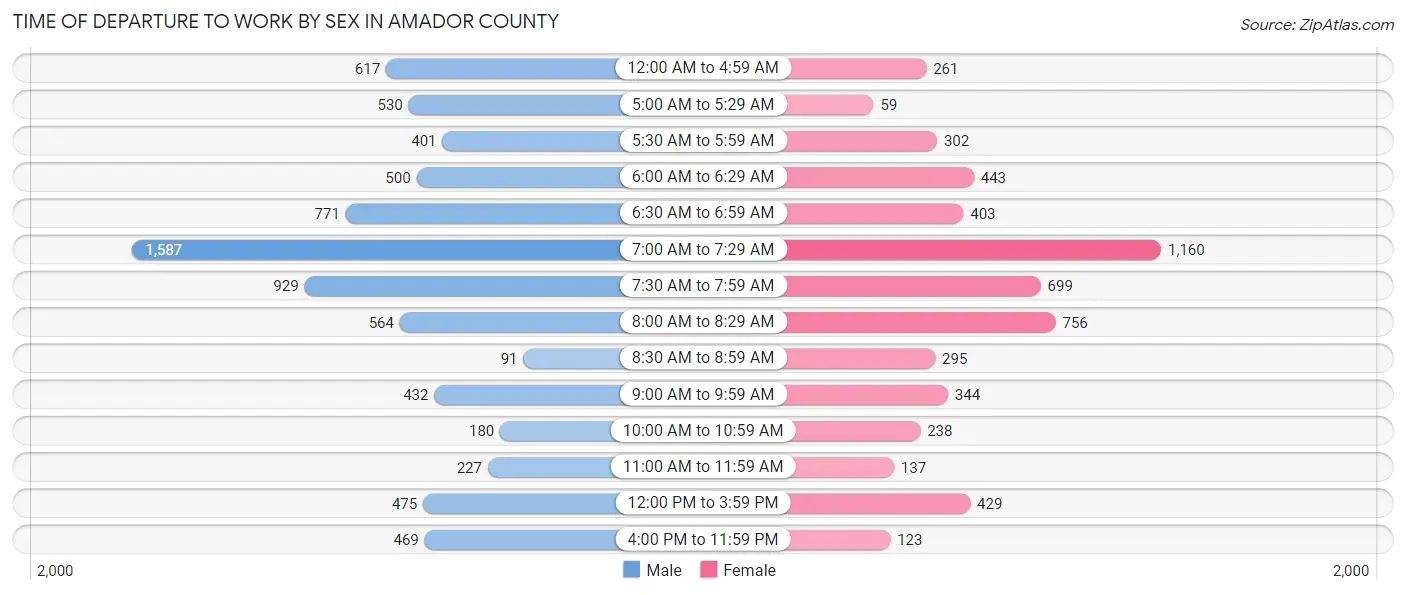
| Time of Departure | Male | Female |
| 12:00 AM to 4:59 AM | 617 (7.9%) | 261 (4.6%) |
| 5:00 AM to 5:29 AM | 530 (6.8%) | 59 (1.0%) |
| 5:30 AM to 5:59 AM | 401 (5.2%) | 302 (5.3%) |
| 6:00 AM to 6:29 AM | 500 (6.4%) | 443 (7.8%) |
| 6:30 AM to 6:59 AM | 771 (9.9%) | 403 (7.1%) |
| 7:00 AM to 7:29 AM | 1,587 (20.4%) | 1,160 (20.5%) |
| 7:30 AM to 7:59 AM | 929 (11.9%) | 699 (12.4%) |
| 8:00 AM to 8:29 AM | 564 (7.3%) | 756 (13.4%) |
| 8:30 AM to 8:59 AM | 91 (1.2%) | 295 (5.2%) |
| 9:00 AM to 9:59 AM | 432 (5.6%) | 344 (6.1%) |
| 10:00 AM to 10:59 AM | 180 (2.3%) | 238 (4.2%) |
| 11:00 AM to 11:59 AM | 227 (2.9%) | 137 (2.4%) |
| 12:00 PM to 3:59 PM | 475 (6.1%) | 429 (7.6%) |
| 4:00 PM to 11:59 PM | 469 (6.0%) | 123 (2.2%) |
| Total | 7,773 (100.0%) | 5,649 (100.0%) |
Housing Occupancy in Amador County
Occupancy by Ownership in Amador County
Of the total 15,745 dwellings in Amador County, owner-occupied units account for 12,440 (79.0%), while renter-occupied units make up 3,305 (21.0%).
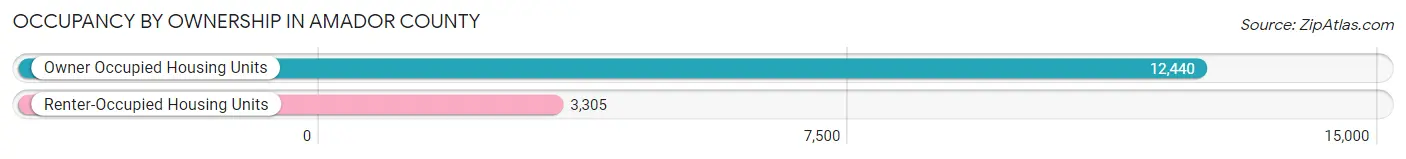
| Occupancy | # Housing Units | % Housing Units |
| Owner Occupied Housing Units | 12,440 | 79.0% |
| Renter-Occupied Housing Units | 3,305 | 21.0% |
| Total Occupied Housing Units | 15,745 | 100.0% |
Occupancy by Household Size in Amador County
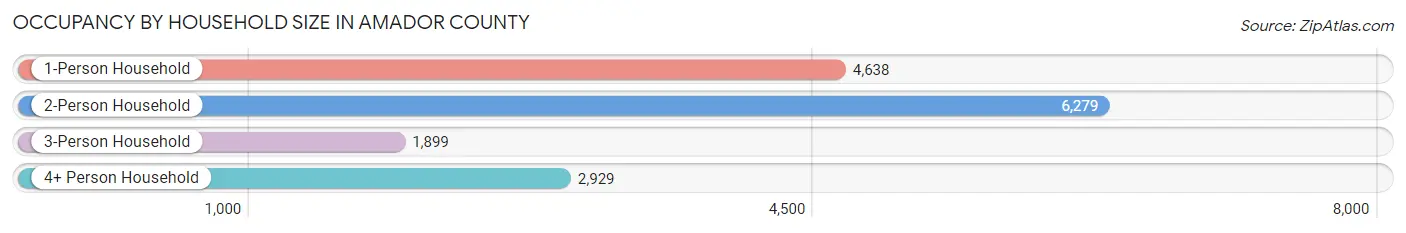
| Household Size | # Housing Units | % Housing Units |
| 1-Person Household | 4,638 | 29.5% |
| 2-Person Household | 6,279 | 39.9% |
| 3-Person Household | 1,899 | 12.1% |
| 4+ Person Household | 2,929 | 18.6% |
| Total Housing Units | 15,745 | 100.0% |
Occupancy by Ownership by Household Size in Amador County
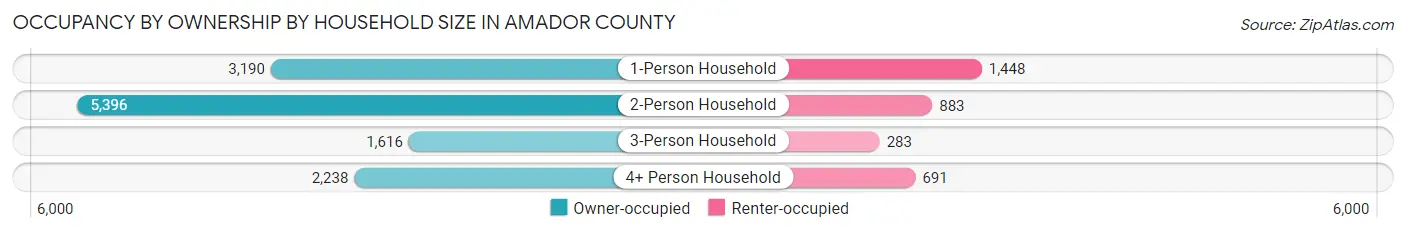
| Household Size | Owner-occupied | Renter-occupied |
| 1-Person Household | 3,190 (68.8%) | 1,448 (31.2%) |
| 2-Person Household | 5,396 (85.9%) | 883 (14.1%) |
| 3-Person Household | 1,616 (85.1%) | 283 (14.9%) |
| 4+ Person Household | 2,238 (76.4%) | 691 (23.6%) |
| Total Housing Units | 12,440 (79.0%) | 3,305 (21.0%) |
Occupancy by Educational Attainment in Amador County
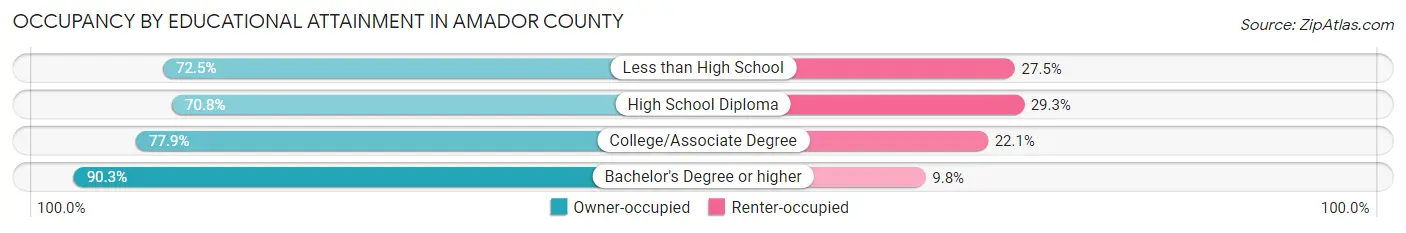
| Household Size | Owner-occupied | Renter-occupied |
| Less than High School | 618 (72.5%) | 234 (27.5%) |
| High School Diploma | 2,775 (70.8%) | 1,147 (29.2%) |
| College/Associate Degree | 5,382 (77.9%) | 1,528 (22.1%) |
| Bachelor's Degree or higher | 3,665 (90.2%) | 396 (9.8%) |
Occupancy by Age of Householder in Amador County
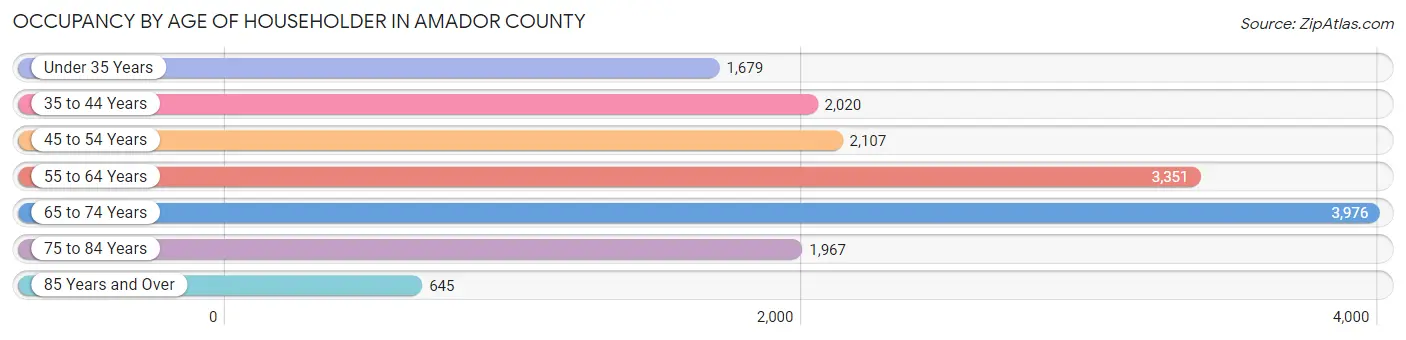
| Age Bracket | # Households | % Households |
| Under 35 Years | 1,679 | 10.7% |
| 35 to 44 Years | 2,020 | 12.8% |
| 45 to 54 Years | 2,107 | 13.4% |
| 55 to 64 Years | 3,351 | 21.3% |
| 65 to 74 Years | 3,976 | 25.3% |
| 75 to 84 Years | 1,967 | 12.5% |
| 85 Years and Over | 645 | 4.1% |
| Total | 15,745 | 100.0% |
Housing Finances in Amador County
Median Income by Occupancy in Amador County
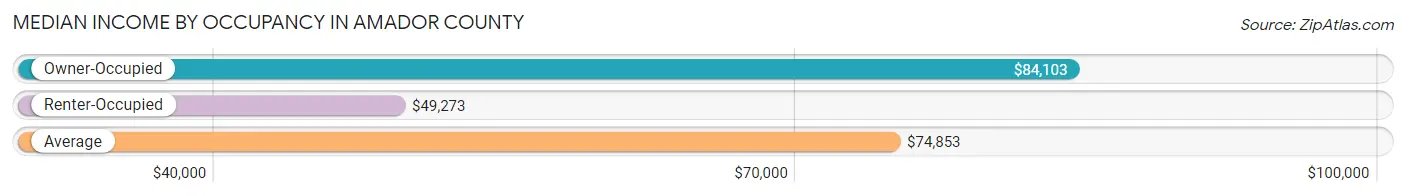
| Occupancy Type | # Households | Median Income |
| Owner-Occupied | 12,440 (79.0%) | $84,103 |
| Renter-Occupied | 3,305 (21.0%) | $49,273 |
| Average | 15,745 (100.0%) | $74,853 |
Occupancy by Householder Income Bracket in Amador County
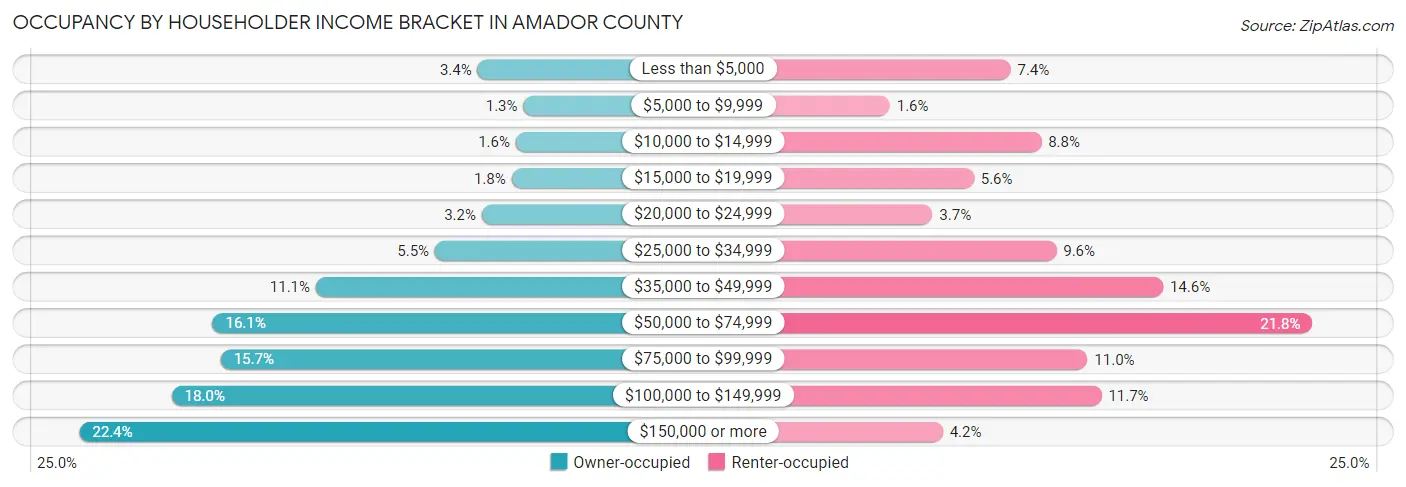
| Income Bracket | Owner-occupied | Renter-occupied |
| Less than $5,000 | 427 (3.4%) | 244 (7.4%) |
| $5,000 to $9,999 | 155 (1.3%) | 54 (1.6%) |
| $10,000 to $14,999 | 200 (1.6%) | 292 (8.8%) |
| $15,000 to $19,999 | 225 (1.8%) | 186 (5.6%) |
| $20,000 to $24,999 | 402 (3.2%) | 121 (3.7%) |
| $25,000 to $34,999 | 679 (5.5%) | 316 (9.6%) |
| $35,000 to $49,999 | 1,384 (11.1%) | 484 (14.6%) |
| $50,000 to $74,999 | 1,996 (16.1%) | 719 (21.7%) |
| $75,000 to $99,999 | 1,948 (15.7%) | 365 (11.0%) |
| $100,000 to $149,999 | 2,239 (18.0%) | 387 (11.7%) |
| $150,000 or more | 2,785 (22.4%) | 137 (4.2%) |
| Total | 12,440 (100.0%) | 3,305 (100.0%) |
Monthly Housing Cost Tiers in Amador County
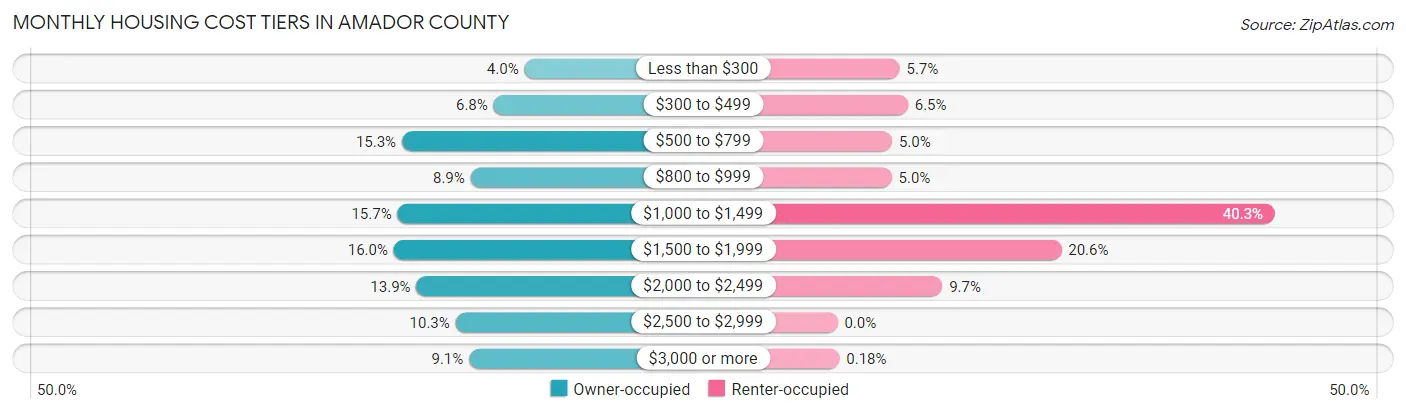
| Monthly Cost | Owner-occupied | Renter-occupied |
| Less than $300 | 495 (4.0%) | 189 (5.7%) |
| $300 to $499 | 848 (6.8%) | 214 (6.5%) |
| $500 to $799 | 1,898 (15.3%) | 166 (5.0%) |
| $800 to $999 | 1,112 (8.9%) | 165 (5.0%) |
| $1,000 to $1,499 | 1,949 (15.7%) | 1,331 (40.3%) |
| $1,500 to $1,999 | 1,992 (16.0%) | 681 (20.6%) |
| $2,000 to $2,499 | 1,733 (13.9%) | 319 (9.7%) |
| $2,500 to $2,999 | 1,284 (10.3%) | 0 (0.0%) |
| $3,000 or more | 1,129 (9.1%) | 6 (0.2%) |
| Total | 12,440 (100.0%) | 3,305 (100.0%) |
Physical Housing Characteristics in Amador County
Housing Structures in Amador County
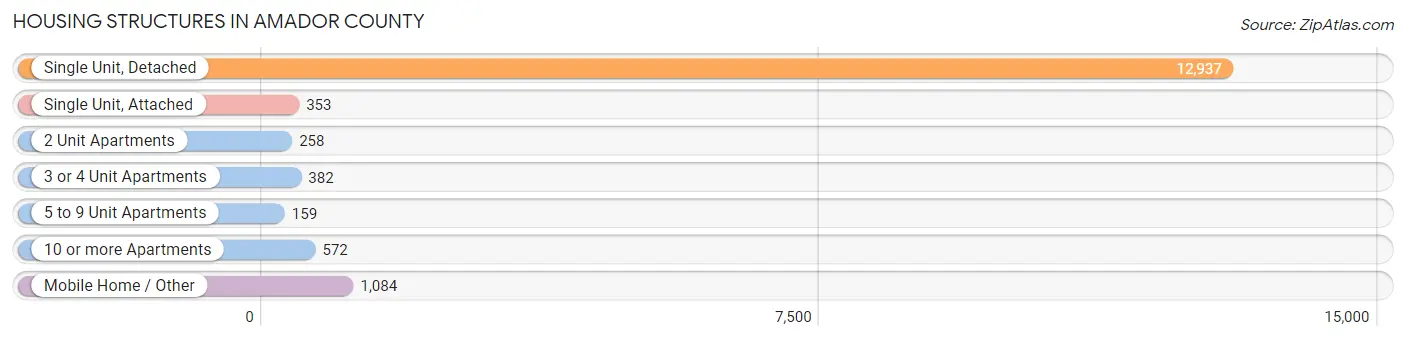
| Structure Type | # Housing Units | % Housing Units |
| Single Unit, Detached | 12,937 | 82.2% |
| Single Unit, Attached | 353 | 2.2% |
| 2 Unit Apartments | 258 | 1.6% |
| 3 or 4 Unit Apartments | 382 | 2.4% |
| 5 to 9 Unit Apartments | 159 | 1.0% |
| 10 or more Apartments | 572 | 3.6% |
| Mobile Home / Other | 1,084 | 6.9% |
| Total | 15,745 | 100.0% |
Housing Structures by Occupancy in Amador County
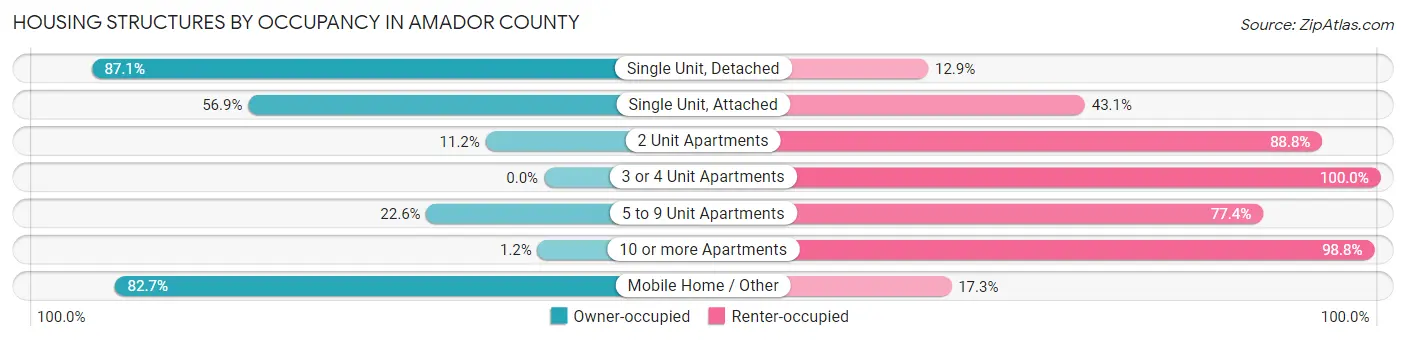
| Structure Type | Owner-occupied | Renter-occupied |
| Single Unit, Detached | 11,271 (87.1%) | 1,666 (12.9%) |
| Single Unit, Attached | 201 (56.9%) | 152 (43.1%) |
| 2 Unit Apartments | 29 (11.2%) | 229 (88.8%) |
| 3 or 4 Unit Apartments | 0 (0.0%) | 382 (100.0%) |
| 5 to 9 Unit Apartments | 36 (22.6%) | 123 (77.4%) |
| 10 or more Apartments | 7 (1.2%) | 565 (98.8%) |
| Mobile Home / Other | 896 (82.7%) | 188 (17.3%) |
| Total | 12,440 (79.0%) | 3,305 (21.0%) |
Housing Structures by Number of Rooms in Amador County
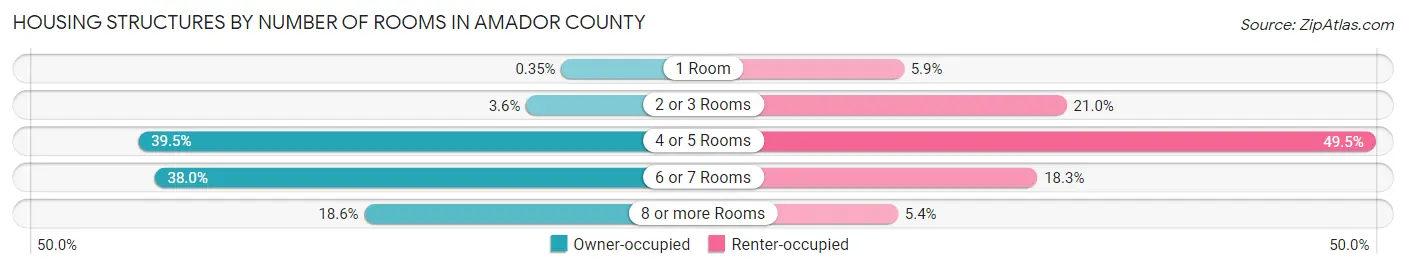
| Number of Rooms | Owner-occupied | Renter-occupied |
| 1 Room | 43 (0.4%) | 195 (5.9%) |
| 2 or 3 Rooms | 448 (3.6%) | 693 (21.0%) |
| 4 or 5 Rooms | 4,914 (39.5%) | 1,637 (49.5%) |
| 6 or 7 Rooms | 4,725 (38.0%) | 603 (18.2%) |
| 8 or more Rooms | 2,310 (18.6%) | 177 (5.4%) |
| Total | 12,440 (100.0%) | 3,305 (100.0%) |
Housing Structure by Heating Type in Amador County
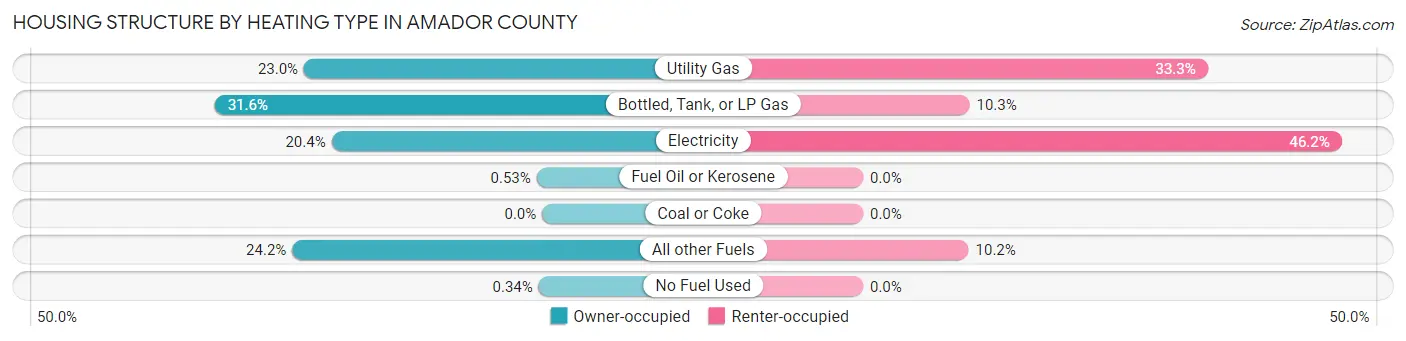
| Heating Type | Owner-occupied | Renter-occupied |
| Utility Gas | 2,862 (23.0%) | 1,100 (33.3%) |
| Bottled, Tank, or LP Gas | 3,935 (31.6%) | 340 (10.3%) |
| Electricity | 2,531 (20.3%) | 1,528 (46.2%) |
| Fuel Oil or Kerosene | 66 (0.5%) | 0 (0.0%) |
| Coal or Coke | 0 (0.0%) | 0 (0.0%) |
| All other Fuels | 3,004 (24.1%) | 337 (10.2%) |
| No Fuel Used | 42 (0.3%) | 0 (0.0%) |
| Total | 12,440 (100.0%) | 3,305 (100.0%) |
Household Vehicle Usage in Amador County
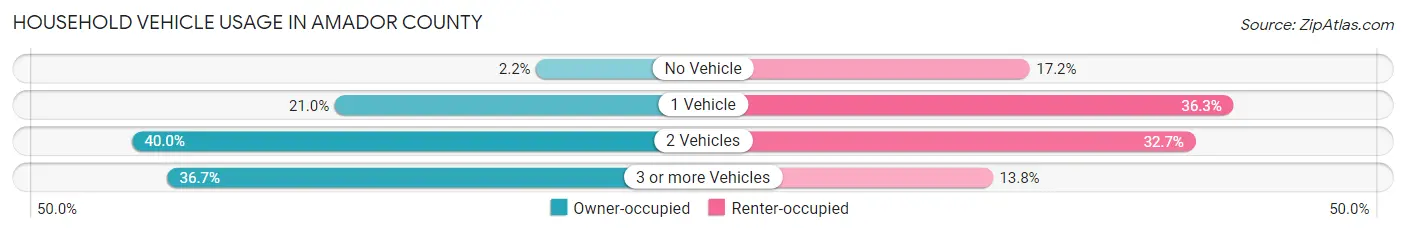
| Vehicles per Household | Owner-occupied | Renter-occupied |
| No Vehicle | 276 (2.2%) | 569 (17.2%) |
| 1 Vehicle | 2,615 (21.0%) | 1,199 (36.3%) |
| 2 Vehicles | 4,979 (40.0%) | 1,082 (32.7%) |
| 3 or more Vehicles | 4,570 (36.7%) | 455 (13.8%) |
| Total | 12,440 (100.0%) | 3,305 (100.0%) |
Real Estate & Mortgages in Amador County
Real Estate and Mortgage Overview in Amador County
| Characteristic | Without Mortgage | With Mortgage |
| Housing Units | 4,603 | 7,837 |
| Median Property Value | $394,100 | $418,000 |
| Median Household Income | $63,984 | $2,185 |
| Monthly Housing Costs | $675 | $1,122 |
| Real Estate Taxes | $2,552 | $66 |
Property Value by Mortgage Status in Amador County
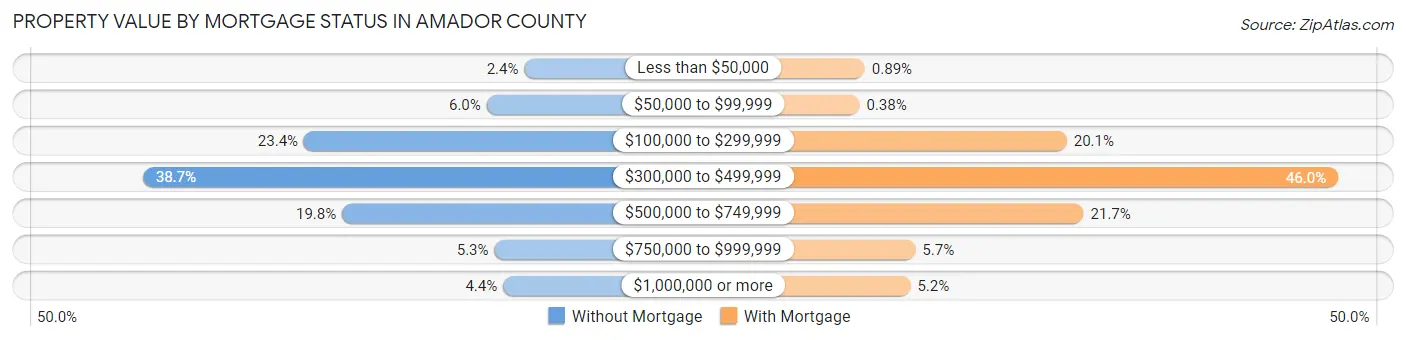
| Property Value | Without Mortgage | With Mortgage |
| Less than $50,000 | 111 (2.4%) | 70 (0.9%) |
| $50,000 to $99,999 | 276 (6.0%) | 30 (0.4%) |
| $100,000 to $299,999 | 1,077 (23.4%) | 1,577 (20.1%) |
| $300,000 to $499,999 | 1,783 (38.7%) | 3,601 (46.0%) |
| $500,000 to $749,999 | 910 (19.8%) | 1,702 (21.7%) |
| $750,000 to $999,999 | 242 (5.3%) | 447 (5.7%) |
| $1,000,000 or more | 204 (4.4%) | 410 (5.2%) |
| Total | 4,603 (100.0%) | 7,837 (100.0%) |
Household Income by Mortgage Status in Amador County
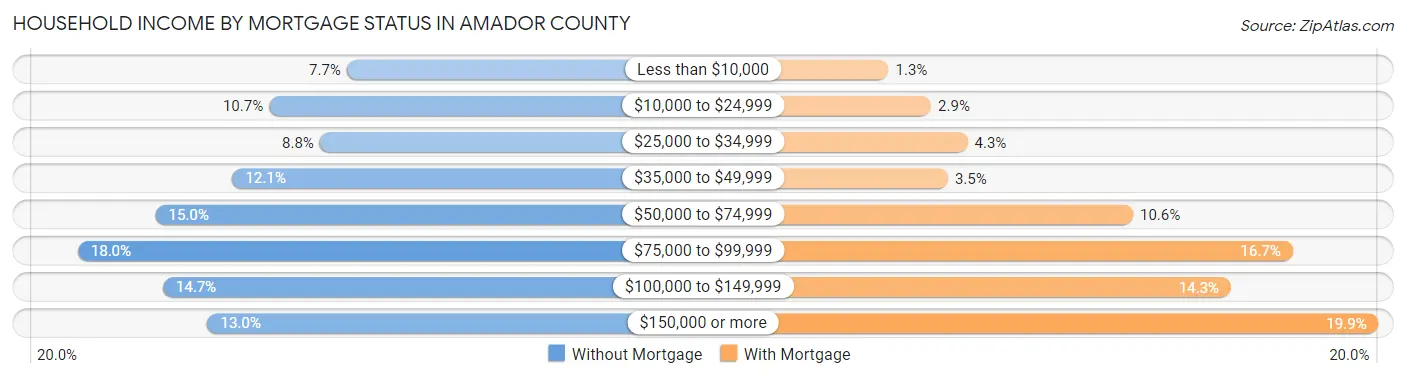
| Household Income | Without Mortgage | With Mortgage |
| Less than $10,000 | 356 (7.7%) | 99 (1.3%) |
| $10,000 to $24,999 | 492 (10.7%) | 226 (2.9%) |
| $25,000 to $34,999 | 403 (8.8%) | 335 (4.3%) |
| $35,000 to $49,999 | 556 (12.1%) | 276 (3.5%) |
| $50,000 to $74,999 | 691 (15.0%) | 828 (10.6%) |
| $75,000 to $99,999 | 827 (18.0%) | 1,305 (16.7%) |
| $100,000 to $149,999 | 678 (14.7%) | 1,121 (14.3%) |
| $150,000 or more | 600 (13.0%) | 1,561 (19.9%) |
| Total | 4,603 (100.0%) | 7,837 (100.0%) |
Property Value to Household Income Ratio in Amador County
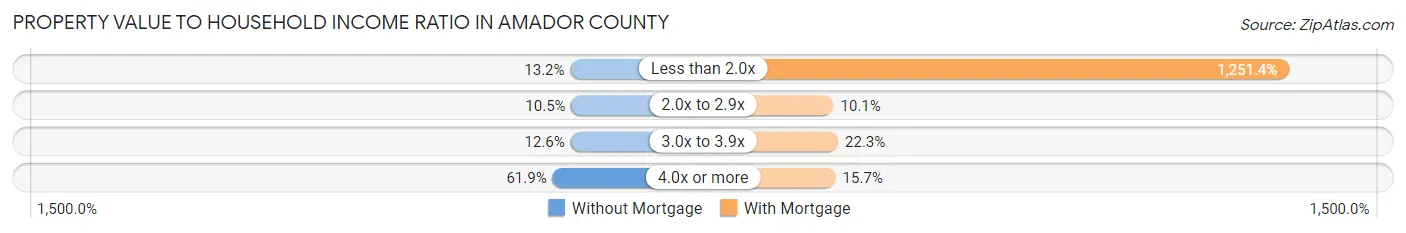
| Value-to-Income Ratio | Without Mortgage | With Mortgage |
| Less than 2.0x | 608 (13.2%) | 98,075 (1,251.4%) |
| 2.0x to 2.9x | 482 (10.5%) | 789 (10.1%) |
| 3.0x to 3.9x | 580 (12.6%) | 1,749 (22.3%) |
| 4.0x or more | 2,849 (61.9%) | 1,229 (15.7%) |
| Total | 4,603 (100.0%) | 7,837 (100.0%) |
Real Estate Taxes by Mortgage Status in Amador County
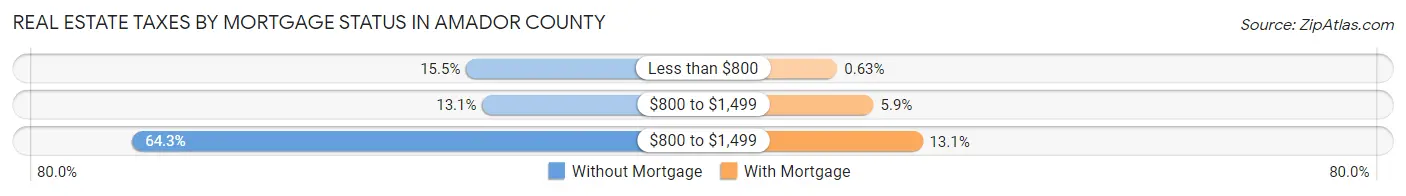
| Property Taxes | Without Mortgage | With Mortgage |
| Less than $800 | 712 (15.5%) | 49 (0.6%) |
| $800 to $1,499 | 604 (13.1%) | 465 (5.9%) |
| $800 to $1,499 | 2,958 (64.3%) | 1,024 (13.1%) |
| Total | 4,603 (100.0%) | 7,837 (100.0%) |
Health & Disability in Amador County
Health Insurance Coverage by Age in Amador County
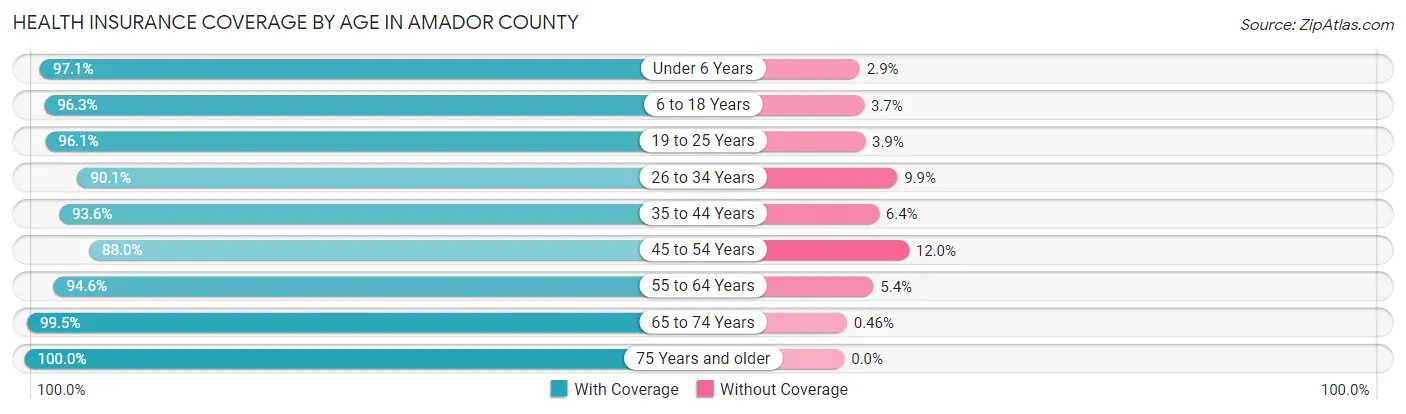
| Age Bracket | With Coverage | Without Coverage |
| Under 6 Years | 1,943 (97.1%) | 58 (2.9%) |
| 6 to 18 Years | 4,462 (96.3%) | 170 (3.7%) |
| 19 to 25 Years | 1,989 (96.1%) | 80 (3.9%) |
| 26 to 34 Years | 3,160 (90.1%) | 346 (9.9%) |
| 35 to 44 Years | 4,055 (93.6%) | 279 (6.4%) |
| 45 to 54 Years | 3,784 (88.0%) | 518 (12.0%) |
| 55 to 64 Years | 5,882 (94.6%) | 337 (5.4%) |
| 65 to 74 Years | 6,315 (99.5%) | 29 (0.5%) |
| 75 Years and older | 4,184 (100.0%) | 0 (0.0%) |
| Total | 35,774 (95.2%) | 1,817 (4.8%) |
Health Insurance Coverage by Citizenship Status in Amador County
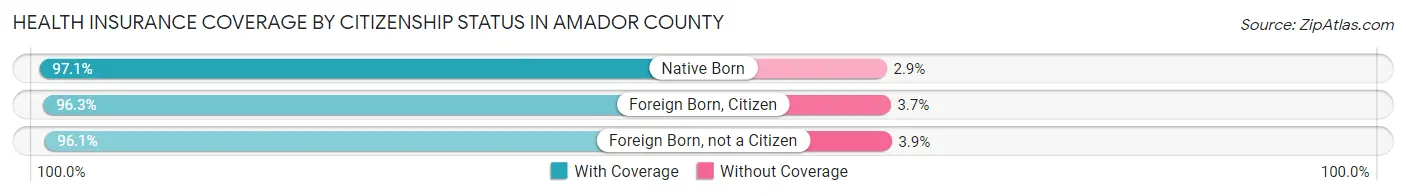
| Citizenship Status | With Coverage | Without Coverage |
| Native Born | 1,943 (97.1%) | 58 (2.9%) |
| Foreign Born, Citizen | 4,462 (96.3%) | 170 (3.7%) |
| Foreign Born, not a Citizen | 1,989 (96.1%) | 80 (3.9%) |
Health Insurance Coverage by Household Income in Amador County
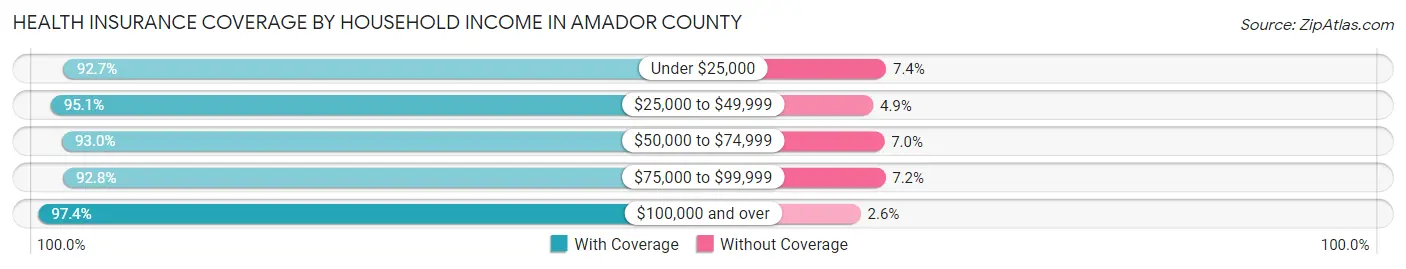
| Household Income | With Coverage | Without Coverage |
| Under $25,000 | 3,002 (92.6%) | 238 (7.3%) |
| $25,000 to $49,999 | 5,039 (95.1%) | 261 (4.9%) |
| $50,000 to $74,999 | 6,217 (93.0%) | 469 (7.0%) |
| $75,000 to $99,999 | 5,381 (92.8%) | 418 (7.2%) |
| $100,000 and over | 16,049 (97.4%) | 426 (2.6%) |
Public vs Private Health Insurance Coverage by Age in Amador County
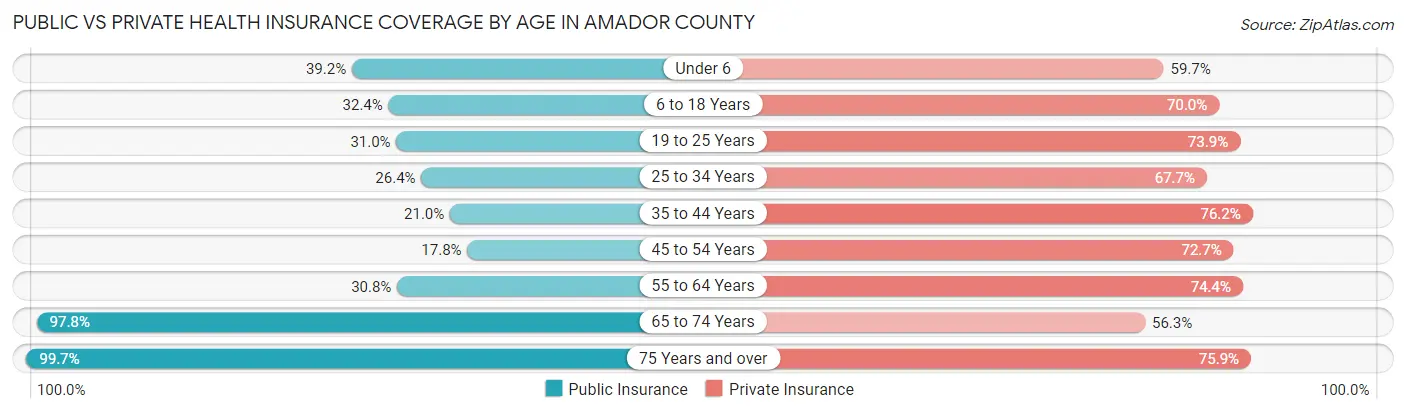
| Age Bracket | Public Insurance | Private Insurance |
| Under 6 | 785 (39.2%) | 1,195 (59.7%) |
| 6 to 18 Years | 1,502 (32.4%) | 3,244 (70.0%) |
| 19 to 25 Years | 641 (31.0%) | 1,529 (73.9%) |
| 25 to 34 Years | 924 (26.4%) | 2,375 (67.7%) |
| 35 to 44 Years | 911 (21.0%) | 3,304 (76.2%) |
| 45 to 54 Years | 766 (17.8%) | 3,128 (72.7%) |
| 55 to 64 Years | 1,918 (30.8%) | 4,628 (74.4%) |
| 65 to 74 Years | 6,202 (97.8%) | 3,571 (56.3%) |
| 75 Years and over | 4,170 (99.7%) | 3,177 (75.9%) |
| Total | 17,819 (47.4%) | 26,151 (69.6%) |
Disability Status by Sex by Age in Amador County
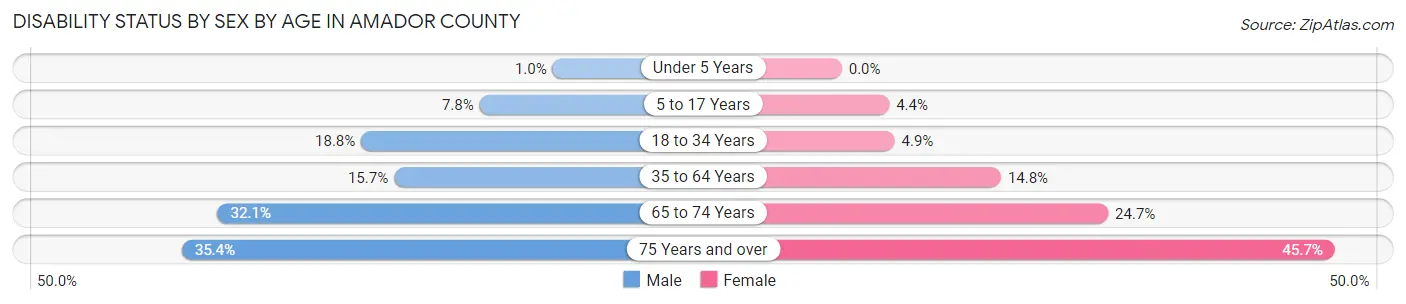
| Age Bracket | Male | Female |
| Under 5 Years | 8 (1.0%) | 0 (0.0%) |
| 5 to 17 Years | 178 (7.8%) | 102 (4.4%) |
| 18 to 34 Years | 621 (18.8%) | 136 (4.9%) |
| 35 to 64 Years | 1,242 (15.7%) | 1,027 (14.8%) |
| 65 to 74 Years | 927 (32.1%) | 854 (24.7%) |
| 75 Years and over | 675 (35.4%) | 1,042 (45.7%) |
Disability Class by Sex by Age in Amador County
Disability Class: Hearing Difficulty
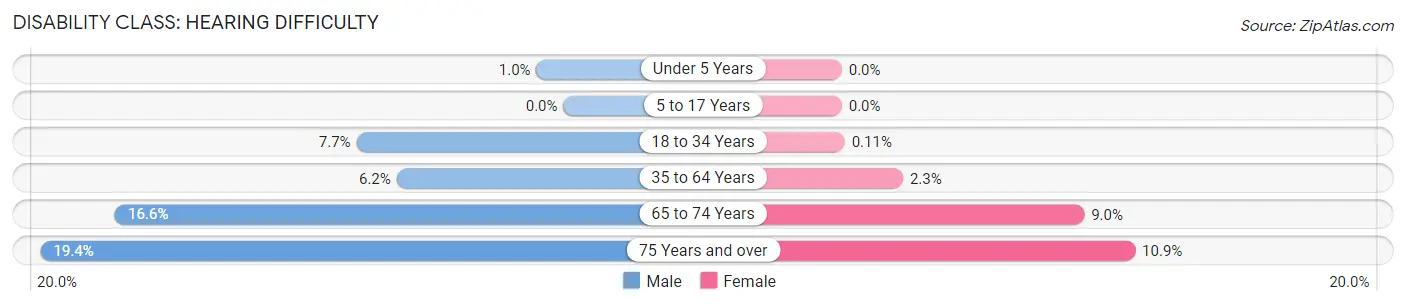
| Age Bracket | Male | Female |
| Under 5 Years | 8 (1.0%) | 0 (0.0%) |
| 5 to 17 Years | 0 (0.0%) | 0 (0.0%) |
| 18 to 34 Years | 254 (7.7%) | 3 (0.1%) |
| 35 to 64 Years | 489 (6.2%) | 158 (2.3%) |
| 65 to 74 Years | 481 (16.6%) | 311 (9.0%) |
| 75 Years and over | 370 (19.4%) | 248 (10.9%) |
Disability Class: Vision Difficulty
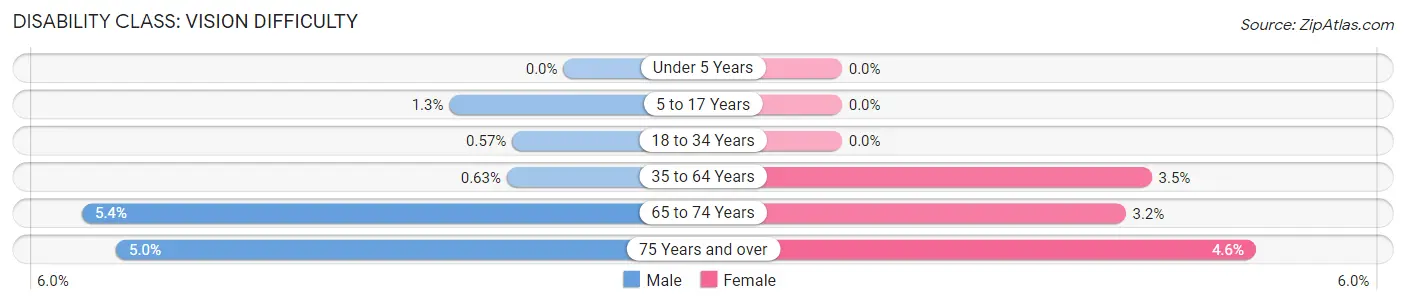
| Age Bracket | Male | Female |
| Under 5 Years | 0 (0.0%) | 0 (0.0%) |
| 5 to 17 Years | 29 (1.3%) | 0 (0.0%) |
| 18 to 34 Years | 19 (0.6%) | 0 (0.0%) |
| 35 to 64 Years | 50 (0.6%) | 240 (3.5%) |
| 65 to 74 Years | 155 (5.4%) | 109 (3.2%) |
| 75 Years and over | 95 (5.0%) | 105 (4.6%) |
Disability Class: Cognitive Difficulty
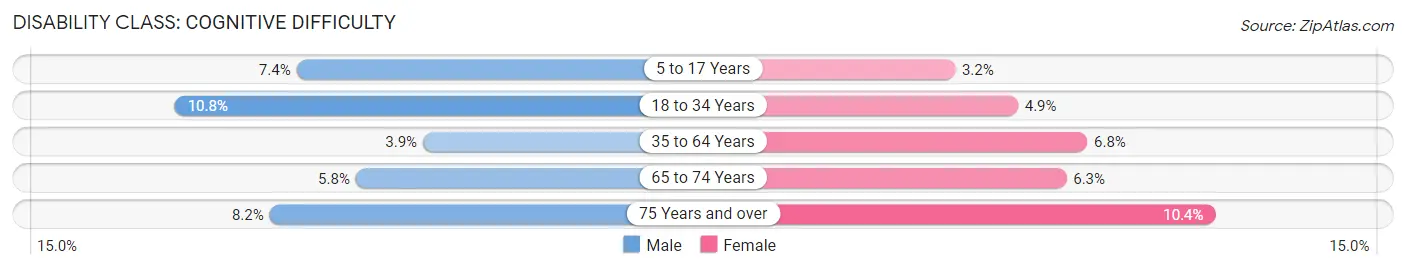
| Age Bracket | Male | Female |
| 5 to 17 Years | 170 (7.4%) | 73 (3.2%) |
| 18 to 34 Years | 358 (10.8%) | 136 (4.9%) |
| 35 to 64 Years | 309 (3.9%) | 475 (6.8%) |
| 65 to 74 Years | 167 (5.8%) | 216 (6.2%) |
| 75 Years and over | 156 (8.2%) | 237 (10.4%) |
Disability Class: Ambulatory Difficulty
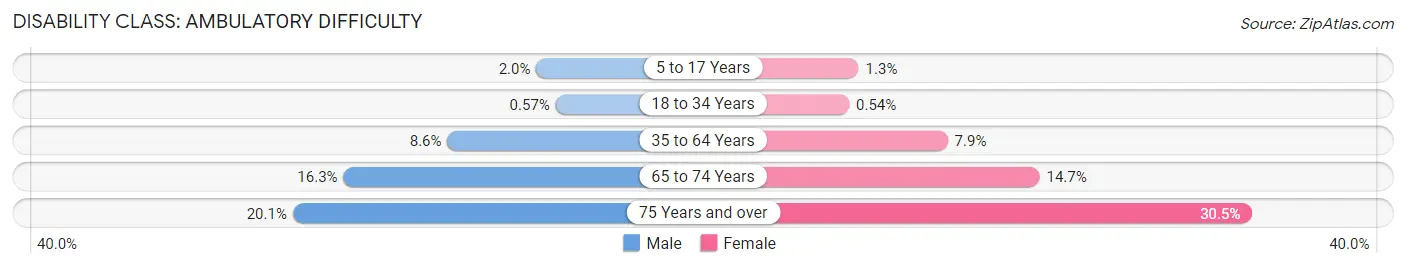
| Age Bracket | Male | Female |
| 5 to 17 Years | 46 (2.0%) | 29 (1.3%) |
| 18 to 34 Years | 19 (0.6%) | 15 (0.5%) |
| 35 to 64 Years | 680 (8.6%) | 547 (7.9%) |
| 65 to 74 Years | 472 (16.3%) | 507 (14.7%) |
| 75 Years and over | 383 (20.1%) | 694 (30.5%) |
Disability Class: Self-Care Difficulty
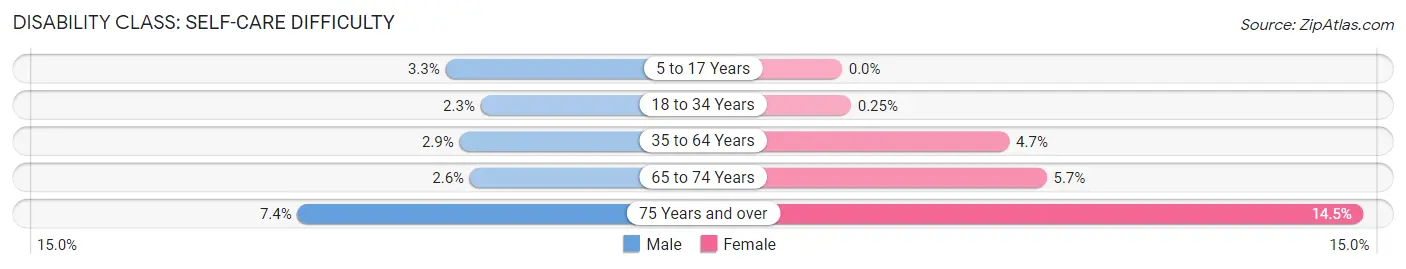
| Age Bracket | Male | Female |
| 5 to 17 Years | 75 (3.3%) | 0 (0.0%) |
| 18 to 34 Years | 76 (2.3%) | 7 (0.3%) |
| 35 to 64 Years | 228 (2.9%) | 324 (4.7%) |
| 65 to 74 Years | 75 (2.6%) | 197 (5.7%) |
| 75 Years and over | 141 (7.4%) | 331 (14.5%) |
Technology Access in Amador County
Computing Device Access in Amador County
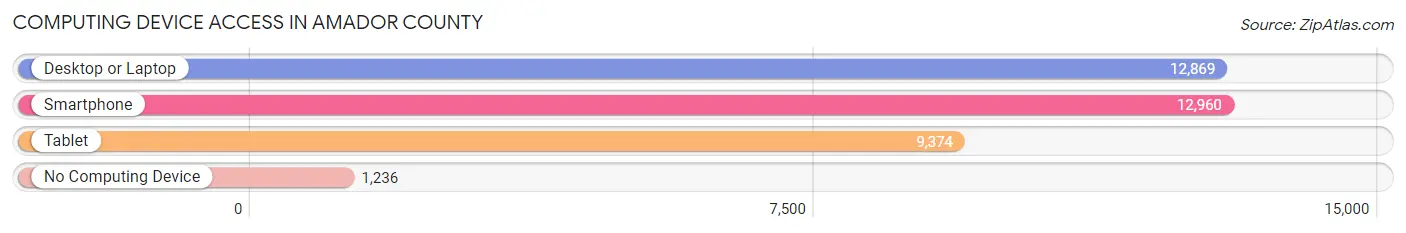
| Device Type | # Households | % Households |
| Desktop or Laptop | 12,869 | 81.7% |
| Smartphone | 12,960 | 82.3% |
| Tablet | 9,374 | 59.5% |
| No Computing Device | 1,236 | 7.9% |
| Total | 15,745 | 100.0% |
Internet Access in Amador County
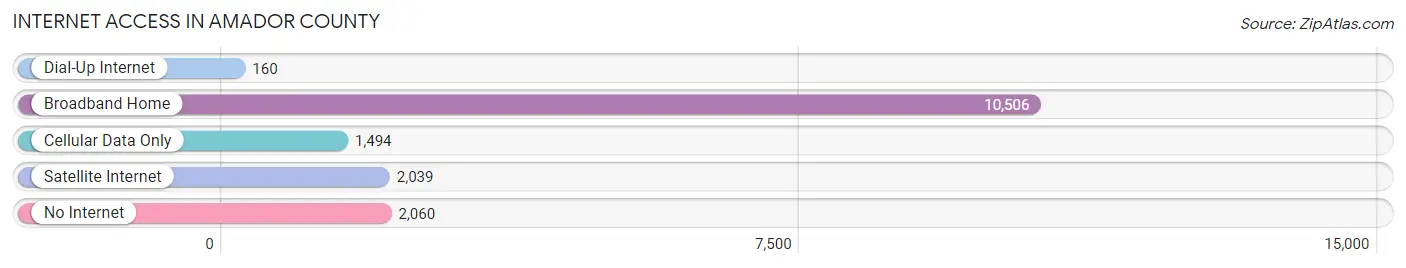
| Internet Type | # Households | % Households |
| Dial-Up Internet | 160 | 1.0% |
| Broadband Home | 10,506 | 66.7% |
| Cellular Data Only | 1,494 | 9.5% |
| Satellite Internet | 2,039 | 13.0% |
| No Internet | 2,060 | 13.1% |
| Total | 15,745 | 100.0% |
Amador County Summary
Amador County is located in the Sierra Nevada foothills of California, about an hour east of Sacramento. It is bordered by El Dorado, Calaveras, and San Joaquin counties. The county seat is Jackson, and the largest city is Sutter Creek. The county has a total area of 591 square miles, with a population of 38,091 as of the 2010 census.
History
Amador County was formed in 1854 from parts of Calaveras and El Dorado counties. It was named after José María Amador, a soldier, rancher, and miner who was born in San Francisco in 1794 and later settled in the area. The county was originally home to the Miwok and Maidu Native American tribes, who lived in the area for thousands of years before the arrival of European settlers.
The Gold Rush of 1849 brought thousands of miners to the area, and the county quickly grew in population and wealth. The county was home to several gold mining towns, including Sutter Creek, Volcano, and Jackson. The county was also home to several wineries, which were established in the late 19th century.
Geography
Amador County is located in the Sierra Nevada foothills of California, about an hour east of Sacramento. It is bordered by El Dorado, Calaveras, and San Joaquin counties. The county has a total area of 591 square miles, with a population of 38,091 as of the 2010 census.
The county is mostly mountainous, with elevations ranging from 500 to 8,000 feet. The highest point in the county is Red Mountain, at 8,037 feet. The county is home to several rivers, including the Mokelumne, Cosumnes, and American rivers.
Economy
The economy of Amador County is largely based on agriculture and tourism. The county is home to several wineries, which produce a variety of wines, including Zinfandel, Cabernet Sauvignon, and Chardonnay. The county is also home to several apple orchards, which produce a variety of apples, including Granny Smith, Golden Delicious, and Red Delicious.
Tourism is also an important part of the county’s economy. The county is home to several state parks, including Indian Grinding Rock State Historic Park, which features a large collection of Native American artifacts. The county is also home to several golf courses, including the Amador Golf Course, which is located in Sutter Creek.
Demographics
As of the 2010 census, Amador County had a population of 38,091. The racial makeup of the county was 79.2% White, 0.7% African American, 1.2% Native American, 0.7% Asian, 0.1% Pacific Islander, 15.2% from other races, and 3.0% from two or more races. Hispanic or Latino of any race were 24.4% of the population.
The median income for a household in the county was $45,845, and the median income for a family was $51,817. The per capita income for the county was $22,845. About 11.2% of families and 14.9% of the population were below the poverty line, including 19.6% of those under age 18 and 7.9% of those age 65 or over.
Common Questions
What is Per Capita Income in Amador County?
Per Capita income in Amador County is $40,379.
What is the Median Family Income in Amador County?
Median Family Income in Amador County is $95,970.
What is the Median Household income in Amador County?
Median Household Income in Amador County is $74,853.
What is Income or Wage Gap in Amador County?
Income or Wage Gap in Amador County is 29.8%.
Women in Amador County earn 70.2 cents for every dollar earned by a man.
What is Family Income Deficit in Amador County?
Family Income Deficit in Amador County is $9,906.
Families that are below poverty line in Amador County earn $9,906 less on average than the poverty threshold level.
What is Inequality or Gini Index in Amador County?
Inequality or Gini Index in Amador County is 0.46.
What is the Total Population of Amador County?
Total Population of Amador County is 40,577.
What is the Total Male Population of Amador County?
Total Male Population of Amador County is 22,007.
What is the Total Female Population of Amador County?
Total Female Population of Amador County is 18,570.
What is the Ratio of Males per 100 Females in Amador County?
There are 118.51 Males per 100 Females in Amador County.
What is the Ratio of Females per 100 Males in Amador County?
There are 84.38 Females per 100 Males in Amador County.
What is the Median Population Age in Amador County?
Median Population Age in Amador County is 49.6 Years.
What is the Average Family Size in Amador County
Average Family Size in Amador County is 2.9 People.
What is the Average Household Size in Amador County
Average Household Size in Amador County is 2.4 People.
How Large is the Labor Force in Amador County?
There are 16,910 People in the Labor Forcein in Amador County.
What is the Percentage of People in the Labor Force in Amador County?
48.1% of People are in the Labor Force in Amador County.
What is the Unemployment Rate in Amador County?
Unemployment Rate in Amador County is 6.0%.