Cities with the Highest Percentage of Moroccan Population in Ohio
RELATED REPORTS & OPTIONS
Moroccan
Ohio
Compare Cities
Map of Cities with the Highest Percentage of Moroccan Population in Ohio
0.00%
6.00%
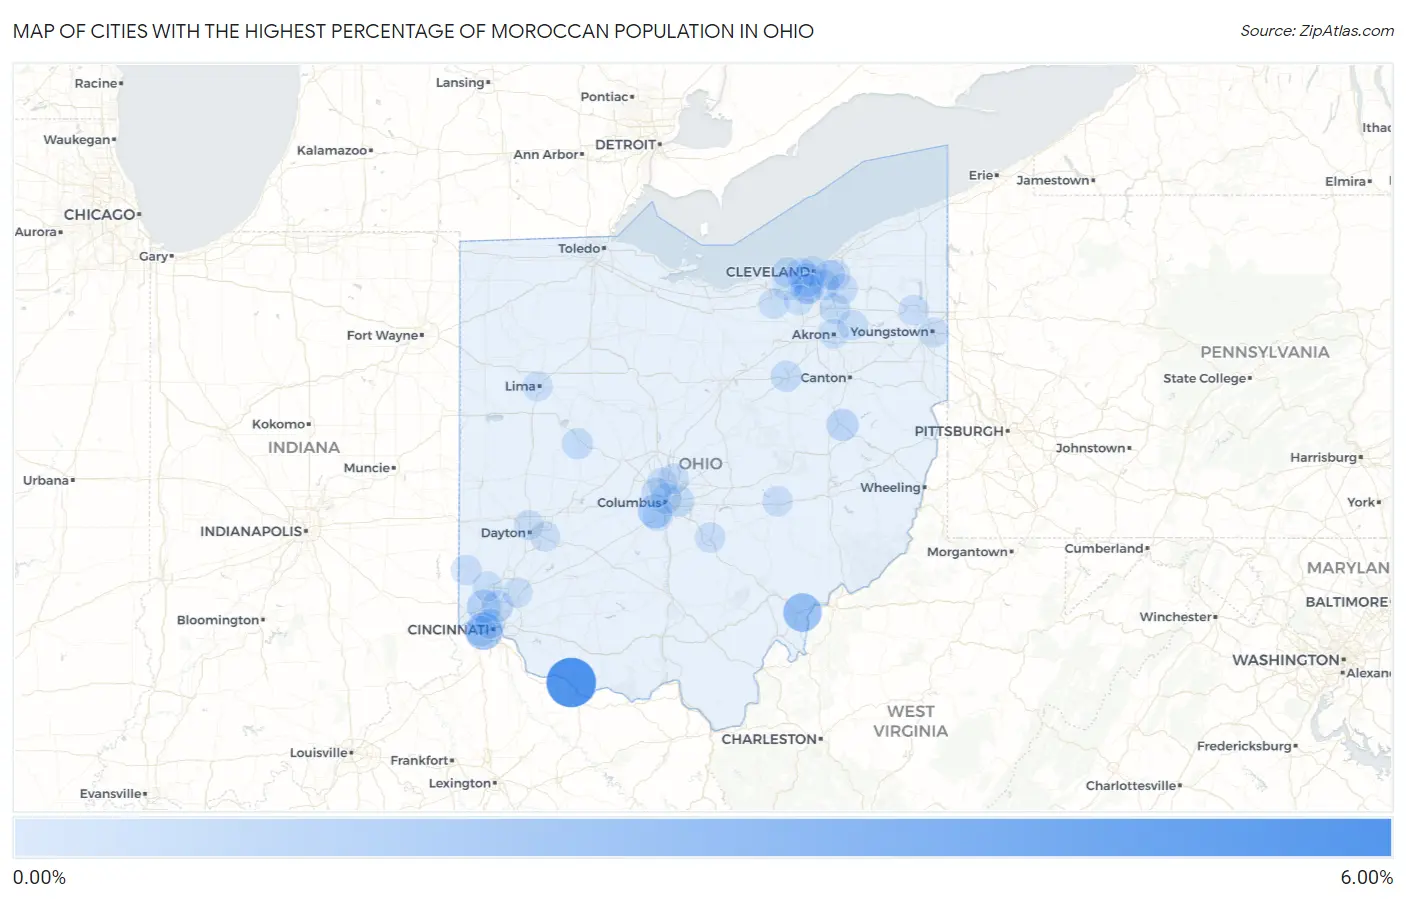
Cities with the Highest Percentage of Moroccan Population in Ohio
| City | Moroccan | vs State | vs National | |
| 1. | Ripley | 5.47% | 0.033% (+5.44)#1 | 0.039% (+5.43)#6 |
| 2. | Coolville | 2.28% | 0.033% (+2.24)#2 | 0.039% (+2.24)#29 |
| 3. | Delshire | 1.99% | 0.033% (+1.95)#3 | 0.039% (+1.95)#43 |
| 4. | Urbancrest | 1.12% | 0.033% (+1.09)#4 | 0.039% (+1.08)#85 |
| 5. | Northgate | 0.93% | 0.033% (+0.896)#5 | 0.039% (+0.890)#101 |
| 6. | Brooklyn | 0.82% | 0.033% (+0.784)#6 | 0.039% (+0.778)#119 |
| 7. | New Philadelphia | 0.56% | 0.033% (+0.529)#7 | 0.039% (+0.523)#195 |
| 8. | Woodlawn | 0.39% | 0.033% (+0.355)#8 | 0.039% (+0.349)#278 |
| 9. | Whitehall | 0.29% | 0.033% (+0.256)#9 | 0.039% (+0.250)#354 |
| 10. | Lakewood | 0.28% | 0.033% (+0.249)#10 | 0.039% (+0.243)#365 |
| 11. | Wooster | 0.26% | 0.033% (+0.226)#11 | 0.039% (+0.220)#399 |
| 12. | Bellefontaine | 0.25% | 0.033% (+0.221)#12 | 0.039% (+0.215)#406 |
| 13. | Boston Heights | 0.24% | 0.033% (+0.208)#13 | 0.039% (+0.202)#417 |
| 14. | Parma Heights | 0.23% | 0.033% (+0.199)#14 | 0.039% (+0.192)#435 |
| 15. | Garfield Heights | 0.22% | 0.033% (+0.184)#15 | 0.039% (+0.178)#458 |
| 16. | Delhi Hills | 0.18% | 0.033% (+0.143)#16 | 0.039% (+0.137)#541 |
| 17. | Beachwood | 0.17% | 0.033% (+0.133)#17 | 0.039% (+0.127)#566 |
| 18. | Columbus | 0.16% | 0.033% (+0.123)#18 | 0.039% (+0.117)#589 |
| 19. | Westerville | 0.13% | 0.033% (+0.100)#19 | 0.039% (+0.094)#652 |
| 20. | Cleveland | 0.13% | 0.033% (+0.092)#20 | 0.039% (+0.086)#678 |
| 21. | Solon | 0.12% | 0.033% (+0.091)#21 | 0.039% (+0.085)#680 |
| 22. | Parma | 0.12% | 0.033% (+0.091)#22 | 0.039% (+0.085)#682 |
| 23. | Lancaster | 0.12% | 0.033% (+0.087)#23 | 0.039% (+0.081)#694 |
| 24. | North Olmsted | 0.12% | 0.033% (+0.085)#24 | 0.039% (+0.078)#697 |
| 25. | Zanesville | 0.097% | 0.033% (+0.064)#25 | 0.039% (+0.057)#781 |
| 26. | Oxford | 0.091% | 0.033% (+0.057)#26 | 0.039% (+0.051)#807 |
| 27. | Grafton | 0.070% | 0.033% (+0.037)#27 | 0.039% (+0.030)#888 |
| 28. | Shaker Heights | 0.069% | 0.033% (+0.035)#28 | 0.039% (+0.029)#896 |
| 29. | Warren | 0.064% | 0.033% (+0.031)#29 | 0.039% (+0.024)#917 |
| 30. | Kent | 0.059% | 0.033% (+0.025)#30 | 0.039% (+0.019)#942 |
| 31. | Bay Village | 0.056% | 0.033% (+0.023)#31 | 0.039% (+0.017)#955 |
| 32. | Cincinnati | 0.054% | 0.033% (+0.021)#32 | 0.039% (+0.015)#962 |
| 33. | Mason | 0.052% | 0.033% (+0.019)#33 | 0.039% (+0.012)#981 |
| 34. | Worthington | 0.047% | 0.033% (+0.013)#34 | 0.039% (+0.007)#1,020 |
| 35. | Grove City | 0.036% | 0.033% (+0.003)#35 | 0.039% (-0.003)#1,104 |
| 36. | Beavercreek | 0.032% | 0.033% (-0.001)#36 | 0.039% (-0.007)#1,132 |
| 37. | Dayton | 0.031% | 0.033% (-0.003)#37 | 0.039% (-0.009)#1,147 |
| 38. | Hamilton | 0.030% | 0.033% (-0.003)#38 | 0.039% (-0.009)#1,154 |
| 39. | Akron | 0.024% | 0.033% (-0.010)#39 | 0.039% (-0.016)#1,206 |
| 40. | Lima | 0.022% | 0.033% (-0.011)#40 | 0.039% (-0.017)#1,219 |
| 41. | Strongsville | 0.022% | 0.033% (-0.012)#41 | 0.039% (-0.018)#1,228 |
| 42. | Upper Arlington | 0.016% | 0.033% (-0.017)#42 | 0.039% (-0.023)#1,282 |
| 43. | Youngstown | 0.0067% | 0.033% (-0.027)#43 | 0.039% (-0.033)#1,390 |
Common Questions
What are the Top 10 Cities with the Highest Percentage of Moroccan Population in Ohio?
Top 10 Cities with the Highest Percentage of Moroccan Population in Ohio are:
#1
5.47%
#2
2.28%
#3
1.99%
#4
1.12%
#5
0.93%
#6
0.82%
#7
0.56%
#8
0.39%
#9
0.29%
#10
0.28%
What city has the Highest Percentage of Moroccan Population in Ohio?
Ripley has the Highest Percentage of Moroccan Population in Ohio with 5.47%.
What is the Percentage of Moroccan Population in the State of Ohio?
Percentage of Moroccan Population in Ohio is 0.033%.
What is the Percentage of Moroccan Population in the United States?
Percentage of Moroccan Population in the United States is 0.039%.