Cities with the Highest Percentage of Moroccan Population in Maryland
RELATED REPORTS & OPTIONS
Moroccan
Maryland
Compare Cities
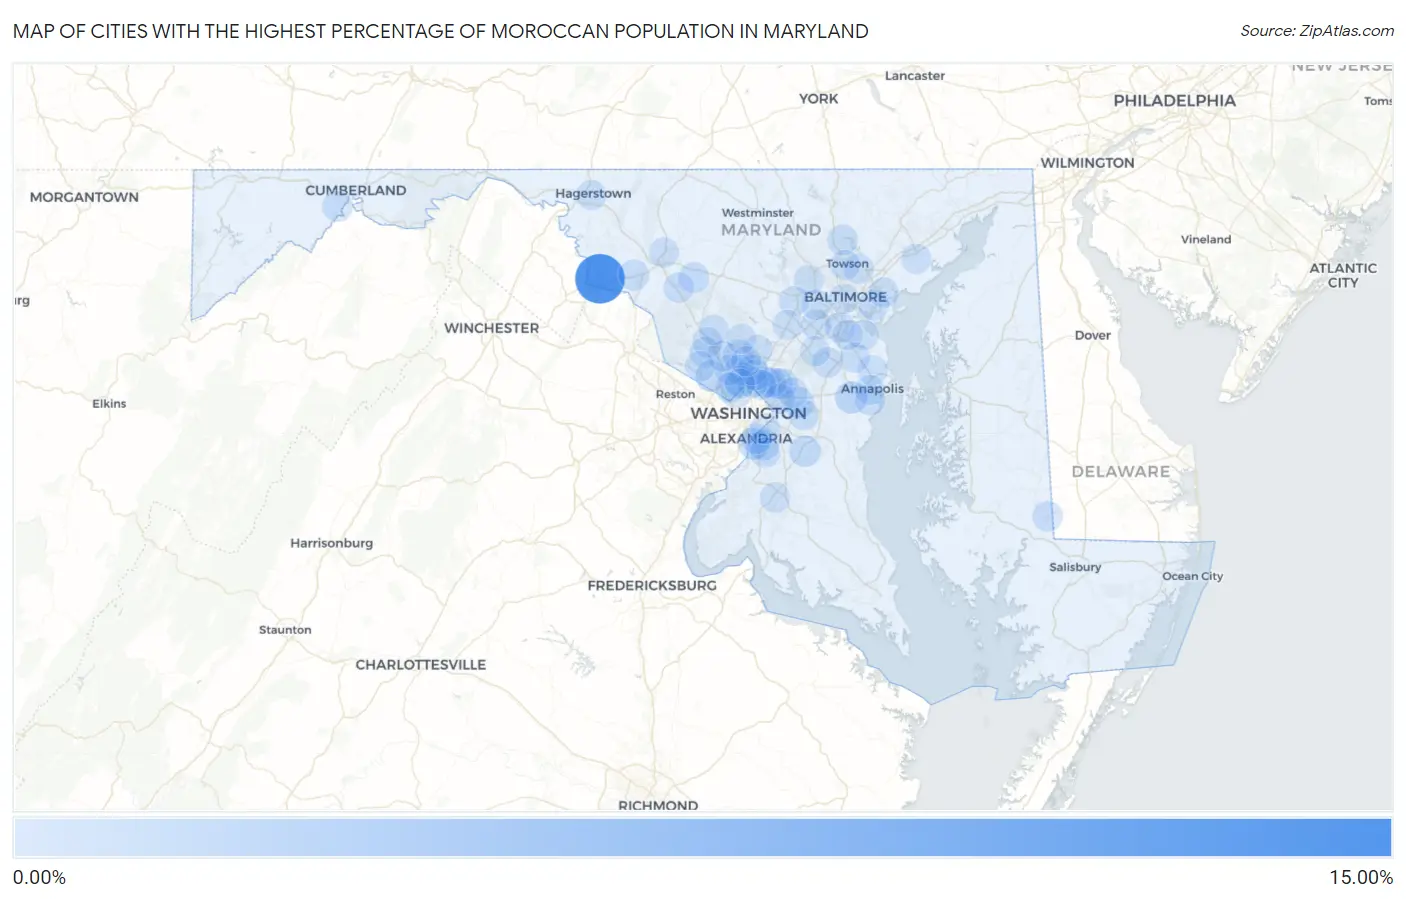
Map of Cities with the Highest Percentage of Moroccan Population in Maryland
0.00%
15.00%
Cities with the Highest Percentage of Moroccan Population in Maryland
| City | Moroccan | vs State | vs National | |
| 1. | Garretts Mill | 11.46% | 0.055%(+11.4)#1 | 0.039%(+11.4)#4 |
| 2. | Riva | 1.15% | 0.055%(+1.10)#2 | 0.039%(+1.11)#79 |
| 3. | National Harbor | 0.96% | 0.055%(+0.906)#3 | 0.039%(+0.921)#98 |
| 4. | Marlton | 0.78% | 0.055%(+0.722)#4 | 0.039%(+0.738)#128 |
| 5. | Potomac | 0.60% | 0.055%(+0.545)#5 | 0.039%(+0.561)#187 |
| 6. | Mitchellville | 0.50% | 0.055%(+0.449)#6 | 0.039%(+0.465)#216 |
| 7. | Friendship Heights Village | 0.49% | 0.055%(+0.432)#7 | 0.039%(+0.447)#223 |
| 8. | Jefferson | 0.47% | 0.055%(+0.420)#8 | 0.039%(+0.435)#226 |
| 9. | North Potomac | 0.45% | 0.055%(+0.399)#9 | 0.039%(+0.414)#243 |
| 10. | Aspen Hill | 0.45% | 0.055%(+0.391)#10 | 0.039%(+0.407)#245 |
| 11. | North Chevy Chase | 0.44% | 0.055%(+0.386)#11 | 0.039%(+0.401)#249 |
| 12. | Monrovia | 0.37% | 0.055%(+0.315)#12 | 0.039%(+0.330)#295 |
| 13. | Oxon Hill | 0.32% | 0.055%(+0.264)#13 | 0.039%(+0.279)#335 |
| 14. | Cresaptown | 0.32% | 0.055%(+0.261)#14 | 0.039%(+0.277)#338 |
| 15. | Greenbelt | 0.31% | 0.055%(+0.258)#15 | 0.039%(+0.273)#340 |
| 16. | Adelphi | 0.28% | 0.055%(+0.223)#16 | 0.039%(+0.238)#374 |
| 17. | Cockeysville | 0.28% | 0.055%(+0.221)#17 | 0.039%(+0.236)#378 |
| 18. | Berwyn Heights | 0.27% | 0.055%(+0.217)#18 | 0.039%(+0.232)#385 |
| 19. | Silver Spring | 0.27% | 0.055%(+0.214)#19 | 0.039%(+0.230)#389 |
| 20. | Sharptown | 0.27% | 0.055%(+0.211)#20 | 0.039%(+0.226)#394 |
| 21. | Dundalk | 0.26% | 0.055%(+0.205)#21 | 0.039%(+0.220)#398 |
| 22. | Kettering | 0.24% | 0.055%(+0.183)#22 | 0.039%(+0.198)#420 |
| 23. | Woodlawn Cdp Baltimore County | 0.23% | 0.055%(+0.177)#23 | 0.039%(+0.193)#433 |
| 24. | College Park | 0.22% | 0.055%(+0.163)#24 | 0.039%(+0.179)#457 |
| 25. | North Bethesda | 0.21% | 0.055%(+0.156)#25 | 0.039%(+0.172)#463 |
| 26. | Four Corners | 0.21% | 0.055%(+0.151)#26 | 0.039%(+0.167)#475 |
| 27. | North Kensington | 0.20% | 0.055%(+0.146)#27 | 0.039%(+0.161)#484 |
| 28. | Forest Heights | 0.19% | 0.055%(+0.135)#28 | 0.039%(+0.150)#507 |
| 29. | Urbana | 0.18% | 0.055%(+0.125)#29 | 0.039%(+0.140)#531 |
| 30. | Annapolis Neck | 0.16% | 0.055%(+0.103)#30 | 0.039%(+0.118)#587 |
| 31. | Friendly | 0.15% | 0.055%(+0.096)#31 | 0.039%(+0.111)#600 |
| 32. | Kemp Mill | 0.14% | 0.055%(+0.087)#32 | 0.039%(+0.102)#623 |
| 33. | Landover Hills | 0.14% | 0.055%(+0.087)#33 | 0.039%(+0.102)#624 |
| 34. | Rockville | 0.14% | 0.055%(+0.085)#34 | 0.039%(+0.101)#627 |
| 35. | Elkridge | 0.14% | 0.055%(+0.084)#35 | 0.039%(+0.099)#635 |
| 36. | Ferndale | 0.14% | 0.055%(+0.083)#36 | 0.039%(+0.099)#637 |
| 37. | Flower Hill | 0.14% | 0.055%(+0.082)#37 | 0.039%(+0.097)#640 |
| 38. | Odenton | 0.13% | 0.055%(+0.076)#38 | 0.039%(+0.092)#661 |
| 39. | Langley Park | 0.12% | 0.055%(+0.069)#39 | 0.039%(+0.085)#683 |
| 40. | Frederick | 0.11% | 0.055%(+0.059)#40 | 0.039%(+0.074)#714 |
| 41. | Riviera Beach | 0.11% | 0.055%(+0.053)#41 | 0.039%(+0.068)#746 |
| 42. | Gaithersburg | 0.11% | 0.055%(+0.053)#42 | 0.039%(+0.068)#747 |
| 43. | Hillcrest Heights | 0.10% | 0.055%(+0.049)#43 | 0.039%(+0.064)#763 |
| 44. | Hagerstown | 0.097% | 0.055%(+0.042)#44 | 0.039%(+0.057)#783 |
| 45. | Parkville | 0.095% | 0.055%(+0.040)#45 | 0.039%(+0.056)#789 |
| 46. | Chevy Chase | 0.092% | 0.055%(+0.037)#46 | 0.039%(+0.053)#803 |
| 47. | Edgewood | 0.092% | 0.055%(+0.037)#47 | 0.039%(+0.052)#805 |
| 48. | Travilah | 0.083% | 0.055%(+0.028)#48 | 0.039%(+0.044)#838 |
| 49. | Cloverly | 0.079% | 0.055%(+0.024)#49 | 0.039%(+0.040)#853 |
| 50. | Waldorf | 0.079% | 0.055%(+0.024)#50 | 0.039%(+0.040)#855 |
| 51. | Catonsville | 0.075% | 0.055%(+0.020)#51 | 0.039%(+0.035)#866 |
| 52. | Milford Mill | 0.073% | 0.055%(+0.018)#52 | 0.039%(+0.034)#874 |
| 53. | Arnold | 0.073% | 0.055%(+0.018)#53 | 0.039%(+0.033)#875 |
| 54. | Lanham | 0.060% | 0.055%(+0.005)#54 | 0.039%(+0.021)#933 |
| 55. | Severna Park | 0.057% | 0.055%(+0.002)#55 | 0.039%(+0.017)#948 |
| 56. | Glenmont | 0.054% | 0.055%(-0.000)#56 | 0.039%(+0.015)#964 |
| 57. | Fort Meade | 0.050% | 0.055%(-0.005)#57 | 0.039%(+0.011)#997 |
| 58. | Ellicott City | 0.045% | 0.055%(-0.010)#58 | 0.039%(+0.005)#1,033 |
| 59. | Baltimore | 0.043% | 0.055%(-0.011)#59 | 0.039%(+0.004)#1,045 |
| 60. | Olney | 0.037% | 0.055%(-0.018)#60 | 0.039%(-0.003)#1,100 |
| 61. | Bethesda | 0.033% | 0.055%(-0.021)#61 | 0.039%(-0.006)#1,125 |
| 62. | Towson | 0.033% | 0.055%(-0.022)#62 | 0.039%(-0.006)#1,128 |
| 63. | Annapolis | 0.027% | 0.055%(-0.028)#63 | 0.039%(-0.012)#1,180 |
| 64. | Columbia | 0.023% | 0.055%(-0.032)#64 | 0.039%(-0.017)#1,218 |
| 65. | Montgomery Village | 0.020% | 0.055%(-0.034)#65 | 0.039%(-0.019)#1,247 |
| 66. | Glen Burnie | 0.020% | 0.055%(-0.035)#66 | 0.039%(-0.020)#1,254 |
| 67. | Essex | 0.020% | 0.055%(-0.035)#67 | 0.039%(-0.020)#1,255 |
Common Questions
What are the Top 10 Cities with the Highest Percentage of Moroccan Population in Maryland?
Top 10 Cities with the Highest Percentage of Moroccan Population in Maryland are:
#1
11.46%
#2
1.15%
#3
0.96%
#4
0.78%
#5
0.60%
#6
0.50%
#7
0.49%
#8
0.47%
#9
0.45%
#10
0.45%
What city has the Highest Percentage of Moroccan Population in Maryland?
Garretts Mill has the Highest Percentage of Moroccan Population in Maryland with 11.46%.
What is the Percentage of Moroccan Population in the State of Maryland?
Percentage of Moroccan Population in Maryland is 0.055%.
What is the Percentage of Moroccan Population in the United States?
Percentage of Moroccan Population in the United States is 0.039%.