Shoreham, NY Map & Demographics
Shoreham Map
Shoreham Overview
$73,941
PER CAPITA INCOME
$159,375
AVG FAMILY INCOME
$156,875
AVG HOUSEHOLD INCOME
57.2%
WAGE / INCOME GAP [ % ]
42.8¢/ $1
WAGE / INCOME GAP [ $ ]
0.43
INEQUALITY / GINI INDEX
591
TOTAL POPULATION
302
MALE POPULATION
289
FEMALE POPULATION
104.50
MALES / 100 FEMALES
95.70
FEMALES / 100 MALES
51.6
MEDIAN AGE
3.4
AVG FAMILY SIZE
3.0
AVG HOUSEHOLD SIZE
270
LABOR FORCE [ PEOPLE ]
59.0%
PERCENT IN LABOR FORCE
3.0%
UNEMPLOYMENT RATE
Shoreham Zip Codes
Shoreham Area Codes
Income in Shoreham
Income Overview in Shoreham
Per Capita Income in Shoreham is $73,941, while median incomes of families and households are $159,375 and $156,875 respectively.
| Characteristic | Number | Measure |
| Per Capita Income | 591 | $73,941 |
| Median Family Income | 155 | $159,375 |
| Mean Family Income | 155 | $215,963 |
| Median Household Income | 197 | $156,875 |
| Mean Household Income | 197 | $215,378 |
| Income Deficit | 155 | $0 |
| Wage / Income Gap (%) | 591 | 57.16% |
| Wage / Income Gap ($) | 591 | 42.84¢ per $1 |
| Gini / Inequality Index | 591 | 0.43 |
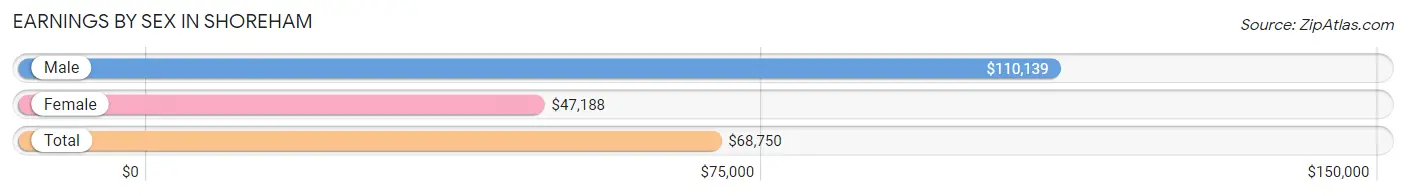
Earnings by Sex in Shoreham
Average Earnings in Shoreham are $68,750, $110,139 for men and $47,188 for women, a difference of 57.2%.
| Sex | Number | Average Earnings |
| Male | 167 (60.3%) | $110,139 |
| Female | 110 (39.7%) | $47,188 |
| Total | 277 (100.0%) | $68,750 |
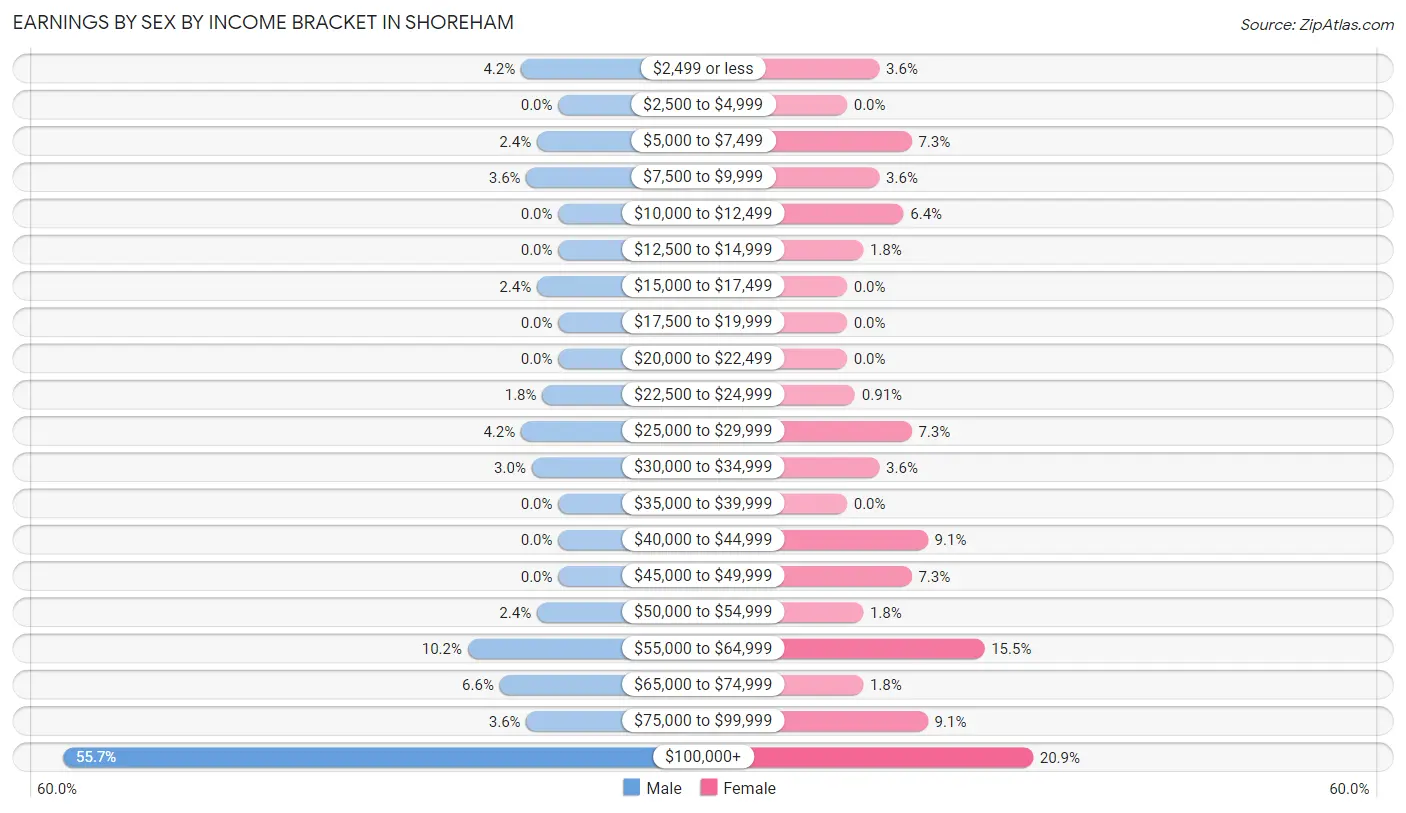
Earnings by Sex by Income Bracket in Shoreham
The most common earnings brackets in Shoreham are $100,000+ for men (93 | 55.7%) and $100,000+ for women (23 | 20.9%).
| Income | Male | Female |
| $2,499 or less | 7 (4.2%) | 4 (3.6%) |
| $2,500 to $4,999 | 0 (0.0%) | 0 (0.0%) |
| $5,000 to $7,499 | 4 (2.4%) | 8 (7.3%) |
| $7,500 to $9,999 | 6 (3.6%) | 4 (3.6%) |
| $10,000 to $12,499 | 0 (0.0%) | 7 (6.4%) |
| $12,500 to $14,999 | 0 (0.0%) | 2 (1.8%) |
| $15,000 to $17,499 | 4 (2.4%) | 0 (0.0%) |
| $17,500 to $19,999 | 0 (0.0%) | 0 (0.0%) |
| $20,000 to $22,499 | 0 (0.0%) | 0 (0.0%) |
| $22,500 to $24,999 | 3 (1.8%) | 1 (0.9%) |
| $25,000 to $29,999 | 7 (4.2%) | 8 (7.3%) |
| $30,000 to $34,999 | 5 (3.0%) | 4 (3.6%) |
| $35,000 to $39,999 | 0 (0.0%) | 0 (0.0%) |
| $40,000 to $44,999 | 0 (0.0%) | 10 (9.1%) |
| $45,000 to $49,999 | 0 (0.0%) | 8 (7.3%) |
| $50,000 to $54,999 | 4 (2.4%) | 2 (1.8%) |
| $55,000 to $64,999 | 17 (10.2%) | 17 (15.4%) |
| $65,000 to $74,999 | 11 (6.6%) | 2 (1.8%) |
| $75,000 to $99,999 | 6 (3.6%) | 10 (9.1%) |
| $100,000+ | 93 (55.7%) | 23 (20.9%) |
| Total | 167 (100.0%) | 110 (100.0%) |
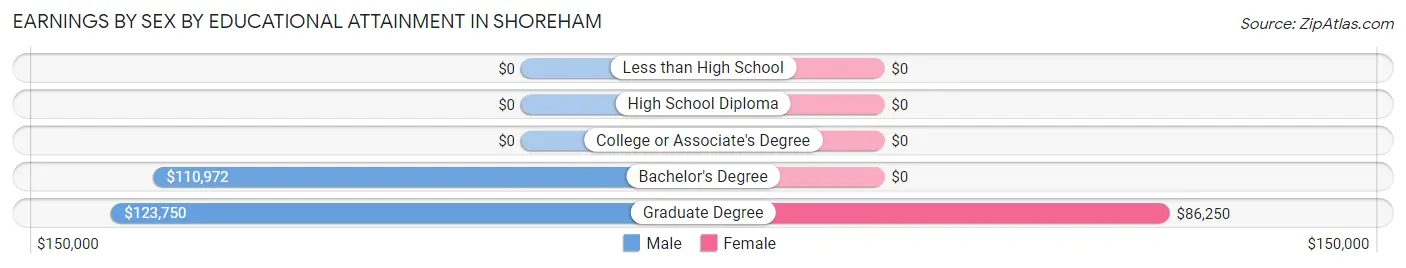
Earnings by Sex by Educational Attainment in Shoreham
Average earnings in Shoreham are $110,972 for men and $56,667 for women, a difference of 48.9%. Men with an educational attainment of graduate degree enjoy the highest average annual earnings of $123,750, while those with bachelor's degree education earn the least with $110,972. Women with an educational attainment of graduate degree earn the most with the average annual earnings of $86,250, while those with graduate degree education have the smallest earnings of $86,250.
| Educational Attainment | Male Income | Female Income |
| Less than High School | - | - |
| High School Diploma | - | - |
| College or Associate's Degree | - | - |
| Bachelor's Degree | $110,972 | $0 |
| Graduate Degree | $123,750 | $86,250 |
| Total | $110,972 | $56,667 |
Family Income in Shoreham
Family Income Brackets in Shoreham
According to the Shoreham family income data, there are 65 families falling into the $200,000+ income range, which is the most common income bracket and makes up 41.9% of all families.
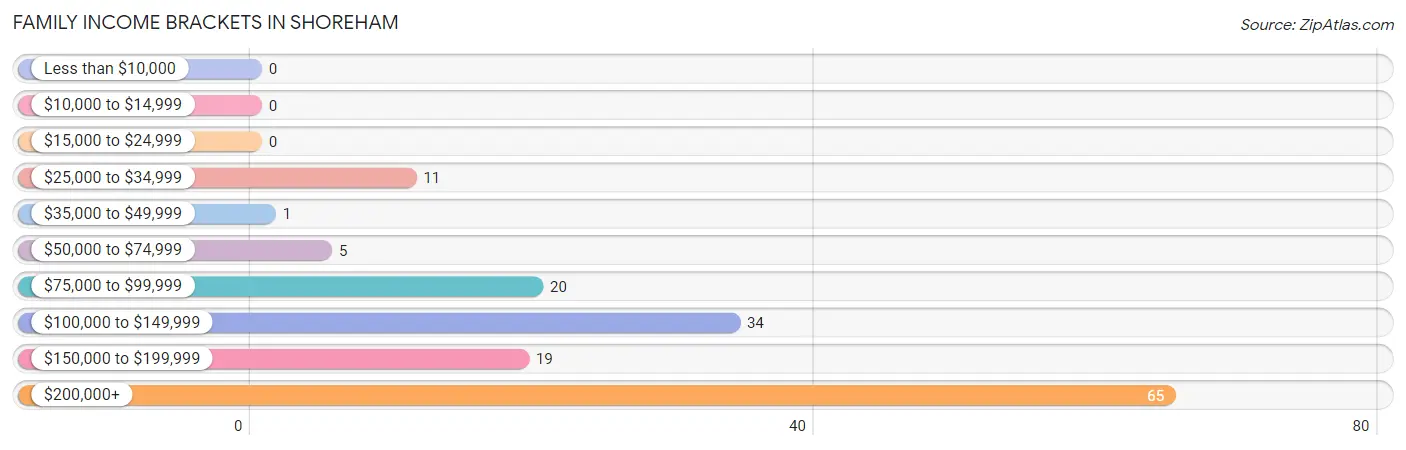
| Income Bracket | # Families | % Families |
| Less than $10,000 | 0 | 0.0% |
| $10,000 to $14,999 | 0 | 0.0% |
| $15,000 to $24,999 | 0 | 0.0% |
| $25,000 to $34,999 | 11 | 7.1% |
| $35,000 to $49,999 | 1 | 0.6% |
| $50,000 to $74,999 | 5 | 3.2% |
| $75,000 to $99,999 | 20 | 12.9% |
| $100,000 to $149,999 | 34 | 21.9% |
| $150,000 to $199,999 | 19 | 12.3% |
| $200,000+ | 65 | 41.9% |
Family Income by Famaliy Size in Shoreham
5-person families (18 | 11.6%) account for the highest median family income in Shoreham with $242,857 per family, while 2-person families (71 | 45.8%) have the highest median income of $77,812 per family member.
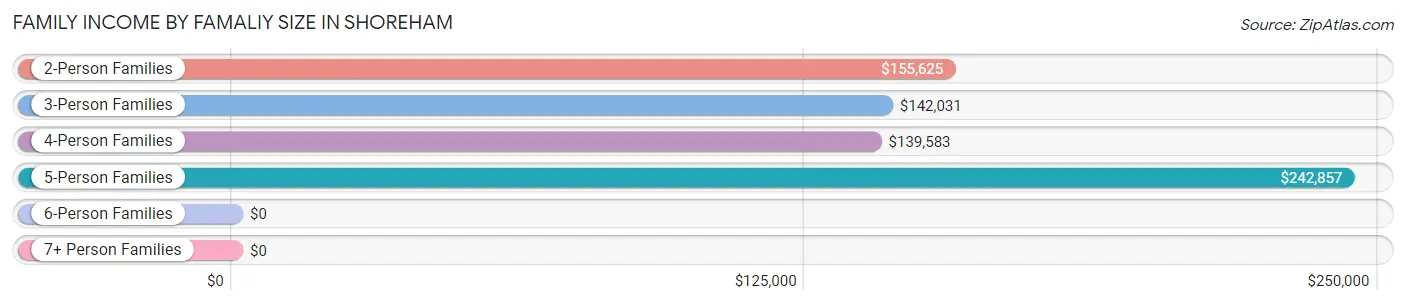
| Income Bracket | # Families | Median Income |
| 2-Person Families | 71 (45.8%) | $155,625 |
| 3-Person Families | 33 (21.3%) | $142,031 |
| 4-Person Families | 23 (14.8%) | $139,583 |
| 5-Person Families | 18 (11.6%) | $242,857 |
| 6-Person Families | 3 (1.9%) | $0 |
| 7+ Person Families | 7 (4.5%) | $0 |
| Total | 155 (100.0%) | $159,375 |
Family Income by Number of Earners in Shoreham
The median family income in Shoreham is $159,375, with families comprising 2 earners (67) having the highest median family income of $214,583, while families with 1 earner (54) have the lowest median family income of $132,500, accounting for 43.2% and 34.8% of families, respectively.
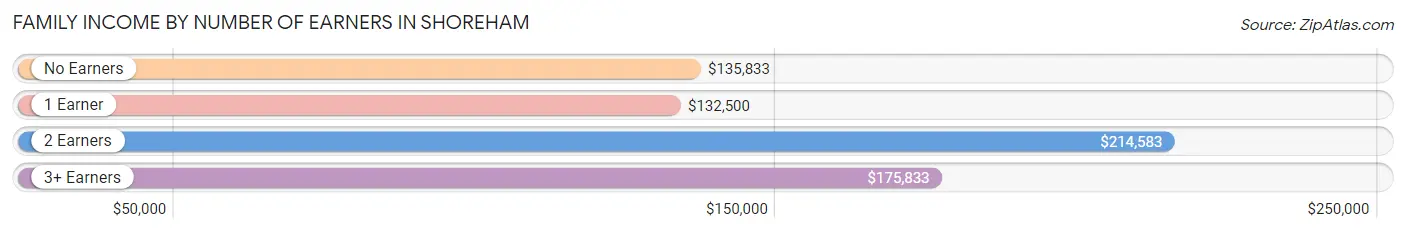
| Number of Earners | # Families | Median Income |
| No Earners | 22 (14.2%) | $135,833 |
| 1 Earner | 54 (34.8%) | $132,500 |
| 2 Earners | 67 (43.2%) | $214,583 |
| 3+ Earners | 12 (7.7%) | $175,833 |
| Total | 155 (100.0%) | $159,375 |
Household Income in Shoreham
Household Income Brackets in Shoreham
With 84 households falling in the category, the $200,000+ income range is the most frequent in Shoreham, accounting for 42.6% of all households.
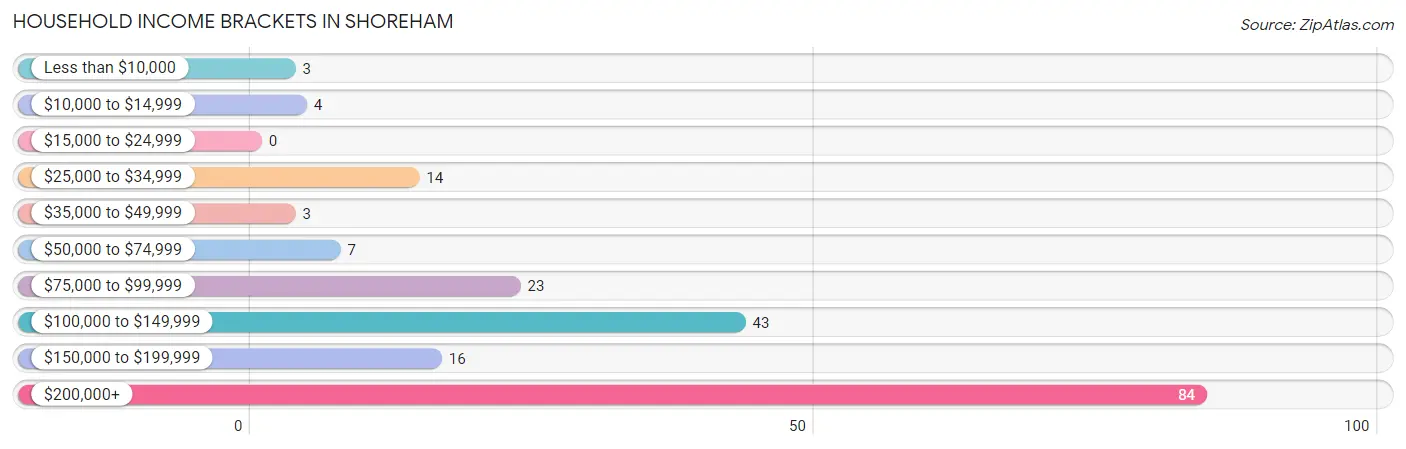
| Income Bracket | # Households | % Households |
| Less than $10,000 | 3 | 1.5% |
| $10,000 to $14,999 | 4 | 2.0% |
| $15,000 to $24,999 | 0 | 0.0% |
| $25,000 to $34,999 | 14 | 7.1% |
| $35,000 to $49,999 | 3 | 1.5% |
| $50,000 to $74,999 | 7 | 3.6% |
| $75,000 to $99,999 | 23 | 11.7% |
| $100,000 to $149,999 | 43 | 21.8% |
| $150,000 to $199,999 | 16 | 8.1% |
| $200,000+ | 84 | 42.6% |
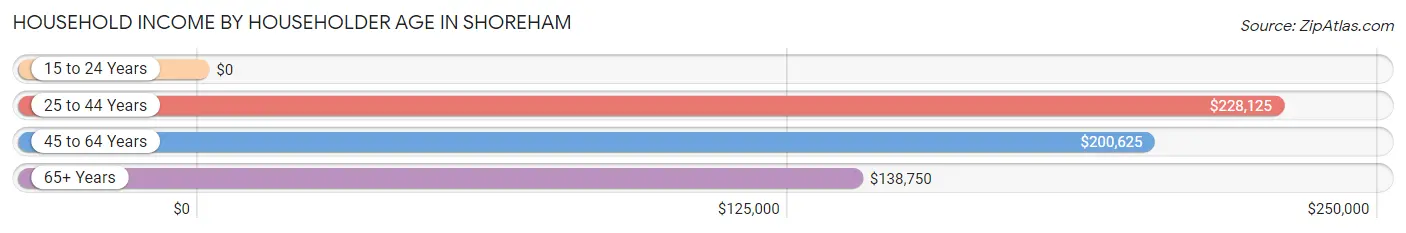
Household Income by Householder Age in Shoreham
The median household income in Shoreham is $156,875, with the highest median household income of $228,125 found in the 25 to 44 years age bracket for the primary householder. A total of 30 households (15.2%) fall into this category.
| Income Bracket | # Households | Median Income |
| 15 to 24 Years | 0 (0.0%) | $0 |
| 25 to 44 Years | 30 (15.2%) | $228,125 |
| 45 to 64 Years | 70 (35.5%) | $200,625 |
| 65+ Years | 97 (49.2%) | $138,750 |
| Total | 197 (100.0%) | $156,875 |
Poverty in Shoreham
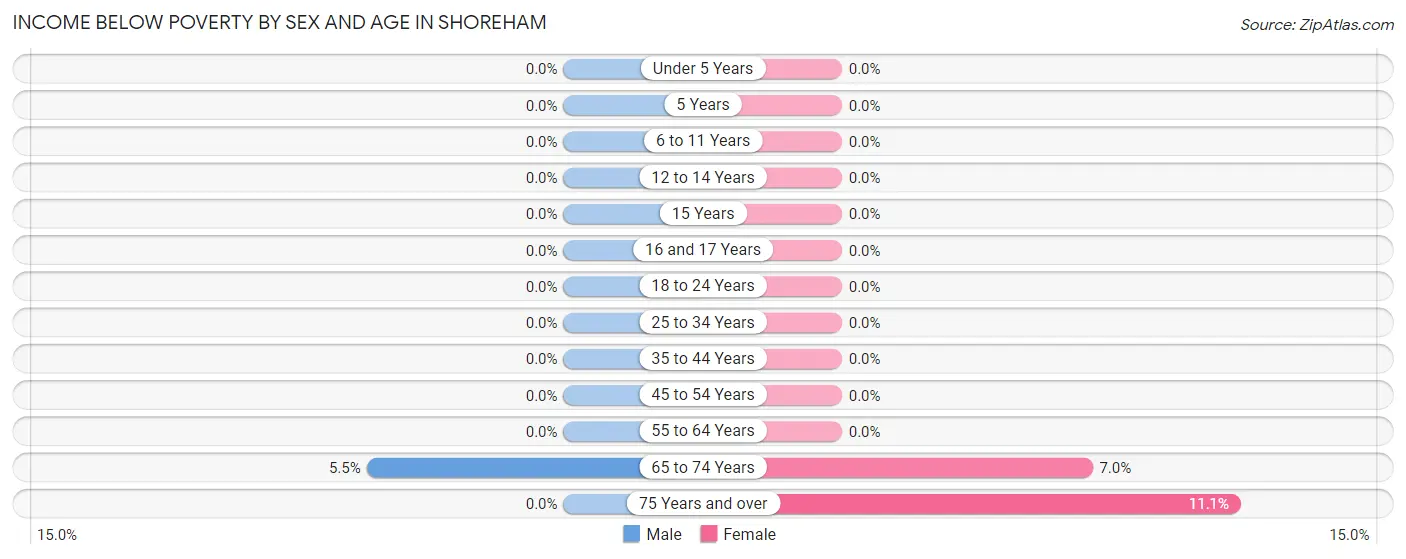
Income Below Poverty by Sex and Age in Shoreham
With 1.3% poverty level for males and 2.1% for females among the residents of Shoreham, 65 to 74 year old males and 75 year old and over females are the most vulnerable to poverty, with 4 males (5.5%) and 3 females (11.1%) in their respective age groups living below the poverty level.
| Age Bracket | Male | Female |
| Under 5 Years | 0 (0.0%) | 0 (0.0%) |
| 5 Years | 0 (0.0%) | 0 (0.0%) |
| 6 to 11 Years | 0 (0.0%) | 0 (0.0%) |
| 12 to 14 Years | 0 (0.0%) | 0 (0.0%) |
| 15 Years | 0 (0.0%) | 0 (0.0%) |
| 16 and 17 Years | 0 (0.0%) | 0 (0.0%) |
| 18 to 24 Years | 0 (0.0%) | 0 (0.0%) |
| 25 to 34 Years | 0 (0.0%) | 0 (0.0%) |
| 35 to 44 Years | 0 (0.0%) | 0 (0.0%) |
| 45 to 54 Years | 0 (0.0%) | 0 (0.0%) |
| 55 to 64 Years | 0 (0.0%) | 0 (0.0%) |
| 65 to 74 Years | 4 (5.5%) | 3 (7.0%) |
| 75 Years and over | 0 (0.0%) | 3 (11.1%) |
| Total | 4 (1.3%) | 6 (2.1%) |
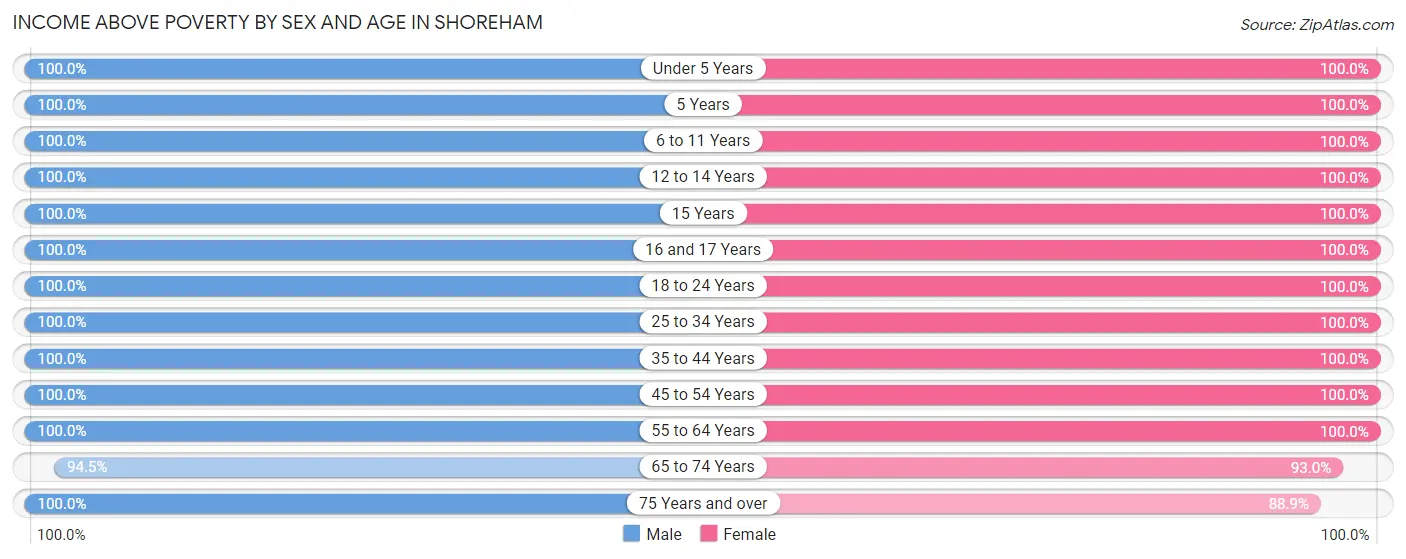
Income Above Poverty by Sex and Age in Shoreham
According to the poverty statistics in Shoreham, males aged under 5 years and females aged under 5 years are the age groups that are most secure financially, with 100.0% of males and 100.0% of females in these age groups living above the poverty line.
| Age Bracket | Male | Female |
| Under 5 Years | 22 (100.0%) | 5 (100.0%) |
| 5 Years | 4 (100.0%) | 4 (100.0%) |
| 6 to 11 Years | 21 (100.0%) | 34 (100.0%) |
| 12 to 14 Years | 15 (100.0%) | 13 (100.0%) |
| 15 Years | 5 (100.0%) | 4 (100.0%) |
| 16 and 17 Years | 2 (100.0%) | 8 (100.0%) |
| 18 to 24 Years | 17 (100.0%) | 21 (100.0%) |
| 25 to 34 Years | 6 (100.0%) | 7 (100.0%) |
| 35 to 44 Years | 24 (100.0%) | 35 (100.0%) |
| 45 to 54 Years | 35 (100.0%) | 37 (100.0%) |
| 55 to 64 Years | 49 (100.0%) | 45 (100.0%) |
| 65 to 74 Years | 69 (94.5%) | 40 (93.0%) |
| 75 Years and over | 29 (100.0%) | 24 (88.9%) |
| Total | 298 (98.7%) | 277 (97.9%) |
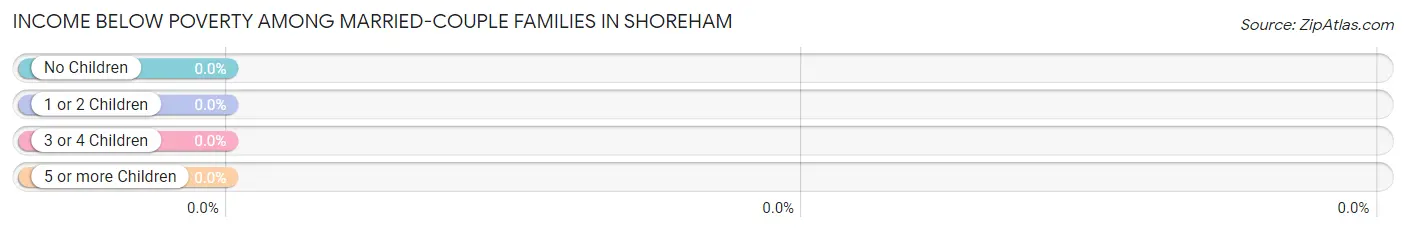
Income Below Poverty Among Married-Couple Families in Shoreham
| Children | Above Poverty | Below Poverty |
| No Children | 91 (100.0%) | 0 (0.0%) |
| 1 or 2 Children | 39 (100.0%) | 0 (0.0%) |
| 3 or 4 Children | 17 (100.0%) | 0 (0.0%) |
| 5 or more Children | 0 (0.0%) | 0 (0.0%) |
| Total | 147 (100.0%) | 0 (0.0%) |
Income Below Poverty Among Single-Parent Households in Shoreham
| Children | Single Father | Single Mother |
| No Children | 0 (0.0%) | 0 (0.0%) |
| 1 or 2 Children | 0 (0.0%) | 0 (0.0%) |
| 3 or 4 Children | 0 (0.0%) | 0 (0.0%) |
| 5 or more Children | 0 (0.0%) | 0 (0.0%) |
| Total | 0 (0.0%) | 0 (0.0%) |
Income Below Poverty Among Married-Couple vs Single-Parent Households in Shoreham
| Children | Married-Couple Families | Single-Parent Households |
| No Children | 0 (0.0%) | 0 (0.0%) |
| 1 or 2 Children | 0 (0.0%) | 0 (0.0%) |
| 3 or 4 Children | 0 (0.0%) | 0 (0.0%) |
| 5 or more Children | 0 (0.0%) | 0 (0.0%) |
| Total | 0 (0.0%) | 0 (0.0%) |
Race in Shoreham
The most populous races in Shoreham are White / Caucasian (496 | 83.9%), Hispanic or Latino (85 | 14.4%), and Two or more Races (85 | 14.4%).
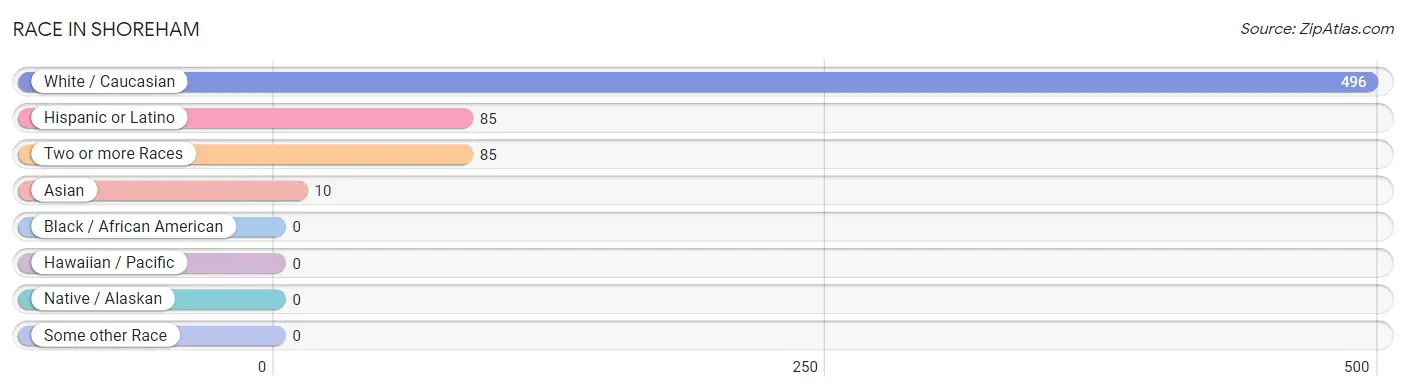
| Race | # Population | % Population |
| Asian | 10 | 1.7% |
| Black / African American | 0 | 0.0% |
| Hawaiian / Pacific | 0 | 0.0% |
| Hispanic or Latino | 85 | 14.4% |
| Native / Alaskan | 0 | 0.0% |
| White / Caucasian | 496 | 83.9% |
| Two or more Races | 85 | 14.4% |
| Some other Race | 0 | 0.0% |
| Total | 591 | 100.0% |
Ancestry in Shoreham
The most populous ancestries reported in Shoreham are German (137 | 23.2%), Italian (125 | 21.1%), English (65 | 11.0%), Irish (65 | 11.0%), and Mexican (62 | 10.5%), together accounting for 76.8% of all Shoreham residents.
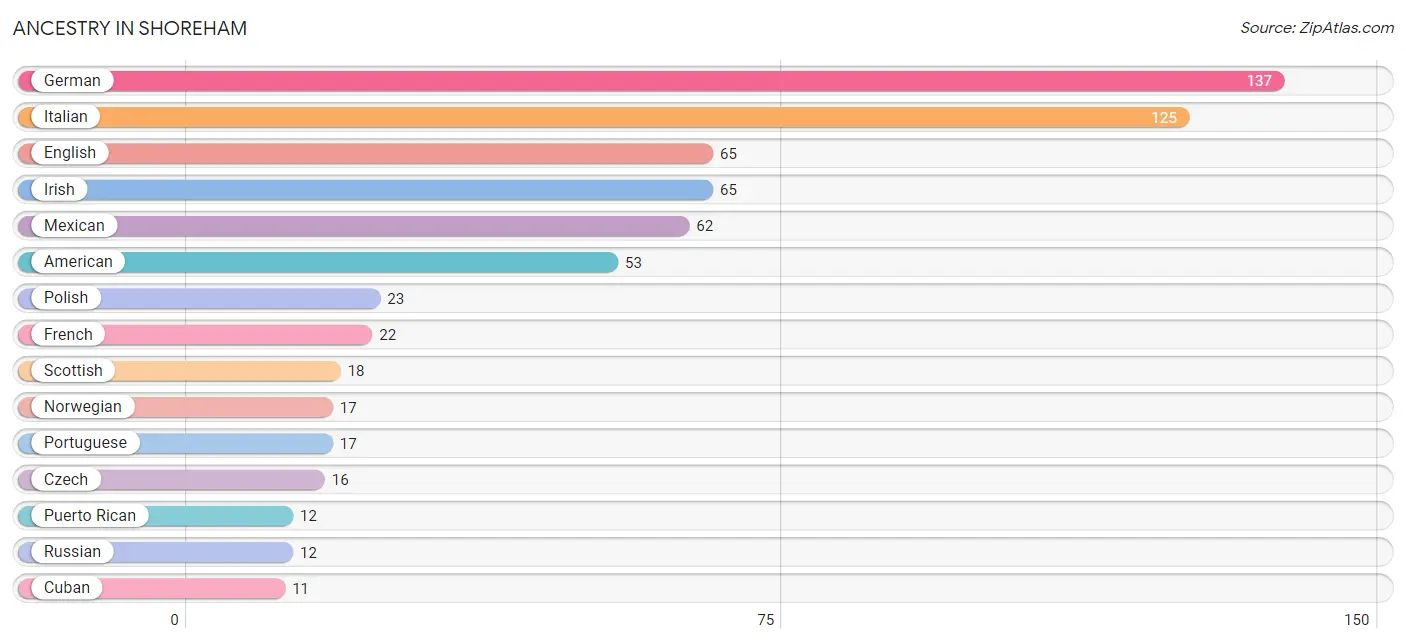
| Ancestry | # Population | % Population |
| American | 53 | 9.0% |
| Bhutanese | 2 | 0.3% |
| British | 3 | 0.5% |
| Burmese | 6 | 1.0% |
| Central American Indian | 2 | 0.3% |
| Chinese | 2 | 0.3% |
| Cuban | 11 | 1.9% |
| Czech | 16 | 2.7% |
| Danish | 4 | 0.7% |
| Dutch | 5 | 0.9% |
| English | 65 | 11.0% |
| French | 22 | 3.7% |
| German | 137 | 23.2% |
| Greek | 5 | 0.9% |
| Irish | 65 | 11.0% |
| Italian | 125 | 21.1% |
| Latvian | 2 | 0.3% |
| Mexican | 62 | 10.5% |
| Norwegian | 17 | 2.9% |
| Pakistani | 1 | 0.2% |
| Polish | 23 | 3.9% |
| Portuguese | 17 | 2.9% |
| Puerto Rican | 12 | 2.0% |
| Russian | 12 | 2.0% |
| Scotch-Irish | 3 | 0.5% |
| Scottish | 18 | 3.0% |
| Swiss | 1 | 0.2% |
| Thai | 2 | 0.3% |
| Ukrainian | 2 | 0.3% |
| Welsh | 2 | 0.3% |
| West Indian | 2 | 0.3% | View All 31 Rows |
Immigrants in Shoreham
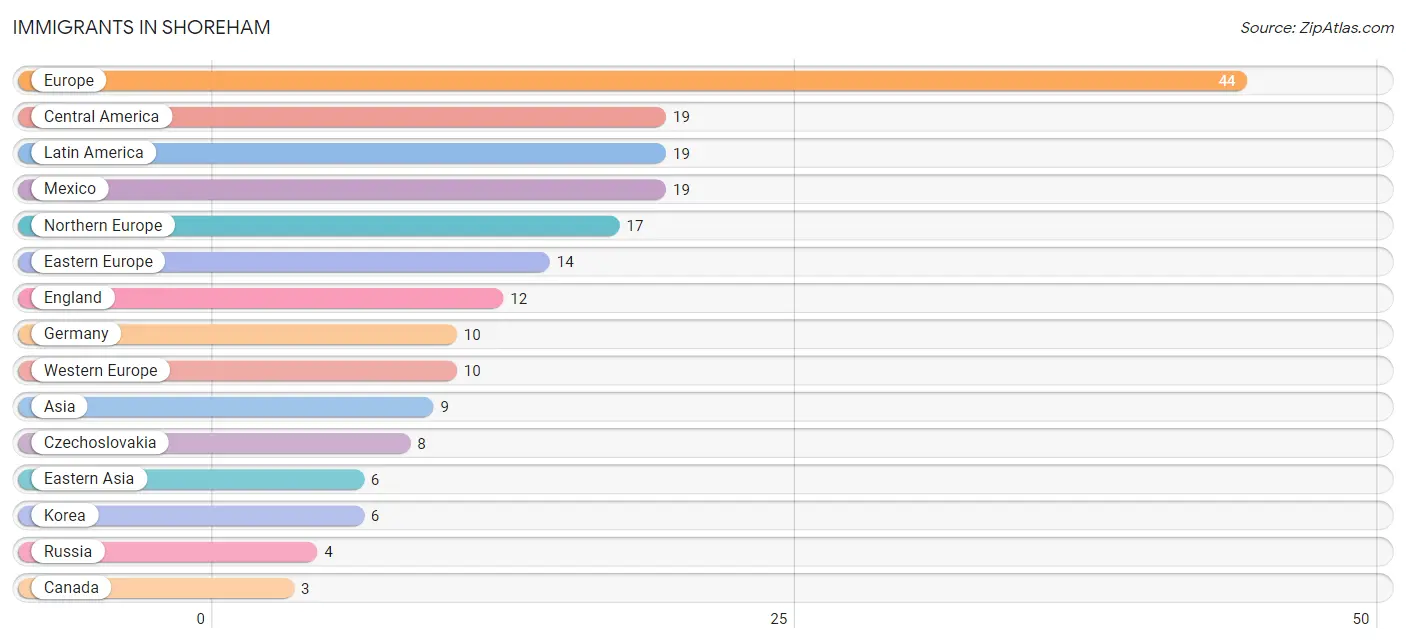
The most numerous immigrant groups reported in Shoreham came from Europe (44 | 7.4%), Central America (19 | 3.2%), Latin America (19 | 3.2%), Mexico (19 | 3.2%), and Northern Europe (17 | 2.9%), together accounting for 20.0% of all Shoreham residents.
| Immigration Origin | # Population | % Population |
| Asia | 9 | 1.5% |
| Canada | 3 | 0.5% |
| Central America | 19 | 3.2% |
| Czechoslovakia | 8 | 1.3% |
| Eastern Asia | 6 | 1.0% |
| Eastern Europe | 14 | 2.4% |
| England | 12 | 2.0% |
| Europe | 44 | 7.4% |
| Germany | 10 | 1.7% |
| India | 2 | 0.3% |
| Italy | 3 | 0.5% |
| Korea | 6 | 1.0% |
| Latin America | 19 | 3.2% |
| Mexico | 19 | 3.2% |
| Northern Europe | 17 | 2.9% |
| Poland | 2 | 0.3% |
| Russia | 4 | 0.7% |
| South Central Asia | 2 | 0.3% |
| South Eastern Asia | 1 | 0.2% |
| Southern Europe | 3 | 0.5% |
| Thailand | 1 | 0.2% |
| Western Europe | 10 | 1.7% | View All 22 Rows |
Sex and Age in Shoreham
Sex and Age in Shoreham
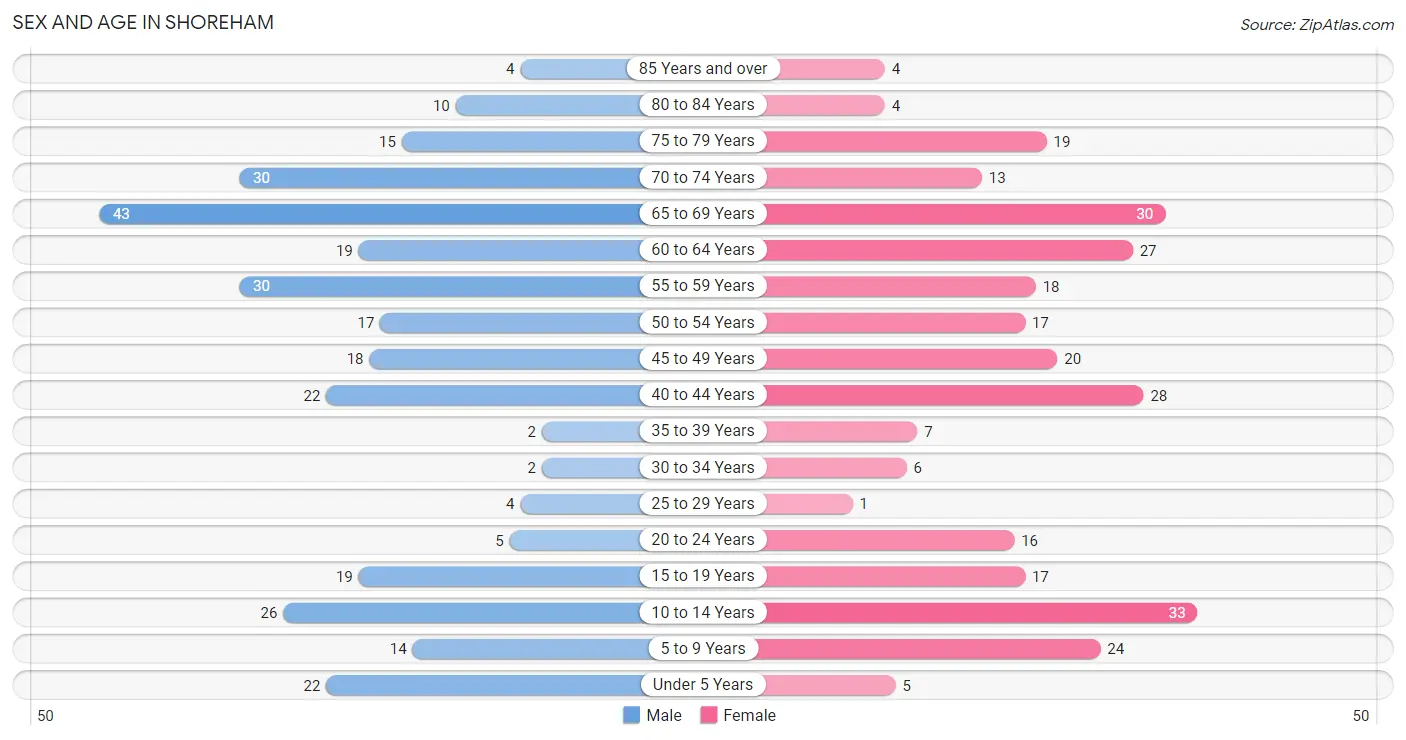
The most populous age groups in Shoreham are 65 to 69 Years (43 | 14.2%) for men and 10 to 14 Years (33 | 11.4%) for women.
| Age Bracket | Male | Female |
| Under 5 Years | 22 (7.3%) | 5 (1.7%) |
| 5 to 9 Years | 14 (4.6%) | 24 (8.3%) |
| 10 to 14 Years | 26 (8.6%) | 33 (11.4%) |
| 15 to 19 Years | 19 (6.3%) | 17 (5.9%) |
| 20 to 24 Years | 5 (1.7%) | 16 (5.5%) |
| 25 to 29 Years | 4 (1.3%) | 1 (0.4%) |
| 30 to 34 Years | 2 (0.7%) | 6 (2.1%) |
| 35 to 39 Years | 2 (0.7%) | 7 (2.4%) |
| 40 to 44 Years | 22 (7.3%) | 28 (9.7%) |
| 45 to 49 Years | 18 (6.0%) | 20 (6.9%) |
| 50 to 54 Years | 17 (5.6%) | 17 (5.9%) |
| 55 to 59 Years | 30 (9.9%) | 18 (6.2%) |
| 60 to 64 Years | 19 (6.3%) | 27 (9.3%) |
| 65 to 69 Years | 43 (14.2%) | 30 (10.4%) |
| 70 to 74 Years | 30 (9.9%) | 13 (4.5%) |
| 75 to 79 Years | 15 (5.0%) | 19 (6.6%) |
| 80 to 84 Years | 10 (3.3%) | 4 (1.4%) |
| 85 Years and over | 4 (1.3%) | 4 (1.4%) |
| Total | 302 (100.0%) | 289 (100.0%) |
Families and Households in Shoreham
Median Family Size in Shoreham
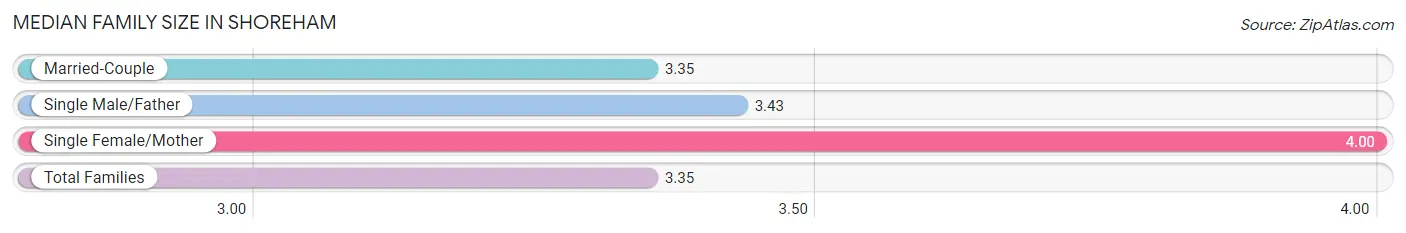
The median family size in Shoreham is 3.35 persons per family, with single female/mother families (1 | 0.6%) accounting for the largest median family size of 4 persons per family. On the other hand, married-couple families (147 | 94.8%) represent the smallest median family size with 3.35 persons per family.
| Family Type | # Families | Family Size |
| Married-Couple | 147 (94.8%) | 3.35 |
| Single Male/Father | 7 (4.5%) | 3.43 |
| Single Female/Mother | 1 (0.6%) | 4.00 |
| Total Families | 155 (100.0%) | 3.35 |
Median Household Size in Shoreham
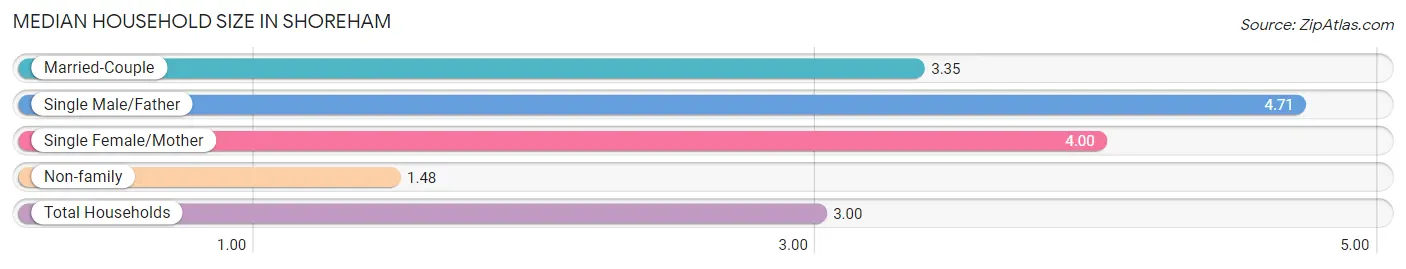
The median household size in Shoreham is 3.00 persons per household, with single male/father households (7 | 3.5%) accounting for the largest median household size of 4.71 persons per household. non-family households (42 | 21.3%) represent the smallest median household size with 1.48 persons per household.
| Household Type | # Households | Household Size |
| Married-Couple | 147 (74.6%) | 3.35 |
| Single Male/Father | 7 (3.5%) | 4.71 |
| Single Female/Mother | 1 (0.5%) | 4.00 |
| Non-family | 42 (21.3%) | 1.48 |
| Total Households | 197 (100.0%) | 3.00 |
Household Size by Marriage Status in Shoreham
Out of a total of 197 households in Shoreham, 155 (78.7%) are family households, while 42 (21.3%) are nonfamily households. The most numerous type of family households are 2-person households, comprising 71, and the most common type of nonfamily households are 1-person households, comprising 21.
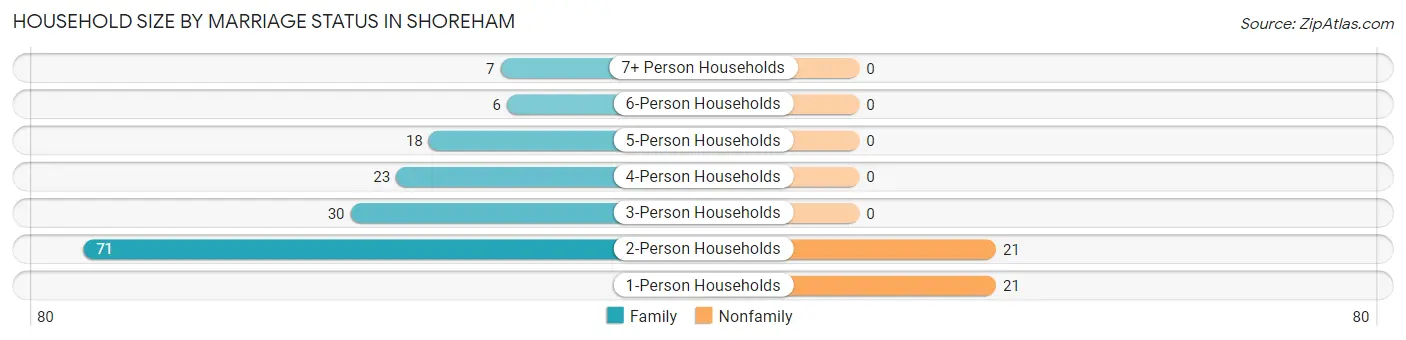
| Household Size | Family Households | Nonfamily Households |
| 1-Person Households | - | 21 (10.7%) |
| 2-Person Households | 71 (36.0%) | 21 (10.7%) |
| 3-Person Households | 30 (15.2%) | 0 (0.0%) |
| 4-Person Households | 23 (11.7%) | 0 (0.0%) |
| 5-Person Households | 18 (9.1%) | 0 (0.0%) |
| 6-Person Households | 6 (3.0%) | 0 (0.0%) |
| 7+ Person Households | 7 (3.5%) | 0 (0.0%) |
| Total | 155 (78.7%) | 42 (21.3%) |
Female Fertility in Shoreham
Fertility by Age in Shoreham
Average fertility rate in Shoreham is 32.0 births per 1,000 women. Women in the age bracket of 35 to 50 years have the highest fertility rate with 55.0 births per 1,000 women. Women in the age bracket of 35 to 50 years acount for 100.0% of all women with births.
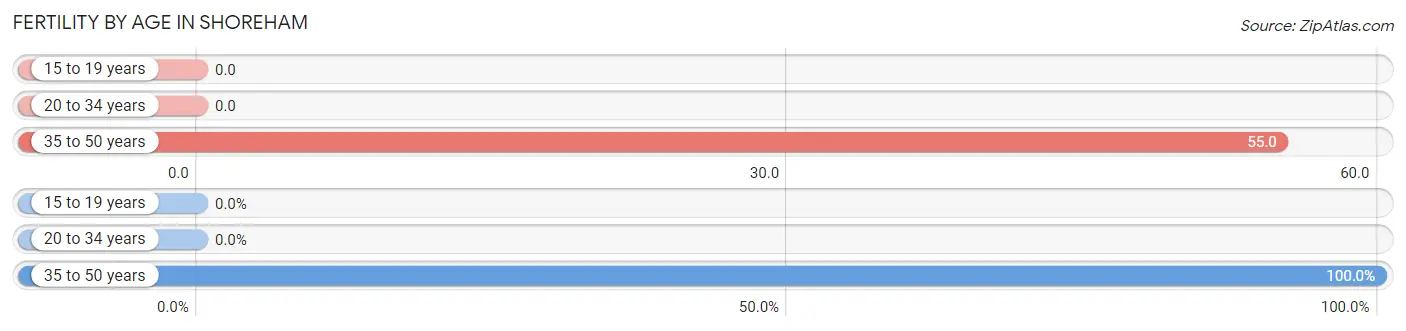
| Age Bracket | Women with Births | Births / 1,000 Women |
| 15 to 19 years | 0 (0.0%) | 0.0 |
| 20 to 34 years | 0 (0.0%) | 0.0 |
| 35 to 50 years | 3 (100.0%) | 55.0 |
| Total | 3 (100.0%) | 32.0 |
Fertility by Age by Marriage Status in Shoreham
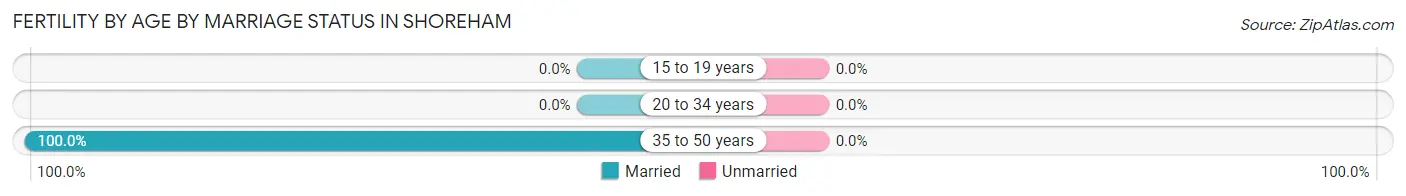
| Age Bracket | Married | Unmarried |
| 15 to 19 years | 0 (0.0%) | 0 (0.0%) |
| 20 to 34 years | 0 (0.0%) | 0 (0.0%) |
| 35 to 50 years | 3 (100.0%) | 0 (0.0%) |
| Total | 3 (100.0%) | 0 (0.0%) |
Fertility by Education in Shoreham
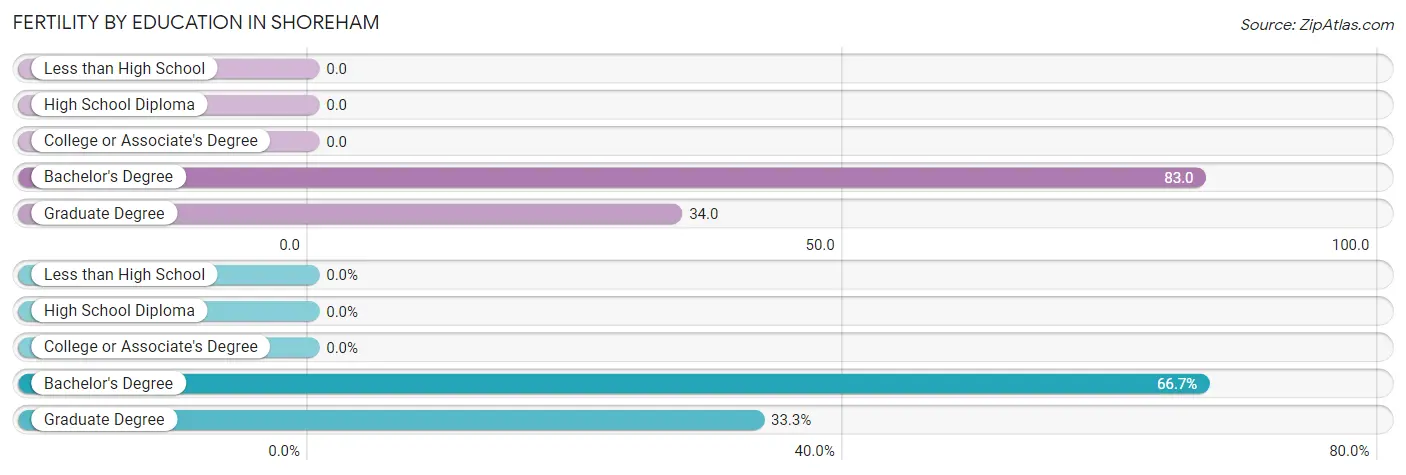
| Educational Attainment | Women with Births | Births / 1,000 Women |
| Less than High School | 0 (0.0%) | 0.0 |
| High School Diploma | 0 (0.0%) | 0.0 |
| College or Associate's Degree | 0 (0.0%) | 0.0 |
| Bachelor's Degree | 2 (66.7%) | 83.0 |
| Graduate Degree | 1 (33.3%) | 34.0 |
| Total | 3 (100.0%) | 32.0 |
Fertility by Education by Marriage Status in Shoreham
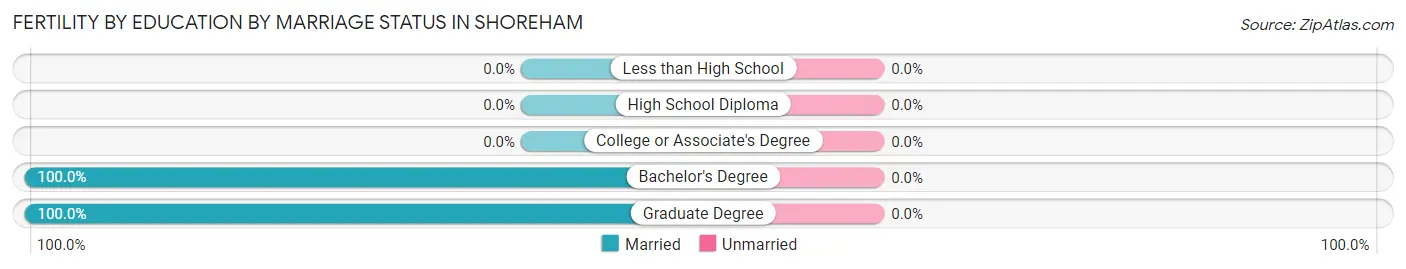
| Educational Attainment | Married | Unmarried |
| Less than High School | 0 (0.0%) | 0 (0.0%) |
| High School Diploma | 0 (0.0%) | 0 (0.0%) |
| College or Associate's Degree | 0 (0.0%) | 0 (0.0%) |
| Bachelor's Degree | 2 (100.0%) | 0 (0.0%) |
| Graduate Degree | 1 (100.0%) | 0 (0.0%) |
| Total | 3 (100.0%) | 0 (0.0%) |
Employment Characteristics in Shoreham
Employment by Class of Employer in Shoreham
Among the 259 employed individuals in Shoreham, private company employees (121 | 46.7%), not-for-profit organizations (38 | 14.7%), and self-employed (incorporated) (35 | 13.5%) make up the most common classes of employment.
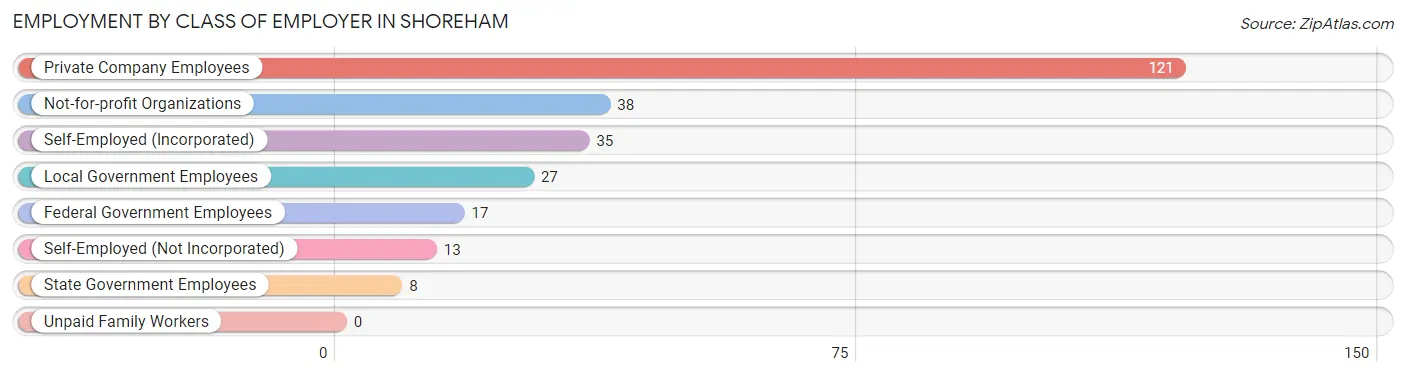
| Employer Class | # Employees | % Employees |
| Private Company Employees | 121 | 46.7% |
| Self-Employed (Incorporated) | 35 | 13.5% |
| Self-Employed (Not Incorporated) | 13 | 5.0% |
| Not-for-profit Organizations | 38 | 14.7% |
| Local Government Employees | 27 | 10.4% |
| State Government Employees | 8 | 3.1% |
| Federal Government Employees | 17 | 6.6% |
| Unpaid Family Workers | 0 | 0.0% |
| Total | 259 | 100.0% |
Employment Status by Age in Shoreham
According to the labor force statistics for Shoreham, out of the total population over 16 years of age (458), 59.0% or 270 individuals are in the labor force, with 3.0% or 8 of them unemployed. The age group with the highest labor force participation rate is 25 to 29 years, with 100.0% or 5 individuals in the labor force. Within the labor force, the 16 to 19 years age range has the highest percentage of unemployed individuals, with 71.4% or 5 of them being unemployed.
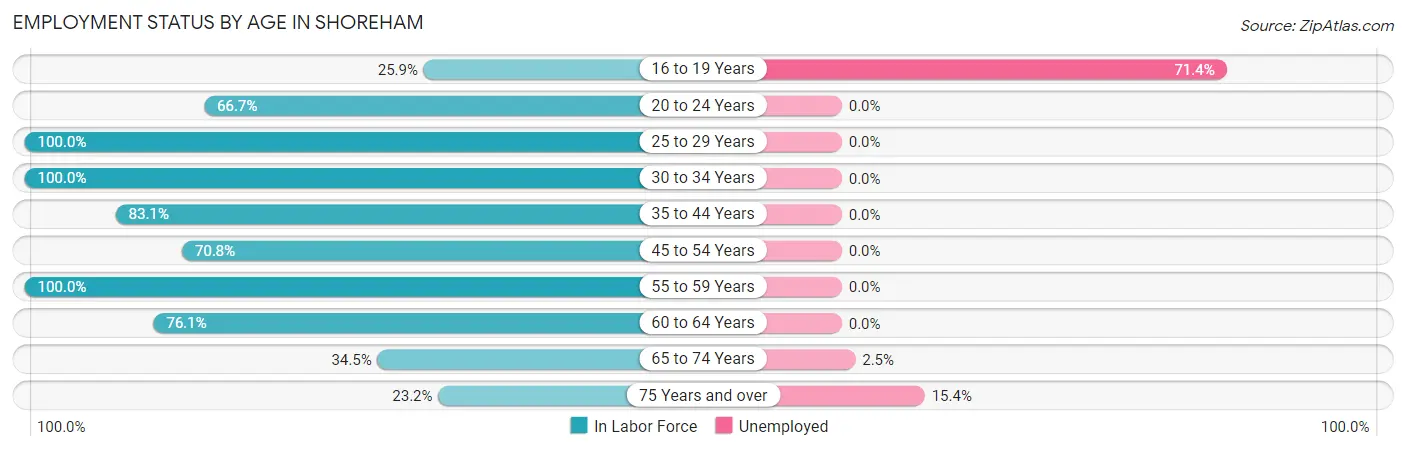
| Age Bracket | In Labor Force | Unemployed |
| 16 to 19 Years | 7 (25.9%) | 5 (71.4%) |
| 20 to 24 Years | 14 (66.7%) | 0 (0.0%) |
| 25 to 29 Years | 5 (100.0%) | 0 (0.0%) |
| 30 to 34 Years | 8 (100.0%) | 0 (0.0%) |
| 35 to 44 Years | 49 (83.1%) | 0 (0.0%) |
| 45 to 54 Years | 51 (70.8%) | 0 (0.0%) |
| 55 to 59 Years | 48 (100.0%) | 0 (0.0%) |
| 60 to 64 Years | 35 (76.1%) | 0 (0.0%) |
| 65 to 74 Years | 40 (34.5%) | 1 (2.5%) |
| 75 Years and over | 13 (23.2%) | 2 (15.4%) |
| Total | 270 (59.0%) | 8 (3.0%) |
Employment Status by Educational Attainment in Shoreham
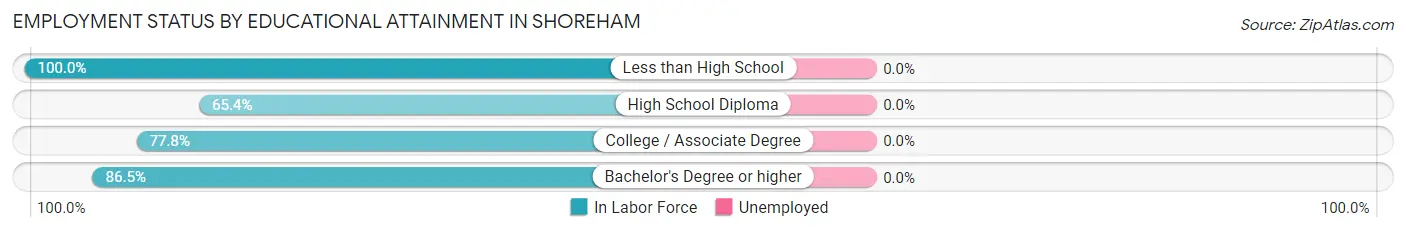
| Educational Attainment | In Labor Force | Unemployed |
| Less than High School | 3 (100.0%) | 0 (0.0%) |
| High School Diploma | 17 (65.4%) | 0 (0.0%) |
| College / Associate Degree | 42 (77.8%) | 0 (0.0%) |
| Bachelor's Degree or higher | 134 (86.5%) | 0 (0.0%) |
| Total | 196 (82.4%) | 0 (0.0%) |
Employment Occupations by Sex in Shoreham
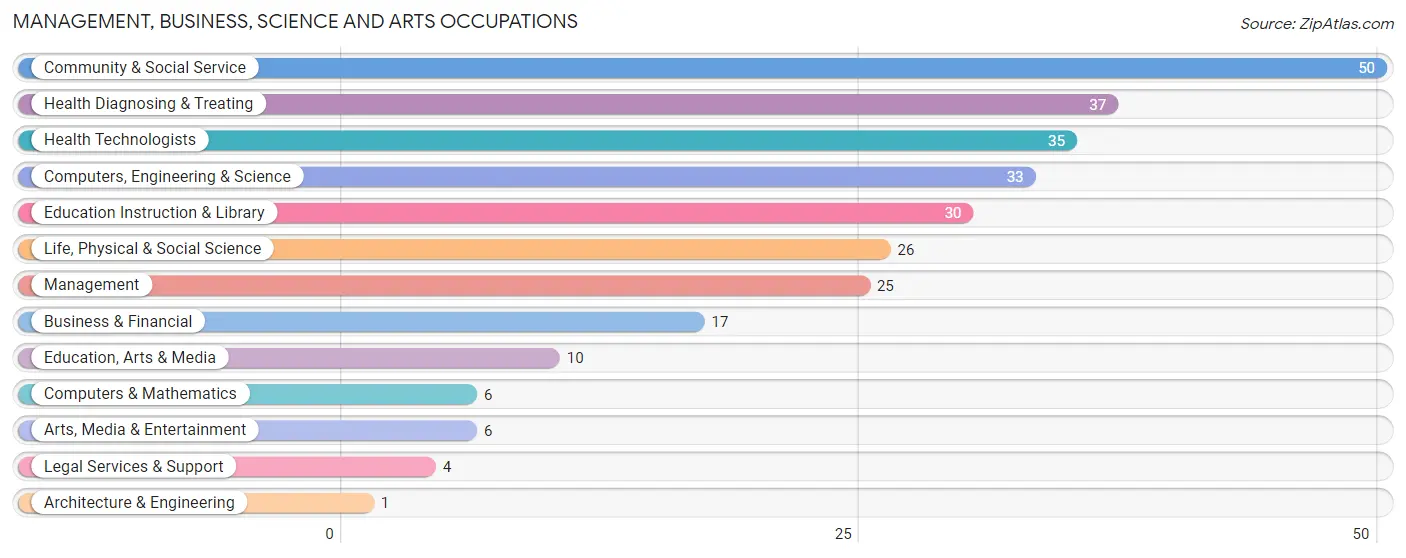
Management, Business, Science and Arts Occupations
The most common Management, Business, Science and Arts occupations in Shoreham are Community & Social Service (50 | 19.2%), Health Diagnosing & Treating (37 | 14.2%), Health Technologists (35 | 13.4%), Computers, Engineering & Science (33 | 12.6%), and Education Instruction & Library (30 | 11.5%).
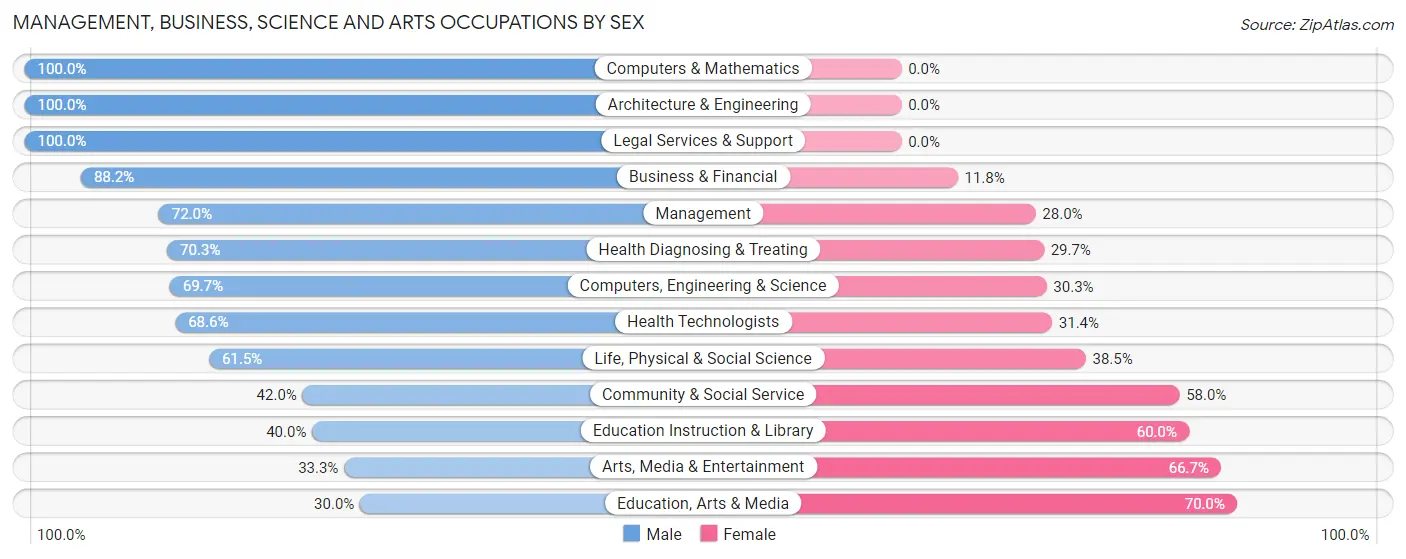
Management, Business, Science and Arts Occupations by Sex
Within the Management, Business, Science and Arts occupations in Shoreham, the most male-oriented occupations are Computers & Mathematics (100.0%), Architecture & Engineering (100.0%), and Legal Services & Support (100.0%), while the most female-oriented occupations are Education, Arts & Media (70.0%), Arts, Media & Entertainment (66.7%), and Education Instruction & Library (60.0%).
| Occupation | Male | Female |
| Management | 18 (72.0%) | 7 (28.0%) |
| Business & Financial | 15 (88.2%) | 2 (11.8%) |
| Computers, Engineering & Science | 23 (69.7%) | 10 (30.3%) |
| Computers & Mathematics | 6 (100.0%) | 0 (0.0%) |
| Architecture & Engineering | 1 (100.0%) | 0 (0.0%) |
| Life, Physical & Social Science | 16 (61.5%) | 10 (38.5%) |
| Community & Social Service | 21 (42.0%) | 29 (58.0%) |
| Education, Arts & Media | 3 (30.0%) | 7 (70.0%) |
| Legal Services & Support | 4 (100.0%) | 0 (0.0%) |
| Education Instruction & Library | 12 (40.0%) | 18 (60.0%) |
| Arts, Media & Entertainment | 2 (33.3%) | 4 (66.7%) |
| Health Diagnosing & Treating | 26 (70.3%) | 11 (29.7%) |
| Health Technologists | 24 (68.6%) | 11 (31.4%) |
| Total (Category) | 103 (63.6%) | 59 (36.4%) |
| Total (Overall) | 161 (61.7%) | 100 (38.3%) |
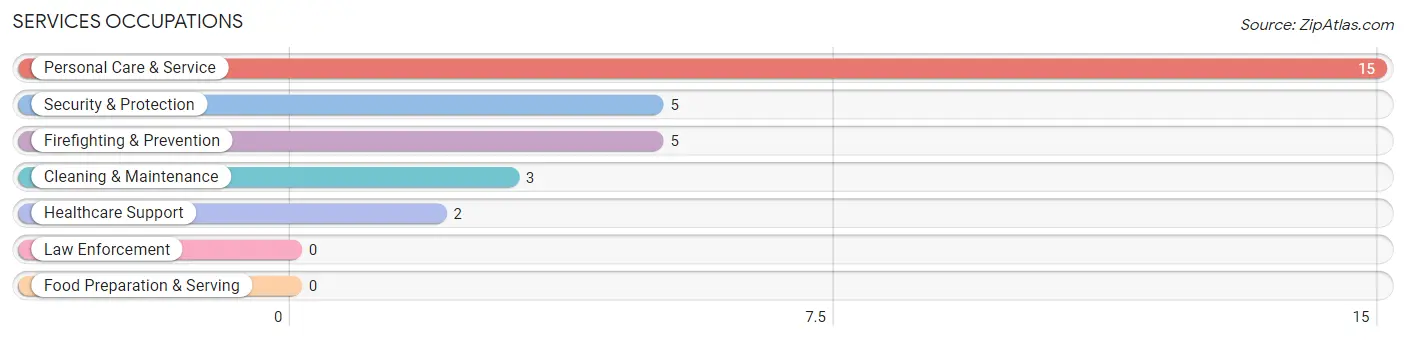
Services Occupations
The most common Services occupations in Shoreham are Personal Care & Service (15 | 5.8%), Security & Protection (5 | 1.9%), Firefighting & Prevention (5 | 1.9%), Cleaning & Maintenance (3 | 1.1%), and Healthcare Support (2 | 0.8%).
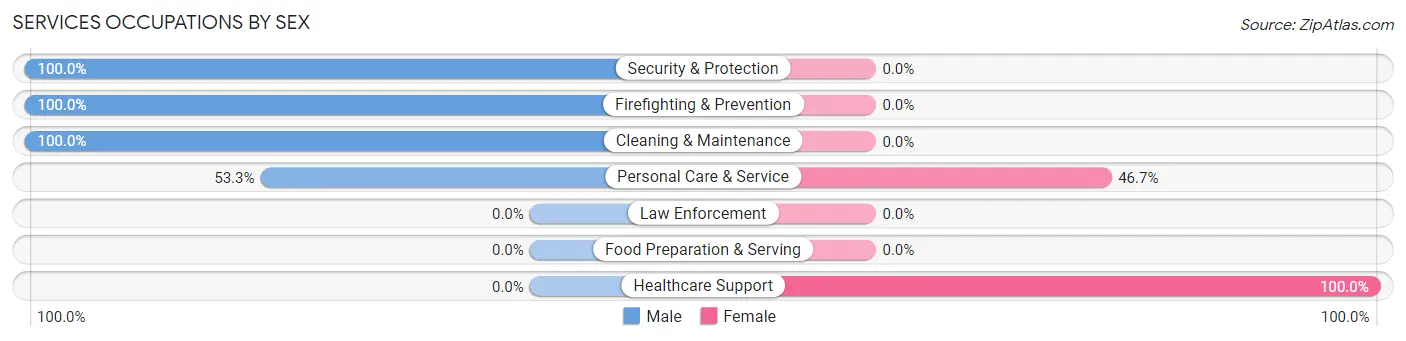
Services Occupations by Sex
Within the Services occupations in Shoreham, the most male-oriented occupations are Security & Protection (100.0%), Firefighting & Prevention (100.0%), and Cleaning & Maintenance (100.0%), while the most female-oriented occupations are Healthcare Support (100.0%), and Personal Care & Service (46.7%).
| Occupation | Male | Female |
| Healthcare Support | 0 (0.0%) | 2 (100.0%) |
| Security & Protection | 5 (100.0%) | 0 (0.0%) |
| Firefighting & Prevention | 5 (100.0%) | 0 (0.0%) |
| Law Enforcement | 0 (0.0%) | 0 (0.0%) |
| Food Preparation & Serving | 0 (0.0%) | 0 (0.0%) |
| Cleaning & Maintenance | 3 (100.0%) | 0 (0.0%) |
| Personal Care & Service | 8 (53.3%) | 7 (46.7%) |
| Total (Category) | 16 (64.0%) | 9 (36.0%) |
| Total (Overall) | 161 (61.7%) | 100 (38.3%) |
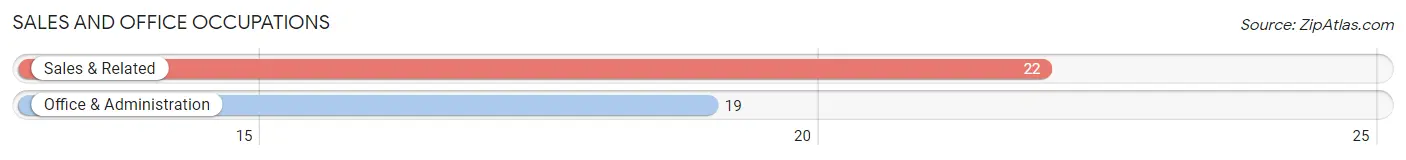
Sales and Office Occupations
The most common Sales and Office occupations in Shoreham are Sales & Related (22 | 8.4%), and Office & Administration (19 | 7.3%).
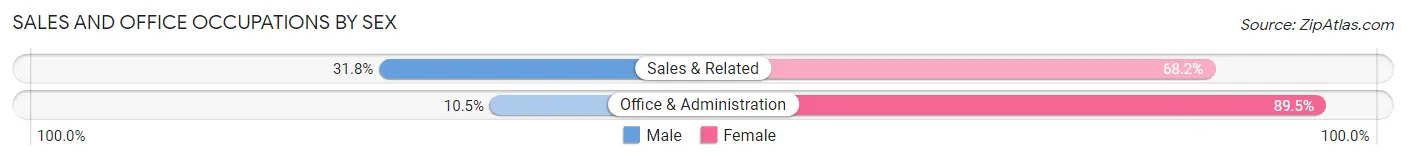
Sales and Office Occupations by Sex
| Occupation | Male | Female |
| Sales & Related | 7 (31.8%) | 15 (68.2%) |
| Office & Administration | 2 (10.5%) | 17 (89.5%) |
| Total (Category) | 9 (22.0%) | 32 (78.0%) |
| Total (Overall) | 161 (61.7%) | 100 (38.3%) |
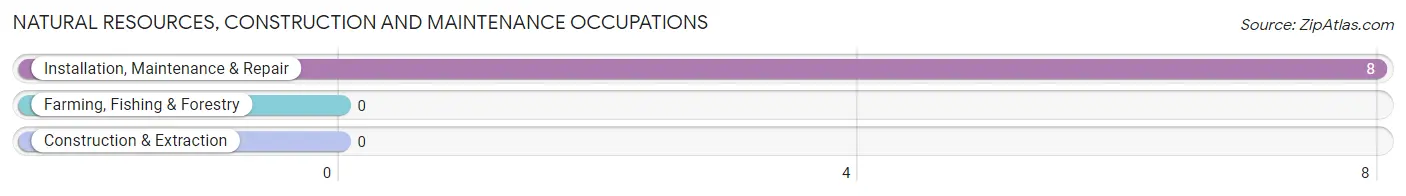
Natural Resources, Construction and Maintenance Occupations
The most common Natural Resources, Construction and Maintenance occupations in Shoreham are , and Installation, Maintenance & Repair (8 | 3.1%).
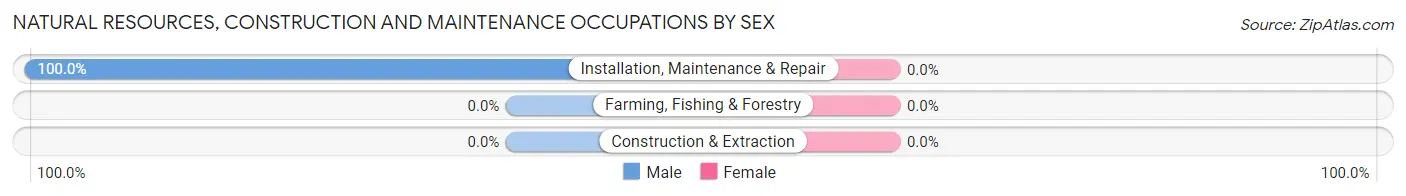
Natural Resources, Construction and Maintenance Occupations by Sex
| Occupation | Male | Female |
| Farming, Fishing & Forestry | 0 (0.0%) | 0 (0.0%) |
| Construction & Extraction | 0 (0.0%) | 0 (0.0%) |
| Installation, Maintenance & Repair | 8 (100.0%) | 0 (0.0%) |
| Total (Category) | 8 (100.0%) | 0 (0.0%) |
| Total (Overall) | 161 (61.7%) | 100 (38.3%) |
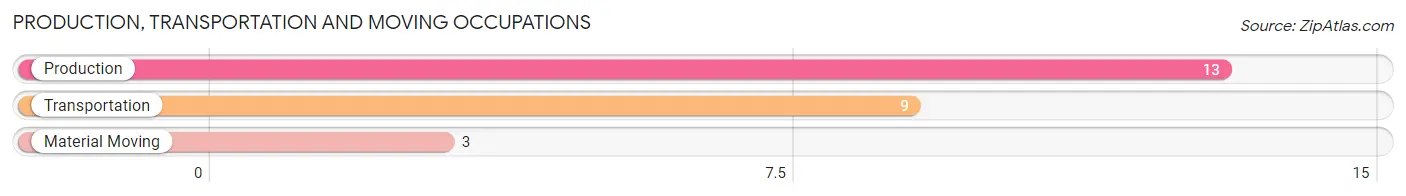
Production, Transportation and Moving Occupations
The most common Production, Transportation and Moving occupations in Shoreham are Production (13 | 5.0%), Transportation (9 | 3.5%), and Material Moving (3 | 1.1%).
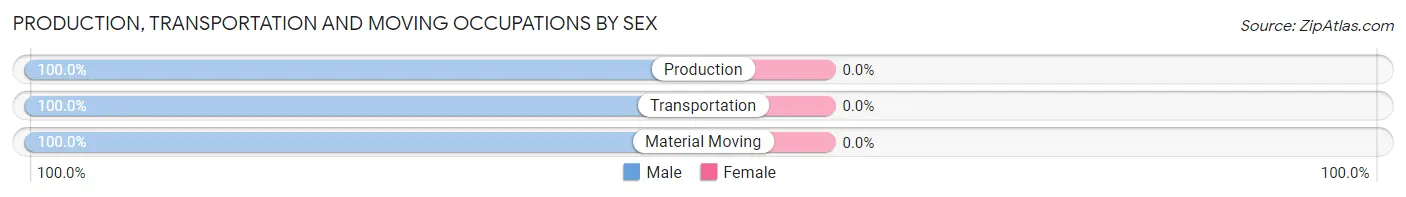
Production, Transportation and Moving Occupations by Sex
| Occupation | Male | Female |
| Production | 13 (100.0%) | 0 (0.0%) |
| Transportation | 9 (100.0%) | 0 (0.0%) |
| Material Moving | 3 (100.0%) | 0 (0.0%) |
| Total (Category) | 25 (100.0%) | 0 (0.0%) |
| Total (Overall) | 161 (61.7%) | 100 (38.3%) |
Employment Industries by Sex in Shoreham
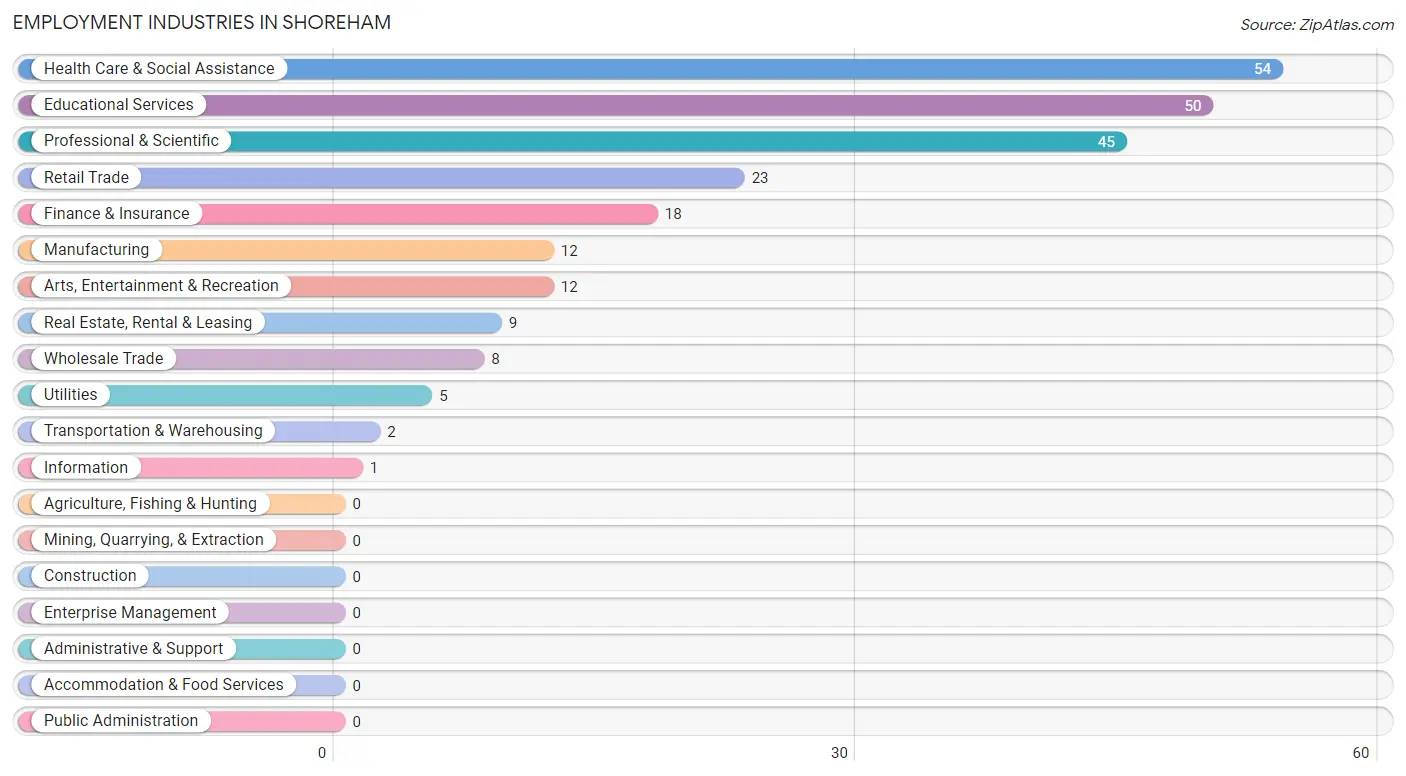
Employment Industries in Shoreham
The major employment industries in Shoreham include Health Care & Social Assistance (54 | 20.7%), Educational Services (50 | 19.2%), Professional & Scientific (45 | 17.2%), Retail Trade (23 | 8.8%), and Finance & Insurance (18 | 6.9%).
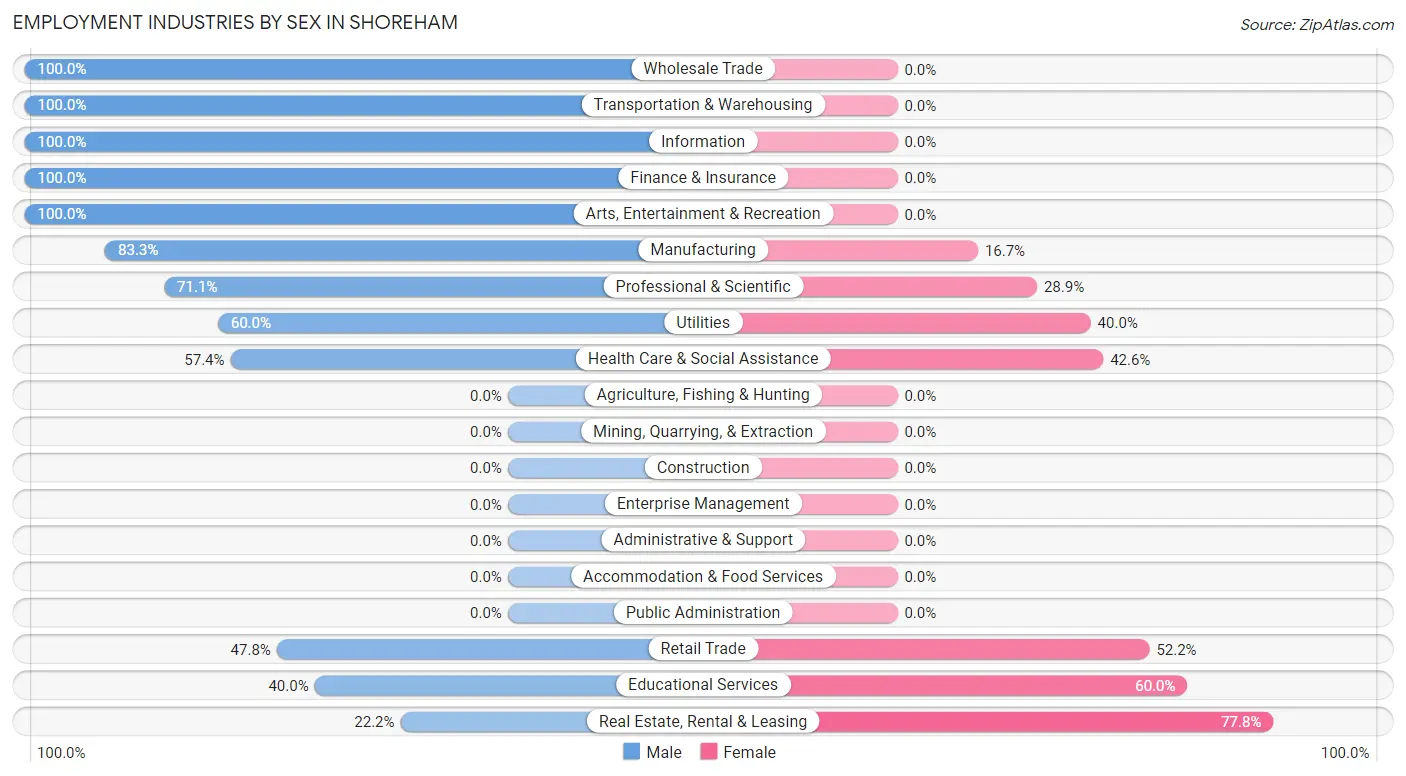
Employment Industries by Sex in Shoreham
The Shoreham industries that see more men than women are Wholesale Trade (100.0%), Transportation & Warehousing (100.0%), and Information (100.0%), whereas the industries that tend to have a higher number of women are Real Estate, Rental & Leasing (77.8%), Educational Services (60.0%), and Retail Trade (52.2%).
| Industry | Male | Female |
| Agriculture, Fishing & Hunting | 0 (0.0%) | 0 (0.0%) |
| Mining, Quarrying, & Extraction | 0 (0.0%) | 0 (0.0%) |
| Construction | 0 (0.0%) | 0 (0.0%) |
| Manufacturing | 10 (83.3%) | 2 (16.7%) |
| Wholesale Trade | 8 (100.0%) | 0 (0.0%) |
| Retail Trade | 11 (47.8%) | 12 (52.2%) |
| Transportation & Warehousing | 2 (100.0%) | 0 (0.0%) |
| Utilities | 3 (60.0%) | 2 (40.0%) |
| Information | 1 (100.0%) | 0 (0.0%) |
| Finance & Insurance | 18 (100.0%) | 0 (0.0%) |
| Real Estate, Rental & Leasing | 2 (22.2%) | 7 (77.8%) |
| Professional & Scientific | 32 (71.1%) | 13 (28.9%) |
| Enterprise Management | 0 (0.0%) | 0 (0.0%) |
| Administrative & Support | 0 (0.0%) | 0 (0.0%) |
| Educational Services | 20 (40.0%) | 30 (60.0%) |
| Health Care & Social Assistance | 31 (57.4%) | 23 (42.6%) |
| Arts, Entertainment & Recreation | 12 (100.0%) | 0 (0.0%) |
| Accommodation & Food Services | 0 (0.0%) | 0 (0.0%) |
| Public Administration | 0 (0.0%) | 0 (0.0%) |
| Total | 161 (61.7%) | 100 (38.3%) |
Education in Shoreham
School Enrollment in Shoreham
The most common levels of schooling among the 162 students in Shoreham are middle school (56 | 34.6%), nursery / preschool (28 | 17.3%), and elementary school (27 | 16.7%).
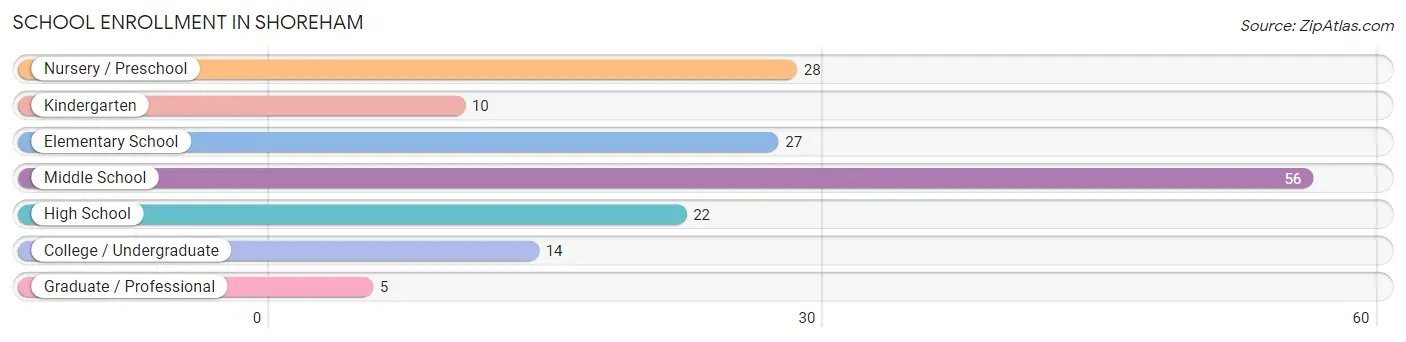
| School Level | # Students | % Students |
| Nursery / Preschool | 28 | 17.3% |
| Kindergarten | 10 | 6.2% |
| Elementary School | 27 | 16.7% |
| Middle School | 56 | 34.6% |
| High School | 22 | 13.6% |
| College / Undergraduate | 14 | 8.6% |
| Graduate / Professional | 5 | 3.1% |
| Total | 162 | 100.0% |
School Enrollment by Age by Funding Source in Shoreham
Out of a total of 162 students who are enrolled in schools in Shoreham, 18 (11.1%) attend a private institution, while the remaining 144 (88.9%) are enrolled in public schools. The age group of 18 to 19 year olds has the highest likelihood of being enrolled in private schools, with 7 (70.0% in the age bracket) enrolled. Conversely, the age group of 15 to 17 year olds has the lowest likelihood of being enrolled in a private school, with 19 (100.0% in the age bracket) attending a public institution.
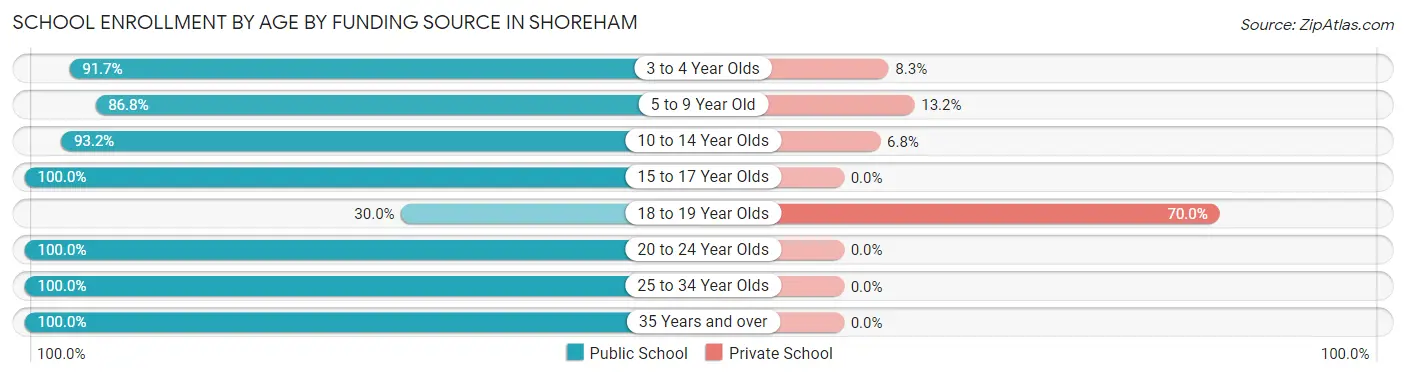
| Age Bracket | Public School | Private School |
| 3 to 4 Year Olds | 22 (91.7%) | 2 (8.3%) |
| 5 to 9 Year Old | 33 (86.8%) | 5 (13.2%) |
| 10 to 14 Year Olds | 55 (93.2%) | 4 (6.8%) |
| 15 to 17 Year Olds | 19 (100.0%) | 0 (0.0%) |
| 18 to 19 Year Olds | 3 (30.0%) | 7 (70.0%) |
| 20 to 24 Year Olds | 7 (100.0%) | 0 (0.0%) |
| 25 to 34 Year Olds | 3 (100.0%) | 0 (0.0%) |
| 35 Years and over | 2 (100.0%) | 0 (0.0%) |
| Total | 144 (88.9%) | 18 (11.1%) |
Educational Attainment by Field of Study in Shoreham
Physical & health sciences (39 | 14.2%), science & technology (38 | 13.8%), education (36 | 13.1%), business (34 | 12.4%), and literature & languages (24 | 8.7%) are the most common fields of study among 275 individuals in Shoreham who have obtained a bachelor's degree or higher.
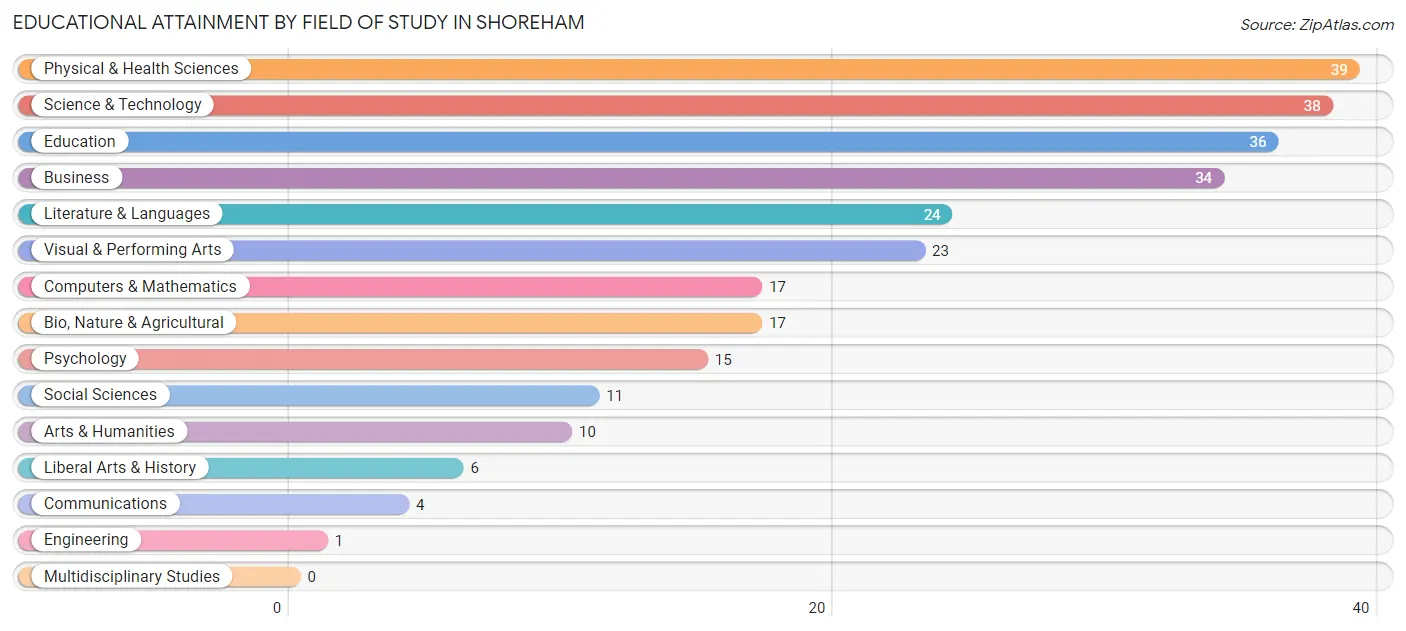
| Field of Study | # Graduates | % Graduates |
| Computers & Mathematics | 17 | 6.2% |
| Bio, Nature & Agricultural | 17 | 6.2% |
| Physical & Health Sciences | 39 | 14.2% |
| Psychology | 15 | 5.4% |
| Social Sciences | 11 | 4.0% |
| Engineering | 1 | 0.4% |
| Multidisciplinary Studies | 0 | 0.0% |
| Science & Technology | 38 | 13.8% |
| Business | 34 | 12.4% |
| Education | 36 | 13.1% |
| Literature & Languages | 24 | 8.7% |
| Liberal Arts & History | 6 | 2.2% |
| Visual & Performing Arts | 23 | 8.4% |
| Communications | 4 | 1.5% |
| Arts & Humanities | 10 | 3.6% |
| Total | 275 | 100.0% |
Transportation & Commute in Shoreham
Vehicle Availability by Sex in Shoreham
The most prevalent vehicle ownership categories in Shoreham are males with 4 vehicles (52, accounting for 32.1%) and females with 4 vehicles (12, making up 53.6%).
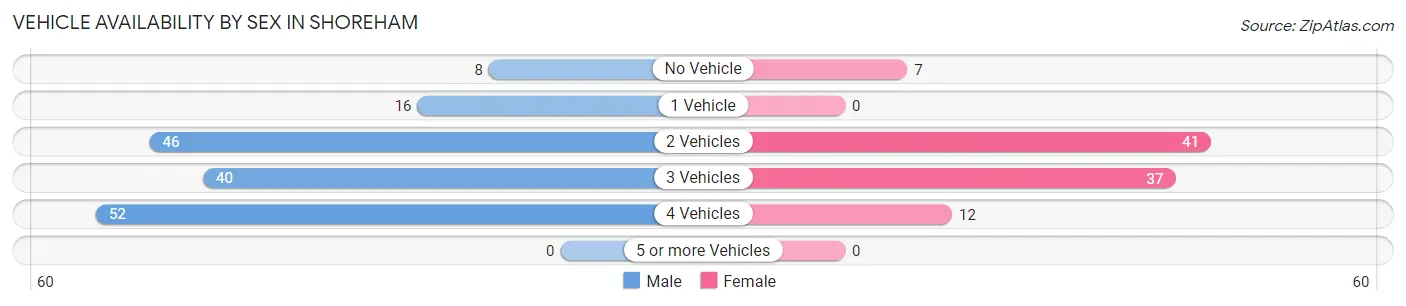
| Vehicles Available | Male | Female |
| No Vehicle | 8 (4.9%) | 7 (7.2%) |
| 1 Vehicle | 16 (9.9%) | 0 (0.0%) |
| 2 Vehicles | 46 (28.4%) | 41 (42.3%) |
| 3 Vehicles | 40 (24.7%) | 37 (38.1%) |
| 4 Vehicles | 52 (32.1%) | 12 (12.4%) |
| 5 or more Vehicles | 0 (0.0%) | 0 (0.0%) |
| Total | 162 (100.0%) | 97 (100.0%) |
Commute Time in Shoreham
The most frequently occuring commute durations in Shoreham are 20 to 24 minutes (62 commuters, 28.6%), 30 to 34 minutes (43 commuters, 19.8%), and 10 to 14 minutes (20 commuters, 9.2%).
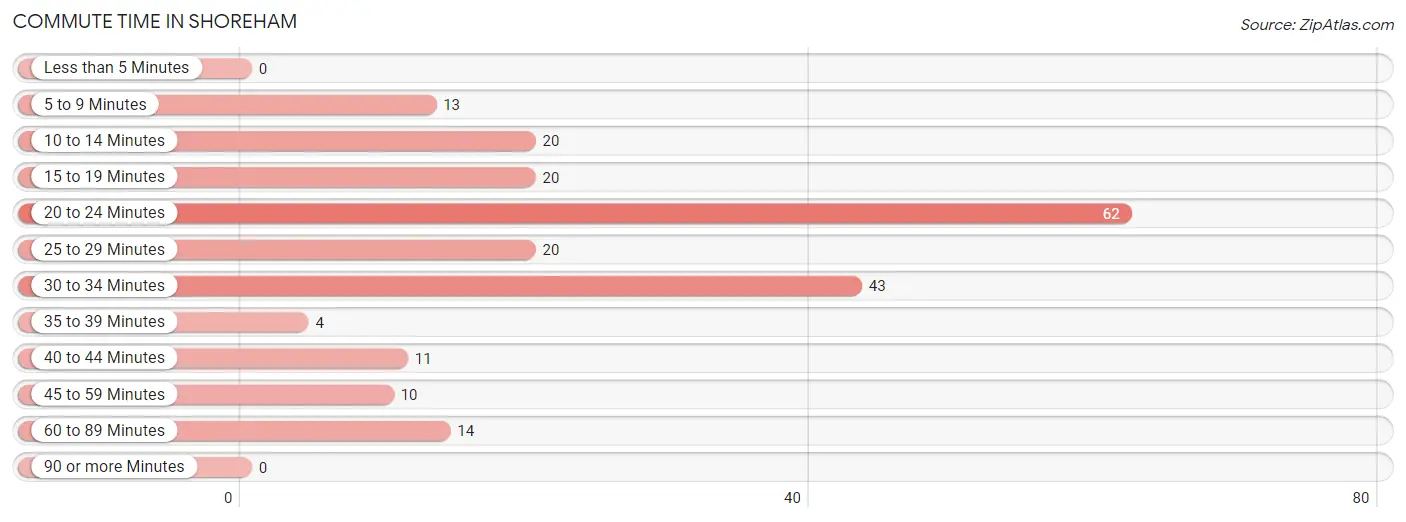
| Commute Time | # Commuters | % Commuters |
| Less than 5 Minutes | 0 | 0.0% |
| 5 to 9 Minutes | 13 | 6.0% |
| 10 to 14 Minutes | 20 | 9.2% |
| 15 to 19 Minutes | 20 | 9.2% |
| 20 to 24 Minutes | 62 | 28.6% |
| 25 to 29 Minutes | 20 | 9.2% |
| 30 to 34 Minutes | 43 | 19.8% |
| 35 to 39 Minutes | 4 | 1.8% |
| 40 to 44 Minutes | 11 | 5.1% |
| 45 to 59 Minutes | 10 | 4.6% |
| 60 to 89 Minutes | 14 | 6.5% |
| 90 or more Minutes | 0 | 0.0% |
Commute Time by Sex in Shoreham
The most common commute times in Shoreham are 20 to 24 minutes (42 commuters, 33.1%) for males and 20 to 24 minutes (20 commuters, 22.2%) for females.
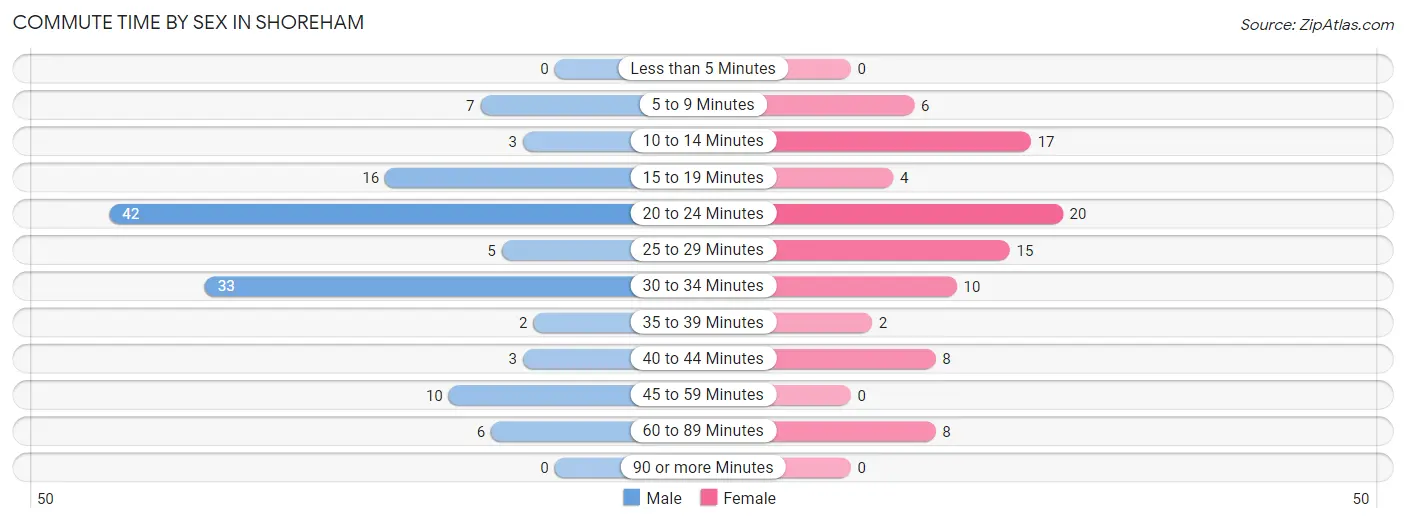
| Commute Time | Male | Female |
| Less than 5 Minutes | 0 (0.0%) | 0 (0.0%) |
| 5 to 9 Minutes | 7 (5.5%) | 6 (6.7%) |
| 10 to 14 Minutes | 3 (2.4%) | 17 (18.9%) |
| 15 to 19 Minutes | 16 (12.6%) | 4 (4.4%) |
| 20 to 24 Minutes | 42 (33.1%) | 20 (22.2%) |
| 25 to 29 Minutes | 5 (3.9%) | 15 (16.7%) |
| 30 to 34 Minutes | 33 (26.0%) | 10 (11.1%) |
| 35 to 39 Minutes | 2 (1.6%) | 2 (2.2%) |
| 40 to 44 Minutes | 3 (2.4%) | 8 (8.9%) |
| 45 to 59 Minutes | 10 (7.9%) | 0 (0.0%) |
| 60 to 89 Minutes | 6 (4.7%) | 8 (8.9%) |
| 90 or more Minutes | 0 (0.0%) | 0 (0.0%) |
Time of Departure to Work by Sex in Shoreham
The most frequent times of departure to work in Shoreham are 7:00 AM to 7:29 AM (32, 25.2%) for males and 7:30 AM to 7:59 AM (25, 27.8%) for females.
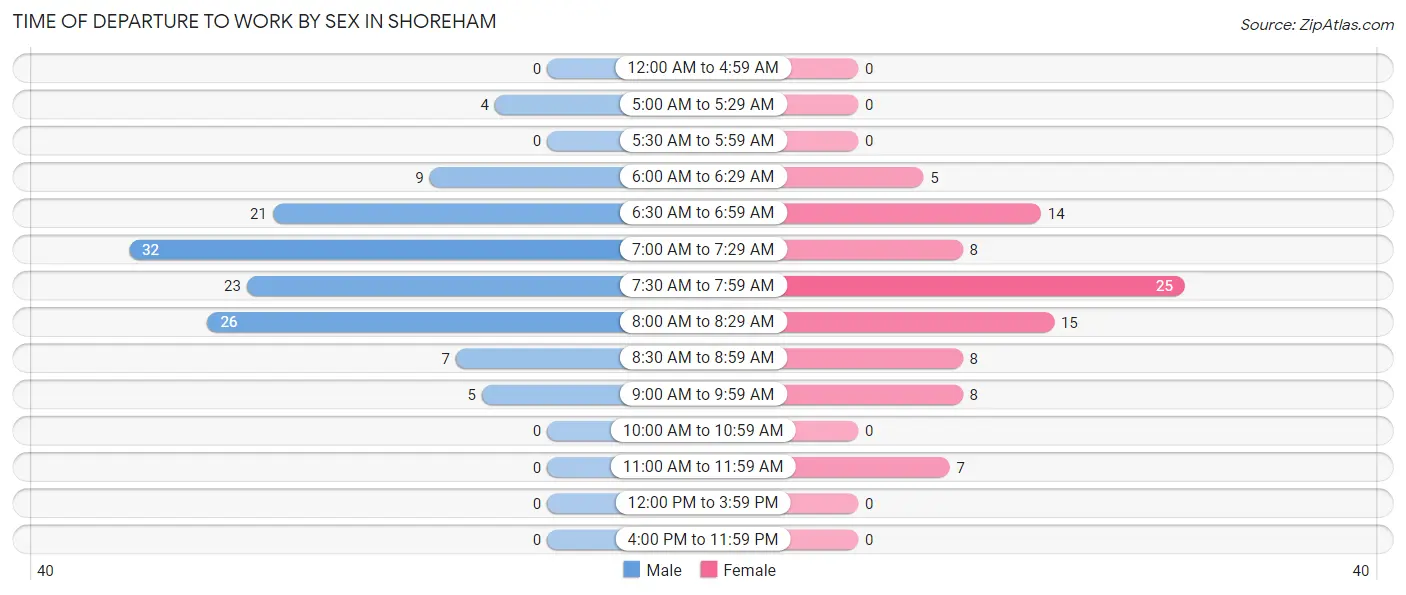
| Time of Departure | Male | Female |
| 12:00 AM to 4:59 AM | 0 (0.0%) | 0 (0.0%) |
| 5:00 AM to 5:29 AM | 4 (3.2%) | 0 (0.0%) |
| 5:30 AM to 5:59 AM | 0 (0.0%) | 0 (0.0%) |
| 6:00 AM to 6:29 AM | 9 (7.1%) | 5 (5.6%) |
| 6:30 AM to 6:59 AM | 21 (16.5%) | 14 (15.6%) |
| 7:00 AM to 7:29 AM | 32 (25.2%) | 8 (8.9%) |
| 7:30 AM to 7:59 AM | 23 (18.1%) | 25 (27.8%) |
| 8:00 AM to 8:29 AM | 26 (20.5%) | 15 (16.7%) |
| 8:30 AM to 8:59 AM | 7 (5.5%) | 8 (8.9%) |
| 9:00 AM to 9:59 AM | 5 (3.9%) | 8 (8.9%) |
| 10:00 AM to 10:59 AM | 0 (0.0%) | 0 (0.0%) |
| 11:00 AM to 11:59 AM | 0 (0.0%) | 7 (7.8%) |
| 12:00 PM to 3:59 PM | 0 (0.0%) | 0 (0.0%) |
| 4:00 PM to 11:59 PM | 0 (0.0%) | 0 (0.0%) |
| Total | 127 (100.0%) | 90 (100.0%) |
Housing Occupancy in Shoreham
Occupancy by Ownership in Shoreham
Of the total 197 dwellings in Shoreham, owner-occupied units account for 187 (94.9%), while renter-occupied units make up 10 (5.1%).
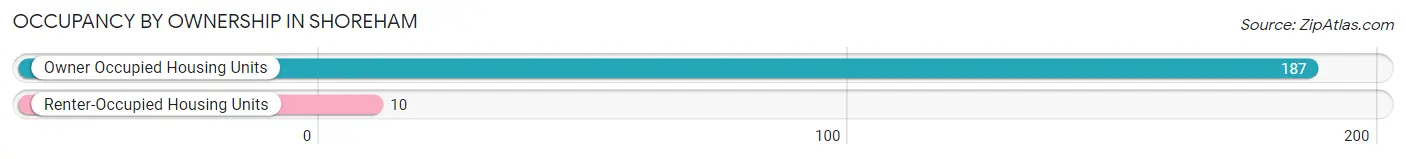
| Occupancy | # Housing Units | % Housing Units |
| Owner Occupied Housing Units | 187 | 94.9% |
| Renter-Occupied Housing Units | 10 | 5.1% |
| Total Occupied Housing Units | 197 | 100.0% |
Occupancy by Household Size in Shoreham

| Household Size | # Housing Units | % Housing Units |
| 1-Person Household | 21 | 10.7% |
| 2-Person Household | 92 | 46.7% |
| 3-Person Household | 30 | 15.2% |
| 4+ Person Household | 54 | 27.4% |
| Total Housing Units | 197 | 100.0% |
Occupancy by Ownership by Household Size in Shoreham
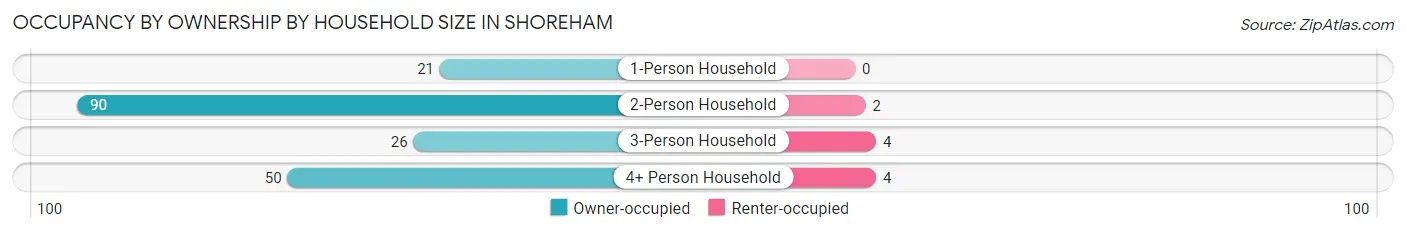
| Household Size | Owner-occupied | Renter-occupied |
| 1-Person Household | 21 (100.0%) | 0 (0.0%) |
| 2-Person Household | 90 (97.8%) | 2 (2.2%) |
| 3-Person Household | 26 (86.7%) | 4 (13.3%) |
| 4+ Person Household | 50 (92.6%) | 4 (7.4%) |
| Total Housing Units | 187 (94.9%) | 10 (5.1%) |
Occupancy by Educational Attainment in Shoreham
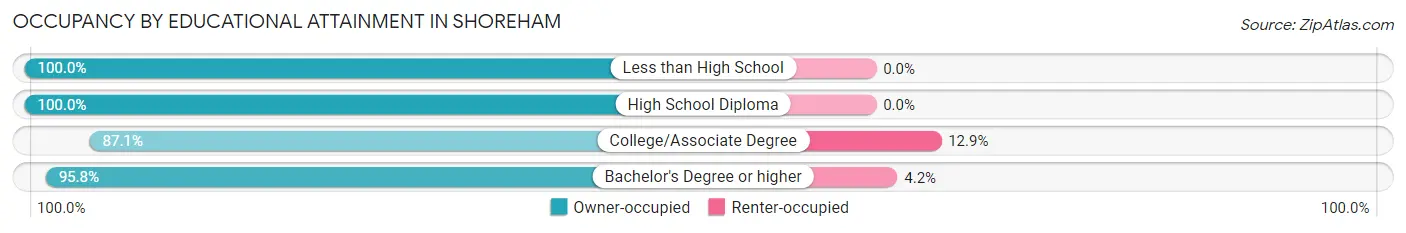
| Household Size | Owner-occupied | Renter-occupied |
| Less than High School | 9 (100.0%) | 0 (0.0%) |
| High School Diploma | 14 (100.0%) | 0 (0.0%) |
| College/Associate Degree | 27 (87.1%) | 4 (12.9%) |
| Bachelor's Degree or higher | 137 (95.8%) | 6 (4.2%) |
Occupancy by Age of Householder in Shoreham
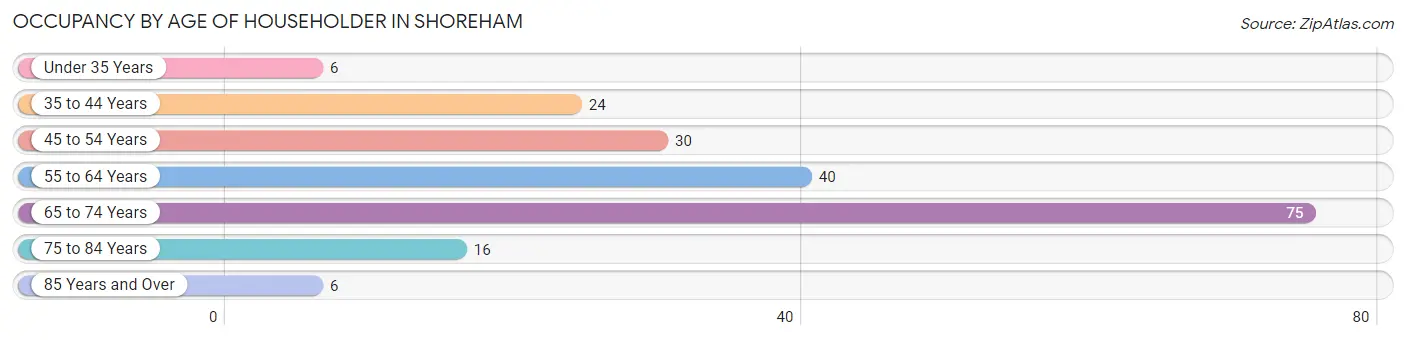
| Age Bracket | # Households | % Households |
| Under 35 Years | 6 | 3.0% |
| 35 to 44 Years | 24 | 12.2% |
| 45 to 54 Years | 30 | 15.2% |
| 55 to 64 Years | 40 | 20.3% |
| 65 to 74 Years | 75 | 38.1% |
| 75 to 84 Years | 16 | 8.1% |
| 85 Years and Over | 6 | 3.0% |
| Total | 197 | 100.0% |
Housing Finances in Shoreham
Median Income by Occupancy in Shoreham
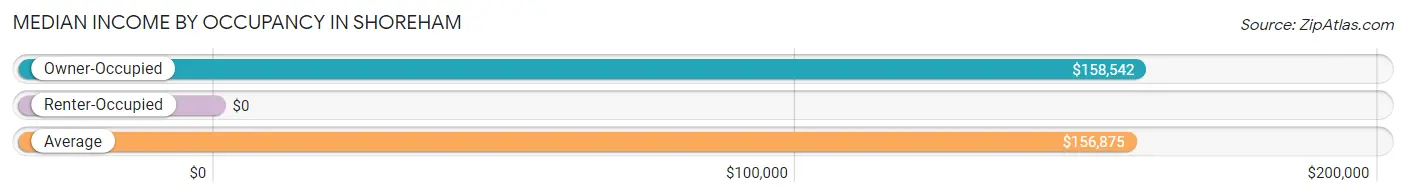
| Occupancy Type | # Households | Median Income |
| Owner-Occupied | 187 (94.9%) | $158,542 |
| Renter-Occupied | 10 (5.1%) | $0 |
| Average | 197 (100.0%) | $156,875 |
Occupancy by Householder Income Bracket in Shoreham
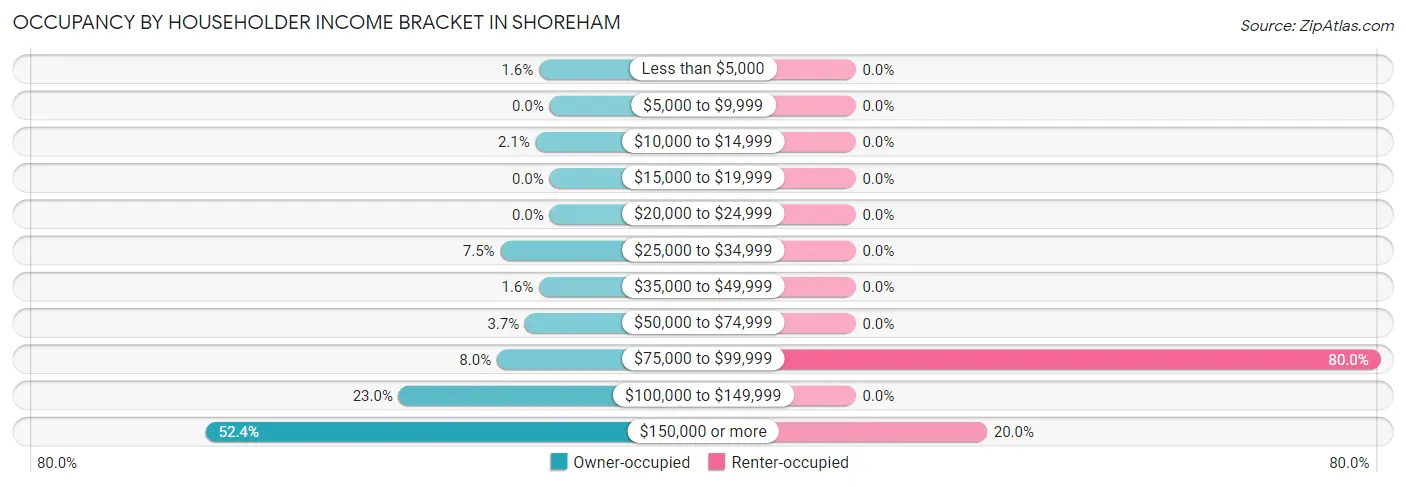
| Income Bracket | Owner-occupied | Renter-occupied |
| Less than $5,000 | 3 (1.6%) | 0 (0.0%) |
| $5,000 to $9,999 | 0 (0.0%) | 0 (0.0%) |
| $10,000 to $14,999 | 4 (2.1%) | 0 (0.0%) |
| $15,000 to $19,999 | 0 (0.0%) | 0 (0.0%) |
| $20,000 to $24,999 | 0 (0.0%) | 0 (0.0%) |
| $25,000 to $34,999 | 14 (7.5%) | 0 (0.0%) |
| $35,000 to $49,999 | 3 (1.6%) | 0 (0.0%) |
| $50,000 to $74,999 | 7 (3.7%) | 0 (0.0%) |
| $75,000 to $99,999 | 15 (8.0%) | 8 (80.0%) |
| $100,000 to $149,999 | 43 (23.0%) | 0 (0.0%) |
| $150,000 or more | 98 (52.4%) | 2 (20.0%) |
| Total | 187 (100.0%) | 10 (100.0%) |
Monthly Housing Cost Tiers in Shoreham
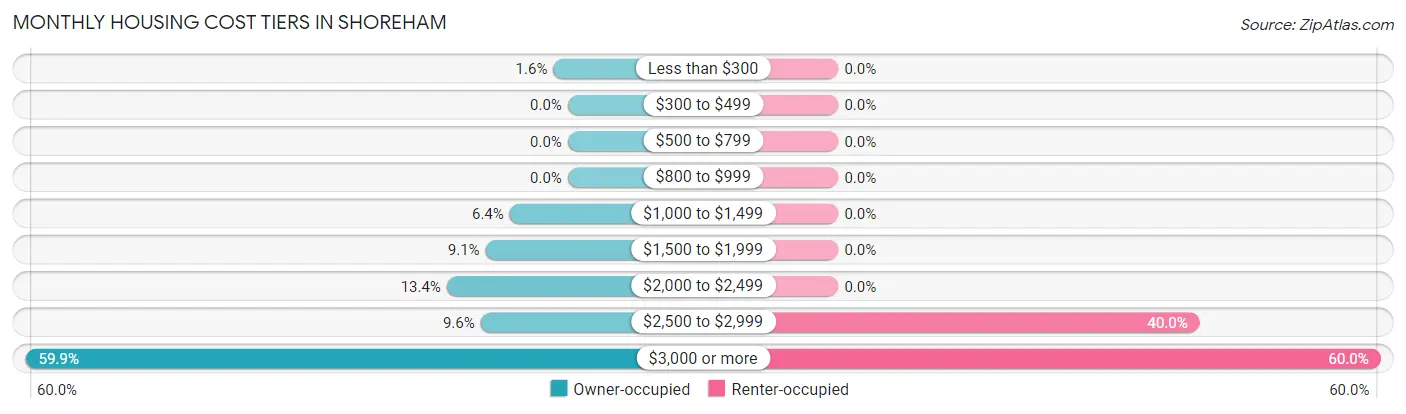
| Monthly Cost | Owner-occupied | Renter-occupied |
| Less than $300 | 3 (1.6%) | 0 (0.0%) |
| $300 to $499 | 0 (0.0%) | 0 (0.0%) |
| $500 to $799 | 0 (0.0%) | 0 (0.0%) |
| $800 to $999 | 0 (0.0%) | 0 (0.0%) |
| $1,000 to $1,499 | 12 (6.4%) | 0 (0.0%) |
| $1,500 to $1,999 | 17 (9.1%) | 0 (0.0%) |
| $2,000 to $2,499 | 25 (13.4%) | 0 (0.0%) |
| $2,500 to $2,999 | 18 (9.6%) | 4 (40.0%) |
| $3,000 or more | 112 (59.9%) | 6 (60.0%) |
| Total | 187 (100.0%) | 10 (100.0%) |
Physical Housing Characteristics in Shoreham
Housing Structures in Shoreham
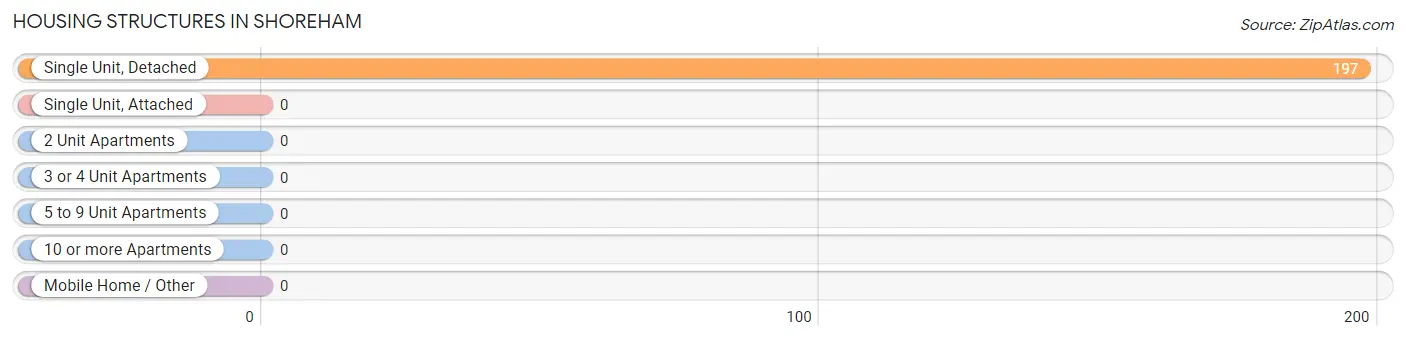
| Structure Type | # Housing Units | % Housing Units |
| Single Unit, Detached | 197 | 100.0% |
| Single Unit, Attached | 0 | 0.0% |
| 2 Unit Apartments | 0 | 0.0% |
| 3 or 4 Unit Apartments | 0 | 0.0% |
| 5 to 9 Unit Apartments | 0 | 0.0% |
| 10 or more Apartments | 0 | 0.0% |
| Mobile Home / Other | 0 | 0.0% |
| Total | 197 | 100.0% |
Housing Structures by Occupancy in Shoreham
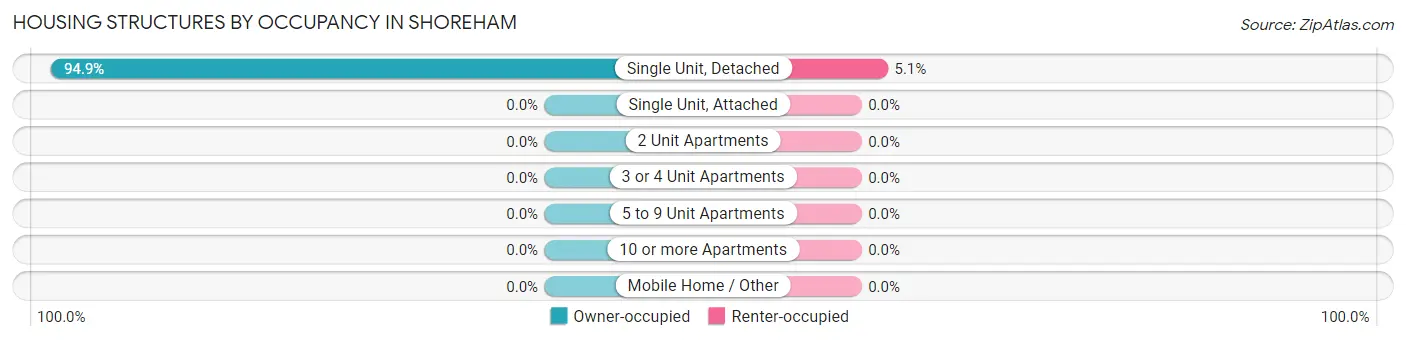
| Structure Type | Owner-occupied | Renter-occupied |
| Single Unit, Detached | 187 (94.9%) | 10 (5.1%) |
| Single Unit, Attached | 0 (0.0%) | 0 (0.0%) |
| 2 Unit Apartments | 0 (0.0%) | 0 (0.0%) |
| 3 or 4 Unit Apartments | 0 (0.0%) | 0 (0.0%) |
| 5 to 9 Unit Apartments | 0 (0.0%) | 0 (0.0%) |
| 10 or more Apartments | 0 (0.0%) | 0 (0.0%) |
| Mobile Home / Other | 0 (0.0%) | 0 (0.0%) |
| Total | 187 (94.9%) | 10 (5.1%) |
Housing Structures by Number of Rooms in Shoreham
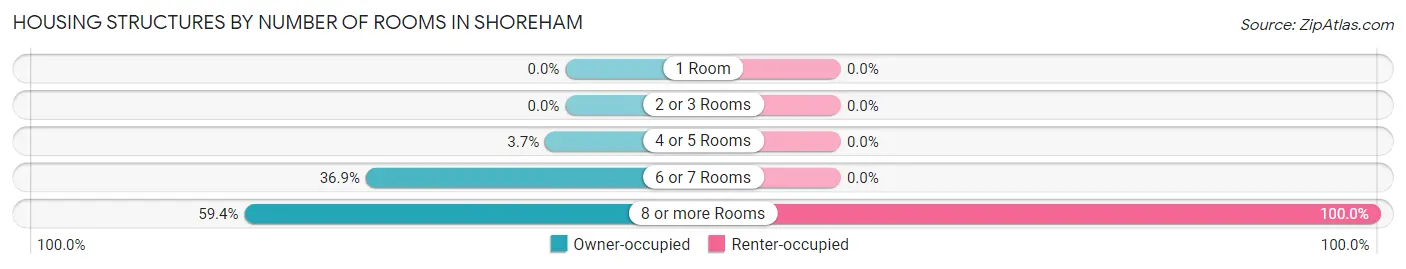
| Number of Rooms | Owner-occupied | Renter-occupied |
| 1 Room | 0 (0.0%) | 0 (0.0%) |
| 2 or 3 Rooms | 0 (0.0%) | 0 (0.0%) |
| 4 or 5 Rooms | 7 (3.7%) | 0 (0.0%) |
| 6 or 7 Rooms | 69 (36.9%) | 0 (0.0%) |
| 8 or more Rooms | 111 (59.4%) | 10 (100.0%) |
| Total | 187 (100.0%) | 10 (100.0%) |
Housing Structure by Heating Type in Shoreham
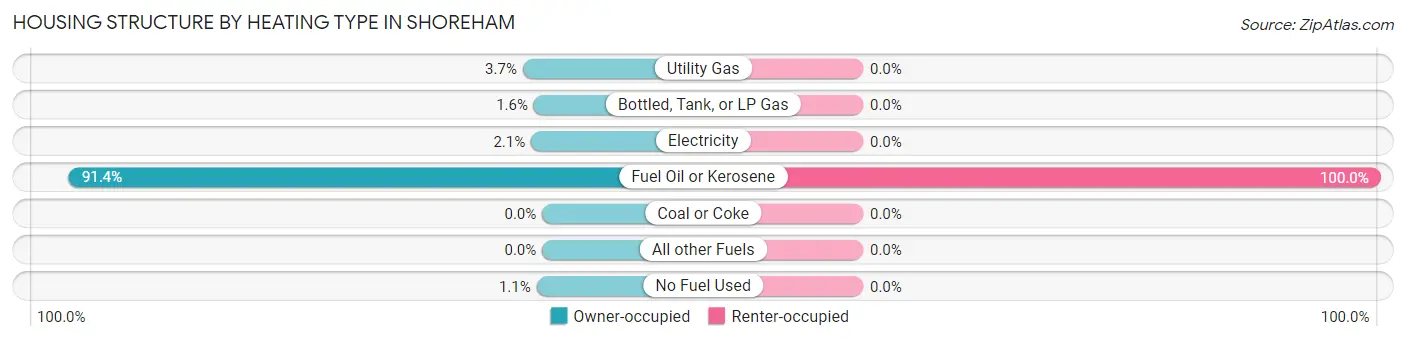
| Heating Type | Owner-occupied | Renter-occupied |
| Utility Gas | 7 (3.7%) | 0 (0.0%) |
| Bottled, Tank, or LP Gas | 3 (1.6%) | 0 (0.0%) |
| Electricity | 4 (2.1%) | 0 (0.0%) |
| Fuel Oil or Kerosene | 171 (91.4%) | 10 (100.0%) |
| Coal or Coke | 0 (0.0%) | 0 (0.0%) |
| All other Fuels | 0 (0.0%) | 0 (0.0%) |
| No Fuel Used | 2 (1.1%) | 0 (0.0%) |
| Total | 187 (100.0%) | 10 (100.0%) |
Household Vehicle Usage in Shoreham
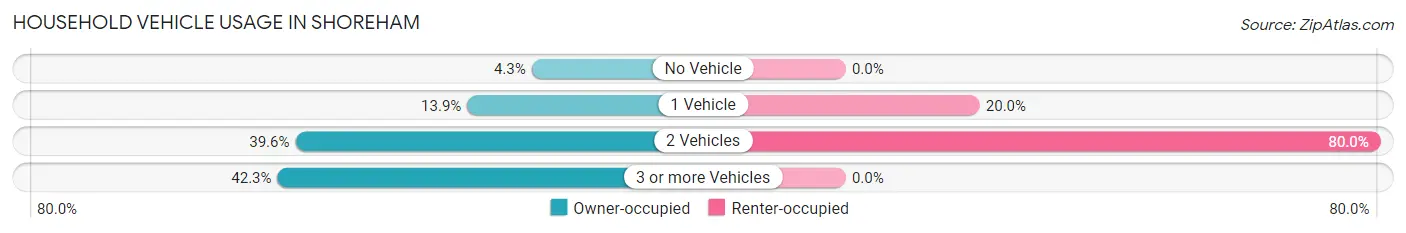
| Vehicles per Household | Owner-occupied | Renter-occupied |
| No Vehicle | 8 (4.3%) | 0 (0.0%) |
| 1 Vehicle | 26 (13.9%) | 2 (20.0%) |
| 2 Vehicles | 74 (39.6%) | 8 (80.0%) |
| 3 or more Vehicles | 79 (42.2%) | 0 (0.0%) |
| Total | 187 (100.0%) | 10 (100.0%) |
Real Estate & Mortgages in Shoreham
Real Estate and Mortgage Overview in Shoreham
| Characteristic | Without Mortgage | With Mortgage |
| Housing Units | 68 | 119 |
| Median Property Value | $564,500 | $708,300 |
| Median Household Income | $158,333 | $62 |
| Monthly Housing Costs | $1,501 | $107 |
| Real Estate Taxes | $10,001 | $0 |
Property Value by Mortgage Status in Shoreham
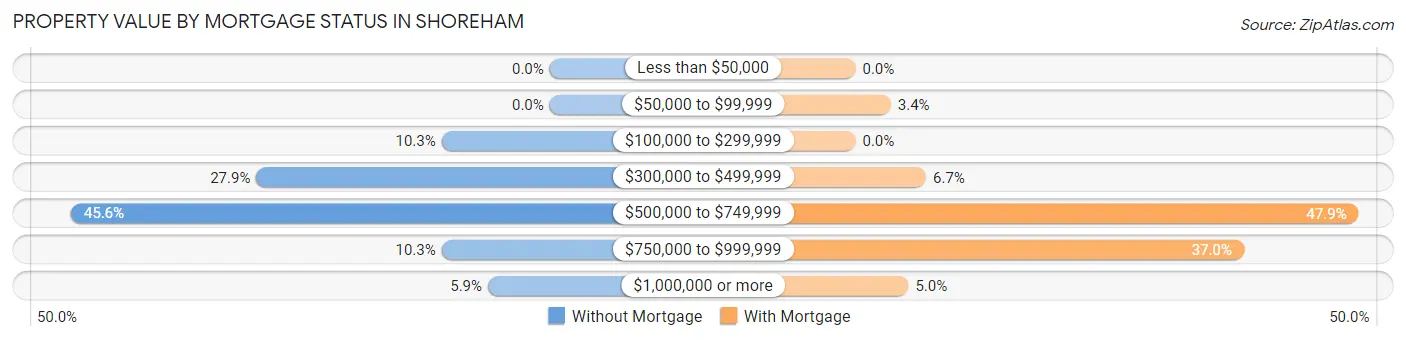
| Property Value | Without Mortgage | With Mortgage |
| Less than $50,000 | 0 (0.0%) | 0 (0.0%) |
| $50,000 to $99,999 | 0 (0.0%) | 4 (3.4%) |
| $100,000 to $299,999 | 7 (10.3%) | 0 (0.0%) |
| $300,000 to $499,999 | 19 (27.9%) | 8 (6.7%) |
| $500,000 to $749,999 | 31 (45.6%) | 57 (47.9%) |
| $750,000 to $999,999 | 7 (10.3%) | 44 (37.0%) |
| $1,000,000 or more | 4 (5.9%) | 6 (5.0%) |
| Total | 68 (100.0%) | 119 (100.0%) |
Household Income by Mortgage Status in Shoreham
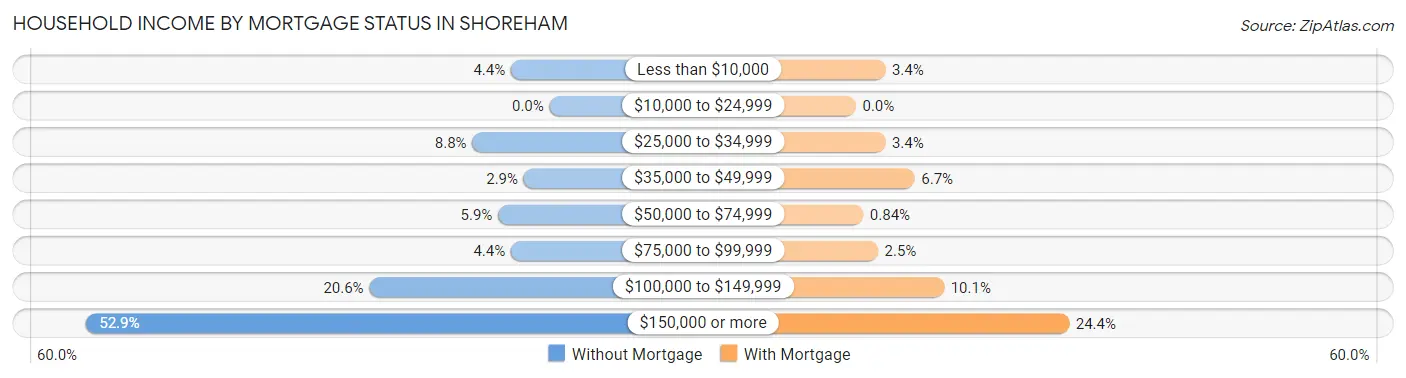
| Household Income | Without Mortgage | With Mortgage |
| Less than $10,000 | 3 (4.4%) | 4 (3.4%) |
| $10,000 to $24,999 | 0 (0.0%) | 0 (0.0%) |
| $25,000 to $34,999 | 6 (8.8%) | 4 (3.4%) |
| $35,000 to $49,999 | 2 (2.9%) | 8 (6.7%) |
| $50,000 to $74,999 | 4 (5.9%) | 1 (0.8%) |
| $75,000 to $99,999 | 3 (4.4%) | 3 (2.5%) |
| $100,000 to $149,999 | 14 (20.6%) | 12 (10.1%) |
| $150,000 or more | 36 (52.9%) | 29 (24.4%) |
| Total | 68 (100.0%) | 119 (100.0%) |
Property Value to Household Income Ratio in Shoreham
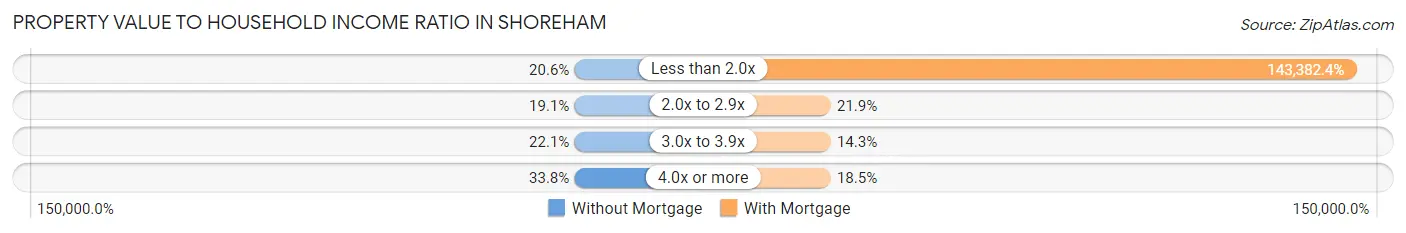
| Value-to-Income Ratio | Without Mortgage | With Mortgage |
| Less than 2.0x | 14 (20.6%) | 170,625 (143,382.3%) |
| 2.0x to 2.9x | 13 (19.1%) | 26 (21.8%) |
| 3.0x to 3.9x | 15 (22.1%) | 17 (14.3%) |
| 4.0x or more | 23 (33.8%) | 22 (18.5%) |
| Total | 68 (100.0%) | 119 (100.0%) |
Real Estate Taxes by Mortgage Status in Shoreham
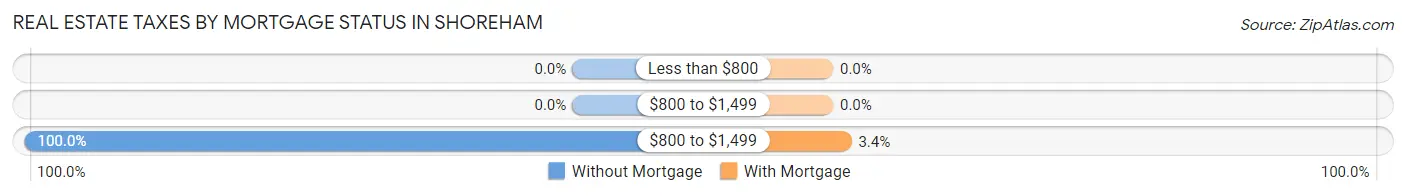
| Property Taxes | Without Mortgage | With Mortgage |
| Less than $800 | 0 (0.0%) | 0 (0.0%) |
| $800 to $1,499 | 0 (0.0%) | 0 (0.0%) |
| $800 to $1,499 | 68 (100.0%) | 4 (3.4%) |
| Total | 68 (100.0%) | 119 (100.0%) |
Health & Disability in Shoreham
Health Insurance Coverage by Age in Shoreham
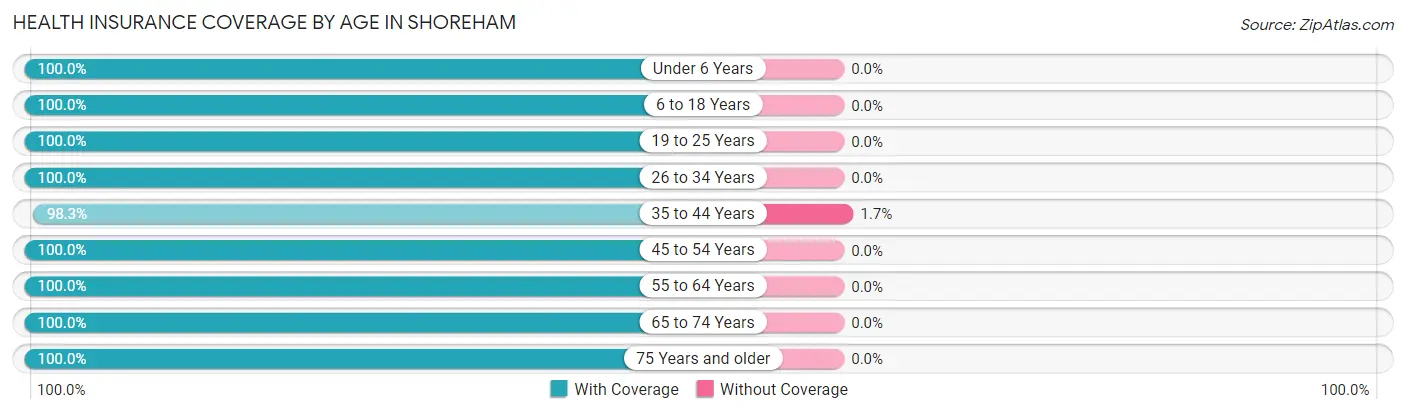
| Age Bracket | With Coverage | Without Coverage |
| Under 6 Years | 35 (100.0%) | 0 (0.0%) |
| 6 to 18 Years | 120 (100.0%) | 0 (0.0%) |
| 19 to 25 Years | 29 (100.0%) | 0 (0.0%) |
| 26 to 34 Years | 10 (100.0%) | 0 (0.0%) |
| 35 to 44 Years | 57 (98.3%) | 1 (1.7%) |
| 45 to 54 Years | 72 (100.0%) | 0 (0.0%) |
| 55 to 64 Years | 94 (100.0%) | 0 (0.0%) |
| 65 to 74 Years | 116 (100.0%) | 0 (0.0%) |
| 75 Years and older | 56 (100.0%) | 0 (0.0%) |
| Total | 589 (99.8%) | 1 (0.2%) |
Health Insurance Coverage by Citizenship Status in Shoreham
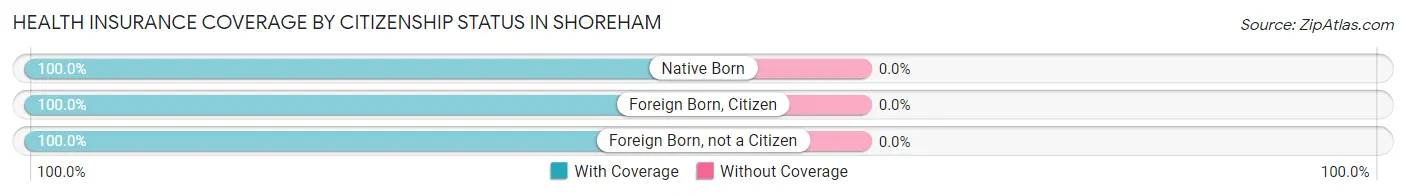
| Citizenship Status | With Coverage | Without Coverage |
| Native Born | 35 (100.0%) | 0 (0.0%) |
| Foreign Born, Citizen | 120 (100.0%) | 0 (0.0%) |
| Foreign Born, not a Citizen | 29 (100.0%) | 0 (0.0%) |
Health Insurance Coverage by Household Income in Shoreham
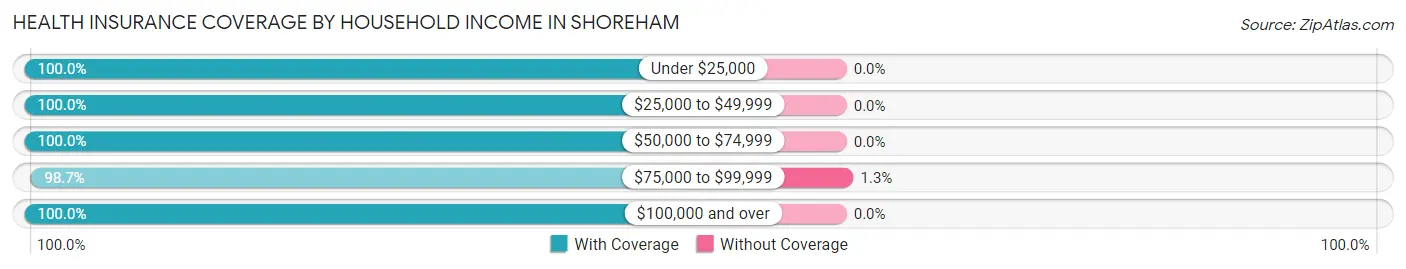
| Household Income | With Coverage | Without Coverage |
| Under $25,000 | 10 (100.0%) | 0 (0.0%) |
| $25,000 to $49,999 | 30 (100.0%) | 0 (0.0%) |
| $50,000 to $74,999 | 20 (100.0%) | 0 (0.0%) |
| $75,000 to $99,999 | 77 (98.7%) | 1 (1.3%) |
| $100,000 and over | 452 (100.0%) | 0 (0.0%) |
Public vs Private Health Insurance Coverage by Age in Shoreham
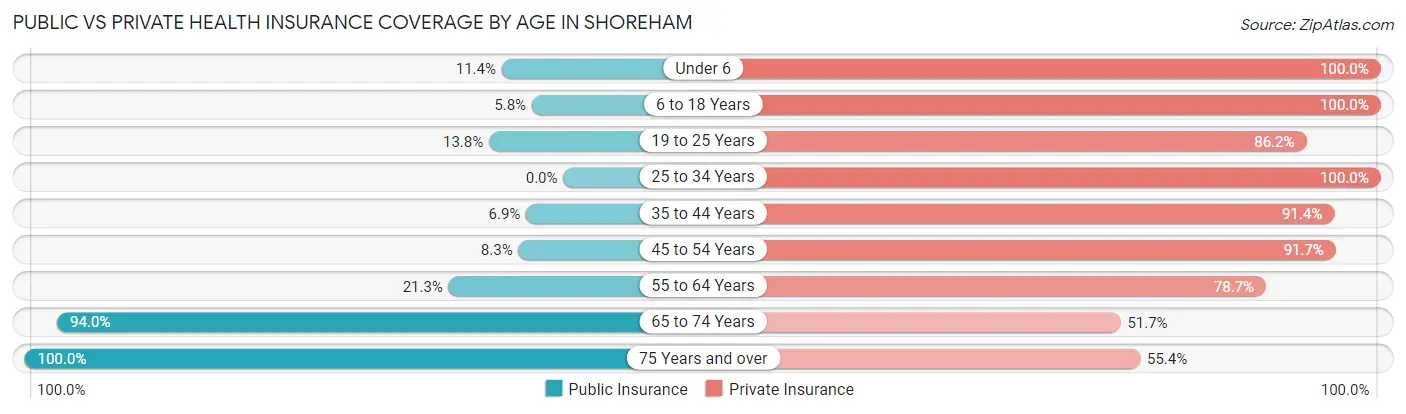
| Age Bracket | Public Insurance | Private Insurance |
| Under 6 | 4 (11.4%) | 35 (100.0%) |
| 6 to 18 Years | 7 (5.8%) | 120 (100.0%) |
| 19 to 25 Years | 4 (13.8%) | 25 (86.2%) |
| 25 to 34 Years | 0 (0.0%) | 10 (100.0%) |
| 35 to 44 Years | 4 (6.9%) | 53 (91.4%) |
| 45 to 54 Years | 6 (8.3%) | 66 (91.7%) |
| 55 to 64 Years | 20 (21.3%) | 74 (78.7%) |
| 65 to 74 Years | 109 (94.0%) | 60 (51.7%) |
| 75 Years and over | 56 (100.0%) | 31 (55.4%) |
| Total | 210 (35.6%) | 474 (80.3%) |
Disability Status by Sex by Age in Shoreham
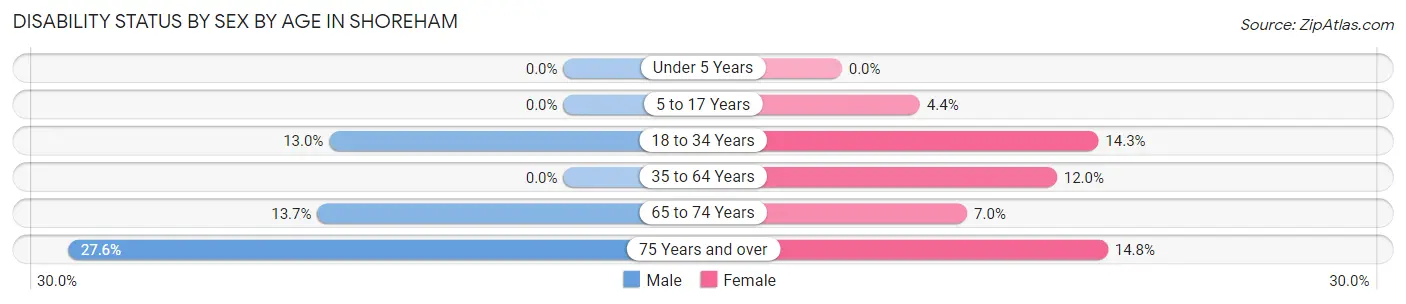
| Age Bracket | Male | Female |
| Under 5 Years | 0 (0.0%) | 0 (0.0%) |
| 5 to 17 Years | 0 (0.0%) | 3 (4.3%) |
| 18 to 34 Years | 3 (13.0%) | 4 (14.3%) |
| 35 to 64 Years | 0 (0.0%) | 14 (12.0%) |
| 65 to 74 Years | 10 (13.7%) | 3 (7.0%) |
| 75 Years and over | 8 (27.6%) | 4 (14.8%) |
Disability Class by Sex by Age in Shoreham
Disability Class: Hearing Difficulty
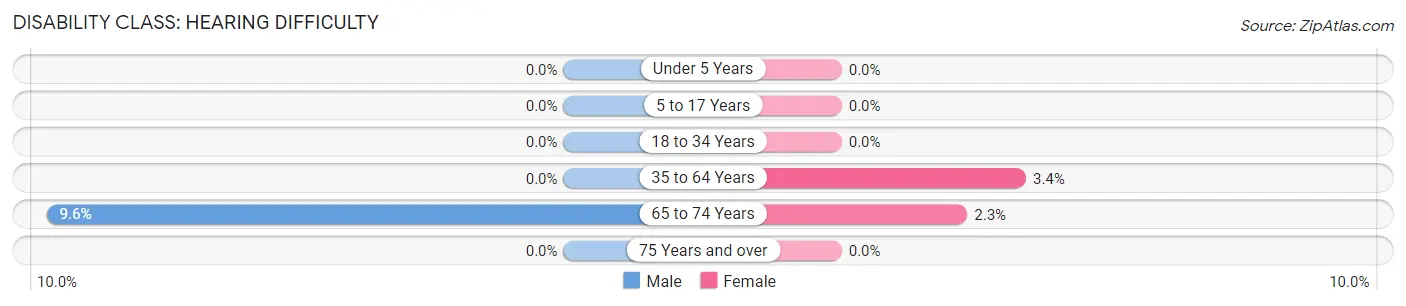
| Age Bracket | Male | Female |
| Under 5 Years | 0 (0.0%) | 0 (0.0%) |
| 5 to 17 Years | 0 (0.0%) | 0 (0.0%) |
| 18 to 34 Years | 0 (0.0%) | 0 (0.0%) |
| 35 to 64 Years | 0 (0.0%) | 4 (3.4%) |
| 65 to 74 Years | 7 (9.6%) | 1 (2.3%) |
| 75 Years and over | 0 (0.0%) | 0 (0.0%) |
Disability Class: Vision Difficulty
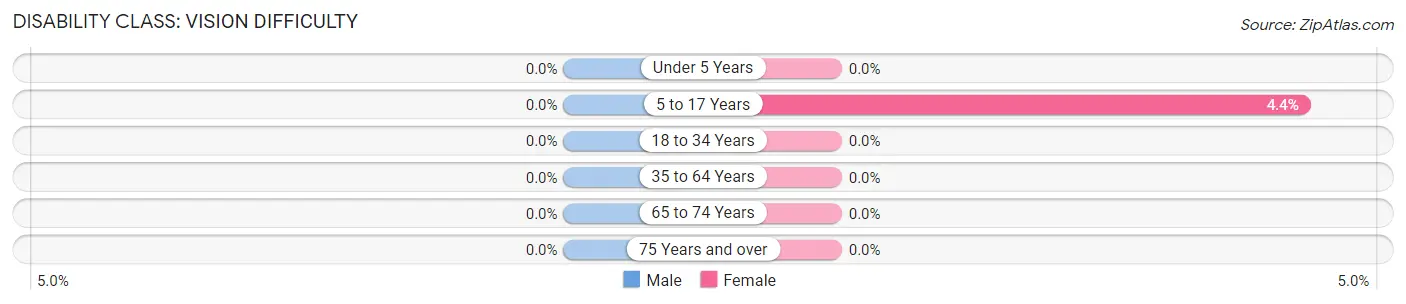
| Age Bracket | Male | Female |
| Under 5 Years | 0 (0.0%) | 0 (0.0%) |
| 5 to 17 Years | 0 (0.0%) | 3 (4.3%) |
| 18 to 34 Years | 0 (0.0%) | 0 (0.0%) |
| 35 to 64 Years | 0 (0.0%) | 0 (0.0%) |
| 65 to 74 Years | 0 (0.0%) | 0 (0.0%) |
| 75 Years and over | 0 (0.0%) | 0 (0.0%) |
Disability Class: Cognitive Difficulty
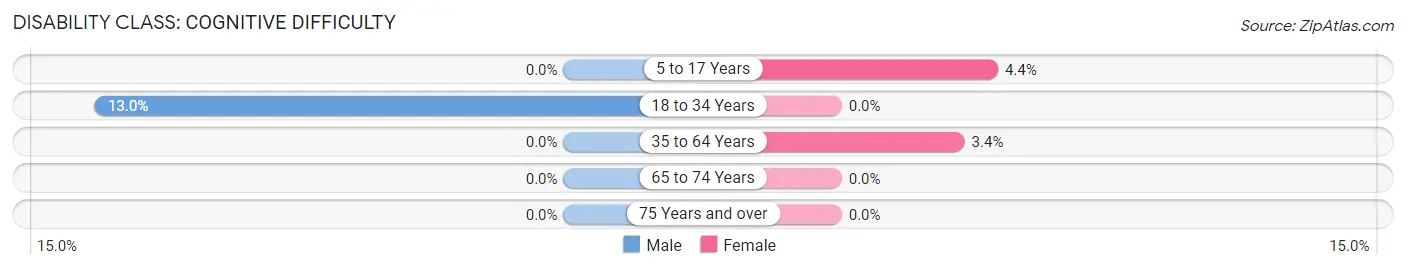
| Age Bracket | Male | Female |
| 5 to 17 Years | 0 (0.0%) | 3 (4.3%) |
| 18 to 34 Years | 3 (13.0%) | 0 (0.0%) |
| 35 to 64 Years | 0 (0.0%) | 4 (3.4%) |
| 65 to 74 Years | 0 (0.0%) | 0 (0.0%) |
| 75 Years and over | 0 (0.0%) | 0 (0.0%) |
Disability Class: Ambulatory Difficulty
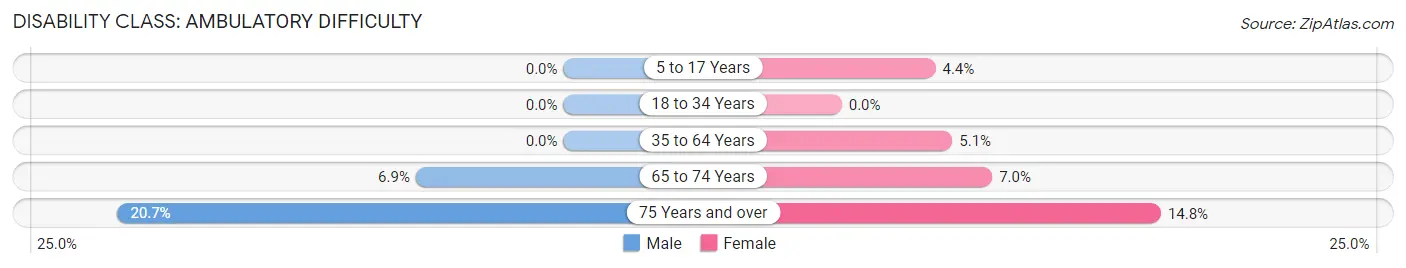
| Age Bracket | Male | Female |
| 5 to 17 Years | 0 (0.0%) | 3 (4.3%) |
| 18 to 34 Years | 0 (0.0%) | 0 (0.0%) |
| 35 to 64 Years | 0 (0.0%) | 6 (5.1%) |
| 65 to 74 Years | 5 (6.9%) | 3 (7.0%) |
| 75 Years and over | 6 (20.7%) | 4 (14.8%) |
Disability Class: Self-Care Difficulty
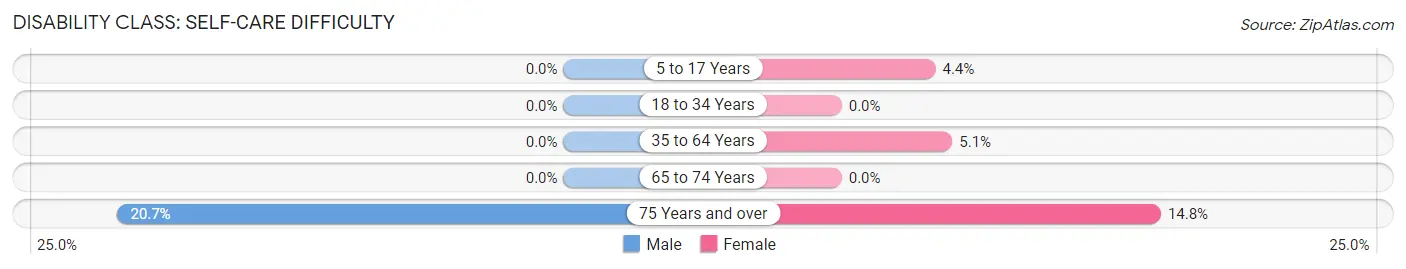
| Age Bracket | Male | Female |
| 5 to 17 Years | 0 (0.0%) | 3 (4.3%) |
| 18 to 34 Years | 0 (0.0%) | 0 (0.0%) |
| 35 to 64 Years | 0 (0.0%) | 6 (5.1%) |
| 65 to 74 Years | 0 (0.0%) | 0 (0.0%) |
| 75 Years and over | 6 (20.7%) | 4 (14.8%) |
Technology Access in Shoreham
Computing Device Access in Shoreham
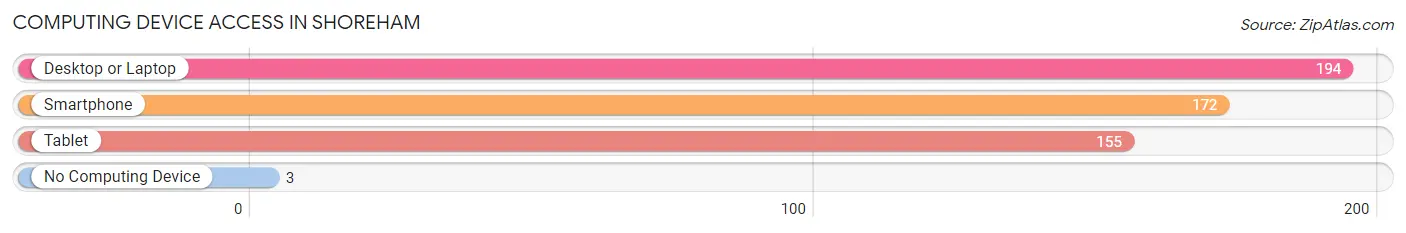
| Device Type | # Households | % Households |
| Desktop or Laptop | 194 | 98.5% |
| Smartphone | 172 | 87.3% |
| Tablet | 155 | 78.7% |
| No Computing Device | 3 | 1.5% |
| Total | 197 | 100.0% |
Internet Access in Shoreham
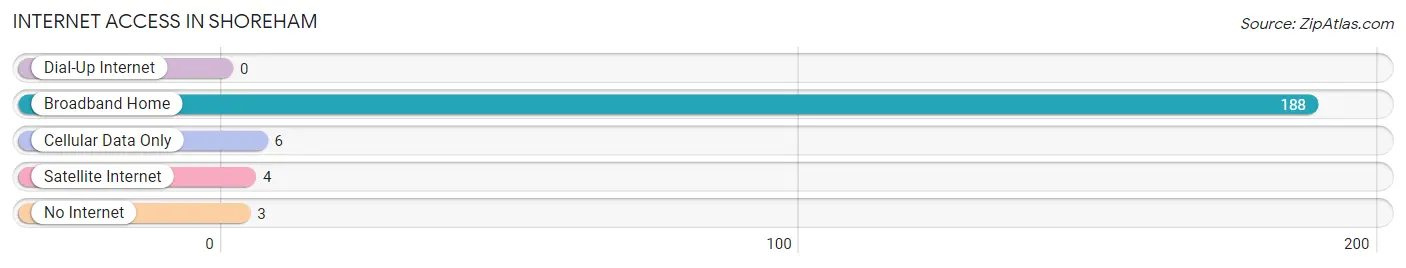
| Internet Type | # Households | % Households |
| Dial-Up Internet | 0 | 0.0% |
| Broadband Home | 188 | 95.4% |
| Cellular Data Only | 6 | 3.0% |
| Satellite Internet | 4 | 2.0% |
| No Internet | 3 | 1.5% |
| Total | 197 | 100.0% |
Shoreham Summary
Shoreham is a hamlet located in the Town of Brookhaven in Suffolk County, New York. It is situated on the north shore of Long Island, approximately 60 miles east of New York City. The hamlet is bordered by the hamlets of Wading River to the east, Rocky Point to the south, and Sound Beach to the west.
History
The area that is now Shoreham was originally inhabited by the Setalcott Indians, a branch of the Algonquin tribe. The first European settlers arrived in the area in 1655, and the hamlet was officially established in 1761. The name Shoreham is derived from the town of Shoreham in England.
In the late 19th century, Shoreham became a popular summer resort destination for wealthy New Yorkers. The area was home to several grand hotels, including the Shoreham Hotel, which was built in 1891 and was the largest hotel on Long Island at the time.
In the early 20th century, Shoreham was home to several large estates, including the estate of William K. Vanderbilt, which was built in 1910. The estate was later purchased by the Catholic Diocese of Rockville Centre and is now the site of St. John the Baptist Diocesan High School.
Geography
Shoreham is located on the north shore of Long Island, approximately 60 miles east of New York City. The hamlet is bordered by the hamlets of Wading River to the east, Rocky Point to the south, and Sound Beach to the west.
The area is characterized by rolling hills, wooded areas, and several small ponds and lakes. The hamlet is home to several parks, including Shoreham Beach State Park, which offers swimming, fishing, and boating.
Economy
The economy of Shoreham is largely based on tourism and retail. The hamlet is home to several small businesses, including restaurants, shops, and galleries. The area is also home to several wineries, including the Macari Vineyards and Winery, which produces award-winning wines.
The hamlet is also home to several large employers, including Brookhaven National Laboratory, which is a research facility operated by the U.S. Department of Energy.
Demographics
As of the 2010 census, the population of Shoreham was 5,717. The median household income was $90,945, and the median age was 43. The population was predominantly white (94.3%), with small percentages of African American (2.2%), Asian (1.7%), and Hispanic (1.2%) residents.
Conclusion
Shoreham is a hamlet located in the Town of Brookhaven in Suffolk County, New York. It is situated on the north shore of Long Island, approximately 60 miles east of New York City. The area was originally inhabited by the Setalcott Indians, and was later settled by European settlers in the 17th century. The hamlet became a popular summer resort destination in the late 19th century, and is now home to several small businesses, wineries, and large employers. The population of Shoreham was 5,717 as of the 2010 census, with a median household income of $90,945 and a median age of 43.
Common Questions
What is Per Capita Income in Shoreham?
Per Capita income in Shoreham is $73,941.
What is the Median Family Income in Shoreham?
Median Family Income in Shoreham is $159,375.
What is the Median Household income in Shoreham?
Median Household Income in Shoreham is $156,875.
What is Income or Wage Gap in Shoreham?
Income or Wage Gap in Shoreham is 57.2%.
Women in Shoreham earn 42.8 cents for every dollar earned by a man.
What is Inequality or Gini Index in Shoreham?
Inequality or Gini Index in Shoreham is 0.43.
What is the Total Population of Shoreham?
Total Population of Shoreham is 591.
What is the Total Male Population of Shoreham?
Total Male Population of Shoreham is 302.
What is the Total Female Population of Shoreham?
Total Female Population of Shoreham is 289.
What is the Ratio of Males per 100 Females in Shoreham?
There are 104.50 Males per 100 Females in Shoreham.
What is the Ratio of Females per 100 Males in Shoreham?
There are 95.70 Females per 100 Males in Shoreham.
What is the Median Population Age in Shoreham?
Median Population Age in Shoreham is 51.6 Years.
What is the Average Family Size in Shoreham
Average Family Size in Shoreham is 3.4 People.
What is the Average Household Size in Shoreham
Average Household Size in Shoreham is 3.0 People.
How Large is the Labor Force in Shoreham?
There are 270 People in the Labor Forcein in Shoreham.
What is the Percentage of People in the Labor Force in Shoreham?
59.0% of People are in the Labor Force in Shoreham.
What is the Unemployment Rate in Shoreham?
Unemployment Rate in Shoreham is 3.0%.