Croton On Hudson, NY Map & Demographics
Croton On Hudson Map
Croton On Hudson Overview
$77,032
PER CAPITA INCOME
$192,700
AVG FAMILY INCOME
$166,087
AVG HOUSEHOLD INCOME
4.7%
WAGE / INCOME GAP [ % ]
95.3¢/ $1
WAGE / INCOME GAP [ $ ]
0.41
INEQUALITY / GINI INDEX
8,237
TOTAL POPULATION
3,968
MALE POPULATION
4,269
FEMALE POPULATION
92.95
MALES / 100 FEMALES
107.59
FEMALES / 100 MALES
45.3
MEDIAN AGE
3.2
AVG FAMILY SIZE
2.7
AVG HOUSEHOLD SIZE
4,534
LABOR FORCE [ PEOPLE ]
68.7%
PERCENT IN LABOR FORCE
7.7%
UNEMPLOYMENT RATE
Croton On Hudson Zip Codes
Croton On Hudson Area Codes
Income in Croton On Hudson
Income Overview in Croton On Hudson
Per Capita Income in Croton On Hudson is $77,032, while median incomes of families and households are $192,700 and $166,087 respectively.
| Characteristic | Number | Measure |
| Per Capita Income | 8,237 | $77,032 |
| Median Family Income | 2,258 | $192,700 |
| Mean Family Income | 2,258 | $231,612 |
| Median Household Income | 2,976 | $166,087 |
| Mean Household Income | 2,976 | $207,515 |
| Income Deficit | 2,258 | $0 |
| Wage / Income Gap (%) | 8,237 | 4.68% |
| Wage / Income Gap ($) | 8,237 | 95.32¢ per $1 |
| Gini / Inequality Index | 8,237 | 0.41 |
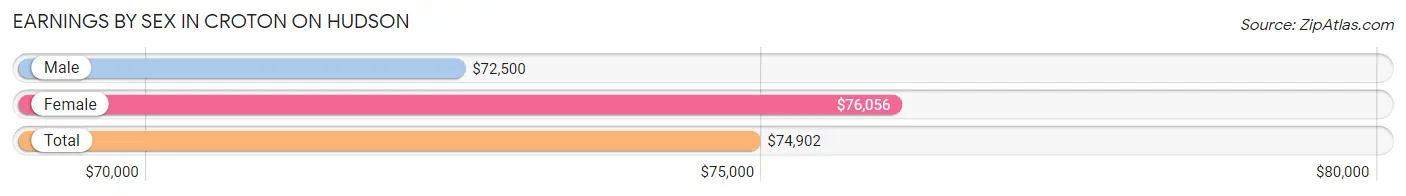
Earnings by Sex in Croton On Hudson
Average Earnings in Croton On Hudson are $74,902, $72,500 for men and $76,056 for women, a difference of 4.7%.
| Sex | Number | Average Earnings |
| Male | 2,642 (53.8%) | $72,500 |
| Female | 2,271 (46.2%) | $76,056 |
| Total | 4,913 (100.0%) | $74,902 |
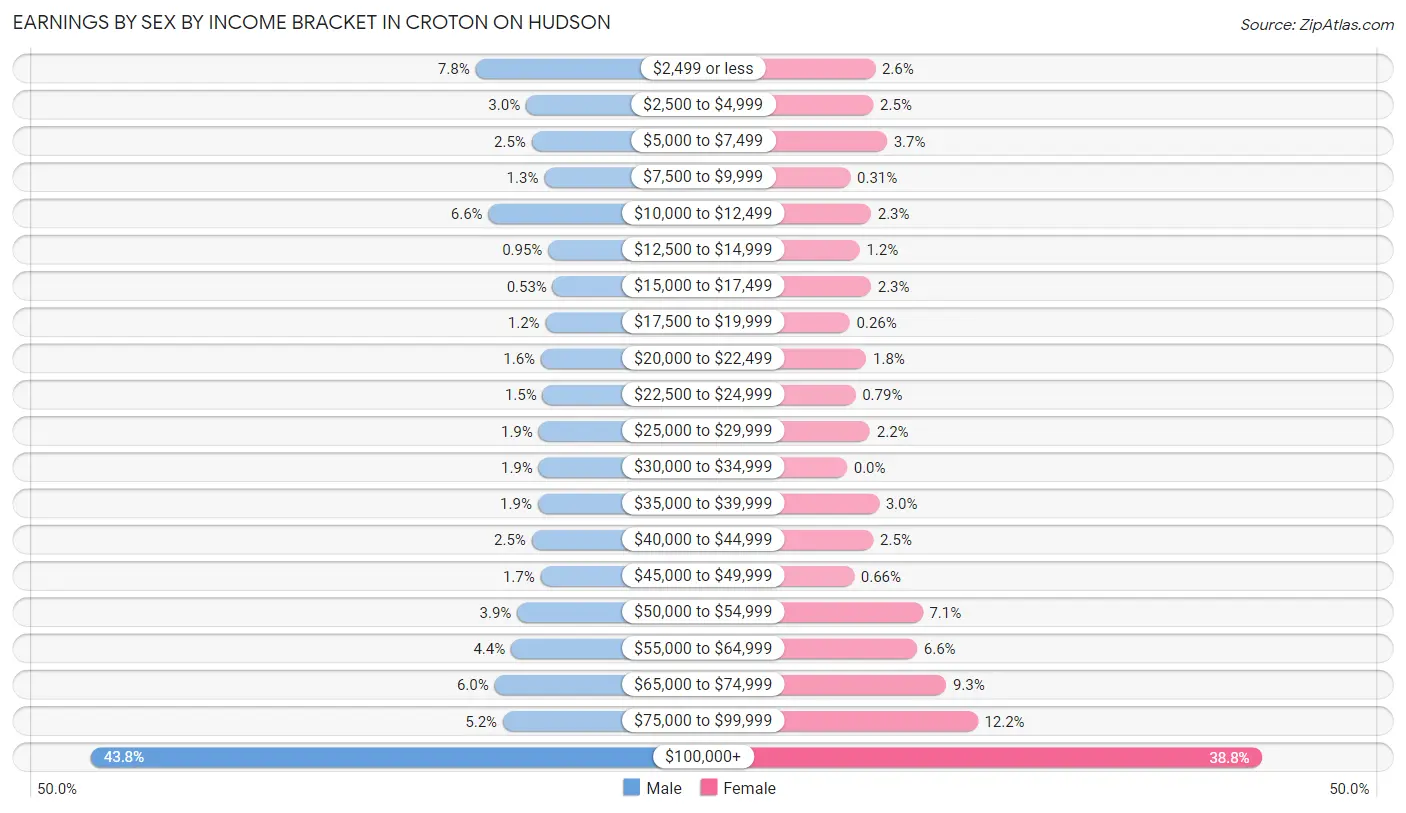
Earnings by Sex by Income Bracket in Croton On Hudson
The most common earnings brackets in Croton On Hudson are $100,000+ for men (1,157 | 43.8%) and $100,000+ for women (882 | 38.8%).
| Income | Male | Female |
| $2,499 or less | 205 (7.8%) | 60 (2.6%) |
| $2,500 to $4,999 | 80 (3.0%) | 56 (2.5%) |
| $5,000 to $7,499 | 66 (2.5%) | 85 (3.7%) |
| $7,500 to $9,999 | 35 (1.3%) | 7 (0.3%) |
| $10,000 to $12,499 | 173 (6.6%) | 51 (2.2%) |
| $12,500 to $14,999 | 25 (0.9%) | 27 (1.2%) |
| $15,000 to $17,499 | 14 (0.5%) | 51 (2.2%) |
| $17,500 to $19,999 | 32 (1.2%) | 6 (0.3%) |
| $20,000 to $22,499 | 43 (1.6%) | 41 (1.8%) |
| $22,500 to $24,999 | 39 (1.5%) | 18 (0.8%) |
| $25,000 to $29,999 | 49 (1.8%) | 49 (2.2%) |
| $30,000 to $34,999 | 49 (1.8%) | 0 (0.0%) |
| $35,000 to $39,999 | 51 (1.9%) | 68 (3.0%) |
| $40,000 to $44,999 | 66 (2.5%) | 56 (2.5%) |
| $45,000 to $49,999 | 44 (1.7%) | 15 (0.7%) |
| $50,000 to $54,999 | 102 (3.9%) | 161 (7.1%) |
| $55,000 to $64,999 | 117 (4.4%) | 149 (6.6%) |
| $65,000 to $74,999 | 158 (6.0%) | 211 (9.3%) |
| $75,000 to $99,999 | 137 (5.2%) | 278 (12.2%) |
| $100,000+ | 1,157 (43.8%) | 882 (38.8%) |
| Total | 2,642 (100.0%) | 2,271 (100.0%) |
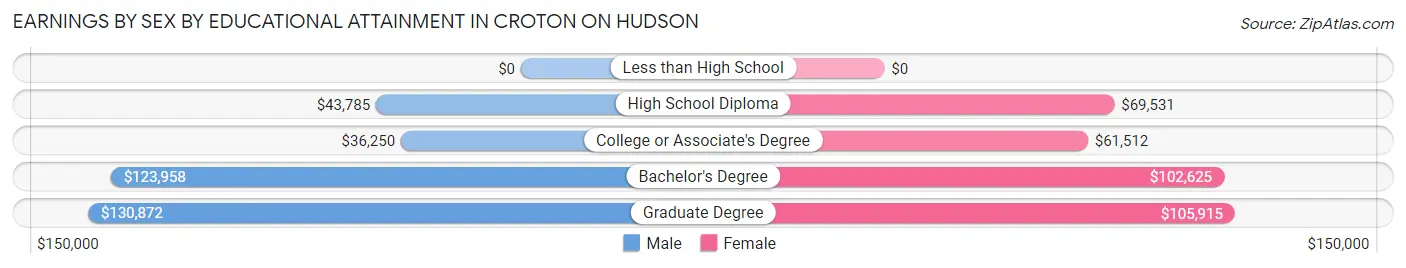
Earnings by Sex by Educational Attainment in Croton On Hudson
Average earnings in Croton On Hudson are $105,326 for men and $93,975 for women, a difference of 10.8%. Men with an educational attainment of graduate degree enjoy the highest average annual earnings of $130,872, while those with college or associate's degree education earn the least with $36,250. Women with an educational attainment of graduate degree earn the most with the average annual earnings of $105,915, while those with college or associate's degree education have the smallest earnings of $61,512.
| Educational Attainment | Male Income | Female Income |
| Less than High School | - | - |
| High School Diploma | $43,785 | $69,531 |
| College or Associate's Degree | $36,250 | $61,512 |
| Bachelor's Degree | $123,958 | $102,625 |
| Graduate Degree | $130,872 | $105,915 |
| Total | $105,326 | $93,975 |
Family Income in Croton On Hudson
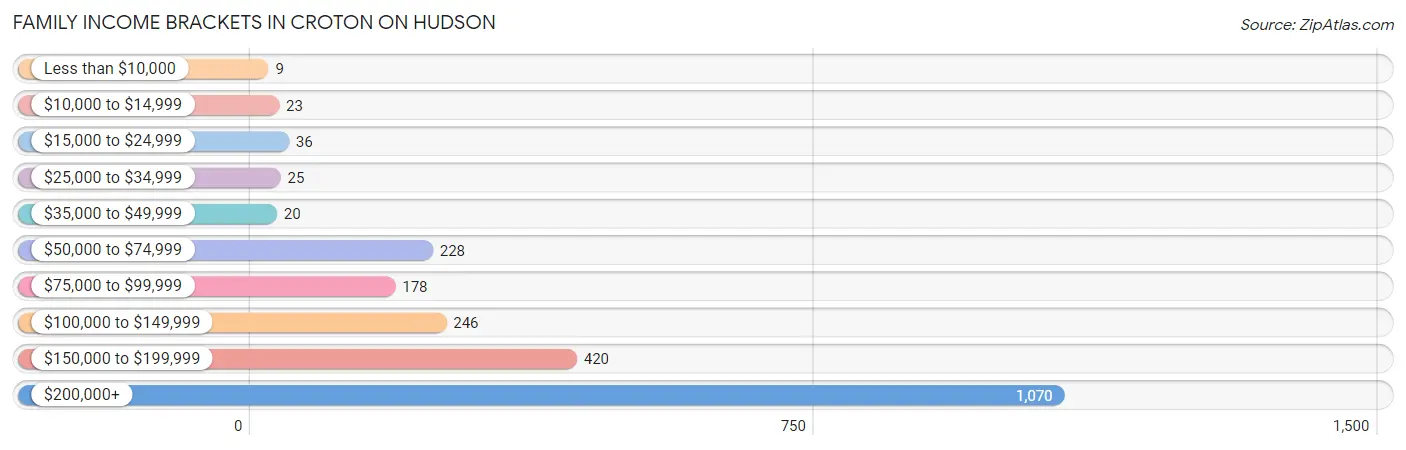
Family Income Brackets in Croton On Hudson
According to the Croton On Hudson family income data, there are 1,070 families falling into the $200,000+ income range, which is the most common income bracket and makes up 47.4% of all families. Conversely, the less than $10,000 income bracket is the least frequent group with only 9 families (0.4%) belonging to this category.
| Income Bracket | # Families | % Families |
| Less than $10,000 | 9 | 0.4% |
| $10,000 to $14,999 | 23 | 1.0% |
| $15,000 to $24,999 | 36 | 1.6% |
| $25,000 to $34,999 | 25 | 1.1% |
| $35,000 to $49,999 | 20 | 0.9% |
| $50,000 to $74,999 | 228 | 10.1% |
| $75,000 to $99,999 | 178 | 7.9% |
| $100,000 to $149,999 | 246 | 10.9% |
| $150,000 to $199,999 | 420 | 18.6% |
| $200,000+ | 1,070 | 47.4% |
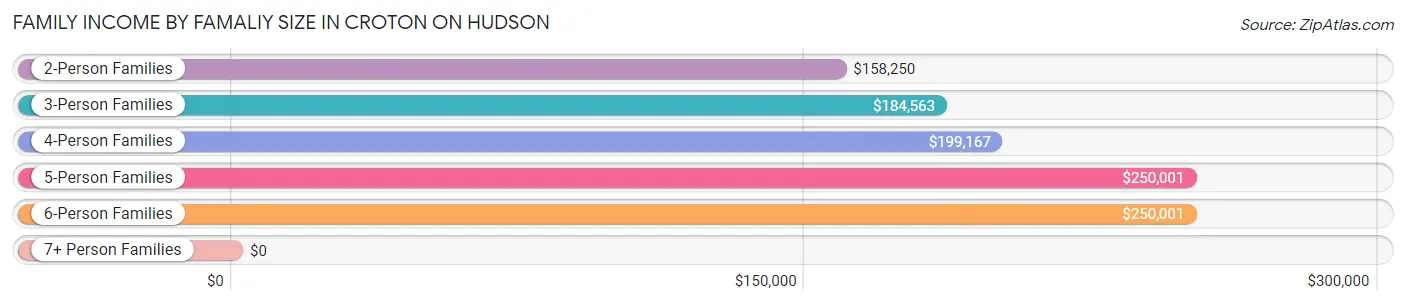
Family Income by Famaliy Size in Croton On Hudson
5-person families (196 | 8.7%) account for the highest median family income in Croton On Hudson with $250,001 per family, while 2-person families (801 | 35.5%) have the highest median income of $79,125 per family member.
| Income Bracket | # Families | Median Income |
| 2-Person Families | 801 (35.5%) | $158,250 |
| 3-Person Families | 731 (32.4%) | $184,563 |
| 4-Person Families | 500 (22.1%) | $199,167 |
| 5-Person Families | 196 (8.7%) | $250,001 |
| 6-Person Families | 30 (1.3%) | $250,001 |
| 7+ Person Families | 0 (0.0%) | $0 |
| Total | 2,258 (100.0%) | $192,700 |
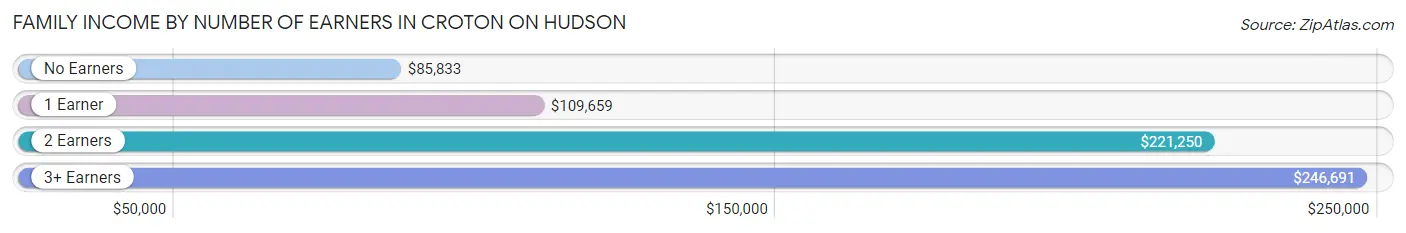
Family Income by Number of Earners in Croton On Hudson
The median family income in Croton On Hudson is $192,700, with families comprising 3+ earners (407) having the highest median family income of $246,691, while families with no earners (206) have the lowest median family income of $85,833, accounting for 18.0% and 9.1% of families, respectively.
| Number of Earners | # Families | Median Income |
| No Earners | 206 (9.1%) | $85,833 |
| 1 Earner | 525 (23.3%) | $109,659 |
| 2 Earners | 1,120 (49.6%) | $221,250 |
| 3+ Earners | 407 (18.0%) | $246,691 |
| Total | 2,258 (100.0%) | $192,700 |
Household Income in Croton On Hudson
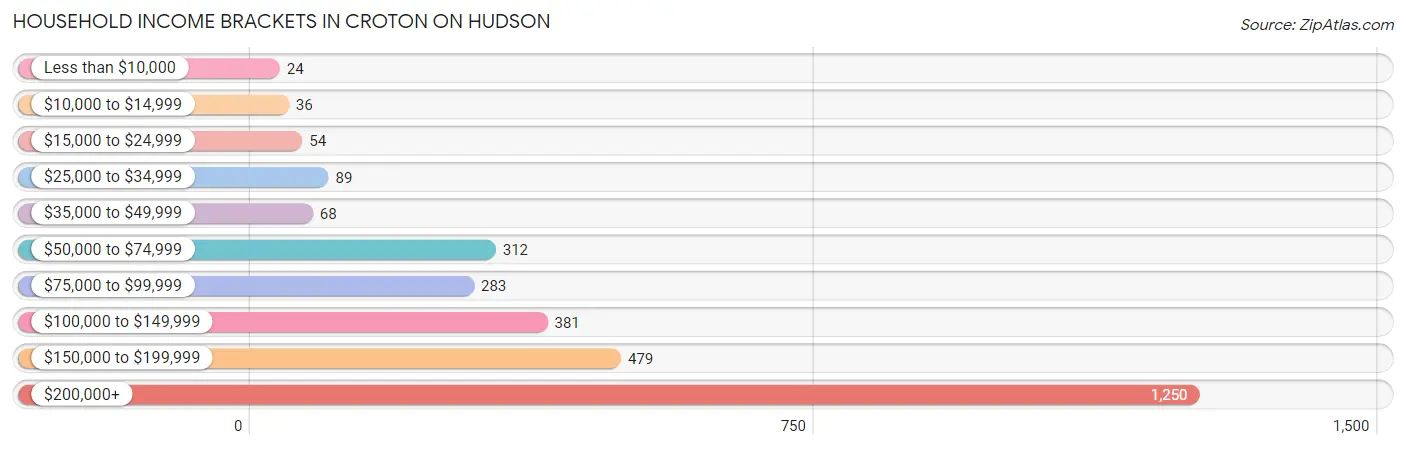
Household Income Brackets in Croton On Hudson
With 1,250 households falling in the category, the $200,000+ income range is the most frequent in Croton On Hudson, accounting for 42.0% of all households. In contrast, only 24 households (0.8%) fall into the less than $10,000 income bracket, making it the least populous group.
| Income Bracket | # Households | % Households |
| Less than $10,000 | 24 | 0.8% |
| $10,000 to $14,999 | 36 | 1.2% |
| $15,000 to $24,999 | 54 | 1.8% |
| $25,000 to $34,999 | 89 | 3.0% |
| $35,000 to $49,999 | 68 | 2.3% |
| $50,000 to $74,999 | 312 | 10.5% |
| $75,000 to $99,999 | 283 | 9.5% |
| $100,000 to $149,999 | 381 | 12.8% |
| $150,000 to $199,999 | 479 | 16.1% |
| $200,000+ | 1,250 | 42.0% |
Household Income by Householder Age in Croton On Hudson
The median household income in Croton On Hudson is $166,087, with the highest median household income of $206,163 found in the 45 to 64 years age bracket for the primary householder. A total of 1,536 households (51.6%) fall into this category. Meanwhile, the 15 to 24 years age bracket for the primary householder has the lowest median household income of $50,357, with 36 households (1.2%) in this group.
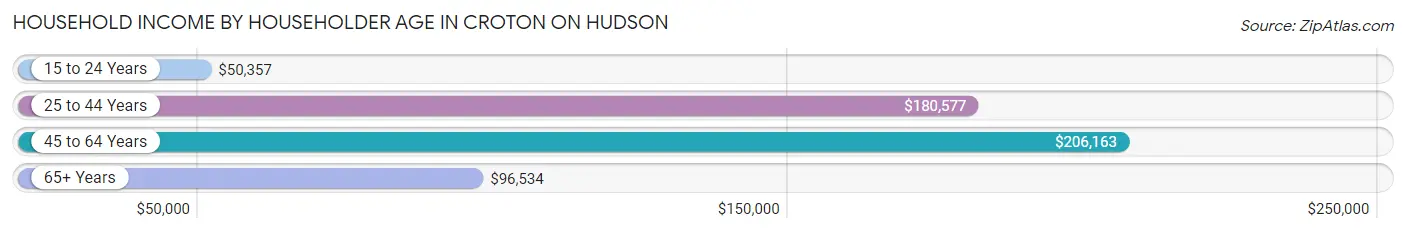
| Income Bracket | # Households | Median Income |
| 15 to 24 Years | 36 (1.2%) | $50,357 |
| 25 to 44 Years | 612 (20.6%) | $180,577 |
| 45 to 64 Years | 1,536 (51.6%) | $206,163 |
| 65+ Years | 792 (26.6%) | $96,534 |
| Total | 2,976 (100.0%) | $166,087 |
Poverty in Croton On Hudson
Income Below Poverty by Sex and Age in Croton On Hudson
With 3.7% poverty level for males and 1.8% for females among the residents of Croton On Hudson, 75 year old and over males and 75 year old and over females are the most vulnerable to poverty, with 20 males (9.6%) and 32 females (9.6%) in their respective age groups living below the poverty level.
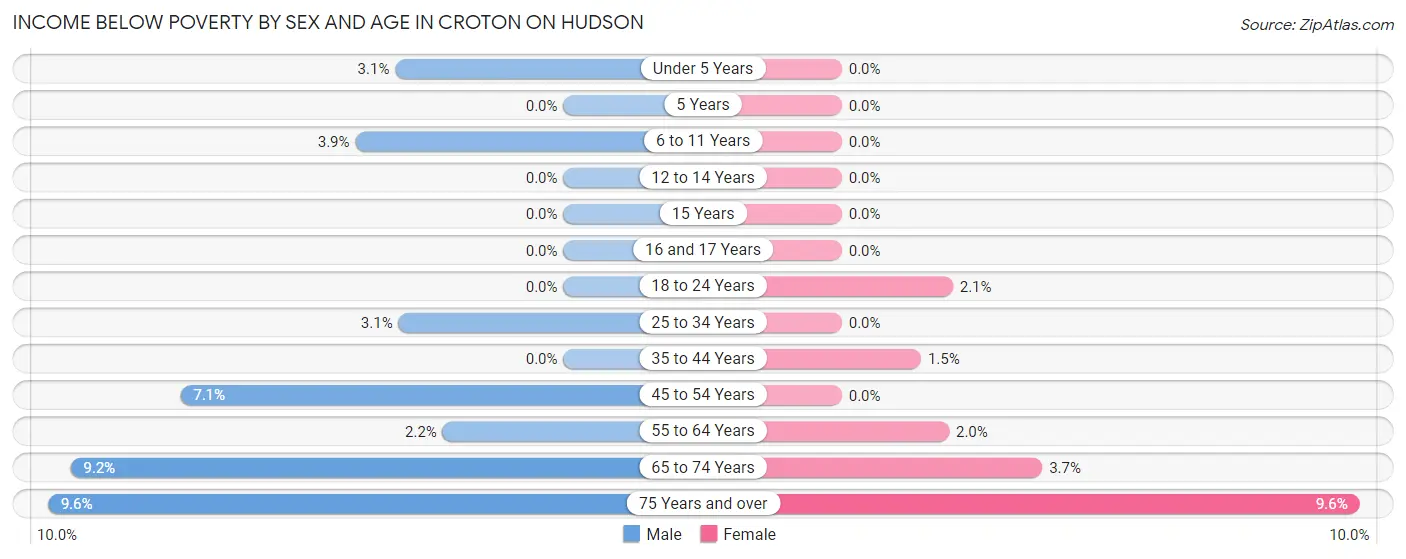
| Age Bracket | Male | Female |
| Under 5 Years | 7 (3.1%) | 0 (0.0%) |
| 5 Years | 0 (0.0%) | 0 (0.0%) |
| 6 to 11 Years | 9 (3.9%) | 0 (0.0%) |
| 12 to 14 Years | 0 (0.0%) | 0 (0.0%) |
| 15 Years | 0 (0.0%) | 0 (0.0%) |
| 16 and 17 Years | 0 (0.0%) | 0 (0.0%) |
| 18 to 24 Years | 0 (0.0%) | 7 (2.1%) |
| 25 to 34 Years | 10 (3.1%) | 0 (0.0%) |
| 35 to 44 Years | 0 (0.0%) | 8 (1.5%) |
| 45 to 54 Years | 41 (7.1%) | 0 (0.0%) |
| 55 to 64 Years | 15 (2.2%) | 15 (2.0%) |
| 65 to 74 Years | 43 (9.1%) | 15 (3.7%) |
| 75 Years and over | 20 (9.6%) | 32 (9.6%) |
| Total | 145 (3.7%) | 77 (1.8%) |
Income Above Poverty by Sex and Age in Croton On Hudson
According to the poverty statistics in Croton On Hudson, males aged 5 years and females aged under 5 years are the age groups that are most secure financially, with 100.0% of males and 100.0% of females in these age groups living above the poverty line.
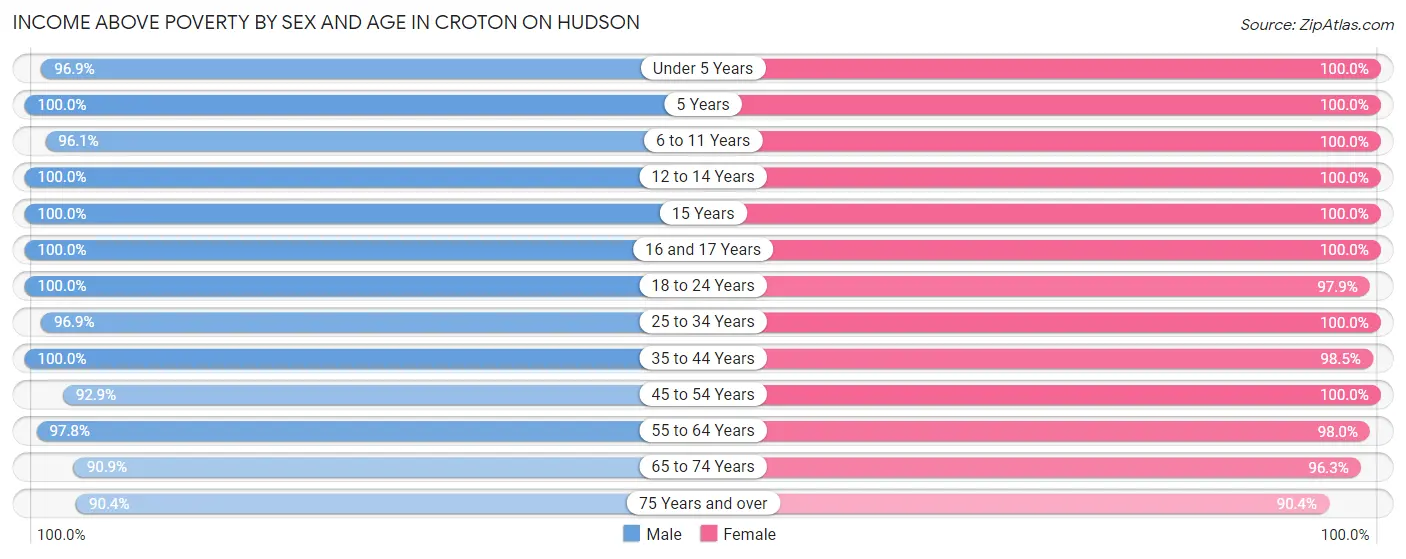
| Age Bracket | Male | Female |
| Under 5 Years | 217 (96.9%) | 231 (100.0%) |
| 5 Years | 66 (100.0%) | 79 (100.0%) |
| 6 to 11 Years | 224 (96.1%) | 442 (100.0%) |
| 12 to 14 Years | 178 (100.0%) | 140 (100.0%) |
| 15 Years | 28 (100.0%) | 17 (100.0%) |
| 16 and 17 Years | 140 (100.0%) | 128 (100.0%) |
| 18 to 24 Years | 337 (100.0%) | 332 (97.9%) |
| 25 to 34 Years | 317 (96.9%) | 165 (100.0%) |
| 35 to 44 Years | 447 (100.0%) | 538 (98.5%) |
| 45 to 54 Years | 536 (92.9%) | 601 (100.0%) |
| 55 to 64 Years | 656 (97.8%) | 737 (98.0%) |
| 65 to 74 Years | 427 (90.8%) | 388 (96.3%) |
| 75 Years and over | 189 (90.4%) | 301 (90.4%) |
| Total | 3,762 (96.3%) | 4,099 (98.2%) |
Income Below Poverty Among Married-Couple Families in Croton On Hudson
The poverty statistics for married-couple families in Croton On Hudson show that 1.6% or 30 of the total 1,898 families live below the poverty line. Families with no children have the highest poverty rate of 3.0%, comprising of 30 families. On the other hand, families with 1 or 2 children have the lowest poverty rate of 0.0%, which includes 0 families.
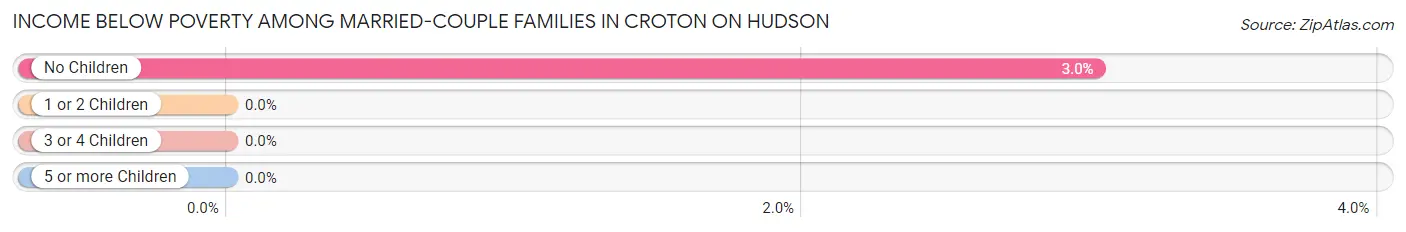
| Children | Above Poverty | Below Poverty |
| No Children | 963 (97.0%) | 30 (3.0%) |
| 1 or 2 Children | 751 (100.0%) | 0 (0.0%) |
| 3 or 4 Children | 154 (100.0%) | 0 (0.0%) |
| 5 or more Children | 0 (0.0%) | 0 (0.0%) |
| Total | 1,868 (98.4%) | 30 (1.6%) |
Income Below Poverty Among Single-Parent Households in Croton On Hudson
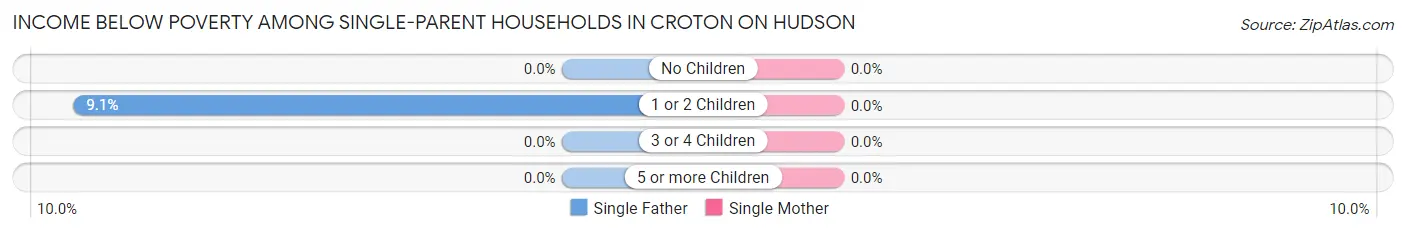
| Children | Single Father | Single Mother |
| No Children | 0 (0.0%) | 0 (0.0%) |
| 1 or 2 Children | 10 (9.1%) | 0 (0.0%) |
| 3 or 4 Children | 0 (0.0%) | 0 (0.0%) |
| 5 or more Children | 0 (0.0%) | 0 (0.0%) |
| Total | 10 (5.9%) | 0 (0.0%) |
Income Below Poverty Among Married-Couple vs Single-Parent Households in Croton On Hudson
The poverty data for Croton On Hudson shows that 30 of the married-couple family households (1.6%) and 10 of the single-parent households (2.8%) are living below the poverty level. Within the married-couple family households, those with no children have the highest poverty rate, with 30 households (3.0%) falling below the poverty line. Among the single-parent households, those with 1 or 2 children have the highest poverty rate, with 10 household (4.2%) living below poverty.
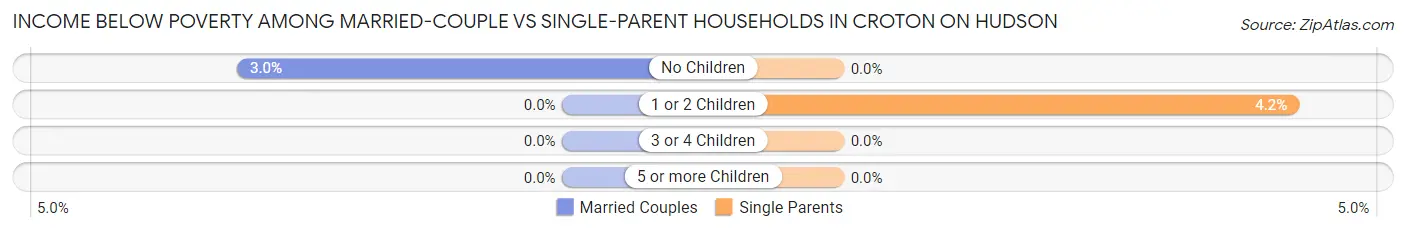
| Children | Married-Couple Families | Single-Parent Households |
| No Children | 30 (3.0%) | 0 (0.0%) |
| 1 or 2 Children | 0 (0.0%) | 10 (4.2%) |
| 3 or 4 Children | 0 (0.0%) | 0 (0.0%) |
| 5 or more Children | 0 (0.0%) | 0 (0.0%) |
| Total | 30 (1.6%) | 10 (2.8%) |
Race in Croton On Hudson
The most populous races in Croton On Hudson are White / Caucasian (6,988 | 84.8%), Hispanic or Latino (999 | 12.1%), and Some other Race (493 | 6.0%).
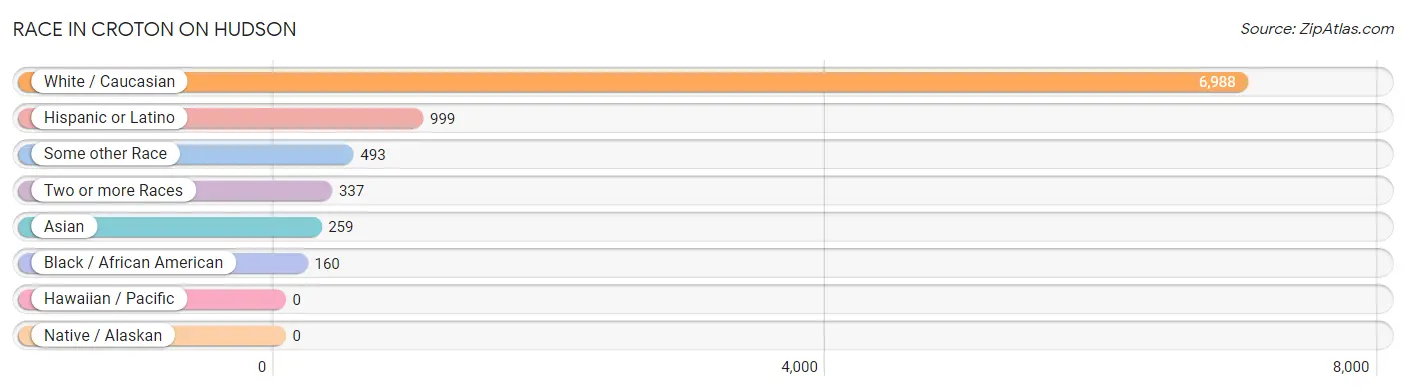
| Race | # Population | % Population |
| Asian | 259 | 3.1% |
| Black / African American | 160 | 1.9% |
| Hawaiian / Pacific | 0 | 0.0% |
| Hispanic or Latino | 999 | 12.1% |
| Native / Alaskan | 0 | 0.0% |
| White / Caucasian | 6,988 | 84.8% |
| Two or more Races | 337 | 4.1% |
| Some other Race | 493 | 6.0% |
| Total | 8,237 | 100.0% |
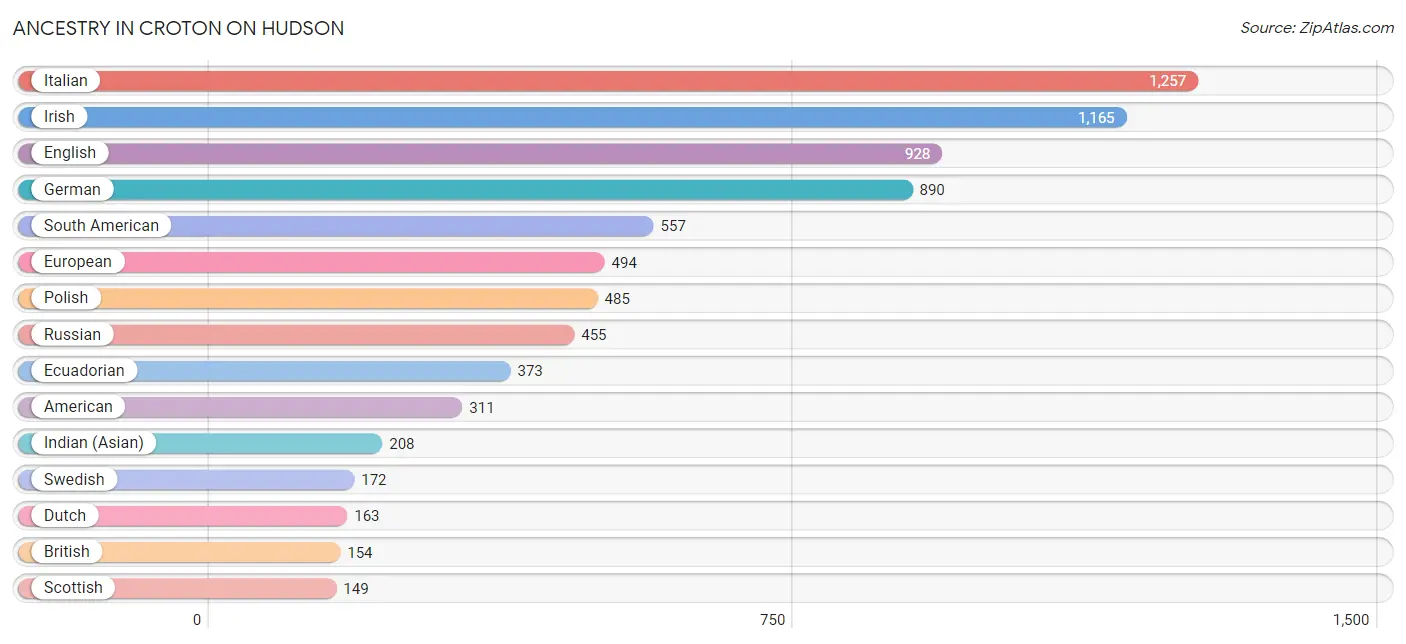
Ancestry in Croton On Hudson
The most populous ancestries reported in Croton On Hudson are Italian (1,257 | 15.3%), Irish (1,165 | 14.1%), English (928 | 11.3%), German (890 | 10.8%), and South American (557 | 6.8%), together accounting for 58.2% of all Croton On Hudson residents.
| Ancestry | # Population | % Population |
| African | 3 | 0.0% |
| Albanian | 6 | 0.1% |
| American | 311 | 3.8% |
| Arab | 35 | 0.4% |
| Argentinean | 14 | 0.2% |
| Australian | 59 | 0.7% |
| Austrian | 53 | 0.6% |
| Bhutanese | 19 | 0.2% |
| Blackfeet | 34 | 0.4% |
| British | 154 | 1.9% |
| Bulgarian | 7 | 0.1% |
| Burmese | 30 | 0.4% |
| Canadian | 8 | 0.1% |
| Central American | 20 | 0.2% |
| Colombian | 73 | 0.9% |
| Cuban | 37 | 0.4% |
| Czech | 43 | 0.5% |
| Danish | 24 | 0.3% |
| Dominican | 43 | 0.5% |
| Dutch | 163 | 2.0% |
| Eastern European | 147 | 1.8% |
| Ecuadorian | 373 | 4.5% |
| English | 928 | 11.3% |
| Estonian | 9 | 0.1% |
| European | 494 | 6.0% |
| French | 105 | 1.3% |
| French Canadian | 4 | 0.1% |
| German | 890 | 10.8% |
| Greek | 15 | 0.2% |
| Guatemalan | 9 | 0.1% |
| Guyanese | 6 | 0.1% |
| Hungarian | 38 | 0.5% |
| Indian (Asian) | 208 | 2.5% |
| Irish | 1,165 | 14.1% |
| Iroquois | 27 | 0.3% |
| Israeli | 36 | 0.4% |
| Italian | 1,257 | 15.3% |
| Jamaican | 20 | 0.2% |
| Jordanian | 8 | 0.1% |
| Korean | 8 | 0.1% |
| Lebanese | 8 | 0.1% |
| Lithuanian | 39 | 0.5% |
| Mexican | 119 | 1.4% |
| Moroccan | 19 | 0.2% |
| Nicaraguan | 11 | 0.1% |
| Northern European | 28 | 0.3% |
| Norwegian | 31 | 0.4% |
| Peruvian | 57 | 0.7% |
| Polish | 485 | 5.9% |
| Portuguese | 19 | 0.2% |
| Puerto Rican | 130 | 1.6% |
| Romanian | 30 | 0.4% |
| Russian | 455 | 5.5% |
| Scotch-Irish | 113 | 1.4% |
| Scottish | 149 | 1.8% |
| Slovak | 15 | 0.2% |
| South American | 557 | 6.8% |
| Spaniard | 36 | 0.4% |
| Sri Lankan | 19 | 0.2% |
| Subsaharan African | 3 | 0.0% |
| Swedish | 172 | 2.1% |
| Swiss | 38 | 0.5% |
| Thai | 53 | 0.6% |
| Ukrainian | 65 | 0.8% |
| Uruguayan | 25 | 0.3% |
| Venezuelan | 15 | 0.2% |
| Welsh | 30 | 0.4% |
| West Indian | 32 | 0.4% |
| Yugoslavian | 28 | 0.3% | View All 69 Rows |
Immigrants in Croton On Hudson
The most numerous immigrant groups reported in Croton On Hudson came from Latin America (397 | 4.8%), Europe (362 | 4.4%), South America (304 | 3.7%), Eastern Europe (201 | 2.4%), and Ecuador (168 | 2.0%), together accounting for 17.4% of all Croton On Hudson residents.
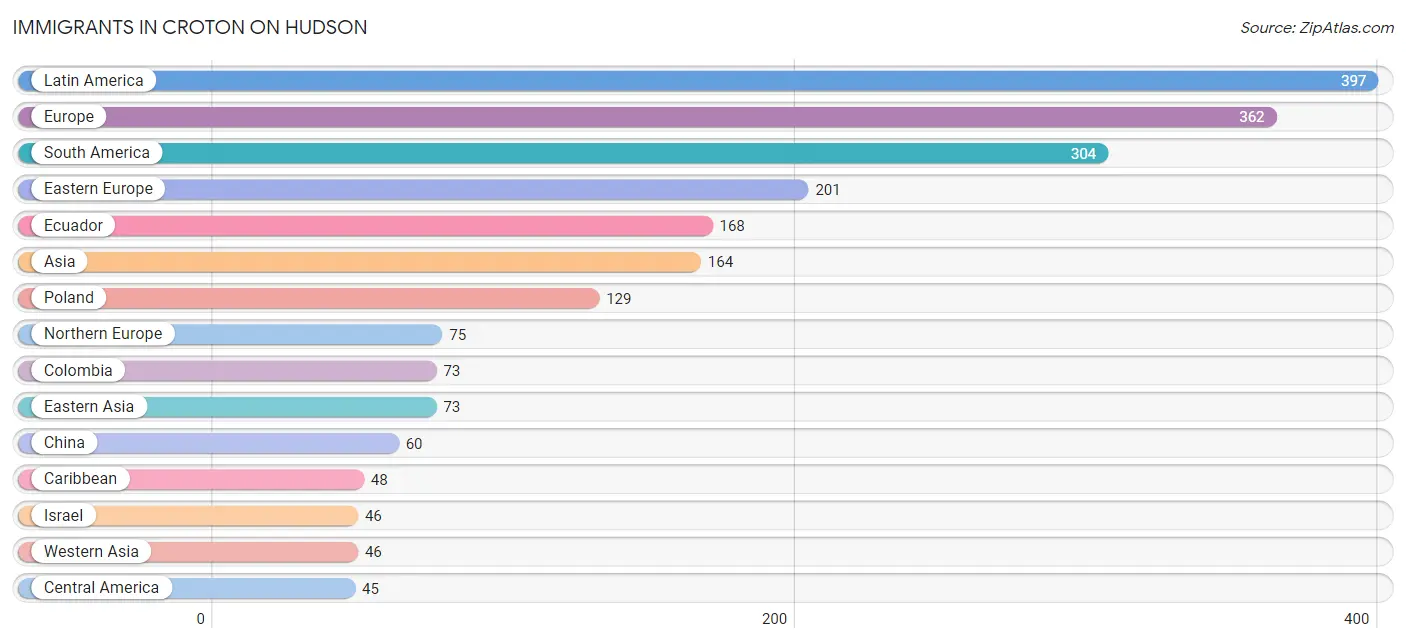
| Immigration Origin | # Population | % Population |
| Africa | 15 | 0.2% |
| Asia | 164 | 2.0% |
| Bosnia and Herzegovina | 28 | 0.3% |
| Bulgaria | 7 | 0.1% |
| Canada | 26 | 0.3% |
| Caribbean | 48 | 0.6% |
| Central America | 45 | 0.5% |
| China | 60 | 0.7% |
| Colombia | 73 | 0.9% |
| Cuba | 6 | 0.1% |
| Czechoslovakia | 21 | 0.3% |
| Dominican Republic | 22 | 0.3% |
| Eastern Africa | 9 | 0.1% |
| Eastern Asia | 73 | 0.9% |
| Eastern Europe | 201 | 2.4% |
| Ecuador | 168 | 2.0% |
| England | 4 | 0.1% |
| Europe | 362 | 4.4% |
| Germany | 31 | 0.4% |
| Greece | 5 | 0.1% |
| Guatemala | 9 | 0.1% |
| Guyana | 6 | 0.1% |
| Hong Kong | 9 | 0.1% |
| India | 31 | 0.4% |
| Iran | 6 | 0.1% |
| Ireland | 42 | 0.5% |
| Israel | 46 | 0.6% |
| Italy | 16 | 0.2% |
| Jamaica | 20 | 0.2% |
| Korea | 13 | 0.2% |
| Latin America | 397 | 4.8% |
| Mexico | 25 | 0.3% |
| Morocco | 6 | 0.1% |
| Nicaragua | 11 | 0.1% |
| Northern Africa | 6 | 0.1% |
| Northern Europe | 75 | 0.9% |
| Peru | 32 | 0.4% |
| Philippines | 8 | 0.1% |
| Poland | 129 | 1.6% |
| Scotland | 10 | 0.1% |
| South America | 304 | 3.7% |
| South Central Asia | 37 | 0.4% |
| South Eastern Asia | 8 | 0.1% |
| Southern Europe | 38 | 0.5% |
| Spain | 17 | 0.2% |
| Taiwan | 3 | 0.0% |
| Ukraine | 7 | 0.1% |
| Uruguay | 25 | 0.3% |
| Western Asia | 46 | 0.6% |
| Western Europe | 31 | 0.4% |
| Zimbabwe | 9 | 0.1% | View All 51 Rows |
Sex and Age in Croton On Hudson
Sex and Age in Croton On Hudson
The most populous age groups in Croton On Hudson are 15 to 19 Years (369 | 9.3%) for men and 55 to 59 Years (387 | 9.1%) for women.
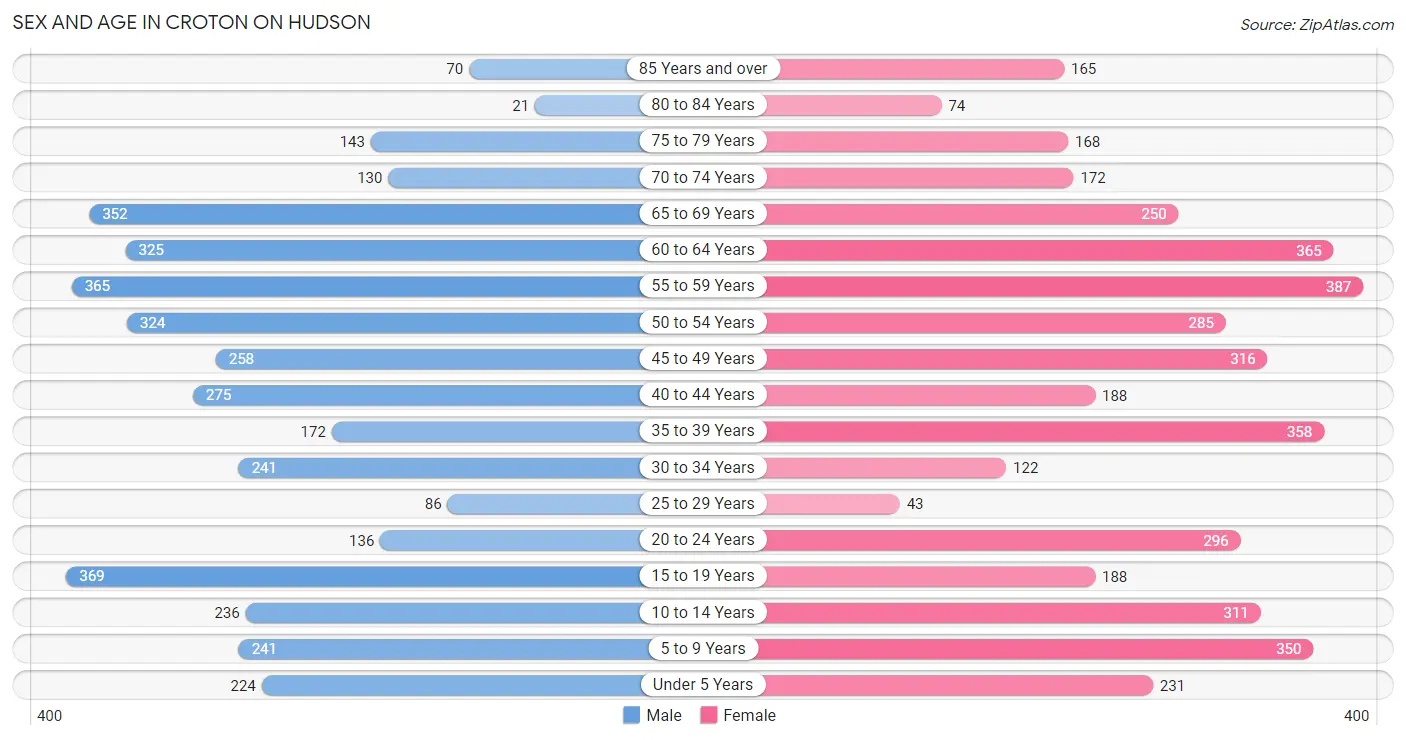
| Age Bracket | Male | Female |
| Under 5 Years | 224 (5.7%) | 231 (5.4%) |
| 5 to 9 Years | 241 (6.1%) | 350 (8.2%) |
| 10 to 14 Years | 236 (5.9%) | 311 (7.3%) |
| 15 to 19 Years | 369 (9.3%) | 188 (4.4%) |
| 20 to 24 Years | 136 (3.4%) | 296 (6.9%) |
| 25 to 29 Years | 86 (2.2%) | 43 (1.0%) |
| 30 to 34 Years | 241 (6.1%) | 122 (2.9%) |
| 35 to 39 Years | 172 (4.3%) | 358 (8.4%) |
| 40 to 44 Years | 275 (6.9%) | 188 (4.4%) |
| 45 to 49 Years | 258 (6.5%) | 316 (7.4%) |
| 50 to 54 Years | 324 (8.2%) | 285 (6.7%) |
| 55 to 59 Years | 365 (9.2%) | 387 (9.1%) |
| 60 to 64 Years | 325 (8.2%) | 365 (8.6%) |
| 65 to 69 Years | 352 (8.9%) | 250 (5.9%) |
| 70 to 74 Years | 130 (3.3%) | 172 (4.0%) |
| 75 to 79 Years | 143 (3.6%) | 168 (3.9%) |
| 80 to 84 Years | 21 (0.5%) | 74 (1.7%) |
| 85 Years and over | 70 (1.8%) | 165 (3.9%) |
| Total | 3,968 (100.0%) | 4,269 (100.0%) |
Families and Households in Croton On Hudson
Median Family Size in Croton On Hudson
The median family size in Croton On Hudson is 3.17 persons per family, with married-couple families (1,898 | 84.1%) accounting for the largest median family size of 3.3 persons per family. On the other hand, single female/mother families (192 | 8.5%) represent the smallest median family size with 2.26 persons per family.
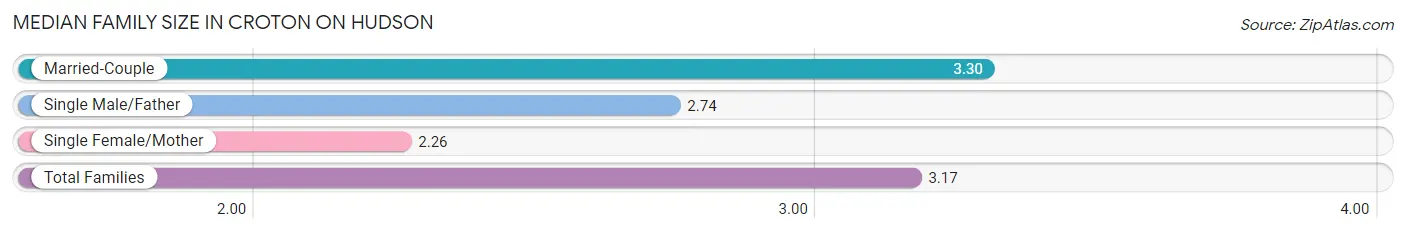
| Family Type | # Families | Family Size |
| Married-Couple | 1,898 (84.1%) | 3.30 |
| Single Male/Father | 168 (7.4%) | 2.74 |
| Single Female/Mother | 192 (8.5%) | 2.26 |
| Total Families | 2,258 (100.0%) | 3.17 |
Median Household Size in Croton On Hudson
The median household size in Croton On Hudson is 2.71 persons per household, with married-couple households (1,898 | 63.8%) accounting for the largest median household size of 3.31 persons per household. non-family households (718 | 24.1%) represent the smallest median household size with 1.15 persons per household.
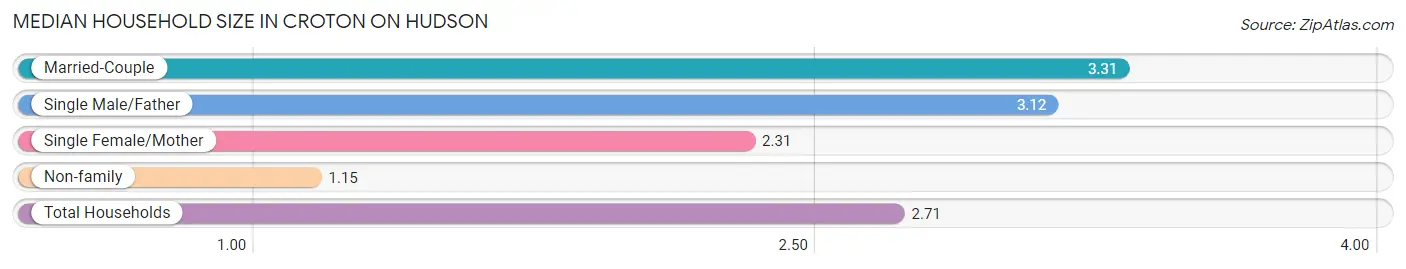
| Household Type | # Households | Household Size |
| Married-Couple | 1,898 (63.8%) | 3.31 |
| Single Male/Father | 168 (5.7%) | 3.12 |
| Single Female/Mother | 192 (6.5%) | 2.31 |
| Non-family | 718 (24.1%) | 1.15 |
| Total Households | 2,976 (100.0%) | 2.71 |
Household Size by Marriage Status in Croton On Hudson
Out of a total of 2,976 households in Croton On Hudson, 2,258 (75.9%) are family households, while 718 (24.1%) are nonfamily households. The most numerous type of family households are 2-person households, comprising 754, and the most common type of nonfamily households are 1-person households, comprising 619.
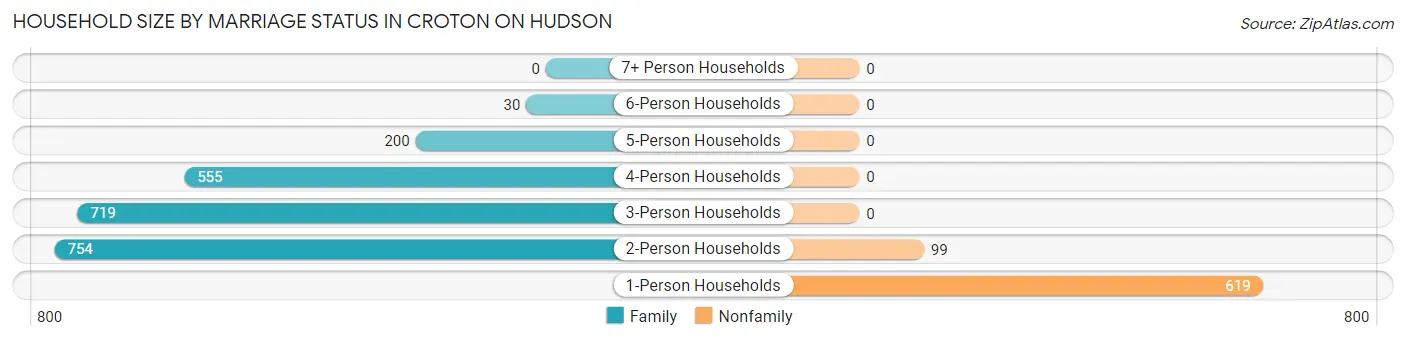
| Household Size | Family Households | Nonfamily Households |
| 1-Person Households | - | 619 (20.8%) |
| 2-Person Households | 754 (25.3%) | 99 (3.3%) |
| 3-Person Households | 719 (24.2%) | 0 (0.0%) |
| 4-Person Households | 555 (18.6%) | 0 (0.0%) |
| 5-Person Households | 200 (6.7%) | 0 (0.0%) |
| 6-Person Households | 30 (1.0%) | 0 (0.0%) |
| 7+ Person Households | 0 (0.0%) | 0 (0.0%) |
| Total | 2,258 (75.9%) | 718 (24.1%) |
Female Fertility in Croton On Hudson
Fertility by Age in Croton On Hudson
Average fertility rate in Croton On Hudson is 67.0 births per 1,000 women. Women in the age bracket of 35 to 50 years have the highest fertility rate with 86.0 births per 1,000 women. Women in the age bracket of 35 to 50 years acount for 76.6% of all women with births.
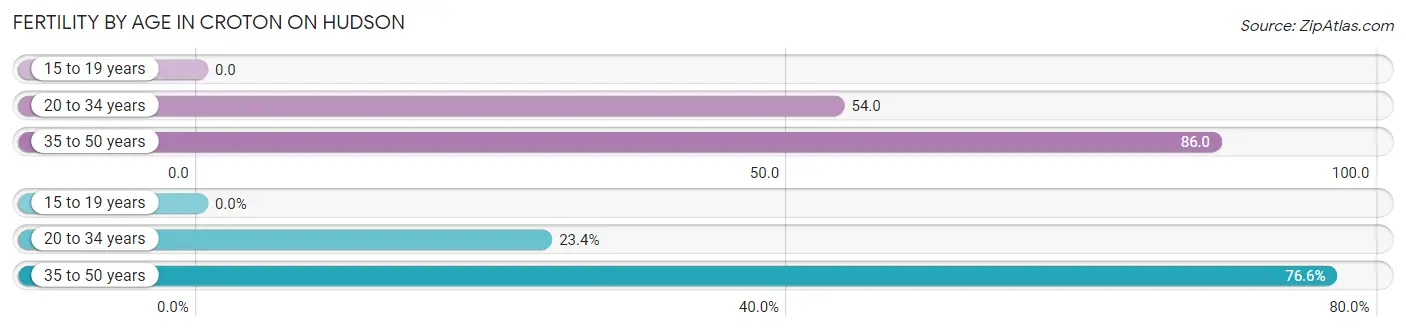
| Age Bracket | Women with Births | Births / 1,000 Women |
| 15 to 19 years | 0 (0.0%) | 0.0 |
| 20 to 34 years | 25 (23.4%) | 54.0 |
| 35 to 50 years | 82 (76.6%) | 86.0 |
| Total | 107 (100.0%) | 67.0 |
Fertility by Age by Marriage Status in Croton On Hudson
88.8% of women with births (107) in Croton On Hudson are married. The highest percentage of unmarried women with births falls into 20 to 34 years age bracket with 48.0% of them unmarried at the time of birth, while the lowest percentage of unmarried women with births belong to 35 to 50 years age bracket with 0.0% of them unmarried.
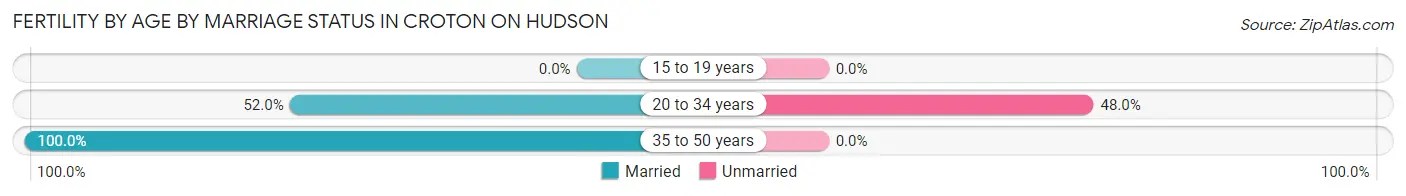
| Age Bracket | Married | Unmarried |
| 15 to 19 years | 0 (0.0%) | 0 (0.0%) |
| 20 to 34 years | 13 (52.0%) | 12 (48.0%) |
| 35 to 50 years | 82 (100.0%) | 0 (0.0%) |
| Total | 95 (88.8%) | 12 (11.2%) |
Fertility by Education in Croton On Hudson
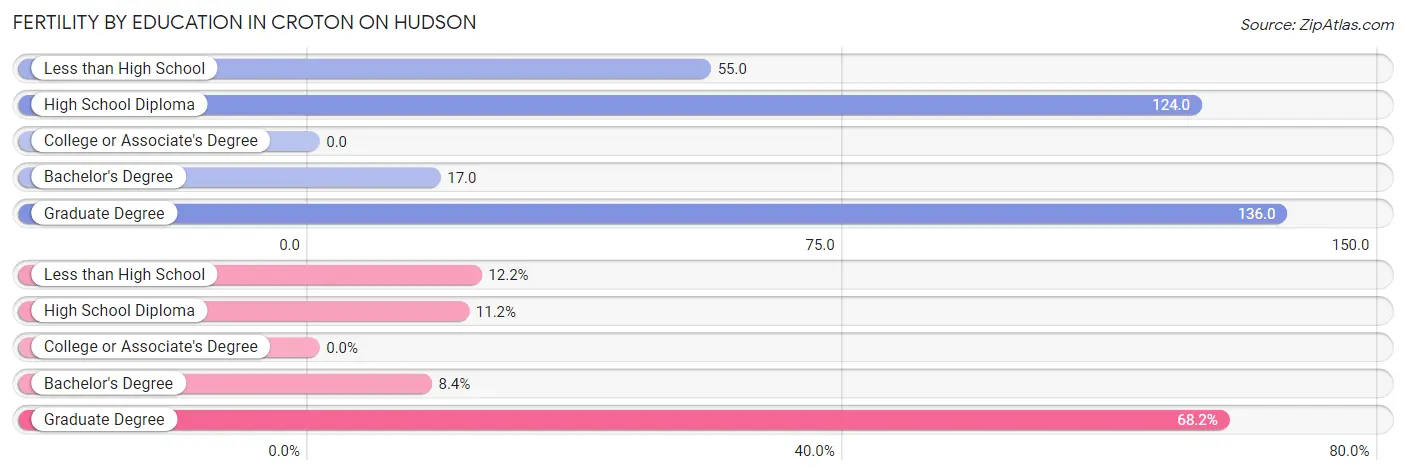
| Educational Attainment | Women with Births | Births / 1,000 Women |
| Less than High School | 13 (12.1%) | 55.0 |
| High School Diploma | 12 (11.2%) | 124.0 |
| College or Associate's Degree | 0 (0.0%) | 0.0 |
| Bachelor's Degree | 9 (8.4%) | 17.0 |
| Graduate Degree | 73 (68.2%) | 136.0 |
| Total | 107 (100.0%) | 67.0 |
Fertility by Education by Marriage Status in Croton On Hudson
11.2% of women with births in Croton On Hudson are unmarried. Women with the educational attainment of less than high school are most likely to be married with 100.0% of them married at childbirth, while women with the educational attainment of high school diploma are least likely to be married with 100.0% of them unmarried at childbirth.
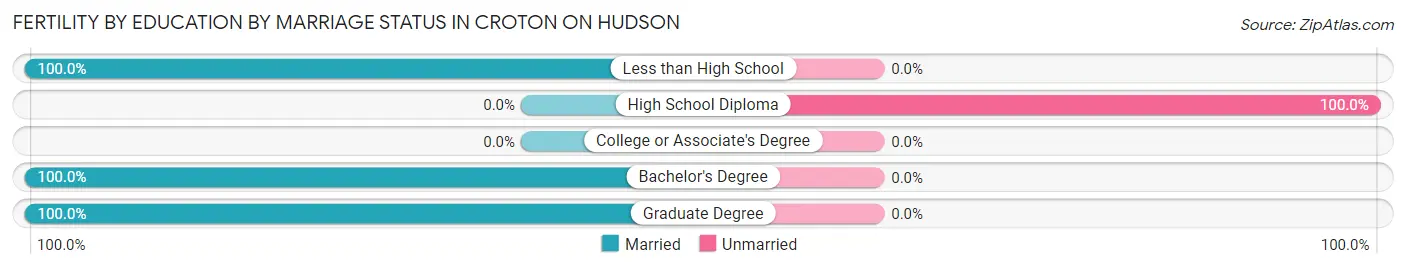
| Educational Attainment | Married | Unmarried |
| Less than High School | 13 (100.0%) | 0 (0.0%) |
| High School Diploma | 0 (0.0%) | 12 (100.0%) |
| College or Associate's Degree | 0 (0.0%) | 0 (0.0%) |
| Bachelor's Degree | 9 (100.0%) | 0 (0.0%) |
| Graduate Degree | 73 (100.0%) | 0 (0.0%) |
| Total | 95 (88.8%) | 12 (11.2%) |
Employment Characteristics in Croton On Hudson
Employment by Class of Employer in Croton On Hudson
Among the 4,028 employed individuals in Croton On Hudson, private company employees (2,429 | 60.3%), not-for-profit organizations (549 | 13.6%), and local government employees (458 | 11.4%) make up the most common classes of employment.
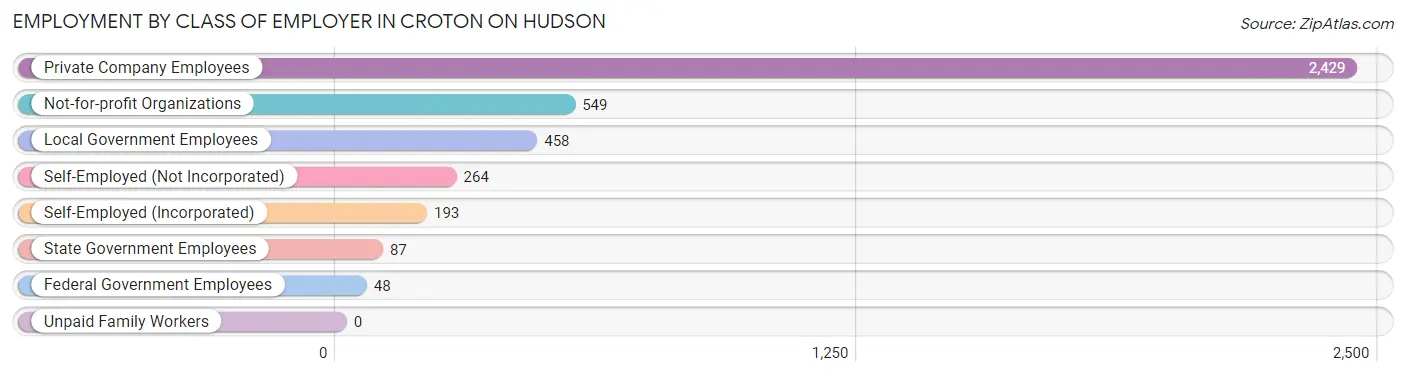
| Employer Class | # Employees | % Employees |
| Private Company Employees | 2,429 | 60.3% |
| Self-Employed (Incorporated) | 193 | 4.8% |
| Self-Employed (Not Incorporated) | 264 | 6.6% |
| Not-for-profit Organizations | 549 | 13.6% |
| Local Government Employees | 458 | 11.4% |
| State Government Employees | 87 | 2.2% |
| Federal Government Employees | 48 | 1.2% |
| Unpaid Family Workers | 0 | 0.0% |
| Total | 4,028 | 100.0% |
Employment Status by Age in Croton On Hudson
According to the labor force statistics for Croton On Hudson, out of the total population over 16 years of age (6,599), 68.7% or 4,534 individuals are in the labor force, with 7.7% or 349 of them unemployed. The age group with the highest labor force participation rate is 35 to 44 years, with 95.9% or 952 individuals in the labor force. Within the labor force, the 25 to 29 years age range has the highest percentage of unemployed individuals, with 23.6% or 26 of them being unemployed.
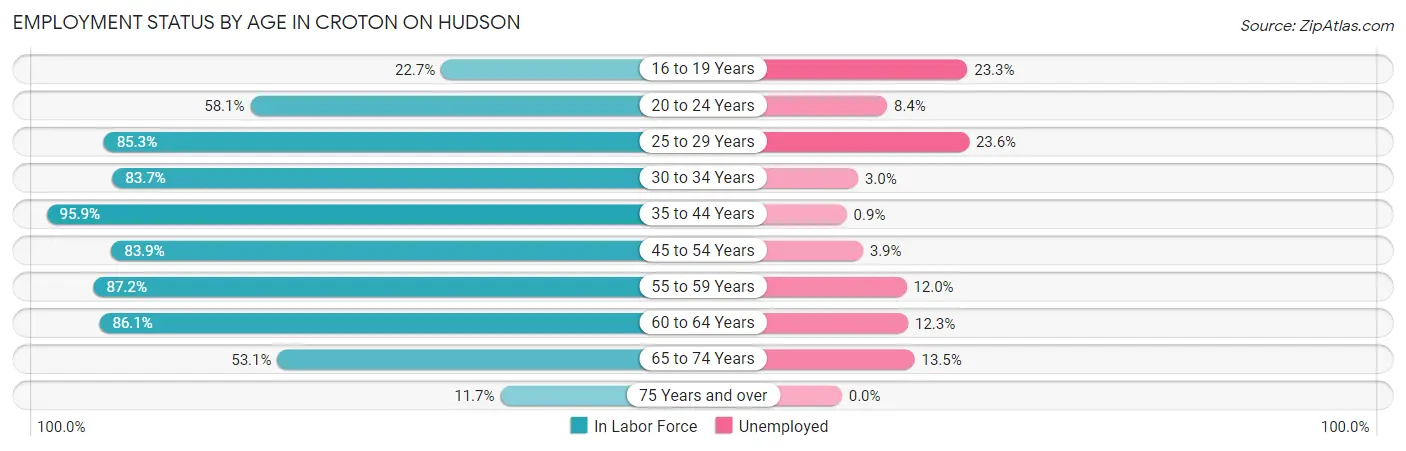
| Age Bracket | In Labor Force | Unemployed |
| 16 to 19 Years | 116 (22.7%) | 27 (23.3%) |
| 20 to 24 Years | 251 (58.1%) | 21 (8.4%) |
| 25 to 29 Years | 110 (85.3%) | 26 (23.6%) |
| 30 to 34 Years | 304 (83.7%) | 9 (3.0%) |
| 35 to 44 Years | 952 (95.9%) | 9 (0.9%) |
| 45 to 54 Years | 993 (83.9%) | 39 (3.9%) |
| 55 to 59 Years | 656 (87.2%) | 79 (12.0%) |
| 60 to 64 Years | 594 (86.1%) | 73 (12.3%) |
| 65 to 74 Years | 480 (53.1%) | 65 (13.5%) |
| 75 Years and over | 75 (11.7%) | 0 (0.0%) |
| Total | 4,534 (68.7%) | 349 (7.7%) |
Employment Status by Educational Attainment in Croton On Hudson
According to labor force statistics for Croton On Hudson, 87.8% of individuals (3,609) out of the total population between 25 and 64 years of age (4,110) are in the labor force, with 6.5% or 235 of them being unemployed. The group with the highest labor force participation rate are those with the educational attainment of bachelor's degree or higher, with 91.1% or 2,711 individuals in the labor force. Within the labor force, individuals with college / associate degree education have the highest percentage of unemployment, with 15.2% or 89 of them being unemployed.
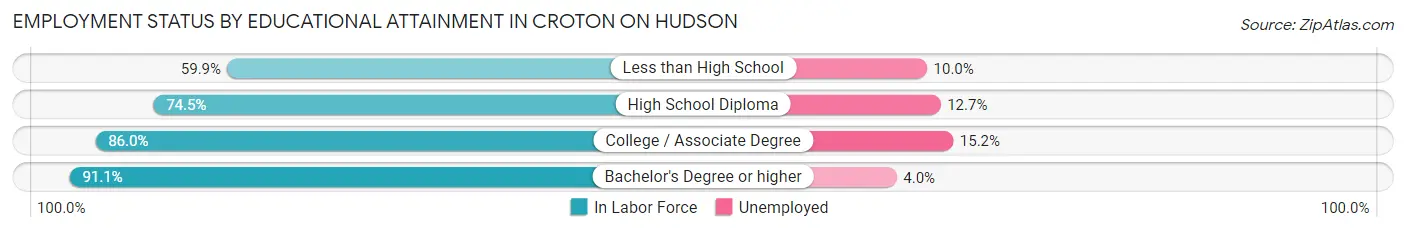
| Educational Attainment | In Labor Force | Unemployed |
| Less than High School | 100 (59.9%) | 17 (10.0%) |
| High School Diploma | 213 (74.5%) | 36 (12.7%) |
| College / Associate Degree | 586 (86.0%) | 104 (15.2%) |
| Bachelor's Degree or higher | 2,711 (91.1%) | 119 (4.0%) |
| Total | 3,609 (87.8%) | 267 (6.5%) |
Employment Occupations by Sex in Croton On Hudson
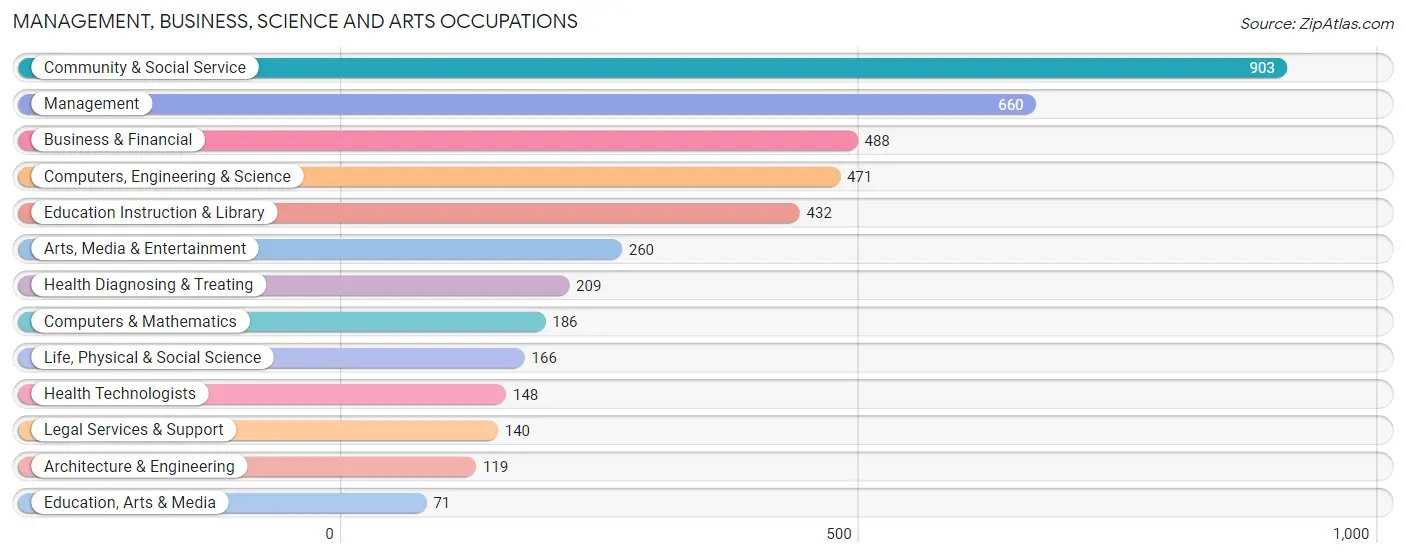
Management, Business, Science and Arts Occupations
The most common Management, Business, Science and Arts occupations in Croton On Hudson are Community & Social Service (903 | 21.6%), Management (660 | 15.8%), Business & Financial (488 | 11.7%), Computers, Engineering & Science (471 | 11.3%), and Education Instruction & Library (432 | 10.3%).
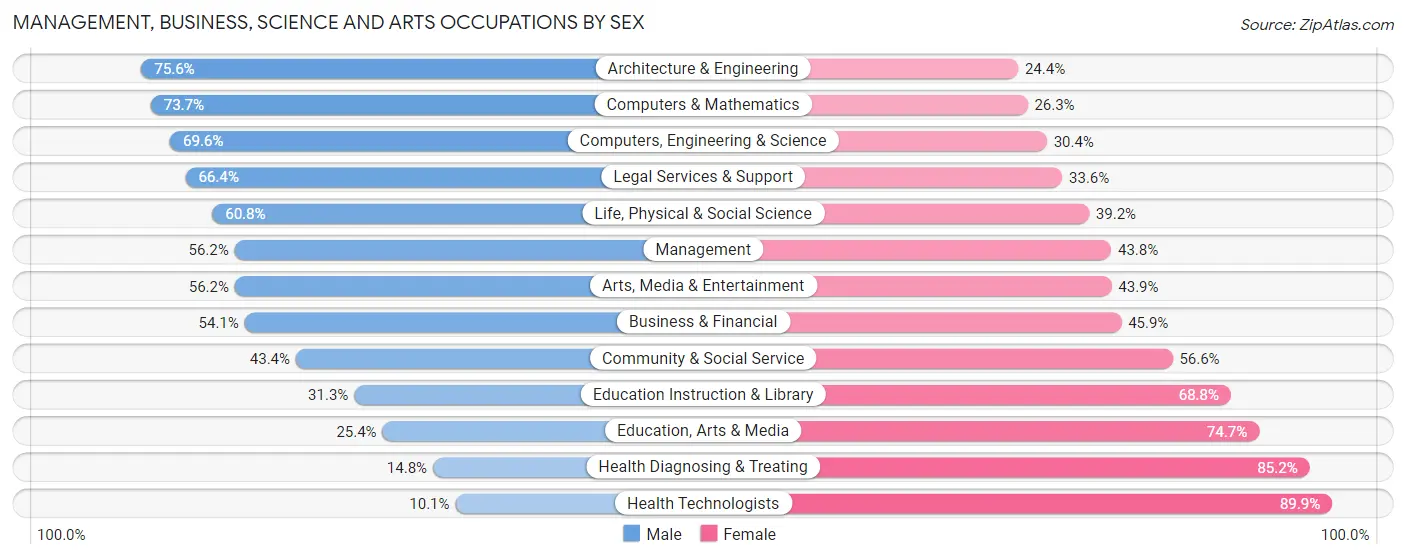
Management, Business, Science and Arts Occupations by Sex
Within the Management, Business, Science and Arts occupations in Croton On Hudson, the most male-oriented occupations are Architecture & Engineering (75.6%), Computers & Mathematics (73.7%), and Computers, Engineering & Science (69.6%), while the most female-oriented occupations are Health Technologists (89.9%), Health Diagnosing & Treating (85.2%), and Education, Arts & Media (74.7%).
| Occupation | Male | Female |
| Management | 371 (56.2%) | 289 (43.8%) |
| Business & Financial | 264 (54.1%) | 224 (45.9%) |
| Computers, Engineering & Science | 328 (69.6%) | 143 (30.4%) |
| Computers & Mathematics | 137 (73.7%) | 49 (26.3%) |
| Architecture & Engineering | 90 (75.6%) | 29 (24.4%) |
| Life, Physical & Social Science | 101 (60.8%) | 65 (39.2%) |
| Community & Social Service | 392 (43.4%) | 511 (56.6%) |
| Education, Arts & Media | 18 (25.4%) | 53 (74.7%) |
| Legal Services & Support | 93 (66.4%) | 47 (33.6%) |
| Education Instruction & Library | 135 (31.2%) | 297 (68.8%) |
| Arts, Media & Entertainment | 146 (56.1%) | 114 (43.9%) |
| Health Diagnosing & Treating | 31 (14.8%) | 178 (85.2%) |
| Health Technologists | 15 (10.1%) | 133 (89.9%) |
| Total (Category) | 1,386 (50.7%) | 1,345 (49.2%) |
| Total (Overall) | 2,162 (51.7%) | 2,021 (48.3%) |
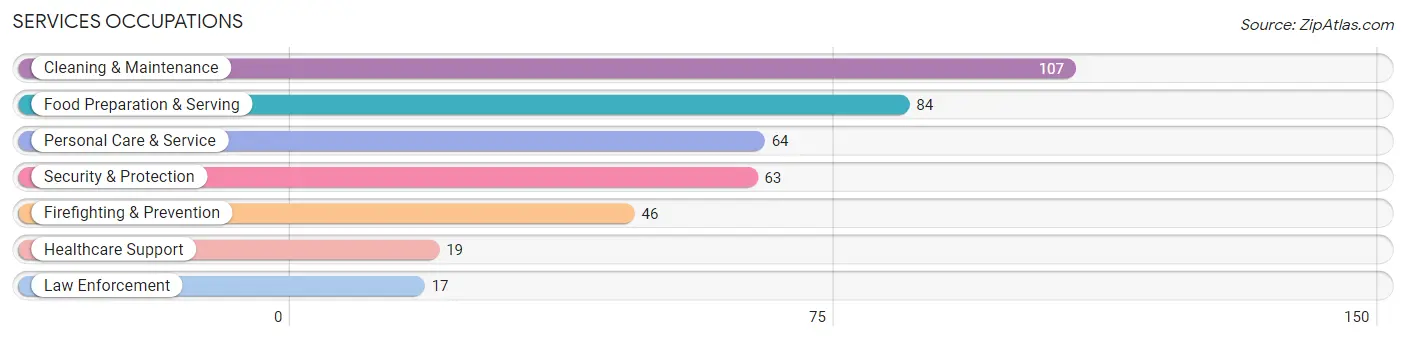
Services Occupations
The most common Services occupations in Croton On Hudson are Cleaning & Maintenance (107 | 2.6%), Food Preparation & Serving (84 | 2.0%), Personal Care & Service (64 | 1.5%), Security & Protection (63 | 1.5%), and Firefighting & Prevention (46 | 1.1%).
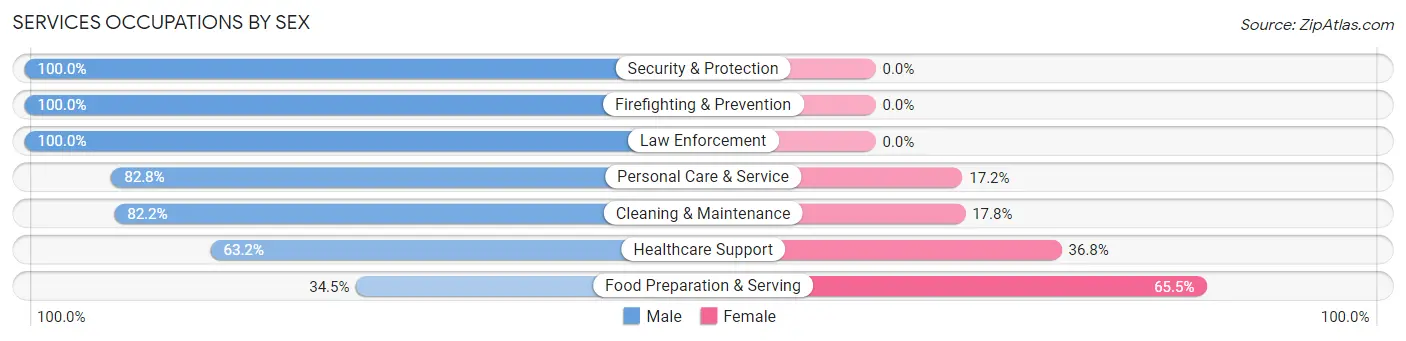
Services Occupations by Sex
Within the Services occupations in Croton On Hudson, the most male-oriented occupations are Security & Protection (100.0%), Firefighting & Prevention (100.0%), and Law Enforcement (100.0%), while the most female-oriented occupations are Food Preparation & Serving (65.5%), Healthcare Support (36.8%), and Cleaning & Maintenance (17.8%).
| Occupation | Male | Female |
| Healthcare Support | 12 (63.2%) | 7 (36.8%) |
| Security & Protection | 63 (100.0%) | 0 (0.0%) |
| Firefighting & Prevention | 46 (100.0%) | 0 (0.0%) |
| Law Enforcement | 17 (100.0%) | 0 (0.0%) |
| Food Preparation & Serving | 29 (34.5%) | 55 (65.5%) |
| Cleaning & Maintenance | 88 (82.2%) | 19 (17.8%) |
| Personal Care & Service | 53 (82.8%) | 11 (17.2%) |
| Total (Category) | 245 (72.7%) | 92 (27.3%) |
| Total (Overall) | 2,162 (51.7%) | 2,021 (48.3%) |
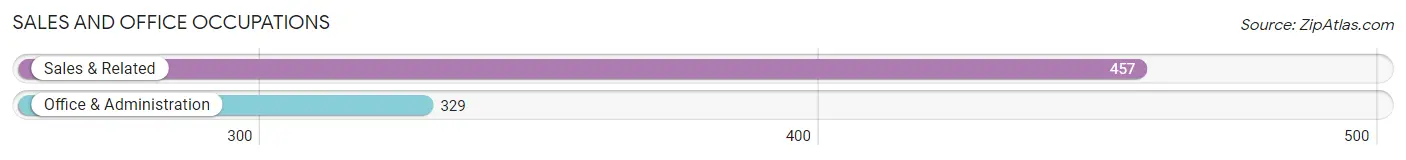
Sales and Office Occupations
The most common Sales and Office occupations in Croton On Hudson are Sales & Related (457 | 10.9%), and Office & Administration (329 | 7.9%).
Sales and Office Occupations by Sex
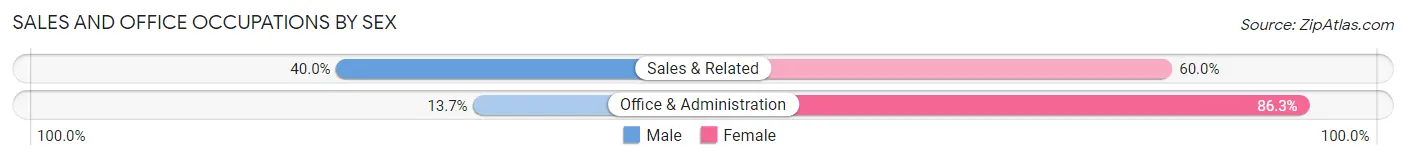
| Occupation | Male | Female |
| Sales & Related | 183 (40.0%) | 274 (60.0%) |
| Office & Administration | 45 (13.7%) | 284 (86.3%) |
| Total (Category) | 228 (29.0%) | 558 (71.0%) |
| Total (Overall) | 2,162 (51.7%) | 2,021 (48.3%) |
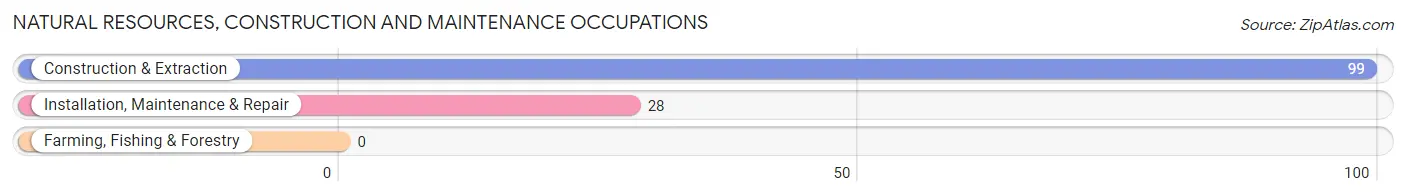
Natural Resources, Construction and Maintenance Occupations
The most common Natural Resources, Construction and Maintenance occupations in Croton On Hudson are Construction & Extraction (99 | 2.4%), and Installation, Maintenance & Repair (28 | 0.7%).
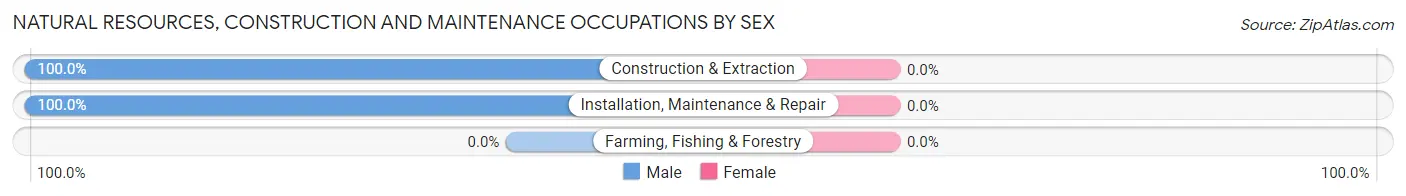
Natural Resources, Construction and Maintenance Occupations by Sex
| Occupation | Male | Female |
| Farming, Fishing & Forestry | 0 (0.0%) | 0 (0.0%) |
| Construction & Extraction | 99 (100.0%) | 0 (0.0%) |
| Installation, Maintenance & Repair | 28 (100.0%) | 0 (0.0%) |
| Total (Category) | 127 (100.0%) | 0 (0.0%) |
| Total (Overall) | 2,162 (51.7%) | 2,021 (48.3%) |
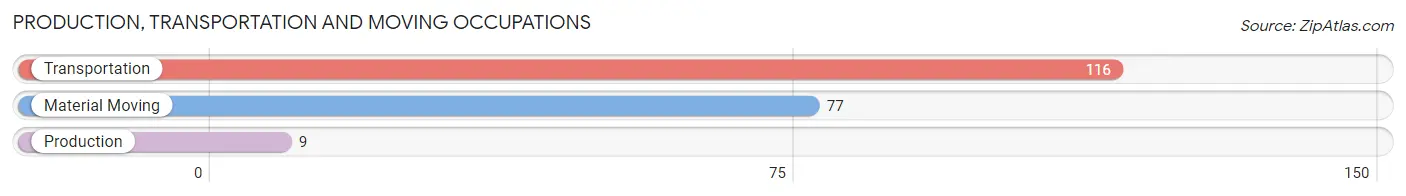
Production, Transportation and Moving Occupations
The most common Production, Transportation and Moving occupations in Croton On Hudson are Transportation (116 | 2.8%), Material Moving (77 | 1.8%), and Production (9 | 0.2%).
Production, Transportation and Moving Occupations by Sex
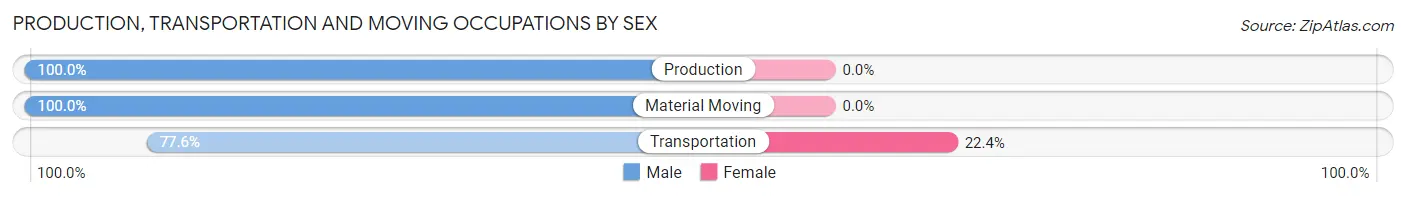
| Occupation | Male | Female |
| Production | 9 (100.0%) | 0 (0.0%) |
| Transportation | 90 (77.6%) | 26 (22.4%) |
| Material Moving | 77 (100.0%) | 0 (0.0%) |
| Total (Category) | 176 (87.1%) | 26 (12.9%) |
| Total (Overall) | 2,162 (51.7%) | 2,021 (48.3%) |
Employment Industries by Sex in Croton On Hudson
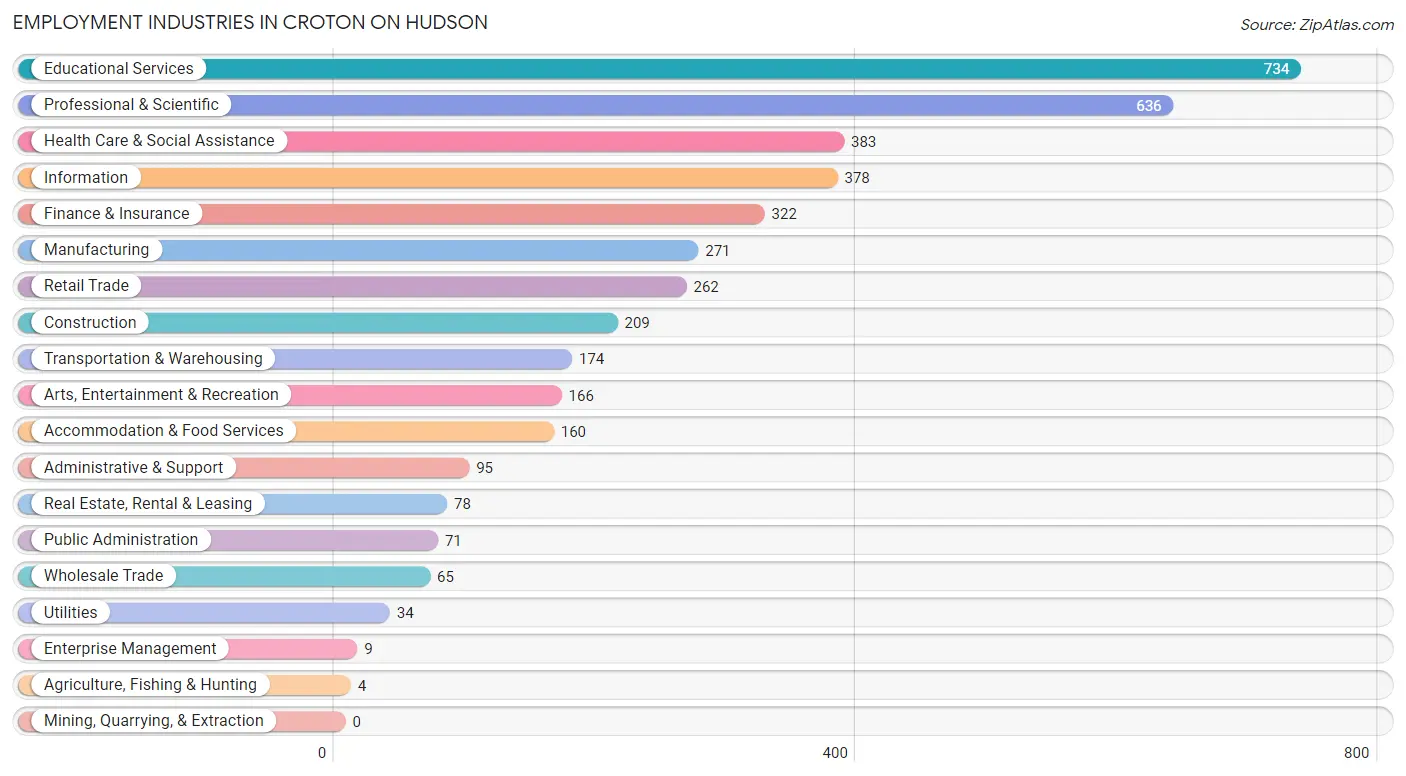
Employment Industries in Croton On Hudson
The major employment industries in Croton On Hudson include Educational Services (734 | 17.5%), Professional & Scientific (636 | 15.2%), Health Care & Social Assistance (383 | 9.2%), Information (378 | 9.0%), and Finance & Insurance (322 | 7.7%).
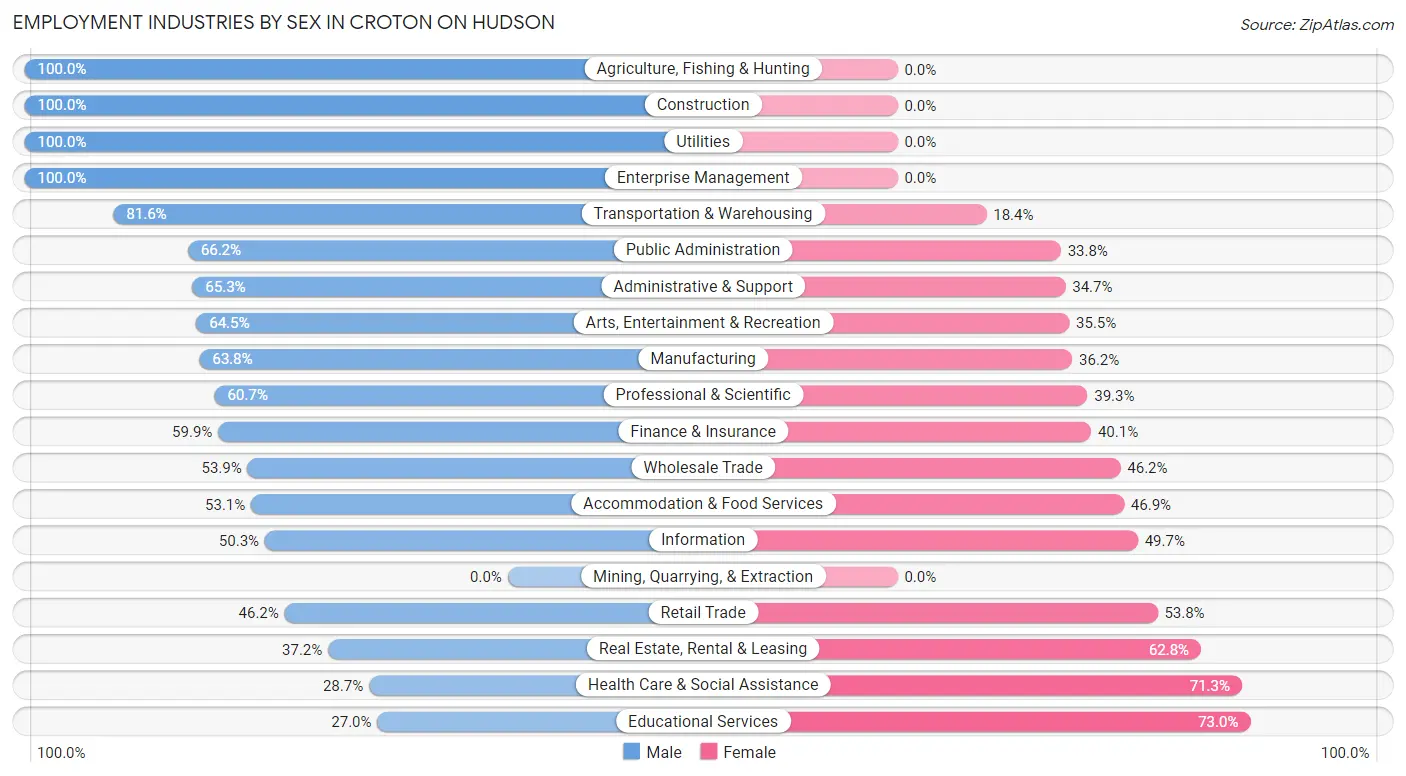
Employment Industries by Sex in Croton On Hudson
The Croton On Hudson industries that see more men than women are Agriculture, Fishing & Hunting (100.0%), Construction (100.0%), and Utilities (100.0%), whereas the industries that tend to have a higher number of women are Educational Services (73.0%), Health Care & Social Assistance (71.3%), and Real Estate, Rental & Leasing (62.8%).
| Industry | Male | Female |
| Agriculture, Fishing & Hunting | 4 (100.0%) | 0 (0.0%) |
| Mining, Quarrying, & Extraction | 0 (0.0%) | 0 (0.0%) |
| Construction | 209 (100.0%) | 0 (0.0%) |
| Manufacturing | 173 (63.8%) | 98 (36.2%) |
| Wholesale Trade | 35 (53.8%) | 30 (46.2%) |
| Retail Trade | 121 (46.2%) | 141 (53.8%) |
| Transportation & Warehousing | 142 (81.6%) | 32 (18.4%) |
| Utilities | 34 (100.0%) | 0 (0.0%) |
| Information | 190 (50.3%) | 188 (49.7%) |
| Finance & Insurance | 193 (59.9%) | 129 (40.1%) |
| Real Estate, Rental & Leasing | 29 (37.2%) | 49 (62.8%) |
| Professional & Scientific | 386 (60.7%) | 250 (39.3%) |
| Enterprise Management | 9 (100.0%) | 0 (0.0%) |
| Administrative & Support | 62 (65.3%) | 33 (34.7%) |
| Educational Services | 198 (27.0%) | 536 (73.0%) |
| Health Care & Social Assistance | 110 (28.7%) | 273 (71.3%) |
| Arts, Entertainment & Recreation | 107 (64.5%) | 59 (35.5%) |
| Accommodation & Food Services | 85 (53.1%) | 75 (46.9%) |
| Public Administration | 47 (66.2%) | 24 (33.8%) |
| Total | 2,162 (51.7%) | 2,021 (48.3%) |
Education in Croton On Hudson
School Enrollment in Croton On Hudson
The most common levels of schooling among the 2,119 students in Croton On Hudson are middle school (478 | 22.6%), high school (434 | 20.5%), and elementary school (414 | 19.5%).
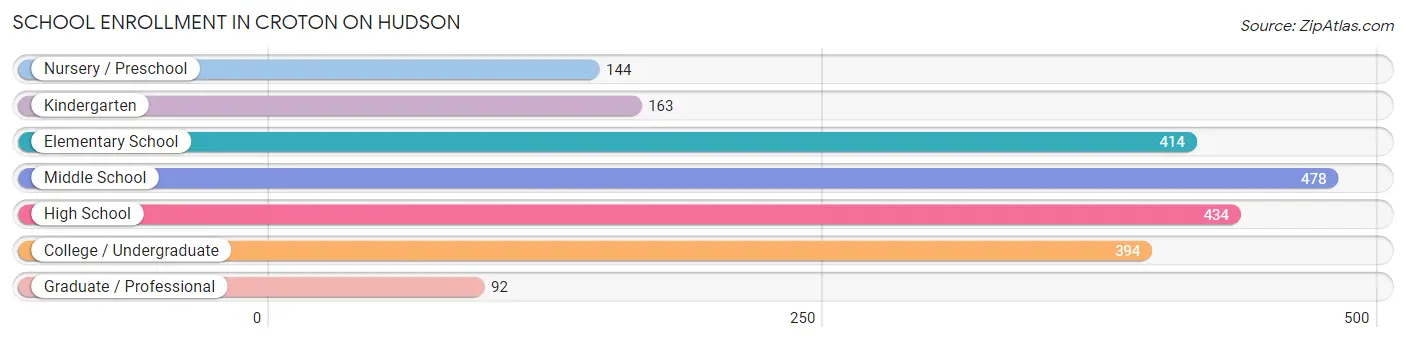
| School Level | # Students | % Students |
| Nursery / Preschool | 144 | 6.8% |
| Kindergarten | 163 | 7.7% |
| Elementary School | 414 | 19.5% |
| Middle School | 478 | 22.6% |
| High School | 434 | 20.5% |
| College / Undergraduate | 394 | 18.6% |
| Graduate / Professional | 92 | 4.3% |
| Total | 2,119 | 100.0% |
School Enrollment by Age by Funding Source in Croton On Hudson
Out of a total of 2,119 students who are enrolled in schools in Croton On Hudson, 428 (20.2%) attend a private institution, while the remaining 1,691 (79.8%) are enrolled in public schools. The age group of 35 years and over has the highest likelihood of being enrolled in private schools, with 51 (79.7% in the age bracket) enrolled. Conversely, the age group of 10 to 14 year olds has the lowest likelihood of being enrolled in a private school, with 538 (98.4% in the age bracket) attending a public institution.
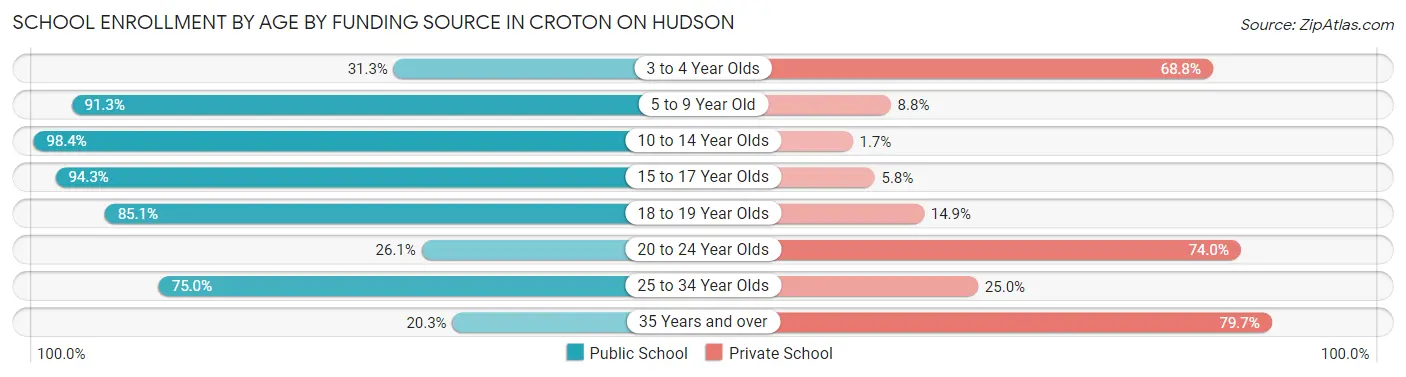
| Age Bracket | Public School | Private School |
| 3 to 4 Year Olds | 45 (31.2%) | 99 (68.8%) |
| 5 to 9 Year Old | 532 (91.2%) | 51 (8.7%) |
| 10 to 14 Year Olds | 538 (98.4%) | 9 (1.7%) |
| 15 to 17 Year Olds | 295 (94.3%) | 18 (5.8%) |
| 18 to 19 Year Olds | 188 (85.1%) | 33 (14.9%) |
| 20 to 24 Year Olds | 56 (26.1%) | 159 (74.0%) |
| 25 to 34 Year Olds | 24 (75.0%) | 8 (25.0%) |
| 35 Years and over | 13 (20.3%) | 51 (79.7%) |
| Total | 1,691 (79.8%) | 428 (20.2%) |
Educational Attainment by Field of Study in Croton On Hudson
Business (614 | 14.3%), visual & performing arts (574 | 13.4%), social sciences (516 | 12.0%), liberal arts & history (449 | 10.5%), and literature & languages (414 | 9.6%) are the most common fields of study among 4,294 individuals in Croton On Hudson who have obtained a bachelor's degree or higher.
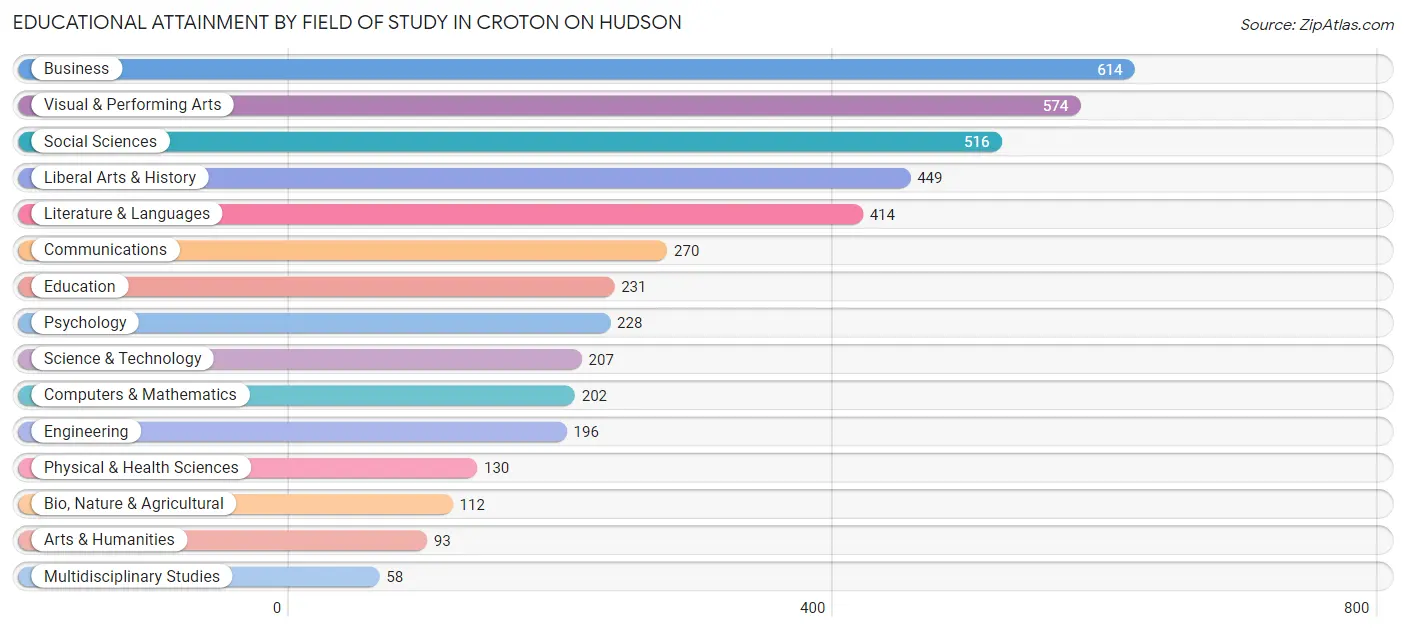
| Field of Study | # Graduates | % Graduates |
| Computers & Mathematics | 202 | 4.7% |
| Bio, Nature & Agricultural | 112 | 2.6% |
| Physical & Health Sciences | 130 | 3.0% |
| Psychology | 228 | 5.3% |
| Social Sciences | 516 | 12.0% |
| Engineering | 196 | 4.6% |
| Multidisciplinary Studies | 58 | 1.3% |
| Science & Technology | 207 | 4.8% |
| Business | 614 | 14.3% |
| Education | 231 | 5.4% |
| Literature & Languages | 414 | 9.6% |
| Liberal Arts & History | 449 | 10.5% |
| Visual & Performing Arts | 574 | 13.4% |
| Communications | 270 | 6.3% |
| Arts & Humanities | 93 | 2.2% |
| Total | 4,294 | 100.0% |
Transportation & Commute in Croton On Hudson
Vehicle Availability by Sex in Croton On Hudson
The most prevalent vehicle ownership categories in Croton On Hudson are males with 2 vehicles (1,019, accounting for 48.0%) and females with 2 vehicles (1,068, making up 53.5%).
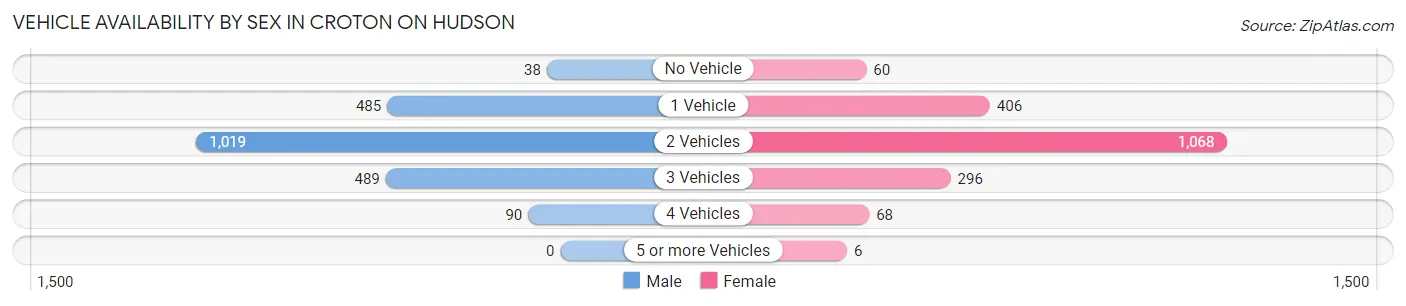
| Vehicles Available | Male | Female |
| No Vehicle | 38 (1.8%) | 60 (3.2%) |
| 1 Vehicle | 485 (22.9%) | 406 (21.3%) |
| 2 Vehicles | 1,019 (48.0%) | 1,068 (56.1%) |
| 3 Vehicles | 489 (23.1%) | 296 (15.5%) |
| 4 Vehicles | 90 (4.2%) | 68 (3.6%) |
| 5 or more Vehicles | 0 (0.0%) | 6 (0.3%) |
| Total | 2,121 (100.0%) | 1,904 (100.0%) |
Commute Time in Croton On Hudson
The most frequently occuring commute durations in Croton On Hudson are 60 to 89 minutes (623 commuters, 21.0%), 90 or more minutes (390 commuters, 13.1%), and 20 to 24 minutes (361 commuters, 12.2%).
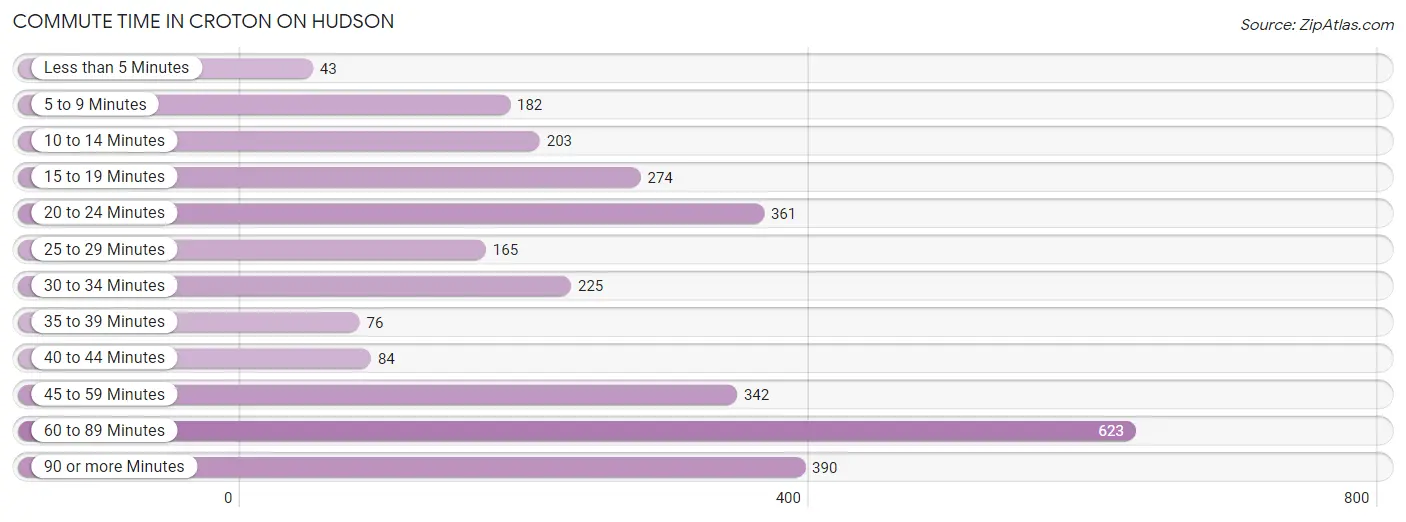
| Commute Time | # Commuters | % Commuters |
| Less than 5 Minutes | 43 | 1.5% |
| 5 to 9 Minutes | 182 | 6.1% |
| 10 to 14 Minutes | 203 | 6.8% |
| 15 to 19 Minutes | 274 | 9.2% |
| 20 to 24 Minutes | 361 | 12.2% |
| 25 to 29 Minutes | 165 | 5.6% |
| 30 to 34 Minutes | 225 | 7.6% |
| 35 to 39 Minutes | 76 | 2.6% |
| 40 to 44 Minutes | 84 | 2.8% |
| 45 to 59 Minutes | 342 | 11.5% |
| 60 to 89 Minutes | 623 | 21.0% |
| 90 or more Minutes | 390 | 13.1% |
Commute Time by Sex in Croton On Hudson
The most common commute times in Croton On Hudson are 60 to 89 minutes (375 commuters, 22.2%) for males and 60 to 89 minutes (248 commuters, 19.3%) for females.
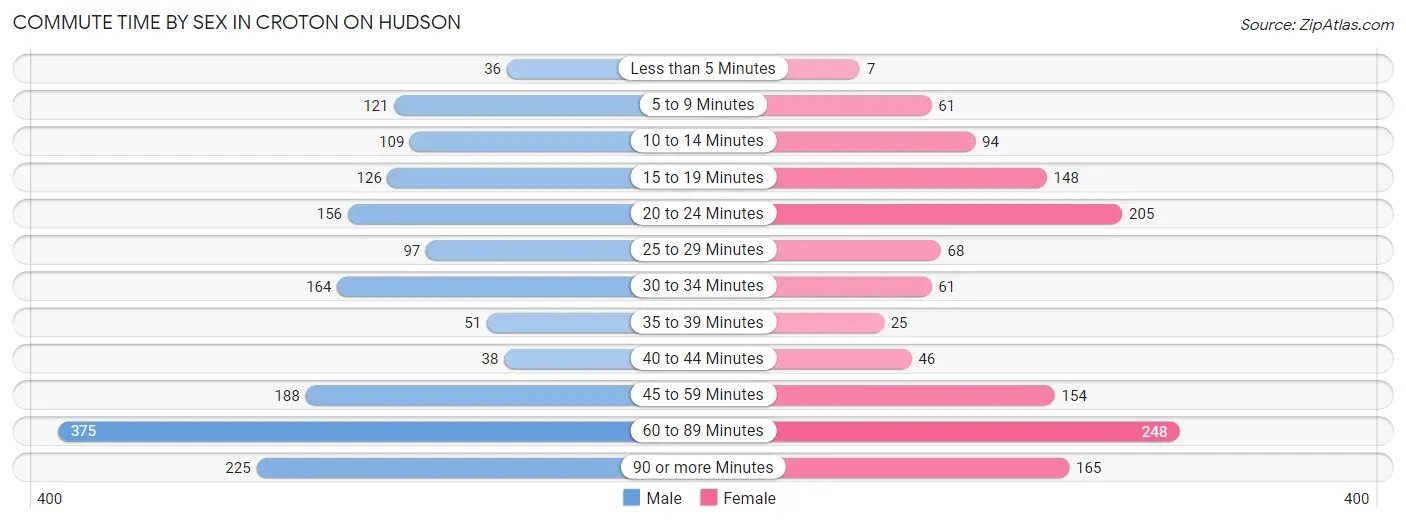
| Commute Time | Male | Female |
| Less than 5 Minutes | 36 (2.1%) | 7 (0.5%) |
| 5 to 9 Minutes | 121 (7.2%) | 61 (4.8%) |
| 10 to 14 Minutes | 109 (6.5%) | 94 (7.3%) |
| 15 to 19 Minutes | 126 (7.5%) | 148 (11.5%) |
| 20 to 24 Minutes | 156 (9.2%) | 205 (16.0%) |
| 25 to 29 Minutes | 97 (5.8%) | 68 (5.3%) |
| 30 to 34 Minutes | 164 (9.7%) | 61 (4.8%) |
| 35 to 39 Minutes | 51 (3.0%) | 25 (1.9%) |
| 40 to 44 Minutes | 38 (2.2%) | 46 (3.6%) |
| 45 to 59 Minutes | 188 (11.2%) | 154 (12.0%) |
| 60 to 89 Minutes | 375 (22.2%) | 248 (19.3%) |
| 90 or more Minutes | 225 (13.4%) | 165 (12.9%) |
Time of Departure to Work by Sex in Croton On Hudson
The most frequent times of departure to work in Croton On Hudson are 8:00 AM to 8:29 AM (393, 23.3%) for males and 7:30 AM to 7:59 AM (274, 21.4%) for females.
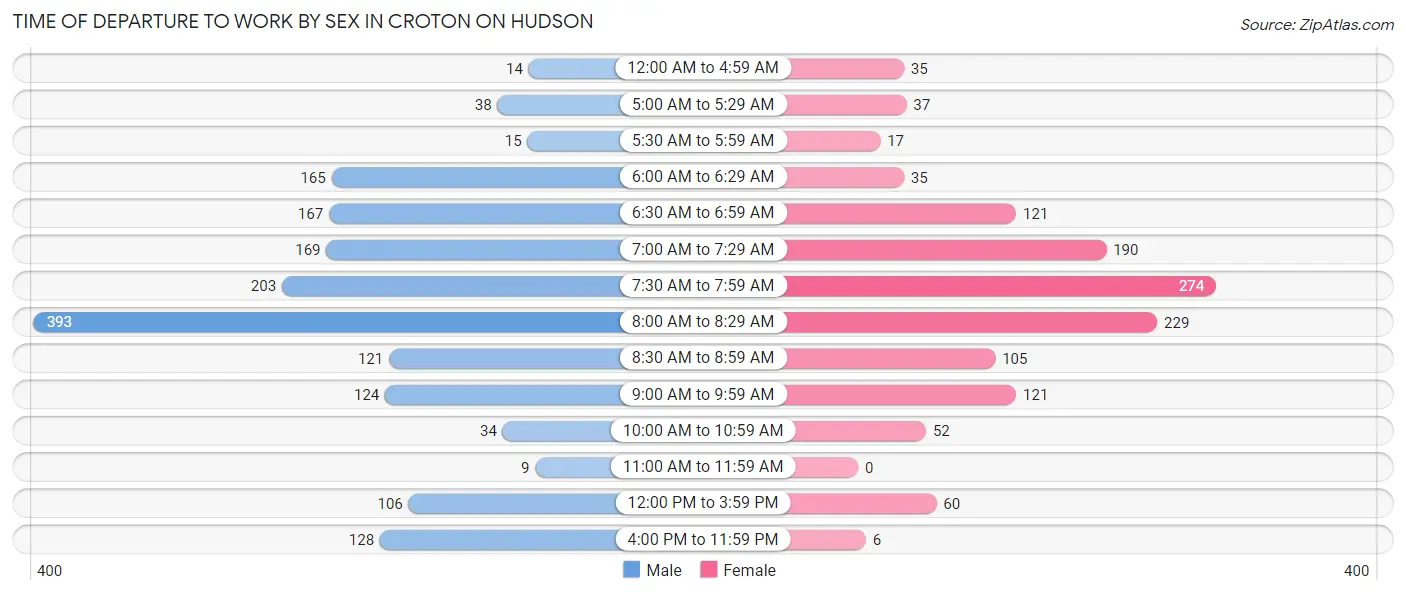
| Time of Departure | Male | Female |
| 12:00 AM to 4:59 AM | 14 (0.8%) | 35 (2.7%) |
| 5:00 AM to 5:29 AM | 38 (2.2%) | 37 (2.9%) |
| 5:30 AM to 5:59 AM | 15 (0.9%) | 17 (1.3%) |
| 6:00 AM to 6:29 AM | 165 (9.8%) | 35 (2.7%) |
| 6:30 AM to 6:59 AM | 167 (9.9%) | 121 (9.4%) |
| 7:00 AM to 7:29 AM | 169 (10.0%) | 190 (14.8%) |
| 7:30 AM to 7:59 AM | 203 (12.0%) | 274 (21.4%) |
| 8:00 AM to 8:29 AM | 393 (23.3%) | 229 (17.9%) |
| 8:30 AM to 8:59 AM | 121 (7.2%) | 105 (8.2%) |
| 9:00 AM to 9:59 AM | 124 (7.3%) | 121 (9.4%) |
| 10:00 AM to 10:59 AM | 34 (2.0%) | 52 (4.1%) |
| 11:00 AM to 11:59 AM | 9 (0.5%) | 0 (0.0%) |
| 12:00 PM to 3:59 PM | 106 (6.3%) | 60 (4.7%) |
| 4:00 PM to 11:59 PM | 128 (7.6%) | 6 (0.5%) |
| Total | 1,686 (100.0%) | 1,282 (100.0%) |
Housing Occupancy in Croton On Hudson
Occupancy by Ownership in Croton On Hudson
Of the total 2,976 dwellings in Croton On Hudson, owner-occupied units account for 2,385 (80.1%), while renter-occupied units make up 591 (19.9%).
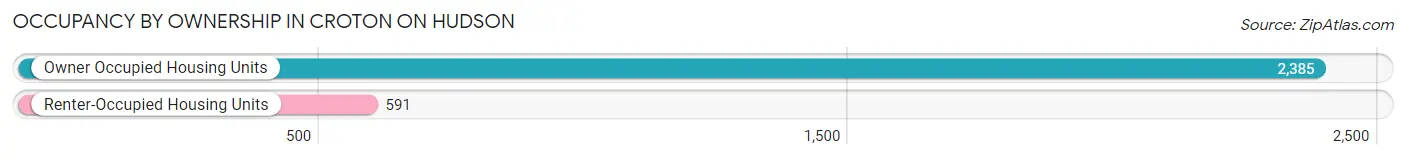
| Occupancy | # Housing Units | % Housing Units |
| Owner Occupied Housing Units | 2,385 | 80.1% |
| Renter-Occupied Housing Units | 591 | 19.9% |
| Total Occupied Housing Units | 2,976 | 100.0% |
Occupancy by Household Size in Croton On Hudson
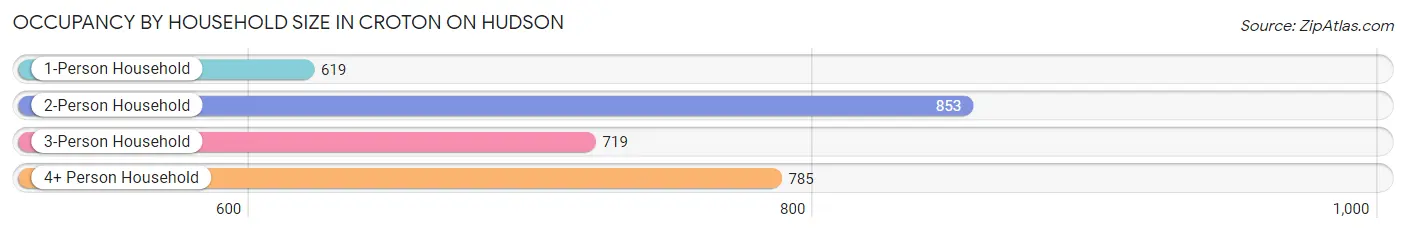
| Household Size | # Housing Units | % Housing Units |
| 1-Person Household | 619 | 20.8% |
| 2-Person Household | 853 | 28.7% |
| 3-Person Household | 719 | 24.2% |
| 4+ Person Household | 785 | 26.4% |
| Total Housing Units | 2,976 | 100.0% |
Occupancy by Ownership by Household Size in Croton On Hudson
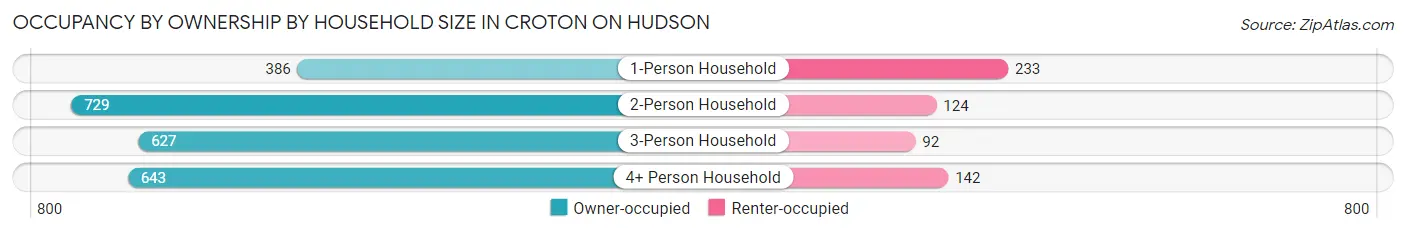
| Household Size | Owner-occupied | Renter-occupied |
| 1-Person Household | 386 (62.4%) | 233 (37.6%) |
| 2-Person Household | 729 (85.5%) | 124 (14.5%) |
| 3-Person Household | 627 (87.2%) | 92 (12.8%) |
| 4+ Person Household | 643 (81.9%) | 142 (18.1%) |
| Total Housing Units | 2,385 (80.1%) | 591 (19.9%) |
Occupancy by Educational Attainment in Croton On Hudson
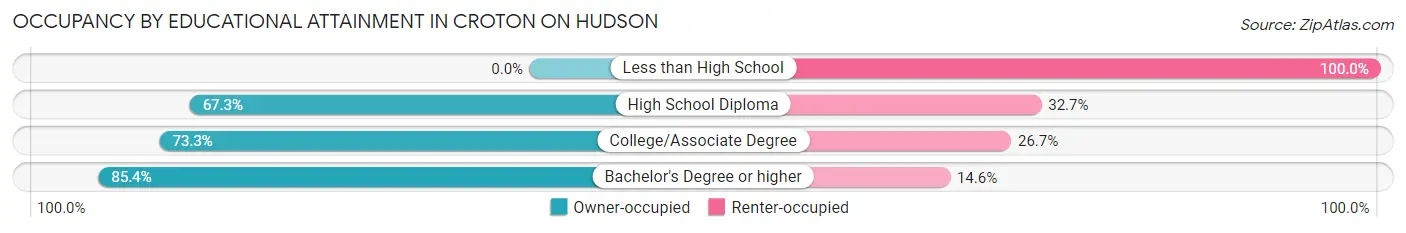
| Household Size | Owner-occupied | Renter-occupied |
| Less than High School | 0 (0.0%) | 57 (100.0%) |
| High School Diploma | 152 (67.3%) | 74 (32.7%) |
| College/Associate Degree | 400 (73.3%) | 146 (26.7%) |
| Bachelor's Degree or higher | 1,833 (85.4%) | 314 (14.6%) |
Occupancy by Age of Householder in Croton On Hudson
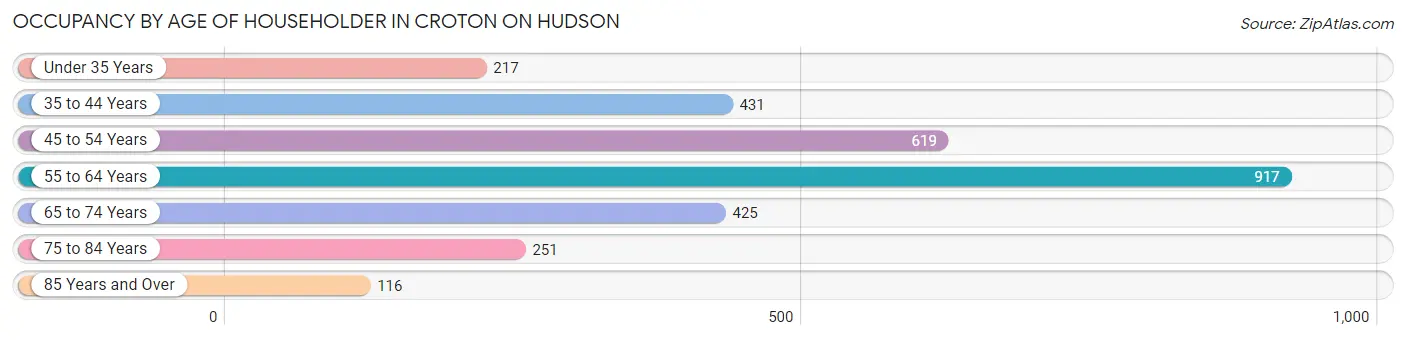
| Age Bracket | # Households | % Households |
| Under 35 Years | 217 | 7.3% |
| 35 to 44 Years | 431 | 14.5% |
| 45 to 54 Years | 619 | 20.8% |
| 55 to 64 Years | 917 | 30.8% |
| 65 to 74 Years | 425 | 14.3% |
| 75 to 84 Years | 251 | 8.4% |
| 85 Years and Over | 116 | 3.9% |
| Total | 2,976 | 100.0% |
Housing Finances in Croton On Hudson
Median Income by Occupancy in Croton On Hudson
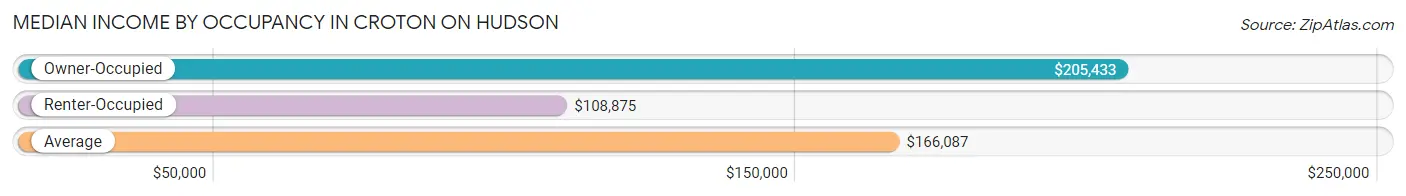
| Occupancy Type | # Households | Median Income |
| Owner-Occupied | 2,385 (80.1%) | $205,433 |
| Renter-Occupied | 591 (19.9%) | $108,875 |
| Average | 2,976 (100.0%) | $166,087 |
Occupancy by Householder Income Bracket in Croton On Hudson
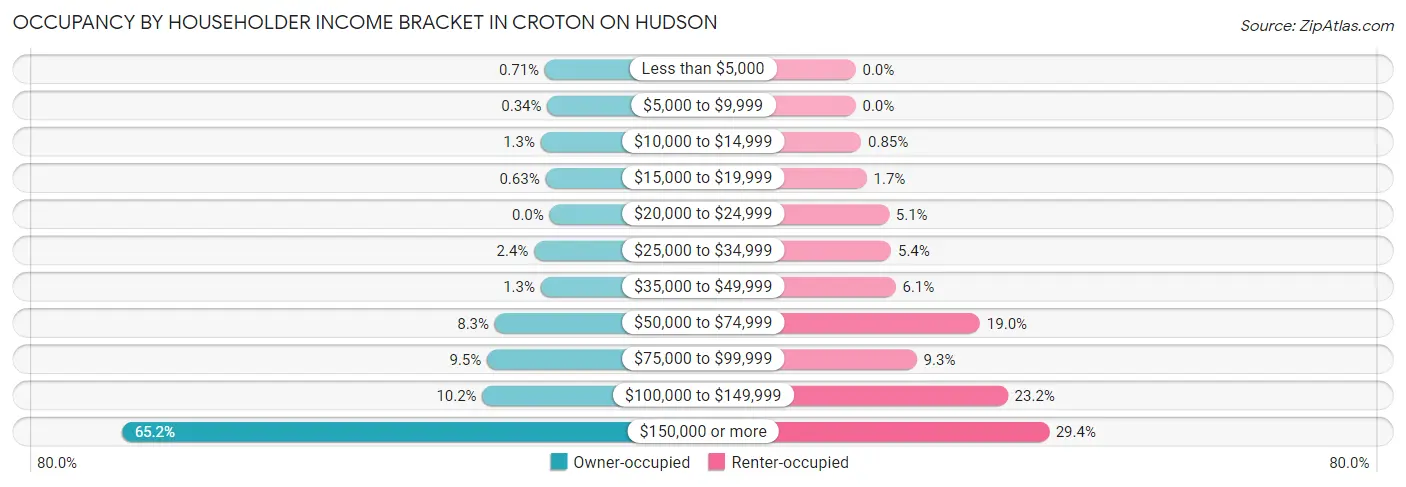
| Income Bracket | Owner-occupied | Renter-occupied |
| Less than $5,000 | 17 (0.7%) | 0 (0.0%) |
| $5,000 to $9,999 | 8 (0.3%) | 0 (0.0%) |
| $10,000 to $14,999 | 32 (1.3%) | 5 (0.9%) |
| $15,000 to $19,999 | 15 (0.6%) | 10 (1.7%) |
| $20,000 to $24,999 | 0 (0.0%) | 30 (5.1%) |
| $25,000 to $34,999 | 56 (2.4%) | 32 (5.4%) |
| $35,000 to $49,999 | 32 (1.3%) | 36 (6.1%) |
| $50,000 to $74,999 | 199 (8.3%) | 112 (19.0%) |
| $75,000 to $99,999 | 227 (9.5%) | 55 (9.3%) |
| $100,000 to $149,999 | 244 (10.2%) | 137 (23.2%) |
| $150,000 or more | 1,555 (65.2%) | 174 (29.4%) |
| Total | 2,385 (100.0%) | 591 (100.0%) |
Monthly Housing Cost Tiers in Croton On Hudson
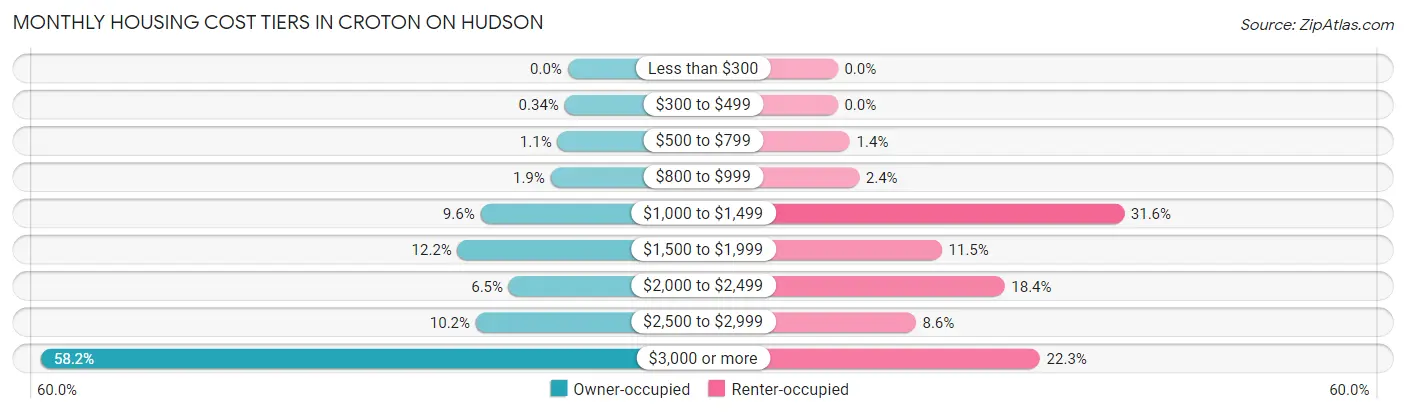
| Monthly Cost | Owner-occupied | Renter-occupied |
| Less than $300 | 0 (0.0%) | 0 (0.0%) |
| $300 to $499 | 8 (0.3%) | 0 (0.0%) |
| $500 to $799 | 27 (1.1%) | 8 (1.3%) |
| $800 to $999 | 45 (1.9%) | 14 (2.4%) |
| $1,000 to $1,499 | 230 (9.6%) | 187 (31.6%) |
| $1,500 to $1,999 | 290 (12.2%) | 68 (11.5%) |
| $2,000 to $2,499 | 155 (6.5%) | 109 (18.4%) |
| $2,500 to $2,999 | 242 (10.2%) | 51 (8.6%) |
| $3,000 or more | 1,388 (58.2%) | 132 (22.3%) |
| Total | 2,385 (100.0%) | 591 (100.0%) |
Physical Housing Characteristics in Croton On Hudson
Housing Structures in Croton On Hudson
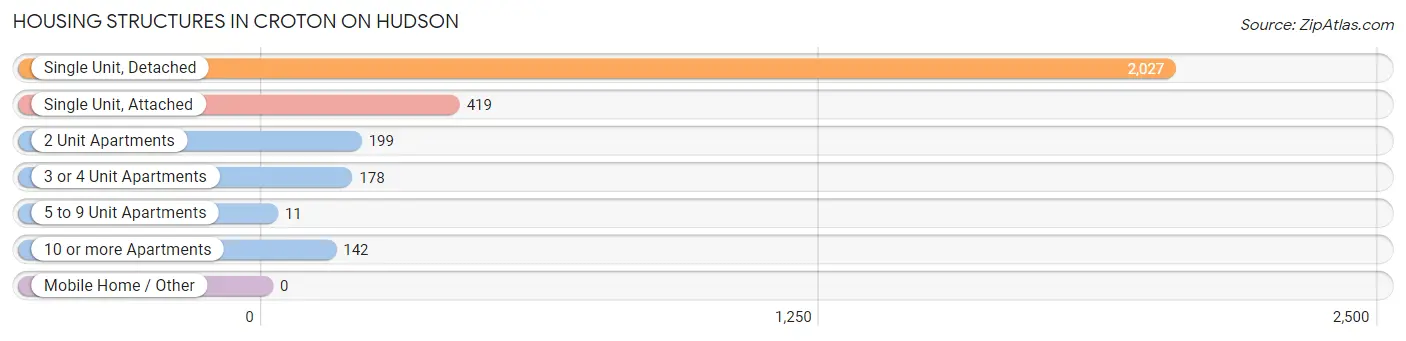
| Structure Type | # Housing Units | % Housing Units |
| Single Unit, Detached | 2,027 | 68.1% |
| Single Unit, Attached | 419 | 14.1% |
| 2 Unit Apartments | 199 | 6.7% |
| 3 or 4 Unit Apartments | 178 | 6.0% |
| 5 to 9 Unit Apartments | 11 | 0.4% |
| 10 or more Apartments | 142 | 4.8% |
| Mobile Home / Other | 0 | 0.0% |
| Total | 2,976 | 100.0% |
Housing Structures by Occupancy in Croton On Hudson
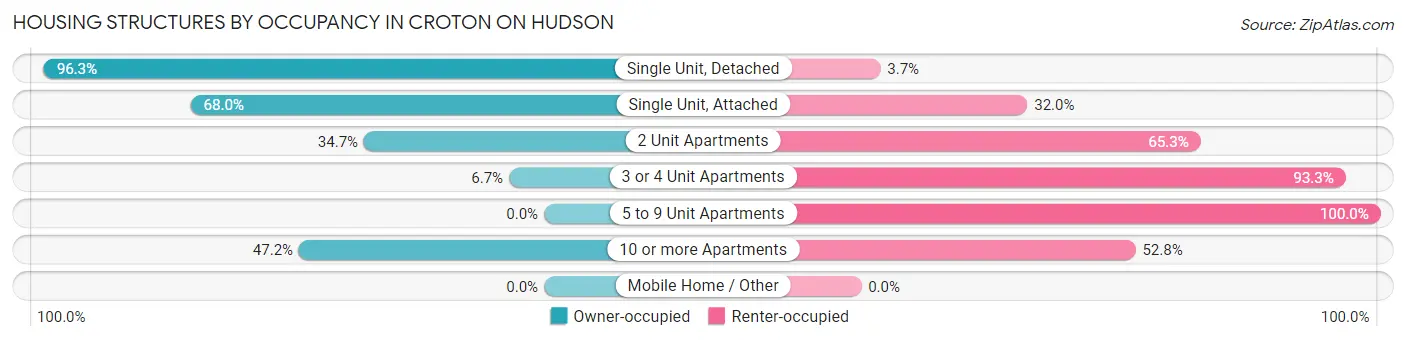
| Structure Type | Owner-occupied | Renter-occupied |
| Single Unit, Detached | 1,952 (96.3%) | 75 (3.7%) |
| Single Unit, Attached | 285 (68.0%) | 134 (32.0%) |
| 2 Unit Apartments | 69 (34.7%) | 130 (65.3%) |
| 3 or 4 Unit Apartments | 12 (6.7%) | 166 (93.3%) |
| 5 to 9 Unit Apartments | 0 (0.0%) | 11 (100.0%) |
| 10 or more Apartments | 67 (47.2%) | 75 (52.8%) |
| Mobile Home / Other | 0 (0.0%) | 0 (0.0%) |
| Total | 2,385 (80.1%) | 591 (19.9%) |
Housing Structures by Number of Rooms in Croton On Hudson
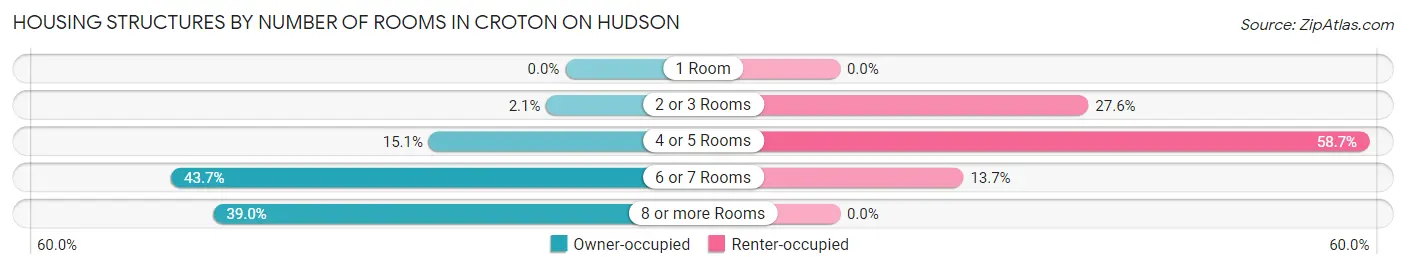
| Number of Rooms | Owner-occupied | Renter-occupied |
| 1 Room | 0 (0.0%) | 0 (0.0%) |
| 2 or 3 Rooms | 50 (2.1%) | 163 (27.6%) |
| 4 or 5 Rooms | 361 (15.1%) | 347 (58.7%) |
| 6 or 7 Rooms | 1,043 (43.7%) | 81 (13.7%) |
| 8 or more Rooms | 931 (39.0%) | 0 (0.0%) |
| Total | 2,385 (100.0%) | 591 (100.0%) |
Housing Structure by Heating Type in Croton On Hudson
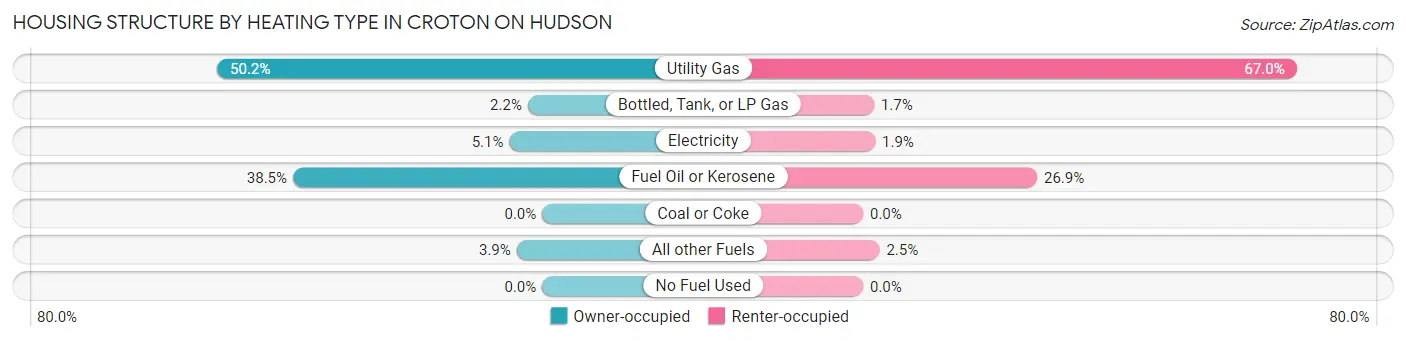
| Heating Type | Owner-occupied | Renter-occupied |
| Utility Gas | 1,198 (50.2%) | 396 (67.0%) |
| Bottled, Tank, or LP Gas | 53 (2.2%) | 10 (1.7%) |
| Electricity | 121 (5.1%) | 11 (1.9%) |
| Fuel Oil or Kerosene | 919 (38.5%) | 159 (26.9%) |
| Coal or Coke | 0 (0.0%) | 0 (0.0%) |
| All other Fuels | 94 (3.9%) | 15 (2.5%) |
| No Fuel Used | 0 (0.0%) | 0 (0.0%) |
| Total | 2,385 (100.0%) | 591 (100.0%) |
Household Vehicle Usage in Croton On Hudson
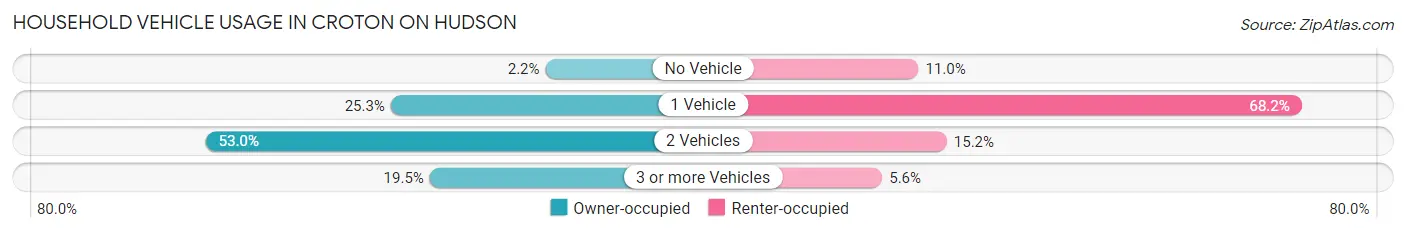
| Vehicles per Household | Owner-occupied | Renter-occupied |
| No Vehicle | 53 (2.2%) | 65 (11.0%) |
| 1 Vehicle | 604 (25.3%) | 403 (68.2%) |
| 2 Vehicles | 1,263 (53.0%) | 90 (15.2%) |
| 3 or more Vehicles | 465 (19.5%) | 33 (5.6%) |
| Total | 2,385 (100.0%) | 591 (100.0%) |
Real Estate & Mortgages in Croton On Hudson
Real Estate and Mortgage Overview in Croton On Hudson
| Characteristic | Without Mortgage | With Mortgage |
| Housing Units | 759 | 1,626 |
| Median Property Value | $698,600 | $659,700 |
| Median Household Income | $139,688 | $1,223 |
| Monthly Housing Costs | $1,501 | $1,286 |
| Real Estate Taxes | $10,001 | $19 |
Property Value by Mortgage Status in Croton On Hudson
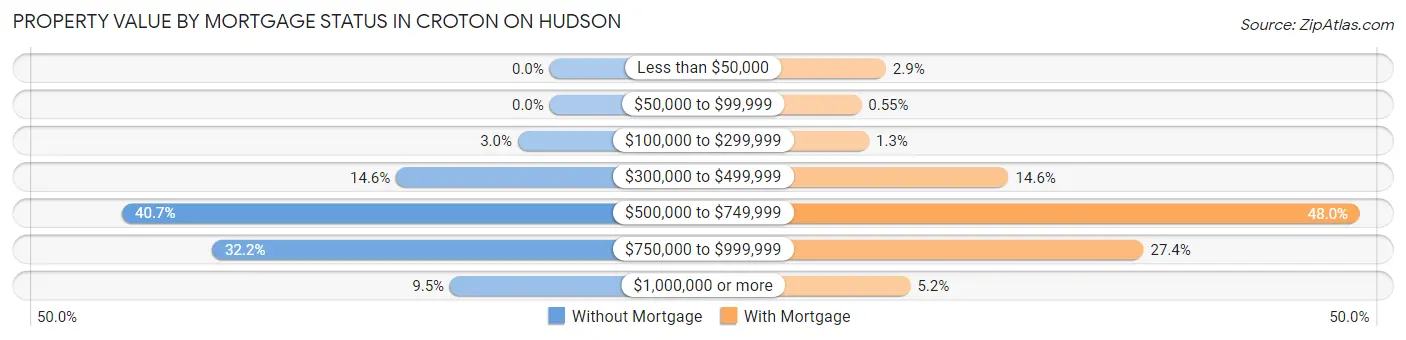
| Property Value | Without Mortgage | With Mortgage |
| Less than $50,000 | 0 (0.0%) | 47 (2.9%) |
| $50,000 to $99,999 | 0 (0.0%) | 9 (0.5%) |
| $100,000 to $299,999 | 23 (3.0%) | 21 (1.3%) |
| $300,000 to $499,999 | 111 (14.6%) | 237 (14.6%) |
| $500,000 to $749,999 | 309 (40.7%) | 781 (48.0%) |
| $750,000 to $999,999 | 244 (32.2%) | 446 (27.4%) |
| $1,000,000 or more | 72 (9.5%) | 85 (5.2%) |
| Total | 759 (100.0%) | 1,626 (100.0%) |
Household Income by Mortgage Status in Croton On Hudson
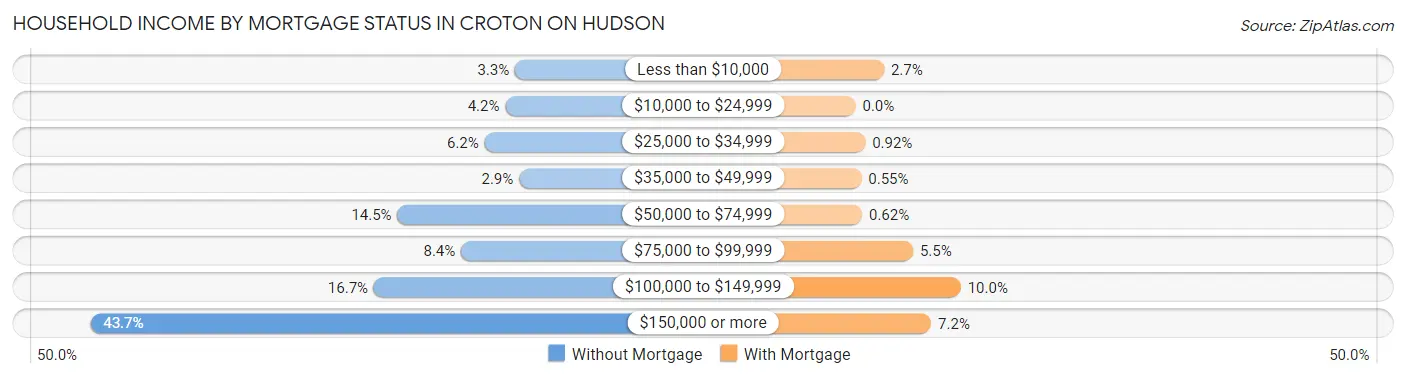
| Household Income | Without Mortgage | With Mortgage |
| Less than $10,000 | 25 (3.3%) | 44 (2.7%) |
| $10,000 to $24,999 | 32 (4.2%) | 0 (0.0%) |
| $25,000 to $34,999 | 47 (6.2%) | 15 (0.9%) |
| $35,000 to $49,999 | 22 (2.9%) | 9 (0.5%) |
| $50,000 to $74,999 | 110 (14.5%) | 10 (0.6%) |
| $75,000 to $99,999 | 64 (8.4%) | 89 (5.5%) |
| $100,000 to $149,999 | 127 (16.7%) | 163 (10.0%) |
| $150,000 or more | 332 (43.7%) | 117 (7.2%) |
| Total | 759 (100.0%) | 1,626 (100.0%) |
Property Value to Household Income Ratio in Croton On Hudson
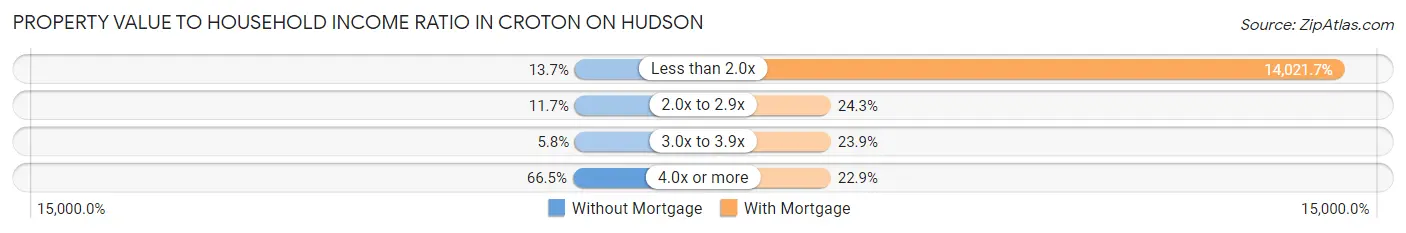
| Value-to-Income Ratio | Without Mortgage | With Mortgage |
| Less than 2.0x | 104 (13.7%) | 227,993 (14,021.7%) |
| 2.0x to 2.9x | 89 (11.7%) | 395 (24.3%) |
| 3.0x to 3.9x | 44 (5.8%) | 389 (23.9%) |
| 4.0x or more | 505 (66.5%) | 373 (22.9%) |
| Total | 759 (100.0%) | 1,626 (100.0%) |
Real Estate Taxes by Mortgage Status in Croton On Hudson
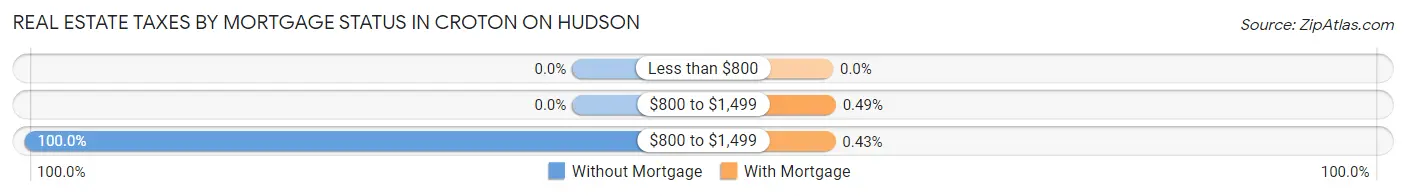
| Property Taxes | Without Mortgage | With Mortgage |
| Less than $800 | 0 (0.0%) | 0 (0.0%) |
| $800 to $1,499 | 0 (0.0%) | 8 (0.5%) |
| $800 to $1,499 | 759 (100.0%) | 7 (0.4%) |
| Total | 759 (100.0%) | 1,626 (100.0%) |
Health & Disability in Croton On Hudson
Health Insurance Coverage by Age in Croton On Hudson
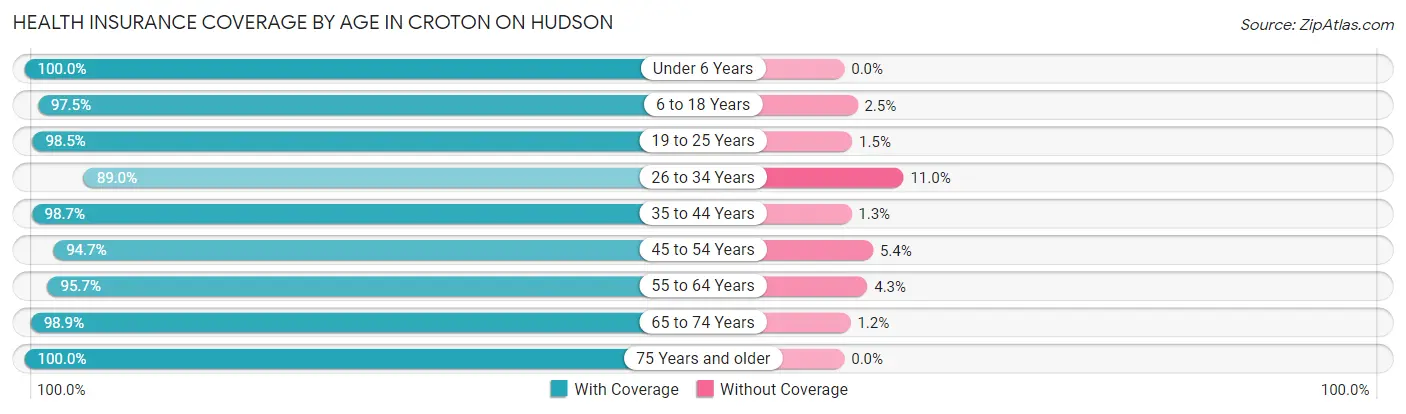
| Age Bracket | With Coverage | Without Coverage |
| Under 6 Years | 600 (100.0%) | 0 (0.0%) |
| 6 to 18 Years | 1,347 (97.5%) | 34 (2.5%) |
| 19 to 25 Years | 604 (98.5%) | 9 (1.5%) |
| 26 to 34 Years | 427 (89.0%) | 53 (11.0%) |
| 35 to 44 Years | 980 (98.7%) | 13 (1.3%) |
| 45 to 54 Years | 1,115 (94.7%) | 63 (5.3%) |
| 55 to 64 Years | 1,362 (95.7%) | 61 (4.3%) |
| 65 to 74 Years | 863 (98.9%) | 10 (1.1%) |
| 75 Years and older | 542 (100.0%) | 0 (0.0%) |
| Total | 7,840 (97.0%) | 243 (3.0%) |
Health Insurance Coverage by Citizenship Status in Croton On Hudson
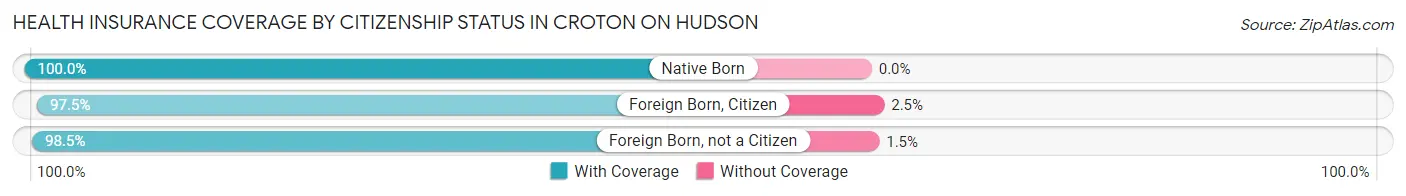
| Citizenship Status | With Coverage | Without Coverage |
| Native Born | 600 (100.0%) | 0 (0.0%) |
| Foreign Born, Citizen | 1,347 (97.5%) | 34 (2.5%) |
| Foreign Born, not a Citizen | 604 (98.5%) | 9 (1.5%) |
Health Insurance Coverage by Household Income in Croton On Hudson
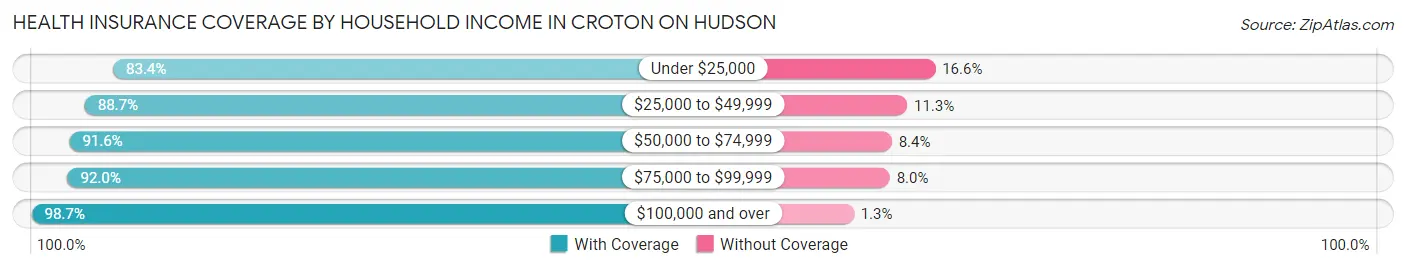
| Household Income | With Coverage | Without Coverage |
| Under $25,000 | 151 (83.4%) | 30 (16.6%) |
| $25,000 to $49,999 | 220 (88.7%) | 28 (11.3%) |
| $50,000 to $74,999 | 610 (91.6%) | 56 (8.4%) |
| $75,000 to $99,999 | 526 (92.0%) | 46 (8.0%) |
| $100,000 and over | 6,320 (98.7%) | 83 (1.3%) |
Public vs Private Health Insurance Coverage by Age in Croton On Hudson
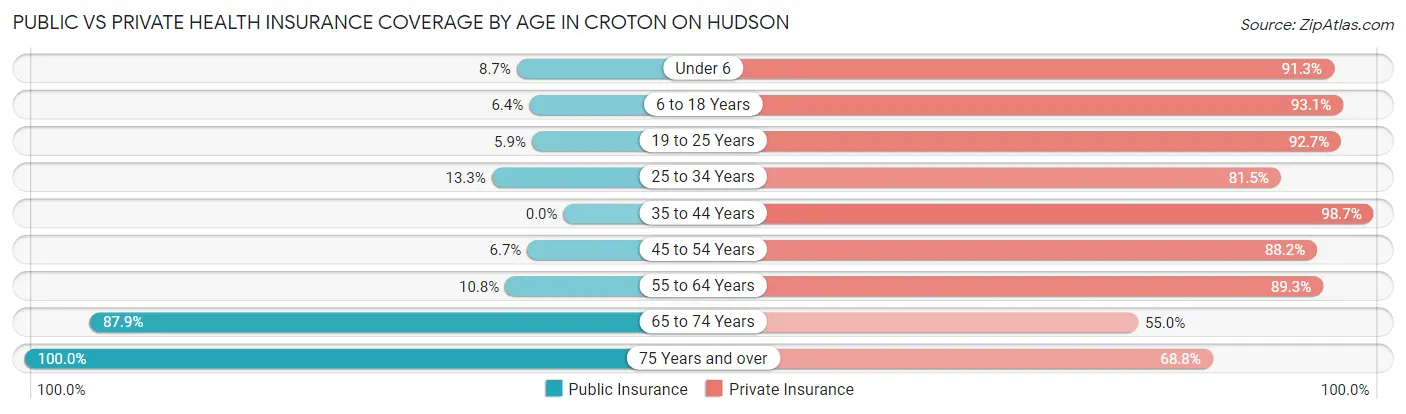
| Age Bracket | Public Insurance | Private Insurance |
| Under 6 | 52 (8.7%) | 548 (91.3%) |
| 6 to 18 Years | 88 (6.4%) | 1,285 (93.0%) |
| 19 to 25 Years | 36 (5.9%) | 568 (92.7%) |
| 25 to 34 Years | 64 (13.3%) | 391 (81.5%) |
| 35 to 44 Years | 0 (0.0%) | 980 (98.7%) |
| 45 to 54 Years | 79 (6.7%) | 1,039 (88.2%) |
| 55 to 64 Years | 154 (10.8%) | 1,271 (89.3%) |
| 65 to 74 Years | 767 (87.9%) | 480 (55.0%) |
| 75 Years and over | 542 (100.0%) | 373 (68.8%) |
| Total | 1,782 (22.1%) | 6,935 (85.8%) |
Disability Status by Sex by Age in Croton On Hudson
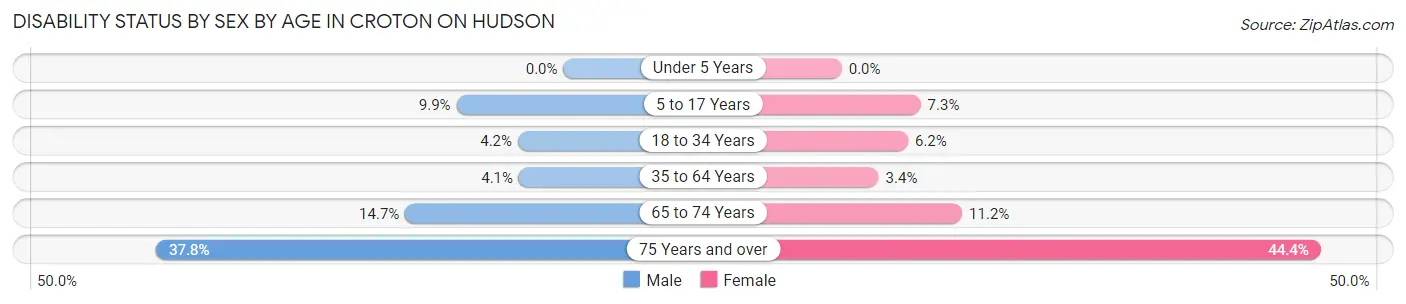
| Age Bracket | Male | Female |
| Under 5 Years | 0 (0.0%) | 0 (0.0%) |
| 5 to 17 Years | 64 (9.9%) | 59 (7.3%) |
| 18 to 34 Years | 28 (4.2%) | 31 (6.1%) |
| 35 to 64 Years | 70 (4.1%) | 65 (3.4%) |
| 65 to 74 Years | 69 (14.7%) | 45 (11.2%) |
| 75 Years and over | 79 (37.8%) | 148 (44.4%) |
Disability Class by Sex by Age in Croton On Hudson
Disability Class: Hearing Difficulty
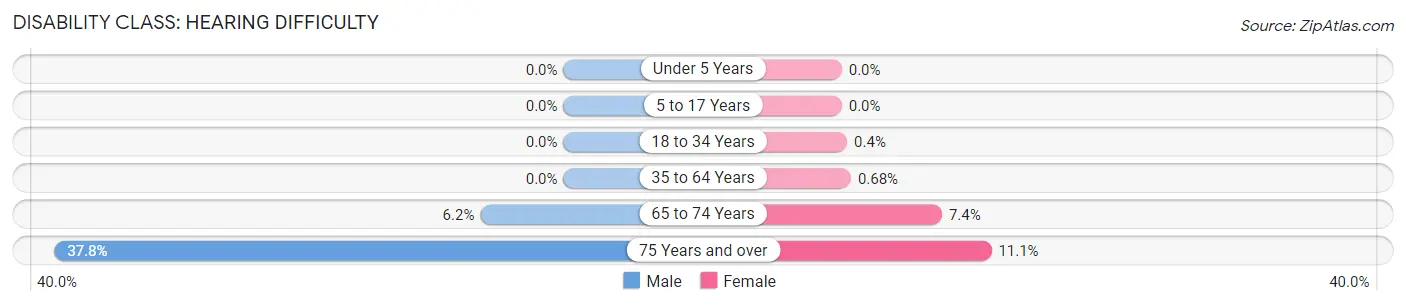
| Age Bracket | Male | Female |
| Under 5 Years | 0 (0.0%) | 0 (0.0%) |
| 5 to 17 Years | 0 (0.0%) | 0 (0.0%) |
| 18 to 34 Years | 0 (0.0%) | 2 (0.4%) |
| 35 to 64 Years | 0 (0.0%) | 13 (0.7%) |
| 65 to 74 Years | 29 (6.2%) | 30 (7.4%) |
| 75 Years and over | 79 (37.8%) | 37 (11.1%) |
Disability Class: Vision Difficulty
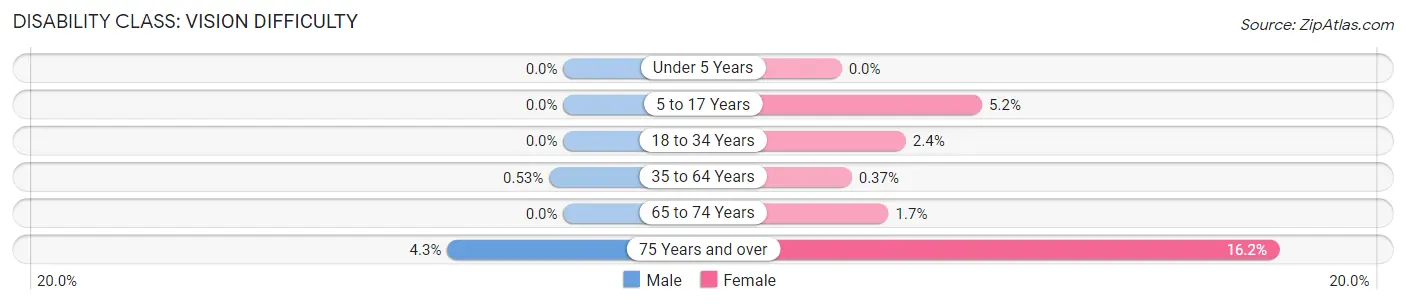
| Age Bracket | Male | Female |
| Under 5 Years | 0 (0.0%) | 0 (0.0%) |
| 5 to 17 Years | 0 (0.0%) | 42 (5.2%) |
| 18 to 34 Years | 0 (0.0%) | 12 (2.4%) |
| 35 to 64 Years | 9 (0.5%) | 7 (0.4%) |
| 65 to 74 Years | 0 (0.0%) | 7 (1.7%) |
| 75 Years and over | 9 (4.3%) | 54 (16.2%) |
Disability Class: Cognitive Difficulty
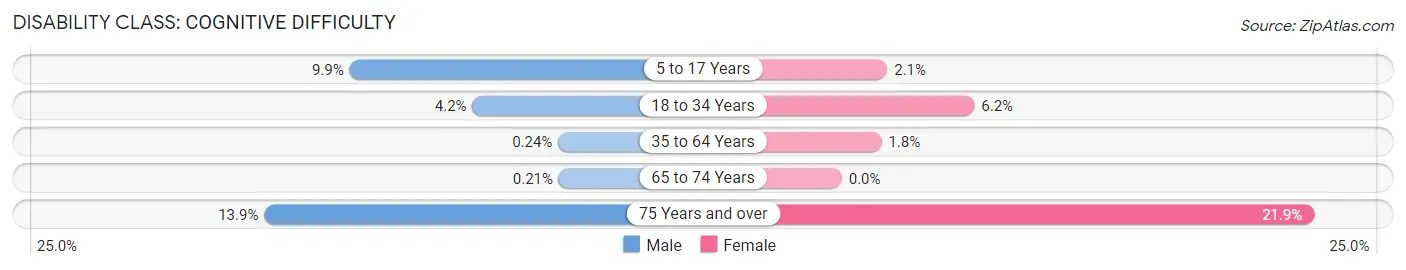
| Age Bracket | Male | Female |
| 5 to 17 Years | 64 (9.9%) | 17 (2.1%) |
| 18 to 34 Years | 28 (4.2%) | 31 (6.1%) |
| 35 to 64 Years | 4 (0.2%) | 35 (1.8%) |
| 65 to 74 Years | 1 (0.2%) | 0 (0.0%) |
| 75 Years and over | 29 (13.9%) | 73 (21.9%) |
Disability Class: Ambulatory Difficulty
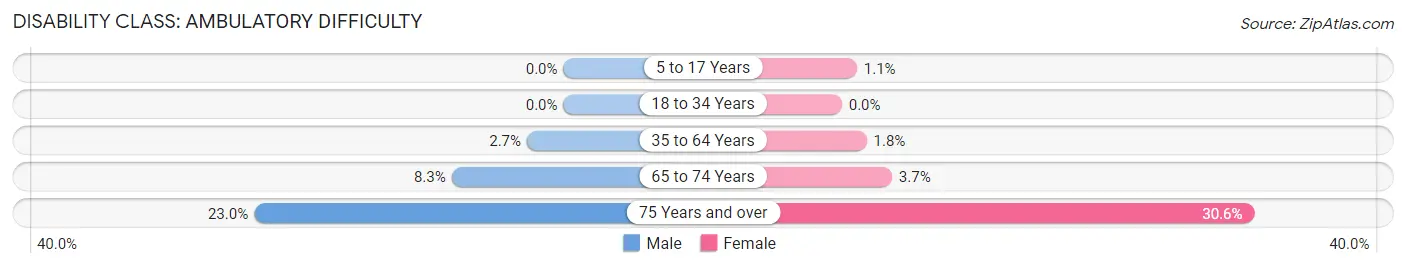
| Age Bracket | Male | Female |
| 5 to 17 Years | 0 (0.0%) | 9 (1.1%) |
| 18 to 34 Years | 0 (0.0%) | 0 (0.0%) |
| 35 to 64 Years | 46 (2.7%) | 35 (1.8%) |
| 65 to 74 Years | 39 (8.3%) | 15 (3.7%) |
| 75 Years and over | 48 (23.0%) | 102 (30.6%) |
Disability Class: Self-Care Difficulty
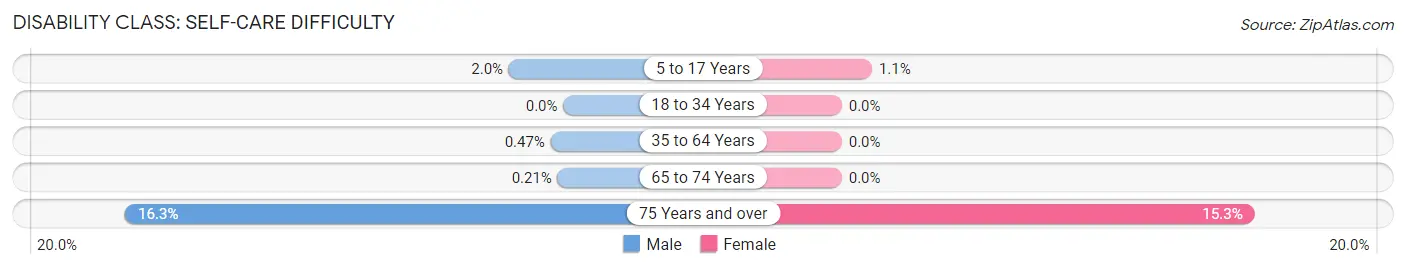
| Age Bracket | Male | Female |
| 5 to 17 Years | 13 (2.0%) | 9 (1.1%) |
| 18 to 34 Years | 0 (0.0%) | 0 (0.0%) |
| 35 to 64 Years | 8 (0.5%) | 0 (0.0%) |
| 65 to 74 Years | 1 (0.2%) | 0 (0.0%) |
| 75 Years and over | 34 (16.3%) | 51 (15.3%) |
Technology Access in Croton On Hudson
Computing Device Access in Croton On Hudson
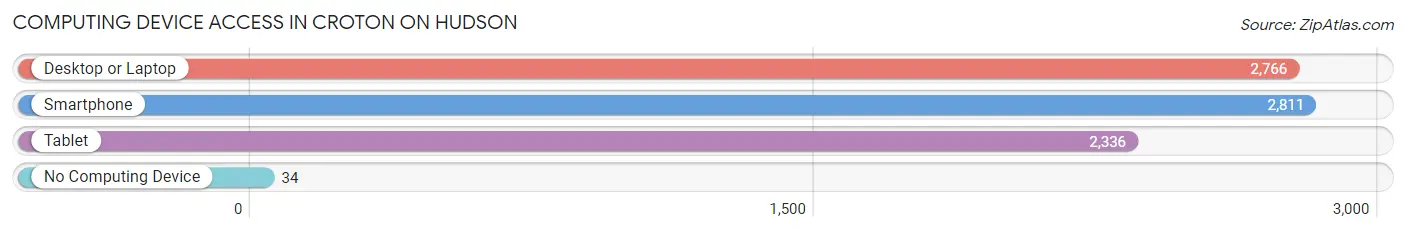
| Device Type | # Households | % Households |
| Desktop or Laptop | 2,766 | 92.9% |
| Smartphone | 2,811 | 94.5% |
| Tablet | 2,336 | 78.5% |
| No Computing Device | 34 | 1.1% |
| Total | 2,976 | 100.0% |
Internet Access in Croton On Hudson
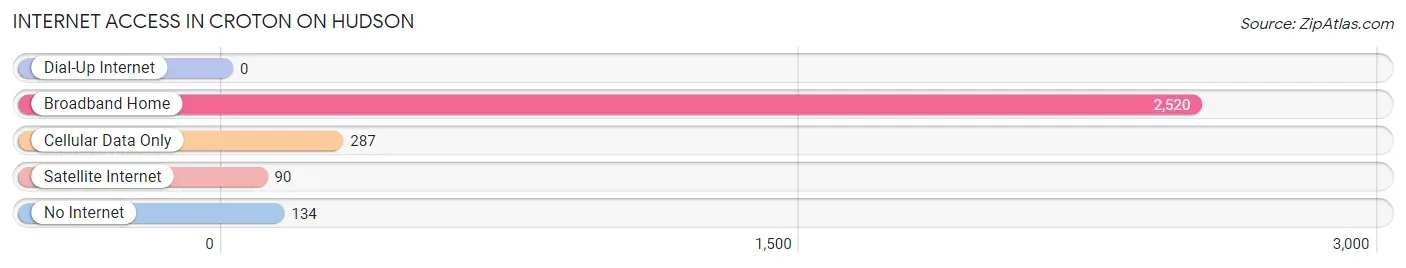
| Internet Type | # Households | % Households |
| Dial-Up Internet | 0 | 0.0% |
| Broadband Home | 2,520 | 84.7% |
| Cellular Data Only | 287 | 9.6% |
| Satellite Internet | 90 | 3.0% |
| No Internet | 134 | 4.5% |
| Total | 2,976 | 100.0% |
Croton On Hudson Summary
Croton On Hudson, NY is a village located in Westchester County, New York. It is situated on the east bank of the Hudson River, about 25 miles north of New York City. The village is part of the town of Cortlandt, which also includes the hamlets of Montrose and Crugers. The population of Croton On Hudson was 8,070 as of the 2010 census.
History
The area that is now Croton On Hudson was originally inhabited by the Wappinger Native American tribe. The first European settlers arrived in the area in the late 17th century. The village was originally known as "Kitchawan," after the Wappinger word for "crooked river." The village was officially incorporated in 1813.
In the 19th century, Croton On Hudson became a popular summer resort destination for wealthy New Yorkers. The village was home to several grand hotels, including the Croton House, which was built in 1845. The village also became a popular destination for artists and writers, including Washington Irving, who wrote his famous short story "Rip Van Winkle" while staying in Croton On Hudson.
Geography
Croton On Hudson is located in Westchester County, New York. It is situated on the east bank of the Hudson River, about 25 miles north of New York City. The village is part of the town of Cortlandt, which also includes the hamlets of Montrose and Crugers. The village is bordered by the towns of Ossining to the north, Yorktown to the east, and Cortlandt to the south.
The village has a total area of 4.2 square miles, of which 3.9 square miles is land and 0.3 square miles is water. The village is located in the Hudson Valley region of New York, and is part of the Croton River watershed.
Economy
The economy of Croton On Hudson is largely based on tourism and retail. The village is home to several popular tourist attractions, including the Croton Point Park, the Croton Gorge Park, and the Croton Aqueduct Trail. The village is also home to several retail stores, restaurants, and other businesses.
Demographics
As of the 2010 census, the population of Croton On Hudson was 8,070. The racial makeup of the village was 87.2% White, 5.2% African American, 0.3% Native American, 3.2% Asian, 0.1% Pacific Islander, and 3.9% from other races. Hispanic or Latino of any race were 8.3% of the population.
The median household income in Croton On Hudson was $90,945, and the median family income was $106,945. The per capita income was $41,945. About 4.2% of families and 5.7% of the population were below the poverty line.
Common Questions
What is Per Capita Income in Croton On Hudson?
Per Capita income in Croton On Hudson is $77,032.
What is the Median Family Income in Croton On Hudson?
Median Family Income in Croton On Hudson is $192,700.
What is the Median Household income in Croton On Hudson?
Median Household Income in Croton On Hudson is $166,087.
What is Income or Wage Gap in Croton On Hudson?
Income or Wage Gap in Croton On Hudson is 4.7%.
Women in Croton On Hudson earn 95.3 cents for every dollar earned by a man.
What is Inequality or Gini Index in Croton On Hudson?
Inequality or Gini Index in Croton On Hudson is 0.41.
What is the Total Population of Croton On Hudson?
Total Population of Croton On Hudson is 8,237.
What is the Total Male Population of Croton On Hudson?
Total Male Population of Croton On Hudson is 3,968.
What is the Total Female Population of Croton On Hudson?
Total Female Population of Croton On Hudson is 4,269.
What is the Ratio of Males per 100 Females in Croton On Hudson?
There are 92.95 Males per 100 Females in Croton On Hudson.
What is the Ratio of Females per 100 Males in Croton On Hudson?
There are 107.59 Females per 100 Males in Croton On Hudson.
What is the Median Population Age in Croton On Hudson?
Median Population Age in Croton On Hudson is 45.3 Years.
What is the Average Family Size in Croton On Hudson
Average Family Size in Croton On Hudson is 3.2 People.
What is the Average Household Size in Croton On Hudson
Average Household Size in Croton On Hudson is 2.7 People.
How Large is the Labor Force in Croton On Hudson?
There are 4,534 People in the Labor Forcein in Croton On Hudson.
What is the Percentage of People in the Labor Force in Croton On Hudson?
68.7% of People are in the Labor Force in Croton On Hudson.
What is the Unemployment Rate in Croton On Hudson?
Unemployment Rate in Croton On Hudson is 7.7%.