Westbury, NY Map & Demographics
Westbury Map
Westbury Overview
$56,344
PER CAPITA INCOME
$141,870
AVG FAMILY INCOME
$125,976
AVG HOUSEHOLD INCOME
34.0%
WAGE / INCOME GAP [ % ]
66.0¢/ $1
WAGE / INCOME GAP [ $ ]
0.45
INEQUALITY / GINI INDEX
15,788
TOTAL POPULATION
7,464
MALE POPULATION
8,324
FEMALE POPULATION
89.67
MALES / 100 FEMALES
111.52
FEMALES / 100 MALES
43.7
MEDIAN AGE
3.5
AVG FAMILY SIZE
3.0
AVG HOUSEHOLD SIZE
8,911
LABOR FORCE [ PEOPLE ]
69.7%
PERCENT IN LABOR FORCE
3.2%
UNEMPLOYMENT RATE
Westbury Zip Codes
Income in Westbury
Income Overview in Westbury
Per Capita Income in Westbury is $56,344, while median incomes of families and households are $141,870 and $125,976 respectively.
| Characteristic | Number | Measure |
| Per Capita Income | 15,788 | $56,344 |
| Median Family Income | 3,881 | $141,870 |
| Mean Family Income | 3,881 | $197,283 |
| Median Household Income | 5,186 | $125,976 |
| Mean Household Income | 5,186 | $171,055 |
| Income Deficit | 3,881 | $0 |
| Wage / Income Gap (%) | 15,788 | 34.01% |
| Wage / Income Gap ($) | 15,788 | 65.99¢ per $1 |
| Gini / Inequality Index | 15,788 | 0.45 |
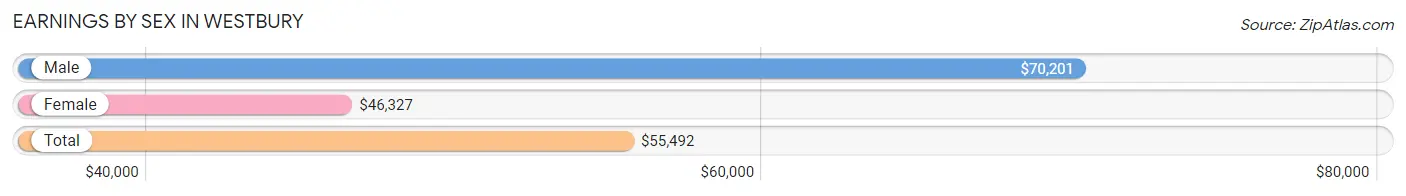
Earnings by Sex in Westbury
Average Earnings in Westbury are $55,492, $70,201 for men and $46,327 for women, a difference of 34.0%.
| Sex | Number | Average Earnings |
| Male | 4,683 (51.8%) | $70,201 |
| Female | 4,362 (48.2%) | $46,327 |
| Total | 9,045 (100.0%) | $55,492 |
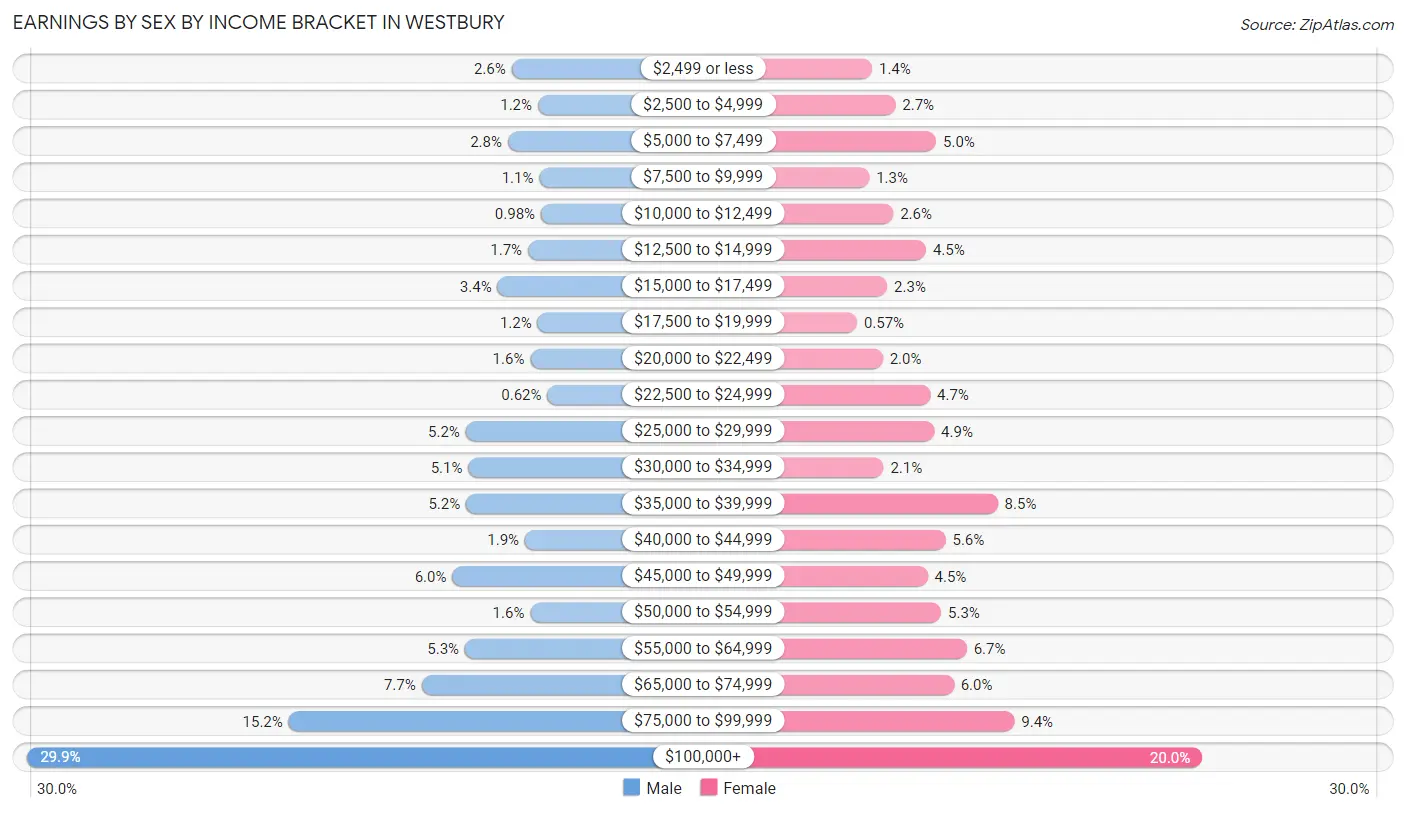
Earnings by Sex by Income Bracket in Westbury
The most common earnings brackets in Westbury are $100,000+ for men (1,398 | 29.8%) and $100,000+ for women (871 | 20.0%).
| Income | Male | Female |
| $2,499 or less | 123 (2.6%) | 62 (1.4%) |
| $2,500 to $4,999 | 54 (1.1%) | 119 (2.7%) |
| $5,000 to $7,499 | 133 (2.8%) | 219 (5.0%) |
| $7,500 to $9,999 | 50 (1.1%) | 55 (1.3%) |
| $10,000 to $12,499 | 46 (1.0%) | 114 (2.6%) |
| $12,500 to $14,999 | 80 (1.7%) | 194 (4.4%) |
| $15,000 to $17,499 | 160 (3.4%) | 99 (2.3%) |
| $17,500 to $19,999 | 55 (1.2%) | 25 (0.6%) |
| $20,000 to $22,499 | 74 (1.6%) | 88 (2.0%) |
| $22,500 to $24,999 | 29 (0.6%) | 204 (4.7%) |
| $25,000 to $29,999 | 244 (5.2%) | 214 (4.9%) |
| $30,000 to $34,999 | 237 (5.1%) | 90 (2.1%) |
| $35,000 to $39,999 | 243 (5.2%) | 370 (8.5%) |
| $40,000 to $44,999 | 88 (1.9%) | 242 (5.6%) |
| $45,000 to $49,999 | 279 (6.0%) | 198 (4.5%) |
| $50,000 to $54,999 | 74 (1.6%) | 231 (5.3%) |
| $55,000 to $64,999 | 246 (5.2%) | 294 (6.7%) |
| $65,000 to $74,999 | 360 (7.7%) | 262 (6.0%) |
| $75,000 to $99,999 | 710 (15.2%) | 411 (9.4%) |
| $100,000+ | 1,398 (29.8%) | 871 (20.0%) |
| Total | 4,683 (100.0%) | 4,362 (100.0%) |
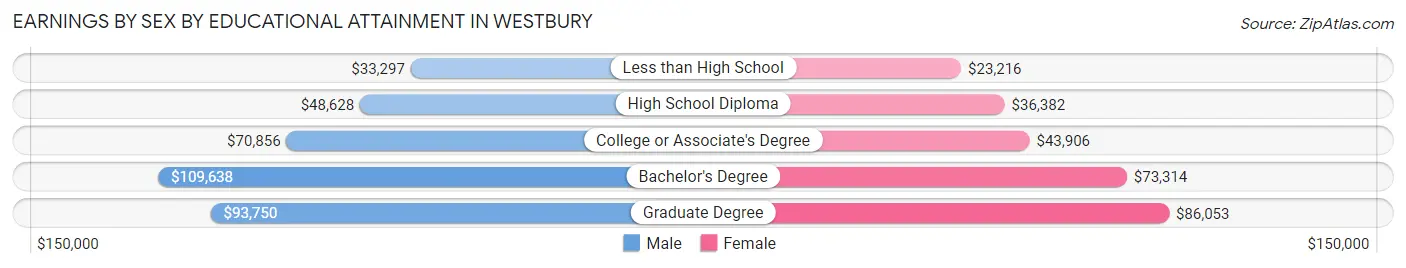
Earnings by Sex by Educational Attainment in Westbury
Average earnings in Westbury are $71,503 for men and $51,890 for women, a difference of 27.4%. Men with an educational attainment of bachelor's degree enjoy the highest average annual earnings of $109,638, while those with less than high school education earn the least with $33,297. Women with an educational attainment of graduate degree earn the most with the average annual earnings of $86,053, while those with less than high school education have the smallest earnings of $23,216.
| Educational Attainment | Male Income | Female Income |
| Less than High School | $33,297 | $23,216 |
| High School Diploma | $48,628 | $36,382 |
| College or Associate's Degree | $70,856 | $43,906 |
| Bachelor's Degree | $109,638 | $73,314 |
| Graduate Degree | $93,750 | $86,053 |
| Total | $71,503 | $51,890 |
Family Income in Westbury
Family Income Brackets in Westbury
According to the Westbury family income data, there are 1,397 families falling into the $200,000+ income range, which is the most common income bracket and makes up 36.0% of all families.
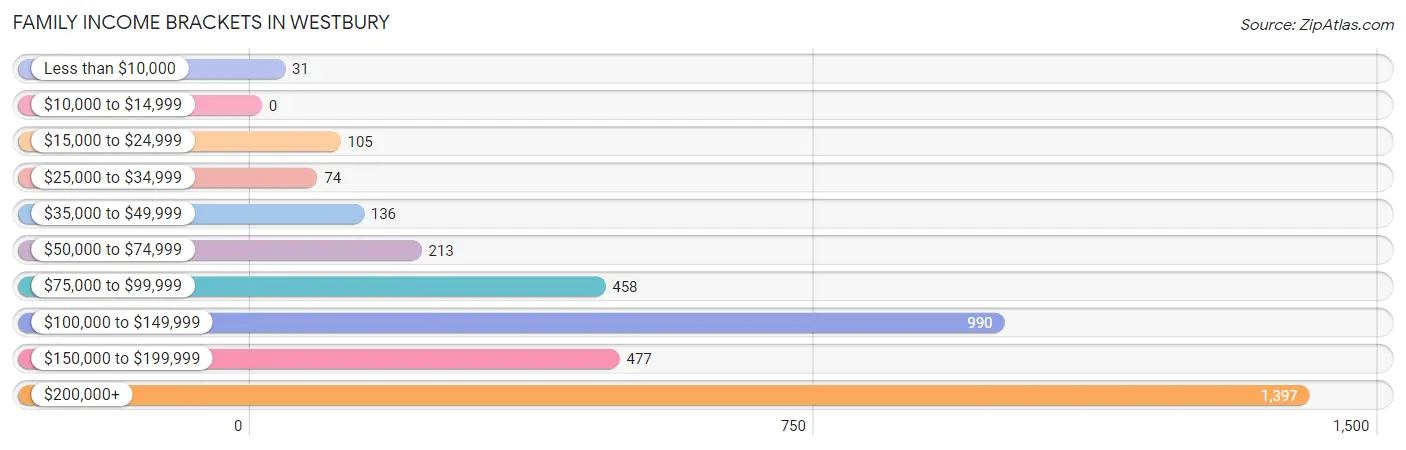
| Income Bracket | # Families | % Families |
| Less than $10,000 | 31 | 0.8% |
| $10,000 to $14,999 | 0 | 0.0% |
| $15,000 to $24,999 | 105 | 2.7% |
| $25,000 to $34,999 | 74 | 1.9% |
| $35,000 to $49,999 | 136 | 3.5% |
| $50,000 to $74,999 | 213 | 5.5% |
| $75,000 to $99,999 | 458 | 11.8% |
| $100,000 to $149,999 | 990 | 25.5% |
| $150,000 to $199,999 | 477 | 12.3% |
| $200,000+ | 1,397 | 36.0% |
Family Income by Famaliy Size in Westbury
5-person families (527 | 13.6%) account for the highest median family income in Westbury with $244,755 per family, while 2-person families (1,309 | 33.7%) have the highest median income of $60,466 per family member.
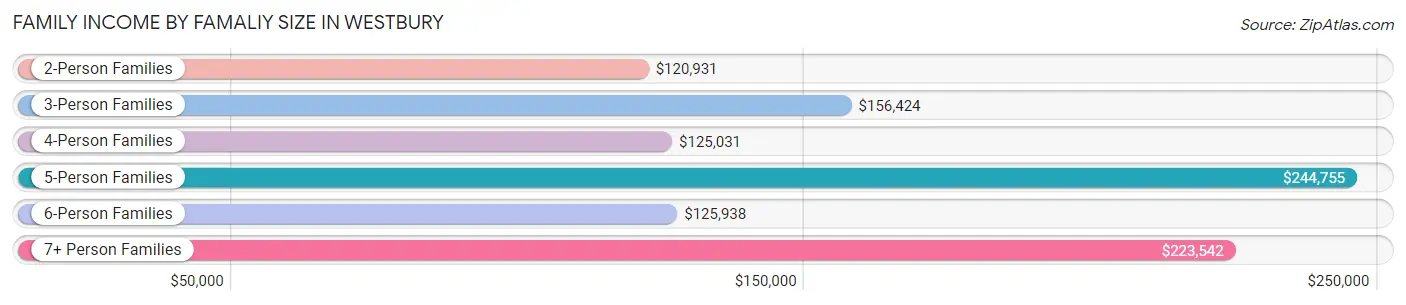
| Income Bracket | # Families | Median Income |
| 2-Person Families | 1,309 (33.7%) | $120,931 |
| 3-Person Families | 923 (23.8%) | $156,424 |
| 4-Person Families | 803 (20.7%) | $125,031 |
| 5-Person Families | 527 (13.6%) | $244,755 |
| 6-Person Families | 82 (2.1%) | $125,938 |
| 7+ Person Families | 237 (6.1%) | $223,542 |
| Total | 3,881 (100.0%) | $141,870 |
Family Income by Number of Earners in Westbury
The median family income in Westbury is $141,870, with families comprising 3+ earners (903) having the highest median family income of $219,271, while families with no earners (222) have the lowest median family income of $82,386, accounting for 23.3% and 5.7% of families, respectively.
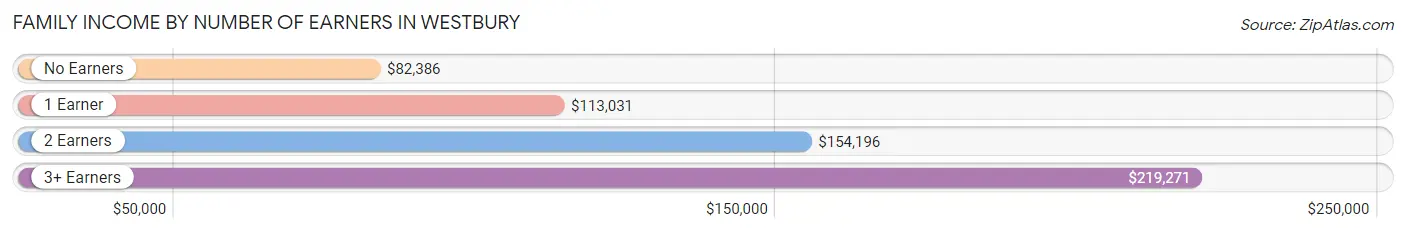
| Number of Earners | # Families | Median Income |
| No Earners | 222 (5.7%) | $82,386 |
| 1 Earner | 927 (23.9%) | $113,031 |
| 2 Earners | 1,829 (47.1%) | $154,196 |
| 3+ Earners | 903 (23.3%) | $219,271 |
| Total | 3,881 (100.0%) | $141,870 |
Household Income in Westbury
Household Income Brackets in Westbury
With 1,504 households falling in the category, the $200,000+ income range is the most frequent in Westbury, accounting for 29.0% of all households. In contrast, only 10 households (0.2%) fall into the $10,000 to $14,999 income bracket, making it the least populous group.
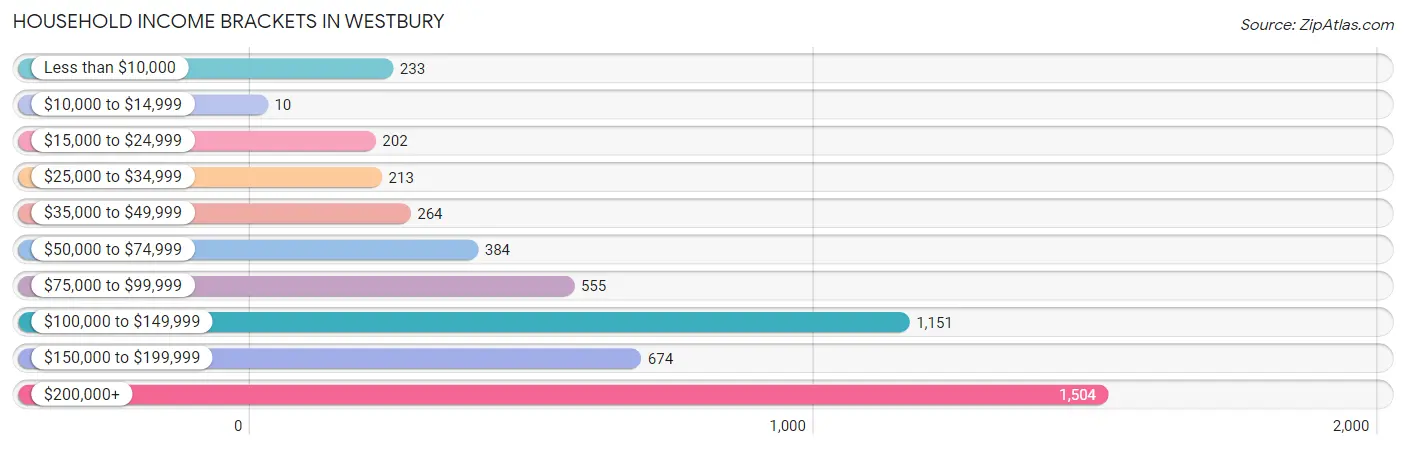
| Income Bracket | # Households | % Households |
| Less than $10,000 | 233 | 4.5% |
| $10,000 to $14,999 | 10 | 0.2% |
| $15,000 to $24,999 | 202 | 3.9% |
| $25,000 to $34,999 | 213 | 4.1% |
| $35,000 to $49,999 | 264 | 5.1% |
| $50,000 to $74,999 | 384 | 7.4% |
| $75,000 to $99,999 | 555 | 10.7% |
| $100,000 to $149,999 | 1,151 | 22.2% |
| $150,000 to $199,999 | 674 | 13.0% |
| $200,000+ | 1,504 | 29.0% |
Household Income by Householder Age in Westbury
The median household income in Westbury is $125,976, with the highest median household income of $155,917 found in the 25 to 44 years age bracket for the primary householder. A total of 1,274 households (24.6%) fall into this category. Meanwhile, the 65+ years age bracket for the primary householder has the lowest median household income of $89,087, with 1,580 households (30.5%) in this group.
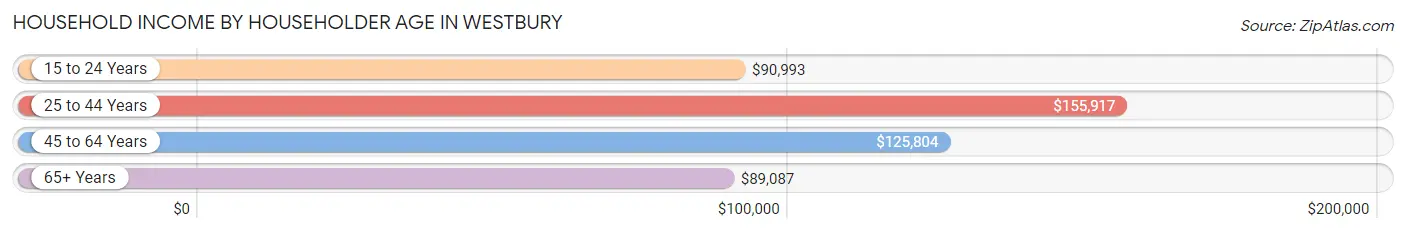
| Income Bracket | # Households | Median Income |
| 15 to 24 Years | 59 (1.1%) | $90,993 |
| 25 to 44 Years | 1,274 (24.6%) | $155,917 |
| 45 to 64 Years | 2,273 (43.8%) | $125,804 |
| 65+ Years | 1,580 (30.5%) | $89,087 |
| Total | 5,186 (100.0%) | $125,976 |
Poverty in Westbury
Income Below Poverty by Sex and Age in Westbury
With 3.6% poverty level for males and 4.9% for females among the residents of Westbury, 75 year old and over males and 15 year old females are the most vulnerable to poverty, with 57 males (12.8%) and 33 females (63.5%) in their respective age groups living below the poverty level.
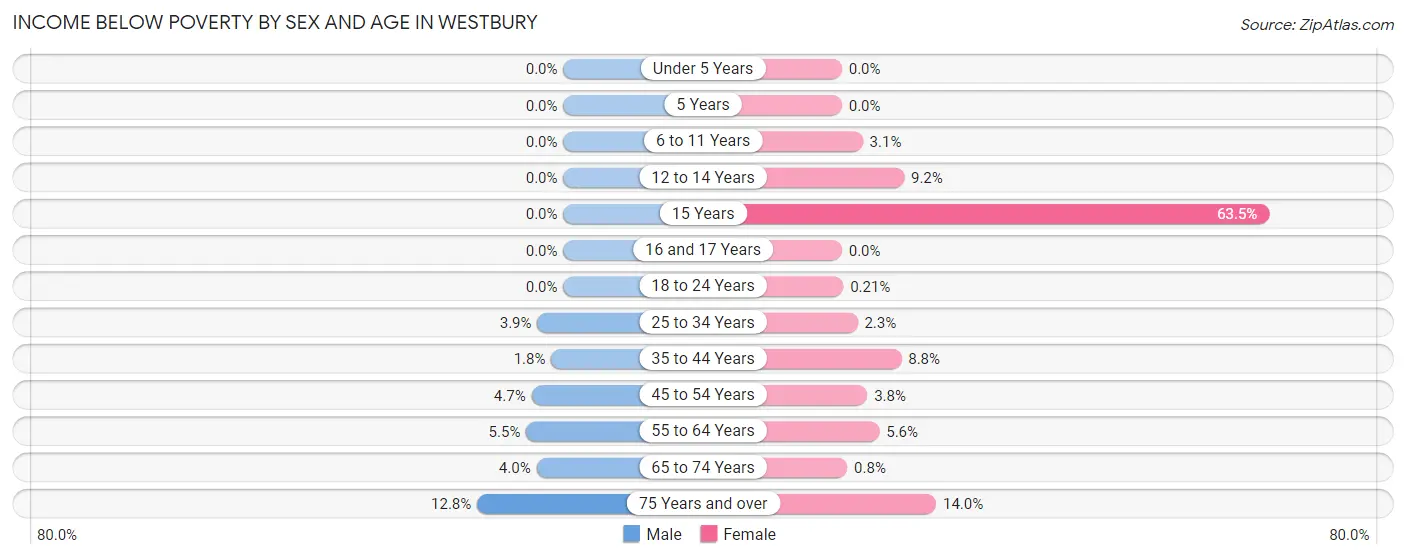
| Age Bracket | Male | Female |
| Under 5 Years | 0 (0.0%) | 0 (0.0%) |
| 5 Years | 0 (0.0%) | 0 (0.0%) |
| 6 to 11 Years | 0 (0.0%) | 24 (3.1%) |
| 12 to 14 Years | 0 (0.0%) | 34 (9.2%) |
| 15 Years | 0 (0.0%) | 33 (63.5%) |
| 16 and 17 Years | 0 (0.0%) | 0 (0.0%) |
| 18 to 24 Years | 0 (0.0%) | 1 (0.2%) |
| 25 to 34 Years | 33 (3.9%) | 25 (2.3%) |
| 35 to 44 Years | 21 (1.8%) | 77 (8.8%) |
| 45 to 54 Years | 52 (4.7%) | 43 (3.8%) |
| 55 to 64 Years | 72 (5.5%) | 70 (5.6%) |
| 65 to 74 Years | 32 (4.0%) | 7 (0.8%) |
| 75 Years and over | 57 (12.8%) | 90 (14.0%) |
| Total | 267 (3.6%) | 404 (4.9%) |
Income Above Poverty by Sex and Age in Westbury
According to the poverty statistics in Westbury, males aged under 5 years and females aged under 5 years are the age groups that are most secure financially, with 100.0% of males and 100.0% of females in these age groups living above the poverty line.
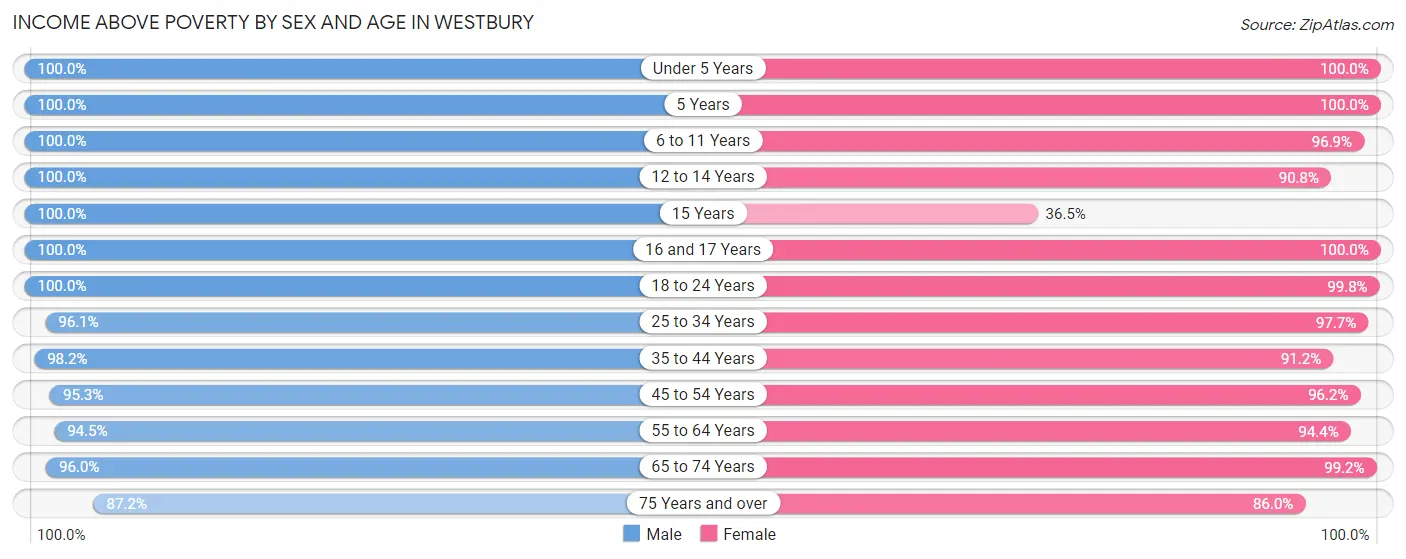
| Age Bracket | Male | Female |
| Under 5 Years | 372 (100.0%) | 610 (100.0%) |
| 5 Years | 10 (100.0%) | 40 (100.0%) |
| 6 to 11 Years | 430 (100.0%) | 750 (96.9%) |
| 12 to 14 Years | 201 (100.0%) | 334 (90.8%) |
| 15 Years | 133 (100.0%) | 19 (36.5%) |
| 16 and 17 Years | 178 (100.0%) | 97 (100.0%) |
| 18 to 24 Years | 434 (100.0%) | 483 (99.8%) |
| 25 to 34 Years | 822 (96.1%) | 1,047 (97.7%) |
| 35 to 44 Years | 1,152 (98.2%) | 795 (91.2%) |
| 45 to 54 Years | 1,048 (95.3%) | 1,095 (96.2%) |
| 55 to 64 Years | 1,234 (94.5%) | 1,186 (94.4%) |
| 65 to 74 Years | 771 (96.0%) | 871 (99.2%) |
| 75 Years and over | 388 (87.2%) | 553 (86.0%) |
| Total | 7,173 (96.4%) | 7,880 (95.1%) |
Income Below Poverty Among Married-Couple Families in Westbury
The poverty statistics for married-couple families in Westbury show that 2.3% or 66 of the total 2,915 families live below the poverty line. Families with 1 or 2 children have the highest poverty rate of 3.0%, comprising of 30 families. On the other hand, families with 3 or 4 children have the lowest poverty rate of 0.0%, which includes 0 families.
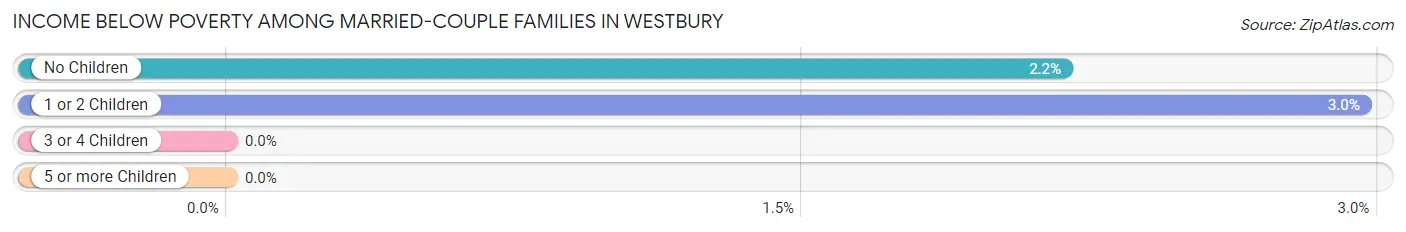
| Children | Above Poverty | Below Poverty |
| No Children | 1,619 (97.8%) | 36 (2.2%) |
| 1 or 2 Children | 985 (97.0%) | 30 (3.0%) |
| 3 or 4 Children | 245 (100.0%) | 0 (0.0%) |
| 5 or more Children | 0 (0.0%) | 0 (0.0%) |
| Total | 2,849 (97.7%) | 66 (2.3%) |
Income Below Poverty Among Single-Parent Households in Westbury
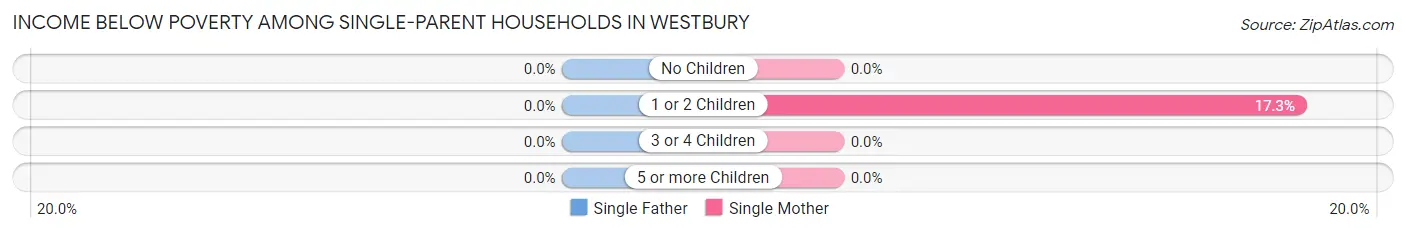
| Children | Single Father | Single Mother |
| No Children | 0 (0.0%) | 0 (0.0%) |
| 1 or 2 Children | 0 (0.0%) | 44 (17.2%) |
| 3 or 4 Children | 0 (0.0%) | 0 (0.0%) |
| 5 or more Children | 0 (0.0%) | 0 (0.0%) |
| Total | 0 (0.0%) | 44 (8.1%) |
Income Below Poverty Among Married-Couple vs Single-Parent Households in Westbury
The poverty data for Westbury shows that 66 of the married-couple family households (2.3%) and 44 of the single-parent households (4.5%) are living below the poverty level. Within the married-couple family households, those with 1 or 2 children have the highest poverty rate, with 30 households (3.0%) falling below the poverty line. Among the single-parent households, those with 1 or 2 children have the highest poverty rate, with 44 household (13.1%) living below poverty.
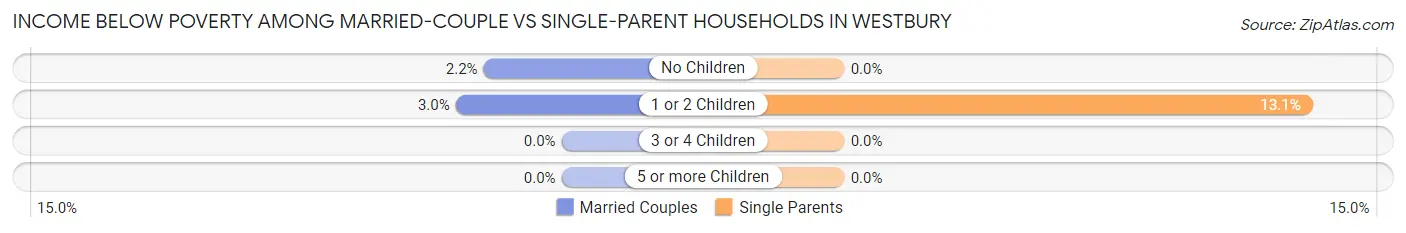
| Children | Married-Couple Families | Single-Parent Households |
| No Children | 36 (2.2%) | 0 (0.0%) |
| 1 or 2 Children | 30 (3.0%) | 44 (13.1%) |
| 3 or 4 Children | 0 (0.0%) | 0 (0.0%) |
| 5 or more Children | 0 (0.0%) | 0 (0.0%) |
| Total | 66 (2.3%) | 44 (4.5%) |
Race in Westbury
The most populous races in Westbury are White / Caucasian (6,965 | 44.1%), Hispanic or Latino (5,079 | 32.2%), and Some other Race (3,015 | 19.1%).
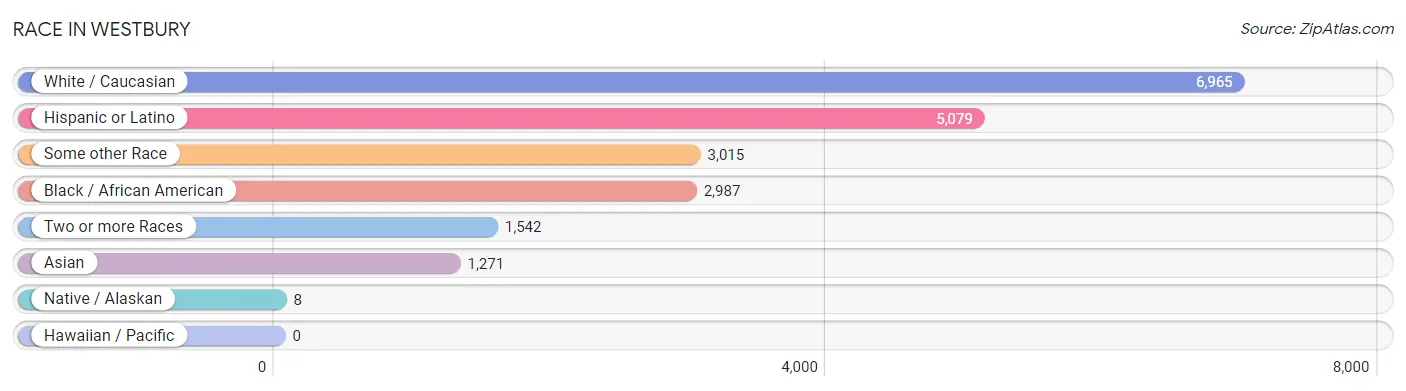
| Race | # Population | % Population |
| Asian | 1,271 | 8.1% |
| Black / African American | 2,987 | 18.9% |
| Hawaiian / Pacific | 0 | 0.0% |
| Hispanic or Latino | 5,079 | 32.2% |
| Native / Alaskan | 8 | 0.1% |
| White / Caucasian | 6,965 | 44.1% |
| Two or more Races | 1,542 | 9.8% |
| Some other Race | 3,015 | 19.1% |
| Total | 15,788 | 100.0% |
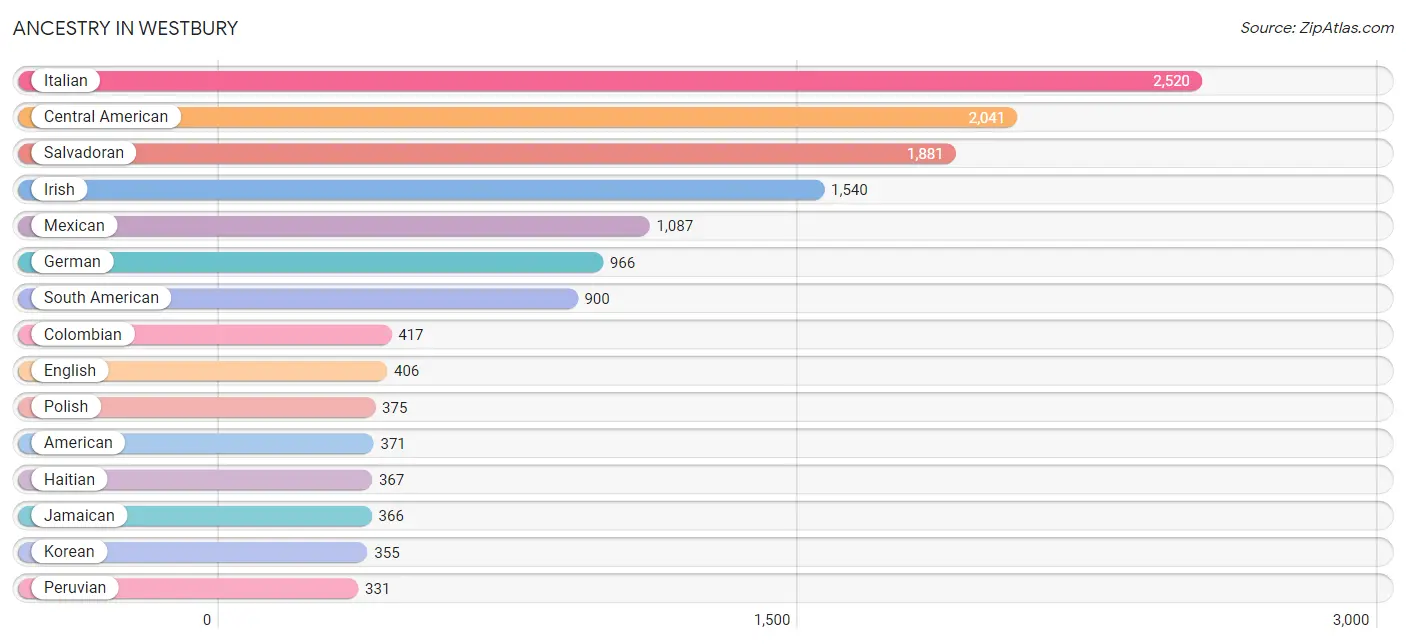
Ancestry in Westbury
The most populous ancestries reported in Westbury are Italian (2,520 | 16.0%), Central American (2,041 | 12.9%), Salvadoran (1,881 | 11.9%), Irish (1,540 | 9.8%), and Mexican (1,087 | 6.9%), together accounting for 57.4% of all Westbury residents.
| Ancestry | # Population | % Population |
| African | 49 | 0.3% |
| Albanian | 204 | 1.3% |
| American | 371 | 2.4% |
| Arab | 7 | 0.0% |
| Argentinean | 20 | 0.1% |
| Armenian | 16 | 0.1% |
| Austrian | 29 | 0.2% |
| Barbadian | 18 | 0.1% |
| Belgian | 25 | 0.2% |
| Bhutanese | 69 | 0.4% |
| Brazilian | 89 | 0.6% |
| Burmese | 161 | 1.0% |
| Canadian | 10 | 0.1% |
| Central American | 2,041 | 12.9% |
| Chilean | 45 | 0.3% |
| Colombian | 417 | 2.6% |
| Costa Rican | 49 | 0.3% |
| Cuban | 46 | 0.3% |
| Cypriot | 43 | 0.3% |
| Czech | 27 | 0.2% |
| Czechoslovakian | 7 | 0.0% |
| Danish | 22 | 0.1% |
| Dominican | 226 | 1.4% |
| Dutch | 39 | 0.3% |
| Eastern European | 19 | 0.1% |
| Ecuadorian | 66 | 0.4% |
| Egyptian | 7 | 0.0% |
| English | 406 | 2.6% |
| European | 45 | 0.3% |
| French | 24 | 0.2% |
| French Canadian | 56 | 0.4% |
| German | 966 | 6.1% |
| Greek | 129 | 0.8% |
| Guatemalan | 30 | 0.2% |
| Guyanese | 119 | 0.7% |
| Haitian | 367 | 2.3% |
| Honduran | 67 | 0.4% |
| Hungarian | 34 | 0.2% |
| Indian (Asian) | 312 | 2.0% |
| Irish | 1,540 | 9.8% |
| Iroquois | 8 | 0.1% |
| Israeli | 48 | 0.3% |
| Italian | 2,520 | 16.0% |
| Jamaican | 366 | 2.3% |
| Kenyan | 12 | 0.1% |
| Korean | 355 | 2.2% |
| Lithuanian | 26 | 0.2% |
| Maltese | 11 | 0.1% |
| Mexican | 1,087 | 6.9% |
| Nigerian | 13 | 0.1% |
| Northern European | 8 | 0.1% |
| Norwegian | 9 | 0.1% |
| Pakistani | 15 | 0.1% |
| Panamanian | 14 | 0.1% |
| Peruvian | 331 | 2.1% |
| Polish | 375 | 2.4% |
| Portuguese | 325 | 2.1% |
| Puerto Rican | 290 | 1.8% |
| Romanian | 8 | 0.1% |
| Russian | 153 | 1.0% |
| Salvadoran | 1,881 | 11.9% |
| Scotch-Irish | 70 | 0.4% |
| Scottish | 4 | 0.0% |
| South American | 900 | 5.7% |
| Spaniard | 69 | 0.4% |
| Spanish | 61 | 0.4% |
| Sri Lankan | 8 | 0.1% |
| Subsaharan African | 74 | 0.5% |
| Swedish | 33 | 0.2% |
| Swiss | 25 | 0.2% |
| Thai | 302 | 1.9% |
| Trinidadian and Tobagonian | 48 | 0.3% |
| U.S. Virgin Islander | 32 | 0.2% |
| Ukrainian | 51 | 0.3% |
| Venezuelan | 21 | 0.1% |
| Welsh | 10 | 0.1% |
| West Indian | 67 | 0.4% | View All 77 Rows |
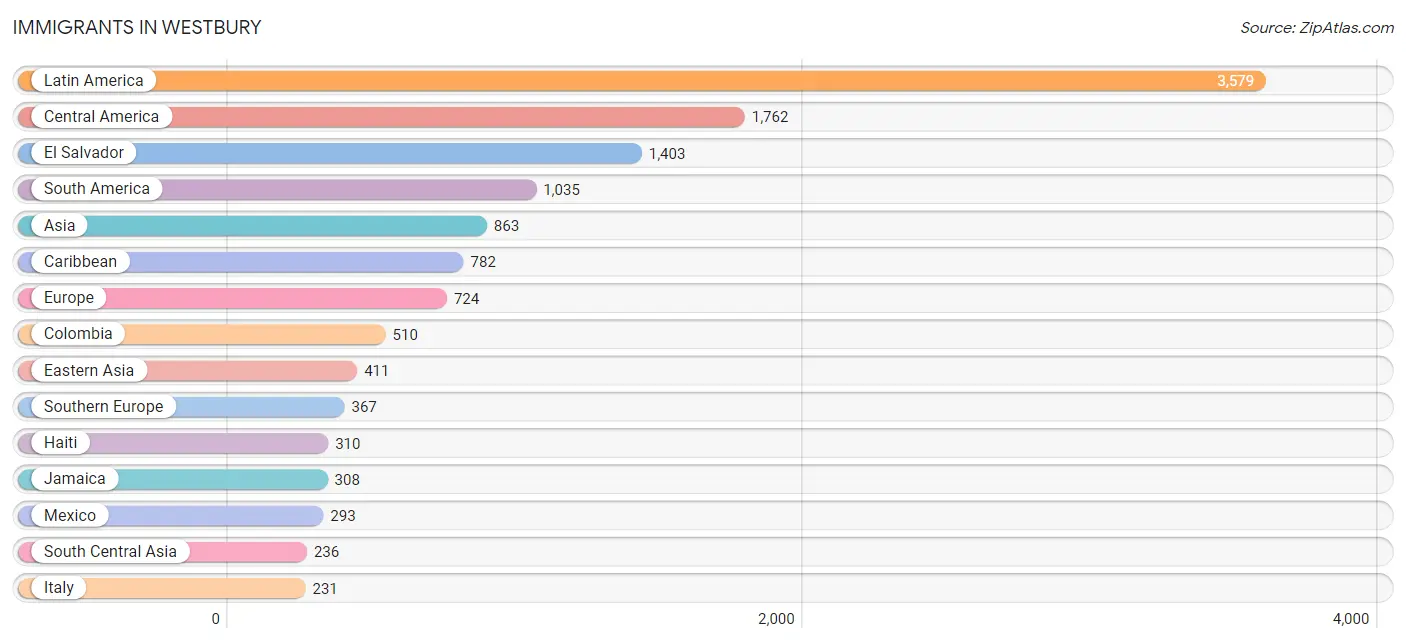
Immigrants in Westbury
The most numerous immigrant groups reported in Westbury came from Latin America (3,579 | 22.7%), Central America (1,762 | 11.2%), El Salvador (1,403 | 8.9%), South America (1,035 | 6.6%), and Asia (863 | 5.5%), together accounting for 54.7% of all Westbury residents.
| Immigration Origin | # Population | % Population |
| Africa | 43 | 0.3% |
| Albania | 108 | 0.7% |
| Argentina | 12 | 0.1% |
| Asia | 863 | 5.5% |
| Australia | 6 | 0.0% |
| Bangladesh | 11 | 0.1% |
| Brazil | 57 | 0.4% |
| Canada | 12 | 0.1% |
| Caribbean | 782 | 5.0% |
| Central America | 1,762 | 11.2% |
| China | 224 | 1.4% |
| Colombia | 510 | 3.2% |
| Cuba | 33 | 0.2% |
| Denmark | 47 | 0.3% |
| Dominican Republic | 26 | 0.2% |
| Eastern Africa | 12 | 0.1% |
| Eastern Asia | 411 | 2.6% |
| Eastern Europe | 169 | 1.1% |
| Ecuador | 144 | 0.9% |
| El Salvador | 1,403 | 8.9% |
| England | 29 | 0.2% |
| Europe | 724 | 4.6% |
| France | 47 | 0.3% |
| Germany | 26 | 0.2% |
| Ghana | 18 | 0.1% |
| Guatemala | 30 | 0.2% |
| Guyana | 119 | 0.7% |
| Haiti | 310 | 2.0% |
| Honduras | 36 | 0.2% |
| Hong Kong | 62 | 0.4% |
| India | 129 | 0.8% |
| Ireland | 39 | 0.3% |
| Israel | 29 | 0.2% |
| Italy | 231 | 1.5% |
| Jamaica | 308 | 1.9% |
| Japan | 33 | 0.2% |
| Kenya | 12 | 0.1% |
| Korea | 154 | 1.0% |
| Latin America | 3,579 | 22.7% |
| Mexico | 293 | 1.9% |
| Nigeria | 13 | 0.1% |
| Northern Europe | 115 | 0.7% |
| Oceania | 6 | 0.0% |
| Pakistan | 83 | 0.5% |
| Peru | 172 | 1.1% |
| Philippines | 152 | 1.0% |
| Poland | 33 | 0.2% |
| Portugal | 102 | 0.6% |
| Russia | 16 | 0.1% |
| Singapore | 11 | 0.1% |
| South America | 1,035 | 6.6% |
| South Central Asia | 236 | 1.5% |
| South Eastern Asia | 163 | 1.0% |
| Southern Europe | 367 | 2.3% |
| Spain | 34 | 0.2% |
| Taiwan | 16 | 0.1% |
| Trinidad and Tobago | 31 | 0.2% |
| Ukraine | 12 | 0.1% |
| Uzbekistan | 13 | 0.1% |
| Venezuela | 21 | 0.1% |
| West Indies | 74 | 0.5% |
| Western Africa | 31 | 0.2% |
| Western Asia | 53 | 0.3% |
| Western Europe | 73 | 0.5% | View All 64 Rows |
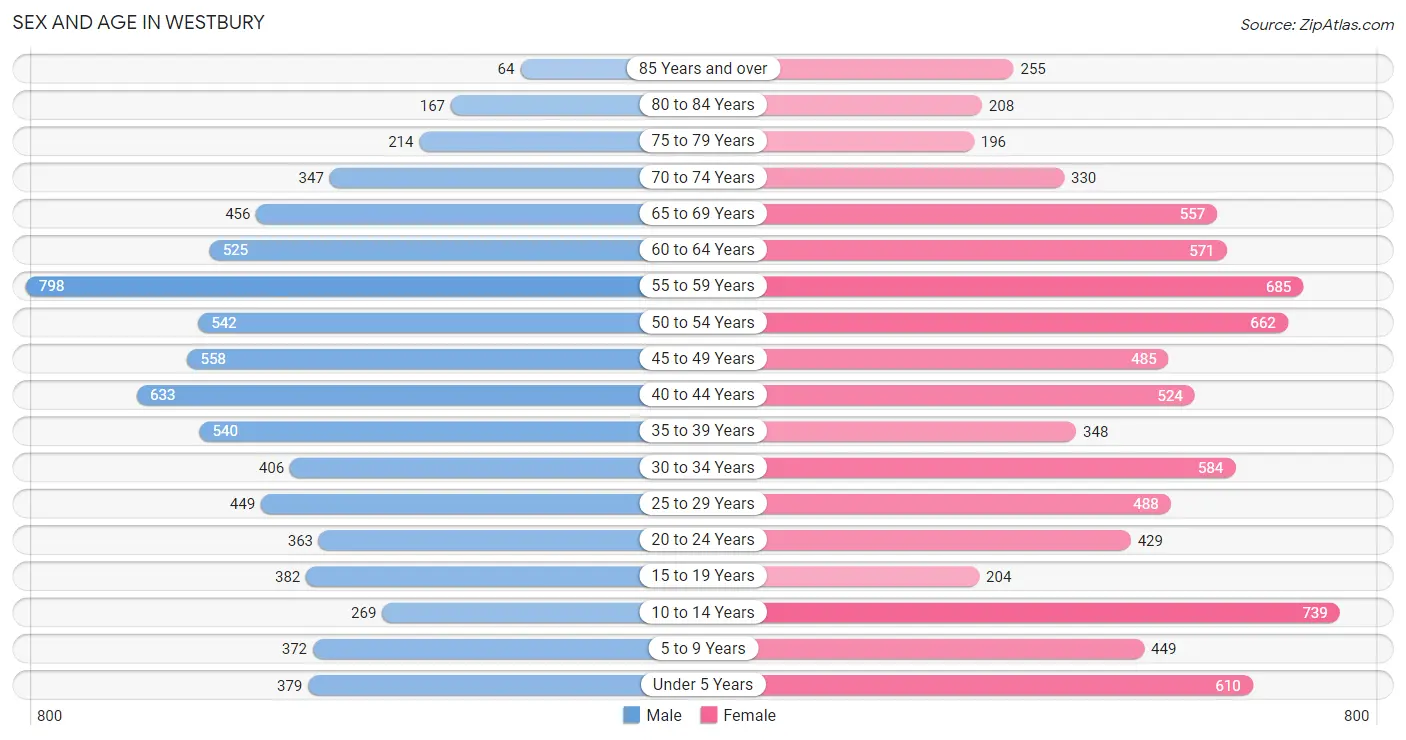
Sex and Age in Westbury
Sex and Age in Westbury
The most populous age groups in Westbury are 55 to 59 Years (798 | 10.7%) for men and 10 to 14 Years (739 | 8.9%) for women.
| Age Bracket | Male | Female |
| Under 5 Years | 379 (5.1%) | 610 (7.3%) |
| 5 to 9 Years | 372 (5.0%) | 449 (5.4%) |
| 10 to 14 Years | 269 (3.6%) | 739 (8.9%) |
| 15 to 19 Years | 382 (5.1%) | 204 (2.5%) |
| 20 to 24 Years | 363 (4.9%) | 429 (5.1%) |
| 25 to 29 Years | 449 (6.0%) | 488 (5.9%) |
| 30 to 34 Years | 406 (5.4%) | 584 (7.0%) |
| 35 to 39 Years | 540 (7.2%) | 348 (4.2%) |
| 40 to 44 Years | 633 (8.5%) | 524 (6.3%) |
| 45 to 49 Years | 558 (7.5%) | 485 (5.8%) |
| 50 to 54 Years | 542 (7.3%) | 662 (8.0%) |
| 55 to 59 Years | 798 (10.7%) | 685 (8.2%) |
| 60 to 64 Years | 525 (7.0%) | 571 (6.9%) |
| 65 to 69 Years | 456 (6.1%) | 557 (6.7%) |
| 70 to 74 Years | 347 (4.6%) | 330 (4.0%) |
| 75 to 79 Years | 214 (2.9%) | 196 (2.4%) |
| 80 to 84 Years | 167 (2.2%) | 208 (2.5%) |
| 85 Years and over | 64 (0.9%) | 255 (3.1%) |
| Total | 7,464 (100.0%) | 8,324 (100.0%) |
Families and Households in Westbury
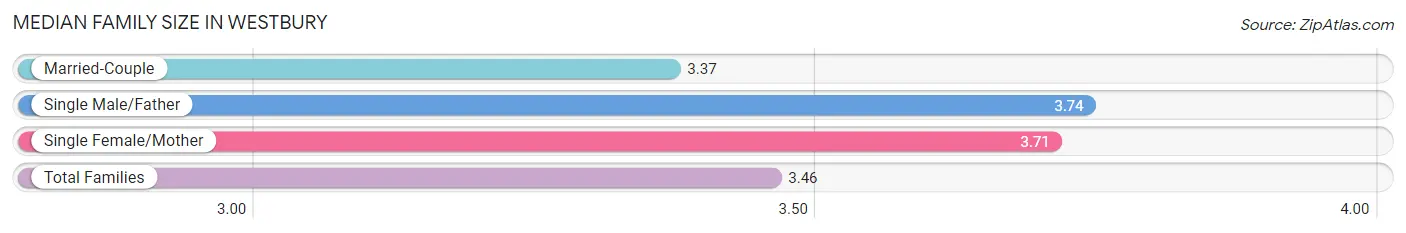
Median Family Size in Westbury
The median family size in Westbury is 3.46 persons per family, with single male/father families (421 | 10.8%) accounting for the largest median family size of 3.74 persons per family. On the other hand, married-couple families (2,915 | 75.1%) represent the smallest median family size with 3.37 persons per family.
| Family Type | # Families | Family Size |
| Married-Couple | 2,915 (75.1%) | 3.37 |
| Single Male/Father | 421 (10.8%) | 3.74 |
| Single Female/Mother | 545 (14.0%) | 3.71 |
| Total Families | 3,881 (100.0%) | 3.46 |
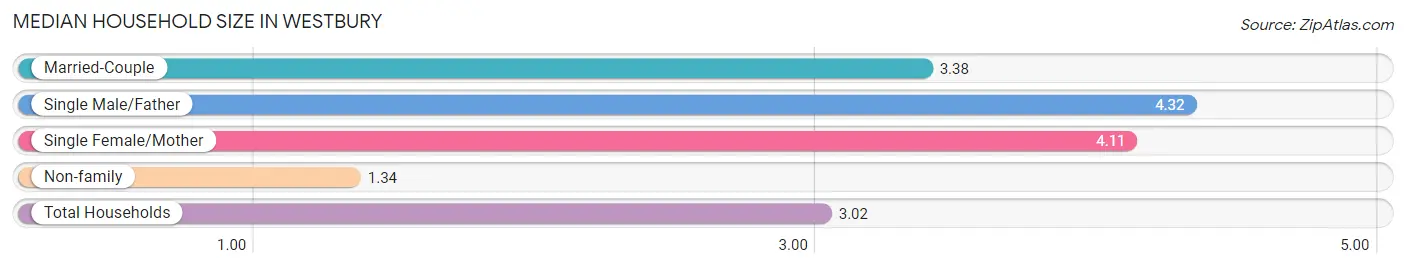
Median Household Size in Westbury
The median household size in Westbury is 3.02 persons per household, with single male/father households (421 | 8.1%) accounting for the largest median household size of 4.32 persons per household. non-family households (1,305 | 25.2%) represent the smallest median household size with 1.34 persons per household.
| Household Type | # Households | Household Size |
| Married-Couple | 2,915 (56.2%) | 3.38 |
| Single Male/Father | 421 (8.1%) | 4.32 |
| Single Female/Mother | 545 (10.5%) | 4.11 |
| Non-family | 1,305 (25.2%) | 1.34 |
| Total Households | 5,186 (100.0%) | 3.02 |
Household Size by Marriage Status in Westbury
Out of a total of 5,186 households in Westbury, 3,881 (74.8%) are family households, while 1,305 (25.2%) are nonfamily households. The most numerous type of family households are 2-person households, comprising 1,254, and the most common type of nonfamily households are 1-person households, comprising 1,010.
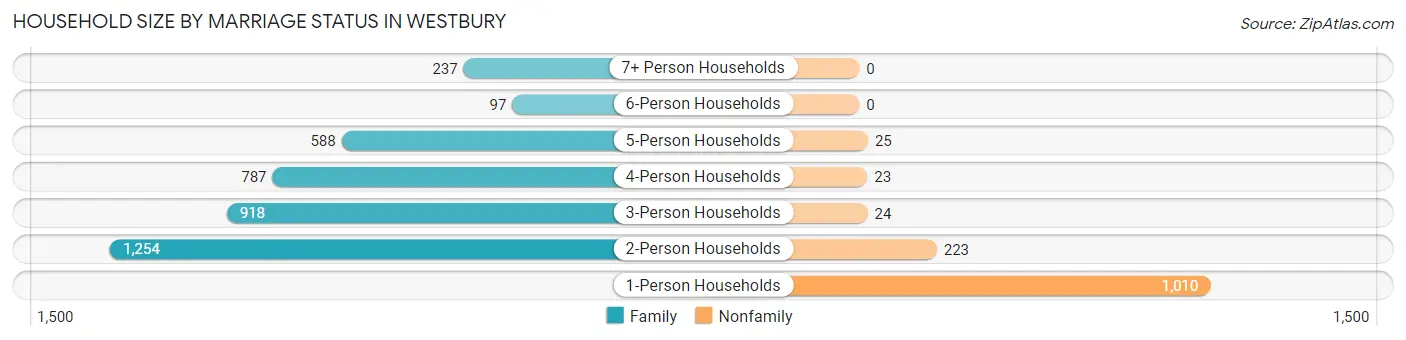
| Household Size | Family Households | Nonfamily Households |
| 1-Person Households | - | 1,010 (19.5%) |
| 2-Person Households | 1,254 (24.2%) | 223 (4.3%) |
| 3-Person Households | 918 (17.7%) | 24 (0.5%) |
| 4-Person Households | 787 (15.2%) | 23 (0.4%) |
| 5-Person Households | 588 (11.3%) | 25 (0.5%) |
| 6-Person Households | 97 (1.9%) | 0 (0.0%) |
| 7+ Person Households | 237 (4.6%) | 0 (0.0%) |
| Total | 3,881 (74.8%) | 1,305 (25.2%) |
Female Fertility in Westbury
Fertility by Age in Westbury
Average fertility rate in Westbury is 46.0 births per 1,000 women. Women in the age bracket of 35 to 50 years have the highest fertility rate with 50.0 births per 1,000 women. Women in the age bracket of 35 to 50 years acount for 51.7% of all women with births.
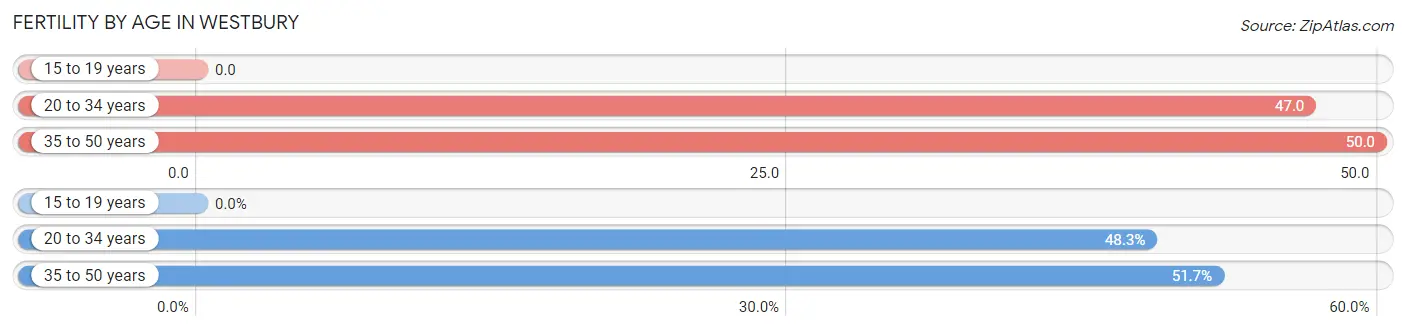
| Age Bracket | Women with Births | Births / 1,000 Women |
| 15 to 19 years | 0 (0.0%) | 0.0 |
| 20 to 34 years | 71 (48.3%) | 47.0 |
| 35 to 50 years | 76 (51.7%) | 50.0 |
| Total | 147 (100.0%) | 46.0 |
Fertility by Age by Marriage Status in Westbury
90.5% of women with births (147) in Westbury are married. The highest percentage of unmarried women with births falls into 20 to 34 years age bracket with 19.7% of them unmarried at the time of birth, while the lowest percentage of unmarried women with births belong to 35 to 50 years age bracket with 0.0% of them unmarried.
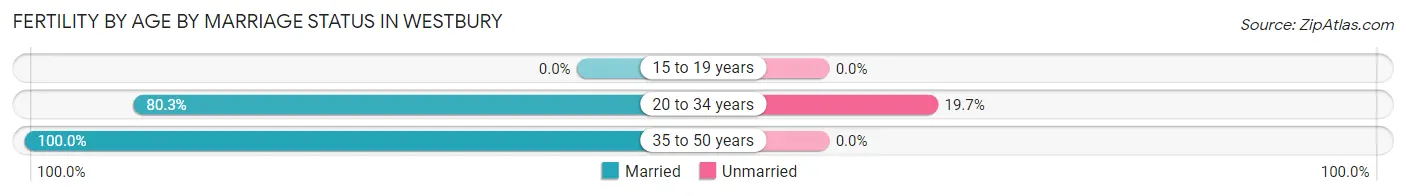
| Age Bracket | Married | Unmarried |
| 15 to 19 years | 0 (0.0%) | 0 (0.0%) |
| 20 to 34 years | 57 (80.3%) | 14 (19.7%) |
| 35 to 50 years | 76 (100.0%) | 0 (0.0%) |
| Total | 133 (90.5%) | 14 (9.5%) |
Fertility by Education in Westbury
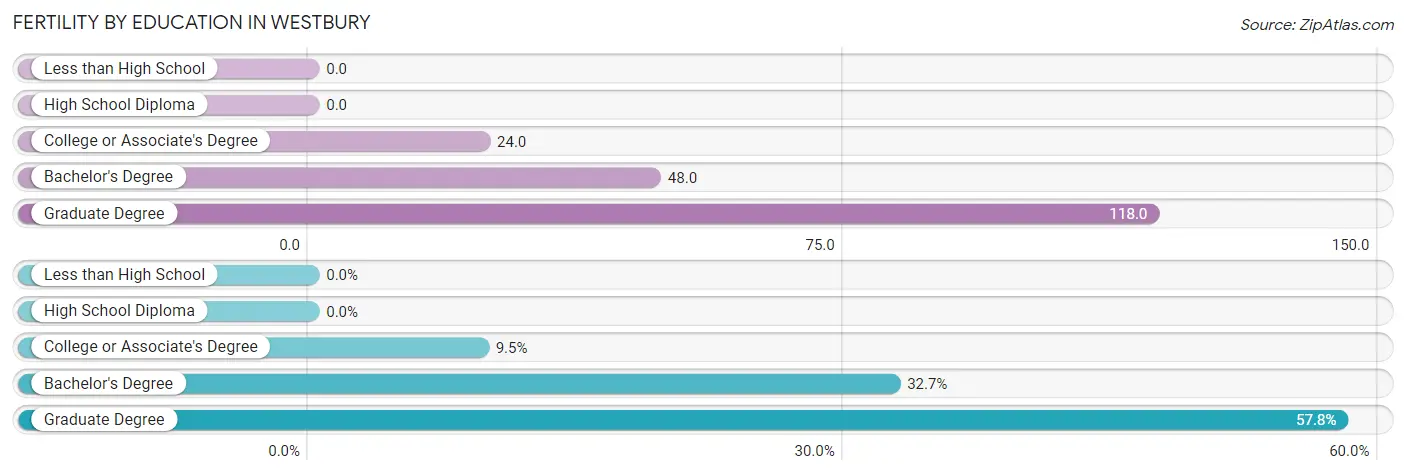
| Educational Attainment | Women with Births | Births / 1,000 Women |
| Less than High School | 0 (0.0%) | 0.0 |
| High School Diploma | 0 (0.0%) | 0.0 |
| College or Associate's Degree | 14 (9.5%) | 24.0 |
| Bachelor's Degree | 48 (32.7%) | 48.0 |
| Graduate Degree | 85 (57.8%) | 118.0 |
| Total | 147 (100.0%) | 46.0 |
Fertility by Education by Marriage Status in Westbury
9.5% of women with births in Westbury are unmarried. Women with the educational attainment of bachelor's degree are most likely to be married with 100.0% of them married at childbirth, while women with the educational attainment of college or associate's degree are least likely to be married with 100.0% of them unmarried at childbirth.
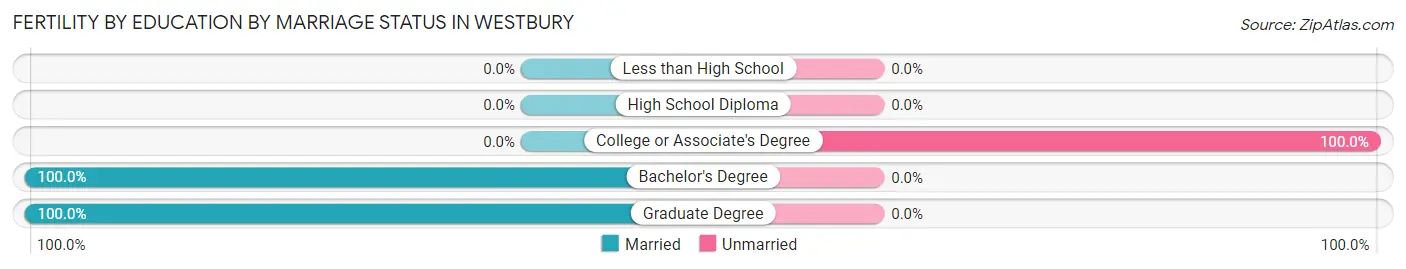
| Educational Attainment | Married | Unmarried |
| Less than High School | 0 (0.0%) | 0 (0.0%) |
| High School Diploma | 0 (0.0%) | 0 (0.0%) |
| College or Associate's Degree | 0 (0.0%) | 14 (100.0%) |
| Bachelor's Degree | 48 (100.0%) | 0 (0.0%) |
| Graduate Degree | 85 (100.0%) | 0 (0.0%) |
| Total | 133 (90.5%) | 14 (9.5%) |
Employment Characteristics in Westbury
Employment by Class of Employer in Westbury
Among the 8,337 employed individuals in Westbury, private company employees (5,137 | 61.6%), not-for-profit organizations (1,174 | 14.1%), and local government employees (756 | 9.1%) make up the most common classes of employment.
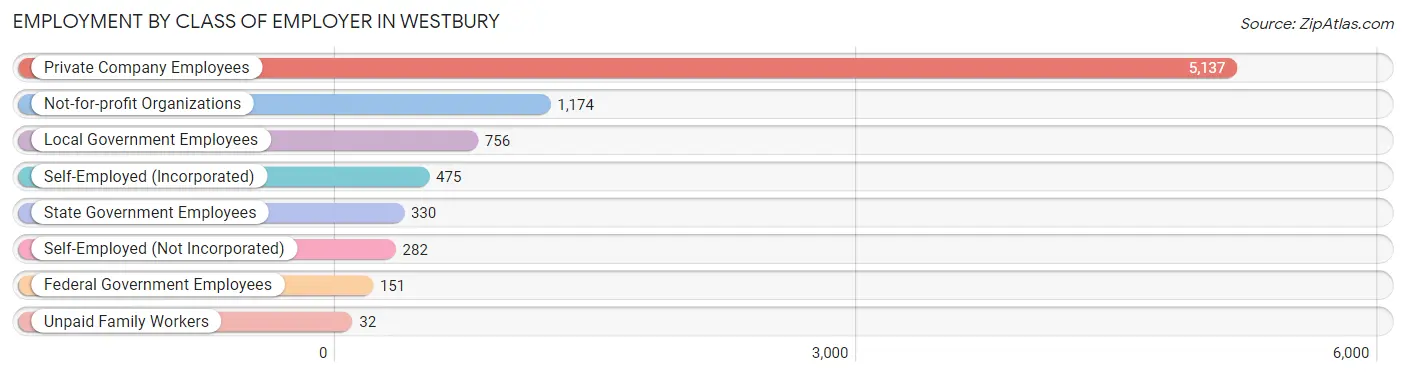
| Employer Class | # Employees | % Employees |
| Private Company Employees | 5,137 | 61.6% |
| Self-Employed (Incorporated) | 475 | 5.7% |
| Self-Employed (Not Incorporated) | 282 | 3.4% |
| Not-for-profit Organizations | 1,174 | 14.1% |
| Local Government Employees | 756 | 9.1% |
| State Government Employees | 330 | 4.0% |
| Federal Government Employees | 151 | 1.8% |
| Unpaid Family Workers | 32 | 0.4% |
| Total | 8,337 | 100.0% |
Employment Status by Age in Westbury
According to the labor force statistics for Westbury, out of the total population over 16 years of age (12,785), 69.7% or 8,911 individuals are in the labor force, with 3.2% or 285 of them unemployed. The age group with the highest labor force participation rate is 25 to 29 years, with 92.5% or 867 individuals in the labor force. Within the labor force, the 16 to 19 years age range has the highest percentage of unemployed individuals, with 24.3% or 33 of them being unemployed.
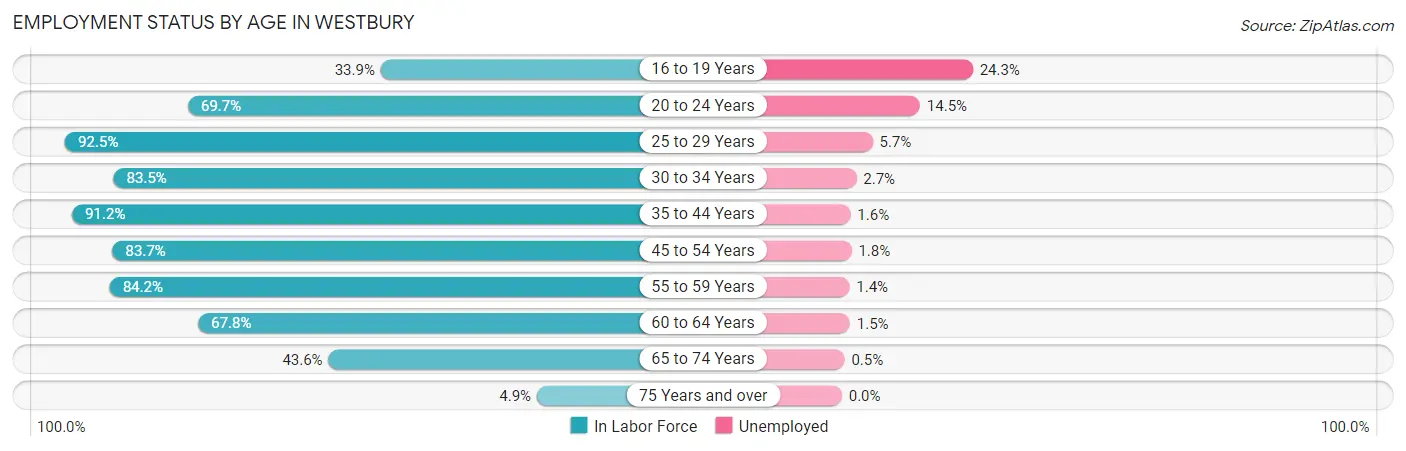
| Age Bracket | In Labor Force | Unemployed |
| 16 to 19 Years | 136 (33.9%) | 33 (24.3%) |
| 20 to 24 Years | 552 (69.7%) | 80 (14.5%) |
| 25 to 29 Years | 867 (92.5%) | 49 (5.7%) |
| 30 to 34 Years | 827 (83.5%) | 22 (2.7%) |
| 35 to 44 Years | 1,865 (91.2%) | 30 (1.6%) |
| 45 to 54 Years | 1,881 (83.7%) | 34 (1.8%) |
| 55 to 59 Years | 1,249 (84.2%) | 17 (1.4%) |
| 60 to 64 Years | 743 (67.8%) | 11 (1.5%) |
| 65 to 74 Years | 737 (43.6%) | 4 (0.5%) |
| 75 Years and over | 54 (4.9%) | 0 (0.0%) |
| Total | 8,911 (69.7%) | 285 (3.2%) |
Employment Status by Educational Attainment in Westbury
According to labor force statistics for Westbury, 84.5% of individuals (7,434) out of the total population between 25 and 64 years of age (8,798) are in the labor force, with 2.2% or 164 of them being unemployed. The group with the highest labor force participation rate are those with the educational attainment of college / associate degree, with 89.3% or 1,723 individuals in the labor force. Within the labor force, individuals with high school diploma education have the highest percentage of unemployment, with 4.1% or 49 of them being unemployed.
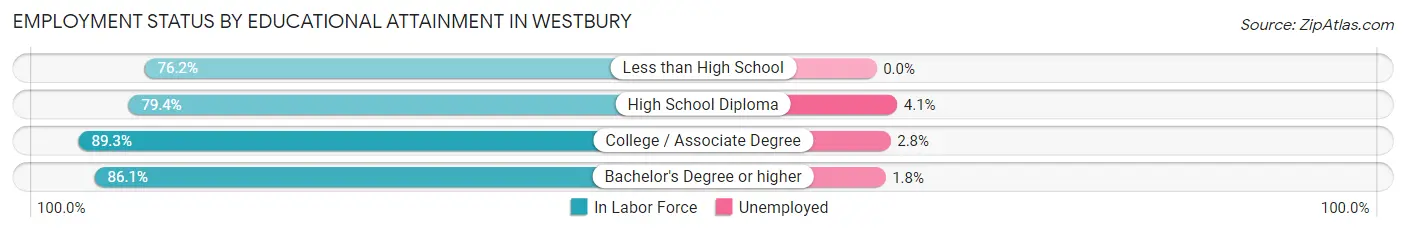
| Educational Attainment | In Labor Force | Unemployed |
| Less than High School | 794 (76.2%) | 0 (0.0%) |
| High School Diploma | 1,193 (79.4%) | 62 (4.1%) |
| College / Associate Degree | 1,723 (89.3%) | 54 (2.8%) |
| Bachelor's Degree or higher | 3,724 (86.1%) | 78 (1.8%) |
| Total | 7,434 (84.5%) | 194 (2.2%) |
Employment Occupations by Sex in Westbury
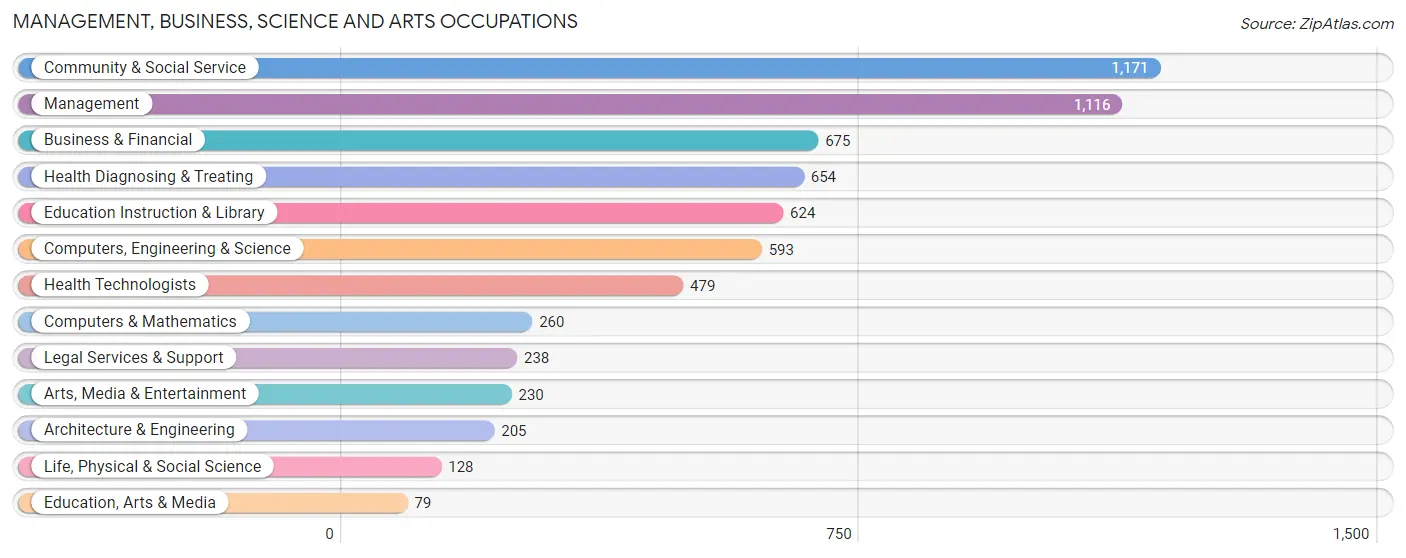
Management, Business, Science and Arts Occupations
The most common Management, Business, Science and Arts occupations in Westbury are Community & Social Service (1,171 | 13.6%), Management (1,116 | 13.0%), Business & Financial (675 | 7.9%), Health Diagnosing & Treating (654 | 7.6%), and Education Instruction & Library (624 | 7.2%).
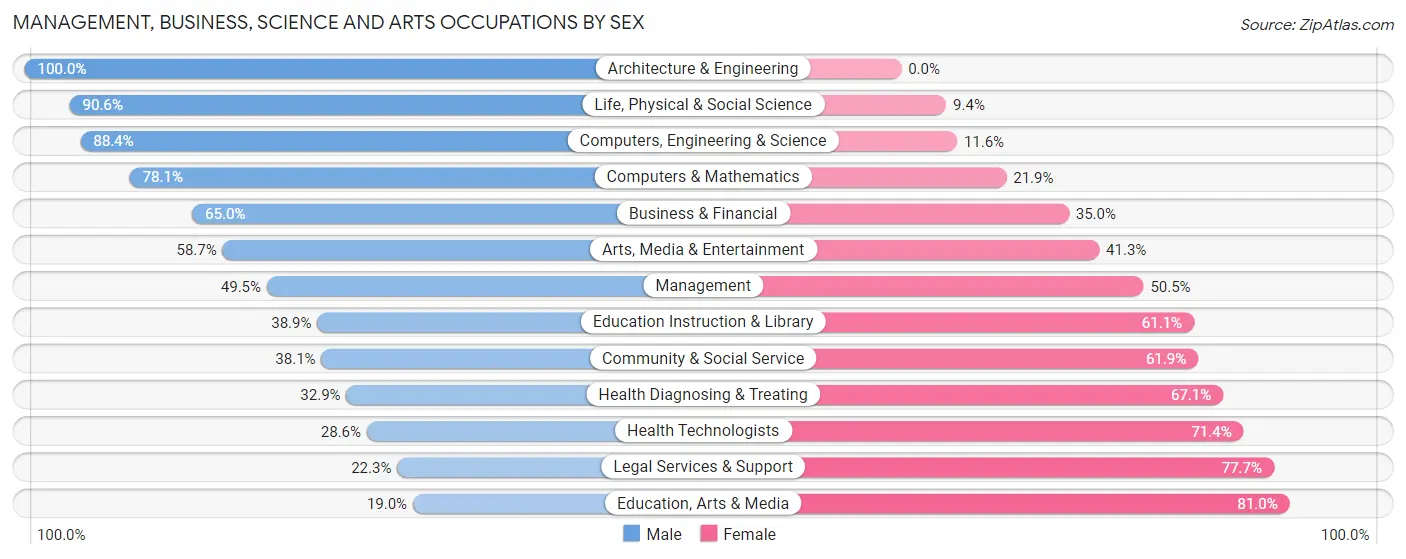
Management, Business, Science and Arts Occupations by Sex
Within the Management, Business, Science and Arts occupations in Westbury, the most male-oriented occupations are Architecture & Engineering (100.0%), Life, Physical & Social Science (90.6%), and Computers, Engineering & Science (88.4%), while the most female-oriented occupations are Education, Arts & Media (81.0%), Legal Services & Support (77.7%), and Health Technologists (71.4%).
| Occupation | Male | Female |
| Management | 552 (49.5%) | 564 (50.5%) |
| Business & Financial | 439 (65.0%) | 236 (35.0%) |
| Computers, Engineering & Science | 524 (88.4%) | 69 (11.6%) |
| Computers & Mathematics | 203 (78.1%) | 57 (21.9%) |
| Architecture & Engineering | 205 (100.0%) | 0 (0.0%) |
| Life, Physical & Social Science | 116 (90.6%) | 12 (9.4%) |
| Community & Social Service | 446 (38.1%) | 725 (61.9%) |
| Education, Arts & Media | 15 (19.0%) | 64 (81.0%) |
| Legal Services & Support | 53 (22.3%) | 185 (77.7%) |
| Education Instruction & Library | 243 (38.9%) | 381 (61.1%) |
| Arts, Media & Entertainment | 135 (58.7%) | 95 (41.3%) |
| Health Diagnosing & Treating | 215 (32.9%) | 439 (67.1%) |
| Health Technologists | 137 (28.6%) | 342 (71.4%) |
| Total (Category) | 2,176 (51.7%) | 2,033 (48.3%) |
| Total (Overall) | 4,493 (52.2%) | 4,110 (47.8%) |
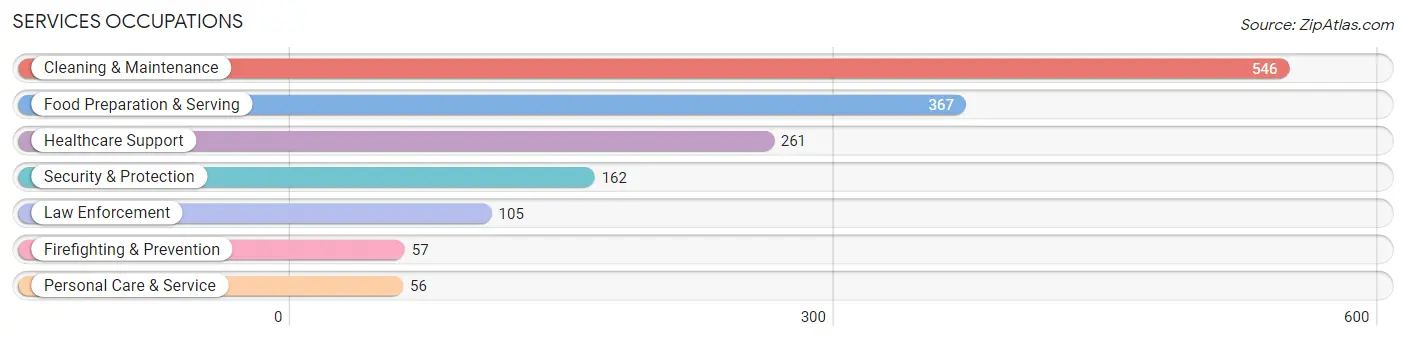
Services Occupations
The most common Services occupations in Westbury are Cleaning & Maintenance (546 | 6.4%), Food Preparation & Serving (367 | 4.3%), Healthcare Support (261 | 3.0%), Security & Protection (162 | 1.9%), and Law Enforcement (105 | 1.2%).
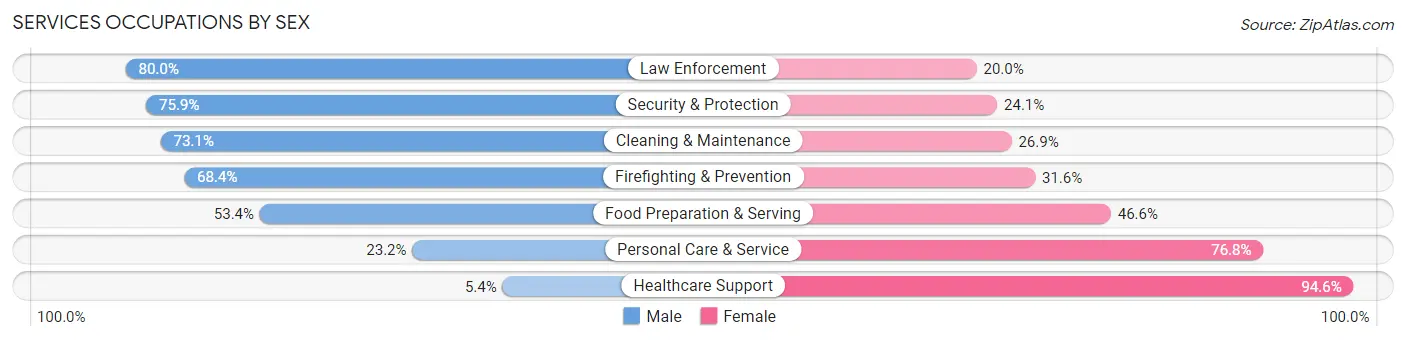
Services Occupations by Sex
Within the Services occupations in Westbury, the most male-oriented occupations are Law Enforcement (80.0%), Security & Protection (75.9%), and Cleaning & Maintenance (73.1%), while the most female-oriented occupations are Healthcare Support (94.6%), Personal Care & Service (76.8%), and Food Preparation & Serving (46.6%).
| Occupation | Male | Female |
| Healthcare Support | 14 (5.4%) | 247 (94.6%) |
| Security & Protection | 123 (75.9%) | 39 (24.1%) |
| Firefighting & Prevention | 39 (68.4%) | 18 (31.6%) |
| Law Enforcement | 84 (80.0%) | 21 (20.0%) |
| Food Preparation & Serving | 196 (53.4%) | 171 (46.6%) |
| Cleaning & Maintenance | 399 (73.1%) | 147 (26.9%) |
| Personal Care & Service | 13 (23.2%) | 43 (76.8%) |
| Total (Category) | 745 (53.5%) | 647 (46.5%) |
| Total (Overall) | 4,493 (52.2%) | 4,110 (47.8%) |
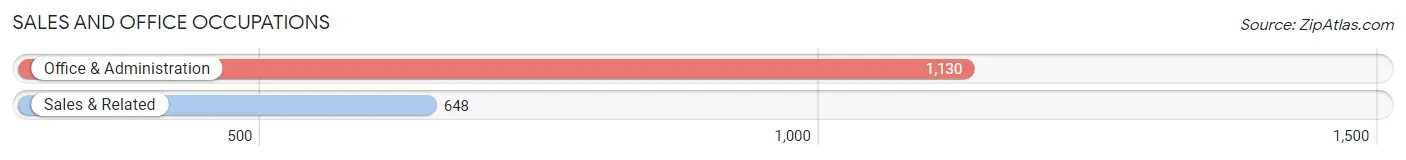
Sales and Office Occupations
The most common Sales and Office occupations in Westbury are Office & Administration (1,130 | 13.1%), and Sales & Related (648 | 7.5%).
Sales and Office Occupations by Sex
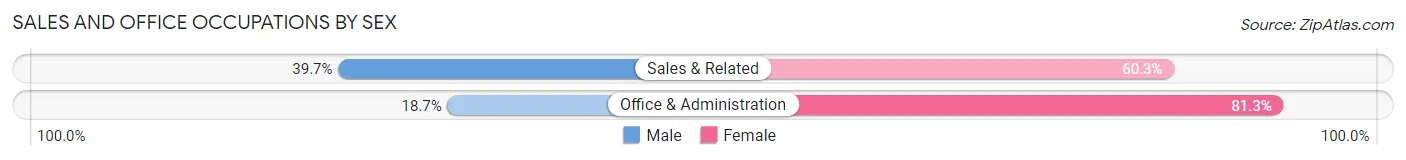
| Occupation | Male | Female |
| Sales & Related | 257 (39.7%) | 391 (60.3%) |
| Office & Administration | 211 (18.7%) | 919 (81.3%) |
| Total (Category) | 468 (26.3%) | 1,310 (73.7%) |
| Total (Overall) | 4,493 (52.2%) | 4,110 (47.8%) |
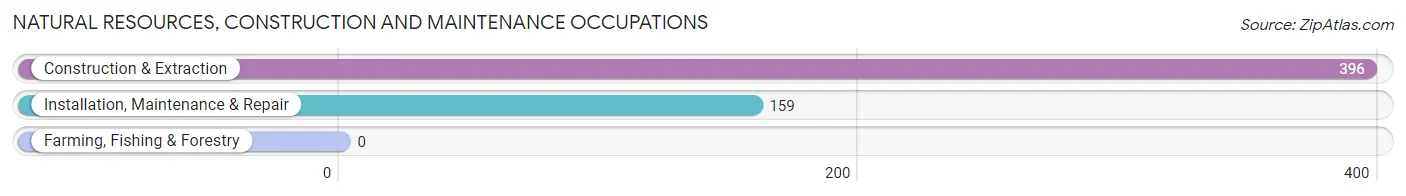
Natural Resources, Construction and Maintenance Occupations
The most common Natural Resources, Construction and Maintenance occupations in Westbury are Construction & Extraction (396 | 4.6%), and Installation, Maintenance & Repair (159 | 1.8%).
Natural Resources, Construction and Maintenance Occupations by Sex
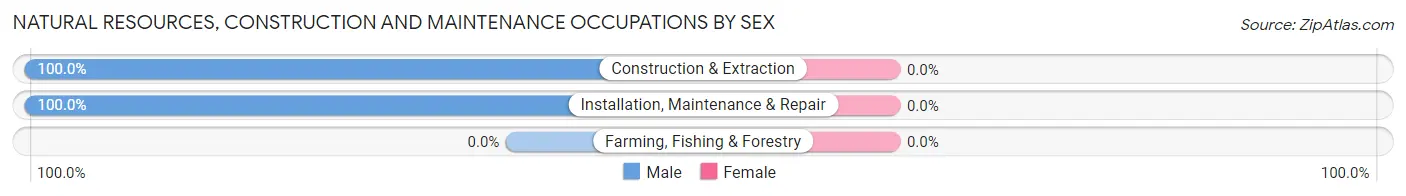
| Occupation | Male | Female |
| Farming, Fishing & Forestry | 0 (0.0%) | 0 (0.0%) |
| Construction & Extraction | 396 (100.0%) | 0 (0.0%) |
| Installation, Maintenance & Repair | 159 (100.0%) | 0 (0.0%) |
| Total (Category) | 555 (100.0%) | 0 (0.0%) |
| Total (Overall) | 4,493 (52.2%) | 4,110 (47.8%) |
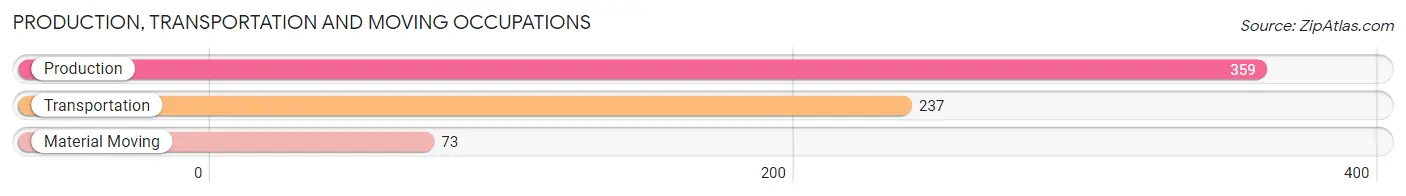
Production, Transportation and Moving Occupations
The most common Production, Transportation and Moving occupations in Westbury are Production (359 | 4.2%), Transportation (237 | 2.8%), and Material Moving (73 | 0.9%).
Production, Transportation and Moving Occupations by Sex
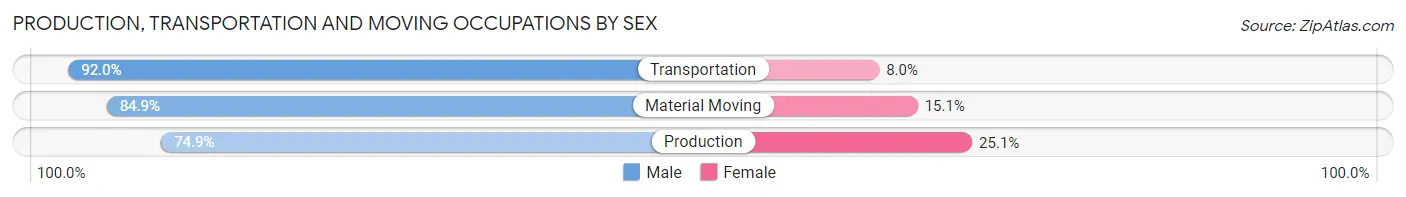
| Occupation | Male | Female |
| Production | 269 (74.9%) | 90 (25.1%) |
| Transportation | 218 (92.0%) | 19 (8.0%) |
| Material Moving | 62 (84.9%) | 11 (15.1%) |
| Total (Category) | 549 (82.1%) | 120 (17.9%) |
| Total (Overall) | 4,493 (52.2%) | 4,110 (47.8%) |
Employment Industries by Sex in Westbury
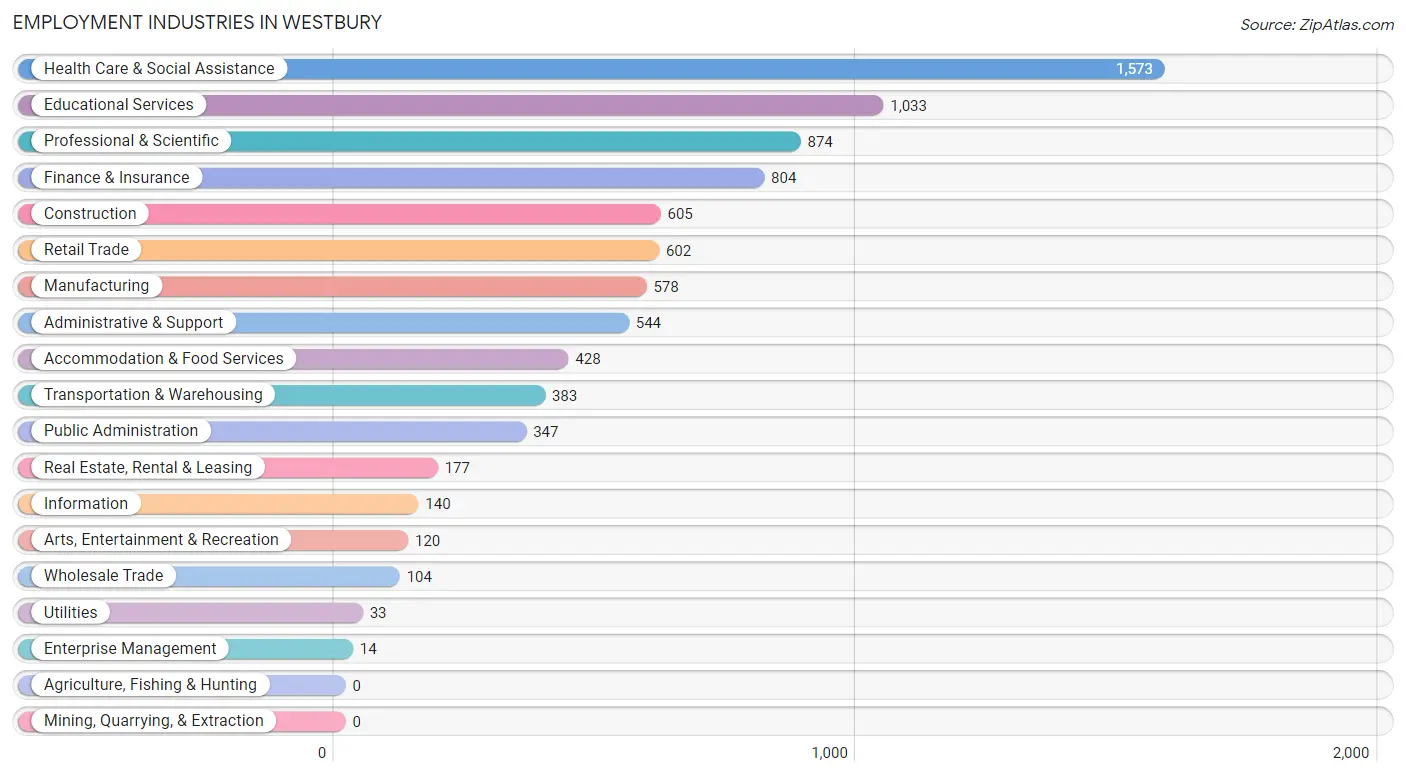
Employment Industries in Westbury
The major employment industries in Westbury include Health Care & Social Assistance (1,573 | 18.3%), Educational Services (1,033 | 12.0%), Professional & Scientific (874 | 10.2%), Finance & Insurance (804 | 9.3%), and Construction (605 | 7.0%).
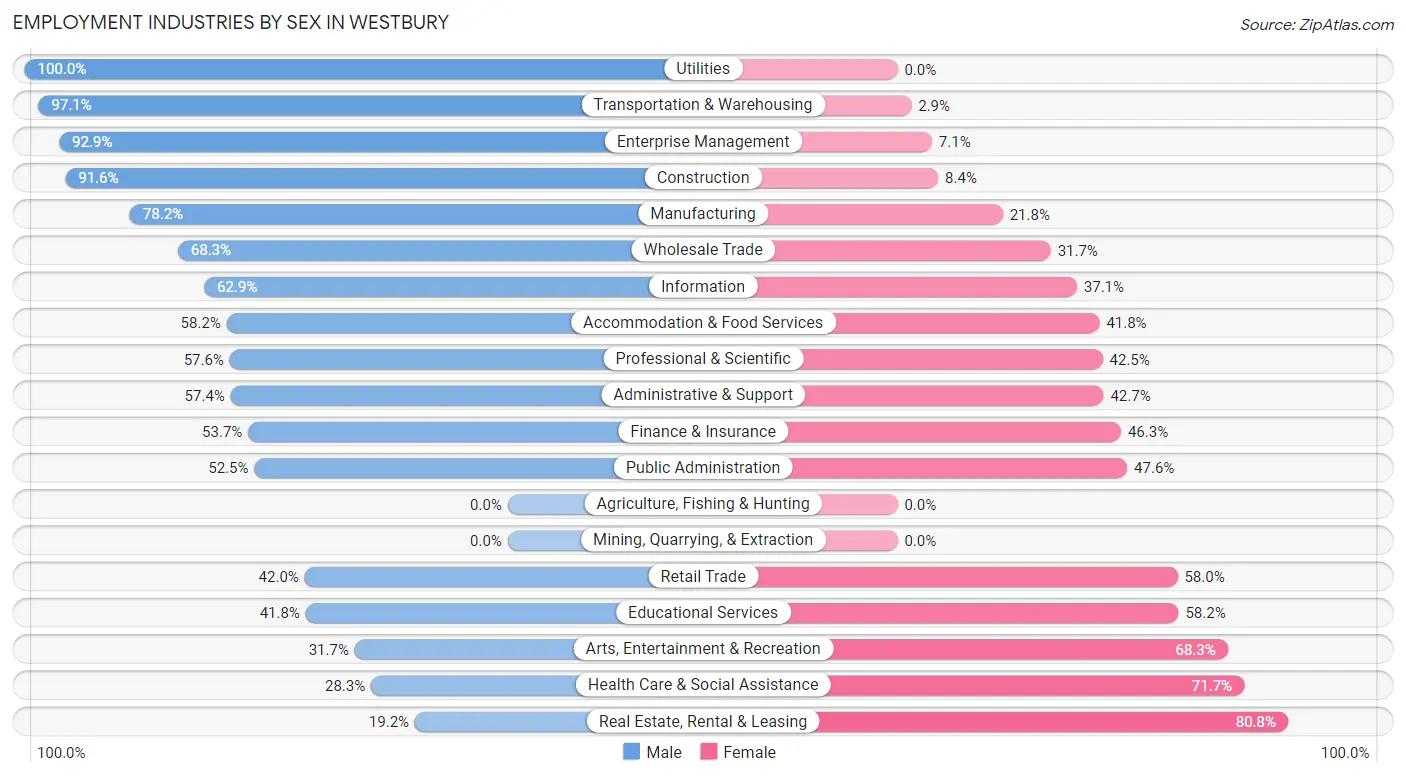
Employment Industries by Sex in Westbury
The Westbury industries that see more men than women are Utilities (100.0%), Transportation & Warehousing (97.1%), and Enterprise Management (92.9%), whereas the industries that tend to have a higher number of women are Real Estate, Rental & Leasing (80.8%), Health Care & Social Assistance (71.7%), and Arts, Entertainment & Recreation (68.3%).
| Industry | Male | Female |
| Agriculture, Fishing & Hunting | 0 (0.0%) | 0 (0.0%) |
| Mining, Quarrying, & Extraction | 0 (0.0%) | 0 (0.0%) |
| Construction | 554 (91.6%) | 51 (8.4%) |
| Manufacturing | 452 (78.2%) | 126 (21.8%) |
| Wholesale Trade | 71 (68.3%) | 33 (31.7%) |
| Retail Trade | 253 (42.0%) | 349 (58.0%) |
| Transportation & Warehousing | 372 (97.1%) | 11 (2.9%) |
| Utilities | 33 (100.0%) | 0 (0.0%) |
| Information | 88 (62.9%) | 52 (37.1%) |
| Finance & Insurance | 432 (53.7%) | 372 (46.3%) |
| Real Estate, Rental & Leasing | 34 (19.2%) | 143 (80.8%) |
| Professional & Scientific | 503 (57.6%) | 371 (42.4%) |
| Enterprise Management | 13 (92.9%) | 1 (7.1%) |
| Administrative & Support | 312 (57.4%) | 232 (42.6%) |
| Educational Services | 432 (41.8%) | 601 (58.2%) |
| Health Care & Social Assistance | 445 (28.3%) | 1,128 (71.7%) |
| Arts, Entertainment & Recreation | 38 (31.7%) | 82 (68.3%) |
| Accommodation & Food Services | 249 (58.2%) | 179 (41.8%) |
| Public Administration | 182 (52.4%) | 165 (47.5%) |
| Total | 4,493 (52.2%) | 4,110 (47.8%) |
Education in Westbury
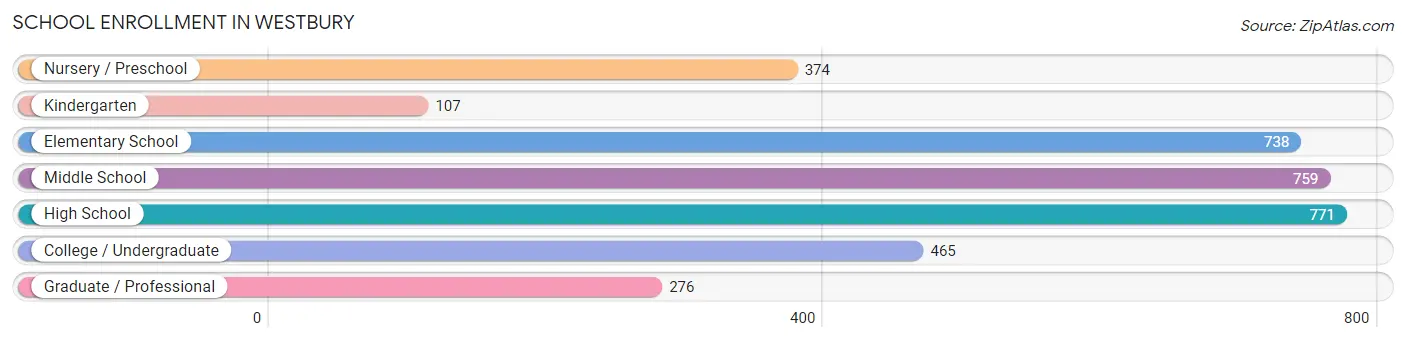
School Enrollment in Westbury
The most common levels of schooling among the 3,490 students in Westbury are high school (771 | 22.1%), middle school (759 | 21.7%), and elementary school (738 | 21.1%).
| School Level | # Students | % Students |
| Nursery / Preschool | 374 | 10.7% |
| Kindergarten | 107 | 3.1% |
| Elementary School | 738 | 21.1% |
| Middle School | 759 | 21.7% |
| High School | 771 | 22.1% |
| College / Undergraduate | 465 | 13.3% |
| Graduate / Professional | 276 | 7.9% |
| Total | 3,490 | 100.0% |
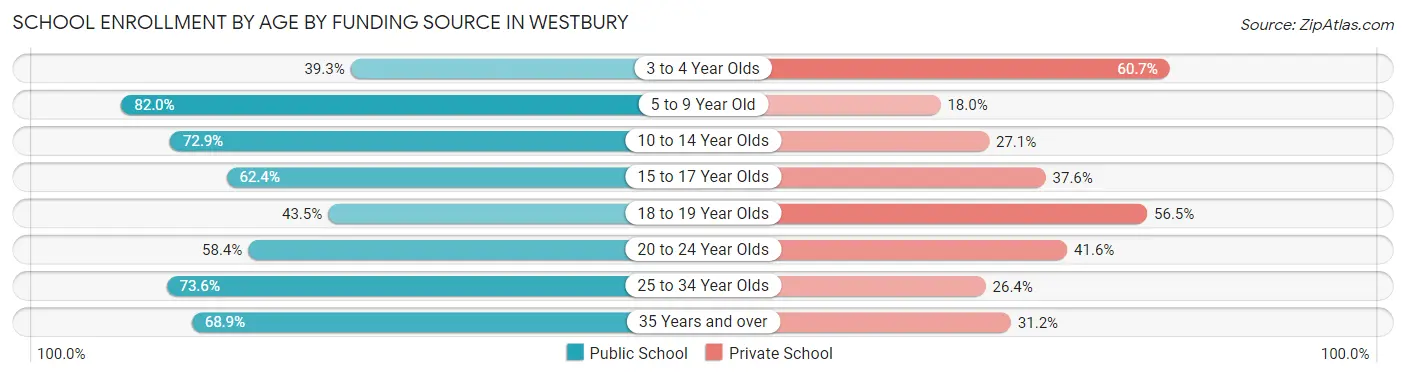
School Enrollment by Age by Funding Source in Westbury
Out of a total of 3,490 students who are enrolled in schools in Westbury, 1,113 (31.9%) attend a private institution, while the remaining 2,377 (68.1%) are enrolled in public schools. The age group of 3 to 4 year olds has the highest likelihood of being enrolled in private schools, with 227 (60.7% in the age bracket) enrolled. Conversely, the age group of 5 to 9 year old has the lowest likelihood of being enrolled in a private school, with 673 (82.0% in the age bracket) attending a public institution.
| Age Bracket | Public School | Private School |
| 3 to 4 Year Olds | 147 (39.3%) | 227 (60.7%) |
| 5 to 9 Year Old | 673 (82.0%) | 148 (18.0%) |
| 10 to 14 Year Olds | 735 (72.9%) | 273 (27.1%) |
| 15 to 17 Year Olds | 287 (62.4%) | 173 (37.6%) |
| 18 to 19 Year Olds | 30 (43.5%) | 39 (56.5%) |
| 20 to 24 Year Olds | 143 (58.4%) | 102 (41.6%) |
| 25 to 34 Year Olds | 153 (73.6%) | 55 (26.4%) |
| 35 Years and over | 210 (68.9%) | 95 (31.1%) |
| Total | 2,377 (68.1%) | 1,113 (31.9%) |
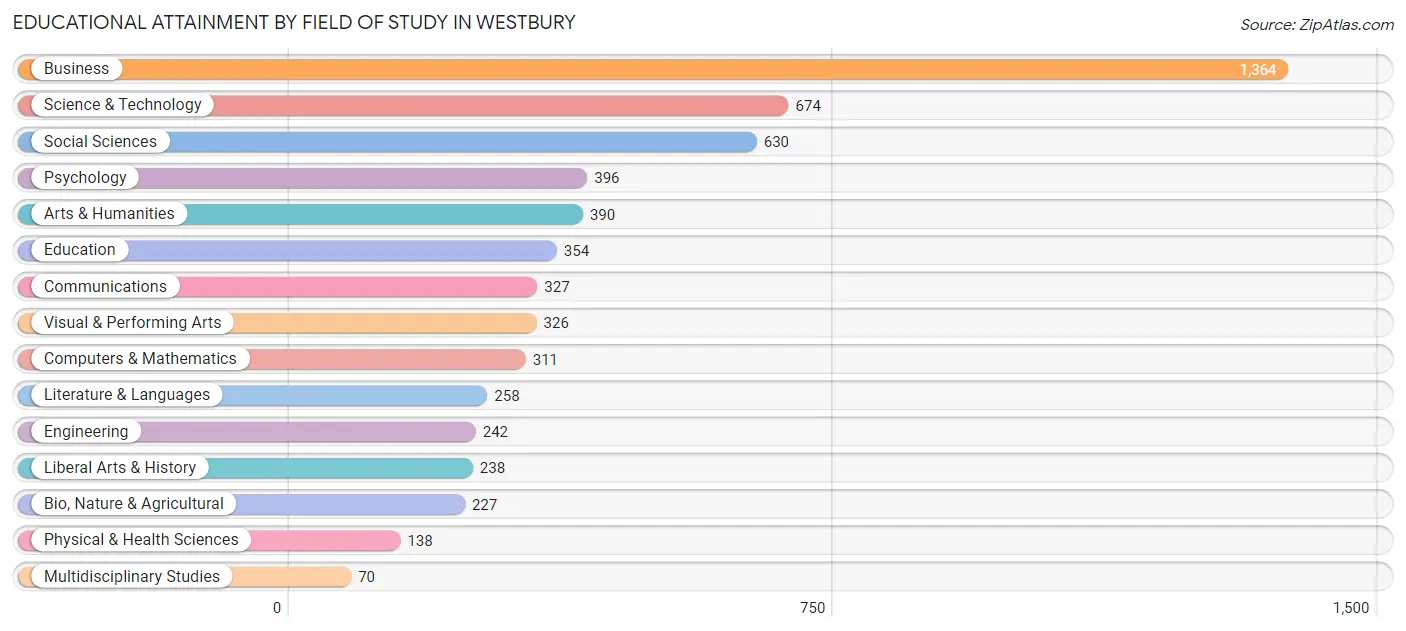
Educational Attainment by Field of Study in Westbury
Business (1,364 | 22.9%), science & technology (674 | 11.3%), social sciences (630 | 10.6%), psychology (396 | 6.7%), and arts & humanities (390 | 6.6%) are the most common fields of study among 5,945 individuals in Westbury who have obtained a bachelor's degree or higher.
| Field of Study | # Graduates | % Graduates |
| Computers & Mathematics | 311 | 5.2% |
| Bio, Nature & Agricultural | 227 | 3.8% |
| Physical & Health Sciences | 138 | 2.3% |
| Psychology | 396 | 6.7% |
| Social Sciences | 630 | 10.6% |
| Engineering | 242 | 4.1% |
| Multidisciplinary Studies | 70 | 1.2% |
| Science & Technology | 674 | 11.3% |
| Business | 1,364 | 22.9% |
| Education | 354 | 5.9% |
| Literature & Languages | 258 | 4.3% |
| Liberal Arts & History | 238 | 4.0% |
| Visual & Performing Arts | 326 | 5.5% |
| Communications | 327 | 5.5% |
| Arts & Humanities | 390 | 6.6% |
| Total | 5,945 | 100.0% |
Transportation & Commute in Westbury
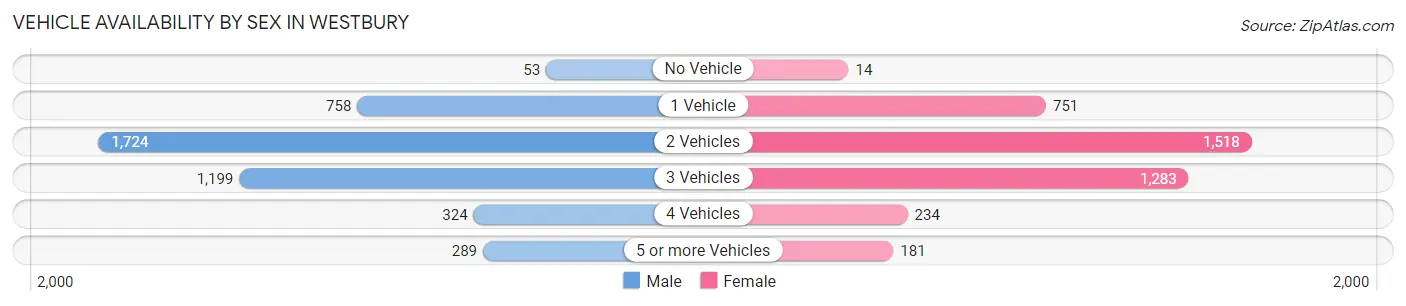
Vehicle Availability by Sex in Westbury
The most prevalent vehicle ownership categories in Westbury are males with 2 vehicles (1,724, accounting for 39.7%) and females with 2 vehicles (1,518, making up 43.3%).
| Vehicles Available | Male | Female |
| No Vehicle | 53 (1.2%) | 14 (0.4%) |
| 1 Vehicle | 758 (17.4%) | 751 (18.9%) |
| 2 Vehicles | 1,724 (39.7%) | 1,518 (38.1%) |
| 3 Vehicles | 1,199 (27.6%) | 1,283 (32.2%) |
| 4 Vehicles | 324 (7.4%) | 234 (5.9%) |
| 5 or more Vehicles | 289 (6.7%) | 181 (4.5%) |
| Total | 4,347 (100.0%) | 3,981 (100.0%) |
Commute Time in Westbury
The most frequently occuring commute durations in Westbury are 10 to 14 minutes (1,265 commuters, 16.6%), 15 to 19 minutes (1,260 commuters, 16.5%), and 45 to 59 minutes (958 commuters, 12.6%).
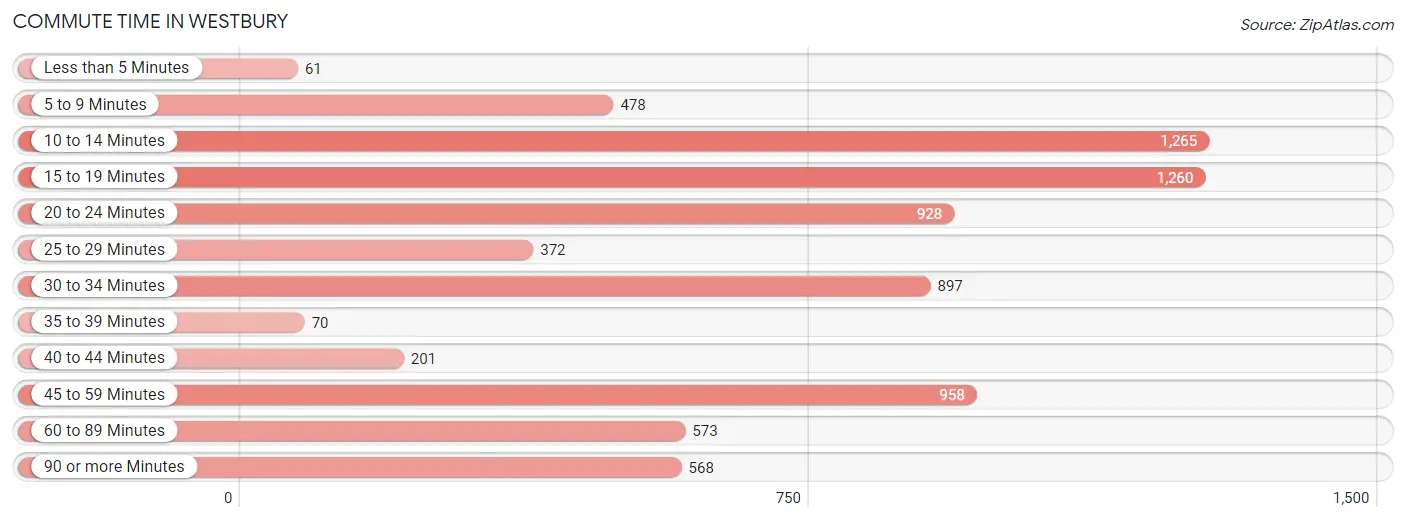
| Commute Time | # Commuters | % Commuters |
| Less than 5 Minutes | 61 | 0.8% |
| 5 to 9 Minutes | 478 | 6.3% |
| 10 to 14 Minutes | 1,265 | 16.6% |
| 15 to 19 Minutes | 1,260 | 16.5% |
| 20 to 24 Minutes | 928 | 12.2% |
| 25 to 29 Minutes | 372 | 4.9% |
| 30 to 34 Minutes | 897 | 11.7% |
| 35 to 39 Minutes | 70 | 0.9% |
| 40 to 44 Minutes | 201 | 2.6% |
| 45 to 59 Minutes | 958 | 12.6% |
| 60 to 89 Minutes | 573 | 7.5% |
| 90 or more Minutes | 568 | 7.4% |
Commute Time by Sex in Westbury
The most common commute times in Westbury are 10 to 14 minutes (695 commuters, 17.7%) for males and 15 to 19 minutes (613 commuters, 16.6%) for females.
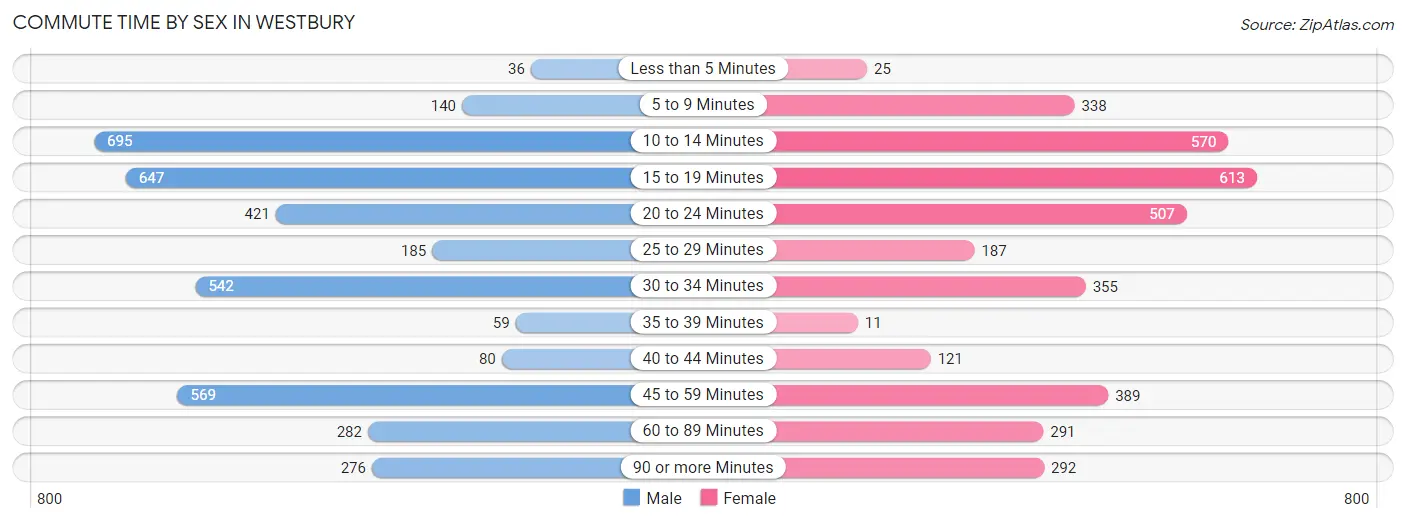
| Commute Time | Male | Female |
| Less than 5 Minutes | 36 (0.9%) | 25 (0.7%) |
| 5 to 9 Minutes | 140 (3.6%) | 338 (9.1%) |
| 10 to 14 Minutes | 695 (17.7%) | 570 (15.4%) |
| 15 to 19 Minutes | 647 (16.5%) | 613 (16.6%) |
| 20 to 24 Minutes | 421 (10.7%) | 507 (13.7%) |
| 25 to 29 Minutes | 185 (4.7%) | 187 (5.1%) |
| 30 to 34 Minutes | 542 (13.8%) | 355 (9.6%) |
| 35 to 39 Minutes | 59 (1.5%) | 11 (0.3%) |
| 40 to 44 Minutes | 80 (2.0%) | 121 (3.3%) |
| 45 to 59 Minutes | 569 (14.5%) | 389 (10.5%) |
| 60 to 89 Minutes | 282 (7.2%) | 291 (7.9%) |
| 90 or more Minutes | 276 (7.0%) | 292 (7.9%) |
Time of Departure to Work by Sex in Westbury
The most frequent times of departure to work in Westbury are 7:00 AM to 7:29 AM (682, 17.3%) for males and 8:00 AM to 8:29 AM (774, 20.9%) for females.
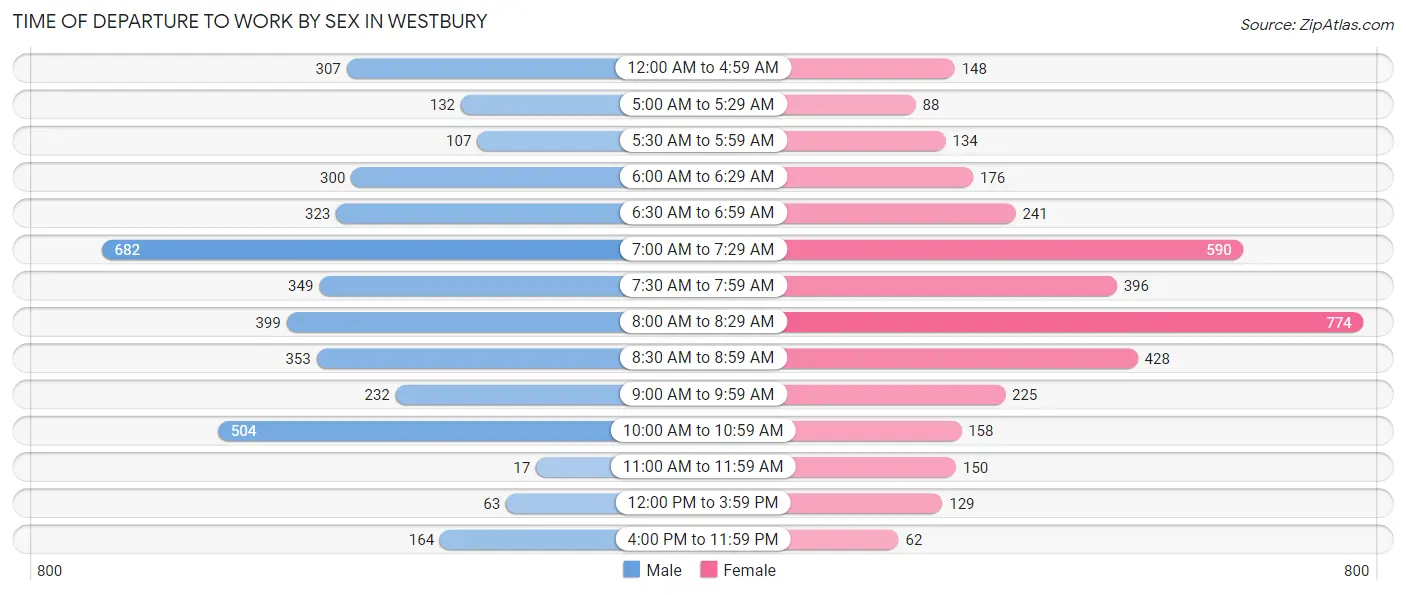
| Time of Departure | Male | Female |
| 12:00 AM to 4:59 AM | 307 (7.8%) | 148 (4.0%) |
| 5:00 AM to 5:29 AM | 132 (3.4%) | 88 (2.4%) |
| 5:30 AM to 5:59 AM | 107 (2.7%) | 134 (3.6%) |
| 6:00 AM to 6:29 AM | 300 (7.6%) | 176 (4.8%) |
| 6:30 AM to 6:59 AM | 323 (8.2%) | 241 (6.5%) |
| 7:00 AM to 7:29 AM | 682 (17.3%) | 590 (16.0%) |
| 7:30 AM to 7:59 AM | 349 (8.9%) | 396 (10.7%) |
| 8:00 AM to 8:29 AM | 399 (10.2%) | 774 (20.9%) |
| 8:30 AM to 8:59 AM | 353 (9.0%) | 428 (11.6%) |
| 9:00 AM to 9:59 AM | 232 (5.9%) | 225 (6.1%) |
| 10:00 AM to 10:59 AM | 504 (12.8%) | 158 (4.3%) |
| 11:00 AM to 11:59 AM | 17 (0.4%) | 150 (4.1%) |
| 12:00 PM to 3:59 PM | 63 (1.6%) | 129 (3.5%) |
| 4:00 PM to 11:59 PM | 164 (4.2%) | 62 (1.7%) |
| Total | 3,932 (100.0%) | 3,699 (100.0%) |
Housing Occupancy in Westbury
Occupancy by Ownership in Westbury
Of the total 5,186 dwellings in Westbury, owner-occupied units account for 4,254 (82.0%), while renter-occupied units make up 932 (18.0%).
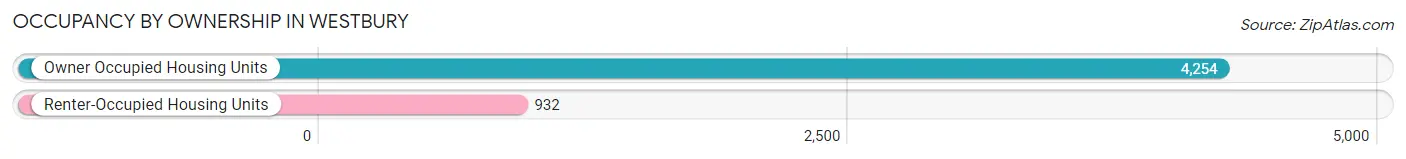
| Occupancy | # Housing Units | % Housing Units |
| Owner Occupied Housing Units | 4,254 | 82.0% |
| Renter-Occupied Housing Units | 932 | 18.0% |
| Total Occupied Housing Units | 5,186 | 100.0% |
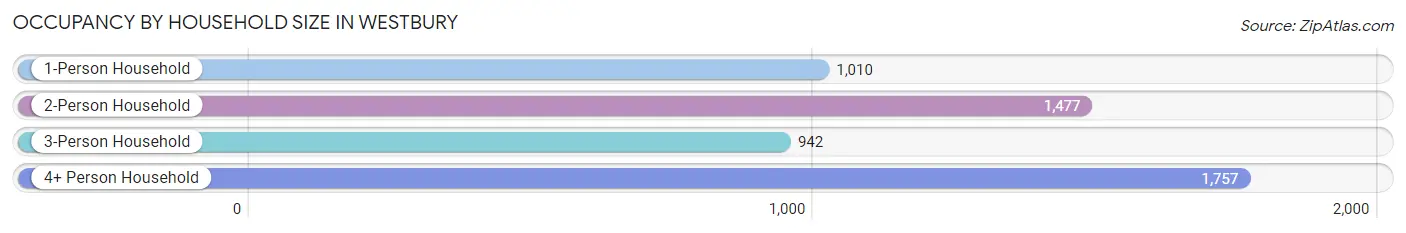
Occupancy by Household Size in Westbury
| Household Size | # Housing Units | % Housing Units |
| 1-Person Household | 1,010 | 19.5% |
| 2-Person Household | 1,477 | 28.5% |
| 3-Person Household | 942 | 18.2% |
| 4+ Person Household | 1,757 | 33.9% |
| Total Housing Units | 5,186 | 100.0% |
Occupancy by Ownership by Household Size in Westbury
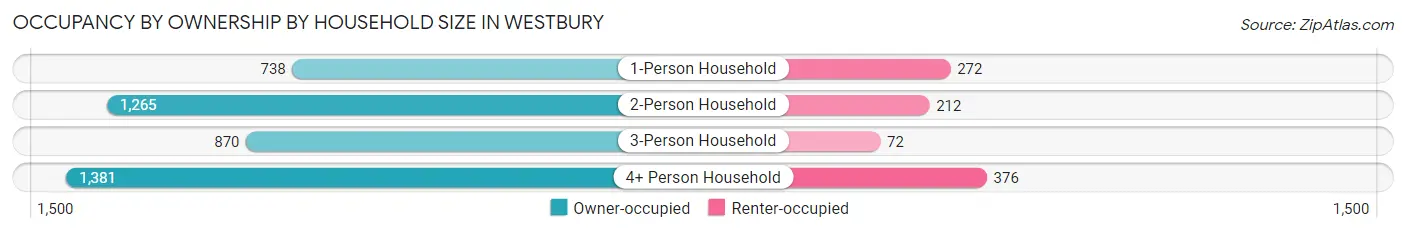
| Household Size | Owner-occupied | Renter-occupied |
| 1-Person Household | 738 (73.1%) | 272 (26.9%) |
| 2-Person Household | 1,265 (85.7%) | 212 (14.3%) |
| 3-Person Household | 870 (92.4%) | 72 (7.6%) |
| 4+ Person Household | 1,381 (78.6%) | 376 (21.4%) |
| Total Housing Units | 4,254 (82.0%) | 932 (18.0%) |
Occupancy by Educational Attainment in Westbury
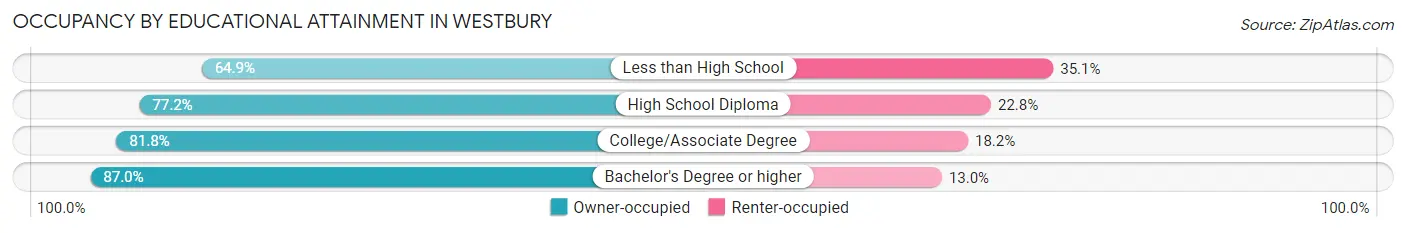
| Household Size | Owner-occupied | Renter-occupied |
| Less than High School | 303 (64.9%) | 164 (35.1%) |
| High School Diploma | 746 (77.2%) | 220 (22.8%) |
| College/Associate Degree | 930 (81.8%) | 207 (18.2%) |
| Bachelor's Degree or higher | 2,275 (87.0%) | 341 (13.0%) |
Occupancy by Age of Householder in Westbury
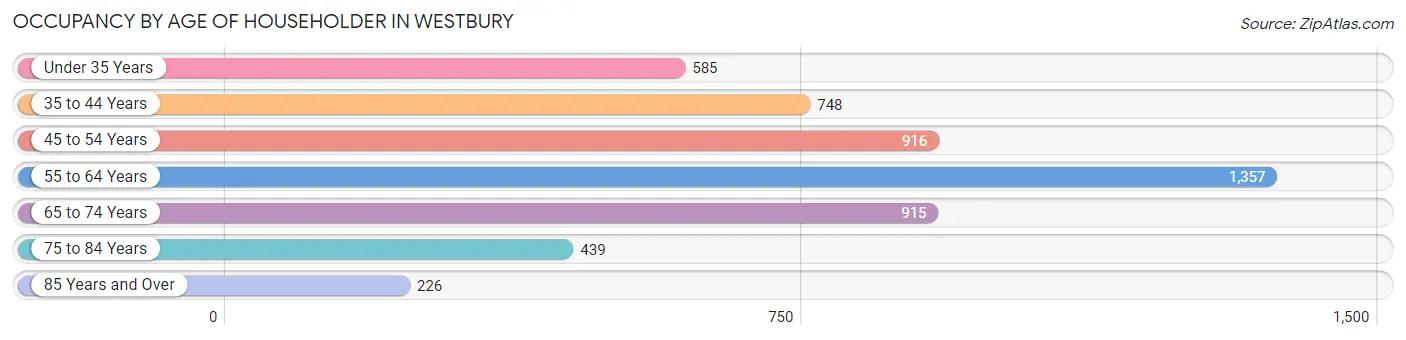
| Age Bracket | # Households | % Households |
| Under 35 Years | 585 | 11.3% |
| 35 to 44 Years | 748 | 14.4% |
| 45 to 54 Years | 916 | 17.7% |
| 55 to 64 Years | 1,357 | 26.2% |
| 65 to 74 Years | 915 | 17.6% |
| 75 to 84 Years | 439 | 8.5% |
| 85 Years and Over | 226 | 4.4% |
| Total | 5,186 | 100.0% |
Housing Finances in Westbury
Median Income by Occupancy in Westbury
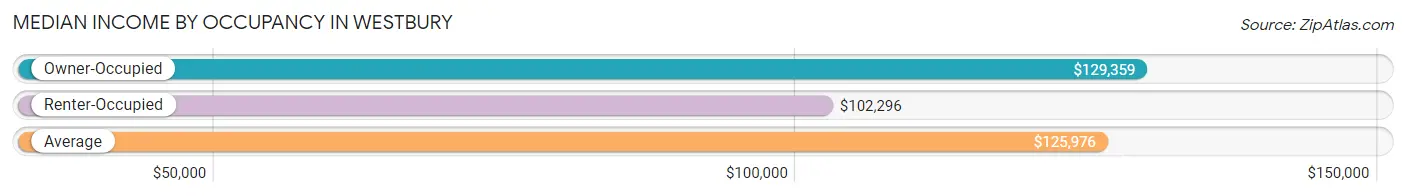
| Occupancy Type | # Households | Median Income |
| Owner-Occupied | 4,254 (82.0%) | $129,359 |
| Renter-Occupied | 932 (18.0%) | $102,296 |
| Average | 5,186 (100.0%) | $125,976 |
Occupancy by Householder Income Bracket in Westbury
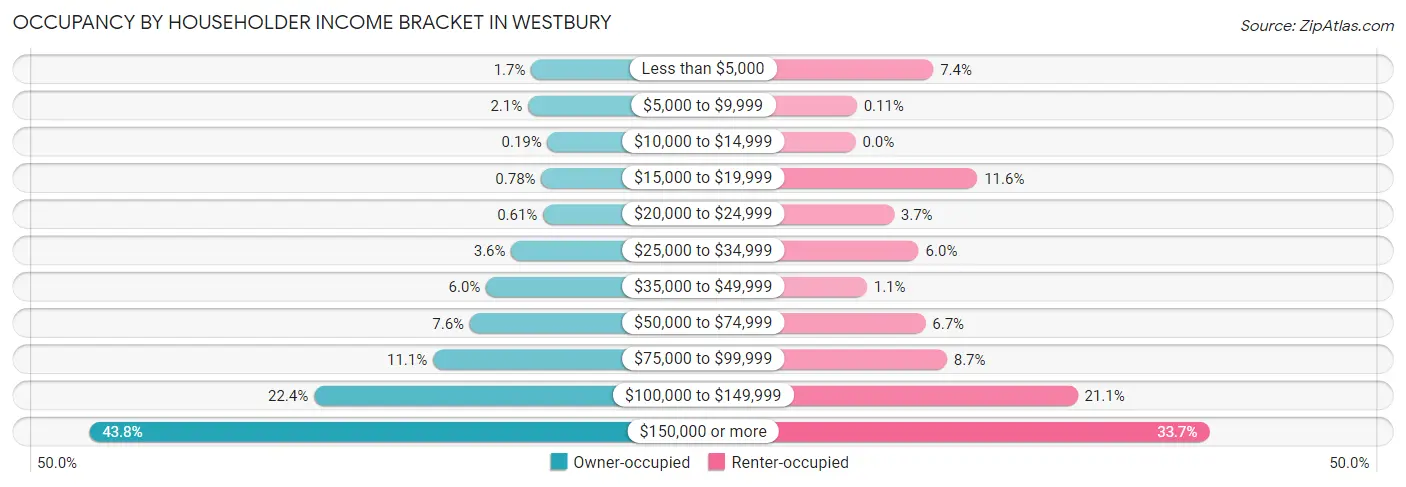
| Income Bracket | Owner-occupied | Renter-occupied |
| Less than $5,000 | 74 (1.7%) | 69 (7.4%) |
| $5,000 to $9,999 | 87 (2.1%) | 1 (0.1%) |
| $10,000 to $14,999 | 8 (0.2%) | 0 (0.0%) |
| $15,000 to $19,999 | 33 (0.8%) | 108 (11.6%) |
| $20,000 to $24,999 | 26 (0.6%) | 34 (3.6%) |
| $25,000 to $34,999 | 155 (3.6%) | 56 (6.0%) |
| $35,000 to $49,999 | 257 (6.0%) | 10 (1.1%) |
| $50,000 to $74,999 | 323 (7.6%) | 62 (6.7%) |
| $75,000 to $99,999 | 472 (11.1%) | 81 (8.7%) |
| $100,000 to $149,999 | 954 (22.4%) | 197 (21.1%) |
| $150,000 or more | 1,865 (43.8%) | 314 (33.7%) |
| Total | 4,254 (100.0%) | 932 (100.0%) |
Monthly Housing Cost Tiers in Westbury
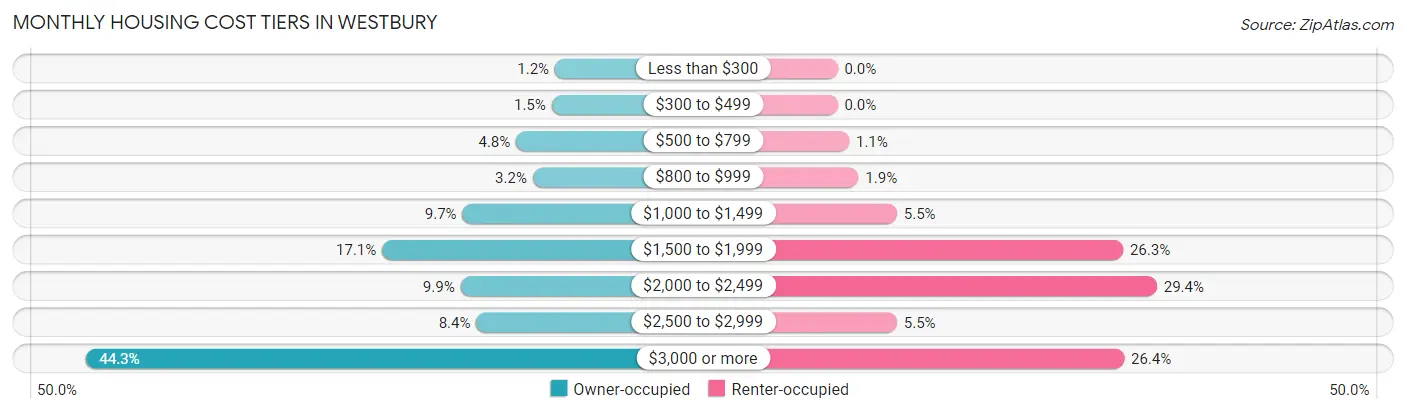
| Monthly Cost | Owner-occupied | Renter-occupied |
| Less than $300 | 50 (1.2%) | 0 (0.0%) |
| $300 to $499 | 63 (1.5%) | 0 (0.0%) |
| $500 to $799 | 202 (4.8%) | 10 (1.1%) |
| $800 to $999 | 137 (3.2%) | 18 (1.9%) |
| $1,000 to $1,499 | 412 (9.7%) | 51 (5.5%) |
| $1,500 to $1,999 | 727 (17.1%) | 245 (26.3%) |
| $2,000 to $2,499 | 420 (9.9%) | 274 (29.4%) |
| $2,500 to $2,999 | 358 (8.4%) | 51 (5.5%) |
| $3,000 or more | 1,885 (44.3%) | 246 (26.4%) |
| Total | 4,254 (100.0%) | 932 (100.0%) |
Physical Housing Characteristics in Westbury
Housing Structures in Westbury
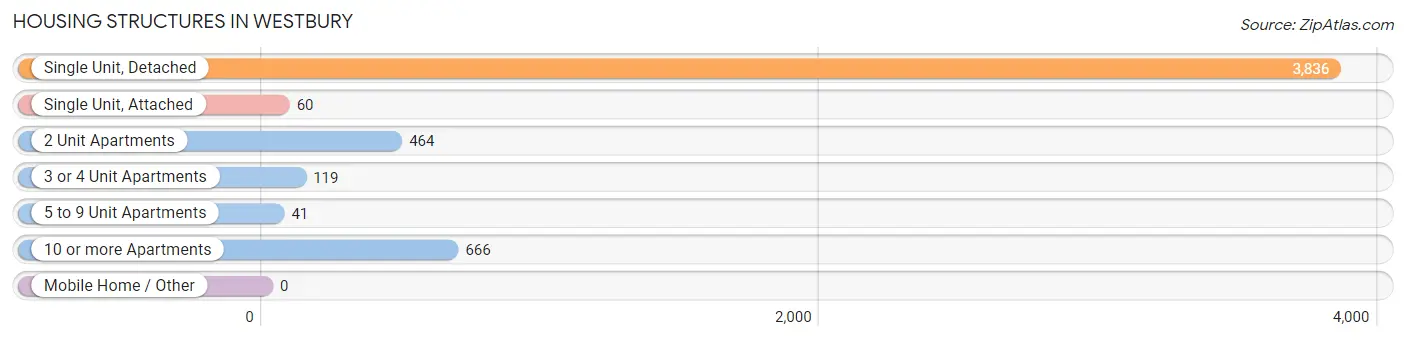
| Structure Type | # Housing Units | % Housing Units |
| Single Unit, Detached | 3,836 | 74.0% |
| Single Unit, Attached | 60 | 1.2% |
| 2 Unit Apartments | 464 | 8.9% |
| 3 or 4 Unit Apartments | 119 | 2.3% |
| 5 to 9 Unit Apartments | 41 | 0.8% |
| 10 or more Apartments | 666 | 12.8% |
| Mobile Home / Other | 0 | 0.0% |
| Total | 5,186 | 100.0% |
Housing Structures by Occupancy in Westbury
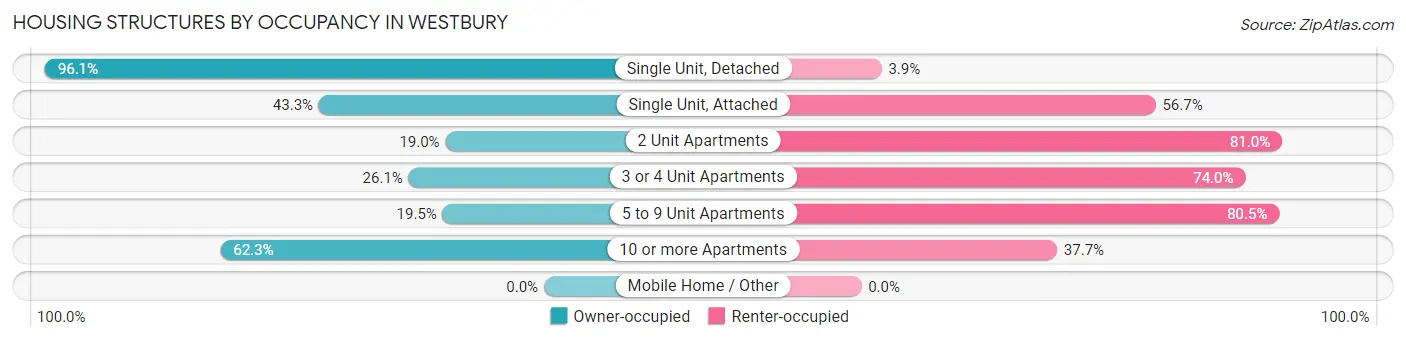
| Structure Type | Owner-occupied | Renter-occupied |
| Single Unit, Detached | 3,686 (96.1%) | 150 (3.9%) |
| Single Unit, Attached | 26 (43.3%) | 34 (56.7%) |
| 2 Unit Apartments | 88 (19.0%) | 376 (81.0%) |
| 3 or 4 Unit Apartments | 31 (26.1%) | 88 (74.0%) |
| 5 to 9 Unit Apartments | 8 (19.5%) | 33 (80.5%) |
| 10 or more Apartments | 415 (62.3%) | 251 (37.7%) |
| Mobile Home / Other | 0 (0.0%) | 0 (0.0%) |
| Total | 4,254 (82.0%) | 932 (18.0%) |
Housing Structures by Number of Rooms in Westbury
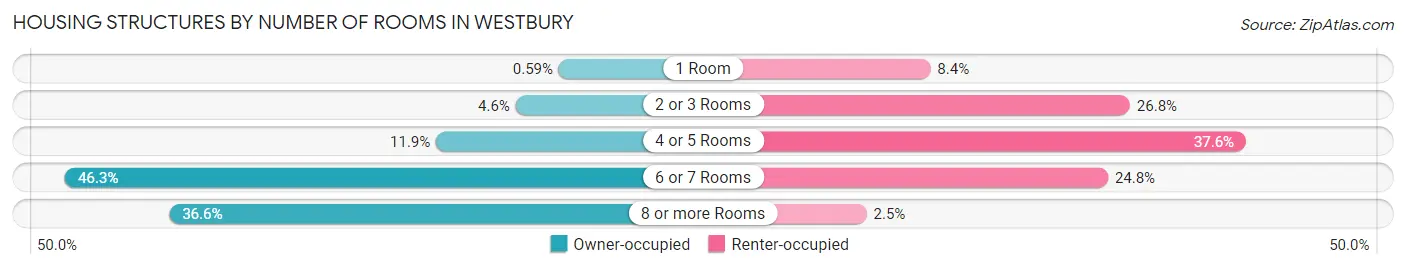
| Number of Rooms | Owner-occupied | Renter-occupied |
| 1 Room | 25 (0.6%) | 78 (8.4%) |
| 2 or 3 Rooms | 195 (4.6%) | 250 (26.8%) |
| 4 or 5 Rooms | 508 (11.9%) | 350 (37.6%) |
| 6 or 7 Rooms | 1,968 (46.3%) | 231 (24.8%) |
| 8 or more Rooms | 1,558 (36.6%) | 23 (2.5%) |
| Total | 4,254 (100.0%) | 932 (100.0%) |
Housing Structure by Heating Type in Westbury
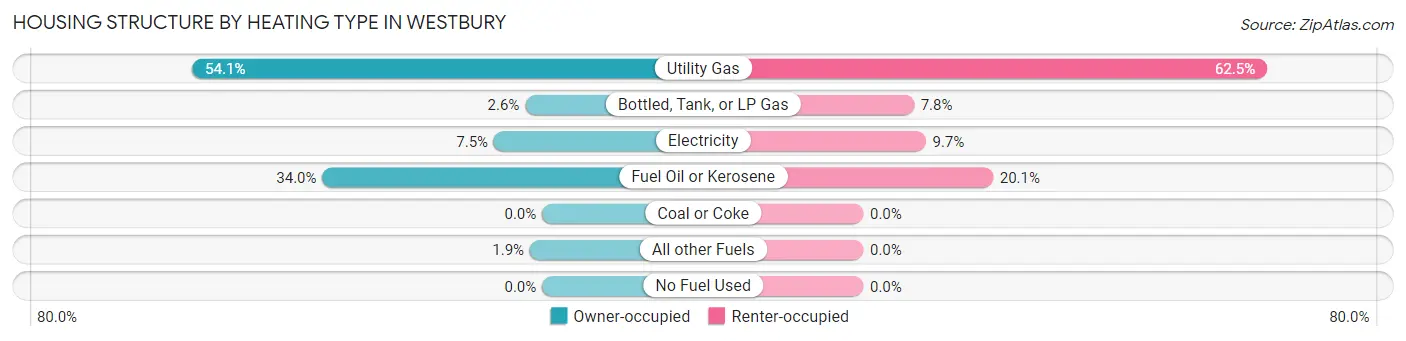
| Heating Type | Owner-occupied | Renter-occupied |
| Utility Gas | 2,301 (54.1%) | 582 (62.5%) |
| Bottled, Tank, or LP Gas | 111 (2.6%) | 73 (7.8%) |
| Electricity | 317 (7.4%) | 90 (9.7%) |
| Fuel Oil or Kerosene | 1,445 (34.0%) | 187 (20.1%) |
| Coal or Coke | 0 (0.0%) | 0 (0.0%) |
| All other Fuels | 80 (1.9%) | 0 (0.0%) |
| No Fuel Used | 0 (0.0%) | 0 (0.0%) |
| Total | 4,254 (100.0%) | 932 (100.0%) |
Household Vehicle Usage in Westbury
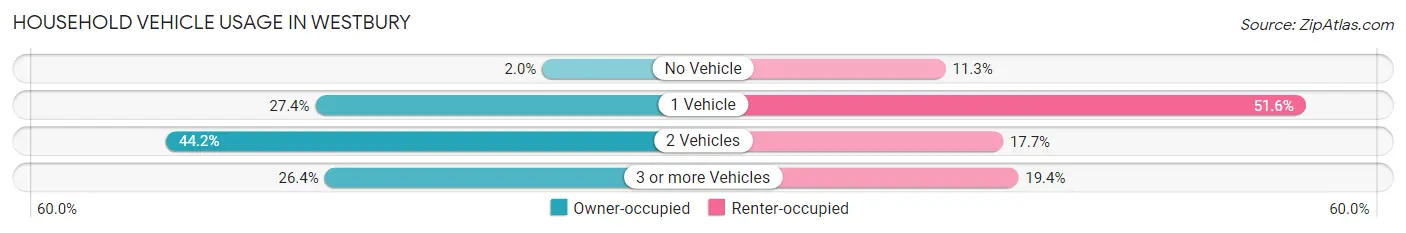
| Vehicles per Household | Owner-occupied | Renter-occupied |
| No Vehicle | 86 (2.0%) | 105 (11.3%) |
| 1 Vehicle | 1,167 (27.4%) | 481 (51.6%) |
| 2 Vehicles | 1,878 (44.2%) | 165 (17.7%) |
| 3 or more Vehicles | 1,123 (26.4%) | 181 (19.4%) |
| Total | 4,254 (100.0%) | 932 (100.0%) |
Real Estate & Mortgages in Westbury
Real Estate and Mortgage Overview in Westbury
| Characteristic | Without Mortgage | With Mortgage |
| Housing Units | 1,504 | 2,750 |
| Median Property Value | $592,700 | $571,300 |
| Median Household Income | $88,194 | $1,408 |
| Monthly Housing Costs | $1,501 | $1,862 |
| Real Estate Taxes | $10,001 | $47 |
Property Value by Mortgage Status in Westbury
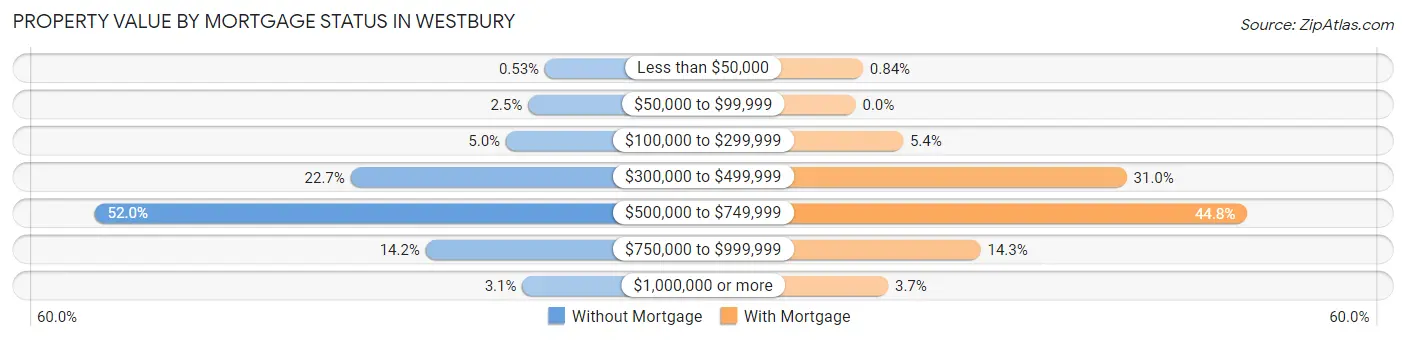
| Property Value | Without Mortgage | With Mortgage |
| Less than $50,000 | 8 (0.5%) | 23 (0.8%) |
| $50,000 to $99,999 | 37 (2.5%) | 0 (0.0%) |
| $100,000 to $299,999 | 75 (5.0%) | 149 (5.4%) |
| $300,000 to $499,999 | 342 (22.7%) | 852 (31.0%) |
| $500,000 to $749,999 | 782 (52.0%) | 1,231 (44.8%) |
| $750,000 to $999,999 | 213 (14.2%) | 393 (14.3%) |
| $1,000,000 or more | 47 (3.1%) | 102 (3.7%) |
| Total | 1,504 (100.0%) | 2,750 (100.0%) |
Household Income by Mortgage Status in Westbury
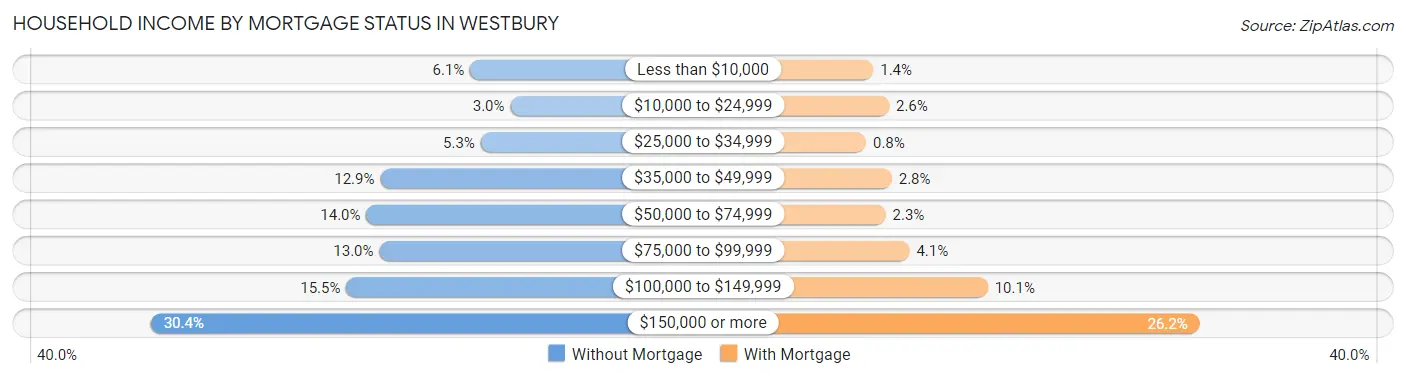
| Household Income | Without Mortgage | With Mortgage |
| Less than $10,000 | 91 (6.0%) | 37 (1.3%) |
| $10,000 to $24,999 | 45 (3.0%) | 70 (2.5%) |
| $25,000 to $34,999 | 79 (5.2%) | 22 (0.8%) |
| $35,000 to $49,999 | 194 (12.9%) | 76 (2.8%) |
| $50,000 to $74,999 | 210 (14.0%) | 63 (2.3%) |
| $75,000 to $99,999 | 195 (13.0%) | 113 (4.1%) |
| $100,000 to $149,999 | 233 (15.5%) | 277 (10.1%) |
| $150,000 or more | 457 (30.4%) | 721 (26.2%) |
| Total | 1,504 (100.0%) | 2,750 (100.0%) |
Property Value to Household Income Ratio in Westbury
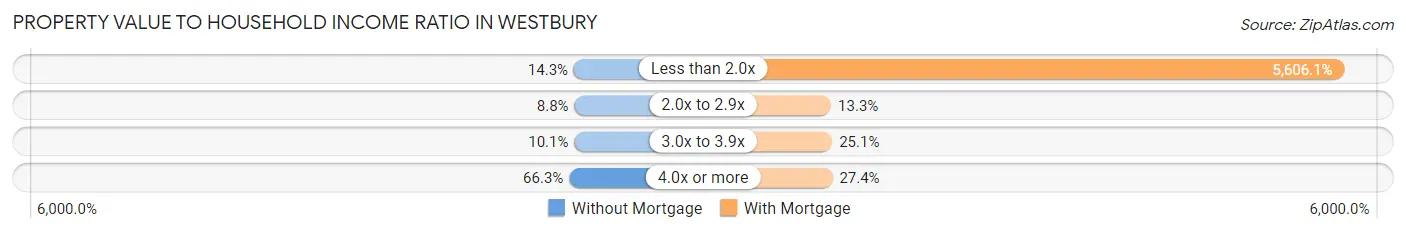
| Value-to-Income Ratio | Without Mortgage | With Mortgage |
| Less than 2.0x | 215 (14.3%) | 154,167 (5,606.1%) |
| 2.0x to 2.9x | 133 (8.8%) | 365 (13.3%) |
| 3.0x to 3.9x | 152 (10.1%) | 689 (25.1%) |
| 4.0x or more | 997 (66.3%) | 752 (27.4%) |
| Total | 1,504 (100.0%) | 2,750 (100.0%) |
Real Estate Taxes by Mortgage Status in Westbury
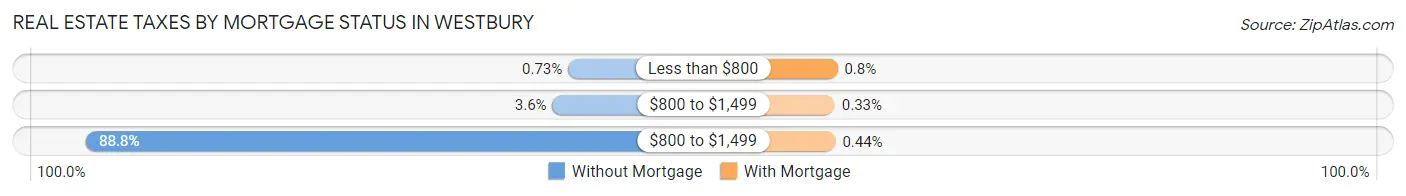
| Property Taxes | Without Mortgage | With Mortgage |
| Less than $800 | 11 (0.7%) | 22 (0.8%) |
| $800 to $1,499 | 54 (3.6%) | 9 (0.3%) |
| $800 to $1,499 | 1,335 (88.8%) | 12 (0.4%) |
| Total | 1,504 (100.0%) | 2,750 (100.0%) |
Health & Disability in Westbury
Health Insurance Coverage by Age in Westbury
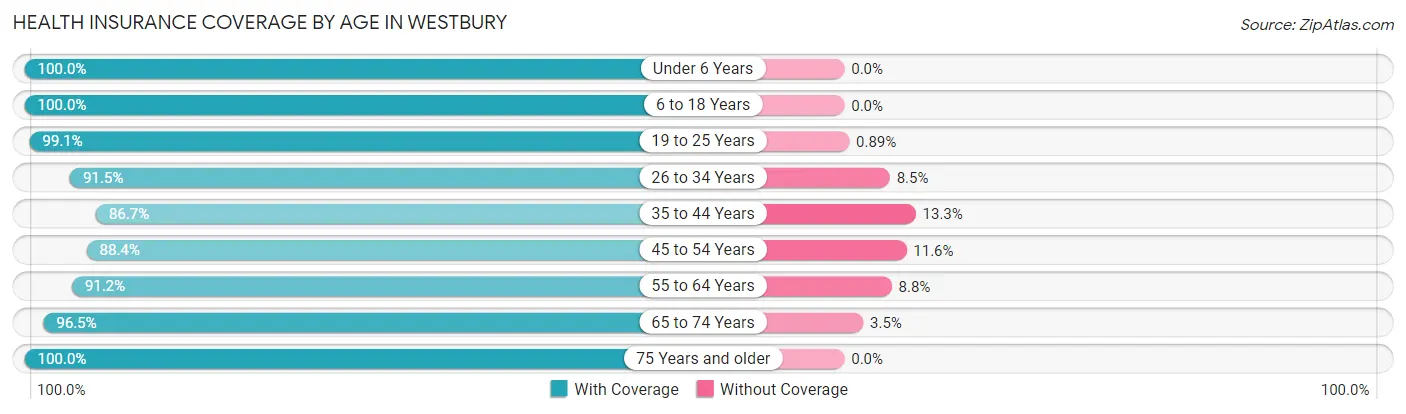
| Age Bracket | With Coverage | Without Coverage |
| Under 6 Years | 1,039 (100.0%) | 0 (0.0%) |
| 6 to 18 Years | 2,284 (100.0%) | 0 (0.0%) |
| 19 to 25 Years | 1,007 (99.1%) | 9 (0.9%) |
| 26 to 34 Years | 1,611 (91.5%) | 149 (8.5%) |
| 35 to 44 Years | 1,773 (86.7%) | 272 (13.3%) |
| 45 to 54 Years | 1,979 (88.4%) | 259 (11.6%) |
| 55 to 64 Years | 2,336 (91.2%) | 226 (8.8%) |
| 65 to 74 Years | 1,622 (96.5%) | 59 (3.5%) |
| 75 Years and older | 1,088 (100.0%) | 0 (0.0%) |
| Total | 14,739 (93.8%) | 974 (6.2%) |
Health Insurance Coverage by Citizenship Status in Westbury
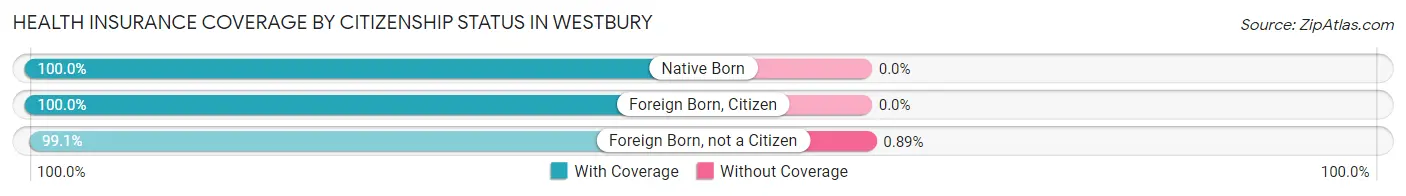
| Citizenship Status | With Coverage | Without Coverage |
| Native Born | 1,039 (100.0%) | 0 (0.0%) |
| Foreign Born, Citizen | 2,284 (100.0%) | 0 (0.0%) |
| Foreign Born, not a Citizen | 1,007 (99.1%) | 9 (0.9%) |
Health Insurance Coverage by Household Income in Westbury
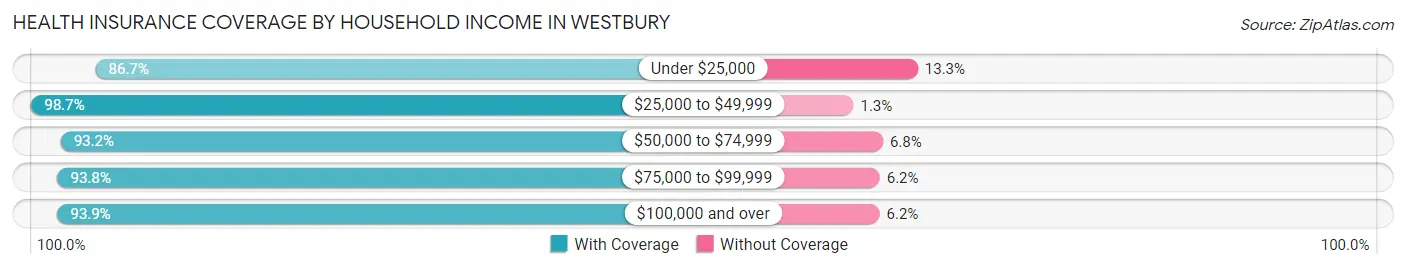
| Household Income | With Coverage | Without Coverage |
| Under $25,000 | 547 (86.7%) | 84 (13.3%) |
| $25,000 to $49,999 | 781 (98.7%) | 10 (1.3%) |
| $50,000 to $74,999 | 812 (93.2%) | 59 (6.8%) |
| $75,000 to $99,999 | 1,656 (93.8%) | 109 (6.2%) |
| $100,000 and over | 10,859 (93.9%) | 712 (6.1%) |
Public vs Private Health Insurance Coverage by Age in Westbury
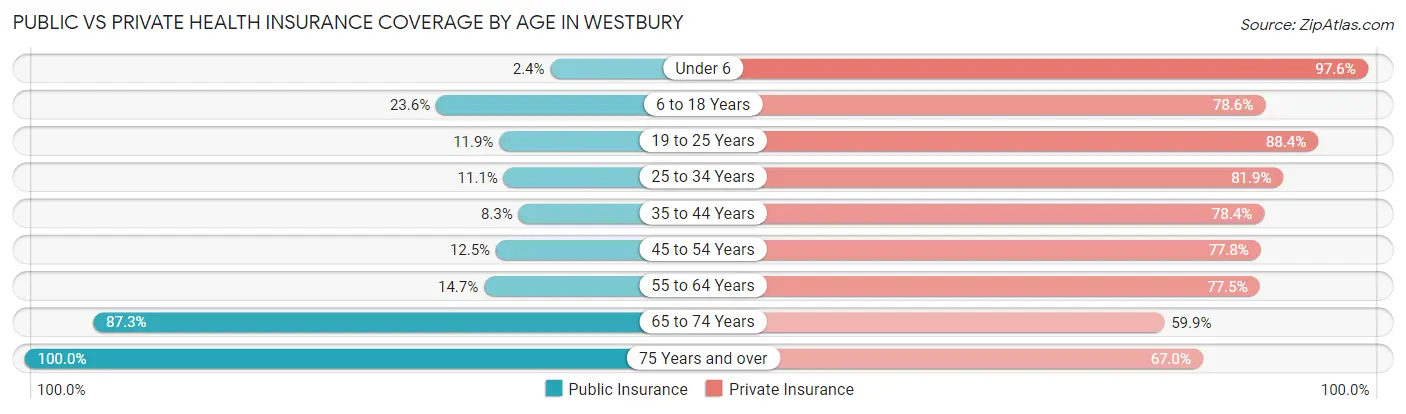
| Age Bracket | Public Insurance | Private Insurance |
| Under 6 | 25 (2.4%) | 1,014 (97.6%) |
| 6 to 18 Years | 540 (23.6%) | 1,794 (78.5%) |
| 19 to 25 Years | 121 (11.9%) | 898 (88.4%) |
| 25 to 34 Years | 195 (11.1%) | 1,442 (81.9%) |
| 35 to 44 Years | 170 (8.3%) | 1,603 (78.4%) |
| 45 to 54 Years | 280 (12.5%) | 1,740 (77.7%) |
| 55 to 64 Years | 377 (14.7%) | 1,986 (77.5%) |
| 65 to 74 Years | 1,467 (87.3%) | 1,006 (59.9%) |
| 75 Years and over | 1,088 (100.0%) | 729 (67.0%) |
| Total | 4,263 (27.1%) | 12,212 (77.7%) |
Disability Status by Sex by Age in Westbury
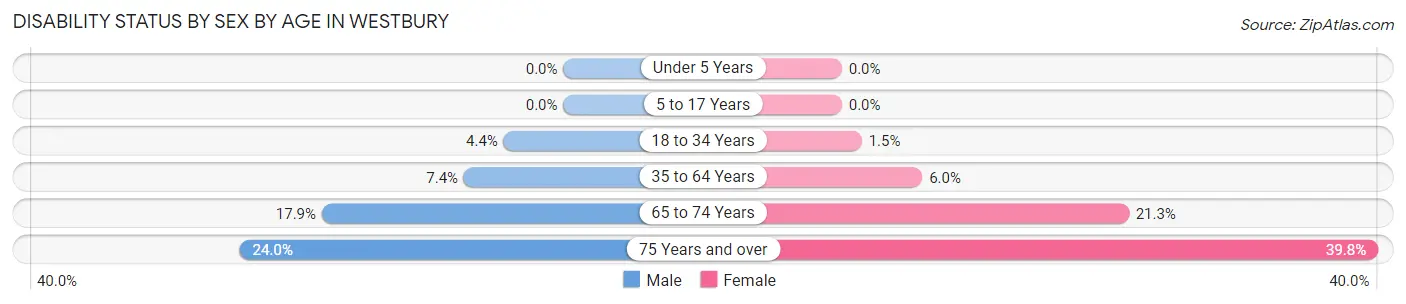
| Age Bracket | Male | Female |
| Under 5 Years | 0 (0.0%) | 0 (0.0%) |
| 5 to 17 Years | 0 (0.0%) | 0 (0.0%) |
| 18 to 34 Years | 56 (4.4%) | 23 (1.5%) |
| 35 to 64 Years | 264 (7.4%) | 195 (6.0%) |
| 65 to 74 Years | 144 (17.9%) | 187 (21.3%) |
| 75 Years and over | 107 (24.0%) | 256 (39.8%) |
Disability Class by Sex by Age in Westbury
Disability Class: Hearing Difficulty
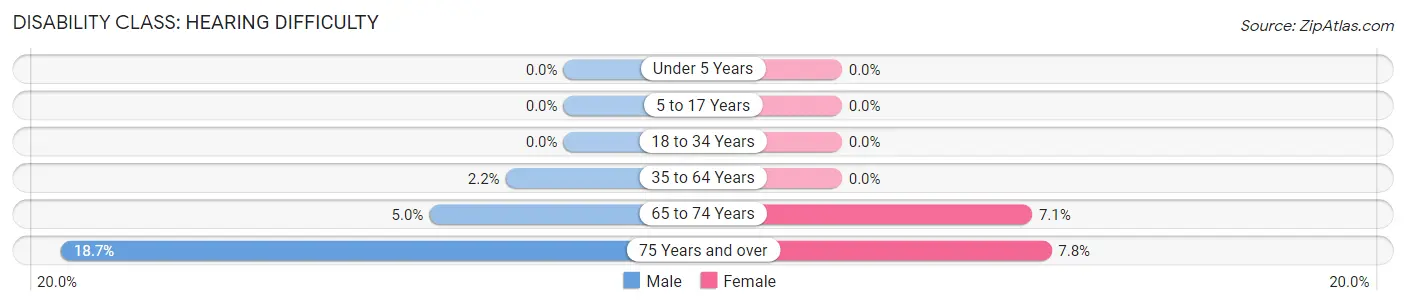
| Age Bracket | Male | Female |
| Under 5 Years | 0 (0.0%) | 0 (0.0%) |
| 5 to 17 Years | 0 (0.0%) | 0 (0.0%) |
| 18 to 34 Years | 0 (0.0%) | 0 (0.0%) |
| 35 to 64 Years | 77 (2.1%) | 0 (0.0%) |
| 65 to 74 Years | 40 (5.0%) | 62 (7.1%) |
| 75 Years and over | 83 (18.6%) | 50 (7.8%) |
Disability Class: Vision Difficulty
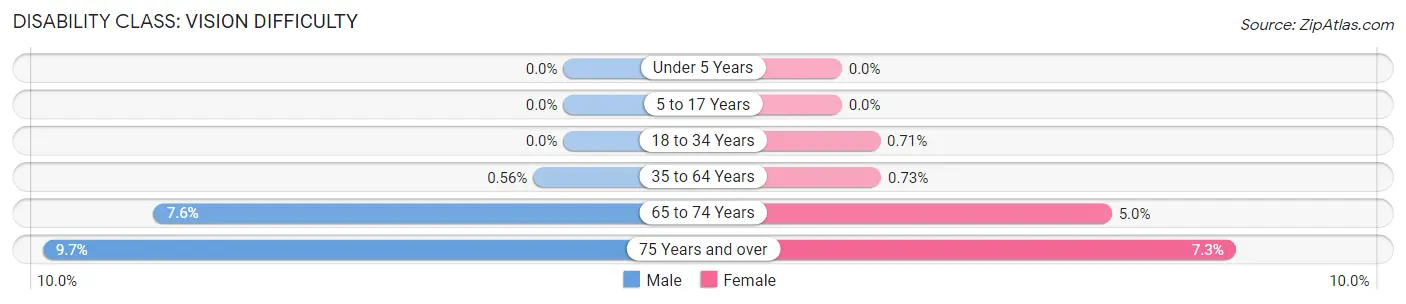
| Age Bracket | Male | Female |
| Under 5 Years | 0 (0.0%) | 0 (0.0%) |
| 5 to 17 Years | 0 (0.0%) | 0 (0.0%) |
| 18 to 34 Years | 0 (0.0%) | 11 (0.7%) |
| 35 to 64 Years | 20 (0.6%) | 24 (0.7%) |
| 65 to 74 Years | 61 (7.6%) | 44 (5.0%) |
| 75 Years and over | 43 (9.7%) | 47 (7.3%) |
Disability Class: Cognitive Difficulty
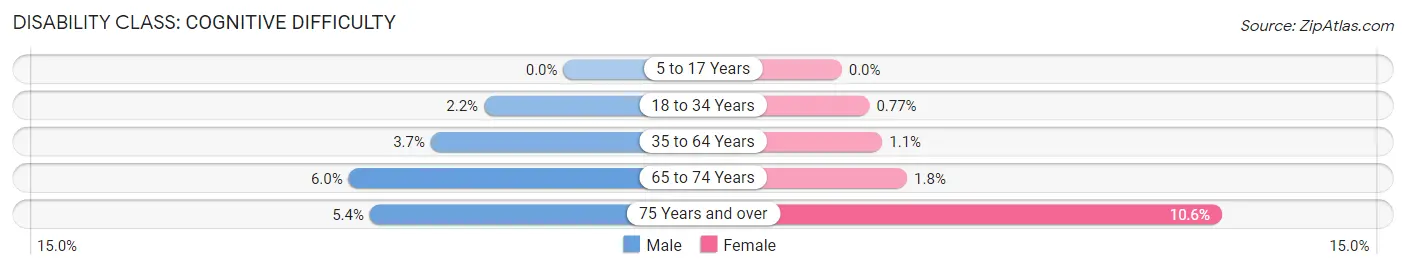
| Age Bracket | Male | Female |
| 5 to 17 Years | 0 (0.0%) | 0 (0.0%) |
| 18 to 34 Years | 28 (2.2%) | 12 (0.8%) |
| 35 to 64 Years | 132 (3.7%) | 37 (1.1%) |
| 65 to 74 Years | 48 (6.0%) | 16 (1.8%) |
| 75 Years and over | 24 (5.4%) | 68 (10.6%) |
Disability Class: Ambulatory Difficulty
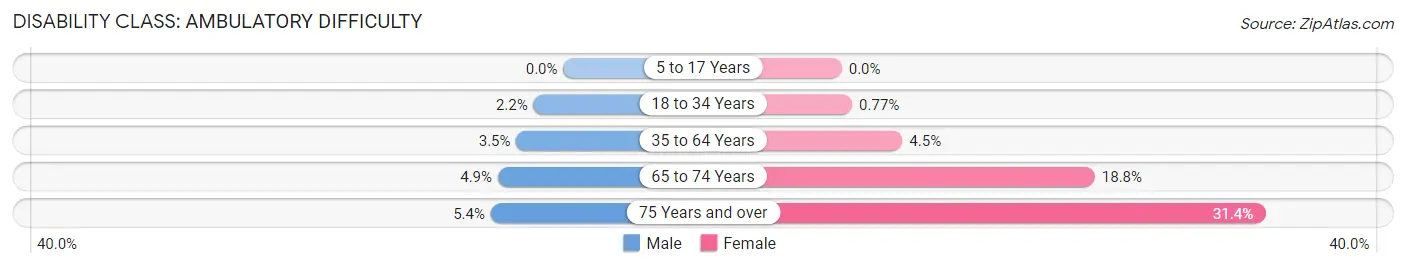
| Age Bracket | Male | Female |
| 5 to 17 Years | 0 (0.0%) | 0 (0.0%) |
| 18 to 34 Years | 28 (2.2%) | 12 (0.8%) |
| 35 to 64 Years | 125 (3.5%) | 147 (4.5%) |
| 65 to 74 Years | 39 (4.9%) | 165 (18.8%) |
| 75 Years and over | 24 (5.4%) | 202 (31.4%) |
Disability Class: Self-Care Difficulty
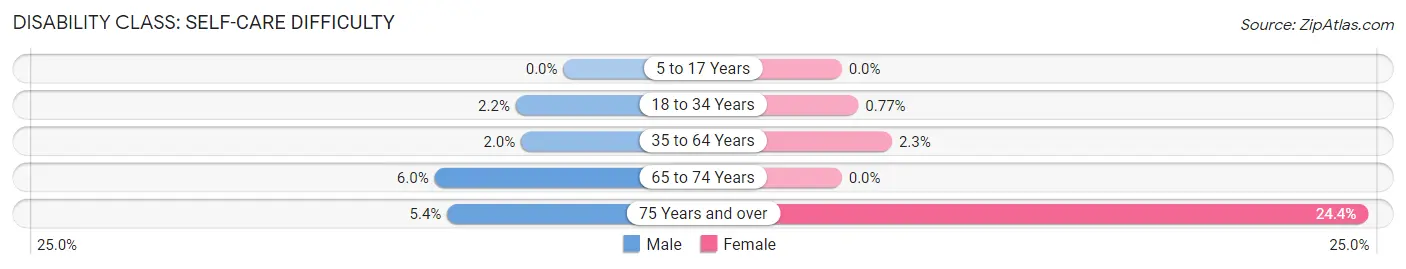
| Age Bracket | Male | Female |
| 5 to 17 Years | 0 (0.0%) | 0 (0.0%) |
| 18 to 34 Years | 28 (2.2%) | 12 (0.8%) |
| 35 to 64 Years | 70 (2.0%) | 76 (2.3%) |
| 65 to 74 Years | 48 (6.0%) | 0 (0.0%) |
| 75 Years and over | 24 (5.4%) | 157 (24.4%) |
Technology Access in Westbury
Computing Device Access in Westbury
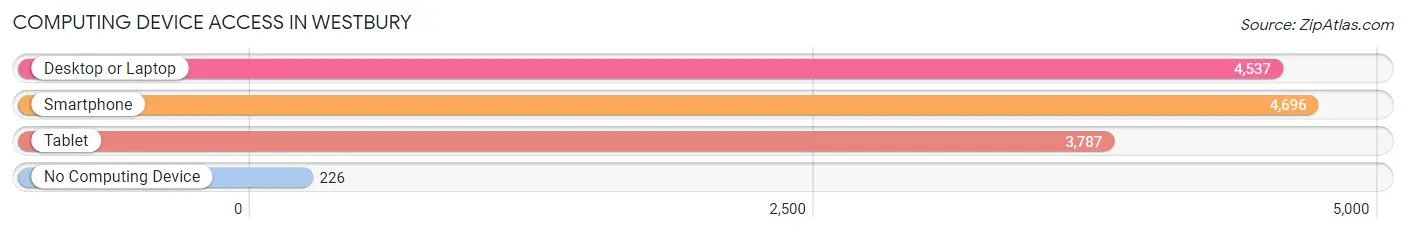
| Device Type | # Households | % Households |
| Desktop or Laptop | 4,537 | 87.5% |
| Smartphone | 4,696 | 90.5% |
| Tablet | 3,787 | 73.0% |
| No Computing Device | 226 | 4.4% |
| Total | 5,186 | 100.0% |
Internet Access in Westbury
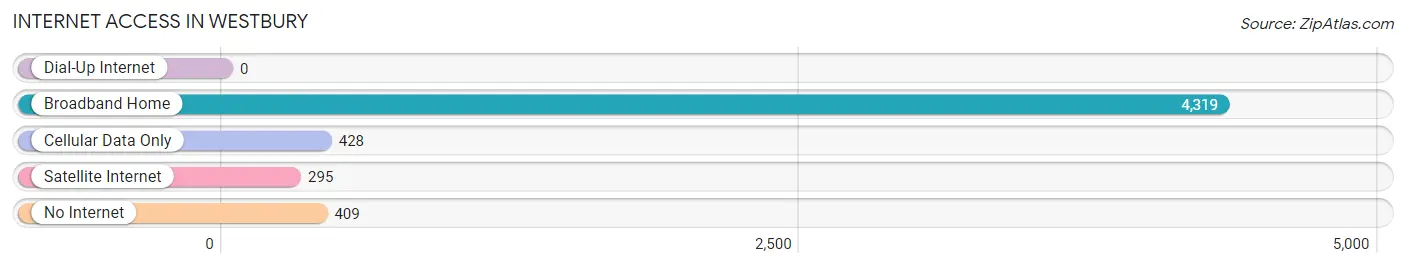
| Internet Type | # Households | % Households |
| Dial-Up Internet | 0 | 0.0% |
| Broadband Home | 4,319 | 83.3% |
| Cellular Data Only | 428 | 8.3% |
| Satellite Internet | 295 | 5.7% |
| No Internet | 409 | 7.9% |
| Total | 5,186 | 100.0% |
Westbury Summary
Westbury is a village located in Nassau County, New York, United States. It is located in the Town of North Hempstead, and is part of the Greater New York City metropolitan area. As of the 2010 census, the village had a population of 15,146.
History
Westbury was first settled in 1658 by English settlers from Hempstead. The village was originally known as "Westbury-on-the-Plain," and was part of the Town of Hempstead. In 1775, the village was incorporated as the Village of Westbury.
In the late 19th century, Westbury was a popular summer resort for wealthy New Yorkers. The village was home to several grand estates, including the estate of William K. Vanderbilt.
Geography
Westbury is located at 40°44'25" North, 73°35'45" West (40.740278, -73.595833). The village is located in the Town of North Hempstead, and is part of the Greater New York City metropolitan area.
Westbury is bordered to the north by Jericho, to the east by Old Westbury, to the south by Carle Place, and to the west by Hicksville.
The village is located on the Hempstead Plains, a flat, low-lying area of Long Island. The village is located on the Hempstead Turnpike, a major east-west thoroughfare.
Economy
Westbury is a primarily residential community, with a small commercial district located along the Hempstead Turnpike. The village is home to several large employers, including Northwell Health, a large healthcare provider, and the Westbury School District.
Demographics
As of the 2010 census, the village had a population of 15,146. The racial makeup of the village was 57.2% White, 22.3% African American, 0.3% Native American, 8.2% Asian, 0.1% Pacific Islander, 8.2% from other races, and 3.9% from two or more races. Hispanic or Latino of any race were 18.3% of the population.
The median household income in Westbury was $76,845, and the median family income was $87,845. The per capita income for the village was $33,945. About 5.2% of families and 6.7% of the population were below the poverty line, including 8.2% of those under age 18 and 5.2% of those age 65 or over.
Common Questions
What is Per Capita Income in Westbury?
Per Capita income in Westbury is $56,344.
What is the Median Family Income in Westbury?
Median Family Income in Westbury is $141,870.
What is the Median Household income in Westbury?
Median Household Income in Westbury is $125,976.
What is Income or Wage Gap in Westbury?
Income or Wage Gap in Westbury is 34.0%.
Women in Westbury earn 66.0 cents for every dollar earned by a man.
What is Inequality or Gini Index in Westbury?
Inequality or Gini Index in Westbury is 0.45.
What is the Total Population of Westbury?
Total Population of Westbury is 15,788.
What is the Total Male Population of Westbury?
Total Male Population of Westbury is 7,464.
What is the Total Female Population of Westbury?
Total Female Population of Westbury is 8,324.
What is the Ratio of Males per 100 Females in Westbury?
There are 89.67 Males per 100 Females in Westbury.
What is the Ratio of Females per 100 Males in Westbury?
There are 111.52 Females per 100 Males in Westbury.
What is the Median Population Age in Westbury?
Median Population Age in Westbury is 43.7 Years.
What is the Average Family Size in Westbury
Average Family Size in Westbury is 3.5 People.
What is the Average Household Size in Westbury
Average Household Size in Westbury is 3.0 People.
How Large is the Labor Force in Westbury?
There are 8,911 People in the Labor Forcein in Westbury.
What is the Percentage of People in the Labor Force in Westbury?
69.7% of People are in the Labor Force in Westbury.
What is the Unemployment Rate in Westbury?
Unemployment Rate in Westbury is 3.2%.