Hillcrest, NY Map & Demographics
Hillcrest Map
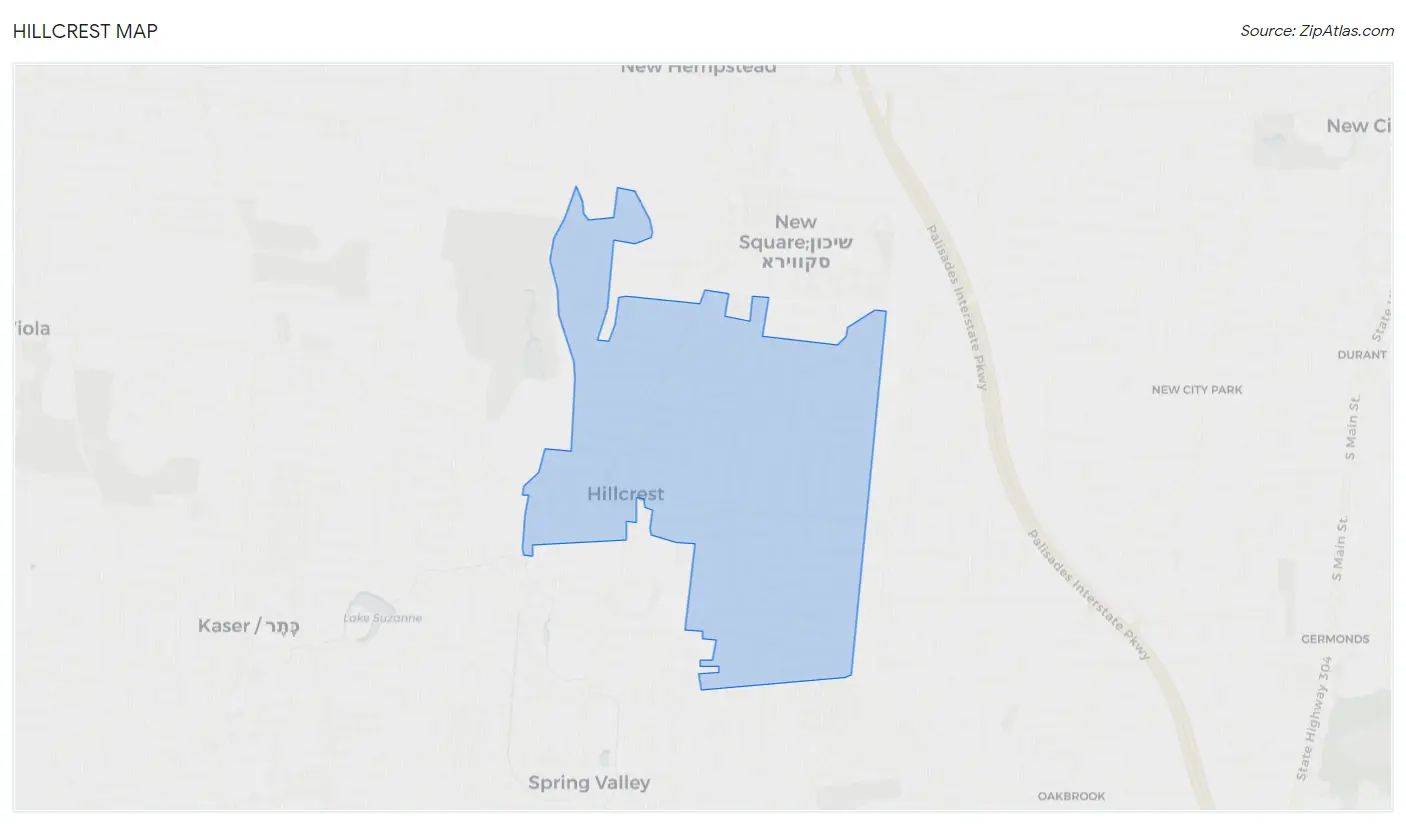
Hillcrest Overview
$41,076
PER CAPITA INCOME
$118,190
AVG FAMILY INCOME
$119,375
AVG HOUSEHOLD INCOME
7.4%
WAGE / INCOME GAP [ % ]
92.6¢/ $1
WAGE / INCOME GAP [ $ ]
0.46
INEQUALITY / GINI INDEX
8,178
TOTAL POPULATION
4,384
MALE POPULATION
3,794
FEMALE POPULATION
115.55
MALES / 100 FEMALES
86.54
FEMALES / 100 MALES
35.7
MEDIAN AGE
3.9
AVG FAMILY SIZE
4.0
AVG HOUSEHOLD SIZE
4,403
LABOR FORCE [ PEOPLE ]
67.4%
PERCENT IN LABOR FORCE
7.4%
UNEMPLOYMENT RATE
Income in Hillcrest
Income Overview in Hillcrest
Per Capita Income in Hillcrest is $41,076, while median incomes of families and households are $118,190 and $119,375 respectively.
| Characteristic | Number | Measure |
| Per Capita Income | 8,178 | $41,076 |
| Median Family Income | 1,776 | $118,190 |
| Mean Family Income | 1,776 | $155,451 |
| Median Household Income | 1,983 | $119,375 |
| Mean Household Income | 1,983 | $156,551 |
| Income Deficit | 1,776 | $0 |
| Wage / Income Gap (%) | 8,178 | 7.39% |
| Wage / Income Gap ($) | 8,178 | 92.61¢ per $1 |
| Gini / Inequality Index | 8,178 | 0.46 |
Earnings by Sex in Hillcrest
Average Earnings in Hillcrest are $42,937, $42,090 for men and $45,451 for women, a difference of 7.4%.
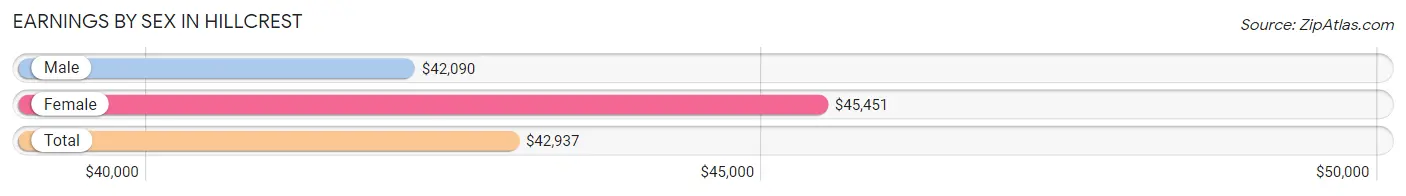
| Sex | Number | Average Earnings |
| Male | 2,458 (56.9%) | $42,090 |
| Female | 1,861 (43.1%) | $45,451 |
| Total | 4,319 (100.0%) | $42,937 |
Earnings by Sex by Income Bracket in Hillcrest
The most common earnings brackets in Hillcrest are $100,000+ for men (307 | 12.5%) and $100,000+ for women (321 | 17.2%).
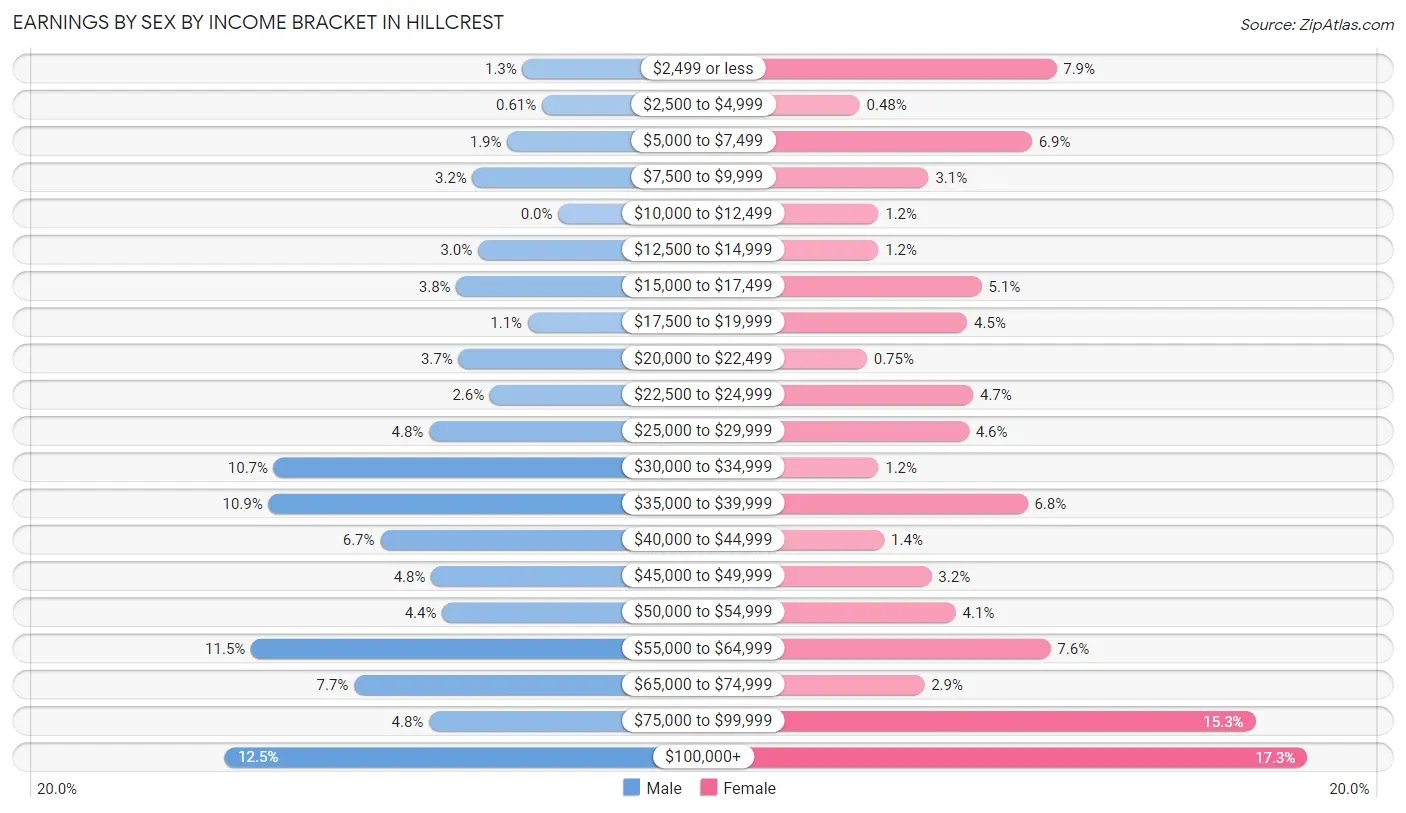
| Income | Male | Female |
| $2,499 or less | 33 (1.3%) | 146 (7.9%) |
| $2,500 to $4,999 | 15 (0.6%) | 9 (0.5%) |
| $5,000 to $7,499 | 47 (1.9%) | 129 (6.9%) |
| $7,500 to $9,999 | 79 (3.2%) | 57 (3.1%) |
| $10,000 to $12,499 | 0 (0.0%) | 22 (1.2%) |
| $12,500 to $14,999 | 74 (3.0%) | 22 (1.2%) |
| $15,000 to $17,499 | 94 (3.8%) | 94 (5.1%) |
| $17,500 to $19,999 | 28 (1.1%) | 84 (4.5%) |
| $20,000 to $22,499 | 92 (3.7%) | 14 (0.7%) |
| $22,500 to $24,999 | 63 (2.6%) | 88 (4.7%) |
| $25,000 to $29,999 | 119 (4.8%) | 85 (4.6%) |
| $30,000 to $34,999 | 262 (10.7%) | 22 (1.2%) |
| $35,000 to $39,999 | 267 (10.9%) | 126 (6.8%) |
| $40,000 to $44,999 | 164 (6.7%) | 26 (1.4%) |
| $45,000 to $49,999 | 117 (4.8%) | 59 (3.2%) |
| $50,000 to $54,999 | 107 (4.3%) | 76 (4.1%) |
| $55,000 to $64,999 | 283 (11.5%) | 142 (7.6%) |
| $65,000 to $74,999 | 188 (7.6%) | 54 (2.9%) |
| $75,000 to $99,999 | 119 (4.8%) | 285 (15.3%) |
| $100,000+ | 307 (12.5%) | 321 (17.2%) |
| Total | 2,458 (100.0%) | 1,861 (100.0%) |
Earnings by Sex by Educational Attainment in Hillcrest
Average earnings in Hillcrest are $42,936 for men and $52,794 for women, a difference of 18.7%. Men with an educational attainment of college or associate's degree enjoy the highest average annual earnings of $67,750, while those with less than high school education earn the least with $33,239. Women with an educational attainment of graduate degree earn the most with the average annual earnings of $98,355, while those with less than high school education have the smallest earnings of $16,792.
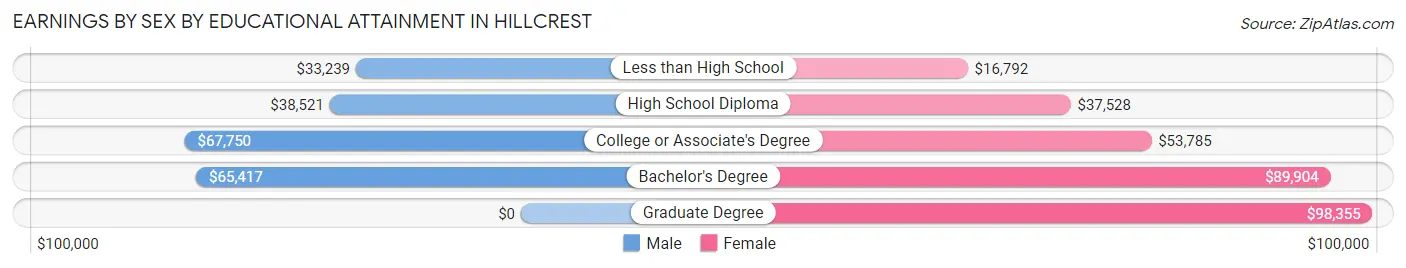
| Educational Attainment | Male Income | Female Income |
| Less than High School | $33,239 | $16,792 |
| High School Diploma | $38,521 | $37,528 |
| College or Associate's Degree | $67,750 | $53,785 |
| Bachelor's Degree | $65,417 | $89,904 |
| Graduate Degree | - | - |
| Total | $42,936 | $52,794 |
Family Income in Hillcrest
Family Income Brackets in Hillcrest
According to the Hillcrest family income data, there are 392 families falling into the $200,000+ income range, which is the most common income bracket and makes up 22.1% of all families. Conversely, the less than $10,000 income bracket is the least frequent group with only 36 families (2.0%) belonging to this category.
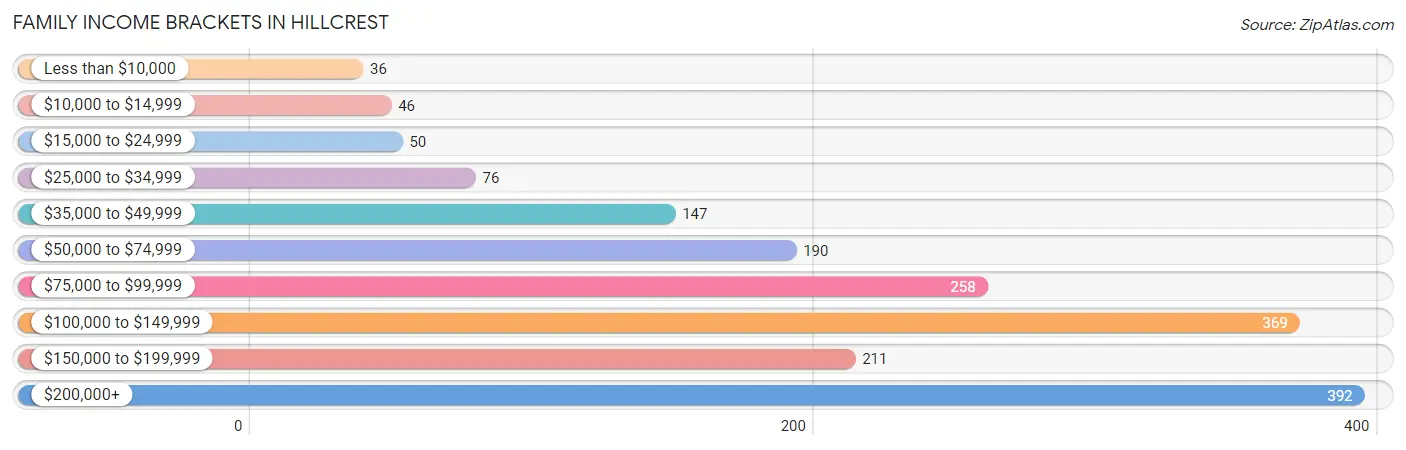
| Income Bracket | # Families | % Families |
| Less than $10,000 | 36 | 2.0% |
| $10,000 to $14,999 | 46 | 2.6% |
| $15,000 to $24,999 | 50 | 2.8% |
| $25,000 to $34,999 | 76 | 4.3% |
| $35,000 to $49,999 | 147 | 8.3% |
| $50,000 to $74,999 | 190 | 10.7% |
| $75,000 to $99,999 | 258 | 14.5% |
| $100,000 to $149,999 | 369 | 20.8% |
| $150,000 to $199,999 | 211 | 11.9% |
| $200,000+ | 392 | 22.1% |
Family Income by Famaliy Size in Hillcrest
3-person families (378 | 21.3%) account for the highest median family income in Hillcrest with $157,400 per family, while 3-person families (378 | 21.3%) have the highest median income of $52,467 per family member.
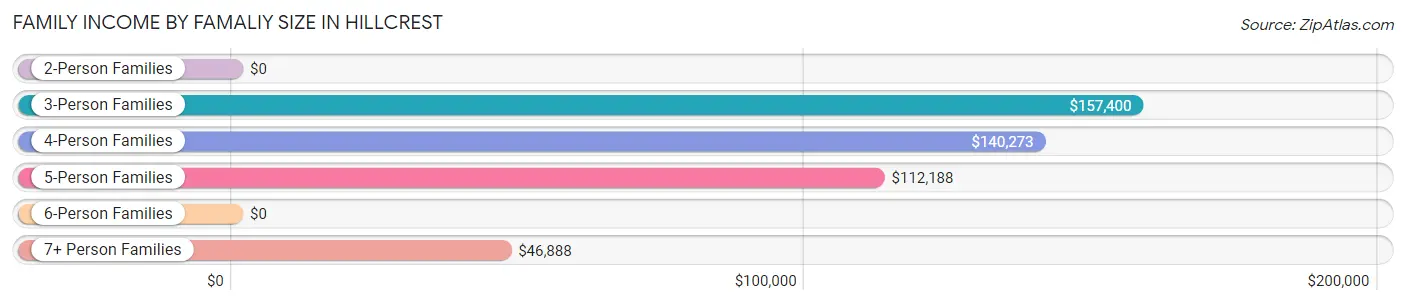
| Income Bracket | # Families | Median Income |
| 2-Person Families | 459 (25.8%) | $0 |
| 3-Person Families | 378 (21.3%) | $157,400 |
| 4-Person Families | 422 (23.8%) | $140,273 |
| 5-Person Families | 164 (9.2%) | $112,188 |
| 6-Person Families | 228 (12.8%) | $0 |
| 7+ Person Families | 125 (7.0%) | $46,888 |
| Total | 1,776 (100.0%) | $118,190 |
Family Income by Number of Earners in Hillcrest
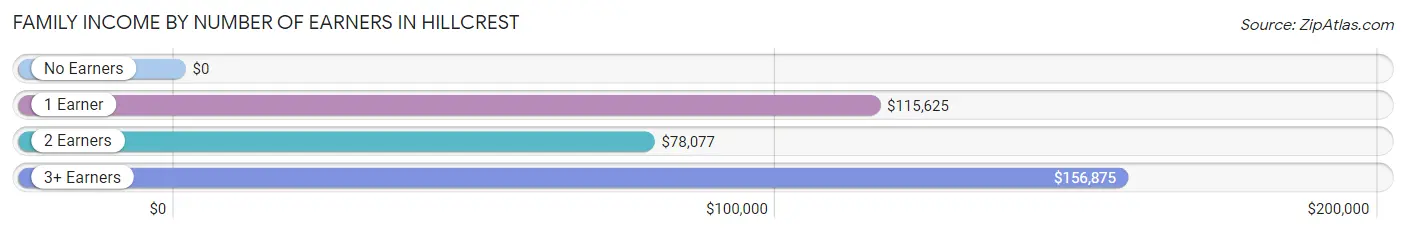
| Number of Earners | # Families | Median Income |
| No Earners | 214 (12.0%) | $0 |
| 1 Earner | 325 (18.3%) | $115,625 |
| 2 Earners | 764 (43.0%) | $78,077 |
| 3+ Earners | 473 (26.6%) | $156,875 |
| Total | 1,776 (100.0%) | $118,190 |
Household Income in Hillcrest
Household Income Brackets in Hillcrest
With 488 households falling in the category, the $200,000+ income range is the most frequent in Hillcrest, accounting for 24.6% of all households. In contrast, only 20 households (1.0%) fall into the less than $10,000 income bracket, making it the least populous group.
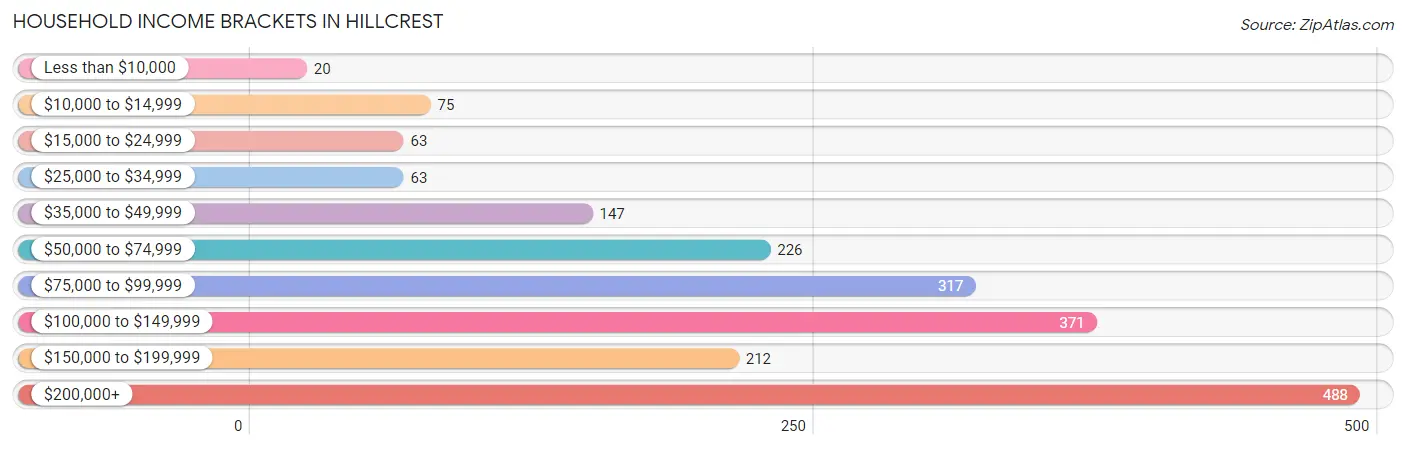
| Income Bracket | # Households | % Households |
| Less than $10,000 | 20 | 1.0% |
| $10,000 to $14,999 | 75 | 3.8% |
| $15,000 to $24,999 | 63 | 3.2% |
| $25,000 to $34,999 | 63 | 3.2% |
| $35,000 to $49,999 | 147 | 7.4% |
| $50,000 to $74,999 | 226 | 11.4% |
| $75,000 to $99,999 | 317 | 16.0% |
| $100,000 to $149,999 | 371 | 18.7% |
| $150,000 to $199,999 | 212 | 10.7% |
| $200,000+ | 488 | 24.6% |
Household Income by Householder Age in Hillcrest
The median household income in Hillcrest is $119,375, with the highest median household income of $126,823 found in the 65+ years age bracket for the primary householder. A total of 581 households (29.3%) fall into this category. Meanwhile, the 15 to 24 years age bracket for the primary householder has the lowest median household income of $0, with 49 households (2.5%) in this group.
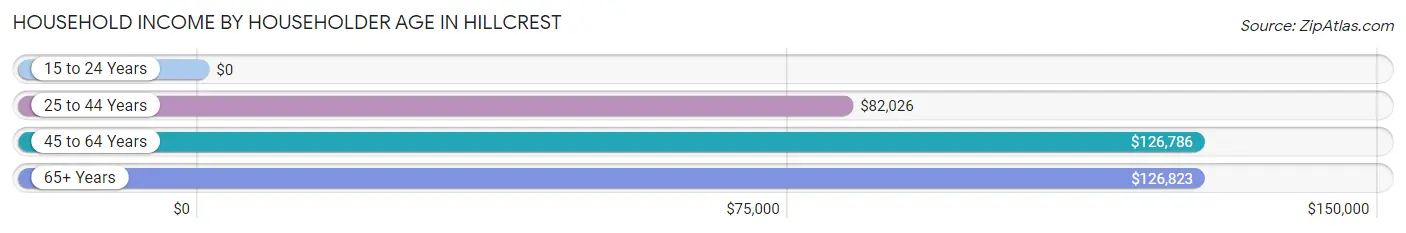
| Income Bracket | # Households | Median Income |
| 15 to 24 Years | 49 (2.5%) | $0 |
| 25 to 44 Years | 431 (21.7%) | $82,026 |
| 45 to 64 Years | 922 (46.5%) | $126,786 |
| 65+ Years | 581 (29.3%) | $126,823 |
| Total | 1,983 (100.0%) | $119,375 |
Poverty in Hillcrest
Income Below Poverty by Sex and Age in Hillcrest
With 18.3% poverty level for males and 16.1% for females among the residents of Hillcrest, 5 year old males and 15 year old females are the most vulnerable to poverty, with 47 males (55.9%) and 33 females (43.4%) in their respective age groups living below the poverty level.
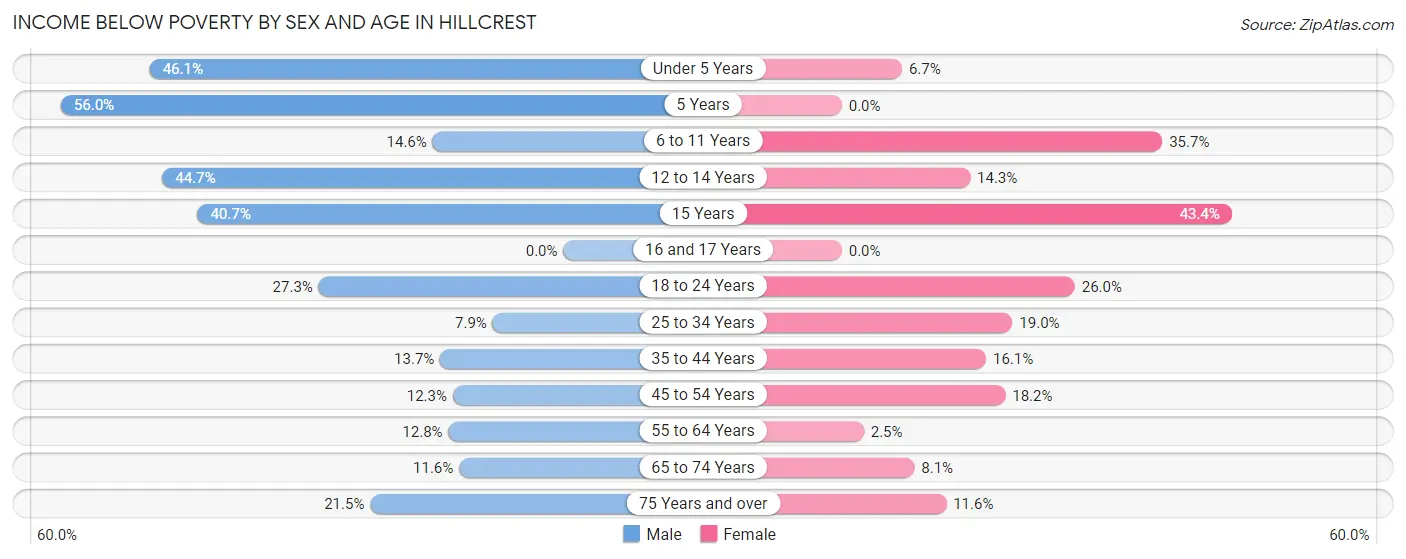
| Age Bracket | Male | Female |
| Under 5 Years | 76 (46.1%) | 14 (6.7%) |
| 5 Years | 47 (55.9%) | 0 (0.0%) |
| 6 to 11 Years | 23 (14.6%) | 121 (35.7%) |
| 12 to 14 Years | 117 (44.7%) | 7 (14.3%) |
| 15 Years | 22 (40.7%) | 33 (43.4%) |
| 16 and 17 Years | 0 (0.0%) | 0 (0.0%) |
| 18 to 24 Years | 130 (27.3%) | 68 (26.0%) |
| 25 to 34 Years | 54 (7.9%) | 106 (19.0%) |
| 35 to 44 Years | 86 (13.7%) | 81 (16.1%) |
| 45 to 54 Years | 74 (12.3%) | 104 (18.2%) |
| 55 to 64 Years | 43 (12.8%) | 12 (2.5%) |
| 65 to 74 Years | 41 (11.6%) | 24 (8.1%) |
| 75 Years and over | 37 (21.5%) | 25 (11.6%) |
| Total | 750 (18.3%) | 595 (16.1%) |
Income Above Poverty by Sex and Age in Hillcrest
According to the poverty statistics in Hillcrest, males aged 16 and 17 years and females aged 5 years are the age groups that are most secure financially, with 100.0% of males and 100.0% of females in these age groups living above the poverty line.
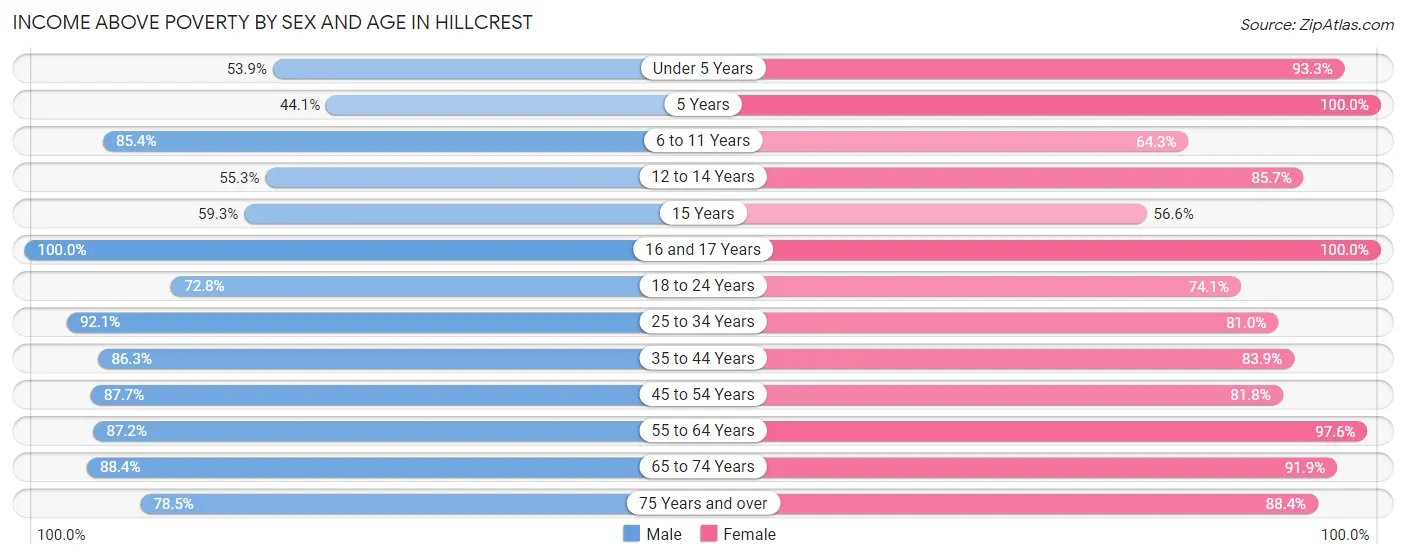
| Age Bracket | Male | Female |
| Under 5 Years | 89 (53.9%) | 195 (93.3%) |
| 5 Years | 37 (44.1%) | 13 (100.0%) |
| 6 to 11 Years | 135 (85.4%) | 218 (64.3%) |
| 12 to 14 Years | 145 (55.3%) | 42 (85.7%) |
| 15 Years | 32 (59.3%) | 43 (56.6%) |
| 16 and 17 Years | 125 (100.0%) | 117 (100.0%) |
| 18 to 24 Years | 347 (72.8%) | 194 (74.1%) |
| 25 to 34 Years | 632 (92.1%) | 452 (81.0%) |
| 35 to 44 Years | 541 (86.3%) | 423 (83.9%) |
| 45 to 54 Years | 527 (87.7%) | 467 (81.8%) |
| 55 to 64 Years | 293 (87.2%) | 478 (97.6%) |
| 65 to 74 Years | 312 (88.4%) | 273 (91.9%) |
| 75 Years and over | 135 (78.5%) | 190 (88.4%) |
| Total | 3,350 (81.7%) | 3,105 (83.9%) |
Income Below Poverty Among Married-Couple Families in Hillcrest
The poverty statistics for married-couple families in Hillcrest show that 10.9% or 132 of the total 1,207 families live below the poverty line. Families with 3 or 4 children have the highest poverty rate of 49.6%, comprising of 63 families. On the other hand, families with no children have the lowest poverty rate of 1.1%, which includes 7 families.
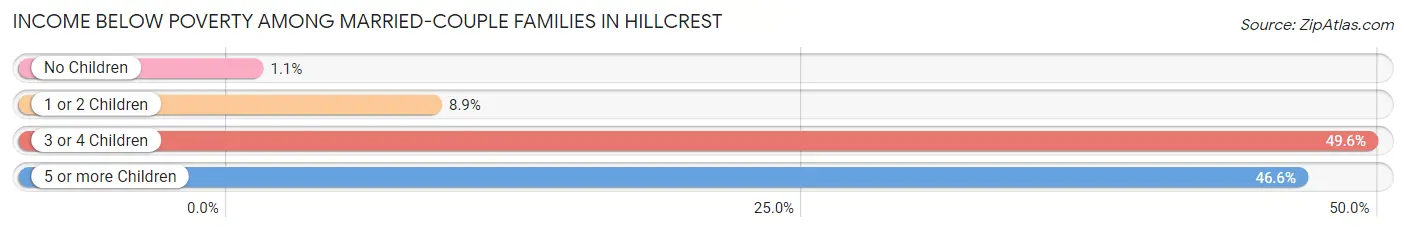
| Children | Above Poverty | Below Poverty |
| No Children | 621 (98.9%) | 7 (1.1%) |
| 1 or 2 Children | 359 (91.1%) | 35 (8.9%) |
| 3 or 4 Children | 64 (50.4%) | 63 (49.6%) |
| 5 or more Children | 31 (53.4%) | 27 (46.6%) |
| Total | 1,075 (89.1%) | 132 (10.9%) |
Income Below Poverty Among Single-Parent Households in Hillcrest
According to the poverty data in Hillcrest, 7.9% or 16 single-father households and 22.9% or 84 single-mother households are living below the poverty line. Among single-father households, those with no children have the highest poverty rate, with 16 households (15.1%) experiencing poverty. Likewise, among single-mother households, those with 1 or 2 children have the highest poverty rate, with 73 households (51.8%) falling below the poverty line.
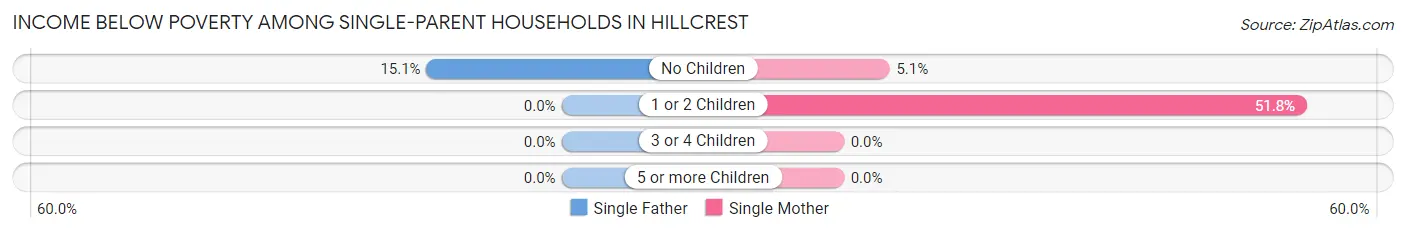
| Children | Single Father | Single Mother |
| No Children | 16 (15.1%) | 11 (5.1%) |
| 1 or 2 Children | 0 (0.0%) | 73 (51.8%) |
| 3 or 4 Children | 0 (0.0%) | 0 (0.0%) |
| 5 or more Children | 0 (0.0%) | 0 (0.0%) |
| Total | 16 (7.9%) | 84 (22.9%) |
Income Below Poverty Among Married-Couple vs Single-Parent Households in Hillcrest
The poverty data for Hillcrest shows that 132 of the married-couple family households (10.9%) and 100 of the single-parent households (17.6%) are living below the poverty level. Within the married-couple family households, those with 3 or 4 children have the highest poverty rate, with 63 households (49.6%) falling below the poverty line. Among the single-parent households, those with 1 or 2 children have the highest poverty rate, with 73 household (43.4%) living below poverty.
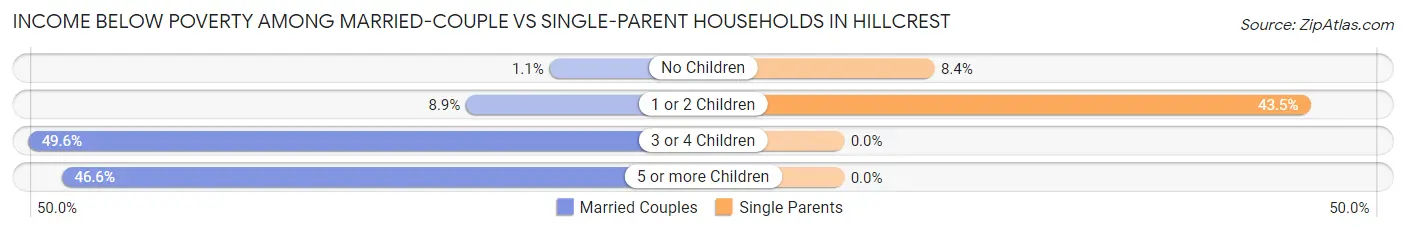
| Children | Married-Couple Families | Single-Parent Households |
| No Children | 7 (1.1%) | 27 (8.4%) |
| 1 or 2 Children | 35 (8.9%) | 73 (43.4%) |
| 3 or 4 Children | 63 (49.6%) | 0 (0.0%) |
| 5 or more Children | 27 (46.6%) | 0 (0.0%) |
| Total | 132 (10.9%) | 100 (17.6%) |
Race in Hillcrest
The most populous races in Hillcrest are Hispanic or Latino (3,544 | 43.3%), Black / African American (2,715 | 33.2%), and White / Caucasian (1,920 | 23.5%).
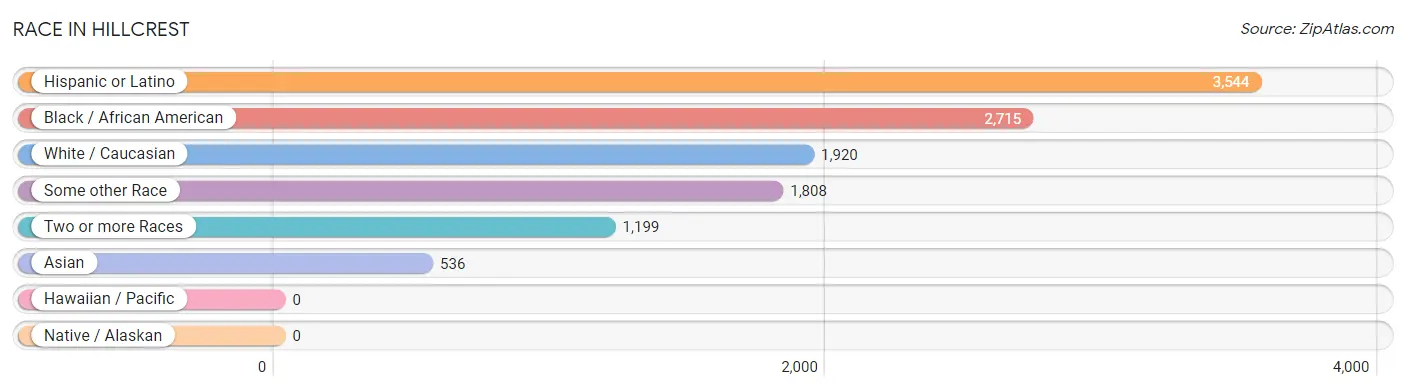
| Race | # Population | % Population |
| Asian | 536 | 6.6% |
| Black / African American | 2,715 | 33.2% |
| Hawaiian / Pacific | 0 | 0.0% |
| Hispanic or Latino | 3,544 | 43.3% |
| Native / Alaskan | 0 | 0.0% |
| White / Caucasian | 1,920 | 23.5% |
| Two or more Races | 1,199 | 14.7% |
| Some other Race | 1,808 | 22.1% |
| Total | 8,178 | 100.0% |
Ancestry in Hillcrest
The most populous ancestries reported in Hillcrest are Central American (1,227 | 15.0%), South American (965 | 11.8%), Ecuadorian (929 | 11.4%), Guatemalan (817 | 10.0%), and Haitian (558 | 6.8%), together accounting for 55.0% of all Hillcrest residents.
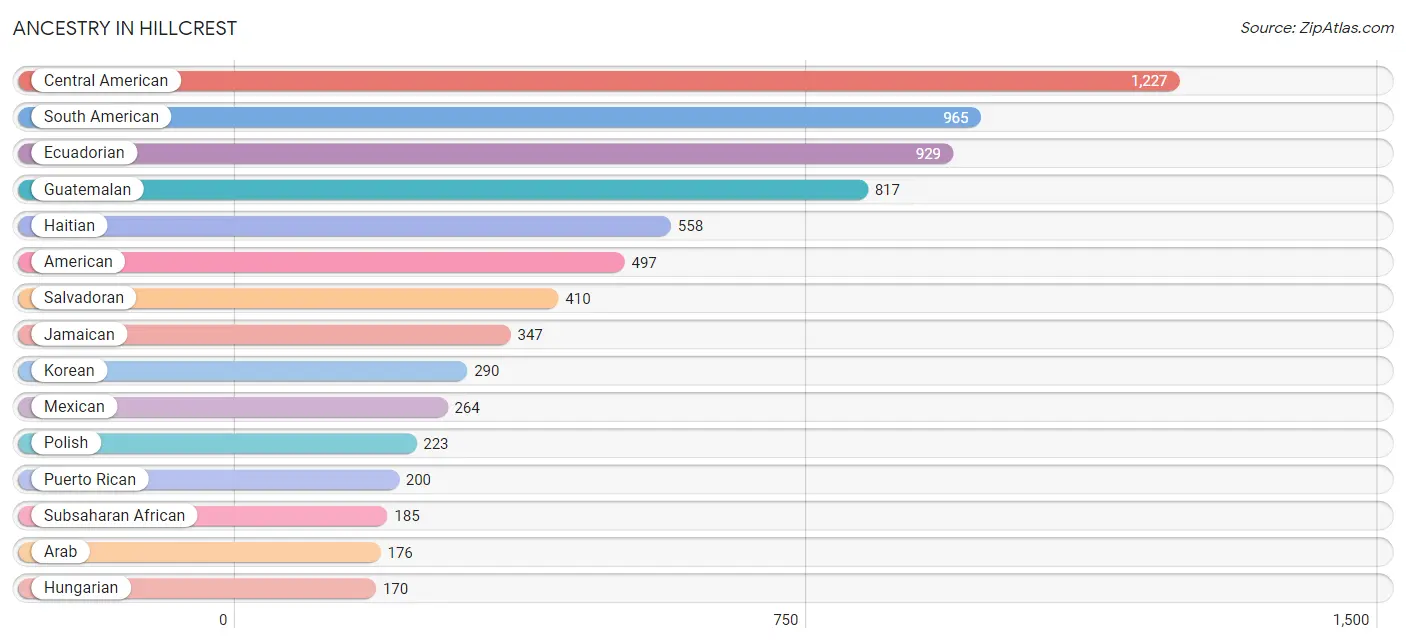
| Ancestry | # Population | % Population |
| African | 34 | 0.4% |
| American | 497 | 6.1% |
| Apache | 97 | 1.2% |
| Arab | 176 | 2.1% |
| Austrian | 12 | 0.2% |
| Barbadian | 15 | 0.2% |
| Blackfeet | 15 | 0.2% |
| British West Indian | 37 | 0.4% |
| Bulgarian | 16 | 0.2% |
| Canadian | 6 | 0.1% |
| Central American | 1,227 | 15.0% |
| Cherokee | 97 | 1.2% |
| Colombian | 7 | 0.1% |
| Croatian | 7 | 0.1% |
| Cuban | 20 | 0.2% |
| Dominican | 139 | 1.7% |
| Eastern European | 43 | 0.5% |
| Ecuadorian | 929 | 11.4% |
| Egyptian | 19 | 0.2% |
| English | 22 | 0.3% |
| European | 122 | 1.5% |
| French | 31 | 0.4% |
| German | 90 | 1.1% |
| Ghanaian | 151 | 1.8% |
| Guatemalan | 817 | 10.0% |
| Haitian | 558 | 6.8% |
| Hungarian | 170 | 2.1% |
| Indian (Asian) | 57 | 0.7% |
| Irish | 101 | 1.2% |
| Iroquois | 97 | 1.2% |
| Israeli | 4 | 0.1% |
| Italian | 53 | 0.6% |
| Jamaican | 347 | 4.2% |
| Japanese | 11 | 0.1% |
| Korean | 290 | 3.5% |
| Mexican | 264 | 3.2% |
| Paraguayan | 9 | 0.1% |
| Pennsylvania German | 6 | 0.1% |
| Peruvian | 20 | 0.2% |
| Polish | 223 | 2.7% |
| Puerto Rican | 200 | 2.5% |
| Romanian | 31 | 0.4% |
| Russian | 12 | 0.2% |
| Salvadoran | 410 | 5.0% |
| Sioux | 97 | 1.2% |
| South American | 965 | 11.8% |
| Spaniard | 97 | 1.2% |
| Spanish | 3 | 0.0% |
| Sri Lankan | 27 | 0.3% |
| Subsaharan African | 185 | 2.3% |
| Syrian | 15 | 0.2% |
| Thai | 145 | 1.8% |
| Ukrainian | 4 | 0.1% |
| West Indian | 12 | 0.2% | View All 54 Rows |
Immigrants in Hillcrest
The most numerous immigrant groups reported in Hillcrest came from Latin America (2,756 | 33.7%), South America (962 | 11.8%), Ecuador (944 | 11.5%), Central America (911 | 11.1%), and Caribbean (883 | 10.8%), together accounting for 78.9% of all Hillcrest residents.
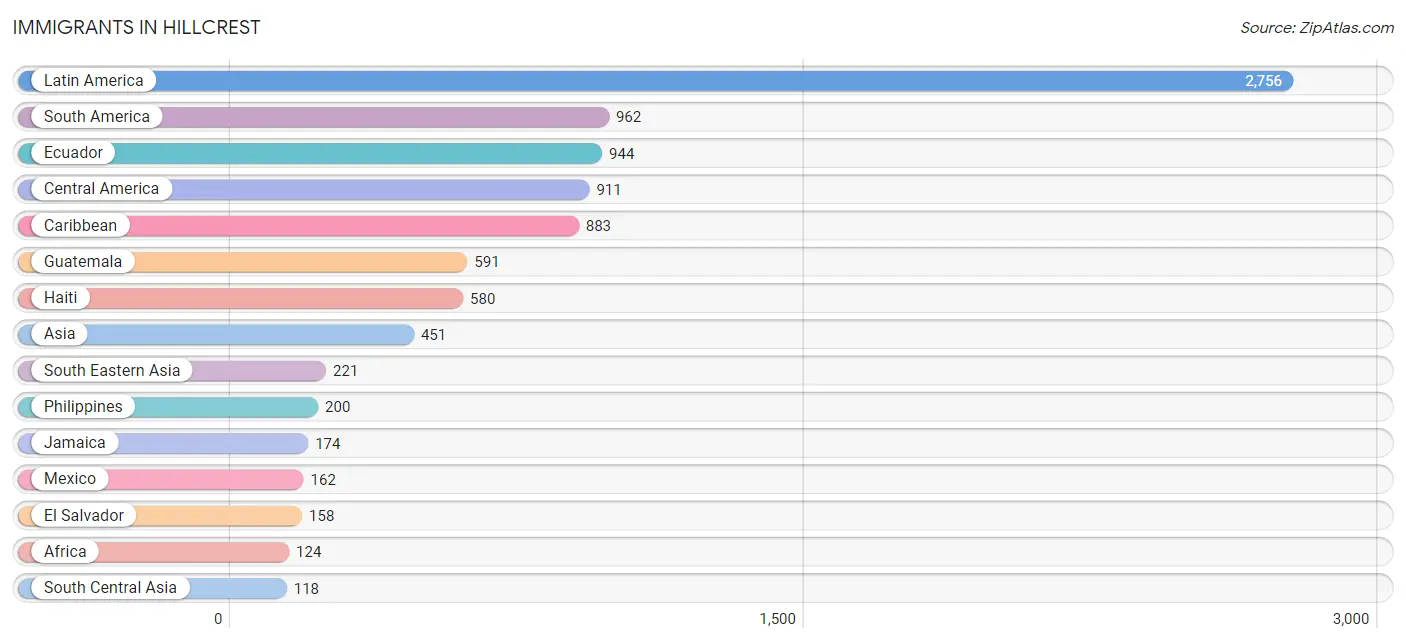
| Immigration Origin | # Population | % Population |
| Africa | 124 | 1.5% |
| Asia | 451 | 5.5% |
| Barbados | 15 | 0.2% |
| Belarus | 4 | 0.1% |
| Bulgaria | 16 | 0.2% |
| Cambodia | 11 | 0.1% |
| Canada | 6 | 0.1% |
| Caribbean | 883 | 10.8% |
| Central America | 911 | 11.1% |
| China | 52 | 0.6% |
| Colombia | 7 | 0.1% |
| Croatia | 7 | 0.1% |
| Dominica | 6 | 0.1% |
| Dominican Republic | 77 | 0.9% |
| Eastern Africa | 10 | 0.1% |
| Eastern Asia | 61 | 0.7% |
| Eastern Europe | 36 | 0.4% |
| Ecuador | 944 | 11.5% |
| El Salvador | 158 | 1.9% |
| England | 39 | 0.5% |
| Europe | 82 | 1.0% |
| Ghana | 114 | 1.4% |
| Guatemala | 591 | 7.2% |
| Guyana | 2 | 0.0% |
| Haiti | 580 | 7.1% |
| India | 82 | 1.0% |
| Israel | 4 | 0.1% |
| Italy | 7 | 0.1% |
| Jamaica | 174 | 2.1% |
| Korea | 9 | 0.1% |
| Latin America | 2,756 | 33.7% |
| Mexico | 162 | 2.0% |
| Northern Europe | 39 | 0.5% |
| Pakistan | 36 | 0.4% |
| Philippines | 200 | 2.5% |
| Poland | 6 | 0.1% |
| Russia | 3 | 0.0% |
| Somalia | 10 | 0.1% |
| South America | 962 | 11.8% |
| South Central Asia | 118 | 1.4% |
| South Eastern Asia | 221 | 2.7% |
| Southern Europe | 7 | 0.1% |
| Taiwan | 25 | 0.3% |
| Vietnam | 10 | 0.1% |
| Western Africa | 114 | 1.4% |
| Western Asia | 51 | 0.6% |
| Yemen | 47 | 0.6% | View All 47 Rows |
Sex and Age in Hillcrest
Sex and Age in Hillcrest
The most populous age groups in Hillcrest are 30 to 34 Years (432 | 9.9%) for men and 45 to 49 Years (312 | 8.2%) for women.
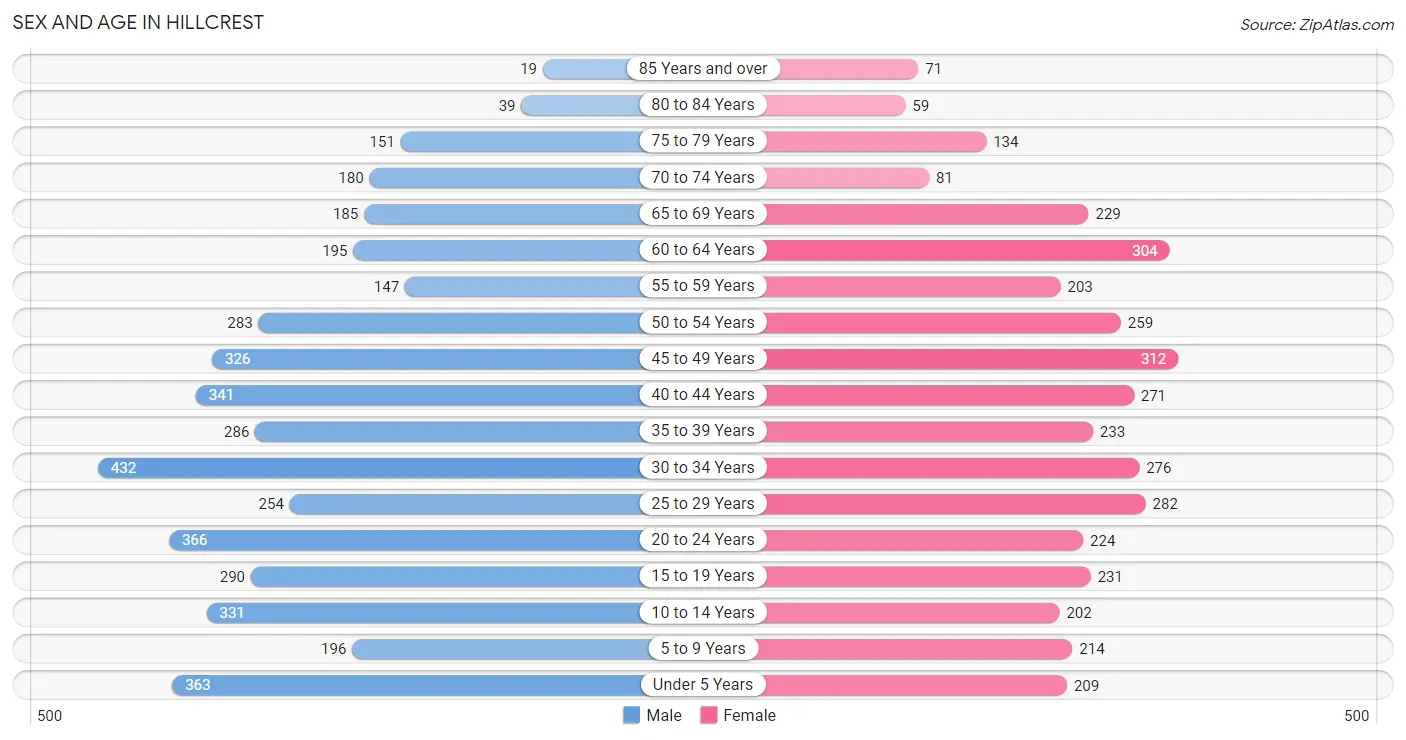
| Age Bracket | Male | Female |
| Under 5 Years | 363 (8.3%) | 209 (5.5%) |
| 5 to 9 Years | 196 (4.5%) | 214 (5.6%) |
| 10 to 14 Years | 331 (7.5%) | 202 (5.3%) |
| 15 to 19 Years | 290 (6.6%) | 231 (6.1%) |
| 20 to 24 Years | 366 (8.4%) | 224 (5.9%) |
| 25 to 29 Years | 254 (5.8%) | 282 (7.4%) |
| 30 to 34 Years | 432 (9.9%) | 276 (7.3%) |
| 35 to 39 Years | 286 (6.5%) | 233 (6.1%) |
| 40 to 44 Years | 341 (7.8%) | 271 (7.1%) |
| 45 to 49 Years | 326 (7.4%) | 312 (8.2%) |
| 50 to 54 Years | 283 (6.5%) | 259 (6.8%) |
| 55 to 59 Years | 147 (3.4%) | 203 (5.3%) |
| 60 to 64 Years | 195 (4.4%) | 304 (8.0%) |
| 65 to 69 Years | 185 (4.2%) | 229 (6.0%) |
| 70 to 74 Years | 180 (4.1%) | 81 (2.1%) |
| 75 to 79 Years | 151 (3.4%) | 134 (3.5%) |
| 80 to 84 Years | 39 (0.9%) | 59 (1.6%) |
| 85 Years and over | 19 (0.4%) | 71 (1.9%) |
| Total | 4,384 (100.0%) | 3,794 (100.0%) |
Families and Households in Hillcrest
Median Family Size in Hillcrest
The median family size in Hillcrest is 3.89 persons per family, with single male/father families (202 | 11.4%) accounting for the largest median family size of 4.48 persons per family. On the other hand, single female/mother families (367 | 20.7%) represent the smallest median family size with 3.49 persons per family.
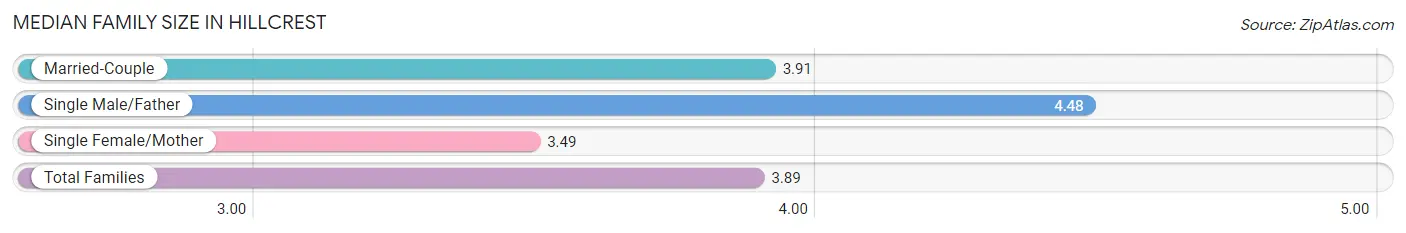
| Family Type | # Families | Family Size |
| Married-Couple | 1,207 (68.0%) | 3.91 |
| Single Male/Father | 202 (11.4%) | 4.48 |
| Single Female/Mother | 367 (20.7%) | 3.49 |
| Total Families | 1,776 (100.0%) | 3.89 |
Median Household Size in Hillcrest
The median household size in Hillcrest is 4.03 persons per household, with single female/mother households (367 | 18.5%) accounting for the largest median household size of 5.11 persons per household. non-family households (207 | 10.4%) represent the smallest median household size with 1.43 persons per household.
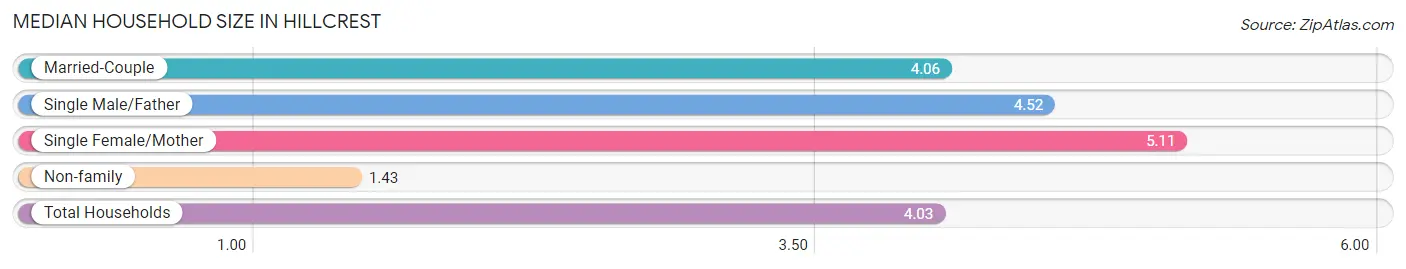
| Household Type | # Households | Household Size |
| Married-Couple | 1,207 (60.9%) | 4.06 |
| Single Male/Father | 202 (10.2%) | 4.52 |
| Single Female/Mother | 367 (18.5%) | 5.11 |
| Non-family | 207 (10.4%) | 1.43 |
| Total Households | 1,983 (100.0%) | 4.03 |
Household Size by Marriage Status in Hillcrest
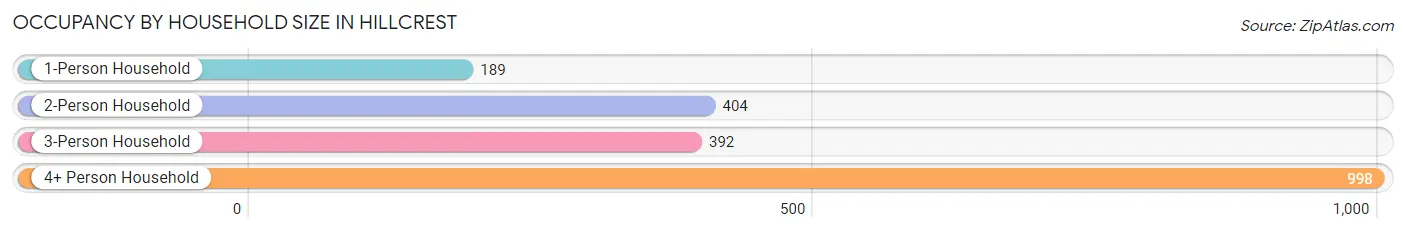
Out of a total of 1,983 households in Hillcrest, 1,776 (89.6%) are family households, while 207 (10.4%) are nonfamily households. The most numerous type of family households are 2-person households, comprising 404, and the most common type of nonfamily households are 1-person households, comprising 189.
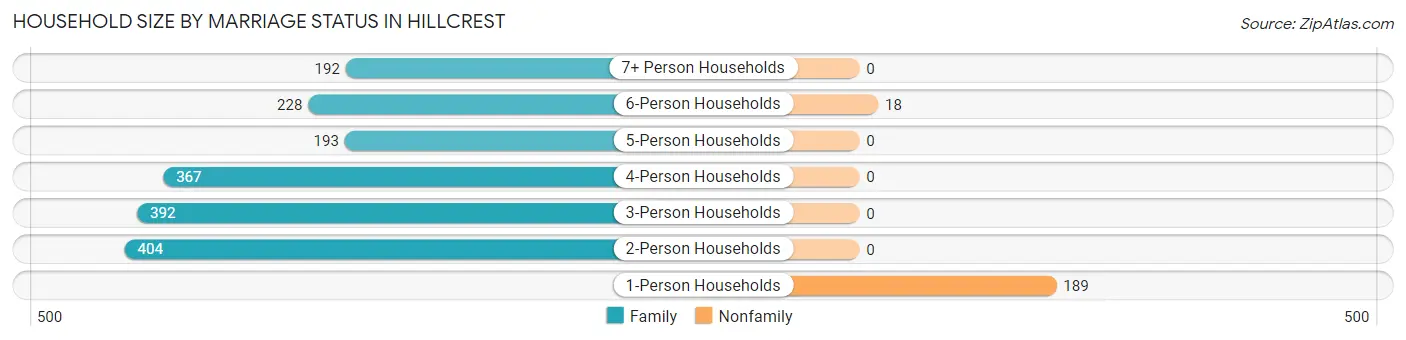
| Household Size | Family Households | Nonfamily Households |
| 1-Person Households | - | 189 (9.5%) |
| 2-Person Households | 404 (20.4%) | 0 (0.0%) |
| 3-Person Households | 392 (19.8%) | 0 (0.0%) |
| 4-Person Households | 367 (18.5%) | 0 (0.0%) |
| 5-Person Households | 193 (9.7%) | 0 (0.0%) |
| 6-Person Households | 228 (11.5%) | 18 (0.9%) |
| 7+ Person Households | 192 (9.7%) | 0 (0.0%) |
| Total | 1,776 (89.6%) | 207 (10.4%) |
Female Fertility in Hillcrest
Fertility by Age in Hillcrest
Average fertility rate in Hillcrest is 10.0 births per 1,000 women. Women in the age bracket of 20 to 34 years have the highest fertility rate with 14.0 births per 1,000 women. Women in the age bracket of 20 to 34 years acount for 61.1% of all women with births.
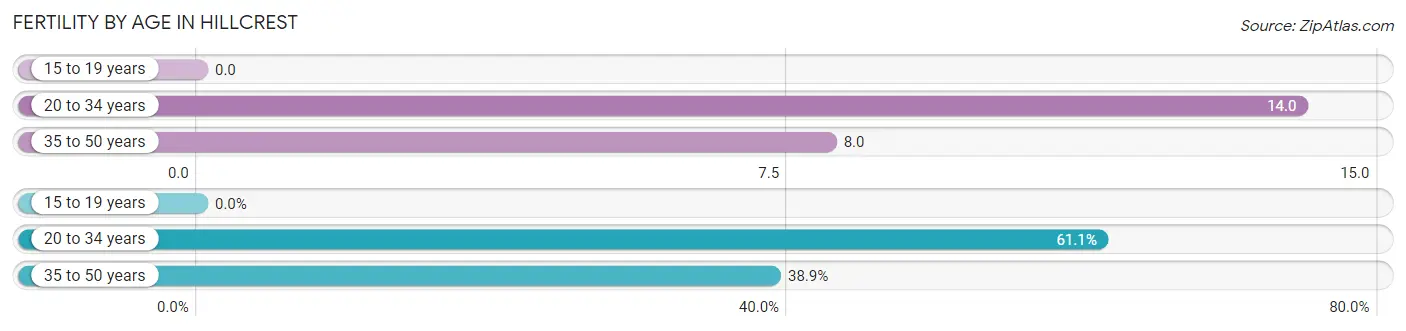
| Age Bracket | Women with Births | Births / 1,000 Women |
| 15 to 19 years | 0 (0.0%) | 0.0 |
| 20 to 34 years | 11 (61.1%) | 14.0 |
| 35 to 50 years | 7 (38.9%) | 8.0 |
| Total | 18 (100.0%) | 10.0 |
Fertility by Age by Marriage Status in Hillcrest
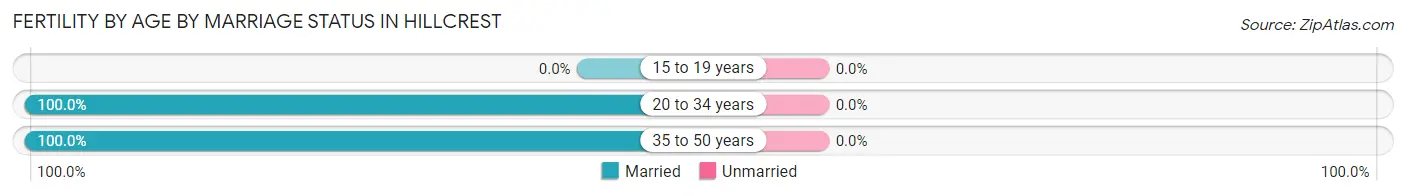
| Age Bracket | Married | Unmarried |
| 15 to 19 years | 0 (0.0%) | 0 (0.0%) |
| 20 to 34 years | 11 (100.0%) | 0 (0.0%) |
| 35 to 50 years | 7 (100.0%) | 0 (0.0%) |
| Total | 18 (100.0%) | 0 (0.0%) |
Fertility by Education in Hillcrest
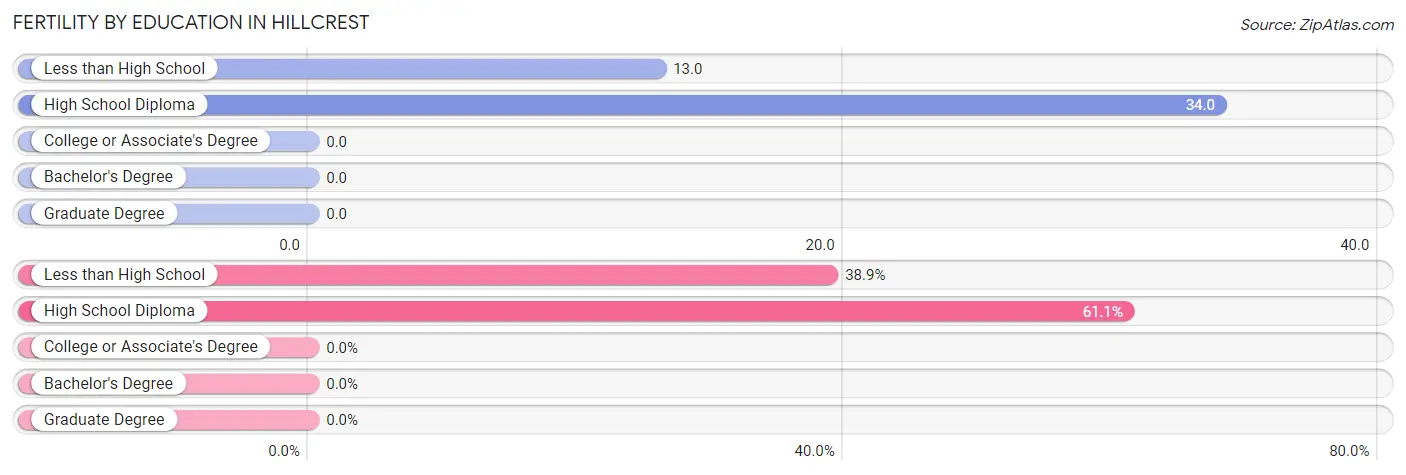
| Educational Attainment | Women with Births | Births / 1,000 Women |
| Less than High School | 7 (38.9%) | 13.0 |
| High School Diploma | 11 (61.1%) | 34.0 |
| College or Associate's Degree | 0 (0.0%) | 0.0 |
| Bachelor's Degree | 0 (0.0%) | 0.0 |
| Graduate Degree | 0 (0.0%) | 0.0 |
| Total | 18 (100.0%) | 10.0 |
Fertility by Education by Marriage Status in Hillcrest
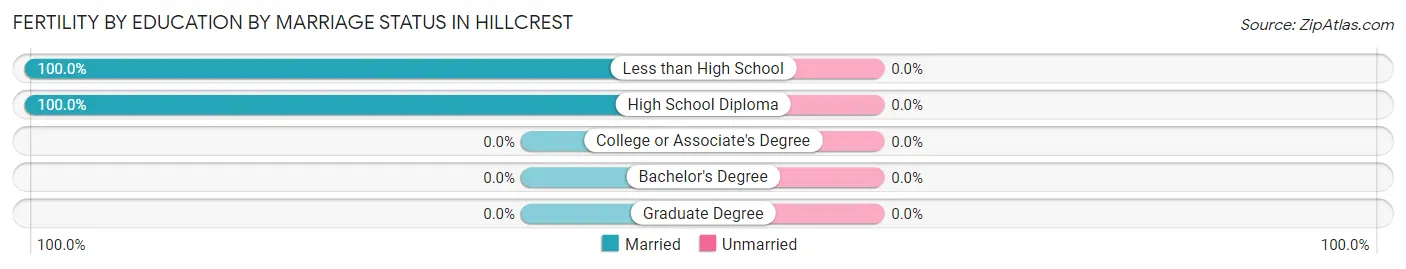
| Educational Attainment | Married | Unmarried |
| Less than High School | 7 (100.0%) | 0 (0.0%) |
| High School Diploma | 11 (100.0%) | 0 (0.0%) |
| College or Associate's Degree | 0 (0.0%) | 0 (0.0%) |
| Bachelor's Degree | 0 (0.0%) | 0 (0.0%) |
| Graduate Degree | 0 (0.0%) | 0 (0.0%) |
| Total | 18 (100.0%) | 0 (0.0%) |
Employment Characteristics in Hillcrest
Employment by Class of Employer in Hillcrest
Among the 4,042 employed individuals in Hillcrest, private company employees (2,423 | 60.0%), not-for-profit organizations (432 | 10.7%), and self-employed (not incorporated) (426 | 10.5%) make up the most common classes of employment.
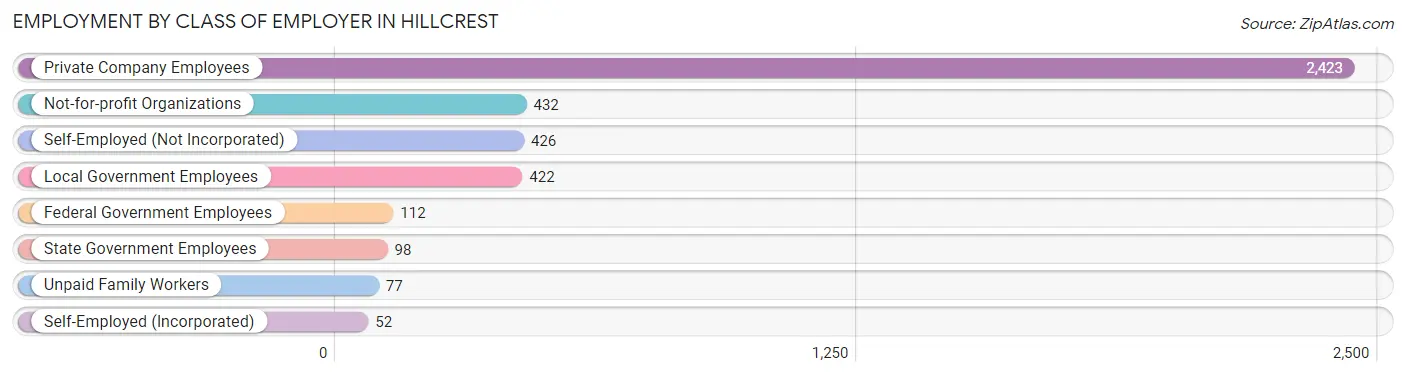
| Employer Class | # Employees | % Employees |
| Private Company Employees | 2,423 | 60.0% |
| Self-Employed (Incorporated) | 52 | 1.3% |
| Self-Employed (Not Incorporated) | 426 | 10.5% |
| Not-for-profit Organizations | 432 | 10.7% |
| Local Government Employees | 422 | 10.4% |
| State Government Employees | 98 | 2.4% |
| Federal Government Employees | 112 | 2.8% |
| Unpaid Family Workers | 77 | 1.9% |
| Total | 4,042 | 100.0% |
Employment Status by Age in Hillcrest
According to the labor force statistics for Hillcrest, out of the total population over 16 years of age (6,533), 67.4% or 4,403 individuals are in the labor force, with 7.4% or 326 of them unemployed. The age group with the highest labor force participation rate is 30 to 34 years, with 89.7% or 635 individuals in the labor force. Within the labor force, the 75 years and over age range has the highest percentage of unemployed individuals, with 36.5% or 31 of them being unemployed.
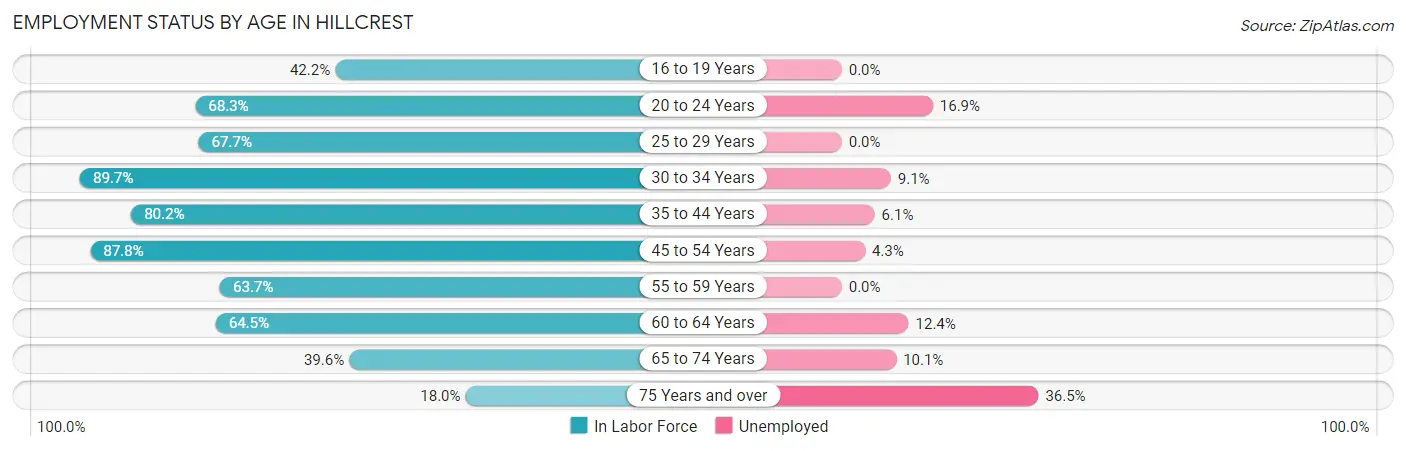
| Age Bracket | In Labor Force | Unemployed |
| 16 to 19 Years | 165 (42.2%) | 0 (0.0%) |
| 20 to 24 Years | 403 (68.3%) | 68 (16.9%) |
| 25 to 29 Years | 363 (67.7%) | 0 (0.0%) |
| 30 to 34 Years | 635 (89.7%) | 58 (9.1%) |
| 35 to 44 Years | 907 (80.2%) | 55 (6.1%) |
| 45 to 54 Years | 1,036 (87.8%) | 45 (4.3%) |
| 55 to 59 Years | 223 (63.7%) | 0 (0.0%) |
| 60 to 64 Years | 322 (64.5%) | 40 (12.4%) |
| 65 to 74 Years | 267 (39.6%) | 27 (10.1%) |
| 75 Years and over | 85 (18.0%) | 31 (36.5%) |
| Total | 4,403 (67.4%) | 326 (7.4%) |
Employment Status by Educational Attainment in Hillcrest
According to labor force statistics for Hillcrest, 79.2% of individuals (3,488) out of the total population between 25 and 64 years of age (4,404) are in the labor force, with 5.7% or 199 of them being unemployed. The group with the highest labor force participation rate are those with the educational attainment of bachelor's degree or higher, with 86.5% or 1,163 individuals in the labor force. Within the labor force, individuals with bachelor's degree or higher education have the highest percentage of unemployment, with 11.5% or 134 of them being unemployed.
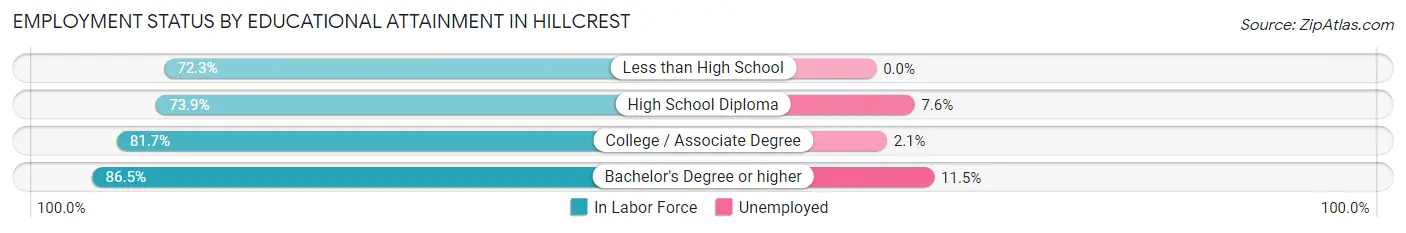
| Educational Attainment | In Labor Force | Unemployed |
| Less than High School | 869 (72.3%) | 0 (0.0%) |
| High School Diploma | 609 (73.9%) | 63 (7.6%) |
| College / Associate Degree | 844 (81.7%) | 22 (2.1%) |
| Bachelor's Degree or higher | 1,163 (86.5%) | 155 (11.5%) |
| Total | 3,488 (79.2%) | 251 (5.7%) |
Employment Occupations by Sex in Hillcrest
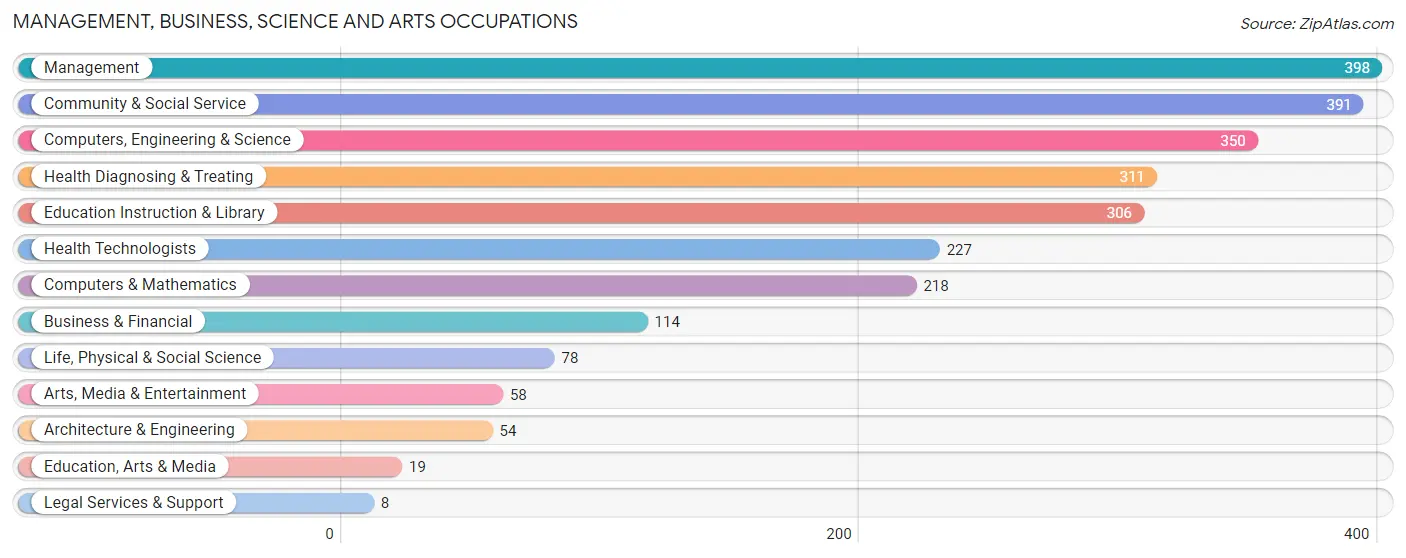
Management, Business, Science and Arts Occupations
The most common Management, Business, Science and Arts occupations in Hillcrest are Management (398 | 9.8%), Community & Social Service (391 | 9.6%), Computers, Engineering & Science (350 | 8.6%), Health Diagnosing & Treating (311 | 7.6%), and Education Instruction & Library (306 | 7.5%).
Management, Business, Science and Arts Occupations by Sex
Within the Management, Business, Science and Arts occupations in Hillcrest, the most male-oriented occupations are Architecture & Engineering (100.0%), Legal Services & Support (100.0%), and Arts, Media & Entertainment (65.5%), while the most female-oriented occupations are Education, Arts & Media (100.0%), Life, Physical & Social Science (84.6%), and Business & Financial (61.4%).
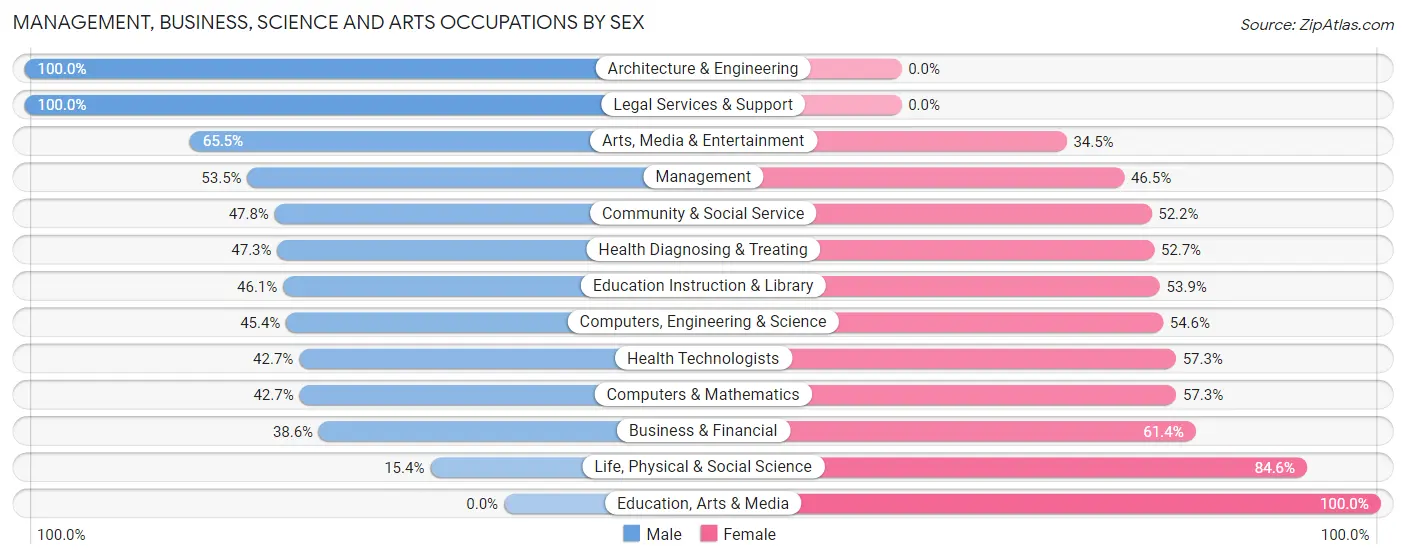
| Occupation | Male | Female |
| Management | 213 (53.5%) | 185 (46.5%) |
| Business & Financial | 44 (38.6%) | 70 (61.4%) |
| Computers, Engineering & Science | 159 (45.4%) | 191 (54.6%) |
| Computers & Mathematics | 93 (42.7%) | 125 (57.3%) |
| Architecture & Engineering | 54 (100.0%) | 0 (0.0%) |
| Life, Physical & Social Science | 12 (15.4%) | 66 (84.6%) |
| Community & Social Service | 187 (47.8%) | 204 (52.2%) |
| Education, Arts & Media | 0 (0.0%) | 19 (100.0%) |
| Legal Services & Support | 8 (100.0%) | 0 (0.0%) |
| Education Instruction & Library | 141 (46.1%) | 165 (53.9%) |
| Arts, Media & Entertainment | 38 (65.5%) | 20 (34.5%) |
| Health Diagnosing & Treating | 147 (47.3%) | 164 (52.7%) |
| Health Technologists | 97 (42.7%) | 130 (57.3%) |
| Total (Category) | 750 (47.9%) | 814 (52.0%) |
| Total (Overall) | 2,381 (58.3%) | 1,701 (41.7%) |
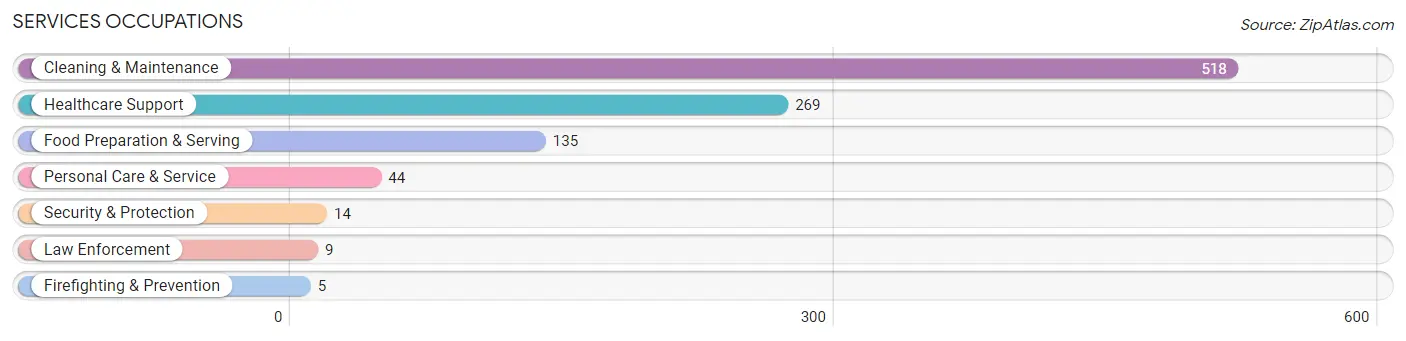
Services Occupations
The most common Services occupations in Hillcrest are Cleaning & Maintenance (518 | 12.7%), Healthcare Support (269 | 6.6%), Food Preparation & Serving (135 | 3.3%), Personal Care & Service (44 | 1.1%), and Security & Protection (14 | 0.3%).
Services Occupations by Sex
Within the Services occupations in Hillcrest, the most male-oriented occupations are Security & Protection (100.0%), Firefighting & Prevention (100.0%), and Law Enforcement (100.0%), while the most female-oriented occupations are Personal Care & Service (100.0%), Healthcare Support (75.1%), and Cleaning & Maintenance (34.4%).
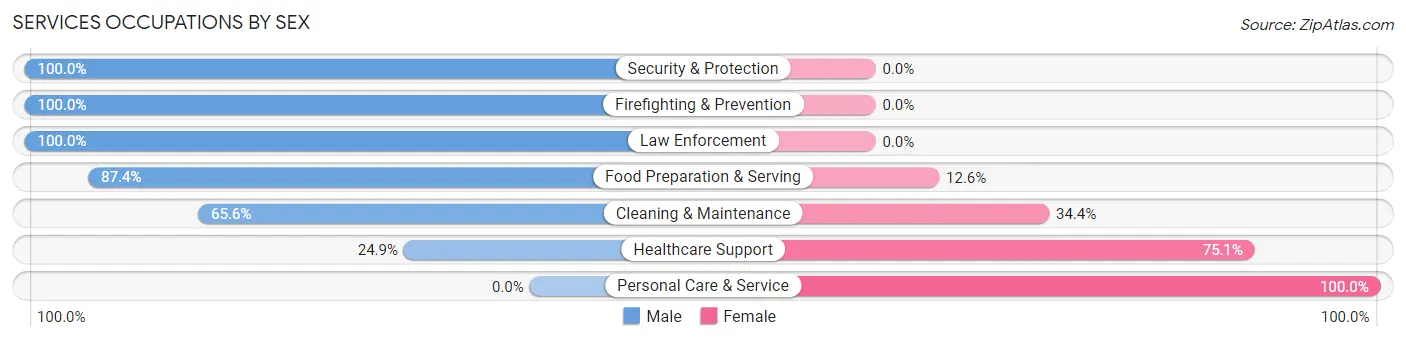
| Occupation | Male | Female |
| Healthcare Support | 67 (24.9%) | 202 (75.1%) |
| Security & Protection | 14 (100.0%) | 0 (0.0%) |
| Firefighting & Prevention | 5 (100.0%) | 0 (0.0%) |
| Law Enforcement | 9 (100.0%) | 0 (0.0%) |
| Food Preparation & Serving | 118 (87.4%) | 17 (12.6%) |
| Cleaning & Maintenance | 340 (65.6%) | 178 (34.4%) |
| Personal Care & Service | 0 (0.0%) | 44 (100.0%) |
| Total (Category) | 539 (55.0%) | 441 (45.0%) |
| Total (Overall) | 2,381 (58.3%) | 1,701 (41.7%) |
Sales and Office Occupations
The most common Sales and Office occupations in Hillcrest are Sales & Related (527 | 12.9%), and Office & Administration (317 | 7.8%).
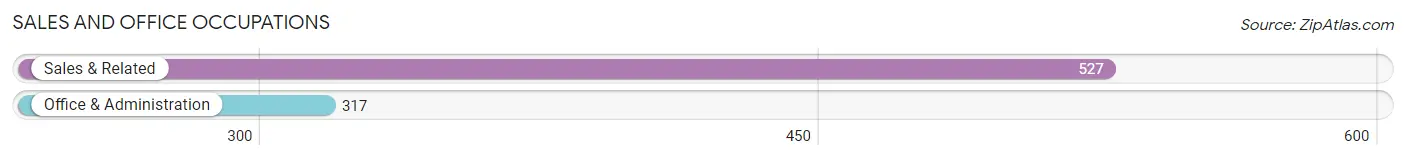
Sales and Office Occupations by Sex
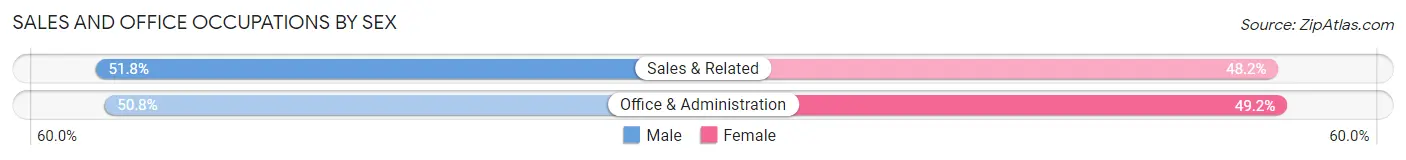
| Occupation | Male | Female |
| Sales & Related | 273 (51.8%) | 254 (48.2%) |
| Office & Administration | 161 (50.8%) | 156 (49.2%) |
| Total (Category) | 434 (51.4%) | 410 (48.6%) |
| Total (Overall) | 2,381 (58.3%) | 1,701 (41.7%) |
Natural Resources, Construction and Maintenance Occupations
The most common Natural Resources, Construction and Maintenance occupations in Hillcrest are Construction & Extraction (261 | 6.4%), Farming, Fishing & Forestry (77 | 1.9%), and Installation, Maintenance & Repair (53 | 1.3%).
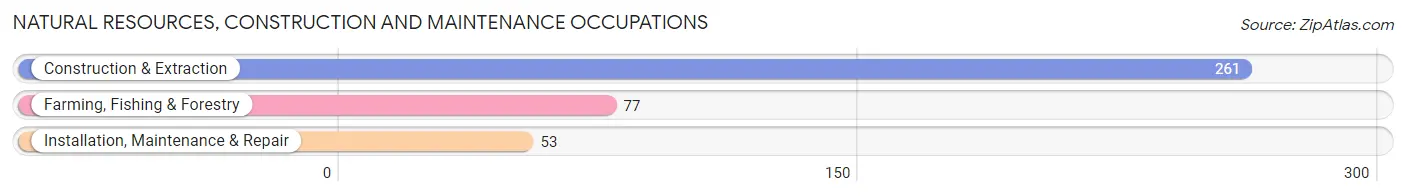
Natural Resources, Construction and Maintenance Occupations by Sex
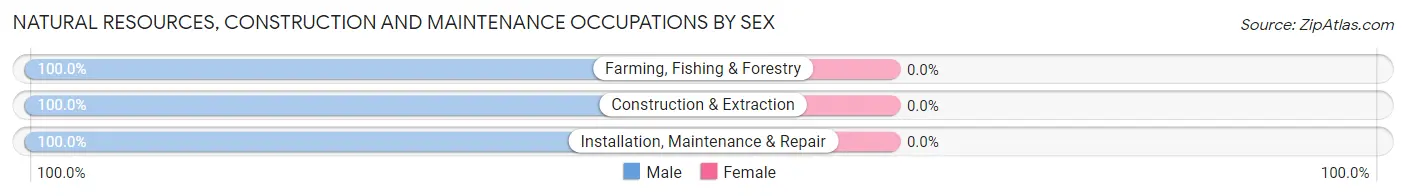
| Occupation | Male | Female |
| Farming, Fishing & Forestry | 77 (100.0%) | 0 (0.0%) |
| Construction & Extraction | 261 (100.0%) | 0 (0.0%) |
| Installation, Maintenance & Repair | 53 (100.0%) | 0 (0.0%) |
| Total (Category) | 391 (100.0%) | 0 (0.0%) |
| Total (Overall) | 2,381 (58.3%) | 1,701 (41.7%) |
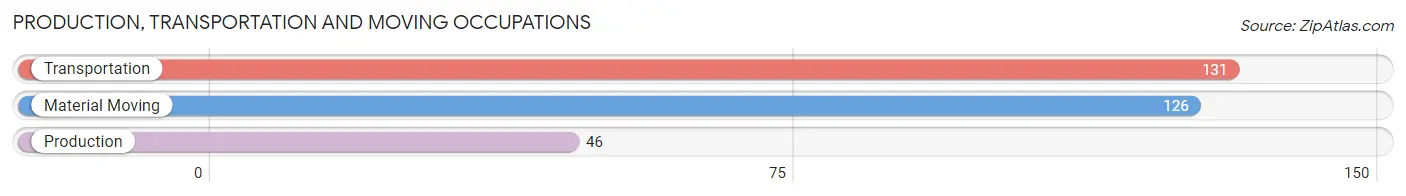
Production, Transportation and Moving Occupations
The most common Production, Transportation and Moving occupations in Hillcrest are Transportation (131 | 3.2%), Material Moving (126 | 3.1%), and Production (46 | 1.1%).
Production, Transportation and Moving Occupations by Sex
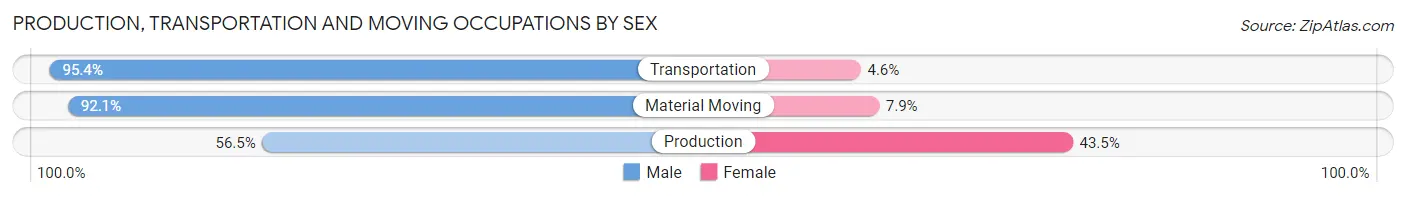
| Occupation | Male | Female |
| Production | 26 (56.5%) | 20 (43.5%) |
| Transportation | 125 (95.4%) | 6 (4.6%) |
| Material Moving | 116 (92.1%) | 10 (7.9%) |
| Total (Category) | 267 (88.1%) | 36 (11.9%) |
| Total (Overall) | 2,381 (58.3%) | 1,701 (41.7%) |
Employment Industries by Sex in Hillcrest
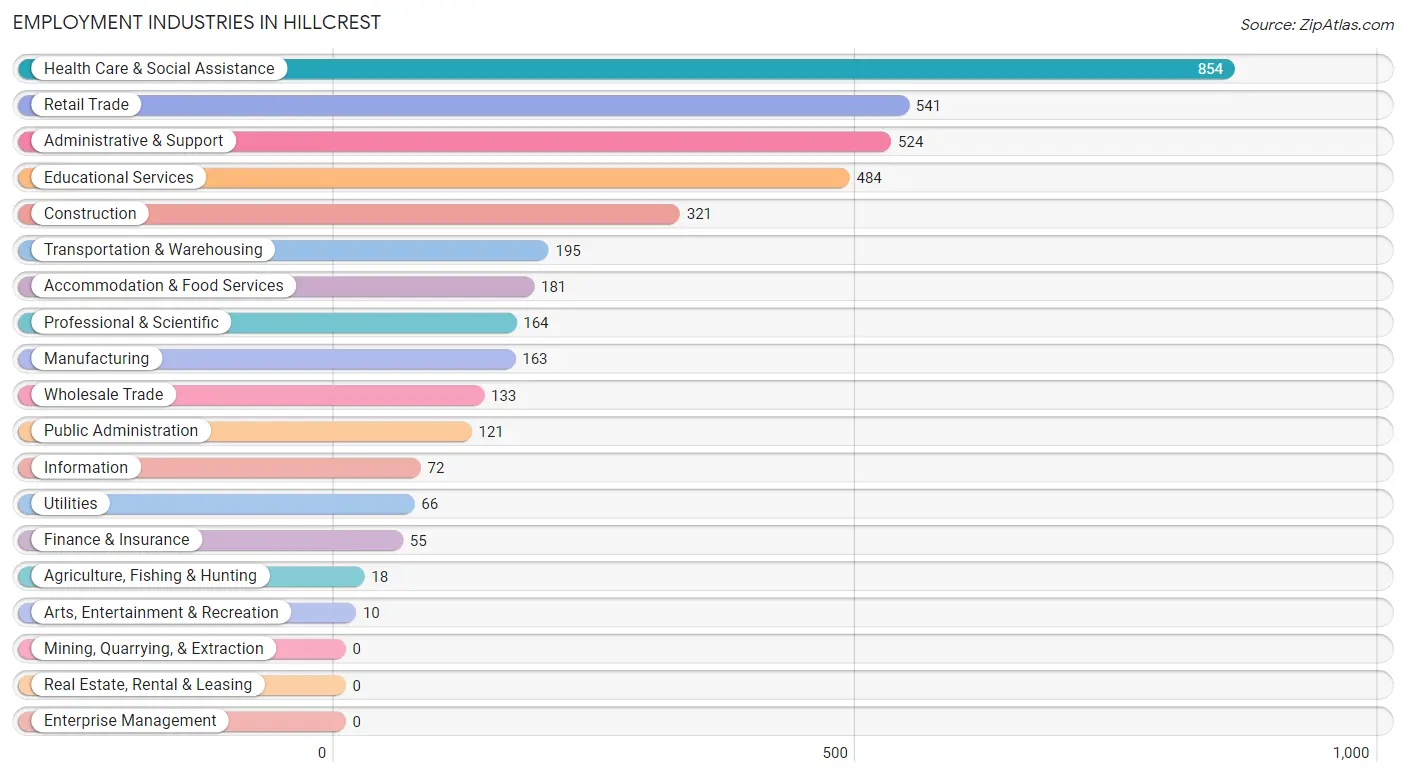
Employment Industries in Hillcrest
The major employment industries in Hillcrest include Health Care & Social Assistance (854 | 20.9%), Retail Trade (541 | 13.3%), Administrative & Support (524 | 12.8%), Educational Services (484 | 11.9%), and Construction (321 | 7.9%).
Employment Industries by Sex in Hillcrest
The Hillcrest industries that see more men than women are Agriculture, Fishing & Hunting (100.0%), Construction (100.0%), and Arts, Entertainment & Recreation (100.0%), whereas the industries that tend to have a higher number of women are Public Administration (82.6%), Information (70.8%), and Finance & Insurance (60.0%).
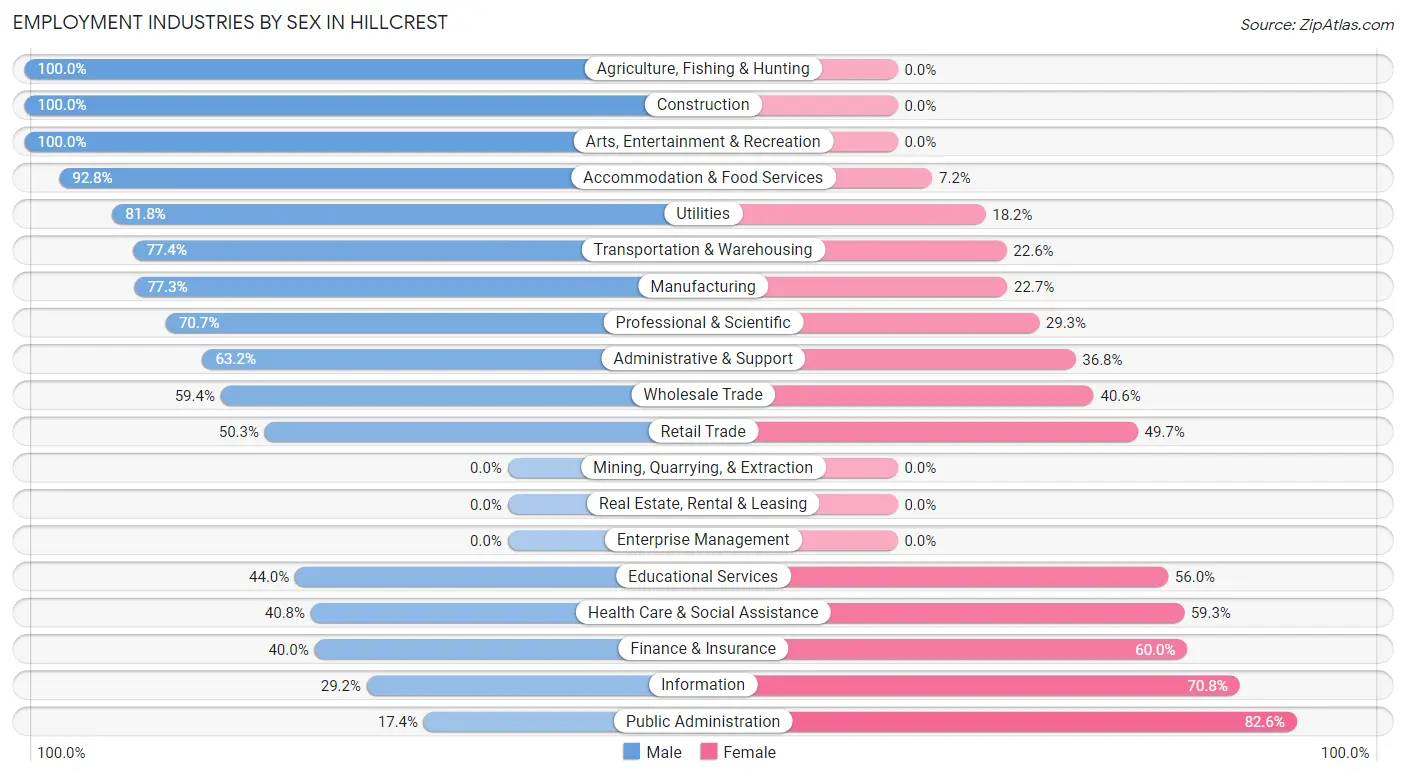
| Industry | Male | Female |
| Agriculture, Fishing & Hunting | 18 (100.0%) | 0 (0.0%) |
| Mining, Quarrying, & Extraction | 0 (0.0%) | 0 (0.0%) |
| Construction | 321 (100.0%) | 0 (0.0%) |
| Manufacturing | 126 (77.3%) | 37 (22.7%) |
| Wholesale Trade | 79 (59.4%) | 54 (40.6%) |
| Retail Trade | 272 (50.3%) | 269 (49.7%) |
| Transportation & Warehousing | 151 (77.4%) | 44 (22.6%) |
| Utilities | 54 (81.8%) | 12 (18.2%) |
| Information | 21 (29.2%) | 51 (70.8%) |
| Finance & Insurance | 22 (40.0%) | 33 (60.0%) |
| Real Estate, Rental & Leasing | 0 (0.0%) | 0 (0.0%) |
| Professional & Scientific | 116 (70.7%) | 48 (29.3%) |
| Enterprise Management | 0 (0.0%) | 0 (0.0%) |
| Administrative & Support | 331 (63.2%) | 193 (36.8%) |
| Educational Services | 213 (44.0%) | 271 (56.0%) |
| Health Care & Social Assistance | 348 (40.7%) | 506 (59.3%) |
| Arts, Entertainment & Recreation | 10 (100.0%) | 0 (0.0%) |
| Accommodation & Food Services | 168 (92.8%) | 13 (7.2%) |
| Public Administration | 21 (17.4%) | 100 (82.6%) |
| Total | 2,381 (58.3%) | 1,701 (41.7%) |
Education in Hillcrest
School Enrollment in Hillcrest
The most common levels of schooling among the 1,899 students in Hillcrest are high school (517 | 27.2%), college / undergraduate (414 | 21.8%), and middle school (405 | 21.3%).
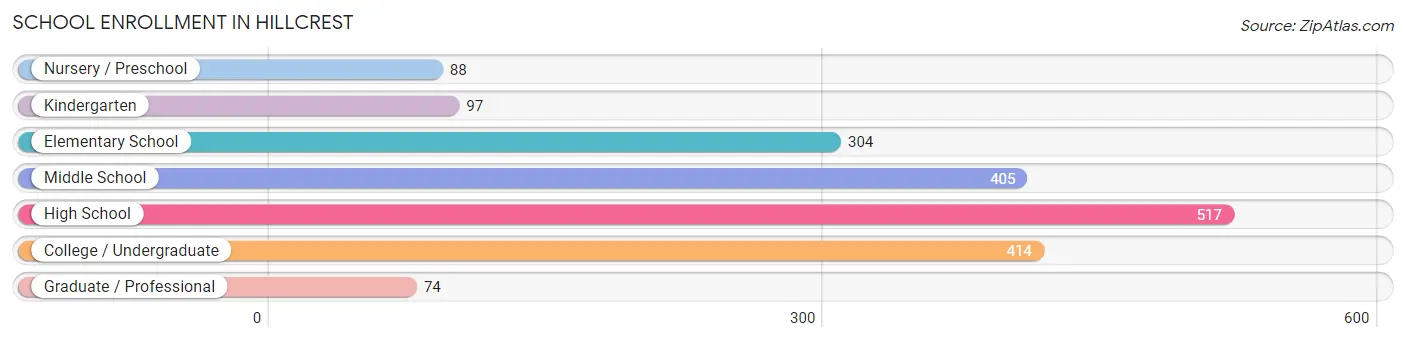
| School Level | # Students | % Students |
| Nursery / Preschool | 88 | 4.6% |
| Kindergarten | 97 | 5.1% |
| Elementary School | 304 | 16.0% |
| Middle School | 405 | 21.3% |
| High School | 517 | 27.2% |
| College / Undergraduate | 414 | 21.8% |
| Graduate / Professional | 74 | 3.9% |
| Total | 1,899 | 100.0% |
School Enrollment by Age by Funding Source in Hillcrest
Out of a total of 1,899 students who are enrolled in schools in Hillcrest, 594 (31.3%) attend a private institution, while the remaining 1,305 (68.7%) are enrolled in public schools. The age group of 3 to 4 year olds has the highest likelihood of being enrolled in private schools, with 86 (100.0% in the age bracket) enrolled. Conversely, the age group of 10 to 14 year olds has the lowest likelihood of being enrolled in a private school, with 435 (81.6% in the age bracket) attending a public institution.
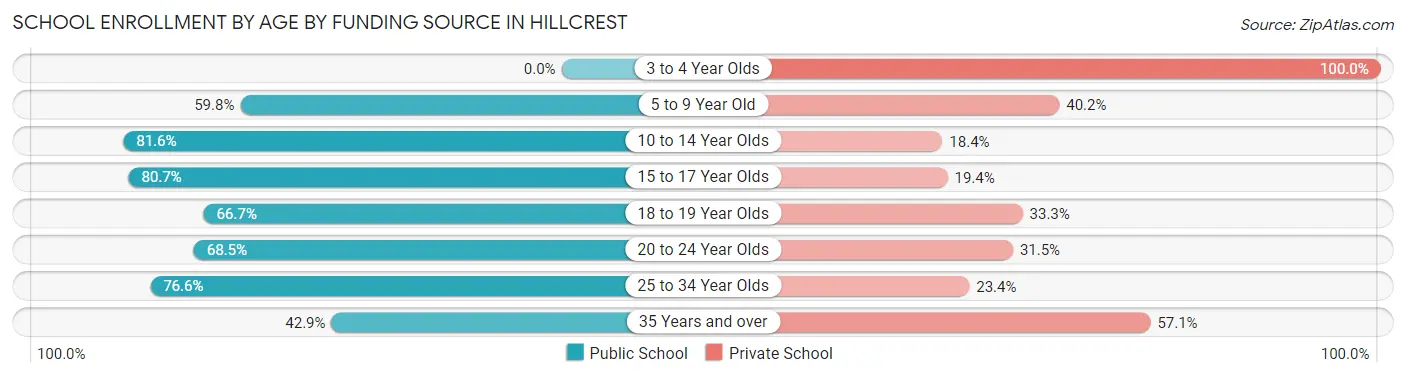
| Age Bracket | Public School | Private School |
| 3 to 4 Year Olds | 0 (0.0%) | 86 (100.0%) |
| 5 to 9 Year Old | 231 (59.8%) | 155 (40.2%) |
| 10 to 14 Year Olds | 435 (81.6%) | 98 (18.4%) |
| 15 to 17 Year Olds | 300 (80.6%) | 72 (19.4%) |
| 18 to 19 Year Olds | 64 (66.7%) | 32 (33.3%) |
| 20 to 24 Year Olds | 202 (68.5%) | 93 (31.5%) |
| 25 to 34 Year Olds | 36 (76.6%) | 11 (23.4%) |
| 35 Years and over | 36 (42.9%) | 48 (57.1%) |
| Total | 1,305 (68.7%) | 594 (31.3%) |
Educational Attainment by Field of Study in Hillcrest
Business (505 | 26.4%), science & technology (321 | 16.8%), education (189 | 9.9%), social sciences (133 | 7.0%), and visual & performing arts (131 | 6.8%) are the most common fields of study among 1,914 individuals in Hillcrest who have obtained a bachelor's degree or higher.
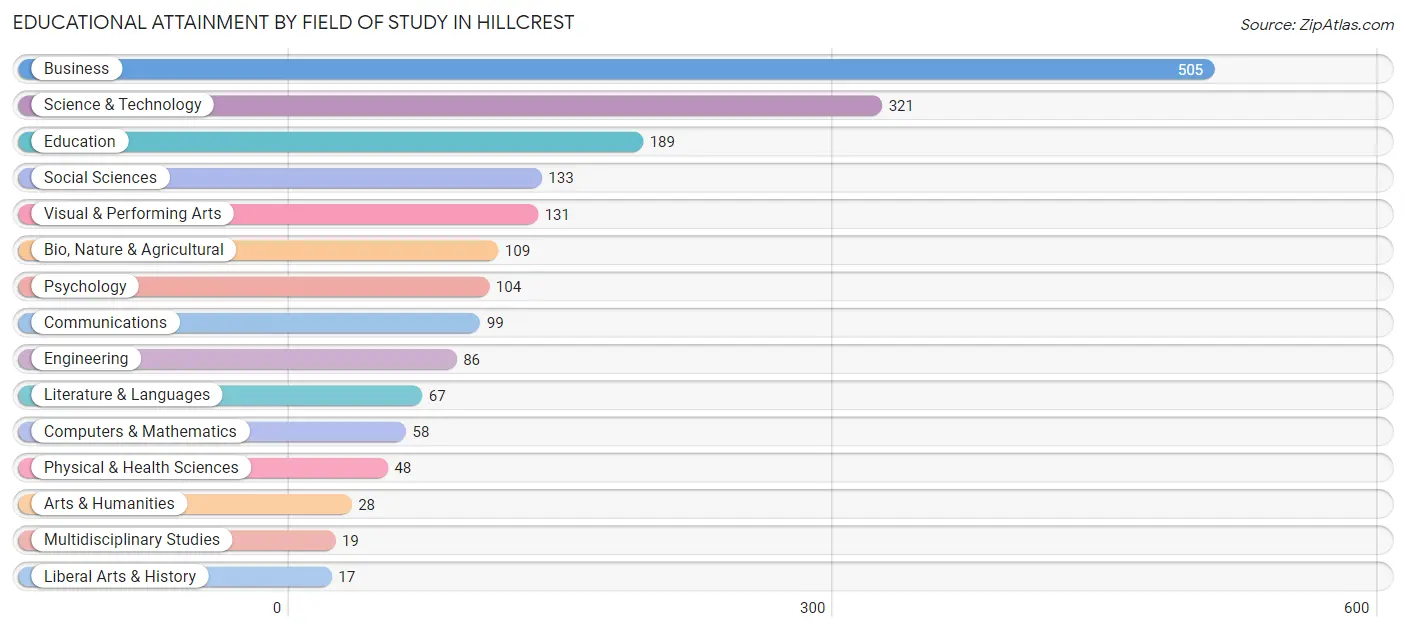
| Field of Study | # Graduates | % Graduates |
| Computers & Mathematics | 58 | 3.0% |
| Bio, Nature & Agricultural | 109 | 5.7% |
| Physical & Health Sciences | 48 | 2.5% |
| Psychology | 104 | 5.4% |
| Social Sciences | 133 | 7.0% |
| Engineering | 86 | 4.5% |
| Multidisciplinary Studies | 19 | 1.0% |
| Science & Technology | 321 | 16.8% |
| Business | 505 | 26.4% |
| Education | 189 | 9.9% |
| Literature & Languages | 67 | 3.5% |
| Liberal Arts & History | 17 | 0.9% |
| Visual & Performing Arts | 131 | 6.8% |
| Communications | 99 | 5.2% |
| Arts & Humanities | 28 | 1.5% |
| Total | 1,914 | 100.0% |
Transportation & Commute in Hillcrest
Vehicle Availability by Sex in Hillcrest
The most prevalent vehicle ownership categories in Hillcrest are males with 3 vehicles (677, accounting for 28.9%) and females with 3 vehicles (513, making up 39.9%).
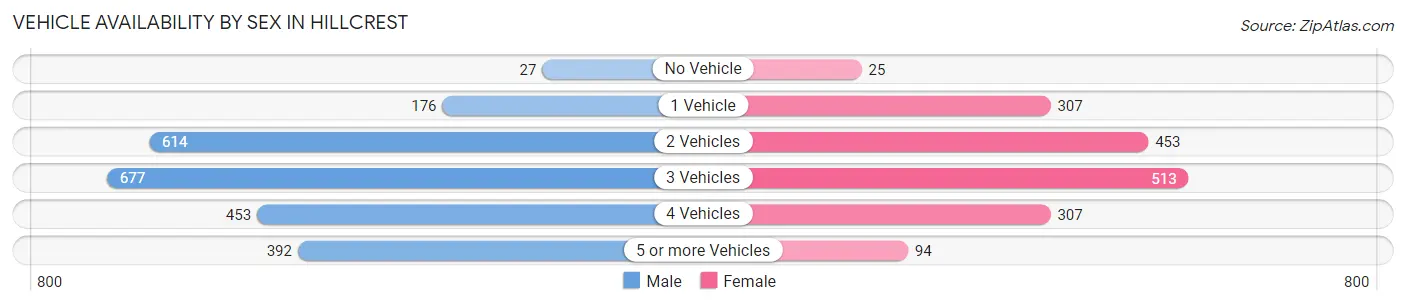
| Vehicles Available | Male | Female |
| No Vehicle | 27 (1.1%) | 25 (1.5%) |
| 1 Vehicle | 176 (7.5%) | 307 (18.1%) |
| 2 Vehicles | 614 (26.3%) | 453 (26.7%) |
| 3 Vehicles | 677 (28.9%) | 513 (30.2%) |
| 4 Vehicles | 453 (19.4%) | 307 (18.1%) |
| 5 or more Vehicles | 392 (16.8%) | 94 (5.5%) |
| Total | 2,339 (100.0%) | 1,699 (100.0%) |
Commute Time in Hillcrest
The most frequently occuring commute durations in Hillcrest are 15 to 19 minutes (776 commuters, 20.8%), 20 to 24 minutes (730 commuters, 19.6%), and 60 to 89 minutes (385 commuters, 10.3%).
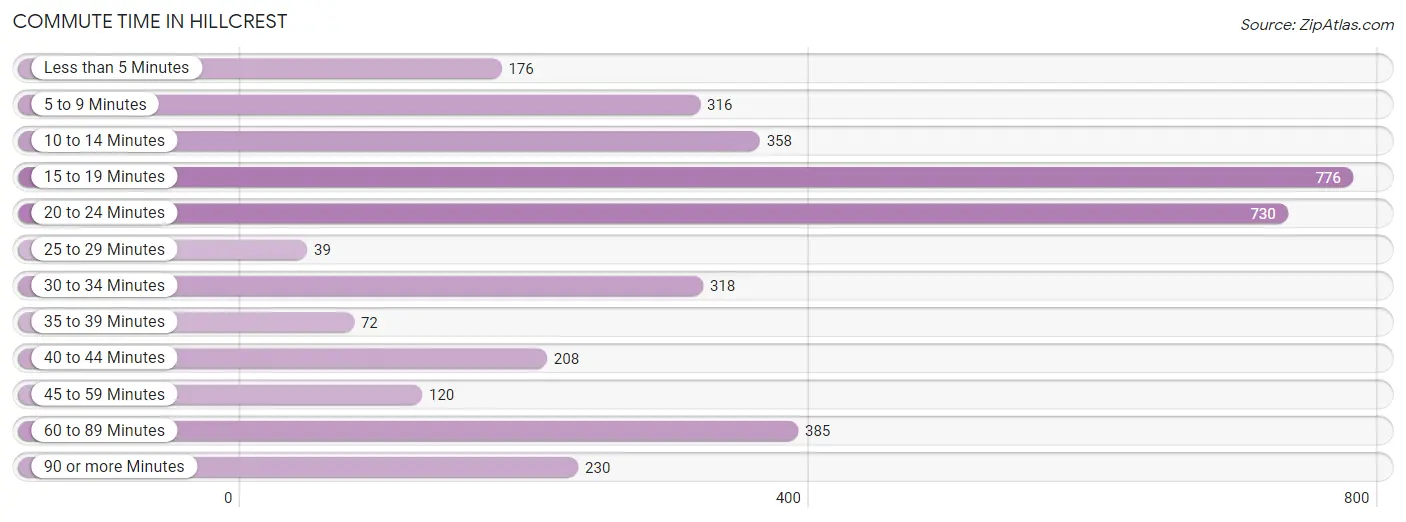
| Commute Time | # Commuters | % Commuters |
| Less than 5 Minutes | 176 | 4.7% |
| 5 to 9 Minutes | 316 | 8.5% |
| 10 to 14 Minutes | 358 | 9.6% |
| 15 to 19 Minutes | 776 | 20.8% |
| 20 to 24 Minutes | 730 | 19.6% |
| 25 to 29 Minutes | 39 | 1.1% |
| 30 to 34 Minutes | 318 | 8.5% |
| 35 to 39 Minutes | 72 | 1.9% |
| 40 to 44 Minutes | 208 | 5.6% |
| 45 to 59 Minutes | 120 | 3.2% |
| 60 to 89 Minutes | 385 | 10.3% |
| 90 or more Minutes | 230 | 6.2% |
Commute Time by Sex in Hillcrest
The most common commute times in Hillcrest are 20 to 24 minutes (499 commuters, 22.7%) for males and 15 to 19 minutes (333 commuters, 21.8%) for females.
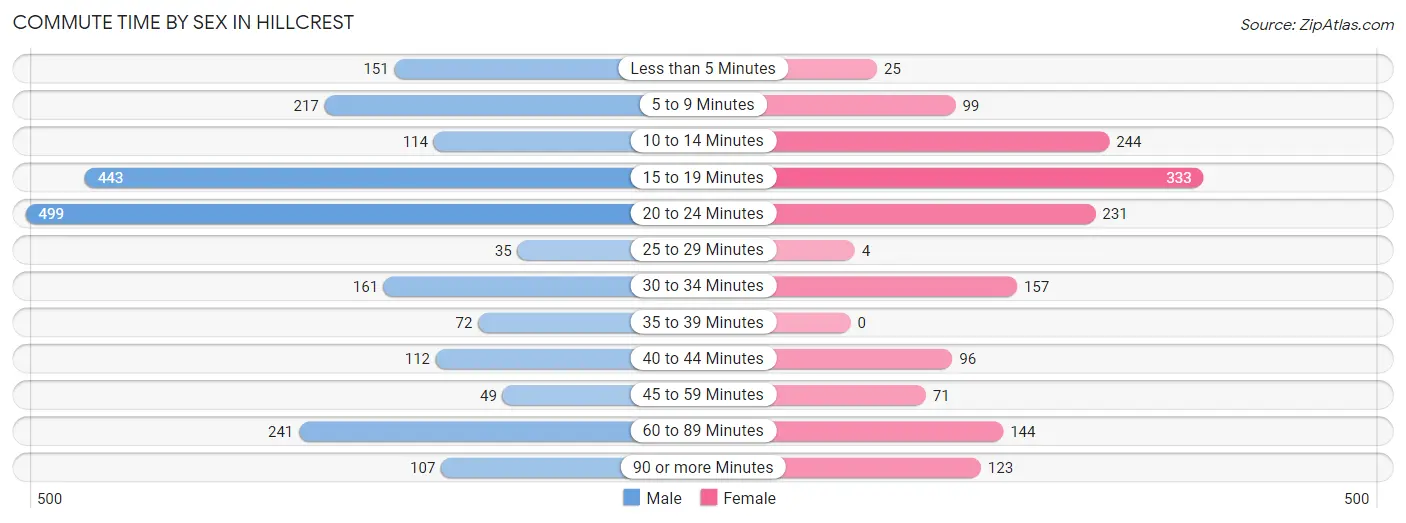
| Commute Time | Male | Female |
| Less than 5 Minutes | 151 (6.9%) | 25 (1.6%) |
| 5 to 9 Minutes | 217 (9.9%) | 99 (6.5%) |
| 10 to 14 Minutes | 114 (5.2%) | 244 (16.0%) |
| 15 to 19 Minutes | 443 (20.1%) | 333 (21.8%) |
| 20 to 24 Minutes | 499 (22.7%) | 231 (15.1%) |
| 25 to 29 Minutes | 35 (1.6%) | 4 (0.3%) |
| 30 to 34 Minutes | 161 (7.3%) | 157 (10.3%) |
| 35 to 39 Minutes | 72 (3.3%) | 0 (0.0%) |
| 40 to 44 Minutes | 112 (5.1%) | 96 (6.3%) |
| 45 to 59 Minutes | 49 (2.2%) | 71 (4.6%) |
| 60 to 89 Minutes | 241 (11.0%) | 144 (9.4%) |
| 90 or more Minutes | 107 (4.9%) | 123 (8.1%) |
Time of Departure to Work by Sex in Hillcrest
The most frequent times of departure to work in Hillcrest are 7:00 AM to 7:29 AM (475, 21.6%) for males and 9:00 AM to 9:59 AM (220, 14.4%) for females.
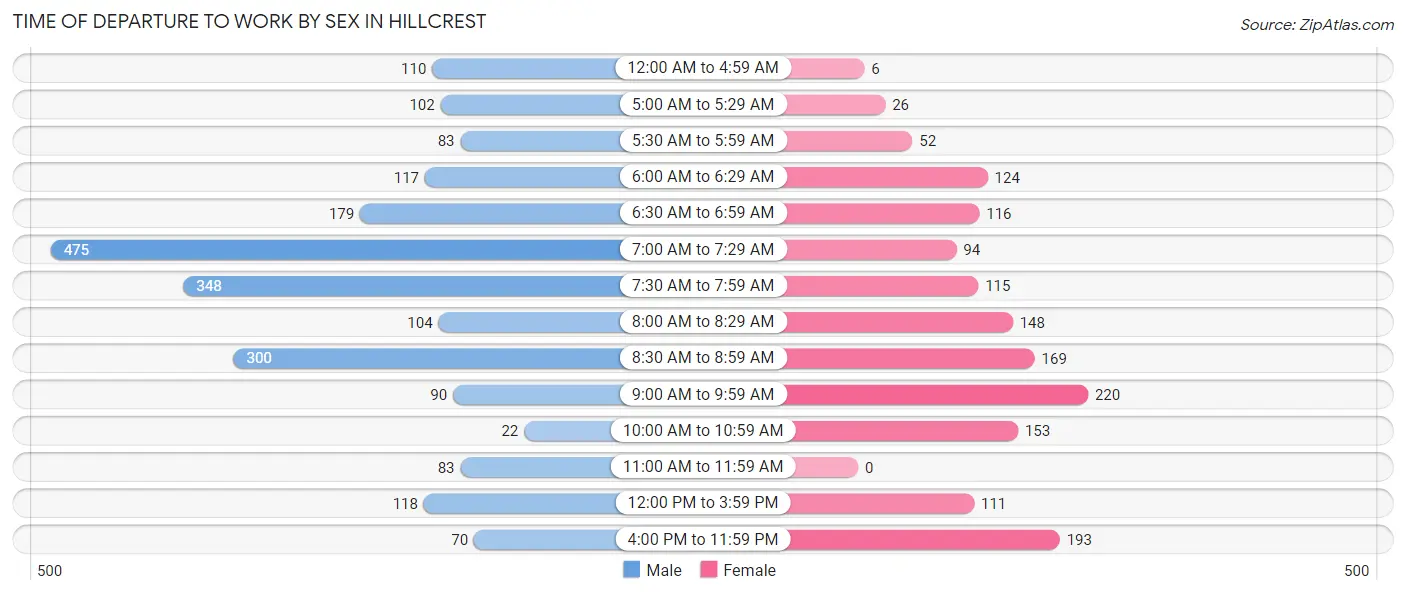
| Time of Departure | Male | Female |
| 12:00 AM to 4:59 AM | 110 (5.0%) | 6 (0.4%) |
| 5:00 AM to 5:29 AM | 102 (4.6%) | 26 (1.7%) |
| 5:30 AM to 5:59 AM | 83 (3.8%) | 52 (3.4%) |
| 6:00 AM to 6:29 AM | 117 (5.3%) | 124 (8.1%) |
| 6:30 AM to 6:59 AM | 179 (8.1%) | 116 (7.6%) |
| 7:00 AM to 7:29 AM | 475 (21.6%) | 94 (6.2%) |
| 7:30 AM to 7:59 AM | 348 (15.8%) | 115 (7.5%) |
| 8:00 AM to 8:29 AM | 104 (4.7%) | 148 (9.7%) |
| 8:30 AM to 8:59 AM | 300 (13.6%) | 169 (11.1%) |
| 9:00 AM to 9:59 AM | 90 (4.1%) | 220 (14.4%) |
| 10:00 AM to 10:59 AM | 22 (1.0%) | 153 (10.0%) |
| 11:00 AM to 11:59 AM | 83 (3.8%) | 0 (0.0%) |
| 12:00 PM to 3:59 PM | 118 (5.4%) | 111 (7.3%) |
| 4:00 PM to 11:59 PM | 70 (3.2%) | 193 (12.6%) |
| Total | 2,201 (100.0%) | 1,527 (100.0%) |
Housing Occupancy in Hillcrest
Occupancy by Ownership in Hillcrest
Of the total 1,983 dwellings in Hillcrest, owner-occupied units account for 1,541 (77.7%), while renter-occupied units make up 442 (22.3%).
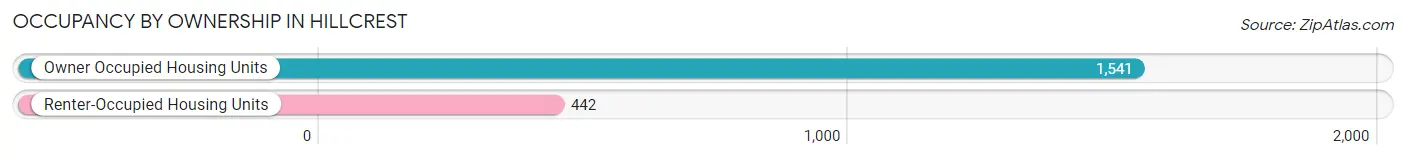
| Occupancy | # Housing Units | % Housing Units |
| Owner Occupied Housing Units | 1,541 | 77.7% |
| Renter-Occupied Housing Units | 442 | 22.3% |
| Total Occupied Housing Units | 1,983 | 100.0% |
Occupancy by Household Size in Hillcrest
| Household Size | # Housing Units | % Housing Units |
| 1-Person Household | 189 | 9.5% |
| 2-Person Household | 404 | 20.4% |
| 3-Person Household | 392 | 19.8% |
| 4+ Person Household | 998 | 50.3% |
| Total Housing Units | 1,983 | 100.0% |
Occupancy by Ownership by Household Size in Hillcrest
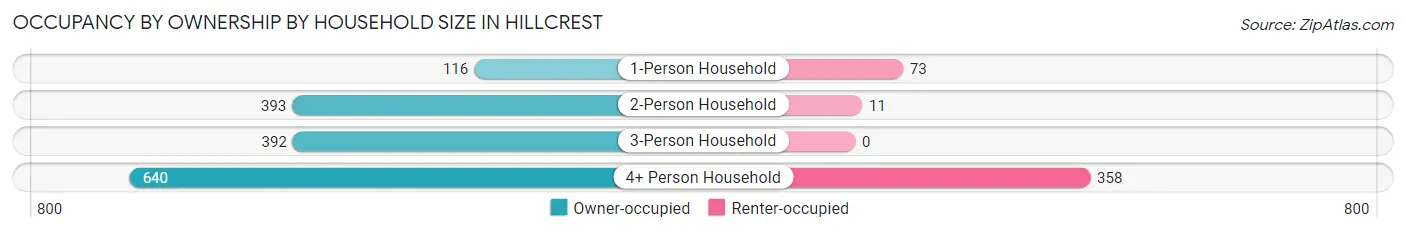
| Household Size | Owner-occupied | Renter-occupied |
| 1-Person Household | 116 (61.4%) | 73 (38.6%) |
| 2-Person Household | 393 (97.3%) | 11 (2.7%) |
| 3-Person Household | 392 (100.0%) | 0 (0.0%) |
| 4+ Person Household | 640 (64.1%) | 358 (35.9%) |
| Total Housing Units | 1,541 (77.7%) | 442 (22.3%) |
Occupancy by Educational Attainment in Hillcrest
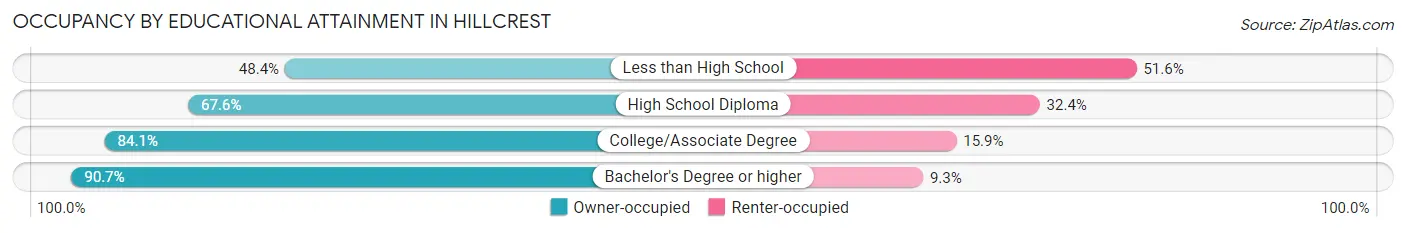
| Household Size | Owner-occupied | Renter-occupied |
| Less than High School | 150 (48.4%) | 160 (51.6%) |
| High School Diploma | 244 (67.6%) | 117 (32.4%) |
| College/Associate Degree | 551 (84.1%) | 104 (15.9%) |
| Bachelor's Degree or higher | 596 (90.7%) | 61 (9.3%) |
Occupancy by Age of Householder in Hillcrest
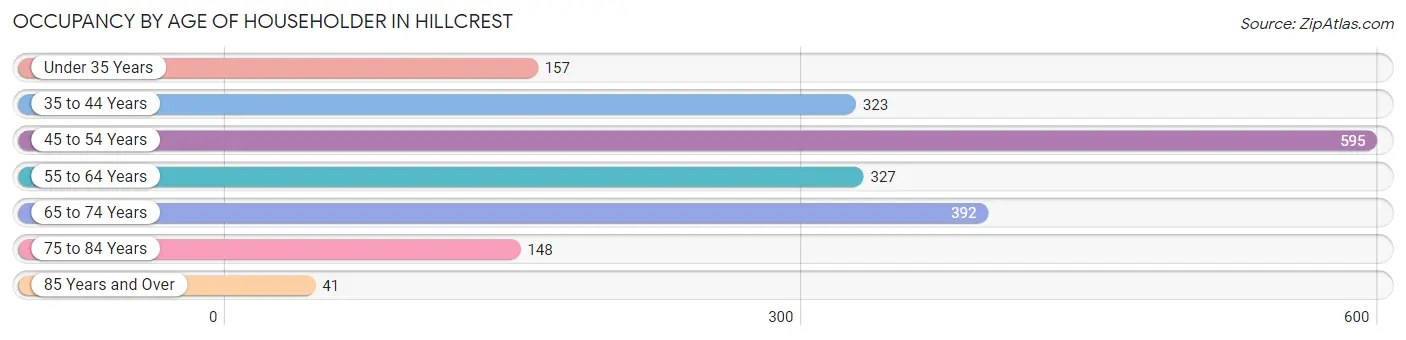
| Age Bracket | # Households | % Households |
| Under 35 Years | 157 | 7.9% |
| 35 to 44 Years | 323 | 16.3% |
| 45 to 54 Years | 595 | 30.0% |
| 55 to 64 Years | 327 | 16.5% |
| 65 to 74 Years | 392 | 19.8% |
| 75 to 84 Years | 148 | 7.5% |
| 85 Years and Over | 41 | 2.1% |
| Total | 1,983 | 100.0% |
Housing Finances in Hillcrest
Median Income by Occupancy in Hillcrest
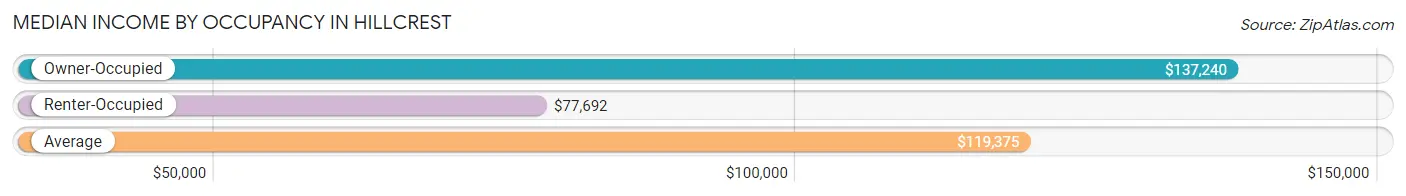
| Occupancy Type | # Households | Median Income |
| Owner-Occupied | 1,541 (77.7%) | $137,240 |
| Renter-Occupied | 442 (22.3%) | $77,692 |
| Average | 1,983 (100.0%) | $119,375 |
Occupancy by Householder Income Bracket in Hillcrest
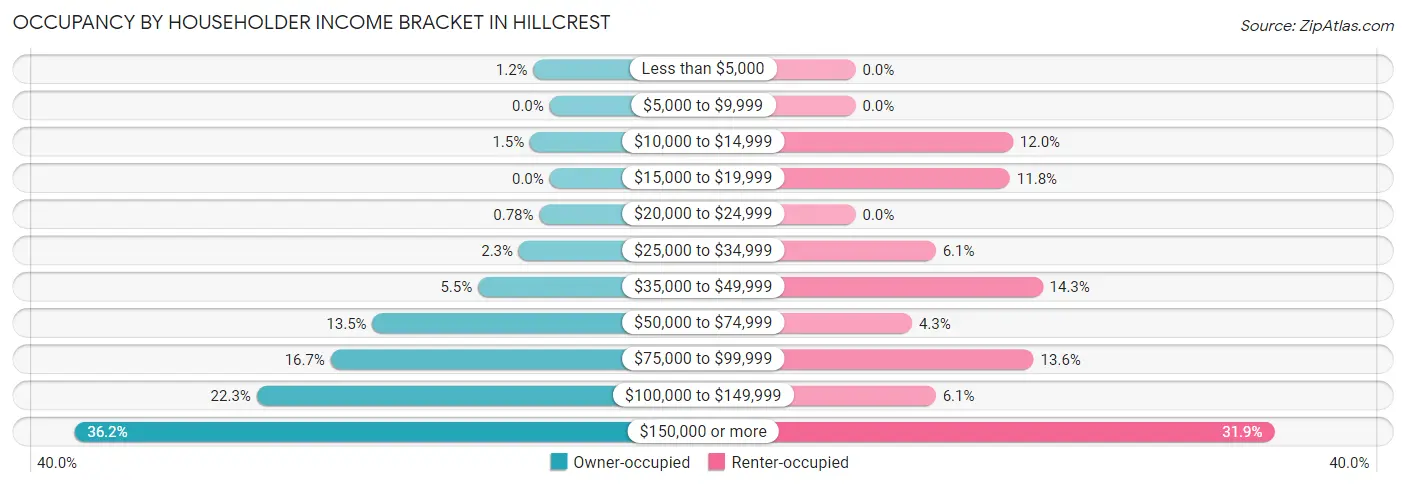
| Income Bracket | Owner-occupied | Renter-occupied |
| Less than $5,000 | 19 (1.2%) | 0 (0.0%) |
| $5,000 to $9,999 | 0 (0.0%) | 0 (0.0%) |
| $10,000 to $14,999 | 23 (1.5%) | 53 (12.0%) |
| $15,000 to $19,999 | 0 (0.0%) | 52 (11.8%) |
| $20,000 to $24,999 | 12 (0.8%) | 0 (0.0%) |
| $25,000 to $34,999 | 36 (2.3%) | 27 (6.1%) |
| $35,000 to $49,999 | 84 (5.4%) | 63 (14.2%) |
| $50,000 to $74,999 | 208 (13.5%) | 19 (4.3%) |
| $75,000 to $99,999 | 257 (16.7%) | 60 (13.6%) |
| $100,000 to $149,999 | 344 (22.3%) | 27 (6.1%) |
| $150,000 or more | 558 (36.2%) | 141 (31.9%) |
| Total | 1,541 (100.0%) | 442 (100.0%) |
Monthly Housing Cost Tiers in Hillcrest
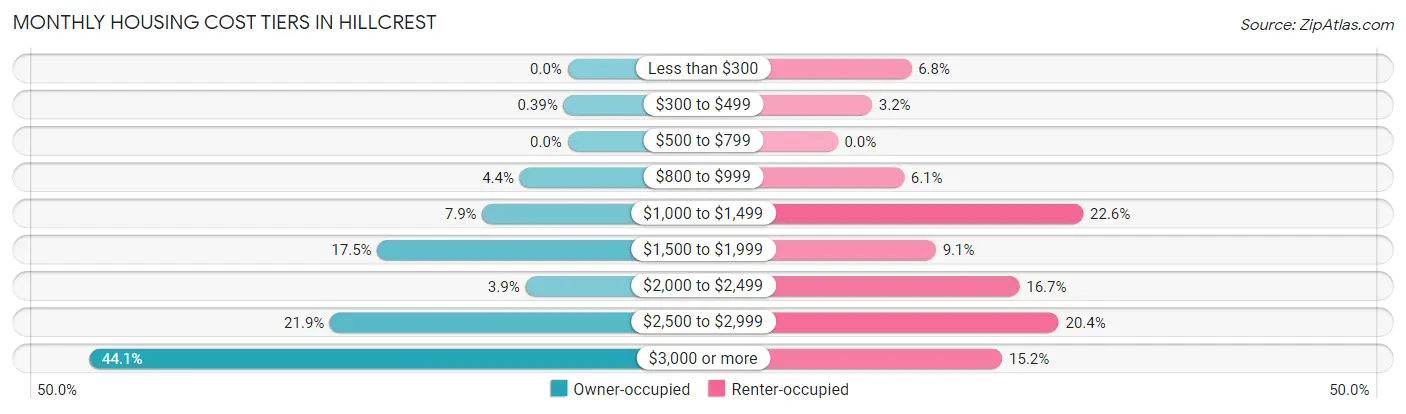
| Monthly Cost | Owner-occupied | Renter-occupied |
| Less than $300 | 0 (0.0%) | 30 (6.8%) |
| $300 to $499 | 6 (0.4%) | 14 (3.2%) |
| $500 to $799 | 0 (0.0%) | 0 (0.0%) |
| $800 to $999 | 68 (4.4%) | 27 (6.1%) |
| $1,000 to $1,499 | 121 (7.9%) | 100 (22.6%) |
| $1,500 to $1,999 | 270 (17.5%) | 40 (9.0%) |
| $2,000 to $2,499 | 60 (3.9%) | 74 (16.7%) |
| $2,500 to $2,999 | 337 (21.9%) | 90 (20.4%) |
| $3,000 or more | 679 (44.1%) | 67 (15.2%) |
| Total | 1,541 (100.0%) | 442 (100.0%) |
Physical Housing Characteristics in Hillcrest
Housing Structures in Hillcrest
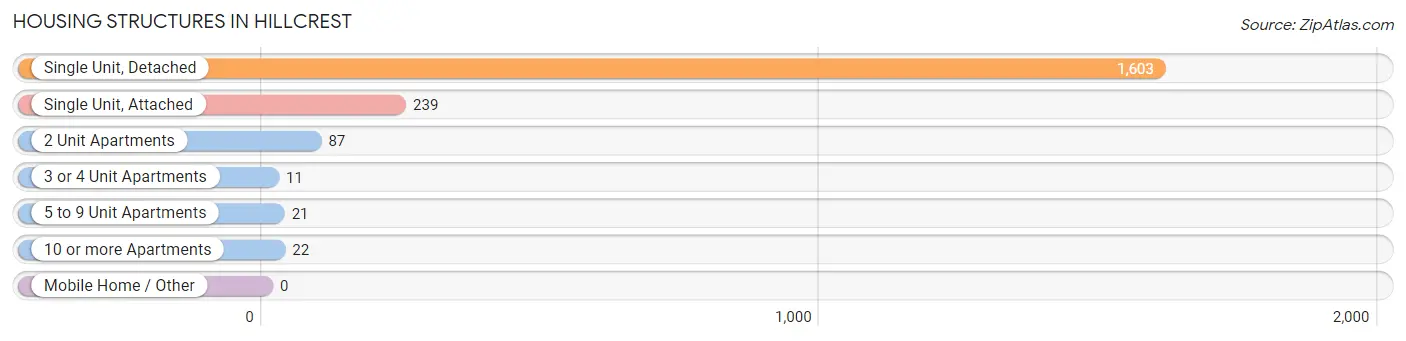
| Structure Type | # Housing Units | % Housing Units |
| Single Unit, Detached | 1,603 | 80.8% |
| Single Unit, Attached | 239 | 12.0% |
| 2 Unit Apartments | 87 | 4.4% |
| 3 or 4 Unit Apartments | 11 | 0.5% |
| 5 to 9 Unit Apartments | 21 | 1.1% |
| 10 or more Apartments | 22 | 1.1% |
| Mobile Home / Other | 0 | 0.0% |
| Total | 1,983 | 100.0% |
Housing Structures by Occupancy in Hillcrest
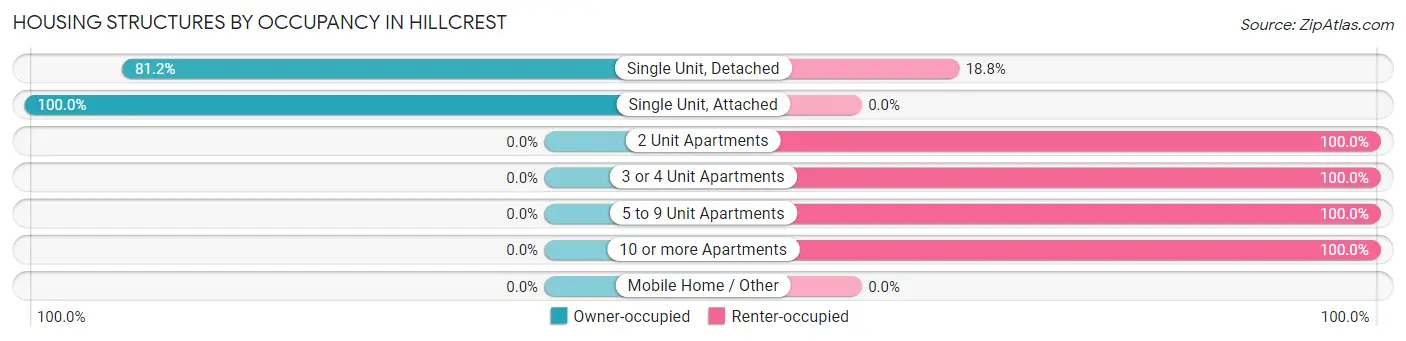
| Structure Type | Owner-occupied | Renter-occupied |
| Single Unit, Detached | 1,302 (81.2%) | 301 (18.8%) |
| Single Unit, Attached | 239 (100.0%) | 0 (0.0%) |
| 2 Unit Apartments | 0 (0.0%) | 87 (100.0%) |
| 3 or 4 Unit Apartments | 0 (0.0%) | 11 (100.0%) |
| 5 to 9 Unit Apartments | 0 (0.0%) | 21 (100.0%) |
| 10 or more Apartments | 0 (0.0%) | 22 (100.0%) |
| Mobile Home / Other | 0 (0.0%) | 0 (0.0%) |
| Total | 1,541 (77.7%) | 442 (22.3%) |
Housing Structures by Number of Rooms in Hillcrest

| Number of Rooms | Owner-occupied | Renter-occupied |
| 1 Room | 0 (0.0%) | 29 (6.6%) |
| 2 or 3 Rooms | 5 (0.3%) | 36 (8.1%) |
| 4 or 5 Rooms | 183 (11.9%) | 33 (7.5%) |
| 6 or 7 Rooms | 637 (41.3%) | 216 (48.9%) |
| 8 or more Rooms | 716 (46.5%) | 128 (29.0%) |
| Total | 1,541 (100.0%) | 442 (100.0%) |
Housing Structure by Heating Type in Hillcrest
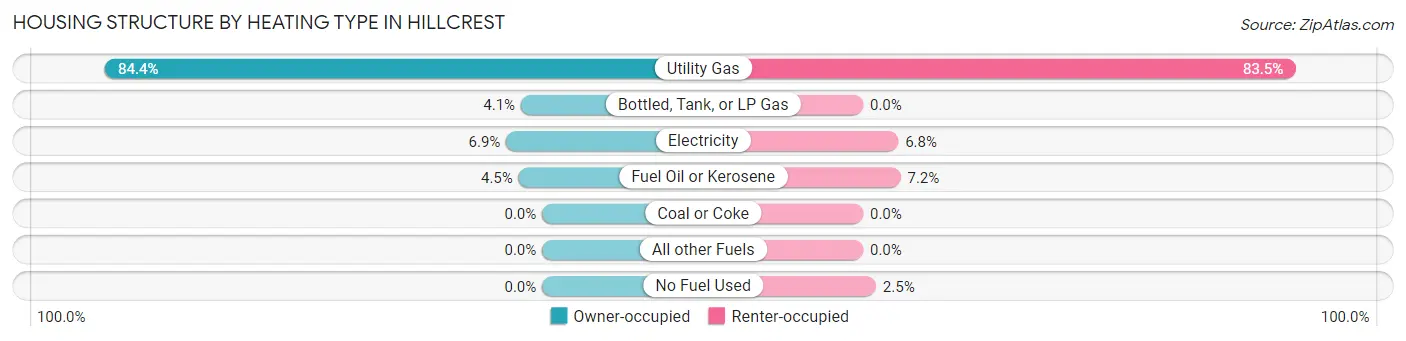
| Heating Type | Owner-occupied | Renter-occupied |
| Utility Gas | 1,301 (84.4%) | 369 (83.5%) |
| Bottled, Tank, or LP Gas | 63 (4.1%) | 0 (0.0%) |
| Electricity | 107 (6.9%) | 30 (6.8%) |
| Fuel Oil or Kerosene | 70 (4.5%) | 32 (7.2%) |
| Coal or Coke | 0 (0.0%) | 0 (0.0%) |
| All other Fuels | 0 (0.0%) | 0 (0.0%) |
| No Fuel Used | 0 (0.0%) | 11 (2.5%) |
| Total | 1,541 (100.0%) | 442 (100.0%) |
Household Vehicle Usage in Hillcrest
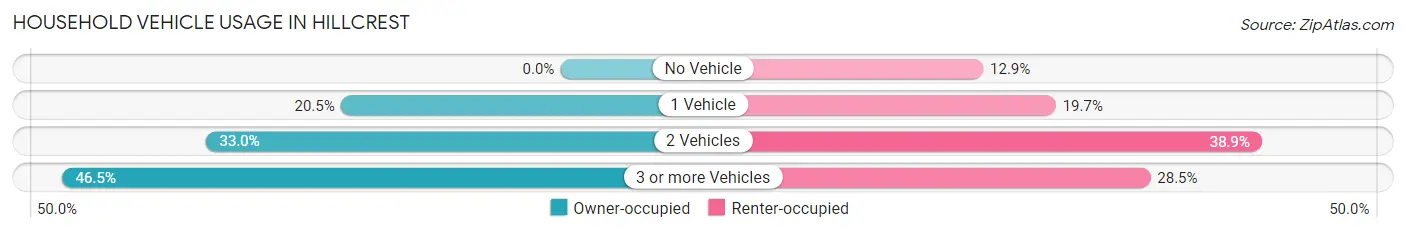
| Vehicles per Household | Owner-occupied | Renter-occupied |
| No Vehicle | 0 (0.0%) | 57 (12.9%) |
| 1 Vehicle | 316 (20.5%) | 87 (19.7%) |
| 2 Vehicles | 509 (33.0%) | 172 (38.9%) |
| 3 or more Vehicles | 716 (46.5%) | 126 (28.5%) |
| Total | 1,541 (100.0%) | 442 (100.0%) |
Real Estate & Mortgages in Hillcrest
Real Estate and Mortgage Overview in Hillcrest
| Characteristic | Without Mortgage | With Mortgage |
| Housing Units | 429 | 1,112 |
| Median Property Value | $470,300 | $498,500 |
| Median Household Income | $136,458 | $382 |
| Monthly Housing Costs | $1,501 | $679 |
| Real Estate Taxes | $10,001 | $10 |
Property Value by Mortgage Status in Hillcrest
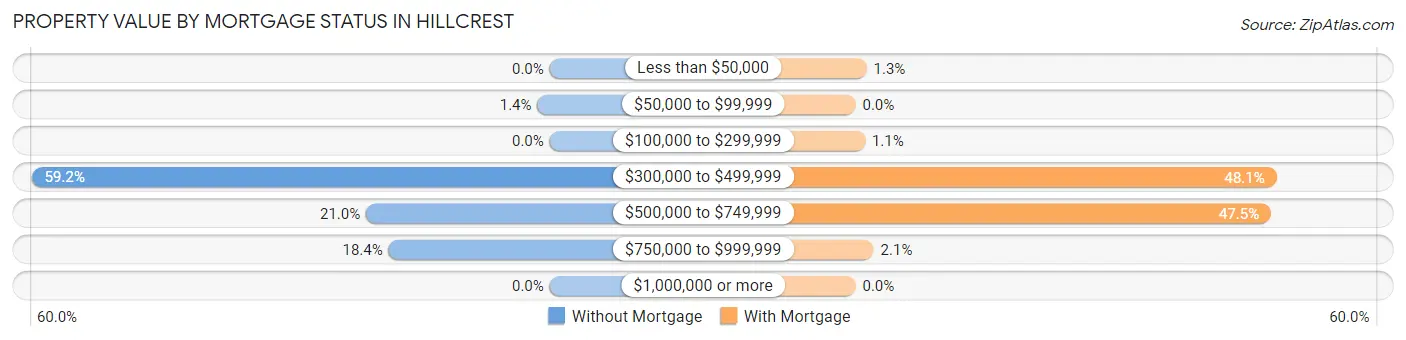
| Property Value | Without Mortgage | With Mortgage |
| Less than $50,000 | 0 (0.0%) | 14 (1.3%) |
| $50,000 to $99,999 | 6 (1.4%) | 0 (0.0%) |
| $100,000 to $299,999 | 0 (0.0%) | 12 (1.1%) |
| $300,000 to $499,999 | 254 (59.2%) | 535 (48.1%) |
| $500,000 to $749,999 | 90 (21.0%) | 528 (47.5%) |
| $750,000 to $999,999 | 79 (18.4%) | 23 (2.1%) |
| $1,000,000 or more | 0 (0.0%) | 0 (0.0%) |
| Total | 429 (100.0%) | 1,112 (100.0%) |
Household Income by Mortgage Status in Hillcrest
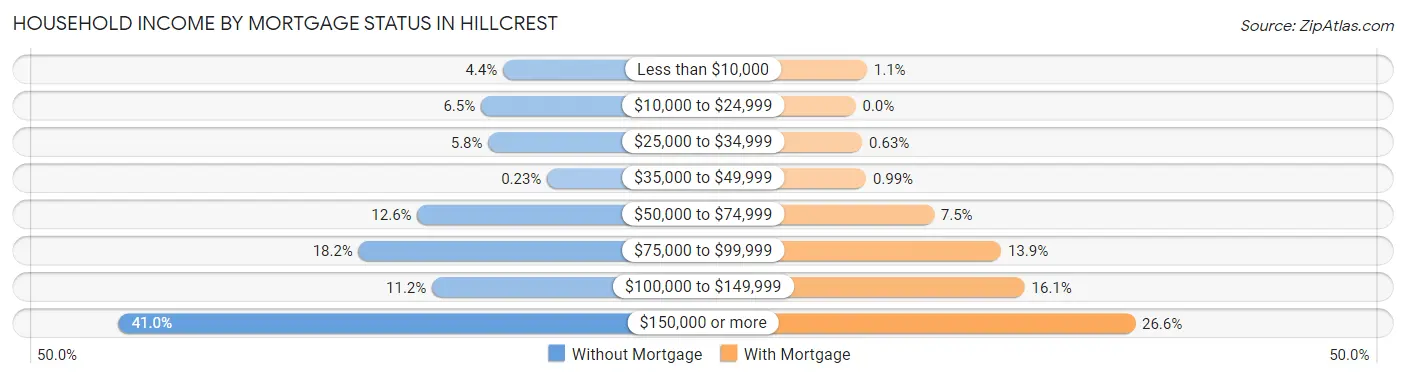
| Household Income | Without Mortgage | With Mortgage |
| Less than $10,000 | 19 (4.4%) | 12 (1.1%) |
| $10,000 to $24,999 | 28 (6.5%) | 0 (0.0%) |
| $25,000 to $34,999 | 25 (5.8%) | 7 (0.6%) |
| $35,000 to $49,999 | 1 (0.2%) | 11 (1.0%) |
| $50,000 to $74,999 | 54 (12.6%) | 83 (7.5%) |
| $75,000 to $99,999 | 78 (18.2%) | 154 (13.9%) |
| $100,000 to $149,999 | 48 (11.2%) | 179 (16.1%) |
| $150,000 or more | 176 (41.0%) | 296 (26.6%) |
| Total | 429 (100.0%) | 1,112 (100.0%) |
Property Value to Household Income Ratio in Hillcrest
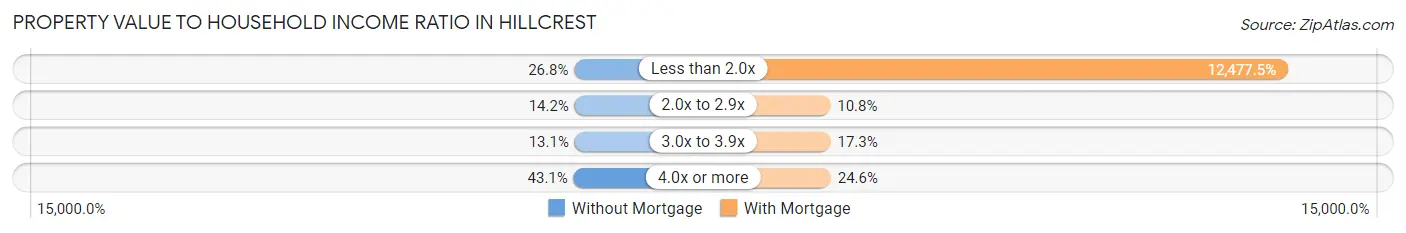
| Value-to-Income Ratio | Without Mortgage | With Mortgage |
| Less than 2.0x | 115 (26.8%) | 138,750 (12,477.5%) |
| 2.0x to 2.9x | 61 (14.2%) | 120 (10.8%) |
| 3.0x to 3.9x | 56 (13.1%) | 192 (17.3%) |
| 4.0x or more | 185 (43.1%) | 273 (24.5%) |
| Total | 429 (100.0%) | 1,112 (100.0%) |
Real Estate Taxes by Mortgage Status in Hillcrest
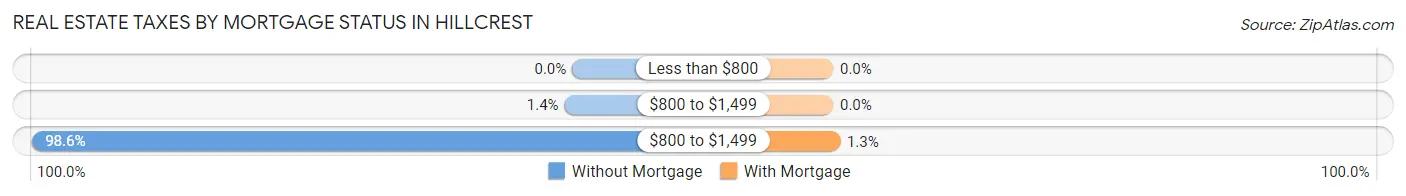
| Property Taxes | Without Mortgage | With Mortgage |
| Less than $800 | 0 (0.0%) | 0 (0.0%) |
| $800 to $1,499 | 6 (1.4%) | 0 (0.0%) |
| $800 to $1,499 | 423 (98.6%) | 14 (1.3%) |
| Total | 429 (100.0%) | 1,112 (100.0%) |
Health & Disability in Hillcrest
Health Insurance Coverage by Age in Hillcrest
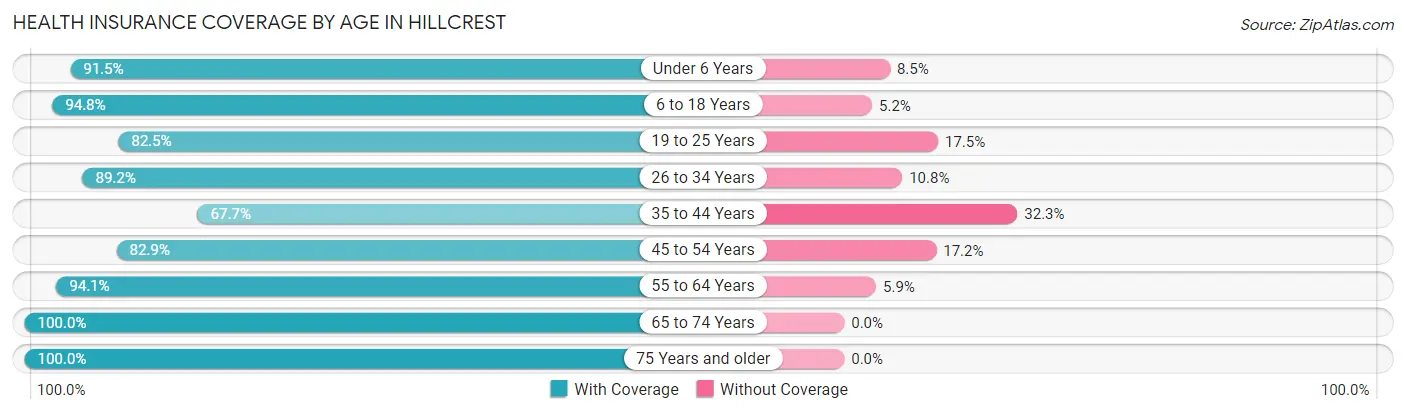
| Age Bracket | With Coverage | Without Coverage |
| Under 6 Years | 612 (91.5%) | 57 (8.5%) |
| 6 to 18 Years | 1,207 (94.8%) | 66 (5.2%) |
| 19 to 25 Years | 675 (82.5%) | 143 (17.5%) |
| 26 to 34 Years | 990 (89.2%) | 120 (10.8%) |
| 35 to 44 Years | 766 (67.7%) | 365 (32.3%) |
| 45 to 54 Years | 971 (82.9%) | 201 (17.2%) |
| 55 to 64 Years | 777 (94.1%) | 49 (5.9%) |
| 65 to 74 Years | 650 (100.0%) | 0 (0.0%) |
| 75 Years and older | 387 (100.0%) | 0 (0.0%) |
| Total | 7,035 (87.5%) | 1,001 (12.5%) |
Health Insurance Coverage by Citizenship Status in Hillcrest
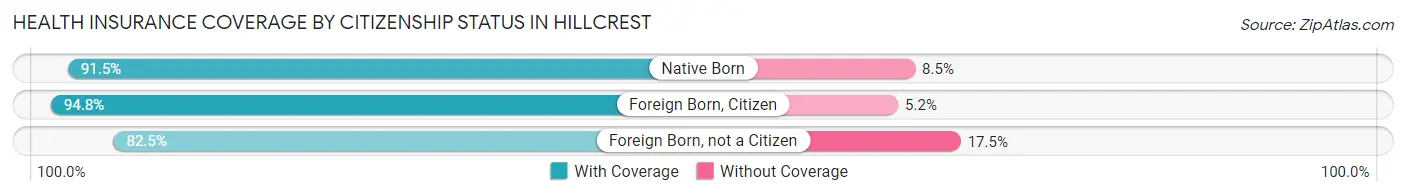
| Citizenship Status | With Coverage | Without Coverage |
| Native Born | 612 (91.5%) | 57 (8.5%) |
| Foreign Born, Citizen | 1,207 (94.8%) | 66 (5.2%) |
| Foreign Born, not a Citizen | 675 (82.5%) | 143 (17.5%) |
Health Insurance Coverage by Household Income in Hillcrest
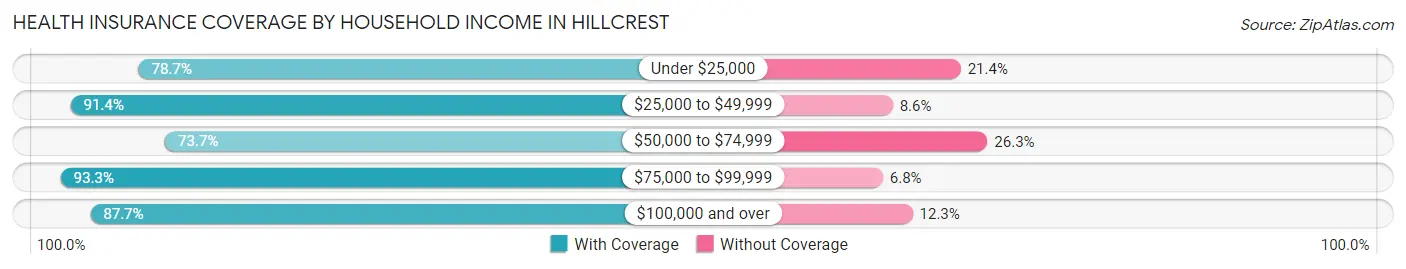
| Household Income | With Coverage | Without Coverage |
| Under $25,000 | 280 (78.6%) | 76 (21.3%) |
| $25,000 to $49,999 | 1,009 (91.4%) | 95 (8.6%) |
| $50,000 to $74,999 | 467 (73.7%) | 167 (26.3%) |
| $75,000 to $99,999 | 1,064 (93.2%) | 77 (6.8%) |
| $100,000 and over | 4,167 (87.7%) | 586 (12.3%) |
Public vs Private Health Insurance Coverage by Age in Hillcrest
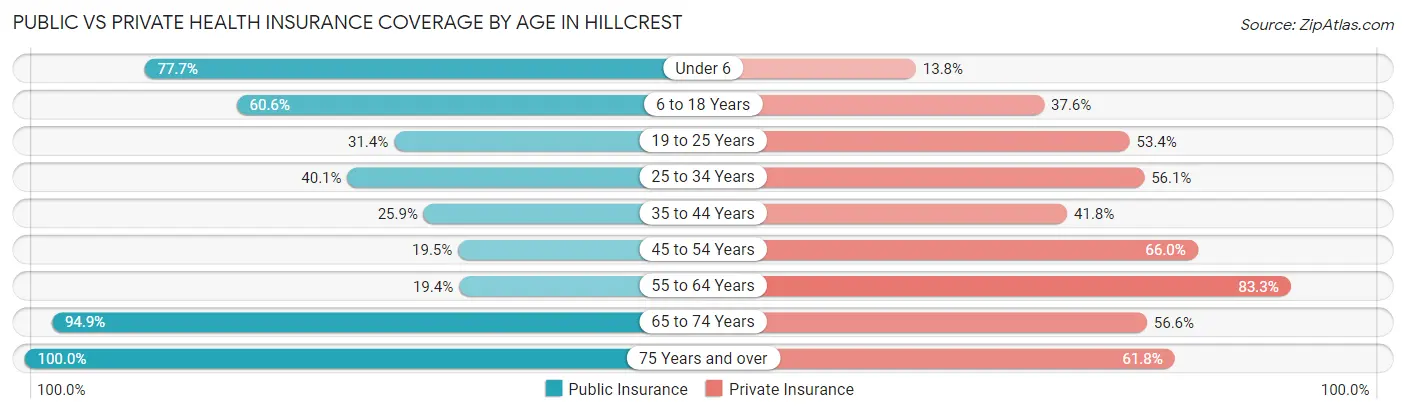
| Age Bracket | Public Insurance | Private Insurance |
| Under 6 | 520 (77.7%) | 92 (13.8%) |
| 6 to 18 Years | 772 (60.6%) | 478 (37.6%) |
| 19 to 25 Years | 257 (31.4%) | 437 (53.4%) |
| 25 to 34 Years | 445 (40.1%) | 623 (56.1%) |
| 35 to 44 Years | 293 (25.9%) | 473 (41.8%) |
| 45 to 54 Years | 229 (19.5%) | 774 (66.0%) |
| 55 to 64 Years | 160 (19.4%) | 688 (83.3%) |
| 65 to 74 Years | 617 (94.9%) | 368 (56.6%) |
| 75 Years and over | 387 (100.0%) | 239 (61.8%) |
| Total | 3,680 (45.8%) | 4,172 (51.9%) |
Disability Status by Sex by Age in Hillcrest
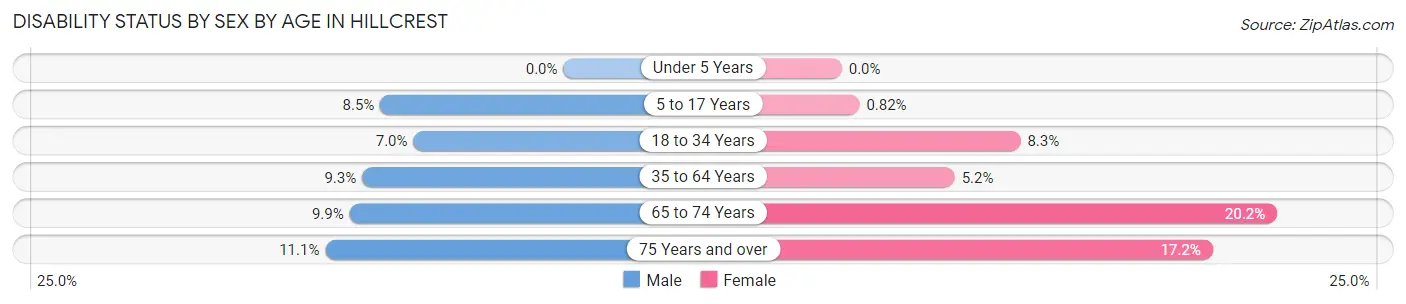
| Age Bracket | Male | Female |
| Under 5 Years | 0 (0.0%) | 0 (0.0%) |
| 5 to 17 Years | 60 (8.5%) | 5 (0.8%) |
| 18 to 34 Years | 81 (7.0%) | 68 (8.3%) |
| 35 to 64 Years | 146 (9.3%) | 82 (5.2%) |
| 65 to 74 Years | 35 (9.9%) | 60 (20.2%) |
| 75 Years and over | 19 (11.1%) | 37 (17.2%) |
Disability Class by Sex by Age in Hillcrest
Disability Class: Hearing Difficulty
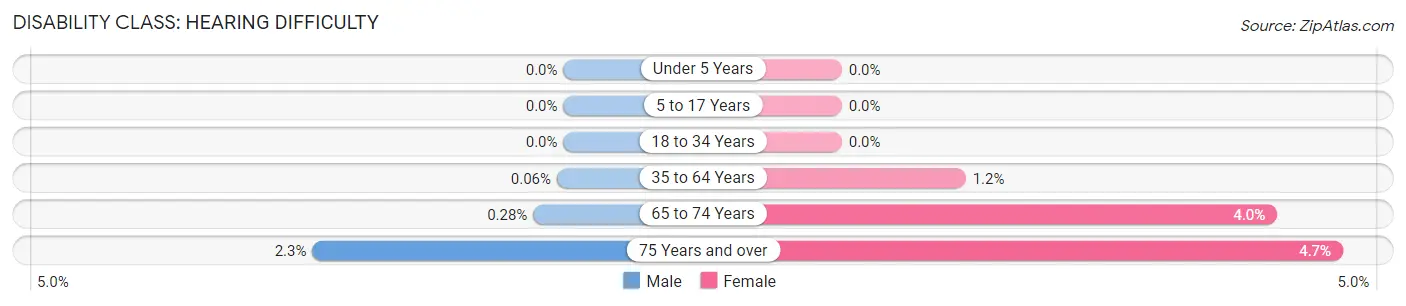
| Age Bracket | Male | Female |
| Under 5 Years | 0 (0.0%) | 0 (0.0%) |
| 5 to 17 Years | 0 (0.0%) | 0 (0.0%) |
| 18 to 34 Years | 0 (0.0%) | 0 (0.0%) |
| 35 to 64 Years | 1 (0.1%) | 18 (1.1%) |
| 65 to 74 Years | 1 (0.3%) | 12 (4.0%) |
| 75 Years and over | 4 (2.3%) | 10 (4.6%) |
Disability Class: Vision Difficulty
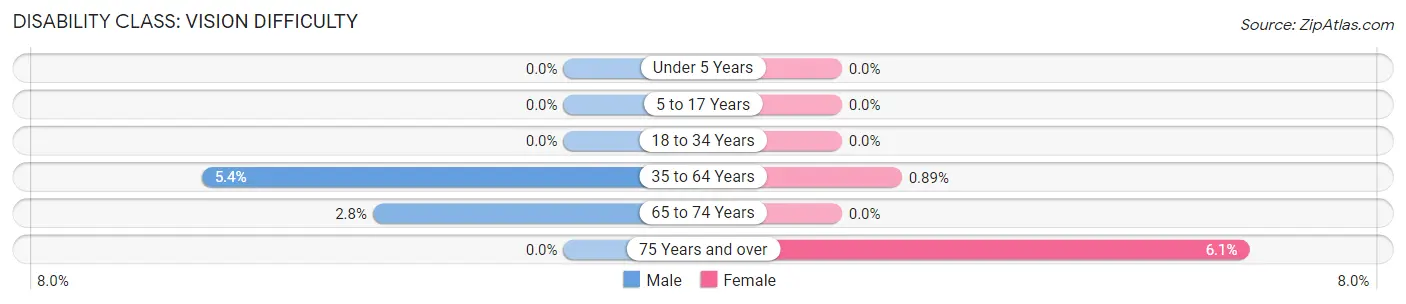
| Age Bracket | Male | Female |
| Under 5 Years | 0 (0.0%) | 0 (0.0%) |
| 5 to 17 Years | 0 (0.0%) | 0 (0.0%) |
| 18 to 34 Years | 0 (0.0%) | 0 (0.0%) |
| 35 to 64 Years | 84 (5.4%) | 14 (0.9%) |
| 65 to 74 Years | 10 (2.8%) | 0 (0.0%) |
| 75 Years and over | 0 (0.0%) | 13 (6.0%) |
Disability Class: Cognitive Difficulty
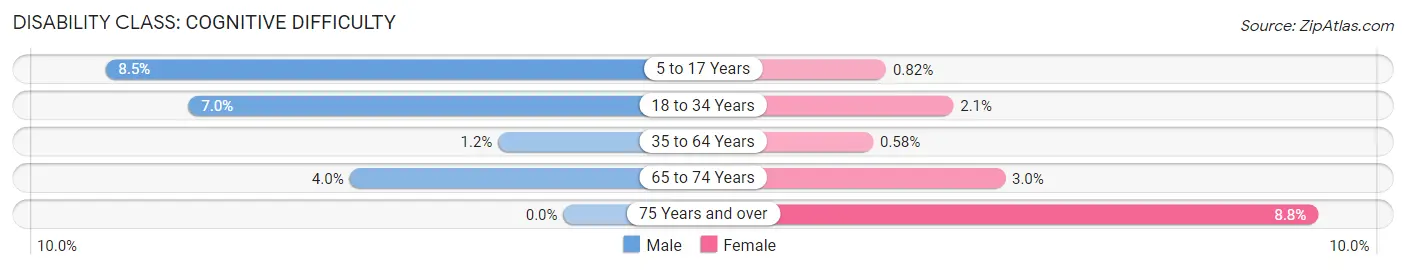
| Age Bracket | Male | Female |
| 5 to 17 Years | 60 (8.5%) | 5 (0.8%) |
| 18 to 34 Years | 81 (7.0%) | 17 (2.1%) |
| 35 to 64 Years | 19 (1.2%) | 9 (0.6%) |
| 65 to 74 Years | 14 (4.0%) | 9 (3.0%) |
| 75 Years and over | 0 (0.0%) | 19 (8.8%) |
Disability Class: Ambulatory Difficulty
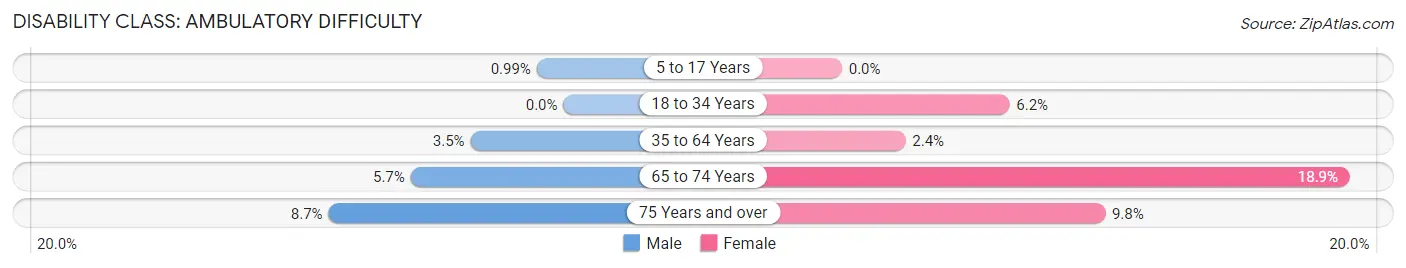
| Age Bracket | Male | Female |
| 5 to 17 Years | 7 (1.0%) | 0 (0.0%) |
| 18 to 34 Years | 0 (0.0%) | 51 (6.2%) |
| 35 to 64 Years | 54 (3.5%) | 37 (2.4%) |
| 65 to 74 Years | 20 (5.7%) | 56 (18.9%) |
| 75 Years and over | 15 (8.7%) | 21 (9.8%) |
Disability Class: Self-Care Difficulty
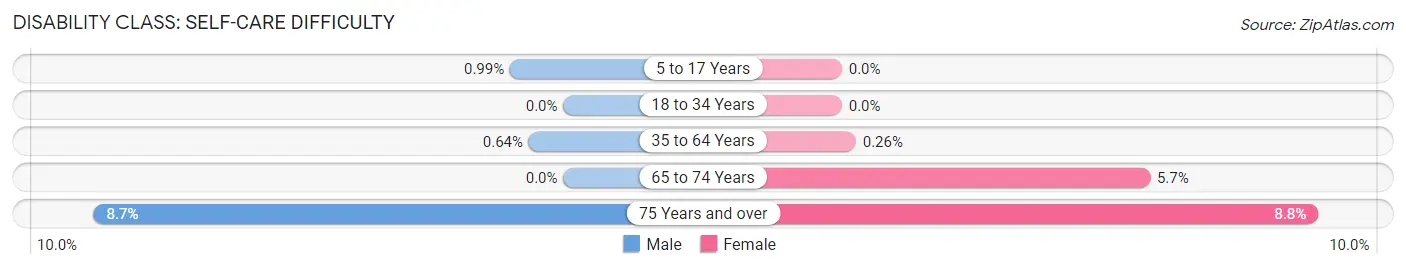
| Age Bracket | Male | Female |
| 5 to 17 Years | 7 (1.0%) | 0 (0.0%) |
| 18 to 34 Years | 0 (0.0%) | 0 (0.0%) |
| 35 to 64 Years | 10 (0.6%) | 4 (0.3%) |
| 65 to 74 Years | 0 (0.0%) | 17 (5.7%) |
| 75 Years and over | 15 (8.7%) | 19 (8.8%) |
Technology Access in Hillcrest
Computing Device Access in Hillcrest
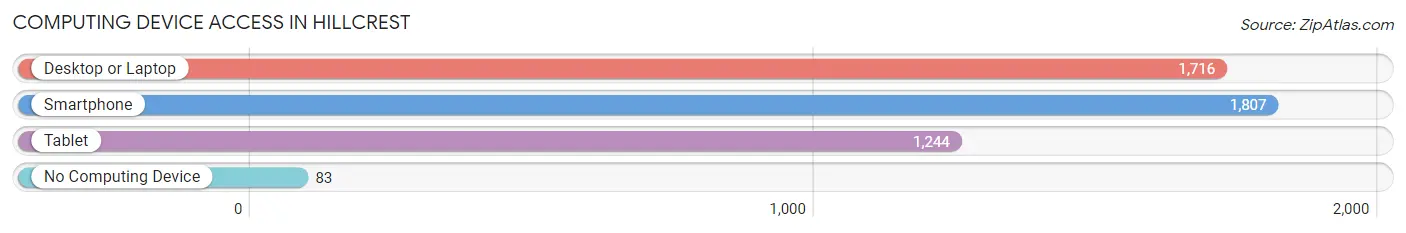
| Device Type | # Households | % Households |
| Desktop or Laptop | 1,716 | 86.5% |
| Smartphone | 1,807 | 91.1% |
| Tablet | 1,244 | 62.7% |
| No Computing Device | 83 | 4.2% |
| Total | 1,983 | 100.0% |
Internet Access in Hillcrest
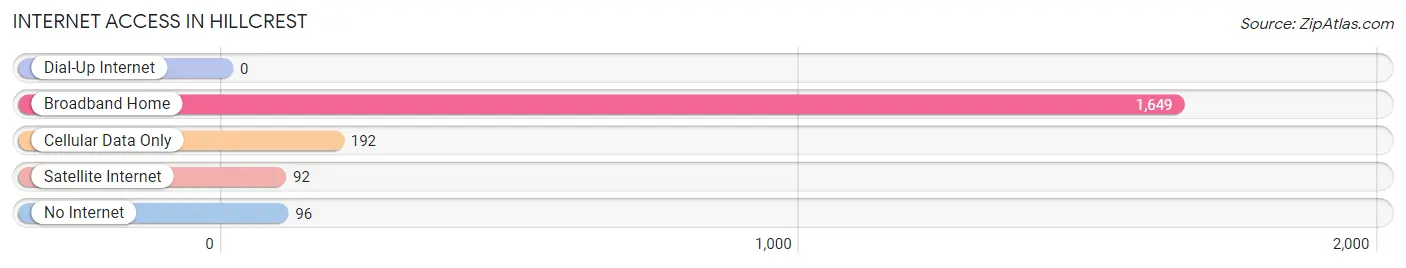
| Internet Type | # Households | % Households |
| Dial-Up Internet | 0 | 0.0% |
| Broadband Home | 1,649 | 83.2% |
| Cellular Data Only | 192 | 9.7% |
| Satellite Internet | 92 | 4.6% |
| No Internet | 96 | 4.8% |
| Total | 1,983 | 100.0% |
Hillcrest Summary
Hillcrest is a hamlet located in the Town of Ramapo in Rockland County, New York. It is located approximately 25 miles northwest of New York City. The hamlet is situated in the foothills of the Ramapo Mountains and is bordered by the hamlets of Monsey, New Hempstead, and New Square.
History
The area that is now Hillcrest was originally inhabited by the Munsee Native Americans. The first European settlers arrived in the area in the late 1700s. The hamlet was originally known as “Hill Crest” and was part of the Town of New Hempstead. In 1853, the hamlet was incorporated as the Town of Hillcrest.
In the late 1800s, the hamlet began to grow as a summer resort destination. The area was known for its natural beauty and was a popular destination for wealthy New Yorkers. The hamlet was home to several large estates, including the Hillcrest Country Club, which was founded in 1895.
In the early 1900s, the hamlet began to attract Jewish immigrants from Eastern Europe. The influx of Jewish immigrants led to the establishment of several synagogues and Jewish schools in the area.
In the 1950s, the hamlet began to experience rapid growth as the population of New York City increased. The hamlet was annexed by the Town of Ramapo in 1959.
Geography
Hillcrest is located in the foothills of the Ramapo Mountains. The hamlet is bordered by the hamlets of Monsey, New Hempstead, and New Square. The hamlet is located approximately 25 miles northwest of New York City.
The hamlet is home to several parks, including Hillcrest Park, which is located on the banks of the Ramapo River. The park features a playground, picnic area, and walking trails.
Economy
The economy of Hillcrest is largely based on retail and services. The hamlet is home to several shopping centers, including the Hillcrest Shopping Center, which features a variety of stores and restaurants.
The hamlet is also home to several businesses, including medical offices, law firms, and accounting firms. The hamlet is also home to several manufacturing companies, including a furniture manufacturer and a printing company.
Demographics
As of the 2010 census, the population of Hillcrest was 8,945. The population is largely Jewish, with approximately 75% of the population identifying as Jewish. The median household income is $76,945, and the median home value is $521,000. The hamlet is home to several synagogues and Jewish schools.
Common Questions
What is Per Capita Income in Hillcrest?
Per Capita income in Hillcrest is $41,076.
What is the Median Family Income in Hillcrest?
Median Family Income in Hillcrest is $118,190.
What is the Median Household income in Hillcrest?
Median Household Income in Hillcrest is $119,375.
What is Income or Wage Gap in Hillcrest?
Income or Wage Gap in Hillcrest is 7.4%.
Women in Hillcrest earn 92.6 cents for every dollar earned by a man.
What is Inequality or Gini Index in Hillcrest?
Inequality or Gini Index in Hillcrest is 0.46.
What is the Total Population of Hillcrest?
Total Population of Hillcrest is 8,178.
What is the Total Male Population of Hillcrest?
Total Male Population of Hillcrest is 4,384.
What is the Total Female Population of Hillcrest?
Total Female Population of Hillcrest is 3,794.
What is the Ratio of Males per 100 Females in Hillcrest?
There are 115.55 Males per 100 Females in Hillcrest.
What is the Ratio of Females per 100 Males in Hillcrest?
There are 86.54 Females per 100 Males in Hillcrest.
What is the Median Population Age in Hillcrest?
Median Population Age in Hillcrest is 35.7 Years.
What is the Average Family Size in Hillcrest
Average Family Size in Hillcrest is 3.9 People.
What is the Average Household Size in Hillcrest
Average Household Size in Hillcrest is 4.0 People.
How Large is the Labor Force in Hillcrest?
There are 4,403 People in the Labor Forcein in Hillcrest.
What is the Percentage of People in the Labor Force in Hillcrest?
67.4% of People are in the Labor Force in Hillcrest.
What is the Unemployment Rate in Hillcrest?
Unemployment Rate in Hillcrest is 7.4%.