Manorhaven, NY Map & Demographics
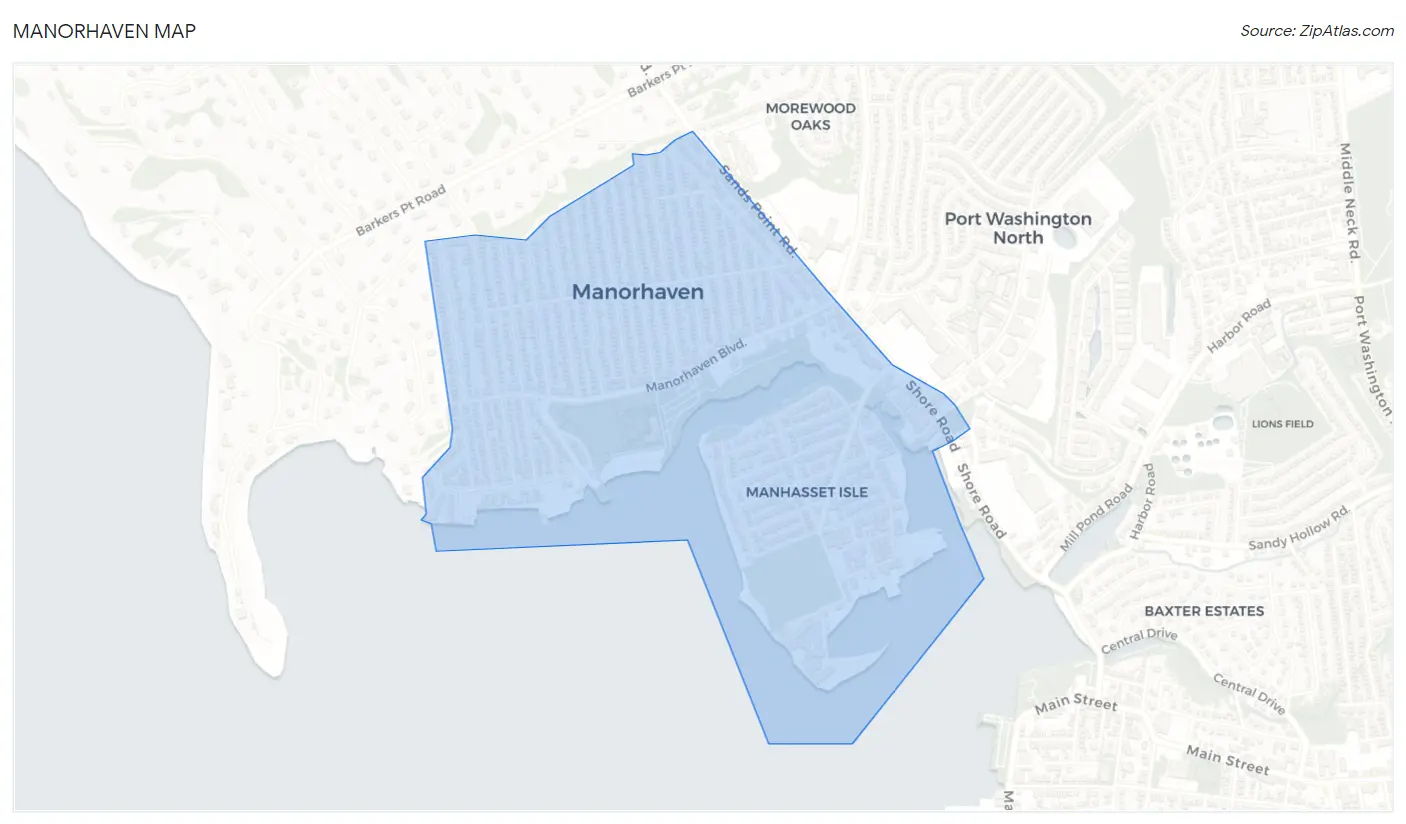
Manorhaven Map
Manorhaven Overview
$51,235
PER CAPITA INCOME
$96,230
AVG FAMILY INCOME
$95,493
AVG HOUSEHOLD INCOME
57.8%
WAGE / INCOME GAP [ % ]
42.2¢/ $1
WAGE / INCOME GAP [ $ ]
0.46
INEQUALITY / GINI INDEX
6,929
TOTAL POPULATION
3,285
MALE POPULATION
3,644
FEMALE POPULATION
90.15
MALES / 100 FEMALES
110.93
FEMALES / 100 MALES
43.0
MEDIAN AGE
3.0
AVG FAMILY SIZE
2.5
AVG HOUSEHOLD SIZE
3,748
LABOR FORCE [ PEOPLE ]
65.5%
PERCENT IN LABOR FORCE
3.3%
UNEMPLOYMENT RATE
Income in Manorhaven
Income Overview in Manorhaven
Per Capita Income in Manorhaven is $51,235, while median incomes of families and households are $96,230 and $95,493 respectively.
| Characteristic | Number | Measure |
| Per Capita Income | 6,929 | $51,235 |
| Median Family Income | 1,889 | $96,230 |
| Mean Family Income | 1,889 | $138,189 |
| Median Household Income | 2,708 | $95,493 |
| Mean Household Income | 2,708 | $130,937 |
| Income Deficit | 1,889 | $0 |
| Wage / Income Gap (%) | 6,929 | 57.81% |
| Wage / Income Gap ($) | 6,929 | 42.19¢ per $1 |
| Gini / Inequality Index | 6,929 | 0.46 |
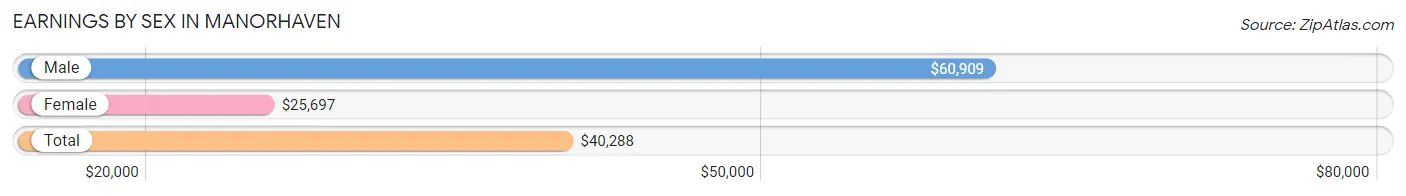
Earnings by Sex in Manorhaven
Average Earnings in Manorhaven are $40,288, $60,909 for men and $25,697 for women, a difference of 57.8%.
| Sex | Number | Average Earnings |
| Male | 2,373 (60.6%) | $60,909 |
| Female | 1,543 (39.4%) | $25,697 |
| Total | 3,916 (100.0%) | $40,288 |
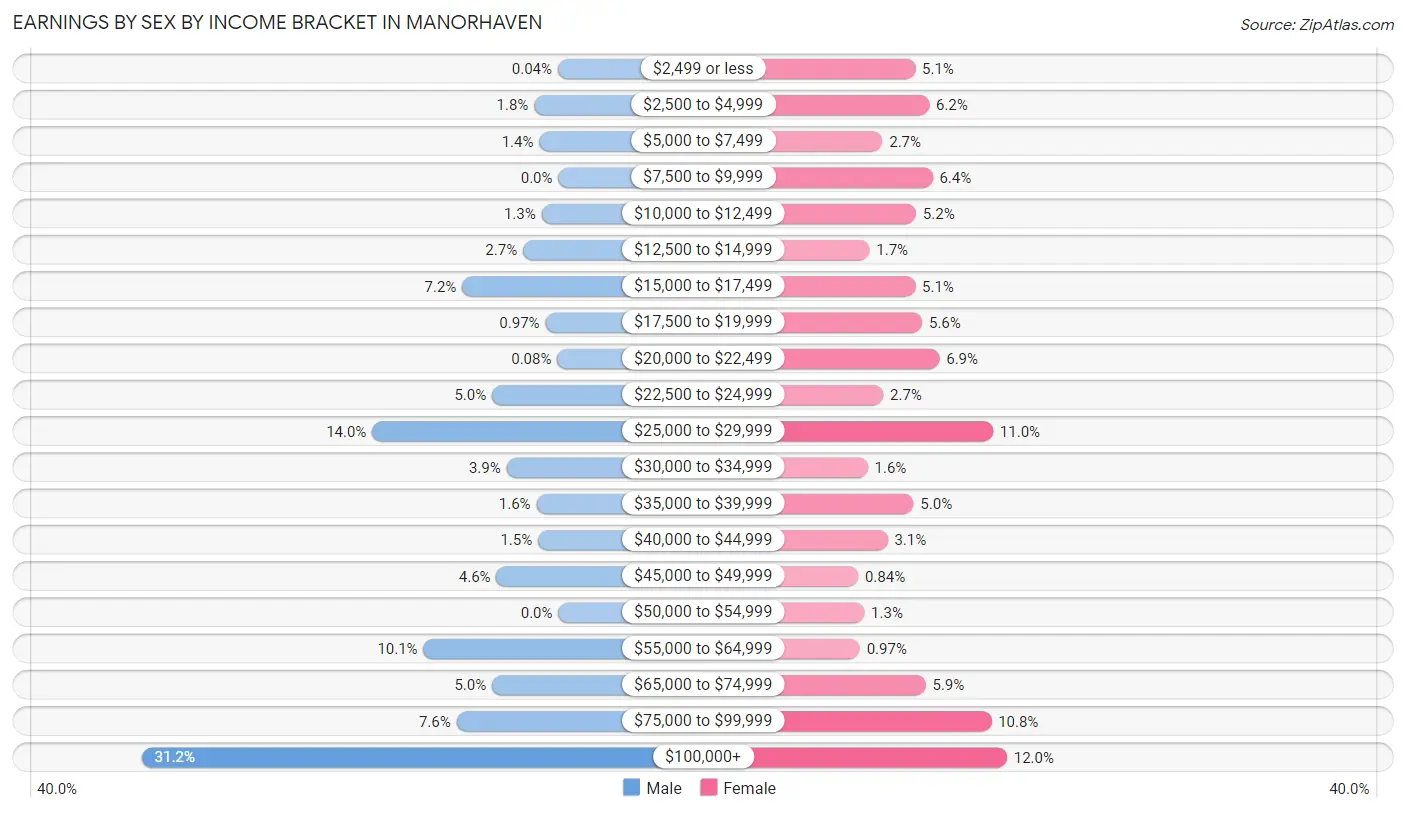
Earnings by Sex by Income Bracket in Manorhaven
The most common earnings brackets in Manorhaven are $100,000+ for men (741 | 31.2%) and $100,000+ for women (185 | 12.0%).
| Income | Male | Female |
| $2,499 or less | 1 (0.0%) | 79 (5.1%) |
| $2,500 to $4,999 | 43 (1.8%) | 95 (6.2%) |
| $5,000 to $7,499 | 34 (1.4%) | 41 (2.7%) |
| $7,500 to $9,999 | 0 (0.0%) | 99 (6.4%) |
| $10,000 to $12,499 | 30 (1.3%) | 80 (5.2%) |
| $12,500 to $14,999 | 63 (2.6%) | 26 (1.7%) |
| $15,000 to $17,499 | 171 (7.2%) | 79 (5.1%) |
| $17,500 to $19,999 | 23 (1.0%) | 87 (5.6%) |
| $20,000 to $22,499 | 2 (0.1%) | 107 (6.9%) |
| $22,500 to $24,999 | 118 (5.0%) | 42 (2.7%) |
| $25,000 to $29,999 | 331 (14.0%) | 169 (11.0%) |
| $30,000 to $34,999 | 92 (3.9%) | 24 (1.6%) |
| $35,000 to $39,999 | 39 (1.6%) | 77 (5.0%) |
| $40,000 to $44,999 | 36 (1.5%) | 47 (3.0%) |
| $45,000 to $49,999 | 110 (4.6%) | 13 (0.8%) |
| $50,000 to $54,999 | 0 (0.0%) | 20 (1.3%) |
| $55,000 to $64,999 | 240 (10.1%) | 15 (1.0%) |
| $65,000 to $74,999 | 118 (5.0%) | 91 (5.9%) |
| $75,000 to $99,999 | 181 (7.6%) | 167 (10.8%) |
| $100,000+ | 741 (31.2%) | 185 (12.0%) |
| Total | 2,373 (100.0%) | 1,543 (100.0%) |
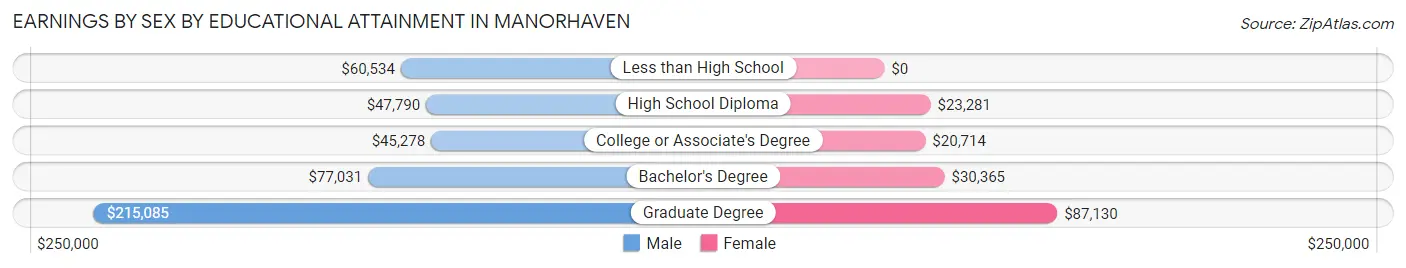
Earnings by Sex by Educational Attainment in Manorhaven
Average earnings in Manorhaven are $66,016 for men and $26,403 for women, a difference of 60.0%. Men with an educational attainment of graduate degree enjoy the highest average annual earnings of $215,085, while those with college or associate's degree education earn the least with $45,278. Women with an educational attainment of graduate degree earn the most with the average annual earnings of $87,130, while those with college or associate's degree education have the smallest earnings of $20,714.
| Educational Attainment | Male Income | Female Income |
| Less than High School | $60,534 | $0 |
| High School Diploma | $47,790 | $23,281 |
| College or Associate's Degree | $45,278 | $20,714 |
| Bachelor's Degree | $77,031 | $30,365 |
| Graduate Degree | $215,085 | $87,130 |
| Total | $66,016 | $26,403 |
Family Income in Manorhaven
Family Income Brackets in Manorhaven
According to the Manorhaven family income data, there are 385 families falling into the $50,000 to $74,999 income range, which is the most common income bracket and makes up 20.4% of all families.
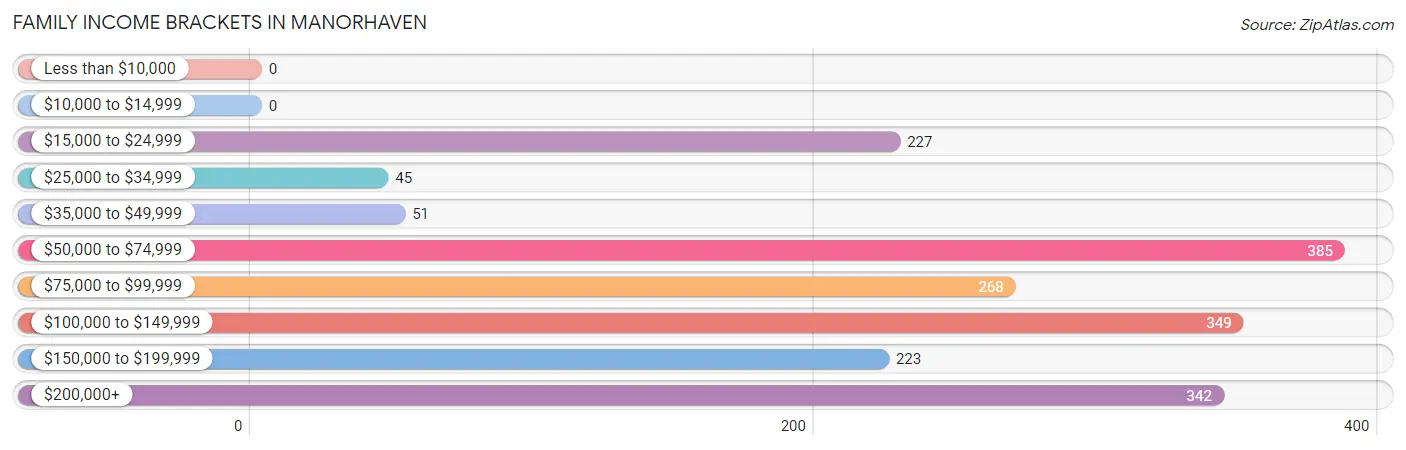
| Income Bracket | # Families | % Families |
| Less than $10,000 | 0 | 0.0% |
| $10,000 to $14,999 | 0 | 0.0% |
| $15,000 to $24,999 | 227 | 12.0% |
| $25,000 to $34,999 | 45 | 2.4% |
| $35,000 to $49,999 | 51 | 2.7% |
| $50,000 to $74,999 | 385 | 20.4% |
| $75,000 to $99,999 | 268 | 14.2% |
| $100,000 to $149,999 | 349 | 18.5% |
| $150,000 to $199,999 | 223 | 11.8% |
| $200,000+ | 342 | 18.1% |
Family Income by Famaliy Size in Manorhaven
3-person families (602 | 31.9%) account for the highest median family income in Manorhaven with $105,581 per family, while 2-person families (726 | 38.4%) have the highest median income of $48,032 per family member.
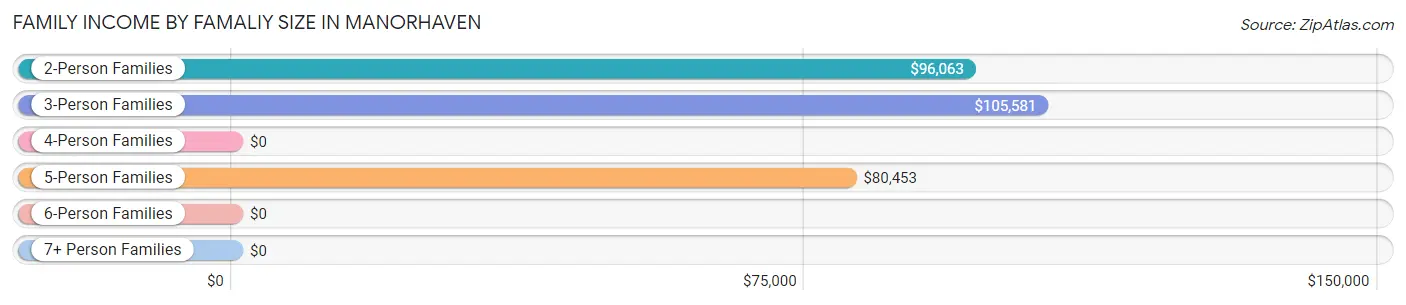
| Income Bracket | # Families | Median Income |
| 2-Person Families | 726 (38.4%) | $96,063 |
| 3-Person Families | 602 (31.9%) | $105,581 |
| 4-Person Families | 225 (11.9%) | $0 |
| 5-Person Families | 319 (16.9%) | $80,453 |
| 6-Person Families | 15 (0.8%) | $0 |
| 7+ Person Families | 2 (0.1%) | $0 |
| Total | 1,889 (100.0%) | $96,230 |
Family Income by Number of Earners in Manorhaven
The median family income in Manorhaven is $96,230, with families comprising 3+ earners (170) having the highest median family income of $183,043, while families with 1 earner (784) have the lowest median family income of $60,997, accounting for 9.0% and 41.5% of families, respectively.
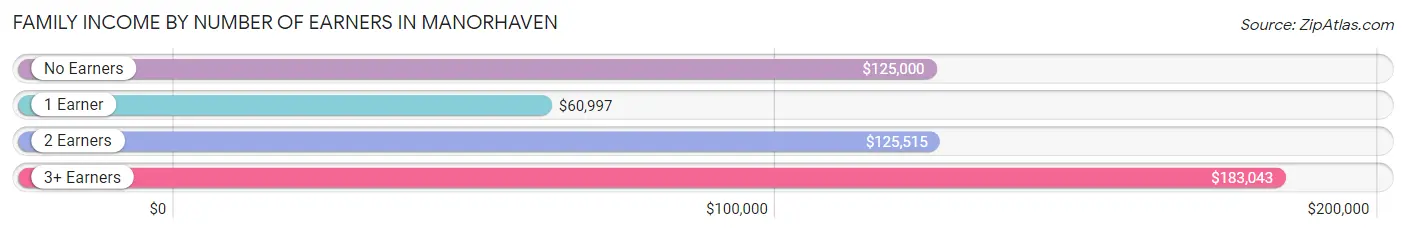
| Number of Earners | # Families | Median Income |
| No Earners | 70 (3.7%) | $125,000 |
| 1 Earner | 784 (41.5%) | $60,997 |
| 2 Earners | 865 (45.8%) | $125,515 |
| 3+ Earners | 170 (9.0%) | $183,043 |
| Total | 1,889 (100.0%) | $96,230 |
Household Income in Manorhaven
Household Income Brackets in Manorhaven
With 509 households falling in the category, the $200,000+ income range is the most frequent in Manorhaven, accounting for 18.8% of all households.
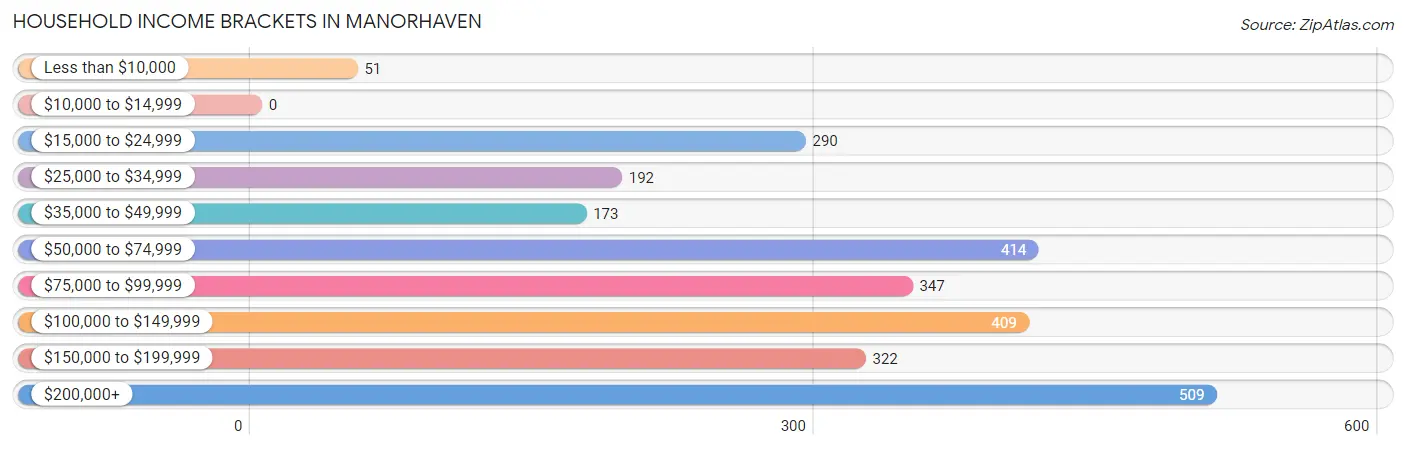
| Income Bracket | # Households | % Households |
| Less than $10,000 | 51 | 1.9% |
| $10,000 to $14,999 | 0 | 0.0% |
| $15,000 to $24,999 | 290 | 10.7% |
| $25,000 to $34,999 | 192 | 7.1% |
| $35,000 to $49,999 | 173 | 6.4% |
| $50,000 to $74,999 | 414 | 15.3% |
| $75,000 to $99,999 | 347 | 12.8% |
| $100,000 to $149,999 | 409 | 15.1% |
| $150,000 to $199,999 | 322 | 11.9% |
| $200,000+ | 509 | 18.8% |
Household Income by Householder Age in Manorhaven
The median household income in Manorhaven is $95,493, with the highest median household income of $105,608 found in the 25 to 44 years age bracket for the primary householder. A total of 564 households (20.8%) fall into this category.
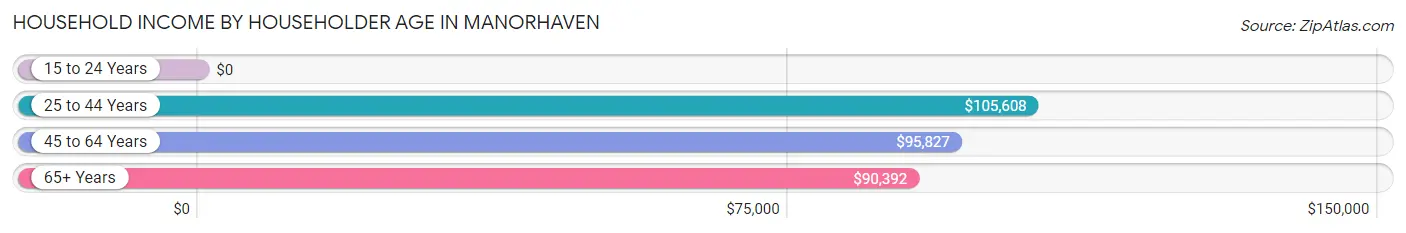
| Income Bracket | # Households | Median Income |
| 15 to 24 Years | 0 (0.0%) | $0 |
| 25 to 44 Years | 564 (20.8%) | $105,608 |
| 45 to 64 Years | 1,452 (53.6%) | $95,827 |
| 65+ Years | 692 (25.6%) | $90,392 |
| Total | 2,708 (100.0%) | $95,493 |
Poverty in Manorhaven
Income Below Poverty by Sex and Age in Manorhaven
With 4.6% poverty level for males and 10.2% for females among the residents of Manorhaven, 18 to 24 year old males and 18 to 24 year old females are the most vulnerable to poverty, with 147 males (39.8%) and 104 females (31.6%) in their respective age groups living below the poverty level.
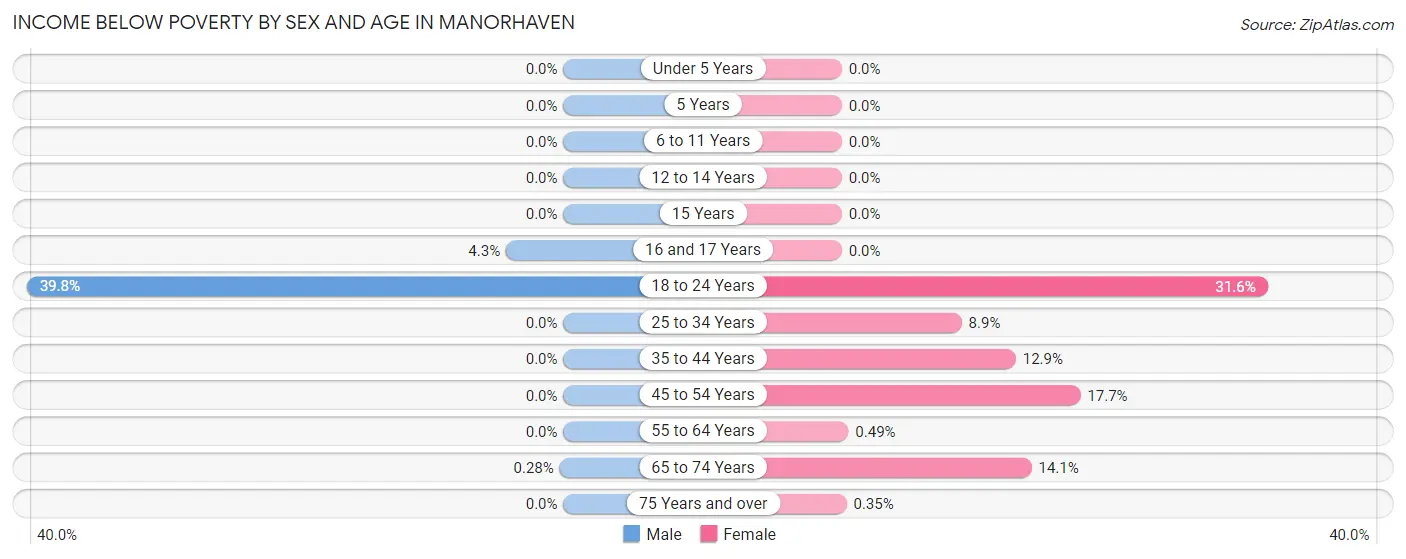
| Age Bracket | Male | Female |
| Under 5 Years | 0 (0.0%) | 0 (0.0%) |
| 5 Years | 0 (0.0%) | 0 (0.0%) |
| 6 to 11 Years | 0 (0.0%) | 0 (0.0%) |
| 12 to 14 Years | 0 (0.0%) | 0 (0.0%) |
| 15 Years | 0 (0.0%) | 0 (0.0%) |
| 16 and 17 Years | 2 (4.3%) | 0 (0.0%) |
| 18 to 24 Years | 147 (39.8%) | 104 (31.6%) |
| 25 to 34 Years | 0 (0.0%) | 38 (8.9%) |
| 35 to 44 Years | 0 (0.0%) | 42 (12.9%) |
| 45 to 54 Years | 0 (0.0%) | 132 (17.7%) |
| 55 to 64 Years | 0 (0.0%) | 2 (0.5%) |
| 65 to 74 Years | 1 (0.3%) | 52 (14.1%) |
| 75 Years and over | 0 (0.0%) | 1 (0.4%) |
| Total | 150 (4.6%) | 371 (10.2%) |
Income Above Poverty by Sex and Age in Manorhaven
According to the poverty statistics in Manorhaven, males aged under 5 years and females aged under 5 years are the age groups that are most secure financially, with 100.0% of males and 100.0% of females in these age groups living above the poverty line.
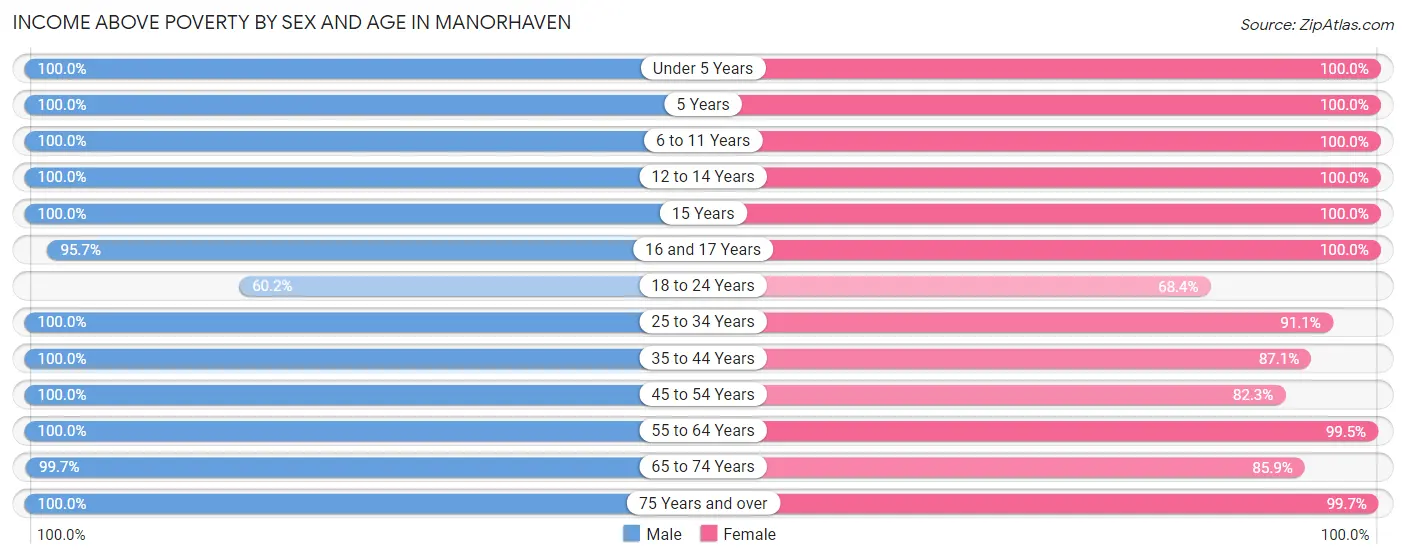
| Age Bracket | Male | Female |
| Under 5 Years | 59 (100.0%) | 227 (100.0%) |
| 5 Years | 62 (100.0%) | 24 (100.0%) |
| 6 to 11 Years | 280 (100.0%) | 282 (100.0%) |
| 12 to 14 Years | 103 (100.0%) | 110 (100.0%) |
| 15 Years | 31 (100.0%) | 29 (100.0%) |
| 16 and 17 Years | 45 (95.7%) | 85 (100.0%) |
| 18 to 24 Years | 222 (60.2%) | 225 (68.4%) |
| 25 to 34 Years | 250 (100.0%) | 389 (91.1%) |
| 35 to 44 Years | 524 (100.0%) | 283 (87.1%) |
| 45 to 54 Years | 604 (100.0%) | 613 (82.3%) |
| 55 to 64 Years | 426 (100.0%) | 408 (99.5%) |
| 65 to 74 Years | 360 (99.7%) | 317 (85.9%) |
| 75 Years and over | 169 (100.0%) | 281 (99.7%) |
| Total | 3,135 (95.4%) | 3,273 (89.8%) |
Income Below Poverty Among Married-Couple Families in Manorhaven
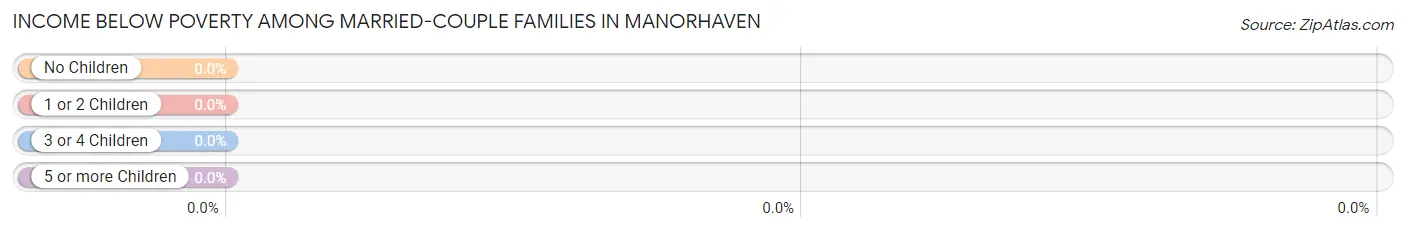
| Children | Above Poverty | Below Poverty |
| No Children | 615 (100.0%) | 0 (0.0%) |
| 1 or 2 Children | 519 (100.0%) | 0 (0.0%) |
| 3 or 4 Children | 119 (100.0%) | 0 (0.0%) |
| 5 or more Children | 0 (0.0%) | 0 (0.0%) |
| Total | 1,253 (100.0%) | 0 (0.0%) |
Income Below Poverty Among Single-Parent Households in Manorhaven
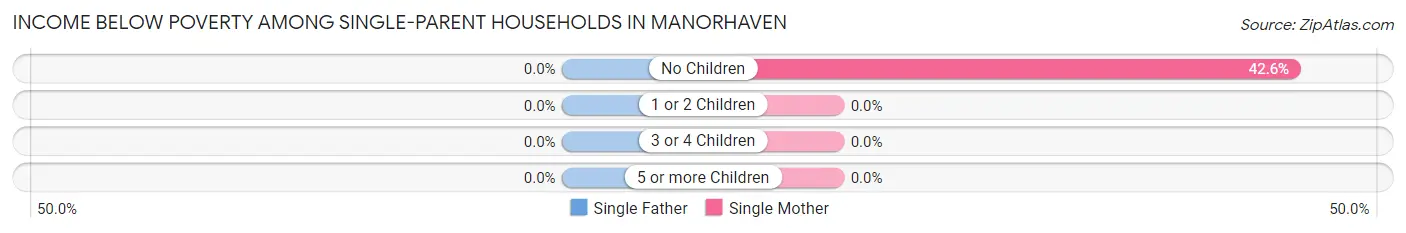
| Children | Single Father | Single Mother |
| No Children | 0 (0.0%) | 132 (42.6%) |
| 1 or 2 Children | 0 (0.0%) | 0 (0.0%) |
| 3 or 4 Children | 0 (0.0%) | 0 (0.0%) |
| 5 or more Children | 0 (0.0%) | 0 (0.0%) |
| Total | 0 (0.0%) | 132 (29.7%) |
Income Below Poverty Among Married-Couple vs Single-Parent Households in Manorhaven
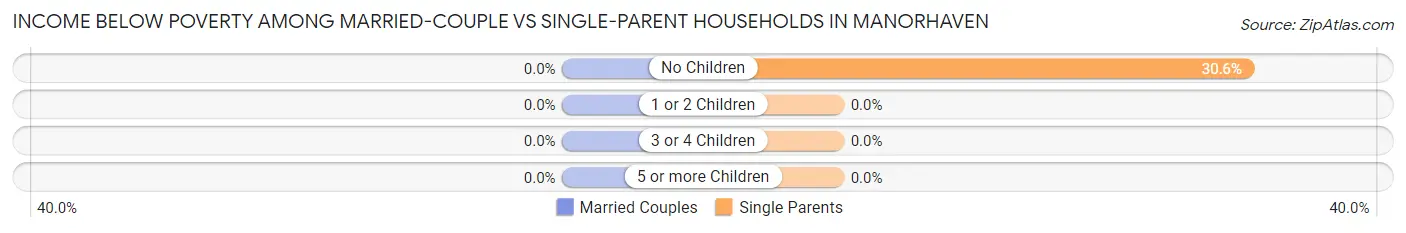
| Children | Married-Couple Families | Single-Parent Households |
| No Children | 0 (0.0%) | 132 (30.6%) |
| 1 or 2 Children | 0 (0.0%) | 0 (0.0%) |
| 3 or 4 Children | 0 (0.0%) | 0 (0.0%) |
| 5 or more Children | 0 (0.0%) | 0 (0.0%) |
| Total | 0 (0.0%) | 132 (20.7%) |
Race in Manorhaven
The most populous races in Manorhaven are White / Caucasian (4,039 | 58.3%), Hispanic or Latino (2,253 | 32.5%), and Some other Race (1,416 | 20.4%).
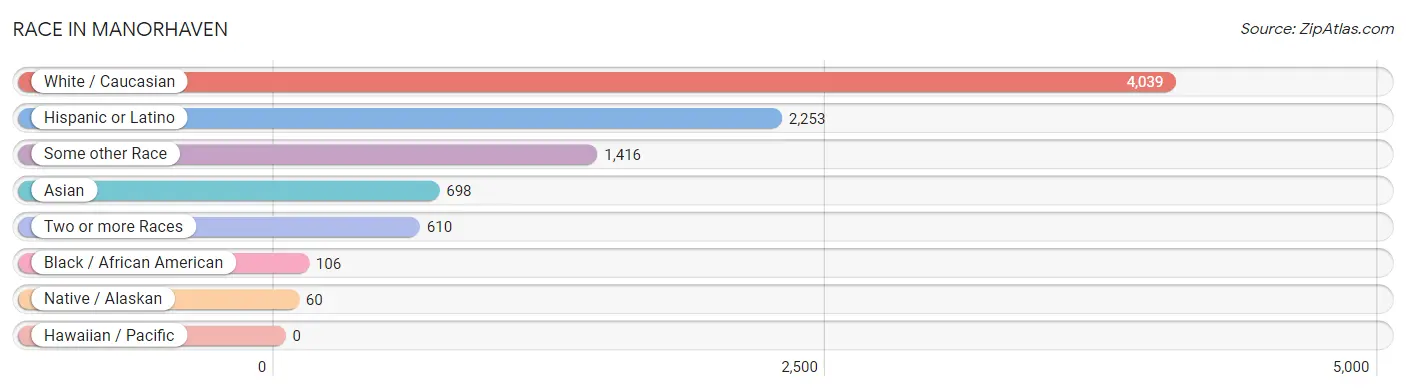
| Race | # Population | % Population |
| Asian | 698 | 10.1% |
| Black / African American | 106 | 1.5% |
| Hawaiian / Pacific | 0 | 0.0% |
| Hispanic or Latino | 2,253 | 32.5% |
| Native / Alaskan | 60 | 0.9% |
| White / Caucasian | 4,039 | 58.3% |
| Two or more Races | 610 | 8.8% |
| Some other Race | 1,416 | 20.4% |
| Total | 6,929 | 100.0% |
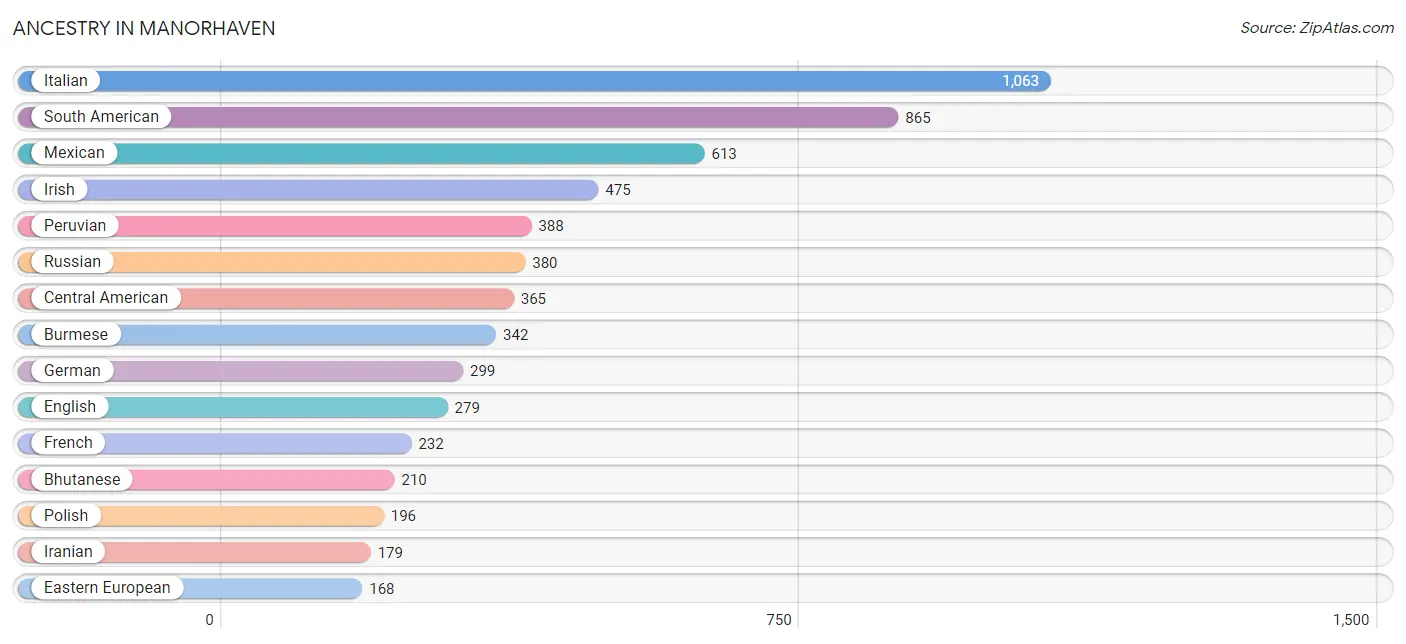
Ancestry in Manorhaven
The most populous ancestries reported in Manorhaven are Italian (1,063 | 15.3%), South American (865 | 12.5%), Mexican (613 | 8.8%), Irish (475 | 6.9%), and Peruvian (388 | 5.6%), together accounting for 49.1% of all Manorhaven residents.
| Ancestry | # Population | % Population |
| African | 39 | 0.6% |
| American | 148 | 2.1% |
| Arab | 90 | 1.3% |
| Austrian | 24 | 0.4% |
| Bhutanese | 210 | 3.0% |
| Bolivian | 113 | 1.6% |
| Brazilian | 35 | 0.5% |
| Burmese | 342 | 4.9% |
| Central American | 365 | 5.3% |
| Chilean | 48 | 0.7% |
| Colombian | 28 | 0.4% |
| Danish | 11 | 0.2% |
| Dutch | 72 | 1.0% |
| Eastern European | 168 | 2.4% |
| Ecuadorian | 148 | 2.1% |
| English | 279 | 4.0% |
| Estonian | 13 | 0.2% |
| European | 120 | 1.7% |
| Finnish | 44 | 0.6% |
| French | 232 | 3.4% |
| German | 299 | 4.3% |
| Guatemalan | 166 | 2.4% |
| Honduran | 35 | 0.5% |
| Hungarian | 24 | 0.4% |
| Indian (Asian) | 162 | 2.3% |
| Iranian | 179 | 2.6% |
| Irish | 475 | 6.9% |
| Israeli | 44 | 0.6% |
| Italian | 1,063 | 15.3% |
| Mexican | 613 | 8.8% |
| Peruvian | 388 | 5.6% |
| Polish | 196 | 2.8% |
| Portuguese | 56 | 0.8% |
| Puerto Rican | 127 | 1.8% |
| Russian | 380 | 5.5% |
| Salvadoran | 164 | 2.4% |
| Scotch-Irish | 14 | 0.2% |
| South American | 865 | 12.5% |
| Spanish American Indian | 60 | 0.9% |
| Subsaharan African | 39 | 0.6% |
| Swedish | 31 | 0.4% |
| Syrian | 25 | 0.4% |
| Thai | 56 | 0.8% |
| Uruguayan | 66 | 0.9% |
| Vietnamese | 19 | 0.3% |
| Yugoslavian | 27 | 0.4% | View All 46 Rows |
Immigrants in Manorhaven
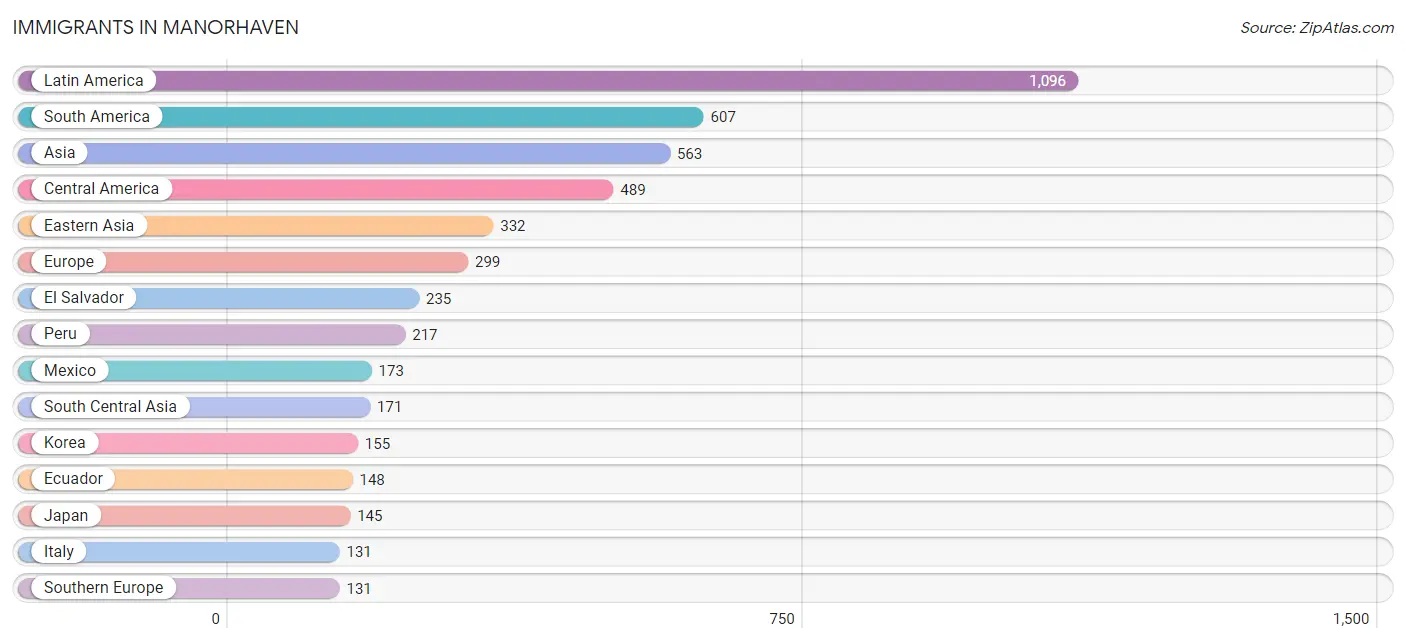
The most numerous immigrant groups reported in Manorhaven came from Latin America (1,096 | 15.8%), South America (607 | 8.8%), Asia (563 | 8.1%), Central America (489 | 7.1%), and Eastern Asia (332 | 4.8%), together accounting for 44.6% of all Manorhaven residents.
| Immigration Origin | # Population | % Population |
| Africa | 80 | 1.1% |
| Asia | 563 | 8.1% |
| Bangladesh | 17 | 0.3% |
| Belarus | 19 | 0.3% |
| Bolivia | 59 | 0.9% |
| Brazil | 35 | 0.5% |
| Central America | 489 | 7.1% |
| Chile | 120 | 1.7% |
| China | 32 | 0.5% |
| Colombia | 28 | 0.4% |
| Eastern Africa | 41 | 0.6% |
| Eastern Asia | 332 | 4.8% |
| Eastern Europe | 19 | 0.3% |
| Ecuador | 148 | 2.1% |
| El Salvador | 235 | 3.4% |
| England | 25 | 0.4% |
| Europe | 299 | 4.3% |
| France | 48 | 0.7% |
| Ghana | 39 | 0.6% |
| Guatemala | 81 | 1.2% |
| India | 66 | 0.9% |
| Iran | 88 | 1.3% |
| Ireland | 10 | 0.1% |
| Israel | 48 | 0.7% |
| Italy | 131 | 1.9% |
| Japan | 145 | 2.1% |
| Korea | 155 | 2.2% |
| Latin America | 1,096 | 15.8% |
| Mexico | 173 | 2.5% |
| Netherlands | 12 | 0.2% |
| Northern Europe | 89 | 1.3% |
| Peru | 217 | 3.1% |
| Philippines | 12 | 0.2% |
| South America | 607 | 8.8% |
| South Central Asia | 171 | 2.5% |
| South Eastern Asia | 12 | 0.2% |
| Southern Europe | 131 | 1.9% |
| Western Africa | 39 | 0.6% |
| Western Asia | 48 | 0.7% |
| Western Europe | 60 | 0.9% |
| Zimbabwe | 41 | 0.6% | View All 41 Rows |
Sex and Age in Manorhaven
Sex and Age in Manorhaven
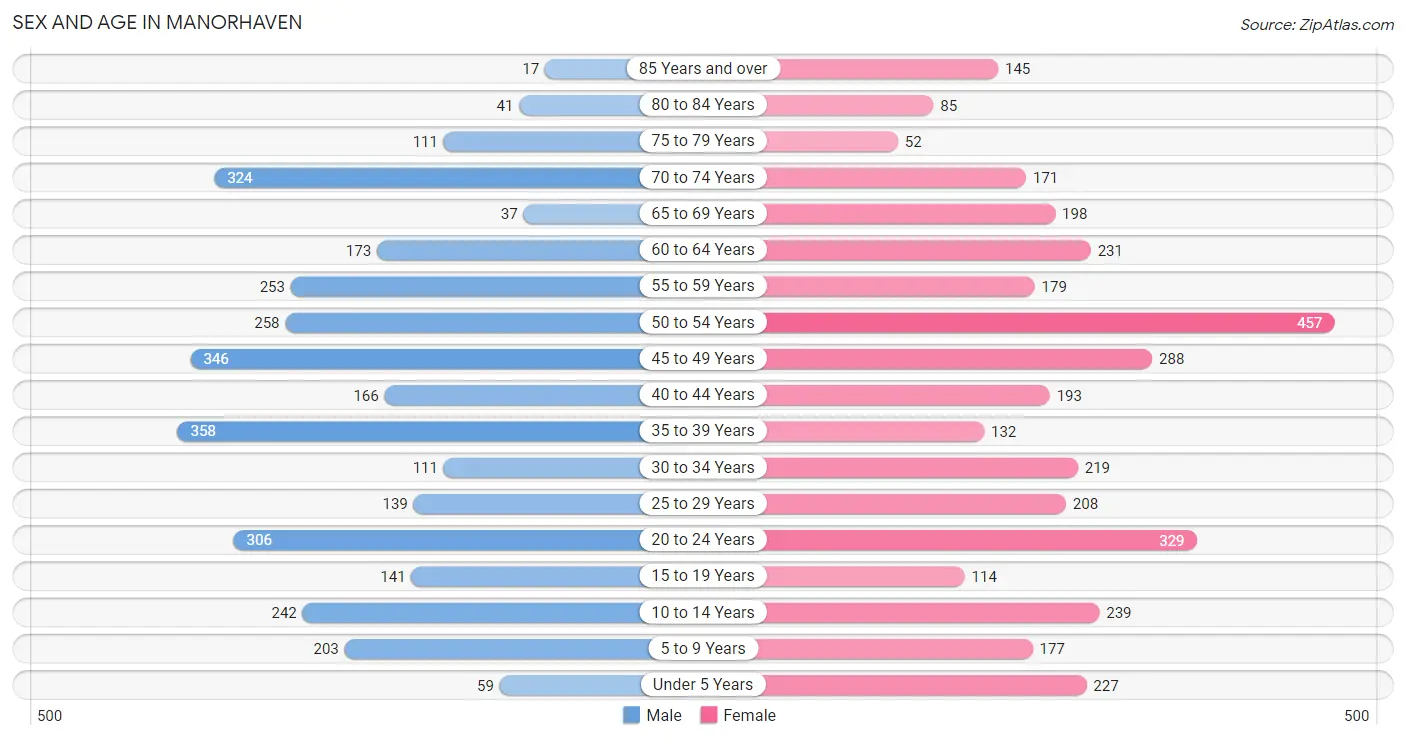
The most populous age groups in Manorhaven are 35 to 39 Years (358 | 10.9%) for men and 50 to 54 Years (457 | 12.5%) for women.
| Age Bracket | Male | Female |
| Under 5 Years | 59 (1.8%) | 227 (6.2%) |
| 5 to 9 Years | 203 (6.2%) | 177 (4.9%) |
| 10 to 14 Years | 242 (7.4%) | 239 (6.6%) |
| 15 to 19 Years | 141 (4.3%) | 114 (3.1%) |
| 20 to 24 Years | 306 (9.3%) | 329 (9.0%) |
| 25 to 29 Years | 139 (4.2%) | 208 (5.7%) |
| 30 to 34 Years | 111 (3.4%) | 219 (6.0%) |
| 35 to 39 Years | 358 (10.9%) | 132 (3.6%) |
| 40 to 44 Years | 166 (5.1%) | 193 (5.3%) |
| 45 to 49 Years | 346 (10.5%) | 288 (7.9%) |
| 50 to 54 Years | 258 (7.9%) | 457 (12.5%) |
| 55 to 59 Years | 253 (7.7%) | 179 (4.9%) |
| 60 to 64 Years | 173 (5.3%) | 231 (6.3%) |
| 65 to 69 Years | 37 (1.1%) | 198 (5.4%) |
| 70 to 74 Years | 324 (9.9%) | 171 (4.7%) |
| 75 to 79 Years | 111 (3.4%) | 52 (1.4%) |
| 80 to 84 Years | 41 (1.3%) | 85 (2.3%) |
| 85 Years and over | 17 (0.5%) | 145 (4.0%) |
| Total | 3,285 (100.0%) | 3,644 (100.0%) |
Families and Households in Manorhaven
Median Family Size in Manorhaven
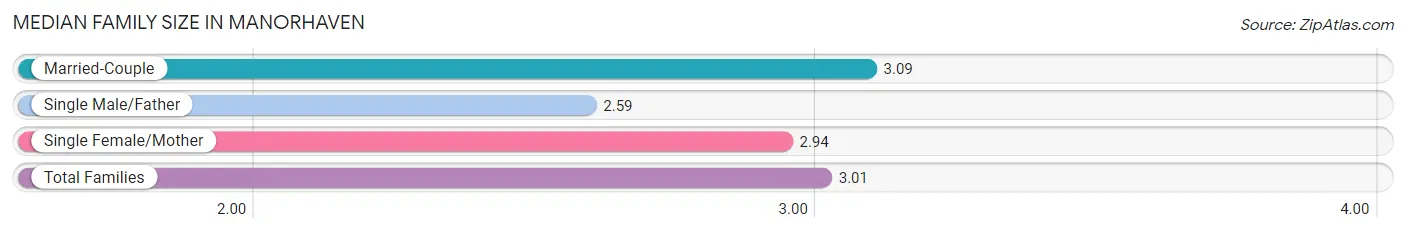
The median family size in Manorhaven is 3.01 persons per family, with married-couple families (1,253 | 66.3%) accounting for the largest median family size of 3.09 persons per family. On the other hand, single male/father families (191 | 10.1%) represent the smallest median family size with 2.59 persons per family.
| Family Type | # Families | Family Size |
| Married-Couple | 1,253 (66.3%) | 3.09 |
| Single Male/Father | 191 (10.1%) | 2.59 |
| Single Female/Mother | 445 (23.6%) | 2.94 |
| Total Families | 1,889 (100.0%) | 3.01 |
Median Household Size in Manorhaven
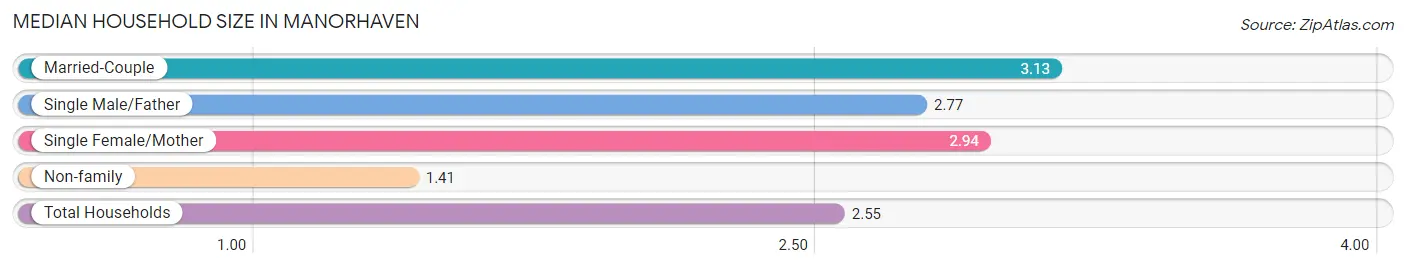
The median household size in Manorhaven is 2.55 persons per household, with married-couple households (1,253 | 46.3%) accounting for the largest median household size of 3.13 persons per household. non-family households (819 | 30.2%) represent the smallest median household size with 1.41 persons per household.
| Household Type | # Households | Household Size |
| Married-Couple | 1,253 (46.3%) | 3.13 |
| Single Male/Father | 191 (7.0%) | 2.77 |
| Single Female/Mother | 445 (16.4%) | 2.94 |
| Non-family | 819 (30.2%) | 1.41 |
| Total Households | 2,708 (100.0%) | 2.55 |
Household Size by Marriage Status in Manorhaven
Out of a total of 2,708 households in Manorhaven, 1,889 (69.8%) are family households, while 819 (30.2%) are nonfamily households. The most numerous type of family households are 2-person households, comprising 702, and the most common type of nonfamily households are 1-person households, comprising 475.
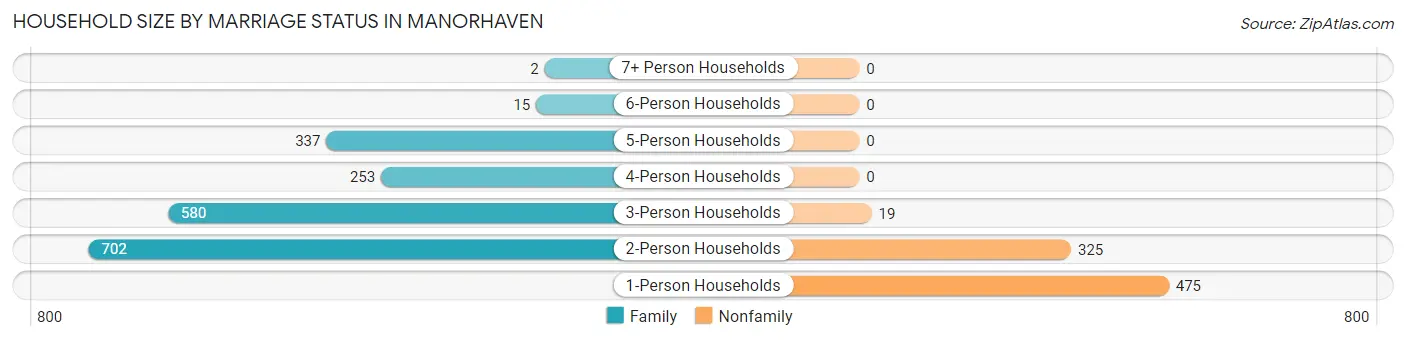
| Household Size | Family Households | Nonfamily Households |
| 1-Person Households | - | 475 (17.5%) |
| 2-Person Households | 702 (25.9%) | 325 (12.0%) |
| 3-Person Households | 580 (21.4%) | 19 (0.7%) |
| 4-Person Households | 253 (9.3%) | 0 (0.0%) |
| 5-Person Households | 337 (12.4%) | 0 (0.0%) |
| 6-Person Households | 15 (0.5%) | 0 (0.0%) |
| 7+ Person Households | 2 (0.1%) | 0 (0.0%) |
| Total | 1,889 (69.8%) | 819 (30.2%) |
Female Fertility in Manorhaven
Fertility by Age in Manorhaven
Average fertility rate in Manorhaven is 74.0 births per 1,000 women. Women in the age bracket of 35 to 50 years have the highest fertility rate with 119.0 births per 1,000 women. Women in the age bracket of 35 to 50 years acount for 69.3% of all women with births.
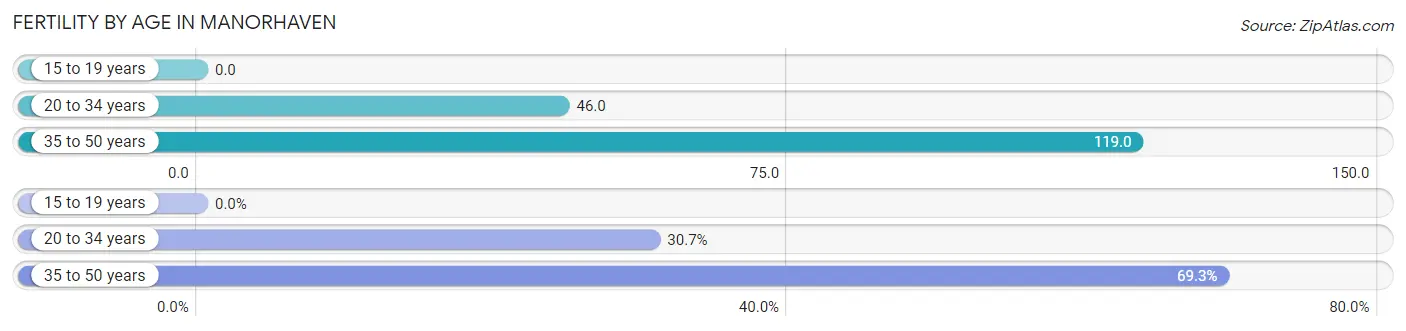
| Age Bracket | Women with Births | Births / 1,000 Women |
| 15 to 19 years | 0 (0.0%) | 0.0 |
| 20 to 34 years | 35 (30.7%) | 46.0 |
| 35 to 50 years | 79 (69.3%) | 119.0 |
| Total | 114 (100.0%) | 74.0 |
Fertility by Age by Marriage Status in Manorhaven
69.3% of women with births (114) in Manorhaven are married. The highest percentage of unmarried women with births falls into 20 to 34 years age bracket with 100.0% of them unmarried at the time of birth, while the lowest percentage of unmarried women with births belong to 35 to 50 years age bracket with 0.0% of them unmarried.
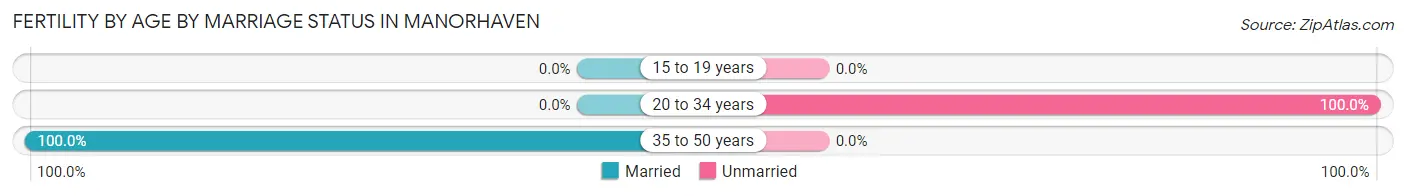
| Age Bracket | Married | Unmarried |
| 15 to 19 years | 0 (0.0%) | 0 (0.0%) |
| 20 to 34 years | 0 (0.0%) | 35 (100.0%) |
| 35 to 50 years | 79 (100.0%) | 0 (0.0%) |
| Total | 79 (69.3%) | 35 (30.7%) |
Fertility by Education in Manorhaven
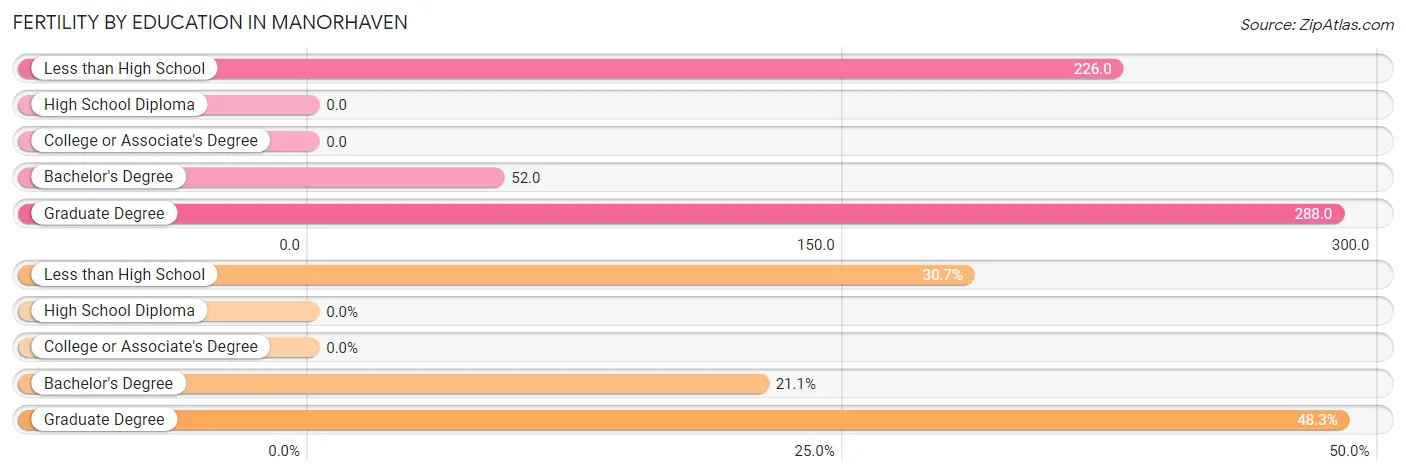
| Educational Attainment | Women with Births | Births / 1,000 Women |
| Less than High School | 35 (30.7%) | 226.0 |
| High School Diploma | 0 (0.0%) | 0.0 |
| College or Associate's Degree | 0 (0.0%) | 0.0 |
| Bachelor's Degree | 24 (21.0%) | 52.0 |
| Graduate Degree | 55 (48.2%) | 288.0 |
| Total | 114 (100.0%) | 74.0 |
Fertility by Education by Marriage Status in Manorhaven
30.7% of women with births in Manorhaven are unmarried. Women with the educational attainment of bachelor's degree are most likely to be married with 100.0% of them married at childbirth, while women with the educational attainment of less than high school are least likely to be married with 100.0% of them unmarried at childbirth.
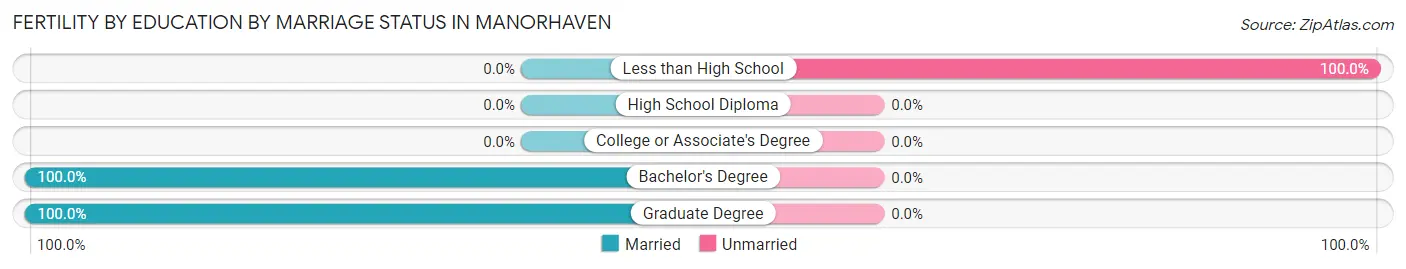
| Educational Attainment | Married | Unmarried |
| Less than High School | 0 (0.0%) | 35 (100.0%) |
| High School Diploma | 0 (0.0%) | 0 (0.0%) |
| College or Associate's Degree | 0 (0.0%) | 0 (0.0%) |
| Bachelor's Degree | 24 (100.0%) | 0 (0.0%) |
| Graduate Degree | 55 (100.0%) | 0 (0.0%) |
| Total | 79 (69.3%) | 35 (30.7%) |
Employment Characteristics in Manorhaven
Employment by Class of Employer in Manorhaven
Among the 3,571 employed individuals in Manorhaven, private company employees (2,376 | 66.5%), not-for-profit organizations (334 | 9.3%), and local government employees (234 | 6.6%) make up the most common classes of employment.
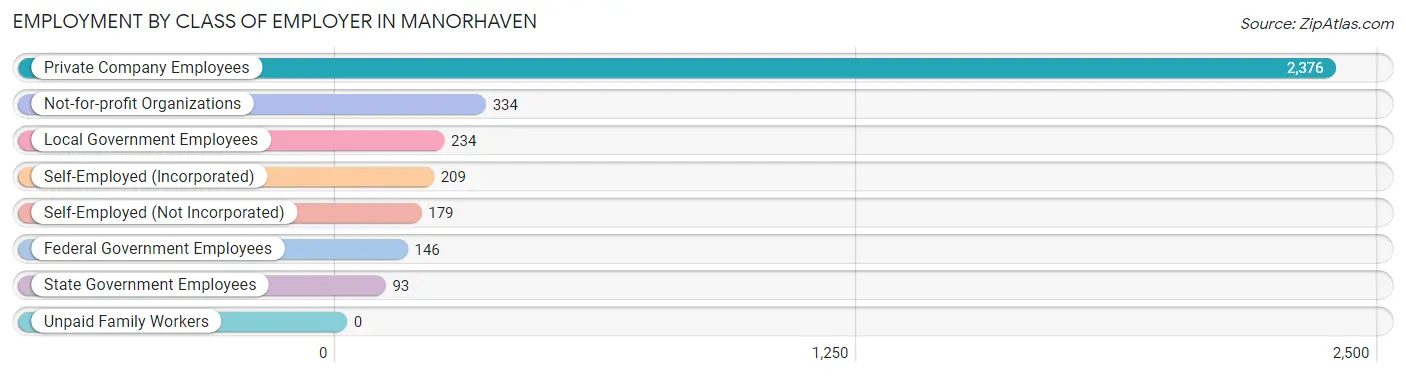
| Employer Class | # Employees | % Employees |
| Private Company Employees | 2,376 | 66.5% |
| Self-Employed (Incorporated) | 209 | 5.9% |
| Self-Employed (Not Incorporated) | 179 | 5.0% |
| Not-for-profit Organizations | 334 | 9.3% |
| Local Government Employees | 234 | 6.6% |
| State Government Employees | 93 | 2.6% |
| Federal Government Employees | 146 | 4.1% |
| Unpaid Family Workers | 0 | 0.0% |
| Total | 3,571 | 100.0% |
Employment Status by Age in Manorhaven
According to the labor force statistics for Manorhaven, out of the total population over 16 years of age (5,722), 65.5% or 3,748 individuals are in the labor force, with 3.3% or 124 of them unemployed. The age group with the highest labor force participation rate is 25 to 29 years, with 100.0% or 347 individuals in the labor force. Within the labor force, the 60 to 64 years age range has the highest percentage of unemployed individuals, with 12.0% or 29 of them being unemployed.
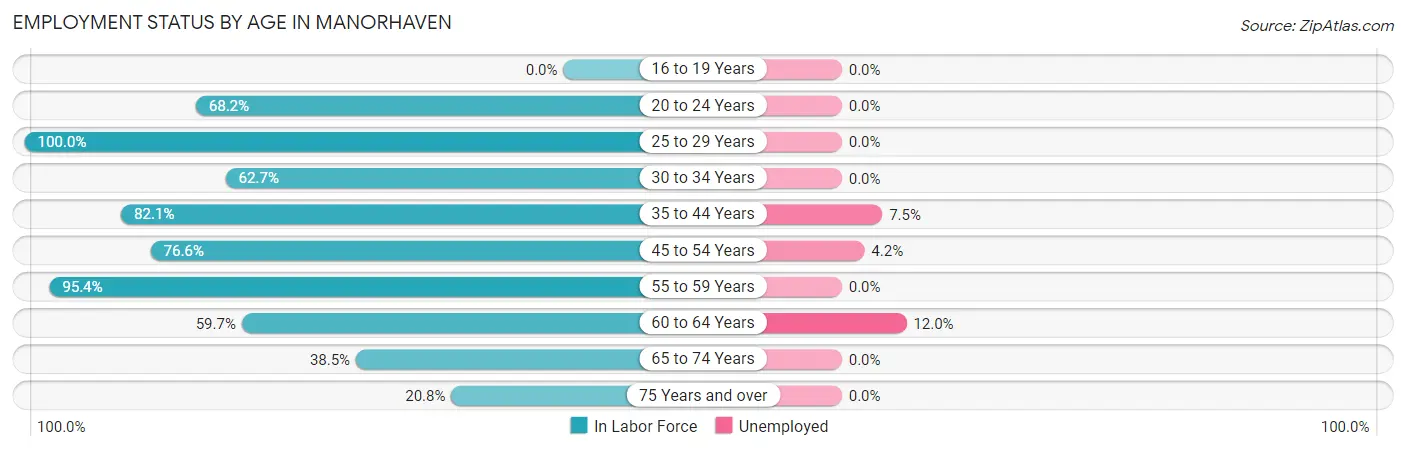
| Age Bracket | In Labor Force | Unemployed |
| 16 to 19 Years | 0 (0.0%) | 0 (0.0%) |
| 20 to 24 Years | 433 (68.2%) | 0 (0.0%) |
| 25 to 29 Years | 347 (100.0%) | 0 (0.0%) |
| 30 to 34 Years | 207 (62.7%) | 0 (0.0%) |
| 35 to 44 Years | 697 (82.1%) | 52 (7.5%) |
| 45 to 54 Years | 1,033 (76.6%) | 43 (4.2%) |
| 55 to 59 Years | 412 (95.4%) | 0 (0.0%) |
| 60 to 64 Years | 241 (59.7%) | 29 (12.0%) |
| 65 to 74 Years | 281 (38.5%) | 0 (0.0%) |
| 75 Years and over | 94 (20.8%) | 0 (0.0%) |
| Total | 3,748 (65.5%) | 124 (3.3%) |
Employment Status by Educational Attainment in Manorhaven
According to labor force statistics for Manorhaven, 79.2% of individuals (2,939) out of the total population between 25 and 64 years of age (3,711) are in the labor force, with 4.2% or 123 of them being unemployed. The group with the highest labor force participation rate are those with the educational attainment of bachelor's degree or higher, with 86.1% or 1,501 individuals in the labor force. Within the labor force, individuals with bachelor's degree or higher education have the highest percentage of unemployment, with 7.3% or 110 of them being unemployed.
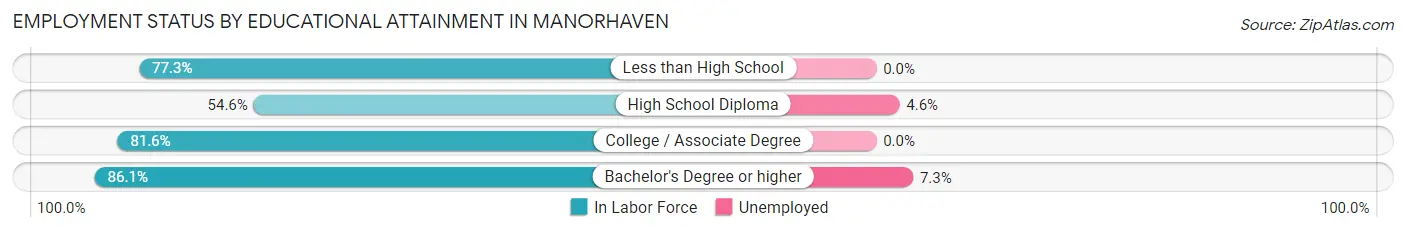
| Educational Attainment | In Labor Force | Unemployed |
| Less than High School | 133 (77.3%) | 0 (0.0%) |
| High School Diploma | 325 (54.6%) | 27 (4.6%) |
| College / Associate Degree | 980 (81.6%) | 0 (0.0%) |
| Bachelor's Degree or higher | 1,501 (86.1%) | 127 (7.3%) |
| Total | 2,939 (79.2%) | 156 (4.2%) |
Employment Occupations by Sex in Manorhaven
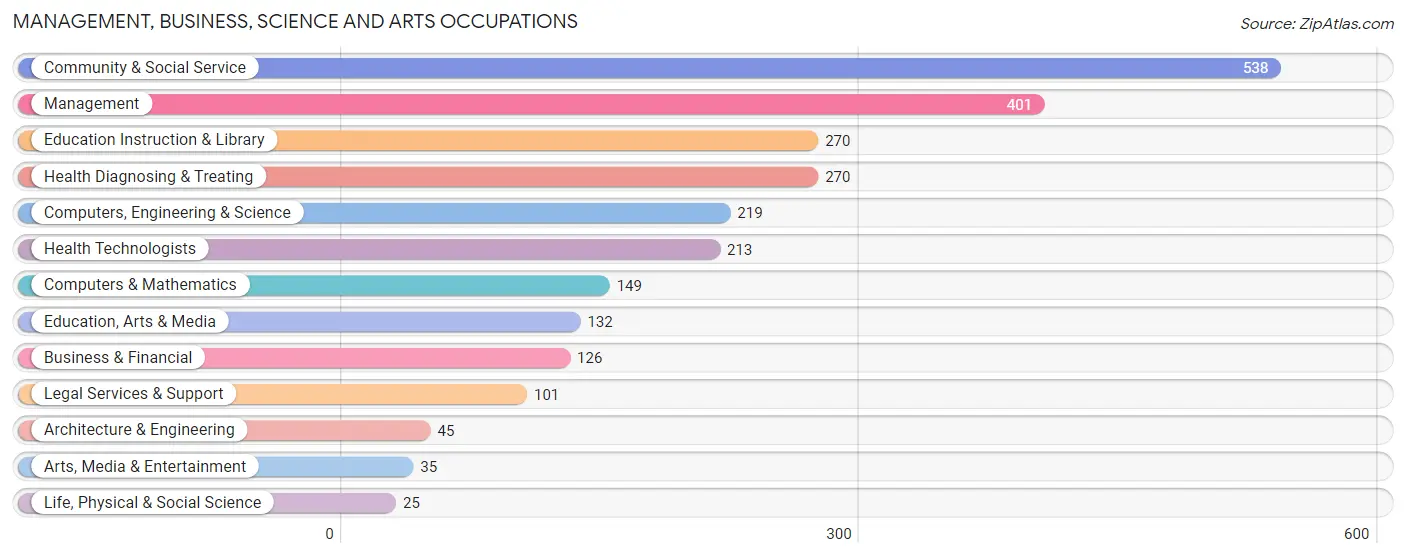
Management, Business, Science and Arts Occupations
The most common Management, Business, Science and Arts occupations in Manorhaven are Community & Social Service (538 | 14.8%), Management (401 | 11.1%), Education Instruction & Library (270 | 7.4%), Health Diagnosing & Treating (270 | 7.4%), and Computers, Engineering & Science (219 | 6.0%).
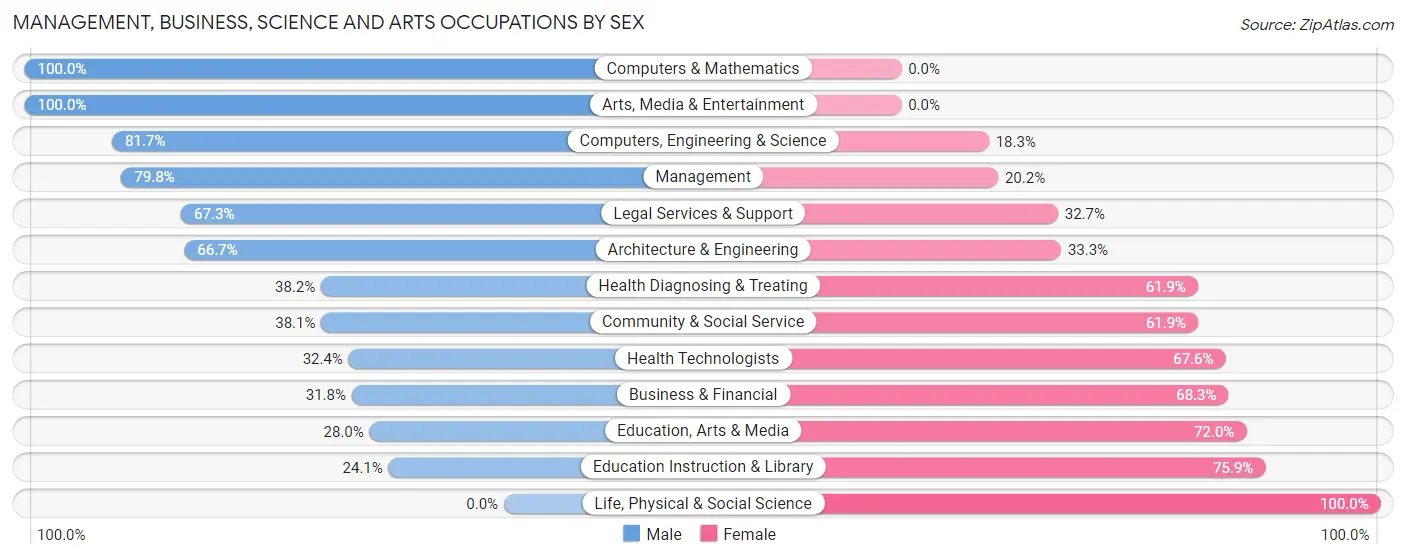
Management, Business, Science and Arts Occupations by Sex
Within the Management, Business, Science and Arts occupations in Manorhaven, the most male-oriented occupations are Computers & Mathematics (100.0%), Arts, Media & Entertainment (100.0%), and Computers, Engineering & Science (81.7%), while the most female-oriented occupations are Life, Physical & Social Science (100.0%), Education Instruction & Library (75.9%), and Education, Arts & Media (72.0%).
| Occupation | Male | Female |
| Management | 320 (79.8%) | 81 (20.2%) |
| Business & Financial | 40 (31.8%) | 86 (68.2%) |
| Computers, Engineering & Science | 179 (81.7%) | 40 (18.3%) |
| Computers & Mathematics | 149 (100.0%) | 0 (0.0%) |
| Architecture & Engineering | 30 (66.7%) | 15 (33.3%) |
| Life, Physical & Social Science | 0 (0.0%) | 25 (100.0%) |
| Community & Social Service | 205 (38.1%) | 333 (61.9%) |
| Education, Arts & Media | 37 (28.0%) | 95 (72.0%) |
| Legal Services & Support | 68 (67.3%) | 33 (32.7%) |
| Education Instruction & Library | 65 (24.1%) | 205 (75.9%) |
| Arts, Media & Entertainment | 35 (100.0%) | 0 (0.0%) |
| Health Diagnosing & Treating | 103 (38.2%) | 167 (61.9%) |
| Health Technologists | 69 (32.4%) | 144 (67.6%) |
| Total (Category) | 847 (54.5%) | 707 (45.5%) |
| Total (Overall) | 2,294 (63.3%) | 1,328 (36.7%) |
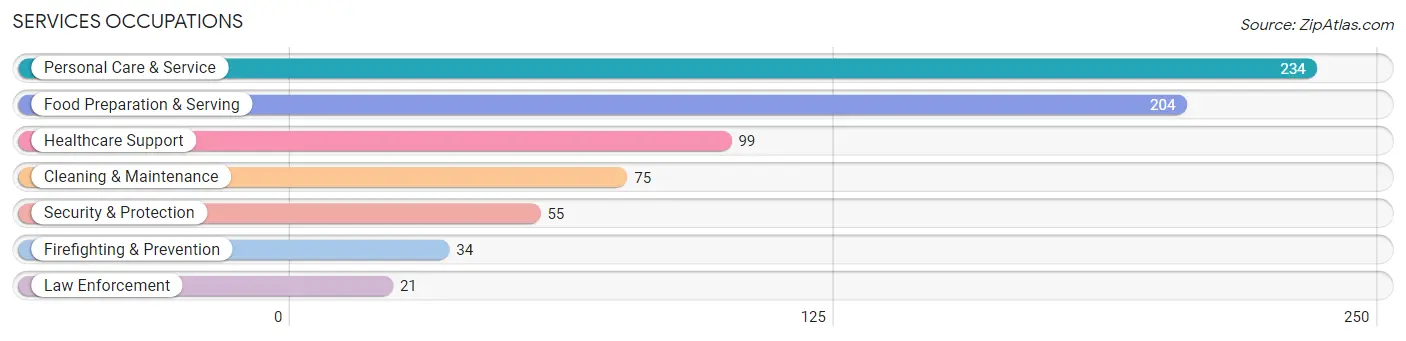
Services Occupations
The most common Services occupations in Manorhaven are Personal Care & Service (234 | 6.5%), Food Preparation & Serving (204 | 5.6%), Healthcare Support (99 | 2.7%), Cleaning & Maintenance (75 | 2.1%), and Security & Protection (55 | 1.5%).
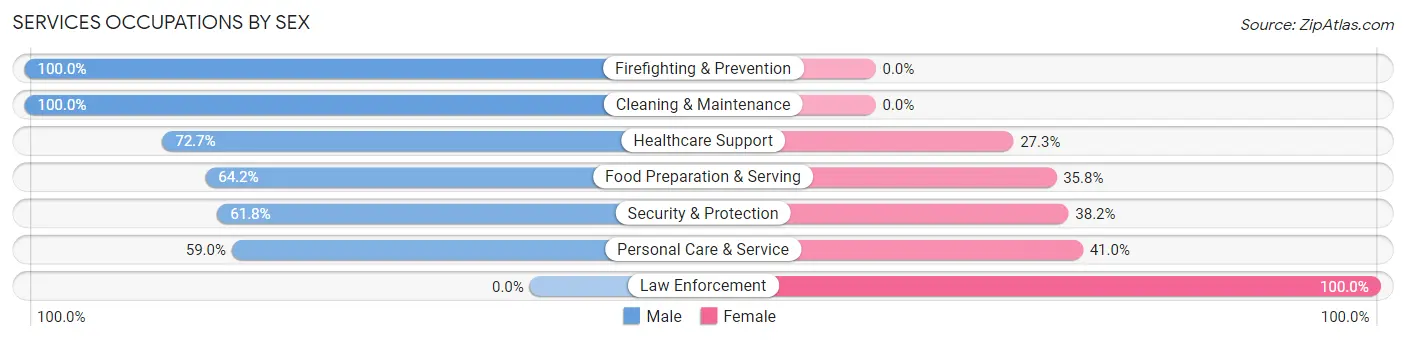
Services Occupations by Sex
Within the Services occupations in Manorhaven, the most male-oriented occupations are Firefighting & Prevention (100.0%), Cleaning & Maintenance (100.0%), and Healthcare Support (72.7%), while the most female-oriented occupations are Law Enforcement (100.0%), Personal Care & Service (41.0%), and Security & Protection (38.2%).
| Occupation | Male | Female |
| Healthcare Support | 72 (72.7%) | 27 (27.3%) |
| Security & Protection | 34 (61.8%) | 21 (38.2%) |
| Firefighting & Prevention | 34 (100.0%) | 0 (0.0%) |
| Law Enforcement | 0 (0.0%) | 21 (100.0%) |
| Food Preparation & Serving | 131 (64.2%) | 73 (35.8%) |
| Cleaning & Maintenance | 75 (100.0%) | 0 (0.0%) |
| Personal Care & Service | 138 (59.0%) | 96 (41.0%) |
| Total (Category) | 450 (67.5%) | 217 (32.5%) |
| Total (Overall) | 2,294 (63.3%) | 1,328 (36.7%) |
Sales and Office Occupations
The most common Sales and Office occupations in Manorhaven are Sales & Related (517 | 14.3%), and Office & Administration (253 | 7.0%).

Sales and Office Occupations by Sex
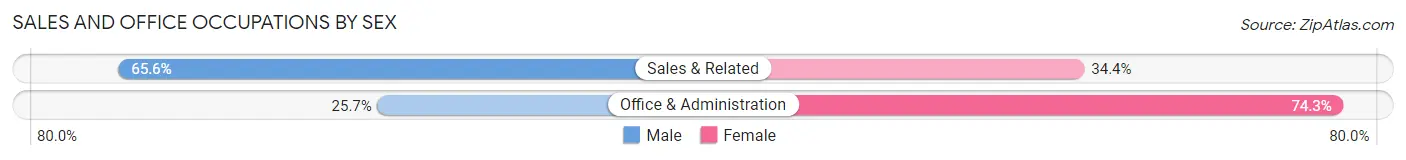
| Occupation | Male | Female |
| Sales & Related | 339 (65.6%) | 178 (34.4%) |
| Office & Administration | 65 (25.7%) | 188 (74.3%) |
| Total (Category) | 404 (52.5%) | 366 (47.5%) |
| Total (Overall) | 2,294 (63.3%) | 1,328 (36.7%) |
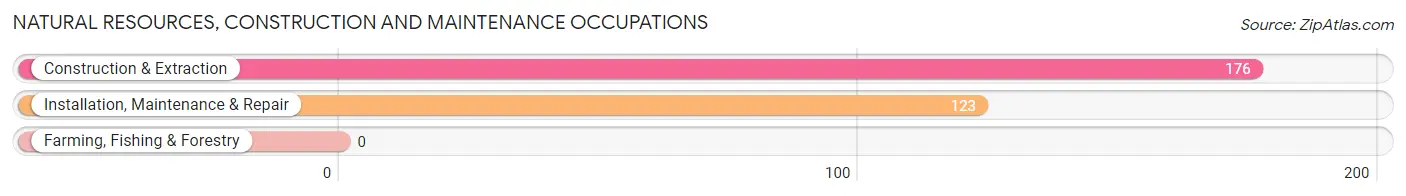
Natural Resources, Construction and Maintenance Occupations
The most common Natural Resources, Construction and Maintenance occupations in Manorhaven are Construction & Extraction (176 | 4.9%), and Installation, Maintenance & Repair (123 | 3.4%).
Natural Resources, Construction and Maintenance Occupations by Sex
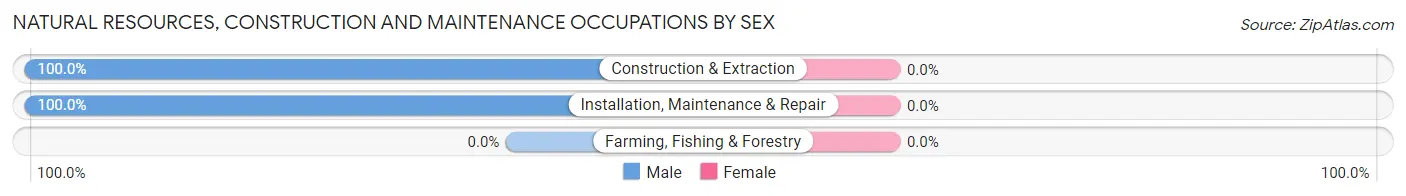
| Occupation | Male | Female |
| Farming, Fishing & Forestry | 0 (0.0%) | 0 (0.0%) |
| Construction & Extraction | 176 (100.0%) | 0 (0.0%) |
| Installation, Maintenance & Repair | 123 (100.0%) | 0 (0.0%) |
| Total (Category) | 299 (100.0%) | 0 (0.0%) |
| Total (Overall) | 2,294 (63.3%) | 1,328 (36.7%) |
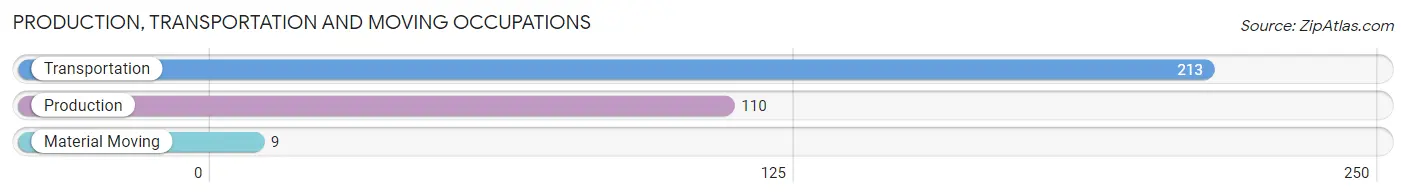
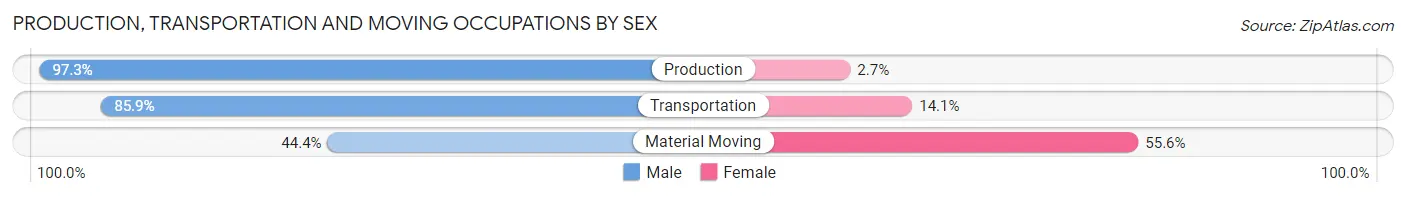
Production, Transportation and Moving Occupations
The most common Production, Transportation and Moving occupations in Manorhaven are Transportation (213 | 5.9%), Production (110 | 3.0%), and Material Moving (9 | 0.3%).
Production, Transportation and Moving Occupations by Sex
| Occupation | Male | Female |
| Production | 107 (97.3%) | 3 (2.7%) |
| Transportation | 183 (85.9%) | 30 (14.1%) |
| Material Moving | 4 (44.4%) | 5 (55.6%) |
| Total (Category) | 294 (88.5%) | 38 (11.5%) |
| Total (Overall) | 2,294 (63.3%) | 1,328 (36.7%) |
Employment Industries by Sex in Manorhaven
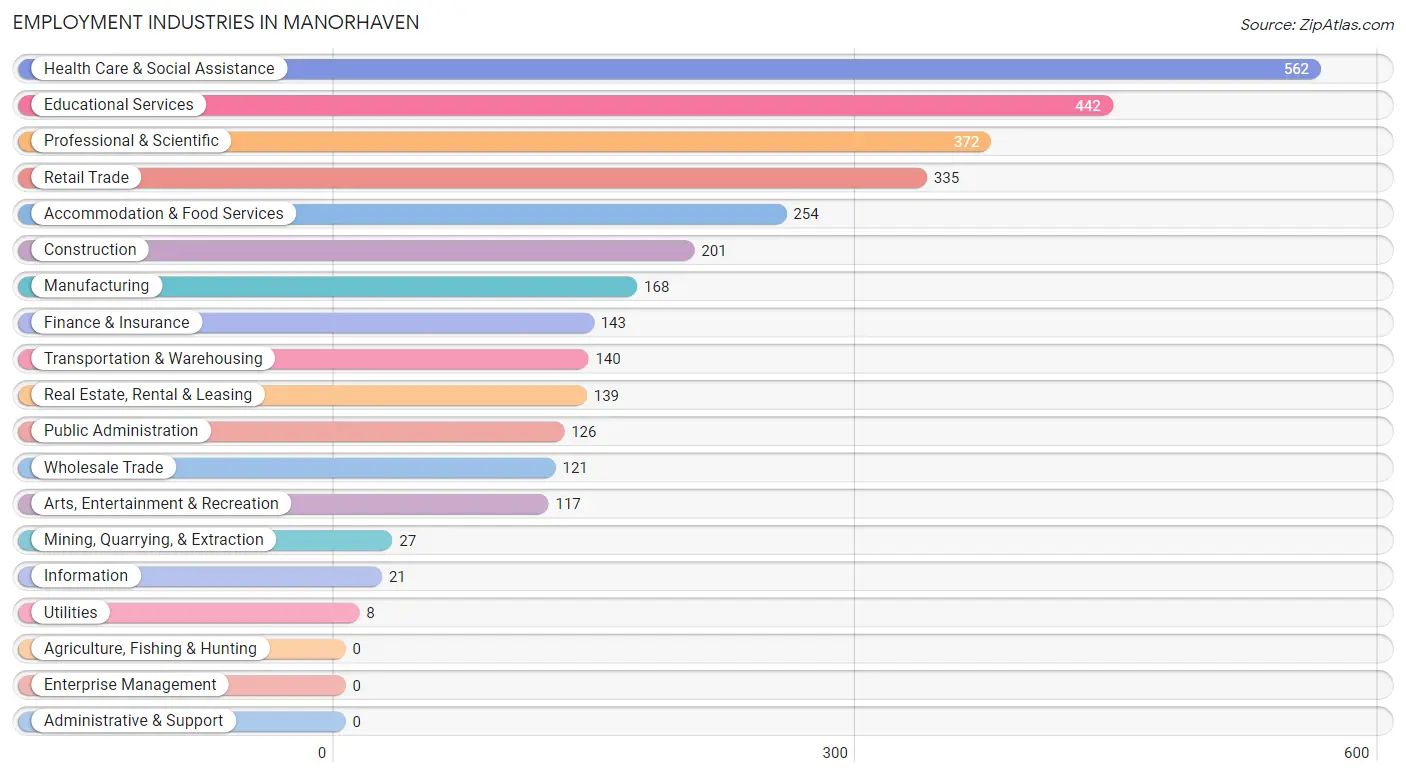
Employment Industries in Manorhaven
The major employment industries in Manorhaven include Health Care & Social Assistance (562 | 15.5%), Educational Services (442 | 12.2%), Professional & Scientific (372 | 10.3%), Retail Trade (335 | 9.2%), and Accommodation & Food Services (254 | 7.0%).
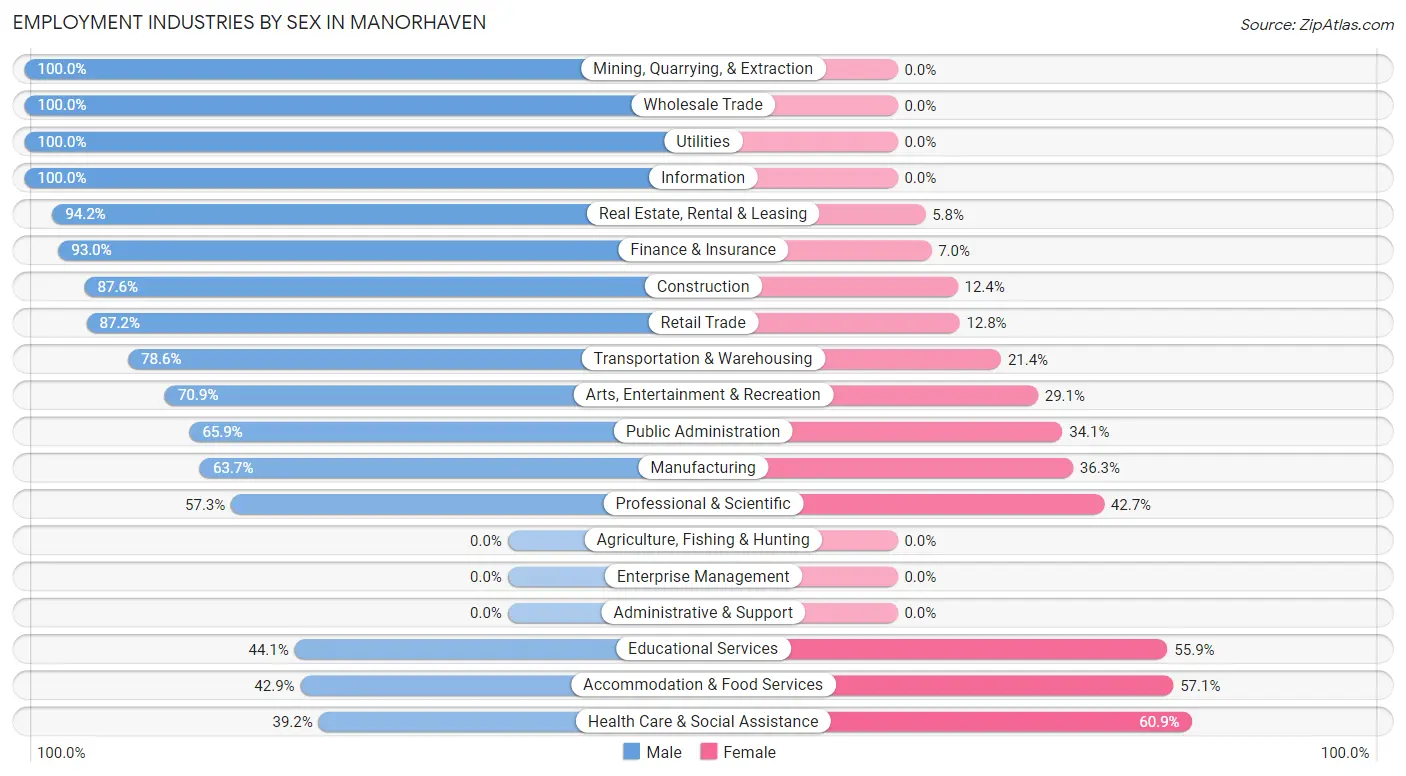
Employment Industries by Sex in Manorhaven
The Manorhaven industries that see more men than women are Mining, Quarrying, & Extraction (100.0%), Wholesale Trade (100.0%), and Utilities (100.0%), whereas the industries that tend to have a higher number of women are Health Care & Social Assistance (60.9%), Accommodation & Food Services (57.1%), and Educational Services (55.9%).
| Industry | Male | Female |
| Agriculture, Fishing & Hunting | 0 (0.0%) | 0 (0.0%) |
| Mining, Quarrying, & Extraction | 27 (100.0%) | 0 (0.0%) |
| Construction | 176 (87.6%) | 25 (12.4%) |
| Manufacturing | 107 (63.7%) | 61 (36.3%) |
| Wholesale Trade | 121 (100.0%) | 0 (0.0%) |
| Retail Trade | 292 (87.2%) | 43 (12.8%) |
| Transportation & Warehousing | 110 (78.6%) | 30 (21.4%) |
| Utilities | 8 (100.0%) | 0 (0.0%) |
| Information | 21 (100.0%) | 0 (0.0%) |
| Finance & Insurance | 133 (93.0%) | 10 (7.0%) |
| Real Estate, Rental & Leasing | 131 (94.2%) | 8 (5.8%) |
| Professional & Scientific | 213 (57.3%) | 159 (42.7%) |
| Enterprise Management | 0 (0.0%) | 0 (0.0%) |
| Administrative & Support | 0 (0.0%) | 0 (0.0%) |
| Educational Services | 195 (44.1%) | 247 (55.9%) |
| Health Care & Social Assistance | 220 (39.2%) | 342 (60.9%) |
| Arts, Entertainment & Recreation | 83 (70.9%) | 34 (29.1%) |
| Accommodation & Food Services | 109 (42.9%) | 145 (57.1%) |
| Public Administration | 83 (65.9%) | 43 (34.1%) |
| Total | 2,294 (63.3%) | 1,328 (36.7%) |
Education in Manorhaven
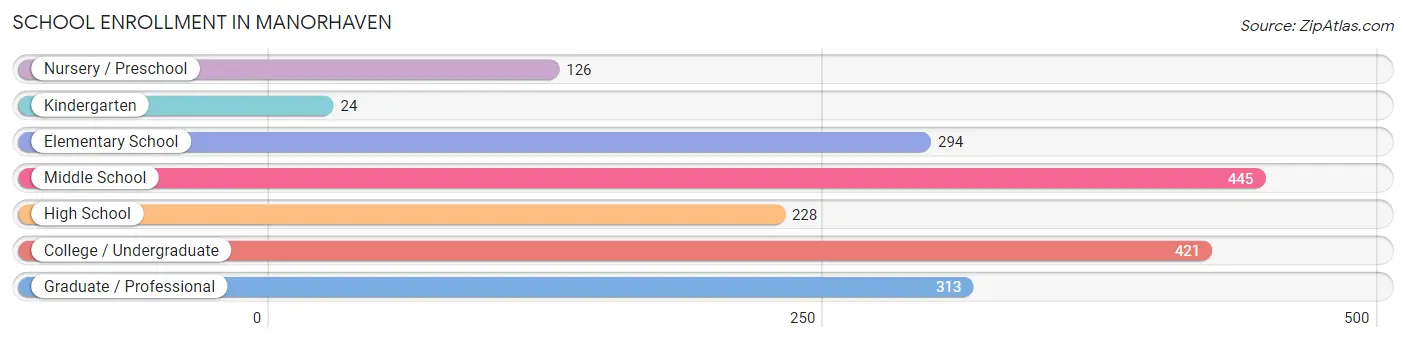
School Enrollment in Manorhaven
The most common levels of schooling among the 1,851 students in Manorhaven are middle school (445 | 24.0%), college / undergraduate (421 | 22.7%), and graduate / professional (313 | 16.9%).
| School Level | # Students | % Students |
| Nursery / Preschool | 126 | 6.8% |
| Kindergarten | 24 | 1.3% |
| Elementary School | 294 | 15.9% |
| Middle School | 445 | 24.0% |
| High School | 228 | 12.3% |
| College / Undergraduate | 421 | 22.7% |
| Graduate / Professional | 313 | 16.9% |
| Total | 1,851 | 100.0% |
School Enrollment by Age by Funding Source in Manorhaven
Out of a total of 1,851 students who are enrolled in schools in Manorhaven, 500 (27.0%) attend a private institution, while the remaining 1,351 (73.0%) are enrolled in public schools. The age group of 25 to 34 year olds has the highest likelihood of being enrolled in private schools, with 56 (98.3% in the age bracket) enrolled. Conversely, the age group of 10 to 14 year olds has the lowest likelihood of being enrolled in a private school, with 481 (100.0% in the age bracket) attending a public institution.
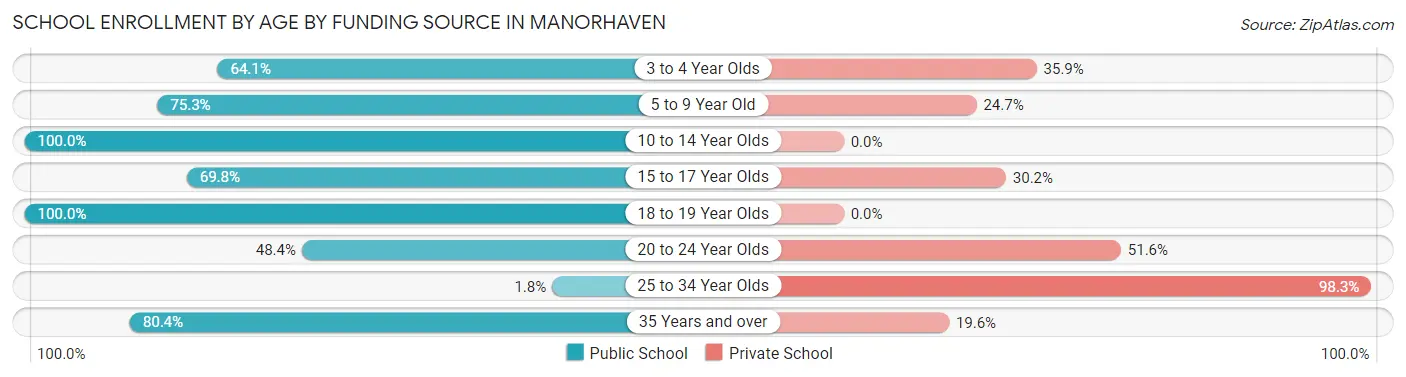
| Age Bracket | Public School | Private School |
| 3 to 4 Year Olds | 41 (64.1%) | 23 (35.9%) |
| 5 to 9 Year Old | 286 (75.3%) | 94 (24.7%) |
| 10 to 14 Year Olds | 481 (100.0%) | 0 (0.0%) |
| 15 to 17 Year Olds | 134 (69.8%) | 58 (30.2%) |
| 18 to 19 Year Olds | 63 (100.0%) | 0 (0.0%) |
| 20 to 24 Year Olds | 223 (48.4%) | 238 (51.6%) |
| 25 to 34 Year Olds | 1 (1.8%) | 56 (98.3%) |
| 35 Years and over | 123 (80.4%) | 30 (19.6%) |
| Total | 1,351 (73.0%) | 500 (27.0%) |
Educational Attainment by Field of Study in Manorhaven
Business (415 | 15.5%), science & technology (355 | 13.3%), engineering (287 | 10.8%), education (236 | 8.8%), and psychology (221 | 8.3%) are the most common fields of study among 2,668 individuals in Manorhaven who have obtained a bachelor's degree or higher.
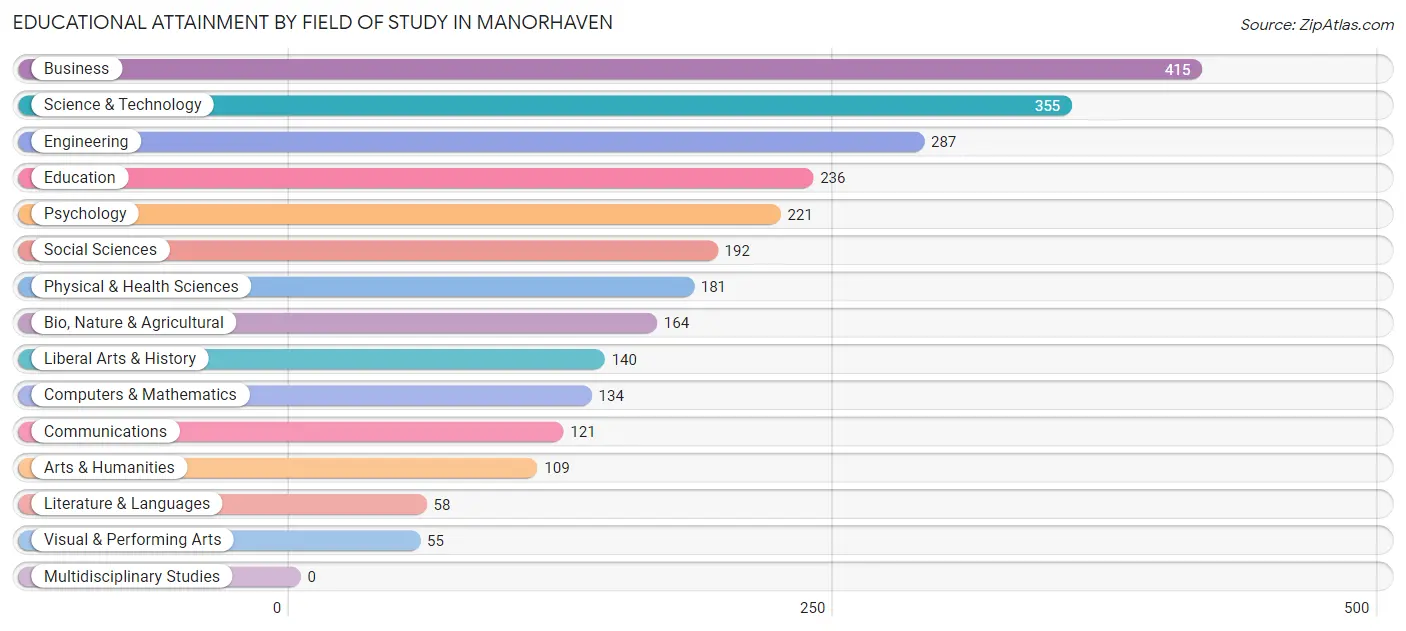
| Field of Study | # Graduates | % Graduates |
| Computers & Mathematics | 134 | 5.0% |
| Bio, Nature & Agricultural | 164 | 6.1% |
| Physical & Health Sciences | 181 | 6.8% |
| Psychology | 221 | 8.3% |
| Social Sciences | 192 | 7.2% |
| Engineering | 287 | 10.8% |
| Multidisciplinary Studies | 0 | 0.0% |
| Science & Technology | 355 | 13.3% |
| Business | 415 | 15.5% |
| Education | 236 | 8.8% |
| Literature & Languages | 58 | 2.2% |
| Liberal Arts & History | 140 | 5.2% |
| Visual & Performing Arts | 55 | 2.1% |
| Communications | 121 | 4.5% |
| Arts & Humanities | 109 | 4.1% |
| Total | 2,668 | 100.0% |
Transportation & Commute in Manorhaven
Vehicle Availability by Sex in Manorhaven
The most prevalent vehicle ownership categories in Manorhaven are males with 2 vehicles (919, accounting for 40.6%) and females with 2 vehicles (493, making up 70.8%).
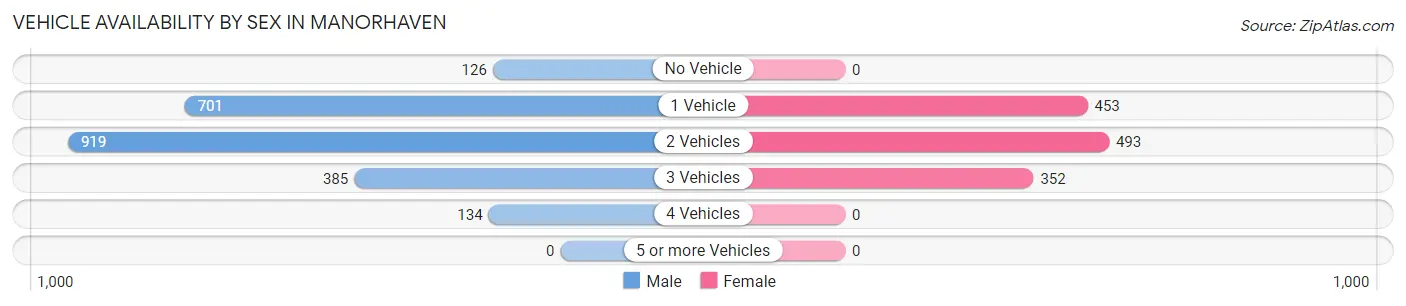
| Vehicles Available | Male | Female |
| No Vehicle | 126 (5.6%) | 0 (0.0%) |
| 1 Vehicle | 701 (30.9%) | 453 (34.9%) |
| 2 Vehicles | 919 (40.6%) | 493 (38.0%) |
| 3 Vehicles | 385 (17.0%) | 352 (27.1%) |
| 4 Vehicles | 134 (5.9%) | 0 (0.0%) |
| 5 or more Vehicles | 0 (0.0%) | 0 (0.0%) |
| Total | 2,265 (100.0%) | 1,298 (100.0%) |
Commute Time in Manorhaven
The most frequently occuring commute durations in Manorhaven are 10 to 14 minutes (506 commuters, 15.6%), 60 to 89 minutes (442 commuters, 13.6%), and 40 to 44 minutes (420 commuters, 12.9%).
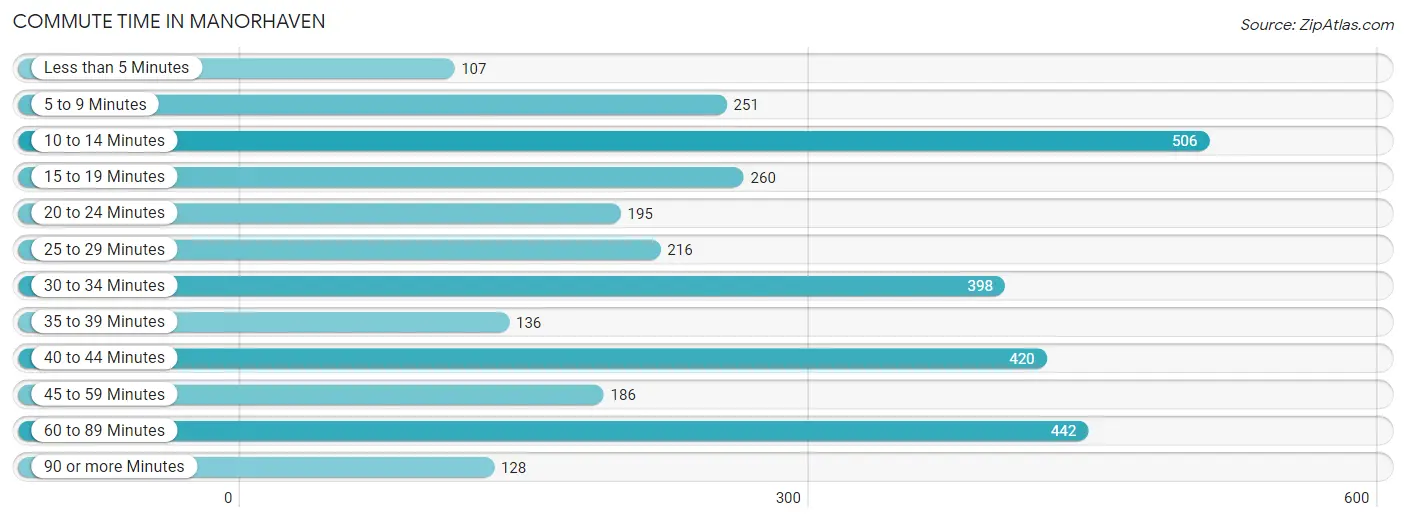
| Commute Time | # Commuters | % Commuters |
| Less than 5 Minutes | 107 | 3.3% |
| 5 to 9 Minutes | 251 | 7.7% |
| 10 to 14 Minutes | 506 | 15.6% |
| 15 to 19 Minutes | 260 | 8.0% |
| 20 to 24 Minutes | 195 | 6.0% |
| 25 to 29 Minutes | 216 | 6.7% |
| 30 to 34 Minutes | 398 | 12.3% |
| 35 to 39 Minutes | 136 | 4.2% |
| 40 to 44 Minutes | 420 | 12.9% |
| 45 to 59 Minutes | 186 | 5.7% |
| 60 to 89 Minutes | 442 | 13.6% |
| 90 or more Minutes | 128 | 3.9% |
Commute Time by Sex in Manorhaven
The most common commute times in Manorhaven are 10 to 14 minutes (383 commuters, 18.8%) for males and 30 to 34 minutes (206 commuters, 17.1%) for females.
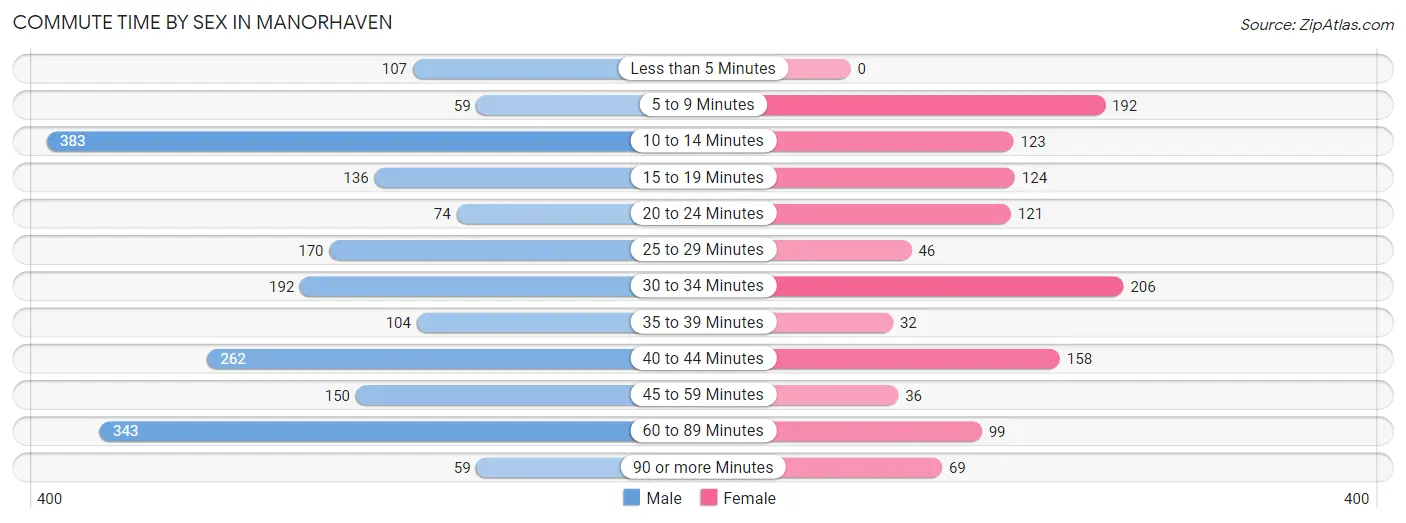
| Commute Time | Male | Female |
| Less than 5 Minutes | 107 (5.2%) | 0 (0.0%) |
| 5 to 9 Minutes | 59 (2.9%) | 192 (15.9%) |
| 10 to 14 Minutes | 383 (18.8%) | 123 (10.2%) |
| 15 to 19 Minutes | 136 (6.7%) | 124 (10.3%) |
| 20 to 24 Minutes | 74 (3.6%) | 121 (10.0%) |
| 25 to 29 Minutes | 170 (8.3%) | 46 (3.8%) |
| 30 to 34 Minutes | 192 (9.4%) | 206 (17.1%) |
| 35 to 39 Minutes | 104 (5.1%) | 32 (2.6%) |
| 40 to 44 Minutes | 262 (12.9%) | 158 (13.1%) |
| 45 to 59 Minutes | 150 (7.4%) | 36 (3.0%) |
| 60 to 89 Minutes | 343 (16.8%) | 99 (8.2%) |
| 90 or more Minutes | 59 (2.9%) | 69 (5.7%) |
Time of Departure to Work by Sex in Manorhaven
The most frequent times of departure to work in Manorhaven are 7:00 AM to 7:29 AM (355, 17.4%) for males and 7:30 AM to 7:59 AM (340, 28.2%) for females.
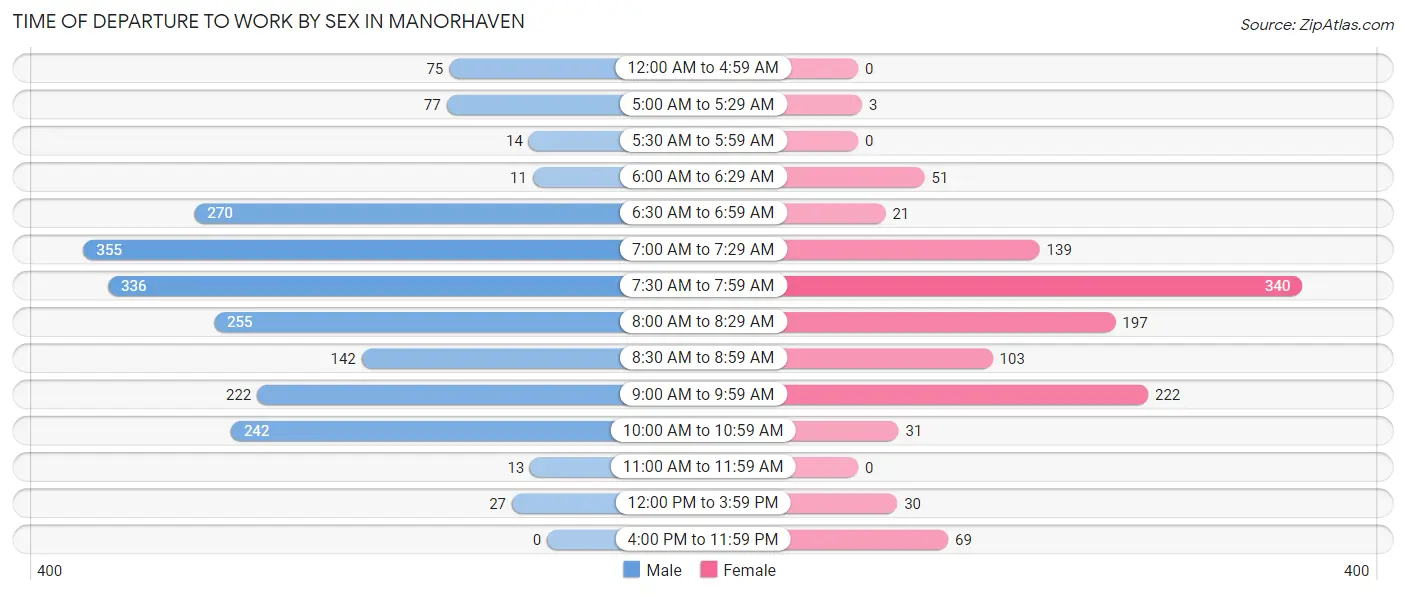
| Time of Departure | Male | Female |
| 12:00 AM to 4:59 AM | 75 (3.7%) | 0 (0.0%) |
| 5:00 AM to 5:29 AM | 77 (3.8%) | 3 (0.3%) |
| 5:30 AM to 5:59 AM | 14 (0.7%) | 0 (0.0%) |
| 6:00 AM to 6:29 AM | 11 (0.5%) | 51 (4.2%) |
| 6:30 AM to 6:59 AM | 270 (13.2%) | 21 (1.7%) |
| 7:00 AM to 7:29 AM | 355 (17.4%) | 139 (11.5%) |
| 7:30 AM to 7:59 AM | 336 (16.5%) | 340 (28.2%) |
| 8:00 AM to 8:29 AM | 255 (12.5%) | 197 (16.3%) |
| 8:30 AM to 8:59 AM | 142 (7.0%) | 103 (8.5%) |
| 9:00 AM to 9:59 AM | 222 (10.9%) | 222 (18.4%) |
| 10:00 AM to 10:59 AM | 242 (11.9%) | 31 (2.6%) |
| 11:00 AM to 11:59 AM | 13 (0.6%) | 0 (0.0%) |
| 12:00 PM to 3:59 PM | 27 (1.3%) | 30 (2.5%) |
| 4:00 PM to 11:59 PM | 0 (0.0%) | 69 (5.7%) |
| Total | 2,039 (100.0%) | 1,206 (100.0%) |
Housing Occupancy in Manorhaven
Occupancy by Ownership in Manorhaven
Of the total 2,708 dwellings in Manorhaven, owner-occupied units account for 1,084 (40.0%), while renter-occupied units make up 1,624 (60.0%).
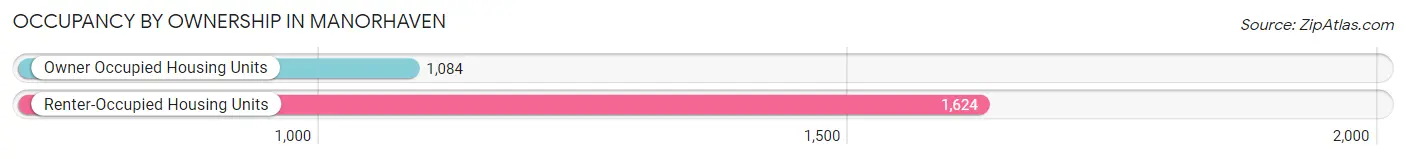
| Occupancy | # Housing Units | % Housing Units |
| Owner Occupied Housing Units | 1,084 | 40.0% |
| Renter-Occupied Housing Units | 1,624 | 60.0% |
| Total Occupied Housing Units | 2,708 | 100.0% |
Occupancy by Household Size in Manorhaven
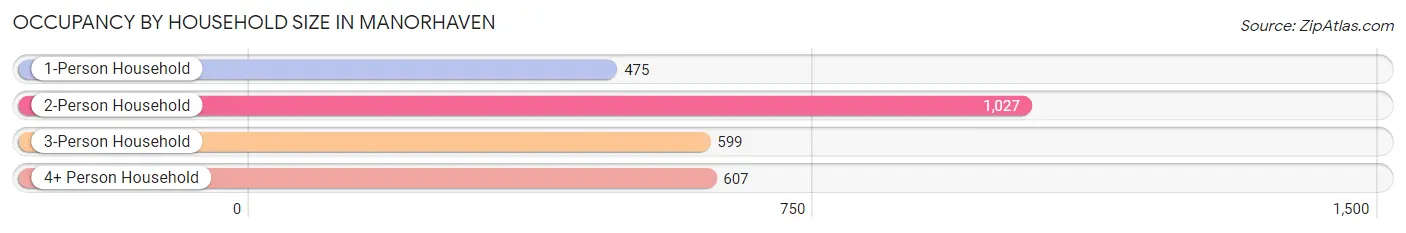
| Household Size | # Housing Units | % Housing Units |
| 1-Person Household | 475 | 17.5% |
| 2-Person Household | 1,027 | 37.9% |
| 3-Person Household | 599 | 22.1% |
| 4+ Person Household | 607 | 22.4% |
| Total Housing Units | 2,708 | 100.0% |
Occupancy by Ownership by Household Size in Manorhaven
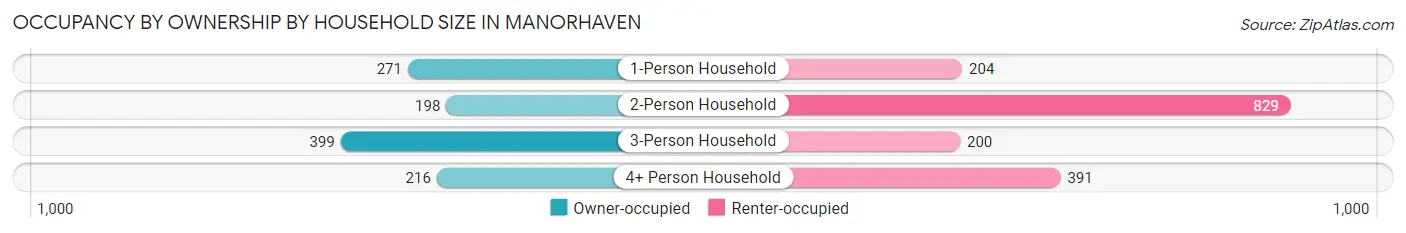
| Household Size | Owner-occupied | Renter-occupied |
| 1-Person Household | 271 (57.1%) | 204 (42.9%) |
| 2-Person Household | 198 (19.3%) | 829 (80.7%) |
| 3-Person Household | 399 (66.6%) | 200 (33.4%) |
| 4+ Person Household | 216 (35.6%) | 391 (64.4%) |
| Total Housing Units | 1,084 (40.0%) | 1,624 (60.0%) |
Occupancy by Educational Attainment in Manorhaven
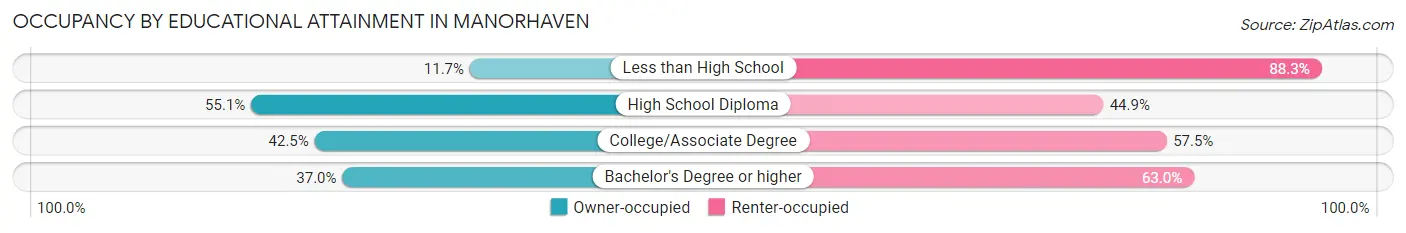
| Household Size | Owner-occupied | Renter-occupied |
| Less than High School | 17 (11.7%) | 128 (88.3%) |
| High School Diploma | 206 (55.1%) | 168 (44.9%) |
| College/Associate Degree | 394 (42.5%) | 533 (57.5%) |
| Bachelor's Degree or higher | 467 (37.0%) | 795 (63.0%) |
Occupancy by Age of Householder in Manorhaven
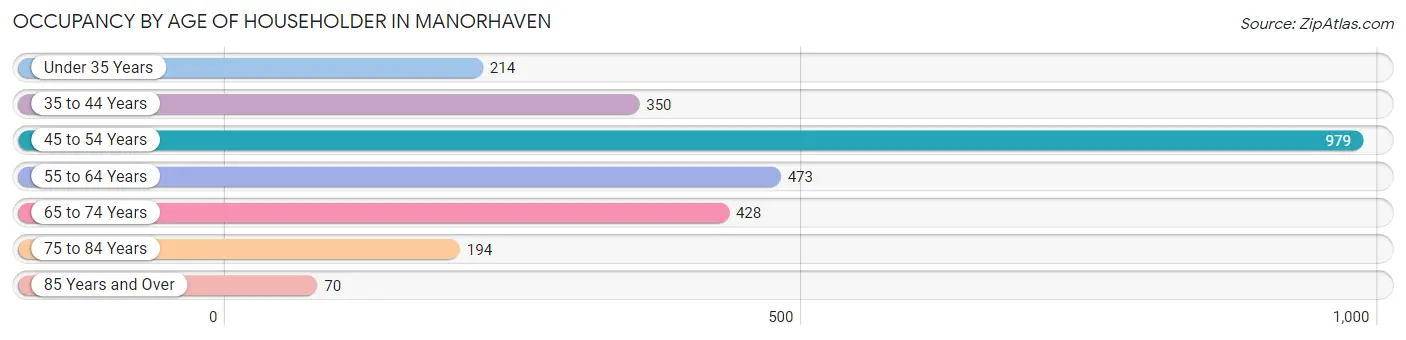
| Age Bracket | # Households | % Households |
| Under 35 Years | 214 | 7.9% |
| 35 to 44 Years | 350 | 12.9% |
| 45 to 54 Years | 979 | 36.1% |
| 55 to 64 Years | 473 | 17.5% |
| 65 to 74 Years | 428 | 15.8% |
| 75 to 84 Years | 194 | 7.2% |
| 85 Years and Over | 70 | 2.6% |
| Total | 2,708 | 100.0% |
Housing Finances in Manorhaven
Median Income by Occupancy in Manorhaven
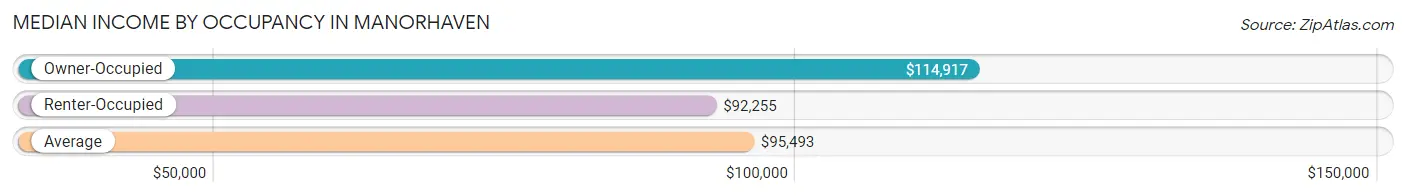
| Occupancy Type | # Households | Median Income |
| Owner-Occupied | 1,084 (40.0%) | $114,917 |
| Renter-Occupied | 1,624 (60.0%) | $92,255 |
| Average | 2,708 (100.0%) | $95,493 |
Occupancy by Householder Income Bracket in Manorhaven
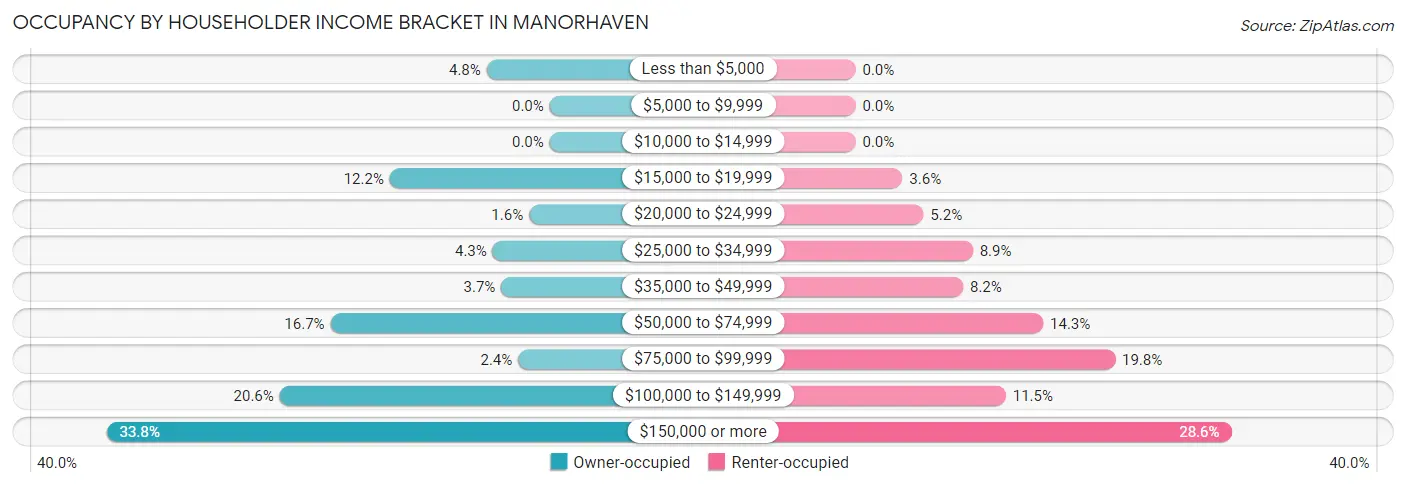
| Income Bracket | Owner-occupied | Renter-occupied |
| Less than $5,000 | 52 (4.8%) | 0 (0.0%) |
| $5,000 to $9,999 | 0 (0.0%) | 0 (0.0%) |
| $10,000 to $14,999 | 0 (0.0%) | 0 (0.0%) |
| $15,000 to $19,999 | 132 (12.2%) | 58 (3.6%) |
| $20,000 to $24,999 | 17 (1.6%) | 84 (5.2%) |
| $25,000 to $34,999 | 47 (4.3%) | 145 (8.9%) |
| $35,000 to $49,999 | 40 (3.7%) | 133 (8.2%) |
| $50,000 to $74,999 | 181 (16.7%) | 232 (14.3%) |
| $75,000 to $99,999 | 26 (2.4%) | 321 (19.8%) |
| $100,000 to $149,999 | 223 (20.6%) | 186 (11.5%) |
| $150,000 or more | 366 (33.8%) | 465 (28.6%) |
| Total | 1,084 (100.0%) | 1,624 (100.0%) |
Monthly Housing Cost Tiers in Manorhaven
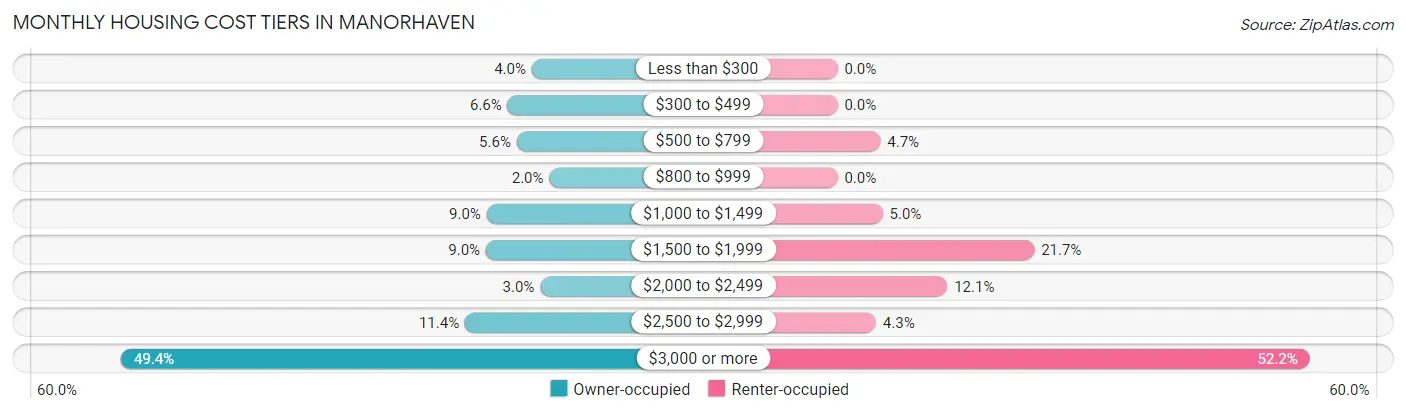
| Monthly Cost | Owner-occupied | Renter-occupied |
| Less than $300 | 43 (4.0%) | 0 (0.0%) |
| $300 to $499 | 72 (6.6%) | 0 (0.0%) |
| $500 to $799 | 61 (5.6%) | 77 (4.7%) |
| $800 to $999 | 22 (2.0%) | 0 (0.0%) |
| $1,000 to $1,499 | 97 (8.9%) | 81 (5.0%) |
| $1,500 to $1,999 | 98 (9.0%) | 353 (21.7%) |
| $2,000 to $2,499 | 33 (3.0%) | 197 (12.1%) |
| $2,500 to $2,999 | 123 (11.4%) | 69 (4.3%) |
| $3,000 or more | 535 (49.3%) | 847 (52.2%) |
| Total | 1,084 (100.0%) | 1,624 (100.0%) |
Physical Housing Characteristics in Manorhaven
Housing Structures in Manorhaven
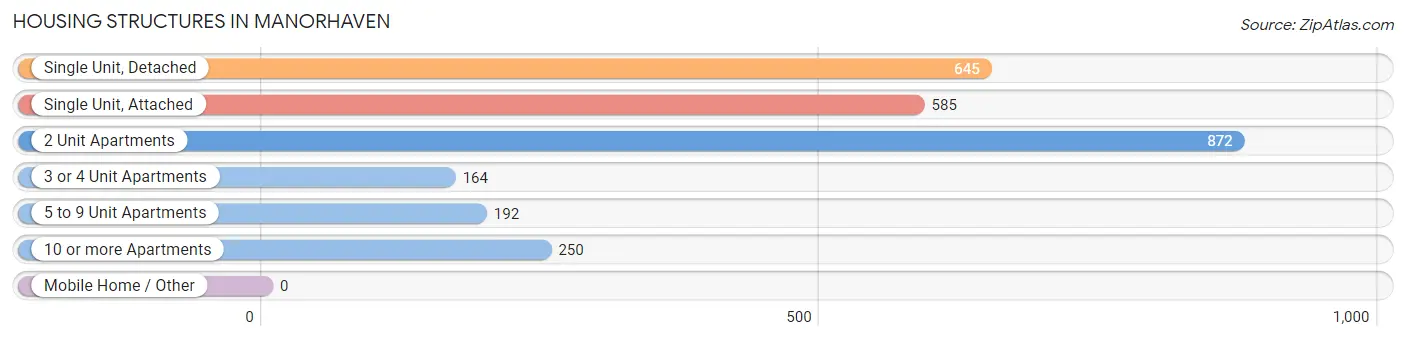
| Structure Type | # Housing Units | % Housing Units |
| Single Unit, Detached | 645 | 23.8% |
| Single Unit, Attached | 585 | 21.6% |
| 2 Unit Apartments | 872 | 32.2% |
| 3 or 4 Unit Apartments | 164 | 6.1% |
| 5 to 9 Unit Apartments | 192 | 7.1% |
| 10 or more Apartments | 250 | 9.2% |
| Mobile Home / Other | 0 | 0.0% |
| Total | 2,708 | 100.0% |
Housing Structures by Occupancy in Manorhaven
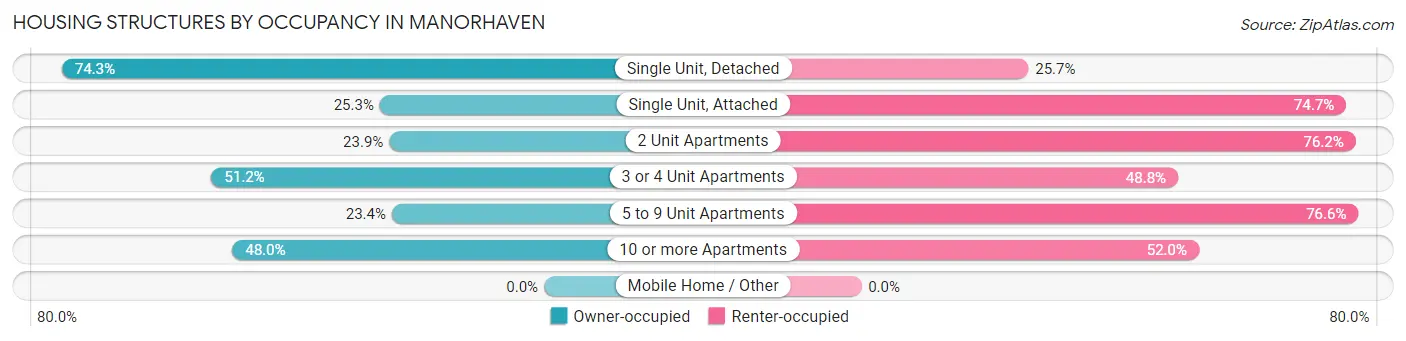
| Structure Type | Owner-occupied | Renter-occupied |
| Single Unit, Detached | 479 (74.3%) | 166 (25.7%) |
| Single Unit, Attached | 148 (25.3%) | 437 (74.7%) |
| 2 Unit Apartments | 208 (23.8%) | 664 (76.1%) |
| 3 or 4 Unit Apartments | 84 (51.2%) | 80 (48.8%) |
| 5 to 9 Unit Apartments | 45 (23.4%) | 147 (76.6%) |
| 10 or more Apartments | 120 (48.0%) | 130 (52.0%) |
| Mobile Home / Other | 0 (0.0%) | 0 (0.0%) |
| Total | 1,084 (40.0%) | 1,624 (60.0%) |
Housing Structures by Number of Rooms in Manorhaven
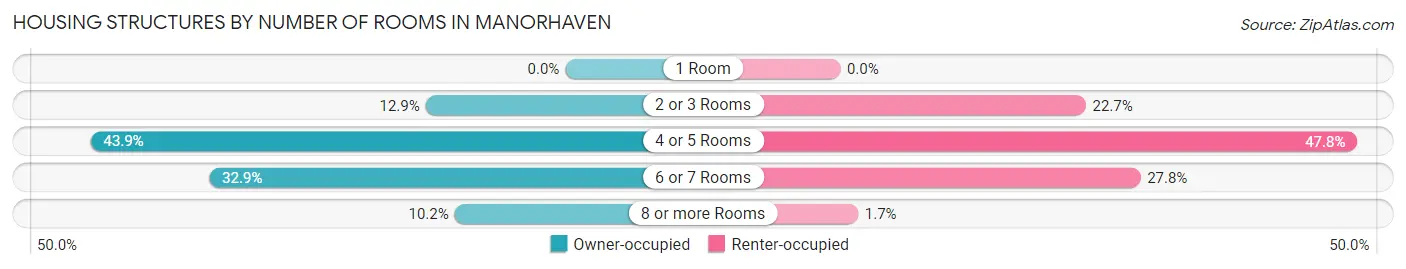
| Number of Rooms | Owner-occupied | Renter-occupied |
| 1 Room | 0 (0.0%) | 0 (0.0%) |
| 2 or 3 Rooms | 140 (12.9%) | 369 (22.7%) |
| 4 or 5 Rooms | 476 (43.9%) | 777 (47.8%) |
| 6 or 7 Rooms | 357 (32.9%) | 451 (27.8%) |
| 8 or more Rooms | 111 (10.2%) | 27 (1.7%) |
| Total | 1,084 (100.0%) | 1,624 (100.0%) |
Housing Structure by Heating Type in Manorhaven
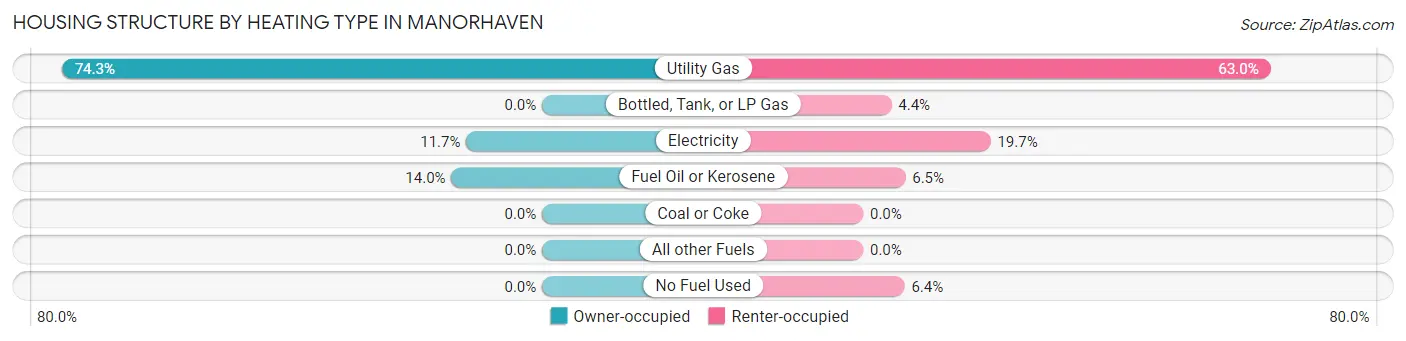
| Heating Type | Owner-occupied | Renter-occupied |
| Utility Gas | 805 (74.3%) | 1,023 (63.0%) |
| Bottled, Tank, or LP Gas | 0 (0.0%) | 71 (4.4%) |
| Electricity | 127 (11.7%) | 320 (19.7%) |
| Fuel Oil or Kerosene | 152 (14.0%) | 106 (6.5%) |
| Coal or Coke | 0 (0.0%) | 0 (0.0%) |
| All other Fuels | 0 (0.0%) | 0 (0.0%) |
| No Fuel Used | 0 (0.0%) | 104 (6.4%) |
| Total | 1,084 (100.0%) | 1,624 (100.0%) |
Household Vehicle Usage in Manorhaven
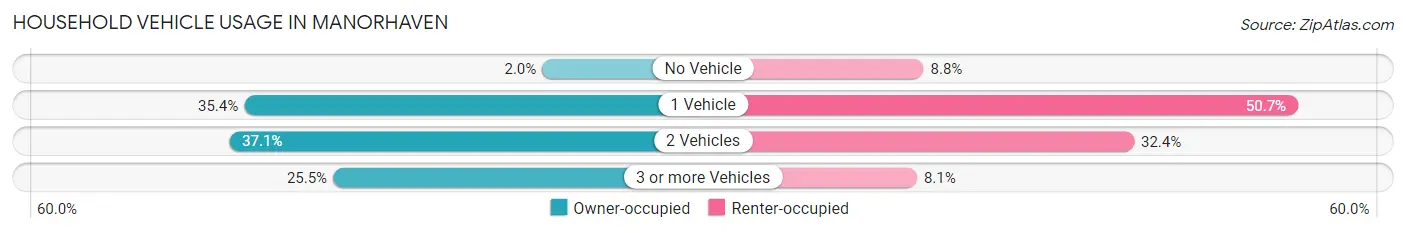
| Vehicles per Household | Owner-occupied | Renter-occupied |
| No Vehicle | 22 (2.0%) | 143 (8.8%) |
| 1 Vehicle | 384 (35.4%) | 824 (50.7%) |
| 2 Vehicles | 402 (37.1%) | 526 (32.4%) |
| 3 or more Vehicles | 276 (25.5%) | 131 (8.1%) |
| Total | 1,084 (100.0%) | 1,624 (100.0%) |
Real Estate & Mortgages in Manorhaven
Real Estate and Mortgage Overview in Manorhaven
| Characteristic | Without Mortgage | With Mortgage |
| Housing Units | 428 | 656 |
| Median Property Value | $555,100 | $685,700 |
| Median Household Income | $101,944 | $263 |
| Monthly Housing Costs | $1,162 | $512 |
| Real Estate Taxes | $8,641 | $22 |
Property Value by Mortgage Status in Manorhaven
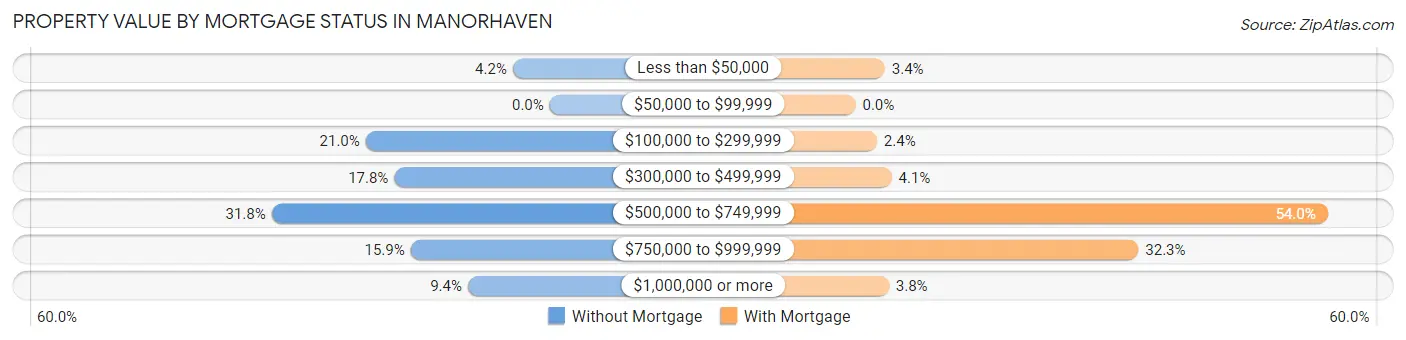
| Property Value | Without Mortgage | With Mortgage |
| Less than $50,000 | 18 (4.2%) | 22 (3.4%) |
| $50,000 to $99,999 | 0 (0.0%) | 0 (0.0%) |
| $100,000 to $299,999 | 90 (21.0%) | 16 (2.4%) |
| $300,000 to $499,999 | 76 (17.8%) | 27 (4.1%) |
| $500,000 to $749,999 | 136 (31.8%) | 354 (54.0%) |
| $750,000 to $999,999 | 68 (15.9%) | 212 (32.3%) |
| $1,000,000 or more | 40 (9.3%) | 25 (3.8%) |
| Total | 428 (100.0%) | 656 (100.0%) |
Household Income by Mortgage Status in Manorhaven
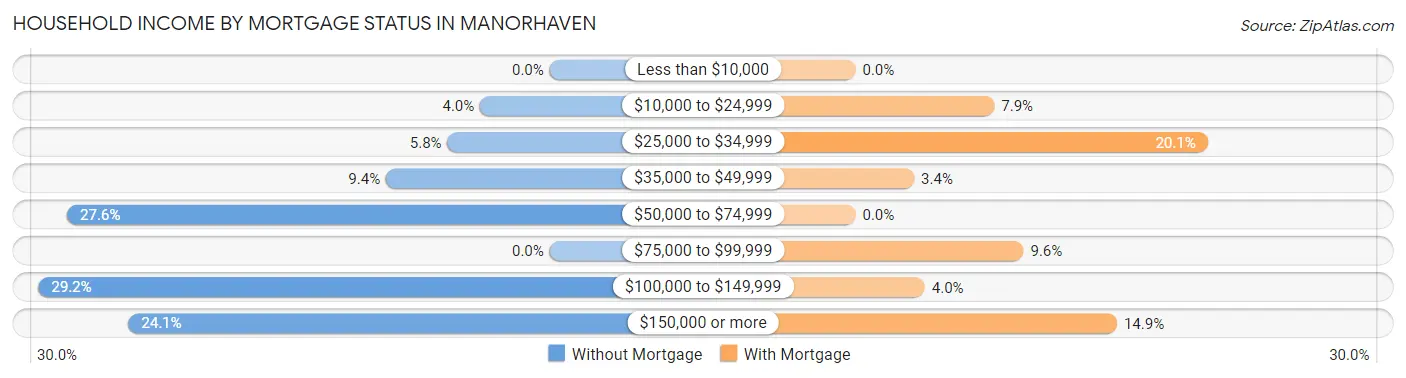
| Household Income | Without Mortgage | With Mortgage |
| Less than $10,000 | 0 (0.0%) | 0 (0.0%) |
| $10,000 to $24,999 | 17 (4.0%) | 52 (7.9%) |
| $25,000 to $34,999 | 25 (5.8%) | 132 (20.1%) |
| $35,000 to $49,999 | 40 (9.3%) | 22 (3.4%) |
| $50,000 to $74,999 | 118 (27.6%) | 0 (0.0%) |
| $75,000 to $99,999 | 0 (0.0%) | 63 (9.6%) |
| $100,000 to $149,999 | 125 (29.2%) | 26 (4.0%) |
| $150,000 or more | 103 (24.1%) | 98 (14.9%) |
| Total | 428 (100.0%) | 656 (100.0%) |
Property Value to Household Income Ratio in Manorhaven
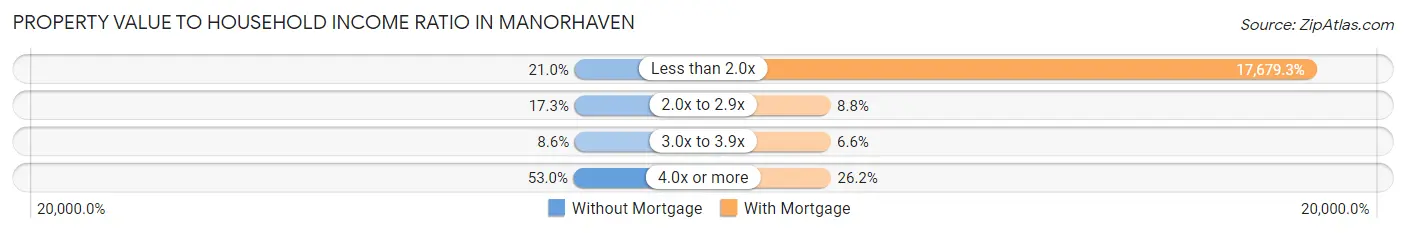
| Value-to-Income Ratio | Without Mortgage | With Mortgage |
| Less than 2.0x | 90 (21.0%) | 115,976 (17,679.3%) |
| 2.0x to 2.9x | 74 (17.3%) | 58 (8.8%) |
| 3.0x to 3.9x | 37 (8.6%) | 43 (6.6%) |
| 4.0x or more | 227 (53.0%) | 172 (26.2%) |
| Total | 428 (100.0%) | 656 (100.0%) |
Real Estate Taxes by Mortgage Status in Manorhaven
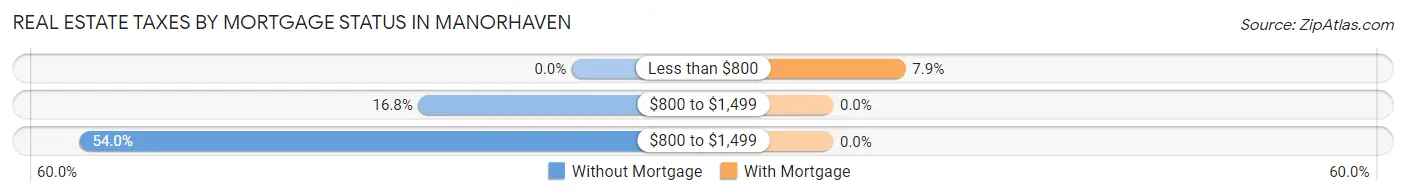
| Property Taxes | Without Mortgage | With Mortgage |
| Less than $800 | 0 (0.0%) | 52 (7.9%) |
| $800 to $1,499 | 72 (16.8%) | 0 (0.0%) |
| $800 to $1,499 | 231 (54.0%) | 0 (0.0%) |
| Total | 428 (100.0%) | 656 (100.0%) |
Health & Disability in Manorhaven
Health Insurance Coverage by Age in Manorhaven
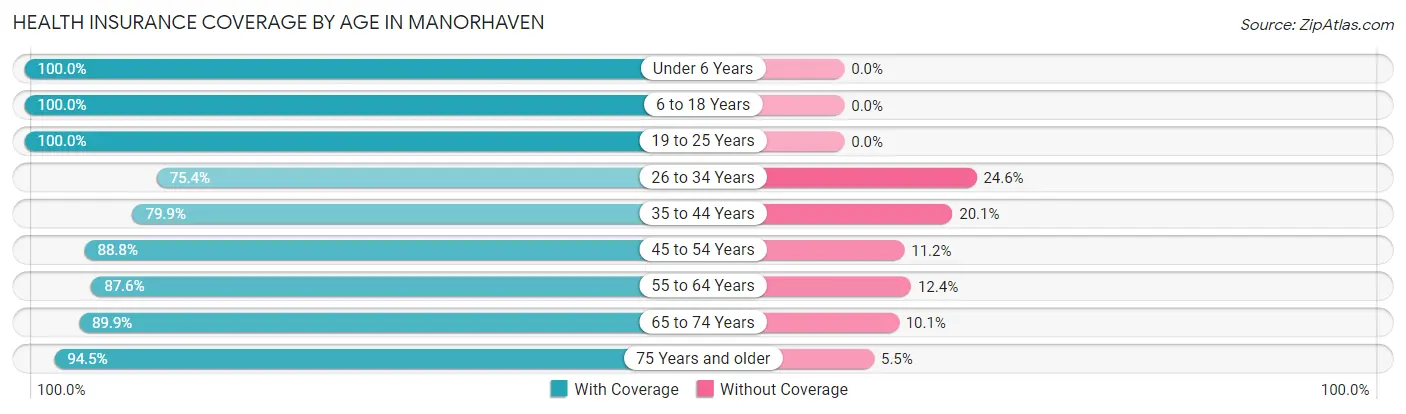
| Age Bracket | With Coverage | Without Coverage |
| Under 6 Years | 372 (100.0%) | 0 (0.0%) |
| 6 to 18 Years | 967 (100.0%) | 0 (0.0%) |
| 19 to 25 Years | 742 (100.0%) | 0 (0.0%) |
| 26 to 34 Years | 477 (75.4%) | 156 (24.6%) |
| 35 to 44 Years | 678 (79.9%) | 171 (20.1%) |
| 45 to 54 Years | 1,198 (88.8%) | 151 (11.2%) |
| 55 to 64 Years | 732 (87.6%) | 104 (12.4%) |
| 65 to 74 Years | 656 (89.9%) | 74 (10.1%) |
| 75 Years and older | 426 (94.5%) | 25 (5.5%) |
| Total | 6,248 (90.2%) | 681 (9.8%) |
Health Insurance Coverage by Citizenship Status in Manorhaven
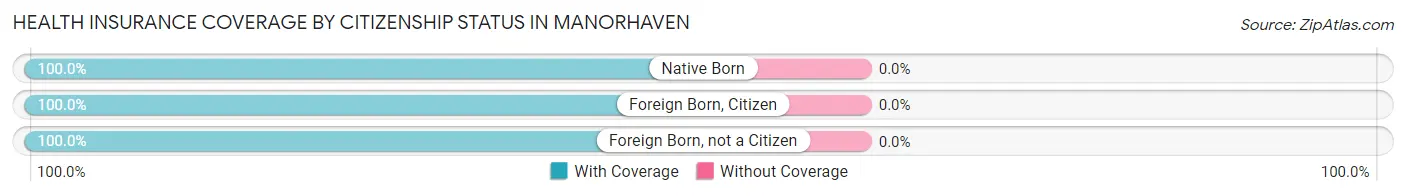
| Citizenship Status | With Coverage | Without Coverage |
| Native Born | 372 (100.0%) | 0 (0.0%) |
| Foreign Born, Citizen | 967 (100.0%) | 0 (0.0%) |
| Foreign Born, not a Citizen | 742 (100.0%) | 0 (0.0%) |
Health Insurance Coverage by Household Income in Manorhaven
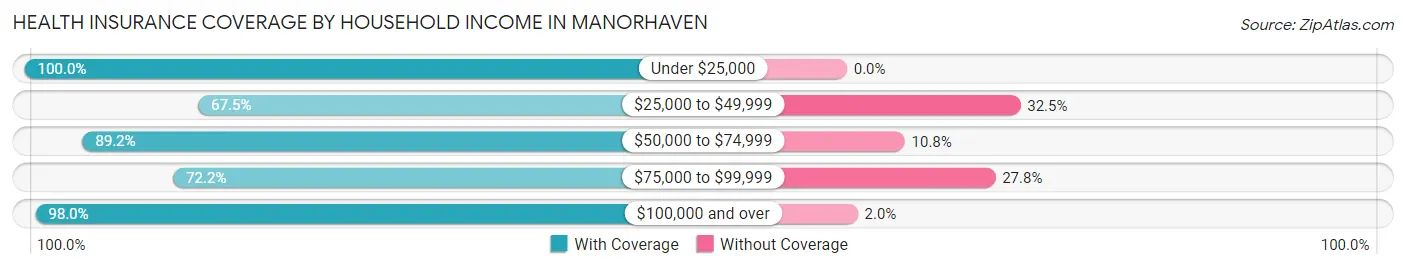
| Household Income | With Coverage | Without Coverage |
| Under $25,000 | 657 (100.0%) | 0 (0.0%) |
| $25,000 to $49,999 | 409 (67.5%) | 197 (32.5%) |
| $50,000 to $74,999 | 1,144 (89.2%) | 139 (10.8%) |
| $75,000 to $99,999 | 719 (72.2%) | 277 (27.8%) |
| $100,000 and over | 3,305 (98.0%) | 68 (2.0%) |
Public vs Private Health Insurance Coverage by Age in Manorhaven
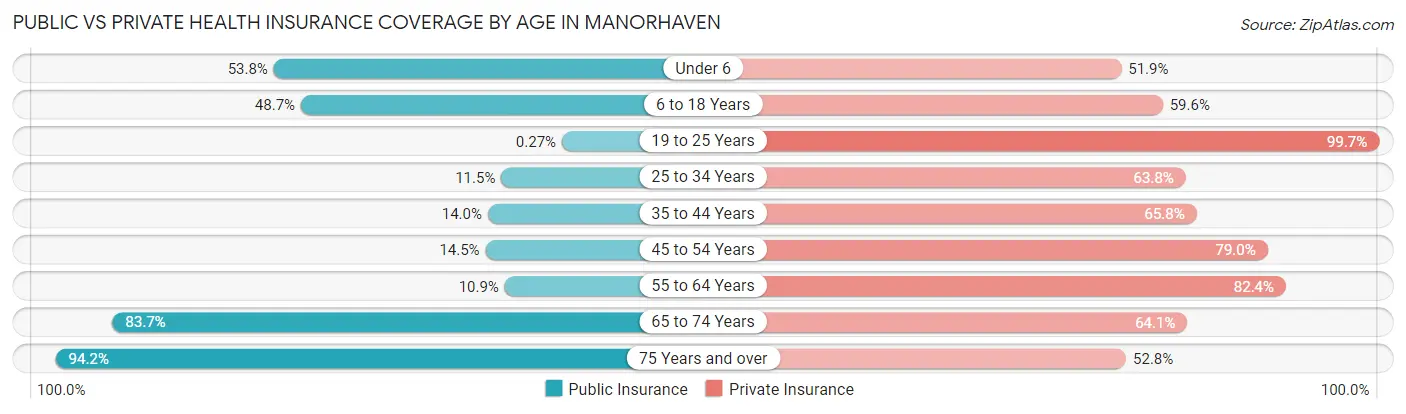
| Age Bracket | Public Insurance | Private Insurance |
| Under 6 | 200 (53.8%) | 193 (51.9%) |
| 6 to 18 Years | 471 (48.7%) | 576 (59.6%) |
| 19 to 25 Years | 2 (0.3%) | 740 (99.7%) |
| 25 to 34 Years | 73 (11.5%) | 404 (63.8%) |
| 35 to 44 Years | 119 (14.0%) | 559 (65.8%) |
| 45 to 54 Years | 195 (14.5%) | 1,066 (79.0%) |
| 55 to 64 Years | 91 (10.9%) | 689 (82.4%) |
| 65 to 74 Years | 611 (83.7%) | 468 (64.1%) |
| 75 Years and over | 425 (94.2%) | 238 (52.8%) |
| Total | 2,187 (31.6%) | 4,933 (71.2%) |
Disability Status by Sex by Age in Manorhaven
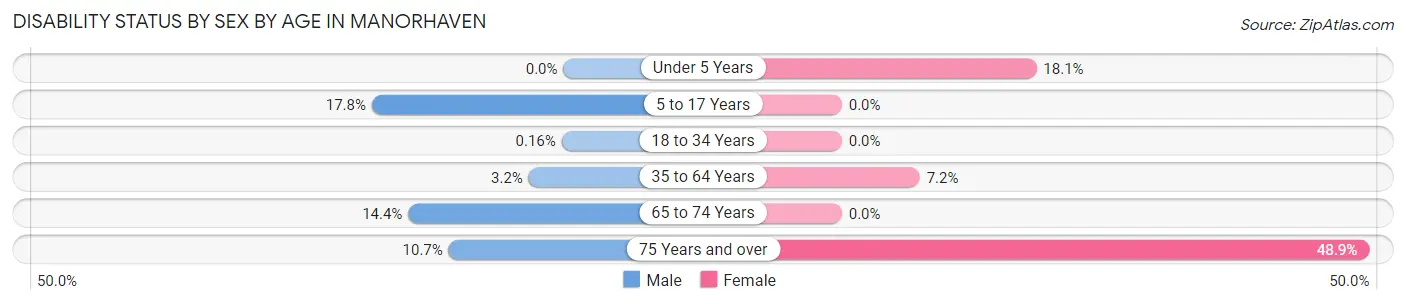
| Age Bracket | Male | Female |
| Under 5 Years | 0 (0.0%) | 41 (18.1%) |
| 5 to 17 Years | 93 (17.8%) | 0 (0.0%) |
| 18 to 34 Years | 1 (0.2%) | 0 (0.0%) |
| 35 to 64 Years | 50 (3.2%) | 107 (7.2%) |
| 65 to 74 Years | 52 (14.4%) | 0 (0.0%) |
| 75 Years and over | 18 (10.6%) | 138 (48.9%) |
Disability Class by Sex by Age in Manorhaven
Disability Class: Hearing Difficulty
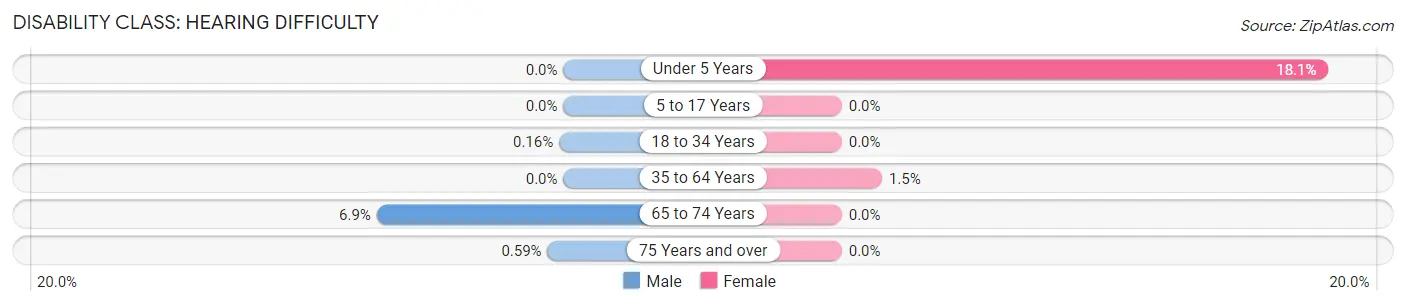
| Age Bracket | Male | Female |
| Under 5 Years | 0 (0.0%) | 41 (18.1%) |
| 5 to 17 Years | 0 (0.0%) | 0 (0.0%) |
| 18 to 34 Years | 1 (0.2%) | 0 (0.0%) |
| 35 to 64 Years | 0 (0.0%) | 22 (1.5%) |
| 65 to 74 Years | 25 (6.9%) | 0 (0.0%) |
| 75 Years and over | 1 (0.6%) | 0 (0.0%) |
Disability Class: Vision Difficulty
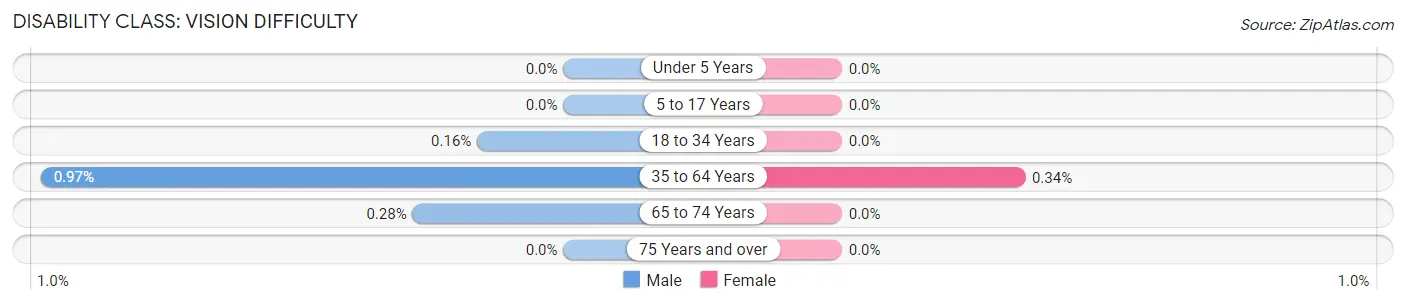
| Age Bracket | Male | Female |
| Under 5 Years | 0 (0.0%) | 0 (0.0%) |
| 5 to 17 Years | 0 (0.0%) | 0 (0.0%) |
| 18 to 34 Years | 1 (0.2%) | 0 (0.0%) |
| 35 to 64 Years | 15 (1.0%) | 5 (0.3%) |
| 65 to 74 Years | 1 (0.3%) | 0 (0.0%) |
| 75 Years and over | 0 (0.0%) | 0 (0.0%) |
Disability Class: Cognitive Difficulty
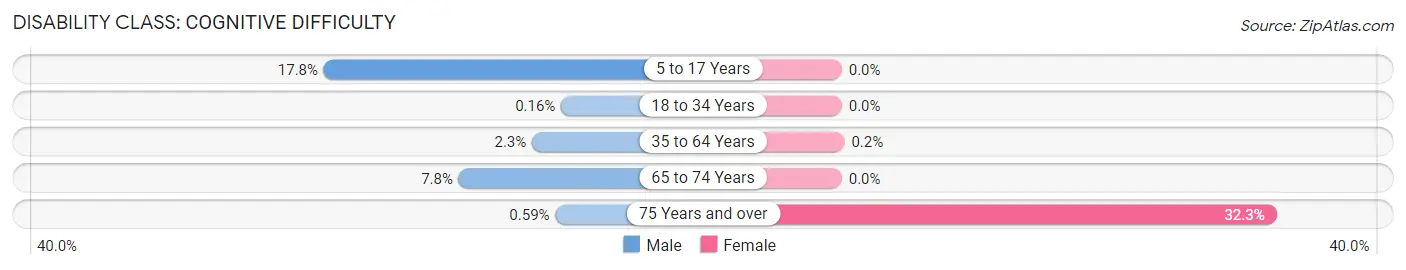
| Age Bracket | Male | Female |
| 5 to 17 Years | 93 (17.8%) | 0 (0.0%) |
| 18 to 34 Years | 1 (0.2%) | 0 (0.0%) |
| 35 to 64 Years | 36 (2.3%) | 3 (0.2%) |
| 65 to 74 Years | 28 (7.8%) | 0 (0.0%) |
| 75 Years and over | 1 (0.6%) | 91 (32.3%) |
Disability Class: Ambulatory Difficulty
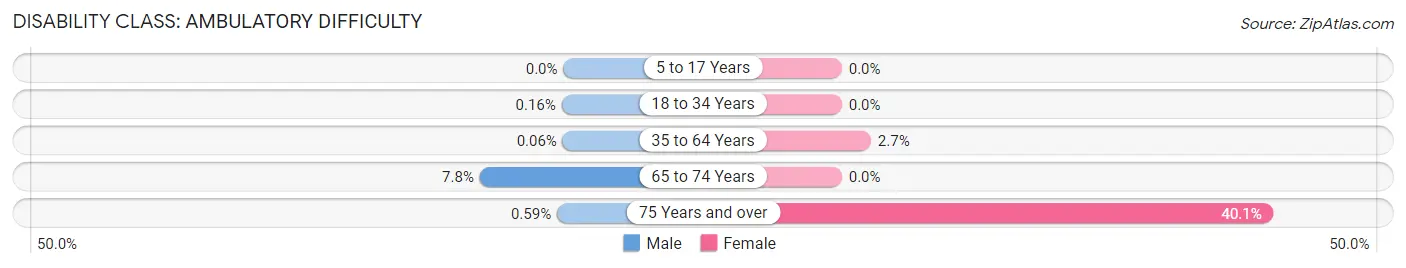
| Age Bracket | Male | Female |
| 5 to 17 Years | 0 (0.0%) | 0 (0.0%) |
| 18 to 34 Years | 1 (0.2%) | 0 (0.0%) |
| 35 to 64 Years | 1 (0.1%) | 40 (2.7%) |
| 65 to 74 Years | 28 (7.8%) | 0 (0.0%) |
| 75 Years and over | 1 (0.6%) | 113 (40.1%) |
Disability Class: Self-Care Difficulty
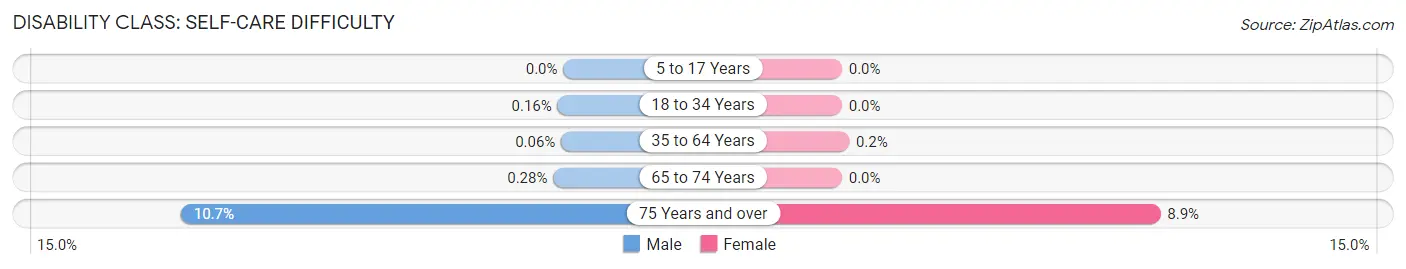
| Age Bracket | Male | Female |
| 5 to 17 Years | 0 (0.0%) | 0 (0.0%) |
| 18 to 34 Years | 1 (0.2%) | 0 (0.0%) |
| 35 to 64 Years | 1 (0.1%) | 3 (0.2%) |
| 65 to 74 Years | 1 (0.3%) | 0 (0.0%) |
| 75 Years and over | 18 (10.6%) | 25 (8.9%) |
Technology Access in Manorhaven
Computing Device Access in Manorhaven
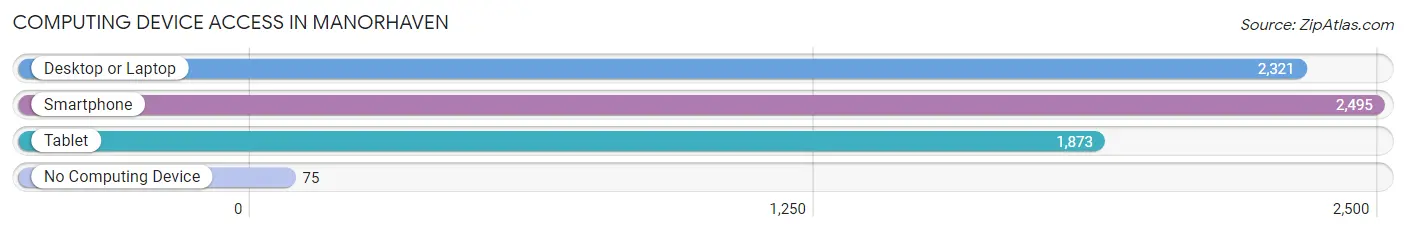
| Device Type | # Households | % Households |
| Desktop or Laptop | 2,321 | 85.7% |
| Smartphone | 2,495 | 92.1% |
| Tablet | 1,873 | 69.2% |
| No Computing Device | 75 | 2.8% |
| Total | 2,708 | 100.0% |
Internet Access in Manorhaven
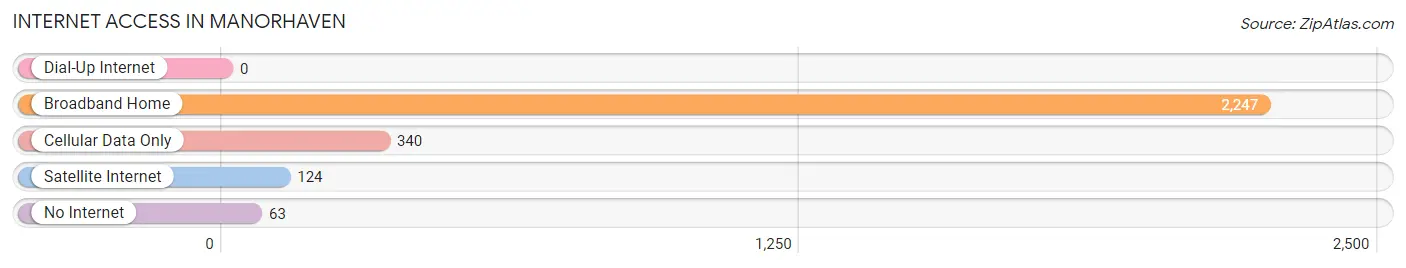
| Internet Type | # Households | % Households |
| Dial-Up Internet | 0 | 0.0% |
| Broadband Home | 2,247 | 83.0% |
| Cellular Data Only | 340 | 12.6% |
| Satellite Internet | 124 | 4.6% |
| No Internet | 63 | 2.3% |
| Total | 2,708 | 100.0% |
Manorhaven Summary
Manorhaven is a village located in the Town of North Hempstead in Nassau County, New York. It is situated on the north shore of Long Island, approximately 25 miles east of New York City. The village has a population of approximately 3,000 people and covers an area of 0.6 square miles.
History
The area that is now Manorhaven was originally inhabited by the Matinecock Native American tribe. The first European settlers arrived in the area in the late 1600s, and the area was known as Cow Neck. In the early 1700s, the area was divided into several large farms, and the area was known as Cow Neck Farms. In the late 1800s, the area was developed as a summer resort community, and the village was incorporated in 1931.
Geography
Manorhaven is located on the north shore of Long Island, approximately 25 miles east of New York City. The village is bordered by the villages of Port Washington to the east, Sands Point to the west, and Great Neck to the south. The village is situated on the Manhasset Bay, and is home to several marinas and yacht clubs. The village is also home to several parks, including Manorhaven Beach Park, which offers swimming, fishing, and other recreational activities.
Economy
The economy of Manorhaven is largely based on tourism and retail. The village is home to several restaurants, bars, and shops, as well as a few small businesses. The village is also home to several marinas and yacht clubs, which attract visitors from all over the region.
Demographics
As of the 2010 census, the population of Manorhaven was 3,000. The racial makeup of the village was 87.3% White, 4.3% African American, 0.3% Native American, 4.3% Asian, and 3.7% from other races. The median household income was $90,000, and the median family income was $100,000.
Conclusion
Manorhaven is a small village located on the north shore of Long Island, approximately 25 miles east of New York City. The village has a population of approximately 3,000 people and covers an area of 0.6 square miles. The economy of Manorhaven is largely based on tourism and retail, and the village is home to several restaurants, bars, and shops. The racial makeup of the village is predominantly White, with a small percentage of African American, Native American, and Asian residents. The median household income is $90,000, and the median family income is $100,000.
Common Questions
What is Per Capita Income in Manorhaven?
Per Capita income in Manorhaven is $51,235.
What is the Median Family Income in Manorhaven?
Median Family Income in Manorhaven is $96,230.
What is the Median Household income in Manorhaven?
Median Household Income in Manorhaven is $95,493.
What is Income or Wage Gap in Manorhaven?
Income or Wage Gap in Manorhaven is 57.8%.
Women in Manorhaven earn 42.2 cents for every dollar earned by a man.
What is Inequality or Gini Index in Manorhaven?
Inequality or Gini Index in Manorhaven is 0.46.
What is the Total Population of Manorhaven?
Total Population of Manorhaven is 6,929.
What is the Total Male Population of Manorhaven?
Total Male Population of Manorhaven is 3,285.
What is the Total Female Population of Manorhaven?
Total Female Population of Manorhaven is 3,644.
What is the Ratio of Males per 100 Females in Manorhaven?
There are 90.15 Males per 100 Females in Manorhaven.
What is the Ratio of Females per 100 Males in Manorhaven?
There are 110.93 Females per 100 Males in Manorhaven.
What is the Median Population Age in Manorhaven?
Median Population Age in Manorhaven is 43.0 Years.
What is the Average Family Size in Manorhaven
Average Family Size in Manorhaven is 3.0 People.
What is the Average Household Size in Manorhaven
Average Household Size in Manorhaven is 2.5 People.
How Large is the Labor Force in Manorhaven?
There are 3,748 People in the Labor Forcein in Manorhaven.
What is the Percentage of People in the Labor Force in Manorhaven?
65.5% of People are in the Labor Force in Manorhaven.
What is the Unemployment Rate in Manorhaven?
Unemployment Rate in Manorhaven is 3.3%.