Dunkirk, NY Map & Demographics
Dunkirk Map
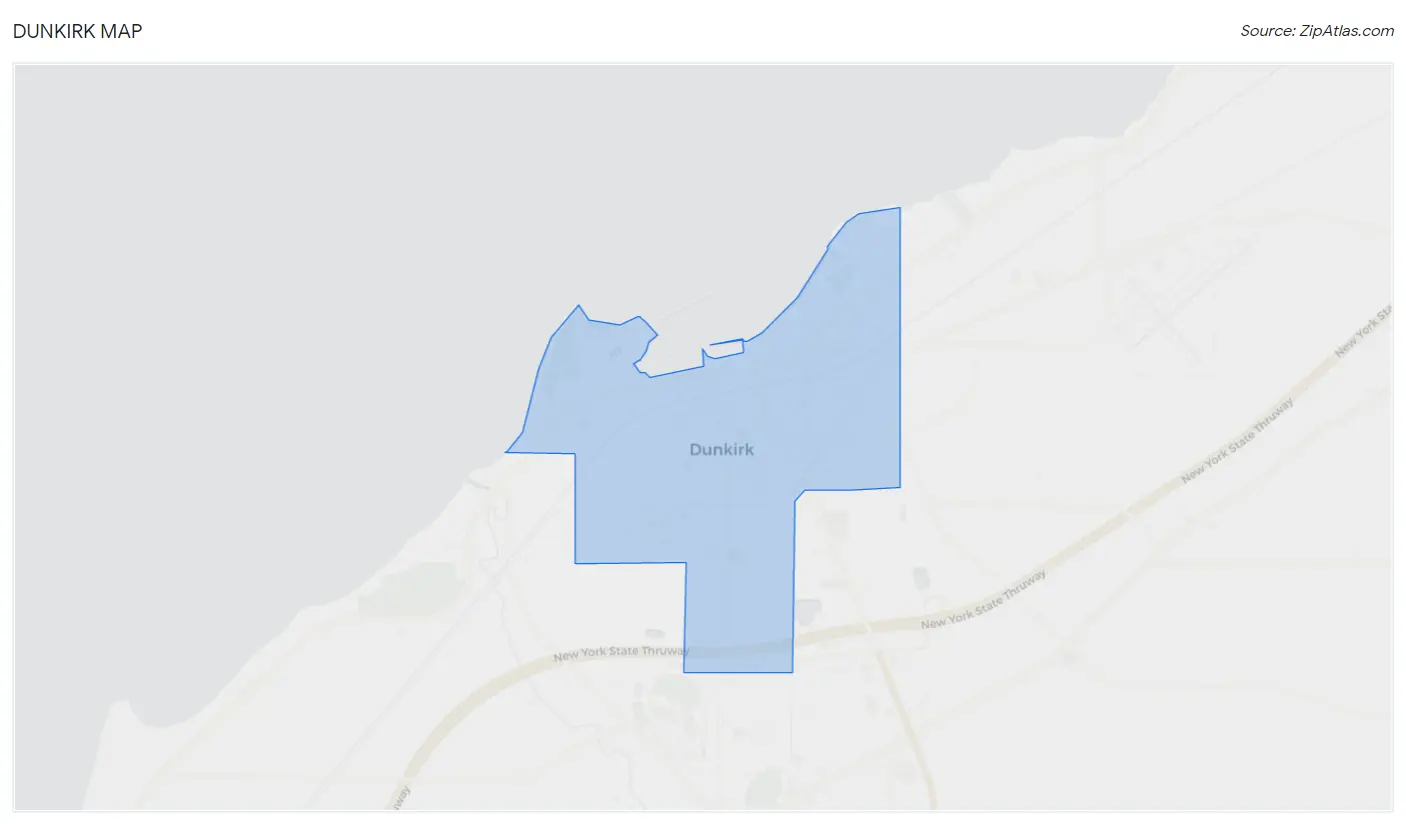
Dunkirk Overview
$27,775
PER CAPITA INCOME
$57,161
AVG FAMILY INCOME
$46,800
AVG HOUSEHOLD INCOME
29.9%
WAGE / INCOME GAP [ % ]
70.1¢/ $1
WAGE / INCOME GAP [ $ ]
$9,548
FAMILY INCOME DEFICIT
0.44
INEQUALITY / GINI INDEX
12,668
TOTAL POPULATION
6,702
MALE POPULATION
5,966
FEMALE POPULATION
112.34
MALES / 100 FEMALES
89.02
FEMALES / 100 MALES
42.6
MEDIAN AGE
2.8
AVG FAMILY SIZE
2.2
AVG HOUSEHOLD SIZE
5,838
LABOR FORCE [ PEOPLE ]
55.2%
PERCENT IN LABOR FORCE
4.6%
UNEMPLOYMENT RATE
Dunkirk Zip Codes
Dunkirk Area Codes
Income in Dunkirk
Income Overview in Dunkirk
Per Capita Income in Dunkirk is $27,775, while median incomes of families and households are $57,161 and $46,800 respectively.
| Characteristic | Number | Measure |
| Per Capita Income | 12,668 | $27,775 |
| Median Family Income | 3,116 | $57,161 |
| Mean Family Income | 3,116 | $68,509 |
| Median Household Income | 5,766 | $46,800 |
| Mean Household Income | 5,766 | $59,152 |
| Income Deficit | 3,116 | $9,548 |
| Wage / Income Gap (%) | 12,668 | 29.86% |
| Wage / Income Gap ($) | 12,668 | 70.14¢ per $1 |
| Gini / Inequality Index | 12,668 | 0.44 |
Earnings by Sex in Dunkirk
Average Earnings in Dunkirk are $30,224, $35,644 for men and $25,000 for women, a difference of 29.9%.
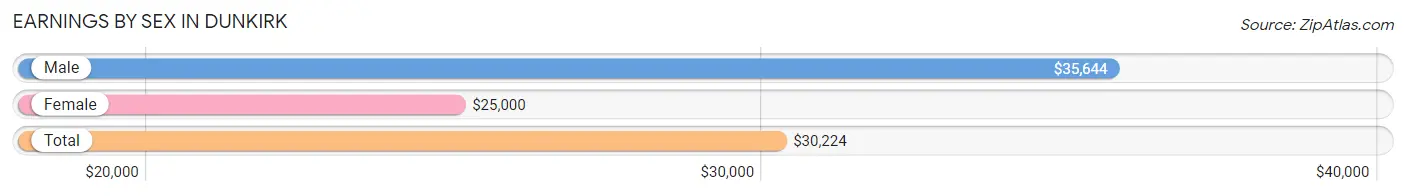
| Sex | Number | Average Earnings |
| Male | 3,406 (53.7%) | $35,644 |
| Female | 2,934 (46.3%) | $25,000 |
| Total | 6,340 (100.0%) | $30,224 |
Earnings by Sex by Income Bracket in Dunkirk
The most common earnings brackets in Dunkirk are $55,000 to $64,999 for men (380 | 11.2%) and $2,499 or less for women (257 | 8.8%).
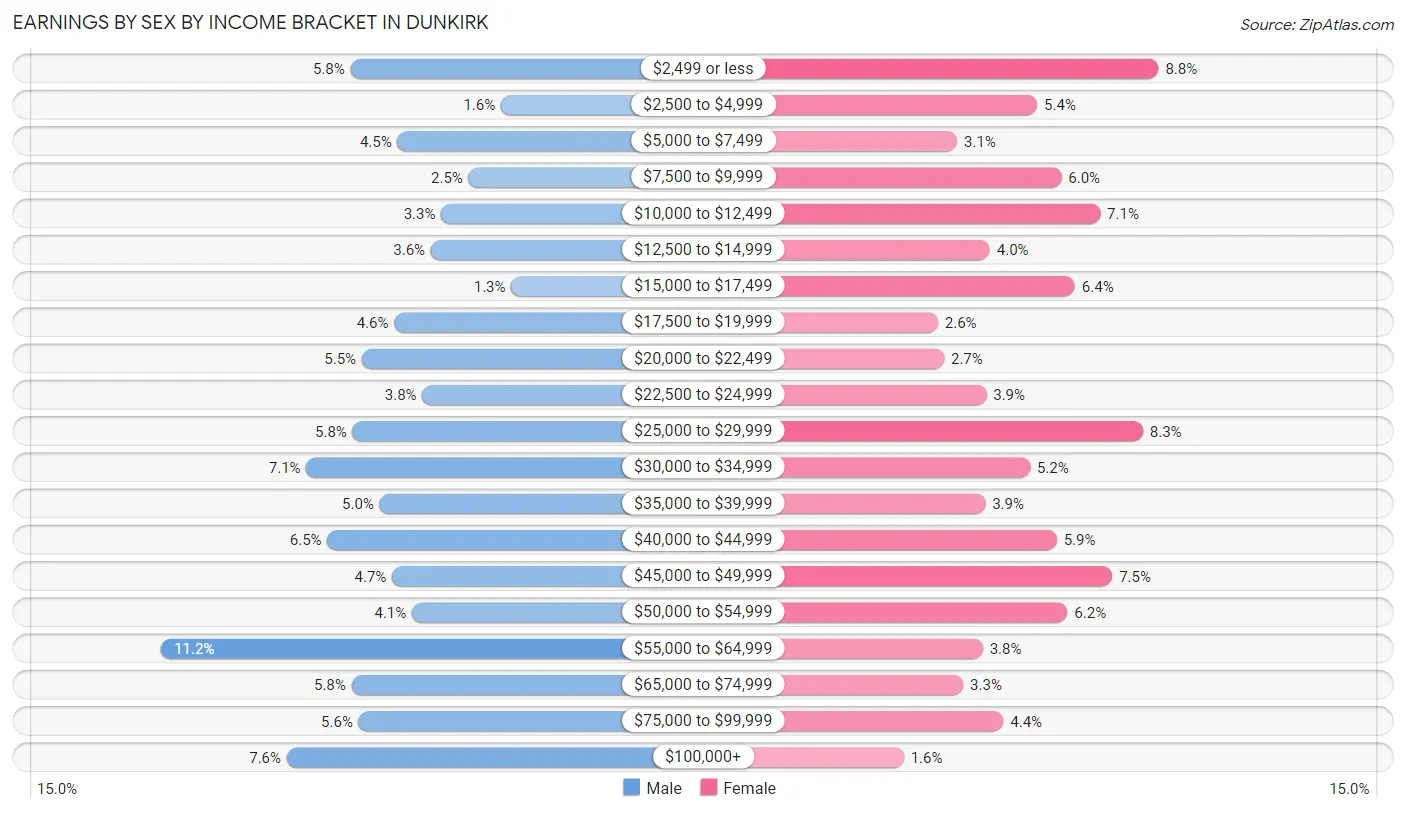
| Income | Male | Female |
| $2,499 or less | 199 (5.8%) | 257 (8.8%) |
| $2,500 to $4,999 | 55 (1.6%) | 157 (5.3%) |
| $5,000 to $7,499 | 154 (4.5%) | 91 (3.1%) |
| $7,500 to $9,999 | 86 (2.5%) | 177 (6.0%) |
| $10,000 to $12,499 | 112 (3.3%) | 209 (7.1%) |
| $12,500 to $14,999 | 122 (3.6%) | 118 (4.0%) |
| $15,000 to $17,499 | 45 (1.3%) | 188 (6.4%) |
| $17,500 to $19,999 | 157 (4.6%) | 75 (2.6%) |
| $20,000 to $22,499 | 188 (5.5%) | 80 (2.7%) |
| $22,500 to $24,999 | 130 (3.8%) | 115 (3.9%) |
| $25,000 to $29,999 | 197 (5.8%) | 244 (8.3%) |
| $30,000 to $34,999 | 241 (7.1%) | 151 (5.1%) |
| $35,000 to $39,999 | 171 (5.0%) | 114 (3.9%) |
| $40,000 to $44,999 | 221 (6.5%) | 173 (5.9%) |
| $45,000 to $49,999 | 159 (4.7%) | 219 (7.5%) |
| $50,000 to $54,999 | 140 (4.1%) | 182 (6.2%) |
| $55,000 to $64,999 | 380 (11.2%) | 112 (3.8%) |
| $65,000 to $74,999 | 198 (5.8%) | 96 (3.3%) |
| $75,000 to $99,999 | 191 (5.6%) | 129 (4.4%) |
| $100,000+ | 260 (7.6%) | 47 (1.6%) |
| Total | 3,406 (100.0%) | 2,934 (100.0%) |
Earnings by Sex by Educational Attainment in Dunkirk
Average earnings in Dunkirk are $41,823 for men and $27,574 for women, a difference of 34.1%. Men with an educational attainment of graduate degree enjoy the highest average annual earnings of $87,566, while those with college or associate's degree education earn the least with $29,489. Women with an educational attainment of graduate degree earn the most with the average annual earnings of $47,969, while those with college or associate's degree education have the smallest earnings of $21,595.
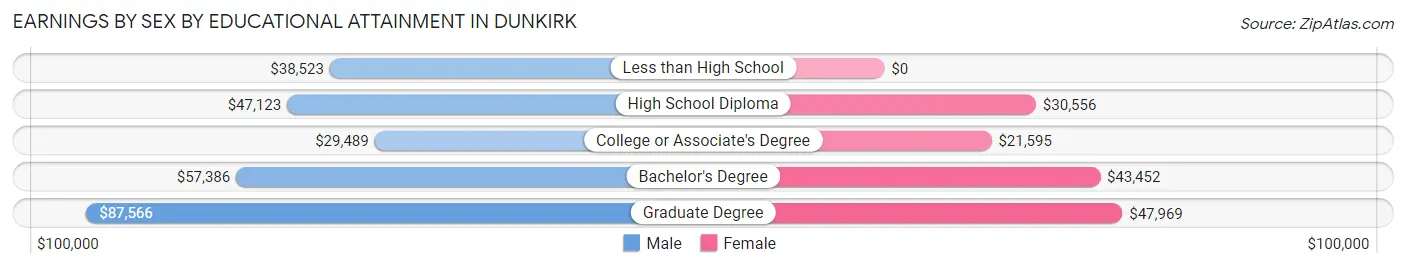
| Educational Attainment | Male Income | Female Income |
| Less than High School | $38,523 | $0 |
| High School Diploma | $47,123 | $30,556 |
| College or Associate's Degree | $29,489 | $21,595 |
| Bachelor's Degree | $57,386 | $43,452 |
| Graduate Degree | $87,566 | $47,969 |
| Total | $41,823 | $27,574 |
Family Income in Dunkirk
Family Income Brackets in Dunkirk
According to the Dunkirk family income data, there are 633 families falling into the $50,000 to $74,999 income range, which is the most common income bracket and makes up 20.3% of all families. Conversely, the $200,000+ income bracket is the least frequent group with only 65 families (2.1%) belonging to this category.
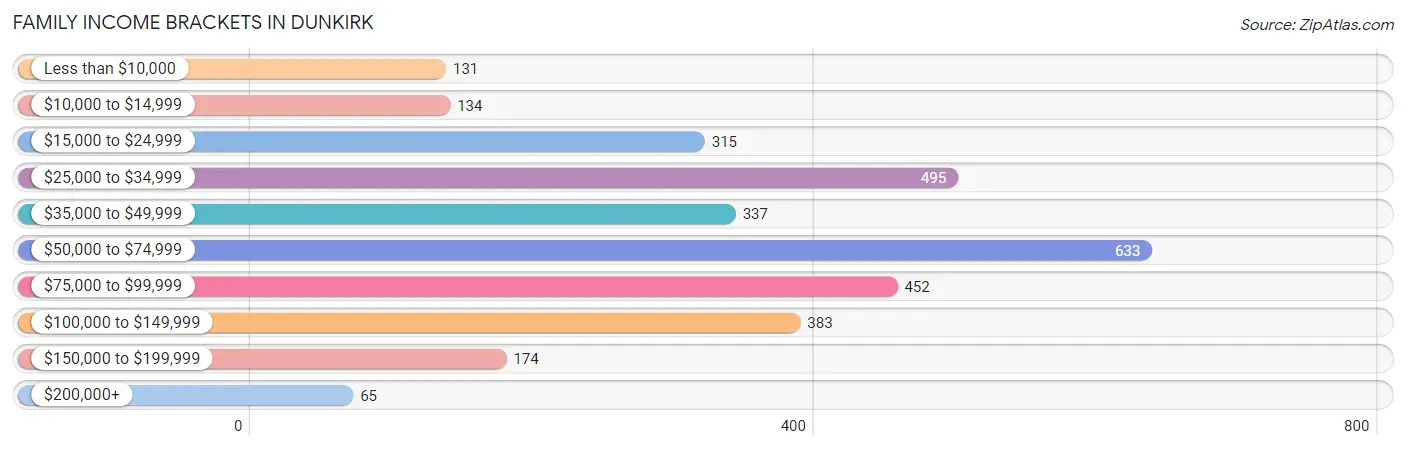
| Income Bracket | # Families | % Families |
| Less than $10,000 | 131 | 4.2% |
| $10,000 to $14,999 | 134 | 4.3% |
| $15,000 to $24,999 | 315 | 10.1% |
| $25,000 to $34,999 | 495 | 15.9% |
| $35,000 to $49,999 | 337 | 10.8% |
| $50,000 to $74,999 | 633 | 20.3% |
| $75,000 to $99,999 | 452 | 14.5% |
| $100,000 to $149,999 | 383 | 12.3% |
| $150,000 to $199,999 | 174 | 5.6% |
| $200,000+ | 65 | 2.1% |
Family Income by Famaliy Size in Dunkirk
4-person families (229 | 7.3%) account for the highest median family income in Dunkirk with $66,696 per family, while 2-person families (1,555 | 49.9%) have the highest median income of $27,116 per family member.
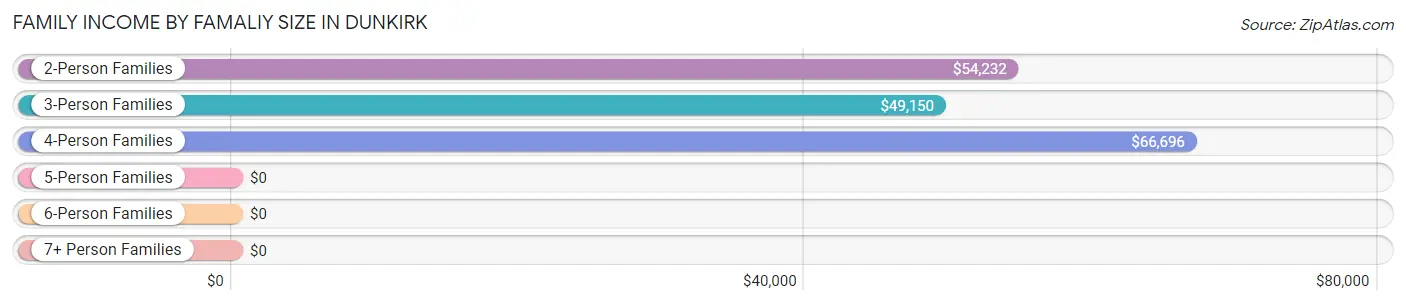
| Income Bracket | # Families | Median Income |
| 2-Person Families | 1,555 (49.9%) | $54,232 |
| 3-Person Families | 987 (31.7%) | $49,150 |
| 4-Person Families | 229 (7.3%) | $66,696 |
| 5-Person Families | 268 (8.6%) | $0 |
| 6-Person Families | 70 (2.2%) | $0 |
| 7+ Person Families | 7 (0.2%) | $0 |
| Total | 3,116 (100.0%) | $57,161 |
Family Income by Number of Earners in Dunkirk
The median family income in Dunkirk is $57,161, with families comprising 3+ earners (315) having the highest median family income of $153,003, while families with 1 earner (1,250) have the lowest median family income of $32,662, accounting for 10.1% and 40.1% of families, respectively.
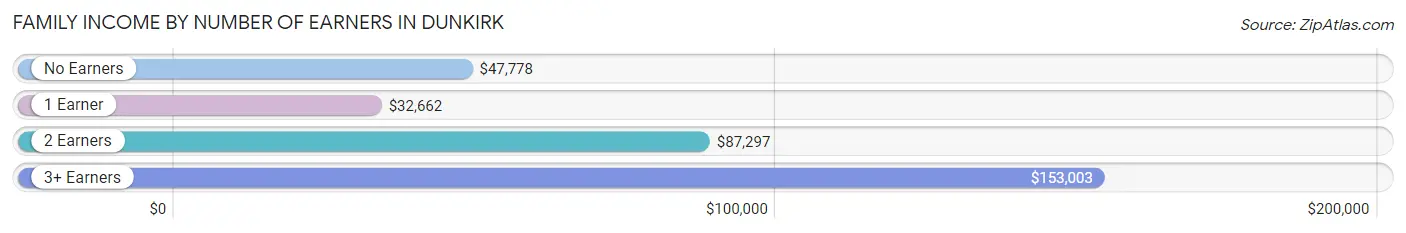
| Number of Earners | # Families | Median Income |
| No Earners | 546 (17.5%) | $47,778 |
| 1 Earner | 1,250 (40.1%) | $32,662 |
| 2 Earners | 1,005 (32.3%) | $87,297 |
| 3+ Earners | 315 (10.1%) | $153,003 |
| Total | 3,116 (100.0%) | $57,161 |
Household Income in Dunkirk
Household Income Brackets in Dunkirk
With 1,280 households falling in the category, the $50,000 to $74,999 income range is the most frequent in Dunkirk, accounting for 22.2% of all households. In contrast, only 92 households (1.6%) fall into the $200,000+ income bracket, making it the least populous group.
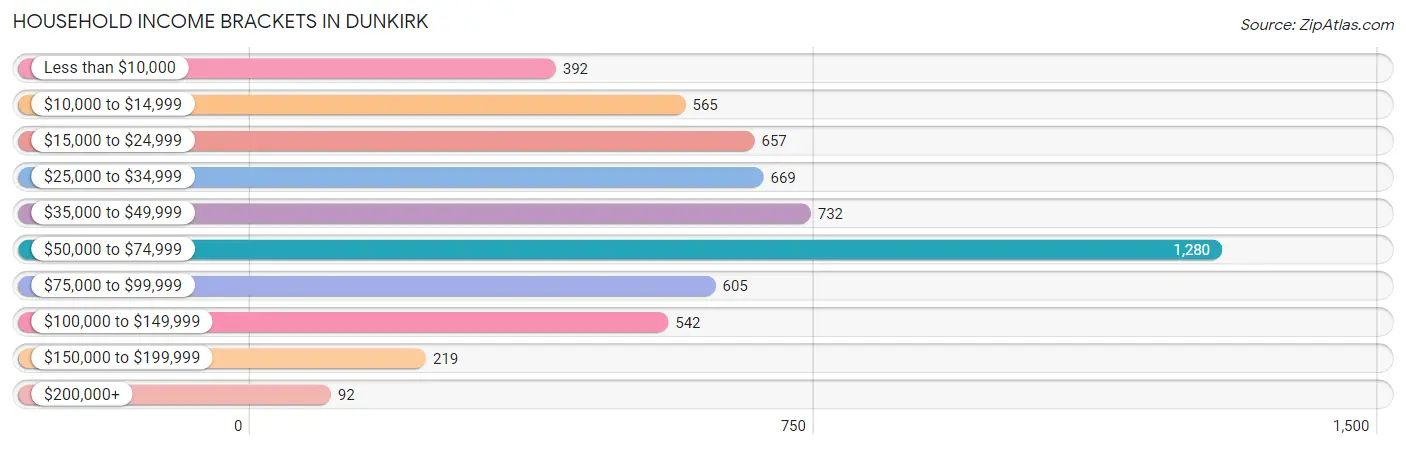
| Income Bracket | # Households | % Households |
| Less than $10,000 | 392 | 6.8% |
| $10,000 to $14,999 | 565 | 9.8% |
| $15,000 to $24,999 | 657 | 11.4% |
| $25,000 to $34,999 | 669 | 11.6% |
| $35,000 to $49,999 | 732 | 12.7% |
| $50,000 to $74,999 | 1,280 | 22.2% |
| $75,000 to $99,999 | 605 | 10.5% |
| $100,000 to $149,999 | 542 | 9.4% |
| $150,000 to $199,999 | 219 | 3.8% |
| $200,000+ | 92 | 1.6% |
Household Income by Householder Age in Dunkirk
The median household income in Dunkirk is $46,800, with the highest median household income of $62,782 found in the 15 to 24 years age bracket for the primary householder. A total of 246 households (4.3%) fall into this category. Meanwhile, the 25 to 44 years age bracket for the primary householder has the lowest median household income of $38,897, with 1,599 households (27.7%) in this group.
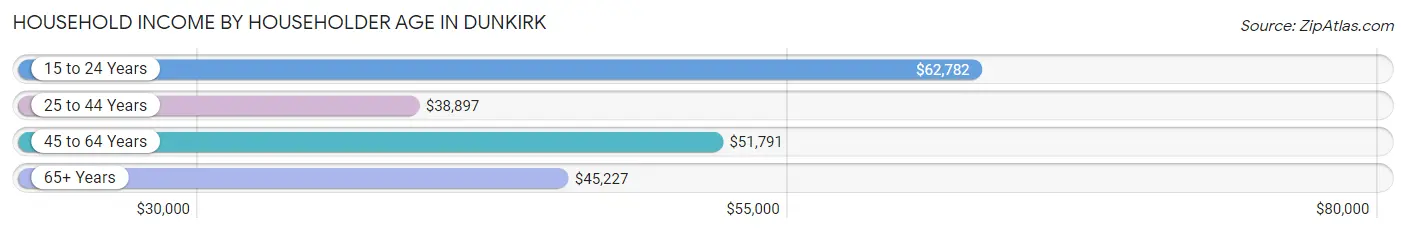
| Income Bracket | # Households | Median Income |
| 15 to 24 Years | 246 (4.3%) | $62,782 |
| 25 to 44 Years | 1,599 (27.7%) | $38,897 |
| 45 to 64 Years | 2,397 (41.6%) | $51,791 |
| 65+ Years | 1,524 (26.4%) | $45,227 |
| Total | 5,766 (100.0%) | $46,800 |
Poverty in Dunkirk
Income Below Poverty by Sex and Age in Dunkirk
With 24.2% poverty level for males and 25.6% for females among the residents of Dunkirk, 5 year old males and under 5 year old females are the most vulnerable to poverty, with 47 males (79.7%) and 228 females (70.4%) in their respective age groups living below the poverty level.
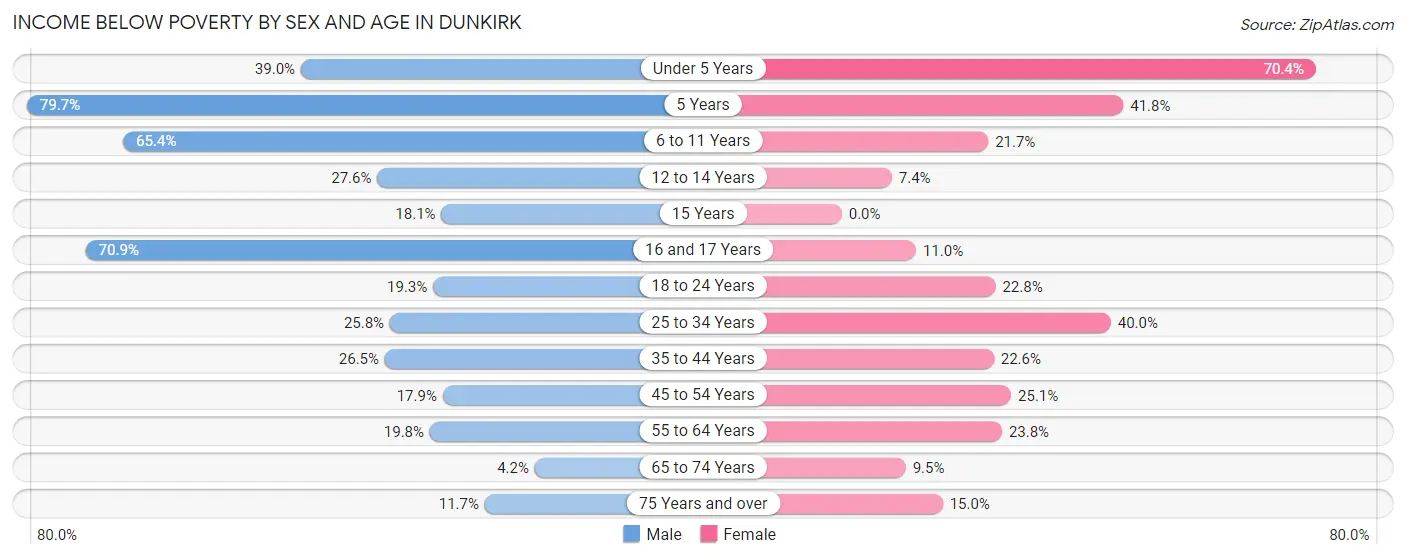
| Age Bracket | Male | Female |
| Under 5 Years | 113 (39.0%) | 228 (70.4%) |
| 5 Years | 47 (79.7%) | 51 (41.8%) |
| 6 to 11 Years | 304 (65.4%) | 40 (21.7%) |
| 12 to 14 Years | 42 (27.6%) | 15 (7.4%) |
| 15 Years | 23 (18.1%) | 0 (0.0%) |
| 16 and 17 Years | 61 (70.9%) | 13 (11.0%) |
| 18 to 24 Years | 176 (19.3%) | 89 (22.8%) |
| 25 to 34 Years | 206 (25.8%) | 342 (40.0%) |
| 35 to 44 Years | 208 (26.5%) | 123 (22.6%) |
| 45 to 54 Years | 139 (17.9%) | 228 (25.1%) |
| 55 to 64 Years | 219 (19.8%) | 244 (23.8%) |
| 65 to 74 Years | 28 (4.2%) | 67 (9.5%) |
| 75 Years and over | 56 (11.7%) | 62 (15.0%) |
| Total | 1,622 (24.2%) | 1,502 (25.6%) |
Income Above Poverty by Sex and Age in Dunkirk
According to the poverty statistics in Dunkirk, males aged 65 to 74 years and females aged 15 years are the age groups that are most secure financially, with 95.8% of males and 100.0% of females in these age groups living above the poverty line.
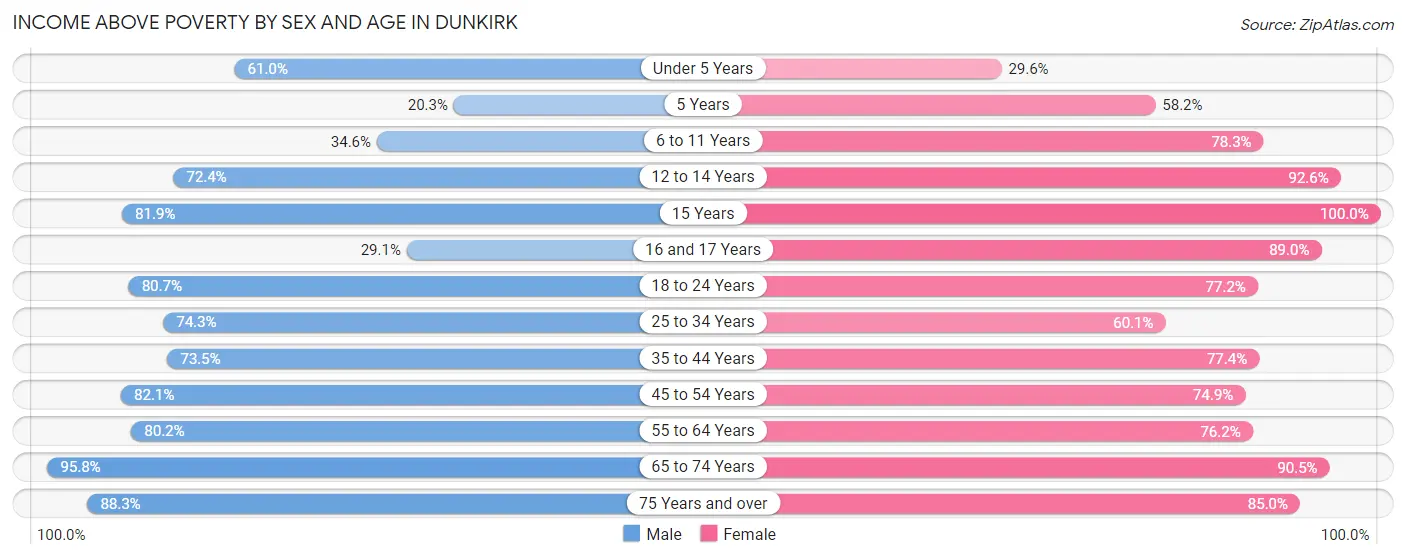
| Age Bracket | Male | Female |
| Under 5 Years | 177 (61.0%) | 96 (29.6%) |
| 5 Years | 12 (20.3%) | 71 (58.2%) |
| 6 to 11 Years | 161 (34.6%) | 144 (78.3%) |
| 12 to 14 Years | 110 (72.4%) | 187 (92.6%) |
| 15 Years | 104 (81.9%) | 65 (100.0%) |
| 16 and 17 Years | 25 (29.1%) | 105 (89.0%) |
| 18 to 24 Years | 734 (80.7%) | 301 (77.2%) |
| 25 to 34 Years | 594 (74.3%) | 514 (60.1%) |
| 35 to 44 Years | 577 (73.5%) | 422 (77.4%) |
| 45 to 54 Years | 637 (82.1%) | 679 (74.9%) |
| 55 to 64 Years | 886 (80.2%) | 782 (76.2%) |
| 65 to 74 Years | 633 (95.8%) | 639 (90.5%) |
| 75 Years and over | 424 (88.3%) | 352 (85.0%) |
| Total | 5,074 (75.8%) | 4,357 (74.4%) |
Income Below Poverty Among Married-Couple Families in Dunkirk
The poverty statistics for married-couple families in Dunkirk show that 4.3% or 73 of the total 1,698 families live below the poverty line. Families with 3 or 4 children have the highest poverty rate of 29.9%, comprising of 38 families. On the other hand, families with 1 or 2 children have the lowest poverty rate of 0.0%, which includes 0 families.
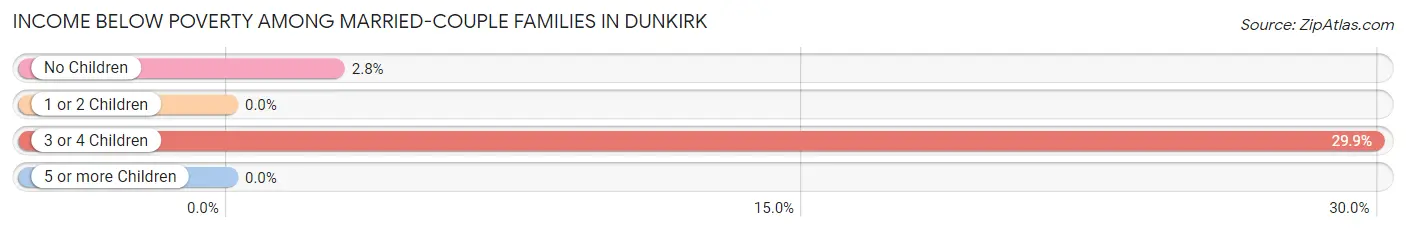
| Children | Above Poverty | Below Poverty |
| No Children | 1,219 (97.2%) | 35 (2.8%) |
| 1 or 2 Children | 317 (100.0%) | 0 (0.0%) |
| 3 or 4 Children | 89 (70.1%) | 38 (29.9%) |
| 5 or more Children | 0 (0.0%) | 0 (0.0%) |
| Total | 1,625 (95.7%) | 73 (4.3%) |
Income Below Poverty Among Single-Parent Households in Dunkirk
According to the poverty data in Dunkirk, 21.0% or 93 single-father households and 42.3% or 412 single-mother households are living below the poverty line. Among single-father households, those with 1 or 2 children have the highest poverty rate, with 93 households (34.2%) experiencing poverty. Likewise, among single-mother households, those with 3 or 4 children have the highest poverty rate, with 129 households (90.8%) falling below the poverty line.
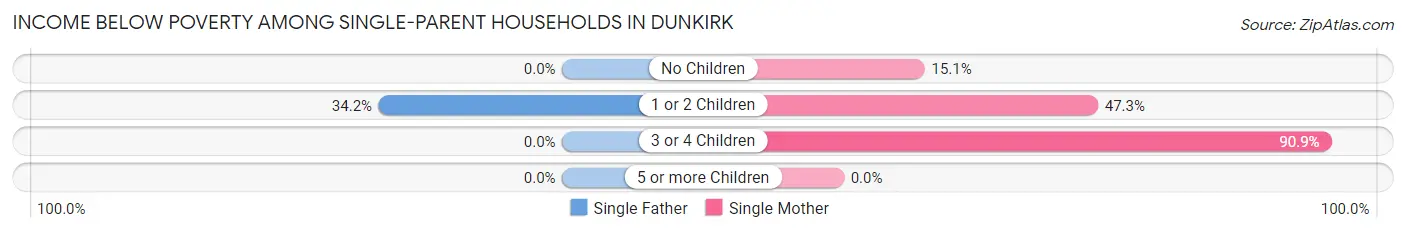
| Children | Single Father | Single Mother |
| No Children | 0 (0.0%) | 52 (15.1%) |
| 1 or 2 Children | 93 (34.2%) | 231 (47.3%) |
| 3 or 4 Children | 0 (0.0%) | 129 (90.8%) |
| 5 or more Children | 0 (0.0%) | 0 (0.0%) |
| Total | 93 (21.0%) | 412 (42.3%) |
Income Below Poverty Among Married-Couple vs Single-Parent Households in Dunkirk
The poverty data for Dunkirk shows that 73 of the married-couple family households (4.3%) and 505 of the single-parent households (35.6%) are living below the poverty level. Within the married-couple family households, those with 3 or 4 children have the highest poverty rate, with 38 households (29.9%) falling below the poverty line. Among the single-parent households, those with 3 or 4 children have the highest poverty rate, with 129 household (90.8%) living below poverty.
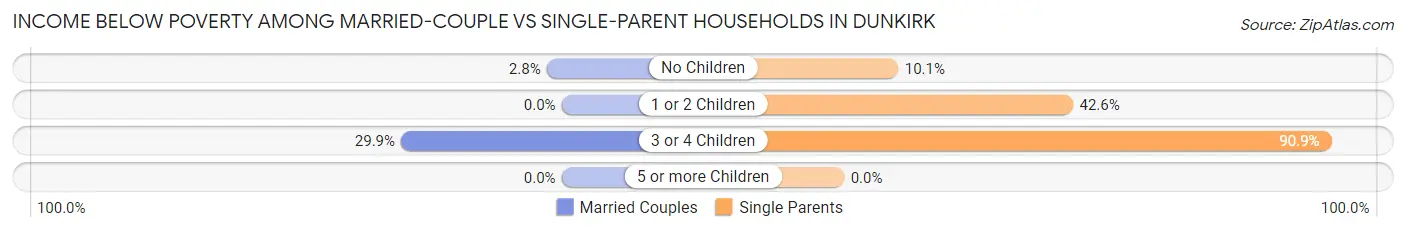
| Children | Married-Couple Families | Single-Parent Households |
| No Children | 35 (2.8%) | 52 (10.1%) |
| 1 or 2 Children | 0 (0.0%) | 324 (42.6%) |
| 3 or 4 Children | 38 (29.9%) | 129 (90.8%) |
| 5 or more Children | 0 (0.0%) | 0 (0.0%) |
| Total | 73 (4.3%) | 505 (35.6%) |
Race in Dunkirk
The most populous races in Dunkirk are White / Caucasian (8,743 | 69.0%), Hispanic or Latino (3,495 | 27.6%), and Two or more Races (1,368 | 10.8%).
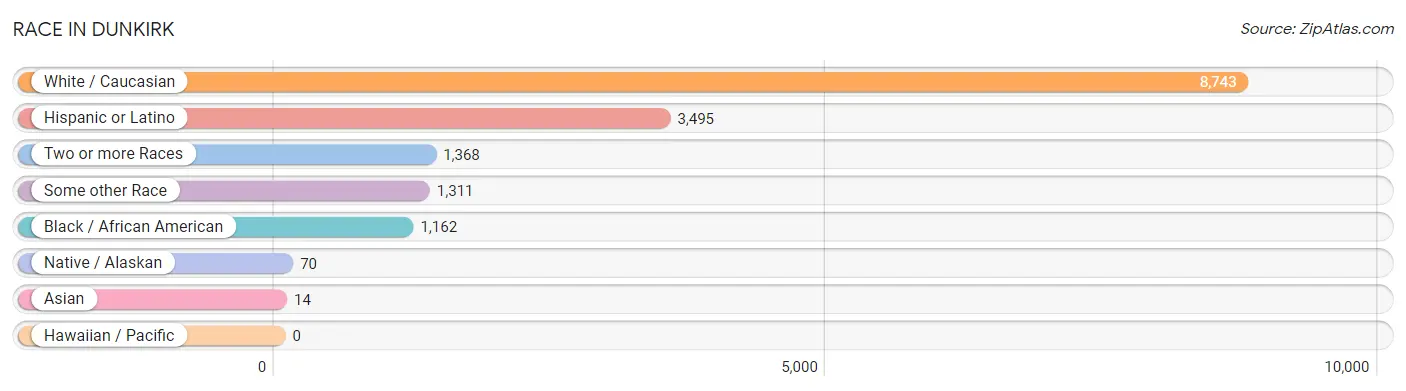
| Race | # Population | % Population |
| Asian | 14 | 0.1% |
| Black / African American | 1,162 | 9.2% |
| Hawaiian / Pacific | 0 | 0.0% |
| Hispanic or Latino | 3,495 | 27.6% |
| Native / Alaskan | 70 | 0.5% |
| White / Caucasian | 8,743 | 69.0% |
| Two or more Races | 1,368 | 10.8% |
| Some other Race | 1,311 | 10.3% |
| Total | 12,668 | 100.0% |
Ancestry in Dunkirk
The most populous ancestries reported in Dunkirk are Puerto Rican (2,830 | 22.3%), Polish (2,627 | 20.7%), German (1,991 | 15.7%), Irish (1,346 | 10.6%), and Italian (1,291 | 10.2%), together accounting for 79.6% of all Dunkirk residents.
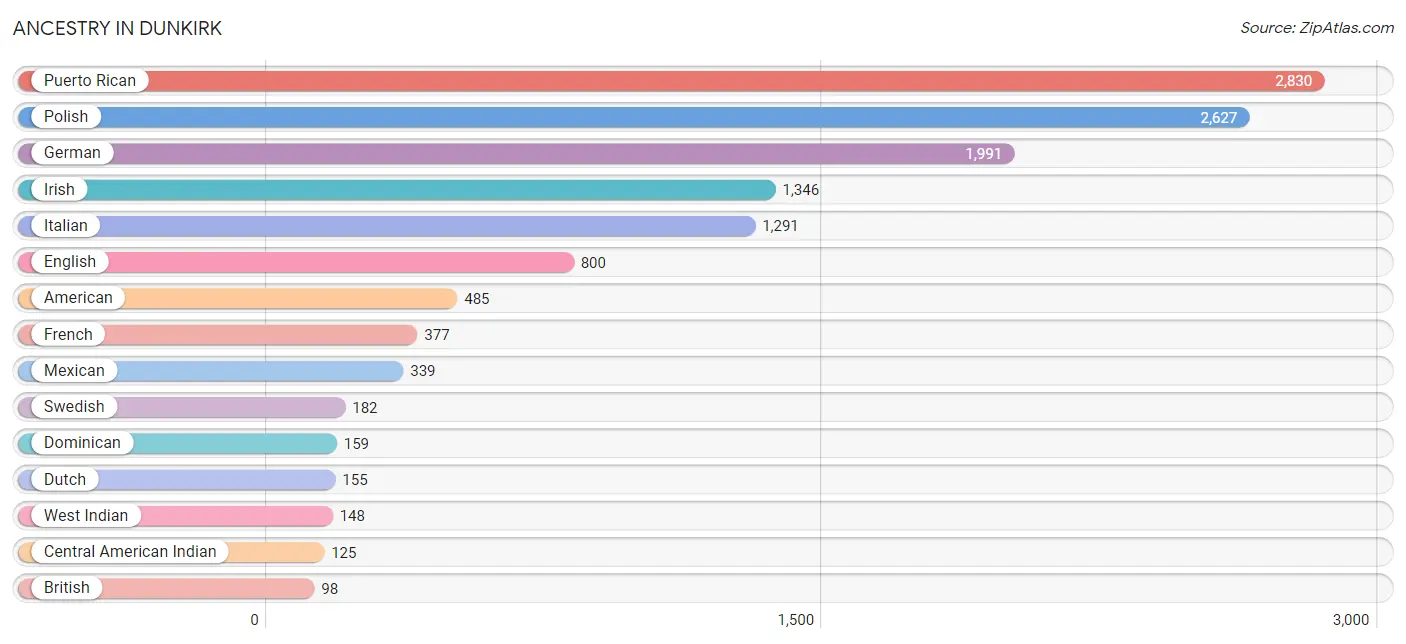
| Ancestry | # Population | % Population |
| Albanian | 29 | 0.2% |
| American | 485 | 3.8% |
| Arab | 8 | 0.1% |
| Austrian | 30 | 0.2% |
| Bhutanese | 11 | 0.1% |
| British | 98 | 0.8% |
| Canadian | 10 | 0.1% |
| Central American | 98 | 0.8% |
| Central American Indian | 125 | 1.0% |
| Cherokee | 61 | 0.5% |
| Chilean | 10 | 0.1% |
| Danish | 16 | 0.1% |
| Dominican | 159 | 1.3% |
| Dutch | 155 | 1.2% |
| Eastern European | 6 | 0.1% |
| English | 800 | 6.3% |
| European | 55 | 0.4% |
| French | 377 | 3.0% |
| French Canadian | 19 | 0.2% |
| German | 1,991 | 15.7% |
| German Russian | 16 | 0.1% |
| Greek | 31 | 0.2% |
| Haitian | 20 | 0.2% |
| Honduran | 89 | 0.7% |
| Indian (Asian) | 69 | 0.5% |
| Irish | 1,346 | 10.6% |
| Iroquois | 77 | 0.6% |
| Italian | 1,291 | 10.2% |
| Jamaican | 24 | 0.2% |
| Lithuanian | 30 | 0.2% |
| Mexican | 339 | 2.7% |
| Mexican American Indian | 18 | 0.1% |
| Nicaraguan | 9 | 0.1% |
| Northern European | 24 | 0.2% |
| Norwegian | 18 | 0.1% |
| Polish | 2,627 | 20.7% |
| Portuguese | 6 | 0.1% |
| Puerto Rican | 2,830 | 22.3% |
| Russian | 84 | 0.7% |
| Scandinavian | 12 | 0.1% |
| Scotch-Irish | 40 | 0.3% |
| Scottish | 58 | 0.5% |
| Slovak | 20 | 0.2% |
| South American | 26 | 0.2% |
| Swedish | 182 | 1.4% |
| Swiss | 5 | 0.0% |
| Syrian | 8 | 0.1% |
| Thai | 47 | 0.4% |
| Trinidadian and Tobagonian | 66 | 0.5% |
| Ukrainian | 15 | 0.1% |
| Venezuelan | 16 | 0.1% |
| Welsh | 46 | 0.4% |
| West Indian | 148 | 1.2% |
| Yugoslavian | 17 | 0.1% | View All 54 Rows |
Immigrants in Dunkirk
The most numerous immigrant groups reported in Dunkirk came from Latin America (227 | 1.8%), Caribbean (165 | 1.3%), Europe (129 | 1.0%), Dominican Republic (119 | 0.9%), and Eastern Europe (60 | 0.5%), together accounting for 5.5% of all Dunkirk residents.
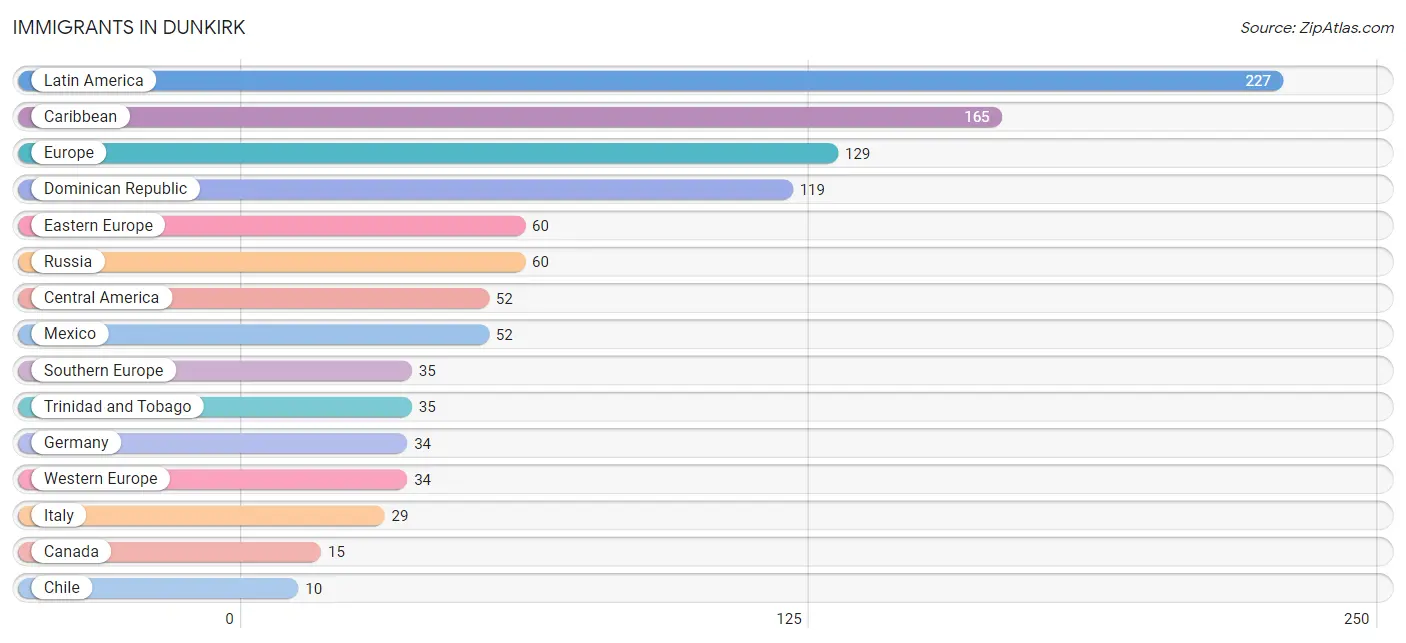
| Immigration Origin | # Population | % Population |
| Canada | 15 | 0.1% |
| Caribbean | 165 | 1.3% |
| Central America | 52 | 0.4% |
| Chile | 10 | 0.1% |
| Dominican Republic | 119 | 0.9% |
| Eastern Europe | 60 | 0.5% |
| Europe | 129 | 1.0% |
| Germany | 34 | 0.3% |
| Haiti | 7 | 0.1% |
| Italy | 29 | 0.2% |
| Jamaica | 4 | 0.0% |
| Latin America | 227 | 1.8% |
| Mexico | 52 | 0.4% |
| Portugal | 6 | 0.1% |
| Russia | 60 | 0.5% |
| South America | 10 | 0.1% |
| Southern Europe | 35 | 0.3% |
| Trinidad and Tobago | 35 | 0.3% |
| Western Europe | 34 | 0.3% | View All 19 Rows |
Sex and Age in Dunkirk
Sex and Age in Dunkirk
The most populous age groups in Dunkirk are 20 to 24 Years (677 | 10.1%) for men and 60 to 64 Years (555 | 9.3%) for women.
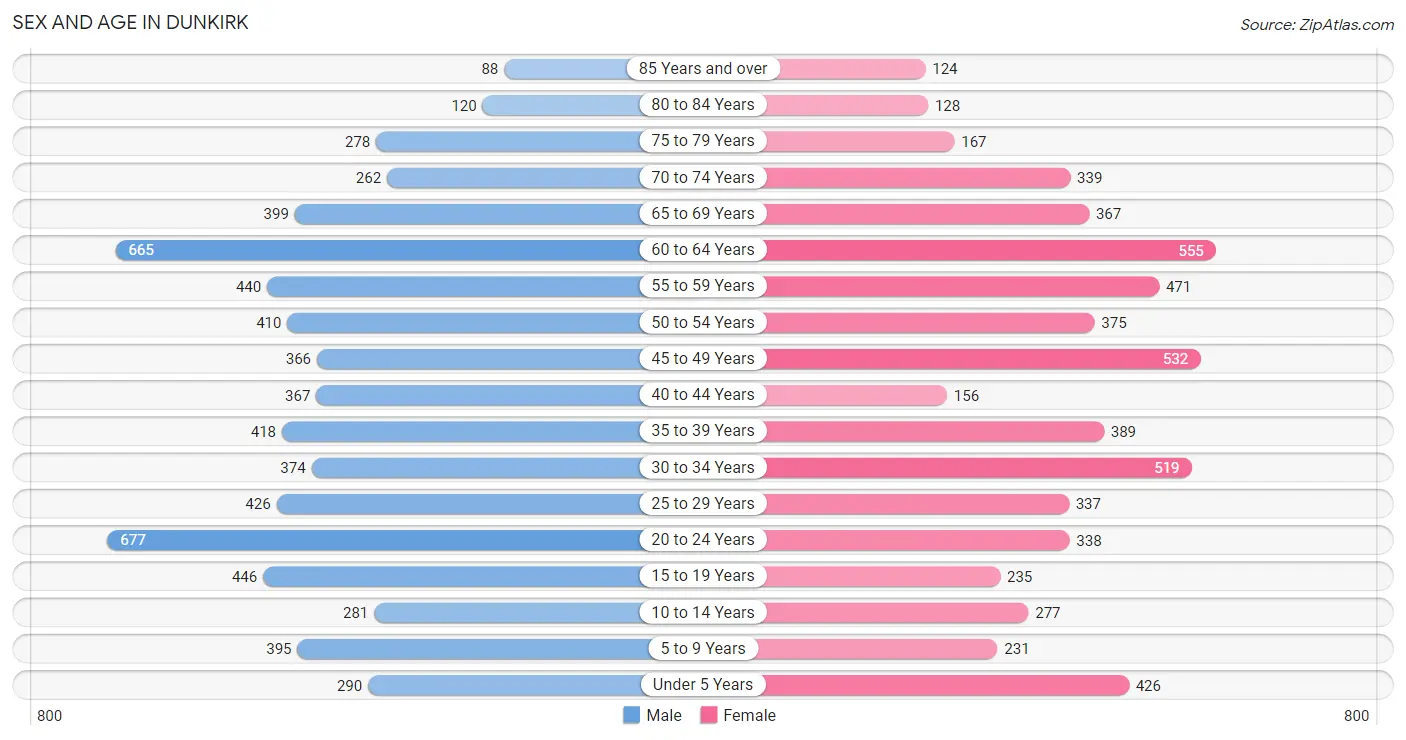
| Age Bracket | Male | Female |
| Under 5 Years | 290 (4.3%) | 426 (7.1%) |
| 5 to 9 Years | 395 (5.9%) | 231 (3.9%) |
| 10 to 14 Years | 281 (4.2%) | 277 (4.6%) |
| 15 to 19 Years | 446 (6.7%) | 235 (3.9%) |
| 20 to 24 Years | 677 (10.1%) | 338 (5.7%) |
| 25 to 29 Years | 426 (6.4%) | 337 (5.7%) |
| 30 to 34 Years | 374 (5.6%) | 519 (8.7%) |
| 35 to 39 Years | 418 (6.2%) | 389 (6.5%) |
| 40 to 44 Years | 367 (5.5%) | 156 (2.6%) |
| 45 to 49 Years | 366 (5.5%) | 532 (8.9%) |
| 50 to 54 Years | 410 (6.1%) | 375 (6.3%) |
| 55 to 59 Years | 440 (6.6%) | 471 (7.9%) |
| 60 to 64 Years | 665 (9.9%) | 555 (9.3%) |
| 65 to 69 Years | 399 (5.9%) | 367 (6.1%) |
| 70 to 74 Years | 262 (3.9%) | 339 (5.7%) |
| 75 to 79 Years | 278 (4.2%) | 167 (2.8%) |
| 80 to 84 Years | 120 (1.8%) | 128 (2.1%) |
| 85 Years and over | 88 (1.3%) | 124 (2.1%) |
| Total | 6,702 (100.0%) | 5,966 (100.0%) |
Families and Households in Dunkirk
Median Family Size in Dunkirk
The median family size in Dunkirk is 2.75 persons per family, with single female/mother families (975 | 31.3%) accounting for the largest median family size of 2.87 persons per family. On the other hand, single male/father families (443 | 14.2%) represent the smallest median family size with 2.61 persons per family.
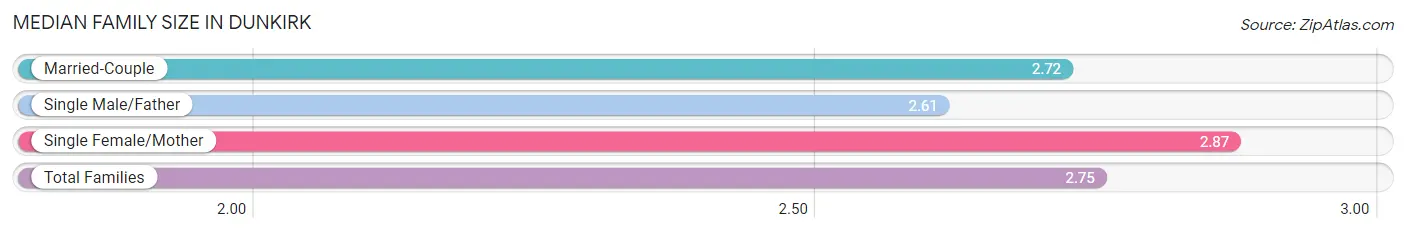
| Family Type | # Families | Family Size |
| Married-Couple | 1,698 (54.5%) | 2.72 |
| Single Male/Father | 443 (14.2%) | 2.61 |
| Single Female/Mother | 975 (31.3%) | 2.87 |
| Total Families | 3,116 (100.0%) | 2.75 |
Median Household Size in Dunkirk
The median household size in Dunkirk is 2.17 persons per household, with single female/mother households (975 | 16.9%) accounting for the largest median household size of 3.5 persons per household. non-family households (2,650 | 46.0%) represent the smallest median household size with 1.17 persons per household.
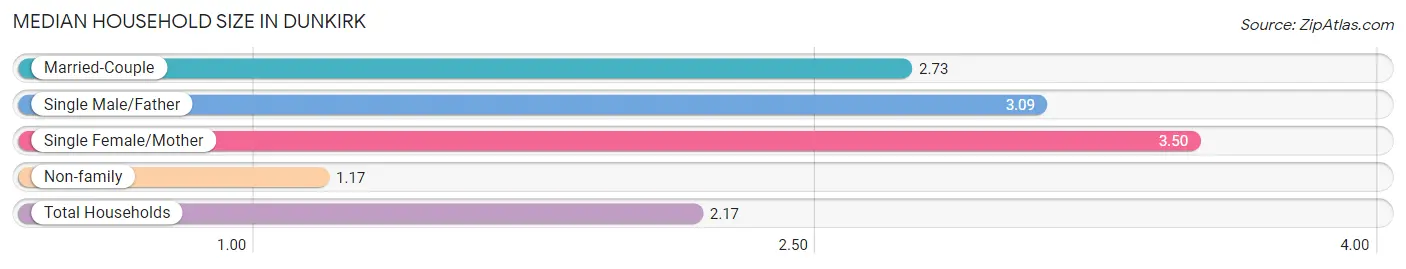
| Household Type | # Households | Household Size |
| Married-Couple | 1,698 (29.4%) | 2.73 |
| Single Male/Father | 443 (7.7%) | 3.09 |
| Single Female/Mother | 975 (16.9%) | 3.50 |
| Non-family | 2,650 (46.0%) | 1.17 |
| Total Households | 5,766 (100.0%) | 2.17 |
Household Size by Marriage Status in Dunkirk
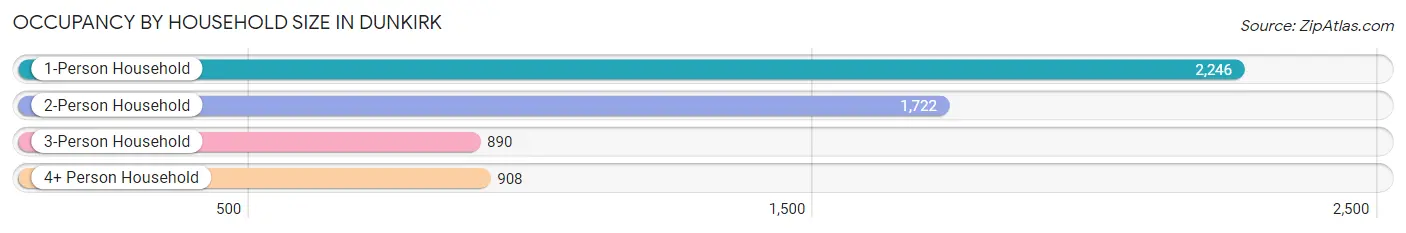
Out of a total of 5,766 households in Dunkirk, 3,116 (54.0%) are family households, while 2,650 (46.0%) are nonfamily households. The most numerous type of family households are 2-person households, comprising 1,318, and the most common type of nonfamily households are 1-person households, comprising 2,246.
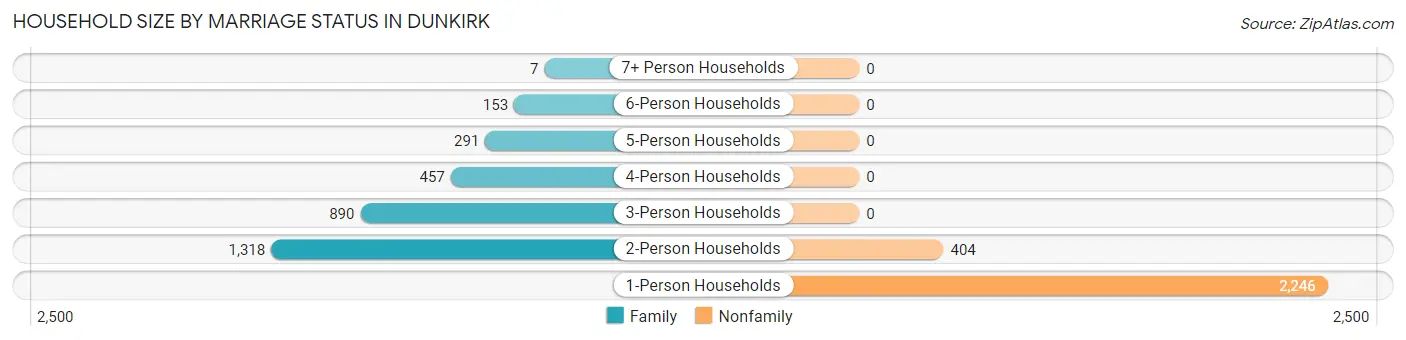
| Household Size | Family Households | Nonfamily Households |
| 1-Person Households | - | 2,246 (39.0%) |
| 2-Person Households | 1,318 (22.9%) | 404 (7.0%) |
| 3-Person Households | 890 (15.4%) | 0 (0.0%) |
| 4-Person Households | 457 (7.9%) | 0 (0.0%) |
| 5-Person Households | 291 (5.1%) | 0 (0.0%) |
| 6-Person Households | 153 (2.6%) | 0 (0.0%) |
| 7+ Person Households | 7 (0.1%) | 0 (0.0%) |
| Total | 3,116 (54.0%) | 2,650 (46.0%) |
Female Fertility in Dunkirk
Fertility by Age in Dunkirk
Average fertility rate in Dunkirk is 70.0 births per 1,000 women. Women in the age bracket of 20 to 34 years have the highest fertility rate with 95.0 births per 1,000 women. Women in the age bracket of 20 to 34 years acount for 62.4% of all women with births.
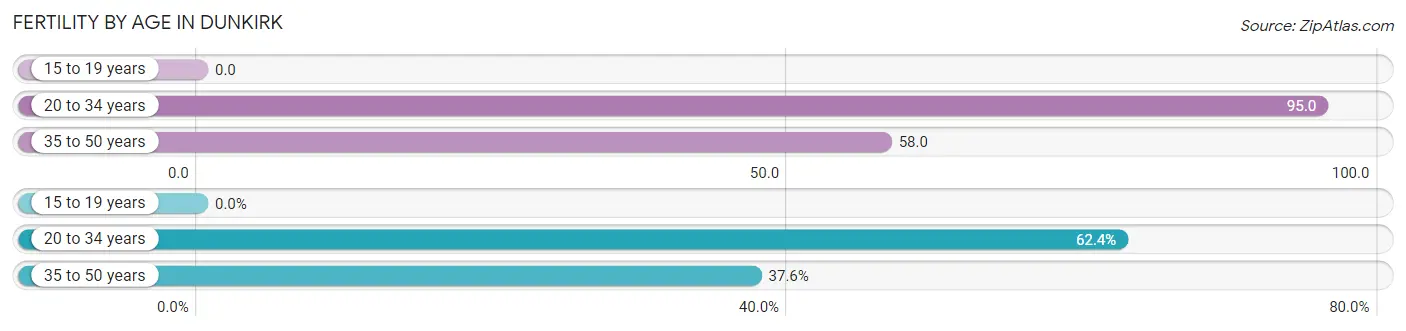
| Age Bracket | Women with Births | Births / 1,000 Women |
| 15 to 19 years | 0 (0.0%) | 0.0 |
| 20 to 34 years | 113 (62.4%) | 95.0 |
| 35 to 50 years | 68 (37.6%) | 58.0 |
| Total | 181 (100.0%) | 70.0 |
Fertility by Age by Marriage Status in Dunkirk
29.8% of women with births (181) in Dunkirk are married. The highest percentage of unmarried women with births falls into 20 to 34 years age bracket with 100.0% of them unmarried at the time of birth, while the lowest percentage of unmarried women with births belong to 35 to 50 years age bracket with 20.6% of them unmarried.
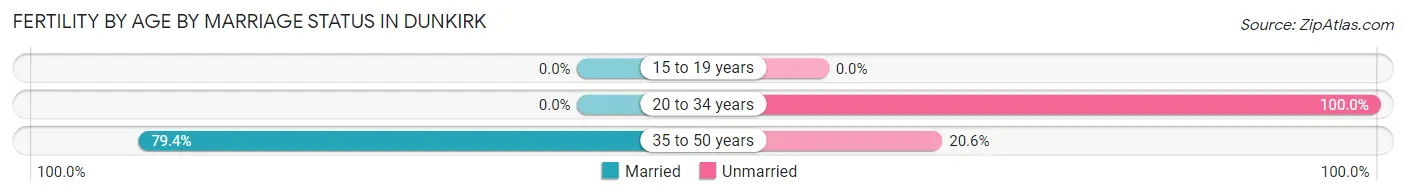
| Age Bracket | Married | Unmarried |
| 15 to 19 years | 0 (0.0%) | 0 (0.0%) |
| 20 to 34 years | 0 (0.0%) | 113 (100.0%) |
| 35 to 50 years | 54 (79.4%) | 14 (20.6%) |
| Total | 54 (29.8%) | 127 (70.2%) |
Fertility by Education in Dunkirk
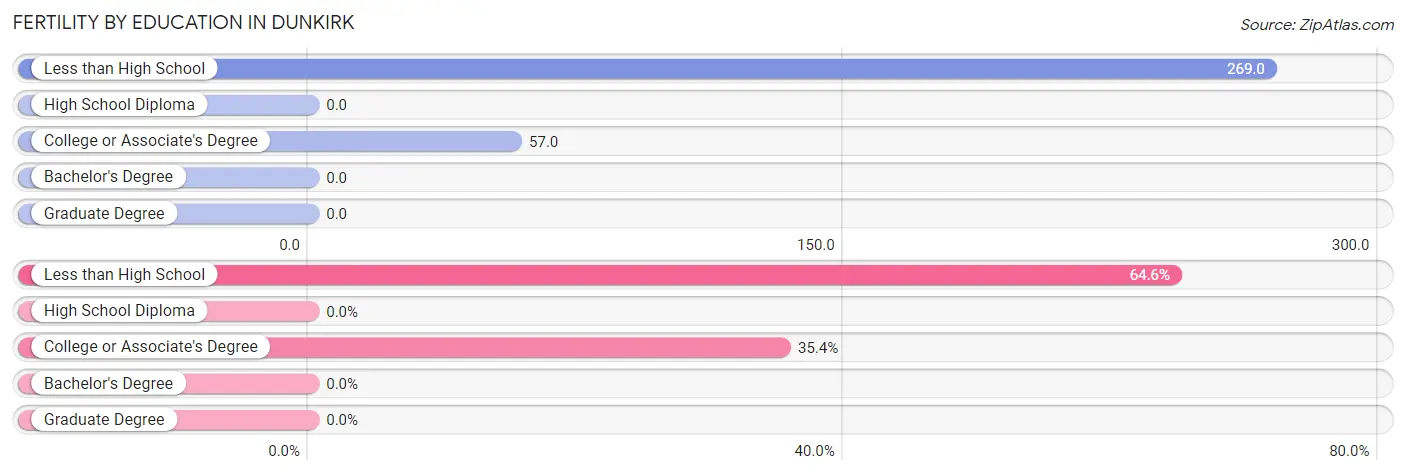
| Educational Attainment | Women with Births | Births / 1,000 Women |
| Less than High School | 117 (64.6%) | 269.0 |
| High School Diploma | 0 (0.0%) | 0.0 |
| College or Associate's Degree | 64 (35.4%) | 57.0 |
| Bachelor's Degree | 0 (0.0%) | 0.0 |
| Graduate Degree | 0 (0.0%) | 0.0 |
| Total | 181 (100.0%) | 70.0 |
Fertility by Education by Marriage Status in Dunkirk
70.2% of women with births in Dunkirk are unmarried. Women with the educational attainment of less than high school are most likely to be married with 38.5% of them married at childbirth, while women with the educational attainment of college or associate's degree are least likely to be married with 85.9% of them unmarried at childbirth.
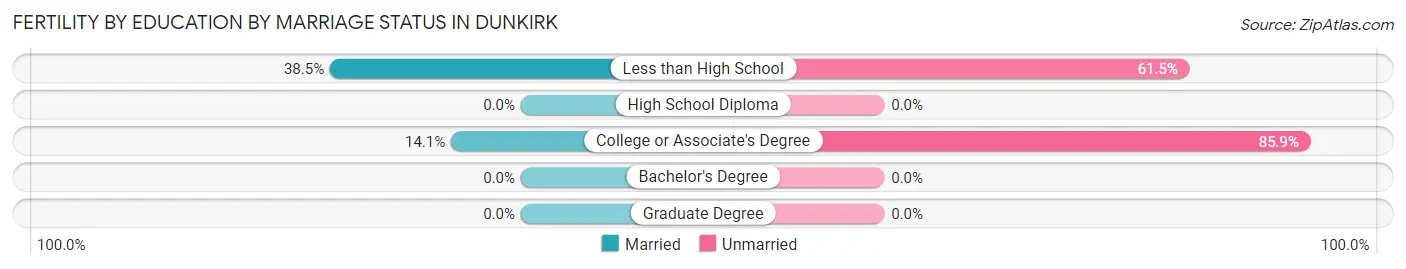
| Educational Attainment | Married | Unmarried |
| Less than High School | 45 (38.5%) | 72 (61.5%) |
| High School Diploma | 0 (0.0%) | 0 (0.0%) |
| College or Associate's Degree | 9 (14.1%) | 55 (85.9%) |
| Bachelor's Degree | 0 (0.0%) | 0 (0.0%) |
| Graduate Degree | 0 (0.0%) | 0 (0.0%) |
| Total | 54 (29.8%) | 127 (70.2%) |
Employment Characteristics in Dunkirk
Employment by Class of Employer in Dunkirk
Among the 5,405 employed individuals in Dunkirk, private company employees (3,268 | 60.5%), not-for-profit organizations (703 | 13.0%), and local government employees (625 | 11.6%) make up the most common classes of employment.
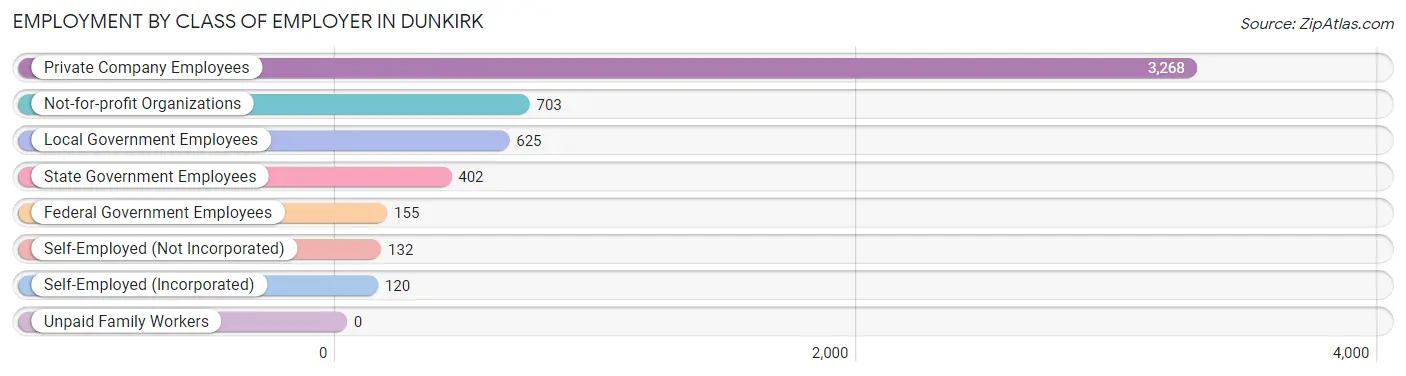
| Employer Class | # Employees | % Employees |
| Private Company Employees | 3,268 | 60.5% |
| Self-Employed (Incorporated) | 120 | 2.2% |
| Self-Employed (Not Incorporated) | 132 | 2.4% |
| Not-for-profit Organizations | 703 | 13.0% |
| Local Government Employees | 625 | 11.6% |
| State Government Employees | 402 | 7.4% |
| Federal Government Employees | 155 | 2.9% |
| Unpaid Family Workers | 0 | 0.0% |
| Total | 5,405 | 100.0% |
Employment Status by Age in Dunkirk
According to the labor force statistics for Dunkirk, out of the total population over 16 years of age (10,576), 55.2% or 5,838 individuals are in the labor force, with 4.6% or 269 of them unemployed. The age group with the highest labor force participation rate is 20 to 24 years, with 78.4% or 796 individuals in the labor force. Within the labor force, the 30 to 34 years age range has the highest percentage of unemployed individuals, with 13.3% or 86 of them being unemployed.
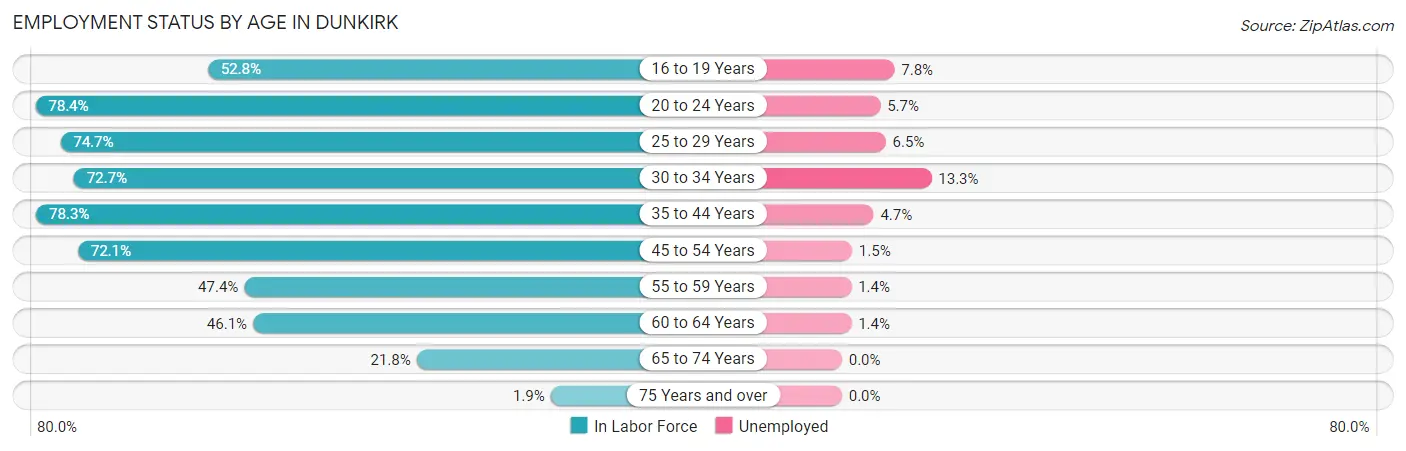
| Age Bracket | In Labor Force | Unemployed |
| 16 to 19 Years | 258 (52.8%) | 20 (7.8%) |
| 20 to 24 Years | 796 (78.4%) | 45 (5.7%) |
| 25 to 29 Years | 570 (74.7%) | 37 (6.5%) |
| 30 to 34 Years | 649 (72.7%) | 86 (13.3%) |
| 35 to 44 Years | 1,041 (78.3%) | 49 (4.7%) |
| 45 to 54 Years | 1,213 (72.1%) | 18 (1.5%) |
| 55 to 59 Years | 432 (47.4%) | 6 (1.4%) |
| 60 to 64 Years | 562 (46.1%) | 8 (1.4%) |
| 65 to 74 Years | 298 (21.8%) | 0 (0.0%) |
| 75 Years and over | 17 (1.9%) | 0 (0.0%) |
| Total | 5,838 (55.2%) | 269 (4.6%) |
Employment Status by Educational Attainment in Dunkirk
According to labor force statistics for Dunkirk, 65.7% of individuals (4,468) out of the total population between 25 and 64 years of age (6,800) are in the labor force, with 4.6% or 206 of them being unemployed. The group with the highest labor force participation rate are those with the educational attainment of bachelor's degree or higher, with 77.2% or 919 individuals in the labor force. Within the labor force, individuals with college / associate degree education have the highest percentage of unemployment, with 7.4% or 131 of them being unemployed.
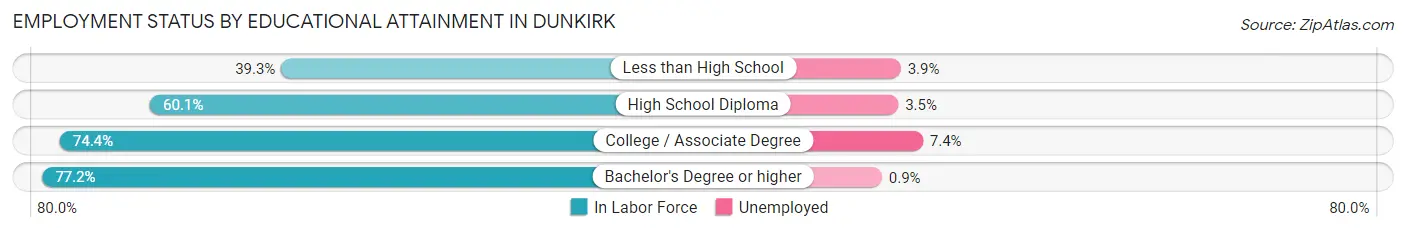
| Educational Attainment | In Labor Force | Unemployed |
| Less than High School | 308 (39.3%) | 31 (3.9%) |
| High School Diploma | 1,468 (60.1%) | 85 (3.5%) |
| College / Associate Degree | 1,774 (74.4%) | 176 (7.4%) |
| Bachelor's Degree or higher | 919 (77.2%) | 11 (0.9%) |
| Total | 4,468 (65.7%) | 313 (4.6%) |
Employment Occupations by Sex in Dunkirk
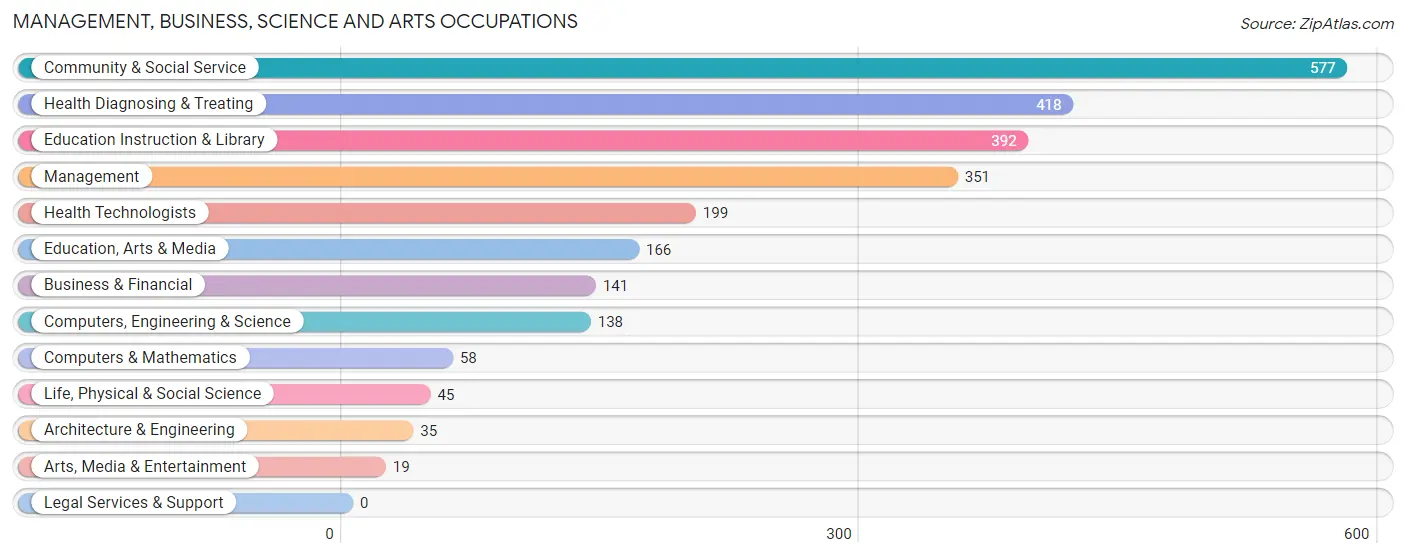
Management, Business, Science and Arts Occupations
The most common Management, Business, Science and Arts occupations in Dunkirk are Community & Social Service (577 | 10.4%), Health Diagnosing & Treating (418 | 7.5%), Education Instruction & Library (392 | 7.0%), Management (351 | 6.3%), and Health Technologists (199 | 3.6%).
Management, Business, Science and Arts Occupations by Sex
Within the Management, Business, Science and Arts occupations in Dunkirk, the most male-oriented occupations are Architecture & Engineering (100.0%), Life, Physical & Social Science (100.0%), and Computers, Engineering & Science (75.4%), while the most female-oriented occupations are Arts, Media & Entertainment (100.0%), Health Diagnosing & Treating (95.5%), and Health Technologists (90.4%).
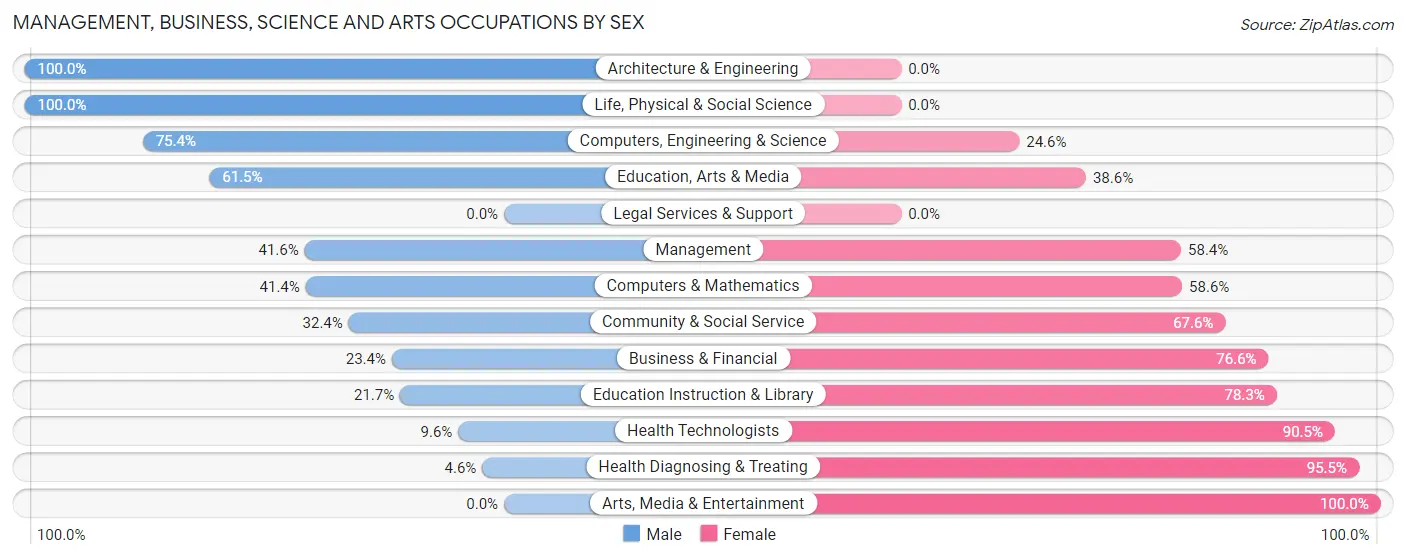
| Occupation | Male | Female |
| Management | 146 (41.6%) | 205 (58.4%) |
| Business & Financial | 33 (23.4%) | 108 (76.6%) |
| Computers, Engineering & Science | 104 (75.4%) | 34 (24.6%) |
| Computers & Mathematics | 24 (41.4%) | 34 (58.6%) |
| Architecture & Engineering | 35 (100.0%) | 0 (0.0%) |
| Life, Physical & Social Science | 45 (100.0%) | 0 (0.0%) |
| Community & Social Service | 187 (32.4%) | 390 (67.6%) |
| Education, Arts & Media | 102 (61.5%) | 64 (38.6%) |
| Legal Services & Support | 0 (0.0%) | 0 (0.0%) |
| Education Instruction & Library | 85 (21.7%) | 307 (78.3%) |
| Arts, Media & Entertainment | 0 (0.0%) | 19 (100.0%) |
| Health Diagnosing & Treating | 19 (4.5%) | 399 (95.5%) |
| Health Technologists | 19 (9.6%) | 180 (90.4%) |
| Total (Category) | 489 (30.1%) | 1,136 (69.9%) |
| Total (Overall) | 3,083 (55.4%) | 2,485 (44.6%) |
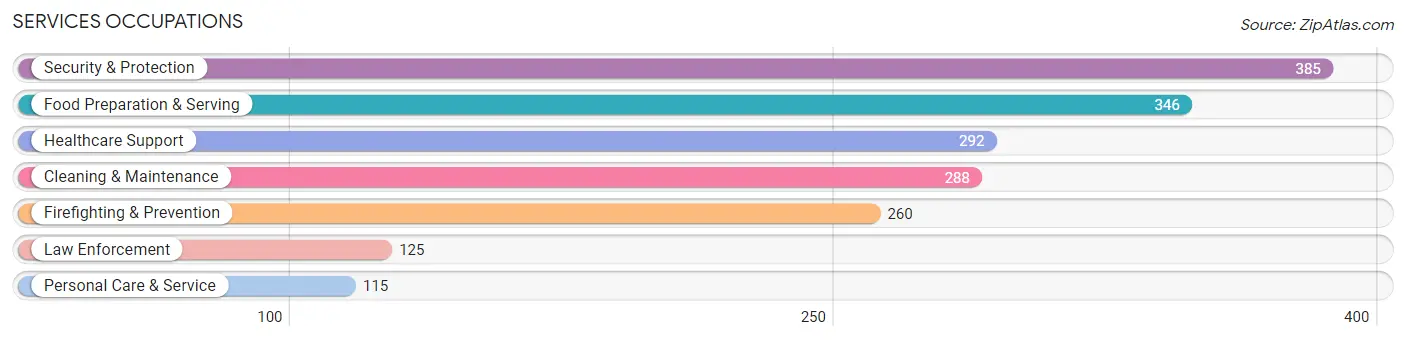
Services Occupations
The most common Services occupations in Dunkirk are Security & Protection (385 | 6.9%), Food Preparation & Serving (346 | 6.2%), Healthcare Support (292 | 5.2%), Cleaning & Maintenance (288 | 5.2%), and Firefighting & Prevention (260 | 4.7%).
Services Occupations by Sex
Within the Services occupations in Dunkirk, the most male-oriented occupations are Law Enforcement (100.0%), Security & Protection (74.8%), and Cleaning & Maintenance (73.3%), while the most female-oriented occupations are Personal Care & Service (67.0%), Healthcare Support (54.8%), and Food Preparation & Serving (46.8%).
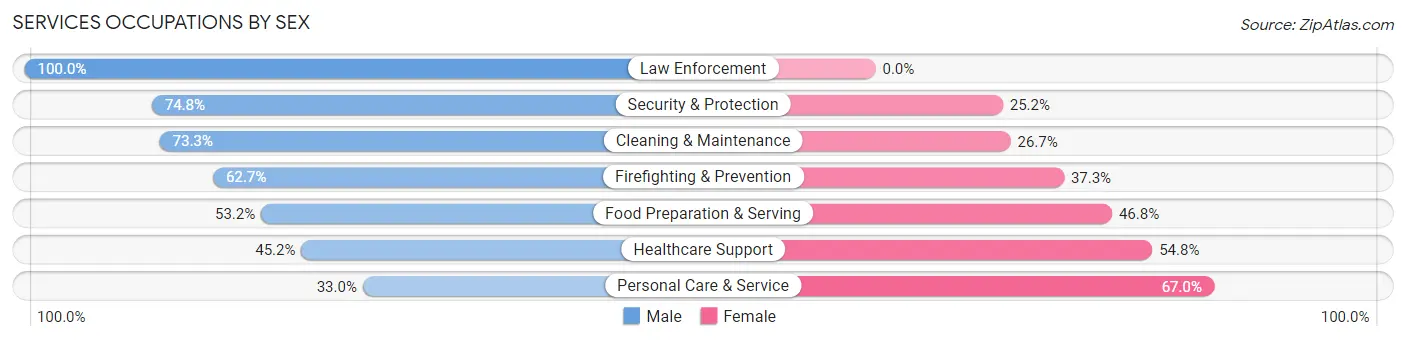
| Occupation | Male | Female |
| Healthcare Support | 132 (45.2%) | 160 (54.8%) |
| Security & Protection | 288 (74.8%) | 97 (25.2%) |
| Firefighting & Prevention | 163 (62.7%) | 97 (37.3%) |
| Law Enforcement | 125 (100.0%) | 0 (0.0%) |
| Food Preparation & Serving | 184 (53.2%) | 162 (46.8%) |
| Cleaning & Maintenance | 211 (73.3%) | 77 (26.7%) |
| Personal Care & Service | 38 (33.0%) | 77 (67.0%) |
| Total (Category) | 853 (59.8%) | 573 (40.2%) |
| Total (Overall) | 3,083 (55.4%) | 2,485 (44.6%) |
Sales and Office Occupations
The most common Sales and Office occupations in Dunkirk are Office & Administration (447 | 8.0%), and Sales & Related (315 | 5.7%).
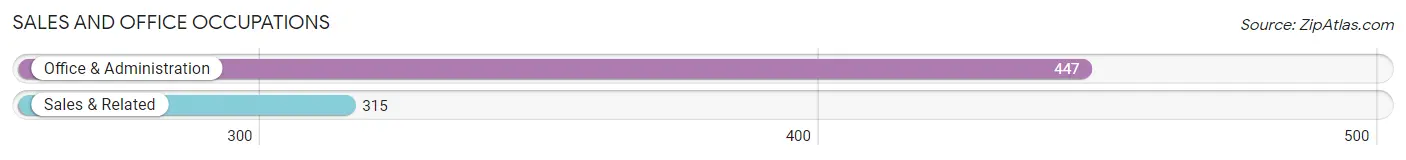
Sales and Office Occupations by Sex
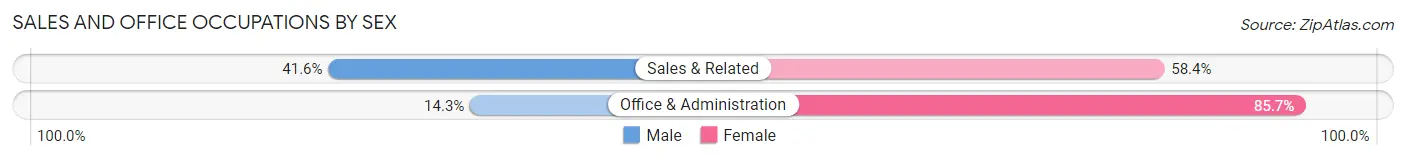
| Occupation | Male | Female |
| Sales & Related | 131 (41.6%) | 184 (58.4%) |
| Office & Administration | 64 (14.3%) | 383 (85.7%) |
| Total (Category) | 195 (25.6%) | 567 (74.4%) |
| Total (Overall) | 3,083 (55.4%) | 2,485 (44.6%) |
Natural Resources, Construction and Maintenance Occupations
The most common Natural Resources, Construction and Maintenance occupations in Dunkirk are Installation, Maintenance & Repair (245 | 4.4%), Construction & Extraction (118 | 2.1%), and Farming, Fishing & Forestry (62 | 1.1%).
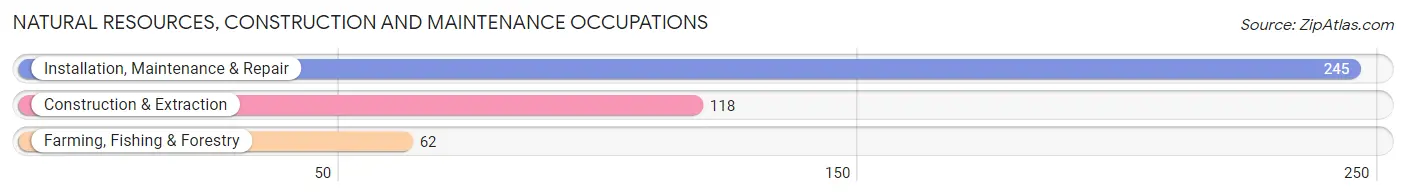
Natural Resources, Construction and Maintenance Occupations by Sex
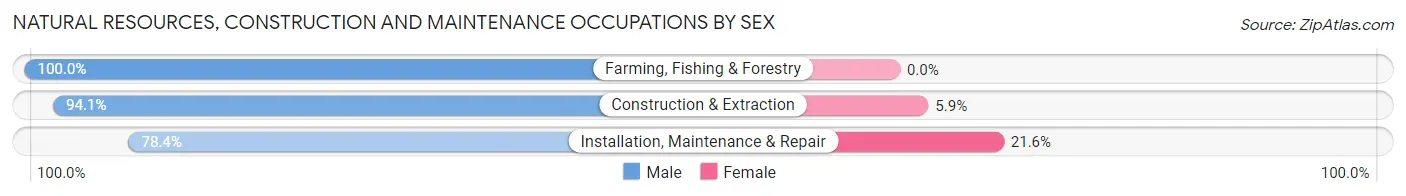
| Occupation | Male | Female |
| Farming, Fishing & Forestry | 62 (100.0%) | 0 (0.0%) |
| Construction & Extraction | 111 (94.1%) | 7 (5.9%) |
| Installation, Maintenance & Repair | 192 (78.4%) | 53 (21.6%) |
| Total (Category) | 365 (85.9%) | 60 (14.1%) |
| Total (Overall) | 3,083 (55.4%) | 2,485 (44.6%) |
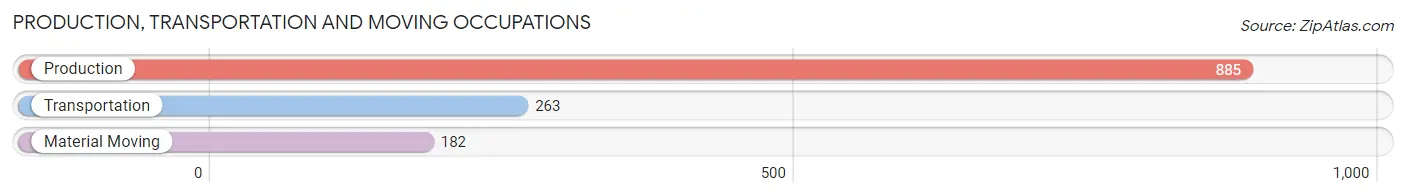
Production, Transportation and Moving Occupations
The most common Production, Transportation and Moving occupations in Dunkirk are Production (885 | 15.9%), Transportation (263 | 4.7%), and Material Moving (182 | 3.3%).
Production, Transportation and Moving Occupations by Sex
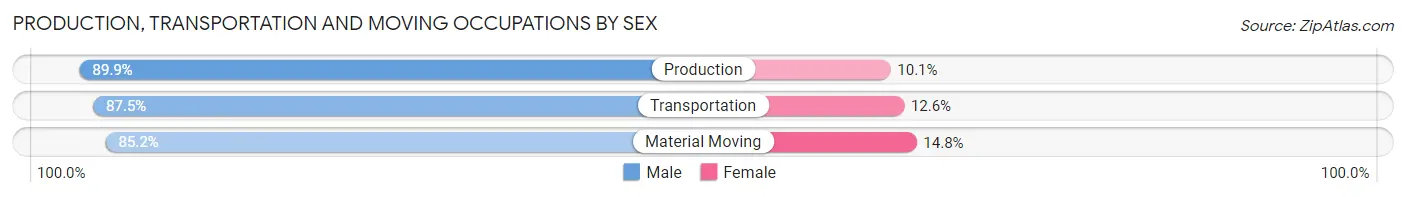
| Occupation | Male | Female |
| Production | 796 (89.9%) | 89 (10.1%) |
| Transportation | 230 (87.5%) | 33 (12.6%) |
| Material Moving | 155 (85.2%) | 27 (14.8%) |
| Total (Category) | 1,181 (88.8%) | 149 (11.2%) |
| Total (Overall) | 3,083 (55.4%) | 2,485 (44.6%) |
Employment Industries by Sex in Dunkirk
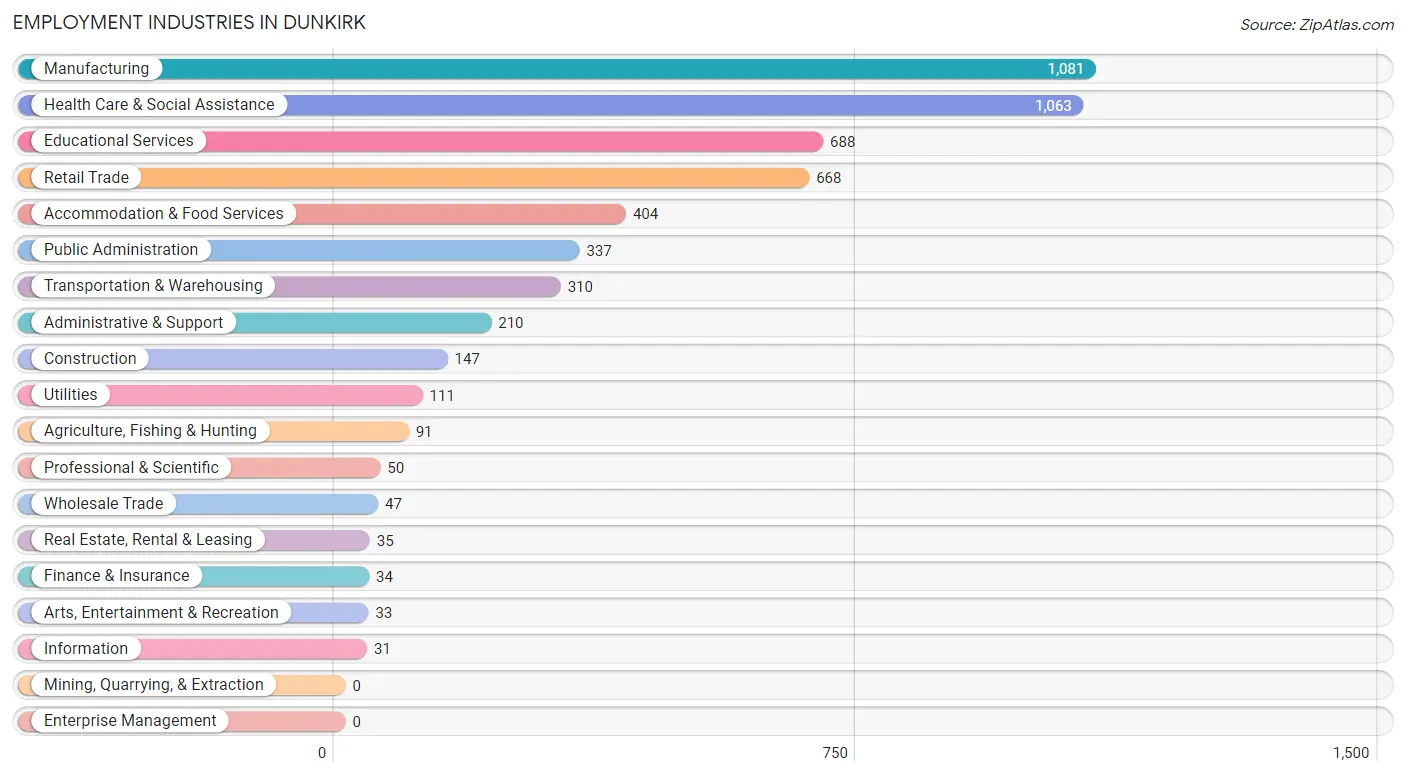
Employment Industries in Dunkirk
The major employment industries in Dunkirk include Manufacturing (1,081 | 19.4%), Health Care & Social Assistance (1,063 | 19.1%), Educational Services (688 | 12.4%), Retail Trade (668 | 12.0%), and Accommodation & Food Services (404 | 7.3%).
Employment Industries by Sex in Dunkirk
The Dunkirk industries that see more men than women are Wholesale Trade (100.0%), Utilities (100.0%), and Real Estate, Rental & Leasing (100.0%), whereas the industries that tend to have a higher number of women are Information (100.0%), Finance & Insurance (100.0%), and Health Care & Social Assistance (77.7%).
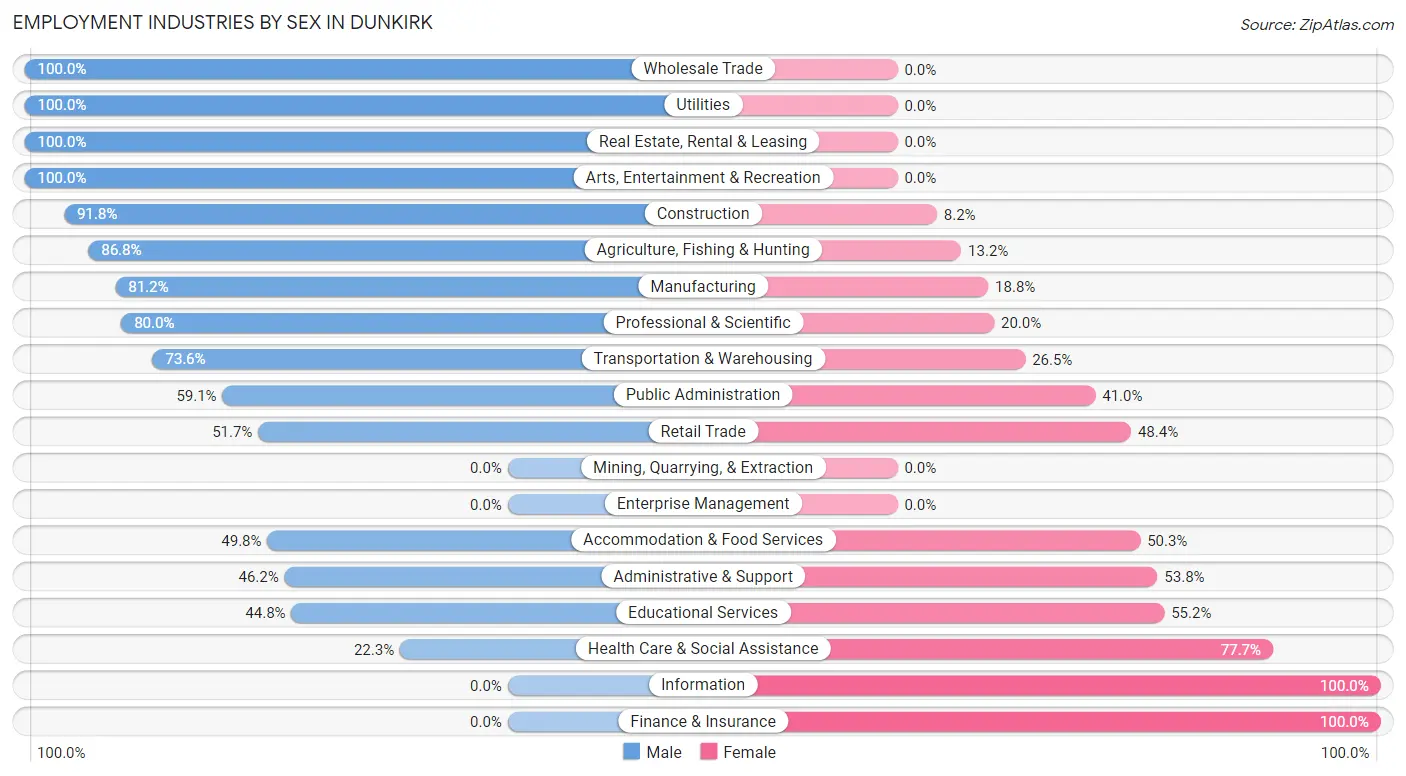
| Industry | Male | Female |
| Agriculture, Fishing & Hunting | 79 (86.8%) | 12 (13.2%) |
| Mining, Quarrying, & Extraction | 0 (0.0%) | 0 (0.0%) |
| Construction | 135 (91.8%) | 12 (8.2%) |
| Manufacturing | 878 (81.2%) | 203 (18.8%) |
| Wholesale Trade | 47 (100.0%) | 0 (0.0%) |
| Retail Trade | 345 (51.6%) | 323 (48.3%) |
| Transportation & Warehousing | 228 (73.6%) | 82 (26.5%) |
| Utilities | 111 (100.0%) | 0 (0.0%) |
| Information | 0 (0.0%) | 31 (100.0%) |
| Finance & Insurance | 0 (0.0%) | 34 (100.0%) |
| Real Estate, Rental & Leasing | 35 (100.0%) | 0 (0.0%) |
| Professional & Scientific | 40 (80.0%) | 10 (20.0%) |
| Enterprise Management | 0 (0.0%) | 0 (0.0%) |
| Administrative & Support | 97 (46.2%) | 113 (53.8%) |
| Educational Services | 308 (44.8%) | 380 (55.2%) |
| Health Care & Social Assistance | 237 (22.3%) | 826 (77.7%) |
| Arts, Entertainment & Recreation | 33 (100.0%) | 0 (0.0%) |
| Accommodation & Food Services | 201 (49.7%) | 203 (50.2%) |
| Public Administration | 199 (59.1%) | 138 (40.9%) |
| Total | 3,083 (55.4%) | 2,485 (44.6%) |
Education in Dunkirk
School Enrollment in Dunkirk
The most common levels of schooling among the 2,427 students in Dunkirk are college / undergraduate (590 | 24.3%), high school (584 | 24.1%), and middle school (407 | 16.8%).
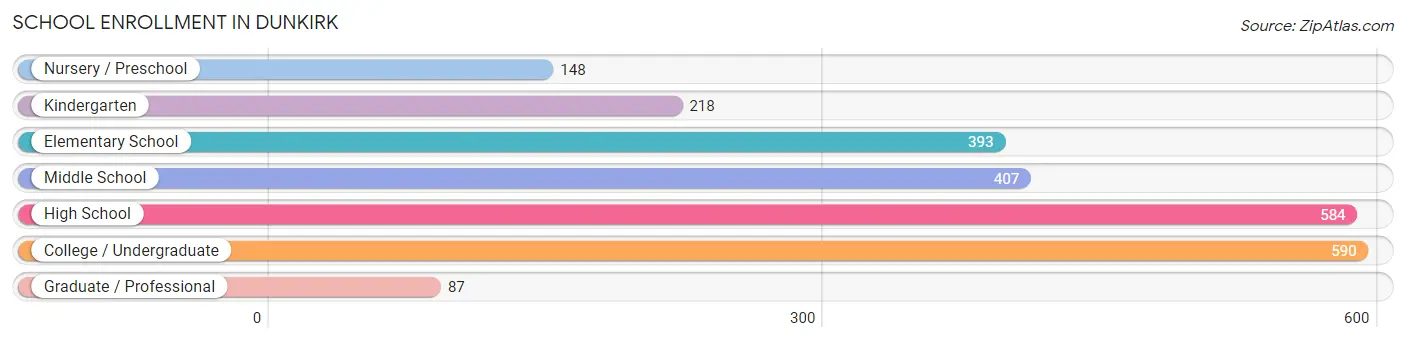
| School Level | # Students | % Students |
| Nursery / Preschool | 148 | 6.1% |
| Kindergarten | 218 | 9.0% |
| Elementary School | 393 | 16.2% |
| Middle School | 407 | 16.8% |
| High School | 584 | 24.1% |
| College / Undergraduate | 590 | 24.3% |
| Graduate / Professional | 87 | 3.6% |
| Total | 2,427 | 100.0% |
School Enrollment by Age by Funding Source in Dunkirk
Out of a total of 2,427 students who are enrolled in schools in Dunkirk, 175 (7.2%) attend a private institution, while the remaining 2,252 (92.8%) are enrolled in public schools. The age group of 35 years and over has the highest likelihood of being enrolled in private schools, with 76 (52.8% in the age bracket) enrolled. Conversely, the age group of 15 to 17 year olds has the lowest likelihood of being enrolled in a private school, with 396 (100.0% in the age bracket) attending a public institution.
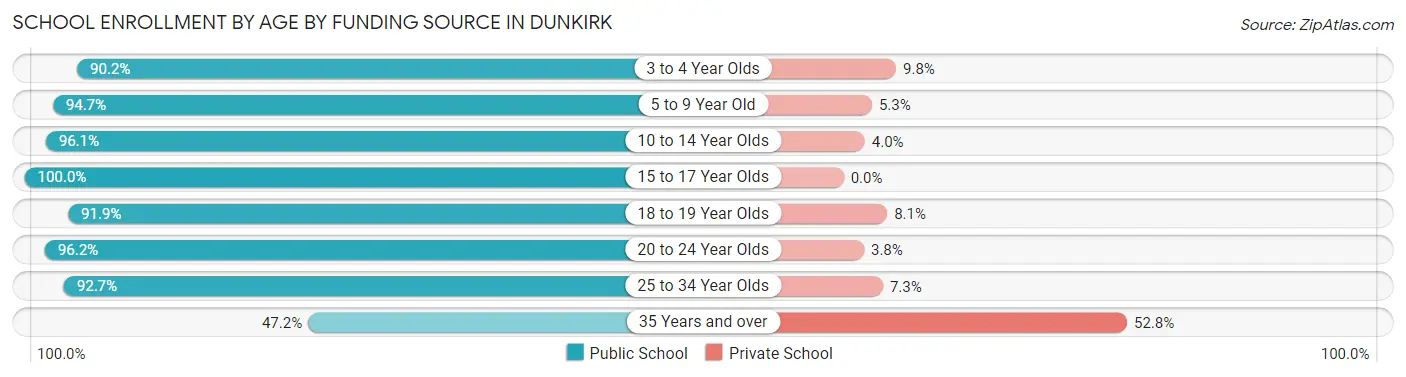
| Age Bracket | Public School | Private School |
| 3 to 4 Year Olds | 120 (90.2%) | 13 (9.8%) |
| 5 to 9 Year Old | 593 (94.7%) | 33 (5.3%) |
| 10 to 14 Year Olds | 486 (96.1%) | 20 (4.0%) |
| 15 to 17 Year Olds | 396 (100.0%) | 0 (0.0%) |
| 18 to 19 Year Olds | 170 (91.9%) | 15 (8.1%) |
| 20 to 24 Year Olds | 381 (96.2%) | 15 (3.8%) |
| 25 to 34 Year Olds | 38 (92.7%) | 3 (7.3%) |
| 35 Years and over | 68 (47.2%) | 76 (52.8%) |
| Total | 2,252 (92.8%) | 175 (7.2%) |
Educational Attainment by Field of Study in Dunkirk
Education (392 | 22.8%), business (252 | 14.6%), visual & performing arts (144 | 8.4%), arts & humanities (139 | 8.1%), and social sciences (127 | 7.4%) are the most common fields of study among 1,721 individuals in Dunkirk who have obtained a bachelor's degree or higher.
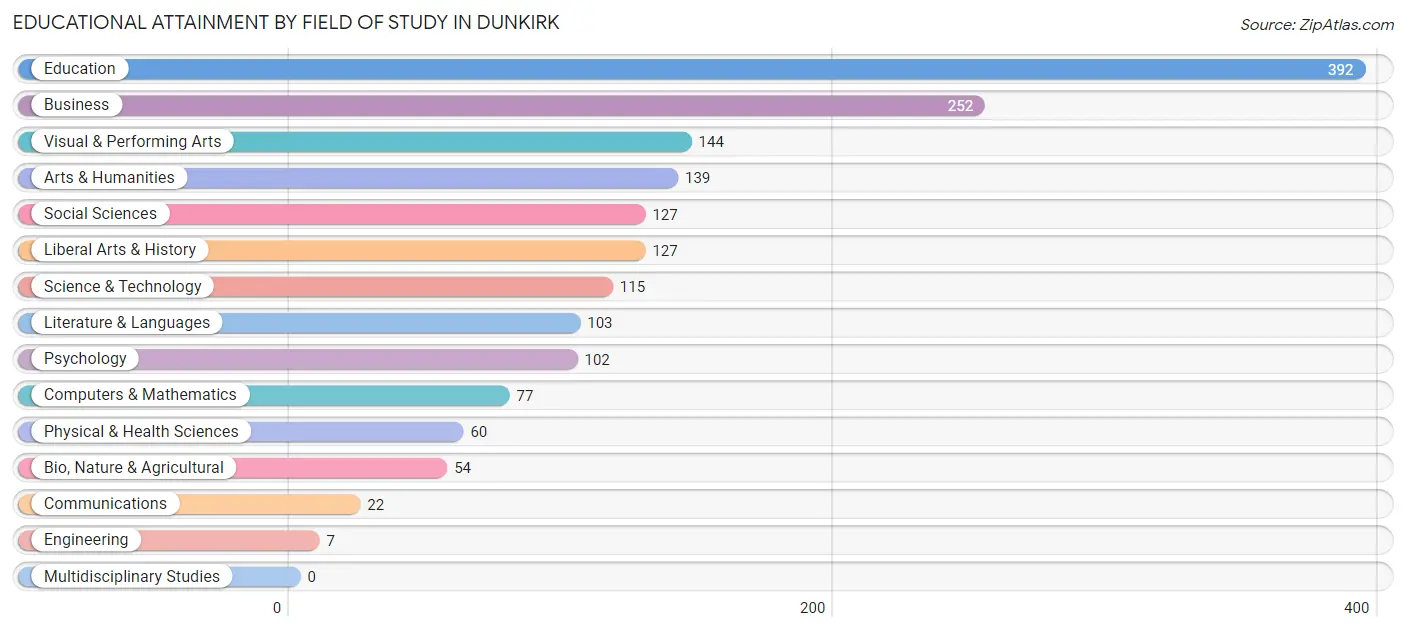
| Field of Study | # Graduates | % Graduates |
| Computers & Mathematics | 77 | 4.5% |
| Bio, Nature & Agricultural | 54 | 3.1% |
| Physical & Health Sciences | 60 | 3.5% |
| Psychology | 102 | 5.9% |
| Social Sciences | 127 | 7.4% |
| Engineering | 7 | 0.4% |
| Multidisciplinary Studies | 0 | 0.0% |
| Science & Technology | 115 | 6.7% |
| Business | 252 | 14.6% |
| Education | 392 | 22.8% |
| Literature & Languages | 103 | 6.0% |
| Liberal Arts & History | 127 | 7.4% |
| Visual & Performing Arts | 144 | 8.4% |
| Communications | 22 | 1.3% |
| Arts & Humanities | 139 | 8.1% |
| Total | 1,721 | 100.0% |
Transportation & Commute in Dunkirk
Vehicle Availability by Sex in Dunkirk
The most prevalent vehicle ownership categories in Dunkirk are males with 2 vehicles (1,365, accounting for 44.7%) and females with 2 vehicles (931, making up 58.2%).
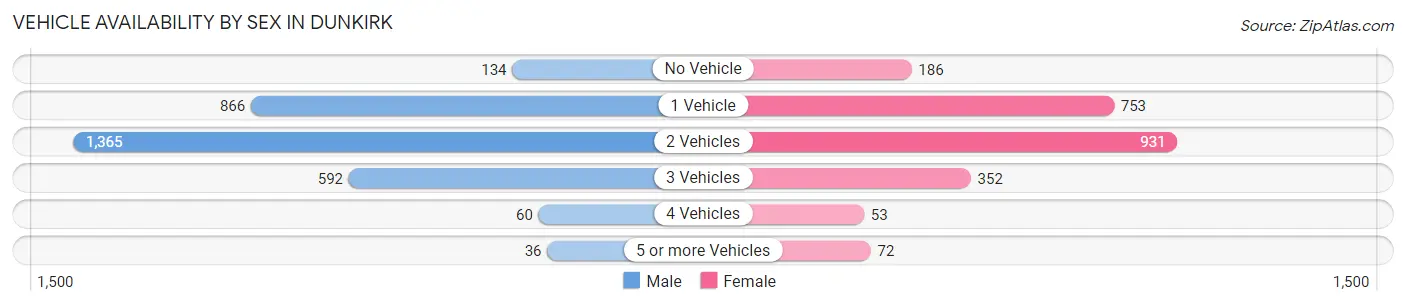
| Vehicles Available | Male | Female |
| No Vehicle | 134 (4.4%) | 186 (7.9%) |
| 1 Vehicle | 866 (28.4%) | 753 (32.1%) |
| 2 Vehicles | 1,365 (44.7%) | 931 (39.7%) |
| 3 Vehicles | 592 (19.4%) | 352 (15.0%) |
| 4 Vehicles | 60 (2.0%) | 53 (2.3%) |
| 5 or more Vehicles | 36 (1.2%) | 72 (3.1%) |
| Total | 3,053 (100.0%) | 2,347 (100.0%) |
Commute Time in Dunkirk
The most frequently occuring commute durations in Dunkirk are 5 to 9 minutes (1,723 commuters, 33.1%), 10 to 14 minutes (1,254 commuters, 24.1%), and 15 to 19 minutes (659 commuters, 12.7%).
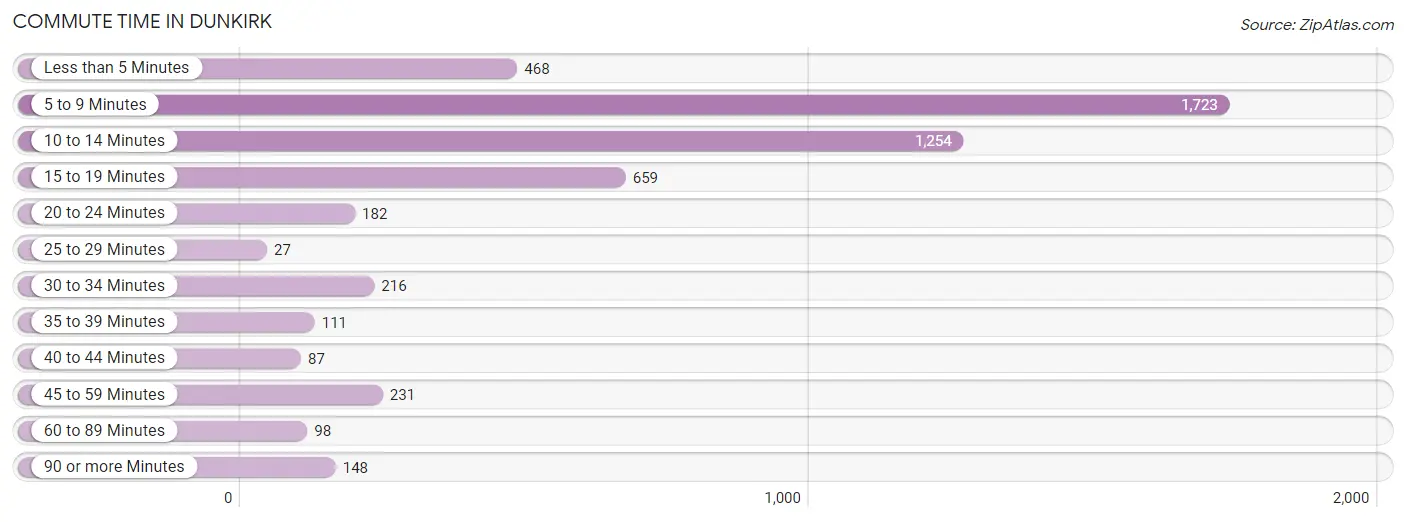
| Commute Time | # Commuters | % Commuters |
| Less than 5 Minutes | 468 | 9.0% |
| 5 to 9 Minutes | 1,723 | 33.1% |
| 10 to 14 Minutes | 1,254 | 24.1% |
| 15 to 19 Minutes | 659 | 12.7% |
| 20 to 24 Minutes | 182 | 3.5% |
| 25 to 29 Minutes | 27 | 0.5% |
| 30 to 34 Minutes | 216 | 4.2% |
| 35 to 39 Minutes | 111 | 2.1% |
| 40 to 44 Minutes | 87 | 1.7% |
| 45 to 59 Minutes | 231 | 4.4% |
| 60 to 89 Minutes | 98 | 1.9% |
| 90 or more Minutes | 148 | 2.8% |
Commute Time by Sex in Dunkirk
The most common commute times in Dunkirk are 5 to 9 minutes (946 commuters, 32.0%) for males and 5 to 9 minutes (777 commuters, 34.6%) for females.
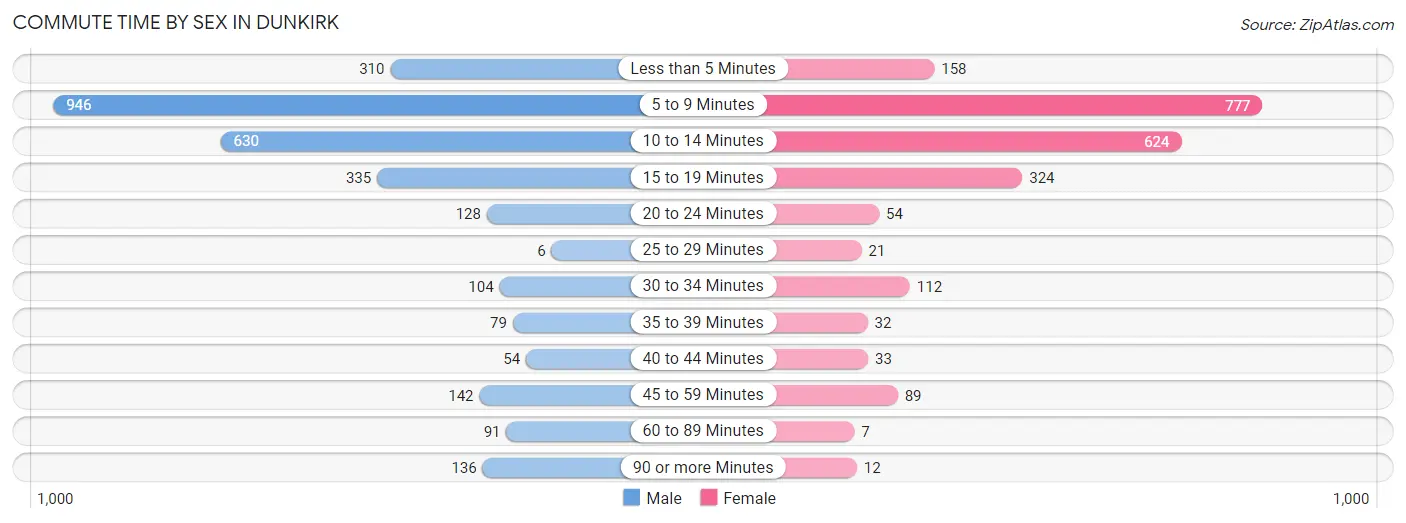
| Commute Time | Male | Female |
| Less than 5 Minutes | 310 (10.5%) | 158 (7.0%) |
| 5 to 9 Minutes | 946 (32.0%) | 777 (34.6%) |
| 10 to 14 Minutes | 630 (21.3%) | 624 (27.8%) |
| 15 to 19 Minutes | 335 (11.3%) | 324 (14.4%) |
| 20 to 24 Minutes | 128 (4.3%) | 54 (2.4%) |
| 25 to 29 Minutes | 6 (0.2%) | 21 (0.9%) |
| 30 to 34 Minutes | 104 (3.5%) | 112 (5.0%) |
| 35 to 39 Minutes | 79 (2.7%) | 32 (1.4%) |
| 40 to 44 Minutes | 54 (1.8%) | 33 (1.5%) |
| 45 to 59 Minutes | 142 (4.8%) | 89 (4.0%) |
| 60 to 89 Minutes | 91 (3.1%) | 7 (0.3%) |
| 90 or more Minutes | 136 (4.6%) | 12 (0.5%) |
Time of Departure to Work by Sex in Dunkirk
The most frequent times of departure to work in Dunkirk are 12:00 PM to 3:59 PM (513, 17.3%) for males and 7:30 AM to 7:59 AM (358, 16.0%) for females.
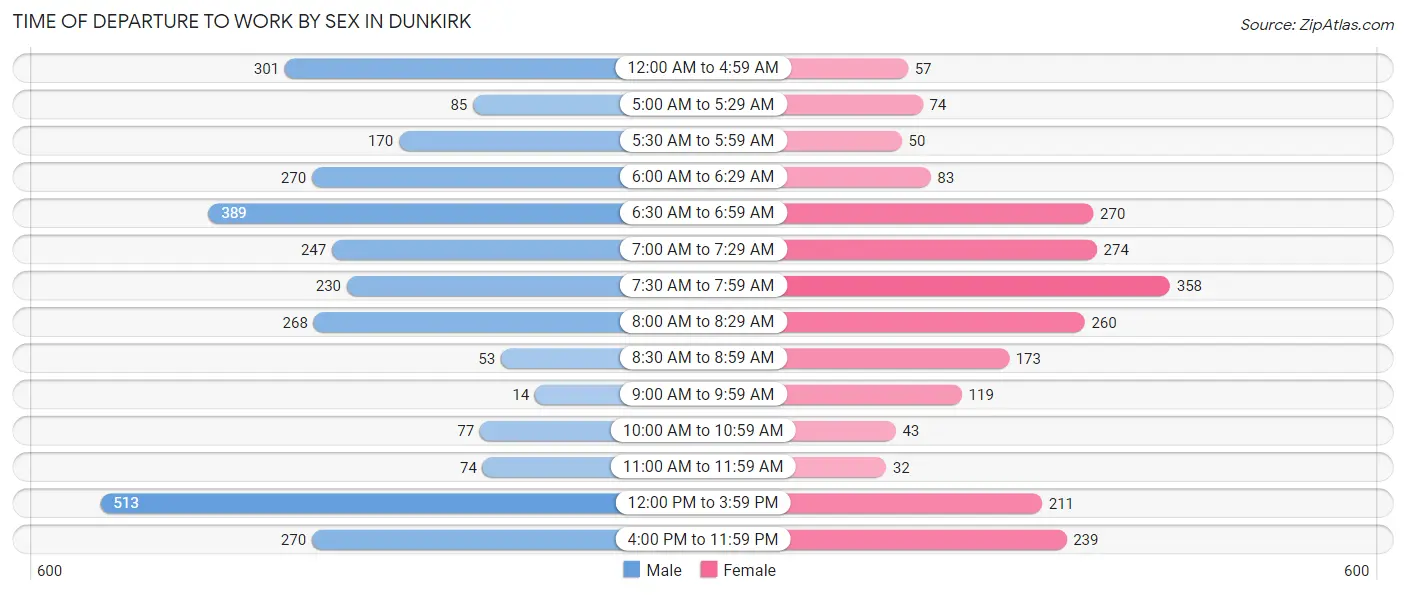
| Time of Departure | Male | Female |
| 12:00 AM to 4:59 AM | 301 (10.2%) | 57 (2.5%) |
| 5:00 AM to 5:29 AM | 85 (2.9%) | 74 (3.3%) |
| 5:30 AM to 5:59 AM | 170 (5.7%) | 50 (2.2%) |
| 6:00 AM to 6:29 AM | 270 (9.1%) | 83 (3.7%) |
| 6:30 AM to 6:59 AM | 389 (13.1%) | 270 (12.0%) |
| 7:00 AM to 7:29 AM | 247 (8.3%) | 274 (12.2%) |
| 7:30 AM to 7:59 AM | 230 (7.8%) | 358 (16.0%) |
| 8:00 AM to 8:29 AM | 268 (9.0%) | 260 (11.6%) |
| 8:30 AM to 8:59 AM | 53 (1.8%) | 173 (7.7%) |
| 9:00 AM to 9:59 AM | 14 (0.5%) | 119 (5.3%) |
| 10:00 AM to 10:59 AM | 77 (2.6%) | 43 (1.9%) |
| 11:00 AM to 11:59 AM | 74 (2.5%) | 32 (1.4%) |
| 12:00 PM to 3:59 PM | 513 (17.3%) | 211 (9.4%) |
| 4:00 PM to 11:59 PM | 270 (9.1%) | 239 (10.7%) |
| Total | 2,961 (100.0%) | 2,243 (100.0%) |
Housing Occupancy in Dunkirk
Occupancy by Ownership in Dunkirk
Of the total 5,766 dwellings in Dunkirk, owner-occupied units account for 3,440 (59.7%), while renter-occupied units make up 2,326 (40.3%).
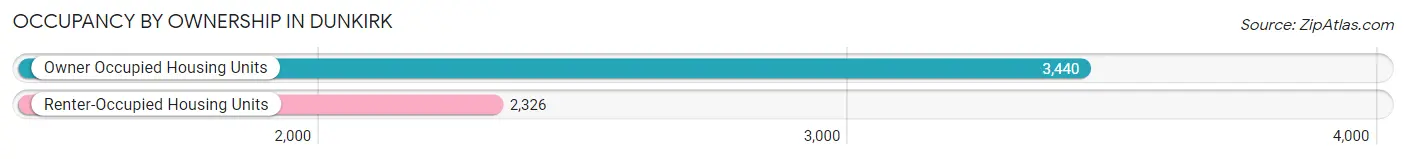
| Occupancy | # Housing Units | % Housing Units |
| Owner Occupied Housing Units | 3,440 | 59.7% |
| Renter-Occupied Housing Units | 2,326 | 40.3% |
| Total Occupied Housing Units | 5,766 | 100.0% |
Occupancy by Household Size in Dunkirk
| Household Size | # Housing Units | % Housing Units |
| 1-Person Household | 2,246 | 39.0% |
| 2-Person Household | 1,722 | 29.9% |
| 3-Person Household | 890 | 15.4% |
| 4+ Person Household | 908 | 15.8% |
| Total Housing Units | 5,766 | 100.0% |
Occupancy by Ownership by Household Size in Dunkirk
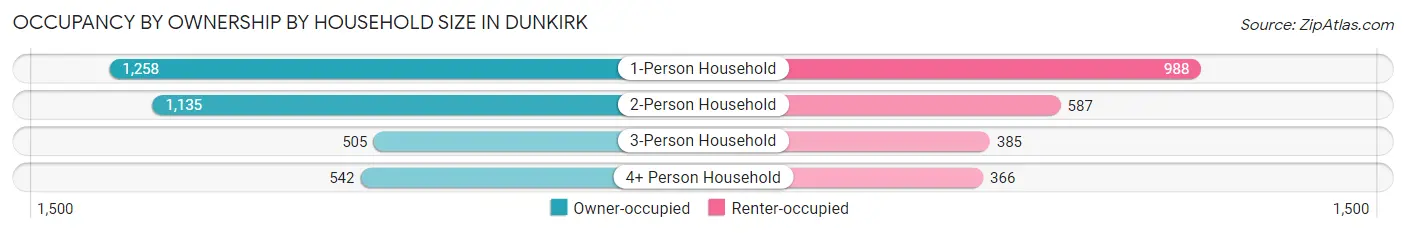
| Household Size | Owner-occupied | Renter-occupied |
| 1-Person Household | 1,258 (56.0%) | 988 (44.0%) |
| 2-Person Household | 1,135 (65.9%) | 587 (34.1%) |
| 3-Person Household | 505 (56.7%) | 385 (43.3%) |
| 4+ Person Household | 542 (59.7%) | 366 (40.3%) |
| Total Housing Units | 3,440 (59.7%) | 2,326 (40.3%) |
Occupancy by Educational Attainment in Dunkirk
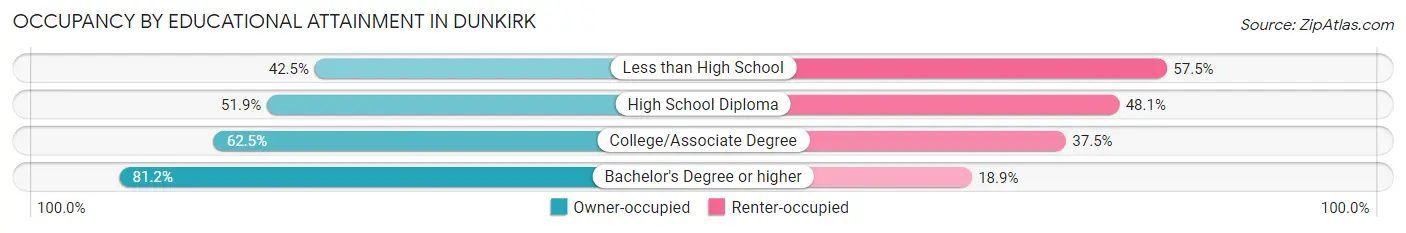
| Household Size | Owner-occupied | Renter-occupied |
| Less than High School | 245 (42.5%) | 332 (57.5%) |
| High School Diploma | 1,126 (51.9%) | 1,043 (48.1%) |
| College/Associate Degree | 1,277 (62.5%) | 767 (37.5%) |
| Bachelor's Degree or higher | 792 (81.1%) | 184 (18.9%) |
Occupancy by Age of Householder in Dunkirk
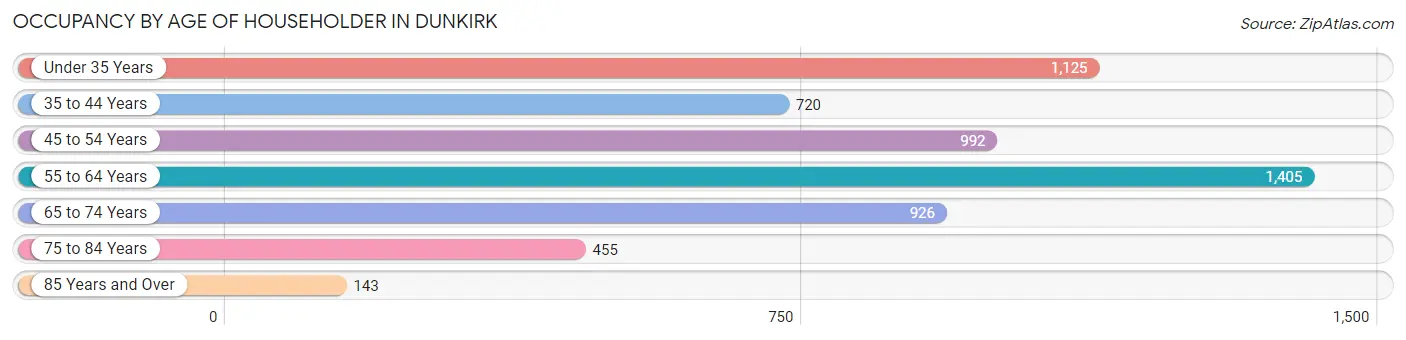
| Age Bracket | # Households | % Households |
| Under 35 Years | 1,125 | 19.5% |
| 35 to 44 Years | 720 | 12.5% |
| 45 to 54 Years | 992 | 17.2% |
| 55 to 64 Years | 1,405 | 24.4% |
| 65 to 74 Years | 926 | 16.1% |
| 75 to 84 Years | 455 | 7.9% |
| 85 Years and Over | 143 | 2.5% |
| Total | 5,766 | 100.0% |
Housing Finances in Dunkirk
Median Income by Occupancy in Dunkirk
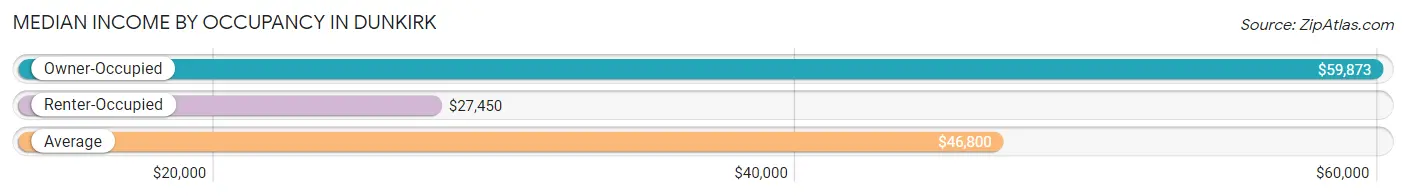
| Occupancy Type | # Households | Median Income |
| Owner-Occupied | 3,440 (59.7%) | $59,873 |
| Renter-Occupied | 2,326 (40.3%) | $27,450 |
| Average | 5,766 (100.0%) | $46,800 |
Occupancy by Householder Income Bracket in Dunkirk
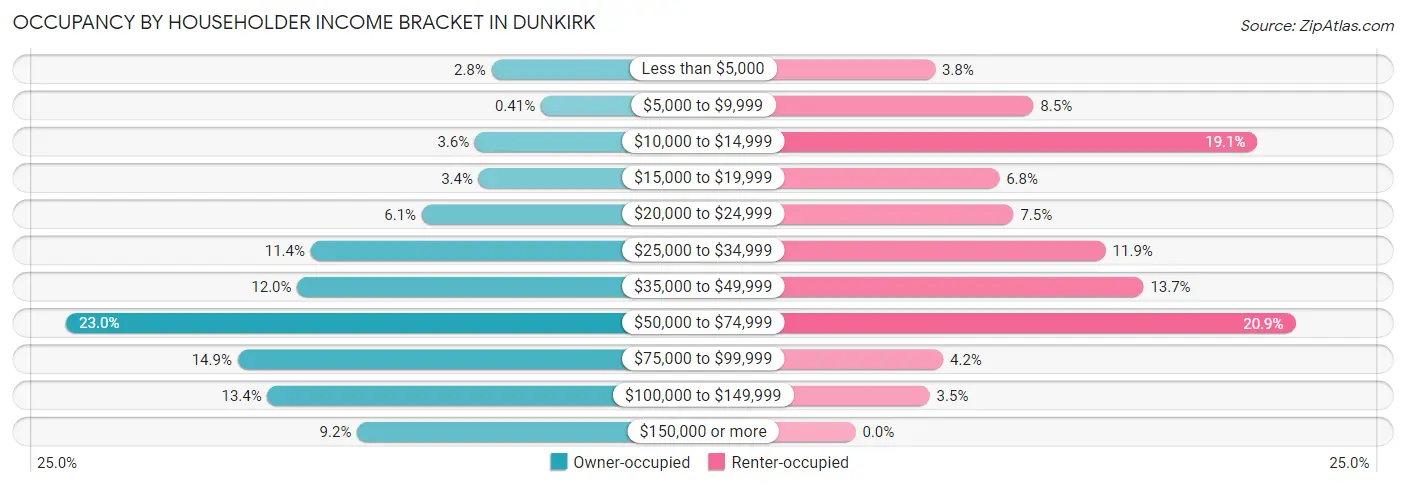
| Income Bracket | Owner-occupied | Renter-occupied |
| Less than $5,000 | 95 (2.8%) | 88 (3.8%) |
| $5,000 to $9,999 | 14 (0.4%) | 197 (8.5%) |
| $10,000 to $14,999 | 122 (3.5%) | 445 (19.1%) |
| $15,000 to $19,999 | 116 (3.4%) | 159 (6.8%) |
| $20,000 to $24,999 | 209 (6.1%) | 175 (7.5%) |
| $25,000 to $34,999 | 391 (11.4%) | 277 (11.9%) |
| $35,000 to $49,999 | 413 (12.0%) | 319 (13.7%) |
| $50,000 to $74,999 | 792 (23.0%) | 487 (20.9%) |
| $75,000 to $99,999 | 511 (14.8%) | 97 (4.2%) |
| $100,000 to $149,999 | 462 (13.4%) | 82 (3.5%) |
| $150,000 or more | 315 (9.2%) | 0 (0.0%) |
| Total | 3,440 (100.0%) | 2,326 (100.0%) |
Monthly Housing Cost Tiers in Dunkirk
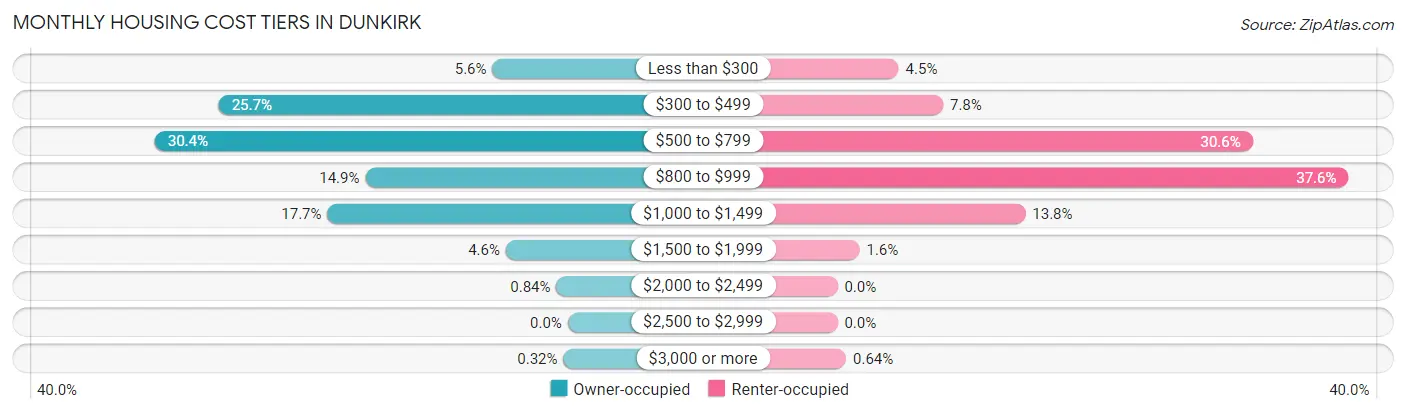
| Monthly Cost | Owner-occupied | Renter-occupied |
| Less than $300 | 191 (5.6%) | 105 (4.5%) |
| $300 to $499 | 884 (25.7%) | 181 (7.8%) |
| $500 to $799 | 1,046 (30.4%) | 711 (30.6%) |
| $800 to $999 | 513 (14.9%) | 875 (37.6%) |
| $1,000 to $1,499 | 609 (17.7%) | 322 (13.8%) |
| $1,500 to $1,999 | 157 (4.6%) | 38 (1.6%) |
| $2,000 to $2,499 | 29 (0.8%) | 0 (0.0%) |
| $2,500 to $2,999 | 0 (0.0%) | 0 (0.0%) |
| $3,000 or more | 11 (0.3%) | 15 (0.6%) |
| Total | 3,440 (100.0%) | 2,326 (100.0%) |
Physical Housing Characteristics in Dunkirk
Housing Structures in Dunkirk
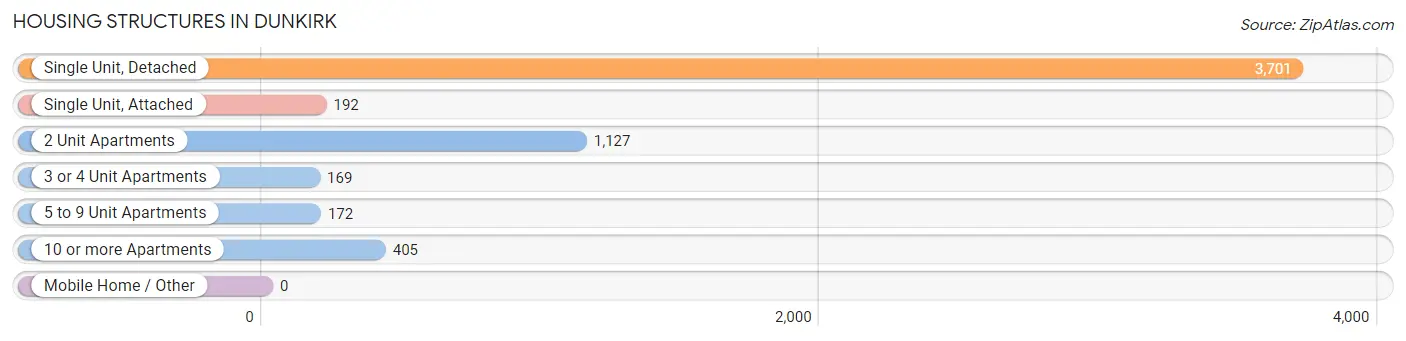
| Structure Type | # Housing Units | % Housing Units |
| Single Unit, Detached | 3,701 | 64.2% |
| Single Unit, Attached | 192 | 3.3% |
| 2 Unit Apartments | 1,127 | 19.6% |
| 3 or 4 Unit Apartments | 169 | 2.9% |
| 5 to 9 Unit Apartments | 172 | 3.0% |
| 10 or more Apartments | 405 | 7.0% |
| Mobile Home / Other | 0 | 0.0% |
| Total | 5,766 | 100.0% |
Housing Structures by Occupancy in Dunkirk
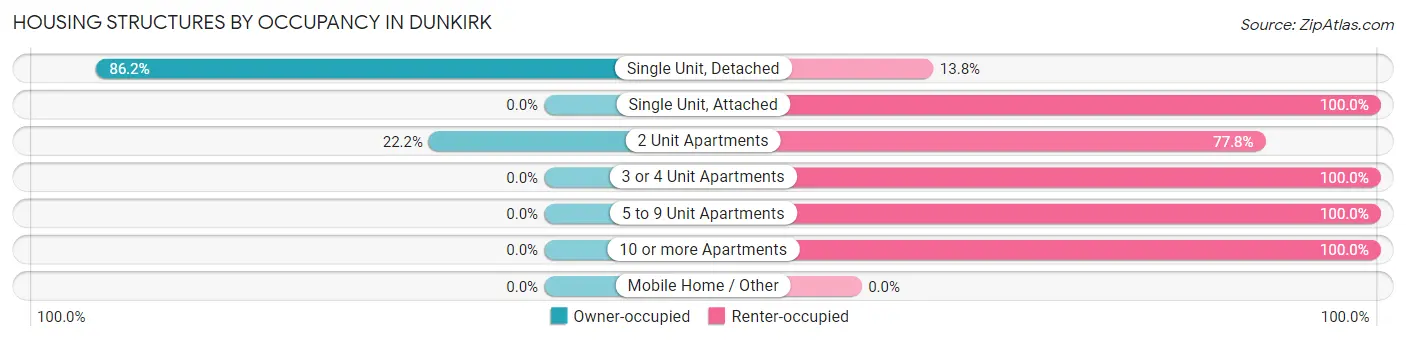
| Structure Type | Owner-occupied | Renter-occupied |
| Single Unit, Detached | 3,190 (86.2%) | 511 (13.8%) |
| Single Unit, Attached | 0 (0.0%) | 192 (100.0%) |
| 2 Unit Apartments | 250 (22.2%) | 877 (77.8%) |
| 3 or 4 Unit Apartments | 0 (0.0%) | 169 (100.0%) |
| 5 to 9 Unit Apartments | 0 (0.0%) | 172 (100.0%) |
| 10 or more Apartments | 0 (0.0%) | 405 (100.0%) |
| Mobile Home / Other | 0 (0.0%) | 0 (0.0%) |
| Total | 3,440 (59.7%) | 2,326 (40.3%) |
Housing Structures by Number of Rooms in Dunkirk
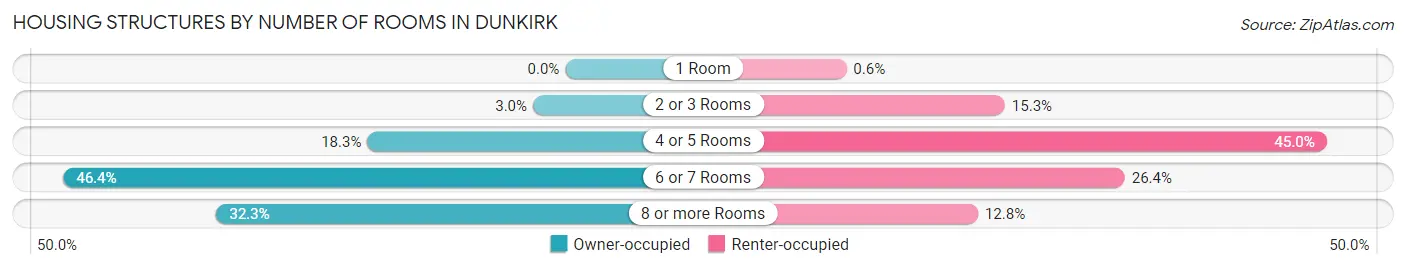
| Number of Rooms | Owner-occupied | Renter-occupied |
| 1 Room | 0 (0.0%) | 14 (0.6%) |
| 2 or 3 Rooms | 103 (3.0%) | 355 (15.3%) |
| 4 or 5 Rooms | 630 (18.3%) | 1,047 (45.0%) |
| 6 or 7 Rooms | 1,597 (46.4%) | 613 (26.4%) |
| 8 or more Rooms | 1,110 (32.3%) | 297 (12.8%) |
| Total | 3,440 (100.0%) | 2,326 (100.0%) |
Housing Structure by Heating Type in Dunkirk
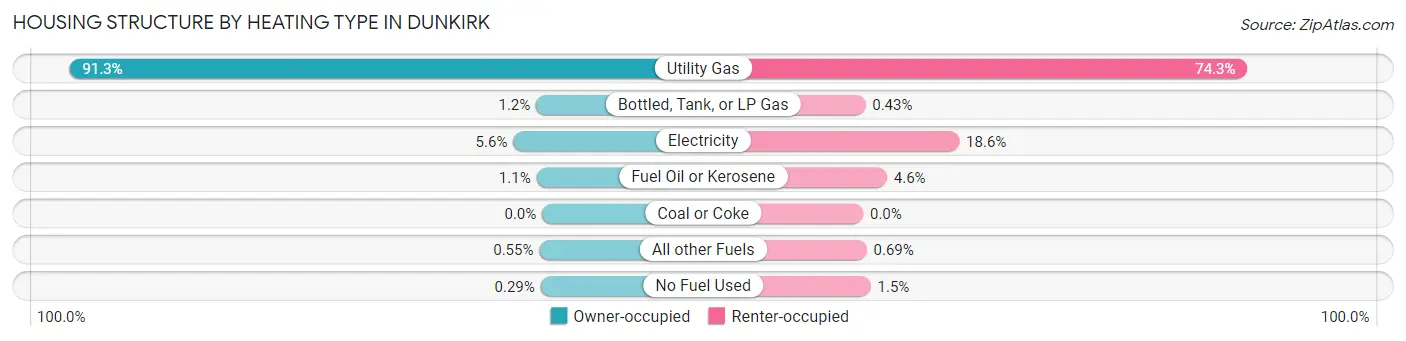
| Heating Type | Owner-occupied | Renter-occupied |
| Utility Gas | 3,142 (91.3%) | 1,727 (74.3%) |
| Bottled, Tank, or LP Gas | 40 (1.2%) | 10 (0.4%) |
| Electricity | 192 (5.6%) | 432 (18.6%) |
| Fuel Oil or Kerosene | 37 (1.1%) | 107 (4.6%) |
| Coal or Coke | 0 (0.0%) | 0 (0.0%) |
| All other Fuels | 19 (0.5%) | 16 (0.7%) |
| No Fuel Used | 10 (0.3%) | 34 (1.5%) |
| Total | 3,440 (100.0%) | 2,326 (100.0%) |
Household Vehicle Usage in Dunkirk
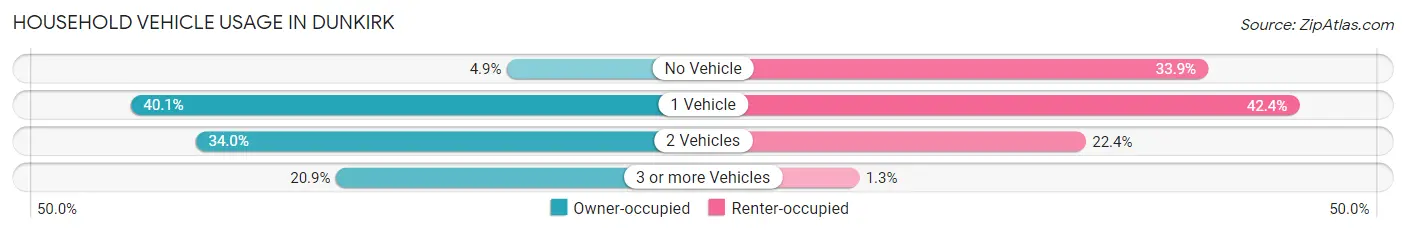
| Vehicles per Household | Owner-occupied | Renter-occupied |
| No Vehicle | 170 (4.9%) | 788 (33.9%) |
| 1 Vehicle | 1,380 (40.1%) | 986 (42.4%) |
| 2 Vehicles | 1,171 (34.0%) | 522 (22.4%) |
| 3 or more Vehicles | 719 (20.9%) | 30 (1.3%) |
| Total | 3,440 (100.0%) | 2,326 (100.0%) |
Real Estate & Mortgages in Dunkirk
Real Estate and Mortgage Overview in Dunkirk
| Characteristic | Without Mortgage | With Mortgage |
| Housing Units | 1,744 | 1,696 |
| Median Property Value | $78,900 | $90,600 |
| Median Household Income | $49,966 | $224 |
| Monthly Housing Costs | $449 | $11 |
| Real Estate Taxes | $2,064 | $60 |
Property Value by Mortgage Status in Dunkirk
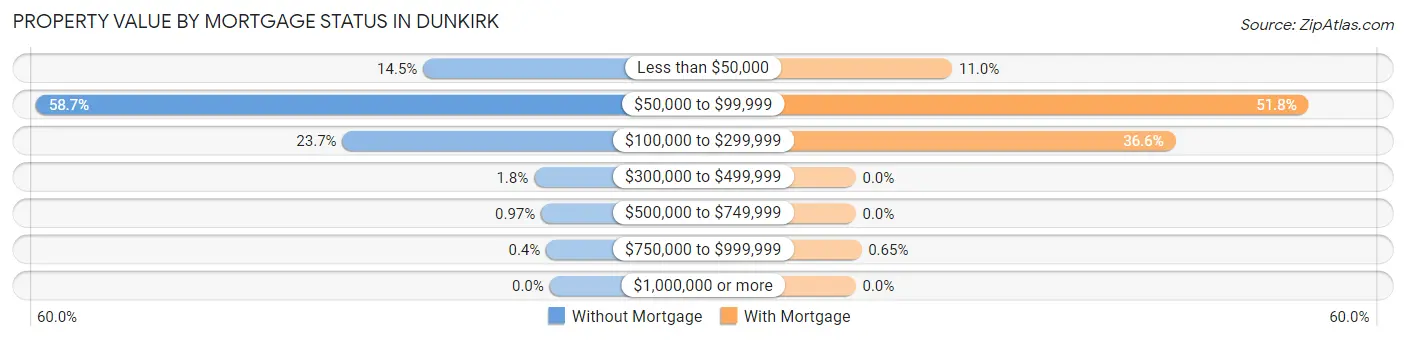
| Property Value | Without Mortgage | With Mortgage |
| Less than $50,000 | 252 (14.4%) | 187 (11.0%) |
| $50,000 to $99,999 | 1,024 (58.7%) | 878 (51.8%) |
| $100,000 to $299,999 | 413 (23.7%) | 620 (36.6%) |
| $300,000 to $499,999 | 31 (1.8%) | 0 (0.0%) |
| $500,000 to $749,999 | 17 (1.0%) | 0 (0.0%) |
| $750,000 to $999,999 | 7 (0.4%) | 11 (0.6%) |
| $1,000,000 or more | 0 (0.0%) | 0 (0.0%) |
| Total | 1,744 (100.0%) | 1,696 (100.0%) |
Household Income by Mortgage Status in Dunkirk
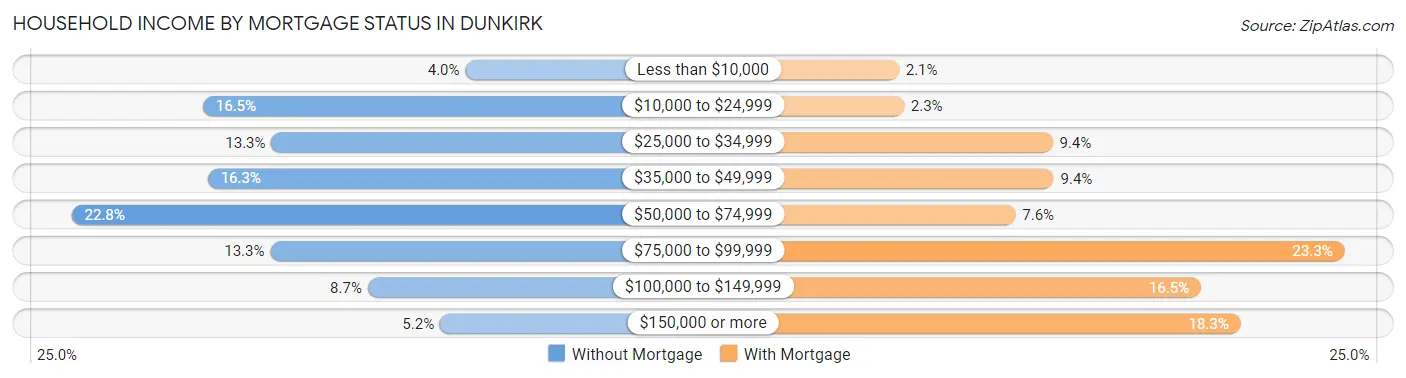
| Household Income | Without Mortgage | With Mortgage |
| Less than $10,000 | 70 (4.0%) | 35 (2.1%) |
| $10,000 to $24,999 | 288 (16.5%) | 39 (2.3%) |
| $25,000 to $34,999 | 231 (13.3%) | 159 (9.4%) |
| $35,000 to $49,999 | 284 (16.3%) | 160 (9.4%) |
| $50,000 to $74,999 | 397 (22.8%) | 129 (7.6%) |
| $75,000 to $99,999 | 232 (13.3%) | 395 (23.3%) |
| $100,000 to $149,999 | 151 (8.7%) | 279 (16.5%) |
| $150,000 or more | 91 (5.2%) | 311 (18.3%) |
| Total | 1,744 (100.0%) | 1,696 (100.0%) |
Property Value to Household Income Ratio in Dunkirk
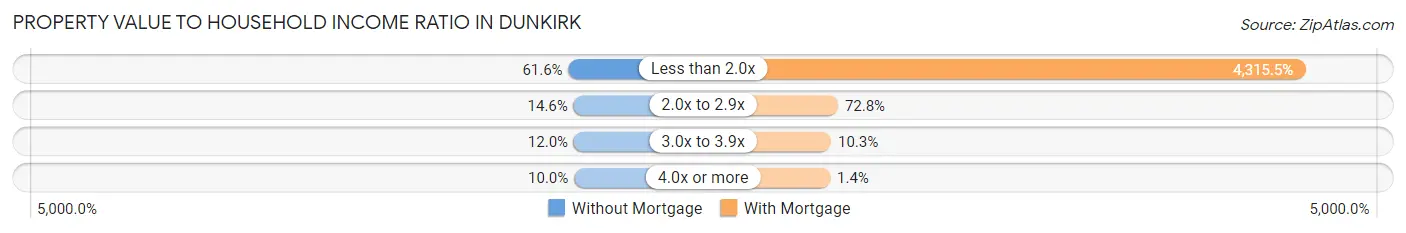
| Value-to-Income Ratio | Without Mortgage | With Mortgage |
| Less than 2.0x | 1,075 (61.6%) | 73,191 (4,315.5%) |
| 2.0x to 2.9x | 255 (14.6%) | 1,235 (72.8%) |
| 3.0x to 3.9x | 209 (12.0%) | 174 (10.3%) |
| 4.0x or more | 175 (10.0%) | 23 (1.4%) |
| Total | 1,744 (100.0%) | 1,696 (100.0%) |
Real Estate Taxes by Mortgage Status in Dunkirk
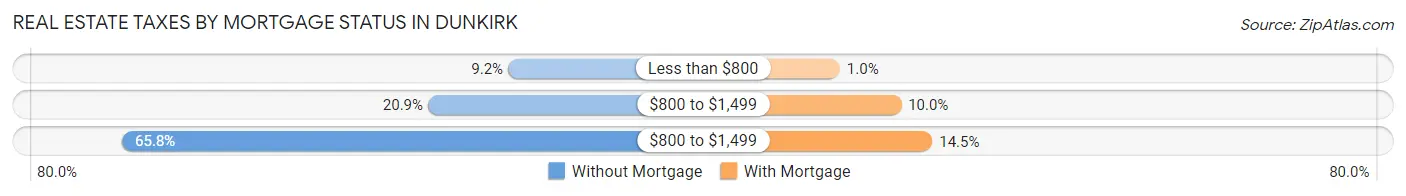
| Property Taxes | Without Mortgage | With Mortgage |
| Less than $800 | 161 (9.2%) | 17 (1.0%) |
| $800 to $1,499 | 365 (20.9%) | 169 (10.0%) |
| $800 to $1,499 | 1,147 (65.8%) | 246 (14.5%) |
| Total | 1,744 (100.0%) | 1,696 (100.0%) |
Health & Disability in Dunkirk
Health Insurance Coverage by Age in Dunkirk
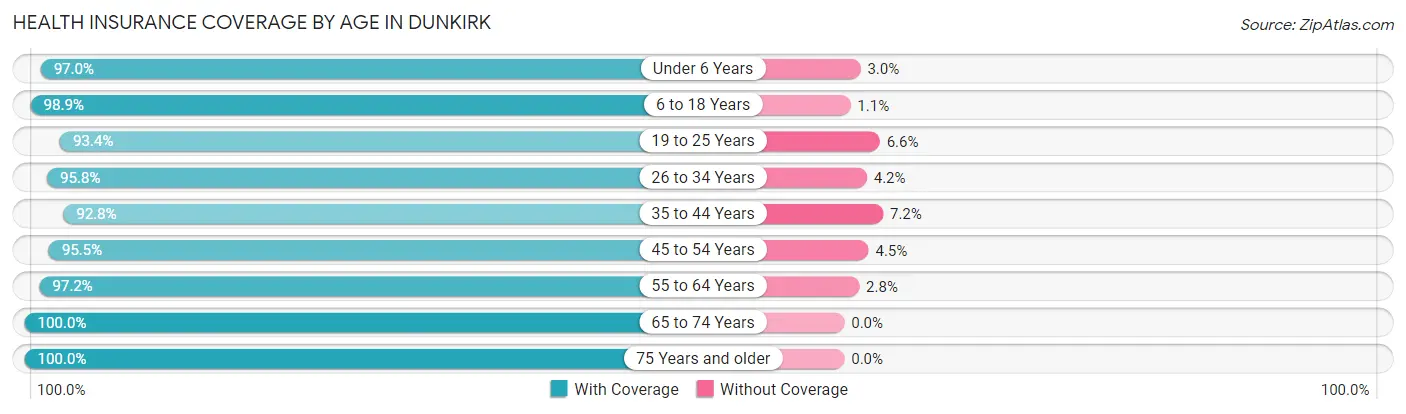
| Age Bracket | With Coverage | Without Coverage |
| Under 6 Years | 870 (97.0%) | 27 (3.0%) |
| 6 to 18 Years | 1,474 (98.9%) | 17 (1.1%) |
| 19 to 25 Years | 1,314 (93.4%) | 93 (6.6%) |
| 26 to 34 Years | 1,396 (95.8%) | 61 (4.2%) |
| 35 to 44 Years | 1,234 (92.8%) | 96 (7.2%) |
| 45 to 54 Years | 1,607 (95.5%) | 76 (4.5%) |
| 55 to 64 Years | 2,072 (97.2%) | 59 (2.8%) |
| 65 to 74 Years | 1,367 (100.0%) | 0 (0.0%) |
| 75 Years and older | 894 (100.0%) | 0 (0.0%) |
| Total | 12,228 (96.6%) | 429 (3.4%) |
Health Insurance Coverage by Citizenship Status in Dunkirk
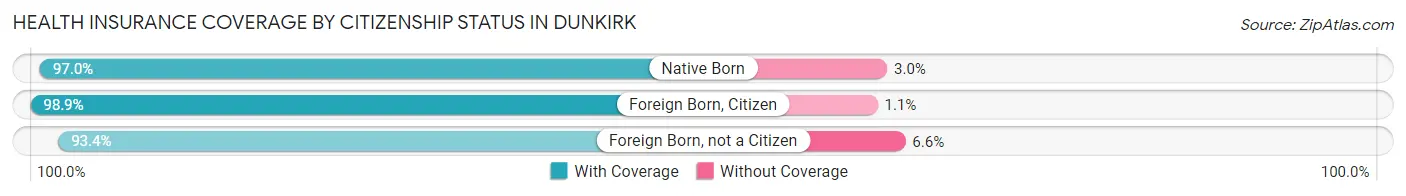
| Citizenship Status | With Coverage | Without Coverage |
| Native Born | 870 (97.0%) | 27 (3.0%) |
| Foreign Born, Citizen | 1,474 (98.9%) | 17 (1.1%) |
| Foreign Born, not a Citizen | 1,314 (93.4%) | 93 (6.6%) |
Health Insurance Coverage by Household Income in Dunkirk
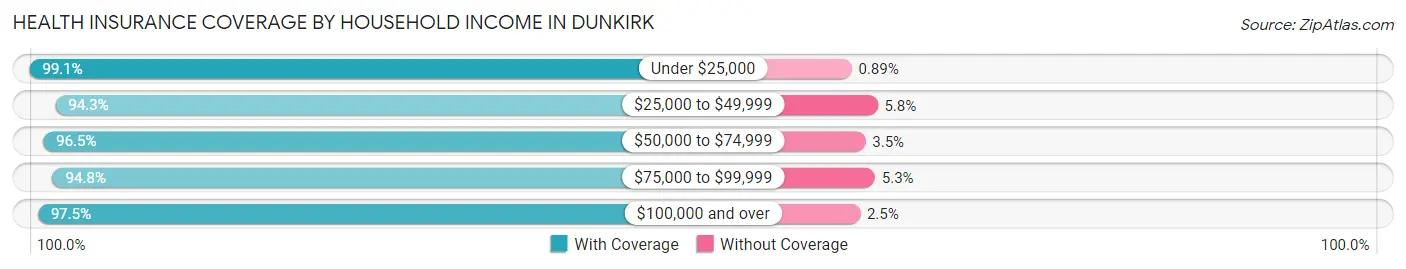
| Household Income | With Coverage | Without Coverage |
| Under $25,000 | 2,684 (99.1%) | 24 (0.9%) |
| $25,000 to $49,999 | 2,326 (94.3%) | 142 (5.8%) |
| $50,000 to $74,999 | 3,002 (96.5%) | 108 (3.5%) |
| $75,000 to $99,999 | 1,734 (94.8%) | 96 (5.2%) |
| $100,000 and over | 2,334 (97.5%) | 59 (2.5%) |
Public vs Private Health Insurance Coverage by Age in Dunkirk
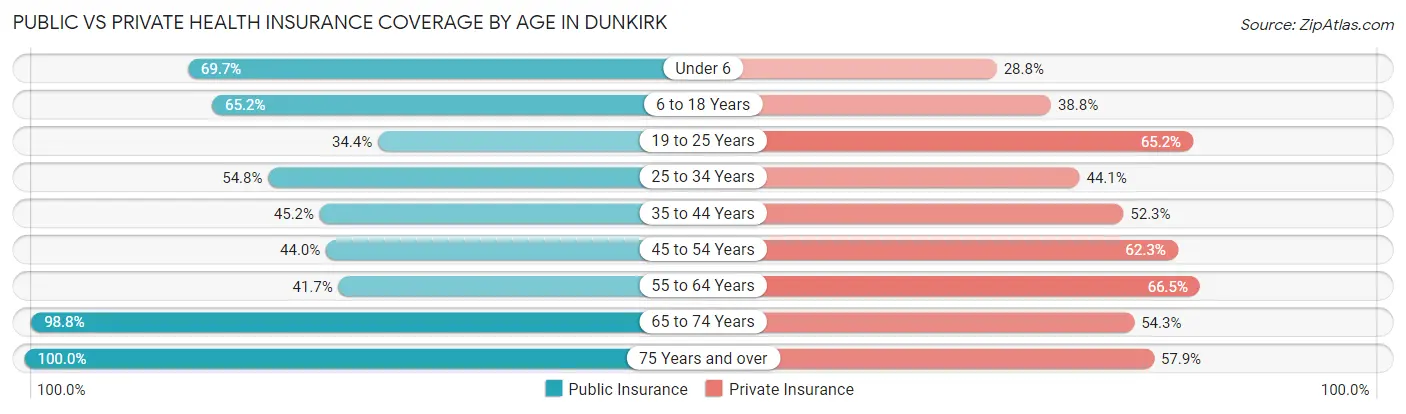
| Age Bracket | Public Insurance | Private Insurance |
| Under 6 | 625 (69.7%) | 258 (28.8%) |
| 6 to 18 Years | 972 (65.2%) | 579 (38.8%) |
| 19 to 25 Years | 484 (34.4%) | 917 (65.2%) |
| 25 to 34 Years | 798 (54.8%) | 643 (44.1%) |
| 35 to 44 Years | 601 (45.2%) | 695 (52.3%) |
| 45 to 54 Years | 741 (44.0%) | 1,049 (62.3%) |
| 55 to 64 Years | 889 (41.7%) | 1,416 (66.4%) |
| 65 to 74 Years | 1,350 (98.8%) | 742 (54.3%) |
| 75 Years and over | 894 (100.0%) | 518 (57.9%) |
| Total | 7,354 (58.1%) | 6,817 (53.9%) |
Disability Status by Sex by Age in Dunkirk
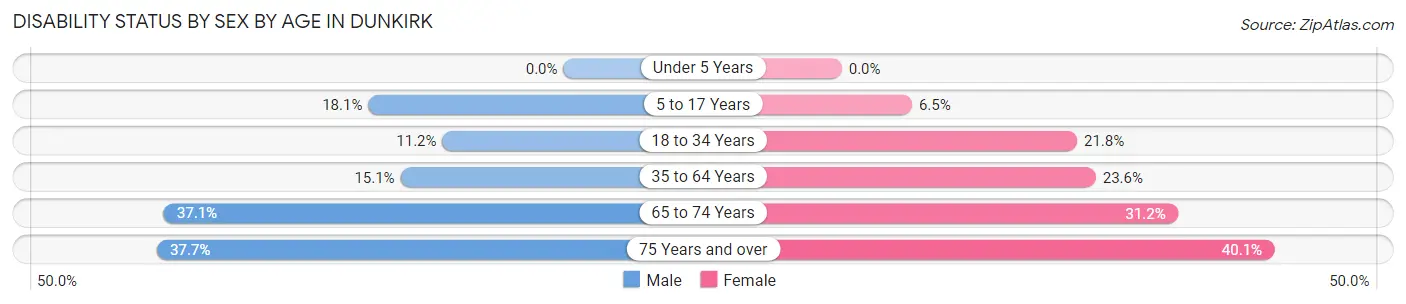
| Age Bracket | Male | Female |
| Under 5 Years | 0 (0.0%) | 0 (0.0%) |
| 5 to 17 Years | 161 (18.1%) | 45 (6.5%) |
| 18 to 34 Years | 192 (11.2%) | 272 (21.8%) |
| 35 to 64 Years | 403 (15.1%) | 584 (23.6%) |
| 65 to 74 Years | 245 (37.1%) | 220 (31.2%) |
| 75 Years and over | 181 (37.7%) | 166 (40.1%) |
Disability Class by Sex by Age in Dunkirk
Disability Class: Hearing Difficulty
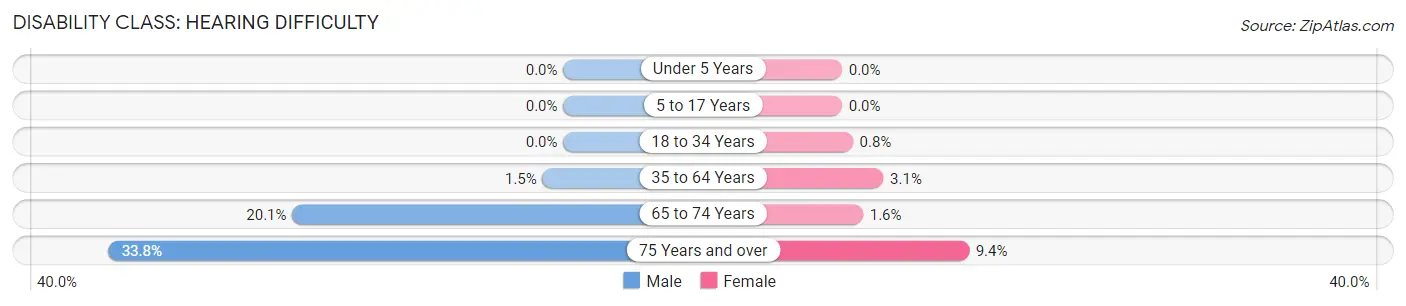
| Age Bracket | Male | Female |
| Under 5 Years | 0 (0.0%) | 0 (0.0%) |
| 5 to 17 Years | 0 (0.0%) | 0 (0.0%) |
| 18 to 34 Years | 0 (0.0%) | 10 (0.8%) |
| 35 to 64 Years | 41 (1.5%) | 76 (3.1%) |
| 65 to 74 Years | 133 (20.1%) | 11 (1.6%) |
| 75 Years and over | 162 (33.8%) | 39 (9.4%) |
Disability Class: Vision Difficulty
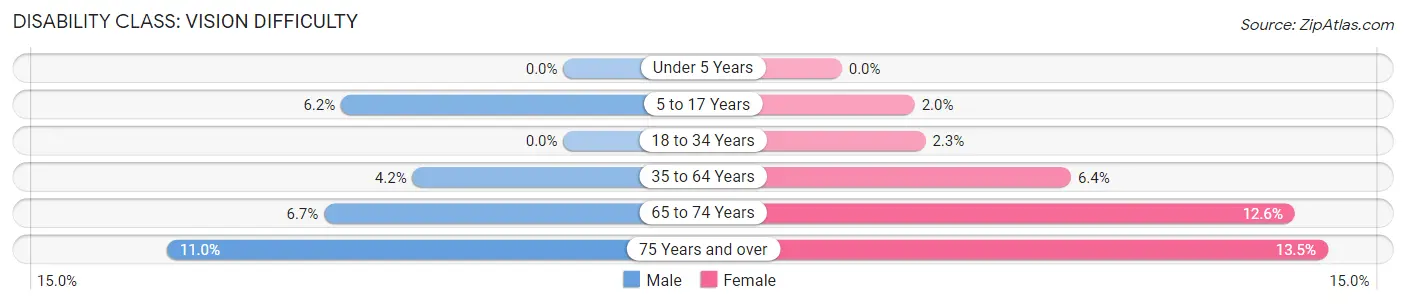
| Age Bracket | Male | Female |
| Under 5 Years | 0 (0.0%) | 0 (0.0%) |
| 5 to 17 Years | 55 (6.2%) | 14 (2.0%) |
| 18 to 34 Years | 0 (0.0%) | 29 (2.3%) |
| 35 to 64 Years | 112 (4.2%) | 158 (6.4%) |
| 65 to 74 Years | 44 (6.7%) | 89 (12.6%) |
| 75 Years and over | 53 (11.0%) | 56 (13.5%) |
Disability Class: Cognitive Difficulty
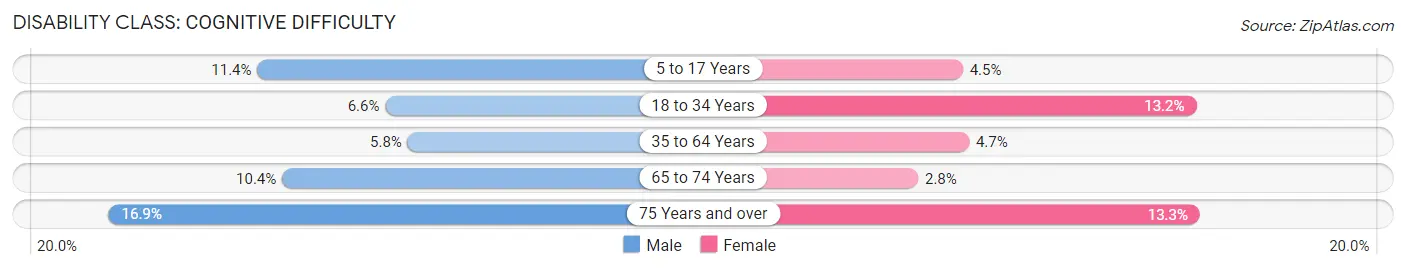
| Age Bracket | Male | Female |
| 5 to 17 Years | 101 (11.4%) | 31 (4.5%) |
| 18 to 34 Years | 113 (6.6%) | 164 (13.2%) |
| 35 to 64 Years | 154 (5.8%) | 117 (4.7%) |
| 65 to 74 Years | 69 (10.4%) | 20 (2.8%) |
| 75 Years and over | 81 (16.9%) | 55 (13.3%) |
Disability Class: Ambulatory Difficulty
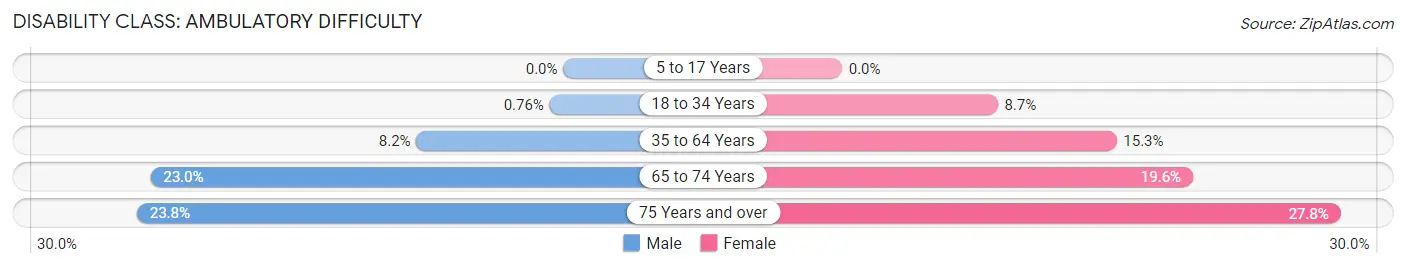
| Age Bracket | Male | Female |
| 5 to 17 Years | 0 (0.0%) | 0 (0.0%) |
| 18 to 34 Years | 13 (0.8%) | 108 (8.7%) |
| 35 to 64 Years | 218 (8.2%) | 379 (15.3%) |
| 65 to 74 Years | 152 (23.0%) | 138 (19.6%) |
| 75 Years and over | 114 (23.7%) | 115 (27.8%) |
Disability Class: Self-Care Difficulty
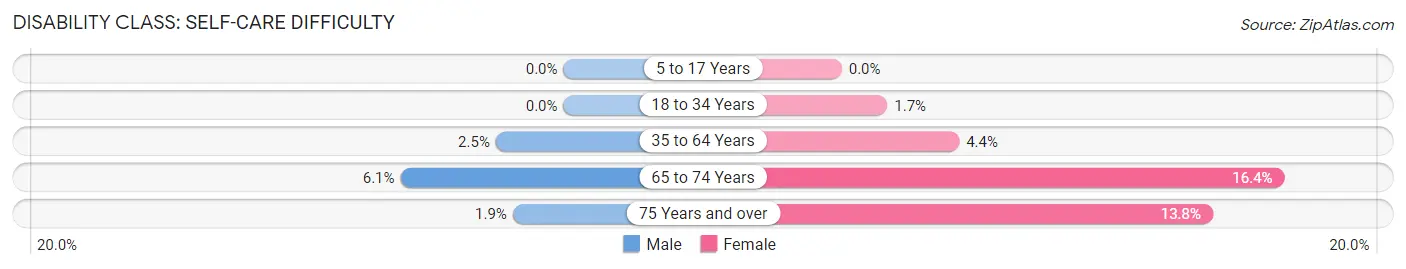
| Age Bracket | Male | Female |
| 5 to 17 Years | 0 (0.0%) | 0 (0.0%) |
| 18 to 34 Years | 0 (0.0%) | 21 (1.7%) |
| 35 to 64 Years | 67 (2.5%) | 108 (4.4%) |
| 65 to 74 Years | 40 (6.0%) | 116 (16.4%) |
| 75 Years and over | 9 (1.9%) | 57 (13.8%) |
Technology Access in Dunkirk
Computing Device Access in Dunkirk
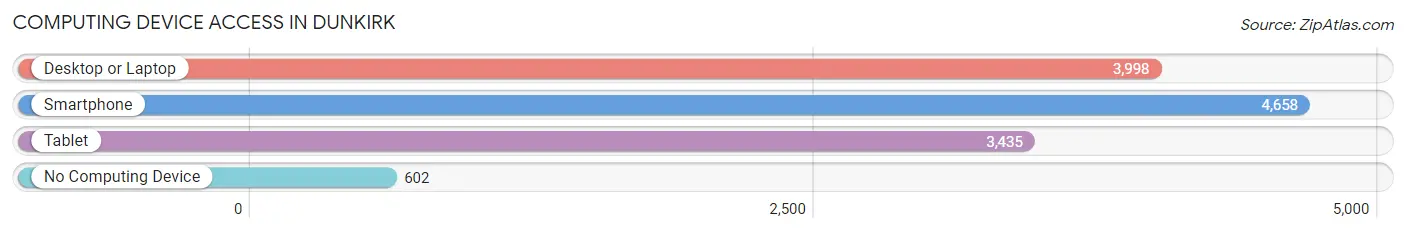
| Device Type | # Households | % Households |
| Desktop or Laptop | 3,998 | 69.3% |
| Smartphone | 4,658 | 80.8% |
| Tablet | 3,435 | 59.6% |
| No Computing Device | 602 | 10.4% |
| Total | 5,766 | 100.0% |
Internet Access in Dunkirk
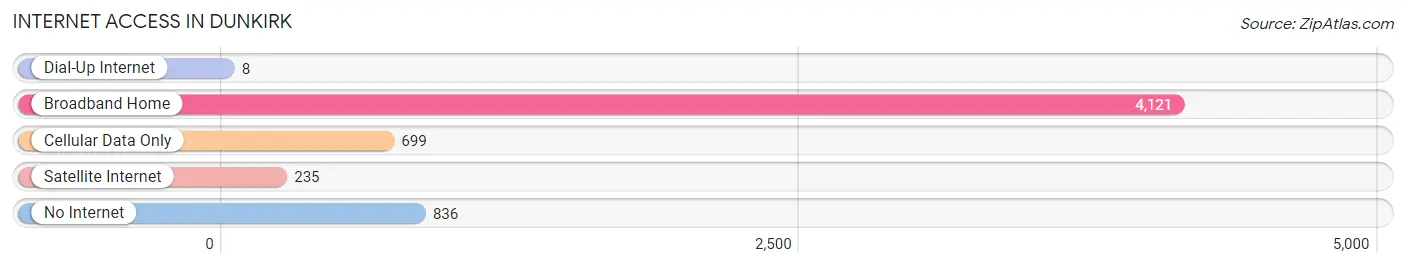
| Internet Type | # Households | % Households |
| Dial-Up Internet | 8 | 0.1% |
| Broadband Home | 4,121 | 71.5% |
| Cellular Data Only | 699 | 12.1% |
| Satellite Internet | 235 | 4.1% |
| No Internet | 836 | 14.5% |
| Total | 5,766 | 100.0% |
Dunkirk Summary
Dunkirk is a city located in Chautauqua County, New York, United States. The population was 12,563 at the 2010 census, making it the most populous city in Chautauqua County. Dunkirk is located on the shores of Lake Erie at the mouth of the Dunkirk Harbor. It is part of the Buffalo-Niagara Falls metropolitan area.
History
The area around Dunkirk was first settled in 1805 by James McMahan, who built a log cabin near the mouth of the Dunkirk Harbor. The area was originally known as "Chautauqua Point" and was part of the larger town of Portland. In 1811, the town of Dunkirk was established and named after the city of Dunkirk in France.
The city of Dunkirk was incorporated in 1880. The city grew rapidly in the late 19th and early 20th centuries, due to its location on Lake Erie and its proximity to the railroads. The city was a major port for the Great Lakes region, and was home to several large industries, including the American Shipbuilding Company, the Dunkirk Iron Works, and the Dunkirk Foundry.
Geography
Dunkirk is located in western Chautauqua County at 42°26′N 79°19′W (42.4333, -79.3167). It is on the south shore of Lake Erie, at the mouth of the Dunkirk Harbor. The city is bordered to the north by the town of Dunkirk and to the south by the town of Sheridan.
According to the United States Census Bureau, the city has a total area of 8.2 square miles (21.2 km2), of which 7.9 square miles (20.5 km2) is land and 0.3 square miles (0.8 km2) is water.
Economy
Dunkirk's economy is largely based on manufacturing and tourism. The city is home to several large industries, including the American Shipbuilding Company, the Dunkirk Iron Works, and the Dunkirk Foundry. The city is also a major port for the Great Lakes region.
Tourism is also an important part of the city's economy. Dunkirk is home to several popular attractions, including the Dunkirk Lighthouse, the Dunkirk Historical Museum, and the Dunkirk-Fredonia Opera House.
Demographics
As of the census of 2010, there were 12,563 people, 5,093 households, and 3,092 families residing in the city. The population density was 1,586.3 people per square mile (613.2/km2). There were 5,717 housing units at an average density of 722.3 per square mile (279.2/km2). The racial makeup of the city was 87.2% White, 8.2% African American, 0.3% Native American, 0.7% Asian, 0.1% Pacific Islander, 1.2% from other races, and 2.3% from two or more races. Hispanic or Latino of any race were 4.7% of the population.
There were 5,093 households, out of which 28.2% had children under the age of 18 living with them, 39.2% were married couples living together, 15.7% had a female householder with no husband present, and 39.7% were non-families. 33.2% of all households were made up of individuals, and 14.3% had someone living alone who was 65 years of age or older. The average household size was 2.37 and the average family size was 3.00.
In the city, the population was spread out, with 24.2% under the age of 18, 8.2% from 18 to 24, 25.7% from 25 to 44, 22.7% from 45 to 64, and 19.2% who were 65 years of age or older. The median age was 38 years. For every 100 females, there were 91.2 males. For every 100 females age 18 and over, there were 87.2 males.
The median income for a household in the city was $30,845, and the median income for a family was $37,945. Males had a median income of $30,917 versus $22,917 for females. The per capita income for the city was $16,845. About 13.2% of families and 16.7% of the population were below the poverty line, including 24.2% of those under age 18 and 8.7% of those age 65 or over.
Common Questions
What is Per Capita Income in Dunkirk?
Per Capita income in Dunkirk is $27,775.
What is the Median Family Income in Dunkirk?
Median Family Income in Dunkirk is $57,161.
What is the Median Household income in Dunkirk?
Median Household Income in Dunkirk is $46,800.
What is Income or Wage Gap in Dunkirk?
Income or Wage Gap in Dunkirk is 29.9%.
Women in Dunkirk earn 70.1 cents for every dollar earned by a man.
What is Family Income Deficit in Dunkirk?
Family Income Deficit in Dunkirk is $9,548.
Families that are below poverty line in Dunkirk earn $9,548 less on average than the poverty threshold level.
What is Inequality or Gini Index in Dunkirk?
Inequality or Gini Index in Dunkirk is 0.44.
What is the Total Population of Dunkirk?
Total Population of Dunkirk is 12,668.
What is the Total Male Population of Dunkirk?
Total Male Population of Dunkirk is 6,702.
What is the Total Female Population of Dunkirk?
Total Female Population of Dunkirk is 5,966.
What is the Ratio of Males per 100 Females in Dunkirk?
There are 112.34 Males per 100 Females in Dunkirk.
What is the Ratio of Females per 100 Males in Dunkirk?
There are 89.02 Females per 100 Males in Dunkirk.
What is the Median Population Age in Dunkirk?
Median Population Age in Dunkirk is 42.6 Years.
What is the Average Family Size in Dunkirk
Average Family Size in Dunkirk is 2.8 People.
What is the Average Household Size in Dunkirk
Average Household Size in Dunkirk is 2.2 People.
How Large is the Labor Force in Dunkirk?
There are 5,838 People in the Labor Forcein in Dunkirk.
What is the Percentage of People in the Labor Force in Dunkirk?
55.2% of People are in the Labor Force in Dunkirk.
What is the Unemployment Rate in Dunkirk?
Unemployment Rate in Dunkirk is 4.6%.