East Hampton North, NY Map & Demographics
East Hampton North Map
East Hampton North Overview
$49,131
PER CAPITA INCOME
$106,042
AVG FAMILY INCOME
$105,156
AVG HOUSEHOLD INCOME
22.0%
WAGE / INCOME GAP [ % ]
78.0¢/ $1
WAGE / INCOME GAP [ $ ]
0.50
INEQUALITY / GINI INDEX
5,587
TOTAL POPULATION
2,535
MALE POPULATION
3,052
FEMALE POPULATION
83.06
MALES / 100 FEMALES
120.39
FEMALES / 100 MALES
36.1
MEDIAN AGE
3.5
AVG FAMILY SIZE
2.9
AVG HOUSEHOLD SIZE
3,201
LABOR FORCE [ PEOPLE ]
73.2%
PERCENT IN LABOR FORCE
0.3%
UNEMPLOYMENT RATE
Income in East Hampton North
Income Overview in East Hampton North
Per Capita Income in East Hampton North is $49,131, while median incomes of families and households are $106,042 and $105,156 respectively.
| Characteristic | Number | Measure |
| Per Capita Income | 5,587 | $49,131 |
| Median Family Income | 1,259 | $106,042 |
| Mean Family Income | 1,259 | $149,539 |
| Median Household Income | 1,938 | $105,156 |
| Mean Household Income | 1,938 | $136,783 |
| Income Deficit | 1,259 | $0 |
| Wage / Income Gap (%) | 5,587 | 22.02% |
| Wage / Income Gap ($) | 5,587 | 77.98¢ per $1 |
| Gini / Inequality Index | 5,587 | 0.50 |
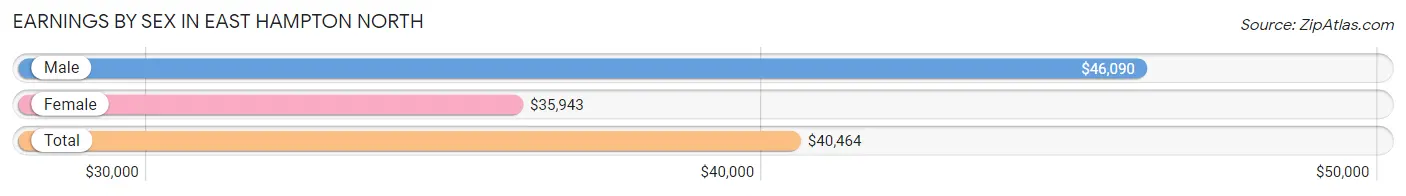
Earnings by Sex in East Hampton North
Average Earnings in East Hampton North are $40,464, $46,090 for men and $35,943 for women, a difference of 22.0%.
| Sex | Number | Average Earnings |
| Male | 1,668 (50.1%) | $46,090 |
| Female | 1,659 (49.9%) | $35,943 |
| Total | 3,327 (100.0%) | $40,464 |
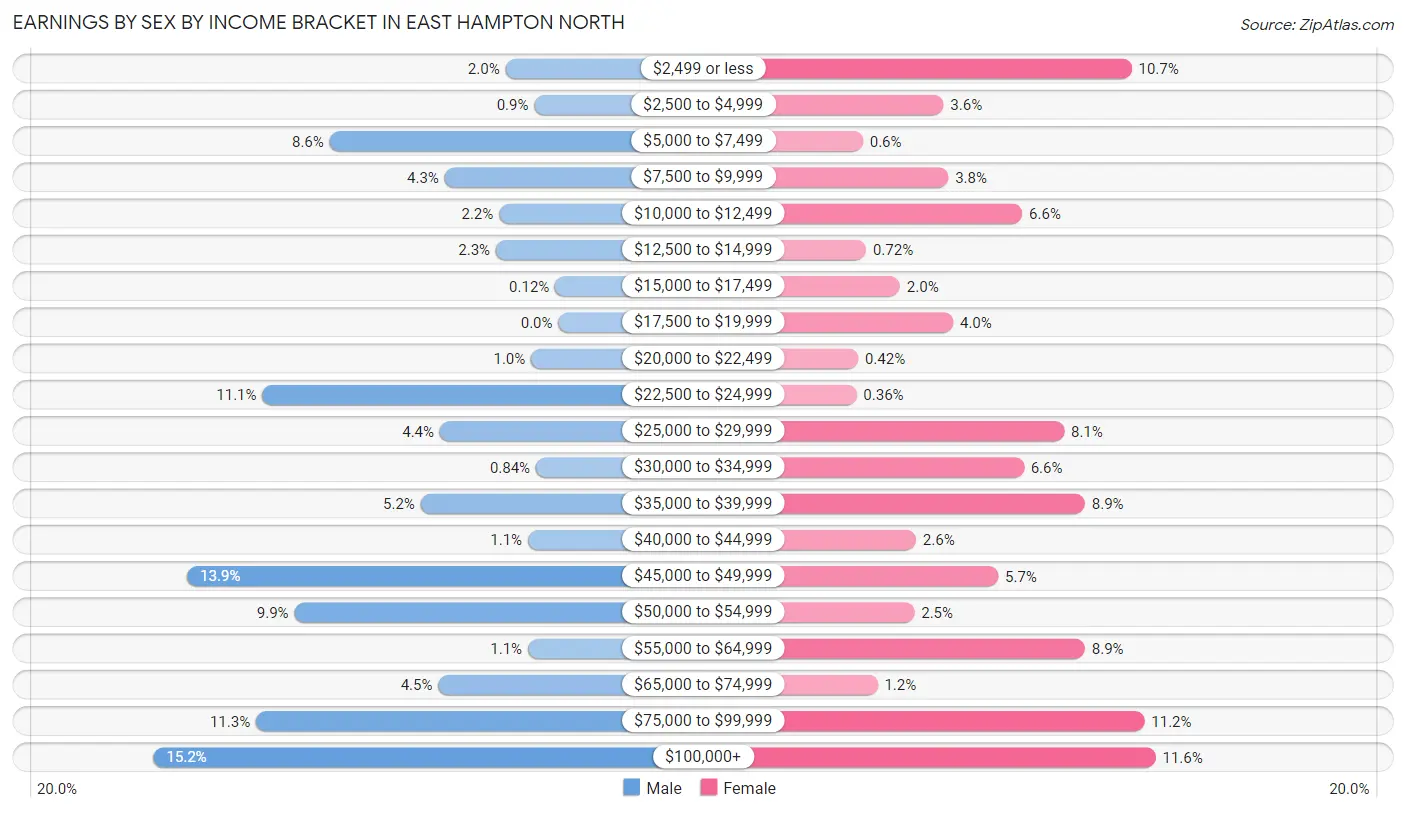
Earnings by Sex by Income Bracket in East Hampton North
The most common earnings brackets in East Hampton North are $100,000+ for men (253 | 15.2%) and $100,000+ for women (192 | 11.6%).
| Income | Male | Female |
| $2,499 or less | 33 (2.0%) | 177 (10.7%) |
| $2,500 to $4,999 | 15 (0.9%) | 60 (3.6%) |
| $5,000 to $7,499 | 143 (8.6%) | 10 (0.6%) |
| $7,500 to $9,999 | 71 (4.3%) | 63 (3.8%) |
| $10,000 to $12,499 | 37 (2.2%) | 109 (6.6%) |
| $12,500 to $14,999 | 39 (2.3%) | 12 (0.7%) |
| $15,000 to $17,499 | 2 (0.1%) | 33 (2.0%) |
| $17,500 to $19,999 | 0 (0.0%) | 66 (4.0%) |
| $20,000 to $22,499 | 17 (1.0%) | 7 (0.4%) |
| $22,500 to $24,999 | 185 (11.1%) | 6 (0.4%) |
| $25,000 to $29,999 | 74 (4.4%) | 135 (8.1%) |
| $30,000 to $34,999 | 14 (0.8%) | 110 (6.6%) |
| $35,000 to $39,999 | 86 (5.2%) | 148 (8.9%) |
| $40,000 to $44,999 | 19 (1.1%) | 43 (2.6%) |
| $45,000 to $49,999 | 232 (13.9%) | 94 (5.7%) |
| $50,000 to $54,999 | 165 (9.9%) | 42 (2.5%) |
| $55,000 to $64,999 | 19 (1.1%) | 148 (8.9%) |
| $65,000 to $74,999 | 75 (4.5%) | 19 (1.1%) |
| $75,000 to $99,999 | 189 (11.3%) | 185 (11.2%) |
| $100,000+ | 253 (15.2%) | 192 (11.6%) |
| Total | 1,668 (100.0%) | 1,659 (100.0%) |
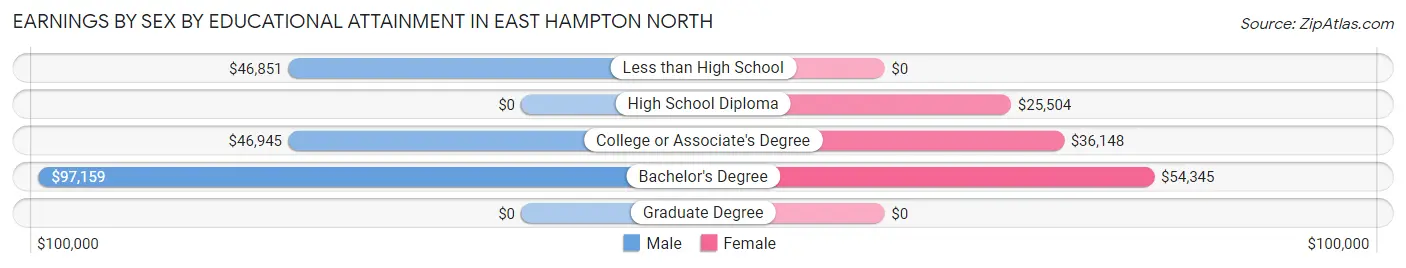
Earnings by Sex by Educational Attainment in East Hampton North
Average earnings in East Hampton North are $47,439 for men and $40,872 for women, a difference of 13.8%. Men with an educational attainment of bachelor's degree enjoy the highest average annual earnings of $97,159, while those with less than high school education earn the least with $46,851. Women with an educational attainment of bachelor's degree earn the most with the average annual earnings of $54,345, while those with high school diploma education have the smallest earnings of $25,504.
| Educational Attainment | Male Income | Female Income |
| Less than High School | $46,851 | $0 |
| High School Diploma | - | - |
| College or Associate's Degree | $46,945 | $36,148 |
| Bachelor's Degree | $97,159 | $54,345 |
| Graduate Degree | - | - |
| Total | $47,439 | $40,872 |
Family Income in East Hampton North
Family Income Brackets in East Hampton North
According to the East Hampton North family income data, there are 345 families falling into the $100,000 to $149,999 income range, which is the most common income bracket and makes up 27.4% of all families. Conversely, the $15,000 to $24,999 income bracket is the least frequent group with only 6 families (0.5%) belonging to this category.
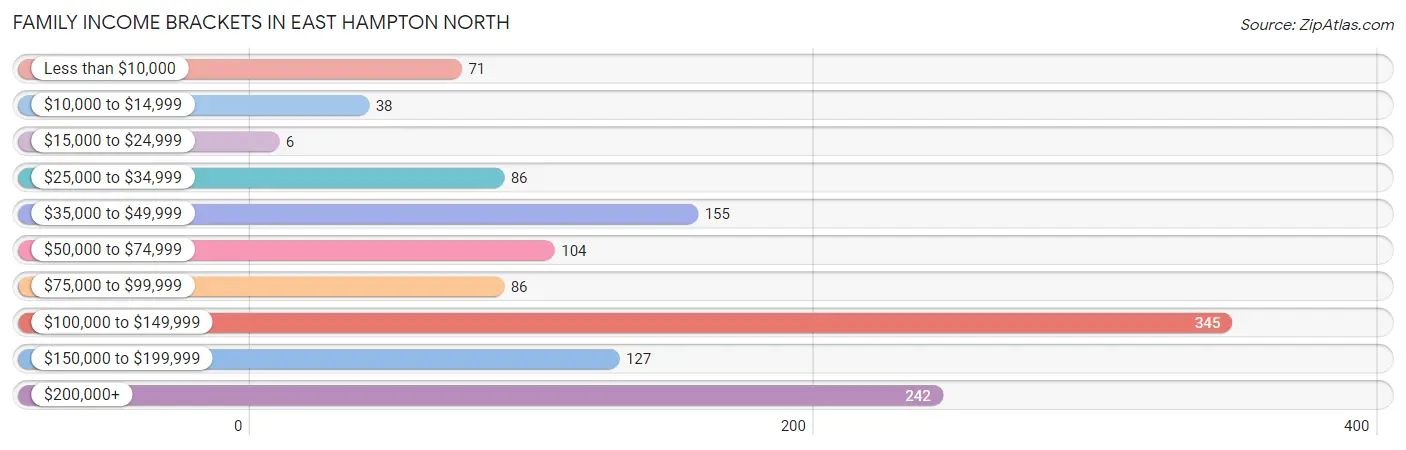
| Income Bracket | # Families | % Families |
| Less than $10,000 | 71 | 5.6% |
| $10,000 to $14,999 | 38 | 3.0% |
| $15,000 to $24,999 | 6 | 0.5% |
| $25,000 to $34,999 | 86 | 6.8% |
| $35,000 to $49,999 | 155 | 12.3% |
| $50,000 to $74,999 | 104 | 8.3% |
| $75,000 to $99,999 | 86 | 6.8% |
| $100,000 to $149,999 | 345 | 27.4% |
| $150,000 to $199,999 | 127 | 10.1% |
| $200,000+ | 242 | 19.2% |
Family Income by Famaliy Size in East Hampton North
7+ person families (56 | 4.4%) account for the highest median family income in East Hampton North with $149,295 per family, while 4-person families (236 | 18.8%) have the highest median income of $34,133 per family member.
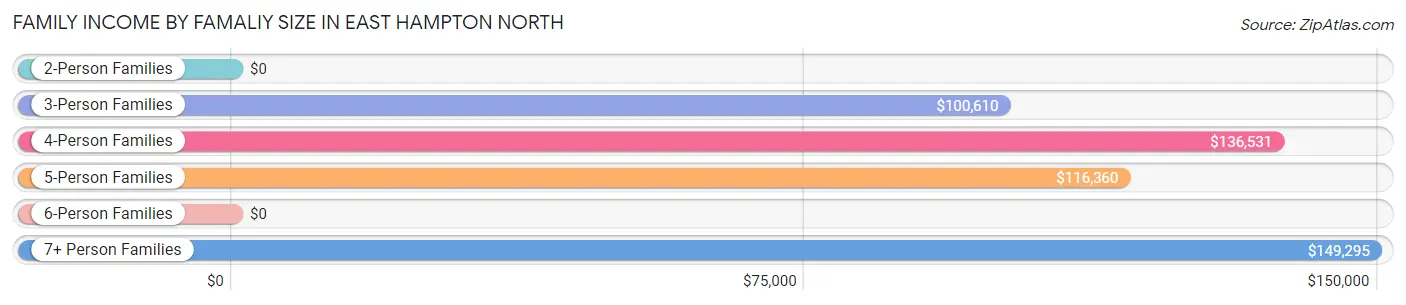
| Income Bracket | # Families | Median Income |
| 2-Person Families | 499 (39.6%) | $0 |
| 3-Person Families | 332 (26.4%) | $100,610 |
| 4-Person Families | 236 (18.8%) | $136,531 |
| 5-Person Families | 77 (6.1%) | $116,360 |
| 6-Person Families | 59 (4.7%) | $0 |
| 7+ Person Families | 56 (4.4%) | $149,295 |
| Total | 1,259 (100.0%) | $106,042 |
Family Income by Number of Earners in East Hampton North
The median family income in East Hampton North is $106,042, with families comprising 3+ earners (285) having the highest median family income of $155,313, while families with 1 earner (478) have the lowest median family income of $55,921, accounting for 22.6% and 38.0% of families, respectively.
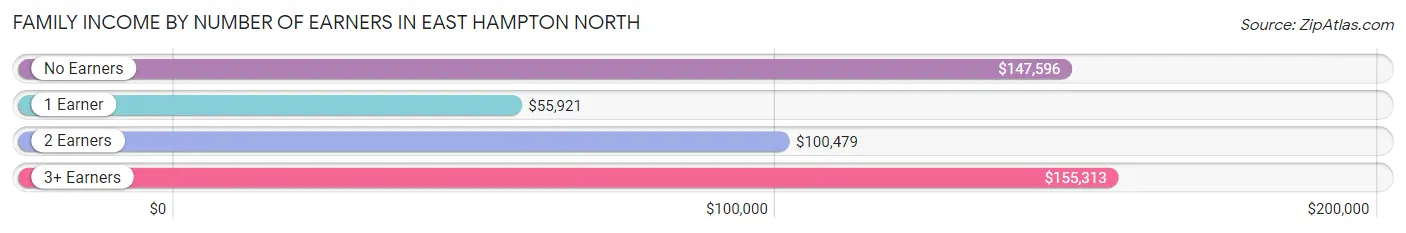
| Number of Earners | # Families | Median Income |
| No Earners | 110 (8.7%) | $147,596 |
| 1 Earner | 478 (38.0%) | $55,921 |
| 2 Earners | 386 (30.7%) | $100,479 |
| 3+ Earners | 285 (22.6%) | $155,313 |
| Total | 1,259 (100.0%) | $106,042 |
Household Income in East Hampton North
Household Income Brackets in East Hampton North
With 593 households falling in the category, the $100,000 to $149,999 income range is the most frequent in East Hampton North, accounting for 30.6% of all households. In contrast, only 50 households (2.6%) fall into the $25,000 to $34,999 income bracket, making it the least populous group.
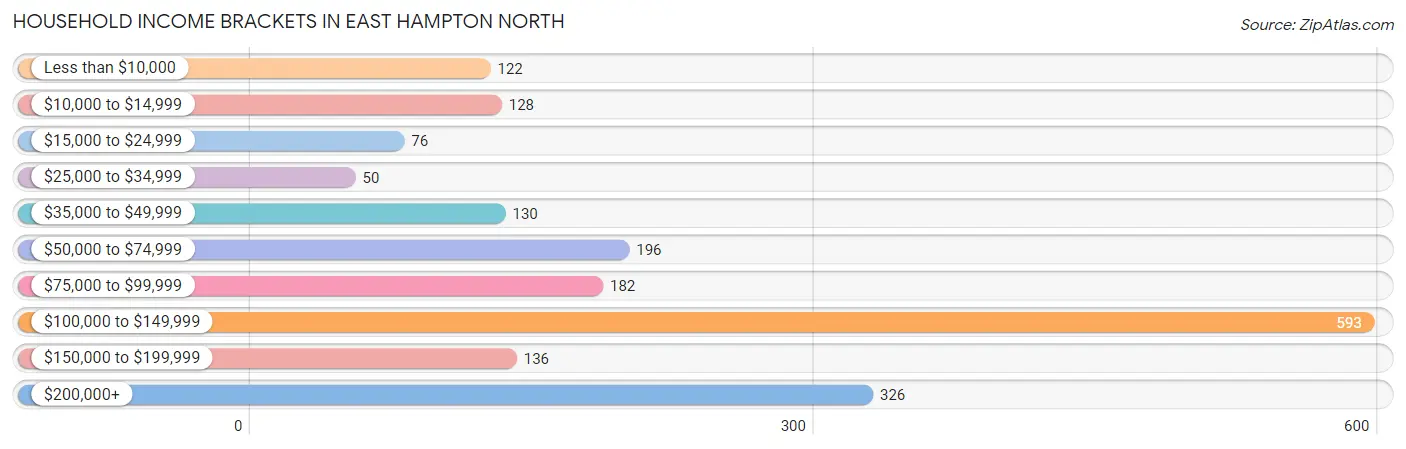
| Income Bracket | # Households | % Households |
| Less than $10,000 | 122 | 6.3% |
| $10,000 to $14,999 | 128 | 6.6% |
| $15,000 to $24,999 | 76 | 3.9% |
| $25,000 to $34,999 | 50 | 2.6% |
| $35,000 to $49,999 | 130 | 6.7% |
| $50,000 to $74,999 | 196 | 10.1% |
| $75,000 to $99,999 | 182 | 9.4% |
| $100,000 to $149,999 | 593 | 30.6% |
| $150,000 to $199,999 | 136 | 7.0% |
| $200,000+ | 326 | 16.8% |
Household Income by Householder Age in East Hampton North
The median household income in East Hampton North is $105,156, with the highest median household income of $116,765 found in the 45 to 64 years age bracket for the primary householder. A total of 822 households (42.4%) fall into this category. Meanwhile, the 15 to 24 years age bracket for the primary householder has the lowest median household income of $0, with 71 households (3.7%) in this group.
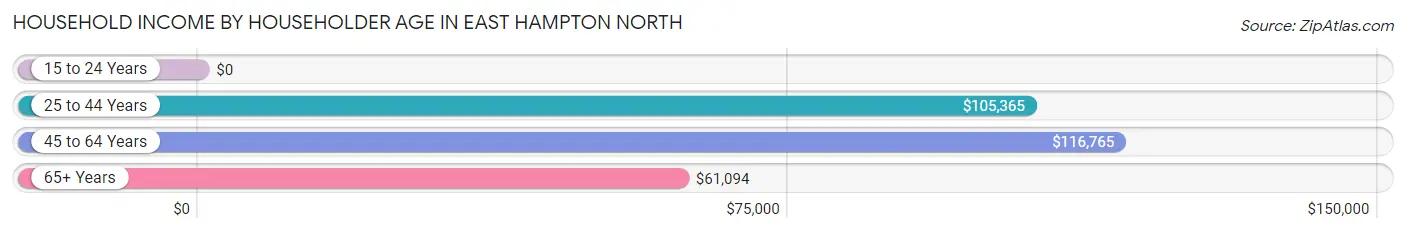
| Income Bracket | # Households | Median Income |
| 15 to 24 Years | 71 (3.7%) | $0 |
| 25 to 44 Years | 574 (29.6%) | $105,365 |
| 45 to 64 Years | 822 (42.4%) | $116,765 |
| 65+ Years | 471 (24.3%) | $61,094 |
| Total | 1,938 (100.0%) | $105,156 |
Poverty in East Hampton North
Income Below Poverty by Sex and Age in East Hampton North
With 5.6% poverty level for males and 10.3% for females among the residents of East Hampton North, 18 to 24 year old males and 18 to 24 year old females are the most vulnerable to poverty, with 111 males (34.8%) and 59 females (36.6%) in their respective age groups living below the poverty level.
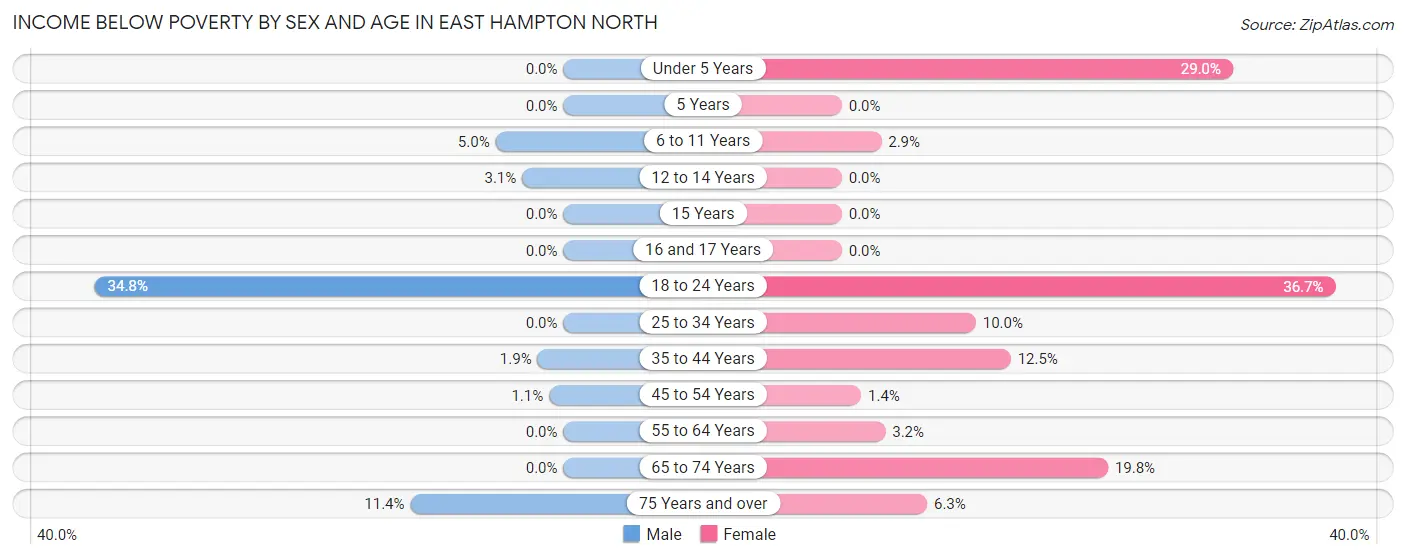
| Age Bracket | Male | Female |
| Under 5 Years | 0 (0.0%) | 81 (29.0%) |
| 5 Years | 0 (0.0%) | 0 (0.0%) |
| 6 to 11 Years | 6 (5.0%) | 7 (2.9%) |
| 12 to 14 Years | 6 (3.1%) | 0 (0.0%) |
| 15 Years | 0 (0.0%) | 0 (0.0%) |
| 16 and 17 Years | 0 (0.0%) | 0 (0.0%) |
| 18 to 24 Years | 111 (34.8%) | 59 (36.6%) |
| 25 to 34 Years | 0 (0.0%) | 39 (10.0%) |
| 35 to 44 Years | 6 (1.9%) | 44 (12.5%) |
| 45 to 54 Years | 3 (1.1%) | 5 (1.4%) |
| 55 to 64 Years | 0 (0.0%) | 17 (3.2%) |
| 65 to 74 Years | 0 (0.0%) | 50 (19.8%) |
| 75 Years and over | 10 (11.4%) | 10 (6.3%) |
| Total | 142 (5.6%) | 312 (10.3%) |
Income Above Poverty by Sex and Age in East Hampton North
According to the poverty statistics in East Hampton North, males aged under 5 years and females aged 12 to 14 years are the age groups that are most secure financially, with 100.0% of males and 100.0% of females in these age groups living above the poverty line.
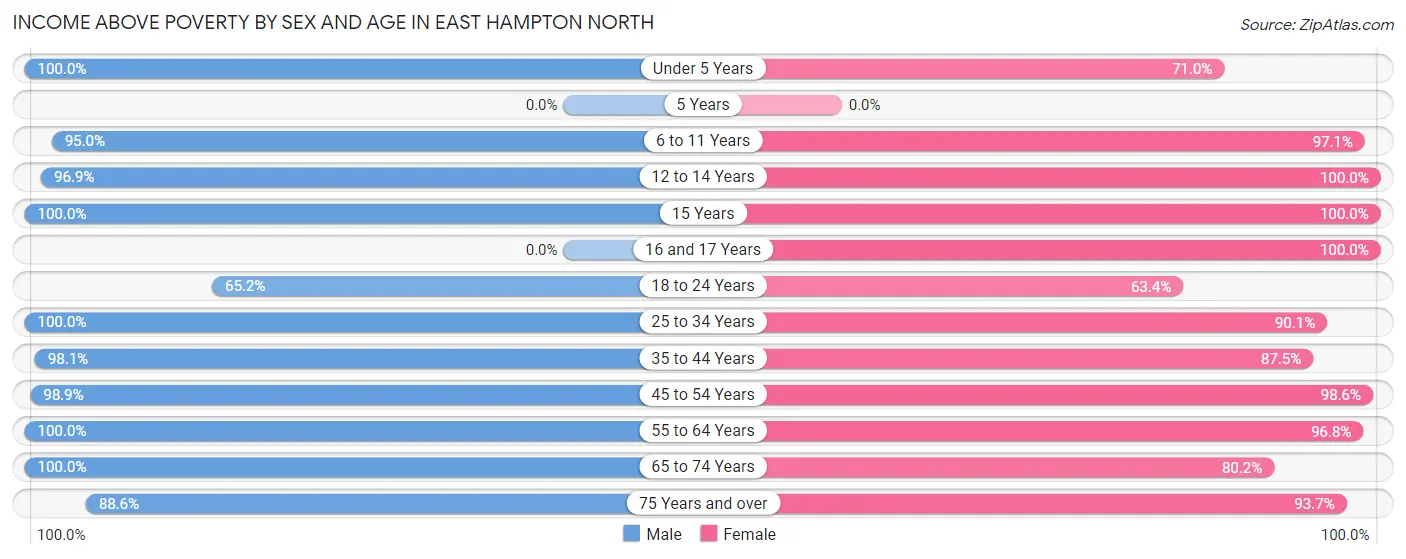
| Age Bracket | Male | Female |
| Under 5 Years | 180 (100.0%) | 198 (71.0%) |
| 5 Years | 0 (0.0%) | 0 (0.0%) |
| 6 to 11 Years | 113 (95.0%) | 232 (97.1%) |
| 12 to 14 Years | 190 (96.9%) | 114 (100.0%) |
| 15 Years | 11 (100.0%) | 25 (100.0%) |
| 16 and 17 Years | 0 (0.0%) | 172 (100.0%) |
| 18 to 24 Years | 208 (65.2%) | 102 (63.3%) |
| 25 to 34 Years | 458 (100.0%) | 353 (90.0%) |
| 35 to 44 Years | 306 (98.1%) | 307 (87.5%) |
| 45 to 54 Years | 279 (98.9%) | 344 (98.6%) |
| 55 to 64 Years | 370 (100.0%) | 510 (96.8%) |
| 65 to 74 Years | 181 (100.0%) | 203 (80.2%) |
| 75 Years and over | 78 (88.6%) | 148 (93.7%) |
| Total | 2,374 (94.4%) | 2,708 (89.7%) |
Income Below Poverty Among Married-Couple Families in East Hampton North
The poverty statistics for married-couple families in East Hampton North show that 0.8% or 6 of the total 789 families live below the poverty line. Families with 3 or 4 children have the highest poverty rate of 26.1%, comprising of 6 families. On the other hand, families with no children have the lowest poverty rate of 0.0%, which includes 0 families.
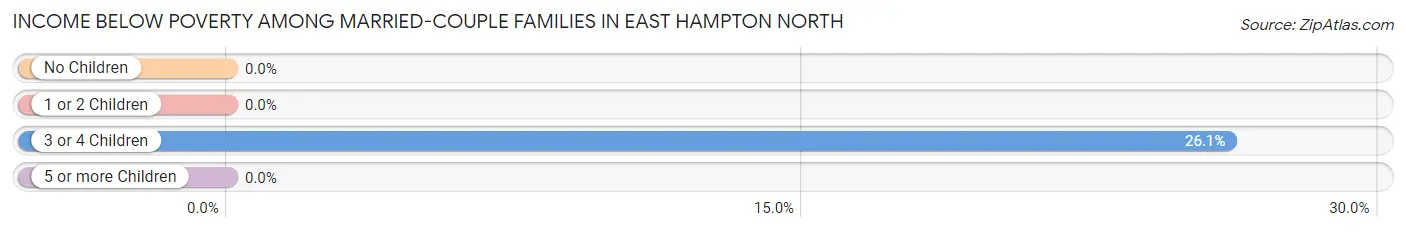
| Children | Above Poverty | Below Poverty |
| No Children | 484 (100.0%) | 0 (0.0%) |
| 1 or 2 Children | 282 (100.0%) | 0 (0.0%) |
| 3 or 4 Children | 17 (73.9%) | 6 (26.1%) |
| 5 or more Children | 0 (0.0%) | 0 (0.0%) |
| Total | 783 (99.2%) | 6 (0.8%) |
Income Below Poverty Among Single-Parent Households in East Hampton North
According to the poverty data in East Hampton North, 51.4% or 71 single-father households and 11.5% or 38 single-mother households are living below the poverty line. Among single-father households, those with 1 or 2 children have the highest poverty rate, with 71 households (51.4%) experiencing poverty. Likewise, among single-mother households, those with no children have the highest poverty rate, with 38 households (49.3%) falling below the poverty line.
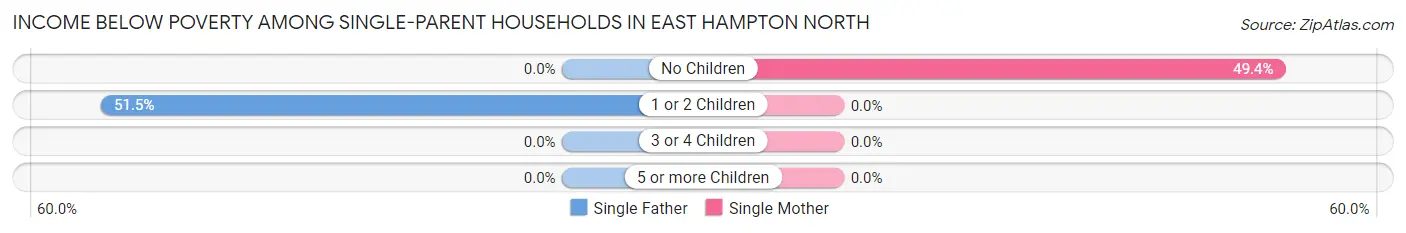
| Children | Single Father | Single Mother |
| No Children | 0 (0.0%) | 38 (49.3%) |
| 1 or 2 Children | 71 (51.4%) | 0 (0.0%) |
| 3 or 4 Children | 0 (0.0%) | 0 (0.0%) |
| 5 or more Children | 0 (0.0%) | 0 (0.0%) |
| Total | 71 (51.4%) | 38 (11.5%) |
Income Below Poverty Among Married-Couple vs Single-Parent Households in East Hampton North
The poverty data for East Hampton North shows that 6 of the married-couple family households (0.8%) and 109 of the single-parent households (23.2%) are living below the poverty level. Within the married-couple family households, those with 3 or 4 children have the highest poverty rate, with 6 households (26.1%) falling below the poverty line. Among the single-parent households, those with no children have the highest poverty rate, with 38 household (49.3%) living below poverty.
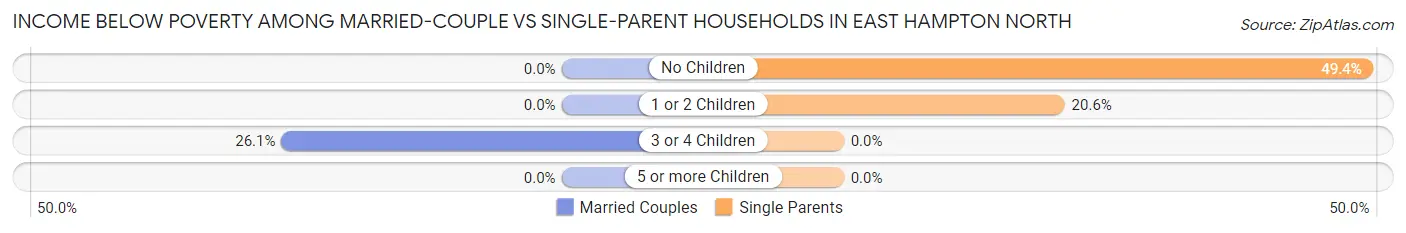
| Children | Married-Couple Families | Single-Parent Households |
| No Children | 0 (0.0%) | 38 (49.3%) |
| 1 or 2 Children | 0 (0.0%) | 71 (20.6%) |
| 3 or 4 Children | 6 (26.1%) | 0 (0.0%) |
| 5 or more Children | 0 (0.0%) | 0 (0.0%) |
| Total | 6 (0.8%) | 109 (23.2%) |
Race in East Hampton North
The most populous races in East Hampton North are White / Caucasian (3,039 | 54.4%), Hispanic or Latino (2,648 | 47.4%), and Two or more Races (1,671 | 29.9%).
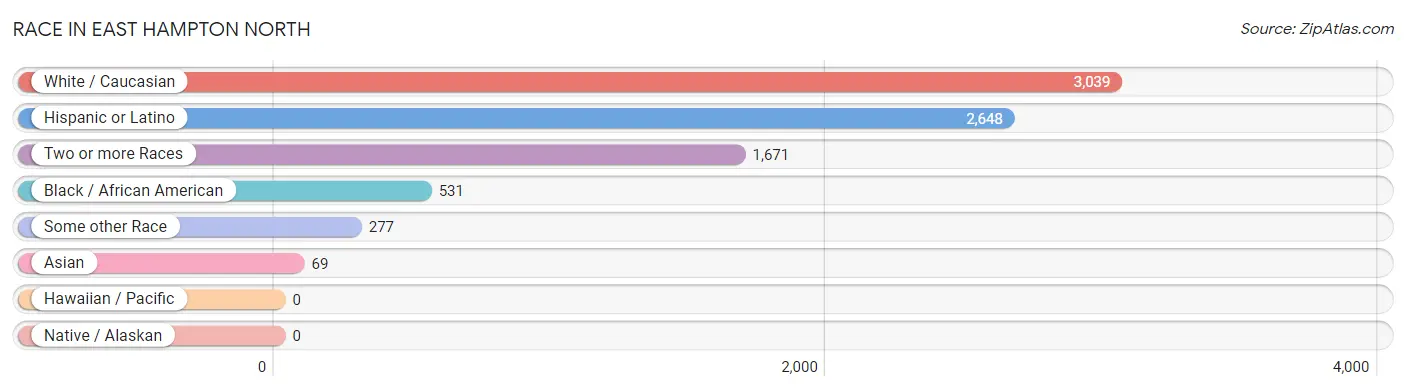
| Race | # Population | % Population |
| Asian | 69 | 1.2% |
| Black / African American | 531 | 9.5% |
| Hawaiian / Pacific | 0 | 0.0% |
| Hispanic or Latino | 2,648 | 47.4% |
| Native / Alaskan | 0 | 0.0% |
| White / Caucasian | 3,039 | 54.4% |
| Two or more Races | 1,671 | 29.9% |
| Some other Race | 277 | 5.0% |
| Total | 5,587 | 100.0% |
Ancestry in East Hampton North
The most populous ancestries reported in East Hampton North are South American (1,519 | 27.2%), Ecuadorian (1,267 | 22.7%), Irish (572 | 10.2%), Mexican (440 | 7.9%), and German (336 | 6.0%), together accounting for 74.0% of all East Hampton North residents.
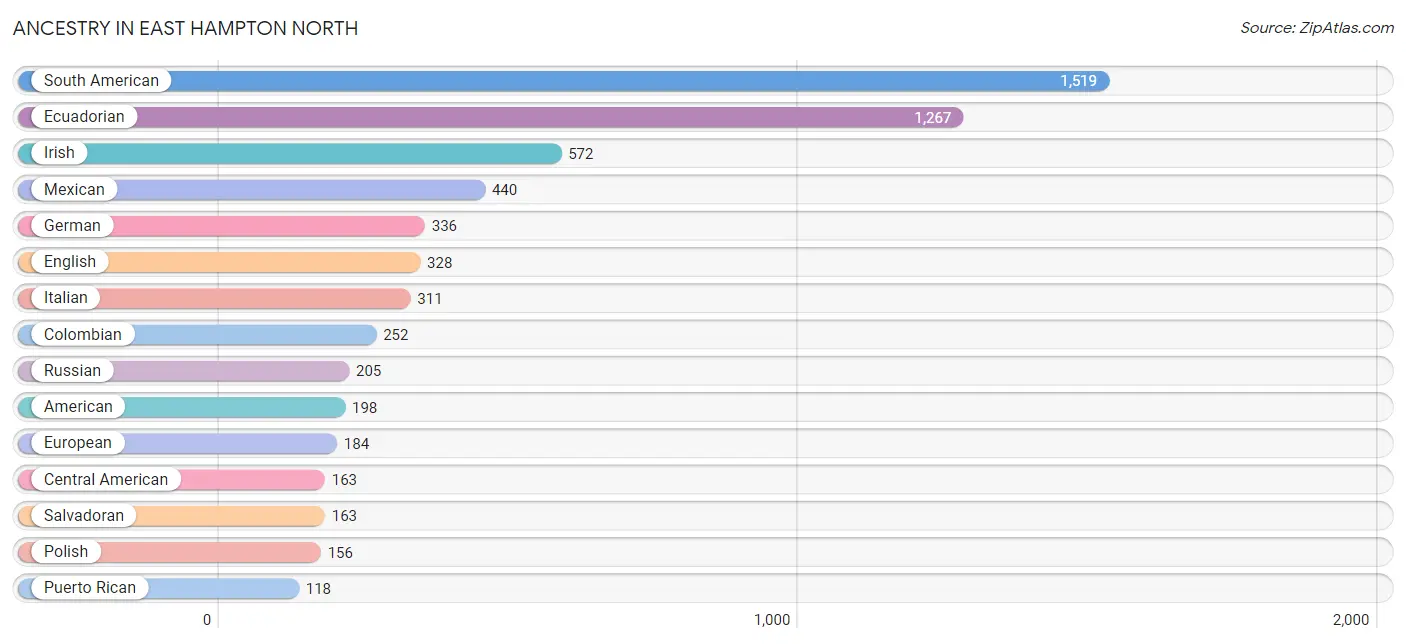
| Ancestry | # Population | % Population |
| African | 30 | 0.5% |
| American | 198 | 3.5% |
| Australian | 19 | 0.3% |
| Austrian | 14 | 0.3% |
| British West Indian | 36 | 0.6% |
| Central American | 163 | 2.9% |
| Colombian | 252 | 4.5% |
| Cuban | 59 | 1.1% |
| Czech | 65 | 1.2% |
| Danish | 22 | 0.4% |
| Dominican | 75 | 1.3% |
| Dutch | 10 | 0.2% |
| Ecuadorian | 1,267 | 22.7% |
| English | 328 | 5.9% |
| European | 184 | 3.3% |
| Finnish | 4 | 0.1% |
| French | 87 | 1.6% |
| German | 336 | 6.0% |
| Greek | 19 | 0.3% |
| Hungarian | 12 | 0.2% |
| Indian (Asian) | 9 | 0.2% |
| Irish | 572 | 10.2% |
| Israeli | 8 | 0.1% |
| Italian | 311 | 5.6% |
| Korean | 60 | 1.1% |
| Lithuanian | 6 | 0.1% |
| Mexican | 440 | 7.9% |
| Mexican American Indian | 15 | 0.3% |
| Navajo | 45 | 0.8% |
| Norwegian | 47 | 0.8% |
| Polish | 156 | 2.8% |
| Puerto Rican | 118 | 2.1% |
| Russian | 205 | 3.7% |
| Salvadoran | 163 | 2.9% |
| Scottish | 38 | 0.7% |
| South American | 1,519 | 27.2% |
| Spaniard | 60 | 1.1% |
| Spanish | 4 | 0.1% |
| Subsaharan African | 30 | 0.5% |
| Ukrainian | 46 | 0.8% | View All 40 Rows |
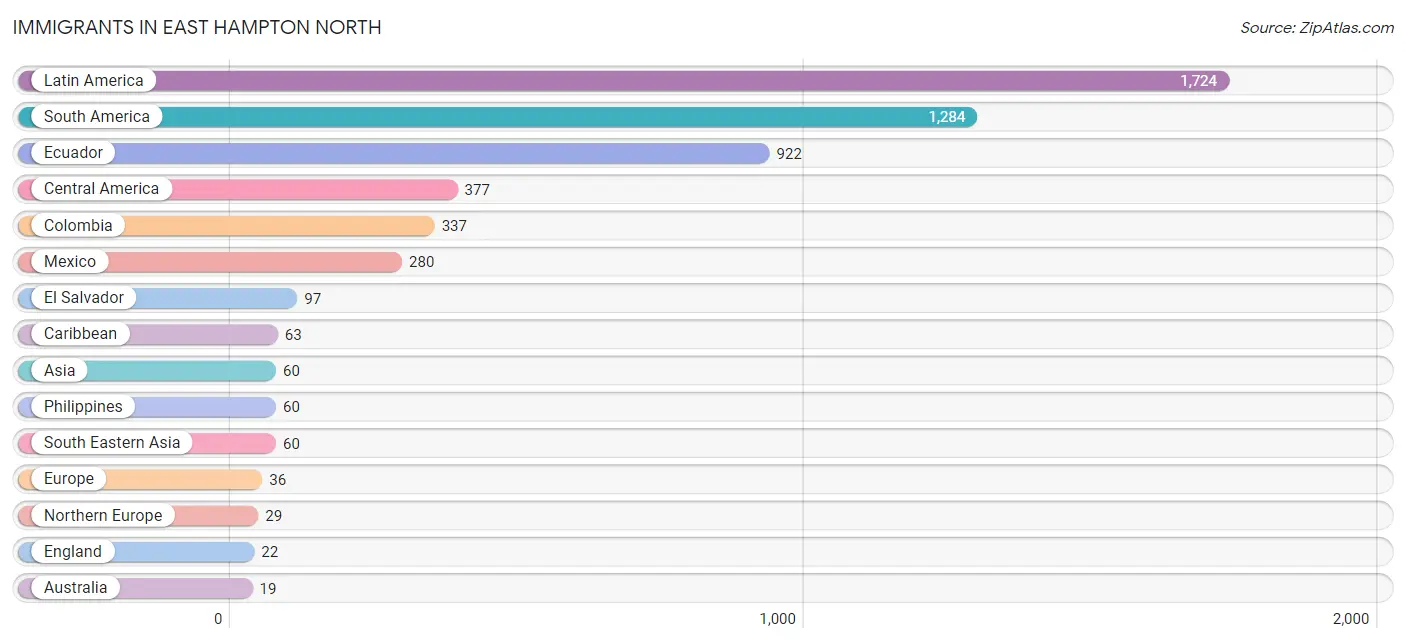
Immigrants in East Hampton North
The most numerous immigrant groups reported in East Hampton North came from Latin America (1,724 | 30.9%), South America (1,284 | 23.0%), Ecuador (922 | 16.5%), Central America (377 | 6.8%), and Colombia (337 | 6.0%), together accounting for 83.1% of all East Hampton North residents.
| Immigration Origin | # Population | % Population |
| Asia | 60 | 1.1% |
| Australia | 19 | 0.3% |
| Brazil | 6 | 0.1% |
| Caribbean | 63 | 1.1% |
| Central America | 377 | 6.8% |
| Colombia | 337 | 6.0% |
| Dominican Republic | 12 | 0.2% |
| Eastern Europe | 7 | 0.1% |
| Ecuador | 922 | 16.5% |
| El Salvador | 97 | 1.7% |
| England | 22 | 0.4% |
| Europe | 36 | 0.6% |
| Guyana | 19 | 0.3% |
| Ireland | 7 | 0.1% |
| Latin America | 1,724 | 30.9% |
| Mexico | 280 | 5.0% |
| Northern Europe | 29 | 0.5% |
| Oceania | 19 | 0.3% |
| Philippines | 60 | 1.1% |
| Russia | 7 | 0.1% |
| South America | 1,284 | 23.0% |
| South Eastern Asia | 60 | 1.1% | View All 22 Rows |
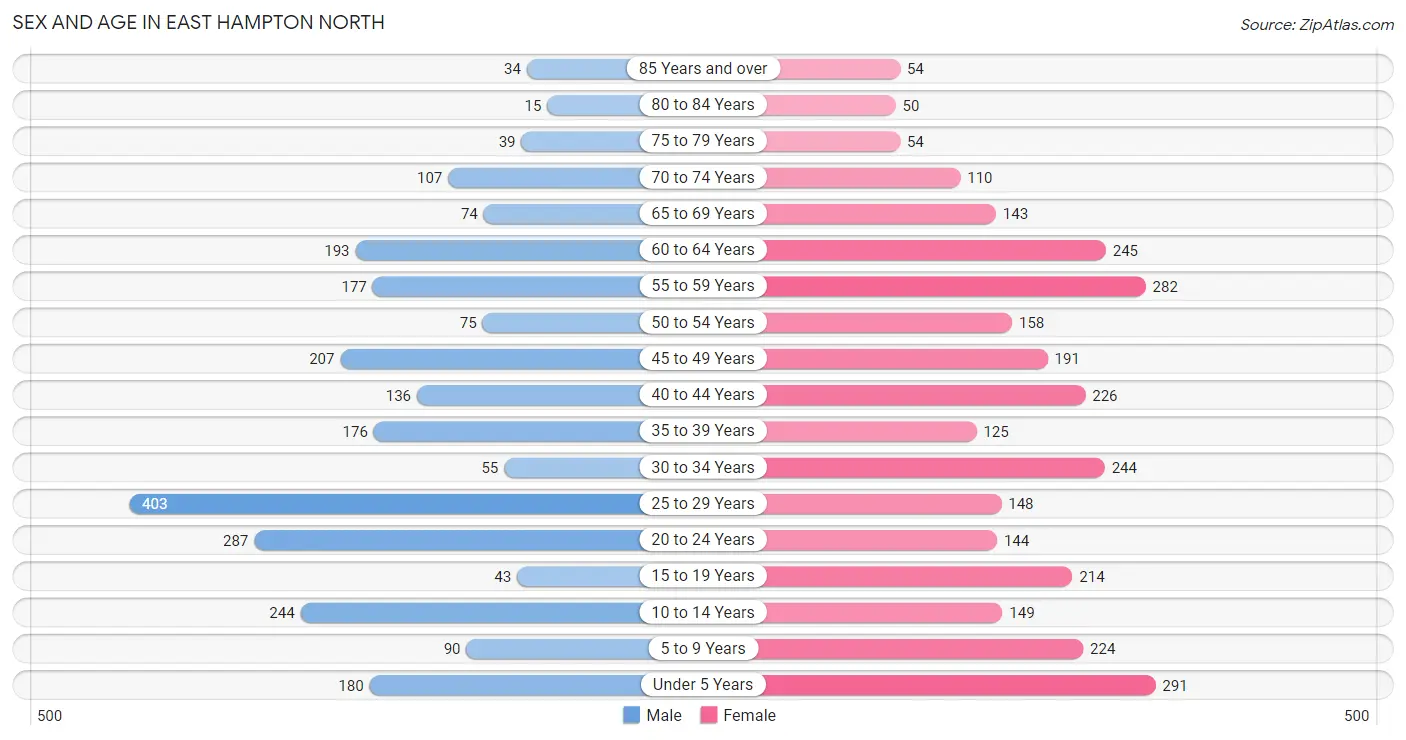
Sex and Age in East Hampton North
Sex and Age in East Hampton North
The most populous age groups in East Hampton North are 25 to 29 Years (403 | 15.9%) for men and Under 5 Years (291 | 9.5%) for women.
| Age Bracket | Male | Female |
| Under 5 Years | 180 (7.1%) | 291 (9.5%) |
| 5 to 9 Years | 90 (3.5%) | 224 (7.3%) |
| 10 to 14 Years | 244 (9.6%) | 149 (4.9%) |
| 15 to 19 Years | 43 (1.7%) | 214 (7.0%) |
| 20 to 24 Years | 287 (11.3%) | 144 (4.7%) |
| 25 to 29 Years | 403 (15.9%) | 148 (4.9%) |
| 30 to 34 Years | 55 (2.2%) | 244 (8.0%) |
| 35 to 39 Years | 176 (6.9%) | 125 (4.1%) |
| 40 to 44 Years | 136 (5.4%) | 226 (7.4%) |
| 45 to 49 Years | 207 (8.2%) | 191 (6.3%) |
| 50 to 54 Years | 75 (3.0%) | 158 (5.2%) |
| 55 to 59 Years | 177 (7.0%) | 282 (9.2%) |
| 60 to 64 Years | 193 (7.6%) | 245 (8.0%) |
| 65 to 69 Years | 74 (2.9%) | 143 (4.7%) |
| 70 to 74 Years | 107 (4.2%) | 110 (3.6%) |
| 75 to 79 Years | 39 (1.5%) | 54 (1.8%) |
| 80 to 84 Years | 15 (0.6%) | 50 (1.6%) |
| 85 Years and over | 34 (1.3%) | 54 (1.8%) |
| Total | 2,535 (100.0%) | 3,052 (100.0%) |
Families and Households in East Hampton North
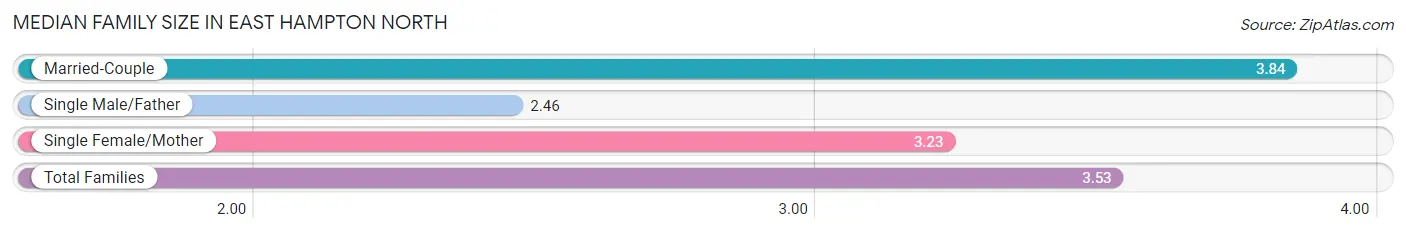
Median Family Size in East Hampton North
The median family size in East Hampton North is 3.53 persons per family, with married-couple families (789 | 62.7%) accounting for the largest median family size of 3.84 persons per family. On the other hand, single male/father families (138 | 11.0%) represent the smallest median family size with 2.46 persons per family.
| Family Type | # Families | Family Size |
| Married-Couple | 789 (62.7%) | 3.84 |
| Single Male/Father | 138 (11.0%) | 2.46 |
| Single Female/Mother | 332 (26.4%) | 3.23 |
| Total Families | 1,259 (100.0%) | 3.53 |
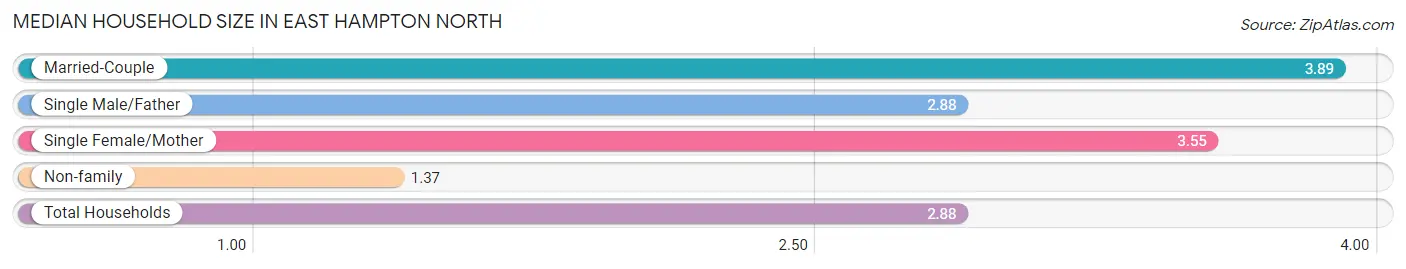
Median Household Size in East Hampton North
The median household size in East Hampton North is 2.88 persons per household, with married-couple households (789 | 40.7%) accounting for the largest median household size of 3.89 persons per household. non-family households (679 | 35.0%) represent the smallest median household size with 1.37 persons per household.
| Household Type | # Households | Household Size |
| Married-Couple | 789 (40.7%) | 3.89 |
| Single Male/Father | 138 (7.1%) | 2.88 |
| Single Female/Mother | 332 (17.1%) | 3.55 |
| Non-family | 679 (35.0%) | 1.37 |
| Total Households | 1,938 (100.0%) | 2.88 |
Household Size by Marriage Status in East Hampton North
Out of a total of 1,938 households in East Hampton North, 1,259 (65.0%) are family households, while 679 (35.0%) are nonfamily households. The most numerous type of family households are 3-person households, comprising 442, and the most common type of nonfamily households are 1-person households, comprising 460.
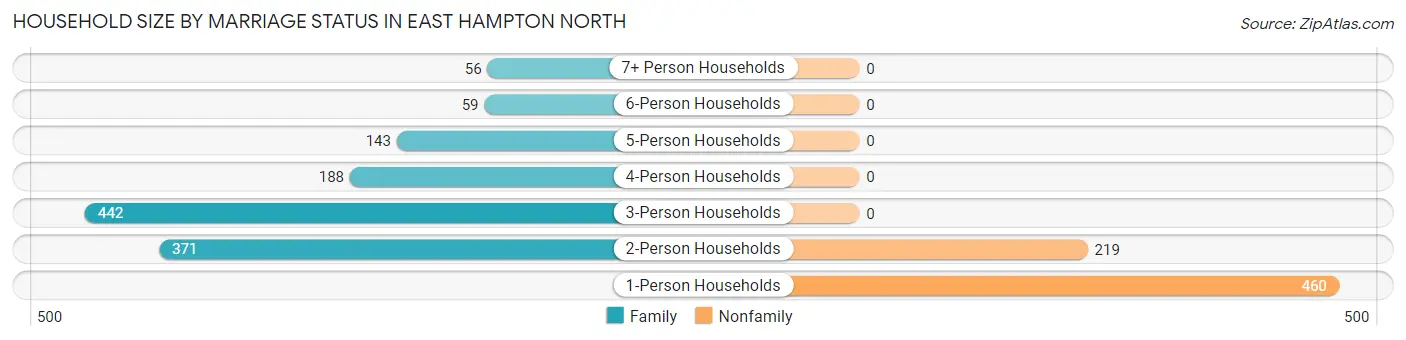
| Household Size | Family Households | Nonfamily Households |
| 1-Person Households | - | 460 (23.7%) |
| 2-Person Households | 371 (19.1%) | 219 (11.3%) |
| 3-Person Households | 442 (22.8%) | 0 (0.0%) |
| 4-Person Households | 188 (9.7%) | 0 (0.0%) |
| 5-Person Households | 143 (7.4%) | 0 (0.0%) |
| 6-Person Households | 59 (3.0%) | 0 (0.0%) |
| 7+ Person Households | 56 (2.9%) | 0 (0.0%) |
| Total | 1,259 (65.0%) | 679 (35.0%) |
Female Fertility in East Hampton North
Fertility by Age in East Hampton North
Average fertility rate in East Hampton North is 27.0 births per 1,000 women. Women in the age bracket of 35 to 50 years have the highest fertility rate with 62.0 births per 1,000 women. Women in the age bracket of 35 to 50 years acount for 100.0% of all women with births.
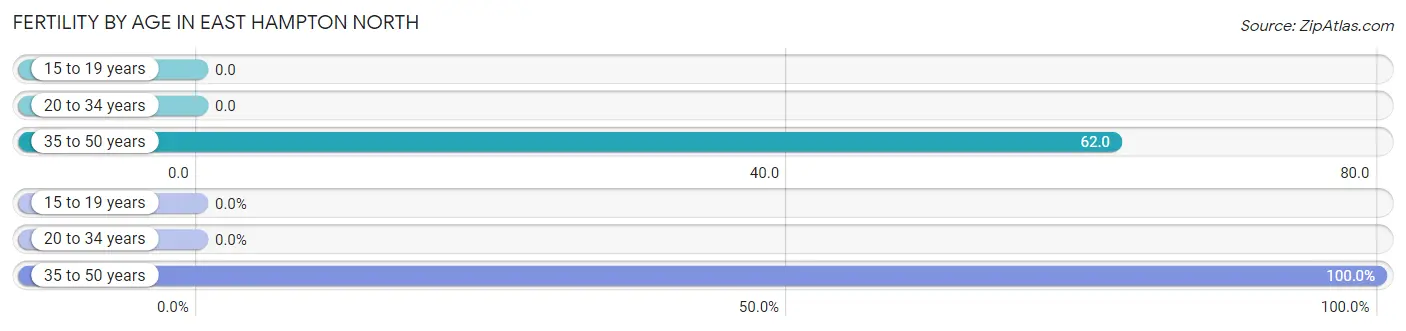
| Age Bracket | Women with Births | Births / 1,000 Women |
| 15 to 19 years | 0 (0.0%) | 0.0 |
| 20 to 34 years | 0 (0.0%) | 0.0 |
| 35 to 50 years | 35 (100.0%) | 62.0 |
| Total | 35 (100.0%) | 27.0 |
Fertility by Age by Marriage Status in East Hampton North
5.7% of women with births (35) in East Hampton North are married. The highest percentage of unmarried women with births falls into 35 to 50 years age bracket with 94.3% of them unmarried at the time of birth, while the lowest percentage of unmarried women with births belong to 35 to 50 years age bracket with 94.3% of them unmarried.
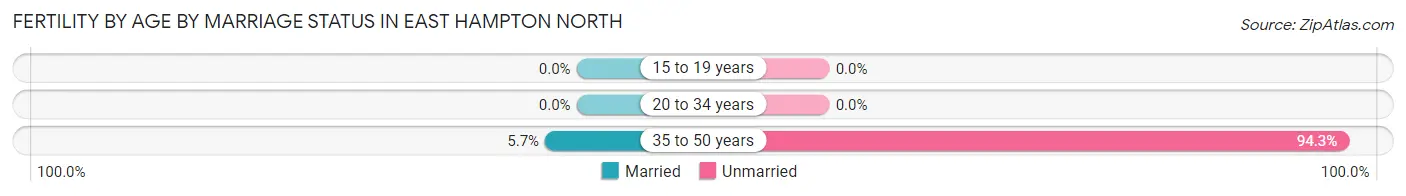
| Age Bracket | Married | Unmarried |
| 15 to 19 years | 0 (0.0%) | 0 (0.0%) |
| 20 to 34 years | 0 (0.0%) | 0 (0.0%) |
| 35 to 50 years | 2 (5.7%) | 33 (94.3%) |
| Total | 2 (5.7%) | 33 (94.3%) |
Fertility by Education in East Hampton North
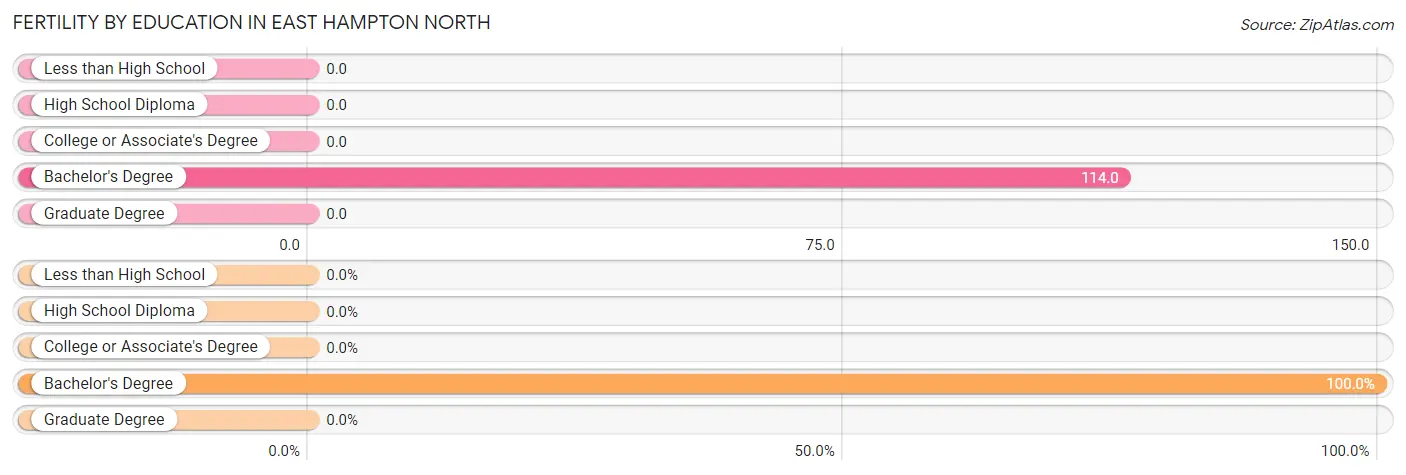
| Educational Attainment | Women with Births | Births / 1,000 Women |
| Less than High School | 0 (0.0%) | 0.0 |
| High School Diploma | 0 (0.0%) | 0.0 |
| College or Associate's Degree | 0 (0.0%) | 0.0 |
| Bachelor's Degree | 35 (100.0%) | 114.0 |
| Graduate Degree | 0 (0.0%) | 0.0 |
| Total | 35 (100.0%) | 27.0 |
Fertility by Education by Marriage Status in East Hampton North
94.3% of women with births in East Hampton North are unmarried. Women with the educational attainment of bachelor's degree are most likely to be married with 5.7% of them married at childbirth, while women with the educational attainment of bachelor's degree are least likely to be married with 94.3% of them unmarried at childbirth.
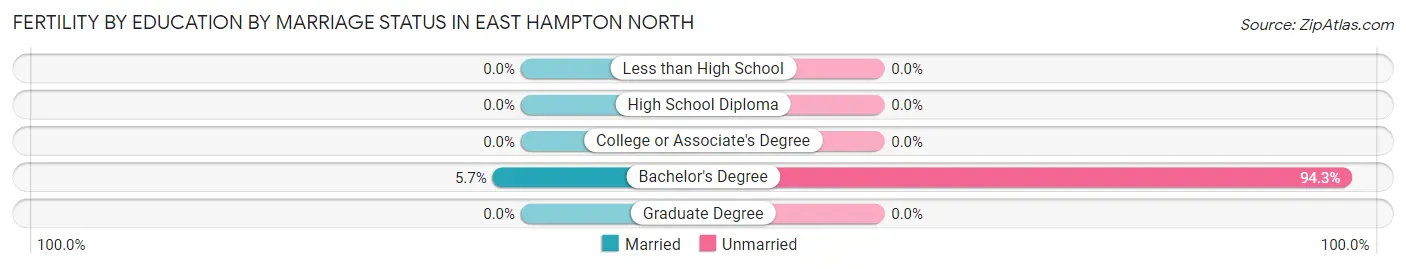
| Educational Attainment | Married | Unmarried |
| Less than High School | 0 (0.0%) | 0 (0.0%) |
| High School Diploma | 0 (0.0%) | 0 (0.0%) |
| College or Associate's Degree | 0 (0.0%) | 0 (0.0%) |
| Bachelor's Degree | 2 (5.7%) | 33 (94.3%) |
| Graduate Degree | 0 (0.0%) | 0 (0.0%) |
| Total | 2 (5.7%) | 33 (94.3%) |
Employment Characteristics in East Hampton North
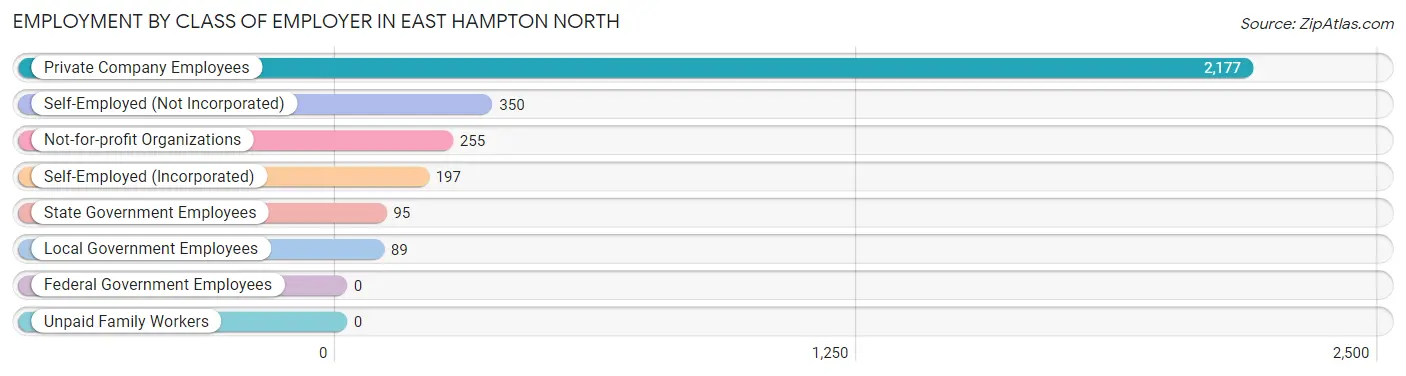
Employment by Class of Employer in East Hampton North
Among the 3,163 employed individuals in East Hampton North, private company employees (2,177 | 68.8%), self-employed (not incorporated) (350 | 11.1%), and not-for-profit organizations (255 | 8.1%) make up the most common classes of employment.
| Employer Class | # Employees | % Employees |
| Private Company Employees | 2,177 | 68.8% |
| Self-Employed (Incorporated) | 197 | 6.2% |
| Self-Employed (Not Incorporated) | 350 | 11.1% |
| Not-for-profit Organizations | 255 | 8.1% |
| Local Government Employees | 89 | 2.8% |
| State Government Employees | 95 | 3.0% |
| Federal Government Employees | 0 | 0.0% |
| Unpaid Family Workers | 0 | 0.0% |
| Total | 3,163 | 100.0% |
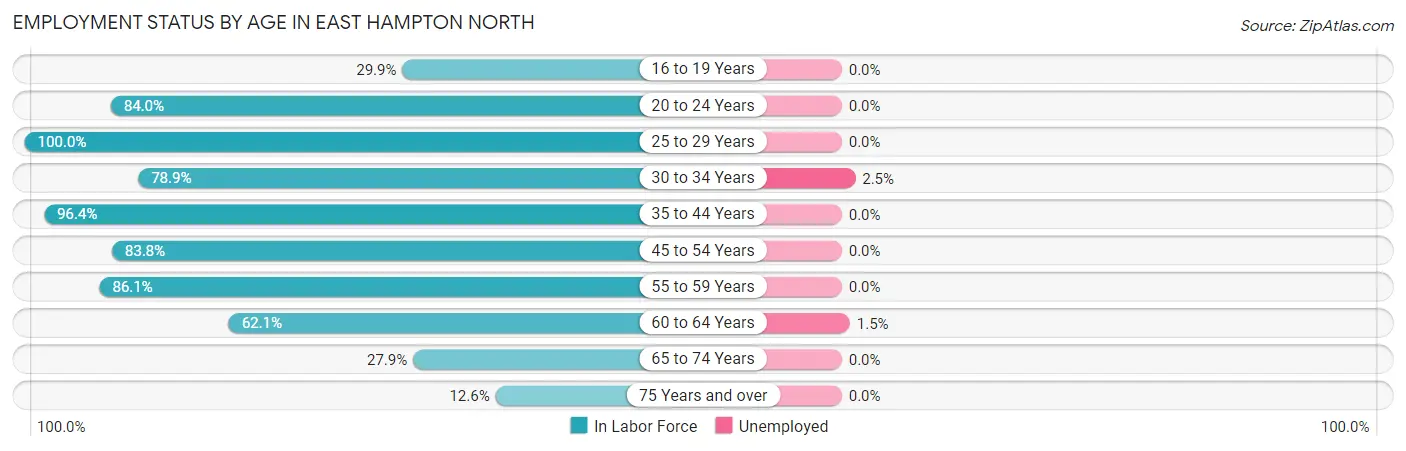
Employment Status by Age in East Hampton North
According to the labor force statistics for East Hampton North, out of the total population over 16 years of age (4,373), 73.2% or 3,201 individuals are in the labor force, with 0.3% or 10 of them unemployed. The age group with the highest labor force participation rate is 25 to 29 years, with 100.0% or 551 individuals in the labor force. Within the labor force, the 30 to 34 years age range has the highest percentage of unemployed individuals, with 2.5% or 6 of them being unemployed.
| Age Bracket | In Labor Force | Unemployed |
| 16 to 19 Years | 66 (29.9%) | 0 (0.0%) |
| 20 to 24 Years | 362 (84.0%) | 0 (0.0%) |
| 25 to 29 Years | 551 (100.0%) | 0 (0.0%) |
| 30 to 34 Years | 236 (78.9%) | 6 (2.5%) |
| 35 to 44 Years | 639 (96.4%) | 0 (0.0%) |
| 45 to 54 Years | 529 (83.8%) | 0 (0.0%) |
| 55 to 59 Years | 395 (86.1%) | 0 (0.0%) |
| 60 to 64 Years | 272 (62.1%) | 4 (1.5%) |
| 65 to 74 Years | 121 (27.9%) | 0 (0.0%) |
| 75 Years and over | 31 (12.6%) | 0 (0.0%) |
| Total | 3,201 (73.2%) | 10 (0.3%) |
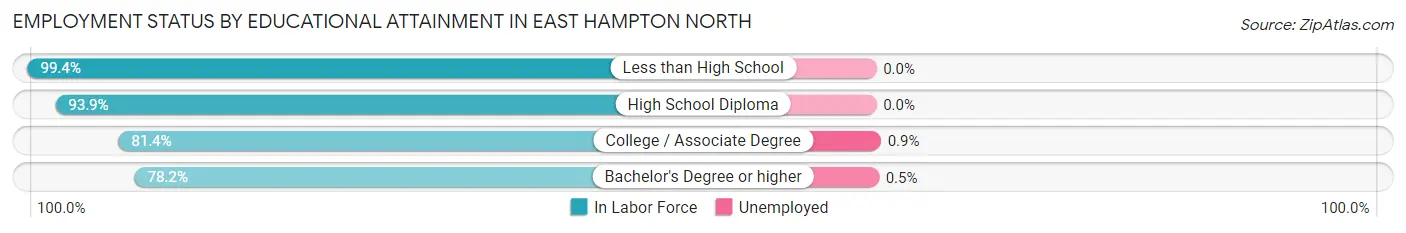
Employment Status by Educational Attainment in East Hampton North
According to labor force statistics for East Hampton North, 86.2% of individuals (2,621) out of the total population between 25 and 64 years of age (3,041) are in the labor force, with 0.4% or 10 of them being unemployed. The group with the highest labor force participation rate are those with the educational attainment of less than high school, with 99.4% or 484 individuals in the labor force. Within the labor force, individuals with college / associate degree education have the highest percentage of unemployment, with 0.9% or 6 of them being unemployed.
| Educational Attainment | In Labor Force | Unemployed |
| Less than High School | 484 (99.4%) | 0 (0.0%) |
| High School Diploma | 677 (93.9%) | 0 (0.0%) |
| College / Associate Degree | 696 (81.4%) | 8 (0.9%) |
| Bachelor's Degree or higher | 765 (78.2%) | 5 (0.5%) |
| Total | 2,621 (86.2%) | 12 (0.4%) |
Employment Occupations by Sex in East Hampton North
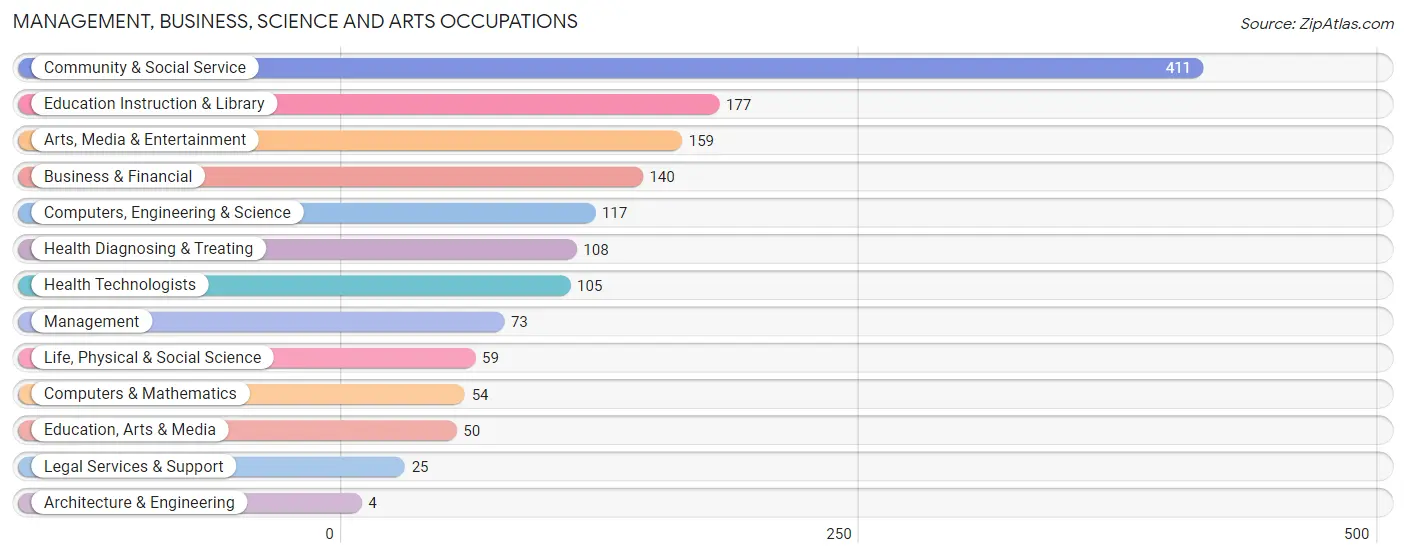
Management, Business, Science and Arts Occupations
The most common Management, Business, Science and Arts occupations in East Hampton North are Community & Social Service (411 | 12.9%), Education Instruction & Library (177 | 5.6%), Arts, Media & Entertainment (159 | 5.0%), Business & Financial (140 | 4.4%), and Computers, Engineering & Science (117 | 3.7%).
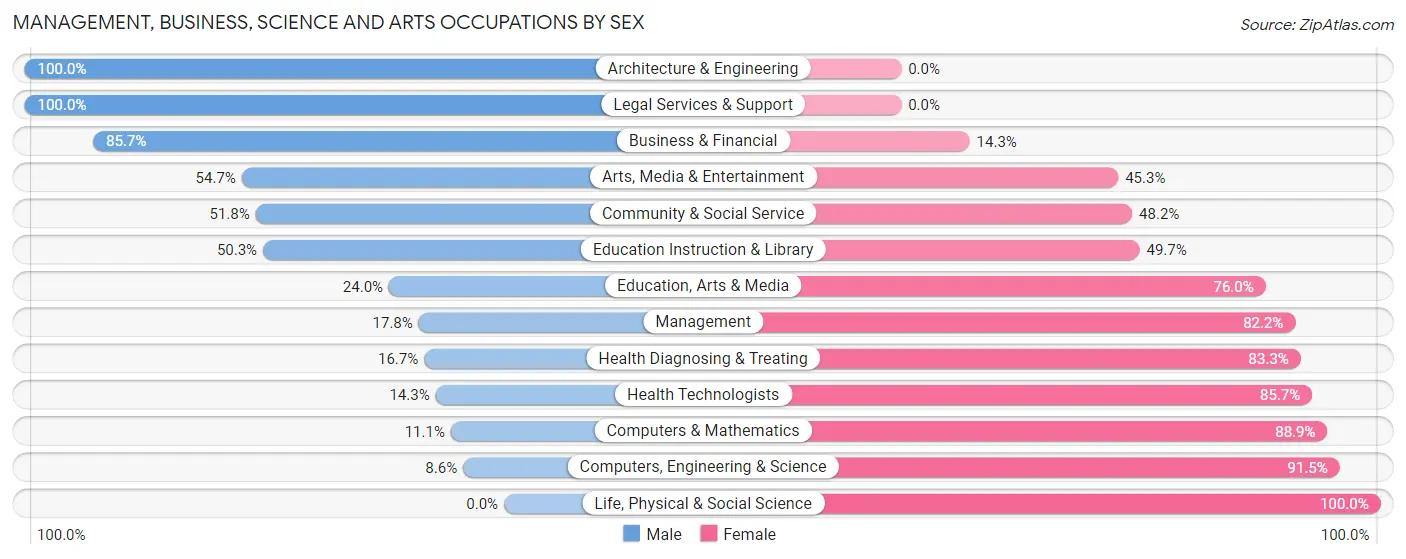
Management, Business, Science and Arts Occupations by Sex
Within the Management, Business, Science and Arts occupations in East Hampton North, the most male-oriented occupations are Architecture & Engineering (100.0%), Legal Services & Support (100.0%), and Business & Financial (85.7%), while the most female-oriented occupations are Life, Physical & Social Science (100.0%), Computers, Engineering & Science (91.4%), and Computers & Mathematics (88.9%).
| Occupation | Male | Female |
| Management | 13 (17.8%) | 60 (82.2%) |
| Business & Financial | 120 (85.7%) | 20 (14.3%) |
| Computers, Engineering & Science | 10 (8.6%) | 107 (91.4%) |
| Computers & Mathematics | 6 (11.1%) | 48 (88.9%) |
| Architecture & Engineering | 4 (100.0%) | 0 (0.0%) |
| Life, Physical & Social Science | 0 (0.0%) | 59 (100.0%) |
| Community & Social Service | 213 (51.8%) | 198 (48.2%) |
| Education, Arts & Media | 12 (24.0%) | 38 (76.0%) |
| Legal Services & Support | 25 (100.0%) | 0 (0.0%) |
| Education Instruction & Library | 89 (50.3%) | 88 (49.7%) |
| Arts, Media & Entertainment | 87 (54.7%) | 72 (45.3%) |
| Health Diagnosing & Treating | 18 (16.7%) | 90 (83.3%) |
| Health Technologists | 15 (14.3%) | 90 (85.7%) |
| Total (Category) | 374 (44.1%) | 475 (55.9%) |
| Total (Overall) | 1,634 (51.2%) | 1,558 (48.8%) |
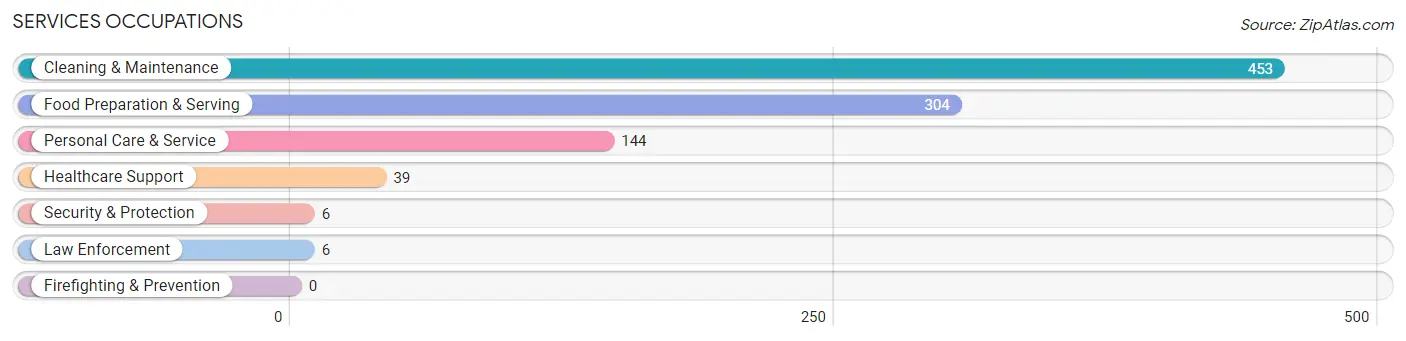
Services Occupations
The most common Services occupations in East Hampton North are Cleaning & Maintenance (453 | 14.2%), Food Preparation & Serving (304 | 9.5%), Personal Care & Service (144 | 4.5%), Healthcare Support (39 | 1.2%), and Security & Protection (6 | 0.2%).
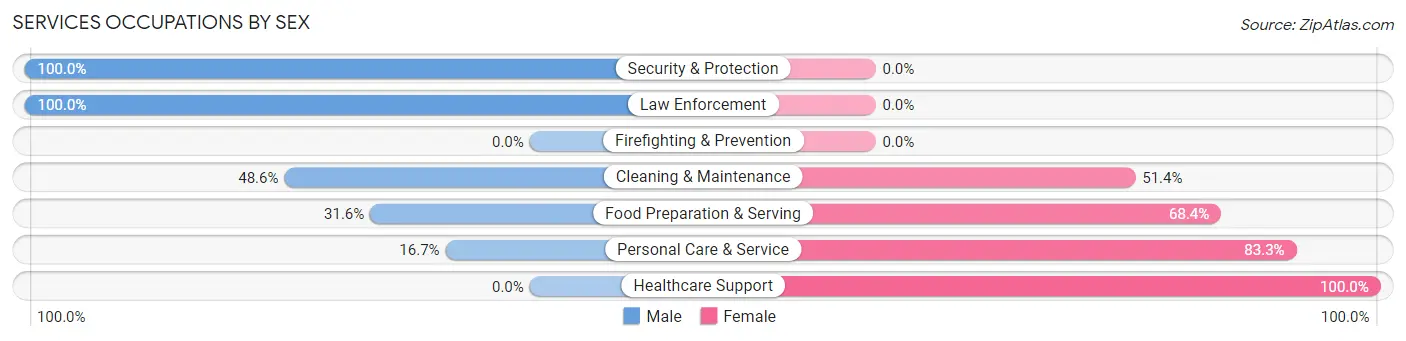
Services Occupations by Sex
Within the Services occupations in East Hampton North, the most male-oriented occupations are Security & Protection (100.0%), Law Enforcement (100.0%), and Cleaning & Maintenance (48.6%), while the most female-oriented occupations are Healthcare Support (100.0%), Personal Care & Service (83.3%), and Food Preparation & Serving (68.4%).
| Occupation | Male | Female |
| Healthcare Support | 0 (0.0%) | 39 (100.0%) |
| Security & Protection | 6 (100.0%) | 0 (0.0%) |
| Firefighting & Prevention | 0 (0.0%) | 0 (0.0%) |
| Law Enforcement | 6 (100.0%) | 0 (0.0%) |
| Food Preparation & Serving | 96 (31.6%) | 208 (68.4%) |
| Cleaning & Maintenance | 220 (48.6%) | 233 (51.4%) |
| Personal Care & Service | 24 (16.7%) | 120 (83.3%) |
| Total (Category) | 346 (36.6%) | 600 (63.4%) |
| Total (Overall) | 1,634 (51.2%) | 1,558 (48.8%) |
Sales and Office Occupations
The most common Sales and Office occupations in East Hampton North are Office & Administration (349 | 10.9%), and Sales & Related (227 | 7.1%).
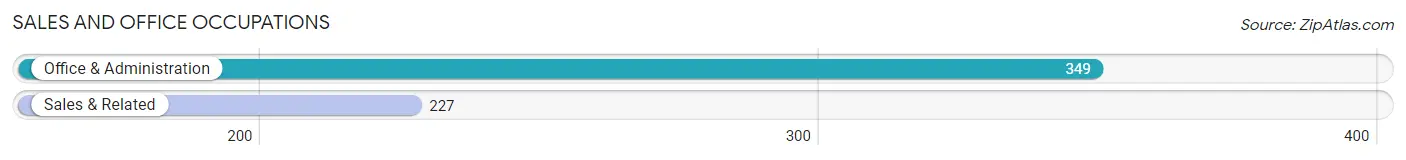
Sales and Office Occupations by Sex
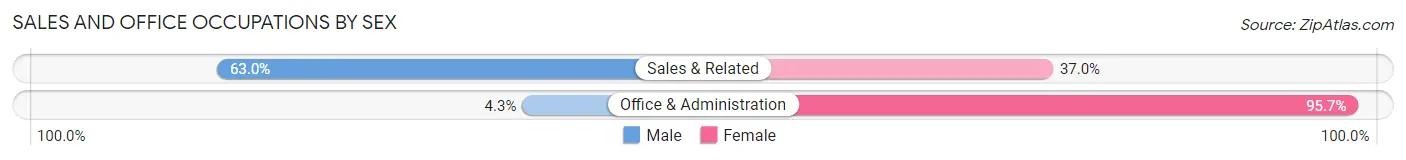
| Occupation | Male | Female |
| Sales & Related | 143 (63.0%) | 84 (37.0%) |
| Office & Administration | 15 (4.3%) | 334 (95.7%) |
| Total (Category) | 158 (27.4%) | 418 (72.6%) |
| Total (Overall) | 1,634 (51.2%) | 1,558 (48.8%) |
Natural Resources, Construction and Maintenance Occupations
The most common Natural Resources, Construction and Maintenance occupations in East Hampton North are Construction & Extraction (330 | 10.3%), and Installation, Maintenance & Repair (191 | 6.0%).
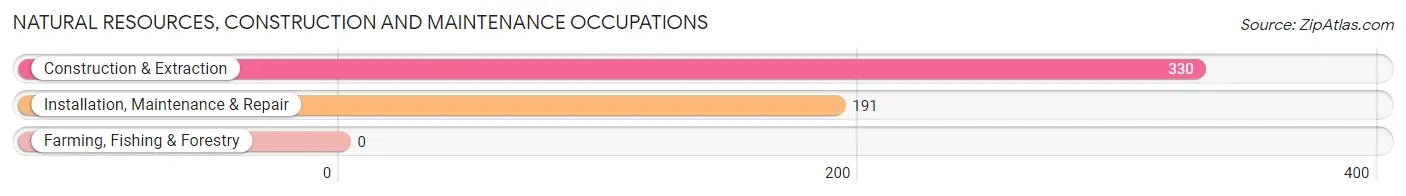
Natural Resources, Construction and Maintenance Occupations by Sex
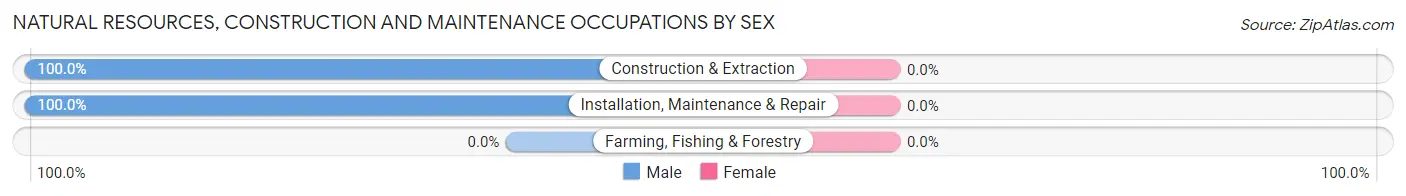
| Occupation | Male | Female |
| Farming, Fishing & Forestry | 0 (0.0%) | 0 (0.0%) |
| Construction & Extraction | 330 (100.0%) | 0 (0.0%) |
| Installation, Maintenance & Repair | 191 (100.0%) | 0 (0.0%) |
| Total (Category) | 521 (100.0%) | 0 (0.0%) |
| Total (Overall) | 1,634 (51.2%) | 1,558 (48.8%) |
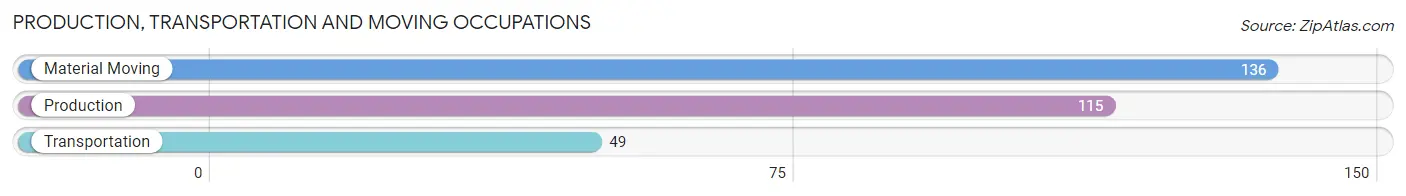
Production, Transportation and Moving Occupations
The most common Production, Transportation and Moving occupations in East Hampton North are Material Moving (136 | 4.3%), Production (115 | 3.6%), and Transportation (49 | 1.5%).
Production, Transportation and Moving Occupations by Sex
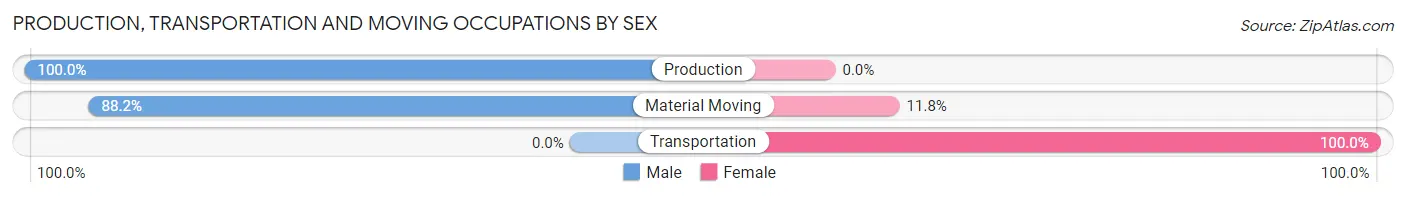
| Occupation | Male | Female |
| Production | 115 (100.0%) | 0 (0.0%) |
| Transportation | 0 (0.0%) | 49 (100.0%) |
| Material Moving | 120 (88.2%) | 16 (11.8%) |
| Total (Category) | 235 (78.3%) | 65 (21.7%) |
| Total (Overall) | 1,634 (51.2%) | 1,558 (48.8%) |
Employment Industries by Sex in East Hampton North
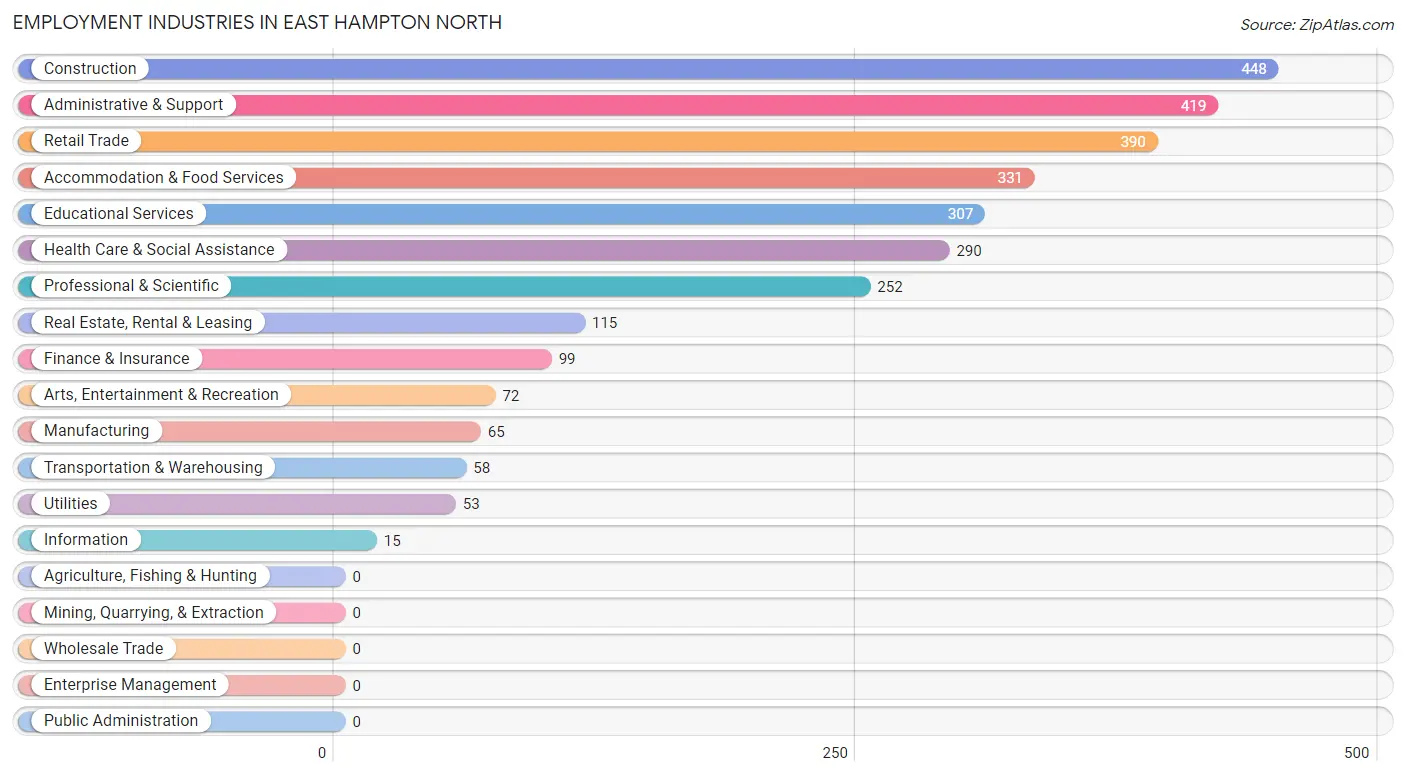
Employment Industries in East Hampton North
The major employment industries in East Hampton North include Construction (448 | 14.0%), Administrative & Support (419 | 13.1%), Retail Trade (390 | 12.2%), Accommodation & Food Services (331 | 10.4%), and Educational Services (307 | 9.6%).
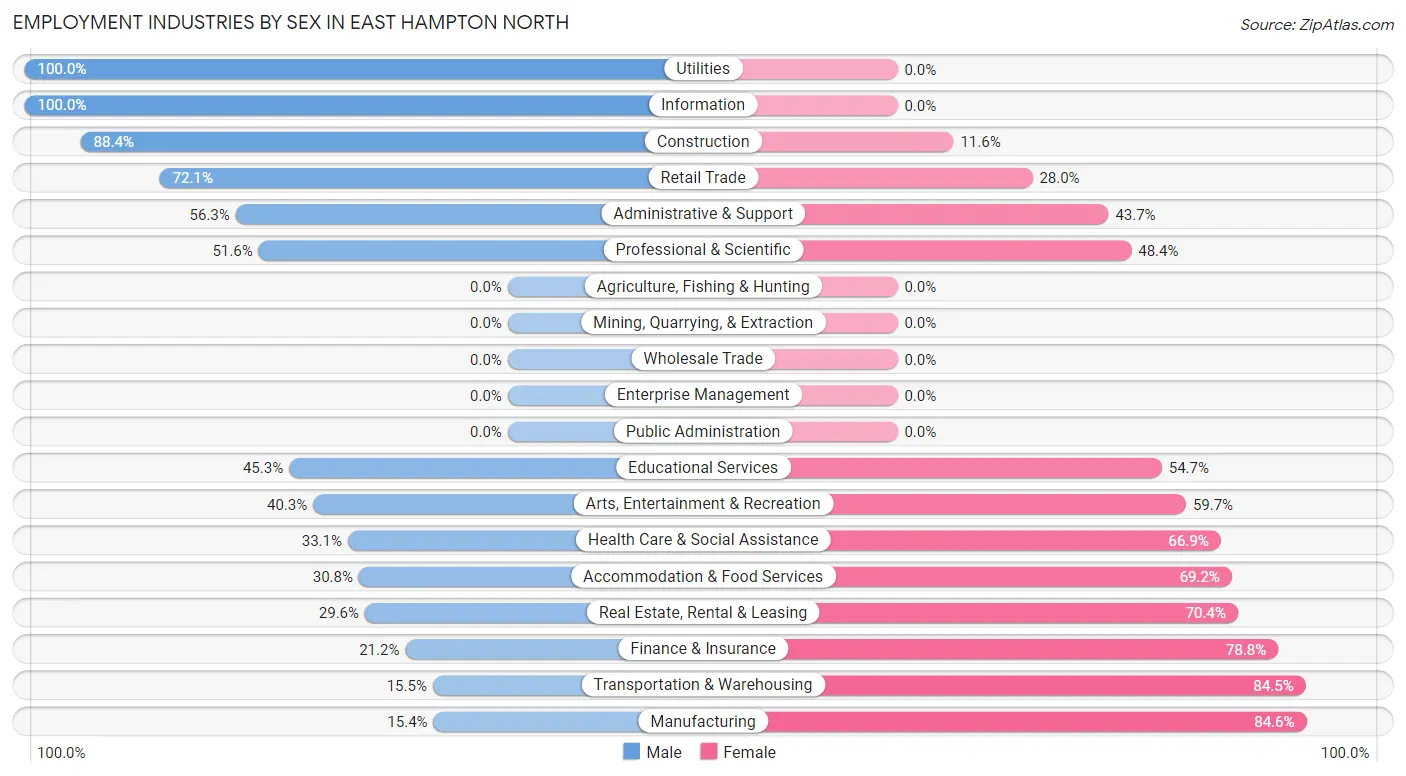
Employment Industries by Sex in East Hampton North
The East Hampton North industries that see more men than women are Utilities (100.0%), Information (100.0%), and Construction (88.4%), whereas the industries that tend to have a higher number of women are Manufacturing (84.6%), Transportation & Warehousing (84.5%), and Finance & Insurance (78.8%).
| Industry | Male | Female |
| Agriculture, Fishing & Hunting | 0 (0.0%) | 0 (0.0%) |
| Mining, Quarrying, & Extraction | 0 (0.0%) | 0 (0.0%) |
| Construction | 396 (88.4%) | 52 (11.6%) |
| Manufacturing | 10 (15.4%) | 55 (84.6%) |
| Wholesale Trade | 0 (0.0%) | 0 (0.0%) |
| Retail Trade | 281 (72.1%) | 109 (28.0%) |
| Transportation & Warehousing | 9 (15.5%) | 49 (84.5%) |
| Utilities | 53 (100.0%) | 0 (0.0%) |
| Information | 15 (100.0%) | 0 (0.0%) |
| Finance & Insurance | 21 (21.2%) | 78 (78.8%) |
| Real Estate, Rental & Leasing | 34 (29.6%) | 81 (70.4%) |
| Professional & Scientific | 130 (51.6%) | 122 (48.4%) |
| Enterprise Management | 0 (0.0%) | 0 (0.0%) |
| Administrative & Support | 236 (56.3%) | 183 (43.7%) |
| Educational Services | 139 (45.3%) | 168 (54.7%) |
| Health Care & Social Assistance | 96 (33.1%) | 194 (66.9%) |
| Arts, Entertainment & Recreation | 29 (40.3%) | 43 (59.7%) |
| Accommodation & Food Services | 102 (30.8%) | 229 (69.2%) |
| Public Administration | 0 (0.0%) | 0 (0.0%) |
| Total | 1,634 (51.2%) | 1,558 (48.8%) |
Education in East Hampton North
School Enrollment in East Hampton North
The most common levels of schooling among the 1,258 students in East Hampton North are middle school (372 | 29.6%), elementary school (298 | 23.7%), and high school (224 | 17.8%).
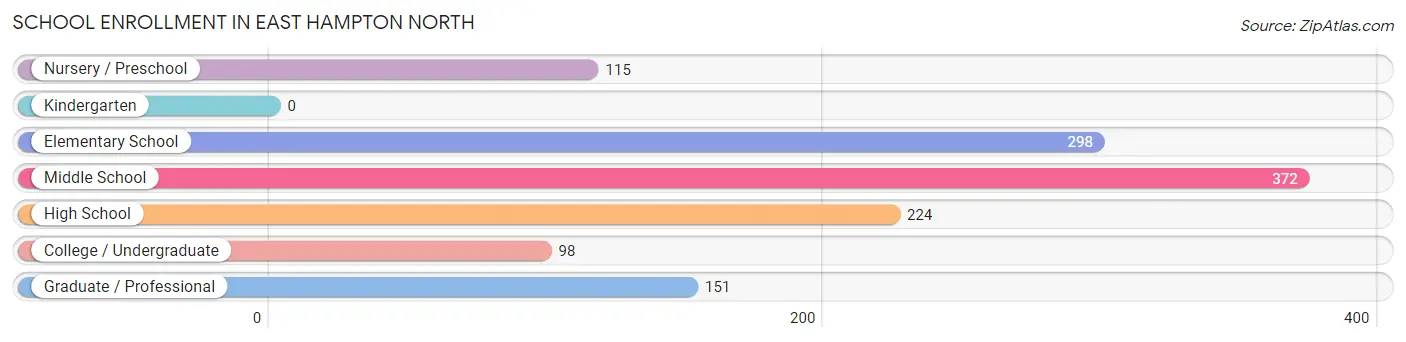
| School Level | # Students | % Students |
| Nursery / Preschool | 115 | 9.1% |
| Kindergarten | 0 | 0.0% |
| Elementary School | 298 | 23.7% |
| Middle School | 372 | 29.6% |
| High School | 224 | 17.8% |
| College / Undergraduate | 98 | 7.8% |
| Graduate / Professional | 151 | 12.0% |
| Total | 1,258 | 100.0% |
School Enrollment by Age by Funding Source in East Hampton North
Out of a total of 1,258 students who are enrolled in schools in East Hampton North, 203 (16.1%) attend a private institution, while the remaining 1,055 (83.9%) are enrolled in public schools. The age group of 25 to 34 year olds has the highest likelihood of being enrolled in private schools, with 78 (100.0% in the age bracket) enrolled. Conversely, the age group of 18 to 19 year olds has the lowest likelihood of being enrolled in a private school, with 49 (100.0% in the age bracket) attending a public institution.
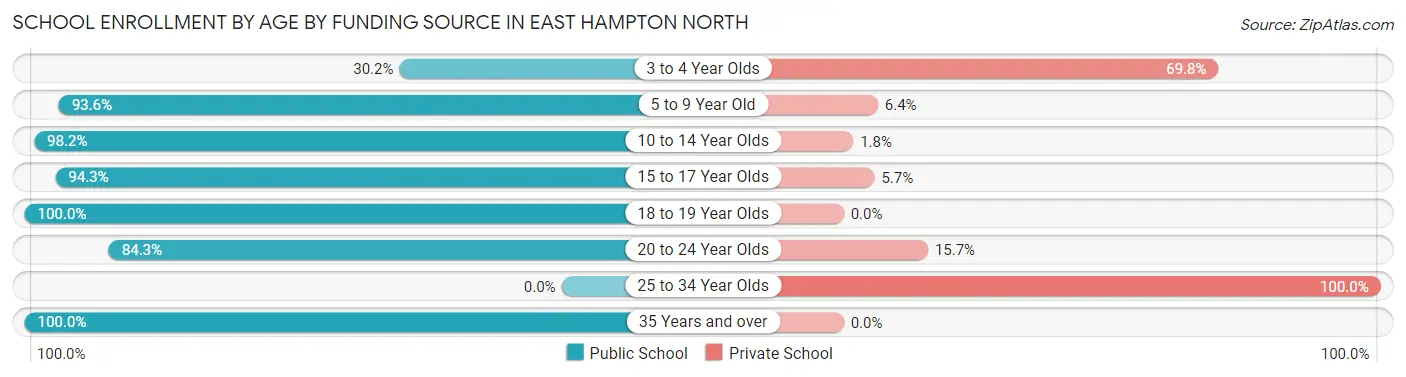
| Age Bracket | Public School | Private School |
| 3 to 4 Year Olds | 29 (30.2%) | 67 (69.8%) |
| 5 to 9 Year Old | 294 (93.6%) | 20 (6.4%) |
| 10 to 14 Year Olds | 386 (98.2%) | 7 (1.8%) |
| 15 to 17 Year Olds | 181 (94.3%) | 11 (5.7%) |
| 18 to 19 Year Olds | 49 (100.0%) | 0 (0.0%) |
| 20 to 24 Year Olds | 102 (84.3%) | 19 (15.7%) |
| 25 to 34 Year Olds | 0 (0.0%) | 78 (100.0%) |
| 35 Years and over | 15 (100.0%) | 0 (0.0%) |
| Total | 1,055 (83.9%) | 203 (16.1%) |
Educational Attainment by Field of Study in East Hampton North
Business (266 | 18.5%), visual & performing arts (253 | 17.6%), education (146 | 10.1%), literature & languages (130 | 9.0%), and psychology (129 | 8.9%) are the most common fields of study among 1,441 individuals in East Hampton North who have obtained a bachelor's degree or higher.
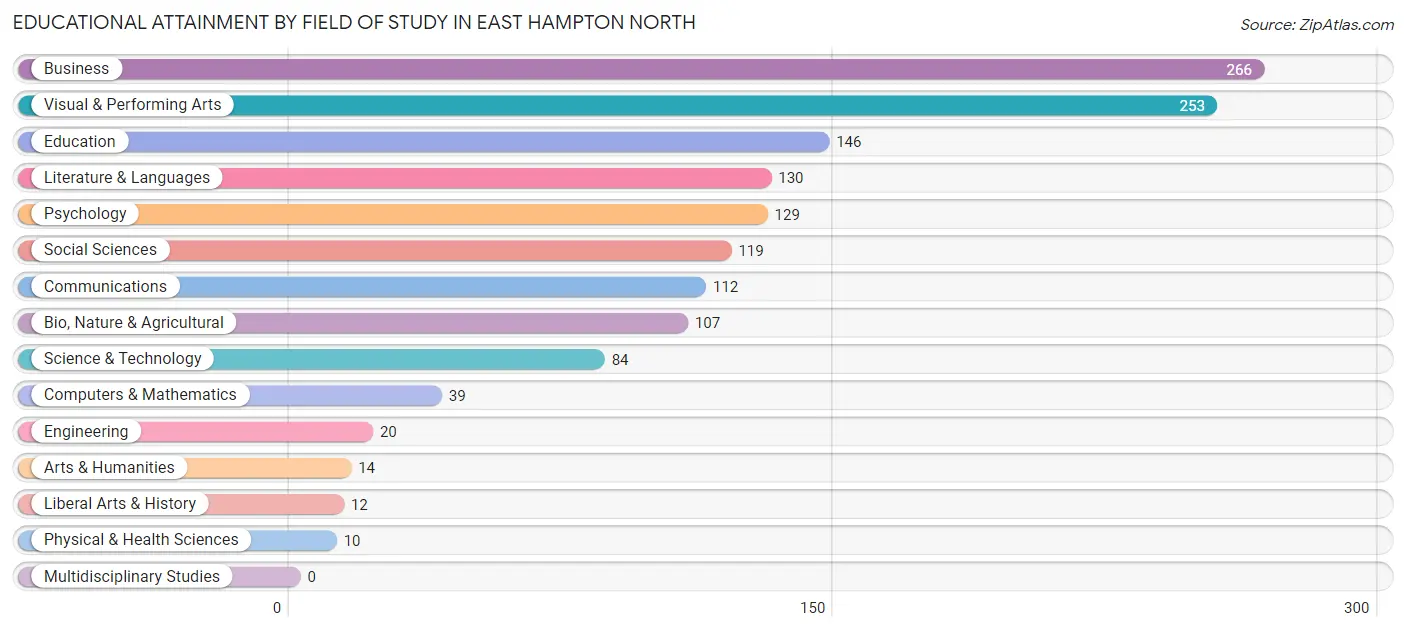
| Field of Study | # Graduates | % Graduates |
| Computers & Mathematics | 39 | 2.7% |
| Bio, Nature & Agricultural | 107 | 7.4% |
| Physical & Health Sciences | 10 | 0.7% |
| Psychology | 129 | 8.9% |
| Social Sciences | 119 | 8.3% |
| Engineering | 20 | 1.4% |
| Multidisciplinary Studies | 0 | 0.0% |
| Science & Technology | 84 | 5.8% |
| Business | 266 | 18.5% |
| Education | 146 | 10.1% |
| Literature & Languages | 130 | 9.0% |
| Liberal Arts & History | 12 | 0.8% |
| Visual & Performing Arts | 253 | 17.6% |
| Communications | 112 | 7.8% |
| Arts & Humanities | 14 | 1.0% |
| Total | 1,441 | 100.0% |
Transportation & Commute in East Hampton North
Vehicle Availability by Sex in East Hampton North
The most prevalent vehicle ownership categories in East Hampton North are males with 2 vehicles (616, accounting for 38.1%) and females with 2 vehicles (674, making up 39.8%).
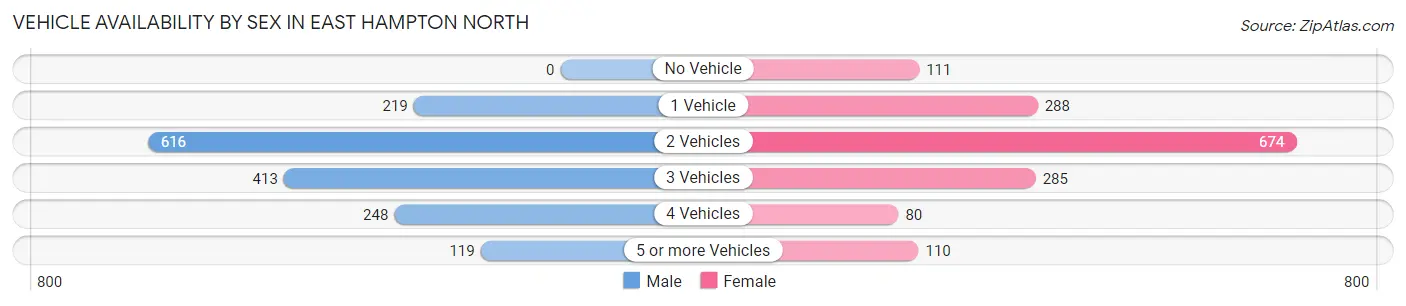
| Vehicles Available | Male | Female |
| No Vehicle | 0 (0.0%) | 111 (7.2%) |
| 1 Vehicle | 219 (13.6%) | 288 (18.6%) |
| 2 Vehicles | 616 (38.1%) | 674 (43.5%) |
| 3 Vehicles | 413 (25.6%) | 285 (18.4%) |
| 4 Vehicles | 248 (15.4%) | 80 (5.2%) |
| 5 or more Vehicles | 119 (7.4%) | 110 (7.1%) |
| Total | 1,615 (100.0%) | 1,548 (100.0%) |
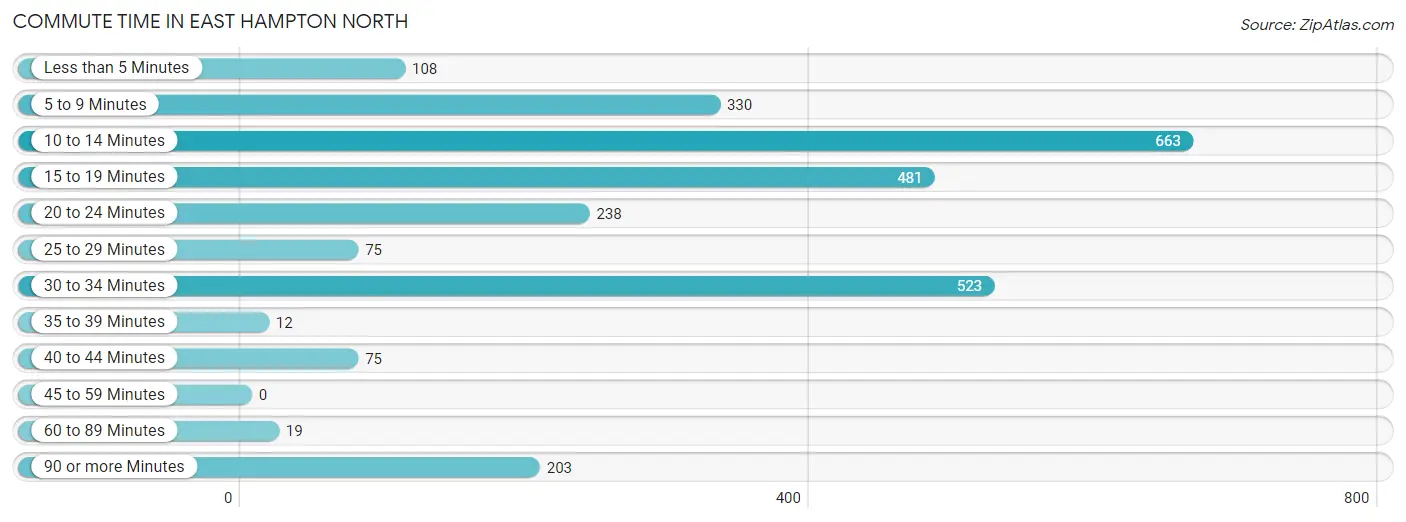
Commute Time in East Hampton North
The most frequently occuring commute durations in East Hampton North are 10 to 14 minutes (663 commuters, 24.3%), 30 to 34 minutes (523 commuters, 19.2%), and 15 to 19 minutes (481 commuters, 17.6%).
| Commute Time | # Commuters | % Commuters |
| Less than 5 Minutes | 108 | 4.0% |
| 5 to 9 Minutes | 330 | 12.1% |
| 10 to 14 Minutes | 663 | 24.3% |
| 15 to 19 Minutes | 481 | 17.6% |
| 20 to 24 Minutes | 238 | 8.7% |
| 25 to 29 Minutes | 75 | 2.8% |
| 30 to 34 Minutes | 523 | 19.2% |
| 35 to 39 Minutes | 12 | 0.4% |
| 40 to 44 Minutes | 75 | 2.8% |
| 45 to 59 Minutes | 0 | 0.0% |
| 60 to 89 Minutes | 19 | 0.7% |
| 90 or more Minutes | 203 | 7.4% |
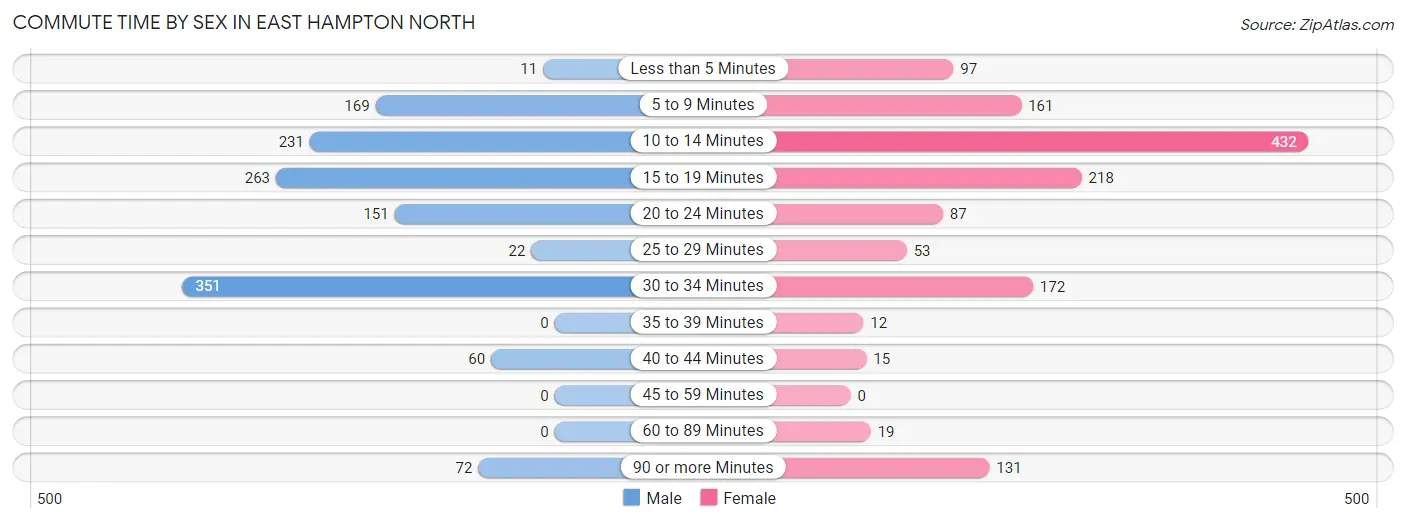
Commute Time by Sex in East Hampton North
The most common commute times in East Hampton North are 30 to 34 minutes (351 commuters, 26.4%) for males and 10 to 14 minutes (432 commuters, 30.9%) for females.
| Commute Time | Male | Female |
| Less than 5 Minutes | 11 (0.8%) | 97 (6.9%) |
| 5 to 9 Minutes | 169 (12.7%) | 161 (11.5%) |
| 10 to 14 Minutes | 231 (17.4%) | 432 (30.9%) |
| 15 to 19 Minutes | 263 (19.8%) | 218 (15.6%) |
| 20 to 24 Minutes | 151 (11.4%) | 87 (6.2%) |
| 25 to 29 Minutes | 22 (1.7%) | 53 (3.8%) |
| 30 to 34 Minutes | 351 (26.4%) | 172 (12.3%) |
| 35 to 39 Minutes | 0 (0.0%) | 12 (0.9%) |
| 40 to 44 Minutes | 60 (4.5%) | 15 (1.1%) |
| 45 to 59 Minutes | 0 (0.0%) | 0 (0.0%) |
| 60 to 89 Minutes | 0 (0.0%) | 19 (1.4%) |
| 90 or more Minutes | 72 (5.4%) | 131 (9.4%) |
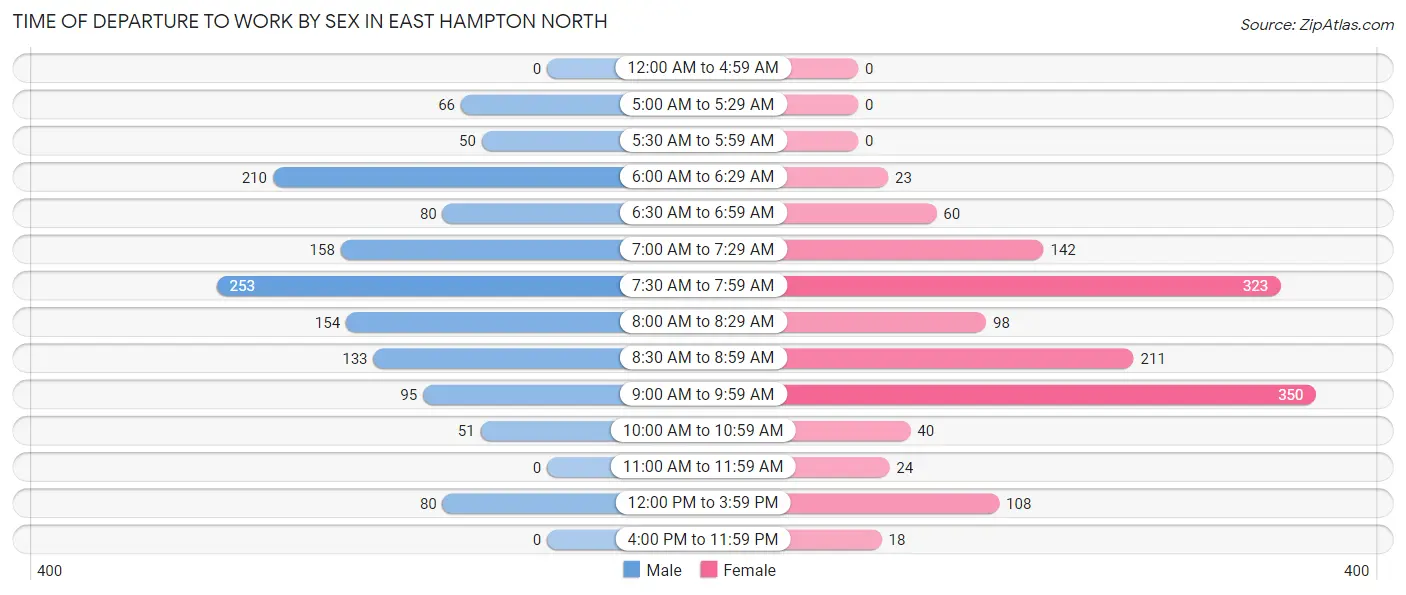
Time of Departure to Work by Sex in East Hampton North
The most frequent times of departure to work in East Hampton North are 7:30 AM to 7:59 AM (253, 19.0%) for males and 9:00 AM to 9:59 AM (350, 25.1%) for females.
| Time of Departure | Male | Female |
| 12:00 AM to 4:59 AM | 0 (0.0%) | 0 (0.0%) |
| 5:00 AM to 5:29 AM | 66 (5.0%) | 0 (0.0%) |
| 5:30 AM to 5:59 AM | 50 (3.8%) | 0 (0.0%) |
| 6:00 AM to 6:29 AM | 210 (15.8%) | 23 (1.7%) |
| 6:30 AM to 6:59 AM | 80 (6.0%) | 60 (4.3%) |
| 7:00 AM to 7:29 AM | 158 (11.9%) | 142 (10.2%) |
| 7:30 AM to 7:59 AM | 253 (19.0%) | 323 (23.1%) |
| 8:00 AM to 8:29 AM | 154 (11.6%) | 98 (7.0%) |
| 8:30 AM to 8:59 AM | 133 (10.0%) | 211 (15.1%) |
| 9:00 AM to 9:59 AM | 95 (7.1%) | 350 (25.1%) |
| 10:00 AM to 10:59 AM | 51 (3.8%) | 40 (2.9%) |
| 11:00 AM to 11:59 AM | 0 (0.0%) | 24 (1.7%) |
| 12:00 PM to 3:59 PM | 80 (6.0%) | 108 (7.7%) |
| 4:00 PM to 11:59 PM | 0 (0.0%) | 18 (1.3%) |
| Total | 1,330 (100.0%) | 1,397 (100.0%) |
Housing Occupancy in East Hampton North
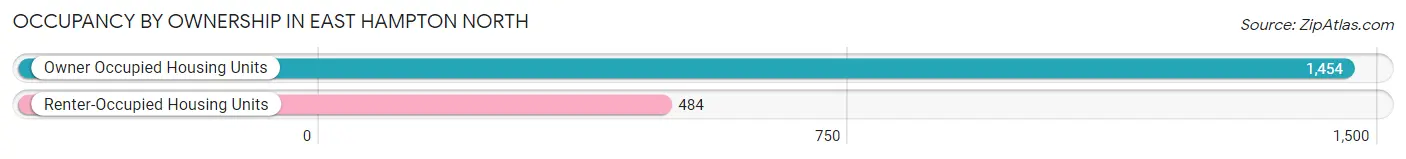
Occupancy by Ownership in East Hampton North
Of the total 1,938 dwellings in East Hampton North, owner-occupied units account for 1,454 (75.0%), while renter-occupied units make up 484 (25.0%).
| Occupancy | # Housing Units | % Housing Units |
| Owner Occupied Housing Units | 1,454 | 75.0% |
| Renter-Occupied Housing Units | 484 | 25.0% |
| Total Occupied Housing Units | 1,938 | 100.0% |
Occupancy by Household Size in East Hampton North
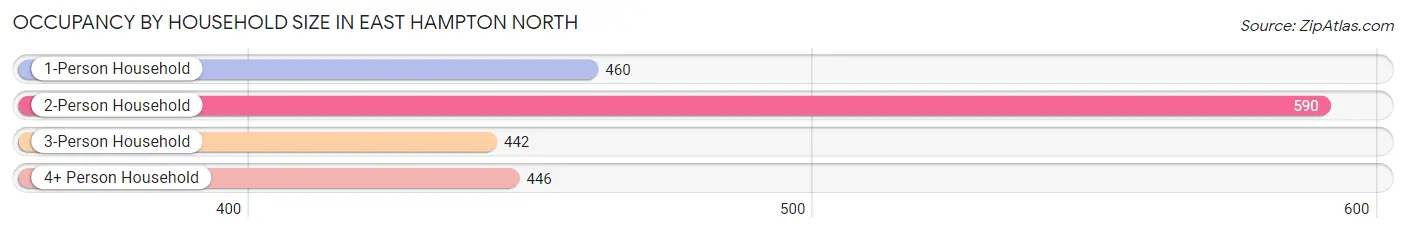
| Household Size | # Housing Units | % Housing Units |
| 1-Person Household | 460 | 23.7% |
| 2-Person Household | 590 | 30.4% |
| 3-Person Household | 442 | 22.8% |
| 4+ Person Household | 446 | 23.0% |
| Total Housing Units | 1,938 | 100.0% |
Occupancy by Ownership by Household Size in East Hampton North
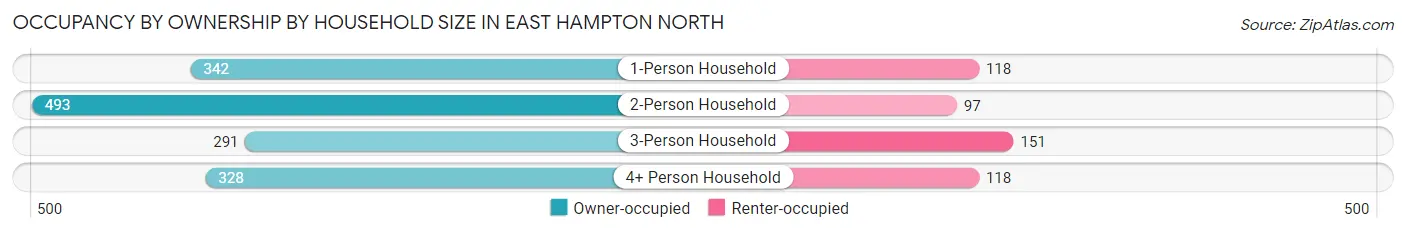
| Household Size | Owner-occupied | Renter-occupied |
| 1-Person Household | 342 (74.4%) | 118 (25.7%) |
| 2-Person Household | 493 (83.6%) | 97 (16.4%) |
| 3-Person Household | 291 (65.8%) | 151 (34.2%) |
| 4+ Person Household | 328 (73.5%) | 118 (26.5%) |
| Total Housing Units | 1,454 (75.0%) | 484 (25.0%) |
Occupancy by Educational Attainment in East Hampton North
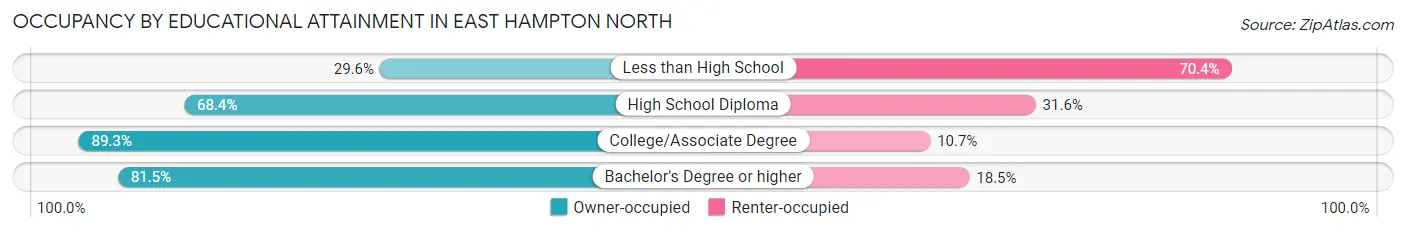
| Household Size | Owner-occupied | Renter-occupied |
| Less than High School | 55 (29.6%) | 131 (70.4%) |
| High School Diploma | 333 (68.4%) | 154 (31.6%) |
| College/Associate Degree | 400 (89.3%) | 48 (10.7%) |
| Bachelor's Degree or higher | 666 (81.5%) | 151 (18.5%) |
Occupancy by Age of Householder in East Hampton North
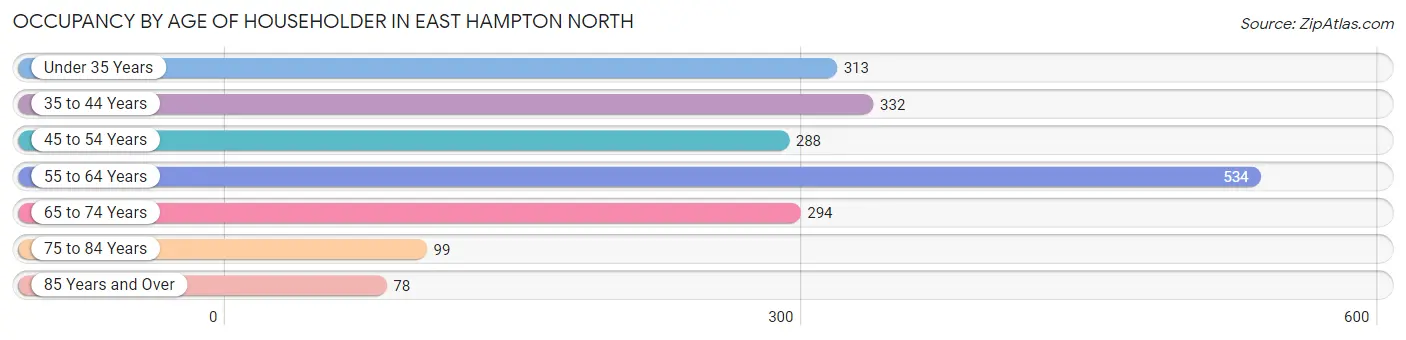
| Age Bracket | # Households | % Households |
| Under 35 Years | 313 | 16.2% |
| 35 to 44 Years | 332 | 17.1% |
| 45 to 54 Years | 288 | 14.9% |
| 55 to 64 Years | 534 | 27.6% |
| 65 to 74 Years | 294 | 15.2% |
| 75 to 84 Years | 99 | 5.1% |
| 85 Years and Over | 78 | 4.0% |
| Total | 1,938 | 100.0% |
Housing Finances in East Hampton North
Median Income by Occupancy in East Hampton North
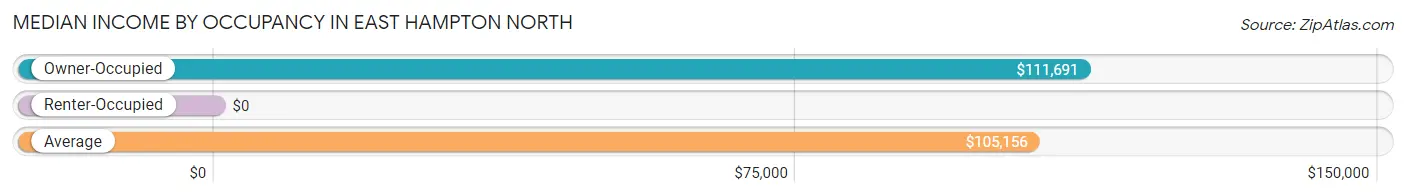
| Occupancy Type | # Households | Median Income |
| Owner-Occupied | 1,454 (75.0%) | $111,691 |
| Renter-Occupied | 484 (25.0%) | $0 |
| Average | 1,938 (100.0%) | $105,156 |
Occupancy by Householder Income Bracket in East Hampton North
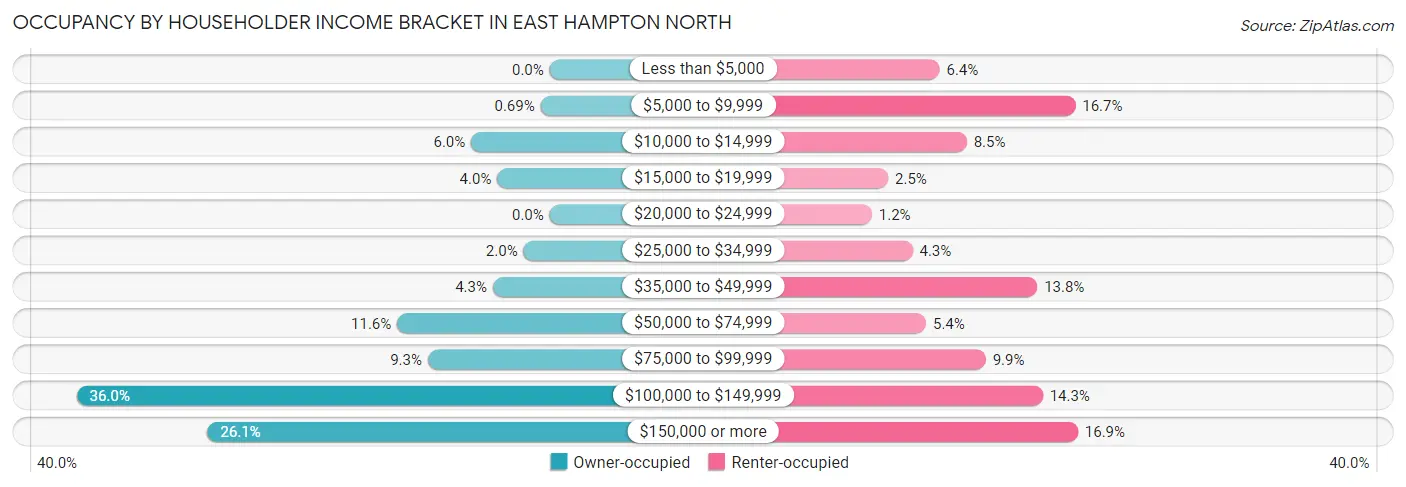
| Income Bracket | Owner-occupied | Renter-occupied |
| Less than $5,000 | 0 (0.0%) | 31 (6.4%) |
| $5,000 to $9,999 | 10 (0.7%) | 81 (16.7%) |
| $10,000 to $14,999 | 87 (6.0%) | 41 (8.5%) |
| $15,000 to $19,999 | 58 (4.0%) | 12 (2.5%) |
| $20,000 to $24,999 | 0 (0.0%) | 6 (1.2%) |
| $25,000 to $34,999 | 29 (2.0%) | 21 (4.3%) |
| $35,000 to $49,999 | 63 (4.3%) | 67 (13.8%) |
| $50,000 to $74,999 | 169 (11.6%) | 26 (5.4%) |
| $75,000 to $99,999 | 135 (9.3%) | 48 (9.9%) |
| $100,000 to $149,999 | 524 (36.0%) | 69 (14.3%) |
| $150,000 or more | 379 (26.1%) | 82 (16.9%) |
| Total | 1,454 (100.0%) | 484 (100.0%) |
Monthly Housing Cost Tiers in East Hampton North
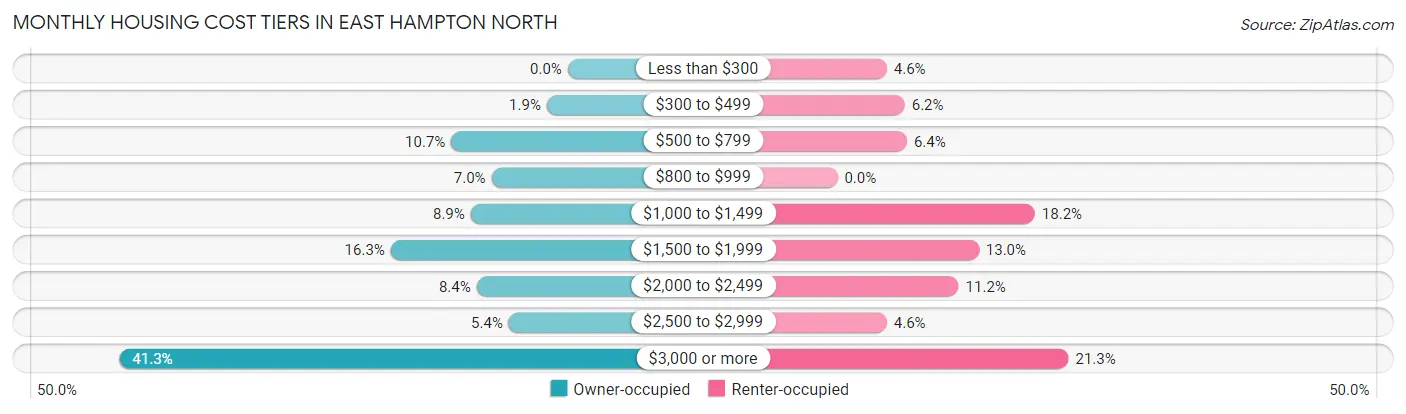
| Monthly Cost | Owner-occupied | Renter-occupied |
| Less than $300 | 0 (0.0%) | 22 (4.5%) |
| $300 to $499 | 28 (1.9%) | 30 (6.2%) |
| $500 to $799 | 156 (10.7%) | 31 (6.4%) |
| $800 to $999 | 102 (7.0%) | 0 (0.0%) |
| $1,000 to $1,499 | 130 (8.9%) | 88 (18.2%) |
| $1,500 to $1,999 | 237 (16.3%) | 63 (13.0%) |
| $2,000 to $2,499 | 122 (8.4%) | 54 (11.2%) |
| $2,500 to $2,999 | 79 (5.4%) | 22 (4.5%) |
| $3,000 or more | 600 (41.3%) | 103 (21.3%) |
| Total | 1,454 (100.0%) | 484 (100.0%) |
Physical Housing Characteristics in East Hampton North
Housing Structures in East Hampton North
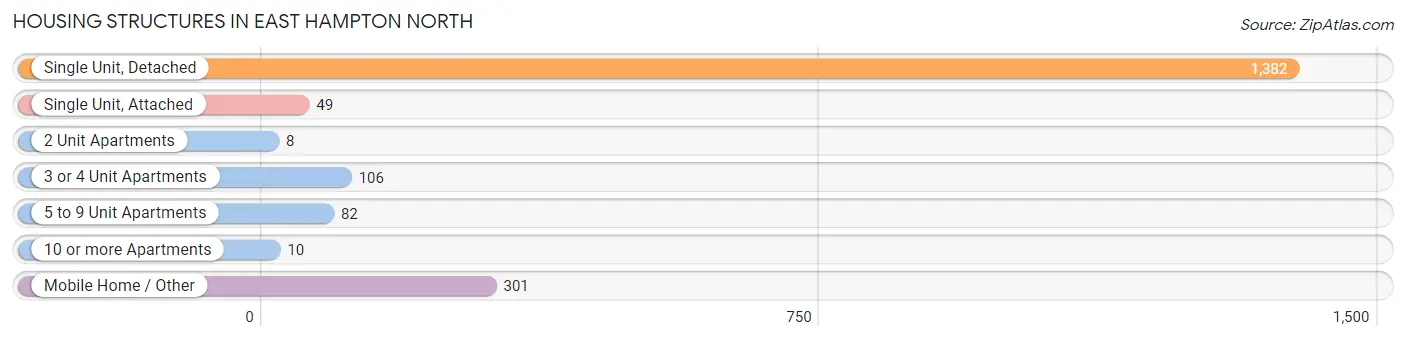
| Structure Type | # Housing Units | % Housing Units |
| Single Unit, Detached | 1,382 | 71.3% |
| Single Unit, Attached | 49 | 2.5% |
| 2 Unit Apartments | 8 | 0.4% |
| 3 or 4 Unit Apartments | 106 | 5.5% |
| 5 to 9 Unit Apartments | 82 | 4.2% |
| 10 or more Apartments | 10 | 0.5% |
| Mobile Home / Other | 301 | 15.5% |
| Total | 1,938 | 100.0% |
Housing Structures by Occupancy in East Hampton North
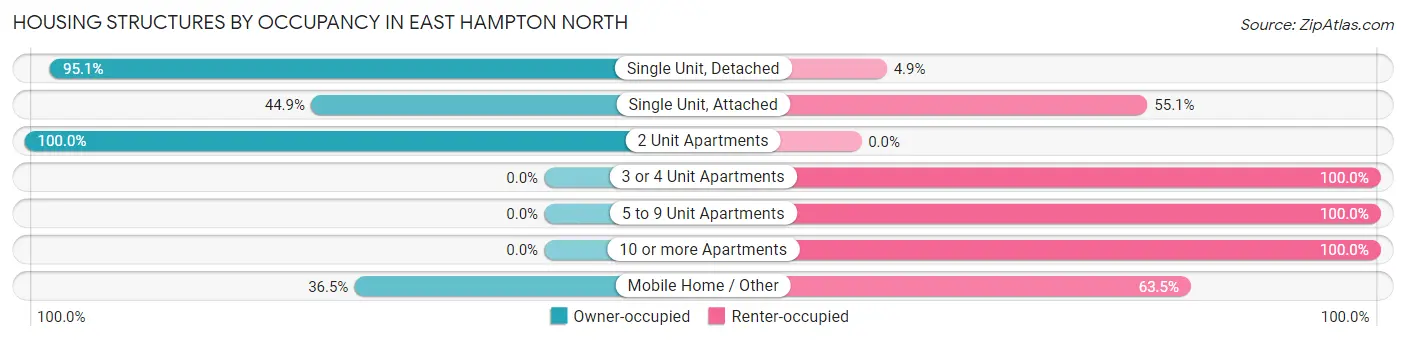
| Structure Type | Owner-occupied | Renter-occupied |
| Single Unit, Detached | 1,314 (95.1%) | 68 (4.9%) |
| Single Unit, Attached | 22 (44.9%) | 27 (55.1%) |
| 2 Unit Apartments | 8 (100.0%) | 0 (0.0%) |
| 3 or 4 Unit Apartments | 0 (0.0%) | 106 (100.0%) |
| 5 to 9 Unit Apartments | 0 (0.0%) | 82 (100.0%) |
| 10 or more Apartments | 0 (0.0%) | 10 (100.0%) |
| Mobile Home / Other | 110 (36.5%) | 191 (63.5%) |
| Total | 1,454 (75.0%) | 484 (25.0%) |
Housing Structures by Number of Rooms in East Hampton North
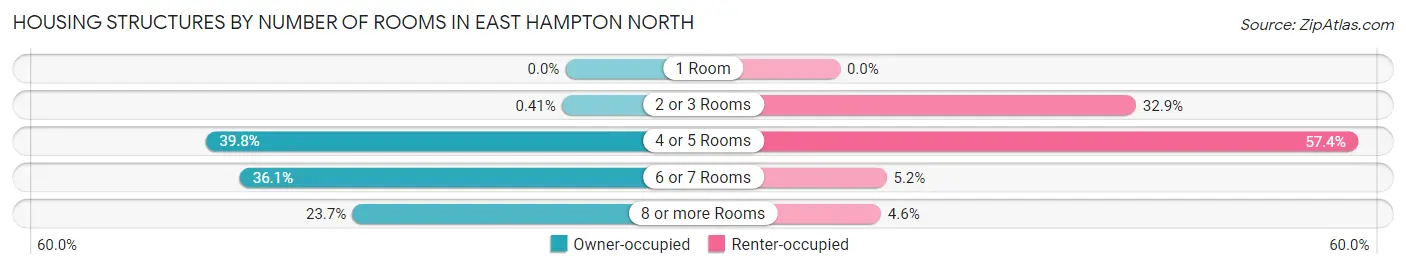
| Number of Rooms | Owner-occupied | Renter-occupied |
| 1 Room | 0 (0.0%) | 0 (0.0%) |
| 2 or 3 Rooms | 6 (0.4%) | 159 (32.9%) |
| 4 or 5 Rooms | 579 (39.8%) | 278 (57.4%) |
| 6 or 7 Rooms | 525 (36.1%) | 25 (5.2%) |
| 8 or more Rooms | 344 (23.7%) | 22 (4.5%) |
| Total | 1,454 (100.0%) | 484 (100.0%) |
Housing Structure by Heating Type in East Hampton North
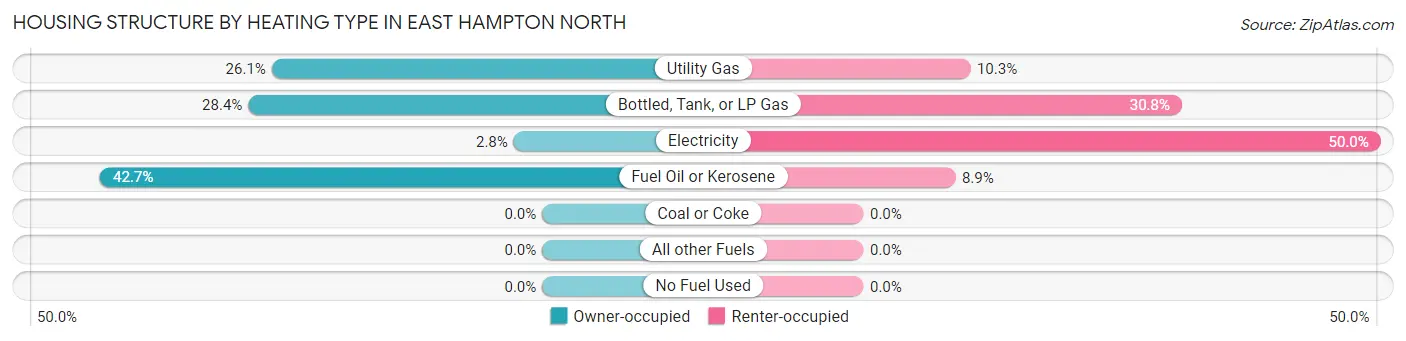
| Heating Type | Owner-occupied | Renter-occupied |
| Utility Gas | 380 (26.1%) | 50 (10.3%) |
| Bottled, Tank, or LP Gas | 413 (28.4%) | 149 (30.8%) |
| Electricity | 40 (2.8%) | 242 (50.0%) |
| Fuel Oil or Kerosene | 621 (42.7%) | 43 (8.9%) |
| Coal or Coke | 0 (0.0%) | 0 (0.0%) |
| All other Fuels | 0 (0.0%) | 0 (0.0%) |
| No Fuel Used | 0 (0.0%) | 0 (0.0%) |
| Total | 1,454 (100.0%) | 484 (100.0%) |
Household Vehicle Usage in East Hampton North
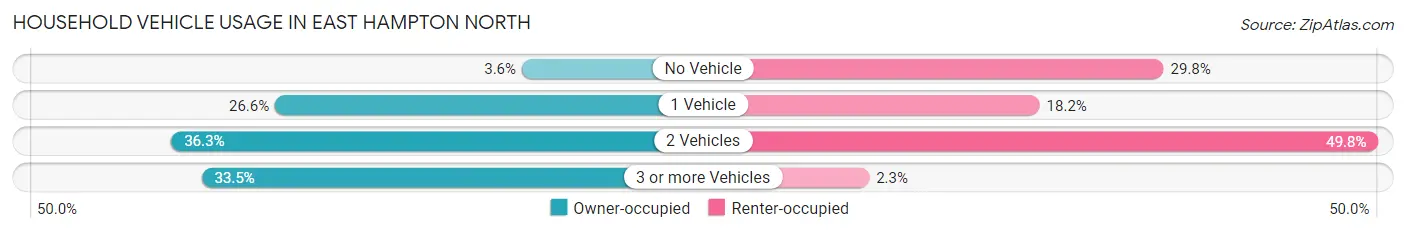
| Vehicles per Household | Owner-occupied | Renter-occupied |
| No Vehicle | 52 (3.6%) | 144 (29.7%) |
| 1 Vehicle | 387 (26.6%) | 88 (18.2%) |
| 2 Vehicles | 528 (36.3%) | 241 (49.8%) |
| 3 or more Vehicles | 487 (33.5%) | 11 (2.3%) |
| Total | 1,454 (100.0%) | 484 (100.0%) |
Real Estate & Mortgages in East Hampton North
Real Estate and Mortgage Overview in East Hampton North
| Characteristic | Without Mortgage | With Mortgage |
| Housing Units | 551 | 903 |
| Median Property Value | $1,016,500 | $875,000 |
| Median Household Income | $67,386 | $286 |
| Monthly Housing Costs | $1,082 | $588 |
| Real Estate Taxes | $5,962 | $46 |
Property Value by Mortgage Status in East Hampton North
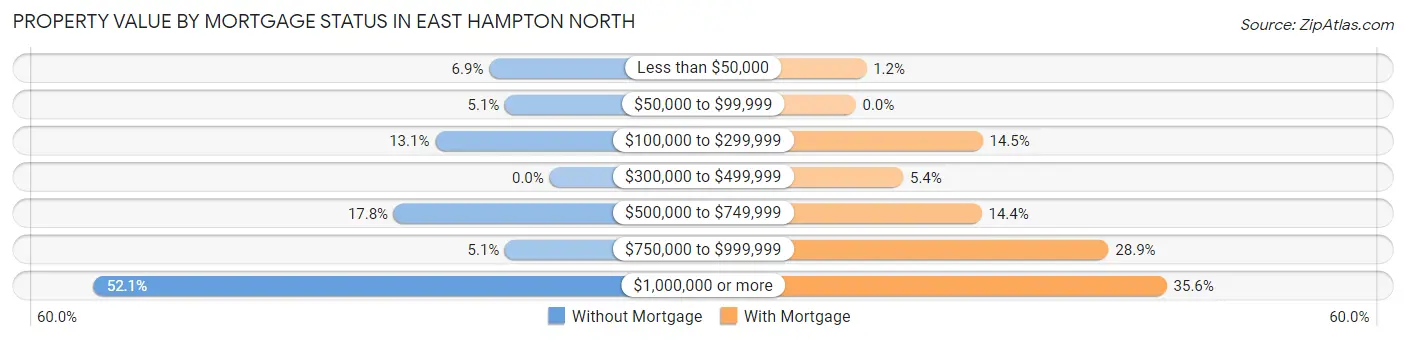
| Property Value | Without Mortgage | With Mortgage |
| Less than $50,000 | 38 (6.9%) | 11 (1.2%) |
| $50,000 to $99,999 | 28 (5.1%) | 0 (0.0%) |
| $100,000 to $299,999 | 72 (13.1%) | 131 (14.5%) |
| $300,000 to $499,999 | 0 (0.0%) | 49 (5.4%) |
| $500,000 to $749,999 | 98 (17.8%) | 130 (14.4%) |
| $750,000 to $999,999 | 28 (5.1%) | 261 (28.9%) |
| $1,000,000 or more | 287 (52.1%) | 321 (35.5%) |
| Total | 551 (100.0%) | 903 (100.0%) |
Household Income by Mortgage Status in East Hampton North
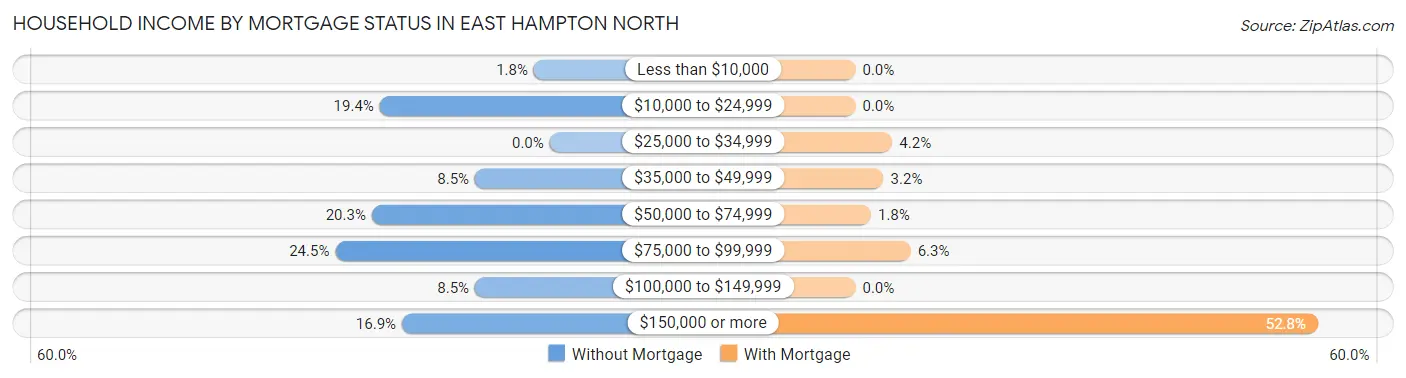
| Household Income | Without Mortgage | With Mortgage |
| Less than $10,000 | 10 (1.8%) | 0 (0.0%) |
| $10,000 to $24,999 | 107 (19.4%) | 0 (0.0%) |
| $25,000 to $34,999 | 0 (0.0%) | 38 (4.2%) |
| $35,000 to $49,999 | 47 (8.5%) | 29 (3.2%) |
| $50,000 to $74,999 | 112 (20.3%) | 16 (1.8%) |
| $75,000 to $99,999 | 135 (24.5%) | 57 (6.3%) |
| $100,000 to $149,999 | 47 (8.5%) | 0 (0.0%) |
| $150,000 or more | 93 (16.9%) | 477 (52.8%) |
| Total | 551 (100.0%) | 903 (100.0%) |
Property Value to Household Income Ratio in East Hampton North
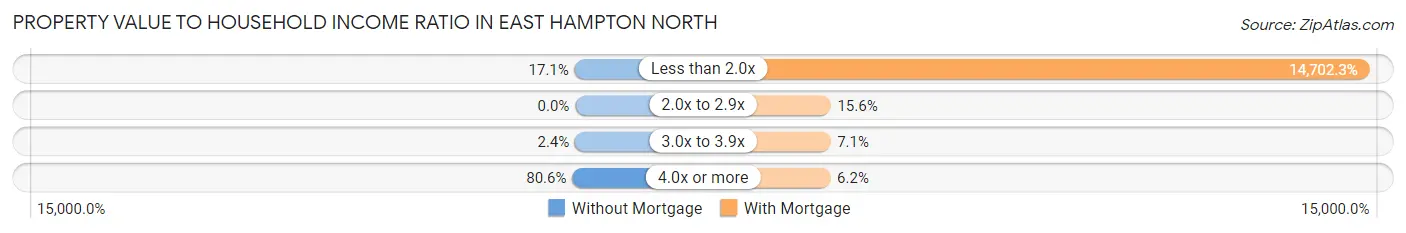
| Value-to-Income Ratio | Without Mortgage | With Mortgage |
| Less than 2.0x | 94 (17.1%) | 132,762 (14,702.3%) |
| 2.0x to 2.9x | 0 (0.0%) | 141 (15.6%) |
| 3.0x to 3.9x | 13 (2.4%) | 64 (7.1%) |
| 4.0x or more | 444 (80.6%) | 56 (6.2%) |
| Total | 551 (100.0%) | 903 (100.0%) |
Real Estate Taxes by Mortgage Status in East Hampton North
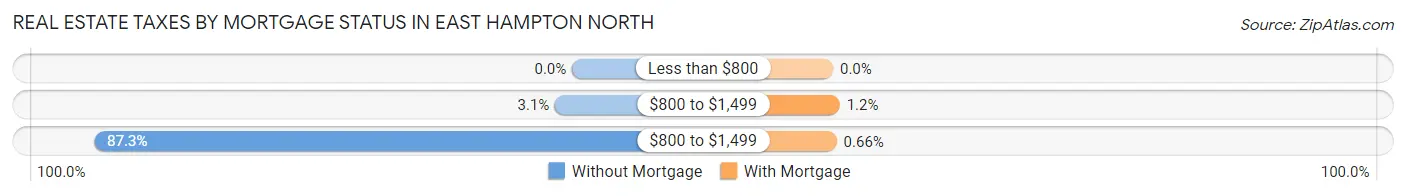
| Property Taxes | Without Mortgage | With Mortgage |
| Less than $800 | 0 (0.0%) | 0 (0.0%) |
| $800 to $1,499 | 17 (3.1%) | 11 (1.2%) |
| $800 to $1,499 | 481 (87.3%) | 6 (0.7%) |
| Total | 551 (100.0%) | 903 (100.0%) |
Health & Disability in East Hampton North
Health Insurance Coverage by Age in East Hampton North
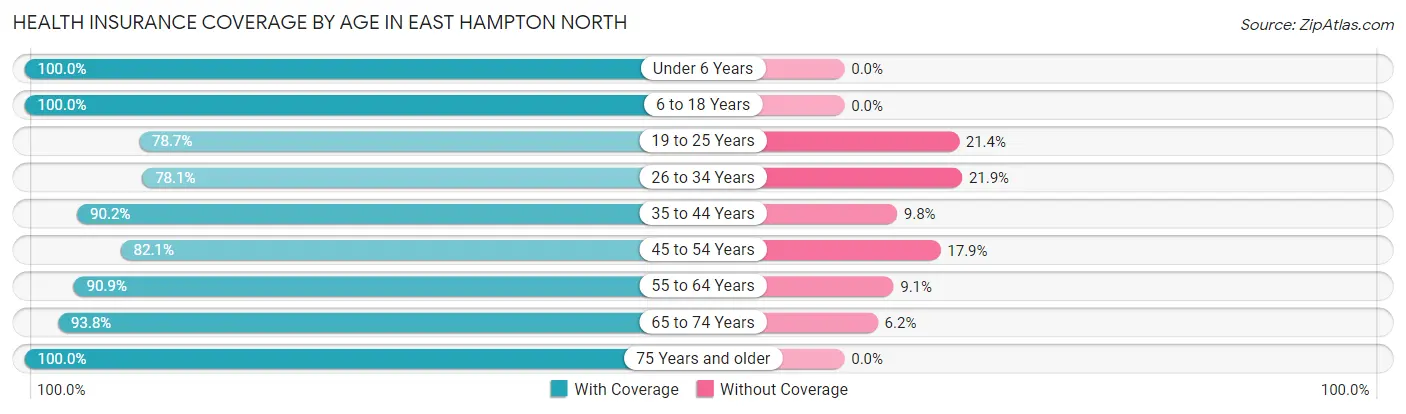
| Age Bracket | With Coverage | Without Coverage |
| Under 6 Years | 490 (100.0%) | 0 (0.0%) |
| 6 to 18 Years | 928 (100.0%) | 0 (0.0%) |
| 19 to 25 Years | 372 (78.6%) | 101 (21.3%) |
| 26 to 34 Years | 644 (78.1%) | 181 (21.9%) |
| 35 to 44 Years | 598 (90.2%) | 65 (9.8%) |
| 45 to 54 Years | 518 (82.1%) | 113 (17.9%) |
| 55 to 64 Years | 815 (90.9%) | 82 (9.1%) |
| 65 to 74 Years | 407 (93.8%) | 27 (6.2%) |
| 75 Years and older | 246 (100.0%) | 0 (0.0%) |
| Total | 5,018 (89.8%) | 569 (10.2%) |
Health Insurance Coverage by Citizenship Status in East Hampton North
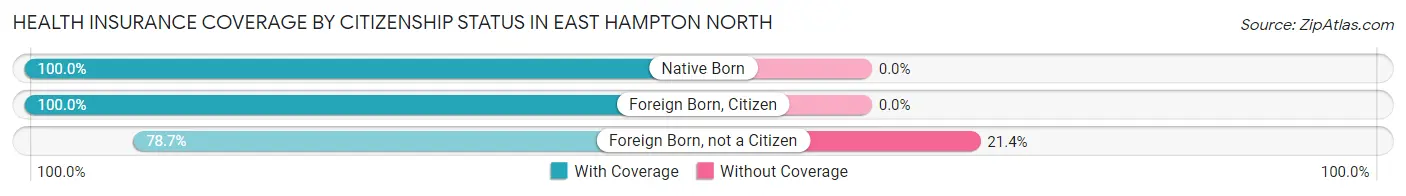
| Citizenship Status | With Coverage | Without Coverage |
| Native Born | 490 (100.0%) | 0 (0.0%) |
| Foreign Born, Citizen | 928 (100.0%) | 0 (0.0%) |
| Foreign Born, not a Citizen | 372 (78.6%) | 101 (21.3%) |
Health Insurance Coverage by Household Income in East Hampton North
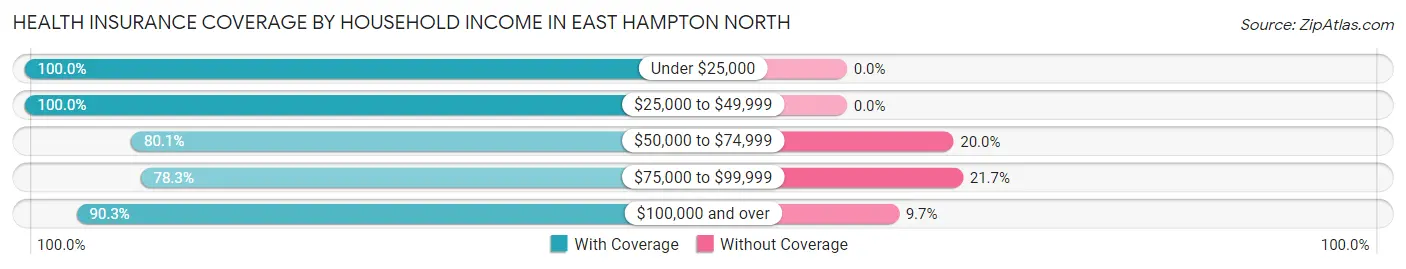
| Household Income | With Coverage | Without Coverage |
| Under $25,000 | 570 (100.0%) | 0 (0.0%) |
| $25,000 to $49,999 | 445 (100.0%) | 0 (0.0%) |
| $50,000 to $74,999 | 349 (80.0%) | 87 (20.0%) |
| $75,000 to $99,999 | 526 (78.3%) | 146 (21.7%) |
| $100,000 and over | 3,120 (90.3%) | 336 (9.7%) |
Public vs Private Health Insurance Coverage by Age in East Hampton North
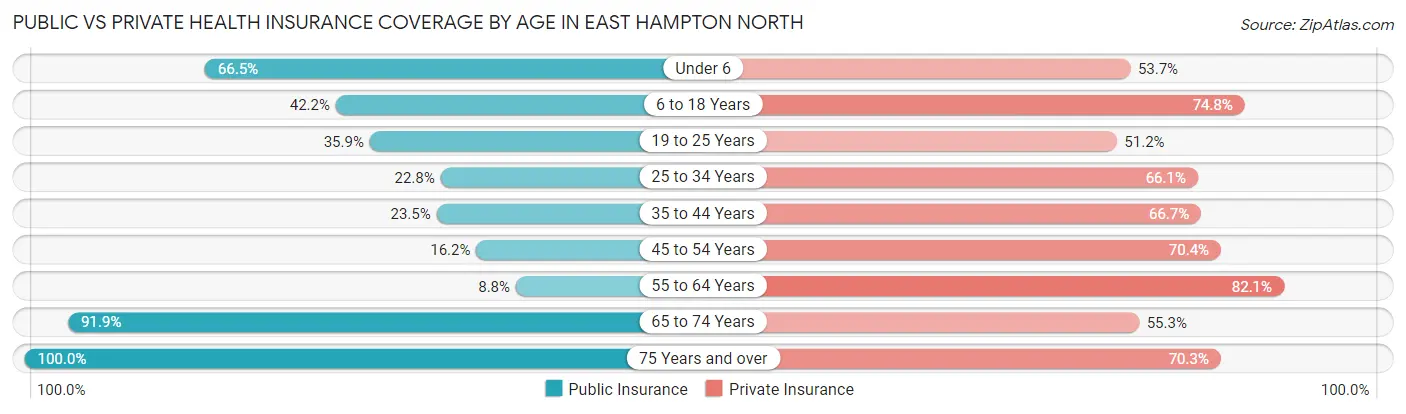
| Age Bracket | Public Insurance | Private Insurance |
| Under 6 | 326 (66.5%) | 263 (53.7%) |
| 6 to 18 Years | 392 (42.2%) | 694 (74.8%) |
| 19 to 25 Years | 170 (35.9%) | 242 (51.2%) |
| 25 to 34 Years | 188 (22.8%) | 545 (66.1%) |
| 35 to 44 Years | 156 (23.5%) | 442 (66.7%) |
| 45 to 54 Years | 102 (16.2%) | 444 (70.4%) |
| 55 to 64 Years | 79 (8.8%) | 736 (82.1%) |
| 65 to 74 Years | 399 (91.9%) | 240 (55.3%) |
| 75 Years and over | 246 (100.0%) | 173 (70.3%) |
| Total | 2,058 (36.8%) | 3,779 (67.6%) |
Disability Status by Sex by Age in East Hampton North
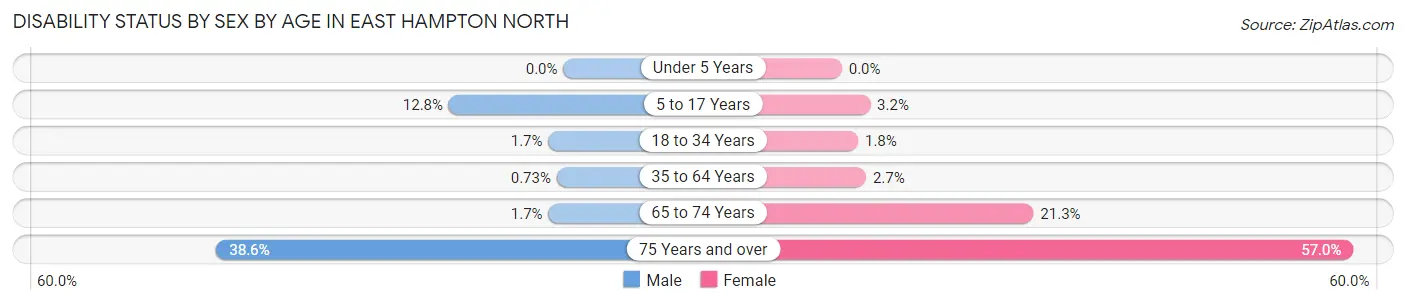
| Age Bracket | Male | Female |
| Under 5 Years | 0 (0.0%) | 0 (0.0%) |
| 5 to 17 Years | 44 (12.8%) | 18 (3.2%) |
| 18 to 34 Years | 13 (1.7%) | 10 (1.8%) |
| 35 to 64 Years | 7 (0.7%) | 33 (2.7%) |
| 65 to 74 Years | 3 (1.7%) | 54 (21.3%) |
| 75 Years and over | 34 (38.6%) | 90 (57.0%) |
Disability Class by Sex by Age in East Hampton North
Disability Class: Hearing Difficulty
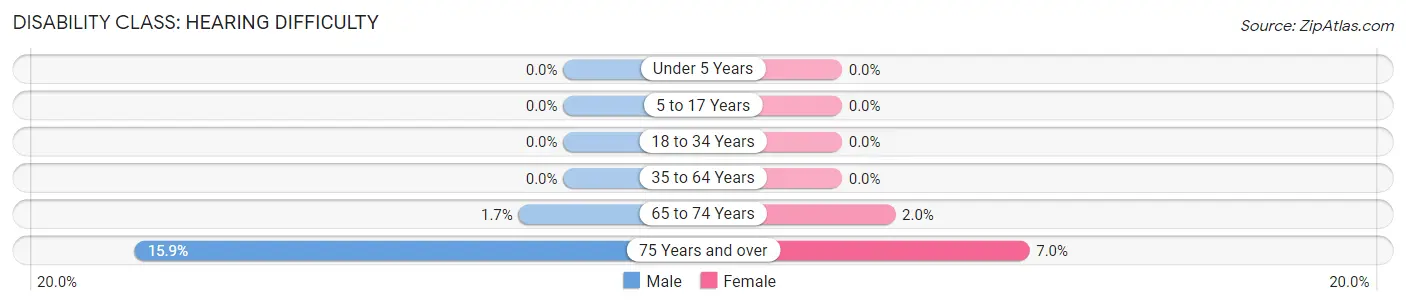
| Age Bracket | Male | Female |
| Under 5 Years | 0 (0.0%) | 0 (0.0%) |
| 5 to 17 Years | 0 (0.0%) | 0 (0.0%) |
| 18 to 34 Years | 0 (0.0%) | 0 (0.0%) |
| 35 to 64 Years | 0 (0.0%) | 0 (0.0%) |
| 65 to 74 Years | 3 (1.7%) | 5 (2.0%) |
| 75 Years and over | 14 (15.9%) | 11 (7.0%) |
Disability Class: Vision Difficulty
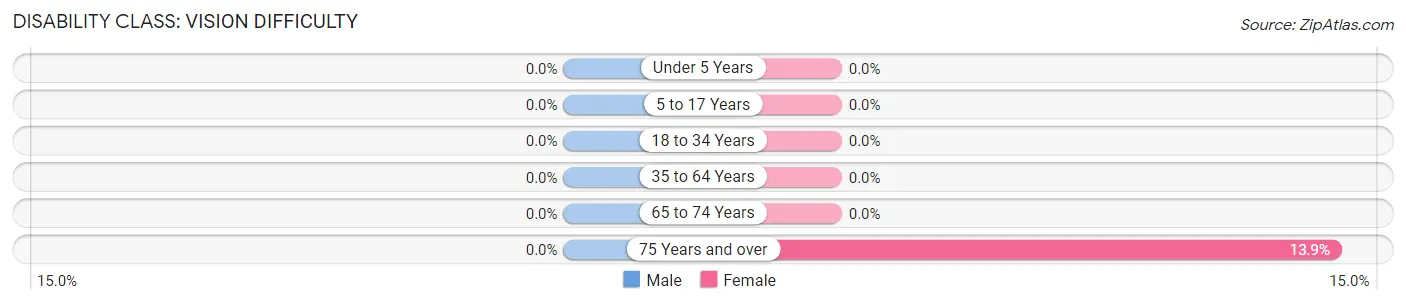
| Age Bracket | Male | Female |
| Under 5 Years | 0 (0.0%) | 0 (0.0%) |
| 5 to 17 Years | 0 (0.0%) | 0 (0.0%) |
| 18 to 34 Years | 0 (0.0%) | 0 (0.0%) |
| 35 to 64 Years | 0 (0.0%) | 0 (0.0%) |
| 65 to 74 Years | 0 (0.0%) | 0 (0.0%) |
| 75 Years and over | 0 (0.0%) | 22 (13.9%) |
Disability Class: Cognitive Difficulty
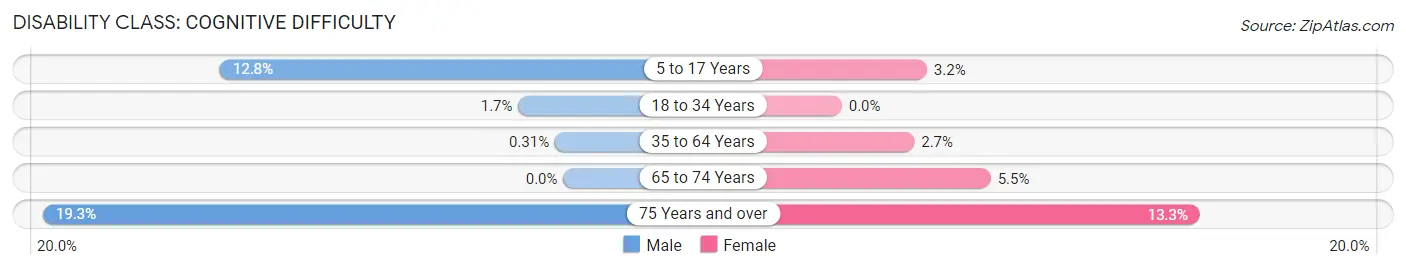
| Age Bracket | Male | Female |
| 5 to 17 Years | 44 (12.8%) | 18 (3.2%) |
| 18 to 34 Years | 13 (1.7%) | 0 (0.0%) |
| 35 to 64 Years | 3 (0.3%) | 33 (2.7%) |
| 65 to 74 Years | 0 (0.0%) | 14 (5.5%) |
| 75 Years and over | 17 (19.3%) | 21 (13.3%) |
Disability Class: Ambulatory Difficulty
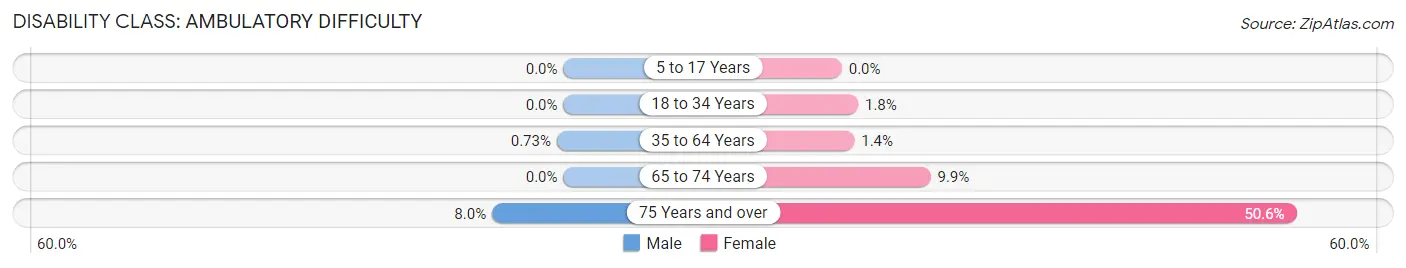
| Age Bracket | Male | Female |
| 5 to 17 Years | 0 (0.0%) | 0 (0.0%) |
| 18 to 34 Years | 0 (0.0%) | 10 (1.8%) |
| 35 to 64 Years | 7 (0.7%) | 17 (1.4%) |
| 65 to 74 Years | 0 (0.0%) | 25 (9.9%) |
| 75 Years and over | 7 (8.0%) | 80 (50.6%) |
Disability Class: Self-Care Difficulty
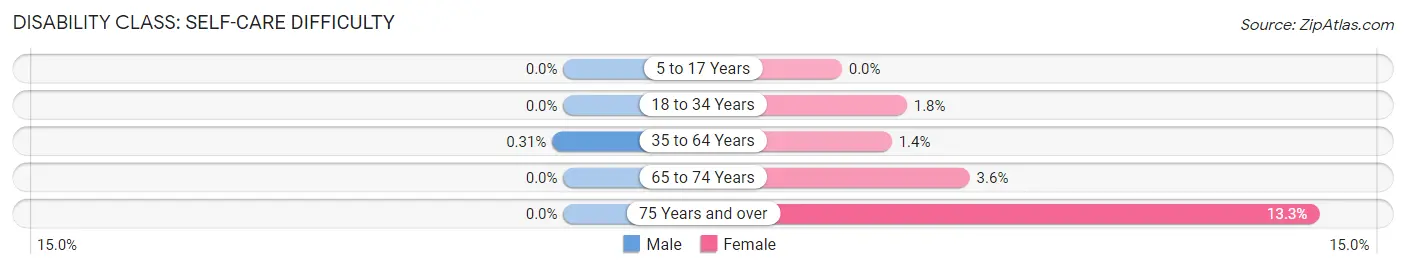
| Age Bracket | Male | Female |
| 5 to 17 Years | 0 (0.0%) | 0 (0.0%) |
| 18 to 34 Years | 0 (0.0%) | 10 (1.8%) |
| 35 to 64 Years | 3 (0.3%) | 17 (1.4%) |
| 65 to 74 Years | 0 (0.0%) | 9 (3.6%) |
| 75 Years and over | 0 (0.0%) | 21 (13.3%) |
Technology Access in East Hampton North
Computing Device Access in East Hampton North
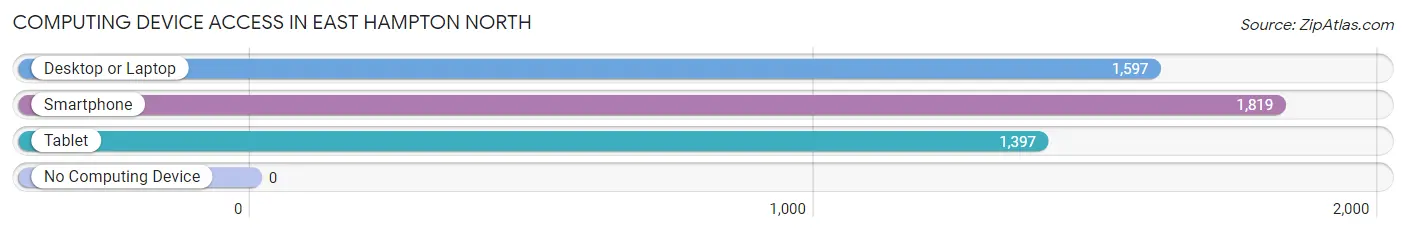
| Device Type | # Households | % Households |
| Desktop or Laptop | 1,597 | 82.4% |
| Smartphone | 1,819 | 93.9% |
| Tablet | 1,397 | 72.1% |
| No Computing Device | 0 | 0.0% |
| Total | 1,938 | 100.0% |
Internet Access in East Hampton North
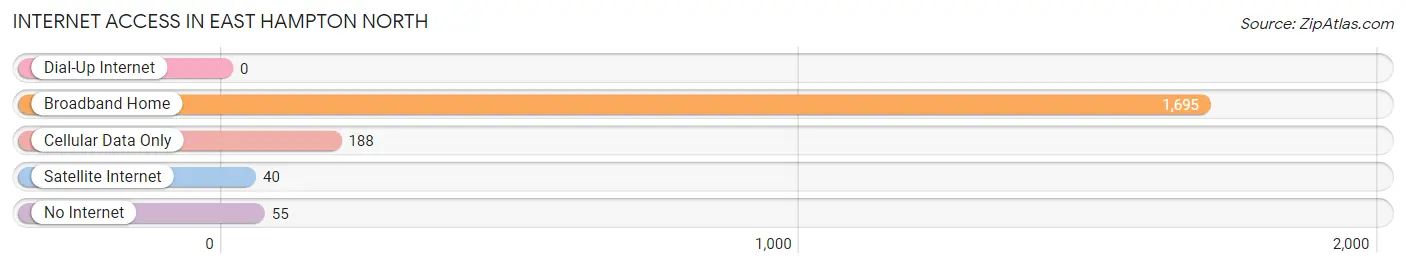
| Internet Type | # Households | % Households |
| Dial-Up Internet | 0 | 0.0% |
| Broadband Home | 1,695 | 87.5% |
| Cellular Data Only | 188 | 9.7% |
| Satellite Internet | 40 | 2.1% |
| No Internet | 55 | 2.8% |
| Total | 1,938 | 100.0% |
East Hampton North Summary
East Hampton North, NY is a hamlet located in the Town of East Hampton in Suffolk County, New York. It is located on the eastern end of Long Island, approximately 90 miles east of New York City. The hamlet is bordered by the hamlets of East Hampton, Springs, and Amagansett. East Hampton North is a small, rural community with a population of approximately 1,000 people.
History
East Hampton North was originally inhabited by the Montaukett Native American tribe. The area was first settled by Europeans in 1648, when a group of English settlers purchased land from the Montaukett. The area was initially known as Maidstone, after the English town of Maidstone. In 1686, the area was renamed East Hampton, after the English town of East Hampton.
In the late 19th century, East Hampton North began to develop as a summer resort destination. The area was known for its beautiful beaches and scenic views. The area was also popular with wealthy New Yorkers, who built large summer homes in the area.
In the early 20th century, East Hampton North began to develop as a year-round community. The area was home to a number of small businesses, including a post office, a general store, and a blacksmith shop.
Geography
East Hampton North is located on the eastern end of Long Island, approximately 90 miles east of New York City. The hamlet is bordered by the hamlets of East Hampton, Springs, and Amagansett. The area is characterized by rolling hills, wooded areas, and open fields. The hamlet is located on the Atlantic Ocean, and is home to several beaches, including Main Beach, Wiborg Beach, and Georgica Beach.
Economy
East Hampton North is a small, rural community with a population of approximately 1,000 people. The area is home to a number of small businesses, including restaurants, retail stores, and art galleries. The area is also home to a number of farms, which produce a variety of fruits and vegetables.
The area is also home to a number of summer resorts, which attract tourists from around the world. The area is also home to a number of wineries, which produce a variety of wines.
Demographics
As of the 2010 census, East Hampton North had a population of 1,000 people. The racial makeup of the hamlet was 94.2% White, 2.2% African American, 0.7% Native American, 0.7% Asian, 0.3% from other races, and 1.9% from two or more races. Hispanic or Latino of any race were 2.2% of the population.
The median household income in East Hampton North was $68,750, and the median family income was $77,500. The per capita income for the hamlet was $35,000. Approximately 8.2% of the population was below the poverty line.
Common Questions
What is Per Capita Income in East Hampton North?
Per Capita income in East Hampton North is $49,131.
What is the Median Family Income in East Hampton North?
Median Family Income in East Hampton North is $106,042.
What is the Median Household income in East Hampton North?
Median Household Income in East Hampton North is $105,156.
What is Income or Wage Gap in East Hampton North?
Income or Wage Gap in East Hampton North is 22.0%.
Women in East Hampton North earn 78.0 cents for every dollar earned by a man.
What is Inequality or Gini Index in East Hampton North?
Inequality or Gini Index in East Hampton North is 0.50.
What is the Total Population of East Hampton North?
Total Population of East Hampton North is 5,587.
What is the Total Male Population of East Hampton North?
Total Male Population of East Hampton North is 2,535.
What is the Total Female Population of East Hampton North?
Total Female Population of East Hampton North is 3,052.
What is the Ratio of Males per 100 Females in East Hampton North?
There are 83.06 Males per 100 Females in East Hampton North.
What is the Ratio of Females per 100 Males in East Hampton North?
There are 120.39 Females per 100 Males in East Hampton North.
What is the Median Population Age in East Hampton North?
Median Population Age in East Hampton North is 36.1 Years.
What is the Average Family Size in East Hampton North
Average Family Size in East Hampton North is 3.5 People.
What is the Average Household Size in East Hampton North
Average Household Size in East Hampton North is 2.9 People.
How Large is the Labor Force in East Hampton North?
There are 3,201 People in the Labor Forcein in East Hampton North.
What is the Percentage of People in the Labor Force in East Hampton North?
73.2% of People are in the Labor Force in East Hampton North.
What is the Unemployment Rate in East Hampton North?
Unemployment Rate in East Hampton North is 0.3%.