North Bay Shore, NY Map & Demographics
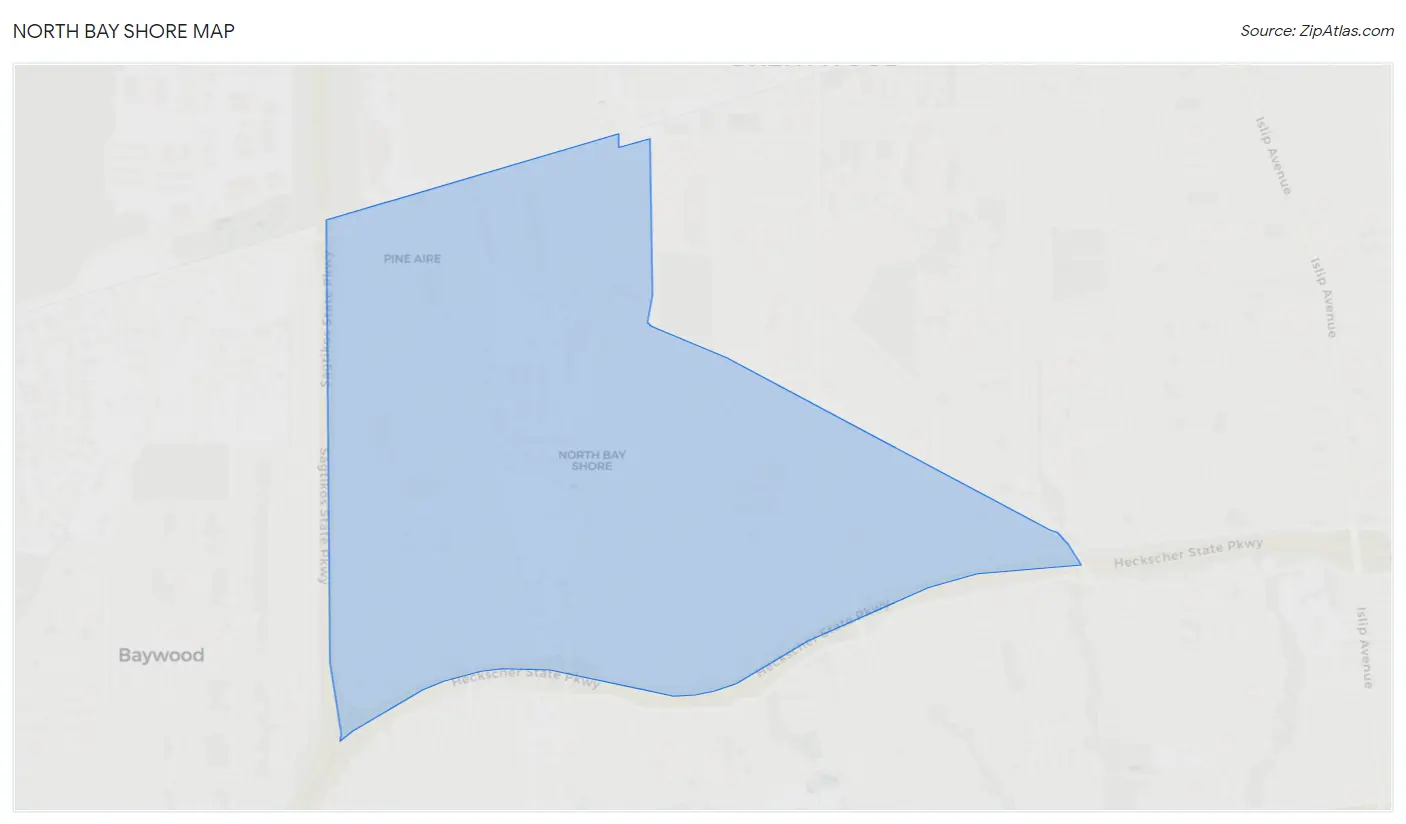
North Bay Shore Map
North Bay Shore Overview
$29,926
PER CAPITA INCOME
$104,774
AVG FAMILY INCOME
$104,004
AVG HOUSEHOLD INCOME
7.4%
WAGE / INCOME GAP [ % ]
92.6¢/ $1
WAGE / INCOME GAP [ $ ]
0.39
INEQUALITY / GINI INDEX
18,392
TOTAL POPULATION
8,962
MALE POPULATION
9,430
FEMALE POPULATION
95.04
MALES / 100 FEMALES
105.22
FEMALES / 100 MALES
35.7
MEDIAN AGE
4.3
AVG FAMILY SIZE
4.2
AVG HOUSEHOLD SIZE
10,297
LABOR FORCE [ PEOPLE ]
72.0%
PERCENT IN LABOR FORCE
5.0%
UNEMPLOYMENT RATE
Income in North Bay Shore
Income Overview in North Bay Shore
Per Capita Income in North Bay Shore is $29,926, while median incomes of families and households are $104,774 and $104,004 respectively.
| Characteristic | Number | Measure |
| Per Capita Income | 18,392 | $29,926 |
| Median Family Income | 3,539 | $104,774 |
| Mean Family Income | 3,539 | $119,957 |
| Median Household Income | 4,401 | $104,004 |
| Mean Household Income | 4,401 | $120,441 |
| Income Deficit | 3,539 | $0 |
| Wage / Income Gap (%) | 18,392 | 7.44% |
| Wage / Income Gap ($) | 18,392 | 92.56¢ per $1 |
| Gini / Inequality Index | 18,392 | 0.39 |
Earnings by Sex in North Bay Shore
Average Earnings in North Bay Shore are $37,053, $38,738 for men and $35,854 for women, a difference of 7.4%.
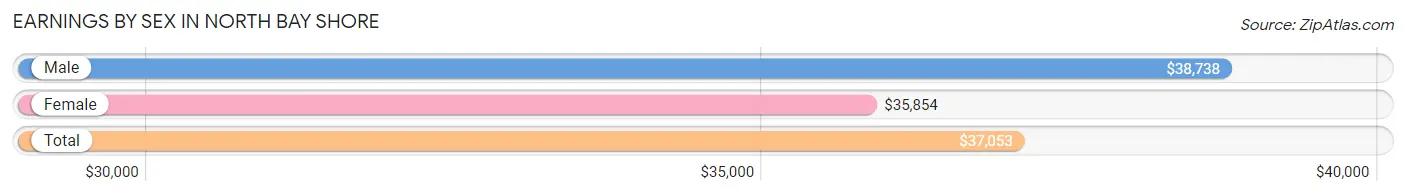
| Sex | Number | Average Earnings |
| Male | 5,232 (50.6%) | $38,738 |
| Female | 5,112 (49.4%) | $35,854 |
| Total | 10,344 (100.0%) | $37,053 |
Earnings by Sex by Income Bracket in North Bay Shore
The most common earnings brackets in North Bay Shore are $100,000+ for men (601 | 11.5%) and $35,000 to $39,999 for women (516 | 10.1%).
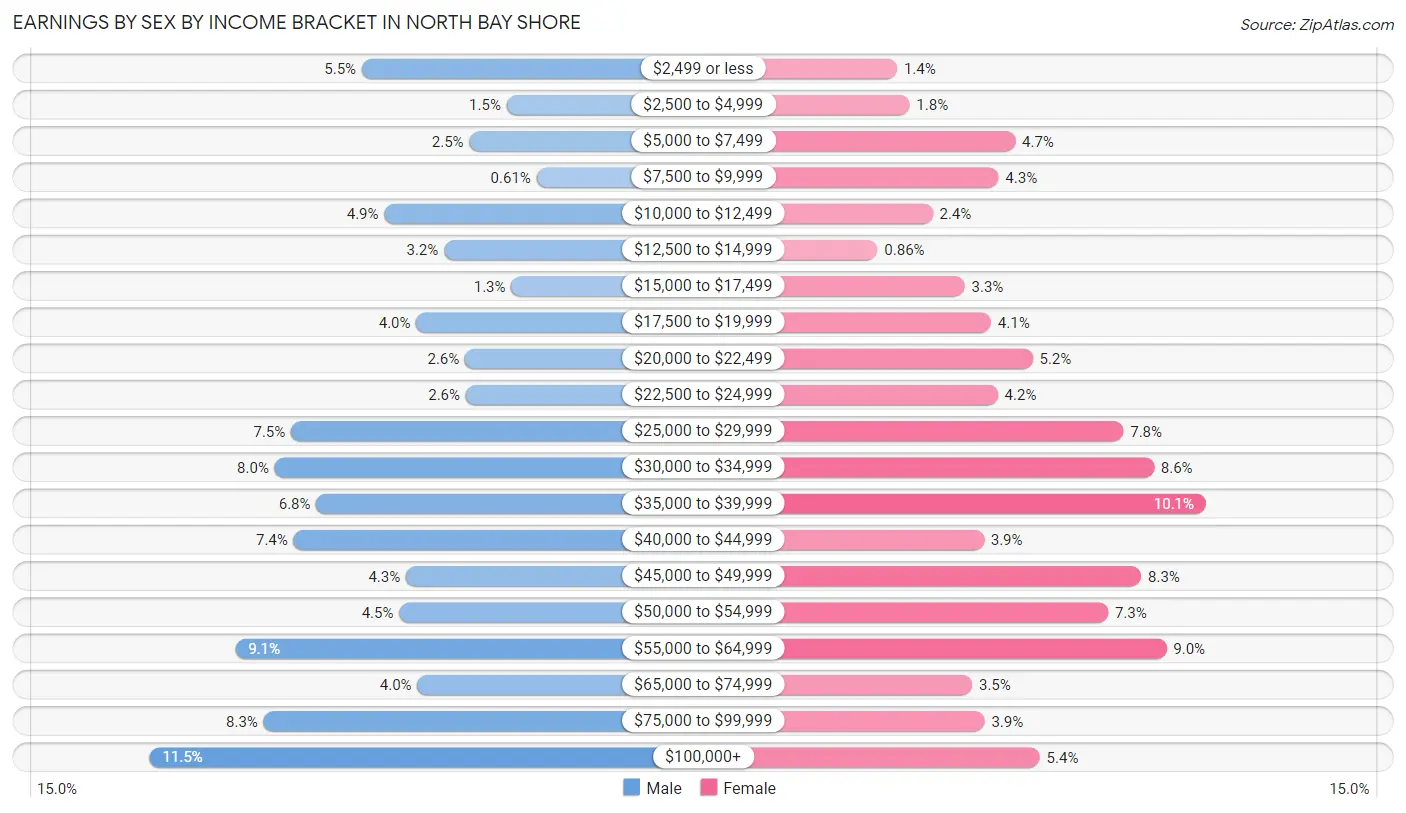
| Income | Male | Female |
| $2,499 or less | 289 (5.5%) | 72 (1.4%) |
| $2,500 to $4,999 | 76 (1.5%) | 90 (1.8%) |
| $5,000 to $7,499 | 131 (2.5%) | 242 (4.7%) |
| $7,500 to $9,999 | 32 (0.6%) | 218 (4.3%) |
| $10,000 to $12,499 | 256 (4.9%) | 123 (2.4%) |
| $12,500 to $14,999 | 168 (3.2%) | 44 (0.9%) |
| $15,000 to $17,499 | 69 (1.3%) | 169 (3.3%) |
| $17,500 to $19,999 | 209 (4.0%) | 207 (4.1%) |
| $20,000 to $22,499 | 137 (2.6%) | 267 (5.2%) |
| $22,500 to $24,999 | 136 (2.6%) | 217 (4.2%) |
| $25,000 to $29,999 | 393 (7.5%) | 397 (7.8%) |
| $30,000 to $34,999 | 417 (8.0%) | 441 (8.6%) |
| $35,000 to $39,999 | 356 (6.8%) | 516 (10.1%) |
| $40,000 to $44,999 | 389 (7.4%) | 197 (3.8%) |
| $45,000 to $49,999 | 224 (4.3%) | 423 (8.3%) |
| $50,000 to $54,999 | 234 (4.5%) | 375 (7.3%) |
| $55,000 to $64,999 | 475 (9.1%) | 459 (9.0%) |
| $65,000 to $74,999 | 207 (4.0%) | 180 (3.5%) |
| $75,000 to $99,999 | 433 (8.3%) | 198 (3.9%) |
| $100,000+ | 601 (11.5%) | 277 (5.4%) |
| Total | 5,232 (100.0%) | 5,112 (100.0%) |
Earnings by Sex by Educational Attainment in North Bay Shore
Average earnings in North Bay Shore are $42,829 for men and $38,961 for women, a difference of 9.0%. Men with an educational attainment of college or associate's degree enjoy the highest average annual earnings of $64,653, while those with high school diploma education earn the least with $35,785. Women with an educational attainment of college or associate's degree earn the most with the average annual earnings of $49,080, while those with high school diploma education have the smallest earnings of $29,077.
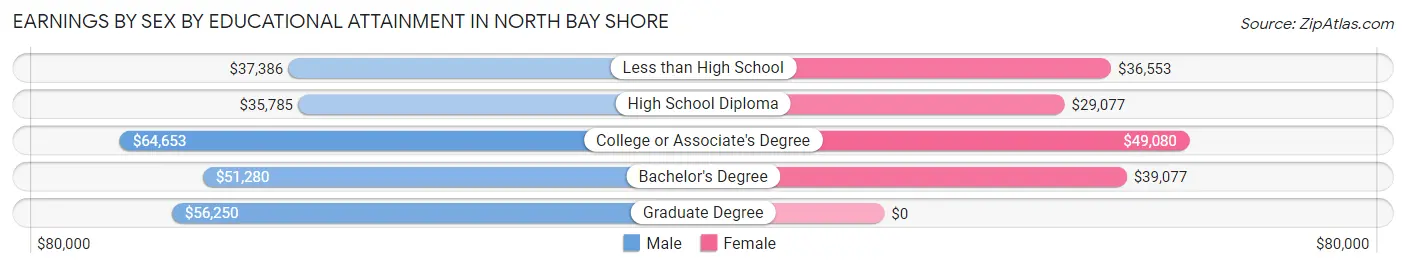
| Educational Attainment | Male Income | Female Income |
| Less than High School | $37,386 | $36,553 |
| High School Diploma | $35,785 | $29,077 |
| College or Associate's Degree | $64,653 | $49,080 |
| Bachelor's Degree | $51,280 | $39,077 |
| Graduate Degree | $56,250 | $0 |
| Total | $42,829 | $38,961 |
Family Income in North Bay Shore
Family Income Brackets in North Bay Shore
According to the North Bay Shore family income data, there are 963 families falling into the $100,000 to $149,999 income range, which is the most common income bracket and makes up 27.2% of all families.
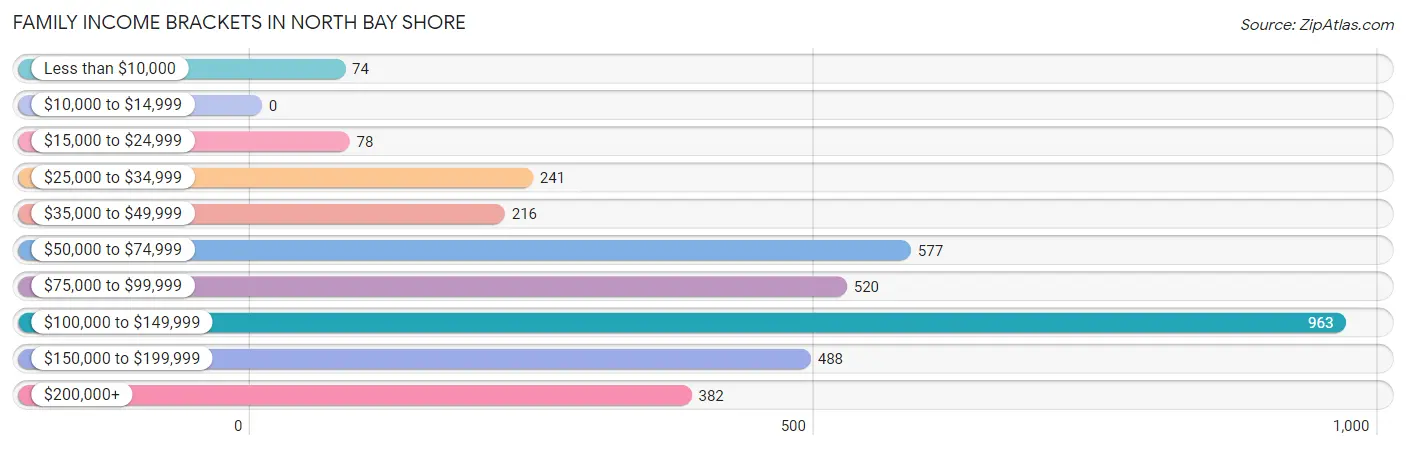
| Income Bracket | # Families | % Families |
| Less than $10,000 | 74 | 2.1% |
| $10,000 to $14,999 | 0 | 0.0% |
| $15,000 to $24,999 | 78 | 2.2% |
| $25,000 to $34,999 | 241 | 6.8% |
| $35,000 to $49,999 | 216 | 6.1% |
| $50,000 to $74,999 | 577 | 16.3% |
| $75,000 to $99,999 | 520 | 14.7% |
| $100,000 to $149,999 | 963 | 27.2% |
| $150,000 to $199,999 | 488 | 13.8% |
| $200,000+ | 382 | 10.8% |
Family Income by Famaliy Size in North Bay Shore
6-person families (453 | 12.8%) account for the highest median family income in North Bay Shore with $174,708 per family, while 2-person families (678 | 19.2%) have the highest median income of $37,834 per family member.
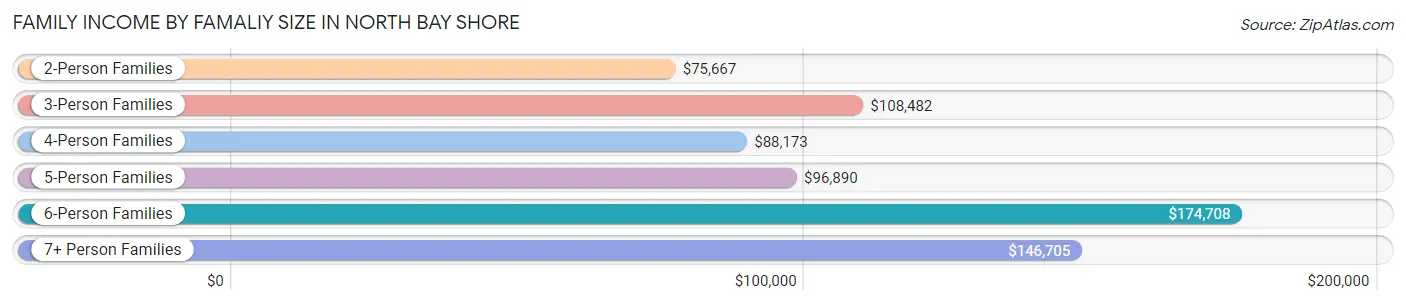
| Income Bracket | # Families | Median Income |
| 2-Person Families | 678 (19.2%) | $75,667 |
| 3-Person Families | 713 (20.2%) | $108,482 |
| 4-Person Families | 1,039 (29.4%) | $88,173 |
| 5-Person Families | 311 (8.8%) | $96,890 |
| 6-Person Families | 453 (12.8%) | $174,708 |
| 7+ Person Families | 345 (9.8%) | $146,705 |
| Total | 3,539 (100.0%) | $104,774 |
Family Income by Number of Earners in North Bay Shore
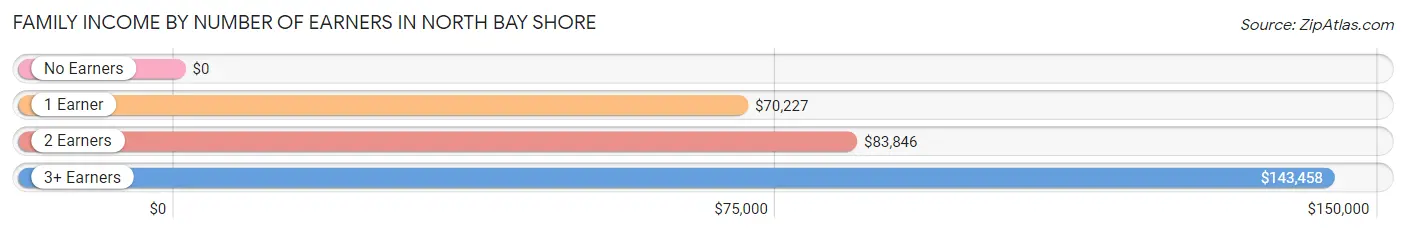
| Number of Earners | # Families | Median Income |
| No Earners | 153 (4.3%) | $0 |
| 1 Earner | 736 (20.8%) | $70,227 |
| 2 Earners | 1,264 (35.7%) | $83,846 |
| 3+ Earners | 1,386 (39.2%) | $143,458 |
| Total | 3,539 (100.0%) | $104,774 |
Household Income in North Bay Shore
Household Income Brackets in North Bay Shore
With 959 households falling in the category, the $100,000 to $149,999 income range is the most frequent in North Bay Shore, accounting for 21.8% of all households. In contrast, only 88 households (2.0%) fall into the $10,000 to $14,999 income bracket, making it the least populous group.
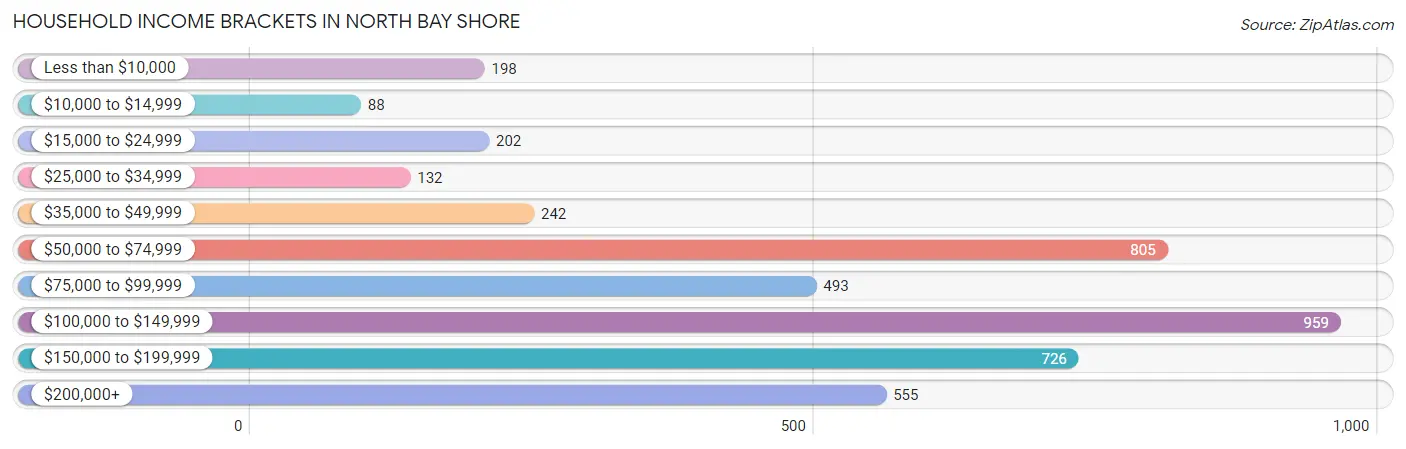
| Income Bracket | # Households | % Households |
| Less than $10,000 | 198 | 4.5% |
| $10,000 to $14,999 | 88 | 2.0% |
| $15,000 to $24,999 | 202 | 4.6% |
| $25,000 to $34,999 | 132 | 3.0% |
| $35,000 to $49,999 | 242 | 5.5% |
| $50,000 to $74,999 | 805 | 18.3% |
| $75,000 to $99,999 | 493 | 11.2% |
| $100,000 to $149,999 | 959 | 21.8% |
| $150,000 to $199,999 | 726 | 16.5% |
| $200,000+ | 555 | 12.6% |
Household Income by Householder Age in North Bay Shore
The median household income in North Bay Shore is $104,004, with the highest median household income of $131,941 found in the 45 to 64 years age bracket for the primary householder. A total of 2,003 households (45.5%) fall into this category. Meanwhile, the 15 to 24 years age bracket for the primary householder has the lowest median household income of $0, with 20 households (0.4%) in this group.
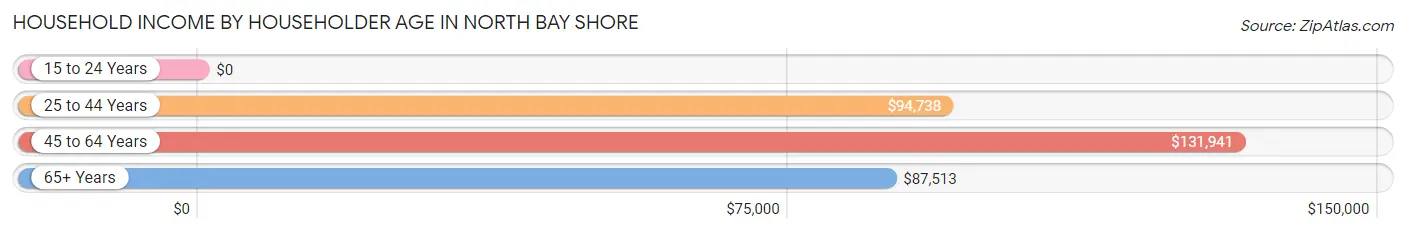
| Income Bracket | # Households | Median Income |
| 15 to 24 Years | 20 (0.4%) | $0 |
| 25 to 44 Years | 1,511 (34.3%) | $94,738 |
| 45 to 64 Years | 2,003 (45.5%) | $131,941 |
| 65+ Years | 867 (19.7%) | $87,513 |
| Total | 4,401 (100.0%) | $104,004 |
Poverty in North Bay Shore
Income Below Poverty by Sex and Age in North Bay Shore
With 11.5% poverty level for males and 12.7% for females among the residents of North Bay Shore, 5 year old males and 18 to 24 year old females are the most vulnerable to poverty, with 105 males (37.5%) and 200 females (22.3%) in their respective age groups living below the poverty level.
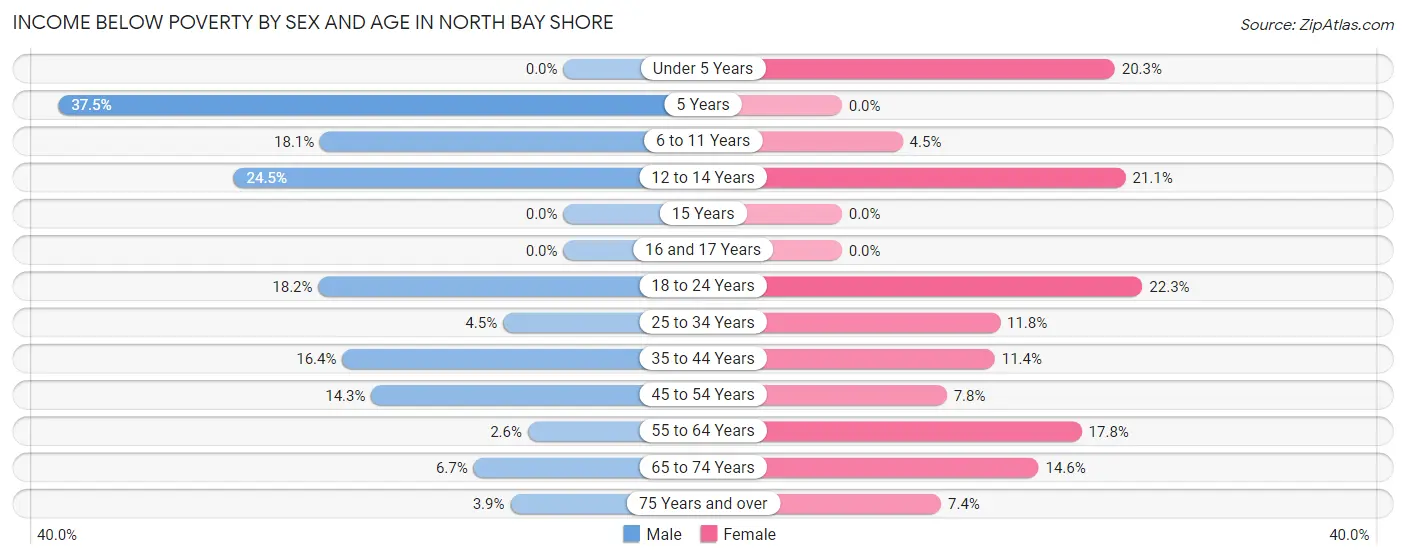
| Age Bracket | Male | Female |
| Under 5 Years | 0 (0.0%) | 118 (20.3%) |
| 5 Years | 105 (37.5%) | 0 (0.0%) |
| 6 to 11 Years | 158 (18.1%) | 30 (4.5%) |
| 12 to 14 Years | 106 (24.5%) | 67 (21.1%) |
| 15 Years | 0 (0.0%) | 0 (0.0%) |
| 16 and 17 Years | 0 (0.0%) | 0 (0.0%) |
| 18 to 24 Years | 137 (18.2%) | 200 (22.3%) |
| 25 to 34 Years | 66 (4.5%) | 185 (11.7%) |
| 35 to 44 Years | 202 (16.4%) | 188 (11.4%) |
| 45 to 54 Years | 181 (14.3%) | 88 (7.8%) |
| 55 to 64 Years | 29 (2.6%) | 150 (17.8%) |
| 65 to 74 Years | 29 (6.7%) | 103 (14.6%) |
| 75 Years and over | 13 (3.9%) | 49 (7.4%) |
| Total | 1,026 (11.5%) | 1,178 (12.7%) |
Income Above Poverty by Sex and Age in North Bay Shore
According to the poverty statistics in North Bay Shore, males aged under 5 years and females aged 5 years are the age groups that are most secure financially, with 100.0% of males and 100.0% of females in these age groups living above the poverty line.
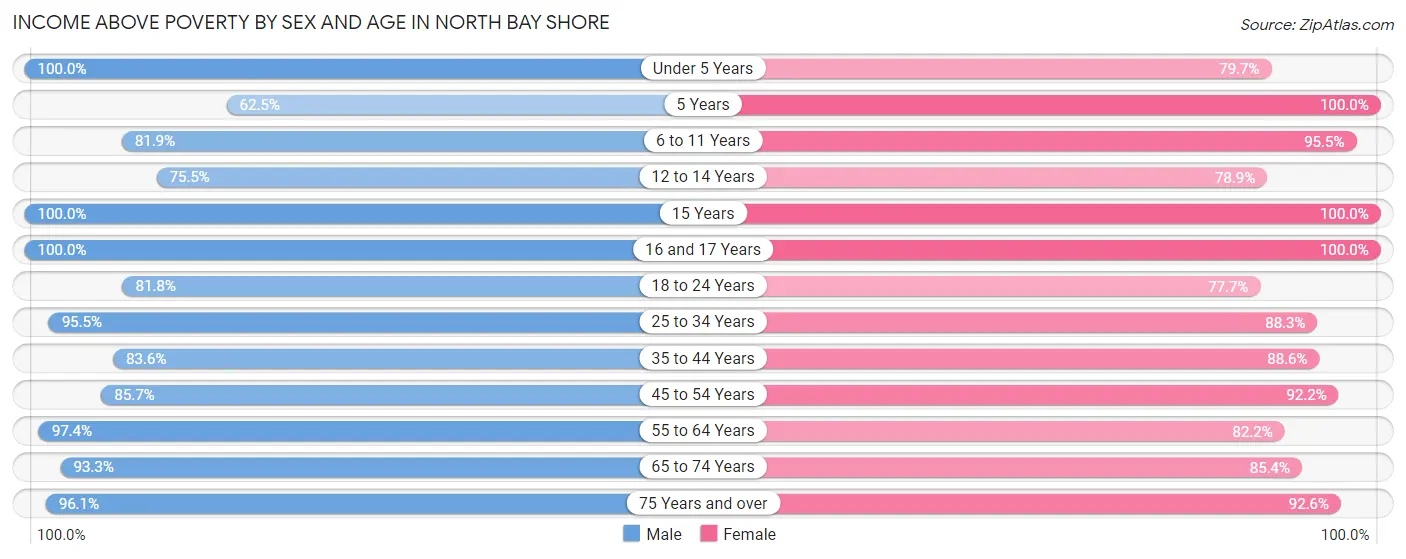
| Age Bracket | Male | Female |
| Under 5 Years | 591 (100.0%) | 464 (79.7%) |
| 5 Years | 175 (62.5%) | 68 (100.0%) |
| 6 to 11 Years | 717 (81.9%) | 633 (95.5%) |
| 12 to 14 Years | 327 (75.5%) | 251 (78.9%) |
| 15 Years | 73 (100.0%) | 69 (100.0%) |
| 16 and 17 Years | 96 (100.0%) | 145 (100.0%) |
| 18 to 24 Years | 616 (81.8%) | 696 (77.7%) |
| 25 to 34 Years | 1,407 (95.5%) | 1,390 (88.2%) |
| 35 to 44 Years | 1,029 (83.6%) | 1,467 (88.6%) |
| 45 to 54 Years | 1,088 (85.7%) | 1,042 (92.2%) |
| 55 to 64 Years | 1,069 (97.4%) | 692 (82.2%) |
| 65 to 74 Years | 406 (93.3%) | 602 (85.4%) |
| 75 Years and over | 317 (96.1%) | 616 (92.6%) |
| Total | 7,911 (88.5%) | 8,135 (87.4%) |
Income Below Poverty Among Married-Couple Families in North Bay Shore
The poverty statistics for married-couple families in North Bay Shore show that 2.3% or 55 of the total 2,383 families live below the poverty line. Families with 1 or 2 children have the highest poverty rate of 4.0%, comprising of 42 families. On the other hand, families with 3 or 4 children have the lowest poverty rate of 0.0%, which includes 0 families.
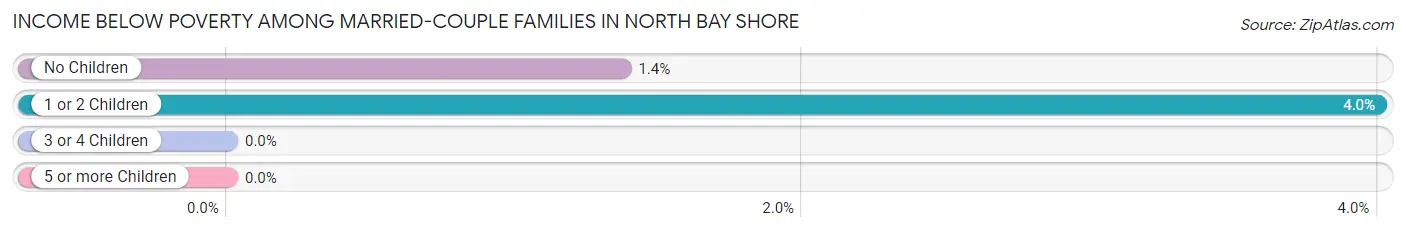
| Children | Above Poverty | Below Poverty |
| No Children | 933 (98.6%) | 13 (1.4%) |
| 1 or 2 Children | 1,007 (96.0%) | 42 (4.0%) |
| 3 or 4 Children | 370 (100.0%) | 0 (0.0%) |
| 5 or more Children | 18 (100.0%) | 0 (0.0%) |
| Total | 2,328 (97.7%) | 55 (2.3%) |
Income Below Poverty Among Single-Parent Households in North Bay Shore
According to the poverty data in North Bay Shore, 38.4% or 207 single-father households and 17.5% or 108 single-mother households are living below the poverty line. Among single-father households, those with 1 or 2 children have the highest poverty rate, with 196 households (58.0%) experiencing poverty. Likewise, among single-mother households, those with 3 or 4 children have the highest poverty rate, with 76 households (86.4%) falling below the poverty line.
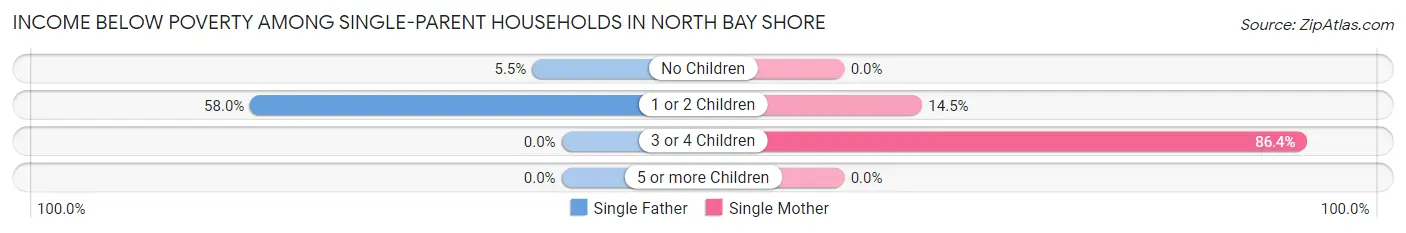
| Children | Single Father | Single Mother |
| No Children | 11 (5.5%) | 0 (0.0%) |
| 1 or 2 Children | 196 (58.0%) | 32 (14.5%) |
| 3 or 4 Children | 0 (0.0%) | 76 (86.4%) |
| 5 or more Children | 0 (0.0%) | 0 (0.0%) |
| Total | 207 (38.4%) | 108 (17.5%) |
Income Below Poverty Among Married-Couple vs Single-Parent Households in North Bay Shore
The poverty data for North Bay Shore shows that 55 of the married-couple family households (2.3%) and 315 of the single-parent households (27.3%) are living below the poverty level. Within the married-couple family households, those with 1 or 2 children have the highest poverty rate, with 42 households (4.0%) falling below the poverty line. Among the single-parent households, those with 3 or 4 children have the highest poverty rate, with 76 household (86.4%) living below poverty.
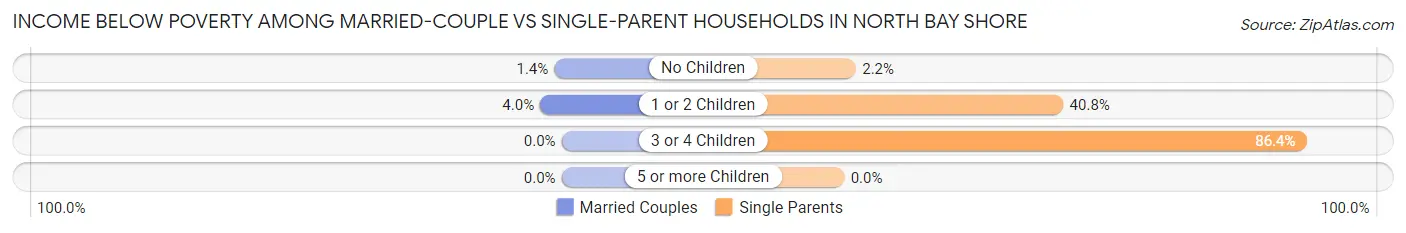
| Children | Married-Couple Families | Single-Parent Households |
| No Children | 13 (1.4%) | 11 (2.2%) |
| 1 or 2 Children | 42 (4.0%) | 228 (40.8%) |
| 3 or 4 Children | 0 (0.0%) | 76 (86.4%) |
| 5 or more Children | 0 (0.0%) | 0 (0.0%) |
| Total | 55 (2.3%) | 315 (27.3%) |
Race in North Bay Shore
The most populous races in North Bay Shore are Hispanic or Latino (11,244 | 61.1%), White / Caucasian (7,197 | 39.1%), and Some other Race (5,829 | 31.7%).
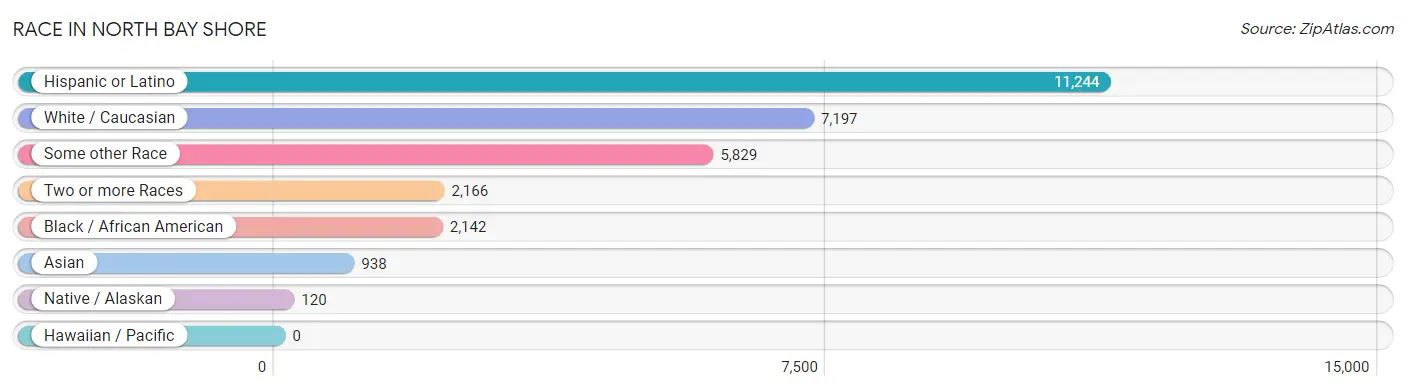
| Race | # Population | % Population |
| Asian | 938 | 5.1% |
| Black / African American | 2,142 | 11.7% |
| Hawaiian / Pacific | 0 | 0.0% |
| Hispanic or Latino | 11,244 | 61.1% |
| Native / Alaskan | 120 | 0.6% |
| White / Caucasian | 7,197 | 39.1% |
| Two or more Races | 2,166 | 11.8% |
| Some other Race | 5,829 | 31.7% |
| Total | 18,392 | 100.0% |
Ancestry in North Bay Shore
The most populous ancestries reported in North Bay Shore are Central American (6,722 | 36.5%), Salvadoran (4,712 | 25.6%), Honduran (1,670 | 9.1%), Puerto Rican (1,617 | 8.8%), and Dominican (1,315 | 7.1%), together accounting for 87.2% of all North Bay Shore residents.
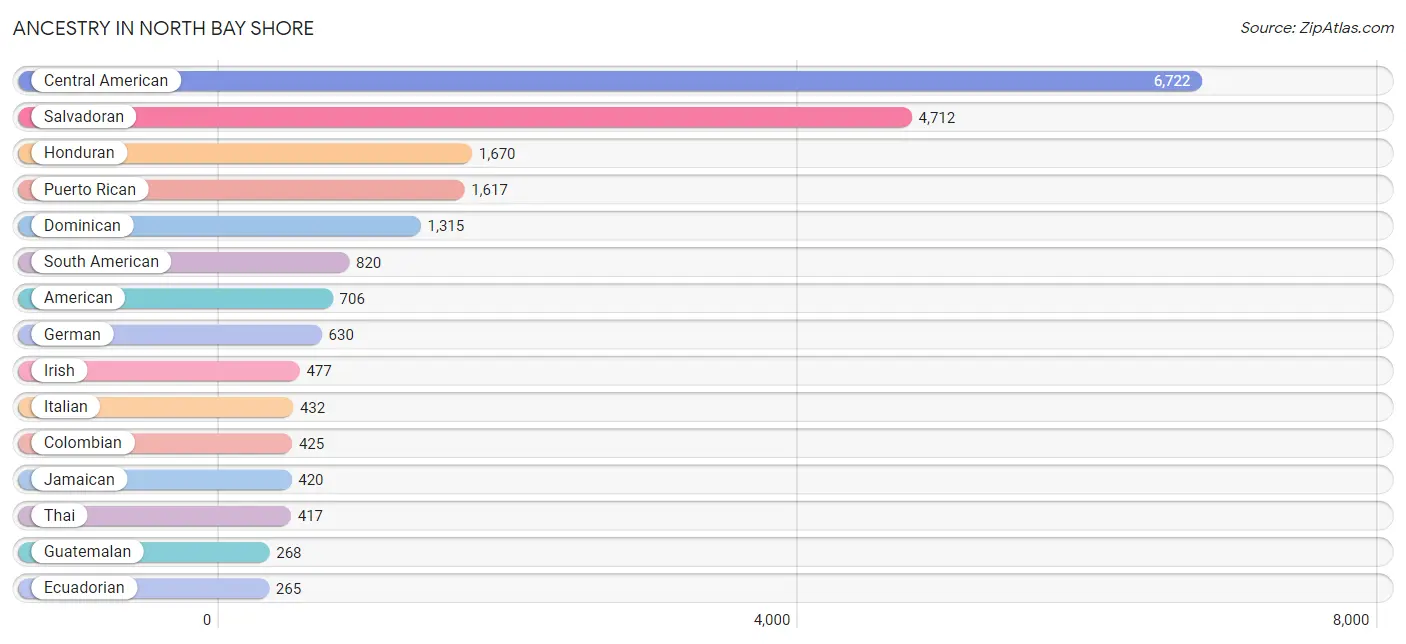
| Ancestry | # Population | % Population |
| American | 706 | 3.8% |
| Apache | 13 | 0.1% |
| Arab | 54 | 0.3% |
| Austrian | 15 | 0.1% |
| Bahamian | 107 | 0.6% |
| Barbadian | 28 | 0.2% |
| Brazilian | 12 | 0.1% |
| British | 19 | 0.1% |
| British West Indian | 86 | 0.5% |
| Burmese | 78 | 0.4% |
| Canadian | 7 | 0.0% |
| Central American | 6,722 | 36.5% |
| Central American Indian | 183 | 1.0% |
| Cherokee | 30 | 0.2% |
| Chilean | 20 | 0.1% |
| Colombian | 425 | 2.3% |
| Croatian | 18 | 0.1% |
| Dominican | 1,315 | 7.1% |
| Dutch | 76 | 0.4% |
| Ecuadorian | 265 | 1.4% |
| English | 71 | 0.4% |
| European | 54 | 0.3% |
| French | 64 | 0.4% |
| French American Indian | 31 | 0.2% |
| French Canadian | 26 | 0.1% |
| German | 630 | 3.4% |
| Greek | 37 | 0.2% |
| Guatemalan | 268 | 1.5% |
| Guyanese | 237 | 1.3% |
| Haitian | 168 | 0.9% |
| Honduran | 1,670 | 9.1% |
| Irish | 477 | 2.6% |
| Iroquois | 31 | 0.2% |
| Italian | 432 | 2.4% |
| Jamaican | 420 | 2.3% |
| Korean | 28 | 0.2% |
| Latvian | 57 | 0.3% |
| Mexican | 70 | 0.4% |
| Moroccan | 54 | 0.3% |
| Native Hawaiian | 33 | 0.2% |
| Norwegian | 11 | 0.1% |
| Panamanian | 54 | 0.3% |
| Peruvian | 93 | 0.5% |
| Polish | 91 | 0.5% |
| Portuguese | 139 | 0.8% |
| Puerto Rican | 1,617 | 8.8% |
| Russian | 14 | 0.1% |
| Salvadoran | 4,712 | 25.6% |
| Scandinavian | 19 | 0.1% |
| Scottish | 8 | 0.0% |
| South American | 820 | 4.5% |
| Spanish | 213 | 1.2% |
| Sri Lankan | 57 | 0.3% |
| Swedish | 8 | 0.0% |
| Thai | 417 | 2.3% |
| Uruguayan | 9 | 0.1% |
| Venezuelan | 8 | 0.0% |
| Vietnamese | 83 | 0.4% |
| West Indian | 45 | 0.2% | View All 59 Rows |
Immigrants in North Bay Shore
The most numerous immigrant groups reported in North Bay Shore came from Latin America (5,870 | 31.9%), Central America (3,737 | 20.3%), El Salvador (2,246 | 12.2%), Caribbean (1,266 | 6.9%), and Asia (1,079 | 5.9%), together accounting for 77.2% of all North Bay Shore residents.
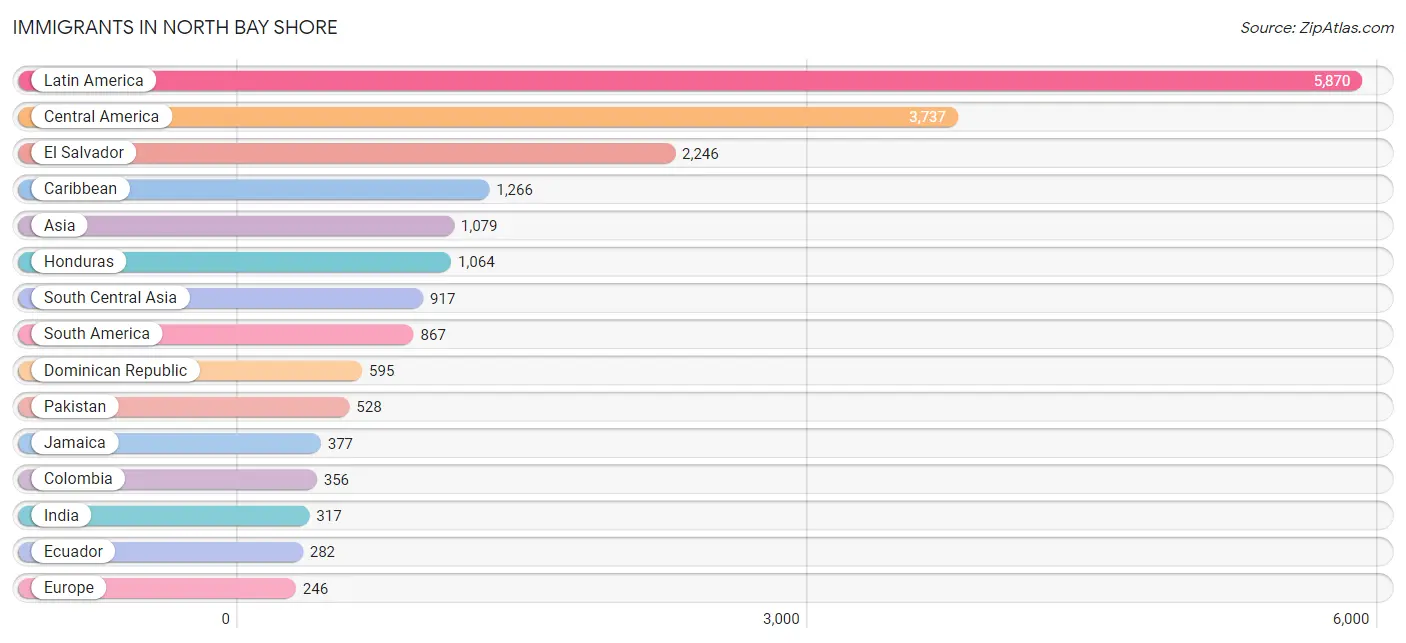
| Immigration Origin | # Population | % Population |
| Africa | 116 | 0.6% |
| Asia | 1,079 | 5.9% |
| Austria | 15 | 0.1% |
| Bangladesh | 72 | 0.4% |
| Barbados | 28 | 0.2% |
| Brazil | 12 | 0.1% |
| Canada | 7 | 0.0% |
| Caribbean | 1,266 | 6.9% |
| Central America | 3,737 | 20.3% |
| China | 13 | 0.1% |
| Colombia | 356 | 1.9% |
| Dominican Republic | 595 | 3.2% |
| Eastern Asia | 58 | 0.3% |
| Eastern Europe | 36 | 0.2% |
| Ecuador | 282 | 1.5% |
| El Salvador | 2,246 | 12.2% |
| Europe | 246 | 1.3% |
| Germany | 51 | 0.3% |
| Ghana | 13 | 0.1% |
| Grenada | 9 | 0.1% |
| Guatemala | 225 | 1.2% |
| Guyana | 69 | 0.4% |
| Haiti | 135 | 0.7% |
| Honduras | 1,064 | 5.8% |
| India | 317 | 1.7% |
| Ireland | 14 | 0.1% |
| Italy | 82 | 0.4% |
| Jamaica | 377 | 2.1% |
| Korea | 45 | 0.2% |
| Latin America | 5,870 | 31.9% |
| Mexico | 202 | 1.1% |
| Morocco | 54 | 0.3% |
| Northern Africa | 54 | 0.3% |
| Northern Europe | 14 | 0.1% |
| Pakistan | 528 | 2.9% |
| Peru | 95 | 0.5% |
| Poland | 36 | 0.2% |
| Portugal | 48 | 0.3% |
| Saudi Arabia | 47 | 0.3% |
| South America | 867 | 4.7% |
| South Central Asia | 917 | 5.0% |
| South Eastern Asia | 57 | 0.3% |
| Southern Europe | 130 | 0.7% |
| Trinidad and Tobago | 36 | 0.2% |
| Uruguay | 45 | 0.2% |
| Venezuela | 8 | 0.0% |
| Vietnam | 57 | 0.3% |
| Western Africa | 13 | 0.1% |
| Western Asia | 47 | 0.3% |
| Western Europe | 66 | 0.4% | View All 50 Rows |
Sex and Age in North Bay Shore
Sex and Age in North Bay Shore
The most populous age groups in North Bay Shore are 25 to 29 Years (947 | 10.6%) for men and 25 to 29 Years (975 | 10.3%) for women.
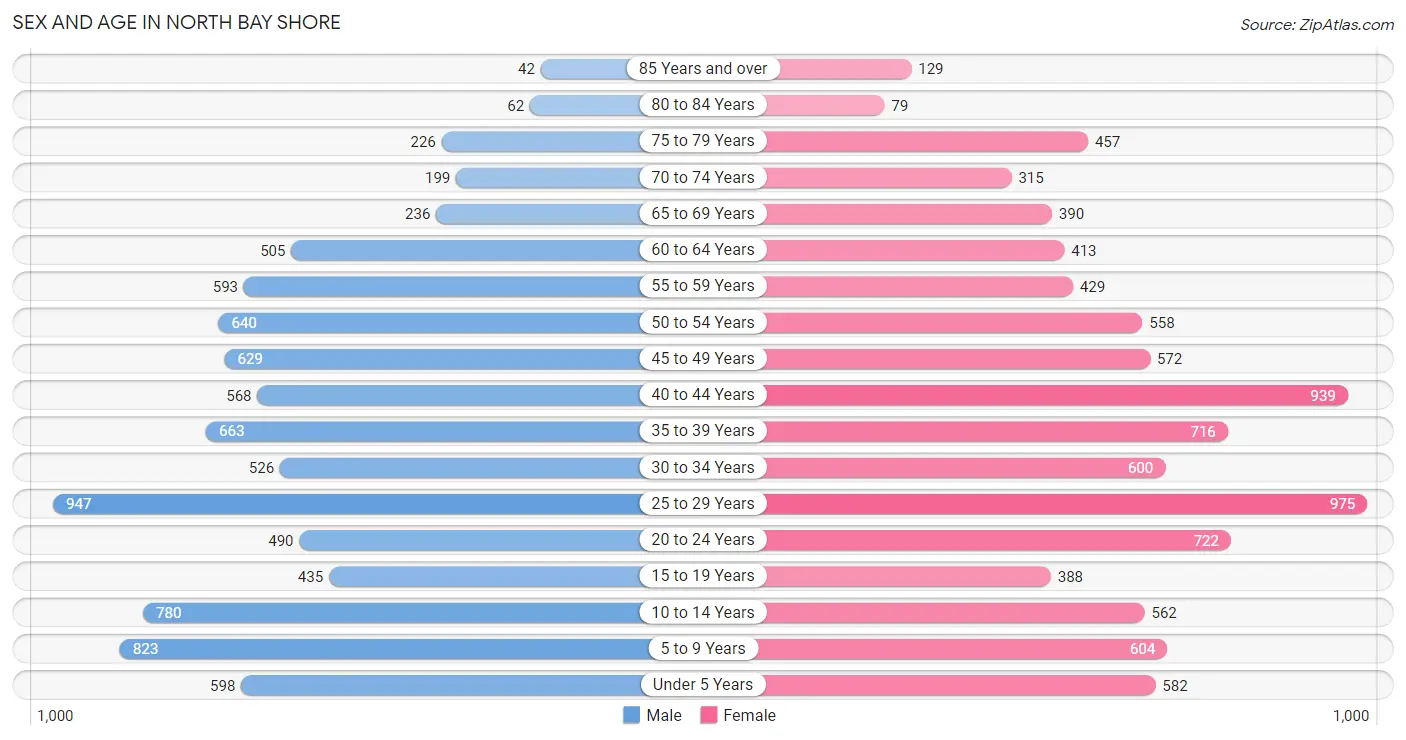
| Age Bracket | Male | Female |
| Under 5 Years | 598 (6.7%) | 582 (6.2%) |
| 5 to 9 Years | 823 (9.2%) | 604 (6.4%) |
| 10 to 14 Years | 780 (8.7%) | 562 (6.0%) |
| 15 to 19 Years | 435 (4.9%) | 388 (4.1%) |
| 20 to 24 Years | 490 (5.5%) | 722 (7.7%) |
| 25 to 29 Years | 947 (10.6%) | 975 (10.3%) |
| 30 to 34 Years | 526 (5.9%) | 600 (6.4%) |
| 35 to 39 Years | 663 (7.4%) | 716 (7.6%) |
| 40 to 44 Years | 568 (6.3%) | 939 (10.0%) |
| 45 to 49 Years | 629 (7.0%) | 572 (6.1%) |
| 50 to 54 Years | 640 (7.1%) | 558 (5.9%) |
| 55 to 59 Years | 593 (6.6%) | 429 (4.5%) |
| 60 to 64 Years | 505 (5.6%) | 413 (4.4%) |
| 65 to 69 Years | 236 (2.6%) | 390 (4.1%) |
| 70 to 74 Years | 199 (2.2%) | 315 (3.3%) |
| 75 to 79 Years | 226 (2.5%) | 457 (4.9%) |
| 80 to 84 Years | 62 (0.7%) | 79 (0.8%) |
| 85 Years and over | 42 (0.5%) | 129 (1.4%) |
| Total | 8,962 (100.0%) | 9,430 (100.0%) |
Families and Households in North Bay Shore
Median Family Size in North Bay Shore
The median family size in North Bay Shore is 4.32 persons per family, with married-couple families (2,383 | 67.3%) accounting for the largest median family size of 4.74 persons per family. On the other hand, single male/father families (539 | 15.2%) represent the smallest median family size with 2.47 persons per family.
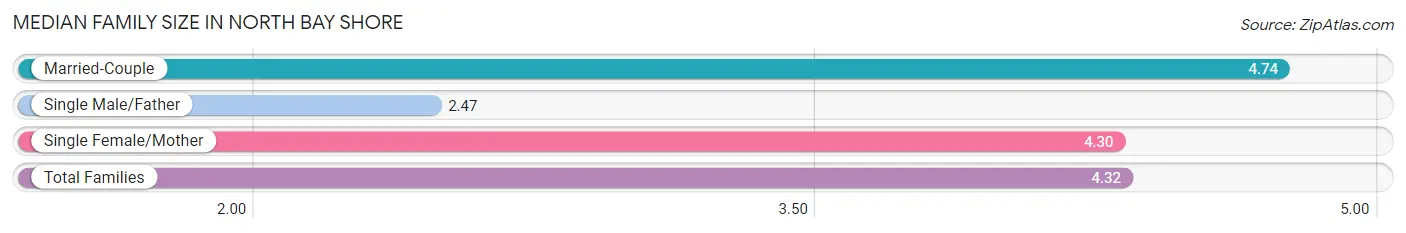
| Family Type | # Families | Family Size |
| Married-Couple | 2,383 (67.3%) | 4.74 |
| Single Male/Father | 539 (15.2%) | 2.47 |
| Single Female/Mother | 617 (17.4%) | 4.30 |
| Total Families | 3,539 (100.0%) | 4.32 |
Median Household Size in North Bay Shore
The median household size in North Bay Shore is 4.17 persons per household, with married-couple households (2,383 | 54.1%) accounting for the largest median household size of 5.13 persons per household. non-family households (862 | 19.6%) represent the smallest median household size with 1.52 persons per household.
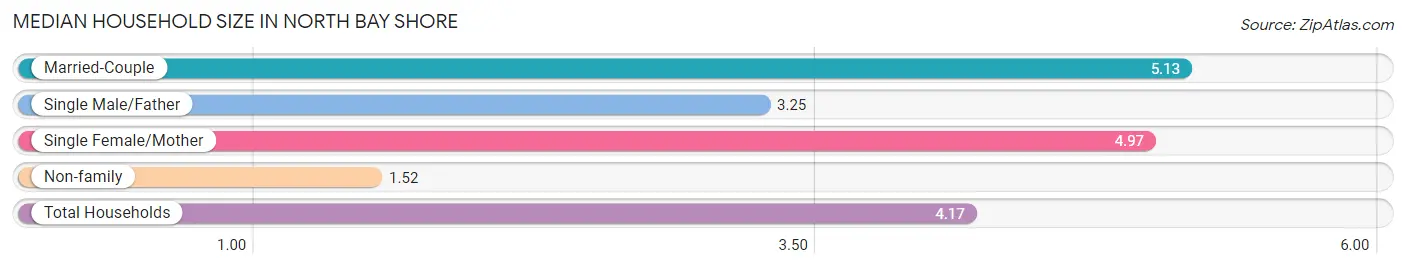
| Household Type | # Households | Household Size |
| Married-Couple | 2,383 (54.1%) | 5.13 |
| Single Male/Father | 539 (12.2%) | 3.25 |
| Single Female/Mother | 617 (14.0%) | 4.97 |
| Non-family | 862 (19.6%) | 1.52 |
| Total Households | 4,401 (100.0%) | 4.17 |
Household Size by Marriage Status in North Bay Shore
Out of a total of 4,401 households in North Bay Shore, 3,539 (80.4%) are family households, while 862 (19.6%) are nonfamily households. The most numerous type of family households are 3-person households, comprising 815, and the most common type of nonfamily households are 1-person households, comprising 637.
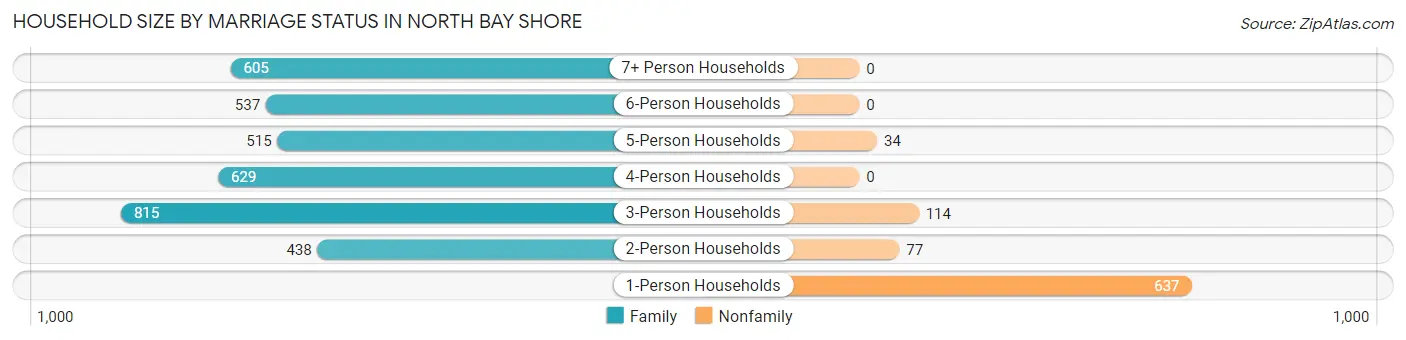
| Household Size | Family Households | Nonfamily Households |
| 1-Person Households | - | 637 (14.5%) |
| 2-Person Households | 438 (10.0%) | 77 (1.8%) |
| 3-Person Households | 815 (18.5%) | 114 (2.6%) |
| 4-Person Households | 629 (14.3%) | 0 (0.0%) |
| 5-Person Households | 515 (11.7%) | 34 (0.8%) |
| 6-Person Households | 537 (12.2%) | 0 (0.0%) |
| 7+ Person Households | 605 (13.8%) | 0 (0.0%) |
| Total | 3,539 (80.4%) | 862 (19.6%) |
Female Fertility in North Bay Shore
Fertility by Age in North Bay Shore
Average fertility rate in North Bay Shore is 68.0 births per 1,000 women. Women in the age bracket of 20 to 34 years have the highest fertility rate with 114.0 births per 1,000 women. Women in the age bracket of 20 to 34 years acount for 76.2% of all women with births.
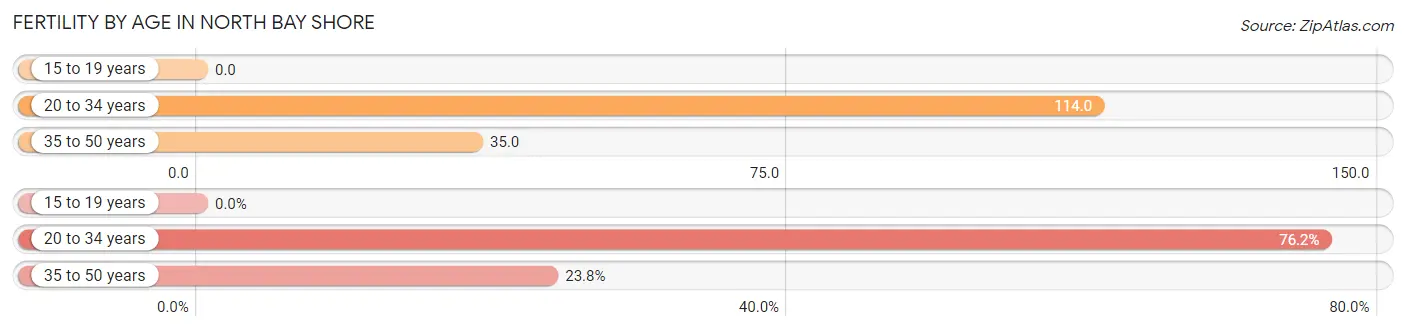
| Age Bracket | Women with Births | Births / 1,000 Women |
| 15 to 19 years | 0 (0.0%) | 0.0 |
| 20 to 34 years | 263 (76.2%) | 114.0 |
| 35 to 50 years | 82 (23.8%) | 35.0 |
| Total | 345 (100.0%) | 68.0 |
Fertility by Age by Marriage Status in North Bay Shore
63.8% of women with births (345) in North Bay Shore are married. The highest percentage of unmarried women with births falls into 20 to 34 years age bracket with 47.5% of them unmarried at the time of birth, while the lowest percentage of unmarried women with births belong to 35 to 50 years age bracket with 0.0% of them unmarried.
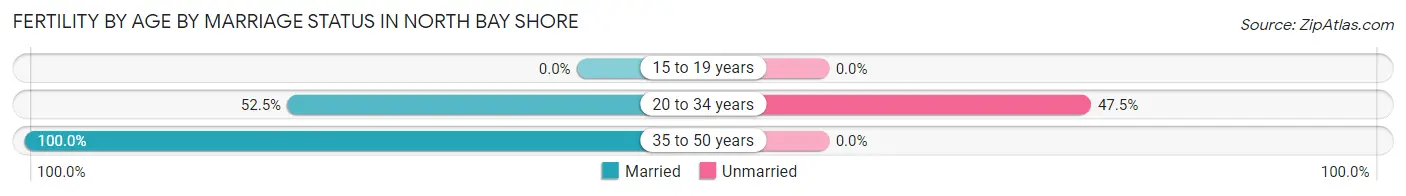
| Age Bracket | Married | Unmarried |
| 15 to 19 years | 0 (0.0%) | 0 (0.0%) |
| 20 to 34 years | 138 (52.5%) | 125 (47.5%) |
| 35 to 50 years | 82 (100.0%) | 0 (0.0%) |
| Total | 220 (63.8%) | 125 (36.2%) |
Fertility by Education in North Bay Shore
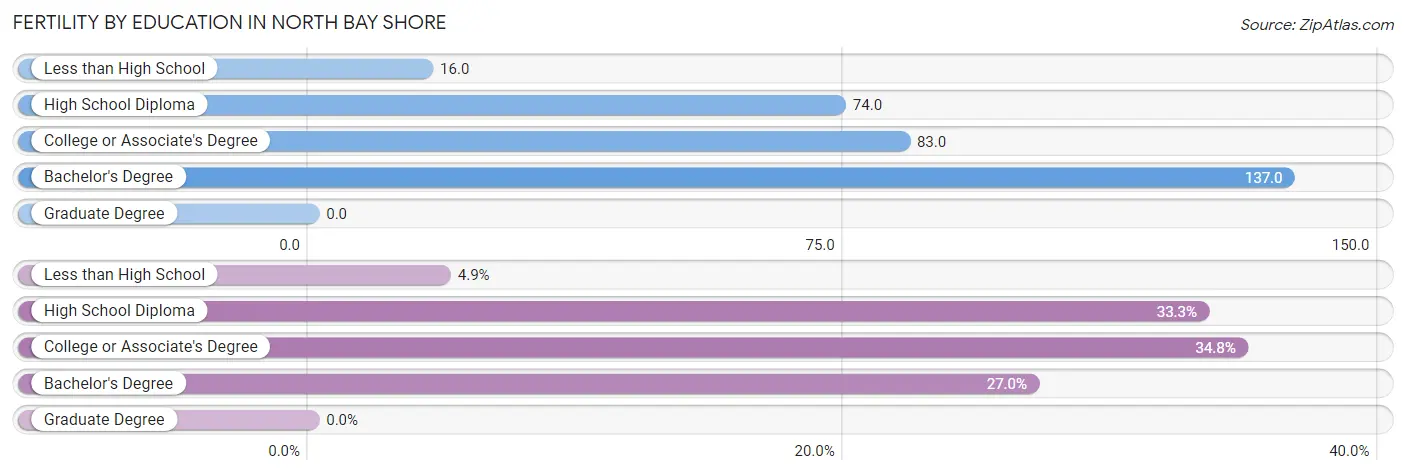
| Educational Attainment | Women with Births | Births / 1,000 Women |
| Less than High School | 17 (4.9%) | 16.0 |
| High School Diploma | 115 (33.3%) | 74.0 |
| College or Associate's Degree | 120 (34.8%) | 83.0 |
| Bachelor's Degree | 93 (27.0%) | 137.0 |
| Graduate Degree | 0 (0.0%) | 0.0 |
| Total | 345 (100.0%) | 68.0 |
Fertility by Education by Marriage Status in North Bay Shore
36.2% of women with births in North Bay Shore are unmarried. Women with the educational attainment of bachelor's degree are most likely to be married with 100.0% of them married at childbirth, while women with the educational attainment of college or associate's degree are least likely to be married with 95.0% of them unmarried at childbirth.
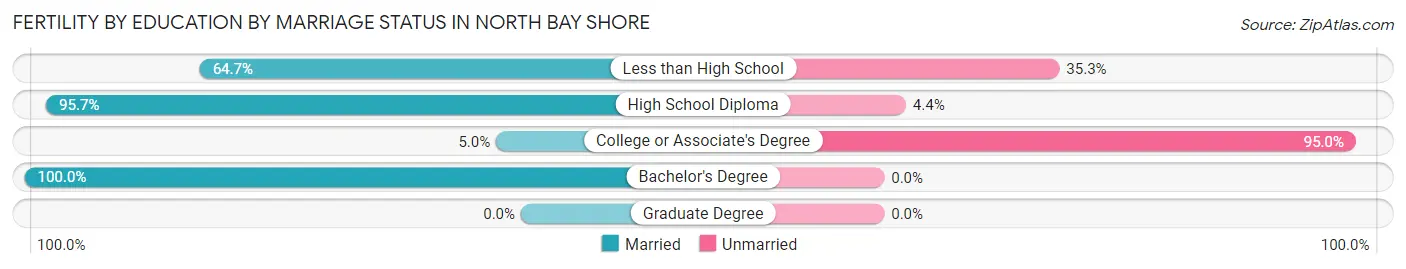
| Educational Attainment | Married | Unmarried |
| Less than High School | 11 (64.7%) | 6 (35.3%) |
| High School Diploma | 110 (95.7%) | 5 (4.3%) |
| College or Associate's Degree | 6 (5.0%) | 114 (95.0%) |
| Bachelor's Degree | 93 (100.0%) | 0 (0.0%) |
| Graduate Degree | 0 (0.0%) | 0 (0.0%) |
| Total | 220 (63.8%) | 125 (36.2%) |
Employment Characteristics in North Bay Shore
Employment by Class of Employer in North Bay Shore
Among the 9,526 employed individuals in North Bay Shore, private company employees (7,318 | 76.8%), self-employed (incorporated) (483 | 5.1%), and not-for-profit organizations (469 | 4.9%) make up the most common classes of employment.
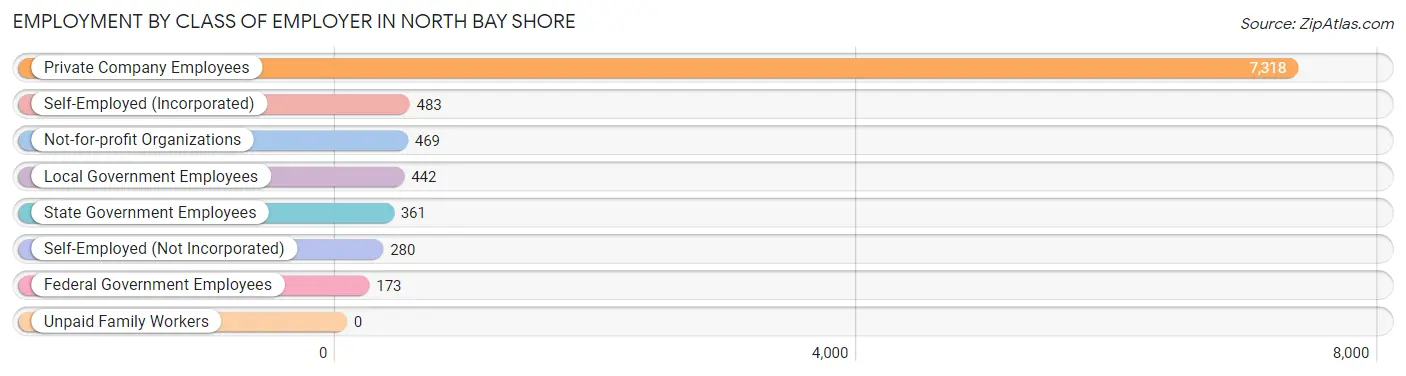
| Employer Class | # Employees | % Employees |
| Private Company Employees | 7,318 | 76.8% |
| Self-Employed (Incorporated) | 483 | 5.1% |
| Self-Employed (Not Incorporated) | 280 | 2.9% |
| Not-for-profit Organizations | 469 | 4.9% |
| Local Government Employees | 442 | 4.6% |
| State Government Employees | 361 | 3.8% |
| Federal Government Employees | 173 | 1.8% |
| Unpaid Family Workers | 0 | 0.0% |
| Total | 9,526 | 100.0% |
Employment Status by Age in North Bay Shore
According to the labor force statistics for North Bay Shore, out of the total population over 16 years of age (14,301), 72.0% or 10,297 individuals are in the labor force, with 5.0% or 515 of them unemployed. The age group with the highest labor force participation rate is 35 to 44 years, with 90.3% or 2,606 individuals in the labor force. Within the labor force, the 16 to 19 years age range has the highest percentage of unemployed individuals, with 18.0% or 50 of them being unemployed.
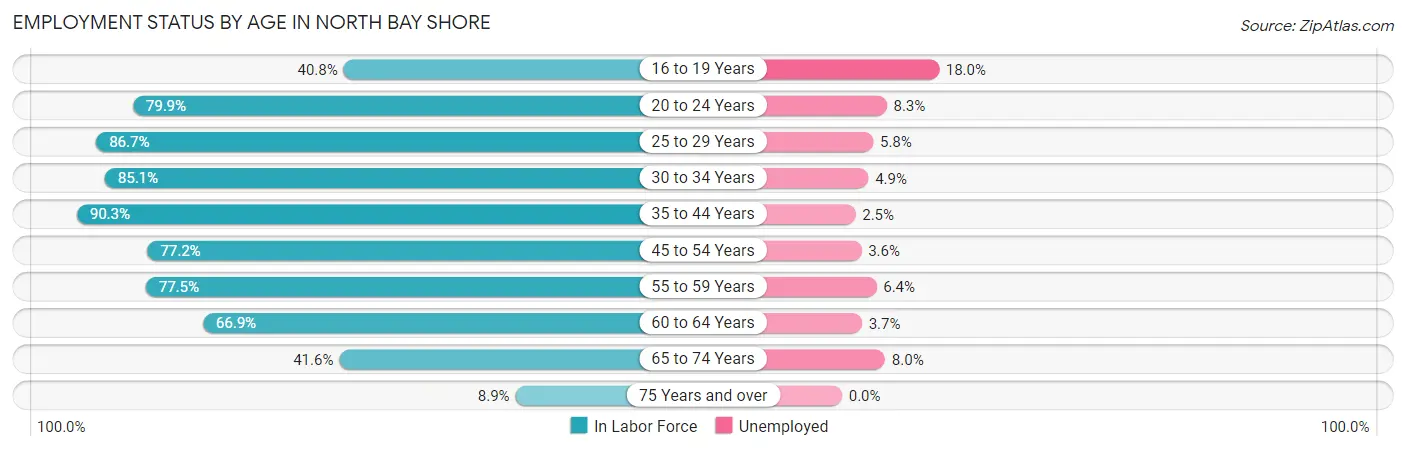
| Age Bracket | In Labor Force | Unemployed |
| 16 to 19 Years | 278 (40.8%) | 50 (18.0%) |
| 20 to 24 Years | 968 (79.9%) | 80 (8.3%) |
| 25 to 29 Years | 1,666 (86.7%) | 97 (5.8%) |
| 30 to 34 Years | 958 (85.1%) | 47 (4.9%) |
| 35 to 44 Years | 2,606 (90.3%) | 65 (2.5%) |
| 45 to 54 Years | 1,852 (77.2%) | 67 (3.6%) |
| 55 to 59 Years | 792 (77.5%) | 51 (6.4%) |
| 60 to 64 Years | 614 (66.9%) | 23 (3.7%) |
| 65 to 74 Years | 474 (41.6%) | 38 (8.0%) |
| 75 Years and over | 89 (8.9%) | 0 (0.0%) |
| Total | 10,297 (72.0%) | 515 (5.0%) |
Employment Status by Educational Attainment in North Bay Shore
According to labor force statistics for North Bay Shore, 82.6% of individuals (8,485) out of the total population between 25 and 64 years of age (10,273) are in the labor force, with 4.1% or 348 of them being unemployed. The group with the highest labor force participation rate are those with the educational attainment of bachelor's degree or higher, with 91.4% or 1,474 individuals in the labor force. Within the labor force, individuals with college / associate degree education have the highest percentage of unemployment, with 5.9% or 138 of them being unemployed.
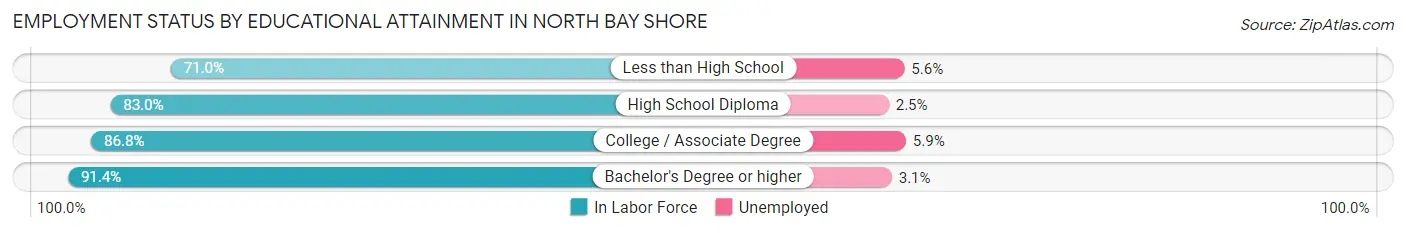
| Educational Attainment | In Labor Force | Unemployed |
| Less than High School | 1,656 (71.0%) | 131 (5.6%) |
| High School Diploma | 3,011 (83.0%) | 91 (2.5%) |
| College / Associate Degree | 2,344 (86.8%) | 159 (5.9%) |
| Bachelor's Degree or higher | 1,474 (91.4%) | 50 (3.1%) |
| Total | 8,485 (82.6%) | 421 (4.1%) |
Employment Occupations by Sex in North Bay Shore
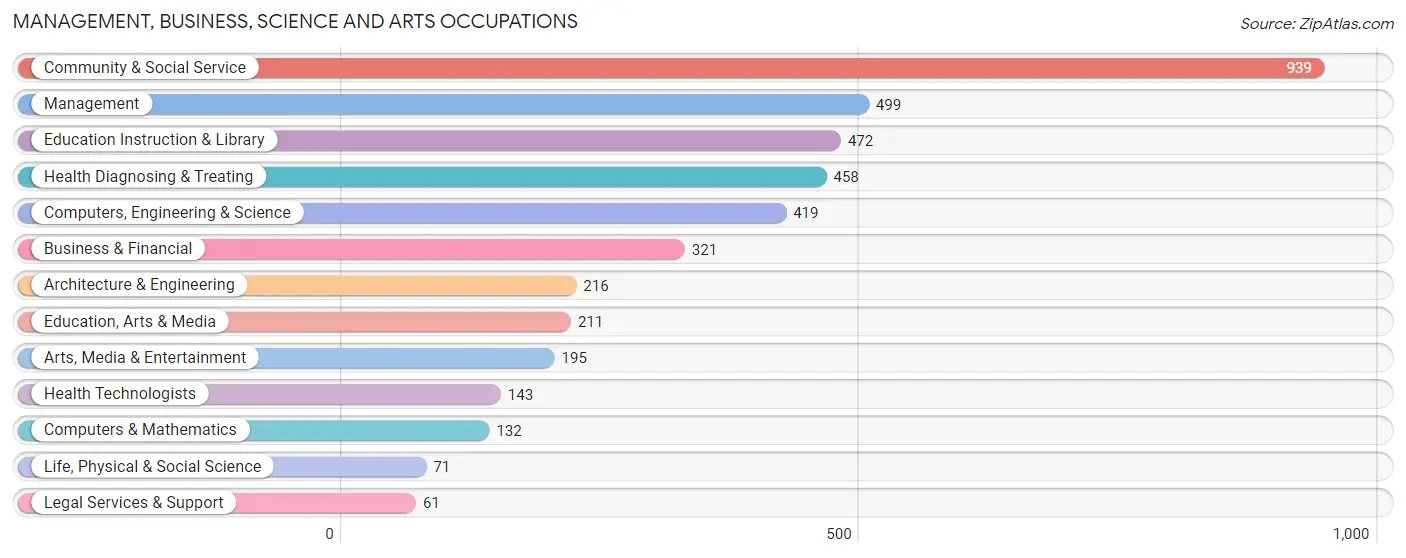
Management, Business, Science and Arts Occupations
The most common Management, Business, Science and Arts occupations in North Bay Shore are Community & Social Service (939 | 9.6%), Management (499 | 5.1%), Education Instruction & Library (472 | 4.8%), Health Diagnosing & Treating (458 | 4.7%), and Computers, Engineering & Science (419 | 4.3%).
Management, Business, Science and Arts Occupations by Sex
Within the Management, Business, Science and Arts occupations in North Bay Shore, the most male-oriented occupations are Computers & Mathematics (100.0%), Architecture & Engineering (89.3%), and Computers, Engineering & Science (85.9%), while the most female-oriented occupations are Legal Services & Support (100.0%), Education Instruction & Library (92.8%), and Education, Arts & Media (92.4%).
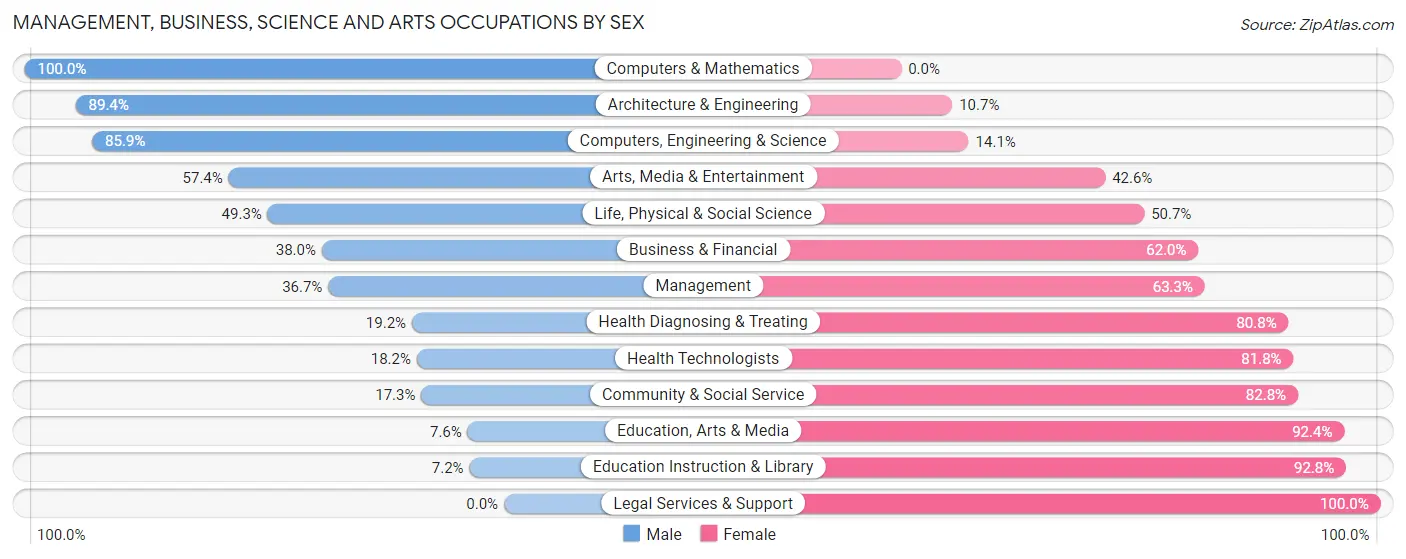
| Occupation | Male | Female |
| Management | 183 (36.7%) | 316 (63.3%) |
| Business & Financial | 122 (38.0%) | 199 (62.0%) |
| Computers, Engineering & Science | 360 (85.9%) | 59 (14.1%) |
| Computers & Mathematics | 132 (100.0%) | 0 (0.0%) |
| Architecture & Engineering | 193 (89.3%) | 23 (10.6%) |
| Life, Physical & Social Science | 35 (49.3%) | 36 (50.7%) |
| Community & Social Service | 162 (17.2%) | 777 (82.8%) |
| Education, Arts & Media | 16 (7.6%) | 195 (92.4%) |
| Legal Services & Support | 0 (0.0%) | 61 (100.0%) |
| Education Instruction & Library | 34 (7.2%) | 438 (92.8%) |
| Arts, Media & Entertainment | 112 (57.4%) | 83 (42.6%) |
| Health Diagnosing & Treating | 88 (19.2%) | 370 (80.8%) |
| Health Technologists | 26 (18.2%) | 117 (81.8%) |
| Total (Category) | 915 (34.7%) | 1,721 (65.3%) |
| Total (Overall) | 4,933 (50.4%) | 4,846 (49.6%) |
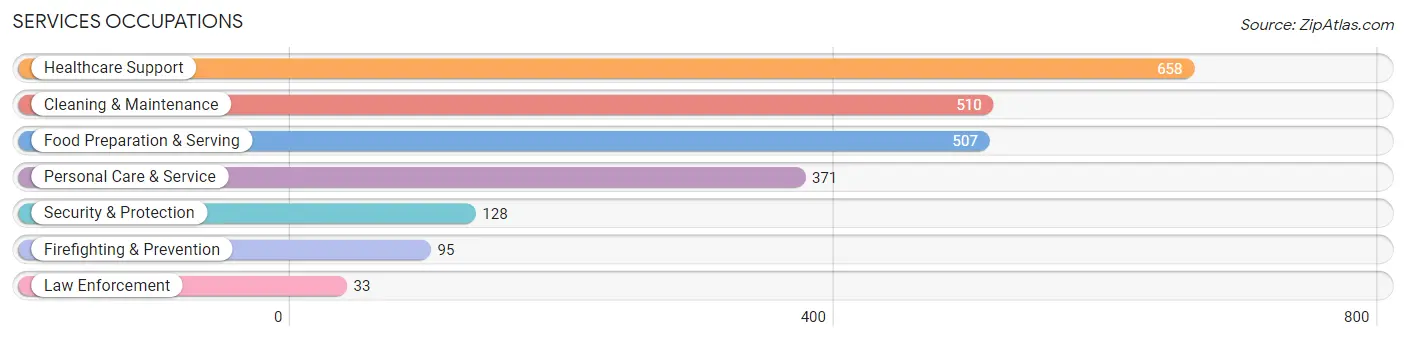
Services Occupations
The most common Services occupations in North Bay Shore are Healthcare Support (658 | 6.7%), Cleaning & Maintenance (510 | 5.2%), Food Preparation & Serving (507 | 5.2%), Personal Care & Service (371 | 3.8%), and Security & Protection (128 | 1.3%).
Services Occupations by Sex
Within the Services occupations in North Bay Shore, the most male-oriented occupations are Law Enforcement (100.0%), Cleaning & Maintenance (65.3%), and Security & Protection (54.7%), while the most female-oriented occupations are Healthcare Support (90.7%), Personal Care & Service (86.0%), and Food Preparation & Serving (70.2%).
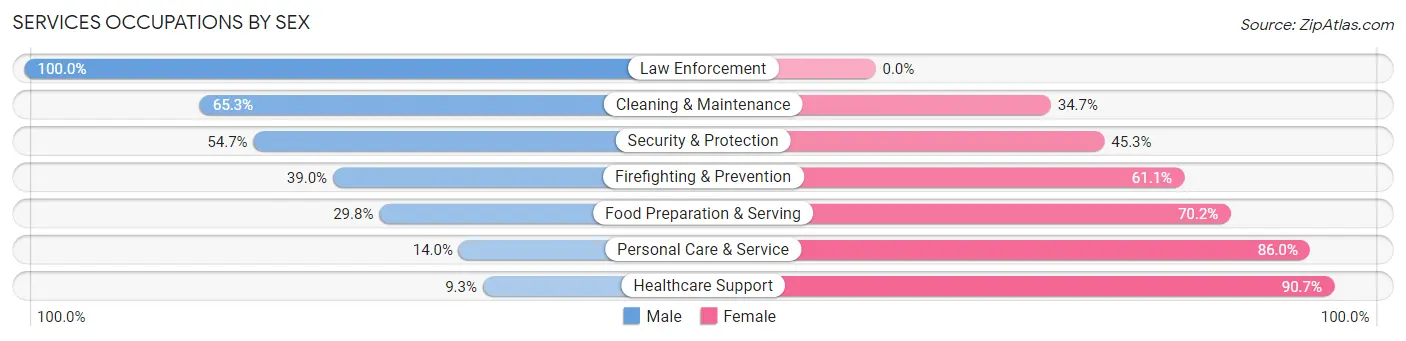
| Occupation | Male | Female |
| Healthcare Support | 61 (9.3%) | 597 (90.7%) |
| Security & Protection | 70 (54.7%) | 58 (45.3%) |
| Firefighting & Prevention | 37 (39.0%) | 58 (61.1%) |
| Law Enforcement | 33 (100.0%) | 0 (0.0%) |
| Food Preparation & Serving | 151 (29.8%) | 356 (70.2%) |
| Cleaning & Maintenance | 333 (65.3%) | 177 (34.7%) |
| Personal Care & Service | 52 (14.0%) | 319 (86.0%) |
| Total (Category) | 667 (30.7%) | 1,507 (69.3%) |
| Total (Overall) | 4,933 (50.4%) | 4,846 (49.6%) |
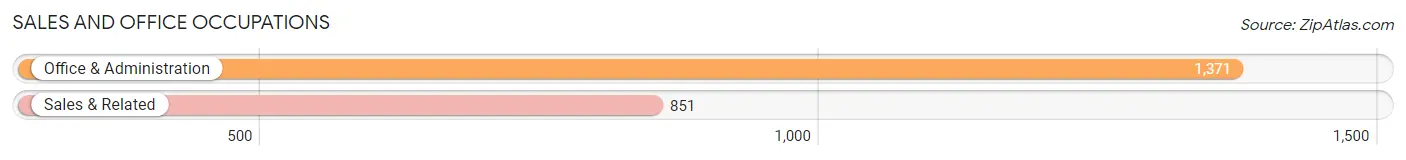
Sales and Office Occupations
The most common Sales and Office occupations in North Bay Shore are Office & Administration (1,371 | 14.0%), and Sales & Related (851 | 8.7%).
Sales and Office Occupations by Sex
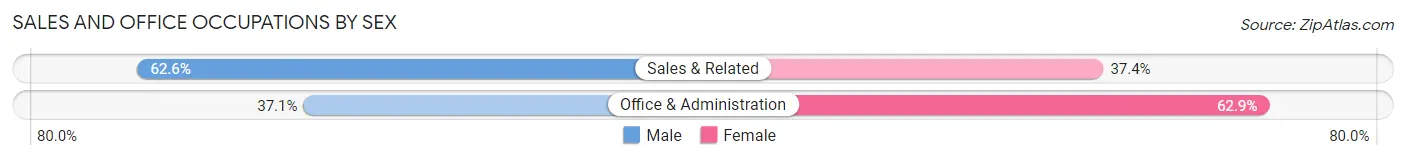
| Occupation | Male | Female |
| Sales & Related | 533 (62.6%) | 318 (37.4%) |
| Office & Administration | 509 (37.1%) | 862 (62.9%) |
| Total (Category) | 1,042 (46.9%) | 1,180 (53.1%) |
| Total (Overall) | 4,933 (50.4%) | 4,846 (49.6%) |
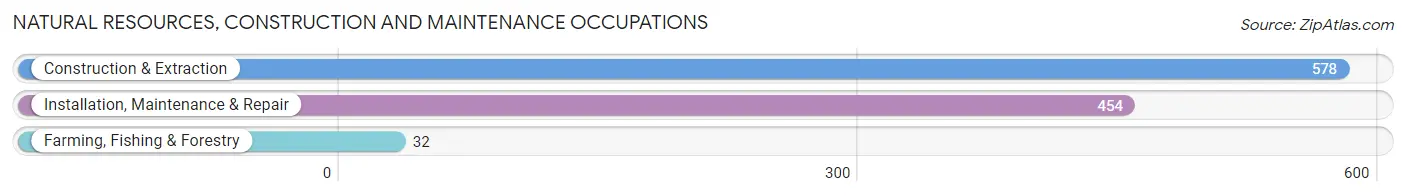
Natural Resources, Construction and Maintenance Occupations
The most common Natural Resources, Construction and Maintenance occupations in North Bay Shore are Construction & Extraction (578 | 5.9%), Installation, Maintenance & Repair (454 | 4.6%), and Farming, Fishing & Forestry (32 | 0.3%).
Natural Resources, Construction and Maintenance Occupations by Sex
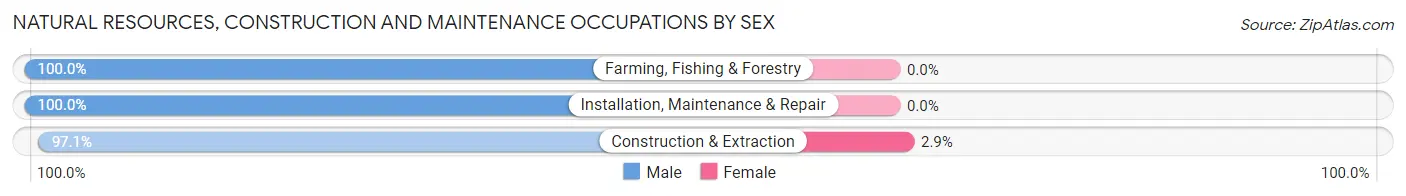
| Occupation | Male | Female |
| Farming, Fishing & Forestry | 32 (100.0%) | 0 (0.0%) |
| Construction & Extraction | 561 (97.1%) | 17 (2.9%) |
| Installation, Maintenance & Repair | 454 (100.0%) | 0 (0.0%) |
| Total (Category) | 1,047 (98.4%) | 17 (1.6%) |
| Total (Overall) | 4,933 (50.4%) | 4,846 (49.6%) |
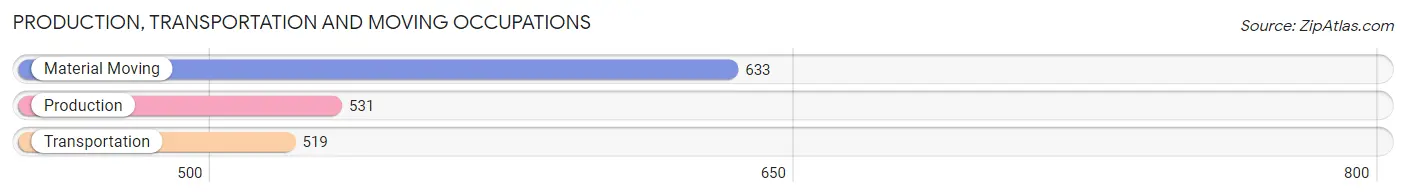
Production, Transportation and Moving Occupations
The most common Production, Transportation and Moving occupations in North Bay Shore are Material Moving (633 | 6.5%), Production (531 | 5.4%), and Transportation (519 | 5.3%).
Production, Transportation and Moving Occupations by Sex
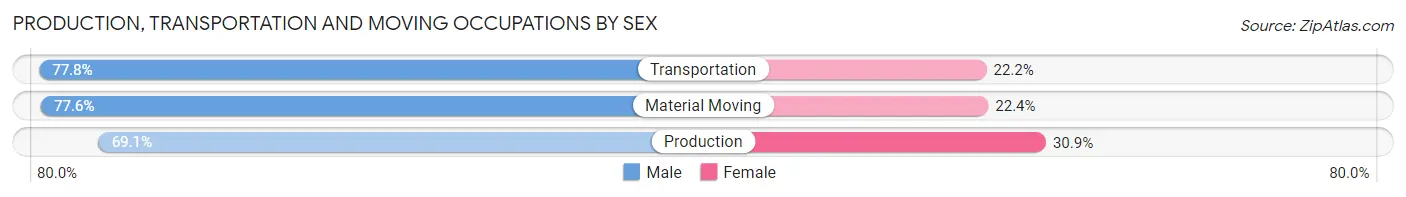
| Occupation | Male | Female |
| Production | 367 (69.1%) | 164 (30.9%) |
| Transportation | 404 (77.8%) | 115 (22.2%) |
| Material Moving | 491 (77.6%) | 142 (22.4%) |
| Total (Category) | 1,262 (75.0%) | 421 (25.0%) |
| Total (Overall) | 4,933 (50.4%) | 4,846 (49.6%) |
Employment Industries by Sex in North Bay Shore
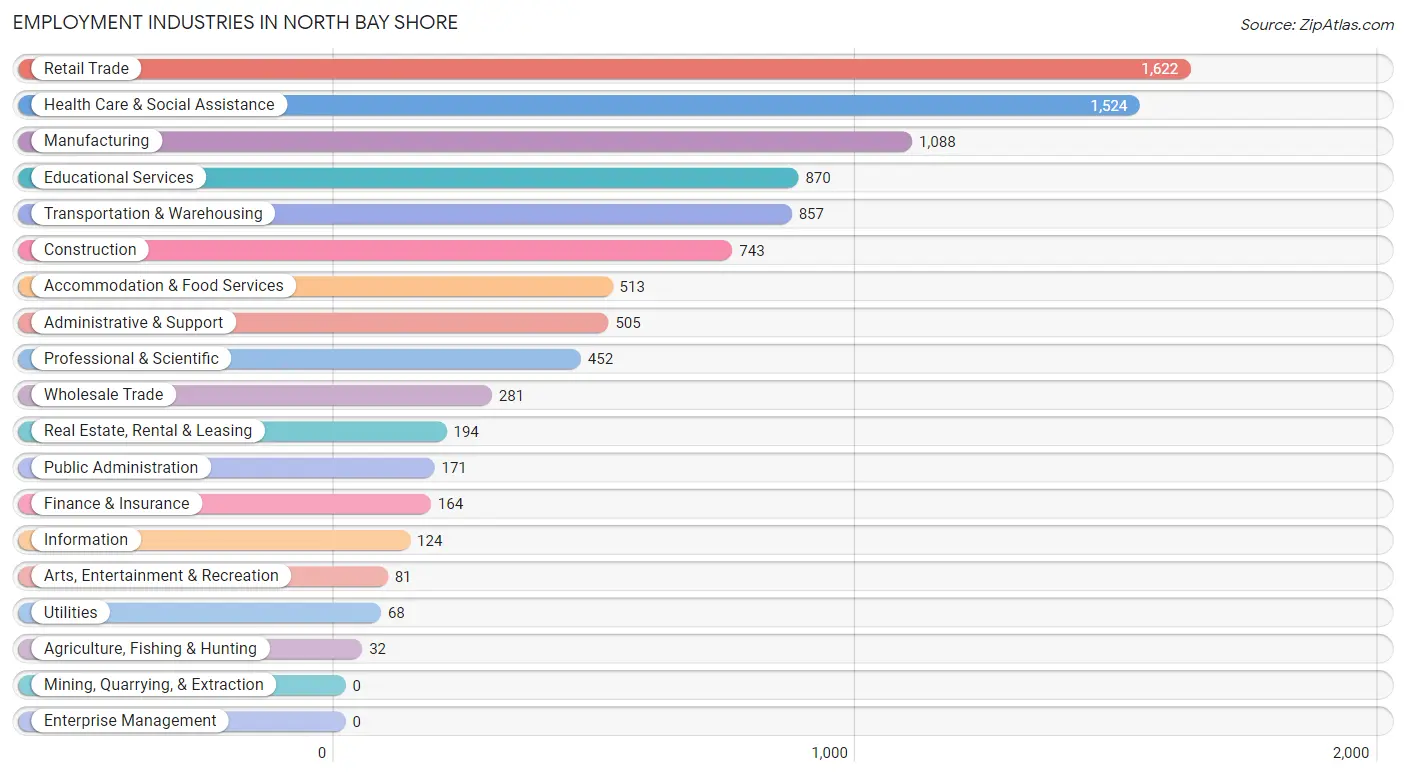
Employment Industries in North Bay Shore
The major employment industries in North Bay Shore include Retail Trade (1,622 | 16.6%), Health Care & Social Assistance (1,524 | 15.6%), Manufacturing (1,088 | 11.1%), Educational Services (870 | 8.9%), and Transportation & Warehousing (857 | 8.8%).
Employment Industries by Sex in North Bay Shore
The North Bay Shore industries that see more men than women are Agriculture, Fishing & Hunting (100.0%), Real Estate, Rental & Leasing (85.1%), and Construction (83.7%), whereas the industries that tend to have a higher number of women are Arts, Entertainment & Recreation (98.8%), Professional & Scientific (85.0%), and Health Care & Social Assistance (78.8%).
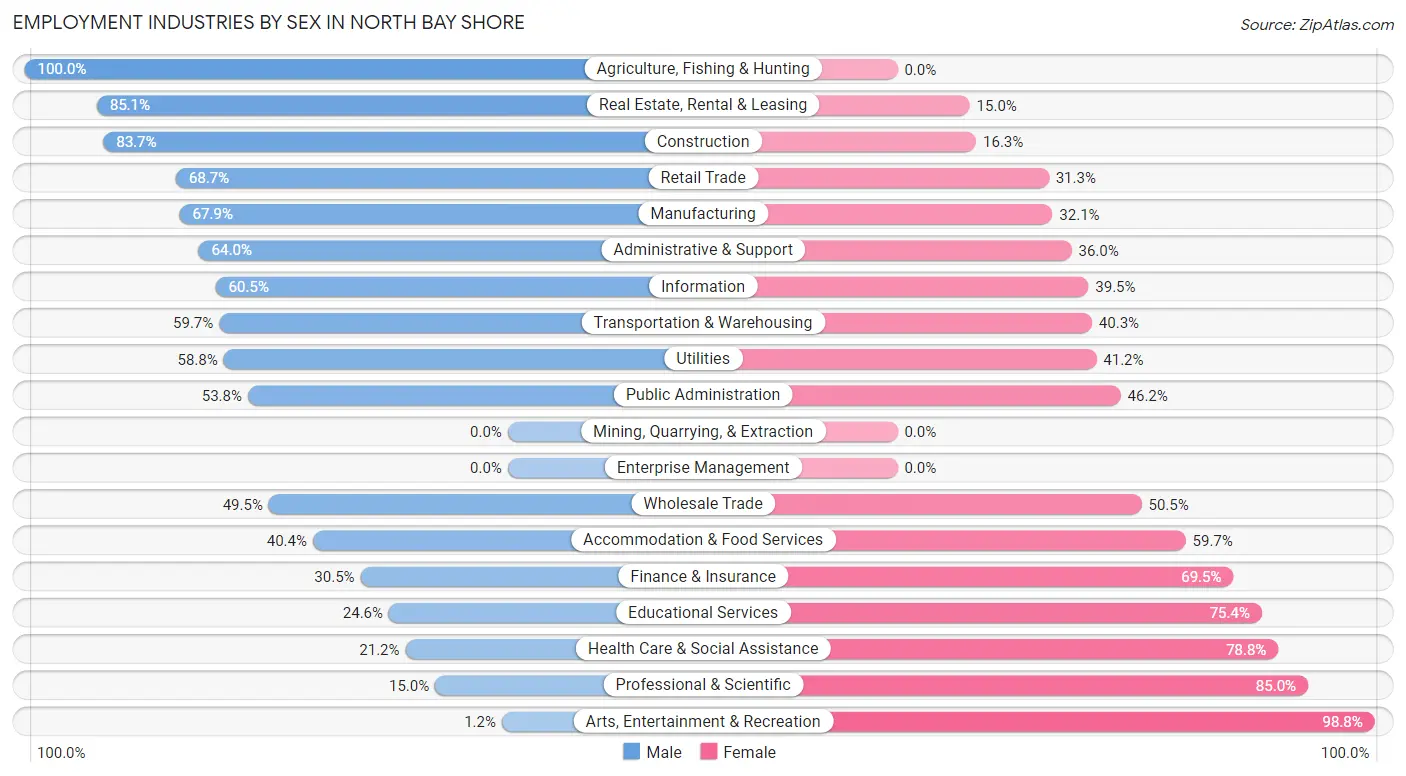
| Industry | Male | Female |
| Agriculture, Fishing & Hunting | 32 (100.0%) | 0 (0.0%) |
| Mining, Quarrying, & Extraction | 0 (0.0%) | 0 (0.0%) |
| Construction | 622 (83.7%) | 121 (16.3%) |
| Manufacturing | 739 (67.9%) | 349 (32.1%) |
| Wholesale Trade | 139 (49.5%) | 142 (50.5%) |
| Retail Trade | 1,114 (68.7%) | 508 (31.3%) |
| Transportation & Warehousing | 512 (59.7%) | 345 (40.3%) |
| Utilities | 40 (58.8%) | 28 (41.2%) |
| Information | 75 (60.5%) | 49 (39.5%) |
| Finance & Insurance | 50 (30.5%) | 114 (69.5%) |
| Real Estate, Rental & Leasing | 165 (85.1%) | 29 (14.9%) |
| Professional & Scientific | 68 (15.0%) | 384 (85.0%) |
| Enterprise Management | 0 (0.0%) | 0 (0.0%) |
| Administrative & Support | 323 (64.0%) | 182 (36.0%) |
| Educational Services | 214 (24.6%) | 656 (75.4%) |
| Health Care & Social Assistance | 323 (21.2%) | 1,201 (78.8%) |
| Arts, Entertainment & Recreation | 1 (1.2%) | 80 (98.8%) |
| Accommodation & Food Services | 207 (40.4%) | 306 (59.7%) |
| Public Administration | 92 (53.8%) | 79 (46.2%) |
| Total | 4,933 (50.4%) | 4,846 (49.6%) |
Education in North Bay Shore
School Enrollment in North Bay Shore
The most common levels of schooling among the 4,570 students in North Bay Shore are elementary school (1,142 | 25.0%), middle school (977 | 21.4%), and college / undergraduate (977 | 21.4%).
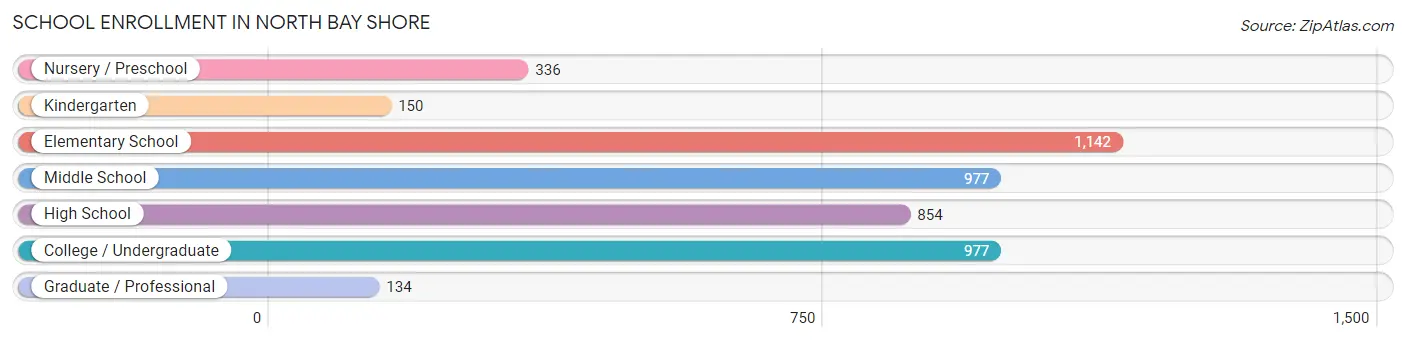
| School Level | # Students | % Students |
| Nursery / Preschool | 336 | 7.3% |
| Kindergarten | 150 | 3.3% |
| Elementary School | 1,142 | 25.0% |
| Middle School | 977 | 21.4% |
| High School | 854 | 18.7% |
| College / Undergraduate | 977 | 21.4% |
| Graduate / Professional | 134 | 2.9% |
| Total | 4,570 | 100.0% |
School Enrollment by Age by Funding Source in North Bay Shore
Out of a total of 4,570 students who are enrolled in schools in North Bay Shore, 489 (10.7%) attend a private institution, while the remaining 4,081 (89.3%) are enrolled in public schools. The age group of 20 to 24 year olds has the highest likelihood of being enrolled in private schools, with 160 (39.3% in the age bracket) enrolled. Conversely, the age group of 15 to 17 year olds has the lowest likelihood of being enrolled in a private school, with 345 (100.0% in the age bracket) attending a public institution.
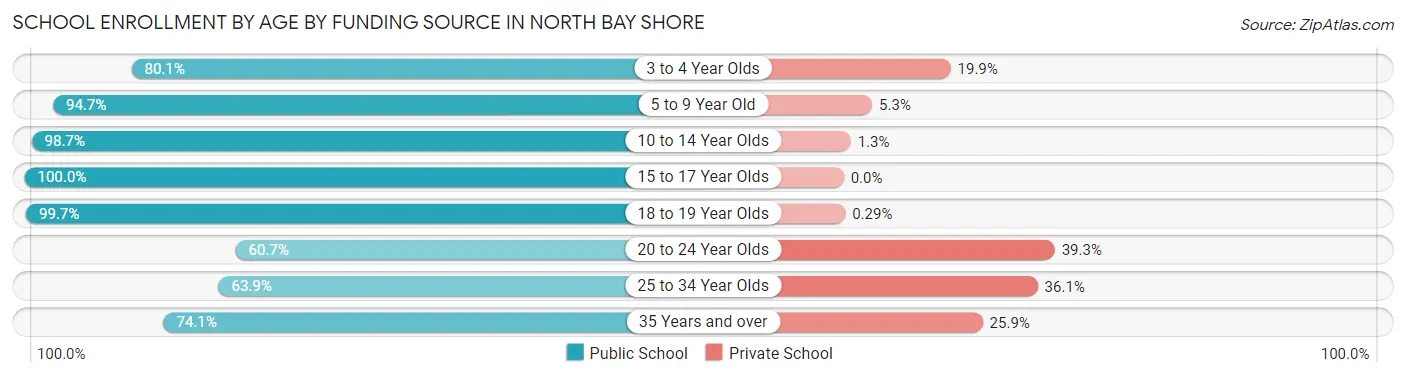
| Age Bracket | Public School | Private School |
| 3 to 4 Year Olds | 205 (80.1%) | 51 (19.9%) |
| 5 to 9 Year Old | 1,266 (94.7%) | 71 (5.3%) |
| 10 to 14 Year Olds | 1,279 (98.7%) | 17 (1.3%) |
| 15 to 17 Year Olds | 345 (100.0%) | 0 (0.0%) |
| 18 to 19 Year Olds | 349 (99.7%) | 1 (0.3%) |
| 20 to 24 Year Olds | 247 (60.7%) | 160 (39.3%) |
| 25 to 34 Year Olds | 244 (63.9%) | 138 (36.1%) |
| 35 Years and over | 146 (74.1%) | 51 (25.9%) |
| Total | 4,081 (89.3%) | 489 (10.7%) |
Educational Attainment by Field of Study in North Bay Shore
Business (394 | 21.4%), education (248 | 13.5%), arts & humanities (241 | 13.1%), science & technology (176 | 9.6%), and social sciences (156 | 8.5%) are the most common fields of study among 1,837 individuals in North Bay Shore who have obtained a bachelor's degree or higher.
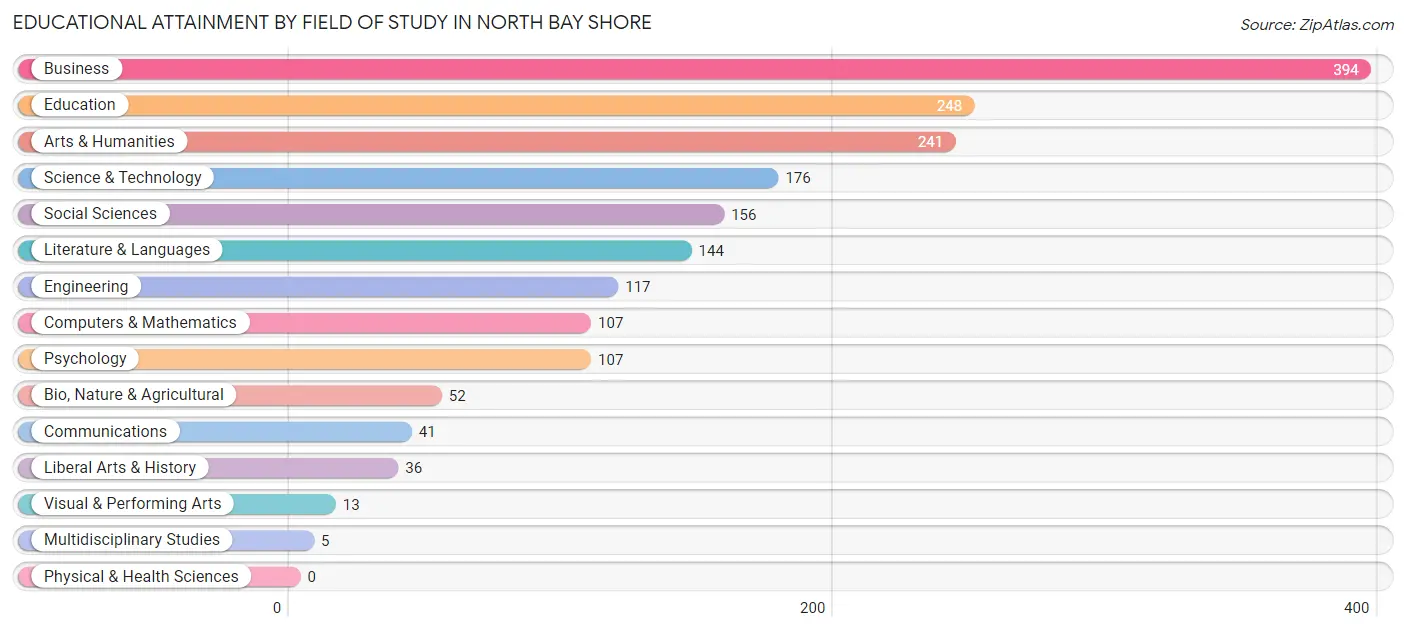
| Field of Study | # Graduates | % Graduates |
| Computers & Mathematics | 107 | 5.8% |
| Bio, Nature & Agricultural | 52 | 2.8% |
| Physical & Health Sciences | 0 | 0.0% |
| Psychology | 107 | 5.8% |
| Social Sciences | 156 | 8.5% |
| Engineering | 117 | 6.4% |
| Multidisciplinary Studies | 5 | 0.3% |
| Science & Technology | 176 | 9.6% |
| Business | 394 | 21.4% |
| Education | 248 | 13.5% |
| Literature & Languages | 144 | 7.8% |
| Liberal Arts & History | 36 | 2.0% |
| Visual & Performing Arts | 13 | 0.7% |
| Communications | 41 | 2.2% |
| Arts & Humanities | 241 | 13.1% |
| Total | 1,837 | 100.0% |
Transportation & Commute in North Bay Shore
Vehicle Availability by Sex in North Bay Shore
The most prevalent vehicle ownership categories in North Bay Shore are males with 3 vehicles (1,320, accounting for 27.4%) and females with 3 vehicles (937, making up 28.1%).
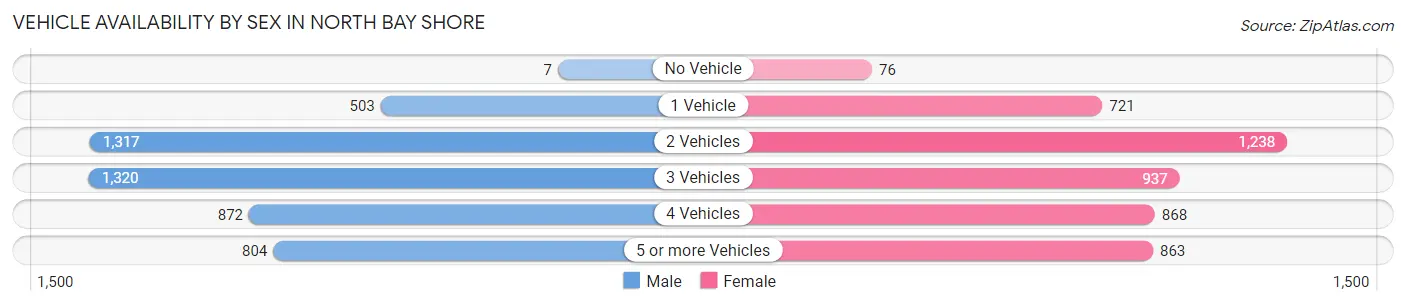
| Vehicles Available | Male | Female |
| No Vehicle | 7 (0.2%) | 76 (1.6%) |
| 1 Vehicle | 503 (10.4%) | 721 (15.3%) |
| 2 Vehicles | 1,317 (27.3%) | 1,238 (26.3%) |
| 3 Vehicles | 1,320 (27.4%) | 937 (19.9%) |
| 4 Vehicles | 872 (18.1%) | 868 (18.5%) |
| 5 or more Vehicles | 804 (16.7%) | 863 (18.3%) |
| Total | 4,823 (100.0%) | 4,703 (100.0%) |
Commute Time in North Bay Shore
The most frequently occuring commute durations in North Bay Shore are 20 to 24 minutes (1,820 commuters, 19.5%), 10 to 14 minutes (1,565 commuters, 16.8%), and 15 to 19 minutes (1,343 commuters, 14.4%).
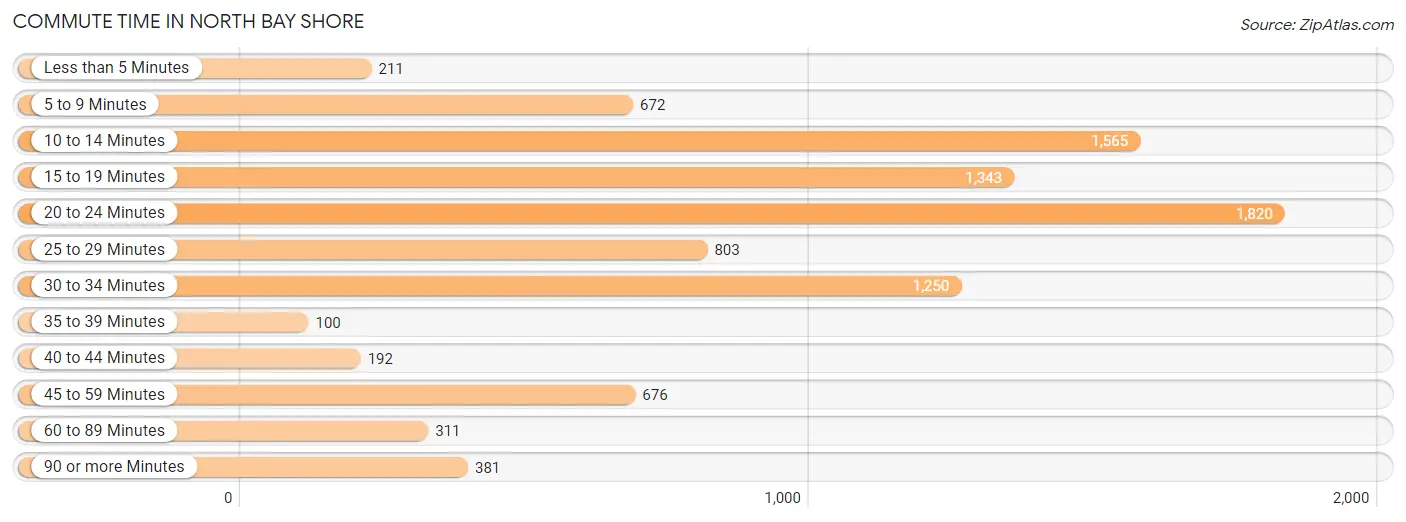
| Commute Time | # Commuters | % Commuters |
| Less than 5 Minutes | 211 | 2.3% |
| 5 to 9 Minutes | 672 | 7.2% |
| 10 to 14 Minutes | 1,565 | 16.8% |
| 15 to 19 Minutes | 1,343 | 14.4% |
| 20 to 24 Minutes | 1,820 | 19.5% |
| 25 to 29 Minutes | 803 | 8.6% |
| 30 to 34 Minutes | 1,250 | 13.4% |
| 35 to 39 Minutes | 100 | 1.1% |
| 40 to 44 Minutes | 192 | 2.1% |
| 45 to 59 Minutes | 676 | 7.2% |
| 60 to 89 Minutes | 311 | 3.3% |
| 90 or more Minutes | 381 | 4.1% |
Commute Time by Sex in North Bay Shore
The most common commute times in North Bay Shore are 20 to 24 minutes (1,029 commuters, 21.6%) for males and 20 to 24 minutes (791 commuters, 17.3%) for females.
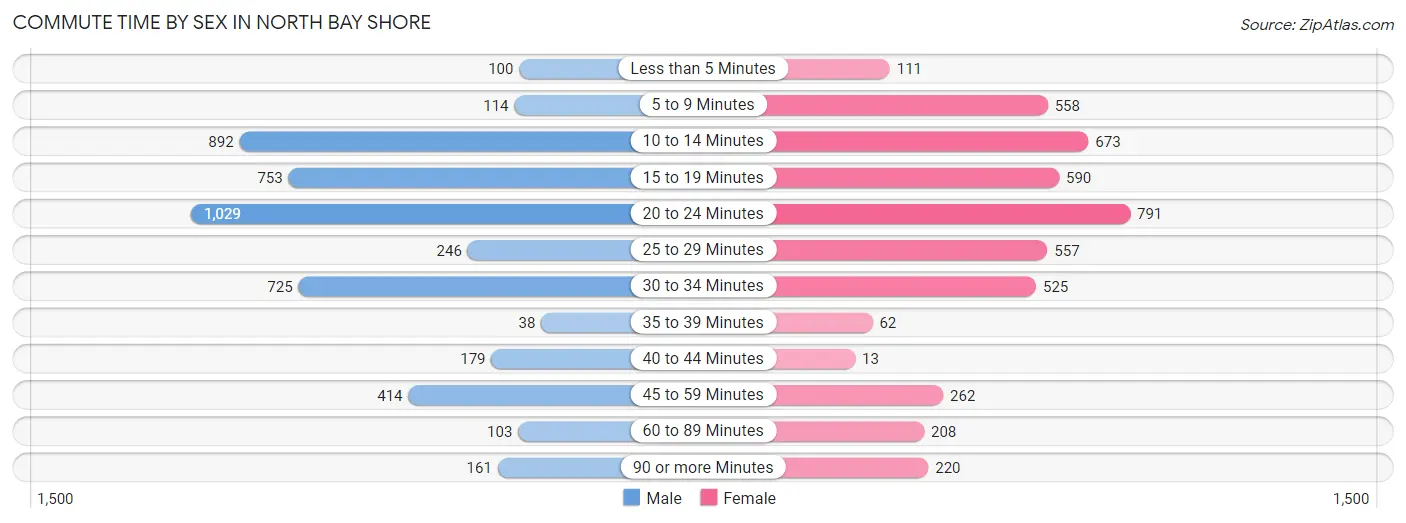
| Commute Time | Male | Female |
| Less than 5 Minutes | 100 (2.1%) | 111 (2.4%) |
| 5 to 9 Minutes | 114 (2.4%) | 558 (12.2%) |
| 10 to 14 Minutes | 892 (18.8%) | 673 (14.7%) |
| 15 to 19 Minutes | 753 (15.8%) | 590 (12.9%) |
| 20 to 24 Minutes | 1,029 (21.6%) | 791 (17.3%) |
| 25 to 29 Minutes | 246 (5.2%) | 557 (12.2%) |
| 30 to 34 Minutes | 725 (15.2%) | 525 (11.5%) |
| 35 to 39 Minutes | 38 (0.8%) | 62 (1.4%) |
| 40 to 44 Minutes | 179 (3.8%) | 13 (0.3%) |
| 45 to 59 Minutes | 414 (8.7%) | 262 (5.7%) |
| 60 to 89 Minutes | 103 (2.2%) | 208 (4.5%) |
| 90 or more Minutes | 161 (3.4%) | 220 (4.8%) |
Time of Departure to Work by Sex in North Bay Shore
The most frequent times of departure to work in North Bay Shore are 7:00 AM to 7:29 AM (1,284, 27.0%) for males and 7:00 AM to 7:29 AM (1,142, 25.0%) for females.
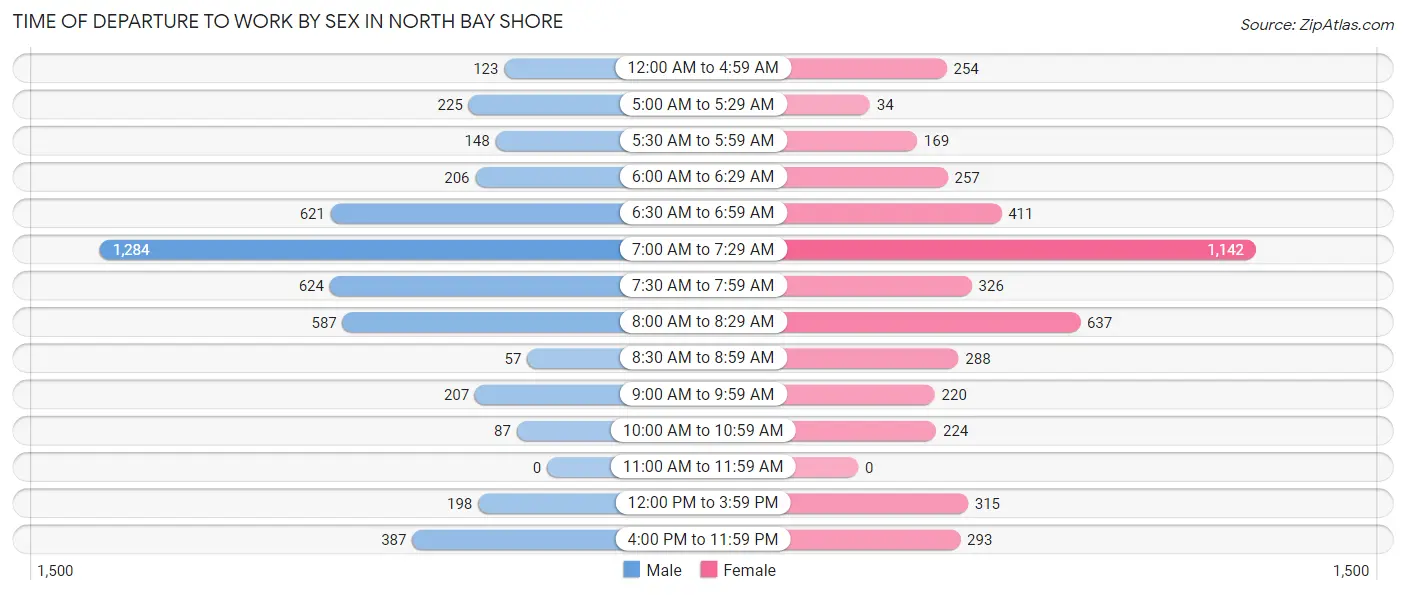
| Time of Departure | Male | Female |
| 12:00 AM to 4:59 AM | 123 (2.6%) | 254 (5.6%) |
| 5:00 AM to 5:29 AM | 225 (4.7%) | 34 (0.7%) |
| 5:30 AM to 5:59 AM | 148 (3.1%) | 169 (3.7%) |
| 6:00 AM to 6:29 AM | 206 (4.3%) | 257 (5.6%) |
| 6:30 AM to 6:59 AM | 621 (13.1%) | 411 (9.0%) |
| 7:00 AM to 7:29 AM | 1,284 (27.0%) | 1,142 (25.0%) |
| 7:30 AM to 7:59 AM | 624 (13.1%) | 326 (7.1%) |
| 8:00 AM to 8:29 AM | 587 (12.3%) | 637 (13.9%) |
| 8:30 AM to 8:59 AM | 57 (1.2%) | 288 (6.3%) |
| 9:00 AM to 9:59 AM | 207 (4.3%) | 220 (4.8%) |
| 10:00 AM to 10:59 AM | 87 (1.8%) | 224 (4.9%) |
| 11:00 AM to 11:59 AM | 0 (0.0%) | 0 (0.0%) |
| 12:00 PM to 3:59 PM | 198 (4.2%) | 315 (6.9%) |
| 4:00 PM to 11:59 PM | 387 (8.1%) | 293 (6.4%) |
| Total | 4,754 (100.0%) | 4,570 (100.0%) |
Housing Occupancy in North Bay Shore
Occupancy by Ownership in North Bay Shore
Of the total 4,401 dwellings in North Bay Shore, owner-occupied units account for 3,435 (78.0%), while renter-occupied units make up 966 (22.0%).
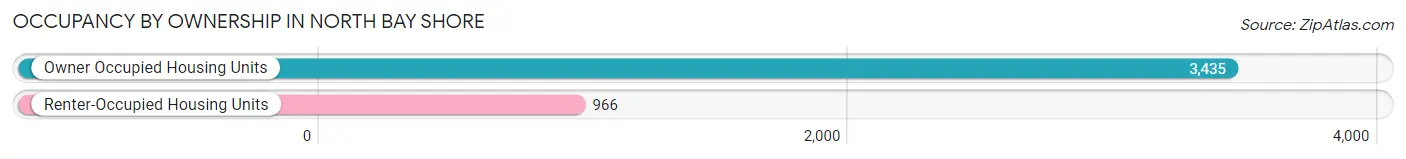
| Occupancy | # Housing Units | % Housing Units |
| Owner Occupied Housing Units | 3,435 | 78.0% |
| Renter-Occupied Housing Units | 966 | 22.0% |
| Total Occupied Housing Units | 4,401 | 100.0% |
Occupancy by Household Size in North Bay Shore
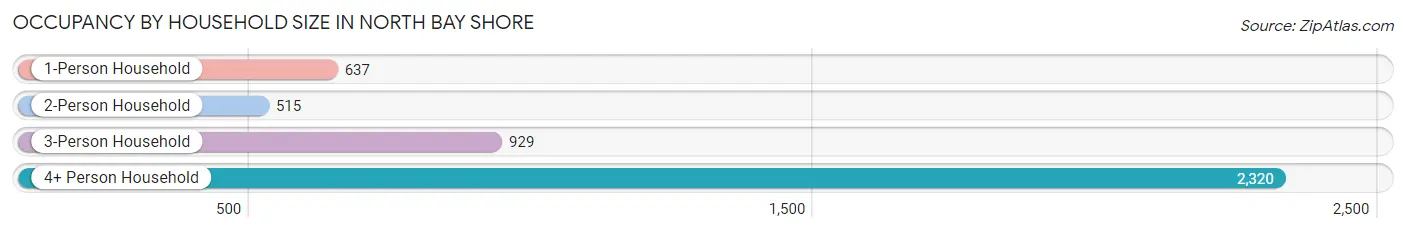
| Household Size | # Housing Units | % Housing Units |
| 1-Person Household | 637 | 14.5% |
| 2-Person Household | 515 | 11.7% |
| 3-Person Household | 929 | 21.1% |
| 4+ Person Household | 2,320 | 52.7% |
| Total Housing Units | 4,401 | 100.0% |
Occupancy by Ownership by Household Size in North Bay Shore
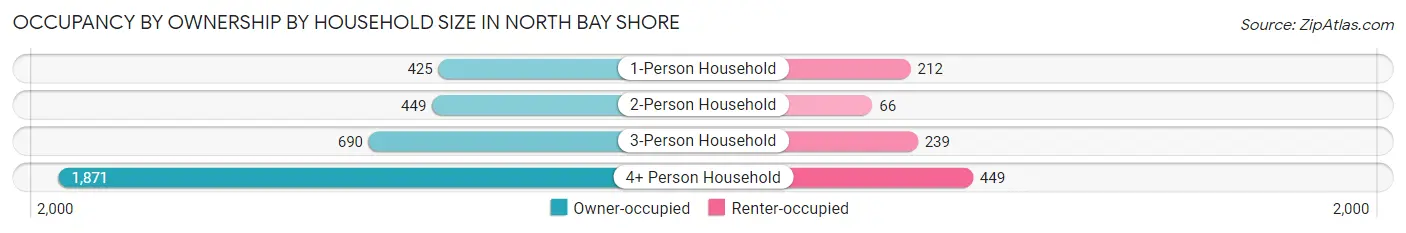
| Household Size | Owner-occupied | Renter-occupied |
| 1-Person Household | 425 (66.7%) | 212 (33.3%) |
| 2-Person Household | 449 (87.2%) | 66 (12.8%) |
| 3-Person Household | 690 (74.3%) | 239 (25.7%) |
| 4+ Person Household | 1,871 (80.6%) | 449 (19.4%) |
| Total Housing Units | 3,435 (78.0%) | 966 (22.0%) |
Occupancy by Educational Attainment in North Bay Shore
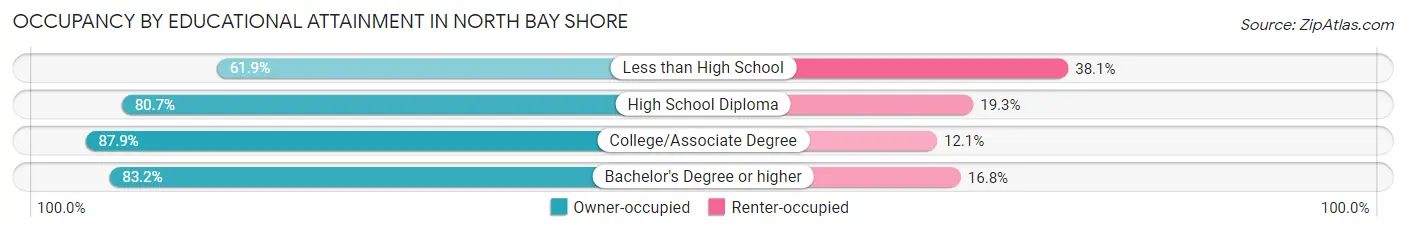
| Household Size | Owner-occupied | Renter-occupied |
| Less than High School | 676 (61.9%) | 416 (38.1%) |
| High School Diploma | 1,350 (80.7%) | 322 (19.3%) |
| College/Associate Degree | 874 (87.9%) | 120 (12.1%) |
| Bachelor's Degree or higher | 535 (83.2%) | 108 (16.8%) |
Occupancy by Age of Householder in North Bay Shore
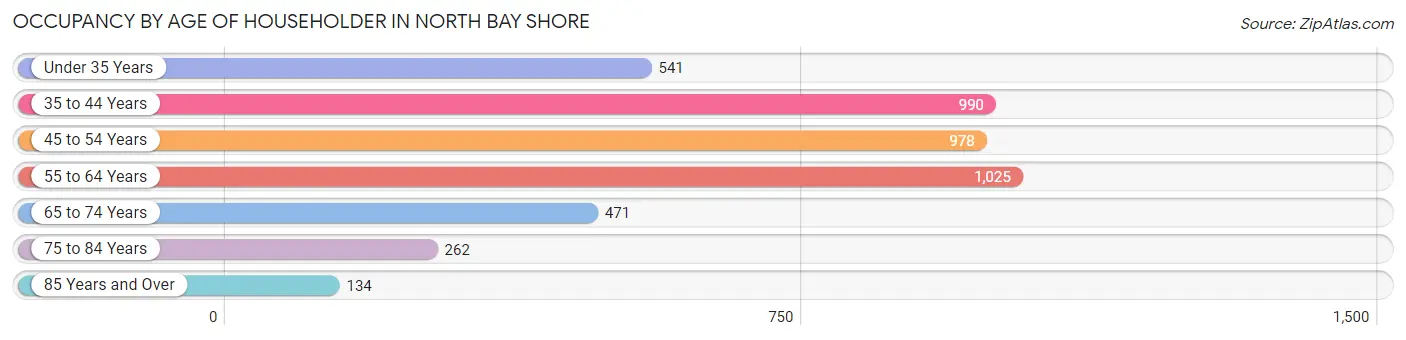
| Age Bracket | # Households | % Households |
| Under 35 Years | 541 | 12.3% |
| 35 to 44 Years | 990 | 22.5% |
| 45 to 54 Years | 978 | 22.2% |
| 55 to 64 Years | 1,025 | 23.3% |
| 65 to 74 Years | 471 | 10.7% |
| 75 to 84 Years | 262 | 5.9% |
| 85 Years and Over | 134 | 3.0% |
| Total | 4,401 | 100.0% |
Housing Finances in North Bay Shore
Median Income by Occupancy in North Bay Shore
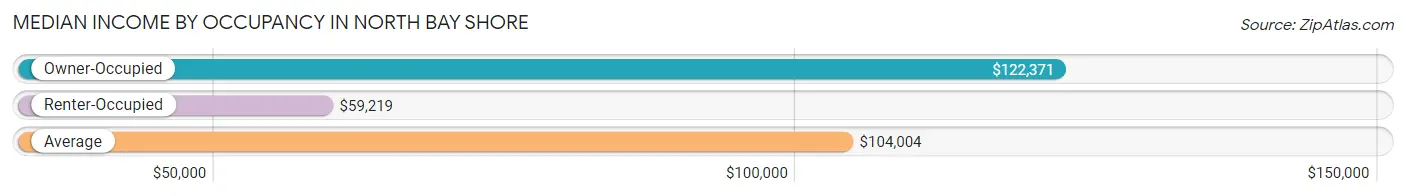
| Occupancy Type | # Households | Median Income |
| Owner-Occupied | 3,435 (78.0%) | $122,371 |
| Renter-Occupied | 966 (22.0%) | $59,219 |
| Average | 4,401 (100.0%) | $104,004 |
Occupancy by Householder Income Bracket in North Bay Shore
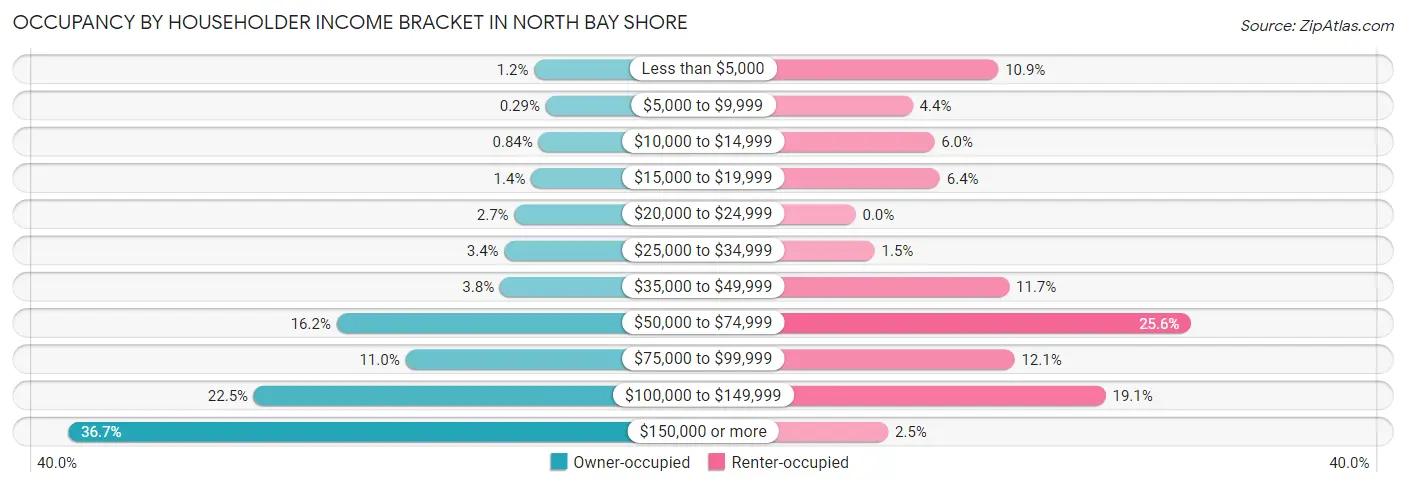
| Income Bracket | Owner-occupied | Renter-occupied |
| Less than $5,000 | 40 (1.2%) | 105 (10.9%) |
| $5,000 to $9,999 | 10 (0.3%) | 42 (4.3%) |
| $10,000 to $14,999 | 29 (0.8%) | 58 (6.0%) |
| $15,000 to $19,999 | 48 (1.4%) | 62 (6.4%) |
| $20,000 to $24,999 | 92 (2.7%) | 0 (0.0%) |
| $25,000 to $34,999 | 118 (3.4%) | 14 (1.5%) |
| $35,000 to $49,999 | 130 (3.8%) | 113 (11.7%) |
| $50,000 to $74,999 | 557 (16.2%) | 247 (25.6%) |
| $75,000 to $99,999 | 377 (11.0%) | 117 (12.1%) |
| $100,000 to $149,999 | 774 (22.5%) | 184 (19.1%) |
| $150,000 or more | 1,260 (36.7%) | 24 (2.5%) |
| Total | 3,435 (100.0%) | 966 (100.0%) |
Monthly Housing Cost Tiers in North Bay Shore
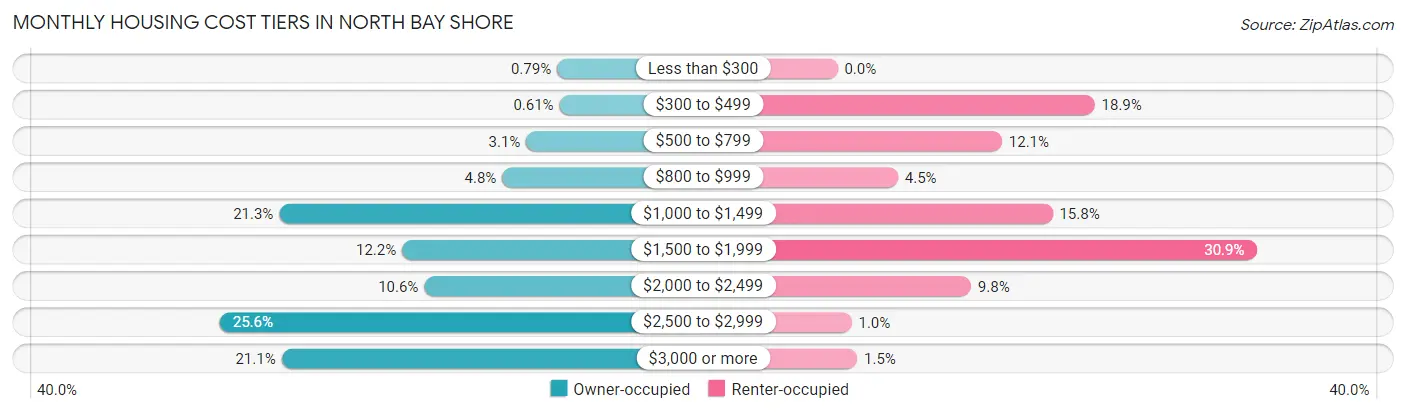
| Monthly Cost | Owner-occupied | Renter-occupied |
| Less than $300 | 27 (0.8%) | 0 (0.0%) |
| $300 to $499 | 21 (0.6%) | 183 (18.9%) |
| $500 to $799 | 105 (3.1%) | 117 (12.1%) |
| $800 to $999 | 166 (4.8%) | 43 (4.4%) |
| $1,000 to $1,499 | 730 (21.2%) | 153 (15.8%) |
| $1,500 to $1,999 | 419 (12.2%) | 298 (30.8%) |
| $2,000 to $2,499 | 363 (10.6%) | 95 (9.8%) |
| $2,500 to $2,999 | 880 (25.6%) | 10 (1.0%) |
| $3,000 or more | 724 (21.1%) | 14 (1.5%) |
| Total | 3,435 (100.0%) | 966 (100.0%) |
Physical Housing Characteristics in North Bay Shore
Housing Structures in North Bay Shore
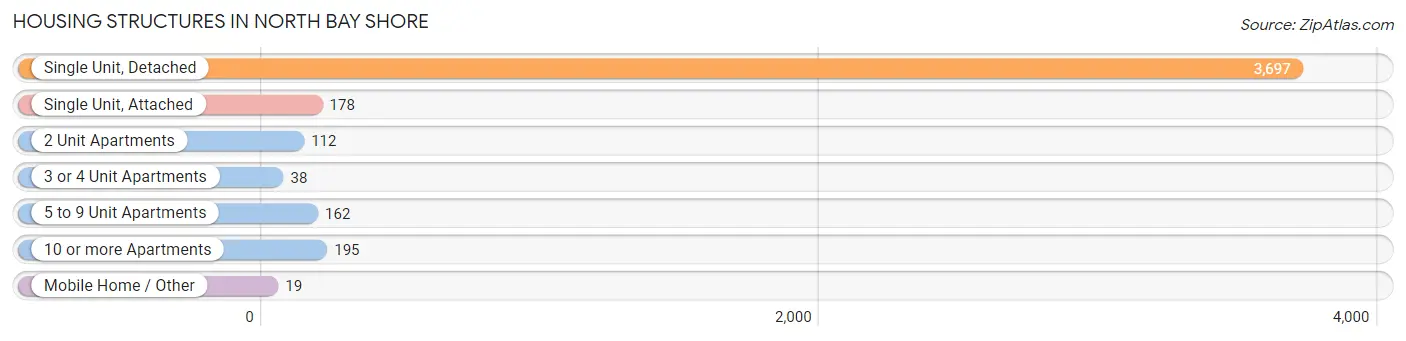
| Structure Type | # Housing Units | % Housing Units |
| Single Unit, Detached | 3,697 | 84.0% |
| Single Unit, Attached | 178 | 4.0% |
| 2 Unit Apartments | 112 | 2.5% |
| 3 or 4 Unit Apartments | 38 | 0.9% |
| 5 to 9 Unit Apartments | 162 | 3.7% |
| 10 or more Apartments | 195 | 4.4% |
| Mobile Home / Other | 19 | 0.4% |
| Total | 4,401 | 100.0% |
Housing Structures by Occupancy in North Bay Shore
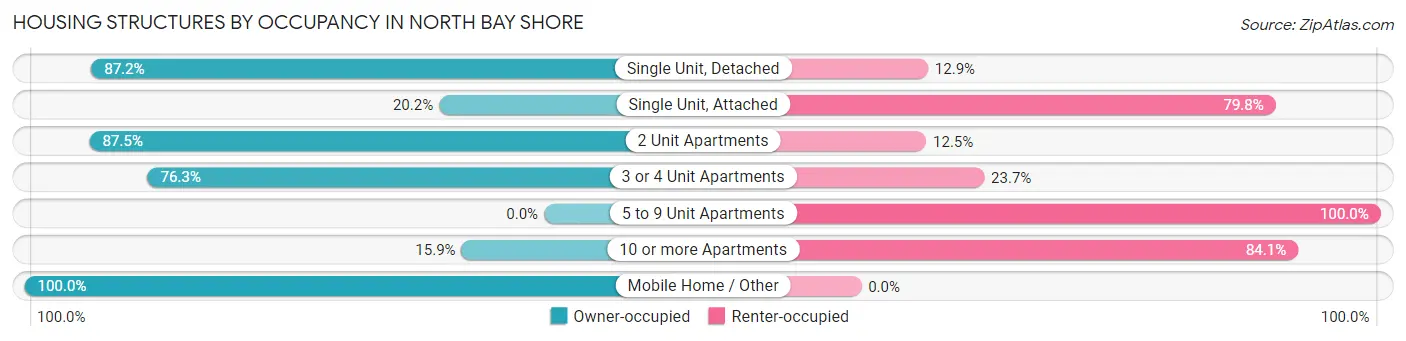
| Structure Type | Owner-occupied | Renter-occupied |
| Single Unit, Detached | 3,222 (87.2%) | 475 (12.9%) |
| Single Unit, Attached | 36 (20.2%) | 142 (79.8%) |
| 2 Unit Apartments | 98 (87.5%) | 14 (12.5%) |
| 3 or 4 Unit Apartments | 29 (76.3%) | 9 (23.7%) |
| 5 to 9 Unit Apartments | 0 (0.0%) | 162 (100.0%) |
| 10 or more Apartments | 31 (15.9%) | 164 (84.1%) |
| Mobile Home / Other | 19 (100.0%) | 0 (0.0%) |
| Total | 3,435 (78.0%) | 966 (22.0%) |
Housing Structures by Number of Rooms in North Bay Shore
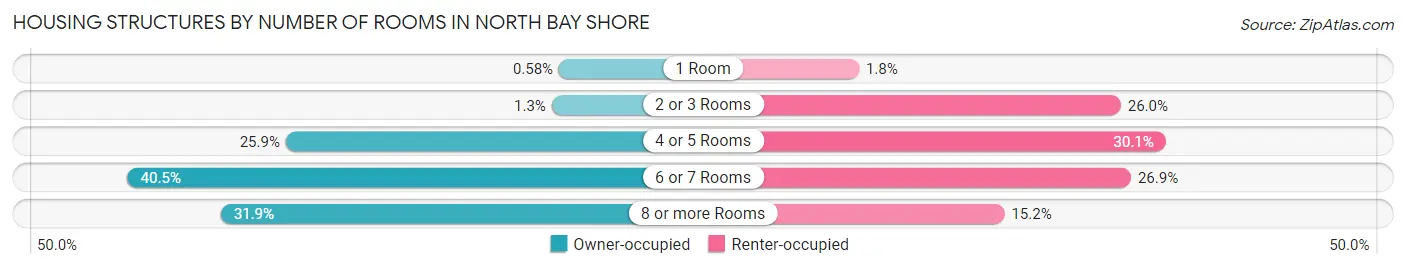
| Number of Rooms | Owner-occupied | Renter-occupied |
| 1 Room | 20 (0.6%) | 17 (1.8%) |
| 2 or 3 Rooms | 43 (1.3%) | 251 (26.0%) |
| 4 or 5 Rooms | 888 (25.9%) | 291 (30.1%) |
| 6 or 7 Rooms | 1,390 (40.5%) | 260 (26.9%) |
| 8 or more Rooms | 1,094 (31.9%) | 147 (15.2%) |
| Total | 3,435 (100.0%) | 966 (100.0%) |
Housing Structure by Heating Type in North Bay Shore
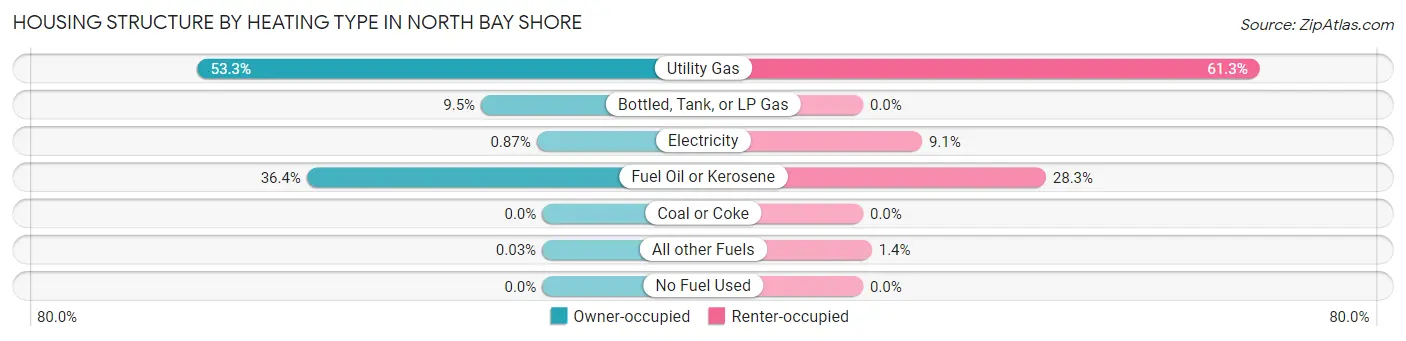
| Heating Type | Owner-occupied | Renter-occupied |
| Utility Gas | 1,829 (53.2%) | 592 (61.3%) |
| Bottled, Tank, or LP Gas | 325 (9.5%) | 0 (0.0%) |
| Electricity | 30 (0.9%) | 88 (9.1%) |
| Fuel Oil or Kerosene | 1,250 (36.4%) | 273 (28.3%) |
| Coal or Coke | 0 (0.0%) | 0 (0.0%) |
| All other Fuels | 1 (0.0%) | 13 (1.3%) |
| No Fuel Used | 0 (0.0%) | 0 (0.0%) |
| Total | 3,435 (100.0%) | 966 (100.0%) |
Household Vehicle Usage in North Bay Shore
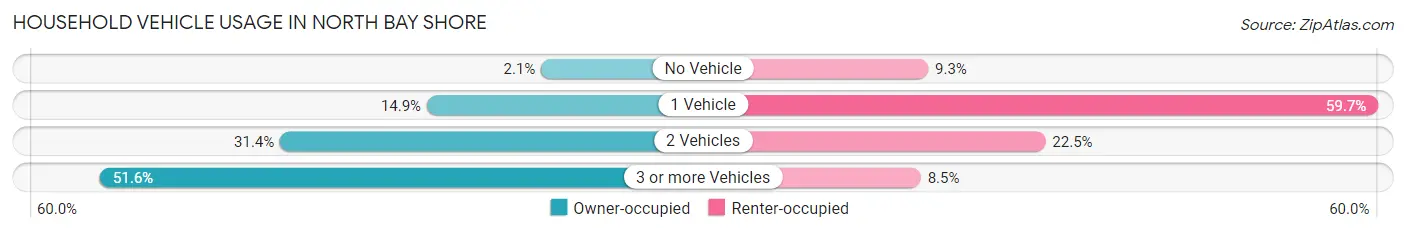
| Vehicles per Household | Owner-occupied | Renter-occupied |
| No Vehicle | 73 (2.1%) | 90 (9.3%) |
| 1 Vehicle | 513 (14.9%) | 577 (59.7%) |
| 2 Vehicles | 1,078 (31.4%) | 217 (22.5%) |
| 3 or more Vehicles | 1,771 (51.6%) | 82 (8.5%) |
| Total | 3,435 (100.0%) | 966 (100.0%) |
Real Estate & Mortgages in North Bay Shore
Real Estate and Mortgage Overview in North Bay Shore
| Characteristic | Without Mortgage | With Mortgage |
| Housing Units | 960 | 2,475 |
| Median Property Value | $402,700 | $390,200 |
| Median Household Income | $105,278 | $904 |
| Monthly Housing Costs | $1,244 | $724 |
| Real Estate Taxes | $8,468 | $151 |
Property Value by Mortgage Status in North Bay Shore
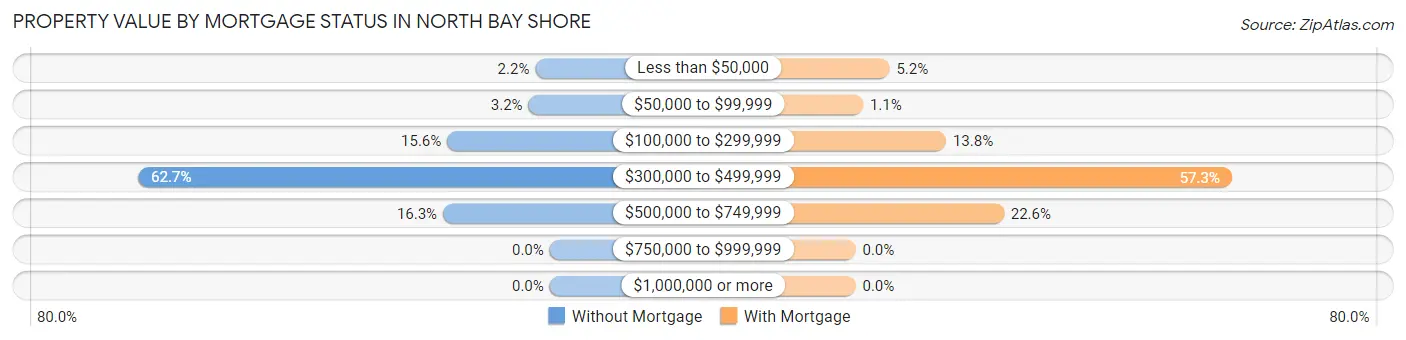
| Property Value | Without Mortgage | With Mortgage |
| Less than $50,000 | 21 (2.2%) | 128 (5.2%) |
| $50,000 to $99,999 | 31 (3.2%) | 28 (1.1%) |
| $100,000 to $299,999 | 150 (15.6%) | 341 (13.8%) |
| $300,000 to $499,999 | 602 (62.7%) | 1,419 (57.3%) |
| $500,000 to $749,999 | 156 (16.3%) | 559 (22.6%) |
| $750,000 to $999,999 | 0 (0.0%) | 0 (0.0%) |
| $1,000,000 or more | 0 (0.0%) | 0 (0.0%) |
| Total | 960 (100.0%) | 2,475 (100.0%) |
Household Income by Mortgage Status in North Bay Shore
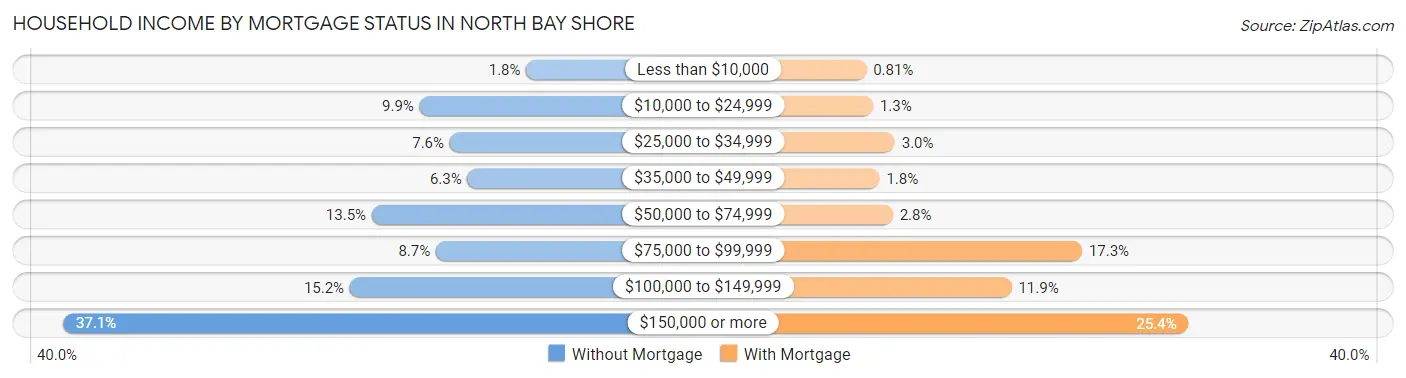
| Household Income | Without Mortgage | With Mortgage |
| Less than $10,000 | 17 (1.8%) | 20 (0.8%) |
| $10,000 to $24,999 | 95 (9.9%) | 33 (1.3%) |
| $25,000 to $34,999 | 73 (7.6%) | 74 (3.0%) |
| $35,000 to $49,999 | 60 (6.2%) | 45 (1.8%) |
| $50,000 to $74,999 | 130 (13.5%) | 70 (2.8%) |
| $75,000 to $99,999 | 83 (8.6%) | 427 (17.2%) |
| $100,000 to $149,999 | 146 (15.2%) | 294 (11.9%) |
| $150,000 or more | 356 (37.1%) | 628 (25.4%) |
| Total | 960 (100.0%) | 2,475 (100.0%) |
Property Value to Household Income Ratio in North Bay Shore
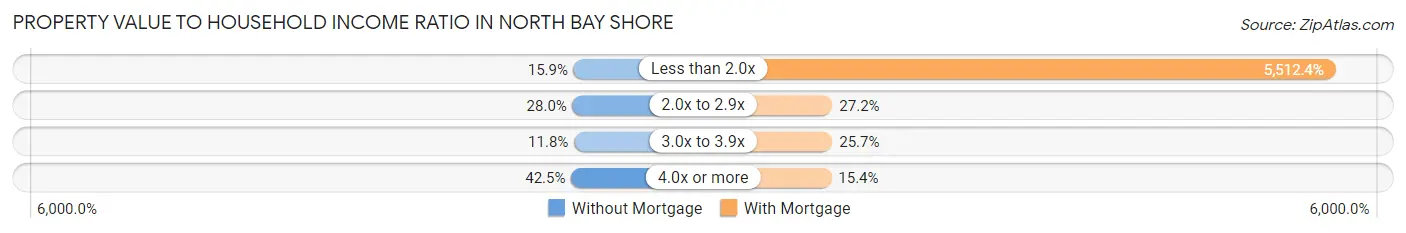
| Value-to-Income Ratio | Without Mortgage | With Mortgage |
| Less than 2.0x | 153 (15.9%) | 136,433 (5,512.4%) |
| 2.0x to 2.9x | 269 (28.0%) | 672 (27.2%) |
| 3.0x to 3.9x | 113 (11.8%) | 637 (25.7%) |
| 4.0x or more | 408 (42.5%) | 380 (15.3%) |
| Total | 960 (100.0%) | 2,475 (100.0%) |
Real Estate Taxes by Mortgage Status in North Bay Shore
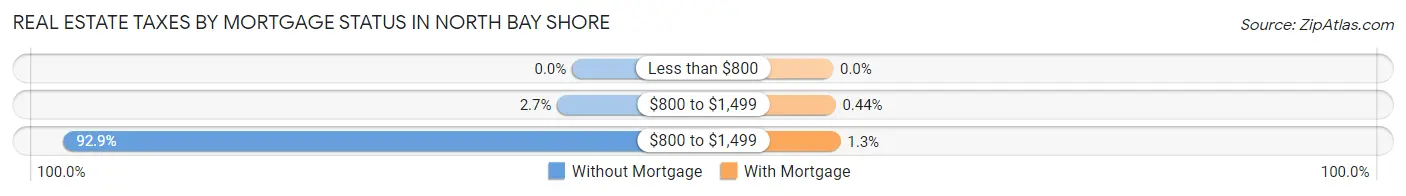
| Property Taxes | Without Mortgage | With Mortgage |
| Less than $800 | 0 (0.0%) | 0 (0.0%) |
| $800 to $1,499 | 26 (2.7%) | 11 (0.4%) |
| $800 to $1,499 | 892 (92.9%) | 33 (1.3%) |
| Total | 960 (100.0%) | 2,475 (100.0%) |
Health & Disability in North Bay Shore
Health Insurance Coverage by Age in North Bay Shore
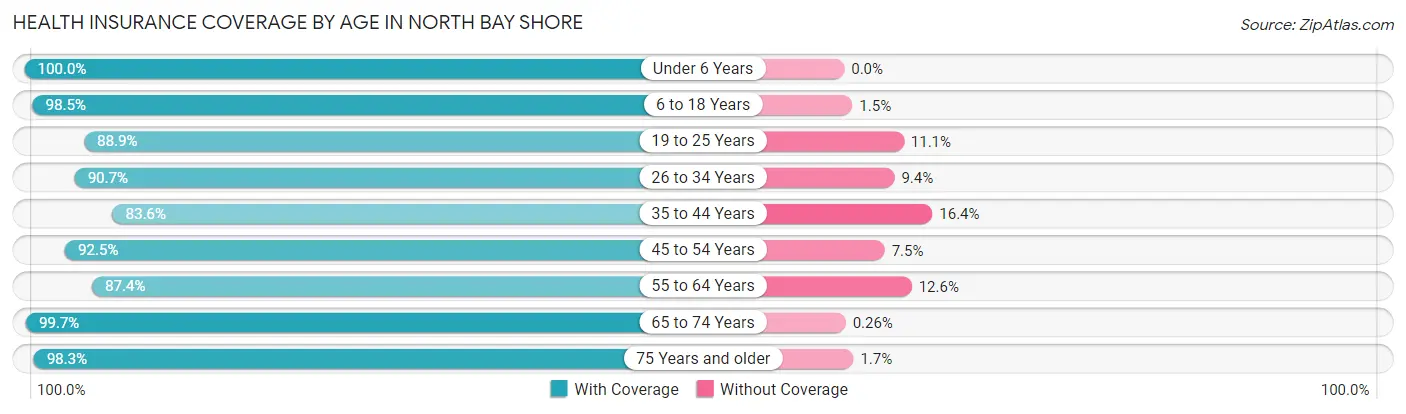
| Age Bracket | With Coverage | Without Coverage |
| Under 6 Years | 1,528 (100.0%) | 0 (0.0%) |
| 6 to 18 Years | 3,058 (98.5%) | 47 (1.5%) |
| 19 to 25 Years | 1,576 (88.9%) | 197 (11.1%) |
| 26 to 34 Years | 2,376 (90.6%) | 245 (9.3%) |
| 35 to 44 Years | 2,412 (83.6%) | 474 (16.4%) |
| 45 to 54 Years | 2,218 (92.5%) | 181 (7.5%) |
| 55 to 64 Years | 1,696 (87.4%) | 244 (12.6%) |
| 65 to 74 Years | 1,137 (99.7%) | 3 (0.3%) |
| 75 Years and older | 978 (98.3%) | 17 (1.7%) |
| Total | 16,979 (92.3%) | 1,408 (7.7%) |
Health Insurance Coverage by Citizenship Status in North Bay Shore
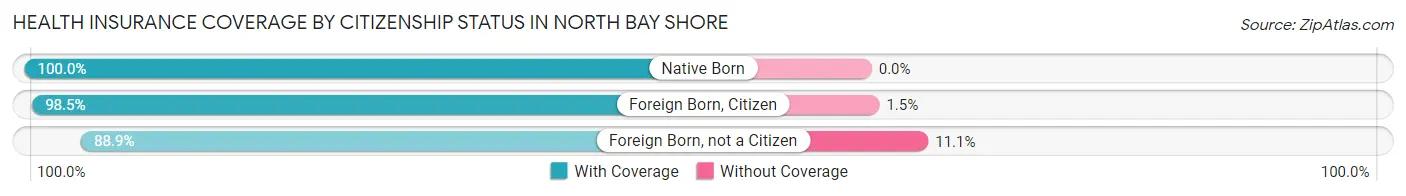
| Citizenship Status | With Coverage | Without Coverage |
| Native Born | 1,528 (100.0%) | 0 (0.0%) |
| Foreign Born, Citizen | 3,058 (98.5%) | 47 (1.5%) |
| Foreign Born, not a Citizen | 1,576 (88.9%) | 197 (11.1%) |
Health Insurance Coverage by Household Income in North Bay Shore
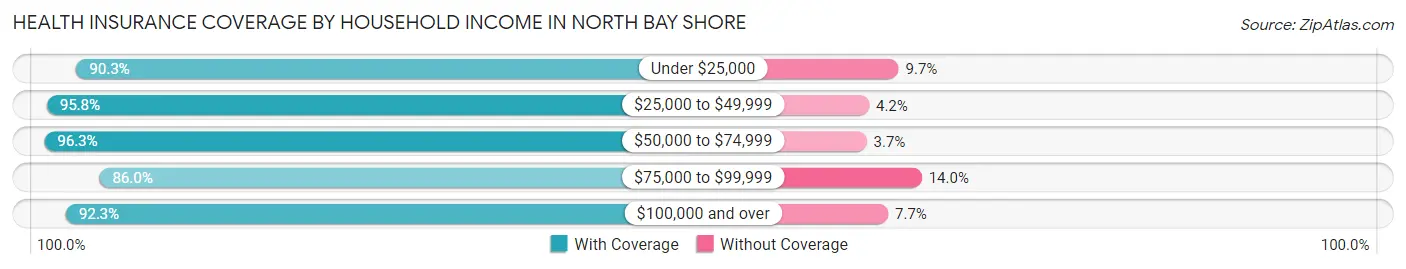
| Household Income | With Coverage | Without Coverage |
| Under $25,000 | 651 (90.3%) | 70 (9.7%) |
| $25,000 to $49,999 | 1,104 (95.8%) | 48 (4.2%) |
| $50,000 to $74,999 | 2,698 (96.3%) | 104 (3.7%) |
| $75,000 to $99,999 | 1,739 (86.0%) | 284 (14.0%) |
| $100,000 and over | 10,749 (92.3%) | 902 (7.7%) |
Public vs Private Health Insurance Coverage by Age in North Bay Shore
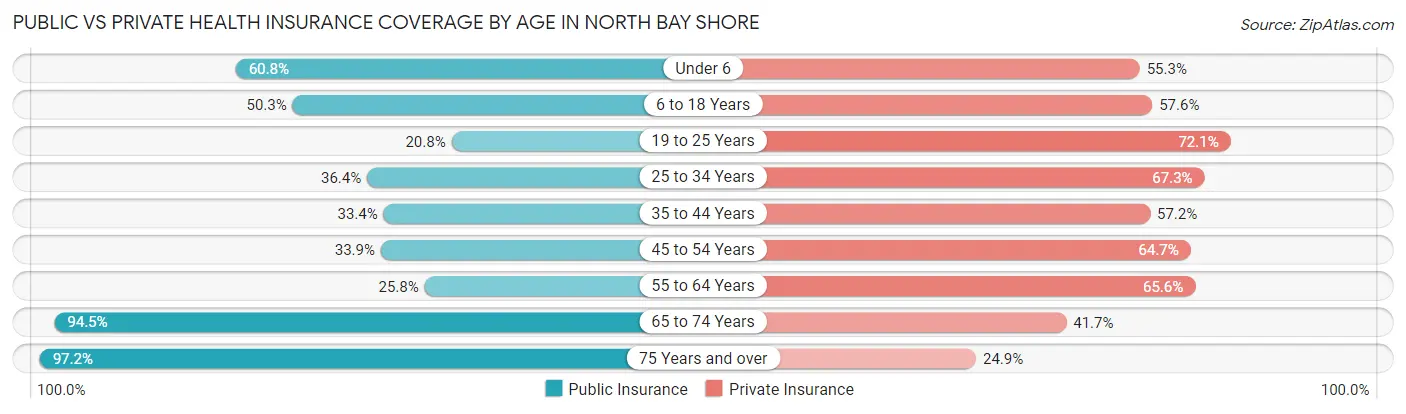
| Age Bracket | Public Insurance | Private Insurance |
| Under 6 | 929 (60.8%) | 845 (55.3%) |
| 6 to 18 Years | 1,561 (50.3%) | 1,789 (57.6%) |
| 19 to 25 Years | 368 (20.8%) | 1,279 (72.1%) |
| 25 to 34 Years | 955 (36.4%) | 1,764 (67.3%) |
| 35 to 44 Years | 963 (33.4%) | 1,651 (57.2%) |
| 45 to 54 Years | 813 (33.9%) | 1,553 (64.7%) |
| 55 to 64 Years | 500 (25.8%) | 1,272 (65.6%) |
| 65 to 74 Years | 1,077 (94.5%) | 475 (41.7%) |
| 75 Years and over | 967 (97.2%) | 248 (24.9%) |
| Total | 8,133 (44.2%) | 10,876 (59.2%) |
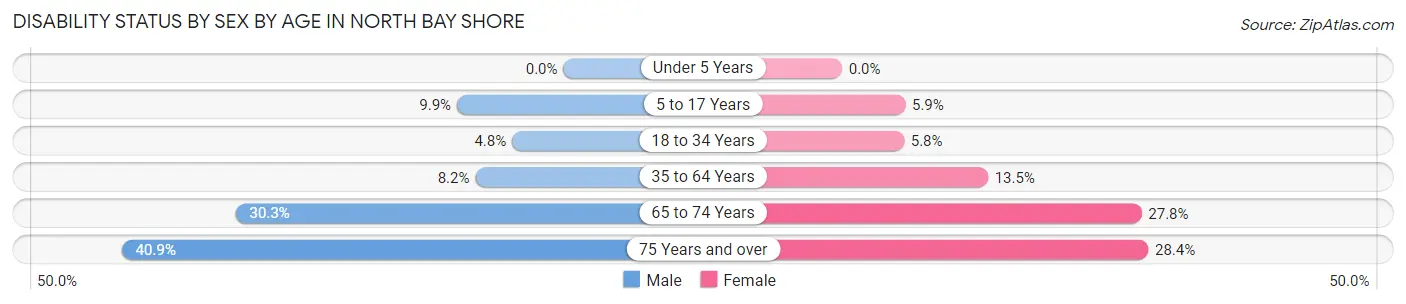
Disability Status by Sex by Age in North Bay Shore
| Age Bracket | Male | Female |
| Under 5 Years | 0 (0.0%) | 0 (0.0%) |
| 5 to 17 Years | 175 (9.9%) | 81 (5.9%) |
| 18 to 34 Years | 106 (4.8%) | 142 (5.8%) |
| 35 to 64 Years | 294 (8.2%) | 491 (13.5%) |
| 65 to 74 Years | 132 (30.3%) | 196 (27.8%) |
| 75 Years and over | 135 (40.9%) | 189 (28.4%) |
Disability Class by Sex by Age in North Bay Shore
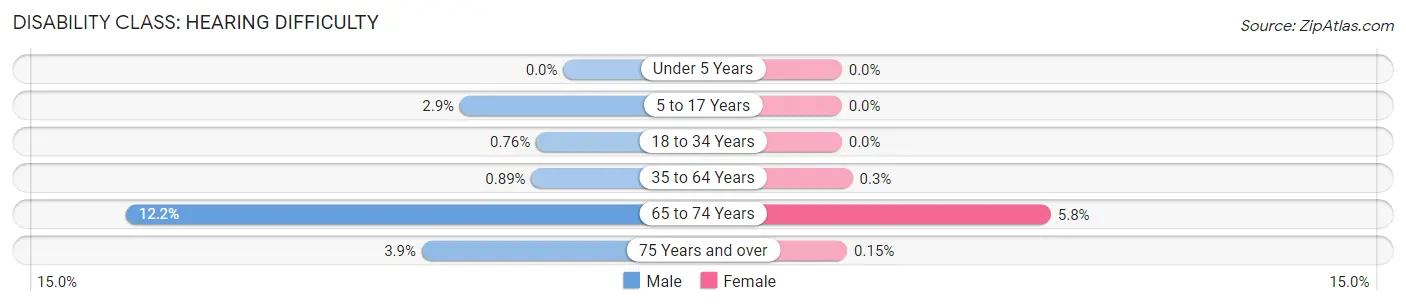
Disability Class: Hearing Difficulty
| Age Bracket | Male | Female |
| Under 5 Years | 0 (0.0%) | 0 (0.0%) |
| 5 to 17 Years | 51 (2.9%) | 0 (0.0%) |
| 18 to 34 Years | 17 (0.8%) | 0 (0.0%) |
| 35 to 64 Years | 32 (0.9%) | 11 (0.3%) |
| 65 to 74 Years | 53 (12.2%) | 41 (5.8%) |
| 75 Years and over | 13 (3.9%) | 1 (0.2%) |
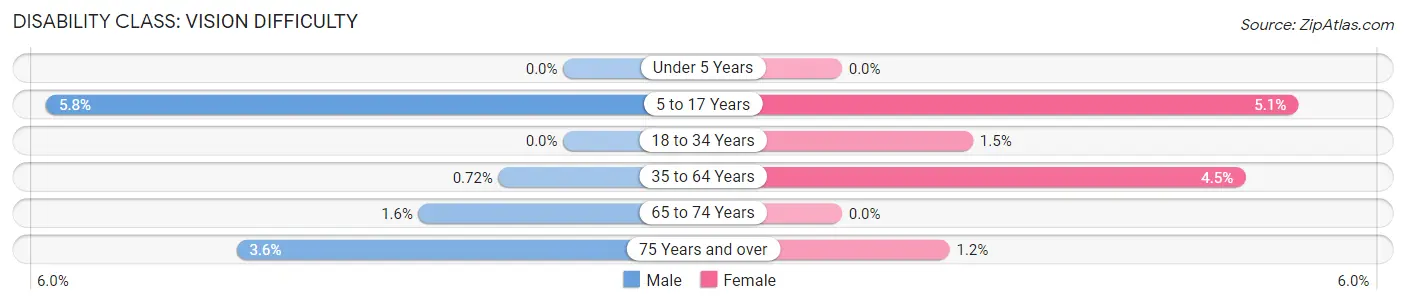
Disability Class: Vision Difficulty
| Age Bracket | Male | Female |
| Under 5 Years | 0 (0.0%) | 0 (0.0%) |
| 5 to 17 Years | 102 (5.8%) | 70 (5.1%) |
| 18 to 34 Years | 0 (0.0%) | 36 (1.5%) |
| 35 to 64 Years | 26 (0.7%) | 163 (4.5%) |
| 65 to 74 Years | 7 (1.6%) | 0 (0.0%) |
| 75 Years and over | 12 (3.6%) | 8 (1.2%) |
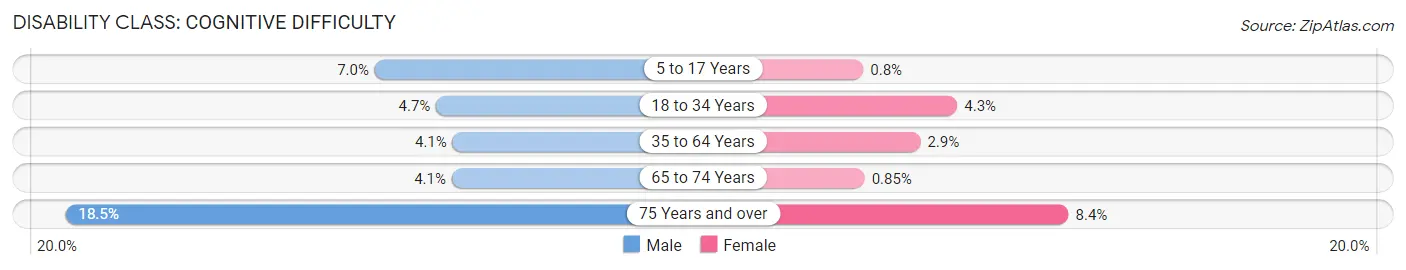
Disability Class: Cognitive Difficulty
| Age Bracket | Male | Female |
| 5 to 17 Years | 124 (7.0%) | 11 (0.8%) |
| 18 to 34 Years | 105 (4.7%) | 106 (4.3%) |
| 35 to 64 Years | 148 (4.1%) | 106 (2.9%) |
| 65 to 74 Years | 18 (4.1%) | 6 (0.9%) |
| 75 Years and over | 61 (18.5%) | 56 (8.4%) |
Disability Class: Ambulatory Difficulty
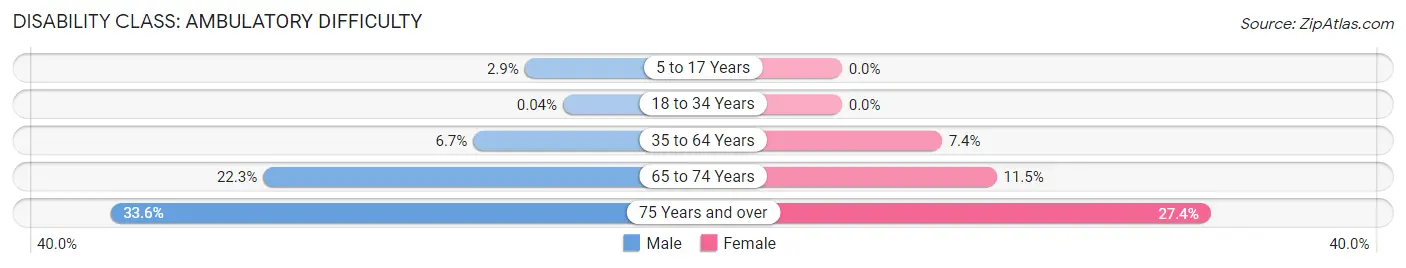
| Age Bracket | Male | Female |
| 5 to 17 Years | 51 (2.9%) | 0 (0.0%) |
| 18 to 34 Years | 1 (0.0%) | 0 (0.0%) |
| 35 to 64 Years | 241 (6.7%) | 269 (7.4%) |
| 65 to 74 Years | 97 (22.3%) | 81 (11.5%) |
| 75 Years and over | 111 (33.6%) | 182 (27.4%) |
Disability Class: Self-Care Difficulty
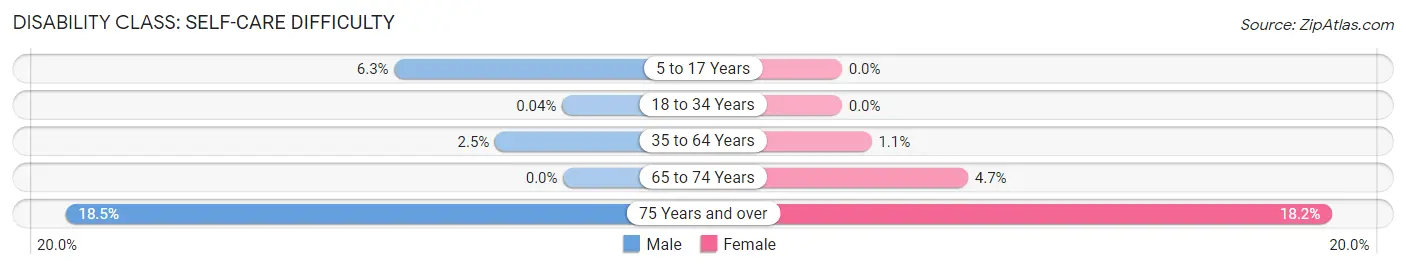
| Age Bracket | Male | Female |
| 5 to 17 Years | 111 (6.3%) | 0 (0.0%) |
| 18 to 34 Years | 1 (0.0%) | 0 (0.0%) |
| 35 to 64 Years | 91 (2.5%) | 40 (1.1%) |
| 65 to 74 Years | 0 (0.0%) | 33 (4.7%) |
| 75 Years and over | 61 (18.5%) | 121 (18.2%) |
Technology Access in North Bay Shore
Computing Device Access in North Bay Shore
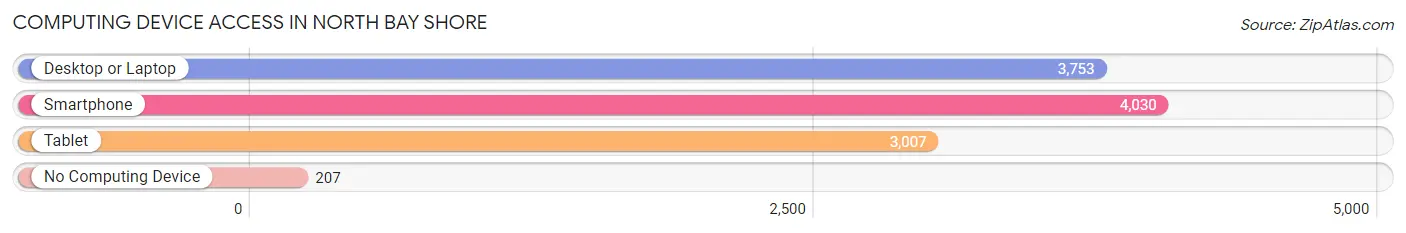
| Device Type | # Households | % Households |
| Desktop or Laptop | 3,753 | 85.3% |
| Smartphone | 4,030 | 91.6% |
| Tablet | 3,007 | 68.3% |
| No Computing Device | 207 | 4.7% |
| Total | 4,401 | 100.0% |
Internet Access in North Bay Shore
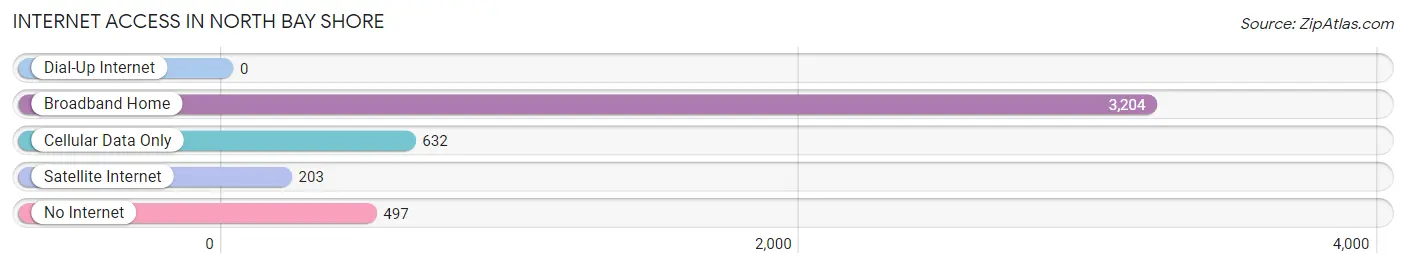
| Internet Type | # Households | % Households |
| Dial-Up Internet | 0 | 0.0% |
| Broadband Home | 3,204 | 72.8% |
| Cellular Data Only | 632 | 14.4% |
| Satellite Internet | 203 | 4.6% |
| No Internet | 497 | 11.3% |
| Total | 4,401 | 100.0% |
North Bay Shore Summary
Bay Shore is a hamlet and census-designated place (CDP) located in the Town of Islip in Suffolk County, New York, United States. It is situated on the South Shore of Long Island, adjoining the Great South Bay. The population was 26,337 at the 2010 census.
History
The area now known as Bay Shore was originally inhabited by the Secatogue tribe of the Algonquin nation. The Secatogues were a peaceful tribe that lived off the land and the waters of the Great South Bay. The Secatogues were eventually displaced by European settlers in the 17th century.
The first European settlers in the area were Dutch and English farmers who arrived in the early 1600s. The area was known as Fire Place for its abundance of native grasses that were used for fuel. The area was also known as Penataquit by the Secatogues, which translates to “where the waters meet”.
In the late 1700s, the area was renamed Bay Shore by Captain John Hand, who was a prominent local landowner. He named the area after the bay that it was situated on.
In the early 1800s, the area began to develop as a resort destination. The first hotel was built in 1820 and the area quickly became a popular destination for wealthy New Yorkers looking to escape the hustle and bustle of the city.
In 1855, the Long Island Rail Road arrived in Bay Shore, connecting the area to New York City and other parts of Long Island. This made the area even more accessible and popular as a resort destination.
In the late 1800s, Bay Shore began to develop as a commercial center. The area was home to a number of factories, including a paper mill, a brickyard, and a shipbuilding yard.
In the early 1900s, Bay Shore continued to grow as a commercial center. The area was home to a number of stores, banks, and other businesses. The area also became a popular destination for summer vacationers.
In the 1950s, Bay Shore began to decline as a commercial center. Many of the factories and businesses closed and the area became a residential community.
Geography
Bay Shore is located at 40°44′N 73°14′W (40.735, -73.233). According to the United States Census Bureau, the CDP has a total area of 5.2 square miles (13.4 km2), of which 4.9 square miles (12.7 km2) is land and 0.3 square miles (0.7 km2) (5.45%) is water.
Bay Shore is located on the South Shore of Long Island, adjoining the Great South Bay. The hamlet is bordered by the hamlets of Brightwaters to the west, Islip to the north, and West Islip to the east.
Economy
Bay Shore is a primarily residential community, but it does have a few businesses. The area is home to a number of retail stores, restaurants, and other businesses. The area is also home to a number of medical offices and other professional services.
The area is also home to a number of marinas, which provide services to boaters. The area is also home to a number of boatyards, which provide services to boat owners.
Demographics
As of the 2010 census, there were 26,337 people, 9,945 households, and 6,845 families residing in the CDP. The population density was 5,346.3 people per square mile (2,068.2/km2). There were 10,541 housing units at an average density of 2,142.3 per square mile (826.2/km2). The racial makeup of the CDP was 79.2% White, 8.2% African American, 0.3% Native American, 4.2% Asian, 0.1% Pacific Islander, 5.2% from other races, and 2.9% from two or more races. Hispanic or Latino of any race were 14.7% of the population.
There were 9,945 households, out of which 32.2% had children under the age of 18 living with them, 51.2% were married couples living together, 12.7% had a female householder with no husband present, and 30.7% were non-families. 24.2% of all households were made up of individuals, and 9.3% had someone living alone who was 65 years of age or older. The average household size was 2.64 and the average family size was 3.14.
In the CDP, the population was spread out, with 23.7% under the age of 18, 8.2% from 18 to 24, 30.2% from 25 to 44, 24.3% from 45 to 64, and 13.6% who were 65 years of age or older. The median age was 37 years. For every 100 females, there were 94.2 males. For every 100 females age 18 and over, there were 91.2 males.
The median income for a household in the CDP was $60,945, and the median income for a family was $68,945. Males had a median income of $45,945 versus $35,945 for females. The per capita income for the CDP was $26,945. About 4.2% of families and 6.2% of the population were below the poverty line, including 8.2% of those under age 18 and 5.2% of those age 65 or over.
Common Questions
What is Per Capita Income in North Bay Shore?
Per Capita income in North Bay Shore is $29,926.
What is the Median Family Income in North Bay Shore?
Median Family Income in North Bay Shore is $104,774.
What is the Median Household income in North Bay Shore?
Median Household Income in North Bay Shore is $104,004.
What is Income or Wage Gap in North Bay Shore?
Income or Wage Gap in North Bay Shore is 7.4%.
Women in North Bay Shore earn 92.6 cents for every dollar earned by a man.
What is Inequality or Gini Index in North Bay Shore?
Inequality or Gini Index in North Bay Shore is 0.39.
What is the Total Population of North Bay Shore?
Total Population of North Bay Shore is 18,392.
What is the Total Male Population of North Bay Shore?
Total Male Population of North Bay Shore is 8,962.
What is the Total Female Population of North Bay Shore?
Total Female Population of North Bay Shore is 9,430.
What is the Ratio of Males per 100 Females in North Bay Shore?
There are 95.04 Males per 100 Females in North Bay Shore.
What is the Ratio of Females per 100 Males in North Bay Shore?
There are 105.22 Females per 100 Males in North Bay Shore.
What is the Median Population Age in North Bay Shore?
Median Population Age in North Bay Shore is 35.7 Years.
What is the Average Family Size in North Bay Shore
Average Family Size in North Bay Shore is 4.3 People.
What is the Average Household Size in North Bay Shore
Average Household Size in North Bay Shore is 4.2 People.
How Large is the Labor Force in North Bay Shore?
There are 10,297 People in the Labor Forcein in North Bay Shore.
What is the Percentage of People in the Labor Force in North Bay Shore?
72.0% of People are in the Labor Force in North Bay Shore.
What is the Unemployment Rate in North Bay Shore?
Unemployment Rate in North Bay Shore is 5.0%.