Wyandanch, NY Map & Demographics
Wyandanch Map
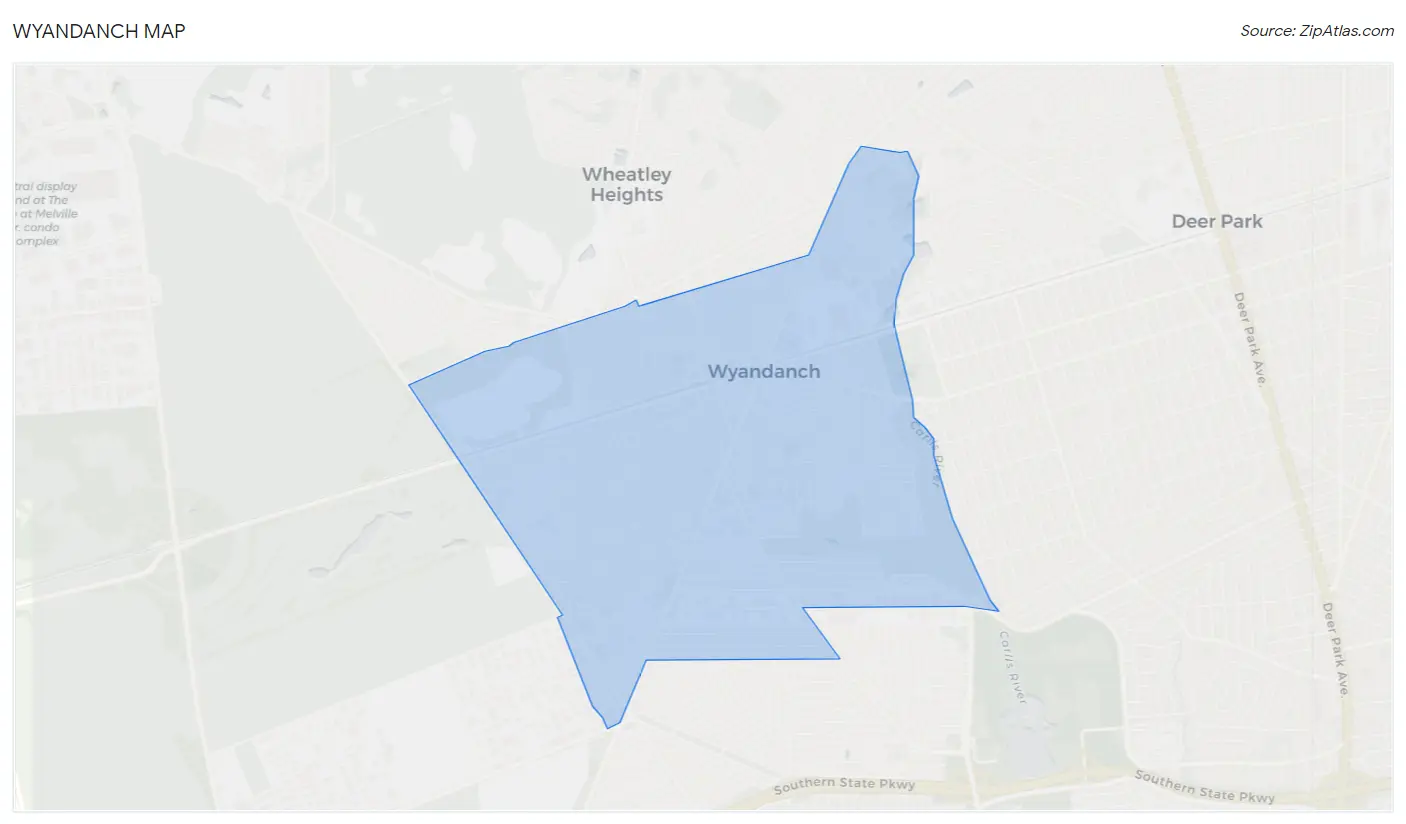
Wyandanch Overview
$29,050
PER CAPITA INCOME
$94,401
AVG FAMILY INCOME
$87,669
AVG HOUSEHOLD INCOME
35.7%
WAGE / INCOME GAP [ % ]
64.3¢/ $1
WAGE / INCOME GAP [ $ ]
0.44
INEQUALITY / GINI INDEX
13,601
TOTAL POPULATION
7,007
MALE POPULATION
6,594
FEMALE POPULATION
106.26
MALES / 100 FEMALES
94.11
FEMALES / 100 MALES
35.1
MEDIAN AGE
4.2
AVG FAMILY SIZE
3.6
AVG HOUSEHOLD SIZE
7,009
LABOR FORCE [ PEOPLE ]
66.8%
PERCENT IN LABOR FORCE
5.7%
UNEMPLOYMENT RATE
Wyandanch Zip Codes
Wyandanch Area Codes
Income in Wyandanch
Income Overview in Wyandanch
Per Capita Income in Wyandanch is $29,050, while median incomes of families and households are $94,401 and $87,669 respectively.
| Characteristic | Number | Measure |
| Per Capita Income | 13,601 | $29,050 |
| Median Family Income | 2,523 | $94,401 |
| Mean Family Income | 2,523 | $105,283 |
| Median Household Income | 3,785 | $87,669 |
| Mean Household Income | 3,785 | $95,393 |
| Income Deficit | 2,523 | $0 |
| Wage / Income Gap (%) | 13,601 | 35.70% |
| Wage / Income Gap ($) | 13,601 | 64.30¢ per $1 |
| Gini / Inequality Index | 13,601 | 0.44 |
Earnings by Sex in Wyandanch
Average Earnings in Wyandanch are $34,858, $43,729 for men and $28,119 for women, a difference of 35.7%.
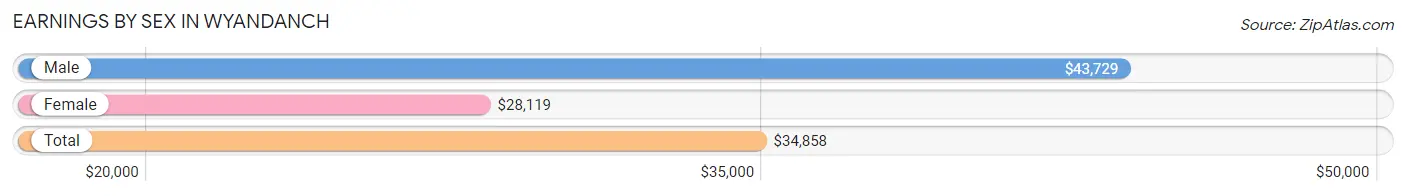
| Sex | Number | Average Earnings |
| Male | 3,949 (56.2%) | $43,729 |
| Female | 3,074 (43.8%) | $28,119 |
| Total | 7,023 (100.0%) | $34,858 |
Earnings by Sex by Income Bracket in Wyandanch
The most common earnings brackets in Wyandanch are $75,000 to $99,999 for men (528 | 13.4%) and $25,000 to $29,999 for women (350 | 11.4%).
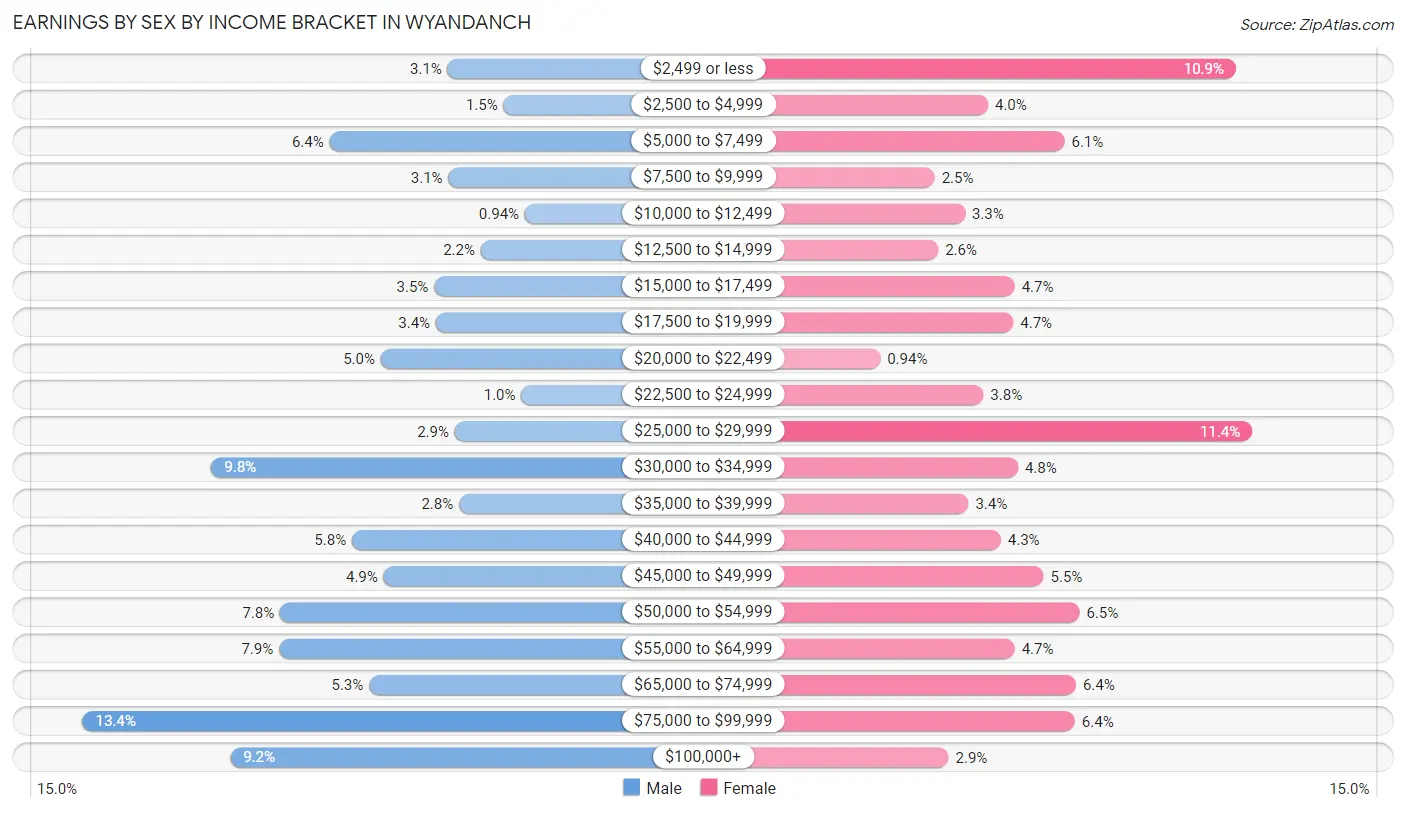
| Income | Male | Female |
| $2,499 or less | 123 (3.1%) | 336 (10.9%) |
| $2,500 to $4,999 | 61 (1.5%) | 122 (4.0%) |
| $5,000 to $7,499 | 254 (6.4%) | 188 (6.1%) |
| $7,500 to $9,999 | 122 (3.1%) | 76 (2.5%) |
| $10,000 to $12,499 | 37 (0.9%) | 102 (3.3%) |
| $12,500 to $14,999 | 86 (2.2%) | 79 (2.6%) |
| $15,000 to $17,499 | 138 (3.5%) | 145 (4.7%) |
| $17,500 to $19,999 | 136 (3.4%) | 144 (4.7%) |
| $20,000 to $22,499 | 197 (5.0%) | 29 (0.9%) |
| $22,500 to $24,999 | 41 (1.0%) | 118 (3.8%) |
| $25,000 to $29,999 | 115 (2.9%) | 350 (11.4%) |
| $30,000 to $34,999 | 385 (9.8%) | 148 (4.8%) |
| $35,000 to $39,999 | 110 (2.8%) | 105 (3.4%) |
| $40,000 to $44,999 | 229 (5.8%) | 133 (4.3%) |
| $45,000 to $49,999 | 194 (4.9%) | 170 (5.5%) |
| $50,000 to $54,999 | 309 (7.8%) | 201 (6.5%) |
| $55,000 to $64,999 | 310 (7.9%) | 145 (4.7%) |
| $65,000 to $74,999 | 210 (5.3%) | 198 (6.4%) |
| $75,000 to $99,999 | 528 (13.4%) | 197 (6.4%) |
| $100,000+ | 364 (9.2%) | 88 (2.9%) |
| Total | 3,949 (100.0%) | 3,074 (100.0%) |
Earnings by Sex by Educational Attainment in Wyandanch
Average earnings in Wyandanch are $50,395 for men and $41,667 for women, a difference of 17.3%. Men with an educational attainment of bachelor's degree enjoy the highest average annual earnings of $63,672, while those with college or associate's degree education earn the least with $33,726. Women with an educational attainment of graduate degree earn the most with the average annual earnings of $68,173, while those with less than high school education have the smallest earnings of $29,113.
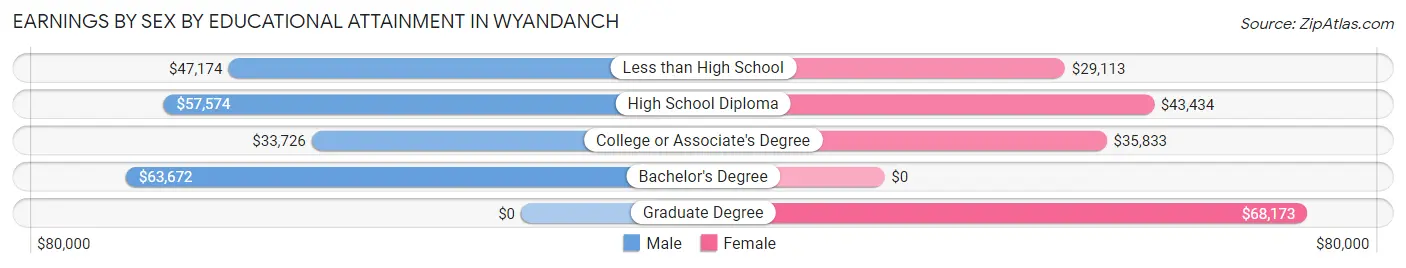
| Educational Attainment | Male Income | Female Income |
| Less than High School | $47,174 | $29,113 |
| High School Diploma | $57,574 | $43,434 |
| College or Associate's Degree | $33,726 | $35,833 |
| Bachelor's Degree | $63,672 | $0 |
| Graduate Degree | - | - |
| Total | $50,395 | $41,667 |
Family Income in Wyandanch
Family Income Brackets in Wyandanch
According to the Wyandanch family income data, there are 555 families falling into the $100,000 to $149,999 income range, which is the most common income bracket and makes up 22.0% of all families. Conversely, the $15,000 to $24,999 income bracket is the least frequent group with only 20 families (0.8%) belonging to this category.
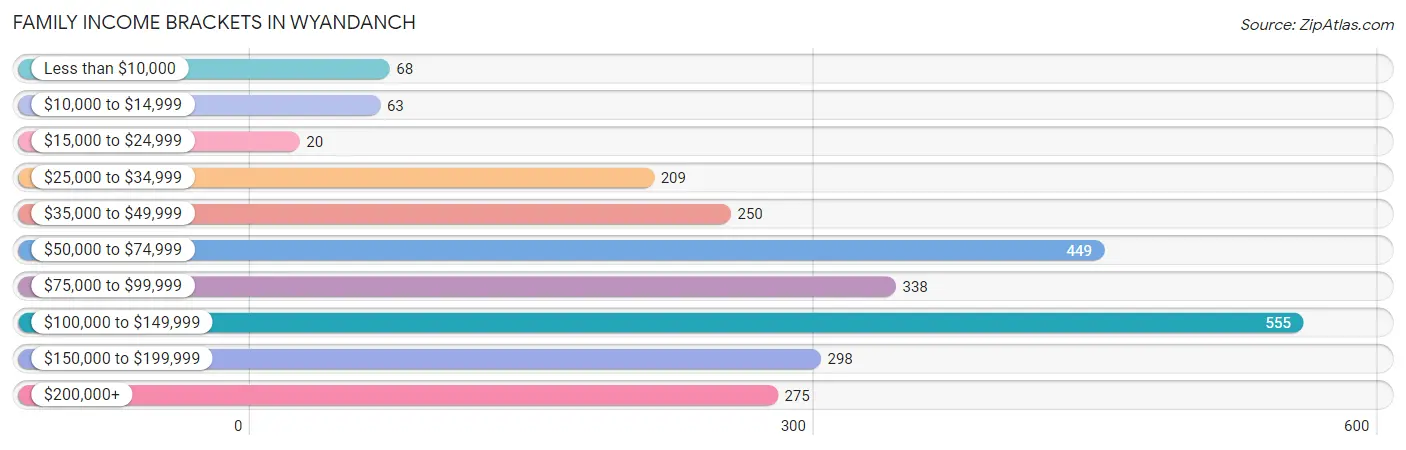
| Income Bracket | # Families | % Families |
| Less than $10,000 | 68 | 2.7% |
| $10,000 to $14,999 | 63 | 2.5% |
| $15,000 to $24,999 | 20 | 0.8% |
| $25,000 to $34,999 | 209 | 8.3% |
| $35,000 to $49,999 | 250 | 9.9% |
| $50,000 to $74,999 | 449 | 17.8% |
| $75,000 to $99,999 | 338 | 13.4% |
| $100,000 to $149,999 | 555 | 22.0% |
| $150,000 to $199,999 | 298 | 11.8% |
| $200,000+ | 275 | 10.9% |
Family Income by Famaliy Size in Wyandanch
5-person families (260 | 10.3%) account for the highest median family income in Wyandanch with $170,054 per family, while 2-person families (626 | 24.8%) have the highest median income of $35,570 per family member.
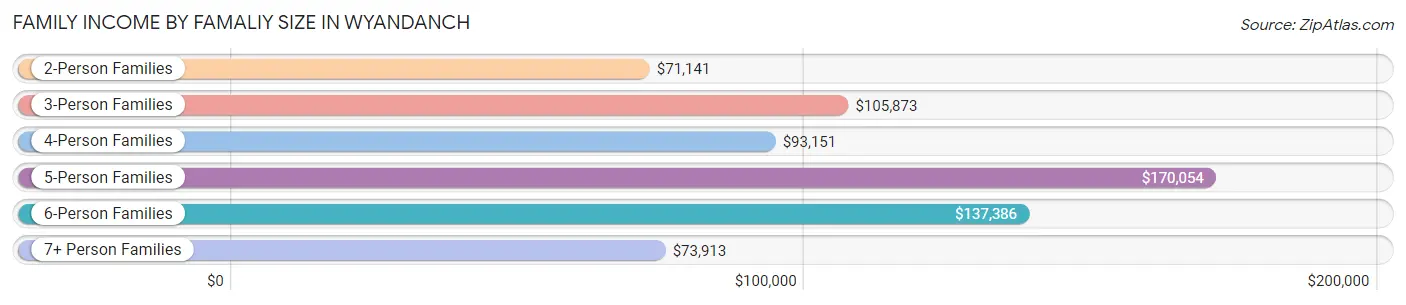
| Income Bracket | # Families | Median Income |
| 2-Person Families | 626 (24.8%) | $71,141 |
| 3-Person Families | 729 (28.9%) | $105,873 |
| 4-Person Families | 505 (20.0%) | $93,151 |
| 5-Person Families | 260 (10.3%) | $170,054 |
| 6-Person Families | 61 (2.4%) | $137,386 |
| 7+ Person Families | 342 (13.6%) | $73,913 |
| Total | 2,523 (100.0%) | $94,401 |
Family Income by Number of Earners in Wyandanch
The median family income in Wyandanch is $94,401, with families comprising 3+ earners (555) having the highest median family income of $142,964, while families with no earners (350) have the lowest median family income of $36,250, accounting for 22.0% and 13.9% of families, respectively.
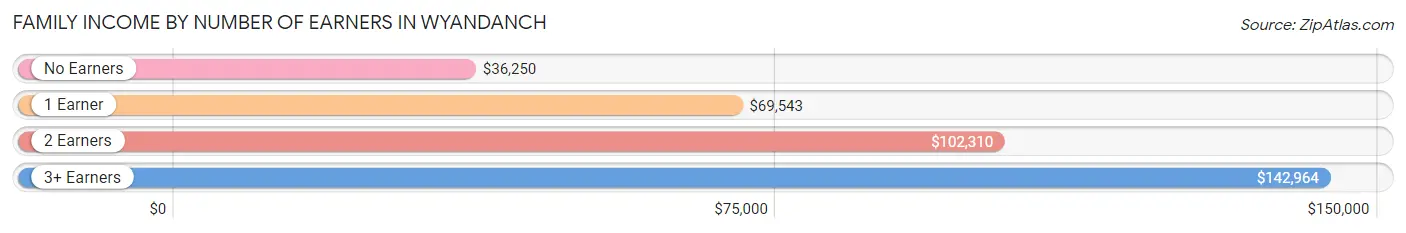
| Number of Earners | # Families | Median Income |
| No Earners | 350 (13.9%) | $36,250 |
| 1 Earner | 673 (26.7%) | $69,543 |
| 2 Earners | 945 (37.5%) | $102,310 |
| 3+ Earners | 555 (22.0%) | $142,964 |
| Total | 2,523 (100.0%) | $94,401 |
Household Income in Wyandanch
Household Income Brackets in Wyandanch
With 712 households falling in the category, the $100,000 to $149,999 income range is the most frequent in Wyandanch, accounting for 18.8% of all households. In contrast, only 174 households (4.6%) fall into the $10,000 to $14,999 income bracket, making it the least populous group.
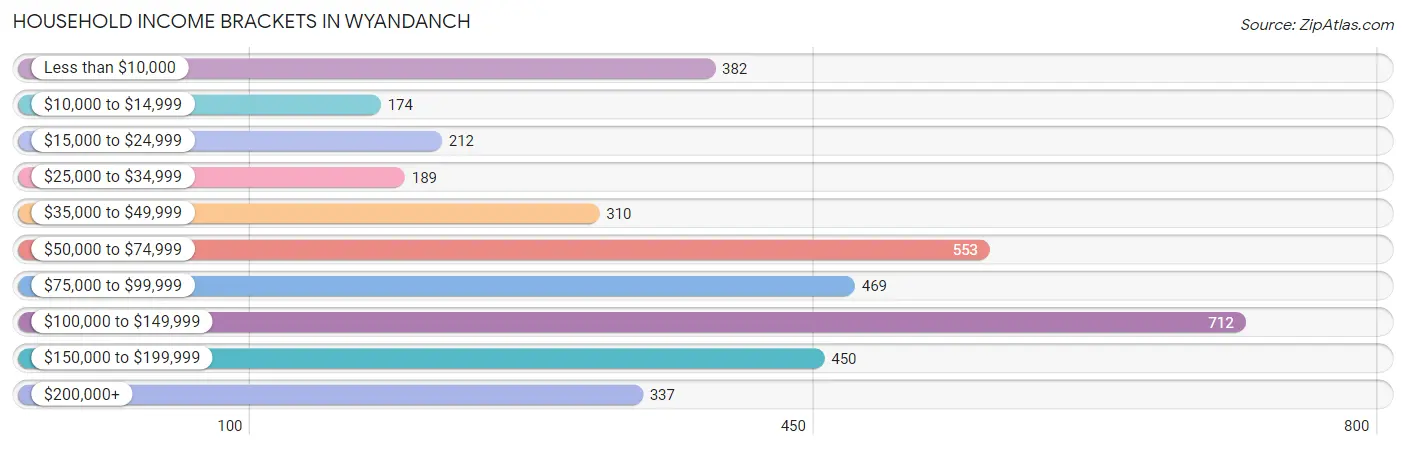
| Income Bracket | # Households | % Households |
| Less than $10,000 | 382 | 10.1% |
| $10,000 to $14,999 | 174 | 4.6% |
| $15,000 to $24,999 | 212 | 5.6% |
| $25,000 to $34,999 | 189 | 5.0% |
| $35,000 to $49,999 | 310 | 8.2% |
| $50,000 to $74,999 | 553 | 14.6% |
| $75,000 to $99,999 | 469 | 12.4% |
| $100,000 to $149,999 | 712 | 18.8% |
| $150,000 to $199,999 | 450 | 11.9% |
| $200,000+ | 337 | 8.9% |
Household Income by Householder Age in Wyandanch
The median household income in Wyandanch is $87,669, with the highest median household income of $119,743 found in the 45 to 64 years age bracket for the primary householder. A total of 1,769 households (46.7%) fall into this category. Meanwhile, the 15 to 24 years age bracket for the primary householder has the lowest median household income of $0, with 51 households (1.3%) in this group.
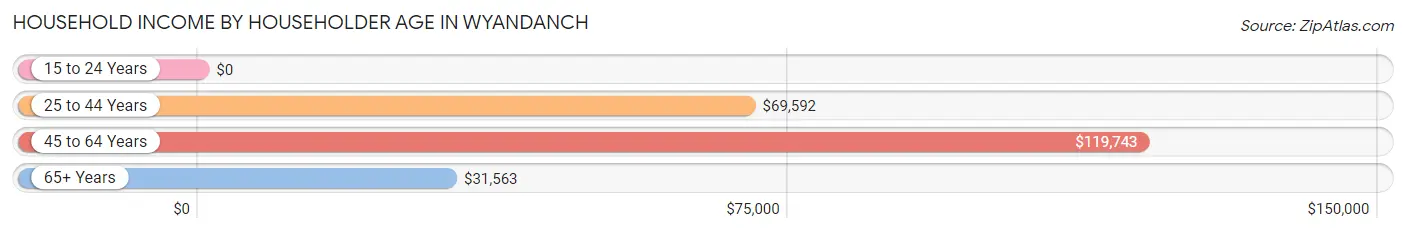
| Income Bracket | # Households | Median Income |
| 15 to 24 Years | 51 (1.3%) | $0 |
| 25 to 44 Years | 985 (26.0%) | $69,592 |
| 45 to 64 Years | 1,769 (46.7%) | $119,743 |
| 65+ Years | 980 (25.9%) | $31,563 |
| Total | 3,785 (100.0%) | $87,669 |
Poverty in Wyandanch
Income Below Poverty by Sex and Age in Wyandanch
With 16.8% poverty level for males and 19.7% for females among the residents of Wyandanch, 65 to 74 year old males and 12 to 14 year old females are the most vulnerable to poverty, with 303 males (59.1%) and 163 females (51.7%) in their respective age groups living below the poverty level.
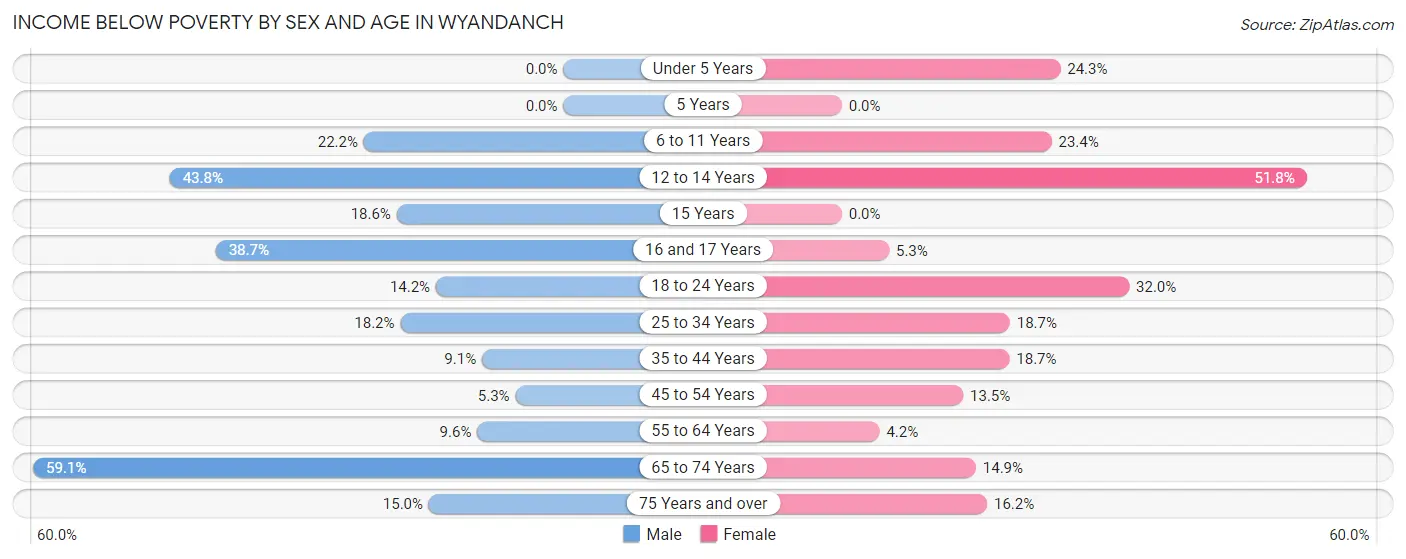
| Age Bracket | Male | Female |
| Under 5 Years | 0 (0.0%) | 109 (24.3%) |
| 5 Years | 0 (0.0%) | 0 (0.0%) |
| 6 to 11 Years | 118 (22.2%) | 164 (23.4%) |
| 12 to 14 Years | 142 (43.8%) | 163 (51.7%) |
| 15 Years | 18 (18.6%) | 0 (0.0%) |
| 16 and 17 Years | 12 (38.7%) | 8 (5.3%) |
| 18 to 24 Years | 127 (14.2%) | 297 (32.0%) |
| 25 to 34 Years | 181 (18.1%) | 128 (18.7%) |
| 35 to 44 Years | 84 (9.1%) | 139 (18.7%) |
| 45 to 54 Years | 61 (5.3%) | 117 (13.5%) |
| 55 to 64 Years | 84 (9.6%) | 30 (4.2%) |
| 65 to 74 Years | 303 (59.1%) | 70 (14.9%) |
| 75 Years and over | 31 (15.0%) | 56 (16.2%) |
| Total | 1,161 (16.8%) | 1,281 (19.7%) |
Income Above Poverty by Sex and Age in Wyandanch
According to the poverty statistics in Wyandanch, males aged under 5 years and females aged 5 years are the age groups that are most secure financially, with 100.0% of males and 100.0% of females in these age groups living above the poverty line.
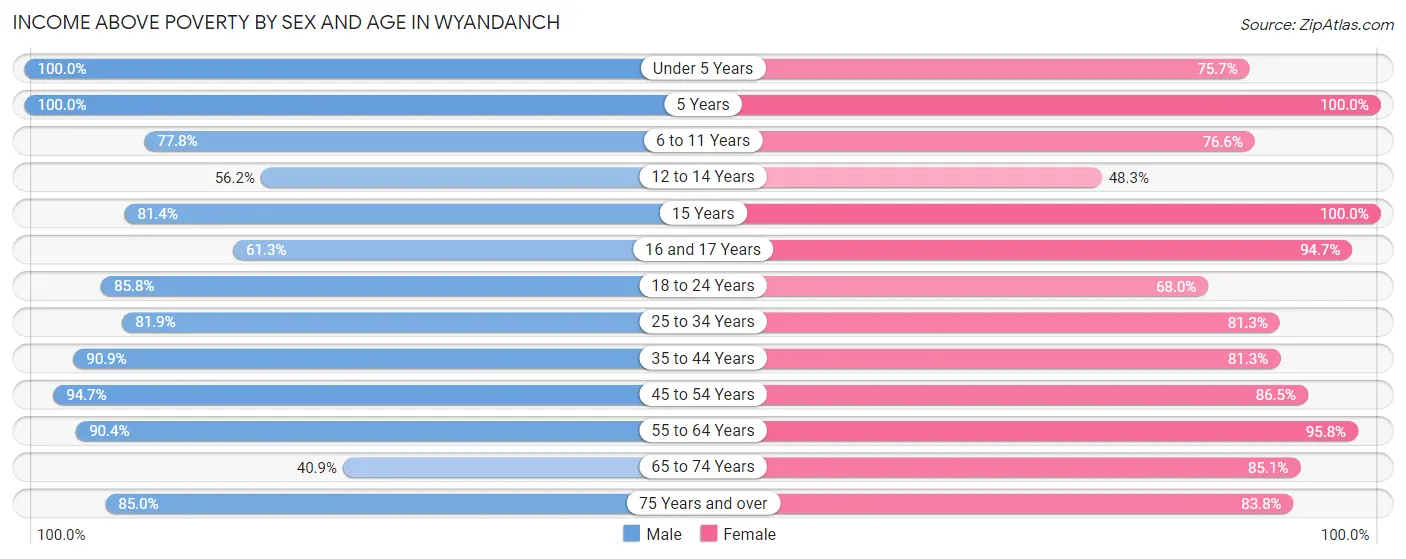
| Age Bracket | Male | Female |
| Under 5 Years | 358 (100.0%) | 339 (75.7%) |
| 5 Years | 29 (100.0%) | 117 (100.0%) |
| 6 to 11 Years | 413 (77.8%) | 538 (76.6%) |
| 12 to 14 Years | 182 (56.2%) | 152 (48.2%) |
| 15 Years | 79 (81.4%) | 15 (100.0%) |
| 16 and 17 Years | 19 (61.3%) | 144 (94.7%) |
| 18 to 24 Years | 768 (85.8%) | 631 (68.0%) |
| 25 to 34 Years | 816 (81.9%) | 556 (81.3%) |
| 35 to 44 Years | 843 (90.9%) | 606 (81.3%) |
| 45 to 54 Years | 1,081 (94.7%) | 749 (86.5%) |
| 55 to 64 Years | 792 (90.4%) | 684 (95.8%) |
| 65 to 74 Years | 210 (40.9%) | 399 (85.1%) |
| 75 Years and over | 176 (85.0%) | 290 (83.8%) |
| Total | 5,766 (83.2%) | 5,220 (80.3%) |
Income Below Poverty Among Married-Couple Families in Wyandanch
The poverty statistics for married-couple families in Wyandanch show that 4.1% or 48 of the total 1,180 families live below the poverty line. Families with 1 or 2 children have the highest poverty rate of 8.8%, comprising of 36 families. On the other hand, families with 3 or 4 children have the lowest poverty rate of 0.0%, which includes 0 families.
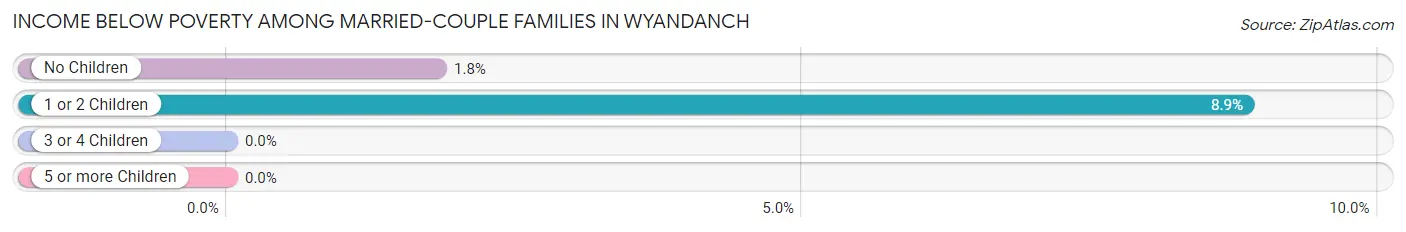
| Children | Above Poverty | Below Poverty |
| No Children | 649 (98.2%) | 12 (1.8%) |
| 1 or 2 Children | 371 (91.1%) | 36 (8.8%) |
| 3 or 4 Children | 112 (100.0%) | 0 (0.0%) |
| 5 or more Children | 0 (0.0%) | 0 (0.0%) |
| Total | 1,132 (95.9%) | 48 (4.1%) |
Income Below Poverty Among Single-Parent Households in Wyandanch
According to the poverty data in Wyandanch, 8.8% or 47 single-father households and 26.2% or 212 single-mother households are living below the poverty line. Among single-father households, those with no children have the highest poverty rate, with 47 households (17.7%) experiencing poverty. Likewise, among single-mother households, those with 3 or 4 children have the highest poverty rate, with 57 households (100.0%) falling below the poverty line.
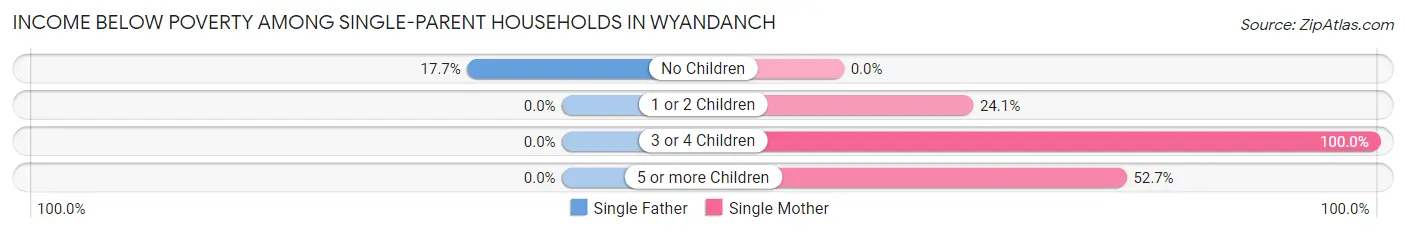
| Children | Single Father | Single Mother |
| No Children | 47 (17.7%) | 0 (0.0%) |
| 1 or 2 Children | 0 (0.0%) | 86 (24.1%) |
| 3 or 4 Children | 0 (0.0%) | 57 (100.0%) |
| 5 or more Children | 0 (0.0%) | 69 (52.7%) |
| Total | 47 (8.8%) | 212 (26.2%) |
Income Below Poverty Among Married-Couple vs Single-Parent Households in Wyandanch
The poverty data for Wyandanch shows that 48 of the married-couple family households (4.1%) and 259 of the single-parent households (19.3%) are living below the poverty level. Within the married-couple family households, those with 1 or 2 children have the highest poverty rate, with 36 households (8.8%) falling below the poverty line. Among the single-parent households, those with 3 or 4 children have the highest poverty rate, with 57 household (93.4%) living below poverty.
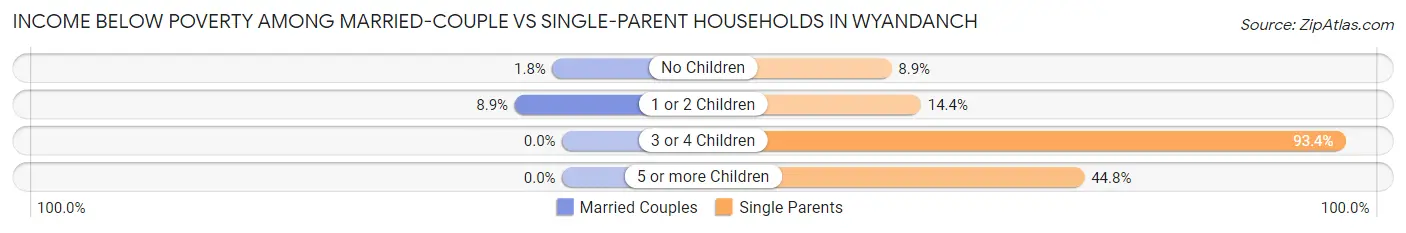
| Children | Married-Couple Families | Single-Parent Households |
| No Children | 12 (1.8%) | 47 (8.9%) |
| 1 or 2 Children | 36 (8.8%) | 86 (14.4%) |
| 3 or 4 Children | 0 (0.0%) | 57 (93.4%) |
| 5 or more Children | 0 (0.0%) | 69 (44.8%) |
| Total | 48 (4.1%) | 259 (19.3%) |
Race in Wyandanch
The most populous races in Wyandanch are Black / African American (7,206 | 53.0%), Hispanic or Latino (5,234 | 38.5%), and Some other Race (3,082 | 22.7%).
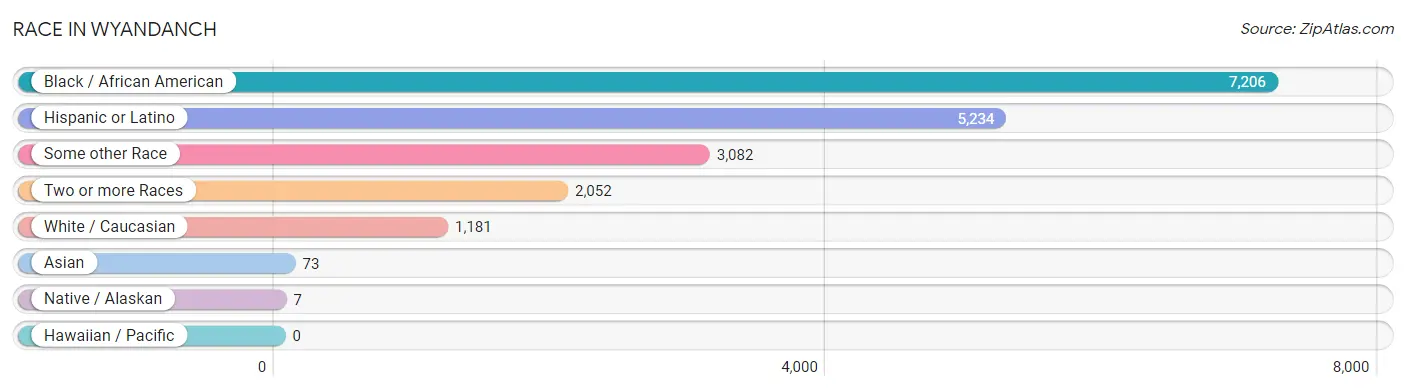
| Race | # Population | % Population |
| Asian | 73 | 0.5% |
| Black / African American | 7,206 | 53.0% |
| Hawaiian / Pacific | 0 | 0.0% |
| Hispanic or Latino | 5,234 | 38.5% |
| Native / Alaskan | 7 | 0.1% |
| White / Caucasian | 1,181 | 8.7% |
| Two or more Races | 2,052 | 15.1% |
| Some other Race | 3,082 | 22.7% |
| Total | 13,601 | 100.0% |
Ancestry in Wyandanch
The most populous ancestries reported in Wyandanch are Central American (2,598 | 19.1%), Salvadoran (2,233 | 16.4%), Jamaican (995 | 7.3%), Puerto Rican (919 | 6.8%), and Haitian (826 | 6.1%), together accounting for 55.7% of all Wyandanch residents.
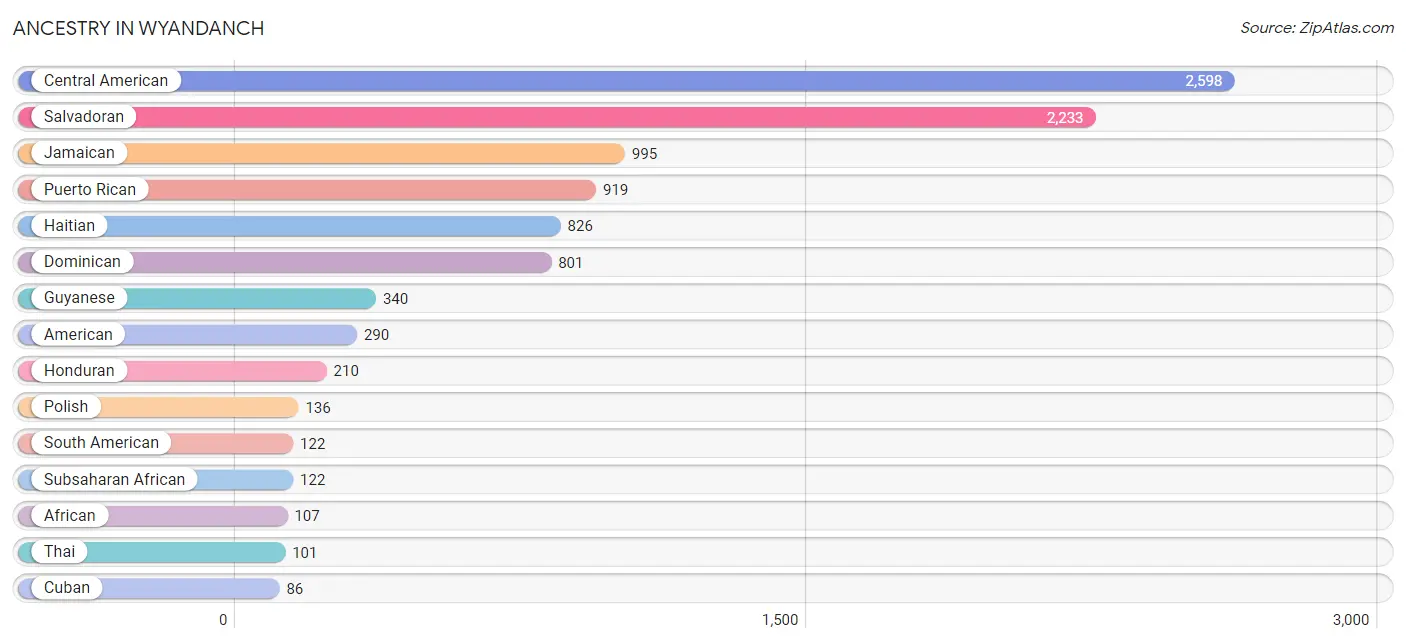
| Ancestry | # Population | % Population |
| African | 107 | 0.8% |
| American | 290 | 2.1% |
| Arab | 14 | 0.1% |
| British West Indian | 78 | 0.6% |
| Central American | 2,598 | 19.1% |
| Central American Indian | 7 | 0.1% |
| Colombian | 49 | 0.4% |
| Cuban | 86 | 0.6% |
| Dominican | 801 | 5.9% |
| Dutch | 15 | 0.1% |
| French | 5 | 0.0% |
| Guyanese | 340 | 2.5% |
| Haitian | 826 | 6.1% |
| Honduran | 210 | 1.5% |
| Irish | 60 | 0.4% |
| Italian | 71 | 0.5% |
| Jamaican | 995 | 7.3% |
| Laotian | 12 | 0.1% |
| Mexican | 56 | 0.4% |
| Nigerian | 15 | 0.1% |
| Peruvian | 73 | 0.5% |
| Polish | 136 | 1.0% |
| Puerto Rican | 919 | 6.8% |
| Salvadoran | 2,233 | 16.4% |
| South American | 122 | 0.9% |
| Subsaharan African | 122 | 0.9% |
| Swedish | 5 | 0.0% |
| Syrian | 14 | 0.1% |
| Thai | 101 | 0.7% |
| Trinidadian and Tobagonian | 16 | 0.1% |
| West Indian | 61 | 0.4% | View All 31 Rows |
Immigrants in Wyandanch
The most numerous immigrant groups reported in Wyandanch came from Latin America (3,578 | 26.3%), Caribbean (2,025 | 14.9%), Central America (1,312 | 9.7%), El Salvador (1,127 | 8.3%), and Haiti (696 | 5.1%), together accounting for 64.3% of all Wyandanch residents.
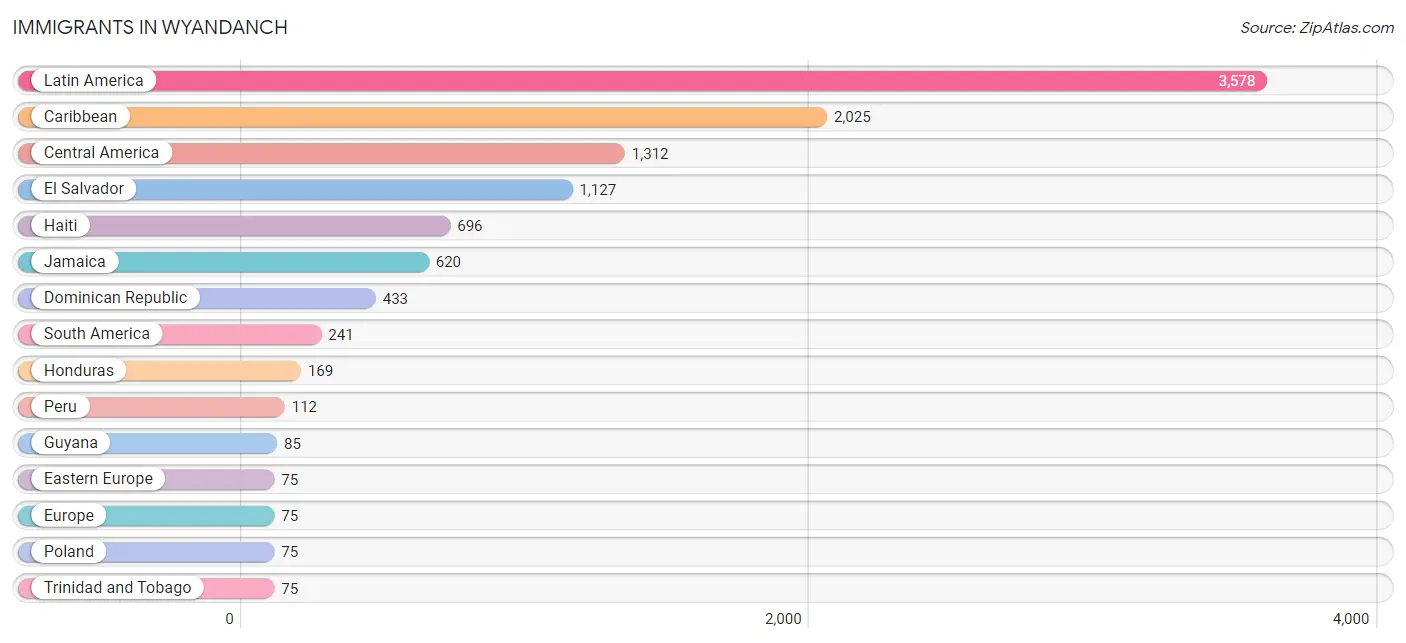
| Immigration Origin | # Population | % Population |
| Africa | 36 | 0.3% |
| Asia | 22 | 0.2% |
| Barbados | 21 | 0.2% |
| Caribbean | 2,025 | 14.9% |
| Central America | 1,312 | 9.7% |
| Colombia | 44 | 0.3% |
| Cuba | 27 | 0.2% |
| Dominican Republic | 433 | 3.2% |
| Eastern Europe | 75 | 0.5% |
| El Salvador | 1,127 | 8.3% |
| Europe | 75 | 0.5% |
| Grenada | 21 | 0.2% |
| Guyana | 85 | 0.6% |
| Haiti | 696 | 5.1% |
| Honduras | 169 | 1.2% |
| India | 10 | 0.1% |
| Indonesia | 12 | 0.1% |
| Jamaica | 620 | 4.6% |
| Latin America | 3,578 | 26.3% |
| Mexico | 16 | 0.1% |
| Nigeria | 36 | 0.3% |
| Peru | 112 | 0.8% |
| Poland | 75 | 0.5% |
| South America | 241 | 1.8% |
| South Central Asia | 10 | 0.1% |
| South Eastern Asia | 12 | 0.1% |
| St. Vincent and the Grenadines | 23 | 0.2% |
| Trinidad and Tobago | 75 | 0.5% |
| West Indies | 26 | 0.2% |
| Western Africa | 36 | 0.3% | View All 30 Rows |
Sex and Age in Wyandanch
Sex and Age in Wyandanch
The most populous age groups in Wyandanch are 20 to 24 Years (656 | 9.4%) for men and 5 to 9 Years (628 | 9.5%) for women.
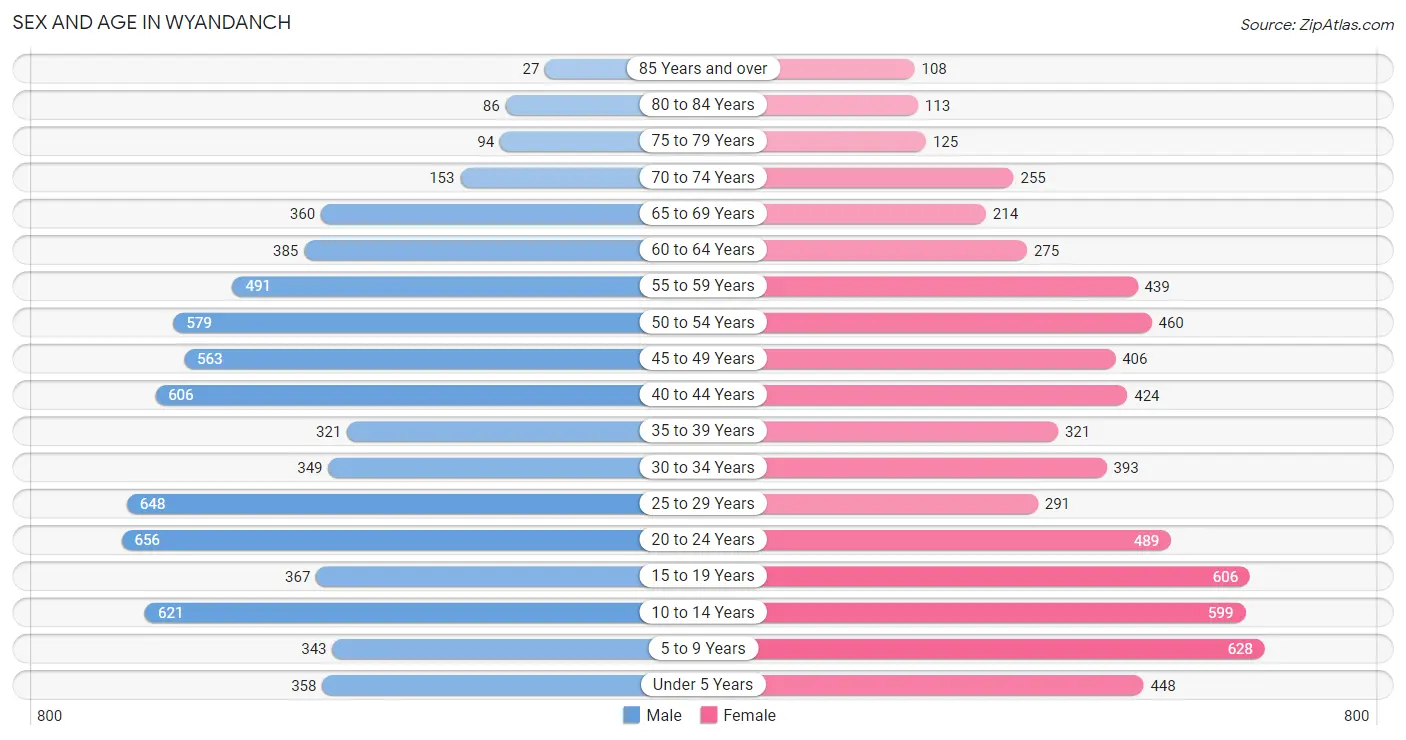
| Age Bracket | Male | Female |
| Under 5 Years | 358 (5.1%) | 448 (6.8%) |
| 5 to 9 Years | 343 (4.9%) | 628 (9.5%) |
| 10 to 14 Years | 621 (8.9%) | 599 (9.1%) |
| 15 to 19 Years | 367 (5.2%) | 606 (9.2%) |
| 20 to 24 Years | 656 (9.4%) | 489 (7.4%) |
| 25 to 29 Years | 648 (9.2%) | 291 (4.4%) |
| 30 to 34 Years | 349 (5.0%) | 393 (6.0%) |
| 35 to 39 Years | 321 (4.6%) | 321 (4.9%) |
| 40 to 44 Years | 606 (8.6%) | 424 (6.4%) |
| 45 to 49 Years | 563 (8.0%) | 406 (6.2%) |
| 50 to 54 Years | 579 (8.3%) | 460 (7.0%) |
| 55 to 59 Years | 491 (7.0%) | 439 (6.7%) |
| 60 to 64 Years | 385 (5.5%) | 275 (4.2%) |
| 65 to 69 Years | 360 (5.1%) | 214 (3.3%) |
| 70 to 74 Years | 153 (2.2%) | 255 (3.9%) |
| 75 to 79 Years | 94 (1.3%) | 125 (1.9%) |
| 80 to 84 Years | 86 (1.2%) | 113 (1.7%) |
| 85 Years and over | 27 (0.4%) | 108 (1.6%) |
| Total | 7,007 (100.0%) | 6,594 (100.0%) |
Families and Households in Wyandanch
Median Family Size in Wyandanch
The median family size in Wyandanch is 4.20 persons per family, with single female/mother families (808 | 32.0%) accounting for the largest median family size of 5.16 persons per family. On the other hand, single male/father families (535 | 21.2%) represent the smallest median family size with 3.16 persons per family.
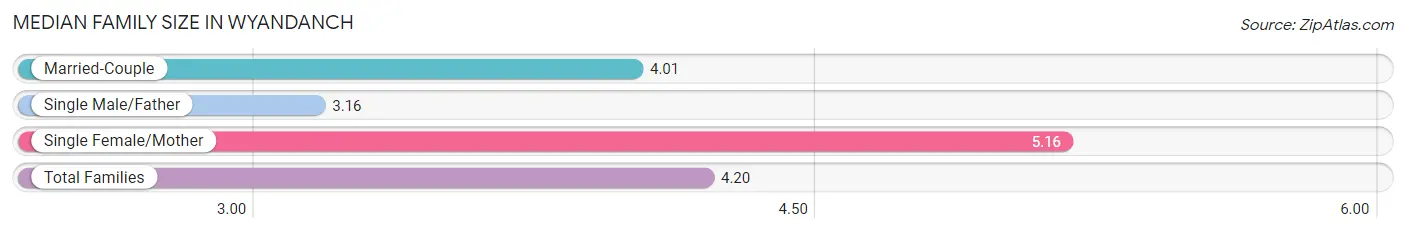
| Family Type | # Families | Family Size |
| Married-Couple | 1,180 (46.8%) | 4.01 |
| Single Male/Father | 535 (21.2%) | 3.16 |
| Single Female/Mother | 808 (32.0%) | 5.16 |
| Total Families | 2,523 (100.0%) | 4.20 |
Median Household Size in Wyandanch
The median household size in Wyandanch is 3.58 persons per household, with single female/mother households (808 | 21.3%) accounting for the largest median household size of 5.38 persons per household. non-family households (1,262 | 33.3%) represent the smallest median household size with 1.44 persons per household.
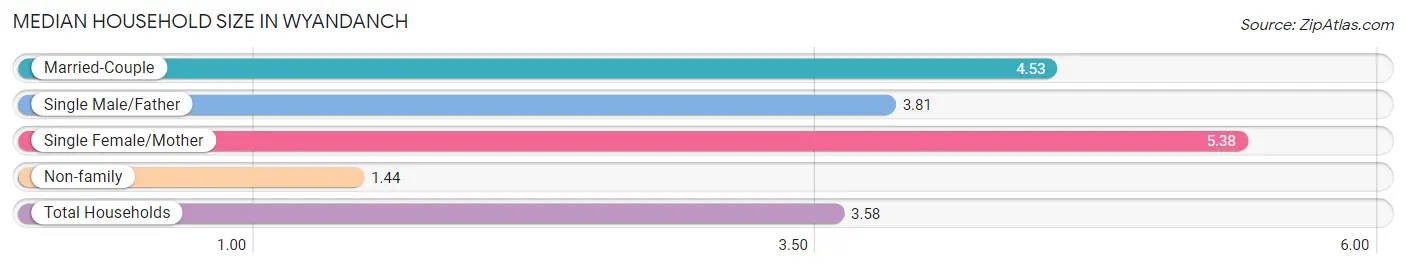
| Household Type | # Households | Household Size |
| Married-Couple | 1,180 (31.2%) | 4.53 |
| Single Male/Father | 535 (14.1%) | 3.81 |
| Single Female/Mother | 808 (21.3%) | 5.38 |
| Non-family | 1,262 (33.3%) | 1.44 |
| Total Households | 3,785 (100.0%) | 3.58 |
Household Size by Marriage Status in Wyandanch
Out of a total of 3,785 households in Wyandanch, 2,523 (66.7%) are family households, while 1,262 (33.3%) are nonfamily households. The most numerous type of family households are 3-person households, comprising 590, and the most common type of nonfamily households are 1-person households, comprising 997.
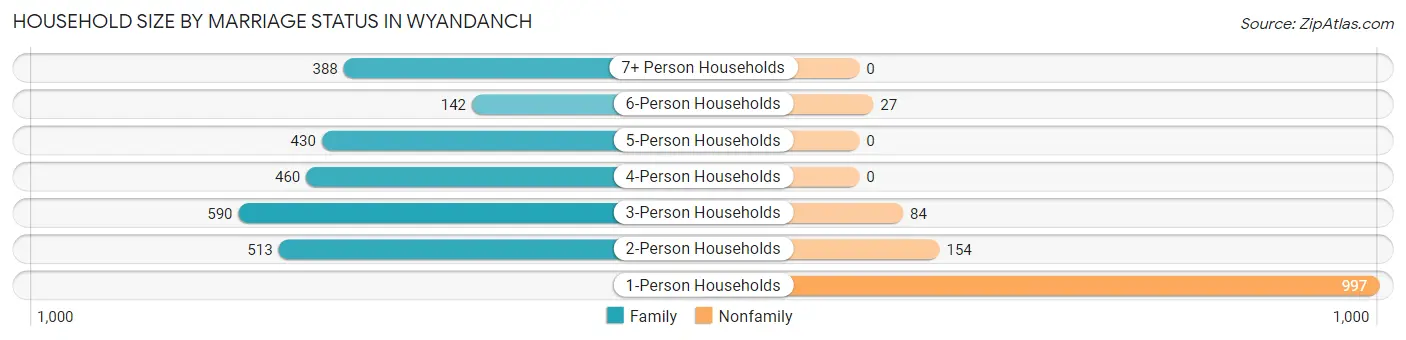
| Household Size | Family Households | Nonfamily Households |
| 1-Person Households | - | 997 (26.3%) |
| 2-Person Households | 513 (13.6%) | 154 (4.1%) |
| 3-Person Households | 590 (15.6%) | 84 (2.2%) |
| 4-Person Households | 460 (12.1%) | 0 (0.0%) |
| 5-Person Households | 430 (11.4%) | 0 (0.0%) |
| 6-Person Households | 142 (3.7%) | 27 (0.7%) |
| 7+ Person Households | 388 (10.2%) | 0 (0.0%) |
| Total | 2,523 (66.7%) | 1,262 (33.3%) |
Female Fertility in Wyandanch
Fertility by Age in Wyandanch
Average fertility rate in Wyandanch is 38.0 births per 1,000 women. Women in the age bracket of 20 to 34 years have the highest fertility rate with 72.0 births per 1,000 women. Women in the age bracket of 20 to 34 years acount for 71.8% of all women with births.
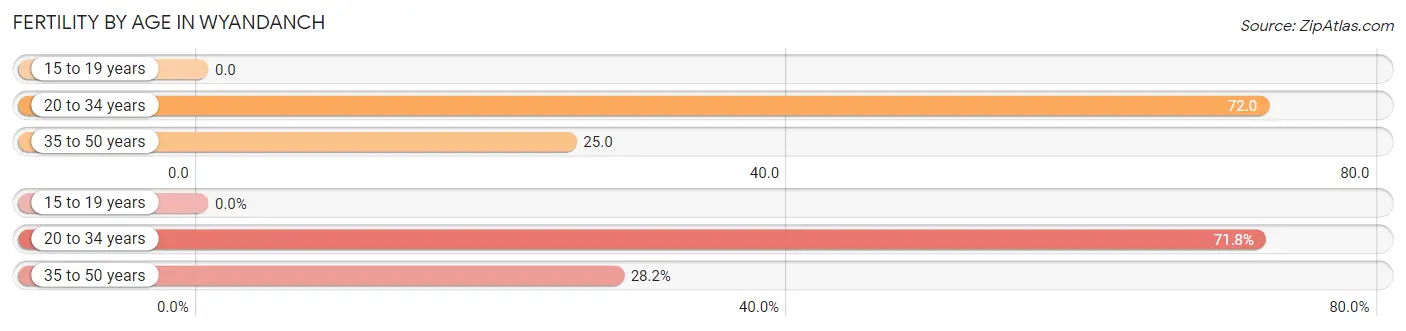
| Age Bracket | Women with Births | Births / 1,000 Women |
| 15 to 19 years | 0 (0.0%) | 0.0 |
| 20 to 34 years | 84 (71.8%) | 72.0 |
| 35 to 50 years | 33 (28.2%) | 25.0 |
| Total | 117 (100.0%) | 38.0 |
Fertility by Age by Marriage Status in Wyandanch
36.8% of women with births (117) in Wyandanch are married. The highest percentage of unmarried women with births falls into 20 to 34 years age bracket with 88.1% of them unmarried at the time of birth, while the lowest percentage of unmarried women with births belong to 35 to 50 years age bracket with 0.0% of them unmarried.
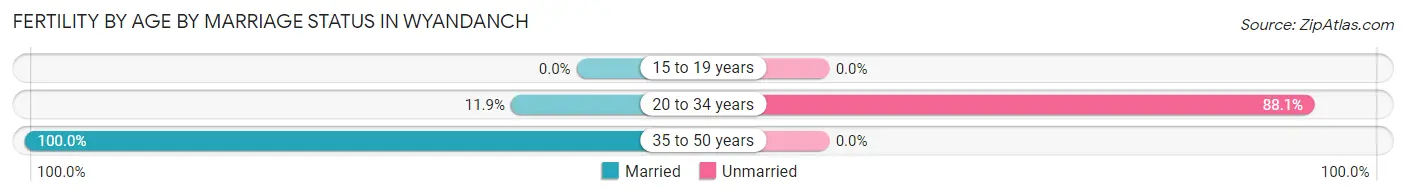
| Age Bracket | Married | Unmarried |
| 15 to 19 years | 0 (0.0%) | 0 (0.0%) |
| 20 to 34 years | 10 (11.9%) | 74 (88.1%) |
| 35 to 50 years | 33 (100.0%) | 0 (0.0%) |
| Total | 43 (36.7%) | 74 (63.2%) |
Fertility by Education in Wyandanch
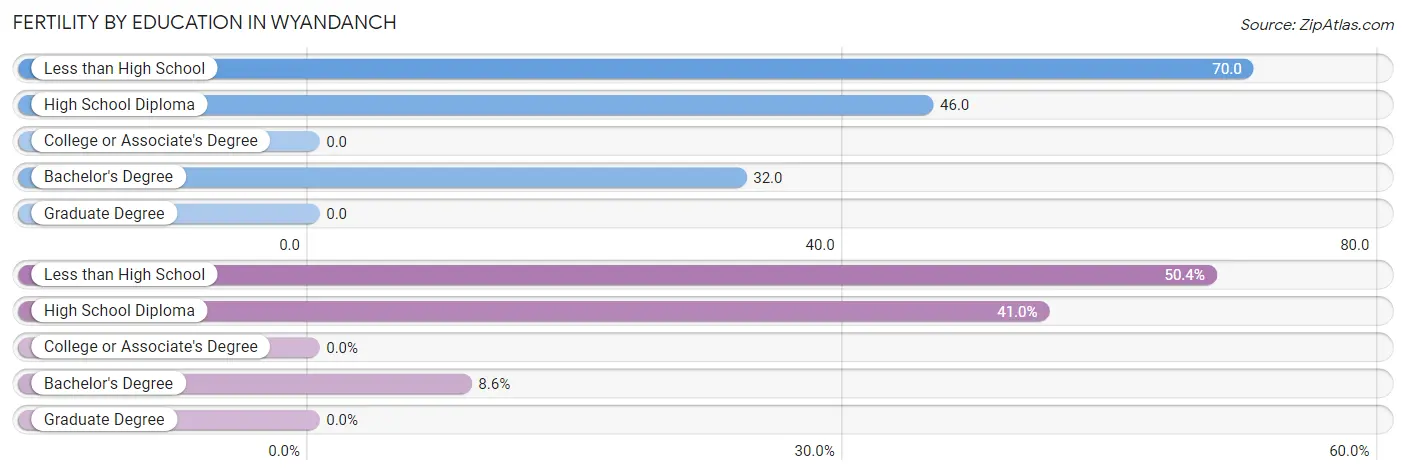
| Educational Attainment | Women with Births | Births / 1,000 Women |
| Less than High School | 59 (50.4%) | 70.0 |
| High School Diploma | 48 (41.0%) | 46.0 |
| College or Associate's Degree | 0 (0.0%) | 0.0 |
| Bachelor's Degree | 10 (8.6%) | 32.0 |
| Graduate Degree | 0 (0.0%) | 0.0 |
| Total | 117 (100.0%) | 38.0 |
Fertility by Education by Marriage Status in Wyandanch
63.2% of women with births in Wyandanch are unmarried. Women with the educational attainment of bachelor's degree are most likely to be married with 100.0% of them married at childbirth, while women with the educational attainment of high school diploma are least likely to be married with 100.0% of them unmarried at childbirth.
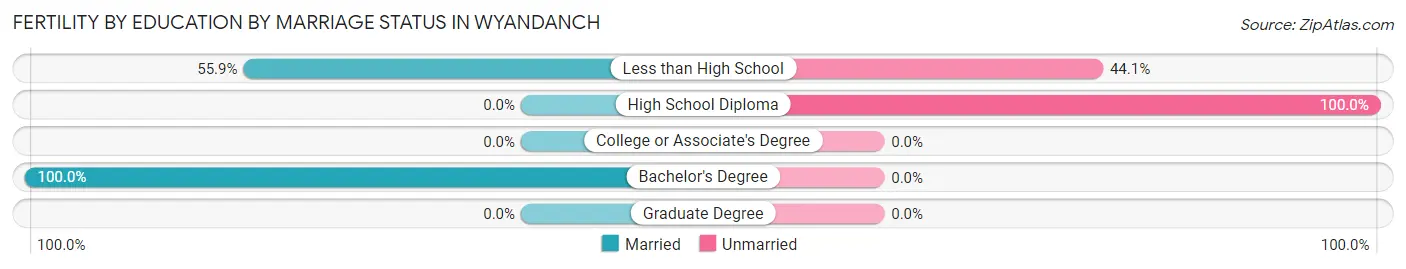
| Educational Attainment | Married | Unmarried |
| Less than High School | 33 (55.9%) | 26 (44.1%) |
| High School Diploma | 0 (0.0%) | 48 (100.0%) |
| College or Associate's Degree | 0 (0.0%) | 0 (0.0%) |
| Bachelor's Degree | 10 (100.0%) | 0 (0.0%) |
| Graduate Degree | 0 (0.0%) | 0 (0.0%) |
| Total | 43 (36.7%) | 74 (63.2%) |
Employment Characteristics in Wyandanch
Employment by Class of Employer in Wyandanch
Among the 6,440 employed individuals in Wyandanch, private company employees (4,385 | 68.1%), not-for-profit organizations (634 | 9.8%), and local government employees (403 | 6.3%) make up the most common classes of employment.
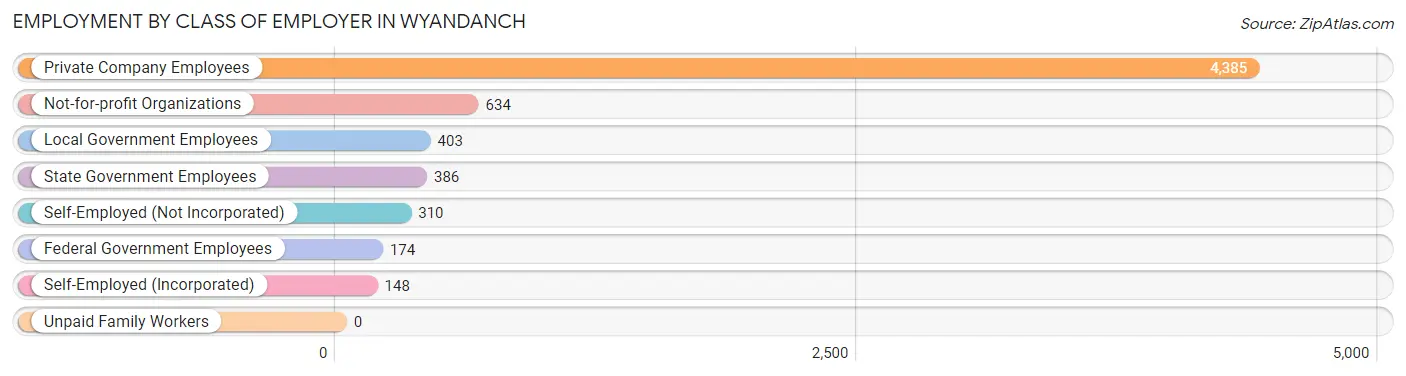
| Employer Class | # Employees | % Employees |
| Private Company Employees | 4,385 | 68.1% |
| Self-Employed (Incorporated) | 148 | 2.3% |
| Self-Employed (Not Incorporated) | 310 | 4.8% |
| Not-for-profit Organizations | 634 | 9.8% |
| Local Government Employees | 403 | 6.3% |
| State Government Employees | 386 | 6.0% |
| Federal Government Employees | 174 | 2.7% |
| Unpaid Family Workers | 0 | 0.0% |
| Total | 6,440 | 100.0% |
Employment Status by Age in Wyandanch
According to the labor force statistics for Wyandanch, out of the total population over 16 years of age (10,492), 66.8% or 7,009 individuals are in the labor force, with 5.7% or 400 of them unemployed. The age group with the highest labor force participation rate is 30 to 34 years, with 92.2% or 684 individuals in the labor force. Within the labor force, the 20 to 24 years age range has the highest percentage of unemployed individuals, with 12.6% or 129 of them being unemployed.
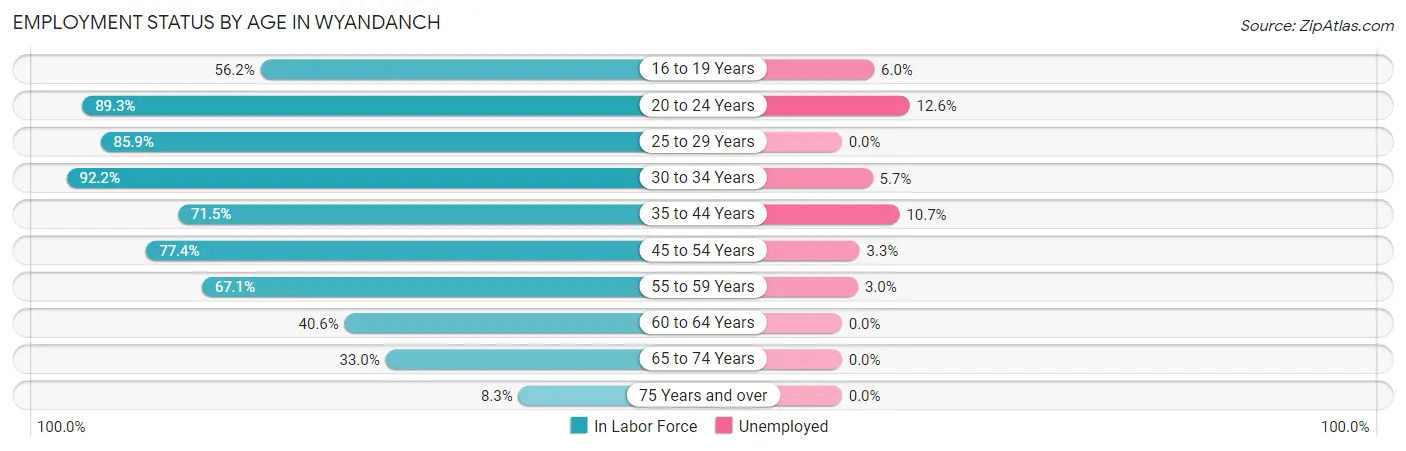
| Age Bracket | In Labor Force | Unemployed |
| 16 to 19 Years | 484 (56.2%) | 29 (6.0%) |
| 20 to 24 Years | 1,022 (89.3%) | 129 (12.6%) |
| 25 to 29 Years | 807 (85.9%) | 0 (0.0%) |
| 30 to 34 Years | 684 (92.2%) | 39 (5.7%) |
| 35 to 44 Years | 1,195 (71.5%) | 128 (10.7%) |
| 45 to 54 Years | 1,554 (77.4%) | 51 (3.3%) |
| 55 to 59 Years | 624 (67.1%) | 19 (3.0%) |
| 60 to 64 Years | 268 (40.6%) | 0 (0.0%) |
| 65 to 74 Years | 324 (33.0%) | 0 (0.0%) |
| 75 Years and over | 46 (8.3%) | 0 (0.0%) |
| Total | 7,009 (66.8%) | 400 (5.7%) |
Employment Status by Educational Attainment in Wyandanch
According to labor force statistics for Wyandanch, 73.8% of individuals (5,130) out of the total population between 25 and 64 years of age (6,951) are in the labor force, with 4.7% or 241 of them being unemployed. The group with the highest labor force participation rate are those with the educational attainment of high school diploma, with 76.7% or 1,770 individuals in the labor force. Within the labor force, individuals with college / associate degree education have the highest percentage of unemployment, with 11.9% or 128 of them being unemployed.
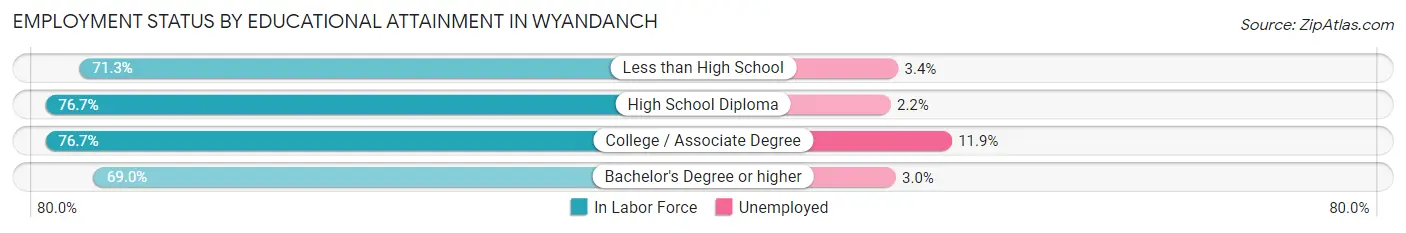
| Educational Attainment | In Labor Force | Unemployed |
| Less than High School | 1,517 (71.3%) | 72 (3.4%) |
| High School Diploma | 1,770 (76.7%) | 51 (2.2%) |
| College / Associate Degree | 1,077 (76.7%) | 167 (11.9%) |
| Bachelor's Degree or higher | 767 (69.0%) | 33 (3.0%) |
| Total | 5,130 (73.8%) | 327 (4.7%) |
Employment Occupations by Sex in Wyandanch
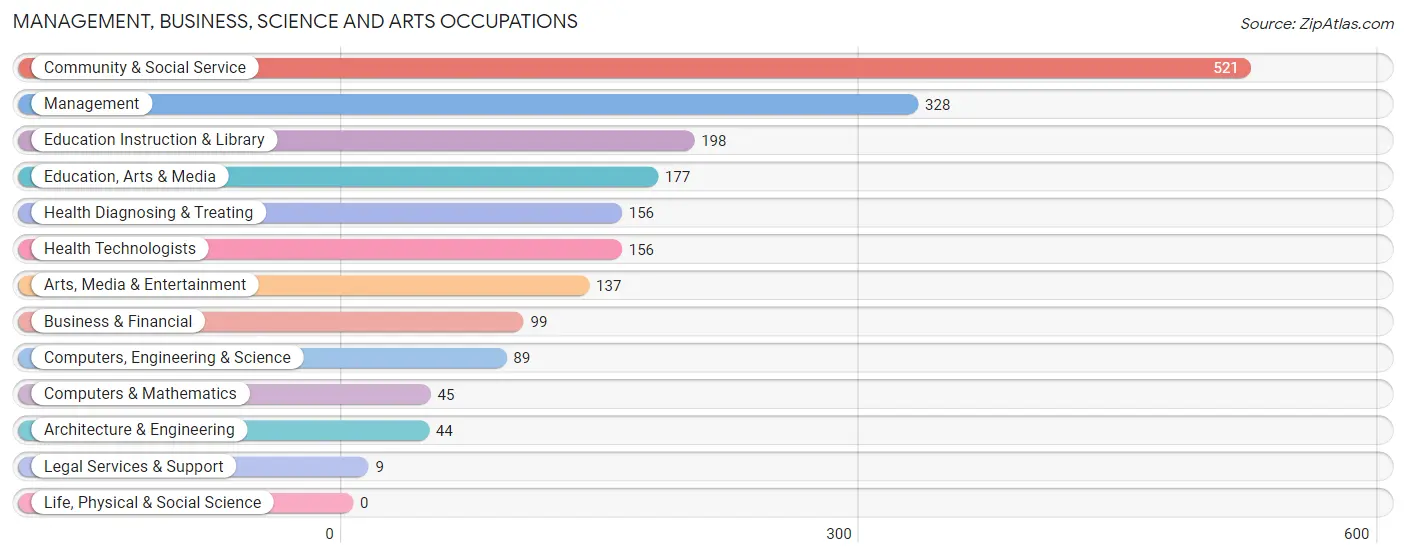
Management, Business, Science and Arts Occupations
The most common Management, Business, Science and Arts occupations in Wyandanch are Community & Social Service (521 | 8.0%), Management (328 | 5.0%), Education Instruction & Library (198 | 3.0%), Education, Arts & Media (177 | 2.7%), and Health Diagnosing & Treating (156 | 2.4%).
Management, Business, Science and Arts Occupations by Sex
Within the Management, Business, Science and Arts occupations in Wyandanch, the most male-oriented occupations are Computers, Engineering & Science (100.0%), Computers & Mathematics (100.0%), and Architecture & Engineering (100.0%), while the most female-oriented occupations are Education Instruction & Library (95.5%), Community & Social Service (62.4%), and Education, Arts & Media (62.2%).
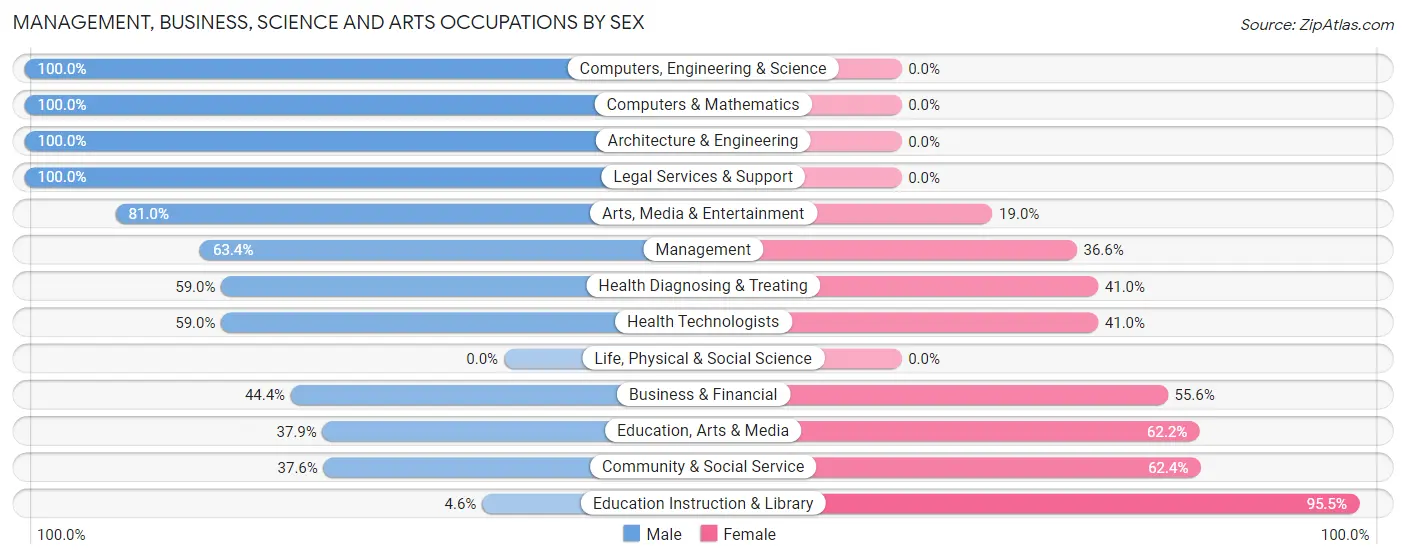
| Occupation | Male | Female |
| Management | 208 (63.4%) | 120 (36.6%) |
| Business & Financial | 44 (44.4%) | 55 (55.6%) |
| Computers, Engineering & Science | 89 (100.0%) | 0 (0.0%) |
| Computers & Mathematics | 45 (100.0%) | 0 (0.0%) |
| Architecture & Engineering | 44 (100.0%) | 0 (0.0%) |
| Life, Physical & Social Science | 0 (0.0%) | 0 (0.0%) |
| Community & Social Service | 196 (37.6%) | 325 (62.4%) |
| Education, Arts & Media | 67 (37.9%) | 110 (62.2%) |
| Legal Services & Support | 9 (100.0%) | 0 (0.0%) |
| Education Instruction & Library | 9 (4.5%) | 189 (95.5%) |
| Arts, Media & Entertainment | 111 (81.0%) | 26 (19.0%) |
| Health Diagnosing & Treating | 92 (59.0%) | 64 (41.0%) |
| Health Technologists | 92 (59.0%) | 64 (41.0%) |
| Total (Category) | 629 (52.7%) | 564 (47.3%) |
| Total (Overall) | 3,738 (57.1%) | 2,814 (42.9%) |
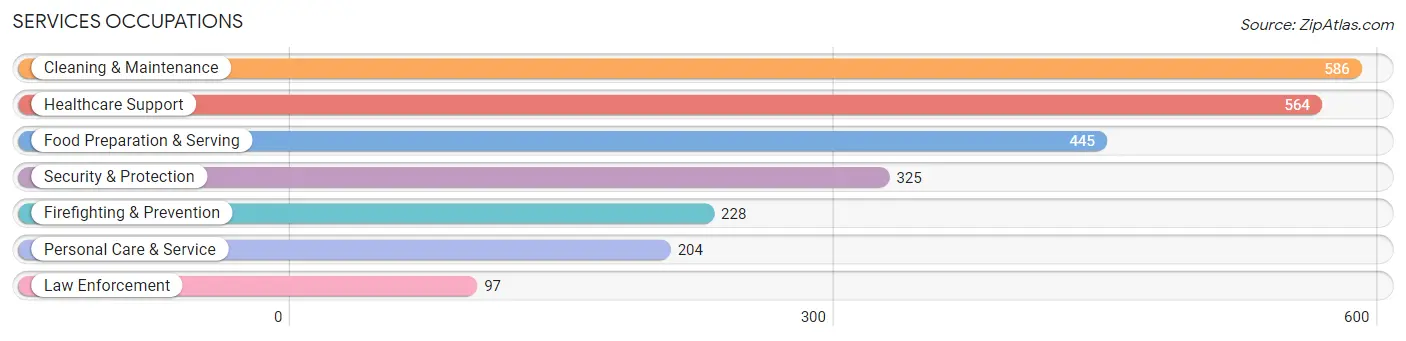
Services Occupations
The most common Services occupations in Wyandanch are Cleaning & Maintenance (586 | 8.9%), Healthcare Support (564 | 8.6%), Food Preparation & Serving (445 | 6.8%), Security & Protection (325 | 5.0%), and Firefighting & Prevention (228 | 3.5%).
Services Occupations by Sex
Within the Services occupations in Wyandanch, the most male-oriented occupations are Law Enforcement (100.0%), Security & Protection (90.8%), and Firefighting & Prevention (86.8%), while the most female-oriented occupations are Healthcare Support (87.6%), Food Preparation & Serving (68.1%), and Personal Care & Service (59.8%).
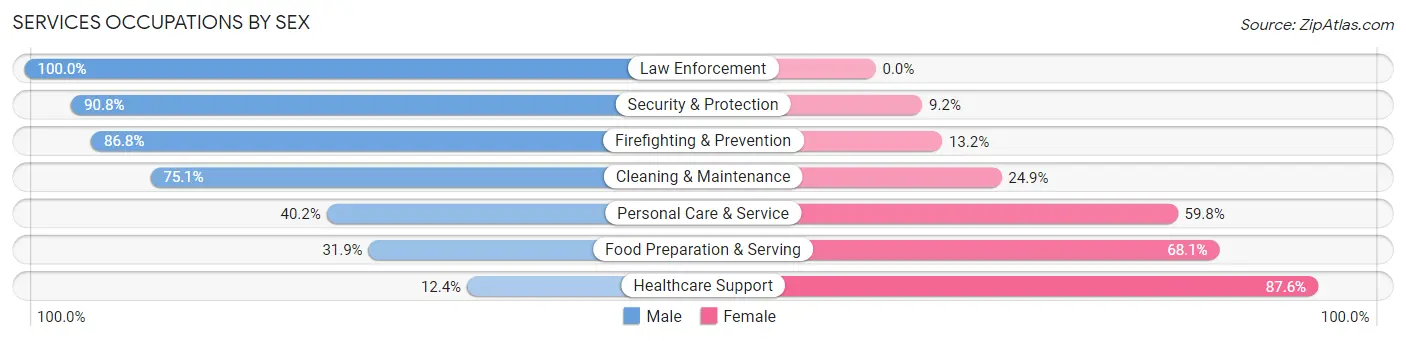
| Occupation | Male | Female |
| Healthcare Support | 70 (12.4%) | 494 (87.6%) |
| Security & Protection | 295 (90.8%) | 30 (9.2%) |
| Firefighting & Prevention | 198 (86.8%) | 30 (13.2%) |
| Law Enforcement | 97 (100.0%) | 0 (0.0%) |
| Food Preparation & Serving | 142 (31.9%) | 303 (68.1%) |
| Cleaning & Maintenance | 440 (75.1%) | 146 (24.9%) |
| Personal Care & Service | 82 (40.2%) | 122 (59.8%) |
| Total (Category) | 1,029 (48.4%) | 1,095 (51.5%) |
| Total (Overall) | 3,738 (57.1%) | 2,814 (42.9%) |
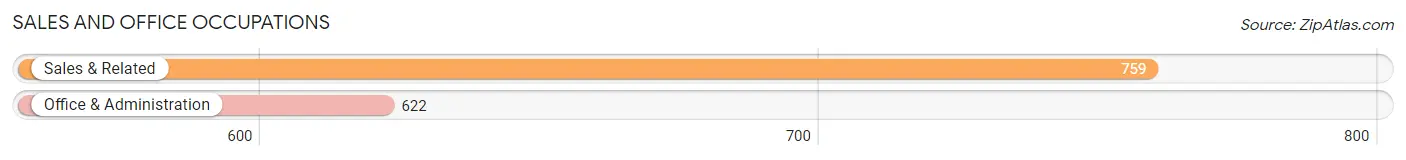
Sales and Office Occupations
The most common Sales and Office occupations in Wyandanch are Sales & Related (759 | 11.6%), and Office & Administration (622 | 9.5%).
Sales and Office Occupations by Sex
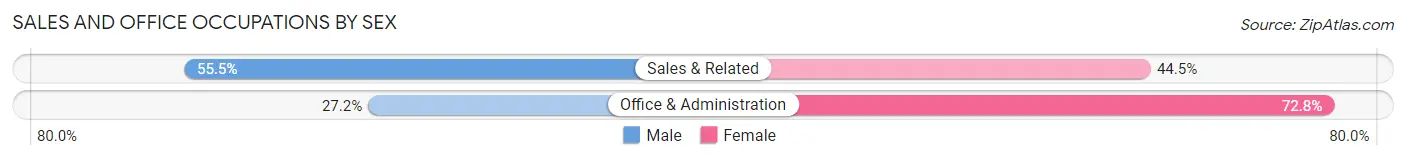
| Occupation | Male | Female |
| Sales & Related | 421 (55.5%) | 338 (44.5%) |
| Office & Administration | 169 (27.2%) | 453 (72.8%) |
| Total (Category) | 590 (42.7%) | 791 (57.3%) |
| Total (Overall) | 3,738 (57.1%) | 2,814 (42.9%) |
Natural Resources, Construction and Maintenance Occupations
The most common Natural Resources, Construction and Maintenance occupations in Wyandanch are Construction & Extraction (125 | 1.9%), Installation, Maintenance & Repair (117 | 1.8%), and Farming, Fishing & Forestry (23 | 0.4%).
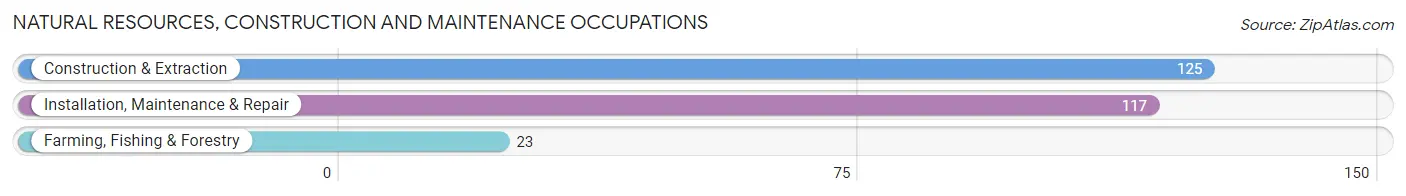
Natural Resources, Construction and Maintenance Occupations by Sex
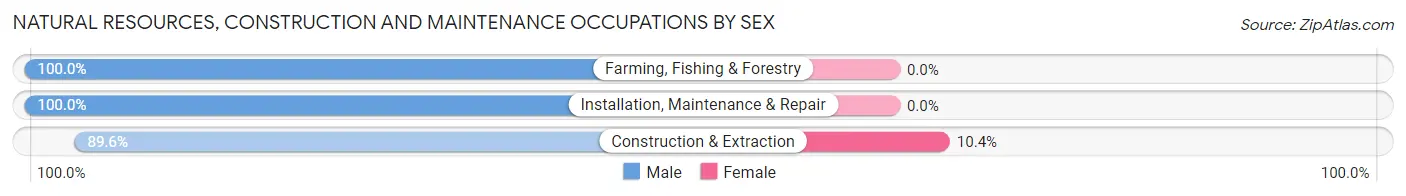
| Occupation | Male | Female |
| Farming, Fishing & Forestry | 23 (100.0%) | 0 (0.0%) |
| Construction & Extraction | 112 (89.6%) | 13 (10.4%) |
| Installation, Maintenance & Repair | 117 (100.0%) | 0 (0.0%) |
| Total (Category) | 252 (95.1%) | 13 (4.9%) |
| Total (Overall) | 3,738 (57.1%) | 2,814 (42.9%) |
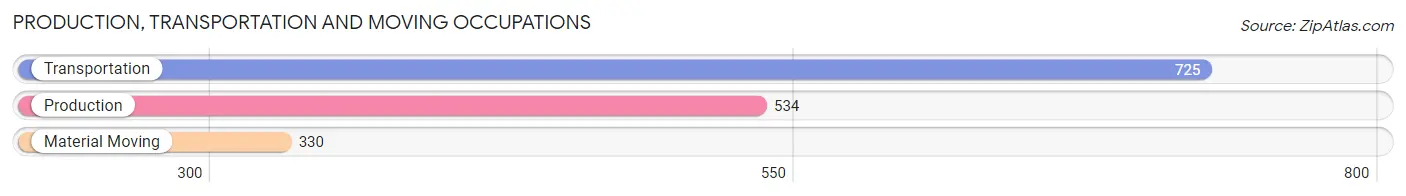
Production, Transportation and Moving Occupations
The most common Production, Transportation and Moving occupations in Wyandanch are Transportation (725 | 11.1%), Production (534 | 8.2%), and Material Moving (330 | 5.0%).
Production, Transportation and Moving Occupations by Sex
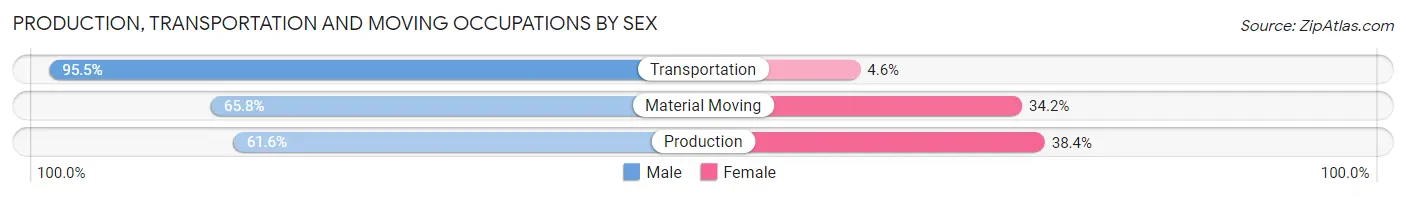
| Occupation | Male | Female |
| Production | 329 (61.6%) | 205 (38.4%) |
| Transportation | 692 (95.5%) | 33 (4.5%) |
| Material Moving | 217 (65.8%) | 113 (34.2%) |
| Total (Category) | 1,238 (77.9%) | 351 (22.1%) |
| Total (Overall) | 3,738 (57.1%) | 2,814 (42.9%) |
Employment Industries by Sex in Wyandanch
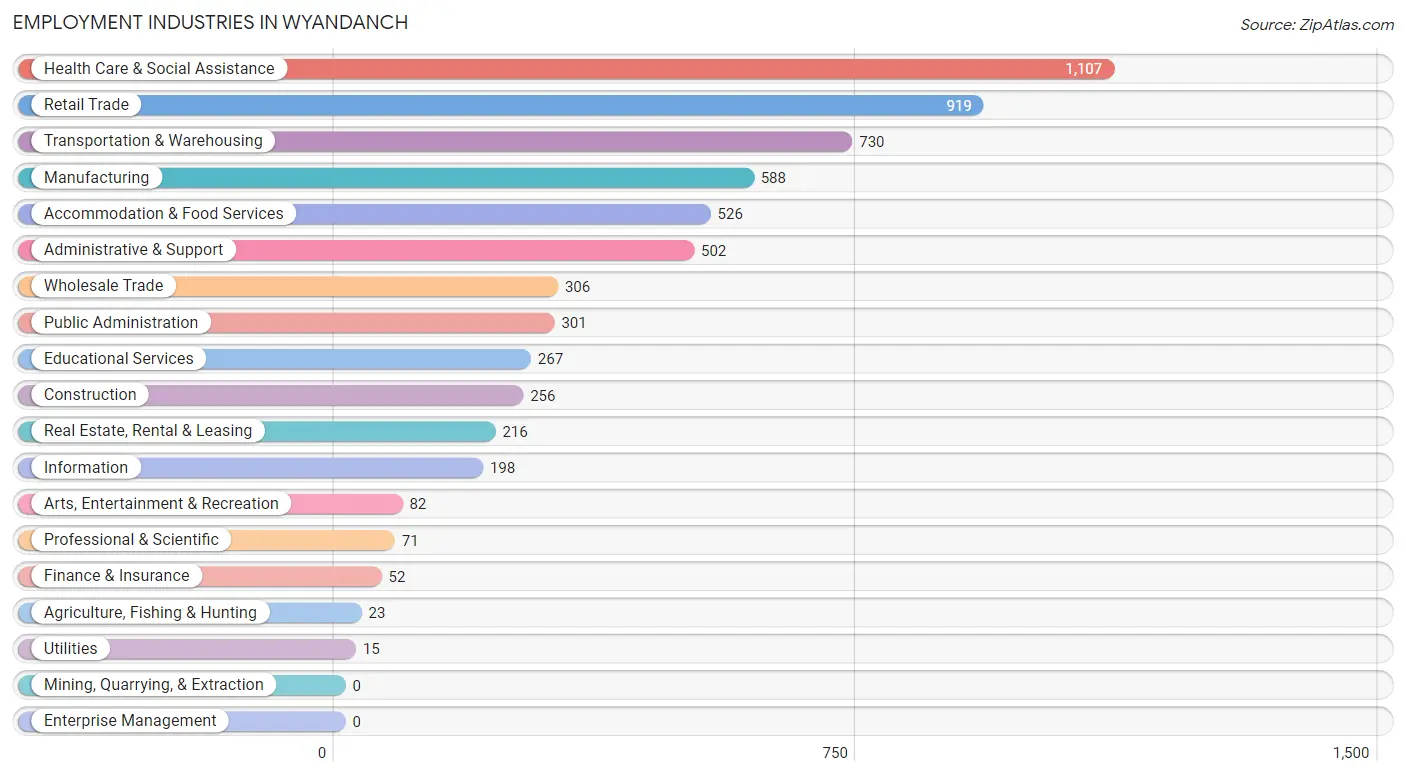
Employment Industries in Wyandanch
The major employment industries in Wyandanch include Health Care & Social Assistance (1,107 | 16.9%), Retail Trade (919 | 14.0%), Transportation & Warehousing (730 | 11.1%), Manufacturing (588 | 9.0%), and Accommodation & Food Services (526 | 8.0%).
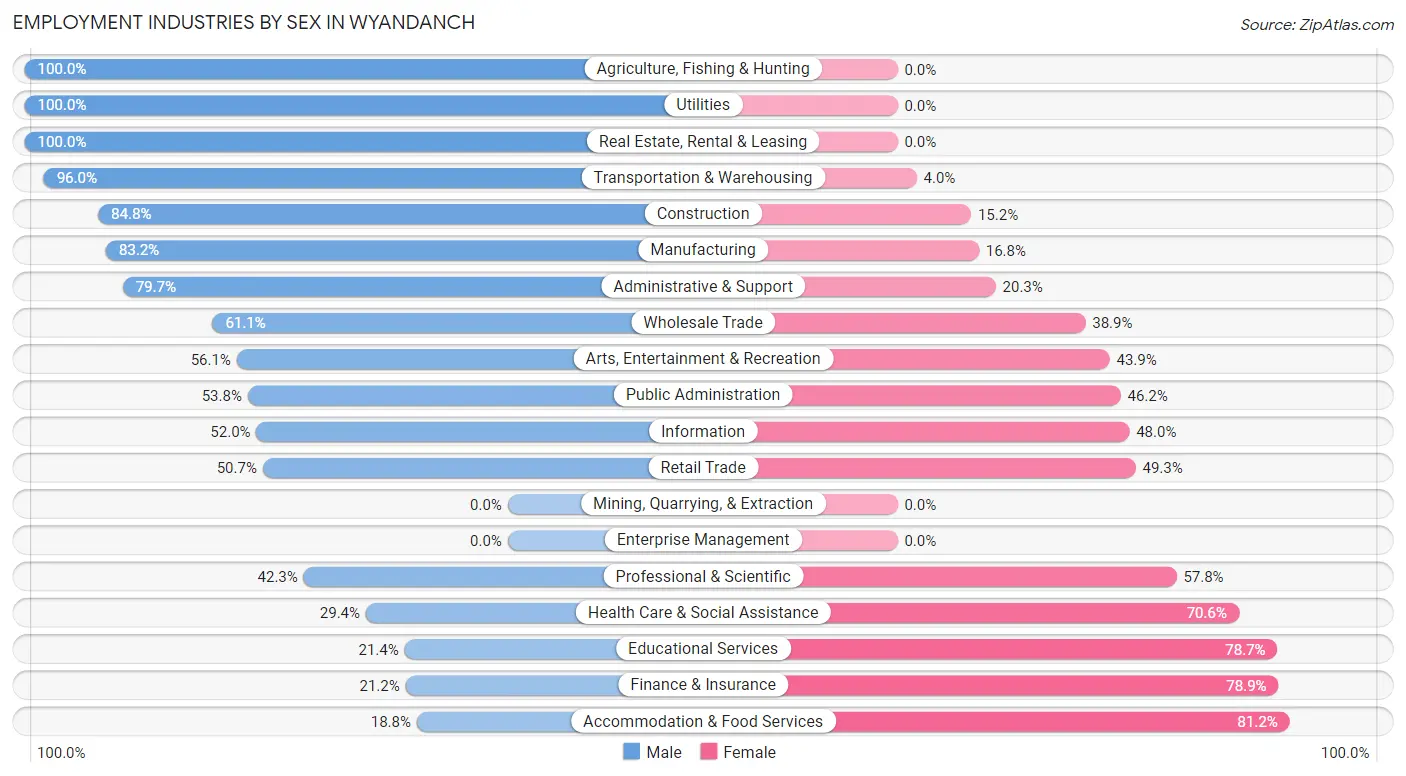
Employment Industries by Sex in Wyandanch
The Wyandanch industries that see more men than women are Agriculture, Fishing & Hunting (100.0%), Utilities (100.0%), and Real Estate, Rental & Leasing (100.0%), whereas the industries that tend to have a higher number of women are Accommodation & Food Services (81.2%), Finance & Insurance (78.8%), and Educational Services (78.6%).
| Industry | Male | Female |
| Agriculture, Fishing & Hunting | 23 (100.0%) | 0 (0.0%) |
| Mining, Quarrying, & Extraction | 0 (0.0%) | 0 (0.0%) |
| Construction | 217 (84.8%) | 39 (15.2%) |
| Manufacturing | 489 (83.2%) | 99 (16.8%) |
| Wholesale Trade | 187 (61.1%) | 119 (38.9%) |
| Retail Trade | 466 (50.7%) | 453 (49.3%) |
| Transportation & Warehousing | 701 (96.0%) | 29 (4.0%) |
| Utilities | 15 (100.0%) | 0 (0.0%) |
| Information | 103 (52.0%) | 95 (48.0%) |
| Finance & Insurance | 11 (21.1%) | 41 (78.8%) |
| Real Estate, Rental & Leasing | 216 (100.0%) | 0 (0.0%) |
| Professional & Scientific | 30 (42.2%) | 41 (57.8%) |
| Enterprise Management | 0 (0.0%) | 0 (0.0%) |
| Administrative & Support | 400 (79.7%) | 102 (20.3%) |
| Educational Services | 57 (21.3%) | 210 (78.6%) |
| Health Care & Social Assistance | 325 (29.4%) | 782 (70.6%) |
| Arts, Entertainment & Recreation | 46 (56.1%) | 36 (43.9%) |
| Accommodation & Food Services | 99 (18.8%) | 427 (81.2%) |
| Public Administration | 162 (53.8%) | 139 (46.2%) |
| Total | 3,738 (57.1%) | 2,814 (42.9%) |
Education in Wyandanch
School Enrollment in Wyandanch
The most common levels of schooling among the 3,628 students in Wyandanch are elementary school (963 | 26.5%), middle school (791 | 21.8%), and high school (733 | 20.2%).
| School Level | # Students | % Students |
| Nursery / Preschool | 78 | 2.1% |
| Kindergarten | 192 | 5.3% |
| Elementary School | 963 | 26.5% |
| Middle School | 791 | 21.8% |
| High School | 733 | 20.2% |
| College / Undergraduate | 699 | 19.3% |
| Graduate / Professional | 172 | 4.7% |
| Total | 3,628 | 100.0% |
School Enrollment by Age by Funding Source in Wyandanch
Out of a total of 3,628 students who are enrolled in schools in Wyandanch, 432 (11.9%) attend a private institution, while the remaining 3,196 (88.1%) are enrolled in public schools. The age group of 3 to 4 year olds has the highest likelihood of being enrolled in private schools, with 53 (98.2% in the age bracket) enrolled. Conversely, the age group of 10 to 14 year olds has the lowest likelihood of being enrolled in a private school, with 1,181 (98.3% in the age bracket) attending a public institution.
| Age Bracket | Public School | Private School |
| 3 to 4 Year Olds | 1 (1.8%) | 53 (98.2%) |
| 5 to 9 Year Old | 870 (91.3%) | 83 (8.7%) |
| 10 to 14 Year Olds | 1,181 (98.3%) | 21 (1.8%) |
| 15 to 17 Year Olds | 280 (94.9%) | 15 (5.1%) |
| 18 to 19 Year Olds | 366 (79.4%) | 95 (20.6%) |
| 20 to 24 Year Olds | 257 (91.5%) | 24 (8.5%) |
| 25 to 34 Year Olds | 130 (67.7%) | 62 (32.3%) |
| 35 Years and over | 110 (57.9%) | 80 (42.1%) |
| Total | 3,196 (88.1%) | 432 (11.9%) |
Educational Attainment by Field of Study in Wyandanch
Business (302 | 23.6%), science & technology (144 | 11.3%), arts & humanities (142 | 11.1%), computers & mathematics (118 | 9.2%), and engineering (113 | 8.8%) are the most common fields of study among 1,279 individuals in Wyandanch who have obtained a bachelor's degree or higher.
| Field of Study | # Graduates | % Graduates |
| Computers & Mathematics | 118 | 9.2% |
| Bio, Nature & Agricultural | 23 | 1.8% |
| Physical & Health Sciences | 10 | 0.8% |
| Psychology | 61 | 4.8% |
| Social Sciences | 74 | 5.8% |
| Engineering | 113 | 8.8% |
| Multidisciplinary Studies | 0 | 0.0% |
| Science & Technology | 144 | 11.3% |
| Business | 302 | 23.6% |
| Education | 97 | 7.6% |
| Literature & Languages | 43 | 3.4% |
| Liberal Arts & History | 36 | 2.8% |
| Visual & Performing Arts | 18 | 1.4% |
| Communications | 98 | 7.7% |
| Arts & Humanities | 142 | 11.1% |
| Total | 1,279 | 100.0% |
Transportation & Commute in Wyandanch
Vehicle Availability by Sex in Wyandanch
The most prevalent vehicle ownership categories in Wyandanch are males with 1 vehicle (1,007, accounting for 27.3%) and females with 1 vehicle (629, making up 36.7%).
| Vehicles Available | Male | Female |
| No Vehicle | 457 (12.4%) | 452 (16.5%) |
| 1 Vehicle | 1,007 (27.3%) | 629 (22.9%) |
| 2 Vehicles | 799 (21.6%) | 652 (23.8%) |
| 3 Vehicles | 928 (25.2%) | 660 (24.1%) |
| 4 Vehicles | 418 (11.3%) | 260 (9.5%) |
| 5 or more Vehicles | 81 (2.2%) | 89 (3.3%) |
| Total | 3,690 (100.0%) | 2,742 (100.0%) |
Commute Time in Wyandanch
The most frequently occuring commute durations in Wyandanch are 10 to 14 minutes (1,137 commuters, 18.0%), 20 to 24 minutes (1,005 commuters, 15.9%), and 5 to 9 minutes (843 commuters, 13.3%).
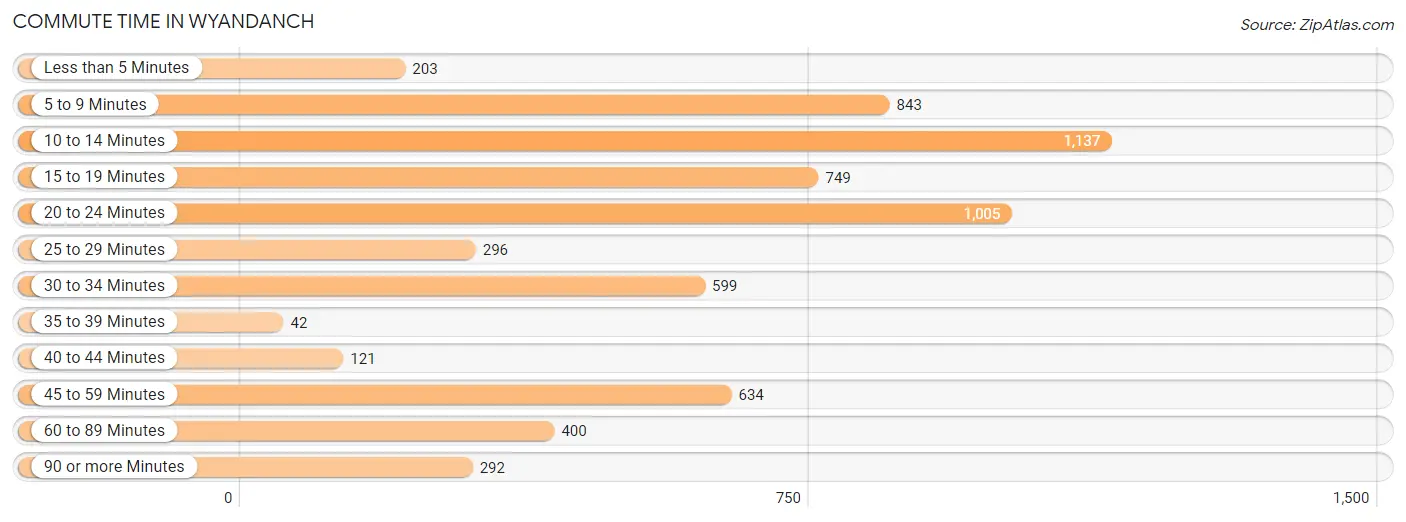
| Commute Time | # Commuters | % Commuters |
| Less than 5 Minutes | 203 | 3.2% |
| 5 to 9 Minutes | 843 | 13.3% |
| 10 to 14 Minutes | 1,137 | 18.0% |
| 15 to 19 Minutes | 749 | 11.8% |
| 20 to 24 Minutes | 1,005 | 15.9% |
| 25 to 29 Minutes | 296 | 4.7% |
| 30 to 34 Minutes | 599 | 9.5% |
| 35 to 39 Minutes | 42 | 0.7% |
| 40 to 44 Minutes | 121 | 1.9% |
| 45 to 59 Minutes | 634 | 10.0% |
| 60 to 89 Minutes | 400 | 6.3% |
| 90 or more Minutes | 292 | 4.6% |
Commute Time by Sex in Wyandanch
The most common commute times in Wyandanch are 20 to 24 minutes (538 commuters, 14.8%) for males and 10 to 14 minutes (680 commuters, 25.4%) for females.
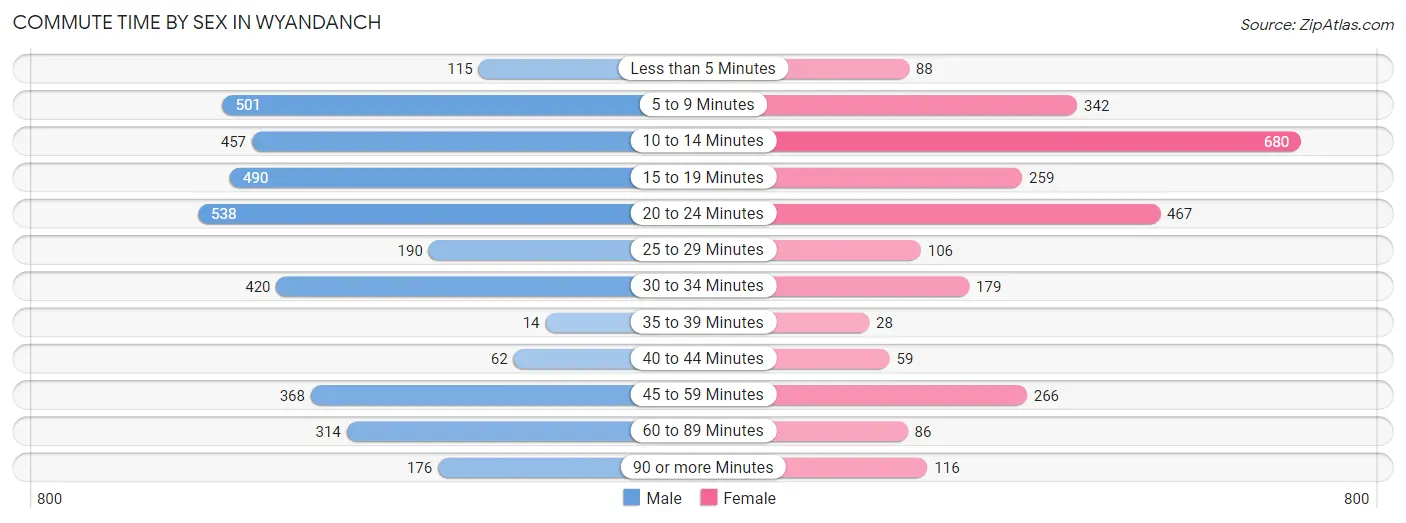
| Commute Time | Male | Female |
| Less than 5 Minutes | 115 (3.2%) | 88 (3.3%) |
| 5 to 9 Minutes | 501 (13.7%) | 342 (12.8%) |
| 10 to 14 Minutes | 457 (12.5%) | 680 (25.4%) |
| 15 to 19 Minutes | 490 (13.4%) | 259 (9.7%) |
| 20 to 24 Minutes | 538 (14.8%) | 467 (17.4%) |
| 25 to 29 Minutes | 190 (5.2%) | 106 (4.0%) |
| 30 to 34 Minutes | 420 (11.5%) | 179 (6.7%) |
| 35 to 39 Minutes | 14 (0.4%) | 28 (1.1%) |
| 40 to 44 Minutes | 62 (1.7%) | 59 (2.2%) |
| 45 to 59 Minutes | 368 (10.1%) | 266 (9.9%) |
| 60 to 89 Minutes | 314 (8.6%) | 86 (3.2%) |
| 90 or more Minutes | 176 (4.8%) | 116 (4.3%) |
Time of Departure to Work by Sex in Wyandanch
The most frequent times of departure to work in Wyandanch are 4:00 PM to 11:59 PM (672, 18.4%) for males and 12:00 PM to 3:59 PM (447, 16.7%) for females.
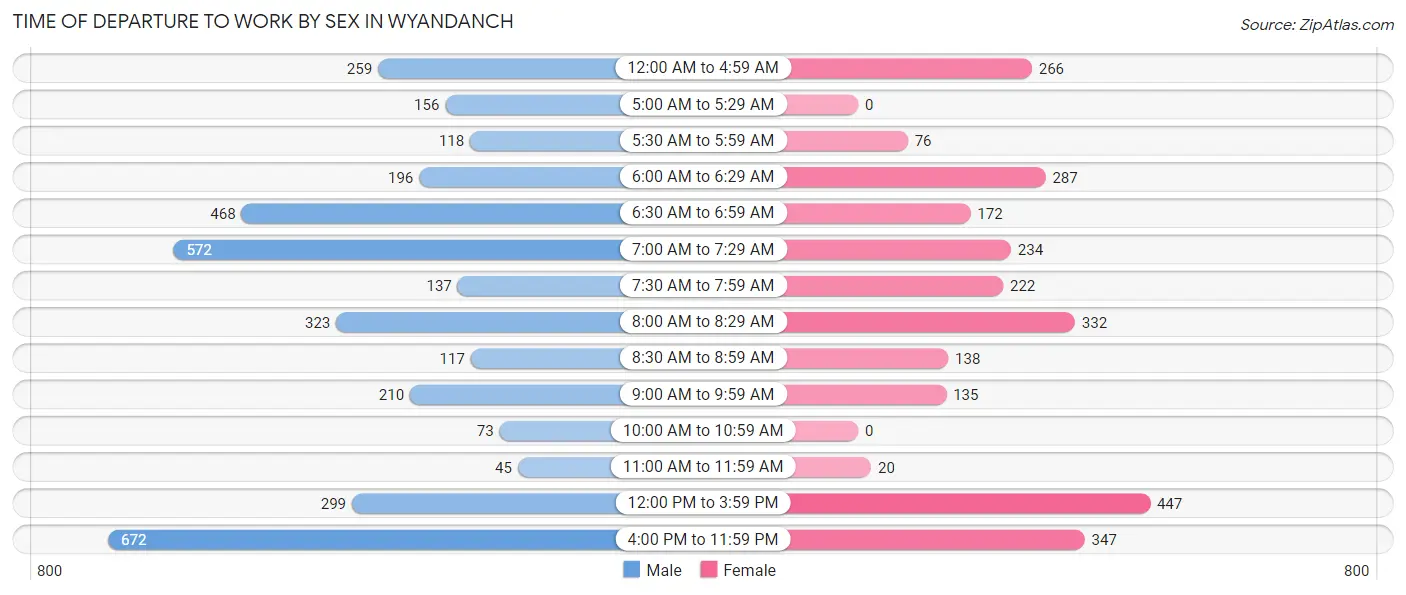
| Time of Departure | Male | Female |
| 12:00 AM to 4:59 AM | 259 (7.1%) | 266 (9.9%) |
| 5:00 AM to 5:29 AM | 156 (4.3%) | 0 (0.0%) |
| 5:30 AM to 5:59 AM | 118 (3.2%) | 76 (2.8%) |
| 6:00 AM to 6:29 AM | 196 (5.4%) | 287 (10.7%) |
| 6:30 AM to 6:59 AM | 468 (12.8%) | 172 (6.4%) |
| 7:00 AM to 7:29 AM | 572 (15.7%) | 234 (8.7%) |
| 7:30 AM to 7:59 AM | 137 (3.8%) | 222 (8.3%) |
| 8:00 AM to 8:29 AM | 323 (8.9%) | 332 (12.4%) |
| 8:30 AM to 8:59 AM | 117 (3.2%) | 138 (5.2%) |
| 9:00 AM to 9:59 AM | 210 (5.8%) | 135 (5.0%) |
| 10:00 AM to 10:59 AM | 73 (2.0%) | 0 (0.0%) |
| 11:00 AM to 11:59 AM | 45 (1.2%) | 20 (0.7%) |
| 12:00 PM to 3:59 PM | 299 (8.2%) | 447 (16.7%) |
| 4:00 PM to 11:59 PM | 672 (18.4%) | 347 (13.0%) |
| Total | 3,645 (100.0%) | 2,676 (100.0%) |
Housing Occupancy in Wyandanch
Occupancy by Ownership in Wyandanch
Of the total 3,785 dwellings in Wyandanch, owner-occupied units account for 2,476 (65.4%), while renter-occupied units make up 1,309 (34.6%).
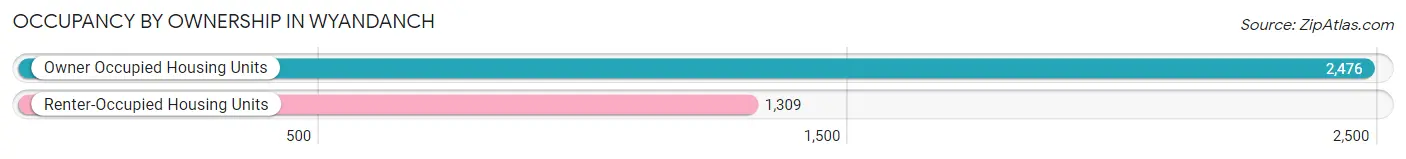
| Occupancy | # Housing Units | % Housing Units |
| Owner Occupied Housing Units | 2,476 | 65.4% |
| Renter-Occupied Housing Units | 1,309 | 34.6% |
| Total Occupied Housing Units | 3,785 | 100.0% |
Occupancy by Household Size in Wyandanch
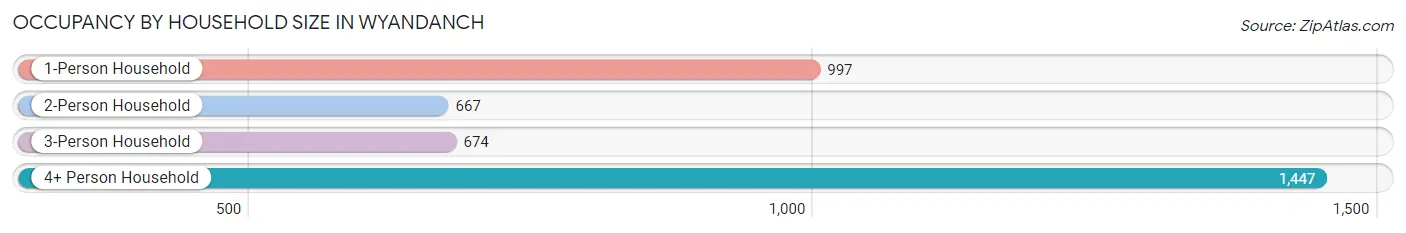
| Household Size | # Housing Units | % Housing Units |
| 1-Person Household | 997 | 26.3% |
| 2-Person Household | 667 | 17.6% |
| 3-Person Household | 674 | 17.8% |
| 4+ Person Household | 1,447 | 38.2% |
| Total Housing Units | 3,785 | 100.0% |
Occupancy by Ownership by Household Size in Wyandanch
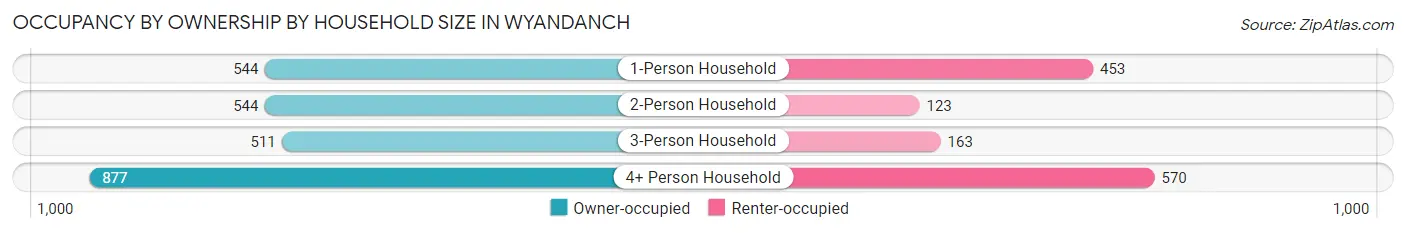
| Household Size | Owner-occupied | Renter-occupied |
| 1-Person Household | 544 (54.6%) | 453 (45.4%) |
| 2-Person Household | 544 (81.6%) | 123 (18.4%) |
| 3-Person Household | 511 (75.8%) | 163 (24.2%) |
| 4+ Person Household | 877 (60.6%) | 570 (39.4%) |
| Total Housing Units | 2,476 (65.4%) | 1,309 (34.6%) |
Occupancy by Educational Attainment in Wyandanch
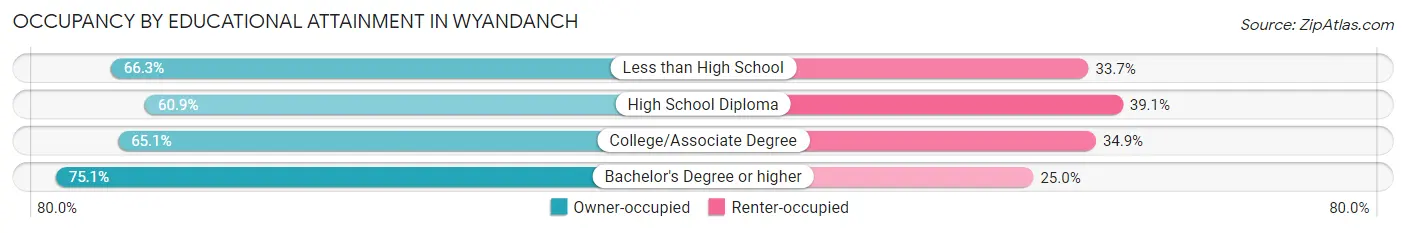
| Household Size | Owner-occupied | Renter-occupied |
| Less than High School | 817 (66.3%) | 415 (33.7%) |
| High School Diploma | 761 (60.9%) | 489 (39.1%) |
| College/Associate Degree | 525 (65.1%) | 281 (34.9%) |
| Bachelor's Degree or higher | 373 (75.0%) | 124 (24.9%) |
Occupancy by Age of Householder in Wyandanch
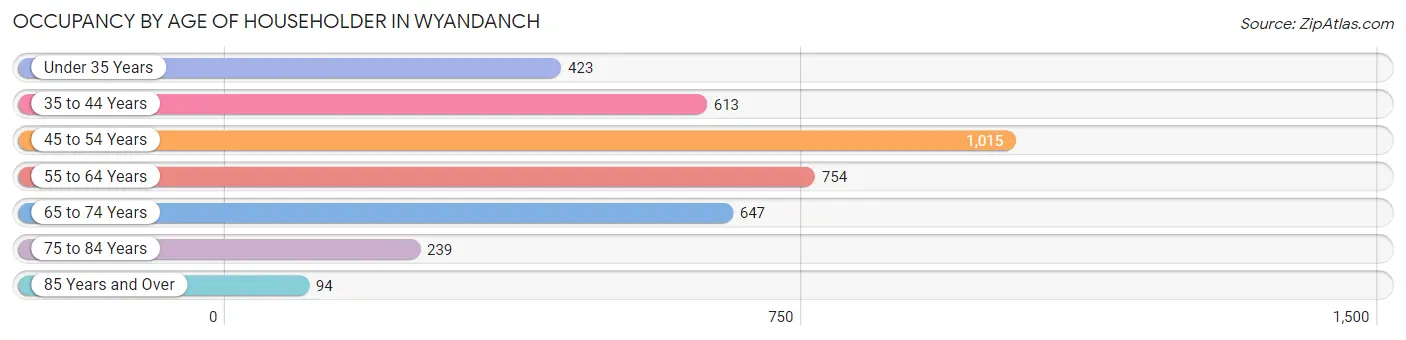
| Age Bracket | # Households | % Households |
| Under 35 Years | 423 | 11.2% |
| 35 to 44 Years | 613 | 16.2% |
| 45 to 54 Years | 1,015 | 26.8% |
| 55 to 64 Years | 754 | 19.9% |
| 65 to 74 Years | 647 | 17.1% |
| 75 to 84 Years | 239 | 6.3% |
| 85 Years and Over | 94 | 2.5% |
| Total | 3,785 | 100.0% |
Housing Finances in Wyandanch
Median Income by Occupancy in Wyandanch
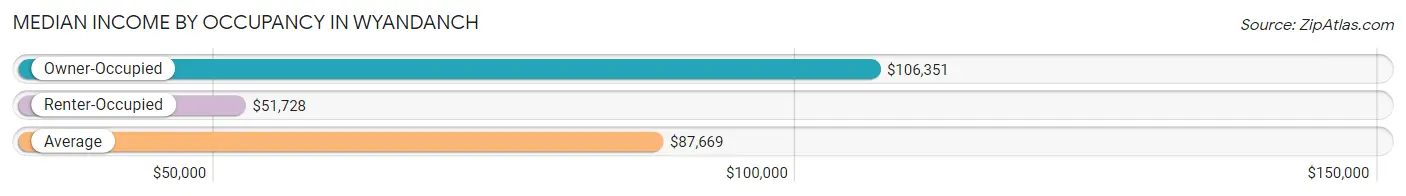
| Occupancy Type | # Households | Median Income |
| Owner-Occupied | 2,476 (65.4%) | $106,351 |
| Renter-Occupied | 1,309 (34.6%) | $51,728 |
| Average | 3,785 (100.0%) | $87,669 |
Occupancy by Householder Income Bracket in Wyandanch
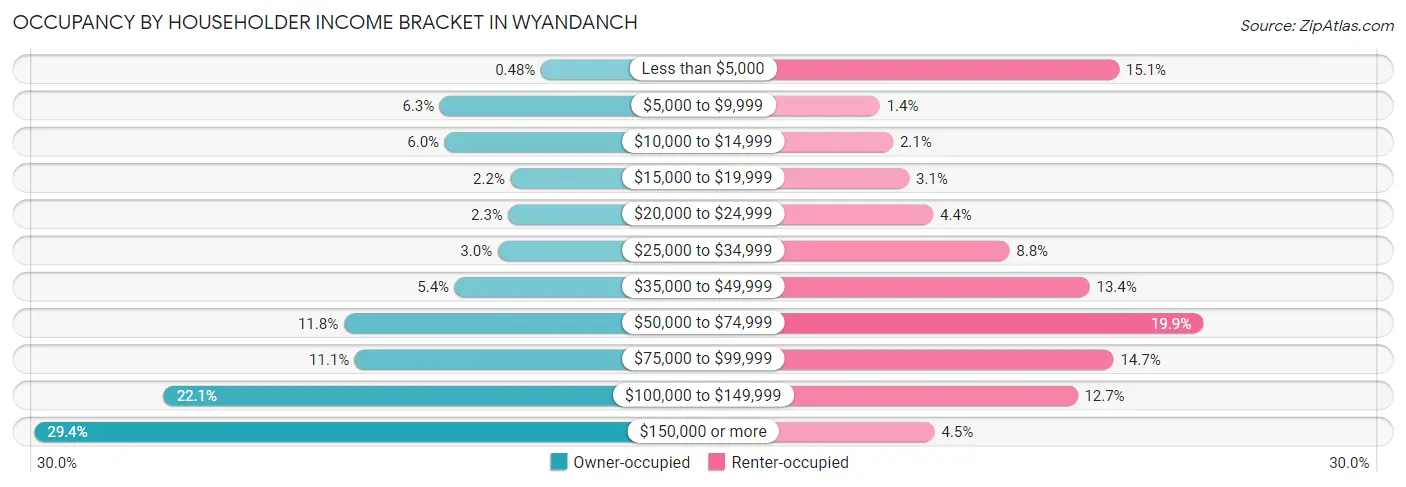
| Income Bracket | Owner-occupied | Renter-occupied |
| Less than $5,000 | 12 (0.5%) | 197 (15.0%) |
| $5,000 to $9,999 | 155 (6.3%) | 18 (1.4%) |
| $10,000 to $14,999 | 148 (6.0%) | 28 (2.1%) |
| $15,000 to $19,999 | 55 (2.2%) | 40 (3.1%) |
| $20,000 to $24,999 | 58 (2.3%) | 58 (4.4%) |
| $25,000 to $34,999 | 73 (2.9%) | 115 (8.8%) |
| $35,000 to $49,999 | 134 (5.4%) | 175 (13.4%) |
| $50,000 to $74,999 | 291 (11.7%) | 260 (19.9%) |
| $75,000 to $99,999 | 275 (11.1%) | 193 (14.7%) |
| $100,000 to $149,999 | 546 (22.1%) | 166 (12.7%) |
| $150,000 or more | 729 (29.4%) | 59 (4.5%) |
| Total | 2,476 (100.0%) | 1,309 (100.0%) |
Monthly Housing Cost Tiers in Wyandanch
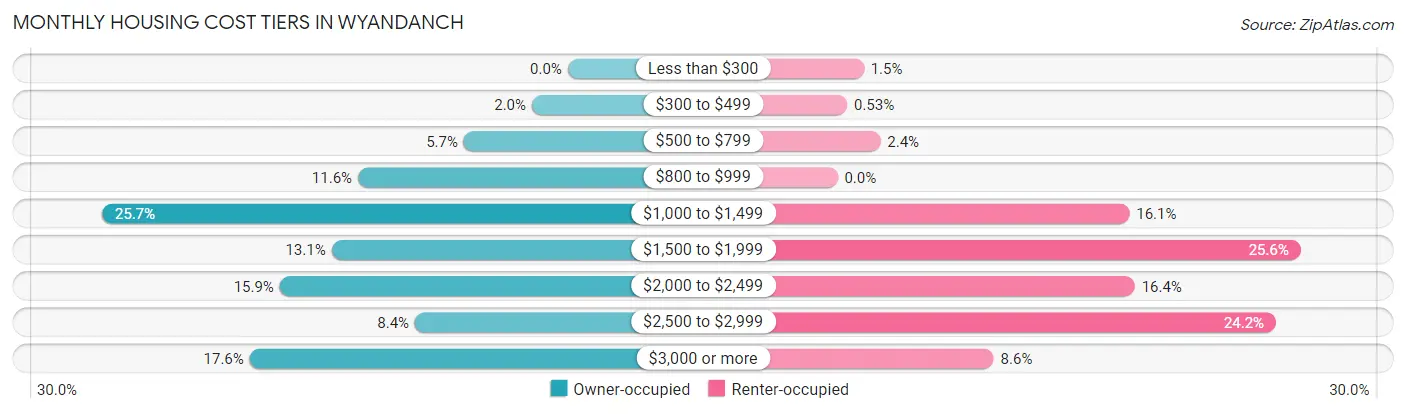
| Monthly Cost | Owner-occupied | Renter-occupied |
| Less than $300 | 0 (0.0%) | 19 (1.5%) |
| $300 to $499 | 49 (2.0%) | 7 (0.5%) |
| $500 to $799 | 142 (5.7%) | 31 (2.4%) |
| $800 to $999 | 287 (11.6%) | 0 (0.0%) |
| $1,000 to $1,499 | 637 (25.7%) | 211 (16.1%) |
| $1,500 to $1,999 | 323 (13.1%) | 335 (25.6%) |
| $2,000 to $2,499 | 394 (15.9%) | 215 (16.4%) |
| $2,500 to $2,999 | 209 (8.4%) | 317 (24.2%) |
| $3,000 or more | 435 (17.6%) | 113 (8.6%) |
| Total | 2,476 (100.0%) | 1,309 (100.0%) |
Physical Housing Characteristics in Wyandanch
Housing Structures in Wyandanch
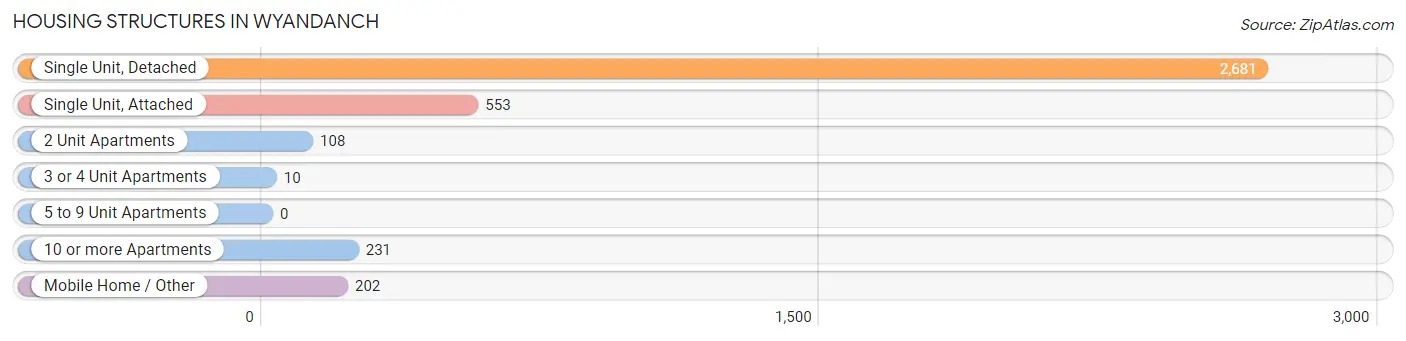
| Structure Type | # Housing Units | % Housing Units |
| Single Unit, Detached | 2,681 | 70.8% |
| Single Unit, Attached | 553 | 14.6% |
| 2 Unit Apartments | 108 | 2.9% |
| 3 or 4 Unit Apartments | 10 | 0.3% |
| 5 to 9 Unit Apartments | 0 | 0.0% |
| 10 or more Apartments | 231 | 6.1% |
| Mobile Home / Other | 202 | 5.3% |
| Total | 3,785 | 100.0% |
Housing Structures by Occupancy in Wyandanch
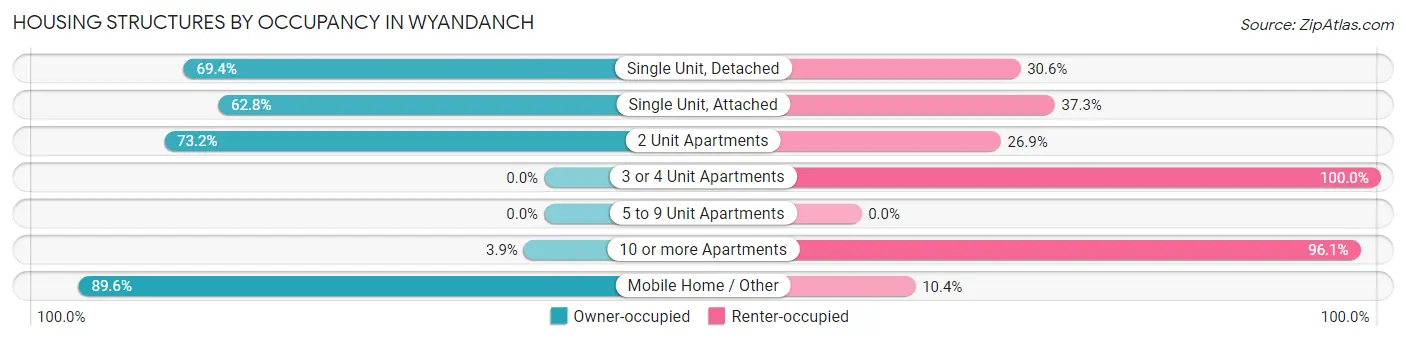
| Structure Type | Owner-occupied | Renter-occupied |
| Single Unit, Detached | 1,860 (69.4%) | 821 (30.6%) |
| Single Unit, Attached | 347 (62.7%) | 206 (37.2%) |
| 2 Unit Apartments | 79 (73.2%) | 29 (26.9%) |
| 3 or 4 Unit Apartments | 0 (0.0%) | 10 (100.0%) |
| 5 to 9 Unit Apartments | 0 (0.0%) | 0 (0.0%) |
| 10 or more Apartments | 9 (3.9%) | 222 (96.1%) |
| Mobile Home / Other | 181 (89.6%) | 21 (10.4%) |
| Total | 2,476 (65.4%) | 1,309 (34.6%) |
Housing Structures by Number of Rooms in Wyandanch
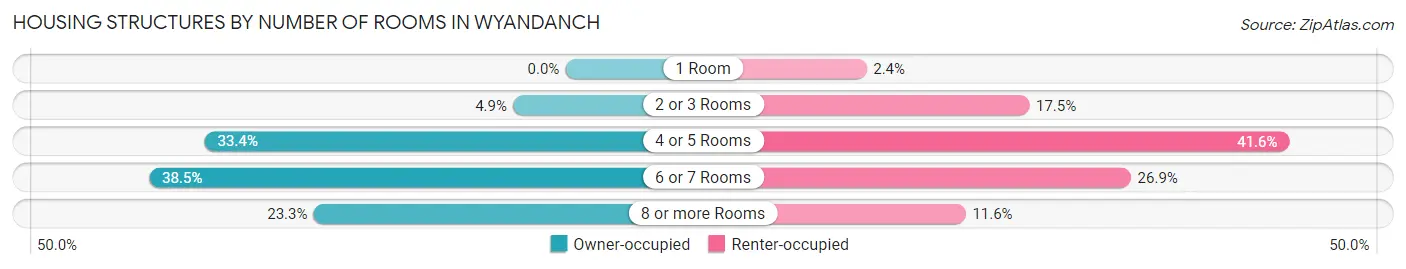
| Number of Rooms | Owner-occupied | Renter-occupied |
| 1 Room | 0 (0.0%) | 32 (2.4%) |
| 2 or 3 Rooms | 120 (4.9%) | 229 (17.5%) |
| 4 or 5 Rooms | 826 (33.4%) | 544 (41.6%) |
| 6 or 7 Rooms | 953 (38.5%) | 352 (26.9%) |
| 8 or more Rooms | 577 (23.3%) | 152 (11.6%) |
| Total | 2,476 (100.0%) | 1,309 (100.0%) |
Housing Structure by Heating Type in Wyandanch
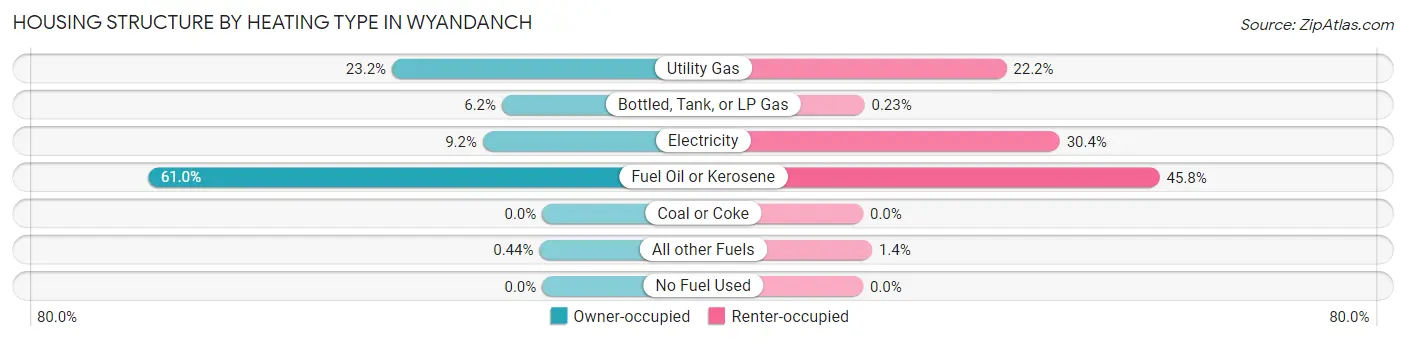
| Heating Type | Owner-occupied | Renter-occupied |
| Utility Gas | 575 (23.2%) | 290 (22.2%) |
| Bottled, Tank, or LP Gas | 154 (6.2%) | 3 (0.2%) |
| Electricity | 227 (9.2%) | 398 (30.4%) |
| Fuel Oil or Kerosene | 1,509 (61.0%) | 600 (45.8%) |
| Coal or Coke | 0 (0.0%) | 0 (0.0%) |
| All other Fuels | 11 (0.4%) | 18 (1.4%) |
| No Fuel Used | 0 (0.0%) | 0 (0.0%) |
| Total | 2,476 (100.0%) | 1,309 (100.0%) |
Household Vehicle Usage in Wyandanch
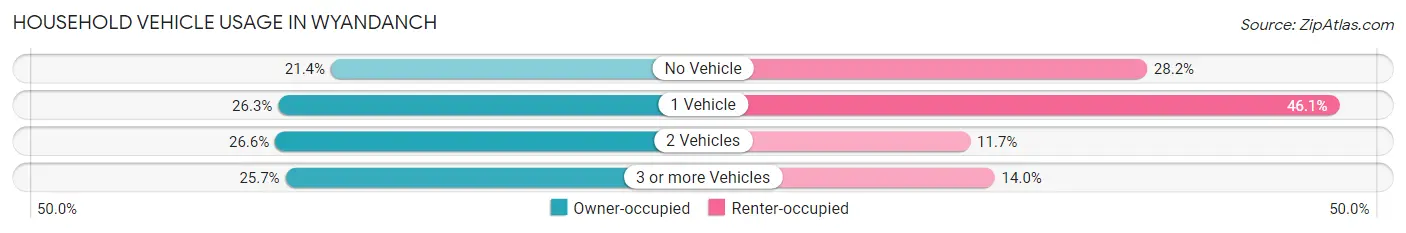
| Vehicles per Household | Owner-occupied | Renter-occupied |
| No Vehicle | 530 (21.4%) | 369 (28.2%) |
| 1 Vehicle | 652 (26.3%) | 604 (46.1%) |
| 2 Vehicles | 659 (26.6%) | 153 (11.7%) |
| 3 or more Vehicles | 635 (25.7%) | 183 (14.0%) |
| Total | 2,476 (100.0%) | 1,309 (100.0%) |
Real Estate & Mortgages in Wyandanch
Real Estate and Mortgage Overview in Wyandanch
| Characteristic | Without Mortgage | With Mortgage |
| Housing Units | 1,235 | 1,241 |
| Median Property Value | $337,600 | $358,600 |
| Median Household Income | $70,966 | $404 |
| Monthly Housing Costs | $1,182 | $431 |
| Real Estate Taxes | $10,001 | $110 |
Property Value by Mortgage Status in Wyandanch
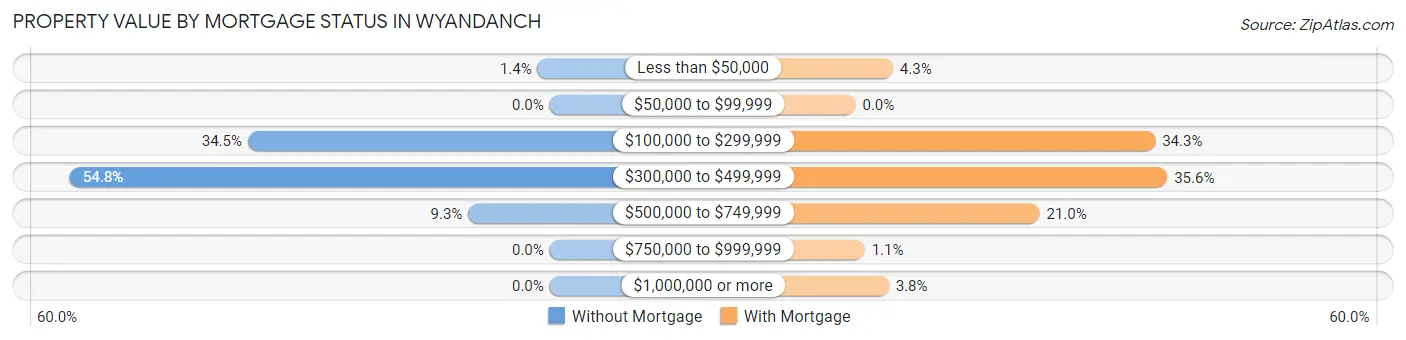
| Property Value | Without Mortgage | With Mortgage |
| Less than $50,000 | 17 (1.4%) | 53 (4.3%) |
| $50,000 to $99,999 | 0 (0.0%) | 0 (0.0%) |
| $100,000 to $299,999 | 426 (34.5%) | 425 (34.3%) |
| $300,000 to $499,999 | 677 (54.8%) | 442 (35.6%) |
| $500,000 to $749,999 | 115 (9.3%) | 261 (21.0%) |
| $750,000 to $999,999 | 0 (0.0%) | 13 (1.1%) |
| $1,000,000 or more | 0 (0.0%) | 47 (3.8%) |
| Total | 1,235 (100.0%) | 1,241 (100.0%) |
Household Income by Mortgage Status in Wyandanch
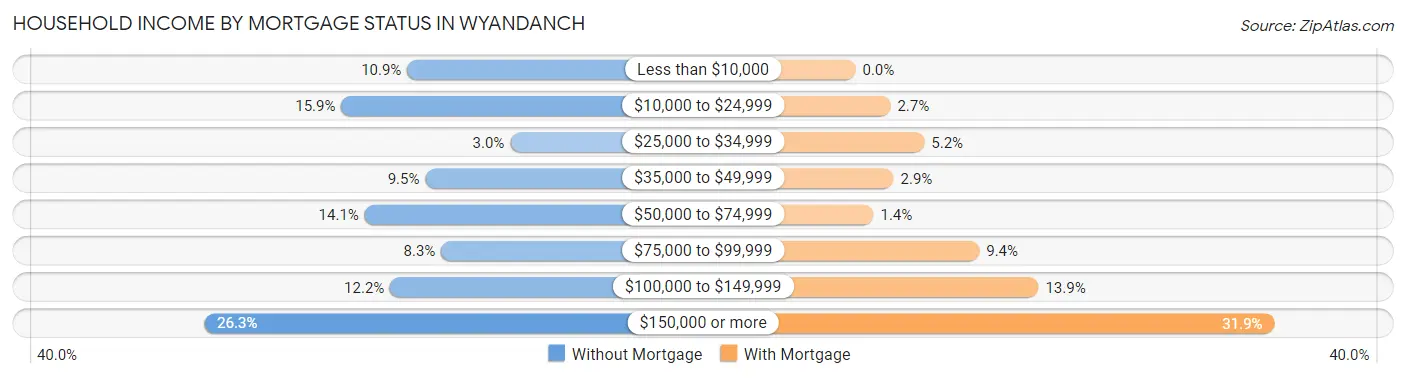
| Household Income | Without Mortgage | With Mortgage |
| Less than $10,000 | 134 (10.8%) | 0 (0.0%) |
| $10,000 to $24,999 | 196 (15.9%) | 33 (2.7%) |
| $25,000 to $34,999 | 37 (3.0%) | 65 (5.2%) |
| $35,000 to $49,999 | 117 (9.5%) | 36 (2.9%) |
| $50,000 to $74,999 | 174 (14.1%) | 17 (1.4%) |
| $75,000 to $99,999 | 102 (8.3%) | 117 (9.4%) |
| $100,000 to $149,999 | 150 (12.1%) | 173 (13.9%) |
| $150,000 or more | 325 (26.3%) | 396 (31.9%) |
| Total | 1,235 (100.0%) | 1,241 (100.0%) |
Property Value to Household Income Ratio in Wyandanch
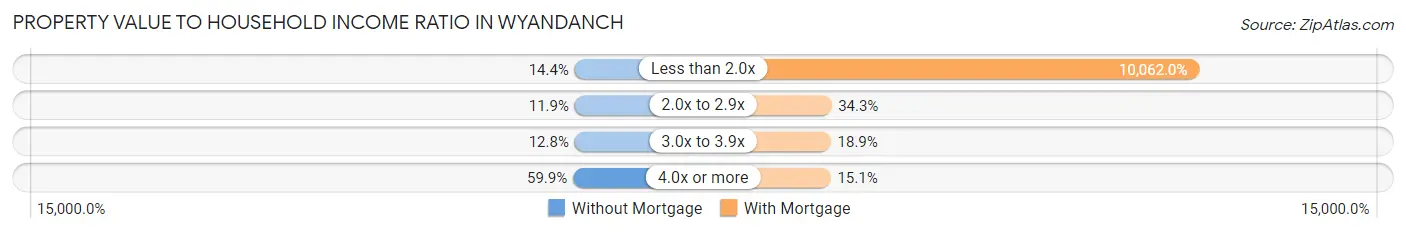
| Value-to-Income Ratio | Without Mortgage | With Mortgage |
| Less than 2.0x | 178 (14.4%) | 124,869 (10,062.0%) |
| 2.0x to 2.9x | 147 (11.9%) | 425 (34.3%) |
| 3.0x to 3.9x | 158 (12.8%) | 234 (18.9%) |
| 4.0x or more | 740 (59.9%) | 187 (15.1%) |
| Total | 1,235 (100.0%) | 1,241 (100.0%) |
Real Estate Taxes by Mortgage Status in Wyandanch
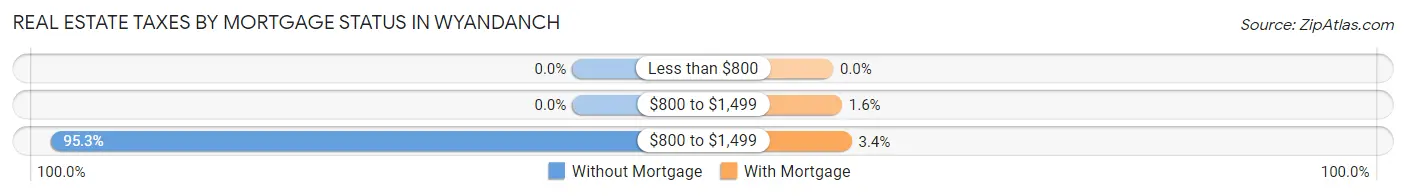
| Property Taxes | Without Mortgage | With Mortgage |
| Less than $800 | 0 (0.0%) | 0 (0.0%) |
| $800 to $1,499 | 0 (0.0%) | 20 (1.6%) |
| $800 to $1,499 | 1,177 (95.3%) | 42 (3.4%) |
| Total | 1,235 (100.0%) | 1,241 (100.0%) |
Health & Disability in Wyandanch
Health Insurance Coverage by Age in Wyandanch
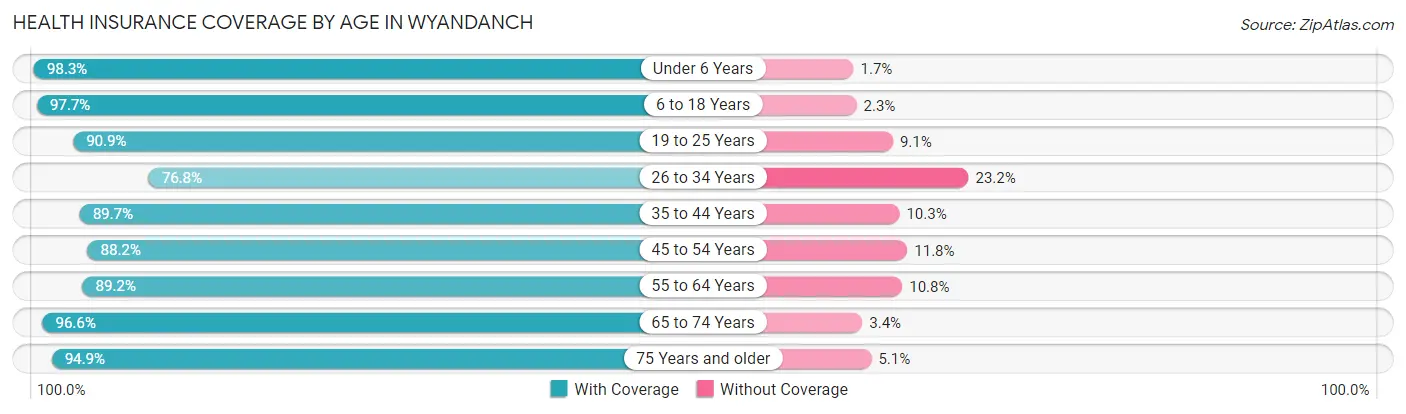
| Age Bracket | With Coverage | Without Coverage |
| Under 6 Years | 960 (98.3%) | 17 (1.7%) |
| 6 to 18 Years | 2,682 (97.7%) | 63 (2.3%) |
| 19 to 25 Years | 1,424 (90.9%) | 142 (9.1%) |
| 26 to 34 Years | 1,131 (76.8%) | 341 (23.2%) |
| 35 to 44 Years | 1,500 (89.7%) | 172 (10.3%) |
| 45 to 54 Years | 1,749 (88.2%) | 233 (11.8%) |
| 55 to 64 Years | 1,418 (89.2%) | 172 (10.8%) |
| 65 to 74 Years | 949 (96.6%) | 33 (3.4%) |
| 75 Years and older | 525 (94.9%) | 28 (5.1%) |
| Total | 12,338 (91.1%) | 1,201 (8.9%) |
Health Insurance Coverage by Citizenship Status in Wyandanch
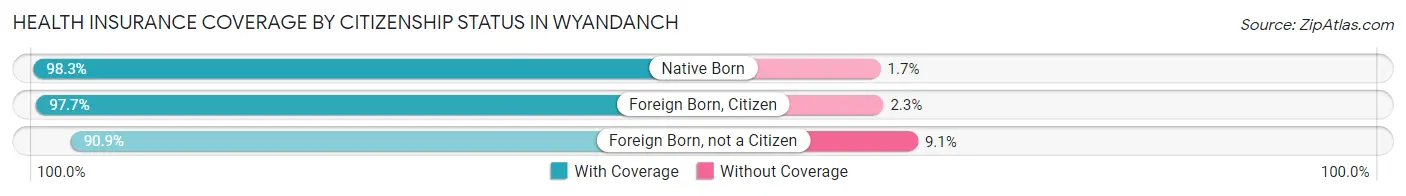
| Citizenship Status | With Coverage | Without Coverage |
| Native Born | 960 (98.3%) | 17 (1.7%) |
| Foreign Born, Citizen | 2,682 (97.7%) | 63 (2.3%) |
| Foreign Born, not a Citizen | 1,424 (90.9%) | 142 (9.1%) |
Health Insurance Coverage by Household Income in Wyandanch
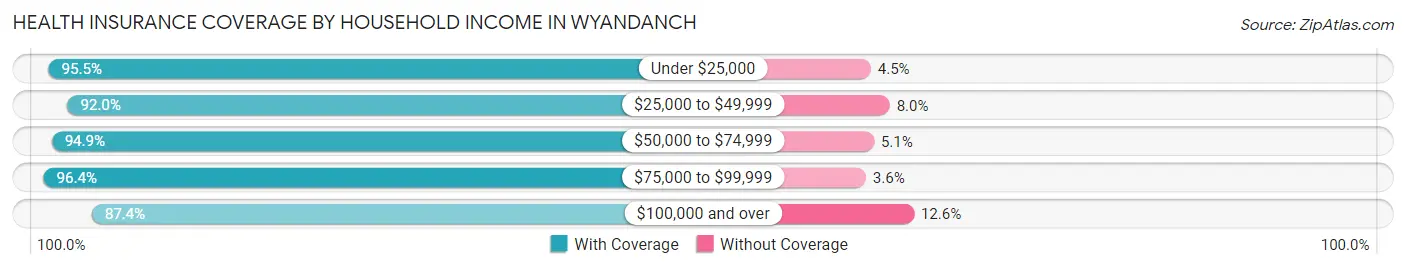
| Household Income | With Coverage | Without Coverage |
| Under $25,000 | 1,144 (95.5%) | 54 (4.5%) |
| $25,000 to $49,999 | 1,671 (92.0%) | 146 (8.0%) |
| $50,000 to $74,999 | 1,529 (94.9%) | 82 (5.1%) |
| $75,000 to $99,999 | 2,126 (96.4%) | 79 (3.6%) |
| $100,000 and over | 5,820 (87.4%) | 838 (12.6%) |
Public vs Private Health Insurance Coverage by Age in Wyandanch
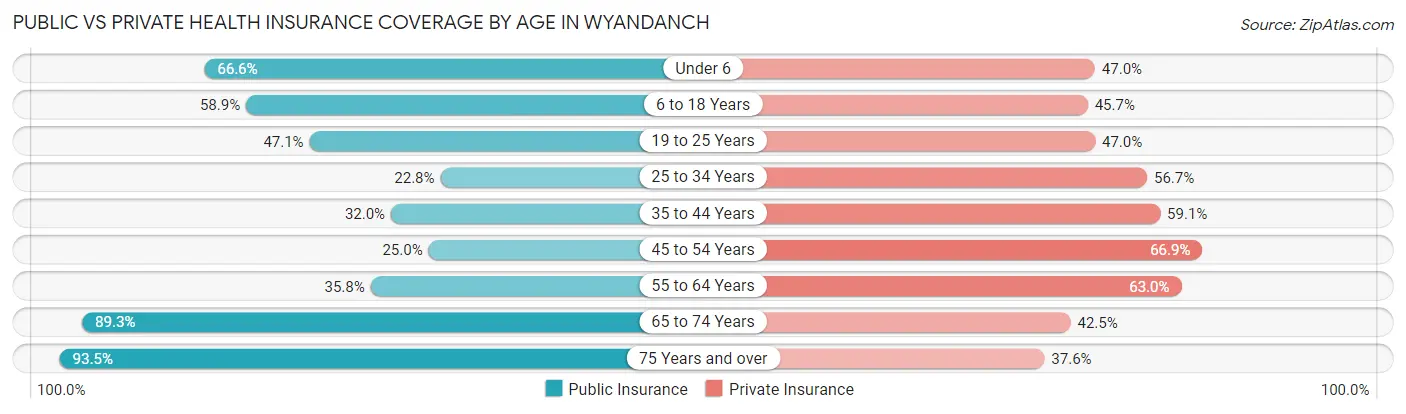
| Age Bracket | Public Insurance | Private Insurance |
| Under 6 | 651 (66.6%) | 459 (47.0%) |
| 6 to 18 Years | 1,617 (58.9%) | 1,253 (45.7%) |
| 19 to 25 Years | 738 (47.1%) | 736 (47.0%) |
| 25 to 34 Years | 336 (22.8%) | 834 (56.7%) |
| 35 to 44 Years | 535 (32.0%) | 988 (59.1%) |
| 45 to 54 Years | 496 (25.0%) | 1,326 (66.9%) |
| 55 to 64 Years | 569 (35.8%) | 1,002 (63.0%) |
| 65 to 74 Years | 877 (89.3%) | 417 (42.5%) |
| 75 Years and over | 517 (93.5%) | 208 (37.6%) |
| Total | 6,336 (46.8%) | 7,223 (53.3%) |
Disability Status by Sex by Age in Wyandanch
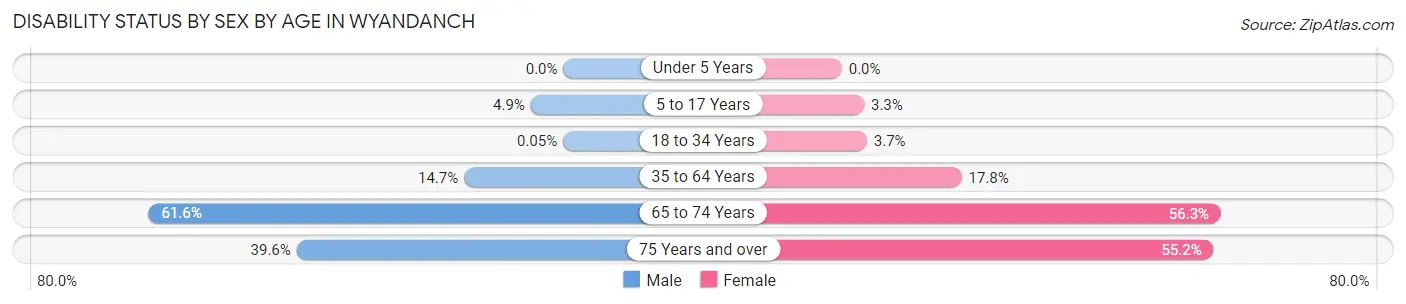
| Age Bracket | Male | Female |
| Under 5 Years | 0 (0.0%) | 0 (0.0%) |
| 5 to 17 Years | 53 (4.9%) | 46 (3.3%) |
| 18 to 34 Years | 1 (0.1%) | 60 (3.7%) |
| 35 to 64 Years | 434 (14.7%) | 409 (17.8%) |
| 65 to 74 Years | 316 (61.6%) | 264 (56.3%) |
| 75 Years and over | 82 (39.6%) | 191 (55.2%) |
Disability Class by Sex by Age in Wyandanch
Disability Class: Hearing Difficulty
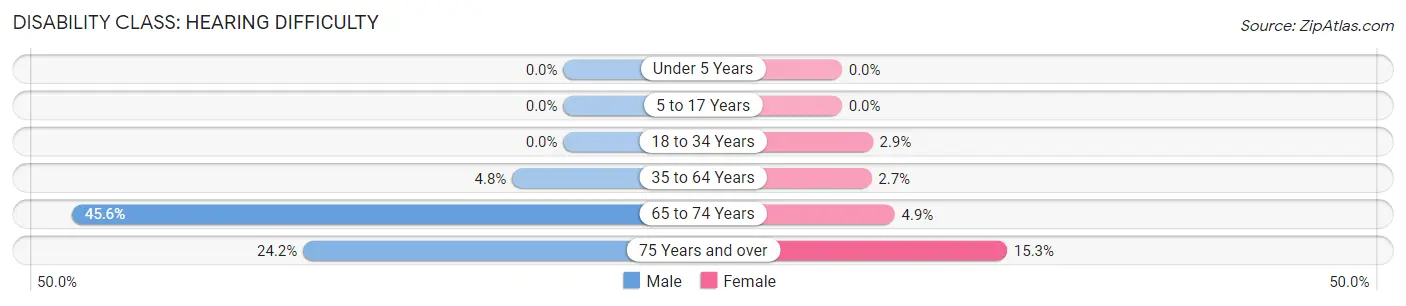
| Age Bracket | Male | Female |
| Under 5 Years | 0 (0.0%) | 0 (0.0%) |
| 5 to 17 Years | 0 (0.0%) | 0 (0.0%) |
| 18 to 34 Years | 0 (0.0%) | 46 (2.9%) |
| 35 to 64 Years | 140 (4.8%) | 63 (2.7%) |
| 65 to 74 Years | 234 (45.6%) | 23 (4.9%) |
| 75 Years and over | 50 (24.1%) | 53 (15.3%) |
Disability Class: Vision Difficulty
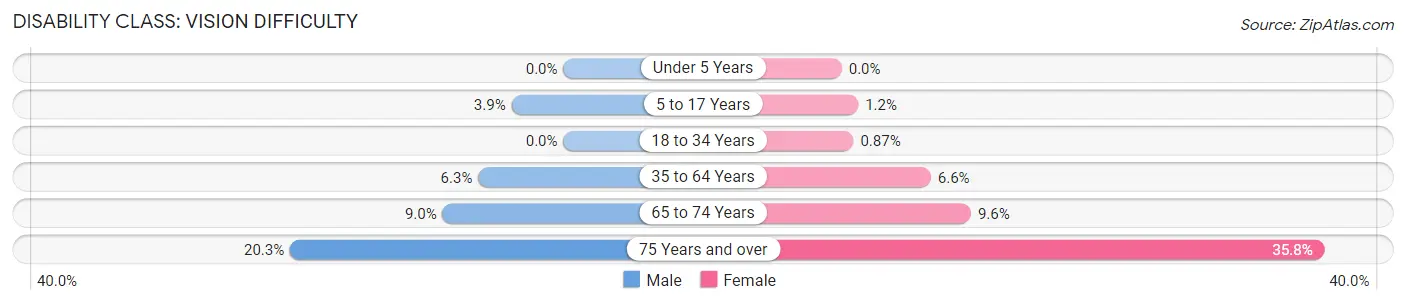
| Age Bracket | Male | Female |
| Under 5 Years | 0 (0.0%) | 0 (0.0%) |
| 5 to 17 Years | 42 (3.8%) | 17 (1.2%) |
| 18 to 34 Years | 0 (0.0%) | 14 (0.9%) |
| 35 to 64 Years | 186 (6.3%) | 152 (6.6%) |
| 65 to 74 Years | 46 (9.0%) | 45 (9.6%) |
| 75 Years and over | 42 (20.3%) | 124 (35.8%) |
Disability Class: Cognitive Difficulty
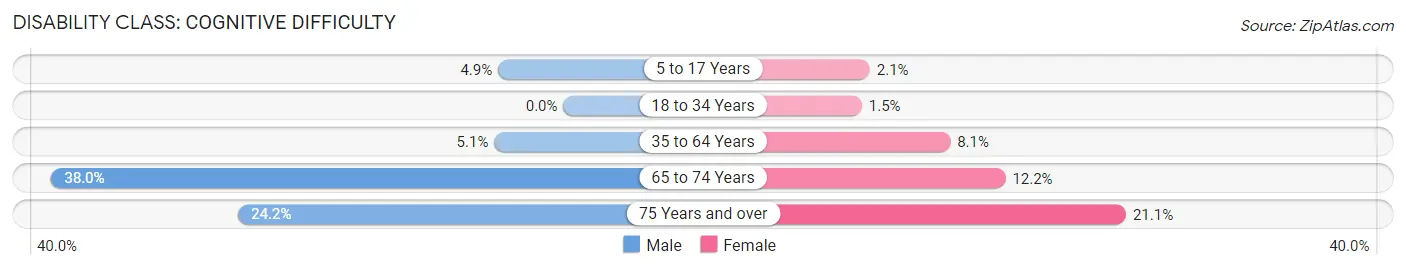
| Age Bracket | Male | Female |
| 5 to 17 Years | 53 (4.9%) | 29 (2.1%) |
| 18 to 34 Years | 0 (0.0%) | 24 (1.5%) |
| 35 to 64 Years | 151 (5.1%) | 185 (8.1%) |
| 65 to 74 Years | 195 (38.0%) | 57 (12.1%) |
| 75 Years and over | 50 (24.1%) | 73 (21.1%) |
Disability Class: Ambulatory Difficulty
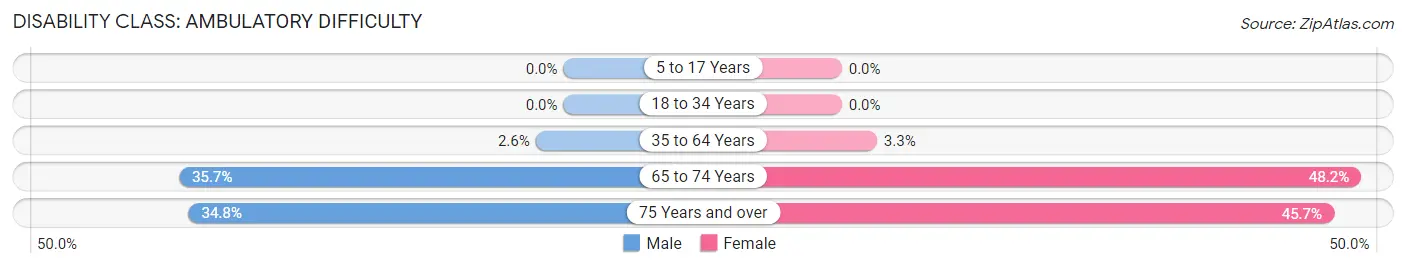
| Age Bracket | Male | Female |
| 5 to 17 Years | 0 (0.0%) | 0 (0.0%) |
| 18 to 34 Years | 0 (0.0%) | 0 (0.0%) |
| 35 to 64 Years | 76 (2.6%) | 75 (3.3%) |
| 65 to 74 Years | 183 (35.7%) | 226 (48.2%) |
| 75 Years and over | 72 (34.8%) | 158 (45.7%) |
Disability Class: Self-Care Difficulty
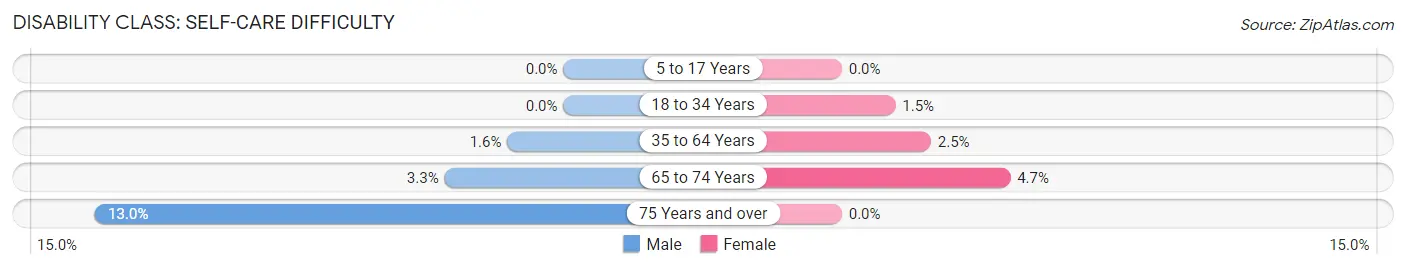
| Age Bracket | Male | Female |
| 5 to 17 Years | 0 (0.0%) | 0 (0.0%) |
| 18 to 34 Years | 0 (0.0%) | 24 (1.5%) |
| 35 to 64 Years | 46 (1.6%) | 57 (2.5%) |
| 65 to 74 Years | 17 (3.3%) | 22 (4.7%) |
| 75 Years and over | 27 (13.0%) | 0 (0.0%) |
Technology Access in Wyandanch
Computing Device Access in Wyandanch
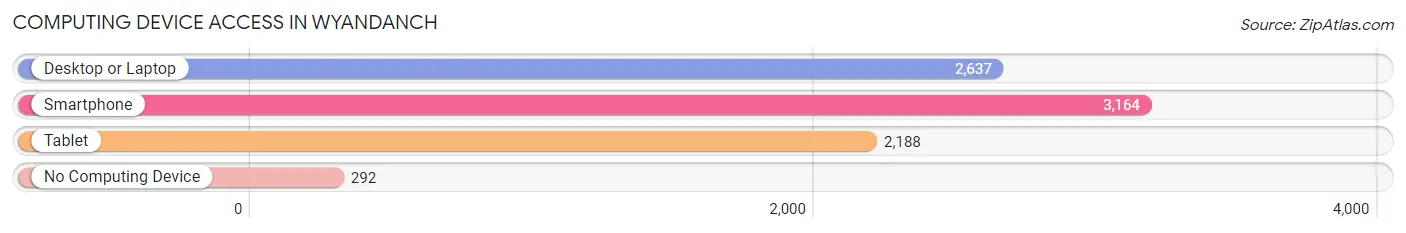
| Device Type | # Households | % Households |
| Desktop or Laptop | 2,637 | 69.7% |
| Smartphone | 3,164 | 83.6% |
| Tablet | 2,188 | 57.8% |
| No Computing Device | 292 | 7.7% |
| Total | 3,785 | 100.0% |
Internet Access in Wyandanch
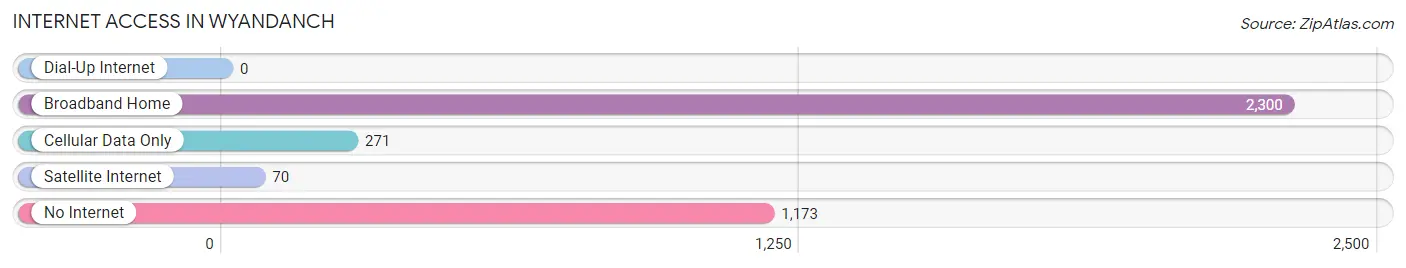
| Internet Type | # Households | % Households |
| Dial-Up Internet | 0 | 0.0% |
| Broadband Home | 2,300 | 60.8% |
| Cellular Data Only | 271 | 7.2% |
| Satellite Internet | 70 | 1.8% |
| No Internet | 1,173 | 31.0% |
| Total | 3,785 | 100.0% |
Wyandanch Summary
Wyandanch is a hamlet and census-designated place (CDP) located in the Town of Babylon in Suffolk County, New York, United States. The population was 11,647 at the 2010 census. Wyandanch is an unincorporated area in the Town of Babylon and is served by the Wyandanch Union Free School District.
History
The area now known as Wyandanch was originally inhabited by the Secatogue Indians, a branch of the Algonquin Nation. The name Wyandanch is derived from Chief Wyandanch, a leader of the Secatogue tribe. The Secatogue Indians sold the land to English settlers in 1653.
The area was originally known as Half Way Hollow Hills, and was part of Huntington Town. In 1872, the Long Island Rail Road opened a station in the area, and the name was changed to Wyandanch. The area was then incorporated as a village in 1882.
In the early 20th century, Wyandanch was a rural farming community. In the 1950s, the Long Island Expressway was built through the area, and the population began to grow. The area was re-designated as a census-designated place in the 1970s.
Geography
Wyandanch is located at 40°45'25" North, 73°22'45" West (40.756944, -73.379167). According to the United States Census Bureau, the CDP has a total area of 2.3 square miles (6.0 km2), all land.
Economy
Wyandanch is primarily a residential community, with a few small businesses located in the area. The largest employer in the area is the Wyandanch Union Free School District, which employs over 500 people. Other employers include the Town of Babylon, the Suffolk County Department of Social Services, and the Wyandanch Public Library.
Demographics
As of the census of 2000, there were 11,647 people, 3,717 households, and 2,845 families residing in the CDP. The population density was 5,068.2 per square mile (1,955.2/km2). There were 3,902 housing units at an average density of 1,694.2/sq mi (653.7/km2). The racial makeup of the CDP was 11.2% White, 79.2% African American, 0.3% Native American, 0.7% Asian, 0.1% Pacific Islander, 5.7% from other races, and 3.0% from two or more races. Hispanic or Latino of any race were 11.2% of the population.
There were 3,717 households, out of which 39.2% had children under the age of 18 living with them, 37.2% were married couples living together, 32.2% had a female householder with no husband present, and 22.2% were non-families. 17.2% of all households were made up of individuals, and 6.2% had someone living alone who was 65 years of age or older. The average household size was 3.13 and the average family size was 3.50.
In the CDP, the population was spread out, with 30.2% under the age of 18, 9.7% from 18 to 24, 28.7% from 25 to 44, 21.2% from 45 to 64, and 10.2% who were 65 years of age or older. The median age was 33 years. For every 100 females, there were 88.2 males. For every 100 females age 18 and over, there were 82.7 males.
The median income for a household in the CDP was $50,945, and the median income for a family was $54,902. Males had a median income of $35,938 versus $30,917 for females. The per capita income for the CDP was $18,945. About 8.2% of families and 10.2% of the population were below the poverty line, including 14.2% of those under age 18 and 8.2% of those age 65 or over.
Common Questions
What is Per Capita Income in Wyandanch?
Per Capita income in Wyandanch is $29,050.
What is the Median Family Income in Wyandanch?
Median Family Income in Wyandanch is $94,401.
What is the Median Household income in Wyandanch?
Median Household Income in Wyandanch is $87,669.
What is Income or Wage Gap in Wyandanch?
Income or Wage Gap in Wyandanch is 35.7%.
Women in Wyandanch earn 64.3 cents for every dollar earned by a man.
What is Inequality or Gini Index in Wyandanch?
Inequality or Gini Index in Wyandanch is 0.44.
What is the Total Population of Wyandanch?
Total Population of Wyandanch is 13,601.
What is the Total Male Population of Wyandanch?
Total Male Population of Wyandanch is 7,007.
What is the Total Female Population of Wyandanch?
Total Female Population of Wyandanch is 6,594.
What is the Ratio of Males per 100 Females in Wyandanch?
There are 106.26 Males per 100 Females in Wyandanch.
What is the Ratio of Females per 100 Males in Wyandanch?
There are 94.11 Females per 100 Males in Wyandanch.
What is the Median Population Age in Wyandanch?
Median Population Age in Wyandanch is 35.1 Years.
What is the Average Family Size in Wyandanch
Average Family Size in Wyandanch is 4.2 People.
What is the Average Household Size in Wyandanch
Average Household Size in Wyandanch is 3.6 People.
How Large is the Labor Force in Wyandanch?
There are 7,009 People in the Labor Forcein in Wyandanch.
What is the Percentage of People in the Labor Force in Wyandanch?
66.8% of People are in the Labor Force in Wyandanch.
What is the Unemployment Rate in Wyandanch?
Unemployment Rate in Wyandanch is 5.7%.