Mount Kisco, NY Map & Demographics
Mount Kisco Map
Mount Kisco Overview
$48,473
PER CAPITA INCOME
$119,750
AVG FAMILY INCOME
$99,444
AVG HOUSEHOLD INCOME
13.8%
WAGE / INCOME GAP [ % ]
86.2¢/ $1
WAGE / INCOME GAP [ $ ]
$17,584
FAMILY INCOME DEFICIT
0.45
INEQUALITY / GINI INDEX
10,835
TOTAL POPULATION
5,684
MALE POPULATION
5,151
FEMALE POPULATION
110.35
MALES / 100 FEMALES
90.62
FEMALES / 100 MALES
40.1
MEDIAN AGE
3.5
AVG FAMILY SIZE
2.6
AVG HOUSEHOLD SIZE
5,745
LABOR FORCE [ PEOPLE ]
67.3%
PERCENT IN LABOR FORCE
4.9%
UNEMPLOYMENT RATE
Mount Kisco Zip Codes
Mount Kisco Area Codes
Income in Mount Kisco
Income Overview in Mount Kisco
Per Capita Income in Mount Kisco is $48,473, while median incomes of families and households are $119,750 and $99,444 respectively.
| Characteristic | Number | Measure |
| Per Capita Income | 10,835 | $48,473 |
| Median Family Income | 2,375 | $119,750 |
| Mean Family Income | 2,375 | $159,623 |
| Median Household Income | 4,202 | $99,444 |
| Mean Household Income | 4,202 | $122,227 |
| Income Deficit | 2,375 | $17,584 |
| Wage / Income Gap (%) | 10,835 | 13.76% |
| Wage / Income Gap ($) | 10,835 | 86.24¢ per $1 |
| Gini / Inequality Index | 10,835 | 0.45 |
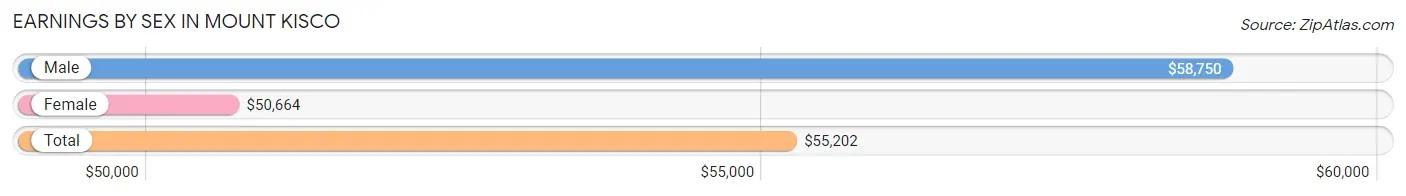
Earnings by Sex in Mount Kisco
Average Earnings in Mount Kisco are $55,202, $58,750 for men and $50,664 for women, a difference of 13.8%.
| Sex | Number | Average Earnings |
| Male | 3,374 (57.8%) | $58,750 |
| Female | 2,463 (42.2%) | $50,664 |
| Total | 5,837 (100.0%) | $55,202 |
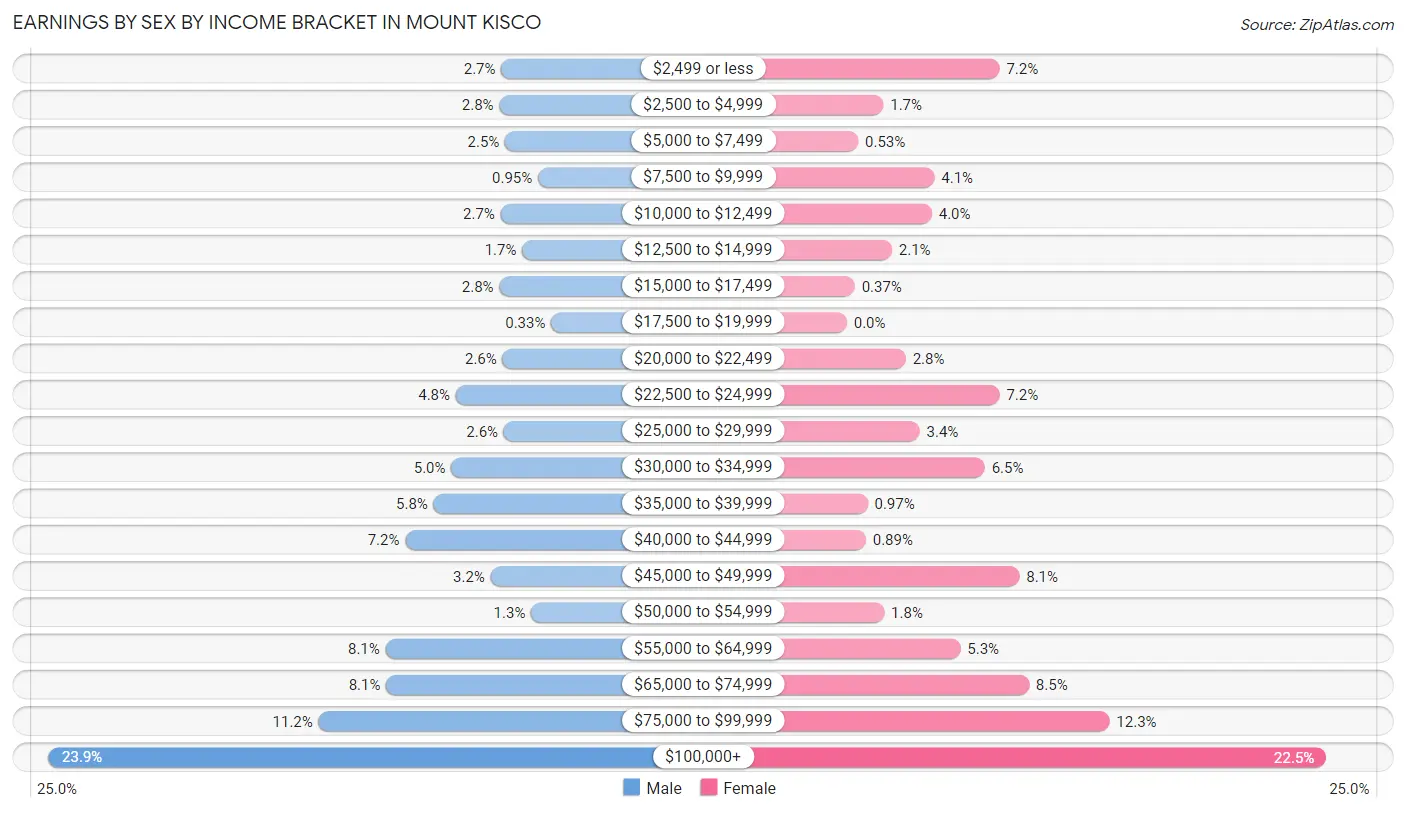
Earnings by Sex by Income Bracket in Mount Kisco
The most common earnings brackets in Mount Kisco are $100,000+ for men (805 | 23.9%) and $100,000+ for women (553 | 22.5%).
| Income | Male | Female |
| $2,499 or less | 90 (2.7%) | 176 (7.1%) |
| $2,500 to $4,999 | 93 (2.8%) | 42 (1.7%) |
| $5,000 to $7,499 | 84 (2.5%) | 13 (0.5%) |
| $7,500 to $9,999 | 32 (0.9%) | 101 (4.1%) |
| $10,000 to $12,499 | 91 (2.7%) | 98 (4.0%) |
| $12,500 to $14,999 | 57 (1.7%) | 52 (2.1%) |
| $15,000 to $17,499 | 93 (2.8%) | 9 (0.4%) |
| $17,500 to $19,999 | 11 (0.3%) | 0 (0.0%) |
| $20,000 to $22,499 | 88 (2.6%) | 68 (2.8%) |
| $22,500 to $24,999 | 162 (4.8%) | 176 (7.1%) |
| $25,000 to $29,999 | 86 (2.5%) | 84 (3.4%) |
| $30,000 to $34,999 | 169 (5.0%) | 159 (6.5%) |
| $35,000 to $39,999 | 197 (5.8%) | 24 (1.0%) |
| $40,000 to $44,999 | 242 (7.2%) | 22 (0.9%) |
| $45,000 to $49,999 | 107 (3.2%) | 199 (8.1%) |
| $50,000 to $54,999 | 43 (1.3%) | 43 (1.8%) |
| $55,000 to $64,999 | 273 (8.1%) | 131 (5.3%) |
| $65,000 to $74,999 | 272 (8.1%) | 210 (8.5%) |
| $75,000 to $99,999 | 379 (11.2%) | 303 (12.3%) |
| $100,000+ | 805 (23.9%) | 553 (22.5%) |
| Total | 3,374 (100.0%) | 2,463 (100.0%) |
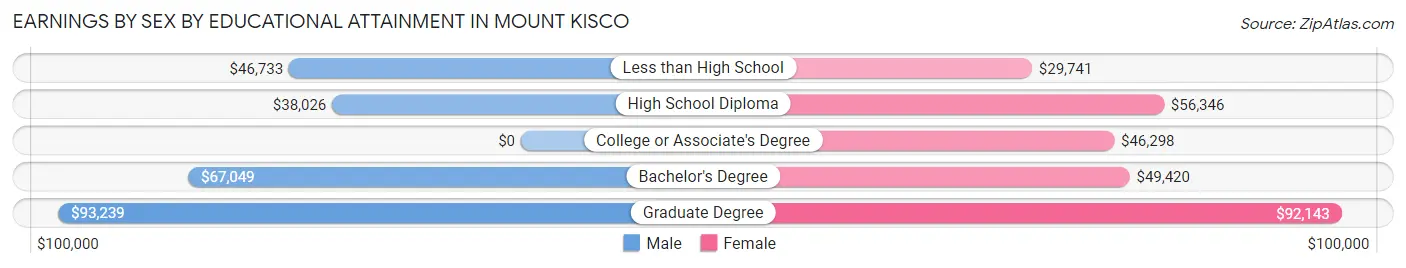
Earnings by Sex by Educational Attainment in Mount Kisco
Average earnings in Mount Kisco are $61,983 for men and $56,683 for women, a difference of 8.6%. Men with an educational attainment of graduate degree enjoy the highest average annual earnings of $93,239, while those with high school diploma education earn the least with $38,026. Women with an educational attainment of graduate degree earn the most with the average annual earnings of $92,143, while those with less than high school education have the smallest earnings of $29,741.
| Educational Attainment | Male Income | Female Income |
| Less than High School | $46,733 | $29,741 |
| High School Diploma | $38,026 | $56,346 |
| College or Associate's Degree | - | - |
| Bachelor's Degree | $67,049 | $49,420 |
| Graduate Degree | $93,239 | $92,143 |
| Total | $61,983 | $56,683 |
Family Income in Mount Kisco
Family Income Brackets in Mount Kisco
According to the Mount Kisco family income data, there are 741 families falling into the $100,000 to $149,999 income range, which is the most common income bracket and makes up 31.2% of all families.
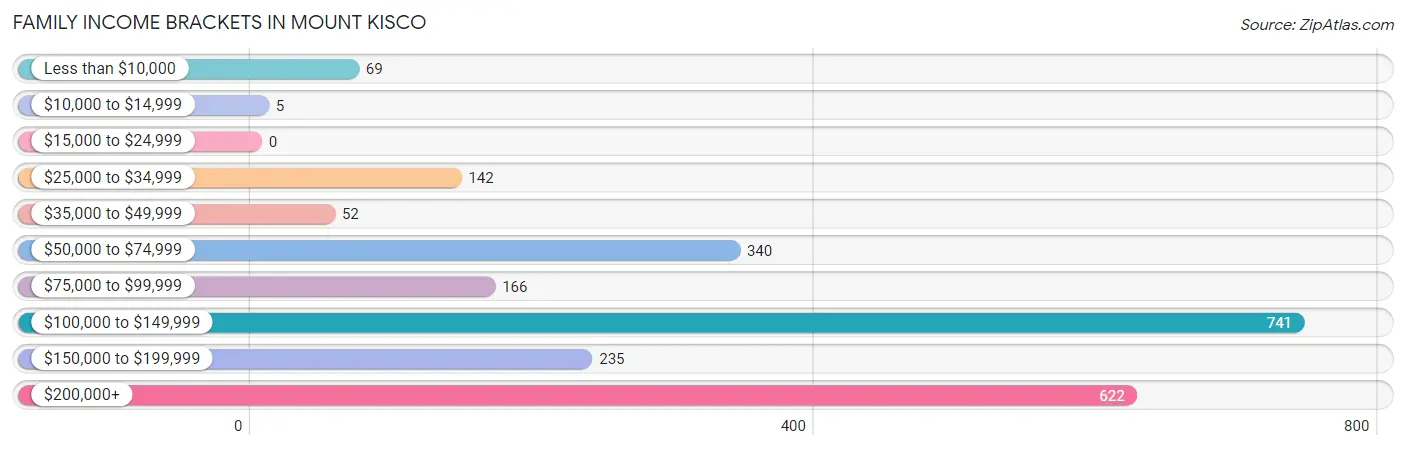
| Income Bracket | # Families | % Families |
| Less than $10,000 | 69 | 2.9% |
| $10,000 to $14,999 | 5 | 0.2% |
| $15,000 to $24,999 | 0 | 0.0% |
| $25,000 to $34,999 | 142 | 6.0% |
| $35,000 to $49,999 | 52 | 2.2% |
| $50,000 to $74,999 | 340 | 14.3% |
| $75,000 to $99,999 | 166 | 7.0% |
| $100,000 to $149,999 | 741 | 31.2% |
| $150,000 to $199,999 | 235 | 9.9% |
| $200,000+ | 622 | 26.2% |
Family Income by Famaliy Size in Mount Kisco
7+ person families (126 | 5.3%) account for the highest median family income in Mount Kisco with $250,001 per family, while 2-person families (747 | 31.5%) have the highest median income of $59,482 per family member.
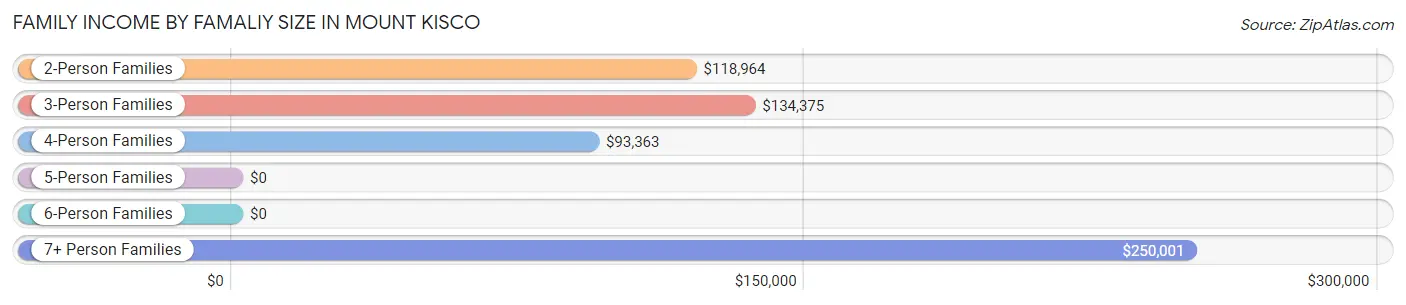
| Income Bracket | # Families | Median Income |
| 2-Person Families | 747 (31.5%) | $118,964 |
| 3-Person Families | 743 (31.3%) | $134,375 |
| 4-Person Families | 525 (22.1%) | $93,363 |
| 5-Person Families | 168 (7.1%) | $0 |
| 6-Person Families | 66 (2.8%) | $0 |
| 7+ Person Families | 126 (5.3%) | $250,001 |
| Total | 2,375 (100.0%) | $119,750 |
Family Income by Number of Earners in Mount Kisco
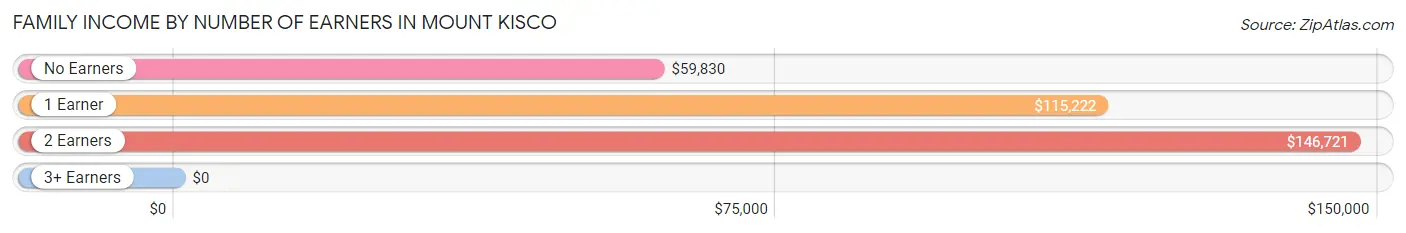
| Number of Earners | # Families | Median Income |
| No Earners | 231 (9.7%) | $59,830 |
| 1 Earner | 724 (30.5%) | $115,222 |
| 2 Earners | 994 (41.8%) | $146,721 |
| 3+ Earners | 426 (17.9%) | $0 |
| Total | 2,375 (100.0%) | $119,750 |
Household Income in Mount Kisco
Household Income Brackets in Mount Kisco
With 1,013 households falling in the category, the $100,000 to $149,999 income range is the most frequent in Mount Kisco, accounting for 24.1% of all households. In contrast, only 4 households (0.1%) fall into the $10,000 to $14,999 income bracket, making it the least populous group.
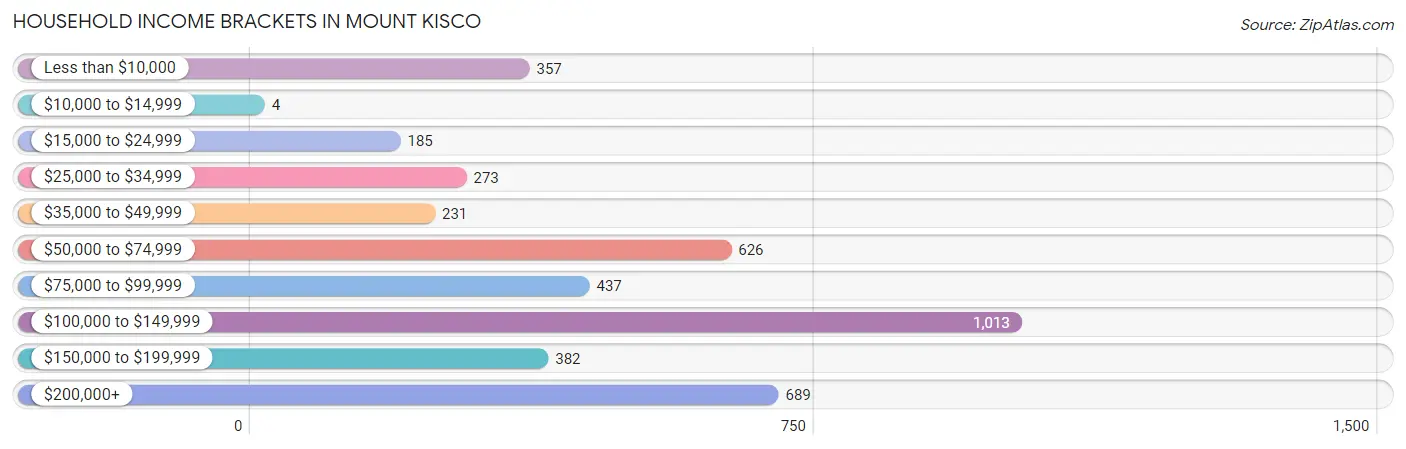
| Income Bracket | # Households | % Households |
| Less than $10,000 | 357 | 8.5% |
| $10,000 to $14,999 | 4 | 0.1% |
| $15,000 to $24,999 | 185 | 4.4% |
| $25,000 to $34,999 | 273 | 6.5% |
| $35,000 to $49,999 | 231 | 5.5% |
| $50,000 to $74,999 | 626 | 14.9% |
| $75,000 to $99,999 | 437 | 10.4% |
| $100,000 to $149,999 | 1,013 | 24.1% |
| $150,000 to $199,999 | 382 | 9.1% |
| $200,000+ | 689 | 16.4% |
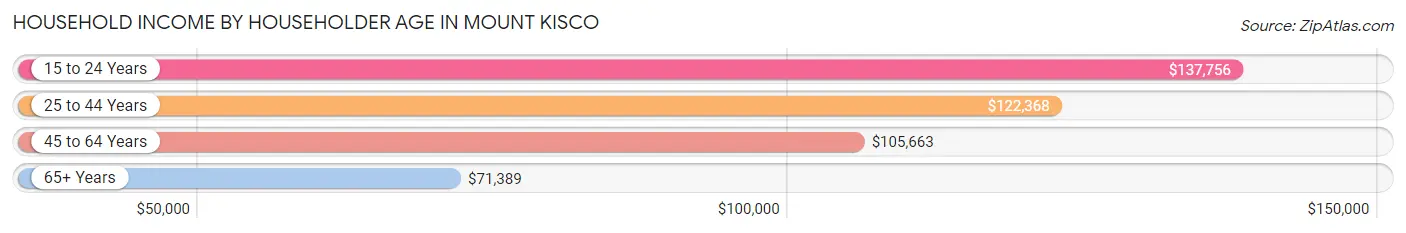
Household Income by Householder Age in Mount Kisco
The median household income in Mount Kisco is $99,444, with the highest median household income of $137,756 found in the 15 to 24 years age bracket for the primary householder. A total of 79 households (1.9%) fall into this category. Meanwhile, the 65+ years age bracket for the primary householder has the lowest median household income of $71,389, with 1,216 households (28.9%) in this group.
| Income Bracket | # Households | Median Income |
| 15 to 24 Years | 79 (1.9%) | $137,756 |
| 25 to 44 Years | 1,126 (26.8%) | $122,368 |
| 45 to 64 Years | 1,781 (42.4%) | $105,663 |
| 65+ Years | 1,216 (28.9%) | $71,389 |
| Total | 4,202 (100.0%) | $99,444 |
Poverty in Mount Kisco
Income Below Poverty by Sex and Age in Mount Kisco
With 7.6% poverty level for males and 5.7% for females among the residents of Mount Kisco, 16 and 17 year old males and 65 to 74 year old females are the most vulnerable to poverty, with 41 males (31.3%) and 96 females (17.2%) in their respective age groups living below the poverty level.
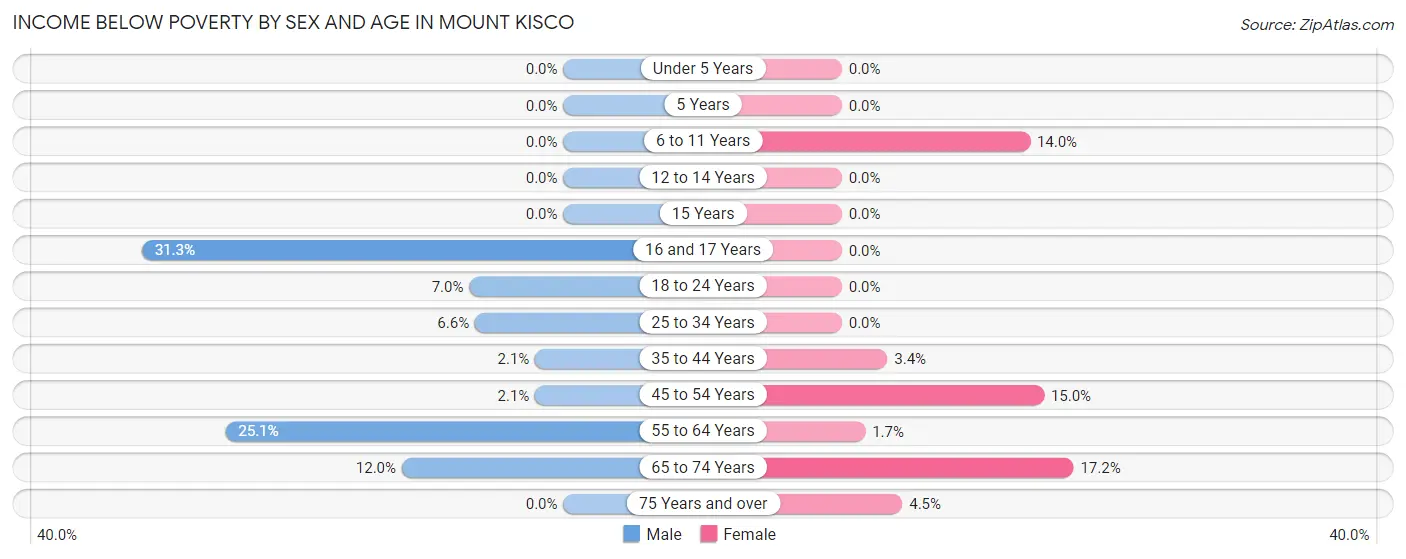
| Age Bracket | Male | Female |
| Under 5 Years | 0 (0.0%) | 0 (0.0%) |
| 5 Years | 0 (0.0%) | 0 (0.0%) |
| 6 to 11 Years | 0 (0.0%) | 38 (14.0%) |
| 12 to 14 Years | 0 (0.0%) | 0 (0.0%) |
| 15 Years | 0 (0.0%) | 0 (0.0%) |
| 16 and 17 Years | 41 (31.3%) | 0 (0.0%) |
| 18 to 24 Years | 21 (7.0%) | 0 (0.0%) |
| 25 to 34 Years | 57 (6.6%) | 0 (0.0%) |
| 35 to 44 Years | 20 (2.1%) | 29 (3.4%) |
| 45 to 54 Years | 13 (2.1%) | 95 (15.0%) |
| 55 to 64 Years | 216 (25.1%) | 11 (1.7%) |
| 65 to 74 Years | 65 (12.0%) | 96 (17.2%) |
| 75 Years and over | 0 (0.0%) | 24 (4.5%) |
| Total | 433 (7.6%) | 293 (5.7%) |
Income Above Poverty by Sex and Age in Mount Kisco
According to the poverty statistics in Mount Kisco, males aged under 5 years and females aged under 5 years are the age groups that are most secure financially, with 100.0% of males and 100.0% of females in these age groups living above the poverty line.
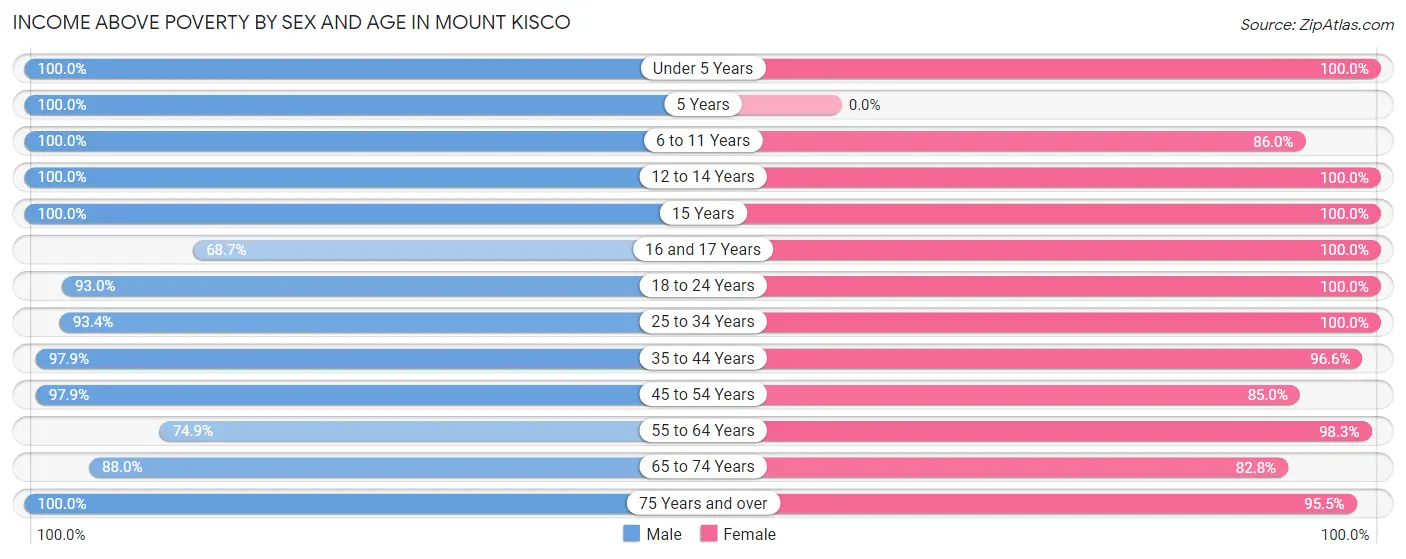
| Age Bracket | Male | Female |
| Under 5 Years | 624 (100.0%) | 572 (100.0%) |
| 5 Years | 39 (100.0%) | 0 (0.0%) |
| 6 to 11 Years | 320 (100.0%) | 234 (86.0%) |
| 12 to 14 Years | 124 (100.0%) | 282 (100.0%) |
| 15 Years | 42 (100.0%) | 23 (100.0%) |
| 16 and 17 Years | 90 (68.7%) | 24 (100.0%) |
| 18 to 24 Years | 280 (93.0%) | 309 (100.0%) |
| 25 to 34 Years | 812 (93.4%) | 451 (100.0%) |
| 35 to 44 Years | 935 (97.9%) | 829 (96.6%) |
| 45 to 54 Years | 608 (97.9%) | 538 (85.0%) |
| 55 to 64 Years | 645 (74.9%) | 621 (98.3%) |
| 65 to 74 Years | 477 (88.0%) | 462 (82.8%) |
| 75 Years and over | 253 (100.0%) | 510 (95.5%) |
| Total | 5,249 (92.4%) | 4,855 (94.3%) |
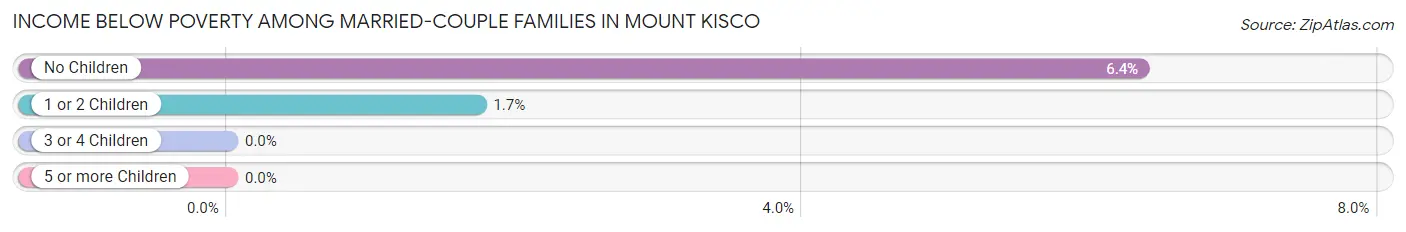
Income Below Poverty Among Married-Couple Families in Mount Kisco
The poverty statistics for married-couple families in Mount Kisco show that 3.6% or 73 of the total 2,000 families live below the poverty line. Families with no children have the highest poverty rate of 6.4%, comprising of 57 families. On the other hand, families with 3 or 4 children have the lowest poverty rate of 0.0%, which includes 0 families.
| Children | Above Poverty | Below Poverty |
| No Children | 840 (93.6%) | 57 (6.4%) |
| 1 or 2 Children | 911 (98.3%) | 16 (1.7%) |
| 3 or 4 Children | 176 (100.0%) | 0 (0.0%) |
| 5 or more Children | 0 (0.0%) | 0 (0.0%) |
| Total | 1,927 (96.4%) | 73 (3.6%) |
Income Below Poverty Among Single-Parent Households in Mount Kisco
| Children | Single Father | Single Mother |
| No Children | 0 (0.0%) | 0 (0.0%) |
| 1 or 2 Children | 0 (0.0%) | 0 (0.0%) |
| 3 or 4 Children | 0 (0.0%) | 0 (0.0%) |
| 5 or more Children | 0 (0.0%) | 0 (0.0%) |
| Total | 0 (0.0%) | 0 (0.0%) |
Income Below Poverty Among Married-Couple vs Single-Parent Households in Mount Kisco
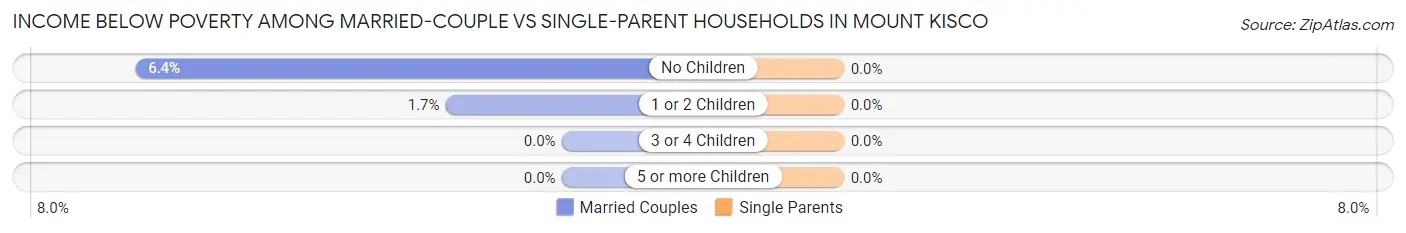
| Children | Married-Couple Families | Single-Parent Households |
| No Children | 57 (6.4%) | 0 (0.0%) |
| 1 or 2 Children | 16 (1.7%) | 0 (0.0%) |
| 3 or 4 Children | 0 (0.0%) | 0 (0.0%) |
| 5 or more Children | 0 (0.0%) | 0 (0.0%) |
| Total | 73 (3.6%) | 0 (0.0%) |
Race in Mount Kisco
The most populous races in Mount Kisco are White / Caucasian (7,281 | 67.2%), Hispanic or Latino (3,735 | 34.5%), and Some other Race (1,831 | 16.9%).
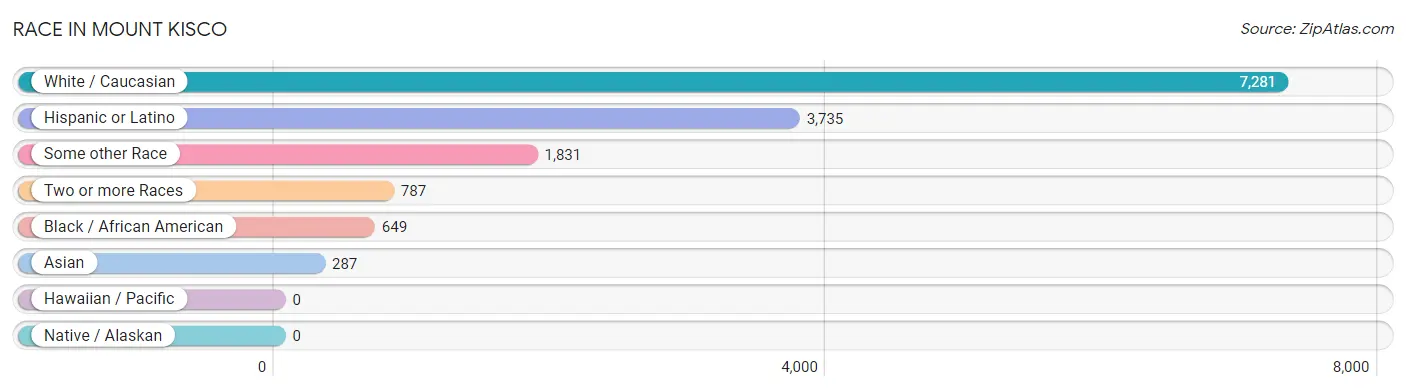
| Race | # Population | % Population |
| Asian | 287 | 2.6% |
| Black / African American | 649 | 6.0% |
| Hawaiian / Pacific | 0 | 0.0% |
| Hispanic or Latino | 3,735 | 34.5% |
| Native / Alaskan | 0 | 0.0% |
| White / Caucasian | 7,281 | 67.2% |
| Two or more Races | 787 | 7.3% |
| Some other Race | 1,831 | 16.9% |
| Total | 10,835 | 100.0% |
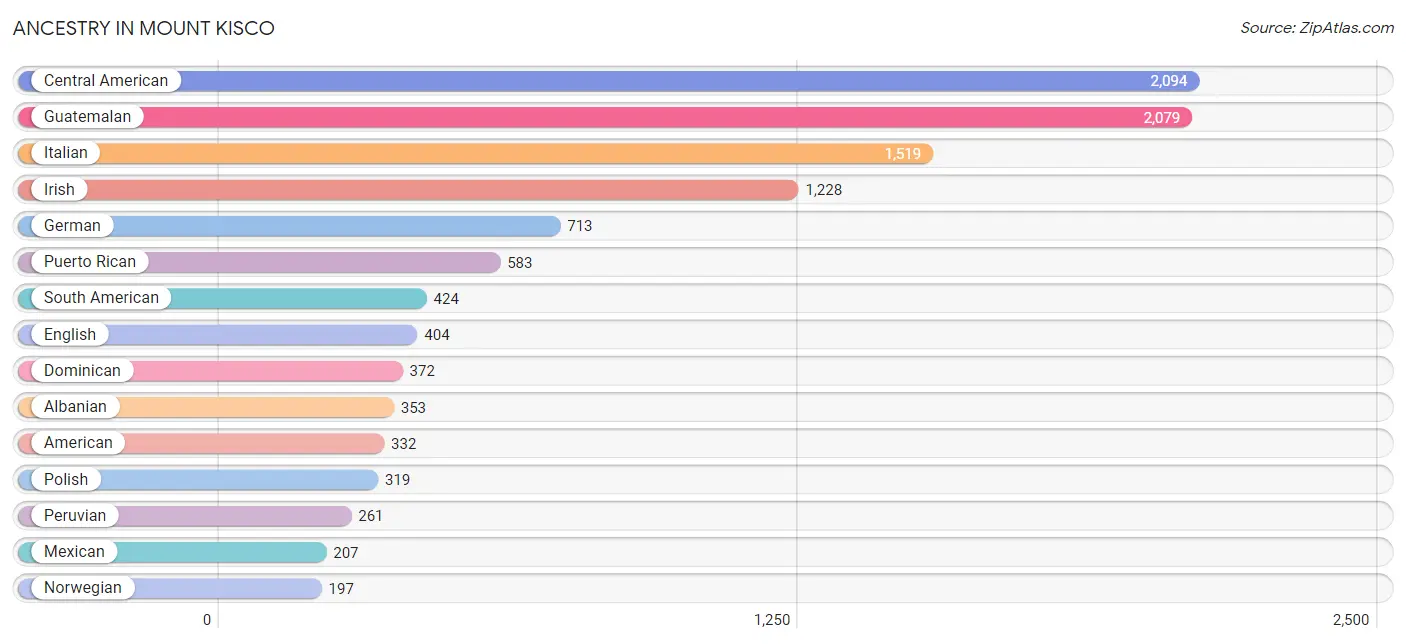
Ancestry in Mount Kisco
The most populous ancestries reported in Mount Kisco are Central American (2,094 | 19.3%), Guatemalan (2,079 | 19.2%), Italian (1,519 | 14.0%), Irish (1,228 | 11.3%), and German (713 | 6.6%), together accounting for 70.4% of all Mount Kisco residents.
| Ancestry | # Population | % Population |
| Albanian | 353 | 3.3% |
| American | 332 | 3.1% |
| Arab | 24 | 0.2% |
| Austrian | 28 | 0.3% |
| Barbadian | 58 | 0.5% |
| Bhutanese | 41 | 0.4% |
| Brazilian | 67 | 0.6% |
| British | 12 | 0.1% |
| Bulgarian | 57 | 0.5% |
| Burmese | 15 | 0.1% |
| Canadian | 61 | 0.6% |
| Celtic | 10 | 0.1% |
| Central American | 2,094 | 19.3% |
| Central American Indian | 93 | 0.9% |
| Cherokee | 8 | 0.1% |
| Colombian | 98 | 0.9% |
| Croatian | 20 | 0.2% |
| Cuban | 22 | 0.2% |
| Czech | 12 | 0.1% |
| Dominican | 372 | 3.4% |
| Dutch | 53 | 0.5% |
| Eastern European | 30 | 0.3% |
| Ecuadorian | 12 | 0.1% |
| English | 404 | 3.7% |
| European | 11 | 0.1% |
| Finnish | 39 | 0.4% |
| French | 48 | 0.4% |
| French Canadian | 24 | 0.2% |
| German | 713 | 6.6% |
| Greek | 75 | 0.7% |
| Guatemalan | 2,079 | 19.2% |
| Haitian | 22 | 0.2% |
| Hungarian | 68 | 0.6% |
| Indian (Asian) | 171 | 1.6% |
| Iranian | 13 | 0.1% |
| Irish | 1,228 | 11.3% |
| Italian | 1,519 | 14.0% |
| Jamaican | 32 | 0.3% |
| Korean | 90 | 0.8% |
| Lebanese | 24 | 0.2% |
| Mexican | 207 | 1.9% |
| Northern European | 19 | 0.2% |
| Norwegian | 197 | 1.8% |
| Paraguayan | 4 | 0.0% |
| Peruvian | 261 | 2.4% |
| Polish | 319 | 2.9% |
| Portuguese | 42 | 0.4% |
| Puerto Rican | 583 | 5.4% |
| Romanian | 8 | 0.1% |
| Russian | 184 | 1.7% |
| Salvadoran | 15 | 0.1% |
| Scandinavian | 15 | 0.1% |
| Scotch-Irish | 11 | 0.1% |
| Scottish | 149 | 1.4% |
| Slavic | 26 | 0.2% |
| Slovak | 128 | 1.2% |
| South American | 424 | 3.9% |
| Spanish | 11 | 0.1% |
| Swedish | 149 | 1.4% |
| Swiss | 14 | 0.1% |
| Thai | 59 | 0.5% |
| Ukrainian | 55 | 0.5% |
| Venezuelan | 49 | 0.4% |
| Welsh | 11 | 0.1% | View All 64 Rows |
Immigrants in Mount Kisco
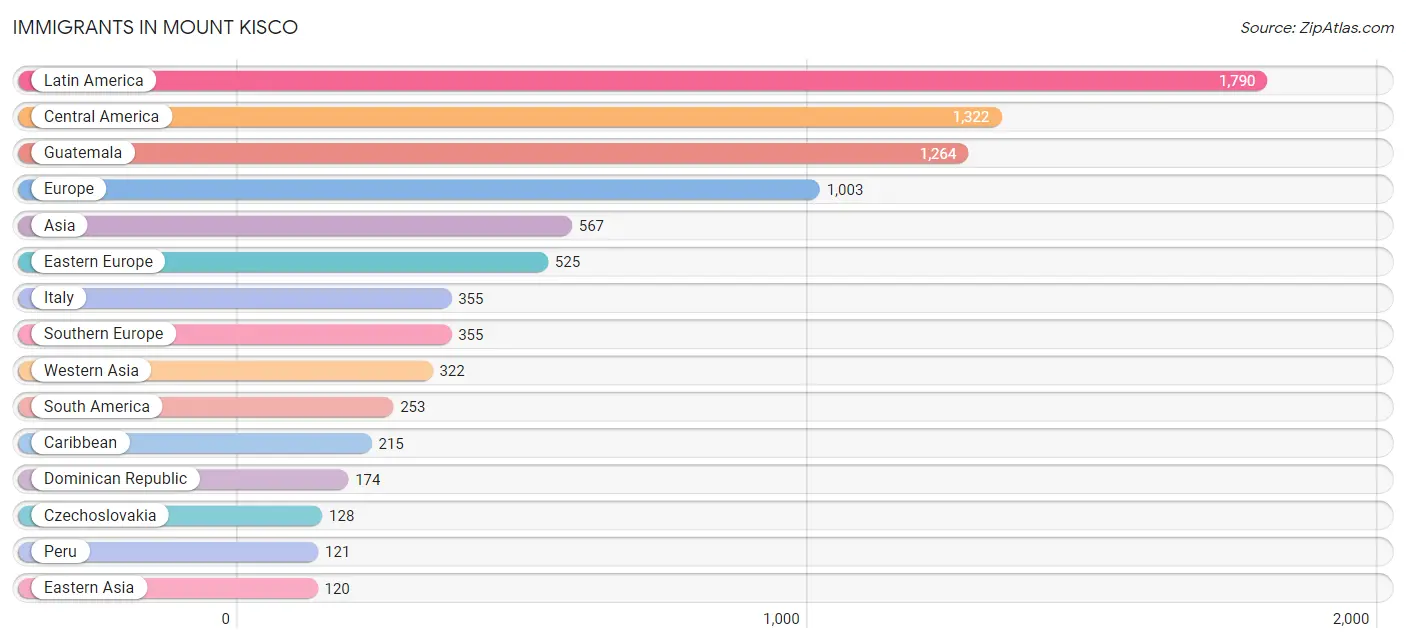
The most numerous immigrant groups reported in Mount Kisco came from Latin America (1,790 | 16.5%), Central America (1,322 | 12.2%), Guatemala (1,264 | 11.7%), Europe (1,003 | 9.3%), and Asia (567 | 5.2%), together accounting for 54.9% of all Mount Kisco residents.
| Immigration Origin | # Population | % Population |
| Africa | 7 | 0.1% |
| Albania | 114 | 1.1% |
| Asia | 567 | 5.2% |
| Brazil | 20 | 0.2% |
| Canada | 36 | 0.3% |
| Caribbean | 215 | 2.0% |
| Central America | 1,322 | 12.2% |
| China | 58 | 0.5% |
| Colombia | 98 | 0.9% |
| Czechoslovakia | 128 | 1.2% |
| Dominican Republic | 174 | 1.6% |
| Eastern Asia | 120 | 1.1% |
| Eastern Europe | 525 | 4.9% |
| El Salvador | 15 | 0.1% |
| England | 28 | 0.3% |
| Europe | 1,003 | 9.3% |
| Germany | 31 | 0.3% |
| Guatemala | 1,264 | 11.7% |
| Guyana | 10 | 0.1% |
| Hong Kong | 26 | 0.2% |
| Hungary | 32 | 0.3% |
| India | 49 | 0.4% |
| Ireland | 19 | 0.2% |
| Italy | 355 | 3.3% |
| Jamaica | 41 | 0.4% |
| Japan | 52 | 0.5% |
| Korea | 10 | 0.1% |
| Latin America | 1,790 | 16.5% |
| Malaysia | 6 | 0.1% |
| Mexico | 43 | 0.4% |
| Moldova | 24 | 0.2% |
| Nepal | 3 | 0.0% |
| Northern Europe | 92 | 0.9% |
| Peru | 121 | 1.1% |
| Philippines | 67 | 0.6% |
| Poland | 41 | 0.4% |
| Russia | 64 | 0.6% |
| Scotland | 20 | 0.2% |
| South Africa | 7 | 0.1% |
| South America | 253 | 2.3% |
| South Central Asia | 52 | 0.5% |
| South Eastern Asia | 73 | 0.7% |
| Southern Europe | 355 | 3.3% |
| Sweden | 7 | 0.1% |
| Ukraine | 11 | 0.1% |
| Western Asia | 322 | 3.0% |
| Western Europe | 31 | 0.3% | View All 47 Rows |
Sex and Age in Mount Kisco
Sex and Age in Mount Kisco
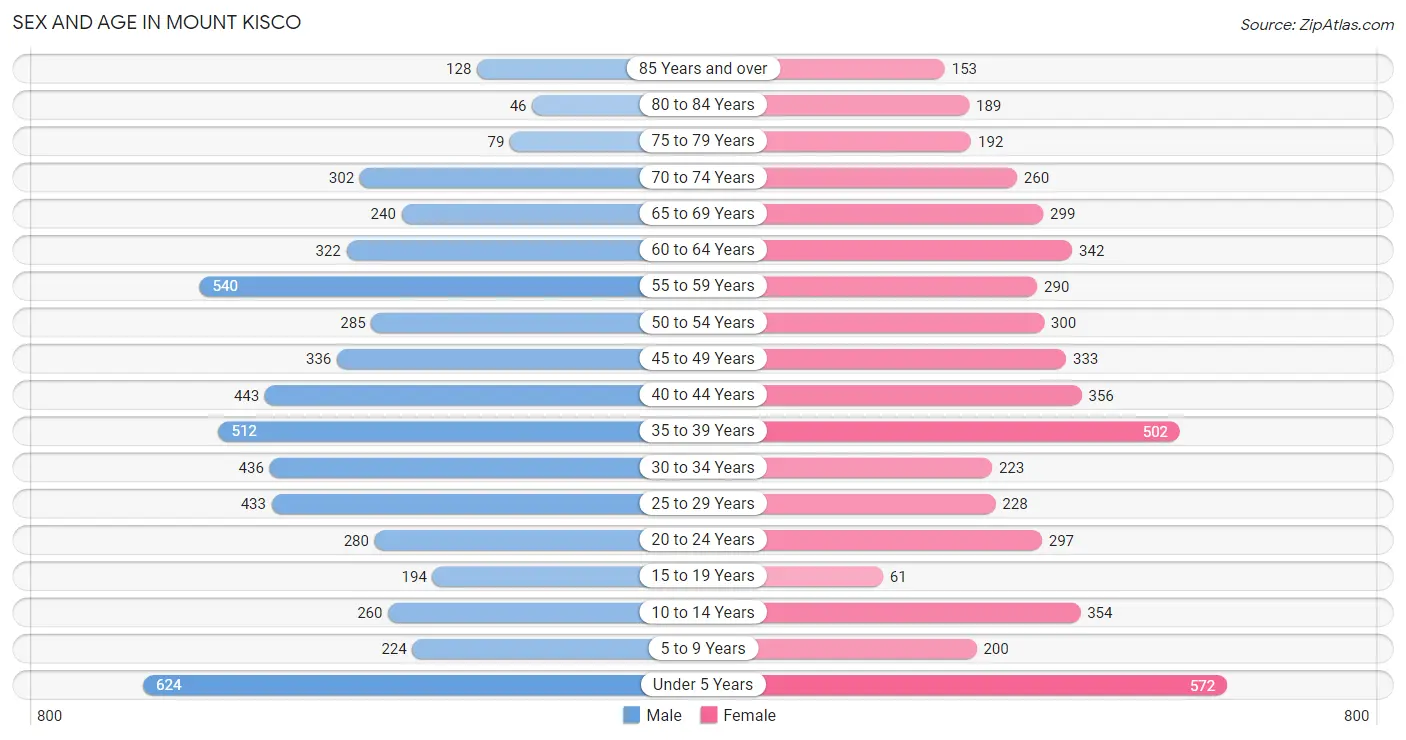
The most populous age groups in Mount Kisco are Under 5 Years (624 | 11.0%) for men and Under 5 Years (572 | 11.1%) for women.
| Age Bracket | Male | Female |
| Under 5 Years | 624 (11.0%) | 572 (11.1%) |
| 5 to 9 Years | 224 (3.9%) | 200 (3.9%) |
| 10 to 14 Years | 260 (4.6%) | 354 (6.9%) |
| 15 to 19 Years | 194 (3.4%) | 61 (1.2%) |
| 20 to 24 Years | 280 (4.9%) | 297 (5.8%) |
| 25 to 29 Years | 433 (7.6%) | 228 (4.4%) |
| 30 to 34 Years | 436 (7.7%) | 223 (4.3%) |
| 35 to 39 Years | 512 (9.0%) | 502 (9.8%) |
| 40 to 44 Years | 443 (7.8%) | 356 (6.9%) |
| 45 to 49 Years | 336 (5.9%) | 333 (6.5%) |
| 50 to 54 Years | 285 (5.0%) | 300 (5.8%) |
| 55 to 59 Years | 540 (9.5%) | 290 (5.6%) |
| 60 to 64 Years | 322 (5.7%) | 342 (6.6%) |
| 65 to 69 Years | 240 (4.2%) | 299 (5.8%) |
| 70 to 74 Years | 302 (5.3%) | 260 (5.1%) |
| 75 to 79 Years | 79 (1.4%) | 192 (3.7%) |
| 80 to 84 Years | 46 (0.8%) | 189 (3.7%) |
| 85 Years and over | 128 (2.2%) | 153 (3.0%) |
| Total | 5,684 (100.0%) | 5,151 (100.0%) |
Families and Households in Mount Kisco
Median Family Size in Mount Kisco
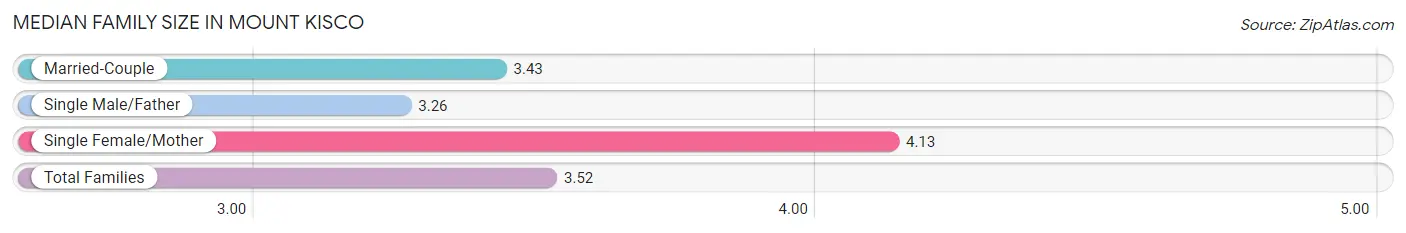
The median family size in Mount Kisco is 3.52 persons per family, with single female/mother families (297 | 12.5%) accounting for the largest median family size of 4.13 persons per family. On the other hand, single male/father families (78 | 3.3%) represent the smallest median family size with 3.26 persons per family.
| Family Type | # Families | Family Size |
| Married-Couple | 2,000 (84.2%) | 3.43 |
| Single Male/Father | 78 (3.3%) | 3.26 |
| Single Female/Mother | 297 (12.5%) | 4.13 |
| Total Families | 2,375 (100.0%) | 3.52 |
Median Household Size in Mount Kisco
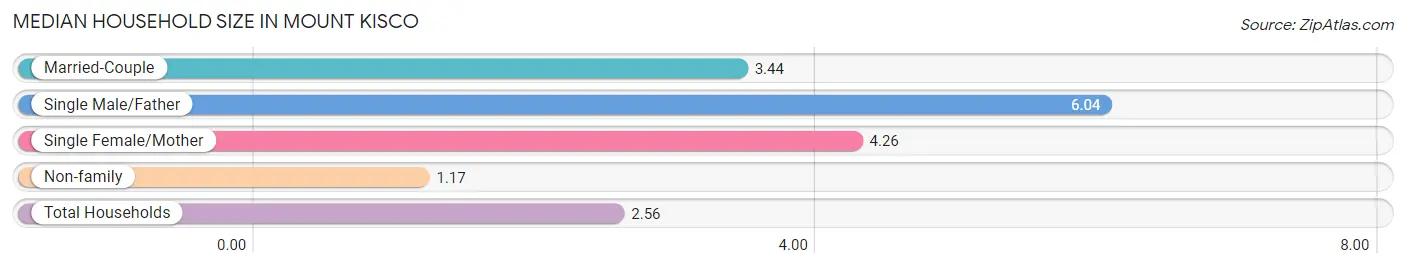
The median household size in Mount Kisco is 2.56 persons per household, with single male/father households (78 | 1.9%) accounting for the largest median household size of 6.04 persons per household. non-family households (1,827 | 43.5%) represent the smallest median household size with 1.17 persons per household.
| Household Type | # Households | Household Size |
| Married-Couple | 2,000 (47.6%) | 3.44 |
| Single Male/Father | 78 (1.9%) | 6.04 |
| Single Female/Mother | 297 (7.1%) | 4.26 |
| Non-family | 1,827 (43.5%) | 1.17 |
| Total Households | 4,202 (100.0%) | 2.56 |
Household Size by Marriage Status in Mount Kisco
Out of a total of 4,202 households in Mount Kisco, 2,375 (56.5%) are family households, while 1,827 (43.5%) are nonfamily households. The most numerous type of family households are 2-person households, comprising 745, and the most common type of nonfamily households are 1-person households, comprising 1,618.
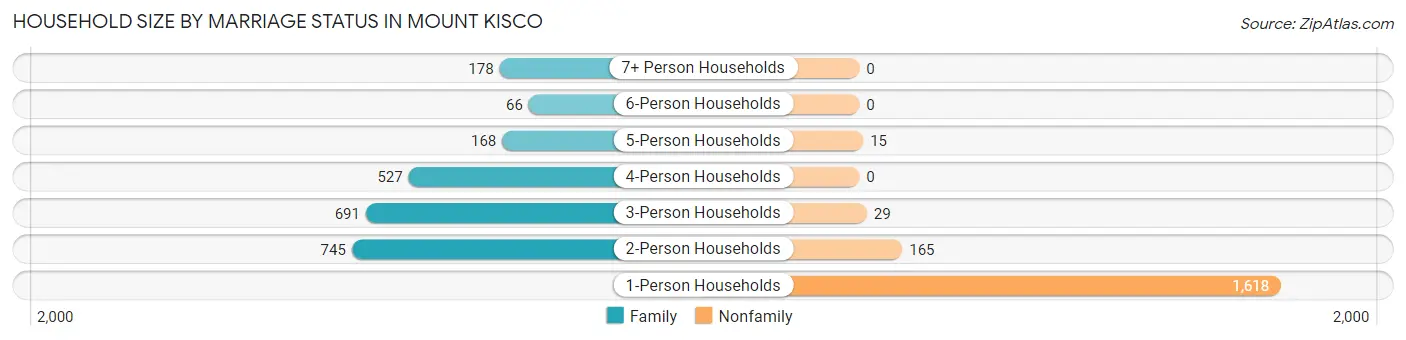
| Household Size | Family Households | Nonfamily Households |
| 1-Person Households | - | 1,618 (38.5%) |
| 2-Person Households | 745 (17.7%) | 165 (3.9%) |
| 3-Person Households | 691 (16.4%) | 29 (0.7%) |
| 4-Person Households | 527 (12.5%) | 0 (0.0%) |
| 5-Person Households | 168 (4.0%) | 15 (0.4%) |
| 6-Person Households | 66 (1.6%) | 0 (0.0%) |
| 7+ Person Households | 178 (4.2%) | 0 (0.0%) |
| Total | 2,375 (56.5%) | 1,827 (43.5%) |
Female Fertility in Mount Kisco
Fertility by Age in Mount Kisco
Average fertility rate in Mount Kisco is 48.0 births per 1,000 women. Women in the age bracket of 35 to 50 years have the highest fertility rate with 50.0 births per 1,000 women. Women in the age bracket of 35 to 50 years acount for 62.2% of all women with births.
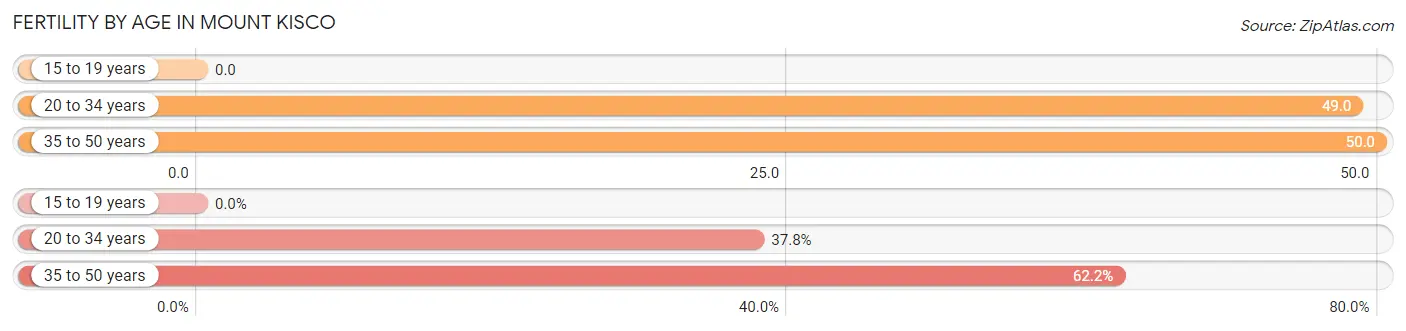
| Age Bracket | Women with Births | Births / 1,000 Women |
| 15 to 19 years | 0 (0.0%) | 0.0 |
| 20 to 34 years | 37 (37.8%) | 49.0 |
| 35 to 50 years | 61 (62.2%) | 50.0 |
| Total | 98 (100.0%) | 48.0 |
Fertility by Age by Marriage Status in Mount Kisco
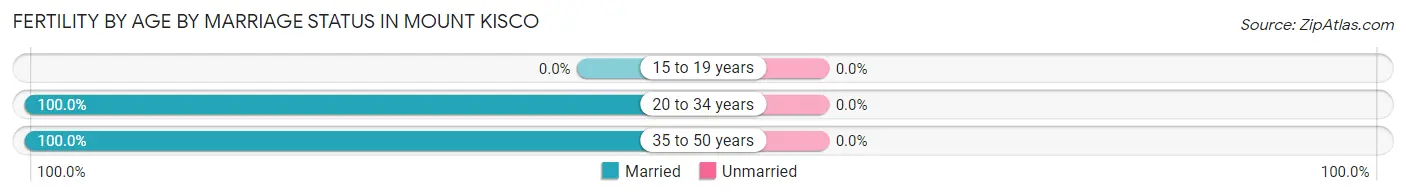
| Age Bracket | Married | Unmarried |
| 15 to 19 years | 0 (0.0%) | 0 (0.0%) |
| 20 to 34 years | 37 (100.0%) | 0 (0.0%) |
| 35 to 50 years | 61 (100.0%) | 0 (0.0%) |
| Total | 98 (100.0%) | 0 (0.0%) |
Fertility by Education in Mount Kisco
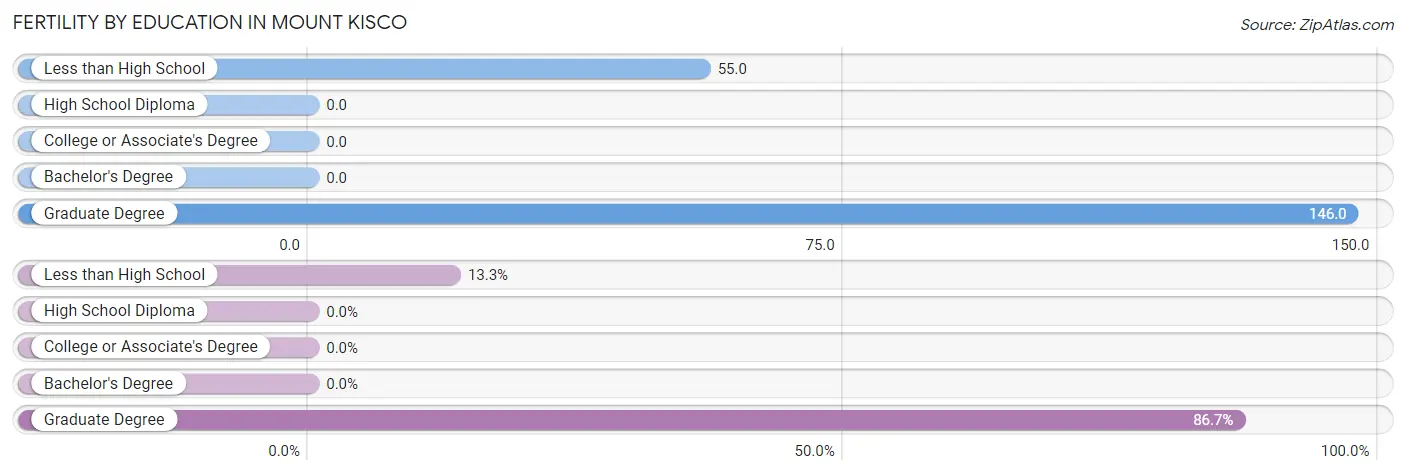
| Educational Attainment | Women with Births | Births / 1,000 Women |
| Less than High School | 13 (13.3%) | 55.0 |
| High School Diploma | 0 (0.0%) | 0.0 |
| College or Associate's Degree | 0 (0.0%) | 0.0 |
| Bachelor's Degree | 0 (0.0%) | 0.0 |
| Graduate Degree | 85 (86.7%) | 146.0 |
| Total | 98 (100.0%) | 48.0 |
Fertility by Education by Marriage Status in Mount Kisco
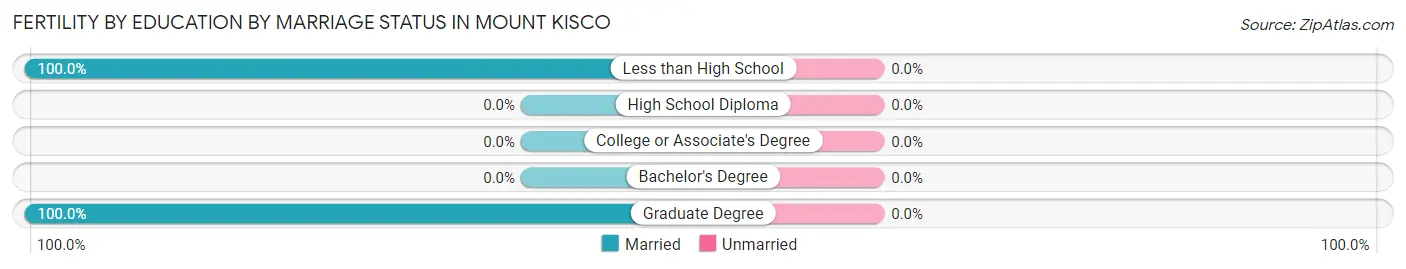
| Educational Attainment | Married | Unmarried |
| Less than High School | 13 (100.0%) | 0 (0.0%) |
| High School Diploma | 0 (0.0%) | 0 (0.0%) |
| College or Associate's Degree | 0 (0.0%) | 0 (0.0%) |
| Bachelor's Degree | 0 (0.0%) | 0 (0.0%) |
| Graduate Degree | 85 (100.0%) | 0 (0.0%) |
| Total | 98 (100.0%) | 0 (0.0%) |
Employment Characteristics in Mount Kisco
Employment by Class of Employer in Mount Kisco
Among the 5,425 employed individuals in Mount Kisco, private company employees (3,566 | 65.7%), local government employees (568 | 10.5%), and not-for-profit organizations (566 | 10.4%) make up the most common classes of employment.
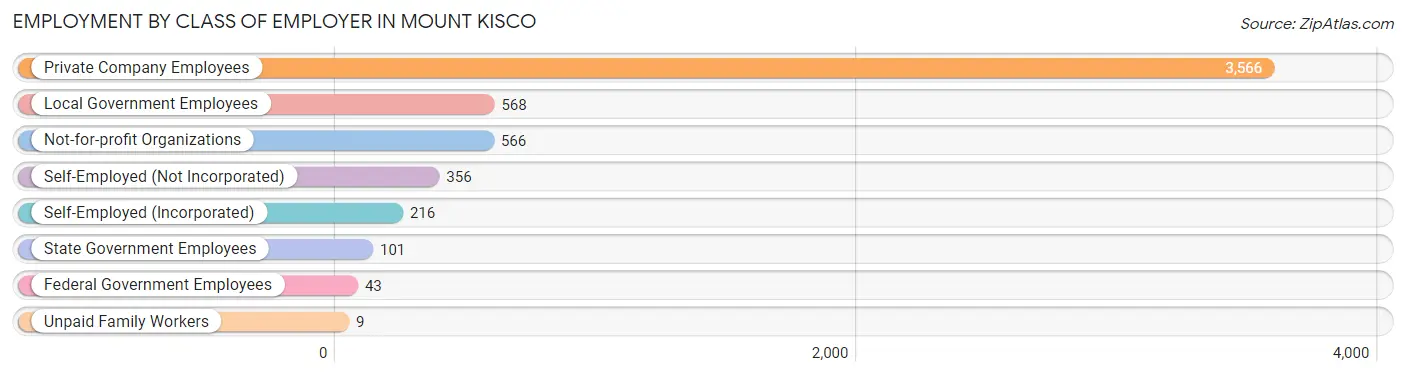
| Employer Class | # Employees | % Employees |
| Private Company Employees | 3,566 | 65.7% |
| Self-Employed (Incorporated) | 216 | 4.0% |
| Self-Employed (Not Incorporated) | 356 | 6.6% |
| Not-for-profit Organizations | 566 | 10.4% |
| Local Government Employees | 568 | 10.5% |
| State Government Employees | 101 | 1.9% |
| Federal Government Employees | 43 | 0.8% |
| Unpaid Family Workers | 9 | 0.2% |
| Total | 5,425 | 100.0% |
Employment Status by Age in Mount Kisco
According to the labor force statistics for Mount Kisco, out of the total population over 16 years of age (8,536), 67.3% or 5,745 individuals are in the labor force, with 4.9% or 282 of them unemployed. The age group with the highest labor force participation rate is 25 to 29 years, with 96.4% or 637 individuals in the labor force. Within the labor force, the 20 to 24 years age range has the highest percentage of unemployed individuals, with 22.9% or 96 of them being unemployed.
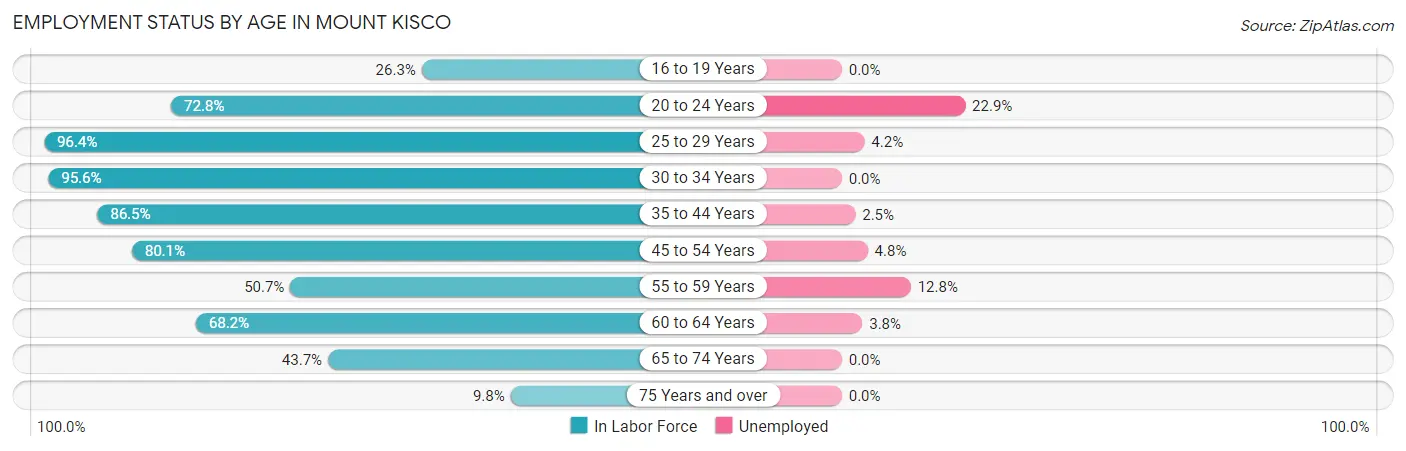
| Age Bracket | In Labor Force | Unemployed |
| 16 to 19 Years | 50 (26.3%) | 0 (0.0%) |
| 20 to 24 Years | 420 (72.8%) | 96 (22.9%) |
| 25 to 29 Years | 637 (96.4%) | 27 (4.2%) |
| 30 to 34 Years | 630 (95.6%) | 0 (0.0%) |
| 35 to 44 Years | 1,568 (86.5%) | 39 (2.5%) |
| 45 to 54 Years | 1,004 (80.1%) | 48 (4.8%) |
| 55 to 59 Years | 421 (50.7%) | 54 (12.8%) |
| 60 to 64 Years | 453 (68.2%) | 17 (3.8%) |
| 65 to 74 Years | 481 (43.7%) | 0 (0.0%) |
| 75 Years and over | 77 (9.8%) | 0 (0.0%) |
| Total | 5,745 (67.3%) | 282 (4.9%) |
Employment Status by Educational Attainment in Mount Kisco
According to labor force statistics for Mount Kisco, 80.2% of individuals (4,717) out of the total population between 25 and 64 years of age (5,881) are in the labor force, with 3.9% or 184 of them being unemployed. The group with the highest labor force participation rate are those with the educational attainment of less than high school, with 93.0% or 766 individuals in the labor force. Within the labor force, individuals with college / associate degree education have the highest percentage of unemployment, with 9.6% or 50 of them being unemployed.
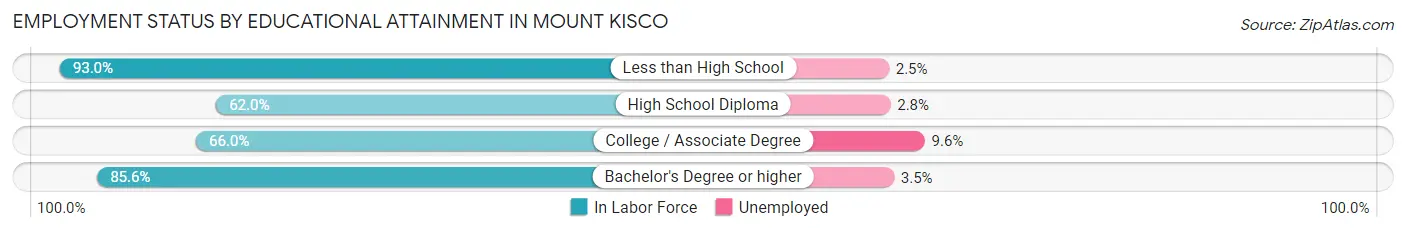
| Educational Attainment | In Labor Force | Unemployed |
| Less than High School | 766 (93.0%) | 21 (2.5%) |
| High School Diploma | 598 (62.0%) | 27 (2.8%) |
| College / Associate Degree | 521 (66.0%) | 76 (9.6%) |
| Bachelor's Degree or higher | 2,827 (85.6%) | 116 (3.5%) |
| Total | 4,717 (80.2%) | 229 (3.9%) |
Employment Occupations by Sex in Mount Kisco
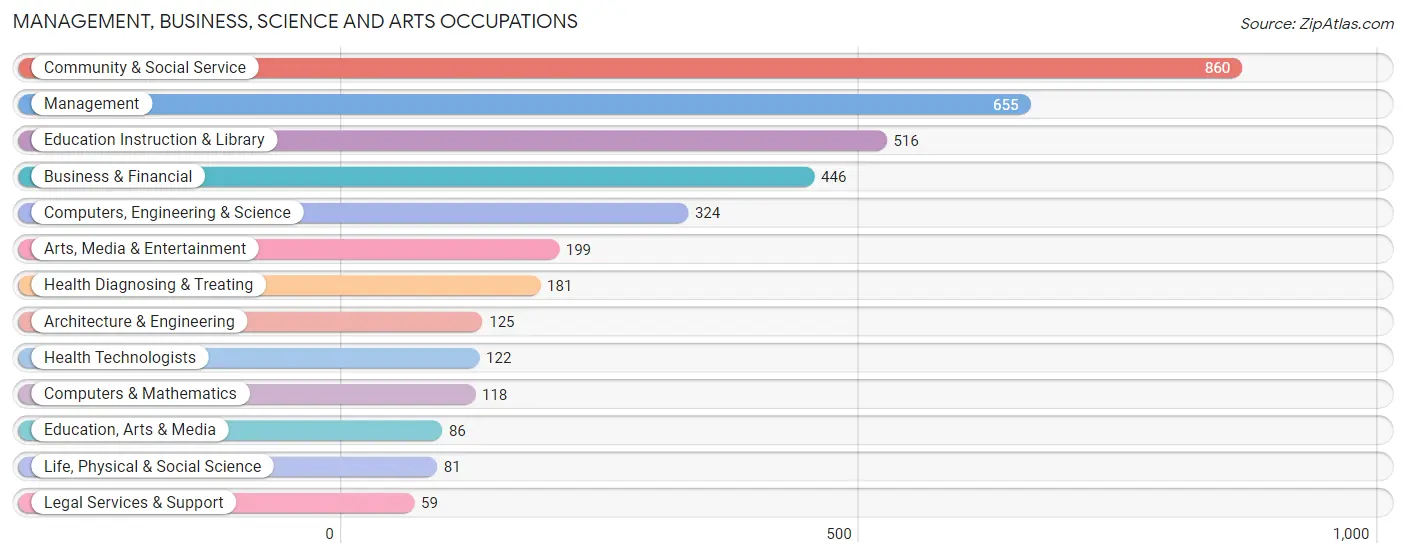
Management, Business, Science and Arts Occupations
The most common Management, Business, Science and Arts occupations in Mount Kisco are Community & Social Service (860 | 15.8%), Management (655 | 12.0%), Education Instruction & Library (516 | 9.5%), Business & Financial (446 | 8.2%), and Computers, Engineering & Science (324 | 5.9%).
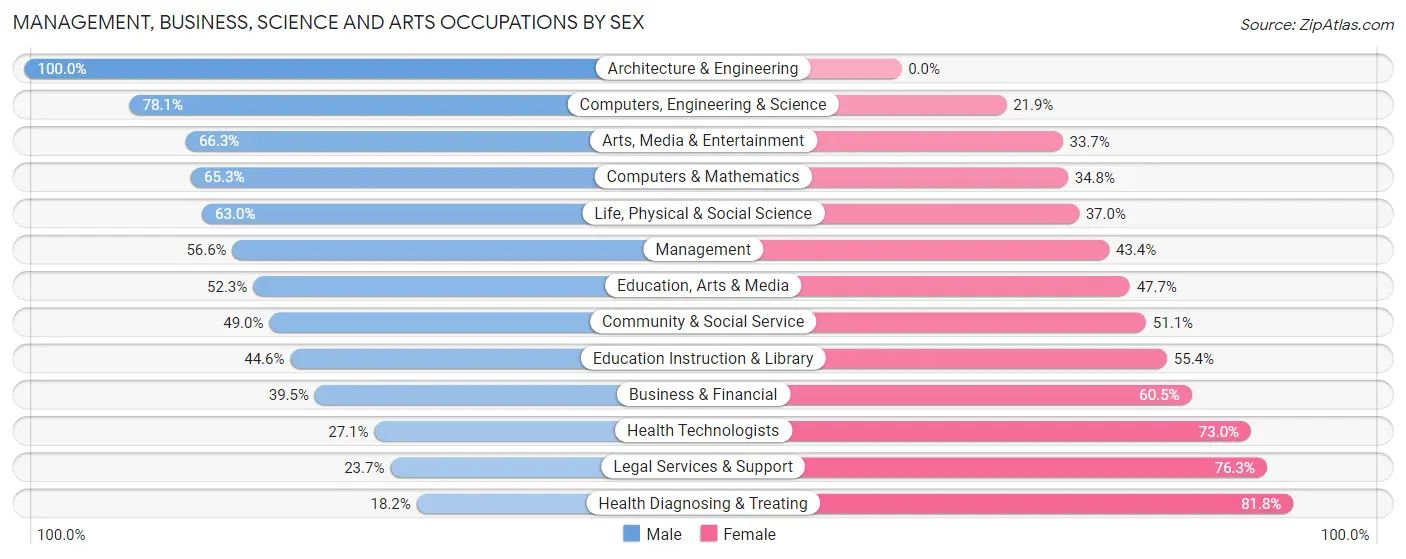
Management, Business, Science and Arts Occupations by Sex
Within the Management, Business, Science and Arts occupations in Mount Kisco, the most male-oriented occupations are Architecture & Engineering (100.0%), Computers, Engineering & Science (78.1%), and Arts, Media & Entertainment (66.3%), while the most female-oriented occupations are Health Diagnosing & Treating (81.8%), Legal Services & Support (76.3%), and Health Technologists (73.0%).
| Occupation | Male | Female |
| Management | 371 (56.6%) | 284 (43.4%) |
| Business & Financial | 176 (39.5%) | 270 (60.5%) |
| Computers, Engineering & Science | 253 (78.1%) | 71 (21.9%) |
| Computers & Mathematics | 77 (65.2%) | 41 (34.7%) |
| Architecture & Engineering | 125 (100.0%) | 0 (0.0%) |
| Life, Physical & Social Science | 51 (63.0%) | 30 (37.0%) |
| Community & Social Service | 421 (48.9%) | 439 (51.0%) |
| Education, Arts & Media | 45 (52.3%) | 41 (47.7%) |
| Legal Services & Support | 14 (23.7%) | 45 (76.3%) |
| Education Instruction & Library | 230 (44.6%) | 286 (55.4%) |
| Arts, Media & Entertainment | 132 (66.3%) | 67 (33.7%) |
| Health Diagnosing & Treating | 33 (18.2%) | 148 (81.8%) |
| Health Technologists | 33 (27.1%) | 89 (73.0%) |
| Total (Category) | 1,254 (50.8%) | 1,212 (49.1%) |
| Total (Overall) | 3,233 (59.2%) | 2,228 (40.8%) |
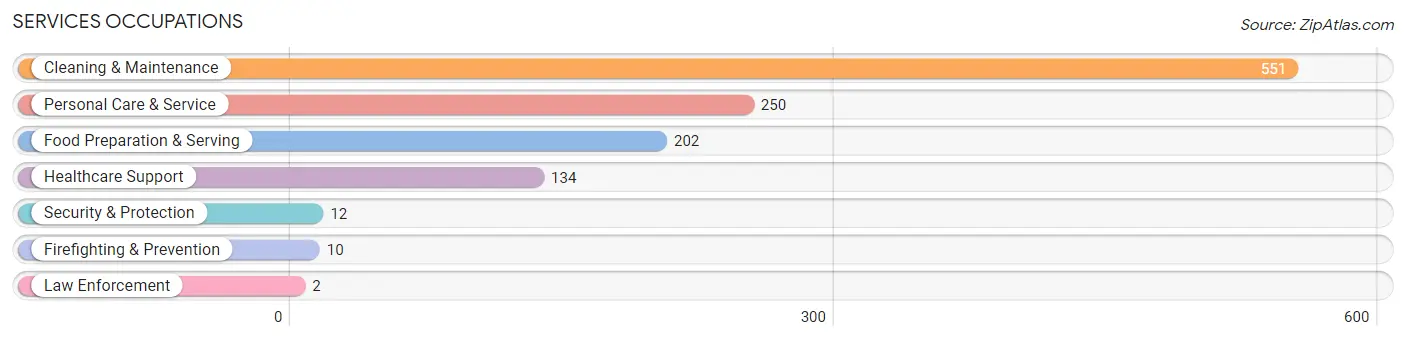
Services Occupations
The most common Services occupations in Mount Kisco are Cleaning & Maintenance (551 | 10.1%), Personal Care & Service (250 | 4.6%), Food Preparation & Serving (202 | 3.7%), Healthcare Support (134 | 2.5%), and Security & Protection (12 | 0.2%).
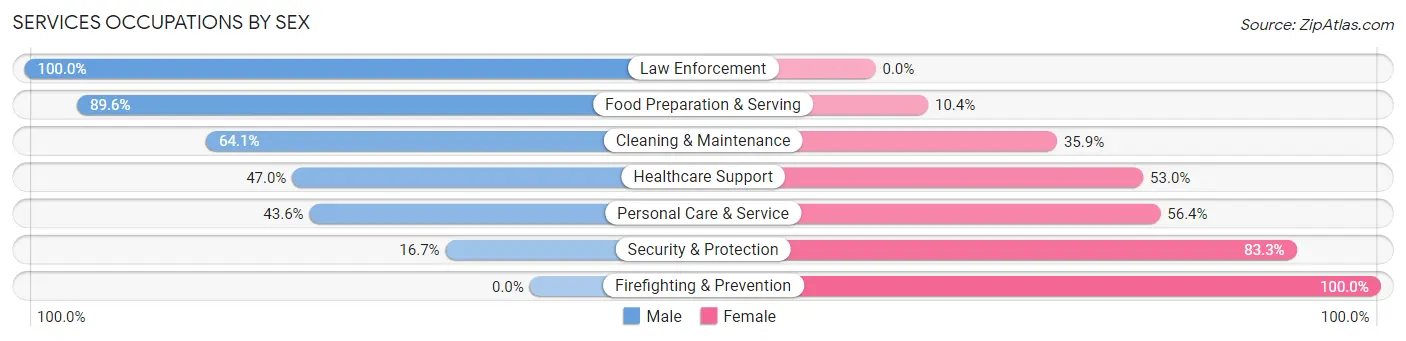
Services Occupations by Sex
Within the Services occupations in Mount Kisco, the most male-oriented occupations are Law Enforcement (100.0%), Food Preparation & Serving (89.6%), and Cleaning & Maintenance (64.1%), while the most female-oriented occupations are Firefighting & Prevention (100.0%), Security & Protection (83.3%), and Personal Care & Service (56.4%).
| Occupation | Male | Female |
| Healthcare Support | 63 (47.0%) | 71 (53.0%) |
| Security & Protection | 2 (16.7%) | 10 (83.3%) |
| Firefighting & Prevention | 0 (0.0%) | 10 (100.0%) |
| Law Enforcement | 2 (100.0%) | 0 (0.0%) |
| Food Preparation & Serving | 181 (89.6%) | 21 (10.4%) |
| Cleaning & Maintenance | 353 (64.1%) | 198 (35.9%) |
| Personal Care & Service | 109 (43.6%) | 141 (56.4%) |
| Total (Category) | 708 (61.6%) | 441 (38.4%) |
| Total (Overall) | 3,233 (59.2%) | 2,228 (40.8%) |
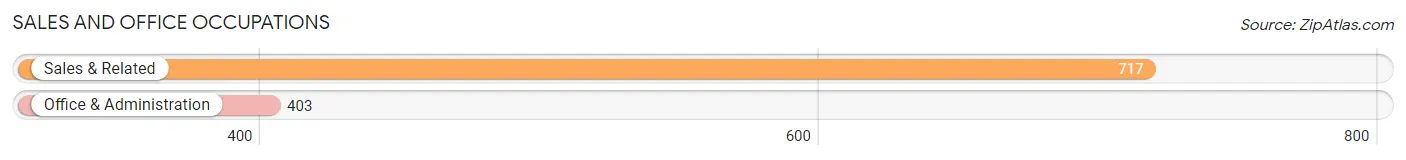
Sales and Office Occupations
The most common Sales and Office occupations in Mount Kisco are Sales & Related (717 | 13.1%), and Office & Administration (403 | 7.4%).
Sales and Office Occupations by Sex
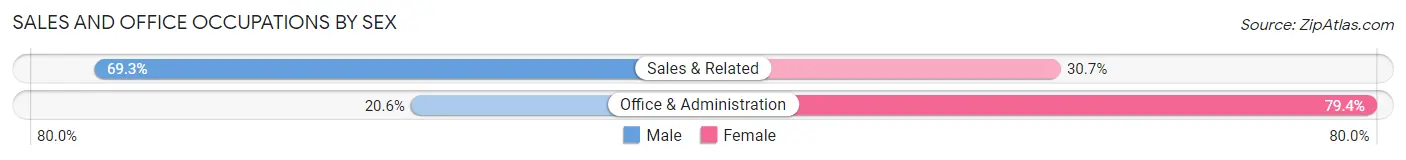
| Occupation | Male | Female |
| Sales & Related | 497 (69.3%) | 220 (30.7%) |
| Office & Administration | 83 (20.6%) | 320 (79.4%) |
| Total (Category) | 580 (51.8%) | 540 (48.2%) |
| Total (Overall) | 3,233 (59.2%) | 2,228 (40.8%) |
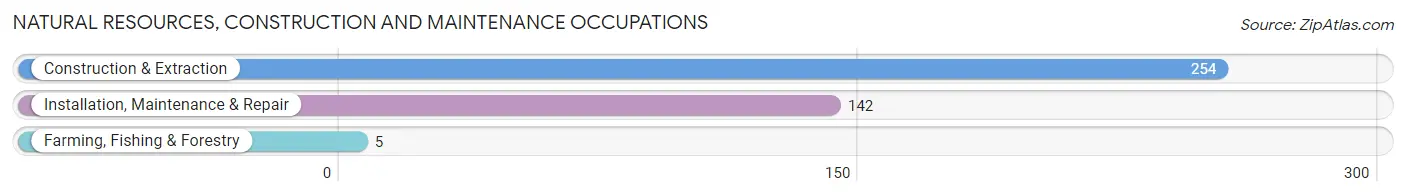
Natural Resources, Construction and Maintenance Occupations
The most common Natural Resources, Construction and Maintenance occupations in Mount Kisco are Construction & Extraction (254 | 4.6%), Installation, Maintenance & Repair (142 | 2.6%), and Farming, Fishing & Forestry (5 | 0.1%).
Natural Resources, Construction and Maintenance Occupations by Sex
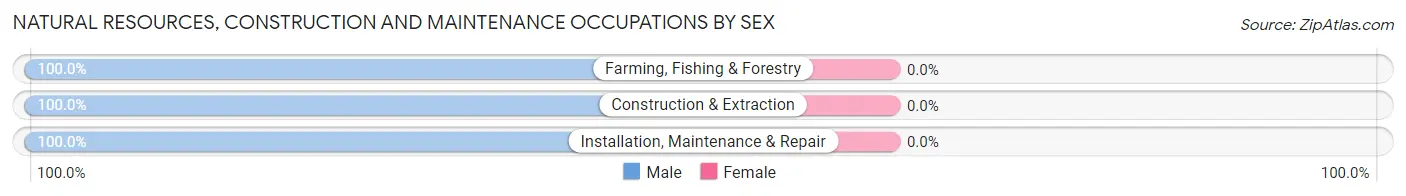
| Occupation | Male | Female |
| Farming, Fishing & Forestry | 5 (100.0%) | 0 (0.0%) |
| Construction & Extraction | 254 (100.0%) | 0 (0.0%) |
| Installation, Maintenance & Repair | 142 (100.0%) | 0 (0.0%) |
| Total (Category) | 401 (100.0%) | 0 (0.0%) |
| Total (Overall) | 3,233 (59.2%) | 2,228 (40.8%) |
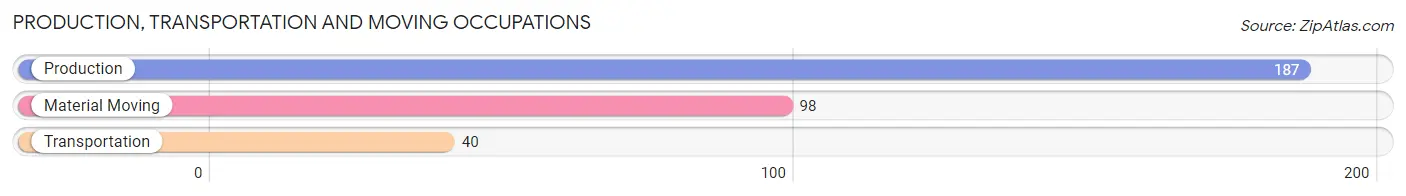
Production, Transportation and Moving Occupations
The most common Production, Transportation and Moving occupations in Mount Kisco are Production (187 | 3.4%), Material Moving (98 | 1.8%), and Transportation (40 | 0.7%).
Production, Transportation and Moving Occupations by Sex
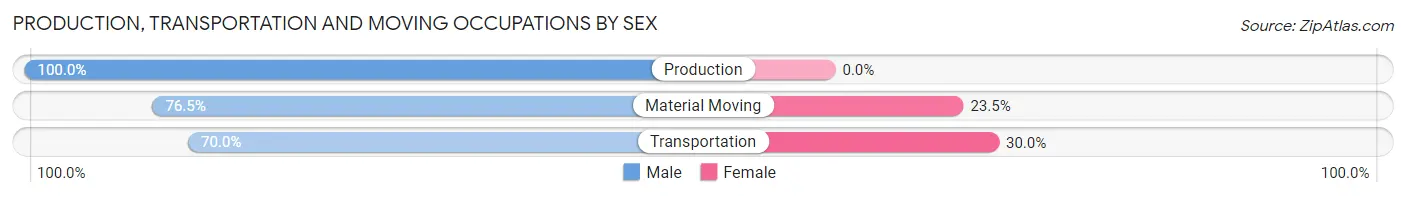
| Occupation | Male | Female |
| Production | 187 (100.0%) | 0 (0.0%) |
| Transportation | 28 (70.0%) | 12 (30.0%) |
| Material Moving | 75 (76.5%) | 23 (23.5%) |
| Total (Category) | 290 (89.2%) | 35 (10.8%) |
| Total (Overall) | 3,233 (59.2%) | 2,228 (40.8%) |
Employment Industries by Sex in Mount Kisco
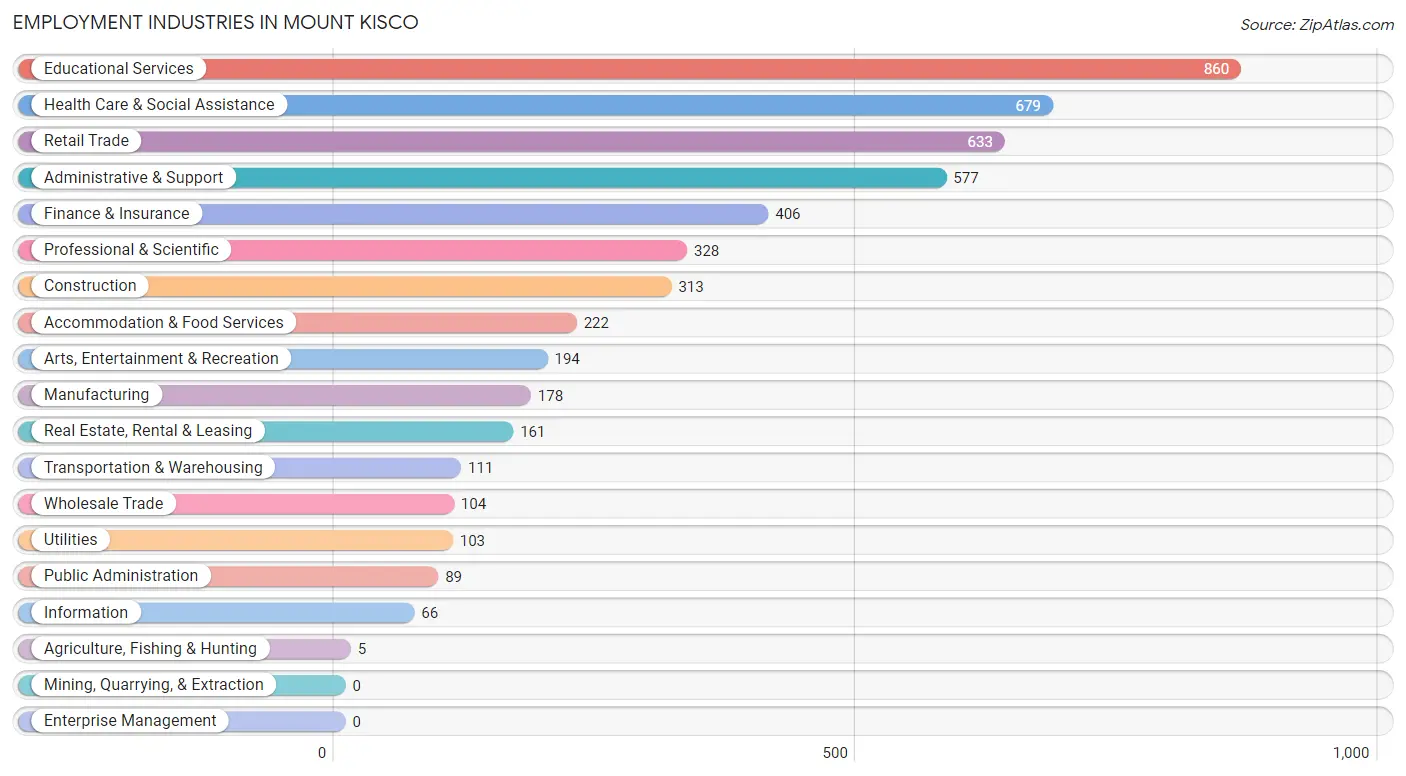
Employment Industries in Mount Kisco
The major employment industries in Mount Kisco include Educational Services (860 | 15.8%), Health Care & Social Assistance (679 | 12.4%), Retail Trade (633 | 11.6%), Administrative & Support (577 | 10.6%), and Finance & Insurance (406 | 7.4%).
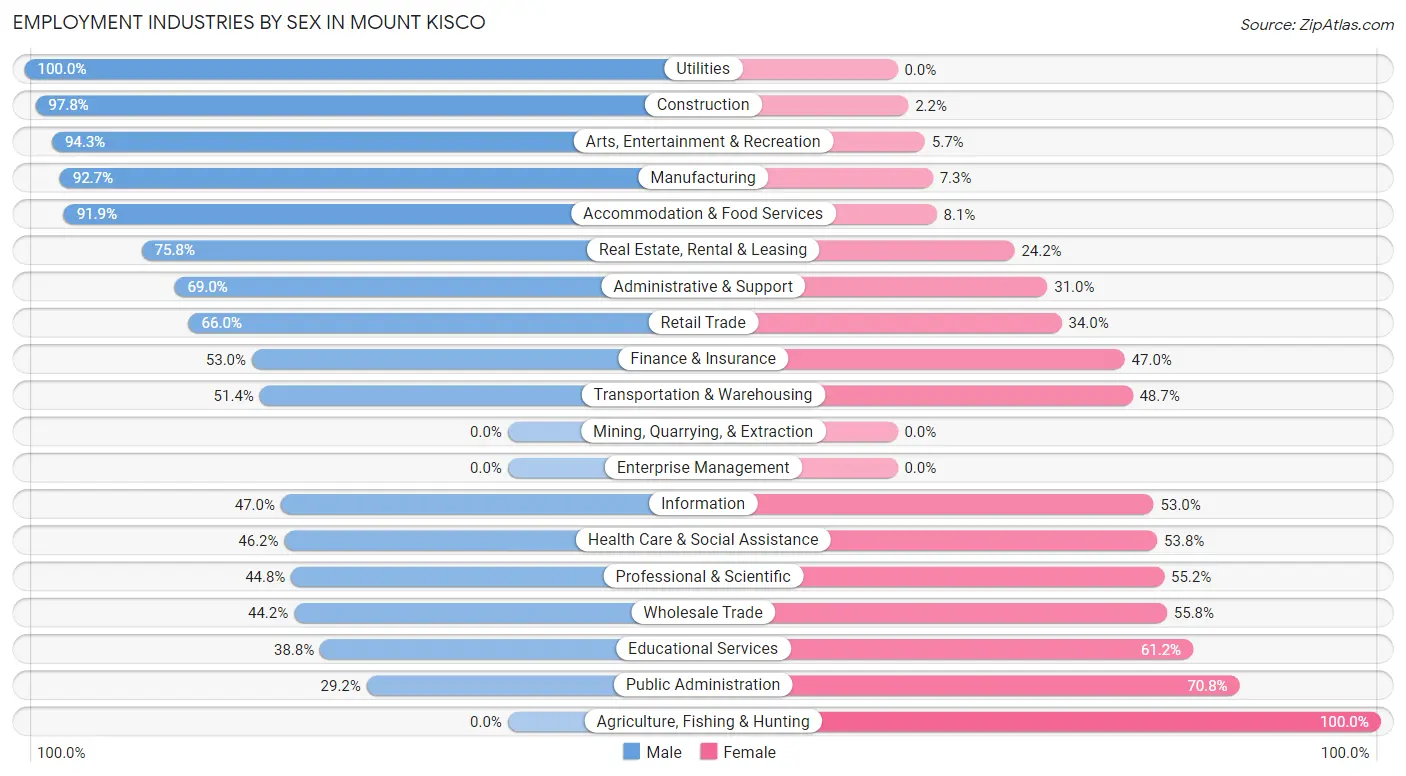
Employment Industries by Sex in Mount Kisco
The Mount Kisco industries that see more men than women are Utilities (100.0%), Construction (97.8%), and Arts, Entertainment & Recreation (94.3%), whereas the industries that tend to have a higher number of women are Agriculture, Fishing & Hunting (100.0%), Public Administration (70.8%), and Educational Services (61.2%).
| Industry | Male | Female |
| Agriculture, Fishing & Hunting | 0 (0.0%) | 5 (100.0%) |
| Mining, Quarrying, & Extraction | 0 (0.0%) | 0 (0.0%) |
| Construction | 306 (97.8%) | 7 (2.2%) |
| Manufacturing | 165 (92.7%) | 13 (7.3%) |
| Wholesale Trade | 46 (44.2%) | 58 (55.8%) |
| Retail Trade | 418 (66.0%) | 215 (34.0%) |
| Transportation & Warehousing | 57 (51.3%) | 54 (48.6%) |
| Utilities | 103 (100.0%) | 0 (0.0%) |
| Information | 31 (47.0%) | 35 (53.0%) |
| Finance & Insurance | 215 (53.0%) | 191 (47.0%) |
| Real Estate, Rental & Leasing | 122 (75.8%) | 39 (24.2%) |
| Professional & Scientific | 147 (44.8%) | 181 (55.2%) |
| Enterprise Management | 0 (0.0%) | 0 (0.0%) |
| Administrative & Support | 398 (69.0%) | 179 (31.0%) |
| Educational Services | 334 (38.8%) | 526 (61.2%) |
| Health Care & Social Assistance | 314 (46.2%) | 365 (53.8%) |
| Arts, Entertainment & Recreation | 183 (94.3%) | 11 (5.7%) |
| Accommodation & Food Services | 204 (91.9%) | 18 (8.1%) |
| Public Administration | 26 (29.2%) | 63 (70.8%) |
| Total | 3,233 (59.2%) | 2,228 (40.8%) |
Education in Mount Kisco
School Enrollment in Mount Kisco
The most common levels of schooling among the 2,009 students in Mount Kisco are high school (464 | 23.1%), elementary school (354 | 17.6%), and middle school (337 | 16.8%).
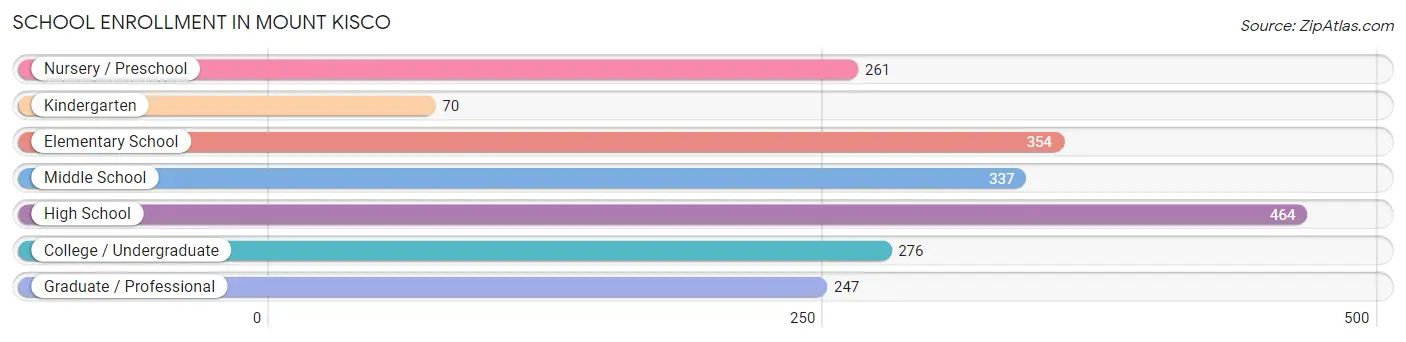
| School Level | # Students | % Students |
| Nursery / Preschool | 261 | 13.0% |
| Kindergarten | 70 | 3.5% |
| Elementary School | 354 | 17.6% |
| Middle School | 337 | 16.8% |
| High School | 464 | 23.1% |
| College / Undergraduate | 276 | 13.7% |
| Graduate / Professional | 247 | 12.3% |
| Total | 2,009 | 100.0% |
School Enrollment by Age by Funding Source in Mount Kisco
Out of a total of 2,009 students who are enrolled in schools in Mount Kisco, 530 (26.4%) attend a private institution, while the remaining 1,479 (73.6%) are enrolled in public schools. The age group of 3 to 4 year olds has the highest likelihood of being enrolled in private schools, with 225 (86.2% in the age bracket) enrolled. Conversely, the age group of 5 to 9 year old has the lowest likelihood of being enrolled in a private school, with 424 (100.0% in the age bracket) attending a public institution.
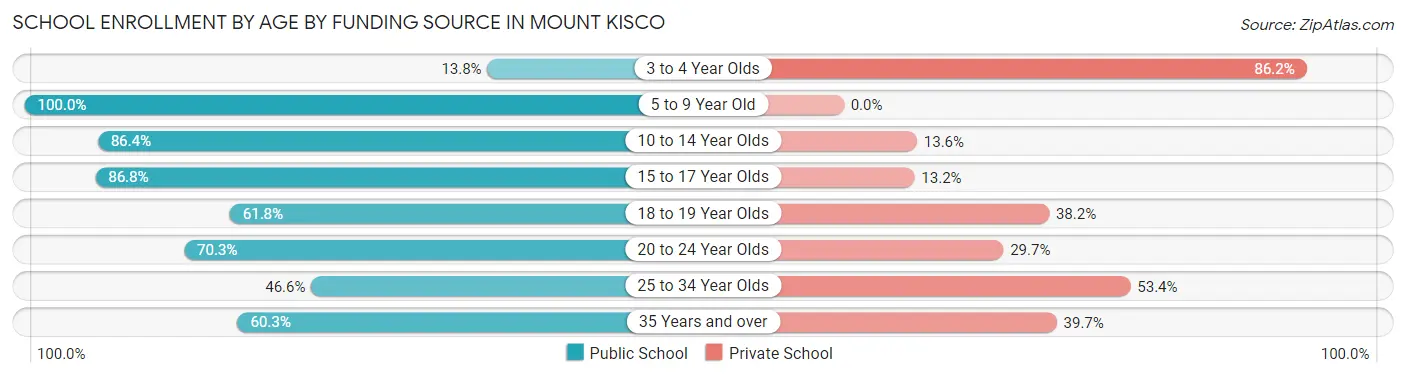
| Age Bracket | Public School | Private School |
| 3 to 4 Year Olds | 36 (13.8%) | 225 (86.2%) |
| 5 to 9 Year Old | 424 (100.0%) | 0 (0.0%) |
| 10 to 14 Year Olds | 488 (86.4%) | 77 (13.6%) |
| 15 to 17 Year Olds | 191 (86.8%) | 29 (13.2%) |
| 18 to 19 Year Olds | 21 (61.8%) | 13 (38.2%) |
| 20 to 24 Year Olds | 201 (70.3%) | 85 (29.7%) |
| 25 to 34 Year Olds | 48 (46.6%) | 55 (53.4%) |
| 35 Years and over | 70 (60.3%) | 46 (39.7%) |
| Total | 1,479 (73.6%) | 530 (26.4%) |
Educational Attainment by Field of Study in Mount Kisco
Business (774 | 17.9%), social sciences (426 | 9.9%), visual & performing arts (418 | 9.7%), education (340 | 7.9%), and psychology (320 | 7.4%) are the most common fields of study among 4,315 individuals in Mount Kisco who have obtained a bachelor's degree or higher.
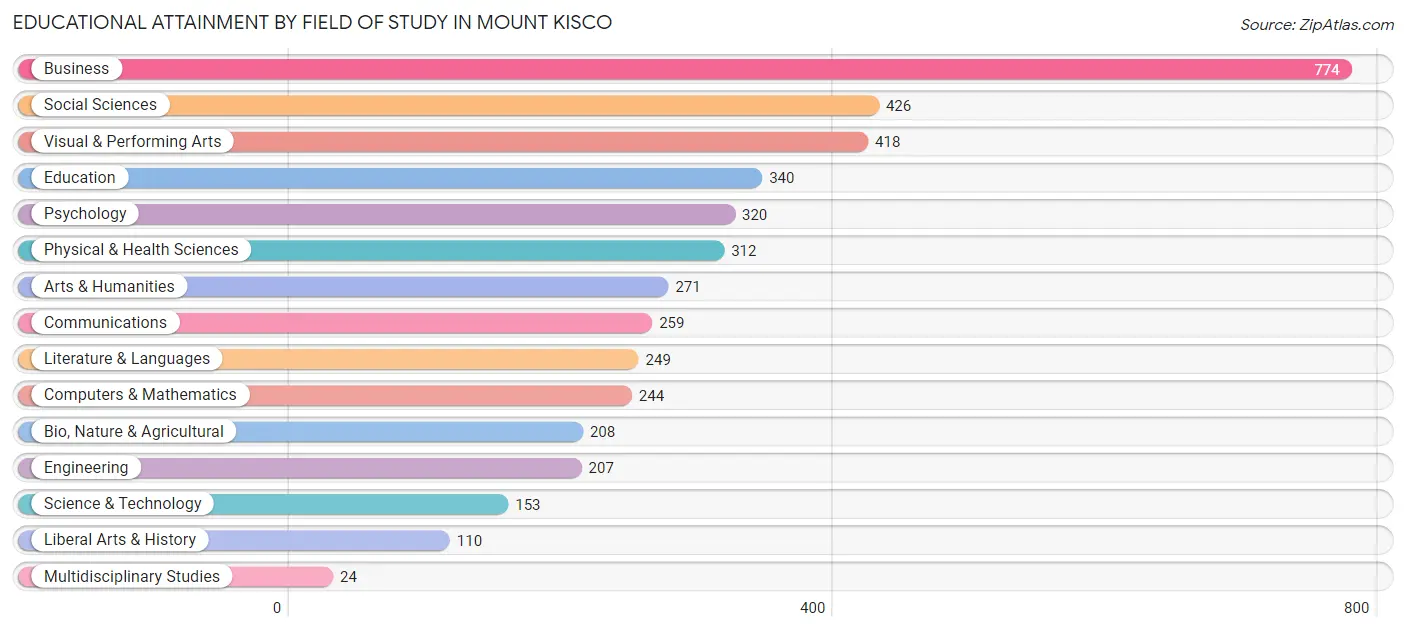
| Field of Study | # Graduates | % Graduates |
| Computers & Mathematics | 244 | 5.7% |
| Bio, Nature & Agricultural | 208 | 4.8% |
| Physical & Health Sciences | 312 | 7.2% |
| Psychology | 320 | 7.4% |
| Social Sciences | 426 | 9.9% |
| Engineering | 207 | 4.8% |
| Multidisciplinary Studies | 24 | 0.6% |
| Science & Technology | 153 | 3.5% |
| Business | 774 | 17.9% |
| Education | 340 | 7.9% |
| Literature & Languages | 249 | 5.8% |
| Liberal Arts & History | 110 | 2.5% |
| Visual & Performing Arts | 418 | 9.7% |
| Communications | 259 | 6.0% |
| Arts & Humanities | 271 | 6.3% |
| Total | 4,315 | 100.0% |
Transportation & Commute in Mount Kisco
Vehicle Availability by Sex in Mount Kisco
The most prevalent vehicle ownership categories in Mount Kisco are males with 2 vehicles (1,076, accounting for 33.9%) and females with 2 vehicles (760, making up 48.4%).
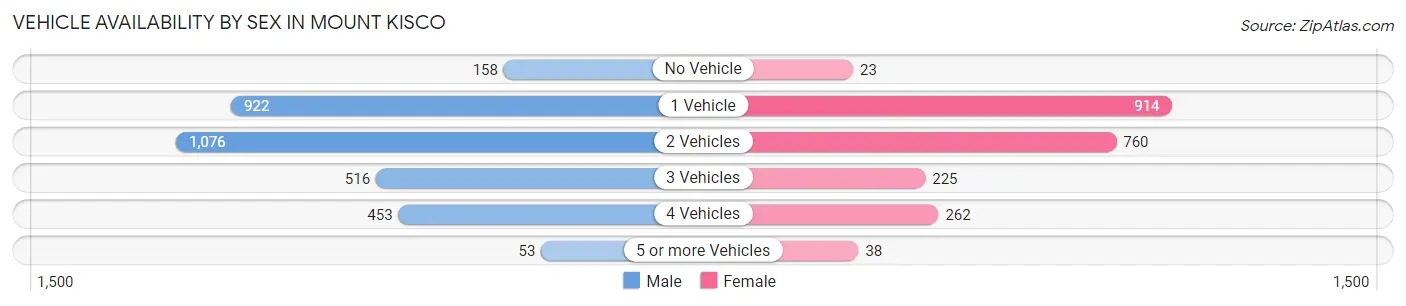
| Vehicles Available | Male | Female |
| No Vehicle | 158 (5.0%) | 23 (1.0%) |
| 1 Vehicle | 922 (29.0%) | 914 (41.1%) |
| 2 Vehicles | 1,076 (33.9%) | 760 (34.2%) |
| 3 Vehicles | 516 (16.2%) | 225 (10.1%) |
| 4 Vehicles | 453 (14.2%) | 262 (11.8%) |
| 5 or more Vehicles | 53 (1.7%) | 38 (1.7%) |
| Total | 3,178 (100.0%) | 2,222 (100.0%) |
Commute Time in Mount Kisco
The most frequently occuring commute durations in Mount Kisco are 30 to 34 minutes (600 commuters, 13.1%), 5 to 9 minutes (587 commuters, 12.8%), and 10 to 14 minutes (572 commuters, 12.4%).
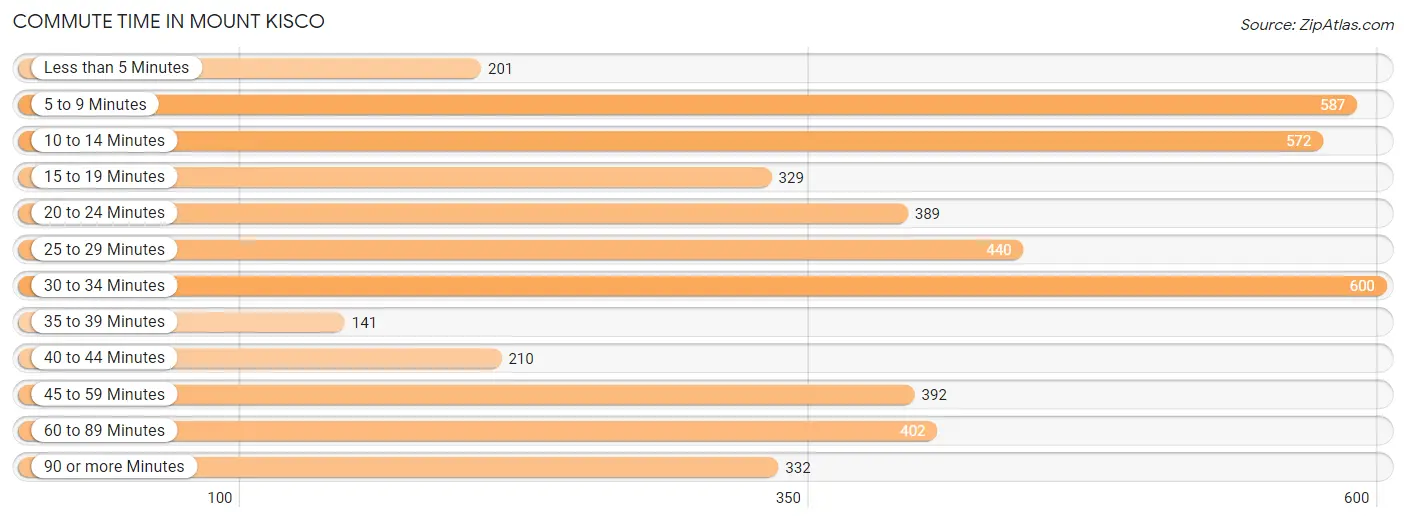
| Commute Time | # Commuters | % Commuters |
| Less than 5 Minutes | 201 | 4.4% |
| 5 to 9 Minutes | 587 | 12.8% |
| 10 to 14 Minutes | 572 | 12.4% |
| 15 to 19 Minutes | 329 | 7.2% |
| 20 to 24 Minutes | 389 | 8.5% |
| 25 to 29 Minutes | 440 | 9.6% |
| 30 to 34 Minutes | 600 | 13.1% |
| 35 to 39 Minutes | 141 | 3.1% |
| 40 to 44 Minutes | 210 | 4.6% |
| 45 to 59 Minutes | 392 | 8.5% |
| 60 to 89 Minutes | 402 | 8.7% |
| 90 or more Minutes | 332 | 7.2% |
Commute Time by Sex in Mount Kisco
The most common commute times in Mount Kisco are 30 to 34 minutes (476 commuters, 17.5%) for males and 5 to 9 minutes (332 commuters, 17.7%) for females.
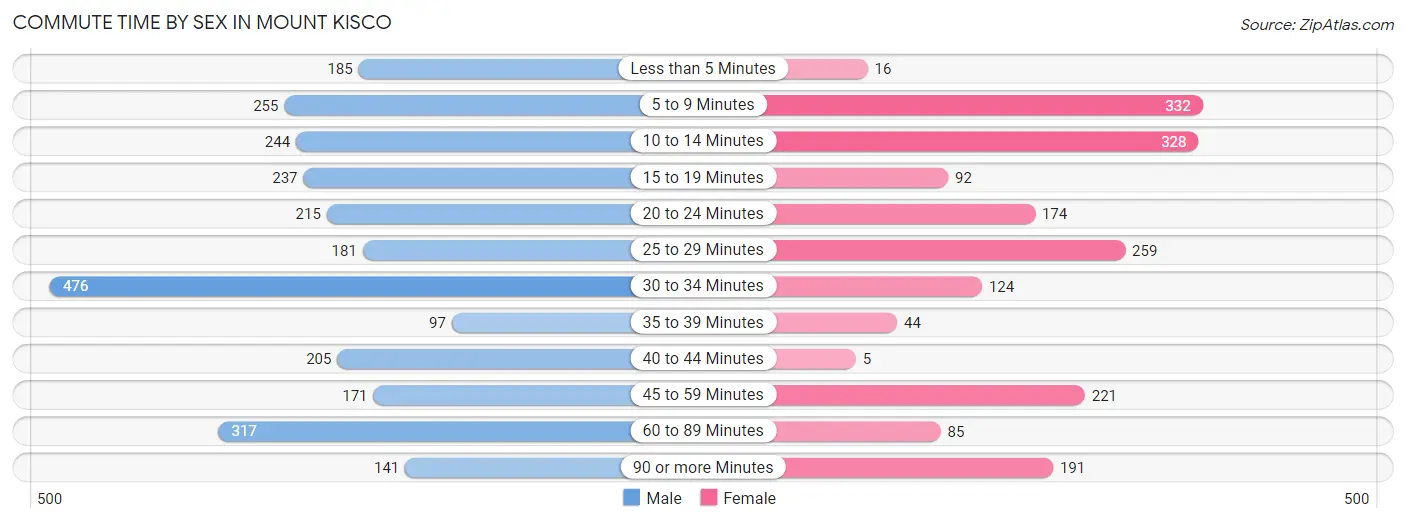
| Commute Time | Male | Female |
| Less than 5 Minutes | 185 (6.8%) | 16 (0.9%) |
| 5 to 9 Minutes | 255 (9.4%) | 332 (17.7%) |
| 10 to 14 Minutes | 244 (9.0%) | 328 (17.5%) |
| 15 to 19 Minutes | 237 (8.7%) | 92 (4.9%) |
| 20 to 24 Minutes | 215 (7.9%) | 174 (9.3%) |
| 25 to 29 Minutes | 181 (6.6%) | 259 (13.8%) |
| 30 to 34 Minutes | 476 (17.5%) | 124 (6.6%) |
| 35 to 39 Minutes | 97 (3.6%) | 44 (2.4%) |
| 40 to 44 Minutes | 205 (7.5%) | 5 (0.3%) |
| 45 to 59 Minutes | 171 (6.3%) | 221 (11.8%) |
| 60 to 89 Minutes | 317 (11.6%) | 85 (4.5%) |
| 90 or more Minutes | 141 (5.2%) | 191 (10.2%) |
Time of Departure to Work by Sex in Mount Kisco
The most frequent times of departure to work in Mount Kisco are 7:00 AM to 7:29 AM (541, 19.9%) for males and 7:00 AM to 7:29 AM (340, 18.2%) for females.
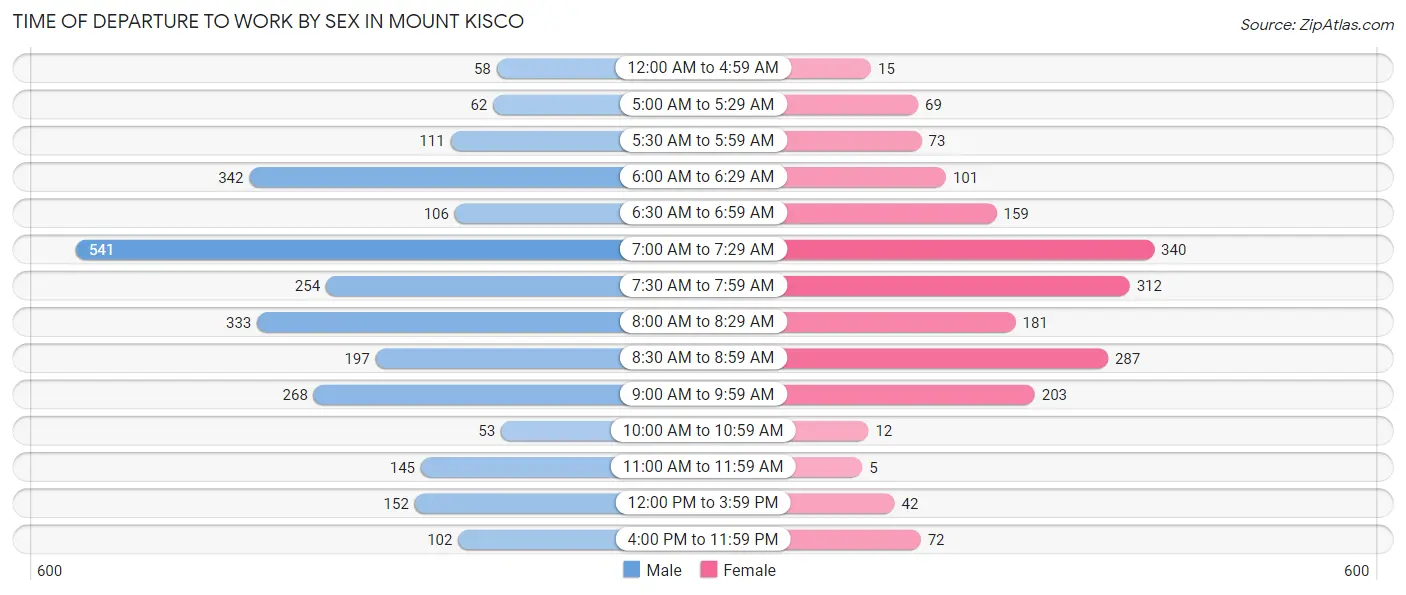
| Time of Departure | Male | Female |
| 12:00 AM to 4:59 AM | 58 (2.1%) | 15 (0.8%) |
| 5:00 AM to 5:29 AM | 62 (2.3%) | 69 (3.7%) |
| 5:30 AM to 5:59 AM | 111 (4.1%) | 73 (3.9%) |
| 6:00 AM to 6:29 AM | 342 (12.6%) | 101 (5.4%) |
| 6:30 AM to 6:59 AM | 106 (3.9%) | 159 (8.5%) |
| 7:00 AM to 7:29 AM | 541 (19.9%) | 340 (18.2%) |
| 7:30 AM to 7:59 AM | 254 (9.3%) | 312 (16.7%) |
| 8:00 AM to 8:29 AM | 333 (12.2%) | 181 (9.7%) |
| 8:30 AM to 8:59 AM | 197 (7.2%) | 287 (15.3%) |
| 9:00 AM to 9:59 AM | 268 (9.8%) | 203 (10.8%) |
| 10:00 AM to 10:59 AM | 53 (1.9%) | 12 (0.6%) |
| 11:00 AM to 11:59 AM | 145 (5.3%) | 5 (0.3%) |
| 12:00 PM to 3:59 PM | 152 (5.6%) | 42 (2.2%) |
| 4:00 PM to 11:59 PM | 102 (3.7%) | 72 (3.8%) |
| Total | 2,724 (100.0%) | 1,871 (100.0%) |
Housing Occupancy in Mount Kisco
Occupancy by Ownership in Mount Kisco
Of the total 4,202 dwellings in Mount Kisco, owner-occupied units account for 2,934 (69.8%), while renter-occupied units make up 1,268 (30.2%).
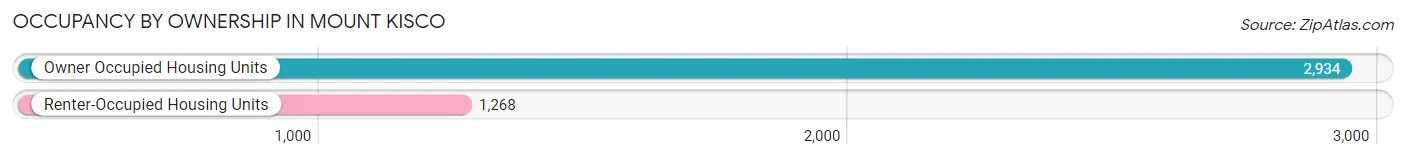
| Occupancy | # Housing Units | % Housing Units |
| Owner Occupied Housing Units | 2,934 | 69.8% |
| Renter-Occupied Housing Units | 1,268 | 30.2% |
| Total Occupied Housing Units | 4,202 | 100.0% |
Occupancy by Household Size in Mount Kisco
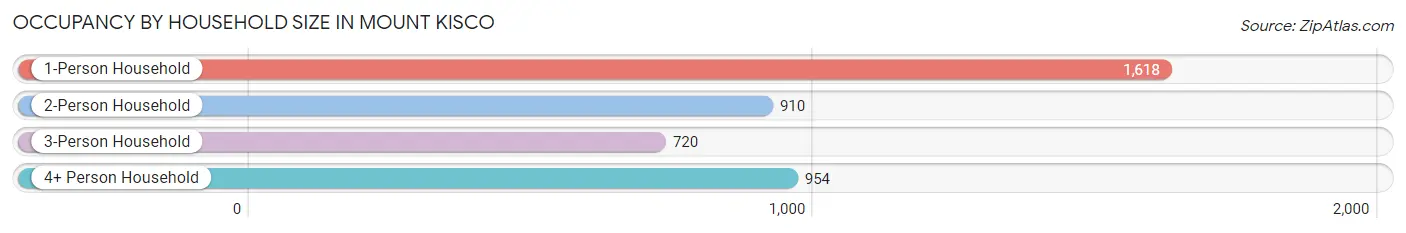
| Household Size | # Housing Units | % Housing Units |
| 1-Person Household | 1,618 | 38.5% |
| 2-Person Household | 910 | 21.7% |
| 3-Person Household | 720 | 17.1% |
| 4+ Person Household | 954 | 22.7% |
| Total Housing Units | 4,202 | 100.0% |
Occupancy by Ownership by Household Size in Mount Kisco
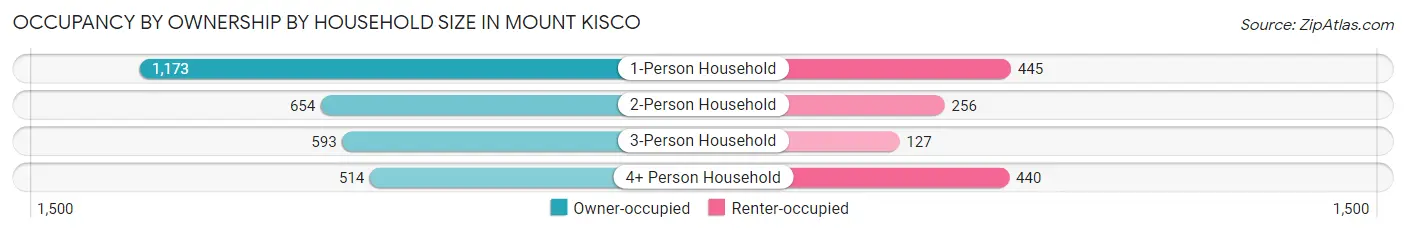
| Household Size | Owner-occupied | Renter-occupied |
| 1-Person Household | 1,173 (72.5%) | 445 (27.5%) |
| 2-Person Household | 654 (71.9%) | 256 (28.1%) |
| 3-Person Household | 593 (82.4%) | 127 (17.6%) |
| 4+ Person Household | 514 (53.9%) | 440 (46.1%) |
| Total Housing Units | 2,934 (69.8%) | 1,268 (30.2%) |
Occupancy by Educational Attainment in Mount Kisco
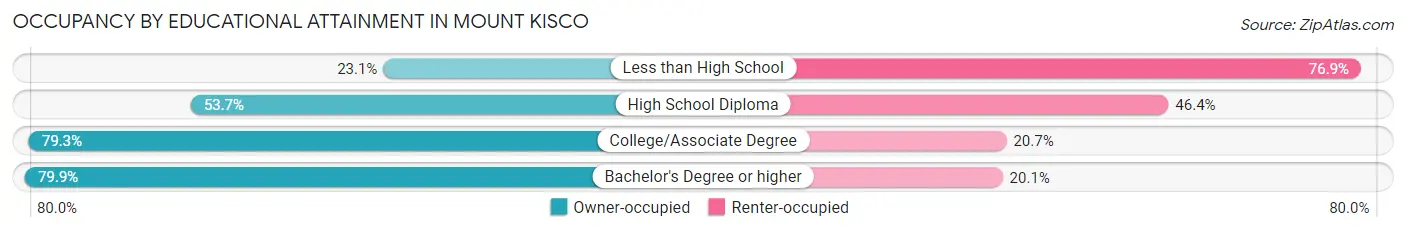
| Household Size | Owner-occupied | Renter-occupied |
| Less than High School | 92 (23.1%) | 306 (76.9%) |
| High School Diploma | 397 (53.6%) | 343 (46.4%) |
| College/Associate Degree | 572 (79.3%) | 149 (20.7%) |
| Bachelor's Degree or higher | 1,873 (79.9%) | 470 (20.1%) |
Occupancy by Age of Householder in Mount Kisco
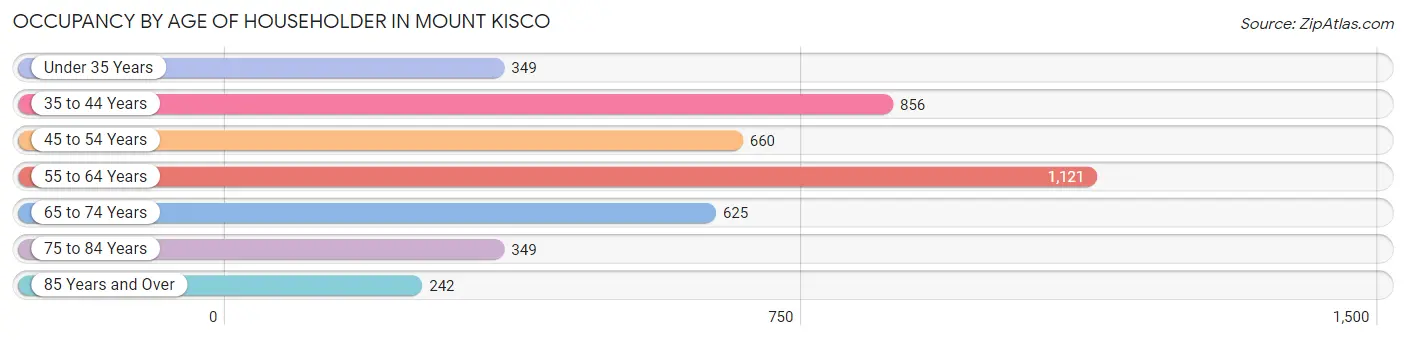
| Age Bracket | # Households | % Households |
| Under 35 Years | 349 | 8.3% |
| 35 to 44 Years | 856 | 20.4% |
| 45 to 54 Years | 660 | 15.7% |
| 55 to 64 Years | 1,121 | 26.7% |
| 65 to 74 Years | 625 | 14.9% |
| 75 to 84 Years | 349 | 8.3% |
| 85 Years and Over | 242 | 5.8% |
| Total | 4,202 | 100.0% |
Housing Finances in Mount Kisco
Median Income by Occupancy in Mount Kisco
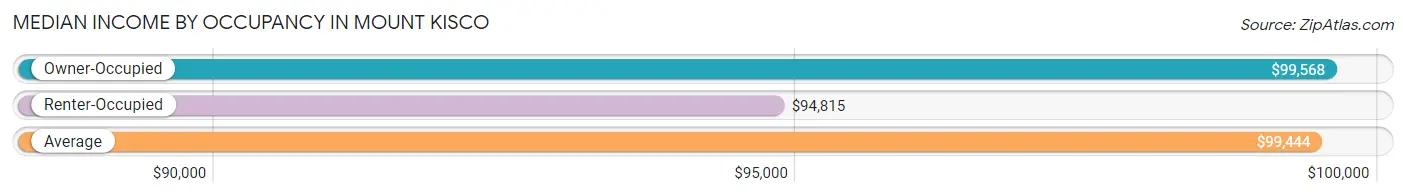
| Occupancy Type | # Households | Median Income |
| Owner-Occupied | 2,934 (69.8%) | $99,568 |
| Renter-Occupied | 1,268 (30.2%) | $94,815 |
| Average | 4,202 (100.0%) | $99,444 |
Occupancy by Householder Income Bracket in Mount Kisco
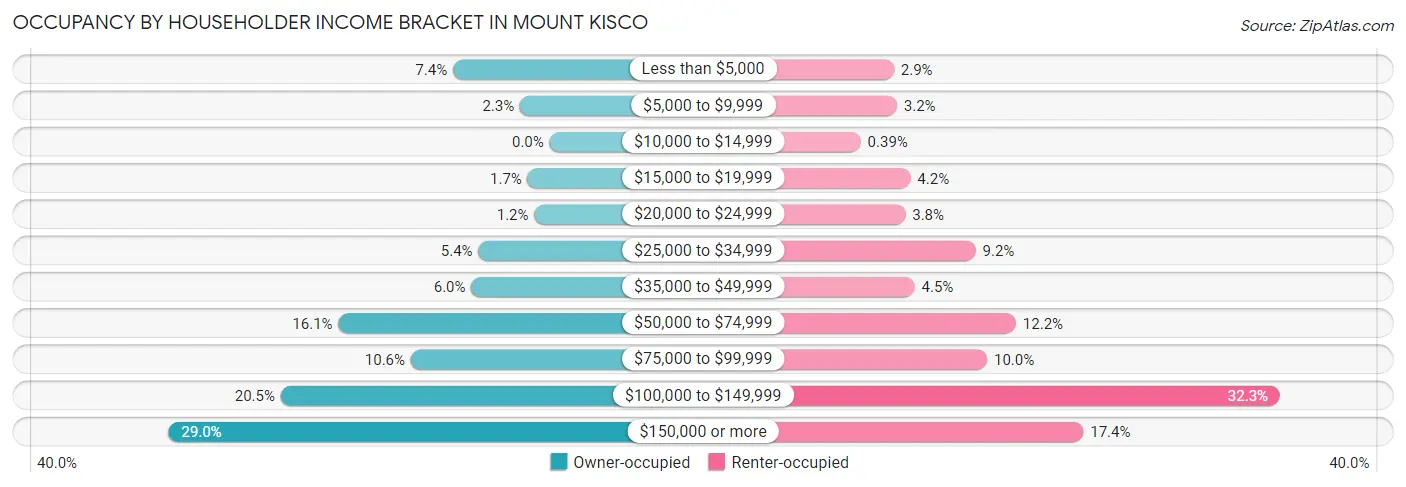
| Income Bracket | Owner-occupied | Renter-occupied |
| Less than $5,000 | 216 (7.4%) | 37 (2.9%) |
| $5,000 to $9,999 | 66 (2.2%) | 40 (3.2%) |
| $10,000 to $14,999 | 0 (0.0%) | 5 (0.4%) |
| $15,000 to $19,999 | 49 (1.7%) | 53 (4.2%) |
| $20,000 to $24,999 | 34 (1.2%) | 48 (3.8%) |
| $25,000 to $34,999 | 159 (5.4%) | 116 (9.1%) |
| $35,000 to $49,999 | 175 (6.0%) | 57 (4.5%) |
| $50,000 to $74,999 | 472 (16.1%) | 155 (12.2%) |
| $75,000 to $99,999 | 310 (10.6%) | 127 (10.0%) |
| $100,000 to $149,999 | 601 (20.5%) | 410 (32.3%) |
| $150,000 or more | 852 (29.0%) | 220 (17.3%) |
| Total | 2,934 (100.0%) | 1,268 (100.0%) |
Monthly Housing Cost Tiers in Mount Kisco
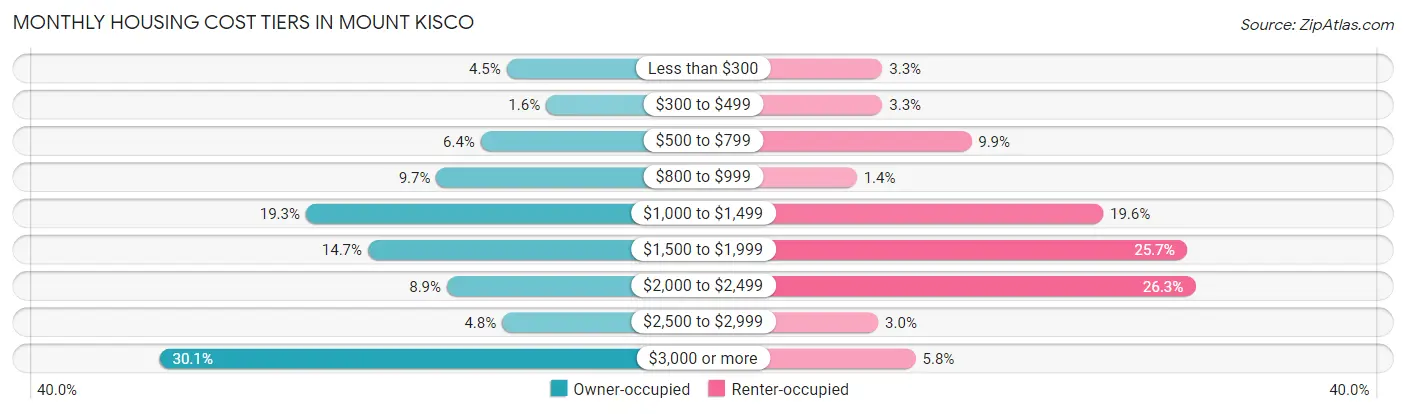
| Monthly Cost | Owner-occupied | Renter-occupied |
| Less than $300 | 132 (4.5%) | 42 (3.3%) |
| $300 to $499 | 47 (1.6%) | 42 (3.3%) |
| $500 to $799 | 188 (6.4%) | 125 (9.9%) |
| $800 to $999 | 284 (9.7%) | 18 (1.4%) |
| $1,000 to $1,499 | 566 (19.3%) | 248 (19.6%) |
| $1,500 to $1,999 | 432 (14.7%) | 326 (25.7%) |
| $2,000 to $2,499 | 261 (8.9%) | 334 (26.3%) |
| $2,500 to $2,999 | 142 (4.8%) | 38 (3.0%) |
| $3,000 or more | 882 (30.1%) | 73 (5.8%) |
| Total | 2,934 (100.0%) | 1,268 (100.0%) |
Physical Housing Characteristics in Mount Kisco
Housing Structures in Mount Kisco
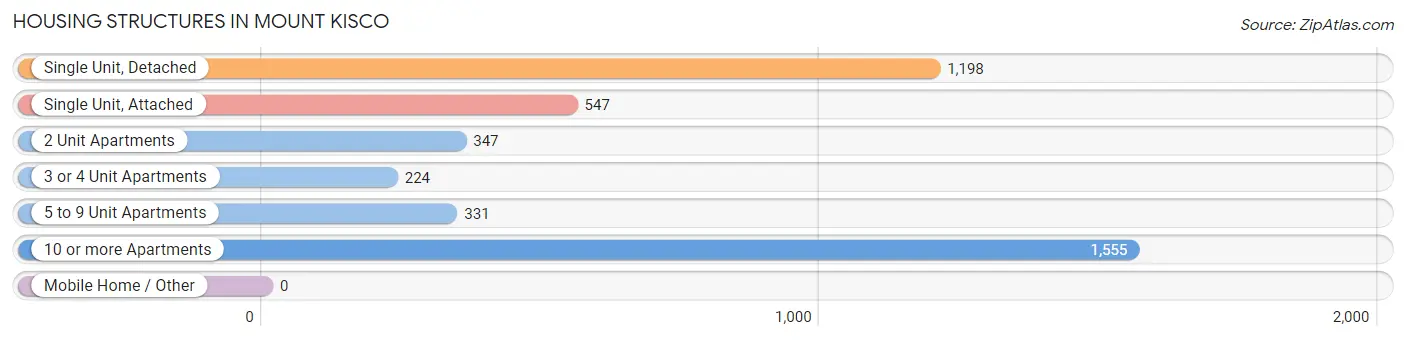
| Structure Type | # Housing Units | % Housing Units |
| Single Unit, Detached | 1,198 | 28.5% |
| Single Unit, Attached | 547 | 13.0% |
| 2 Unit Apartments | 347 | 8.3% |
| 3 or 4 Unit Apartments | 224 | 5.3% |
| 5 to 9 Unit Apartments | 331 | 7.9% |
| 10 or more Apartments | 1,555 | 37.0% |
| Mobile Home / Other | 0 | 0.0% |
| Total | 4,202 | 100.0% |
Housing Structures by Occupancy in Mount Kisco
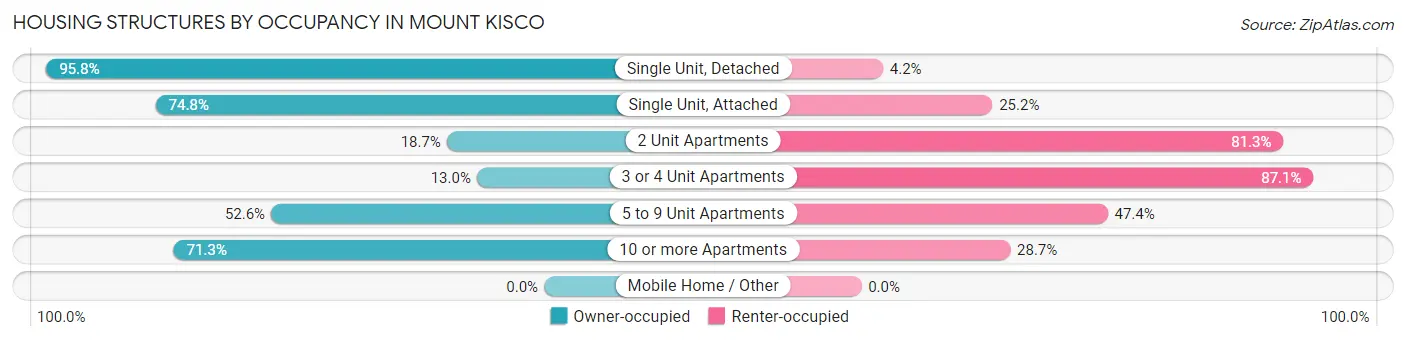
| Structure Type | Owner-occupied | Renter-occupied |
| Single Unit, Detached | 1,148 (95.8%) | 50 (4.2%) |
| Single Unit, Attached | 409 (74.8%) | 138 (25.2%) |
| 2 Unit Apartments | 65 (18.7%) | 282 (81.3%) |
| 3 or 4 Unit Apartments | 29 (13.0%) | 195 (87.1%) |
| 5 to 9 Unit Apartments | 174 (52.6%) | 157 (47.4%) |
| 10 or more Apartments | 1,109 (71.3%) | 446 (28.7%) |
| Mobile Home / Other | 0 (0.0%) | 0 (0.0%) |
| Total | 2,934 (69.8%) | 1,268 (30.2%) |
Housing Structures by Number of Rooms in Mount Kisco
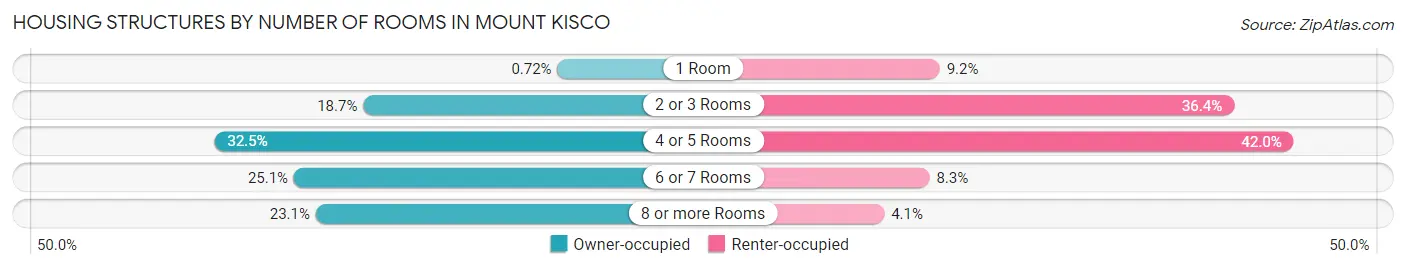
| Number of Rooms | Owner-occupied | Renter-occupied |
| 1 Room | 21 (0.7%) | 117 (9.2%) |
| 2 or 3 Rooms | 548 (18.7%) | 462 (36.4%) |
| 4 or 5 Rooms | 952 (32.5%) | 532 (42.0%) |
| 6 or 7 Rooms | 736 (25.1%) | 105 (8.3%) |
| 8 or more Rooms | 677 (23.1%) | 52 (4.1%) |
| Total | 2,934 (100.0%) | 1,268 (100.0%) |
Housing Structure by Heating Type in Mount Kisco
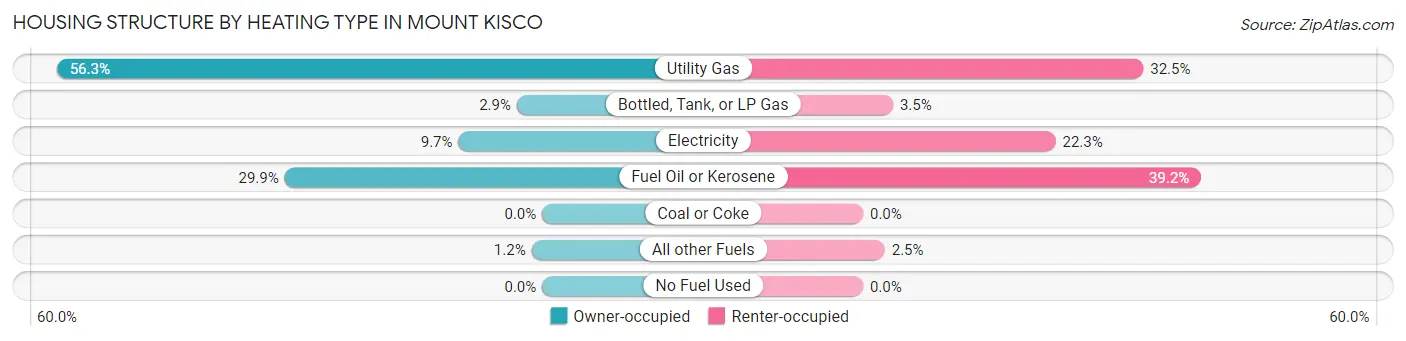
| Heating Type | Owner-occupied | Renter-occupied |
| Utility Gas | 1,651 (56.3%) | 412 (32.5%) |
| Bottled, Tank, or LP Gas | 86 (2.9%) | 44 (3.5%) |
| Electricity | 285 (9.7%) | 283 (22.3%) |
| Fuel Oil or Kerosene | 876 (29.9%) | 497 (39.2%) |
| Coal or Coke | 0 (0.0%) | 0 (0.0%) |
| All other Fuels | 36 (1.2%) | 32 (2.5%) |
| No Fuel Used | 0 (0.0%) | 0 (0.0%) |
| Total | 2,934 (100.0%) | 1,268 (100.0%) |
Household Vehicle Usage in Mount Kisco
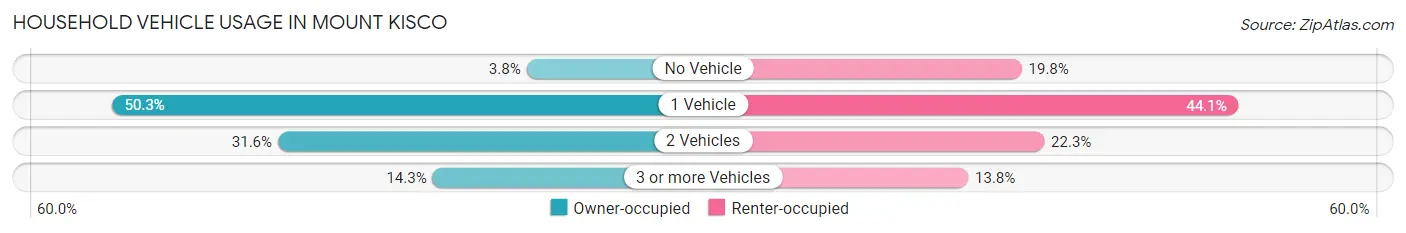
| Vehicles per Household | Owner-occupied | Renter-occupied |
| No Vehicle | 111 (3.8%) | 251 (19.8%) |
| 1 Vehicle | 1,475 (50.3%) | 559 (44.1%) |
| 2 Vehicles | 928 (31.6%) | 283 (22.3%) |
| 3 or more Vehicles | 420 (14.3%) | 175 (13.8%) |
| Total | 2,934 (100.0%) | 1,268 (100.0%) |
Real Estate & Mortgages in Mount Kisco
Real Estate and Mortgage Overview in Mount Kisco
| Characteristic | Without Mortgage | With Mortgage |
| Housing Units | 1,434 | 1,500 |
| Median Property Value | $512,100 | $500,800 |
| Median Household Income | $71,833 | $473 |
| Monthly Housing Costs | $1,343 | $769 |
| Real Estate Taxes | $9,371 | $83 |
Property Value by Mortgage Status in Mount Kisco
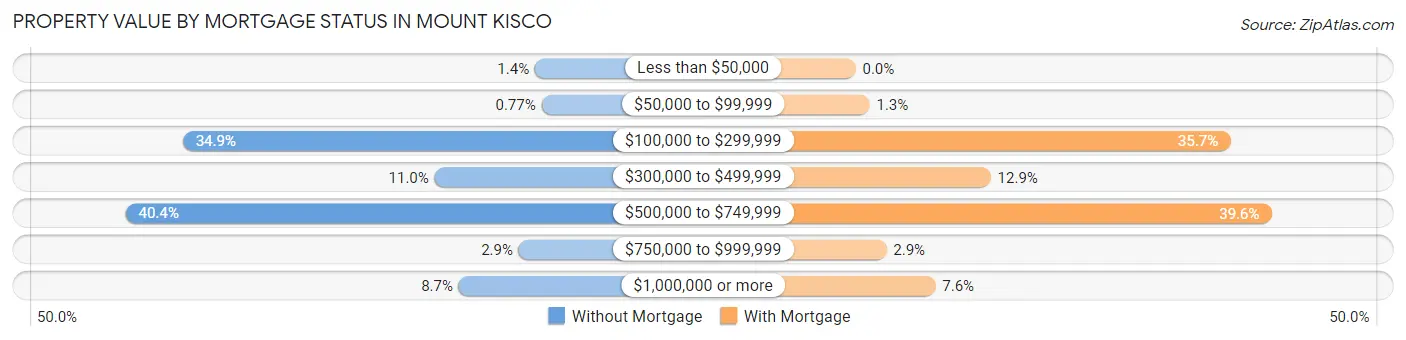
| Property Value | Without Mortgage | With Mortgage |
| Less than $50,000 | 20 (1.4%) | 0 (0.0%) |
| $50,000 to $99,999 | 11 (0.8%) | 20 (1.3%) |
| $100,000 to $299,999 | 501 (34.9%) | 535 (35.7%) |
| $300,000 to $499,999 | 157 (11.0%) | 193 (12.9%) |
| $500,000 to $749,999 | 579 (40.4%) | 594 (39.6%) |
| $750,000 to $999,999 | 42 (2.9%) | 44 (2.9%) |
| $1,000,000 or more | 124 (8.6%) | 114 (7.6%) |
| Total | 1,434 (100.0%) | 1,500 (100.0%) |
Household Income by Mortgage Status in Mount Kisco
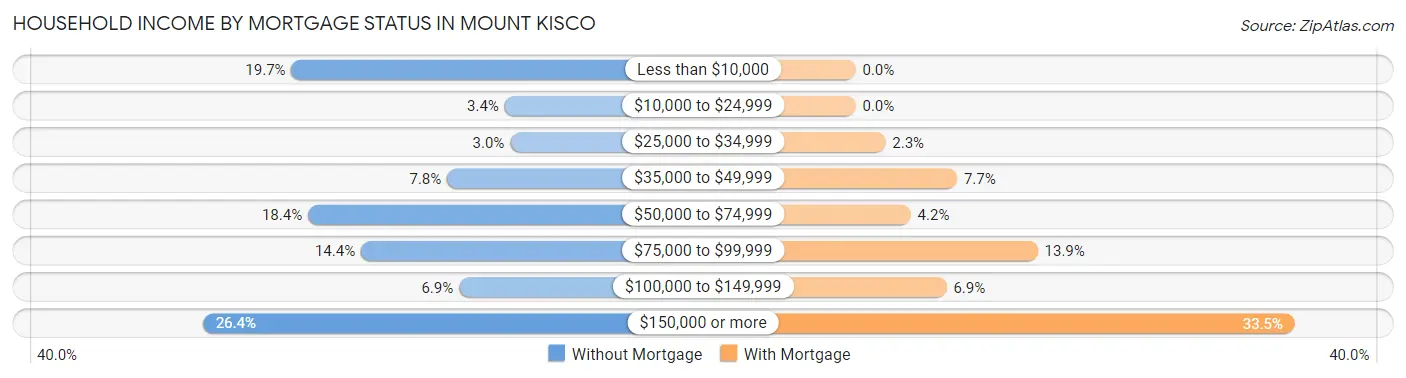
| Household Income | Without Mortgage | With Mortgage |
| Less than $10,000 | 282 (19.7%) | 0 (0.0%) |
| $10,000 to $24,999 | 49 (3.4%) | 0 (0.0%) |
| $25,000 to $34,999 | 43 (3.0%) | 34 (2.3%) |
| $35,000 to $49,999 | 112 (7.8%) | 116 (7.7%) |
| $50,000 to $74,999 | 264 (18.4%) | 63 (4.2%) |
| $75,000 to $99,999 | 206 (14.4%) | 208 (13.9%) |
| $100,000 to $149,999 | 99 (6.9%) | 104 (6.9%) |
| $150,000 or more | 379 (26.4%) | 502 (33.5%) |
| Total | 1,434 (100.0%) | 1,500 (100.0%) |
Property Value to Household Income Ratio in Mount Kisco
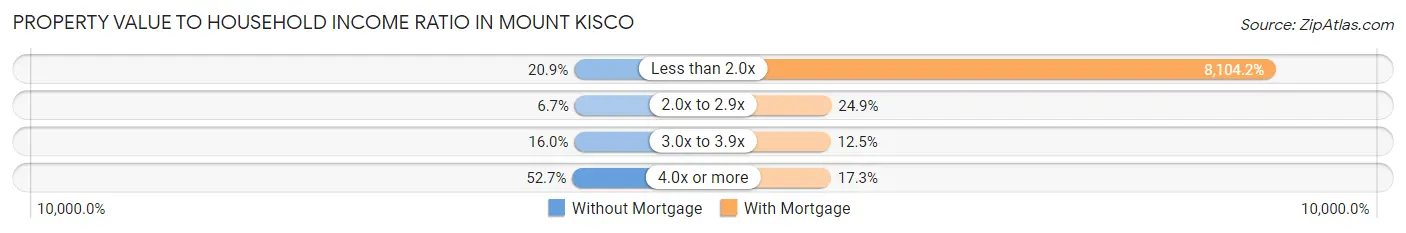
| Value-to-Income Ratio | Without Mortgage | With Mortgage |
| Less than 2.0x | 300 (20.9%) | 121,563 (8,104.2%) |
| 2.0x to 2.9x | 96 (6.7%) | 373 (24.9%) |
| 3.0x to 3.9x | 230 (16.0%) | 187 (12.5%) |
| 4.0x or more | 756 (52.7%) | 259 (17.3%) |
| Total | 1,434 (100.0%) | 1,500 (100.0%) |
Real Estate Taxes by Mortgage Status in Mount Kisco
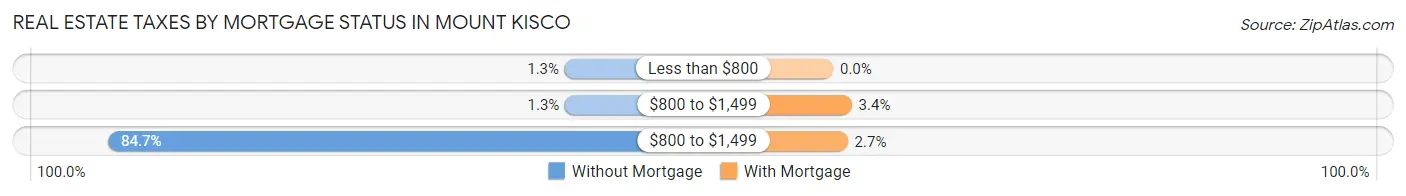
| Property Taxes | Without Mortgage | With Mortgage |
| Less than $800 | 19 (1.3%) | 0 (0.0%) |
| $800 to $1,499 | 18 (1.3%) | 51 (3.4%) |
| $800 to $1,499 | 1,215 (84.7%) | 40 (2.7%) |
| Total | 1,434 (100.0%) | 1,500 (100.0%) |
Health & Disability in Mount Kisco
Health Insurance Coverage by Age in Mount Kisco
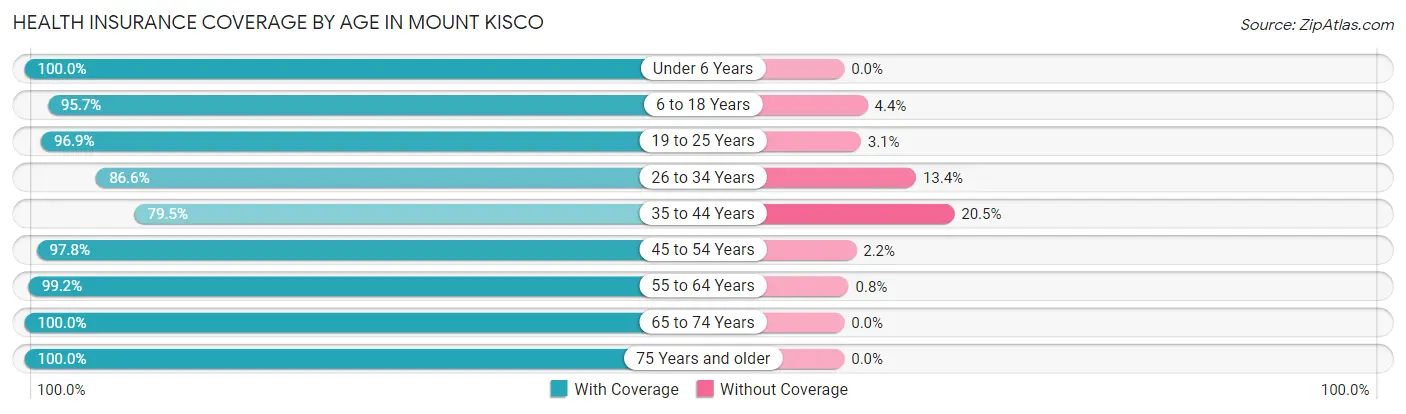
| Age Bracket | With Coverage | Without Coverage |
| Under 6 Years | 1,235 (100.0%) | 0 (0.0%) |
| 6 to 18 Years | 1,165 (95.7%) | 53 (4.3%) |
| 19 to 25 Years | 724 (96.9%) | 23 (3.1%) |
| 26 to 34 Years | 1,025 (86.6%) | 158 (13.4%) |
| 35 to 44 Years | 1,441 (79.5%) | 372 (20.5%) |
| 45 to 54 Years | 1,226 (97.8%) | 28 (2.2%) |
| 55 to 64 Years | 1,481 (99.2%) | 12 (0.8%) |
| 65 to 74 Years | 1,100 (100.0%) | 0 (0.0%) |
| 75 Years and older | 787 (100.0%) | 0 (0.0%) |
| Total | 10,184 (94.0%) | 646 (6.0%) |
Health Insurance Coverage by Citizenship Status in Mount Kisco
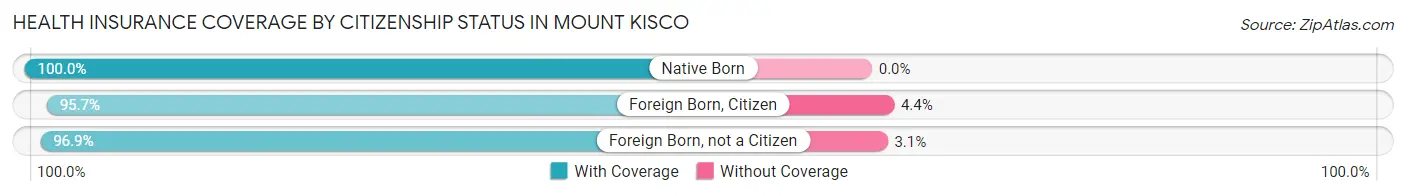
| Citizenship Status | With Coverage | Without Coverage |
| Native Born | 1,235 (100.0%) | 0 (0.0%) |
| Foreign Born, Citizen | 1,165 (95.7%) | 53 (4.3%) |
| Foreign Born, not a Citizen | 724 (96.9%) | 23 (3.1%) |
Health Insurance Coverage by Household Income in Mount Kisco
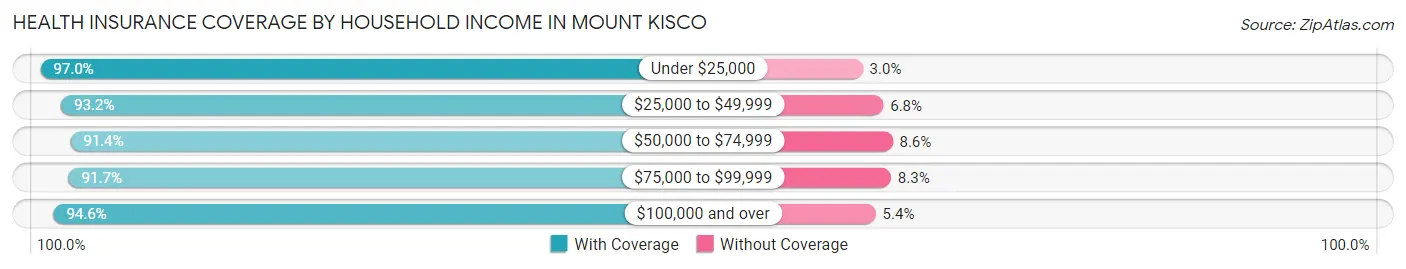
| Household Income | With Coverage | Without Coverage |
| Under $25,000 | 653 (97.0%) | 20 (3.0%) |
| $25,000 to $49,999 | 871 (93.2%) | 64 (6.8%) |
| $50,000 to $74,999 | 1,237 (91.4%) | 116 (8.6%) |
| $75,000 to $99,999 | 811 (91.7%) | 73 (8.3%) |
| $100,000 and over | 6,519 (94.6%) | 373 (5.4%) |
Public vs Private Health Insurance Coverage by Age in Mount Kisco
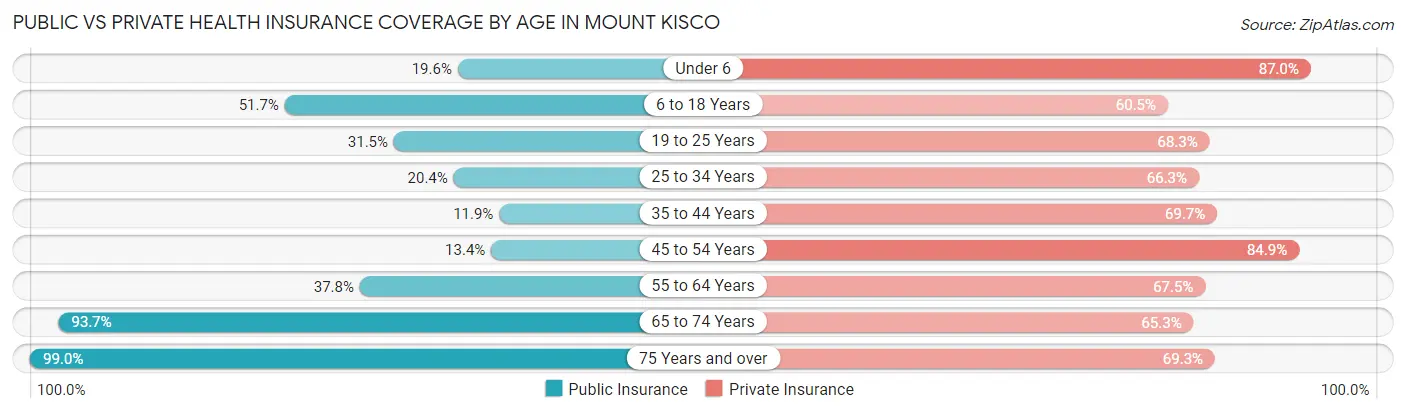
| Age Bracket | Public Insurance | Private Insurance |
| Under 6 | 242 (19.6%) | 1,075 (87.0%) |
| 6 to 18 Years | 630 (51.7%) | 737 (60.5%) |
| 19 to 25 Years | 235 (31.5%) | 510 (68.3%) |
| 25 to 34 Years | 241 (20.4%) | 784 (66.3%) |
| 35 to 44 Years | 216 (11.9%) | 1,263 (69.7%) |
| 45 to 54 Years | 168 (13.4%) | 1,064 (84.9%) |
| 55 to 64 Years | 564 (37.8%) | 1,007 (67.4%) |
| 65 to 74 Years | 1,031 (93.7%) | 718 (65.3%) |
| 75 Years and over | 779 (99.0%) | 545 (69.3%) |
| Total | 4,106 (37.9%) | 7,703 (71.1%) |
Disability Status by Sex by Age in Mount Kisco
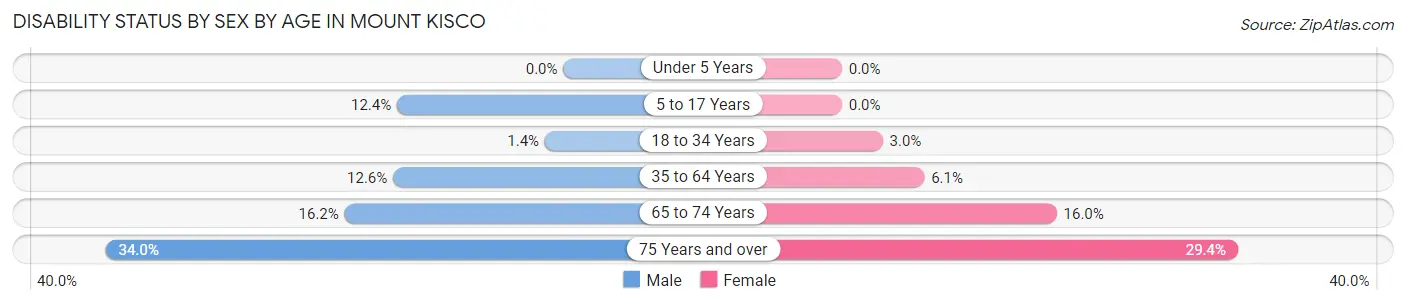
| Age Bracket | Male | Female |
| Under 5 Years | 0 (0.0%) | 0 (0.0%) |
| 5 to 17 Years | 81 (12.3%) | 0 (0.0%) |
| 18 to 34 Years | 16 (1.4%) | 23 (3.0%) |
| 35 to 64 Years | 308 (12.6%) | 130 (6.1%) |
| 65 to 74 Years | 88 (16.2%) | 89 (16.0%) |
| 75 Years and over | 86 (34.0%) | 157 (29.4%) |
Disability Class by Sex by Age in Mount Kisco
Disability Class: Hearing Difficulty
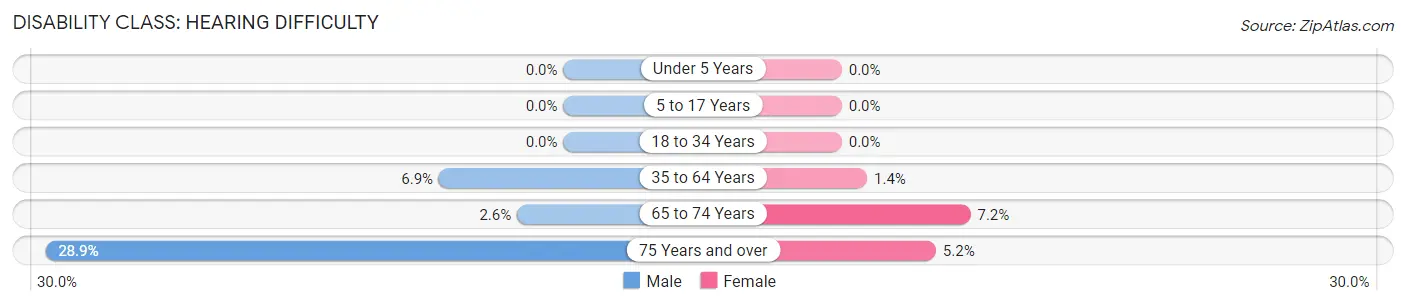
| Age Bracket | Male | Female |
| Under 5 Years | 0 (0.0%) | 0 (0.0%) |
| 5 to 17 Years | 0 (0.0%) | 0 (0.0%) |
| 18 to 34 Years | 0 (0.0%) | 0 (0.0%) |
| 35 to 64 Years | 169 (6.9%) | 30 (1.4%) |
| 65 to 74 Years | 14 (2.6%) | 40 (7.2%) |
| 75 Years and over | 73 (28.8%) | 28 (5.2%) |
Disability Class: Vision Difficulty
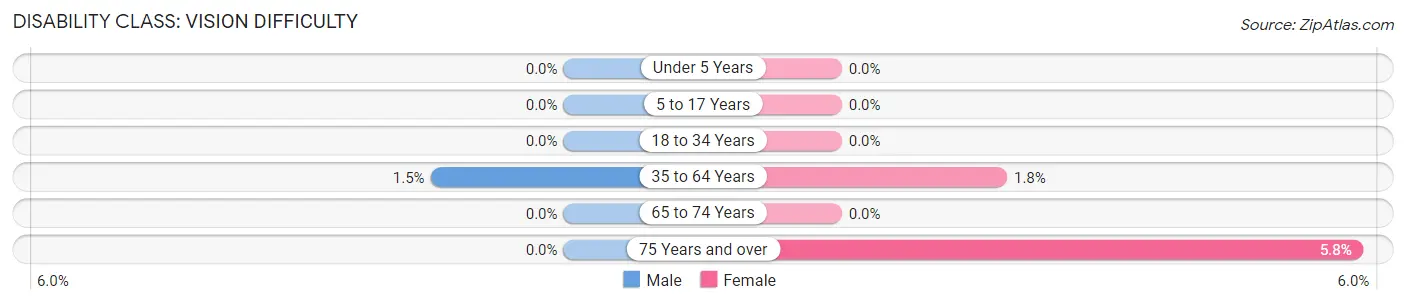
| Age Bracket | Male | Female |
| Under 5 Years | 0 (0.0%) | 0 (0.0%) |
| 5 to 17 Years | 0 (0.0%) | 0 (0.0%) |
| 18 to 34 Years | 0 (0.0%) | 0 (0.0%) |
| 35 to 64 Years | 36 (1.5%) | 39 (1.8%) |
| 65 to 74 Years | 0 (0.0%) | 0 (0.0%) |
| 75 Years and over | 0 (0.0%) | 31 (5.8%) |
Disability Class: Cognitive Difficulty
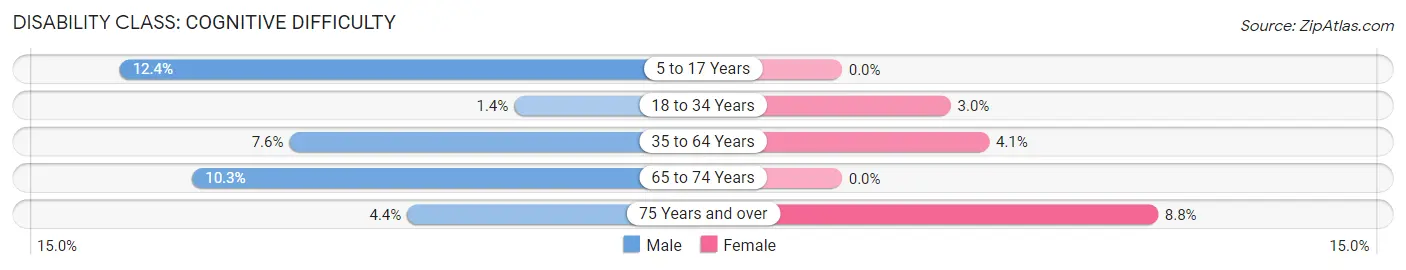
| Age Bracket | Male | Female |
| 5 to 17 Years | 81 (12.3%) | 0 (0.0%) |
| 18 to 34 Years | 16 (1.4%) | 23 (3.0%) |
| 35 to 64 Years | 186 (7.6%) | 87 (4.1%) |
| 65 to 74 Years | 56 (10.3%) | 0 (0.0%) |
| 75 Years and over | 11 (4.3%) | 47 (8.8%) |
Disability Class: Ambulatory Difficulty
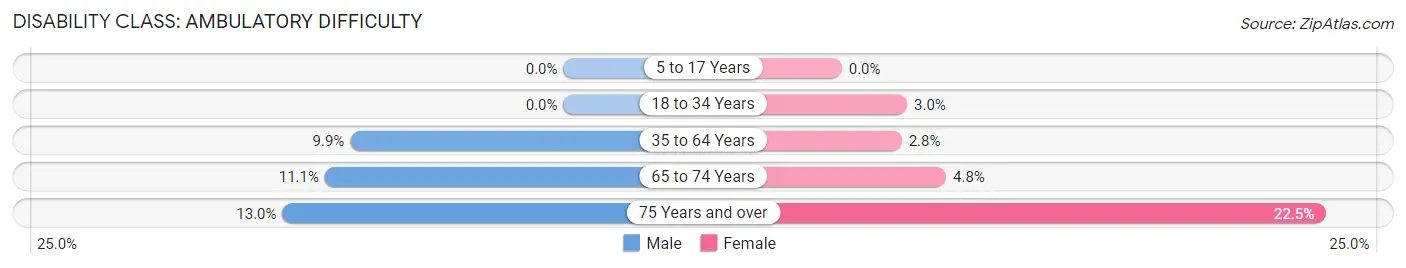
| Age Bracket | Male | Female |
| 5 to 17 Years | 0 (0.0%) | 0 (0.0%) |
| 18 to 34 Years | 0 (0.0%) | 23 (3.0%) |
| 35 to 64 Years | 241 (9.9%) | 59 (2.8%) |
| 65 to 74 Years | 60 (11.1%) | 27 (4.8%) |
| 75 Years and over | 33 (13.0%) | 120 (22.5%) |
Disability Class: Self-Care Difficulty
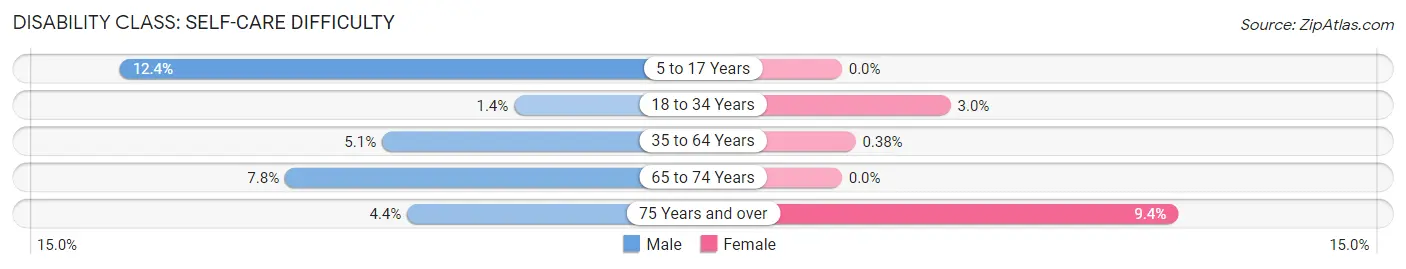
| Age Bracket | Male | Female |
| 5 to 17 Years | 81 (12.3%) | 0 (0.0%) |
| 18 to 34 Years | 16 (1.4%) | 23 (3.0%) |
| 35 to 64 Years | 123 (5.1%) | 8 (0.4%) |
| 65 to 74 Years | 42 (7.7%) | 0 (0.0%) |
| 75 Years and over | 11 (4.3%) | 50 (9.4%) |
Technology Access in Mount Kisco
Computing Device Access in Mount Kisco
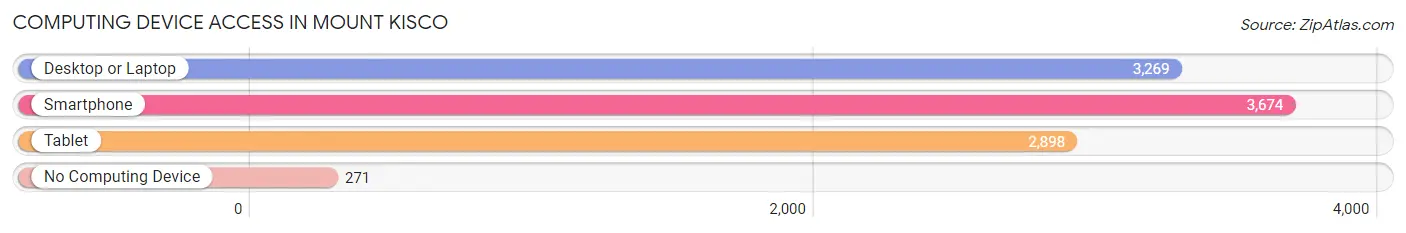
| Device Type | # Households | % Households |
| Desktop or Laptop | 3,269 | 77.8% |
| Smartphone | 3,674 | 87.4% |
| Tablet | 2,898 | 69.0% |
| No Computing Device | 271 | 6.5% |
| Total | 4,202 | 100.0% |
Internet Access in Mount Kisco
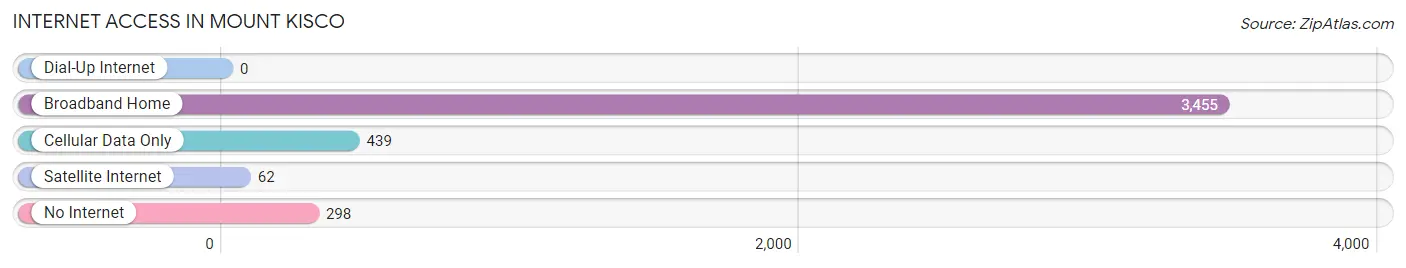
| Internet Type | # Households | % Households |
| Dial-Up Internet | 0 | 0.0% |
| Broadband Home | 3,455 | 82.2% |
| Cellular Data Only | 439 | 10.4% |
| Satellite Internet | 62 | 1.5% |
| No Internet | 298 | 7.1% |
| Total | 4,202 | 100.0% |
Mount Kisco Summary
Mount Kisco is a village located in Westchester County, New York, United States. It is situated in the northern part of the county, about 40 miles north of New York City. The village is part of the town of New Castle and is the county seat of Westchester County. The population of Mount Kisco was 10,877 at the 2010 census.
History
The area that is now Mount Kisco was originally inhabited by the Mohegan Indians. The first European settlers arrived in the area in the late 17th century. The village was originally known as "Smith's Corners" and was renamed "Mount Kisco" in 1875. The name is derived from the Native American word "Keskauke," which means "settlement on the hill."
The village was incorporated in 1885 and was the first village in Westchester County to be incorporated. In the late 19th century, Mount Kisco became a popular summer resort destination for wealthy New Yorkers. The village was also home to a number of large estates, including the estate of John Jacob Astor IV.
Geography
Mount Kisco is located in northern Westchester County, about 40 miles north of New York City. The village is situated on the Croton River, which flows through the village. The village is bordered by the towns of Bedford, New Castle, and Somers.
The village has a total area of 2.2 square miles, all of which is land. The village is located at an elevation of 590 feet above sea level.
Economy
The economy of Mount Kisco is largely based on the service industry. The village is home to a number of restaurants, retail stores, and professional services. The village is also home to a number of corporate headquarters, including PepsiCo, IBM, and Nestle.
The village is also home to a number of medical facilities, including Northern Westchester Hospital and the Mount Kisco Medical Group. The village is also home to a number of educational institutions, including the Mount Kisco Public Library and the Mount Kisco Day School.
Demographics
As of the 2010 census, the population of Mount Kisco was 10,877. The racial makeup of the village was 79.2% White, 8.3% African American, 0.2% Native American, 5.3% Asian, 0.1% Pacific Islander, 4.2% from other races, and 2.7% from two or more races. Hispanic or Latino of any race were 15.2% of the population.
The median income for a household in the village was $63,917, and the median income for a family was $76,917. The per capita income for the village was $35,917. About 5.2% of families and 8.2% of the population were below the poverty line, including 10.2% of those under age 18 and 5.2% of those age 65 or over.
Common Questions
What is Per Capita Income in Mount Kisco?
Per Capita income in Mount Kisco is $48,473.
What is the Median Family Income in Mount Kisco?
Median Family Income in Mount Kisco is $119,750.
What is the Median Household income in Mount Kisco?
Median Household Income in Mount Kisco is $99,444.
What is Income or Wage Gap in Mount Kisco?
Income or Wage Gap in Mount Kisco is 13.8%.
Women in Mount Kisco earn 86.2 cents for every dollar earned by a man.
What is Family Income Deficit in Mount Kisco?
Family Income Deficit in Mount Kisco is $17,584.
Families that are below poverty line in Mount Kisco earn $17,584 less on average than the poverty threshold level.
What is Inequality or Gini Index in Mount Kisco?
Inequality or Gini Index in Mount Kisco is 0.45.
What is the Total Population of Mount Kisco?
Total Population of Mount Kisco is 10,835.
What is the Total Male Population of Mount Kisco?
Total Male Population of Mount Kisco is 5,684.
What is the Total Female Population of Mount Kisco?
Total Female Population of Mount Kisco is 5,151.
What is the Ratio of Males per 100 Females in Mount Kisco?
There are 110.35 Males per 100 Females in Mount Kisco.
What is the Ratio of Females per 100 Males in Mount Kisco?
There are 90.62 Females per 100 Males in Mount Kisco.
What is the Median Population Age in Mount Kisco?
Median Population Age in Mount Kisco is 40.1 Years.
What is the Average Family Size in Mount Kisco
Average Family Size in Mount Kisco is 3.5 People.
What is the Average Household Size in Mount Kisco
Average Household Size in Mount Kisco is 2.6 People.
How Large is the Labor Force in Mount Kisco?
There are 5,745 People in the Labor Forcein in Mount Kisco.
What is the Percentage of People in the Labor Force in Mount Kisco?
67.3% of People are in the Labor Force in Mount Kisco.
What is the Unemployment Rate in Mount Kisco?
Unemployment Rate in Mount Kisco is 4.9%.