Freeport, NY Map & Demographics
Freeport Map

Freeport Overview
$43,202
PER CAPITA INCOME
$129,132
AVG FAMILY INCOME
$109,390
AVG HOUSEHOLD INCOME
9.6%
WAGE / INCOME GAP [ % ]
90.4¢/ $1
WAGE / INCOME GAP [ $ ]
$9,828
FAMILY INCOME DEFICIT
0.42
INEQUALITY / GINI INDEX
44,210
TOTAL POPULATION
21,816
MALE POPULATION
22,394
FEMALE POPULATION
97.42
MALES / 100 FEMALES
102.65
FEMALES / 100 MALES
39.3
MEDIAN AGE
3.8
AVG FAMILY SIZE
3.1
AVG HOUSEHOLD SIZE
24,718
LABOR FORCE [ PEOPLE ]
68.7%
PERCENT IN LABOR FORCE
6.0%
UNEMPLOYMENT RATE
Freeport Zip Codes
Freeport Area Codes
Income in Freeport
Income Overview in Freeport
Per Capita Income in Freeport is $43,202, while median incomes of families and households are $129,132 and $109,390 respectively.
| Characteristic | Number | Measure |
| Per Capita Income | 44,210 | $43,202 |
| Median Family Income | 9,760 | $129,132 |
| Mean Family Income | 9,760 | $150,393 |
| Median Household Income | 14,169 | $109,390 |
| Mean Household Income | 14,169 | $132,379 |
| Income Deficit | 9,760 | $9,828 |
| Wage / Income Gap (%) | 44,210 | 9.58% |
| Wage / Income Gap ($) | 44,210 | 90.42¢ per $1 |
| Gini / Inequality Index | 44,210 | 0.42 |
Earnings by Sex in Freeport
Average Earnings in Freeport are $44,580, $45,824 for men and $41,434 for women, a difference of 9.6%.

| Sex | Number | Average Earnings |
| Male | 12,765 (50.9%) | $45,824 |
| Female | 12,314 (49.1%) | $41,434 |
| Total | 25,079 (100.0%) | $44,580 |
Earnings by Sex by Income Bracket in Freeport
The most common earnings brackets in Freeport are $100,000+ for men (2,535 | 19.9%) and $100,000+ for women (2,181 | 17.7%).

| Income | Male | Female |
| $2,499 or less | 251 (2.0%) | 200 (1.6%) |
| $2,500 to $4,999 | 202 (1.6%) | 113 (0.9%) |
| $5,000 to $7,499 | 208 (1.6%) | 394 (3.2%) |
| $7,500 to $9,999 | 120 (0.9%) | 327 (2.7%) |
| $10,000 to $12,499 | 383 (3.0%) | 279 (2.3%) |
| $12,500 to $14,999 | 139 (1.1%) | 611 (5.0%) |
| $15,000 to $17,499 | 533 (4.2%) | 632 (5.1%) |
| $17,500 to $19,999 | 220 (1.7%) | 446 (3.6%) |
| $20,000 to $22,499 | 336 (2.6%) | 367 (3.0%) |
| $22,500 to $24,999 | 654 (5.1%) | 359 (2.9%) |
| $25,000 to $29,999 | 1,103 (8.6%) | 481 (3.9%) |
| $30,000 to $34,999 | 808 (6.3%) | 961 (7.8%) |
| $35,000 to $39,999 | 479 (3.7%) | 827 (6.7%) |
| $40,000 to $44,999 | 818 (6.4%) | 370 (3.0%) |
| $45,000 to $49,999 | 603 (4.7%) | 753 (6.1%) |
| $50,000 to $54,999 | 330 (2.6%) | 343 (2.8%) |
| $55,000 to $64,999 | 1,149 (9.0%) | 946 (7.7%) |
| $65,000 to $74,999 | 504 (4.0%) | 428 (3.5%) |
| $75,000 to $99,999 | 1,390 (10.9%) | 1,296 (10.5%) |
| $100,000+ | 2,535 (19.9%) | 2,181 (17.7%) |
| Total | 12,765 (100.0%) | 12,314 (100.0%) |
Earnings by Sex by Educational Attainment in Freeport
Average earnings in Freeport are $52,005 for men and $47,012 for women, a difference of 9.6%. Men with an educational attainment of graduate degree enjoy the highest average annual earnings of $101,962, while those with high school diploma education earn the least with $36,697. Women with an educational attainment of graduate degree earn the most with the average annual earnings of $91,883, while those with less than high school education have the smallest earnings of $20,868.

| Educational Attainment | Male Income | Female Income |
| Less than High School | $40,000 | $20,868 |
| High School Diploma | $36,697 | $36,568 |
| College or Associate's Degree | $56,724 | $39,583 |
| Bachelor's Degree | $84,263 | $86,369 |
| Graduate Degree | $101,962 | $91,883 |
| Total | $52,005 | $47,012 |
Family Income in Freeport
Family Income Brackets in Freeport
According to the Freeport family income data, there are 2,411 families falling into the $100,000 to $149,999 income range, which is the most common income bracket and makes up 24.7% of all families. Conversely, the $10,000 to $14,999 income bracket is the least frequent group with only 29 families (0.3%) belonging to this category.

| Income Bracket | # Families | % Families |
| Less than $10,000 | 185 | 1.9% |
| $10,000 to $14,999 | 29 | 0.3% |
| $15,000 to $24,999 | 254 | 2.6% |
| $25,000 to $34,999 | 293 | 3.0% |
| $35,000 to $49,999 | 556 | 5.7% |
| $50,000 to $74,999 | 1,347 | 13.8% |
| $75,000 to $99,999 | 917 | 9.4% |
| $100,000 to $149,999 | 2,411 | 24.7% |
| $150,000 to $199,999 | 1,649 | 16.9% |
| $200,000+ | 2,118 | 21.7% |
Family Income by Famaliy Size in Freeport
7+ person families (792 | 8.1%) account for the highest median family income in Freeport with $224,595 per family, while 2-person families (2,975 | 30.5%) have the highest median income of $47,716 per family member.

| Income Bracket | # Families | Median Income |
| 2-Person Families | 2,975 (30.5%) | $95,431 |
| 3-Person Families | 2,149 (22.0%) | $120,469 |
| 4-Person Families | 2,042 (20.9%) | $146,940 |
| 5-Person Families | 944 (9.7%) | $146,532 |
| 6-Person Families | 858 (8.8%) | $131,185 |
| 7+ Person Families | 792 (8.1%) | $224,595 |
| Total | 9,760 (100.0%) | $129,132 |
Family Income by Number of Earners in Freeport
The median family income in Freeport is $129,132, with families comprising 3+ earners (2,631) having the highest median family income of $155,175, while families with no earners (846) have the lowest median family income of $53,906, accounting for 27.0% and 8.7% of families, respectively.
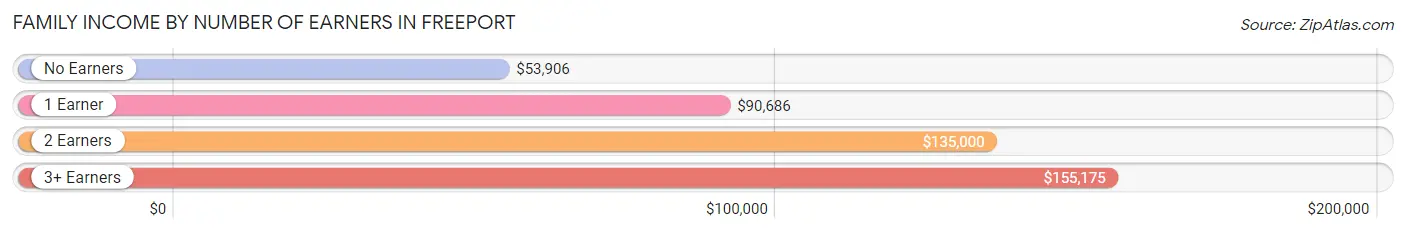
| Number of Earners | # Families | Median Income |
| No Earners | 846 (8.7%) | $53,906 |
| 1 Earner | 2,553 (26.2%) | $90,686 |
| 2 Earners | 3,730 (38.2%) | $135,000 |
| 3+ Earners | 2,631 (27.0%) | $155,175 |
| Total | 9,760 (100.0%) | $129,132 |
Household Income in Freeport
Household Income Brackets in Freeport
With 3,301 households falling in the category, the $100,000 to $149,999 income range is the most frequent in Freeport, accounting for 23.3% of all households. In contrast, only 269 households (1.9%) fall into the $10,000 to $14,999 income bracket, making it the least populous group.

| Income Bracket | # Households | % Households |
| Less than $10,000 | 368 | 2.6% |
| $10,000 to $14,999 | 269 | 1.9% |
| $15,000 to $24,999 | 850 | 6.0% |
| $25,000 to $34,999 | 567 | 4.0% |
| $35,000 to $49,999 | 1,119 | 7.9% |
| $50,000 to $74,999 | 1,856 | 13.1% |
| $75,000 to $99,999 | 1,445 | 10.2% |
| $100,000 to $149,999 | 3,301 | 23.3% |
| $150,000 to $199,999 | 1,714 | 12.1% |
| $200,000+ | 2,678 | 18.9% |
Household Income by Householder Age in Freeport
The median household income in Freeport is $109,390, with the highest median household income of $127,239 found in the 25 to 44 years age bracket for the primary householder. A total of 4,160 households (29.4%) fall into this category. Meanwhile, the 15 to 24 years age bracket for the primary householder has the lowest median household income of $51,313, with 135 households (0.9%) in this group.

| Income Bracket | # Households | Median Income |
| 15 to 24 Years | 135 (0.9%) | $51,313 |
| 25 to 44 Years | 4,160 (29.4%) | $127,239 |
| 45 to 64 Years | 5,705 (40.3%) | $119,549 |
| 65+ Years | 4,169 (29.4%) | $77,332 |
| Total | 14,169 (100.0%) | $109,390 |
Poverty in Freeport
Income Below Poverty by Sex and Age in Freeport
With 6.7% poverty level for males and 7.1% for females among the residents of Freeport, 15 year old males and 75 year old and over females are the most vulnerable to poverty, with 42 males (24.7%) and 192 females (14.1%) in their respective age groups living below the poverty level.

| Age Bracket | Male | Female |
| Under 5 Years | 122 (13.5%) | 80 (5.5%) |
| 5 Years | 45 (14.7%) | 0 (0.0%) |
| 6 to 11 Years | 94 (5.2%) | 59 (4.4%) |
| 12 to 14 Years | 85 (8.7%) | 34 (4.2%) |
| 15 Years | 42 (24.7%) | 0 (0.0%) |
| 16 and 17 Years | 35 (8.7%) | 31 (5.9%) |
| 18 to 24 Years | 189 (10.4%) | 209 (9.8%) |
| 25 to 34 Years | 144 (4.1%) | 143 (5.0%) |
| 35 to 44 Years | 93 (2.9%) | 197 (6.6%) |
| 45 to 54 Years | 139 (4.5%) | 251 (7.7%) |
| 55 to 64 Years | 227 (8.4%) | 156 (6.0%) |
| 65 to 74 Years | 136 (7.9%) | 226 (9.3%) |
| 75 Years and over | 99 (9.1%) | 192 (14.1%) |
| Total | 1,450 (6.7%) | 1,578 (7.1%) |
Income Above Poverty by Sex and Age in Freeport
According to the poverty statistics in Freeport, males aged 35 to 44 years and females aged 5 years are the age groups that are most secure financially, with 97.1% of males and 100.0% of females in these age groups living above the poverty line.

| Age Bracket | Male | Female |
| Under 5 Years | 782 (86.5%) | 1,370 (94.5%) |
| 5 Years | 262 (85.3%) | 100 (100.0%) |
| 6 to 11 Years | 1,707 (94.8%) | 1,294 (95.6%) |
| 12 to 14 Years | 891 (91.3%) | 775 (95.8%) |
| 15 Years | 128 (75.3%) | 318 (100.0%) |
| 16 and 17 Years | 367 (91.3%) | 493 (94.1%) |
| 18 to 24 Years | 1,620 (89.5%) | 1,929 (90.2%) |
| 25 to 34 Years | 3,335 (95.9%) | 2,703 (95.0%) |
| 35 to 44 Years | 3,147 (97.1%) | 2,811 (93.4%) |
| 45 to 54 Years | 2,914 (95.5%) | 3,023 (92.3%) |
| 55 to 64 Years | 2,466 (91.6%) | 2,459 (94.0%) |
| 65 to 74 Years | 1,592 (92.1%) | 2,193 (90.7%) |
| 75 Years and over | 988 (90.9%) | 1,165 (85.9%) |
| Total | 20,199 (93.3%) | 20,633 (92.9%) |
Income Below Poverty Among Married-Couple Families in Freeport
The poverty statistics for married-couple families in Freeport show that 2.1% or 125 of the total 6,006 families live below the poverty line. Families with 5 or more children have the highest poverty rate of 22.5%, comprising of 9 families. On the other hand, families with 3 or 4 children have the lowest poverty rate of 0.0%, which includes 0 families.

| Children | Above Poverty | Below Poverty |
| No Children | 2,985 (96.9%) | 96 (3.1%) |
| 1 or 2 Children | 2,438 (99.2%) | 20 (0.8%) |
| 3 or 4 Children | 427 (100.0%) | 0 (0.0%) |
| 5 or more Children | 31 (77.5%) | 9 (22.5%) |
| Total | 5,881 (97.9%) | 125 (2.1%) |
Income Below Poverty Among Single-Parent Households in Freeport
According to the poverty data in Freeport, 7.0% or 91 single-father households and 12.0% or 293 single-mother households are living below the poverty line. Among single-father households, those with no children have the highest poverty rate, with 71 households (10.6%) experiencing poverty. Likewise, among single-mother households, those with 5 or more children have the highest poverty rate, with 18 households (23.1%) falling below the poverty line.

| Children | Single Father | Single Mother |
| No Children | 71 (10.6%) | 100 (10.4%) |
| 1 or 2 Children | 0 (0.0%) | 131 (12.9%) |
| 3 or 4 Children | 20 (9.4%) | 44 (11.2%) |
| 5 or more Children | 0 (0.0%) | 18 (23.1%) |
| Total | 91 (7.0%) | 293 (12.0%) |
Income Below Poverty Among Married-Couple vs Single-Parent Households in Freeport
The poverty data for Freeport shows that 125 of the married-couple family households (2.1%) and 384 of the single-parent households (10.2%) are living below the poverty level. Within the married-couple family households, those with 5 or more children have the highest poverty rate, with 9 households (22.5%) falling below the poverty line. Among the single-parent households, those with 5 or more children have the highest poverty rate, with 18 household (23.1%) living below poverty.

| Children | Married-Couple Families | Single-Parent Households |
| No Children | 96 (3.1%) | 171 (10.5%) |
| 1 or 2 Children | 20 (0.8%) | 131 (9.1%) |
| 3 or 4 Children | 0 (0.0%) | 64 (10.6%) |
| 5 or more Children | 9 (22.5%) | 18 (23.1%) |
| Total | 125 (2.1%) | 384 (10.2%) |
Race in Freeport
The most populous races in Freeport are Hispanic or Latino (19,240 | 43.5%), White / Caucasian (14,149 | 32.0%), and Black / African American (13,937 | 31.5%).

| Race | # Population | % Population |
| Asian | 893 | 2.0% |
| Black / African American | 13,937 | 31.5% |
| Hawaiian / Pacific | 5 | 0.0% |
| Hispanic or Latino | 19,240 | 43.5% |
| Native / Alaskan | 29 | 0.1% |
| White / Caucasian | 14,149 | 32.0% |
| Two or more Races | 6,131 | 13.9% |
| Some other Race | 9,066 | 20.5% |
| Total | 44,210 | 100.0% |
Ancestry in Freeport
The most populous ancestries reported in Freeport are Central American (7,166 | 16.2%), Dominican (6,940 | 15.7%), Salvadoran (5,393 | 12.2%), Italian (2,132 | 4.8%), and South American (1,843 | 4.2%), together accounting for 53.1% of all Freeport residents.

| Ancestry | # Population | % Population |
| African | 257 | 0.6% |
| American | 727 | 1.6% |
| Arab | 11 | 0.0% |
| Argentinean | 45 | 0.1% |
| Austrian | 8 | 0.0% |
| Barbadian | 137 | 0.3% |
| Belizean | 42 | 0.1% |
| Bermudan | 8 | 0.0% |
| Bhutanese | 4 | 0.0% |
| Bolivian | 6 | 0.0% |
| Brazilian | 11 | 0.0% |
| British | 43 | 0.1% |
| British West Indian | 137 | 0.3% |
| Burmese | 183 | 0.4% |
| Central American | 7,166 | 16.2% |
| Central American Indian | 374 | 0.9% |
| Colombian | 880 | 2.0% |
| Costa Rican | 134 | 0.3% |
| Croatian | 19 | 0.0% |
| Cuban | 378 | 0.9% |
| Czech | 11 | 0.0% |
| Czechoslovakian | 20 | 0.1% |
| Danish | 35 | 0.1% |
| Dominican | 6,940 | 15.7% |
| Dutch | 32 | 0.1% |
| Dutch West Indian | 45 | 0.1% |
| Eastern European | 66 | 0.2% |
| Ecuadorian | 731 | 1.7% |
| Egyptian | 11 | 0.0% |
| English | 379 | 0.9% |
| Estonian | 16 | 0.0% |
| European | 82 | 0.2% |
| Finnish | 41 | 0.1% |
| French | 231 | 0.5% |
| French Canadian | 51 | 0.1% |
| German | 1,130 | 2.6% |
| Ghanaian | 15 | 0.0% |
| Greek | 235 | 0.5% |
| Guatemalan | 1,142 | 2.6% |
| Guyanese | 325 | 0.7% |
| Haitian | 1,777 | 4.0% |
| Honduran | 158 | 0.4% |
| Hungarian | 38 | 0.1% |
| Icelander | 17 | 0.0% |
| Indian (Asian) | 145 | 0.3% |
| Iranian | 9 | 0.0% |
| Irish | 1,563 | 3.5% |
| Italian | 2,132 | 4.8% |
| Jamaican | 1,607 | 3.6% |
| Korean | 204 | 0.5% |
| Latvian | 17 | 0.0% |
| Lithuanian | 9 | 0.0% |
| Mexican | 382 | 0.9% |
| Native Hawaiian | 5 | 0.0% |
| Nicaraguan | 19 | 0.0% |
| Nigerian | 367 | 0.8% |
| Norwegian | 95 | 0.2% |
| Panamanian | 320 | 0.7% |
| Peruvian | 156 | 0.4% |
| Polish | 464 | 1.1% |
| Portuguese | 202 | 0.5% |
| Puerto Rican | 1,526 | 3.5% |
| Romanian | 56 | 0.1% |
| Russian | 461 | 1.0% |
| Salvadoran | 5,393 | 12.2% |
| Scandinavian | 12 | 0.0% |
| Scotch-Irish | 78 | 0.2% |
| Scottish | 260 | 0.6% |
| Serbian | 19 | 0.0% |
| Slavic | 20 | 0.1% |
| Slovak | 29 | 0.1% |
| Slovene | 30 | 0.1% |
| South American | 1,843 | 4.2% |
| South American Indian | 68 | 0.2% |
| Spaniard | 31 | 0.1% |
| Spanish | 4 | 0.0% |
| Subsaharan African | 616 | 1.4% |
| Swedish | 79 | 0.2% |
| Thai | 673 | 1.5% |
| Trinidadian and Tobagonian | 524 | 1.2% |
| Ugandan | 2 | 0.0% |
| Ukrainian | 30 | 0.1% |
| Uruguayan | 11 | 0.0% |
| Venezuelan | 14 | 0.0% |
| Vietnamese | 3 | 0.0% |
| Welsh | 7 | 0.0% |
| West Indian | 484 | 1.1% |
| Zimbabwean | 10 | 0.0% | View All 88 Rows |
Immigrants in Freeport
The most numerous immigrant groups reported in Freeport came from Latin America (13,937 | 31.5%), Caribbean (6,904 | 15.6%), Central America (5,337 | 12.1%), Dominican Republic (3,946 | 8.9%), and El Salvador (3,737 | 8.5%), together accounting for 76.6% of all Freeport residents.

| Immigration Origin | # Population | % Population |
| Africa | 329 | 0.7% |
| Argentina | 28 | 0.1% |
| Asia | 579 | 1.3% |
| Australia | 2 | 0.0% |
| Bangladesh | 8 | 0.0% |
| Barbados | 185 | 0.4% |
| Belize | 10 | 0.0% |
| Bolivia | 6 | 0.0% |
| Brazil | 11 | 0.0% |
| Canada | 40 | 0.1% |
| Caribbean | 6,904 | 15.6% |
| Central America | 5,337 | 12.1% |
| China | 112 | 0.3% |
| Colombia | 528 | 1.2% |
| Costa Rica | 147 | 0.3% |
| Cuba | 267 | 0.6% |
| Czechoslovakia | 29 | 0.1% |
| Dominica | 245 | 0.5% |
| Dominican Republic | 3,946 | 8.9% |
| Eastern Africa | 27 | 0.1% |
| Eastern Asia | 241 | 0.5% |
| Eastern Europe | 61 | 0.1% |
| Ecuador | 614 | 1.4% |
| Egypt | 11 | 0.0% |
| El Salvador | 3,737 | 8.5% |
| England | 16 | 0.0% |
| Europe | 546 | 1.2% |
| France | 37 | 0.1% |
| Germany | 44 | 0.1% |
| Greece | 24 | 0.1% |
| Grenada | 13 | 0.0% |
| Guatemala | 668 | 1.5% |
| Guyana | 353 | 0.8% |
| Haiti | 949 | 2.1% |
| Honduras | 163 | 0.4% |
| Hong Kong | 27 | 0.1% |
| India | 24 | 0.1% |
| Iran | 17 | 0.0% |
| Ireland | 6 | 0.0% |
| Italy | 158 | 0.4% |
| Jamaica | 611 | 1.4% |
| Japan | 4 | 0.0% |
| Jordan | 6 | 0.0% |
| Korea | 125 | 0.3% |
| Latin America | 13,937 | 31.5% |
| Mexico | 231 | 0.5% |
| Nicaragua | 35 | 0.1% |
| Nigeria | 291 | 0.7% |
| Northern Africa | 11 | 0.0% |
| Northern Europe | 33 | 0.1% |
| Oceania | 2 | 0.0% |
| Pakistan | 159 | 0.4% |
| Panama | 346 | 0.8% |
| Peru | 113 | 0.3% |
| Philippines | 47 | 0.1% |
| Poland | 32 | 0.1% |
| Portugal | 179 | 0.4% |
| South America | 1,696 | 3.8% |
| South Central Asia | 241 | 0.5% |
| South Eastern Asia | 91 | 0.2% |
| Southern Europe | 371 | 0.8% |
| Spain | 10 | 0.0% |
| Thailand | 44 | 0.1% |
| Trinidad and Tobago | 346 | 0.8% |
| Uganda | 2 | 0.0% |
| Uruguay | 29 | 0.1% |
| Venezuela | 14 | 0.0% |
| West Indies | 258 | 0.6% |
| Western Africa | 291 | 0.7% |
| Western Asia | 6 | 0.0% |
| Western Europe | 81 | 0.2% |
| Zimbabwe | 19 | 0.0% | View All 72 Rows |
Sex and Age in Freeport
Sex and Age in Freeport
The most populous age groups in Freeport are 45 to 49 Years (1,995 | 9.1%) for men and 50 to 54 Years (1,833 | 8.2%) for women.

| Age Bracket | Male | Female |
| Under 5 Years | 928 (4.3%) | 1,450 (6.5%) |
| 5 to 9 Years | 1,184 (5.4%) | 1,110 (5.0%) |
| 10 to 14 Years | 1,917 (8.8%) | 1,153 (5.1%) |
| 15 to 19 Years | 1,138 (5.2%) | 1,537 (6.9%) |
| 20 to 24 Years | 1,246 (5.7%) | 1,444 (6.5%) |
| 25 to 29 Years | 1,721 (7.9%) | 1,212 (5.4%) |
| 30 to 34 Years | 1,758 (8.1%) | 1,634 (7.3%) |
| 35 to 39 Years | 1,491 (6.8%) | 1,629 (7.3%) |
| 40 to 44 Years | 1,753 (8.0%) | 1,385 (6.2%) |
| 45 to 49 Years | 1,995 (9.1%) | 1,441 (6.4%) |
| 50 to 54 Years | 1,068 (4.9%) | 1,833 (8.2%) |
| 55 to 59 Years | 1,629 (7.5%) | 1,446 (6.5%) |
| 60 to 64 Years | 1,083 (5.0%) | 1,180 (5.3%) |
| 65 to 69 Years | 798 (3.7%) | 1,472 (6.6%) |
| 70 to 74 Years | 966 (4.4%) | 969 (4.3%) |
| 75 to 79 Years | 617 (2.8%) | 430 (1.9%) |
| 80 to 84 Years | 194 (0.9%) | 618 (2.8%) |
| 85 Years and over | 330 (1.5%) | 451 (2.0%) |
| Total | 21,816 (100.0%) | 22,394 (100.0%) |
Families and Households in Freeport
Median Family Size in Freeport
The median family size in Freeport is 3.75 persons per family, with single female/mother families (2,450 | 25.1%) accounting for the largest median family size of 3.93 persons per family. On the other hand, single male/father families (1,304 | 13.4%) represent the smallest median family size with 3.18 persons per family.

| Family Type | # Families | Family Size |
| Married-Couple | 6,006 (61.5%) | 3.80 |
| Single Male/Father | 1,304 (13.4%) | 3.18 |
| Single Female/Mother | 2,450 (25.1%) | 3.93 |
| Total Families | 9,760 (100.0%) | 3.75 |
Median Household Size in Freeport
The median household size in Freeport is 3.08 persons per household, with single female/mother households (2,450 | 17.3%) accounting for the largest median household size of 4.23 persons per household. non-family households (4,409 | 31.1%) represent the smallest median household size with 1.22 persons per household.

| Household Type | # Households | Household Size |
| Married-Couple | 6,006 (42.4%) | 3.87 |
| Single Male/Father | 1,304 (9.2%) | 3.64 |
| Single Female/Mother | 2,450 (17.3%) | 4.23 |
| Non-family | 4,409 (31.1%) | 1.22 |
| Total Households | 14,169 (100.0%) | 3.08 |
Household Size by Marriage Status in Freeport
Out of a total of 14,169 households in Freeport, 9,760 (68.9%) are family households, while 4,409 (31.1%) are nonfamily households. The most numerous type of family households are 2-person households, comprising 2,709, and the most common type of nonfamily households are 1-person households, comprising 3,591.

| Household Size | Family Households | Nonfamily Households |
| 1-Person Households | - | 3,591 (25.3%) |
| 2-Person Households | 2,709 (19.1%) | 729 (5.1%) |
| 3-Person Households | 2,122 (15.0%) | 72 (0.5%) |
| 4-Person Households | 1,786 (12.6%) | 0 (0.0%) |
| 5-Person Households | 1,286 (9.1%) | 17 (0.1%) |
| 6-Person Households | 819 (5.8%) | 0 (0.0%) |
| 7+ Person Households | 1,038 (7.3%) | 0 (0.0%) |
| Total | 9,760 (68.9%) | 4,409 (31.1%) |
Female Fertility in Freeport
Fertility by Age in Freeport
Average fertility rate in Freeport is 25.0 births per 1,000 women. Women in the age bracket of 20 to 34 years have the highest fertility rate with 35.0 births per 1,000 women. Women in the age bracket of 20 to 34 years acount for 57.8% of all women with births.

| Age Bracket | Women with Births | Births / 1,000 Women |
| 15 to 19 years | 11 (4.2%) | 7.0 |
| 20 to 34 years | 152 (57.8%) | 35.0 |
| 35 to 50 years | 100 (38.0%) | 21.0 |
| Total | 263 (100.0%) | 25.0 |
Fertility by Age by Marriage Status in Freeport
58.9% of women with births (263) in Freeport are married. The highest percentage of unmarried women with births falls into 35 to 50 years age bracket with 94.0% of them unmarried at the time of birth, while the lowest percentage of unmarried women with births belong to 15 to 19 years age bracket with 0.0% of them unmarried.

| Age Bracket | Married | Unmarried |
| 15 to 19 years | 11 (100.0%) | 0 (0.0%) |
| 20 to 34 years | 138 (90.8%) | 14 (9.2%) |
| 35 to 50 years | 6 (6.0%) | 94 (94.0%) |
| Total | 155 (58.9%) | 108 (41.1%) |
Fertility by Education in Freeport

| Educational Attainment | Women with Births | Births / 1,000 Women |
| Less than High School | 56 (21.3%) | 28.0 |
| High School Diploma | 0 (0.0%) | 0.0 |
| College or Associate's Degree | 118 (44.9%) | 37.0 |
| Bachelor's Degree | 69 (26.2%) | 38.0 |
| Graduate Degree | 20 (7.6%) | 18.0 |
| Total | 263 (100.0%) | 25.0 |
Fertility by Education by Marriage Status in Freeport
41.1% of women with births in Freeport are unmarried. Women with the educational attainment of college or associate's degree are most likely to be married with 88.1% of them married at childbirth, while women with the educational attainment of graduate degree are least likely to be married with 100.0% of them unmarried at childbirth.

| Educational Attainment | Married | Unmarried |
| Less than High School | 11 (19.6%) | 45 (80.4%) |
| High School Diploma | 0 (0.0%) | 0 (0.0%) |
| College or Associate's Degree | 104 (88.1%) | 14 (11.9%) |
| Bachelor's Degree | 40 (58.0%) | 29 (42.0%) |
| Graduate Degree | 0 (0.0%) | 20 (100.0%) |
| Total | 155 (58.9%) | 108 (41.1%) |
Employment Characteristics in Freeport
Employment by Class of Employer in Freeport
Among the 22,481 employed individuals in Freeport, private company employees (15,575 | 69.3%), local government employees (2,377 | 10.6%), and not-for-profit organizations (1,402 | 6.2%) make up the most common classes of employment.

| Employer Class | # Employees | % Employees |
| Private Company Employees | 15,575 | 69.3% |
| Self-Employed (Incorporated) | 701 | 3.1% |
| Self-Employed (Not Incorporated) | 1,317 | 5.9% |
| Not-for-profit Organizations | 1,402 | 6.2% |
| Local Government Employees | 2,377 | 10.6% |
| State Government Employees | 697 | 3.1% |
| Federal Government Employees | 412 | 1.8% |
| Unpaid Family Workers | 0 | 0.0% |
| Total | 22,481 | 100.0% |
Employment Status by Age in Freeport
According to the labor force statistics for Freeport, out of the total population over 16 years of age (35,979), 68.7% or 24,718 individuals are in the labor force, with 6.0% or 1,483 of them unemployed. The age group with the highest labor force participation rate is 30 to 34 years, with 90.4% or 3,066 individuals in the labor force. Within the labor force, the 20 to 24 years age range has the highest percentage of unemployed individuals, with 18.7% or 374 of them being unemployed.
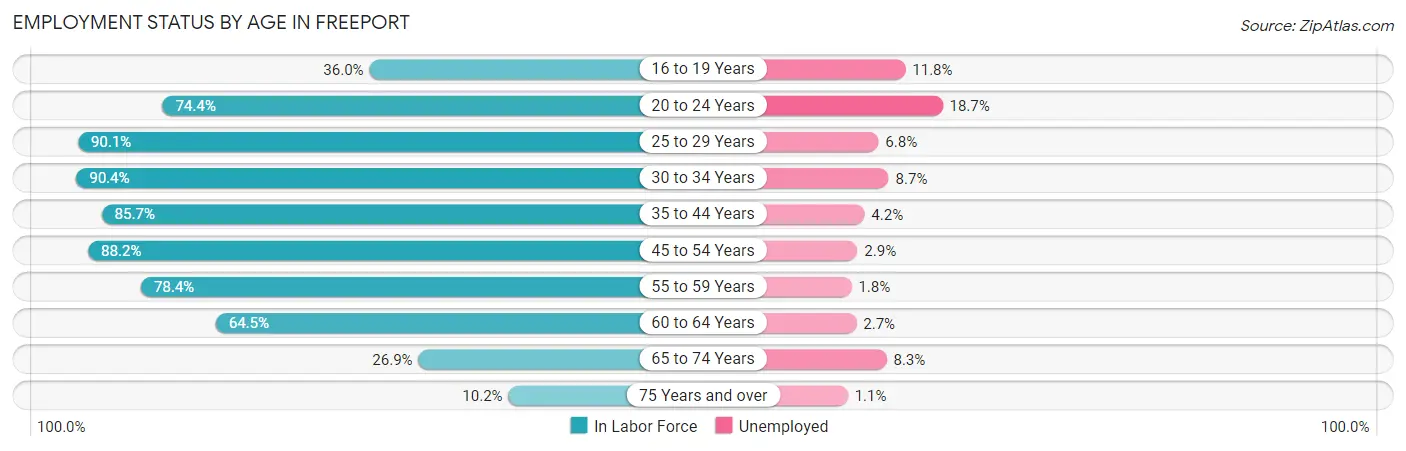
| Age Bracket | In Labor Force | Unemployed |
| 16 to 19 Years | 787 (36.0%) | 93 (11.8%) |
| 20 to 24 Years | 2,001 (74.4%) | 374 (18.7%) |
| 25 to 29 Years | 2,643 (90.1%) | 180 (6.8%) |
| 30 to 34 Years | 3,066 (90.4%) | 267 (8.7%) |
| 35 to 44 Years | 5,363 (85.7%) | 225 (4.2%) |
| 45 to 54 Years | 5,589 (88.2%) | 162 (2.9%) |
| 55 to 59 Years | 2,411 (78.4%) | 43 (1.8%) |
| 60 to 64 Years | 1,460 (64.5%) | 39 (2.7%) |
| 65 to 74 Years | 1,131 (26.9%) | 94 (8.3%) |
| 75 Years and over | 269 (10.2%) | 3 (1.1%) |
| Total | 24,718 (68.7%) | 1,483 (6.0%) |
Employment Status by Educational Attainment in Freeport
According to labor force statistics for Freeport, 84.7% of individuals (20,547) out of the total population between 25 and 64 years of age (24,258) are in the labor force, with 4.5% or 925 of them being unemployed. The group with the highest labor force participation rate are those with the educational attainment of bachelor's degree or higher, with 92.7% or 6,263 individuals in the labor force. Within the labor force, individuals with college / associate degree education have the highest percentage of unemployment, with 5.6% or 319 of them being unemployed.
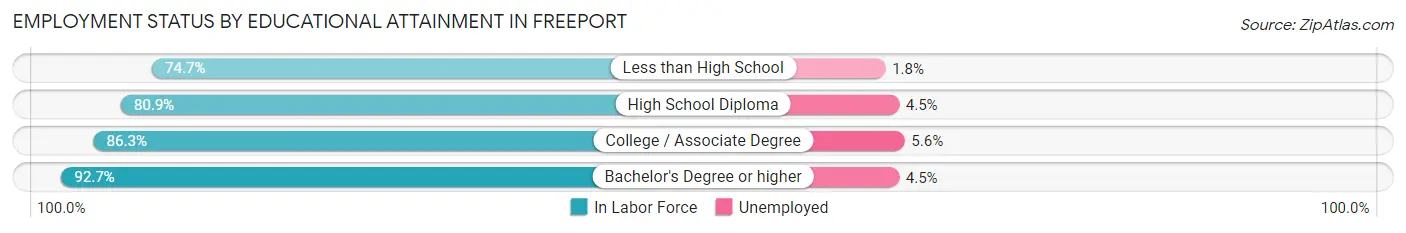
| Educational Attainment | In Labor Force | Unemployed |
| Less than High School | 2,825 (74.7%) | 68 (1.8%) |
| High School Diploma | 5,766 (80.9%) | 321 (4.5%) |
| College / Associate Degree | 5,690 (86.3%) | 369 (5.6%) |
| Bachelor's Degree or higher | 6,263 (92.7%) | 304 (4.5%) |
| Total | 20,547 (84.7%) | 1,092 (4.5%) |
Employment Occupations by Sex in Freeport
Management, Business, Science and Arts Occupations
The most common Management, Business, Science and Arts occupations in Freeport are Community & Social Service (1,934 | 8.3%), Health Diagnosing & Treating (1,887 | 8.1%), Management (1,882 | 8.1%), Health Technologists (1,227 | 5.3%), and Education Instruction & Library (937 | 4.0%).

Management, Business, Science and Arts Occupations by Sex
Within the Management, Business, Science and Arts occupations in Freeport, the most male-oriented occupations are Computers & Mathematics (60.8%), Computers, Engineering & Science (59.7%), and Architecture & Engineering (59.3%), while the most female-oriented occupations are Education, Arts & Media (82.8%), Health Diagnosing & Treating (78.6%), and Health Technologists (78.6%).
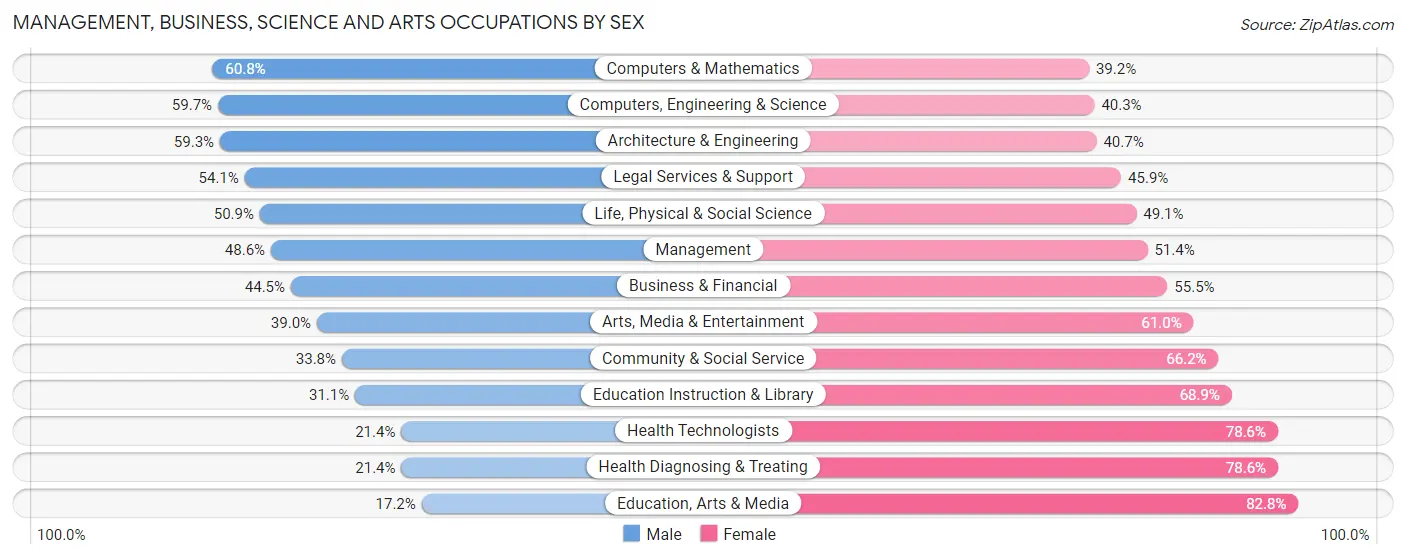
| Occupation | Male | Female |
| Management | 915 (48.6%) | 967 (51.4%) |
| Business & Financial | 409 (44.5%) | 511 (55.5%) |
| Computers, Engineering & Science | 515 (59.7%) | 348 (40.3%) |
| Computers & Mathematics | 312 (60.8%) | 201 (39.2%) |
| Architecture & Engineering | 176 (59.3%) | 121 (40.7%) |
| Life, Physical & Social Science | 27 (50.9%) | 26 (49.1%) |
| Community & Social Service | 654 (33.8%) | 1,280 (66.2%) |
| Education, Arts & Media | 45 (17.2%) | 217 (82.8%) |
| Legal Services & Support | 112 (54.1%) | 95 (45.9%) |
| Education Instruction & Library | 291 (31.1%) | 646 (68.9%) |
| Arts, Media & Entertainment | 206 (39.0%) | 322 (61.0%) |
| Health Diagnosing & Treating | 404 (21.4%) | 1,483 (78.6%) |
| Health Technologists | 263 (21.4%) | 964 (78.6%) |
| Total (Category) | 2,897 (38.7%) | 4,589 (61.3%) |
| Total (Overall) | 11,814 (50.8%) | 11,423 (49.2%) |
Services Occupations
The most common Services occupations in Freeport are Food Preparation & Serving (1,543 | 6.6%), Cleaning & Maintenance (1,432 | 6.2%), Security & Protection (1,053 | 4.5%), Healthcare Support (999 | 4.3%), and Firefighting & Prevention (594 | 2.6%).

Services Occupations by Sex
Within the Services occupations in Freeport, the most male-oriented occupations are Firefighting & Prevention (65.1%), Cleaning & Maintenance (63.7%), and Security & Protection (57.8%), while the most female-oriented occupations are Healthcare Support (96.5%), Personal Care & Service (56.2%), and Law Enforcement (51.6%).

| Occupation | Male | Female |
| Healthcare Support | 35 (3.5%) | 964 (96.5%) |
| Security & Protection | 609 (57.8%) | 444 (42.2%) |
| Firefighting & Prevention | 387 (65.1%) | 207 (34.8%) |
| Law Enforcement | 222 (48.4%) | 237 (51.6%) |
| Food Preparation & Serving | 773 (50.1%) | 770 (49.9%) |
| Cleaning & Maintenance | 912 (63.7%) | 520 (36.3%) |
| Personal Care & Service | 260 (43.8%) | 334 (56.2%) |
| Total (Category) | 2,589 (46.1%) | 3,032 (53.9%) |
| Total (Overall) | 11,814 (50.8%) | 11,423 (49.2%) |
Sales and Office Occupations
The most common Sales and Office occupations in Freeport are Office & Administration (2,389 | 10.3%), and Sales & Related (2,223 | 9.6%).

Sales and Office Occupations by Sex

| Occupation | Male | Female |
| Sales & Related | 1,164 (52.4%) | 1,059 (47.6%) |
| Office & Administration | 645 (27.0%) | 1,744 (73.0%) |
| Total (Category) | 1,809 (39.2%) | 2,803 (60.8%) |
| Total (Overall) | 11,814 (50.8%) | 11,423 (49.2%) |
Natural Resources, Construction and Maintenance Occupations
The most common Natural Resources, Construction and Maintenance occupations in Freeport are Construction & Extraction (1,413 | 6.1%), Installation, Maintenance & Repair (858 | 3.7%), and Farming, Fishing & Forestry (95 | 0.4%).

Natural Resources, Construction and Maintenance Occupations by Sex

| Occupation | Male | Female |
| Farming, Fishing & Forestry | 95 (100.0%) | 0 (0.0%) |
| Construction & Extraction | 1,344 (95.1%) | 69 (4.9%) |
| Installation, Maintenance & Repair | 854 (99.5%) | 4 (0.5%) |
| Total (Category) | 2,293 (96.9%) | 73 (3.1%) |
| Total (Overall) | 11,814 (50.8%) | 11,423 (49.2%) |
Production, Transportation and Moving Occupations
The most common Production, Transportation and Moving occupations in Freeport are Transportation (1,620 | 7.0%), Production (812 | 3.5%), and Material Moving (720 | 3.1%).

Production, Transportation and Moving Occupations by Sex

| Occupation | Male | Female |
| Production | 376 (46.3%) | 436 (53.7%) |
| Transportation | 1,363 (84.1%) | 257 (15.9%) |
| Material Moving | 487 (67.6%) | 233 (32.4%) |
| Total (Category) | 2,226 (70.6%) | 926 (29.4%) |
| Total (Overall) | 11,814 (50.8%) | 11,423 (49.2%) |
Employment Industries by Sex in Freeport
Employment Industries in Freeport
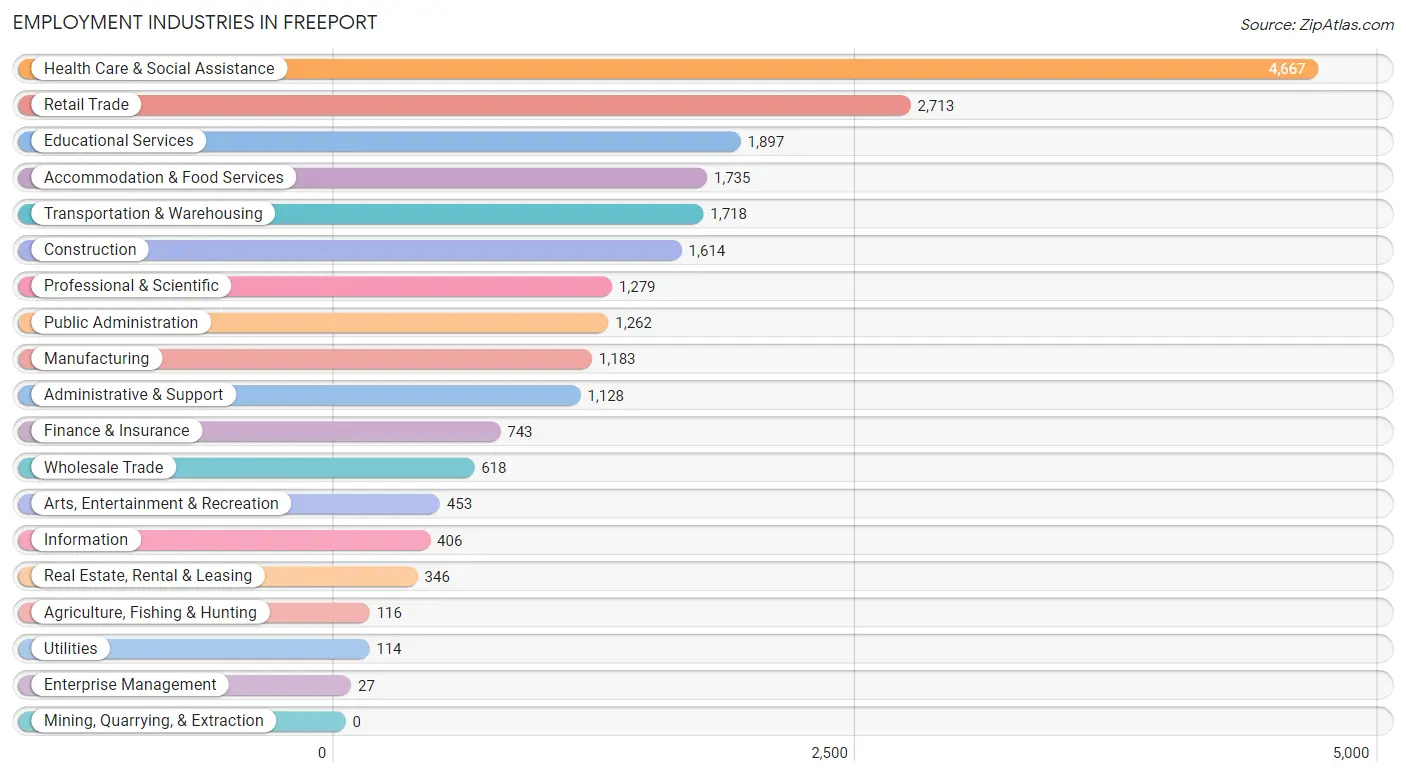
The major employment industries in Freeport include Health Care & Social Assistance (4,667 | 20.1%), Retail Trade (2,713 | 11.7%), Educational Services (1,897 | 8.2%), Accommodation & Food Services (1,735 | 7.5%), and Transportation & Warehousing (1,718 | 7.4%).
Employment Industries by Sex in Freeport
The Freeport industries that see more men than women are Agriculture, Fishing & Hunting (100.0%), Utilities (93.0%), and Construction (89.0%), whereas the industries that tend to have a higher number of women are Enterprise Management (100.0%), Health Care & Social Assistance (75.0%), and Information (63.5%).

| Industry | Male | Female |
| Agriculture, Fishing & Hunting | 116 (100.0%) | 0 (0.0%) |
| Mining, Quarrying, & Extraction | 0 (0.0%) | 0 (0.0%) |
| Construction | 1,436 (89.0%) | 178 (11.0%) |
| Manufacturing | 554 (46.8%) | 629 (53.2%) |
| Wholesale Trade | 472 (76.4%) | 146 (23.6%) |
| Retail Trade | 1,712 (63.1%) | 1,001 (36.9%) |
| Transportation & Warehousing | 1,185 (69.0%) | 533 (31.0%) |
| Utilities | 106 (93.0%) | 8 (7.0%) |
| Information | 148 (36.4%) | 258 (63.5%) |
| Finance & Insurance | 301 (40.5%) | 442 (59.5%) |
| Real Estate, Rental & Leasing | 144 (41.6%) | 202 (58.4%) |
| Professional & Scientific | 641 (50.1%) | 638 (49.9%) |
| Enterprise Management | 0 (0.0%) | 27 (100.0%) |
| Administrative & Support | 800 (70.9%) | 328 (29.1%) |
| Educational Services | 700 (36.9%) | 1,197 (63.1%) |
| Health Care & Social Assistance | 1,165 (25.0%) | 3,502 (75.0%) |
| Arts, Entertainment & Recreation | 285 (62.9%) | 168 (37.1%) |
| Accommodation & Food Services | 781 (45.0%) | 954 (55.0%) |
| Public Administration | 533 (42.2%) | 729 (57.8%) |
| Total | 11,814 (50.8%) | 11,423 (49.2%) |
Education in Freeport
School Enrollment in Freeport
The most common levels of schooling among the 9,719 students in Freeport are middle school (2,595 | 26.7%), high school (2,029 | 20.9%), and elementary school (1,955 | 20.1%).

| School Level | # Students | % Students |
| Nursery / Preschool | 352 | 3.6% |
| Kindergarten | 375 | 3.9% |
| Elementary School | 1,955 | 20.1% |
| Middle School | 2,595 | 26.7% |
| High School | 2,029 | 20.9% |
| College / Undergraduate | 1,824 | 18.8% |
| Graduate / Professional | 589 | 6.1% |
| Total | 9,719 | 100.0% |
School Enrollment by Age by Funding Source in Freeport
Out of a total of 9,719 students who are enrolled in schools in Freeport, 1,351 (13.9%) attend a private institution, while the remaining 8,368 (86.1%) are enrolled in public schools. The age group of 35 years and over has the highest likelihood of being enrolled in private schools, with 190 (48.6% in the age bracket) enrolled. Conversely, the age group of 10 to 14 year olds has the lowest likelihood of being enrolled in a private school, with 2,818 (95.3% in the age bracket) attending a public institution.

| Age Bracket | Public School | Private School |
| 3 to 4 Year Olds | 295 (84.3%) | 55 (15.7%) |
| 5 to 9 Year Old | 2,127 (93.7%) | 142 (6.3%) |
| 10 to 14 Year Olds | 2,818 (95.3%) | 140 (4.7%) |
| 15 to 17 Year Olds | 1,265 (94.0%) | 81 (6.0%) |
| 18 to 19 Year Olds | 844 (86.1%) | 136 (13.9%) |
| 20 to 24 Year Olds | 390 (53.8%) | 335 (46.2%) |
| 25 to 34 Year Olds | 429 (61.3%) | 271 (38.7%) |
| 35 Years and over | 201 (51.4%) | 190 (48.6%) |
| Total | 8,368 (86.1%) | 1,351 (13.9%) |
Educational Attainment by Field of Study in Freeport
Business (2,069 | 23.9%), science & technology (1,232 | 14.2%), education (844 | 9.7%), social sciences (642 | 7.4%), and computers & mathematics (590 | 6.8%) are the most common fields of study among 8,668 individuals in Freeport who have obtained a bachelor's degree or higher.

| Field of Study | # Graduates | % Graduates |
| Computers & Mathematics | 590 | 6.8% |
| Bio, Nature & Agricultural | 266 | 3.1% |
| Physical & Health Sciences | 239 | 2.8% |
| Psychology | 459 | 5.3% |
| Social Sciences | 642 | 7.4% |
| Engineering | 495 | 5.7% |
| Multidisciplinary Studies | 66 | 0.8% |
| Science & Technology | 1,232 | 14.2% |
| Business | 2,069 | 23.9% |
| Education | 844 | 9.7% |
| Literature & Languages | 381 | 4.4% |
| Liberal Arts & History | 398 | 4.6% |
| Visual & Performing Arts | 329 | 3.8% |
| Communications | 176 | 2.0% |
| Arts & Humanities | 482 | 5.6% |
| Total | 8,668 | 100.0% |
Transportation & Commute in Freeport
Vehicle Availability by Sex in Freeport
The most prevalent vehicle ownership categories in Freeport are males with 2 vehicles (4,406, accounting for 38.8%) and females with 2 vehicles (4,098, making up 39.7%).

| Vehicles Available | Male | Female |
| No Vehicle | 726 (6.4%) | 387 (3.5%) |
| 1 Vehicle | 2,164 (19.1%) | 2,725 (24.5%) |
| 2 Vehicles | 4,406 (38.8%) | 4,098 (36.9%) |
| 3 Vehicles | 2,380 (21.0%) | 2,343 (21.1%) |
| 4 Vehicles | 1,148 (10.1%) | 704 (6.3%) |
| 5 or more Vehicles | 529 (4.7%) | 842 (7.6%) |
| Total | 11,353 (100.0%) | 11,099 (100.0%) |
Commute Time in Freeport
The most frequently occuring commute durations in Freeport are 20 to 24 minutes (3,171 commuters, 15.2%), 15 to 19 minutes (2,567 commuters, 12.3%), and 30 to 34 minutes (2,523 commuters, 12.1%).

| Commute Time | # Commuters | % Commuters |
| Less than 5 Minutes | 321 | 1.5% |
| 5 to 9 Minutes | 1,152 | 5.5% |
| 10 to 14 Minutes | 2,168 | 10.4% |
| 15 to 19 Minutes | 2,567 | 12.3% |
| 20 to 24 Minutes | 3,171 | 15.2% |
| 25 to 29 Minutes | 1,464 | 7.0% |
| 30 to 34 Minutes | 2,523 | 12.1% |
| 35 to 39 Minutes | 900 | 4.3% |
| 40 to 44 Minutes | 1,155 | 5.6% |
| 45 to 59 Minutes | 1,808 | 8.7% |
| 60 to 89 Minutes | 2,036 | 9.8% |
| 90 or more Minutes | 1,551 | 7.4% |
Commute Time by Sex in Freeport
The most common commute times in Freeport are 30 to 34 minutes (1,361 commuters, 13.0%) for males and 20 to 24 minutes (1,817 commuters, 17.6%) for females.

| Commute Time | Male | Female |
| Less than 5 Minutes | 57 (0.5%) | 264 (2.6%) |
| 5 to 9 Minutes | 535 (5.1%) | 617 (6.0%) |
| 10 to 14 Minutes | 1,182 (11.3%) | 986 (9.6%) |
| 15 to 19 Minutes | 849 (8.1%) | 1,718 (16.6%) |
| 20 to 24 Minutes | 1,354 (12.9%) | 1,817 (17.6%) |
| 25 to 29 Minutes | 881 (8.4%) | 583 (5.7%) |
| 30 to 34 Minutes | 1,361 (13.0%) | 1,162 (11.3%) |
| 35 to 39 Minutes | 532 (5.1%) | 368 (3.6%) |
| 40 to 44 Minutes | 684 (6.5%) | 471 (4.6%) |
| 45 to 59 Minutes | 857 (8.2%) | 951 (9.2%) |
| 60 to 89 Minutes | 1,177 (11.2%) | 859 (8.3%) |
| 90 or more Minutes | 1,024 (9.8%) | 527 (5.1%) |
Time of Departure to Work by Sex in Freeport
The most frequent times of departure to work in Freeport are 7:00 AM to 7:29 AM (1,723, 16.4%) for males and 8:00 AM to 8:29 AM (1,979, 19.2%) for females.

| Time of Departure | Male | Female |
| 12:00 AM to 4:59 AM | 672 (6.4%) | 169 (1.6%) |
| 5:00 AM to 5:29 AM | 761 (7.2%) | 144 (1.4%) |
| 5:30 AM to 5:59 AM | 511 (4.9%) | 385 (3.7%) |
| 6:00 AM to 6:29 AM | 1,009 (9.6%) | 956 (9.3%) |
| 6:30 AM to 6:59 AM | 745 (7.1%) | 817 (7.9%) |
| 7:00 AM to 7:29 AM | 1,723 (16.4%) | 1,441 (14.0%) |
| 7:30 AM to 7:59 AM | 729 (7.0%) | 1,223 (11.8%) |
| 8:00 AM to 8:29 AM | 1,330 (12.7%) | 1,979 (19.2%) |
| 8:30 AM to 8:59 AM | 490 (4.7%) | 1,089 (10.5%) |
| 9:00 AM to 9:59 AM | 779 (7.4%) | 740 (7.2%) |
| 10:00 AM to 10:59 AM | 230 (2.2%) | 218 (2.1%) |
| 11:00 AM to 11:59 AM | 61 (0.6%) | 271 (2.6%) |
| 12:00 PM to 3:59 PM | 719 (6.9%) | 368 (3.6%) |
| 4:00 PM to 11:59 PM | 734 (7.0%) | 523 (5.1%) |
| Total | 10,493 (100.0%) | 10,323 (100.0%) |
Housing Occupancy in Freeport
Occupancy by Ownership in Freeport
Of the total 14,169 dwellings in Freeport, owner-occupied units account for 9,777 (69.0%), while renter-occupied units make up 4,392 (31.0%).

| Occupancy | # Housing Units | % Housing Units |
| Owner Occupied Housing Units | 9,777 | 69.0% |
| Renter-Occupied Housing Units | 4,392 | 31.0% |
| Total Occupied Housing Units | 14,169 | 100.0% |
Occupancy by Household Size in Freeport

| Household Size | # Housing Units | % Housing Units |
| 1-Person Household | 3,591 | 25.3% |
| 2-Person Household | 3,438 | 24.3% |
| 3-Person Household | 2,194 | 15.5% |
| 4+ Person Household | 4,946 | 34.9% |
| Total Housing Units | 14,169 | 100.0% |
Occupancy by Ownership by Household Size in Freeport

| Household Size | Owner-occupied | Renter-occupied |
| 1-Person Household | 2,241 (62.4%) | 1,350 (37.6%) |
| 2-Person Household | 2,495 (72.6%) | 943 (27.4%) |
| 3-Person Household | 1,735 (79.1%) | 459 (20.9%) |
| 4+ Person Household | 3,306 (66.8%) | 1,640 (33.2%) |
| Total Housing Units | 9,777 (69.0%) | 4,392 (31.0%) |
Occupancy by Educational Attainment in Freeport

| Household Size | Owner-occupied | Renter-occupied |
| Less than High School | 782 (39.4%) | 1,205 (60.6%) |
| High School Diploma | 2,457 (61.7%) | 1,526 (38.3%) |
| College/Associate Degree | 2,637 (74.2%) | 917 (25.8%) |
| Bachelor's Degree or higher | 3,901 (84.0%) | 744 (16.0%) |
Occupancy by Age of Householder in Freeport

| Age Bracket | # Households | % Households |
| Under 35 Years | 1,433 | 10.1% |
| 35 to 44 Years | 2,862 | 20.2% |
| 45 to 54 Years | 2,499 | 17.6% |
| 55 to 64 Years | 3,206 | 22.6% |
| 65 to 74 Years | 2,535 | 17.9% |
| 75 to 84 Years | 1,278 | 9.0% |
| 85 Years and Over | 356 | 2.5% |
| Total | 14,169 | 100.0% |
Housing Finances in Freeport
Median Income by Occupancy in Freeport

| Occupancy Type | # Households | Median Income |
| Owner-Occupied | 9,777 (69.0%) | $125,227 |
| Renter-Occupied | 4,392 (31.0%) | $77,500 |
| Average | 14,169 (100.0%) | $109,390 |
Occupancy by Householder Income Bracket in Freeport

| Income Bracket | Owner-occupied | Renter-occupied |
| Less than $5,000 | 117 (1.2%) | 133 (3.0%) |
| $5,000 to $9,999 | 40 (0.4%) | 83 (1.9%) |
| $10,000 to $14,999 | 93 (0.9%) | 177 (4.0%) |
| $15,000 to $19,999 | 209 (2.1%) | 293 (6.7%) |
| $20,000 to $24,999 | 152 (1.5%) | 196 (4.5%) |
| $25,000 to $34,999 | 298 (3.0%) | 264 (6.0%) |
| $35,000 to $49,999 | 651 (6.7%) | 475 (10.8%) |
| $50,000 to $74,999 | 1,315 (13.5%) | 535 (12.2%) |
| $75,000 to $99,999 | 1,039 (10.6%) | 402 (9.1%) |
| $100,000 to $149,999 | 2,002 (20.5%) | 1,301 (29.6%) |
| $150,000 or more | 3,861 (39.5%) | 533 (12.1%) |
| Total | 9,777 (100.0%) | 4,392 (100.0%) |
Monthly Housing Cost Tiers in Freeport

| Monthly Cost | Owner-occupied | Renter-occupied |
| Less than $300 | 242 (2.5%) | 135 (3.1%) |
| $300 to $499 | 147 (1.5%) | 179 (4.1%) |
| $500 to $799 | 255 (2.6%) | 101 (2.3%) |
| $800 to $999 | 172 (1.8%) | 322 (7.3%) |
| $1,000 to $1,499 | 1,411 (14.4%) | 577 (13.1%) |
| $1,500 to $1,999 | 1,501 (15.3%) | 983 (22.4%) |
| $2,000 to $2,499 | 856 (8.8%) | 929 (21.1%) |
| $2,500 to $2,999 | 1,178 (12.0%) | 304 (6.9%) |
| $3,000 or more | 4,015 (41.1%) | 677 (15.4%) |
| Total | 9,777 (100.0%) | 4,392 (100.0%) |
Physical Housing Characteristics in Freeport
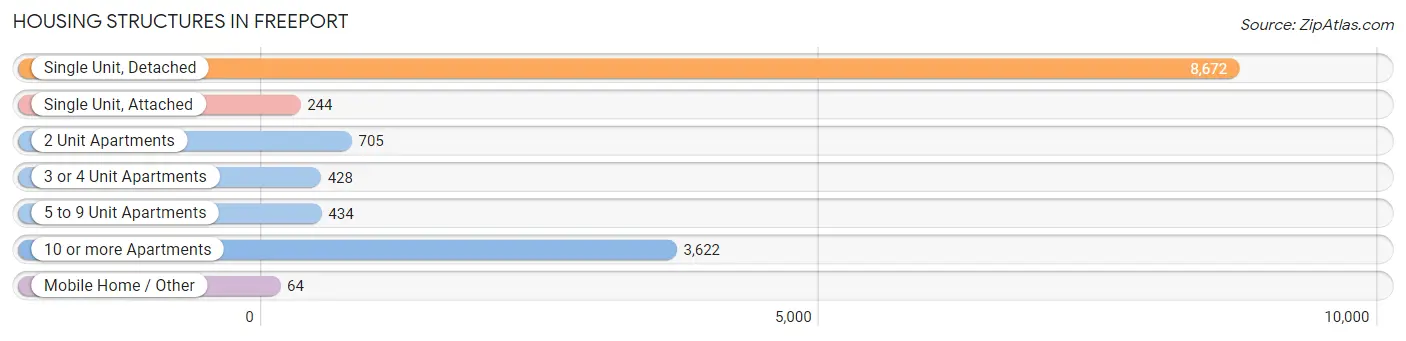
Housing Structures in Freeport
| Structure Type | # Housing Units | % Housing Units |
| Single Unit, Detached | 8,672 | 61.2% |
| Single Unit, Attached | 244 | 1.7% |
| 2 Unit Apartments | 705 | 5.0% |
| 3 or 4 Unit Apartments | 428 | 3.0% |
| 5 to 9 Unit Apartments | 434 | 3.1% |
| 10 or more Apartments | 3,622 | 25.6% |
| Mobile Home / Other | 64 | 0.4% |
| Total | 14,169 | 100.0% |
Housing Structures by Occupancy in Freeport

| Structure Type | Owner-occupied | Renter-occupied |
| Single Unit, Detached | 7,738 (89.2%) | 934 (10.8%) |
| Single Unit, Attached | 230 (94.3%) | 14 (5.7%) |
| 2 Unit Apartments | 370 (52.5%) | 335 (47.5%) |
| 3 or 4 Unit Apartments | 34 (7.9%) | 394 (92.1%) |
| 5 to 9 Unit Apartments | 126 (29.0%) | 308 (71.0%) |
| 10 or more Apartments | 1,230 (34.0%) | 2,392 (66.0%) |
| Mobile Home / Other | 49 (76.6%) | 15 (23.4%) |
| Total | 9,777 (69.0%) | 4,392 (31.0%) |
Housing Structures by Number of Rooms in Freeport

| Number of Rooms | Owner-occupied | Renter-occupied |
| 1 Room | 95 (1.0%) | 520 (11.8%) |
| 2 or 3 Rooms | 915 (9.4%) | 1,215 (27.7%) |
| 4 or 5 Rooms | 1,765 (18.0%) | 1,647 (37.5%) |
| 6 or 7 Rooms | 4,361 (44.6%) | 574 (13.1%) |
| 8 or more Rooms | 2,641 (27.0%) | 436 (9.9%) |
| Total | 9,777 (100.0%) | 4,392 (100.0%) |
Housing Structure by Heating Type in Freeport

| Heating Type | Owner-occupied | Renter-occupied |
| Utility Gas | 5,903 (60.4%) | 2,569 (58.5%) |
| Bottled, Tank, or LP Gas | 156 (1.6%) | 69 (1.6%) |
| Electricity | 1,016 (10.4%) | 709 (16.1%) |
| Fuel Oil or Kerosene | 2,632 (26.9%) | 779 (17.7%) |
| Coal or Coke | 0 (0.0%) | 0 (0.0%) |
| All other Fuels | 62 (0.6%) | 219 (5.0%) |
| No Fuel Used | 8 (0.1%) | 47 (1.1%) |
| Total | 9,777 (100.0%) | 4,392 (100.0%) |
Household Vehicle Usage in Freeport

| Vehicles per Household | Owner-occupied | Renter-occupied |
| No Vehicle | 340 (3.5%) | 1,075 (24.5%) |
| 1 Vehicle | 2,992 (30.6%) | 1,846 (42.0%) |
| 2 Vehicles | 4,090 (41.8%) | 901 (20.5%) |
| 3 or more Vehicles | 2,355 (24.1%) | 570 (13.0%) |
| Total | 9,777 (100.0%) | 4,392 (100.0%) |
Real Estate & Mortgages in Freeport
Real Estate and Mortgage Overview in Freeport
| Characteristic | Without Mortgage | With Mortgage |
| Housing Units | 2,966 | 6,811 |
| Median Property Value | $426,200 | $453,000 |
| Median Household Income | $75,789 | $3,103 |
| Monthly Housing Costs | $1,419 | $3,996 |
| Real Estate Taxes | $10,001 | $309 |
Property Value by Mortgage Status in Freeport

| Property Value | Without Mortgage | With Mortgage |
| Less than $50,000 | 113 (3.8%) | 79 (1.2%) |
| $50,000 to $99,999 | 112 (3.8%) | 88 (1.3%) |
| $100,000 to $299,999 | 516 (17.4%) | 839 (12.3%) |
| $300,000 to $499,999 | 1,462 (49.3%) | 3,353 (49.2%) |
| $500,000 to $749,999 | 636 (21.4%) | 2,289 (33.6%) |
| $750,000 to $999,999 | 112 (3.8%) | 116 (1.7%) |
| $1,000,000 or more | 15 (0.5%) | 47 (0.7%) |
| Total | 2,966 (100.0%) | 6,811 (100.0%) |
Household Income by Mortgage Status in Freeport

| Household Income | Without Mortgage | With Mortgage |
| Less than $10,000 | 102 (3.4%) | 118 (1.7%) |
| $10,000 to $24,999 | 244 (8.2%) | 55 (0.8%) |
| $25,000 to $34,999 | 125 (4.2%) | 210 (3.1%) |
| $35,000 to $49,999 | 333 (11.2%) | 173 (2.5%) |
| $50,000 to $74,999 | 661 (22.3%) | 318 (4.7%) |
| $75,000 to $99,999 | 202 (6.8%) | 654 (9.6%) |
| $100,000 to $149,999 | 541 (18.2%) | 837 (12.3%) |
| $150,000 or more | 758 (25.6%) | 1,461 (21.4%) |
| Total | 2,966 (100.0%) | 6,811 (100.0%) |
Property Value to Household Income Ratio in Freeport

| Value-to-Income Ratio | Without Mortgage | With Mortgage |
| Less than 2.0x | 468 (15.8%) | 137,402 (2,017.4%) |
| 2.0x to 2.9x | 515 (17.4%) | 1,724 (25.3%) |
| 3.0x to 3.9x | 515 (17.4%) | 1,586 (23.3%) |
| 4.0x or more | 1,452 (48.9%) | 1,087 (16.0%) |
| Total | 2,966 (100.0%) | 6,811 (100.0%) |
Real Estate Taxes by Mortgage Status in Freeport

| Property Taxes | Without Mortgage | With Mortgage |
| Less than $800 | 70 (2.4%) | 14 (0.2%) |
| $800 to $1,499 | 35 (1.2%) | 120 (1.8%) |
| $800 to $1,499 | 2,653 (89.4%) | 144 (2.1%) |
| Total | 2,966 (100.0%) | 6,811 (100.0%) |
Health & Disability in Freeport
Health Insurance Coverage by Age in Freeport
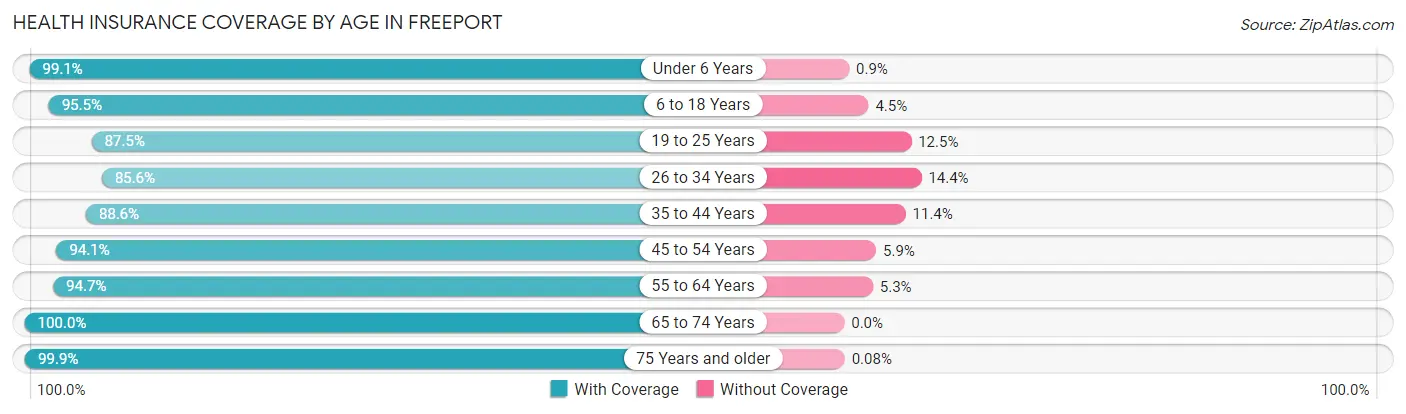
| Age Bracket | With Coverage | Without Coverage |
| Under 6 Years | 2,760 (99.1%) | 25 (0.9%) |
| 6 to 18 Years | 6,580 (95.5%) | 311 (4.5%) |
| 19 to 25 Years | 3,387 (87.5%) | 483 (12.5%) |
| 26 to 34 Years | 5,026 (85.6%) | 845 (14.4%) |
| 35 to 44 Years | 5,534 (88.6%) | 714 (11.4%) |
| 45 to 54 Years | 5,952 (94.1%) | 375 (5.9%) |
| 55 to 64 Years | 5,025 (94.7%) | 283 (5.3%) |
| 65 to 74 Years | 4,147 (100.0%) | 0 (0.0%) |
| 75 Years and older | 2,442 (99.9%) | 2 (0.1%) |
| Total | 40,853 (93.1%) | 3,038 (6.9%) |
Health Insurance Coverage by Citizenship Status in Freeport

| Citizenship Status | With Coverage | Without Coverage |
| Native Born | 2,760 (99.1%) | 25 (0.9%) |
| Foreign Born, Citizen | 6,580 (95.5%) | 311 (4.5%) |
| Foreign Born, not a Citizen | 3,387 (87.5%) | 483 (12.5%) |
Health Insurance Coverage by Household Income in Freeport

| Household Income | With Coverage | Without Coverage |
| Under $25,000 | 1,834 (90.1%) | 201 (9.9%) |
| $25,000 to $49,999 | 3,406 (88.2%) | 455 (11.8%) |
| $50,000 to $74,999 | 4,517 (94.3%) | 271 (5.7%) |
| $75,000 to $99,999 | 3,566 (92.0%) | 311 (8.0%) |
| $100,000 and over | 27,326 (93.8%) | 1,794 (6.2%) |
Public vs Private Health Insurance Coverage by Age in Freeport

| Age Bracket | Public Insurance | Private Insurance |
| Under 6 | 767 (27.5%) | 2,059 (73.9%) |
| 6 to 18 Years | 2,118 (30.7%) | 4,826 (70.0%) |
| 19 to 25 Years | 1,035 (26.7%) | 2,459 (63.5%) |
| 25 to 34 Years | 1,036 (17.6%) | 4,116 (70.1%) |
| 35 to 44 Years | 981 (15.7%) | 4,752 (76.1%) |
| 45 to 54 Years | 1,256 (19.9%) | 4,891 (77.3%) |
| 55 to 64 Years | 1,159 (21.8%) | 4,231 (79.7%) |
| 65 to 74 Years | 3,894 (93.9%) | 2,138 (51.6%) |
| 75 Years and over | 2,410 (98.6%) | 1,341 (54.9%) |
| Total | 14,656 (33.4%) | 30,813 (70.2%) |
Disability Status by Sex by Age in Freeport

| Age Bracket | Male | Female |
| Under 5 Years | 0 (0.0%) | 0 (0.0%) |
| 5 to 17 Years | 118 (3.2%) | 0 (0.0%) |
| 18 to 34 Years | 175 (3.3%) | 61 (1.2%) |
| 35 to 64 Years | 763 (8.5%) | 621 (7.0%) |
| 65 to 74 Years | 233 (13.5%) | 511 (21.1%) |
| 75 Years and over | 370 (34.0%) | 653 (48.1%) |
Disability Class by Sex by Age in Freeport
Disability Class: Hearing Difficulty

| Age Bracket | Male | Female |
| Under 5 Years | 0 (0.0%) | 0 (0.0%) |
| 5 to 17 Years | 0 (0.0%) | 0 (0.0%) |
| 18 to 34 Years | 2 (0.0%) | 0 (0.0%) |
| 35 to 64 Years | 28 (0.3%) | 61 (0.7%) |
| 65 to 74 Years | 95 (5.5%) | 6 (0.3%) |
| 75 Years and over | 159 (14.6%) | 203 (15.0%) |
Disability Class: Vision Difficulty

| Age Bracket | Male | Female |
| Under 5 Years | 0 (0.0%) | 0 (0.0%) |
| 5 to 17 Years | 0 (0.0%) | 0 (0.0%) |
| 18 to 34 Years | 2 (0.0%) | 0 (0.0%) |
| 35 to 64 Years | 68 (0.8%) | 112 (1.3%) |
| 65 to 74 Years | 38 (2.2%) | 65 (2.7%) |
| 75 Years and over | 25 (2.3%) | 25 (1.8%) |
Disability Class: Cognitive Difficulty

| Age Bracket | Male | Female |
| 5 to 17 Years | 91 (2.5%) | 0 (0.0%) |
| 18 to 34 Years | 123 (2.3%) | 47 (0.9%) |
| 35 to 64 Years | 237 (2.6%) | 133 (1.5%) |
| 65 to 74 Years | 79 (4.6%) | 91 (3.8%) |
| 75 Years and over | 123 (11.3%) | 111 (8.2%) |
Disability Class: Ambulatory Difficulty

| Age Bracket | Male | Female |
| 5 to 17 Years | 27 (0.7%) | 0 (0.0%) |
| 18 to 34 Years | 17 (0.3%) | 26 (0.5%) |
| 35 to 64 Years | 579 (6.4%) | 359 (4.0%) |
| 65 to 74 Years | 110 (6.4%) | 413 (17.1%) |
| 75 Years and over | 298 (27.4%) | 561 (41.3%) |
Disability Class: Self-Care Difficulty
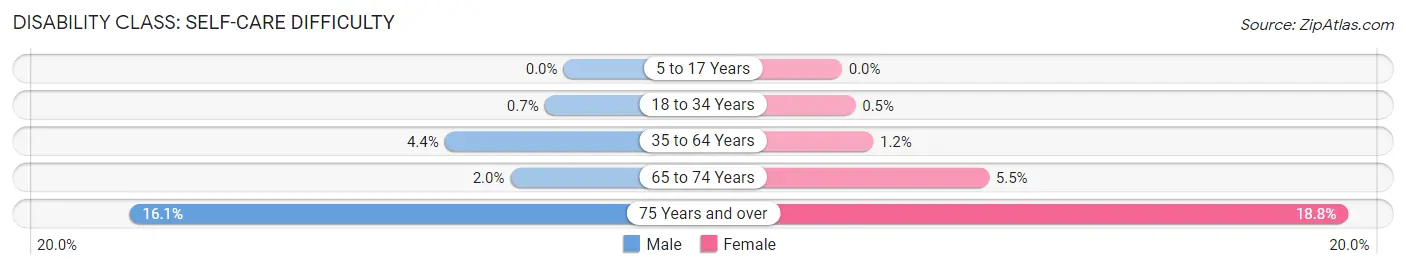
| Age Bracket | Male | Female |
| 5 to 17 Years | 0 (0.0%) | 0 (0.0%) |
| 18 to 34 Years | 37 (0.7%) | 25 (0.5%) |
| 35 to 64 Years | 396 (4.4%) | 103 (1.2%) |
| 65 to 74 Years | 34 (2.0%) | 132 (5.5%) |
| 75 Years and over | 175 (16.1%) | 255 (18.8%) |
Technology Access in Freeport
Computing Device Access in Freeport

| Device Type | # Households | % Households |
| Desktop or Laptop | 11,682 | 82.5% |
| Smartphone | 12,445 | 87.8% |
| Tablet | 8,841 | 62.4% |
| No Computing Device | 720 | 5.1% |
| Total | 14,169 | 100.0% |
Internet Access in Freeport

| Internet Type | # Households | % Households |
| Dial-Up Internet | 38 | 0.3% |
| Broadband Home | 11,490 | 81.1% |
| Cellular Data Only | 1,289 | 9.1% |
| Satellite Internet | 462 | 3.3% |
| No Internet | 1,183 | 8.4% |
| Total | 14,169 | 100.0% |
Freeport Summary
Freeport, New York is a village located in Nassau County, on the South Shore of Long Island. It is part of the Greater New York City metropolitan area and is situated approximately 25 miles east of Manhattan. The village has a population of approximately 43,000 people and is known for its diverse population, vibrant economy, and rich history.
Geography
Freeport is located on the South Shore of Long Island, in Nassau County. It is bordered by the villages of Baldwin to the west, Merrick to the east, and Roosevelt to the south. The village is situated on the Hempstead Plains, a flat, low-lying area of land that is part of the Atlantic Coastal Plain. The village is located on the southern shore of the Hempstead Bay, which is part of the Long Island Sound. The village is also located near the Nassau-Suffolk County border, and is approximately 25 miles east of Manhattan.
History
The area that is now Freeport was originally inhabited by the Meroke Indians, who were part of the Algonquin tribe. The first European settlers arrived in the area in the 1640s, and the village was officially founded in 1853. The village was named after the Freeport Railroad, which was built in the area in 1854. The railroad was a major factor in the growth of the village, as it provided easy access to New York City.
In the late 19th century, Freeport became a popular summer resort destination for wealthy New Yorkers. The village was known for its beaches, fishing, and other recreational activities. In the early 20th century, the village experienced a period of rapid growth and development. This was due in part to the construction of the Long Island Rail Road, which provided easy access to New York City.
Economy
Freeport is a major economic center in Nassau County. The village is home to a variety of businesses, including retail stores, restaurants, and manufacturing companies. The village is also home to a number of corporate headquarters, including the headquarters of the National Grid Corporation. The village is also home to a number of financial institutions, including the Bank of America and the New York Community Bank.
The village is also home to a number of tourist attractions, including the Nautical Mile, a popular shopping and dining destination. The village is also home to the Freeport Marina, which is a popular destination for boaters and fishermen.
Demographics
As of the 2010 census, the population of Freeport was 43,023. The population is diverse, with a large African American population (25.3%), a large Hispanic population (19.2%), and a large Asian population (7.2%). The median household income in the village is $67,945, and the median home value is $372,400.
Conclusion
Freeport, New York is a vibrant village located on the South Shore of Long Island. The village has a rich history, a diverse population, and a thriving economy. The village is home to a variety of businesses, financial institutions, and tourist attractions. The village is also home to a large African American, Hispanic, and Asian population. Freeport is a great place to live, work, and visit.
Common Questions
What is Per Capita Income in Freeport?
Per Capita income in Freeport is $43,202.
What is the Median Family Income in Freeport?
Median Family Income in Freeport is $129,132.
What is the Median Household income in Freeport?
Median Household Income in Freeport is $109,390.
What is Income or Wage Gap in Freeport?
Income or Wage Gap in Freeport is 9.6%.
Women in Freeport earn 90.4 cents for every dollar earned by a man.
What is Family Income Deficit in Freeport?
Family Income Deficit in Freeport is $9,828.
Families that are below poverty line in Freeport earn $9,828 less on average than the poverty threshold level.
What is Inequality or Gini Index in Freeport?
Inequality or Gini Index in Freeport is 0.42.
What is the Total Population of Freeport?
Total Population of Freeport is 44,210.
What is the Total Male Population of Freeport?
Total Male Population of Freeport is 21,816.
What is the Total Female Population of Freeport?
Total Female Population of Freeport is 22,394.
What is the Ratio of Males per 100 Females in Freeport?
There are 97.42 Males per 100 Females in Freeport.
What is the Ratio of Females per 100 Males in Freeport?
There are 102.65 Females per 100 Males in Freeport.
What is the Median Population Age in Freeport?
Median Population Age in Freeport is 39.3 Years.
What is the Average Family Size in Freeport
Average Family Size in Freeport is 3.8 People.
What is the Average Household Size in Freeport
Average Household Size in Freeport is 3.1 People.
How Large is the Labor Force in Freeport?
There are 24,718 People in the Labor Forcein in Freeport.
What is the Percentage of People in the Labor Force in Freeport?
68.7% of People are in the Labor Force in Freeport.
What is the Unemployment Rate in Freeport?
Unemployment Rate in Freeport is 6.0%.