Walton Park, NY Map & Demographics
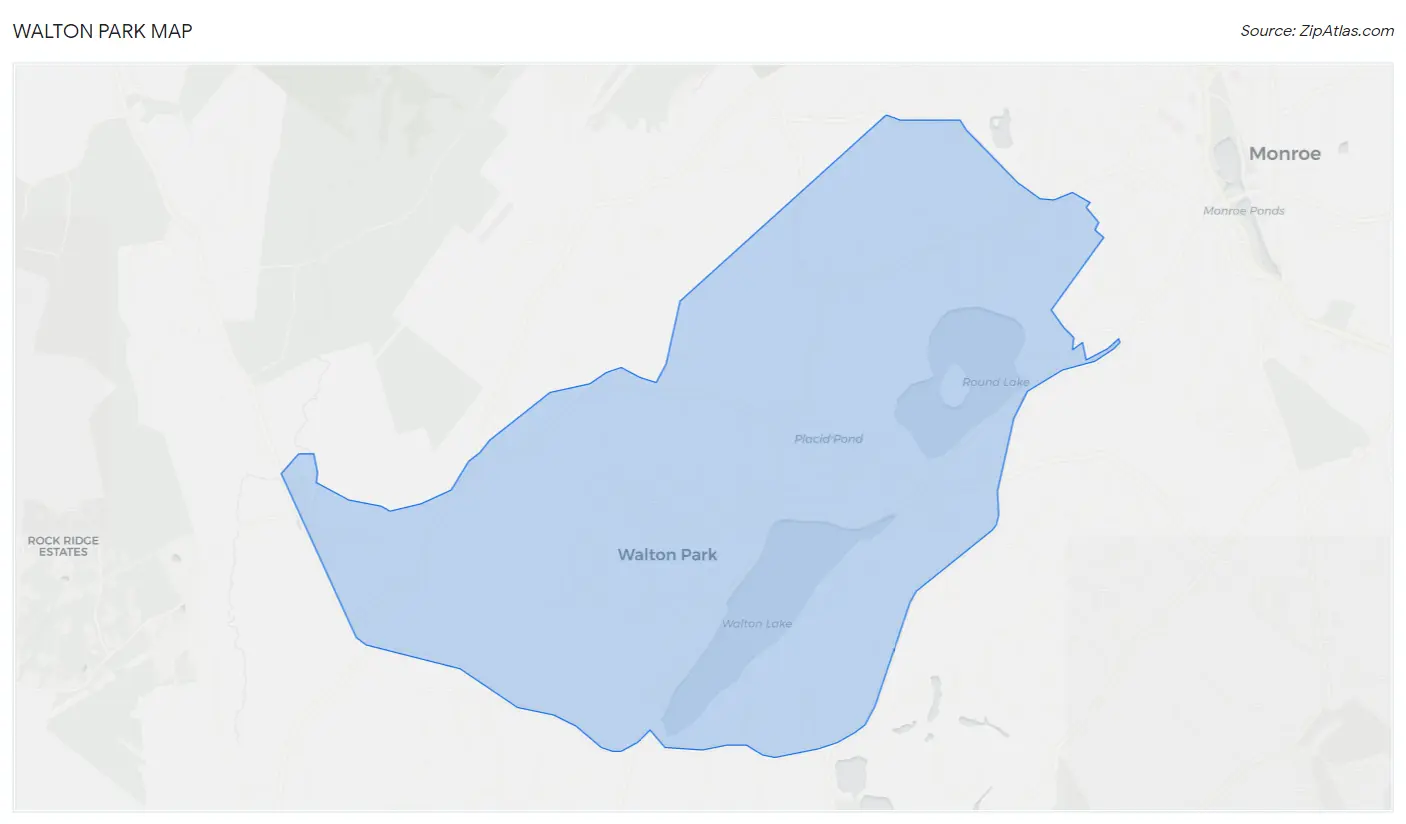
Walton Park Map
Walton Park Overview
$53,677
PER CAPITA INCOME
$135,441
AVG FAMILY INCOME
$140,614
AVG HOUSEHOLD INCOME
42.3%
WAGE / INCOME GAP [ % ]
57.7¢/ $1
WAGE / INCOME GAP [ $ ]
0.36
INEQUALITY / GINI INDEX
4,139
TOTAL POPULATION
2,054
MALE POPULATION
2,085
FEMALE POPULATION
98.51
MALES / 100 FEMALES
101.51
FEMALES / 100 MALES
45.1
MEDIAN AGE
3.1
AVG FAMILY SIZE
2.8
AVG HOUSEHOLD SIZE
2,305
LABOR FORCE [ PEOPLE ]
67.7%
PERCENT IN LABOR FORCE
5.0%
UNEMPLOYMENT RATE
Income in Walton Park
Income Overview in Walton Park
Per Capita Income in Walton Park is $53,677, while median incomes of families and households are $135,441 and $140,614 respectively.
| Characteristic | Number | Measure |
| Per Capita Income | 4,139 | $53,677 |
| Median Family Income | 1,210 | $135,441 |
| Mean Family Income | 1,210 | $153,579 |
| Median Household Income | 1,482 | $140,614 |
| Mean Household Income | 1,482 | $149,520 |
| Income Deficit | 1,210 | $0 |
| Wage / Income Gap (%) | 4,139 | 42.30% |
| Wage / Income Gap ($) | 4,139 | 57.70¢ per $1 |
| Gini / Inequality Index | 4,139 | 0.36 |
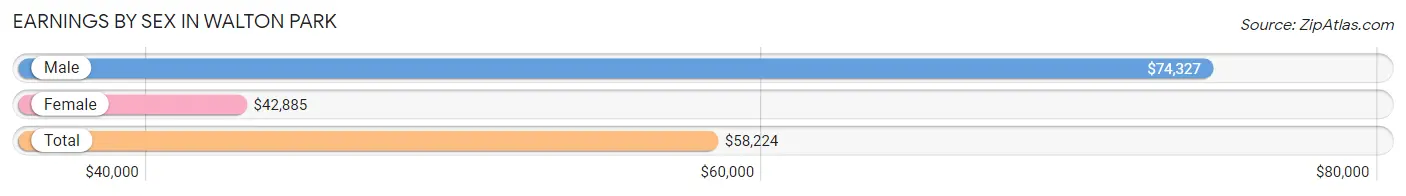
Earnings by Sex in Walton Park
Average Earnings in Walton Park are $58,224, $74,327 for men and $42,885 for women, a difference of 42.3%.
| Sex | Number | Average Earnings |
| Male | 1,181 (49.8%) | $74,327 |
| Female | 1,190 (50.2%) | $42,885 |
| Total | 2,371 (100.0%) | $58,224 |
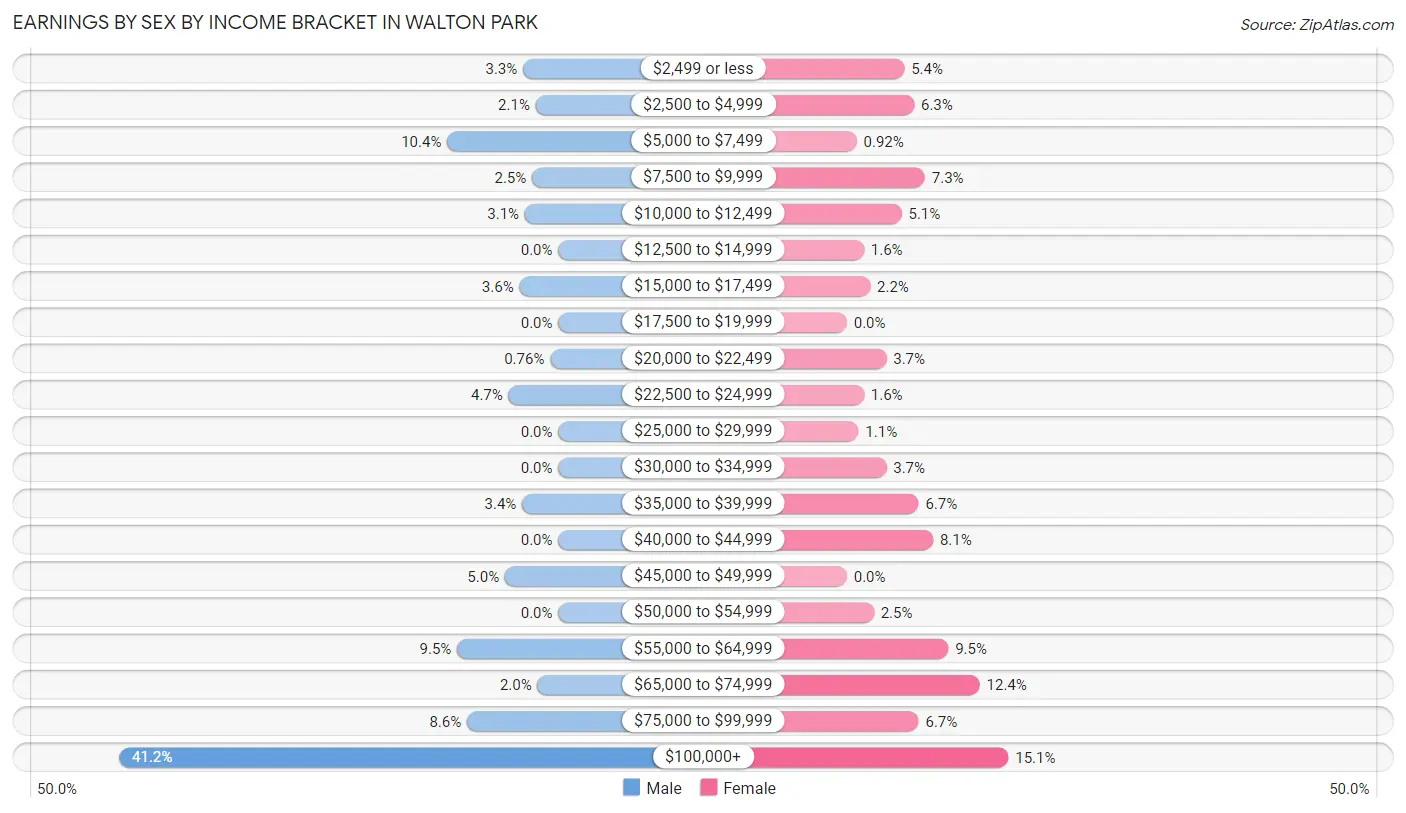
Earnings by Sex by Income Bracket in Walton Park
The most common earnings brackets in Walton Park are $100,000+ for men (486 | 41.1%) and $100,000+ for women (180 | 15.1%).
| Income | Male | Female |
| $2,499 or less | 39 (3.3%) | 64 (5.4%) |
| $2,500 to $4,999 | 25 (2.1%) | 75 (6.3%) |
| $5,000 to $7,499 | 123 (10.4%) | 11 (0.9%) |
| $7,500 to $9,999 | 29 (2.5%) | 87 (7.3%) |
| $10,000 to $12,499 | 37 (3.1%) | 61 (5.1%) |
| $12,500 to $14,999 | 0 (0.0%) | 19 (1.6%) |
| $15,000 to $17,499 | 43 (3.6%) | 26 (2.2%) |
| $17,500 to $19,999 | 0 (0.0%) | 0 (0.0%) |
| $20,000 to $22,499 | 9 (0.8%) | 44 (3.7%) |
| $22,500 to $24,999 | 55 (4.7%) | 19 (1.6%) |
| $25,000 to $29,999 | 0 (0.0%) | 13 (1.1%) |
| $30,000 to $34,999 | 0 (0.0%) | 44 (3.7%) |
| $35,000 to $39,999 | 40 (3.4%) | 80 (6.7%) |
| $40,000 to $44,999 | 0 (0.0%) | 96 (8.1%) |
| $45,000 to $49,999 | 59 (5.0%) | 0 (0.0%) |
| $50,000 to $54,999 | 0 (0.0%) | 30 (2.5%) |
| $55,000 to $64,999 | 112 (9.5%) | 113 (9.5%) |
| $65,000 to $74,999 | 23 (1.9%) | 148 (12.4%) |
| $75,000 to $99,999 | 101 (8.6%) | 80 (6.7%) |
| $100,000+ | 486 (41.1%) | 180 (15.1%) |
| Total | 1,181 (100.0%) | 1,190 (100.0%) |
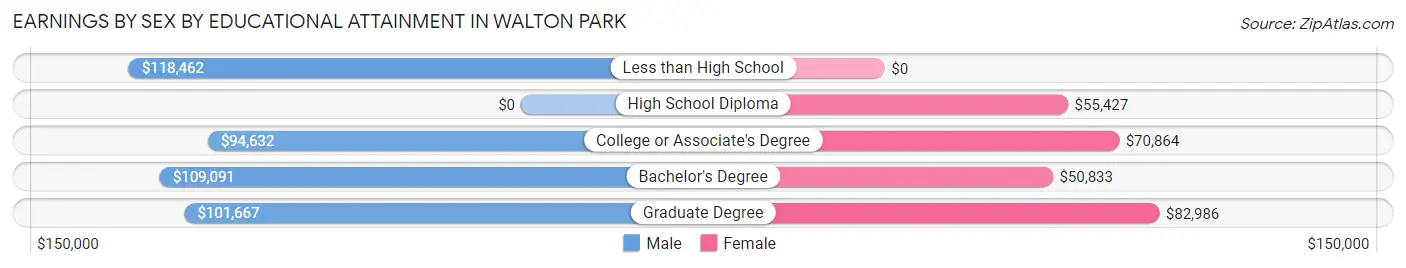
Earnings by Sex by Educational Attainment in Walton Park
Average earnings in Walton Park are $86,442 for men and $56,611 for women, a difference of 34.5%. Men with an educational attainment of less than high school enjoy the highest average annual earnings of $118,462, while those with college or associate's degree education earn the least with $94,632. Women with an educational attainment of graduate degree earn the most with the average annual earnings of $82,986, while those with bachelor's degree education have the smallest earnings of $50,833.
| Educational Attainment | Male Income | Female Income |
| Less than High School | $118,462 | $0 |
| High School Diploma | - | - |
| College or Associate's Degree | $94,632 | $70,864 |
| Bachelor's Degree | $109,091 | $50,833 |
| Graduate Degree | $101,667 | $82,986 |
| Total | $86,442 | $56,611 |
Family Income in Walton Park
Family Income Brackets in Walton Park
According to the Walton Park family income data, there are 280 families falling into the $50,000 to $74,999 income range, which is the most common income bracket and makes up 23.1% of all families.
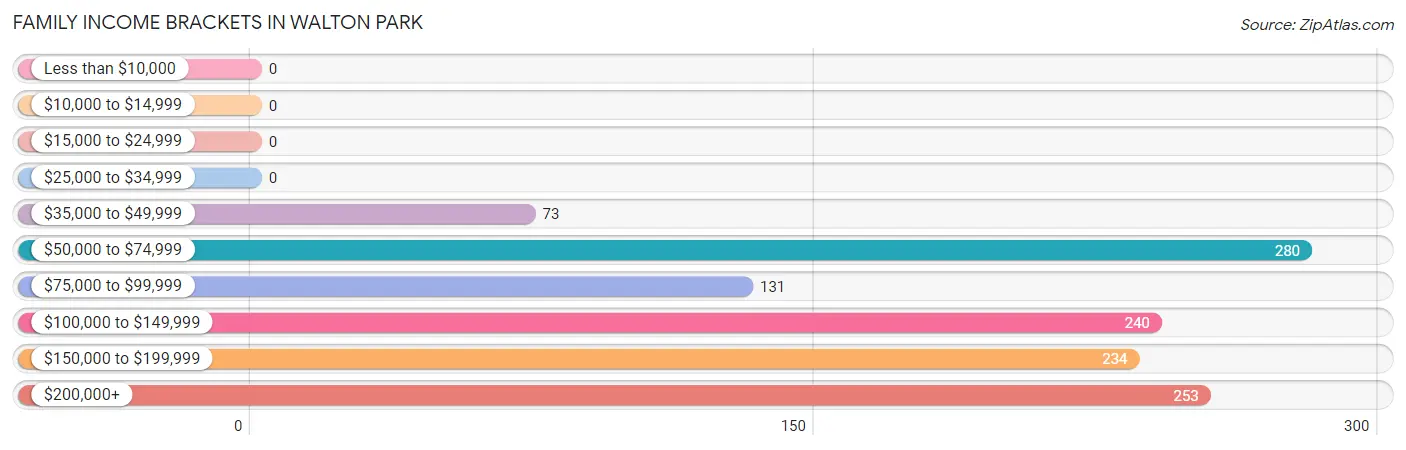
| Income Bracket | # Families | % Families |
| Less than $10,000 | 0 | 0.0% |
| $10,000 to $14,999 | 0 | 0.0% |
| $15,000 to $24,999 | 0 | 0.0% |
| $25,000 to $34,999 | 0 | 0.0% |
| $35,000 to $49,999 | 73 | 6.0% |
| $50,000 to $74,999 | 280 | 23.1% |
| $75,000 to $99,999 | 131 | 10.8% |
| $100,000 to $149,999 | 240 | 19.8% |
| $150,000 to $199,999 | 234 | 19.3% |
| $200,000+ | 253 | 20.9% |
Family Income by Famaliy Size in Walton Park
4-person families (176 | 14.5%) account for the highest median family income in Walton Park with $186,071 per family, while 2-person families (545 | 45.0%) have the highest median income of $61,292 per family member.
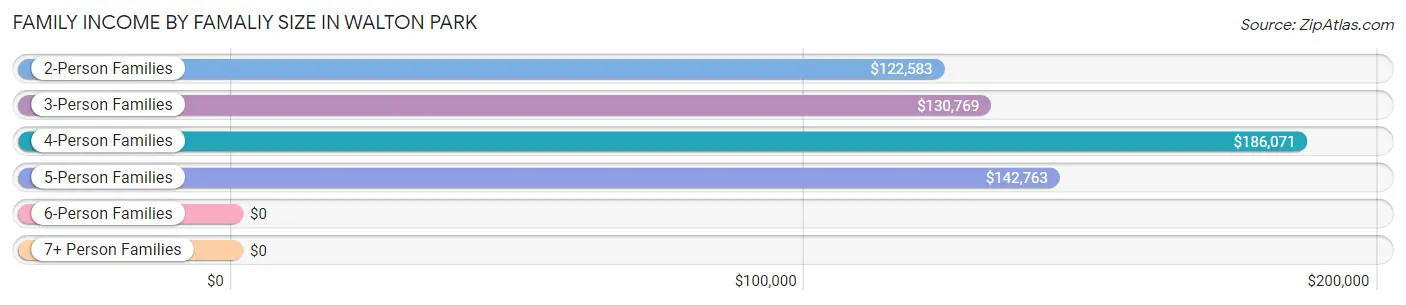
| Income Bracket | # Families | Median Income |
| 2-Person Families | 545 (45.0%) | $122,583 |
| 3-Person Families | 266 (22.0%) | $130,769 |
| 4-Person Families | 176 (14.5%) | $186,071 |
| 5-Person Families | 152 (12.6%) | $142,763 |
| 6-Person Families | 71 (5.9%) | $0 |
| 7+ Person Families | 0 (0.0%) | $0 |
| Total | 1,210 (100.0%) | $135,441 |
Family Income by Number of Earners in Walton Park
The median family income in Walton Park is $135,441, with families comprising 3+ earners (313) having the highest median family income of $186,138, while families with 1 earner (434) have the lowest median family income of $71,318, accounting for 25.9% and 35.9% of families, respectively.
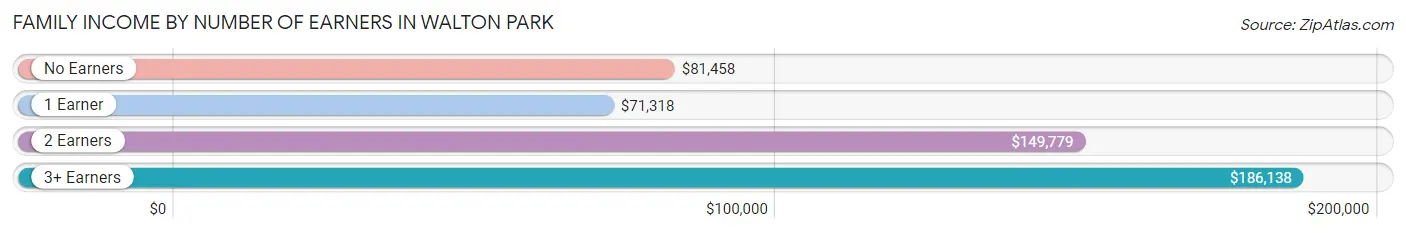
| Number of Earners | # Families | Median Income |
| No Earners | 182 (15.0%) | $81,458 |
| 1 Earner | 434 (35.9%) | $71,318 |
| 2 Earners | 281 (23.2%) | $149,779 |
| 3+ Earners | 313 (25.9%) | $186,138 |
| Total | 1,210 (100.0%) | $135,441 |
Household Income in Walton Park
Household Income Brackets in Walton Park
With 359 households falling in the category, the $100,000 to $149,999 income range is the most frequent in Walton Park, accounting for 24.2% of all households.
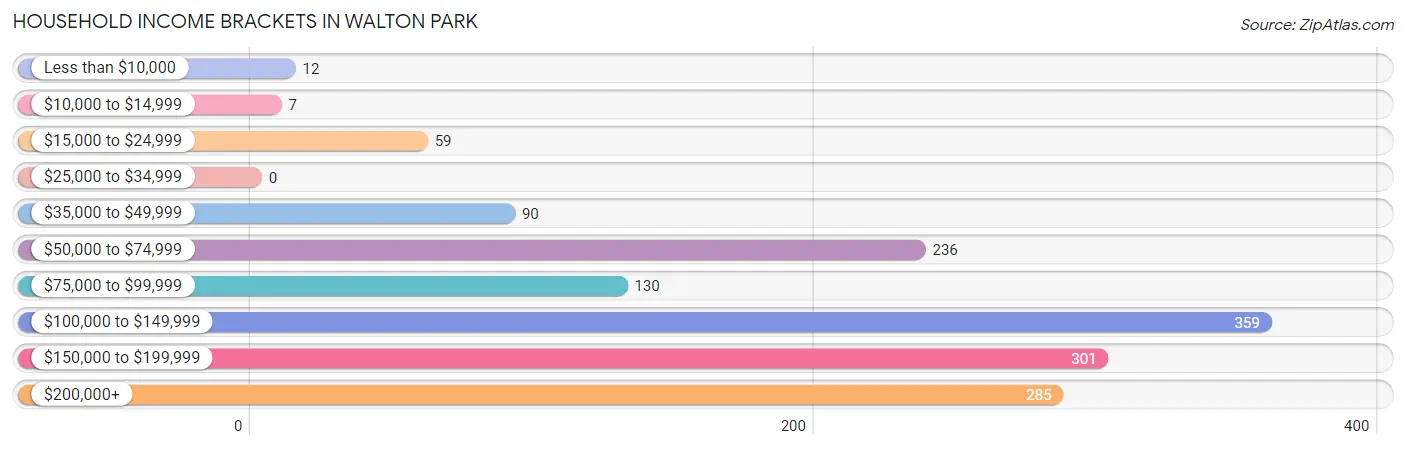
| Income Bracket | # Households | % Households |
| Less than $10,000 | 12 | 0.8% |
| $10,000 to $14,999 | 7 | 0.5% |
| $15,000 to $24,999 | 59 | 4.0% |
| $25,000 to $34,999 | 0 | 0.0% |
| $35,000 to $49,999 | 90 | 6.1% |
| $50,000 to $74,999 | 236 | 15.9% |
| $75,000 to $99,999 | 130 | 8.8% |
| $100,000 to $149,999 | 359 | 24.2% |
| $150,000 to $199,999 | 301 | 20.3% |
| $200,000+ | 285 | 19.2% |
Household Income by Householder Age in Walton Park
The median household income in Walton Park is $140,614, with the highest median household income of $148,088 found in the 45 to 64 years age bracket for the primary householder. A total of 682 households (46.0%) fall into this category.
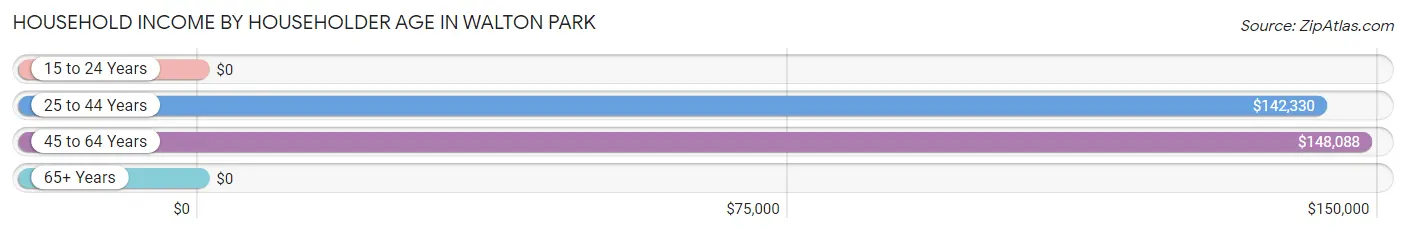
| Income Bracket | # Households | Median Income |
| 15 to 24 Years | 0 (0.0%) | $0 |
| 25 to 44 Years | 362 (24.4%) | $142,330 |
| 45 to 64 Years | 682 (46.0%) | $148,088 |
| 65+ Years | 438 (29.5%) | $0 |
| Total | 1,482 (100.0%) | $140,614 |
Poverty in Walton Park
Income Below Poverty by Sex and Age in Walton Park
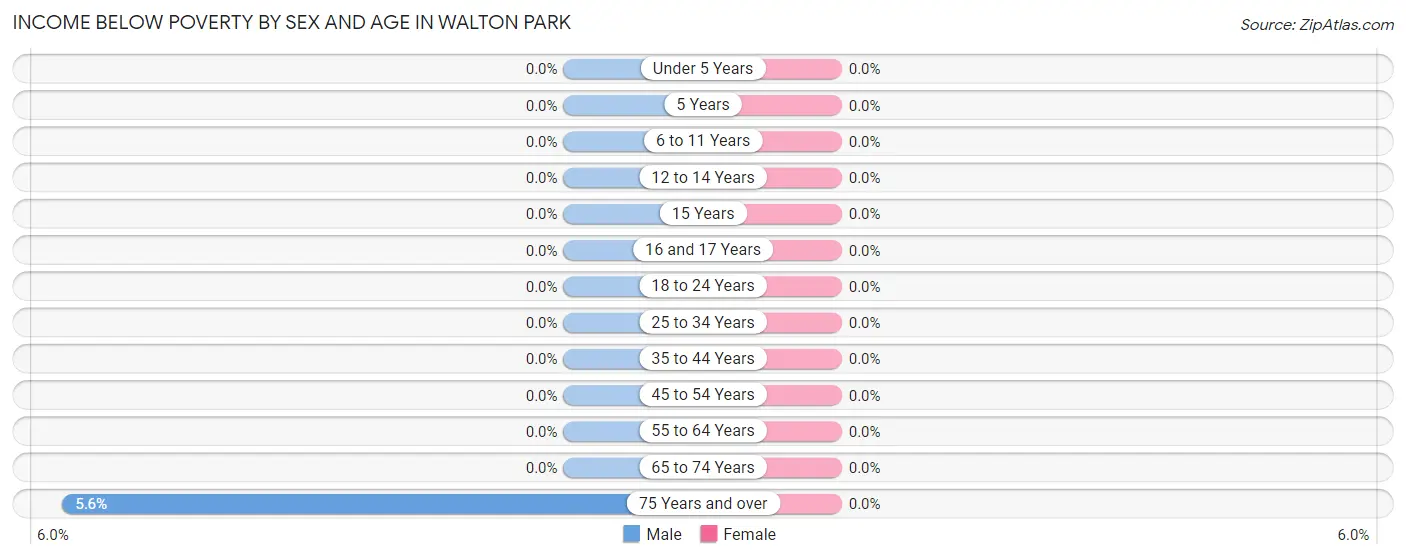
| Age Bracket | Male | Female |
| Under 5 Years | 0 (0.0%) | 0 (0.0%) |
| 5 Years | 0 (0.0%) | 0 (0.0%) |
| 6 to 11 Years | 0 (0.0%) | 0 (0.0%) |
| 12 to 14 Years | 0 (0.0%) | 0 (0.0%) |
| 15 Years | 0 (0.0%) | 0 (0.0%) |
| 16 and 17 Years | 0 (0.0%) | 0 (0.0%) |
| 18 to 24 Years | 0 (0.0%) | 0 (0.0%) |
| 25 to 34 Years | 0 (0.0%) | 0 (0.0%) |
| 35 to 44 Years | 0 (0.0%) | 0 (0.0%) |
| 45 to 54 Years | 0 (0.0%) | 0 (0.0%) |
| 55 to 64 Years | 0 (0.0%) | 0 (0.0%) |
| 65 to 74 Years | 0 (0.0%) | 0 (0.0%) |
| 75 Years and over | 12 (5.6%) | 0 (0.0%) |
| Total | 12 (0.6%) | 0 (0.0%) |
Income Above Poverty by Sex and Age in Walton Park
According to the poverty statistics in Walton Park, males aged under 5 years and females aged under 5 years are the age groups that are most secure financially, with 100.0% of males and 100.0% of females in these age groups living above the poverty line.
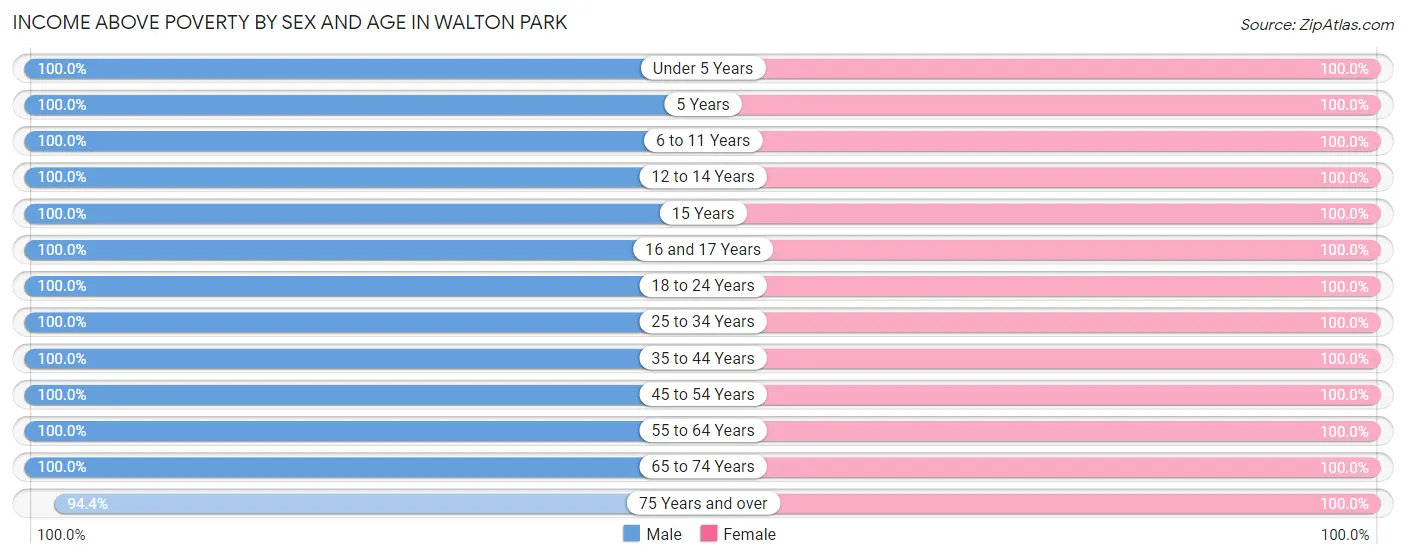
| Age Bracket | Male | Female |
| Under 5 Years | 136 (100.0%) | 18 (100.0%) |
| 5 Years | 19 (100.0%) | 68 (100.0%) |
| 6 to 11 Years | 176 (100.0%) | 136 (100.0%) |
| 12 to 14 Years | 45 (100.0%) | 91 (100.0%) |
| 15 Years | 13 (100.0%) | 33 (100.0%) |
| 16 and 17 Years | 22 (100.0%) | 150 (100.0%) |
| 18 to 24 Years | 132 (100.0%) | 143 (100.0%) |
| 25 to 34 Years | 239 (100.0%) | 178 (100.0%) |
| 35 to 44 Years | 238 (100.0%) | 227 (100.0%) |
| 45 to 54 Years | 315 (100.0%) | 238 (100.0%) |
| 55 to 64 Years | 257 (100.0%) | 289 (100.0%) |
| 65 to 74 Years | 247 (100.0%) | 376 (100.0%) |
| 75 Years and over | 203 (94.4%) | 138 (100.0%) |
| Total | 2,042 (99.4%) | 2,085 (100.0%) |
Income Below Poverty Among Married-Couple Families in Walton Park
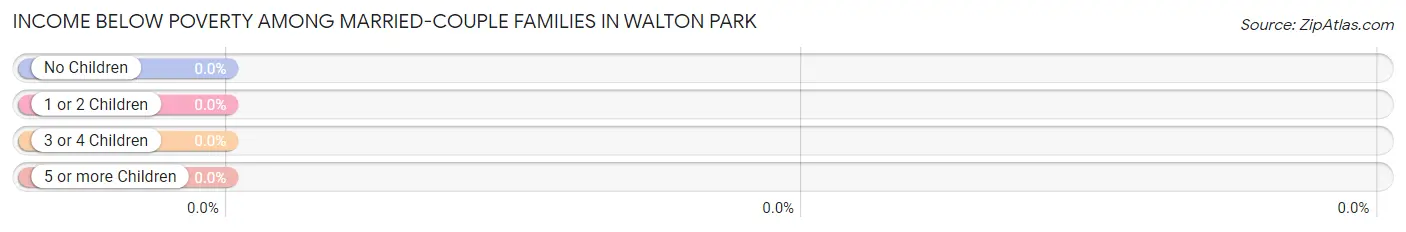
| Children | Above Poverty | Below Poverty |
| No Children | 541 (100.0%) | 0 (0.0%) |
| 1 or 2 Children | 290 (100.0%) | 0 (0.0%) |
| 3 or 4 Children | 48 (100.0%) | 0 (0.0%) |
| 5 or more Children | 0 (0.0%) | 0 (0.0%) |
| Total | 879 (100.0%) | 0 (0.0%) |
Income Below Poverty Among Single-Parent Households in Walton Park
| Children | Single Father | Single Mother |
| No Children | 0 (0.0%) | 0 (0.0%) |
| 1 or 2 Children | 0 (0.0%) | 0 (0.0%) |
| 3 or 4 Children | 0 (0.0%) | 0 (0.0%) |
| 5 or more Children | 0 (0.0%) | 0 (0.0%) |
| Total | 0 (0.0%) | 0 (0.0%) |
Income Below Poverty Among Married-Couple vs Single-Parent Households in Walton Park
| Children | Married-Couple Families | Single-Parent Households |
| No Children | 0 (0.0%) | 0 (0.0%) |
| 1 or 2 Children | 0 (0.0%) | 0 (0.0%) |
| 3 or 4 Children | 0 (0.0%) | 0 (0.0%) |
| 5 or more Children | 0 (0.0%) | 0 (0.0%) |
| Total | 0 (0.0%) | 0 (0.0%) |
Race in Walton Park
The most populous races in Walton Park are White / Caucasian (2,630 | 63.5%), Hispanic or Latino (1,305 | 31.5%), and Two or more Races (578 | 14.0%).
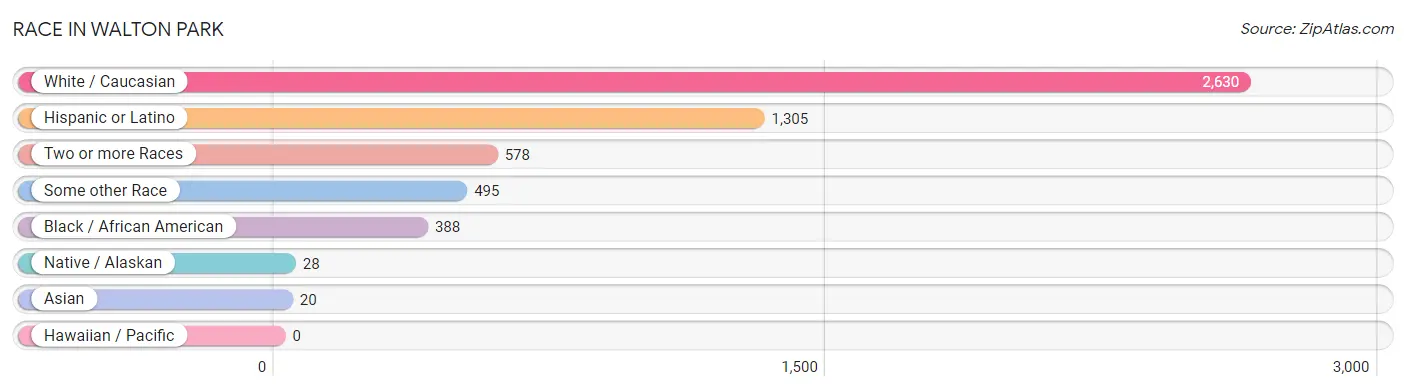
| Race | # Population | % Population |
| Asian | 20 | 0.5% |
| Black / African American | 388 | 9.4% |
| Hawaiian / Pacific | 0 | 0.0% |
| Hispanic or Latino | 1,305 | 31.5% |
| Native / Alaskan | 28 | 0.7% |
| White / Caucasian | 2,630 | 63.5% |
| Two or more Races | 578 | 14.0% |
| Some other Race | 495 | 12.0% |
| Total | 4,139 | 100.0% |
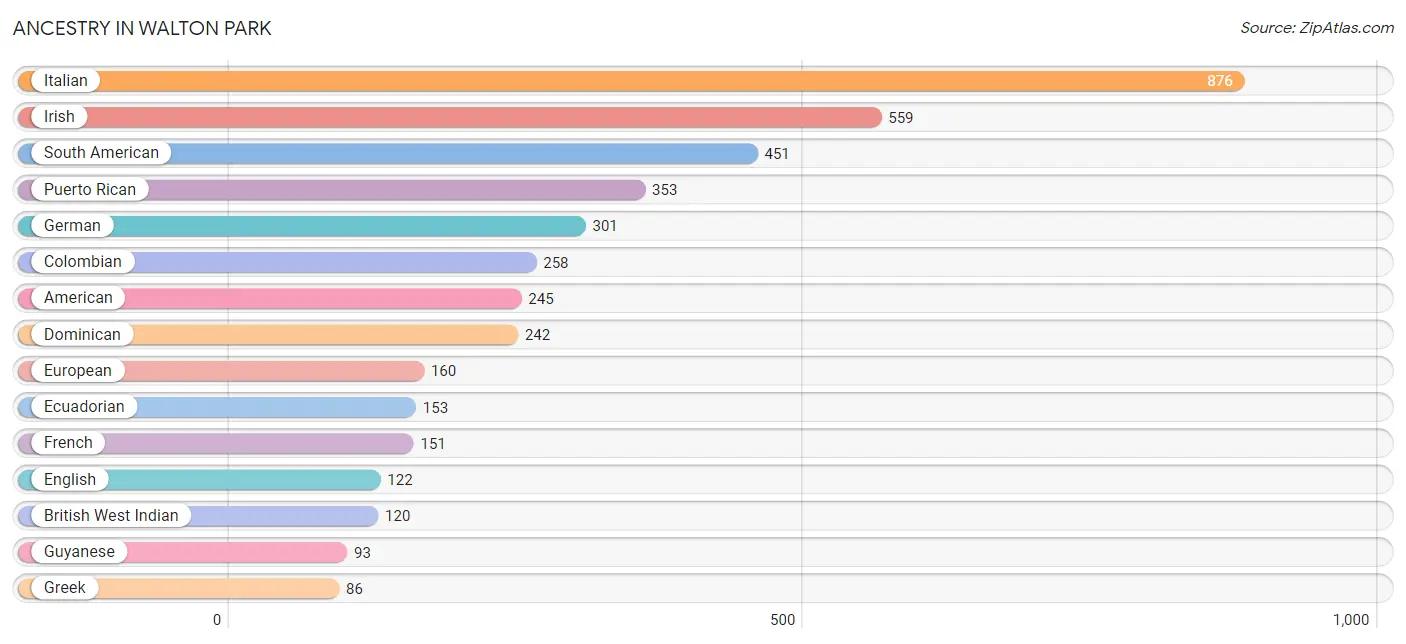
Ancestry in Walton Park
The most populous ancestries reported in Walton Park are Italian (876 | 21.2%), Irish (559 | 13.5%), South American (451 | 10.9%), Puerto Rican (353 | 8.5%), and German (301 | 7.3%), together accounting for 61.4% of all Walton Park residents.
| Ancestry | # Population | % Population |
| Albanian | 11 | 0.3% |
| American | 245 | 5.9% |
| Arab | 13 | 0.3% |
| Armenian | 13 | 0.3% |
| Bolivian | 22 | 0.5% |
| British | 12 | 0.3% |
| British West Indian | 120 | 2.9% |
| Central American Indian | 54 | 1.3% |
| Chilean | 18 | 0.4% |
| Colombian | 258 | 6.2% |
| Cuban | 37 | 0.9% |
| Czech | 11 | 0.3% |
| Danish | 13 | 0.3% |
| Dominican | 242 | 5.9% |
| Dutch | 18 | 0.4% |
| Ecuadorian | 153 | 3.7% |
| English | 122 | 2.9% |
| European | 160 | 3.9% |
| Finnish | 9 | 0.2% |
| French | 151 | 3.6% |
| French Canadian | 15 | 0.4% |
| German | 301 | 7.3% |
| Greek | 86 | 2.1% |
| Guyanese | 93 | 2.2% |
| Indian (Asian) | 50 | 1.2% |
| Irish | 559 | 13.5% |
| Italian | 876 | 21.2% |
| Jamaican | 59 | 1.4% |
| Mexican | 33 | 0.8% |
| Mexican American Indian | 22 | 0.5% |
| Navajo | 20 | 0.5% |
| Nigerian | 41 | 1.0% |
| Norwegian | 30 | 0.7% |
| Polish | 75 | 1.8% |
| Puerto Rican | 353 | 8.5% |
| Russian | 10 | 0.2% |
| Scotch-Irish | 11 | 0.3% |
| Scottish | 59 | 1.4% |
| South American | 451 | 10.9% |
| South American Indian | 22 | 0.5% |
| Spaniard | 75 | 1.8% |
| Subsaharan African | 70 | 1.7% |
| Swedish | 35 | 0.9% |
| Swiss | 11 | 0.3% |
| Syrian | 13 | 0.3% |
| Ukrainian | 11 | 0.3% | View All 46 Rows |
Immigrants in Walton Park
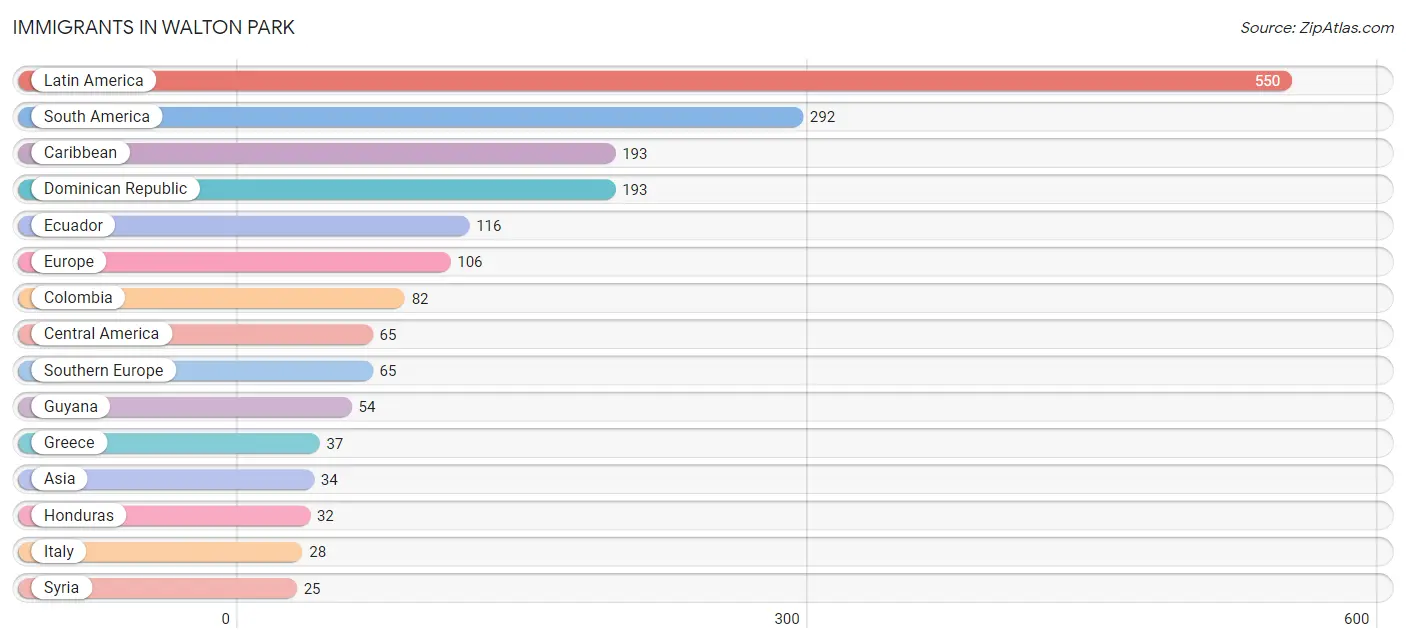
The most numerous immigrant groups reported in Walton Park came from Latin America (550 | 13.3%), South America (292 | 7.0%), Caribbean (193 | 4.7%), Dominican Republic (193 | 4.7%), and Ecuador (116 | 2.8%), together accounting for 32.5% of all Walton Park residents.
| Immigration Origin | # Population | % Population |
| Asia | 34 | 0.8% |
| Bolivia | 22 | 0.5% |
| Caribbean | 193 | 4.7% |
| Central America | 65 | 1.6% |
| Chile | 18 | 0.4% |
| China | 9 | 0.2% |
| Colombia | 82 | 2.0% |
| Dominican Republic | 193 | 4.7% |
| Eastern Asia | 9 | 0.2% |
| Eastern Europe | 24 | 0.6% |
| Ecuador | 116 | 2.8% |
| Europe | 106 | 2.6% |
| Greece | 37 | 0.9% |
| Guyana | 54 | 1.3% |
| Honduras | 32 | 0.8% |
| Hong Kong | 9 | 0.2% |
| Italy | 28 | 0.7% |
| Latin America | 550 | 13.3% |
| Mexico | 17 | 0.4% |
| Netherlands | 5 | 0.1% |
| Northern Europe | 12 | 0.3% |
| Panama | 16 | 0.4% |
| Poland | 24 | 0.6% |
| South America | 292 | 7.0% |
| Southern Europe | 65 | 1.6% |
| Sweden | 12 | 0.3% |
| Syria | 25 | 0.6% |
| Western Asia | 25 | 0.6% |
| Western Europe | 5 | 0.1% | View All 29 Rows |
Sex and Age in Walton Park
Sex and Age in Walton Park
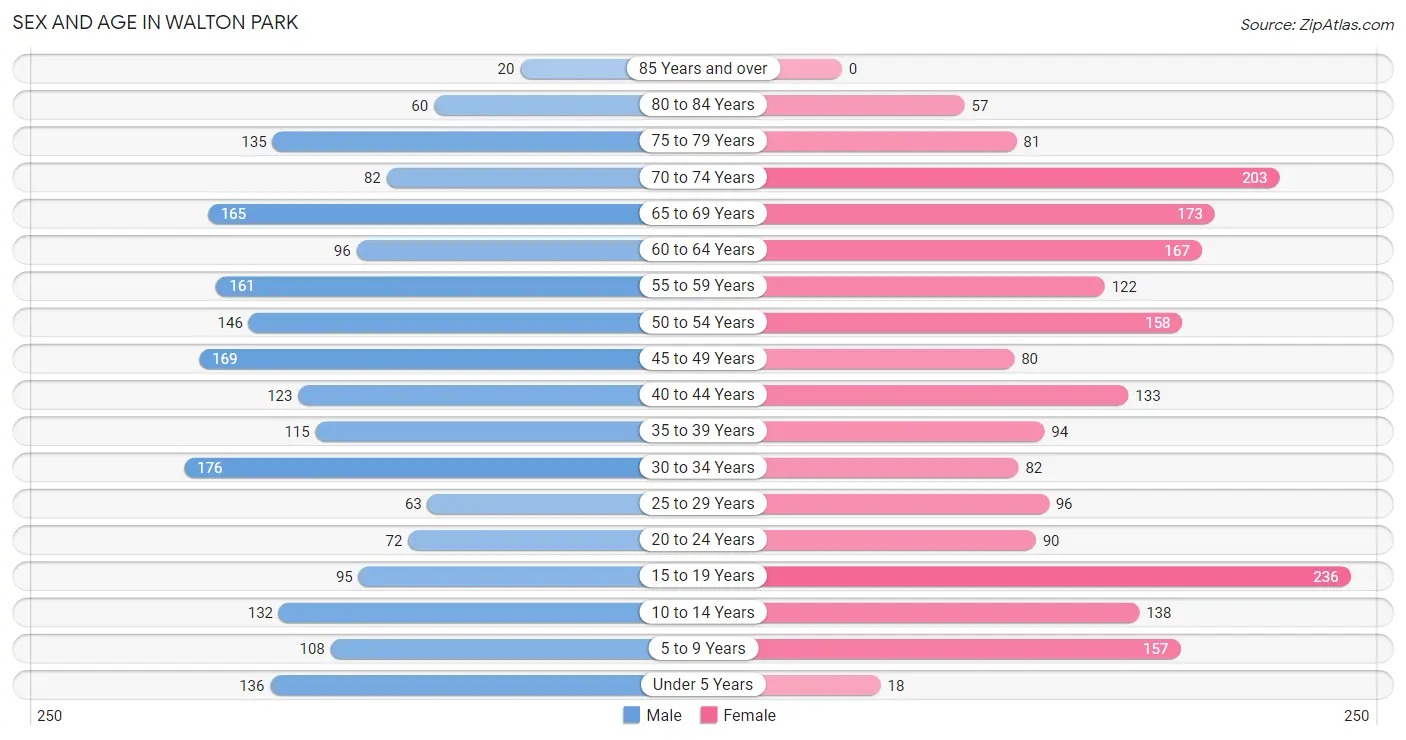
The most populous age groups in Walton Park are 30 to 34 Years (176 | 8.6%) for men and 15 to 19 Years (236 | 11.3%) for women.
| Age Bracket | Male | Female |
| Under 5 Years | 136 (6.6%) | 18 (0.9%) |
| 5 to 9 Years | 108 (5.3%) | 157 (7.5%) |
| 10 to 14 Years | 132 (6.4%) | 138 (6.6%) |
| 15 to 19 Years | 95 (4.6%) | 236 (11.3%) |
| 20 to 24 Years | 72 (3.5%) | 90 (4.3%) |
| 25 to 29 Years | 63 (3.1%) | 96 (4.6%) |
| 30 to 34 Years | 176 (8.6%) | 82 (3.9%) |
| 35 to 39 Years | 115 (5.6%) | 94 (4.5%) |
| 40 to 44 Years | 123 (6.0%) | 133 (6.4%) |
| 45 to 49 Years | 169 (8.2%) | 80 (3.8%) |
| 50 to 54 Years | 146 (7.1%) | 158 (7.6%) |
| 55 to 59 Years | 161 (7.8%) | 122 (5.9%) |
| 60 to 64 Years | 96 (4.7%) | 167 (8.0%) |
| 65 to 69 Years | 165 (8.0%) | 173 (8.3%) |
| 70 to 74 Years | 82 (4.0%) | 203 (9.7%) |
| 75 to 79 Years | 135 (6.6%) | 81 (3.9%) |
| 80 to 84 Years | 60 (2.9%) | 57 (2.7%) |
| 85 Years and over | 20 (1.0%) | 0 (0.0%) |
| Total | 2,054 (100.0%) | 2,085 (100.0%) |
Families and Households in Walton Park
Median Family Size in Walton Park
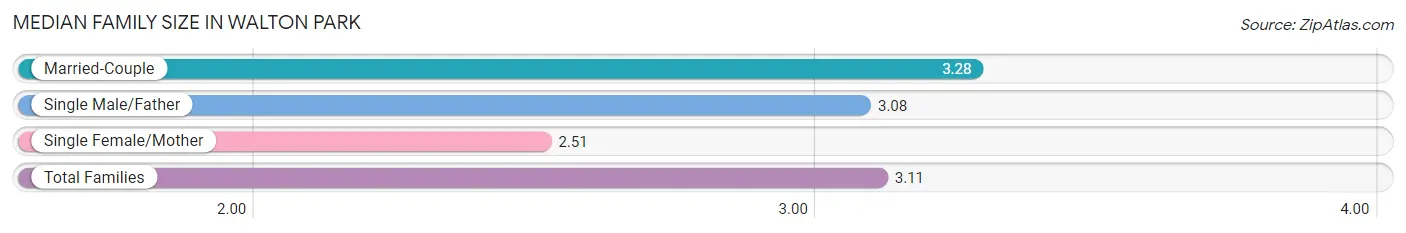
The median family size in Walton Park is 3.11 persons per family, with married-couple families (879 | 72.6%) accounting for the largest median family size of 3.28 persons per family. On the other hand, single female/mother families (258 | 21.3%) represent the smallest median family size with 2.51 persons per family.
| Family Type | # Families | Family Size |
| Married-Couple | 879 (72.6%) | 3.28 |
| Single Male/Father | 73 (6.0%) | 3.08 |
| Single Female/Mother | 258 (21.3%) | 2.51 |
| Total Families | 1,210 (100.0%) | 3.11 |
Median Household Size in Walton Park
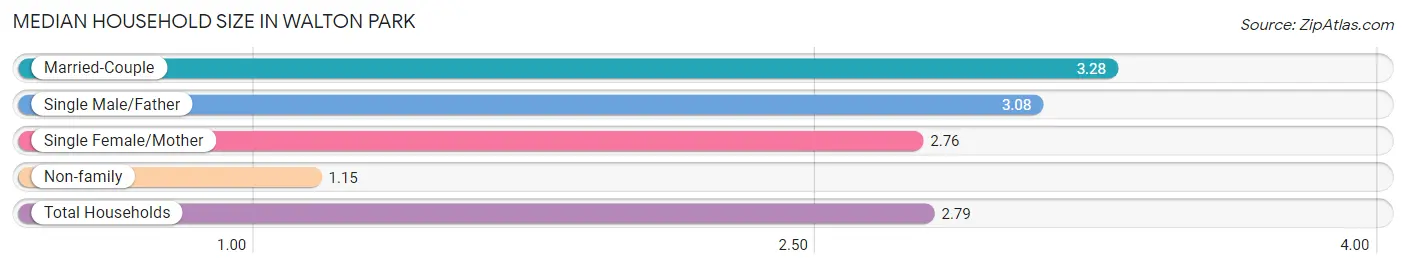
The median household size in Walton Park is 2.79 persons per household, with married-couple households (879 | 59.3%) accounting for the largest median household size of 3.28 persons per household. non-family households (272 | 18.3%) represent the smallest median household size with 1.15 persons per household.
| Household Type | # Households | Household Size |
| Married-Couple | 879 (59.3%) | 3.28 |
| Single Male/Father | 73 (4.9%) | 3.08 |
| Single Female/Mother | 258 (17.4%) | 2.76 |
| Non-family | 272 (18.3%) | 1.15 |
| Total Households | 1,482 (100.0%) | 2.79 |
Household Size by Marriage Status in Walton Park
Out of a total of 1,482 households in Walton Park, 1,210 (81.7%) are family households, while 272 (18.3%) are nonfamily households. The most numerous type of family households are 2-person households, comprising 545, and the most common type of nonfamily households are 1-person households, comprising 228.
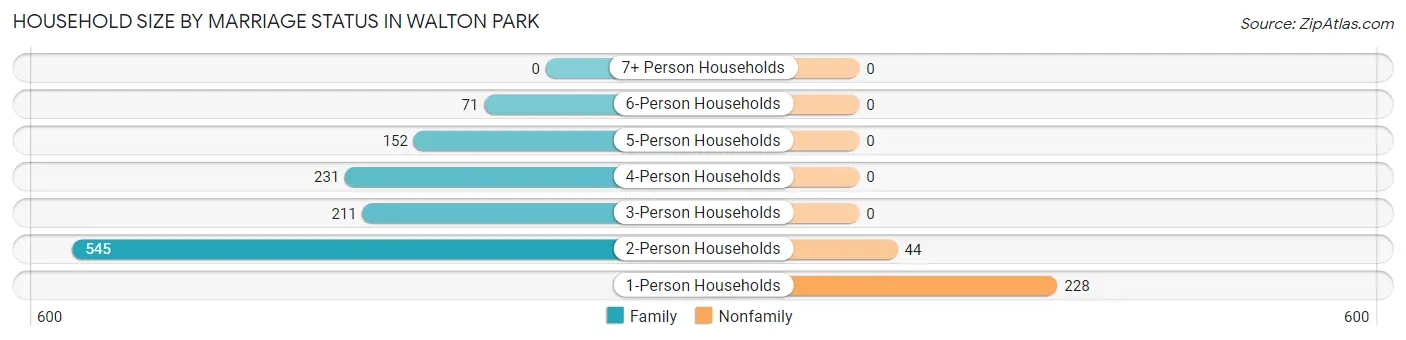
| Household Size | Family Households | Nonfamily Households |
| 1-Person Households | - | 228 (15.4%) |
| 2-Person Households | 545 (36.8%) | 44 (3.0%) |
| 3-Person Households | 211 (14.2%) | 0 (0.0%) |
| 4-Person Households | 231 (15.6%) | 0 (0.0%) |
| 5-Person Households | 152 (10.3%) | 0 (0.0%) |
| 6-Person Households | 71 (4.8%) | 0 (0.0%) |
| 7+ Person Households | 0 (0.0%) | 0 (0.0%) |
| Total | 1,210 (81.7%) | 272 (18.3%) |
Female Fertility in Walton Park
Fertility by Age in Walton Park
| Age Bracket | Women with Births | Births / 1,000 Women |
| 15 to 19 years | 0 (0.0%) | 0.0 |
| 20 to 34 years | 0 (0.0%) | 0.0 |
| 35 to 50 years | 0 (0.0%) | 0.0 |
| Total | 0 (0.0%) | 0.0 |
Fertility by Age by Marriage Status in Walton Park
| Age Bracket | Married | Unmarried |
| 15 to 19 years | 0 (0.0%) | 0 (0.0%) |
| 20 to 34 years | 0 (0.0%) | 0 (0.0%) |
| 35 to 50 years | 0 (0.0%) | 0 (0.0%) |
| Total | 0 (0.0%) | 0 (0.0%) |
Fertility by Education in Walton Park
| Educational Attainment | Women with Births | Births / 1,000 Women |
| Less than High School | 0 (0.0%) | 0.0 |
| High School Diploma | 0 (0.0%) | 0.0 |
| College or Associate's Degree | 0 (0.0%) | 0.0 |
| Bachelor's Degree | 0 (0.0%) | 0.0 |
| Graduate Degree | 0 (0.0%) | 0.0 |
| Total | 0 (0.0%) | 0.0 |
Fertility by Education by Marriage Status in Walton Park
| Educational Attainment | Married | Unmarried |
| Less than High School | 0 (0.0%) | 0 (0.0%) |
| High School Diploma | 0 (0.0%) | 0 (0.0%) |
| College or Associate's Degree | 0 (0.0%) | 0 (0.0%) |
| Bachelor's Degree | 0 (0.0%) | 0 (0.0%) |
| Graduate Degree | 0 (0.0%) | 0 (0.0%) |
| Total | 0 (0.0%) | 0 (0.0%) |
Employment Characteristics in Walton Park
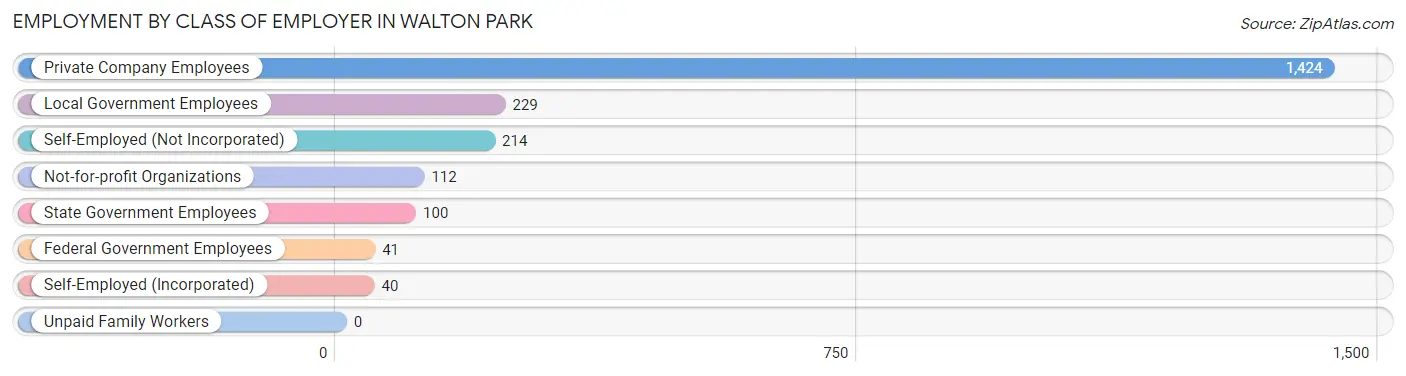
Employment by Class of Employer in Walton Park
Among the 2,160 employed individuals in Walton Park, private company employees (1,424 | 65.9%), local government employees (229 | 10.6%), and self-employed (not incorporated) (214 | 9.9%) make up the most common classes of employment.
| Employer Class | # Employees | % Employees |
| Private Company Employees | 1,424 | 65.9% |
| Self-Employed (Incorporated) | 40 | 1.8% |
| Self-Employed (Not Incorporated) | 214 | 9.9% |
| Not-for-profit Organizations | 112 | 5.2% |
| Local Government Employees | 229 | 10.6% |
| State Government Employees | 100 | 4.6% |
| Federal Government Employees | 41 | 1.9% |
| Unpaid Family Workers | 0 | 0.0% |
| Total | 2,160 | 100.0% |
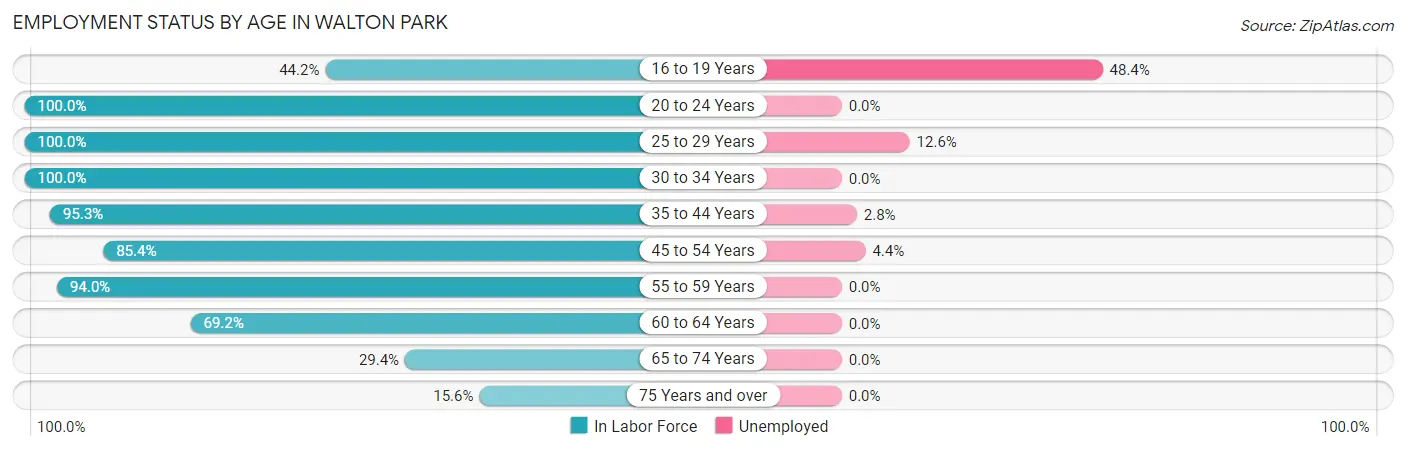
Employment Status by Age in Walton Park
According to the labor force statistics for Walton Park, out of the total population over 16 years of age (3,404), 67.7% or 2,305 individuals are in the labor force, with 5.0% or 115 of them unemployed. The age group with the highest labor force participation rate is 20 to 24 years, with 100.0% or 162 individuals in the labor force. Within the labor force, the 16 to 19 years age range has the highest percentage of unemployed individuals, with 48.4% or 61 of them being unemployed.
| Age Bracket | In Labor Force | Unemployed |
| 16 to 19 Years | 126 (44.2%) | 61 (48.4%) |
| 20 to 24 Years | 162 (100.0%) | 0 (0.0%) |
| 25 to 29 Years | 159 (100.0%) | 20 (12.6%) |
| 30 to 34 Years | 258 (100.0%) | 0 (0.0%) |
| 35 to 44 Years | 443 (95.3%) | 12 (2.8%) |
| 45 to 54 Years | 472 (85.4%) | 21 (4.4%) |
| 55 to 59 Years | 266 (94.0%) | 0 (0.0%) |
| 60 to 64 Years | 182 (69.2%) | 0 (0.0%) |
| 65 to 74 Years | 183 (29.4%) | 0 (0.0%) |
| 75 Years and over | 55 (15.6%) | 0 (0.0%) |
| Total | 2,305 (67.7%) | 115 (5.0%) |
Employment Status by Educational Attainment in Walton Park
According to labor force statistics for Walton Park, 89.9% of individuals (1,781) out of the total population between 25 and 64 years of age (1,981) are in the labor force, with 3.0% or 53 of them being unemployed. The group with the highest labor force participation rate are those with the educational attainment of less than high school, with 100.0% or 60 individuals in the labor force. Within the labor force, individuals with high school diploma education have the highest percentage of unemployment, with 7.8% or 33 of them being unemployed.
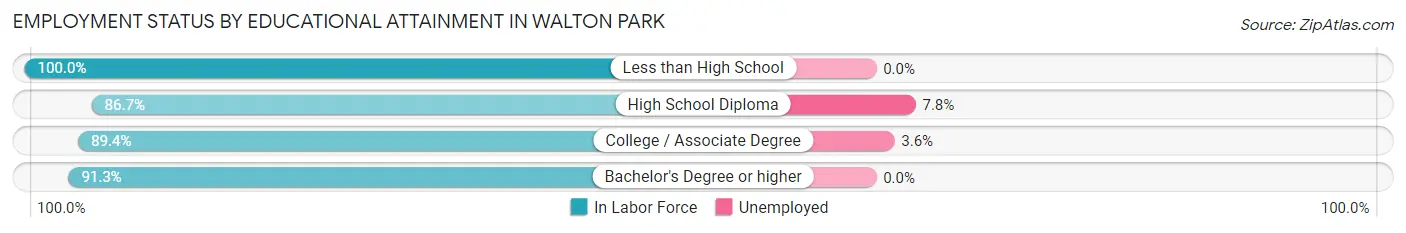
| Educational Attainment | In Labor Force | Unemployed |
| Less than High School | 60 (100.0%) | 0 (0.0%) |
| High School Diploma | 425 (86.7%) | 38 (7.8%) |
| College / Associate Degree | 558 (89.4%) | 22 (3.6%) |
| Bachelor's Degree or higher | 737 (91.3%) | 0 (0.0%) |
| Total | 1,781 (89.9%) | 59 (3.0%) |
Employment Occupations by Sex in Walton Park
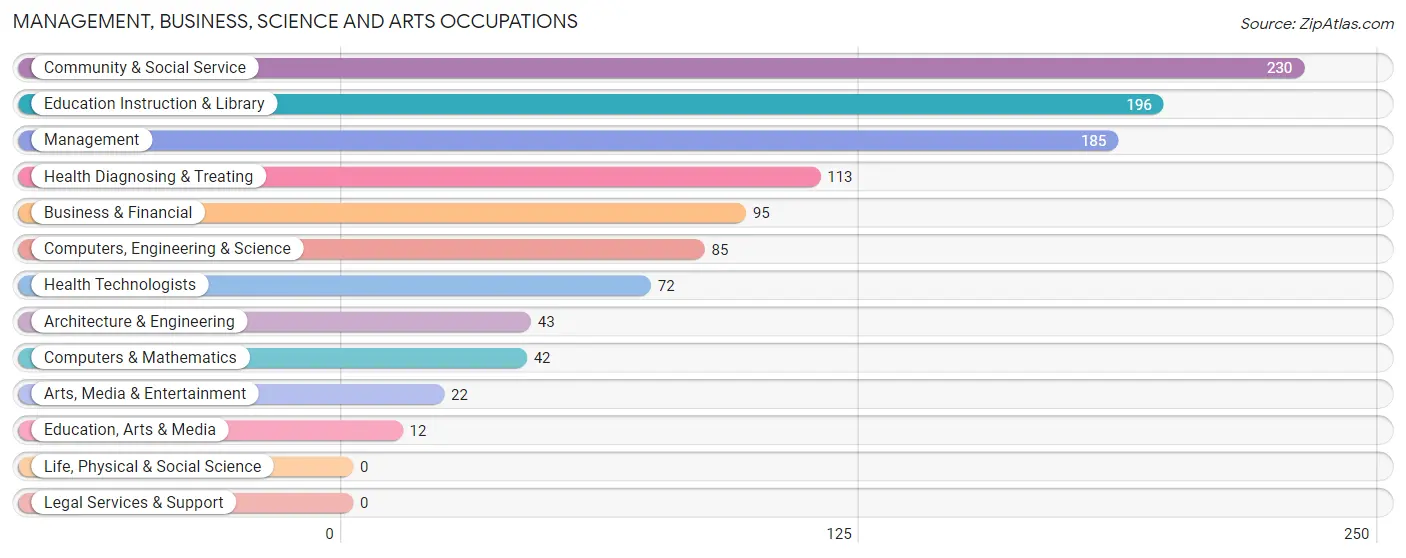
Management, Business, Science and Arts Occupations
The most common Management, Business, Science and Arts occupations in Walton Park are Community & Social Service (230 | 10.6%), Education Instruction & Library (196 | 9.0%), Management (185 | 8.5%), Health Diagnosing & Treating (113 | 5.2%), and Business & Financial (95 | 4.4%).
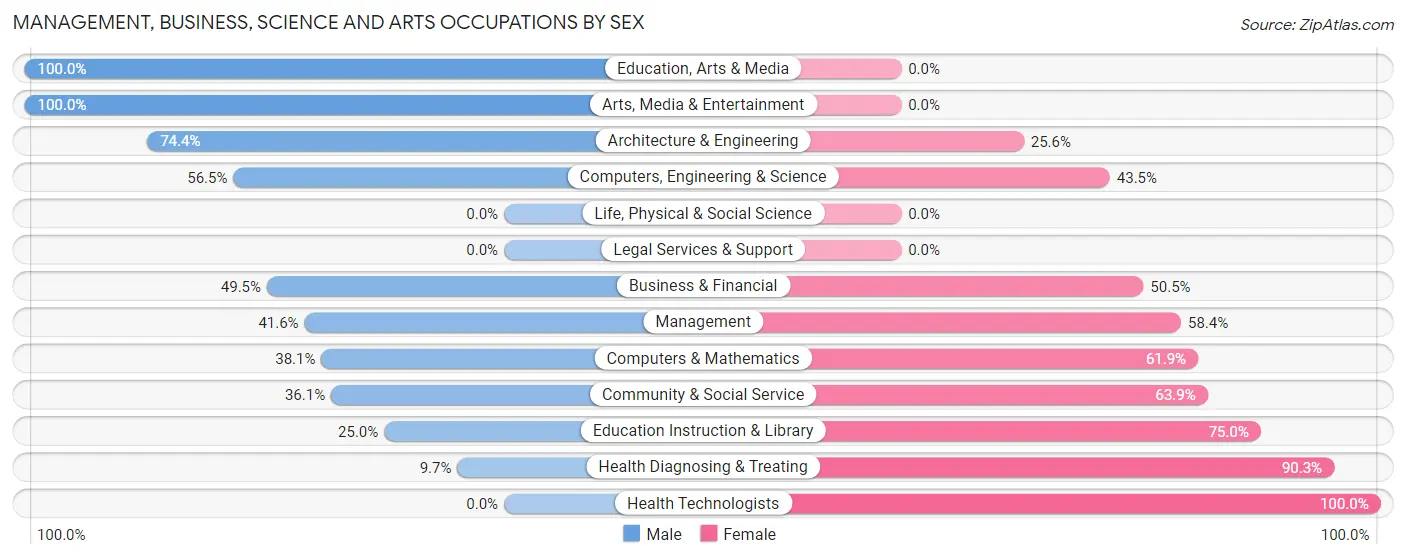
Management, Business, Science and Arts Occupations by Sex
Within the Management, Business, Science and Arts occupations in Walton Park, the most male-oriented occupations are Education, Arts & Media (100.0%), Arts, Media & Entertainment (100.0%), and Architecture & Engineering (74.4%), while the most female-oriented occupations are Health Technologists (100.0%), Health Diagnosing & Treating (90.3%), and Education Instruction & Library (75.0%).
| Occupation | Male | Female |
| Management | 77 (41.6%) | 108 (58.4%) |
| Business & Financial | 47 (49.5%) | 48 (50.5%) |
| Computers, Engineering & Science | 48 (56.5%) | 37 (43.5%) |
| Computers & Mathematics | 16 (38.1%) | 26 (61.9%) |
| Architecture & Engineering | 32 (74.4%) | 11 (25.6%) |
| Life, Physical & Social Science | 0 (0.0%) | 0 (0.0%) |
| Community & Social Service | 83 (36.1%) | 147 (63.9%) |
| Education, Arts & Media | 12 (100.0%) | 0 (0.0%) |
| Legal Services & Support | 0 (0.0%) | 0 (0.0%) |
| Education Instruction & Library | 49 (25.0%) | 147 (75.0%) |
| Arts, Media & Entertainment | 22 (100.0%) | 0 (0.0%) |
| Health Diagnosing & Treating | 11 (9.7%) | 102 (90.3%) |
| Health Technologists | 0 (0.0%) | 72 (100.0%) |
| Total (Category) | 266 (37.6%) | 442 (62.4%) |
| Total (Overall) | 1,090 (50.1%) | 1,084 (49.9%) |
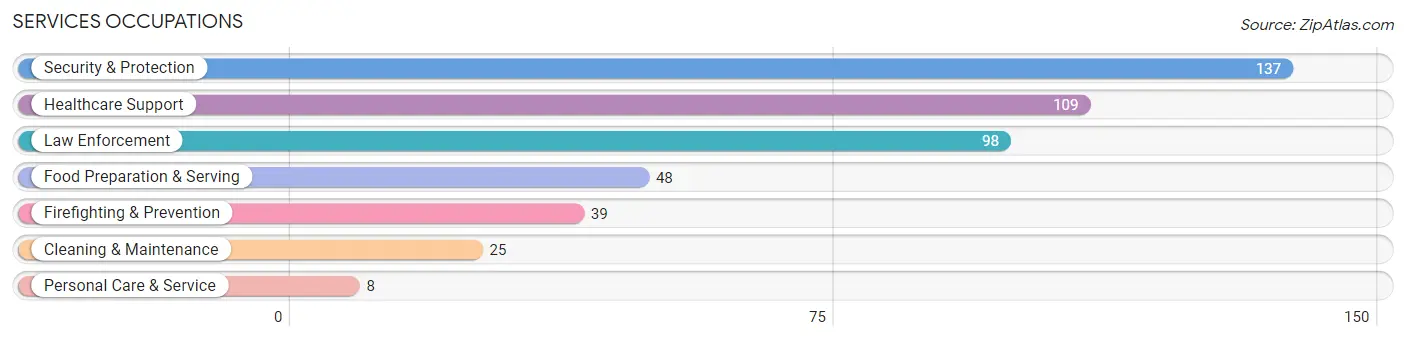
Services Occupations
The most common Services occupations in Walton Park are Security & Protection (137 | 6.3%), Healthcare Support (109 | 5.0%), Law Enforcement (98 | 4.5%), Food Preparation & Serving (48 | 2.2%), and Firefighting & Prevention (39 | 1.8%).
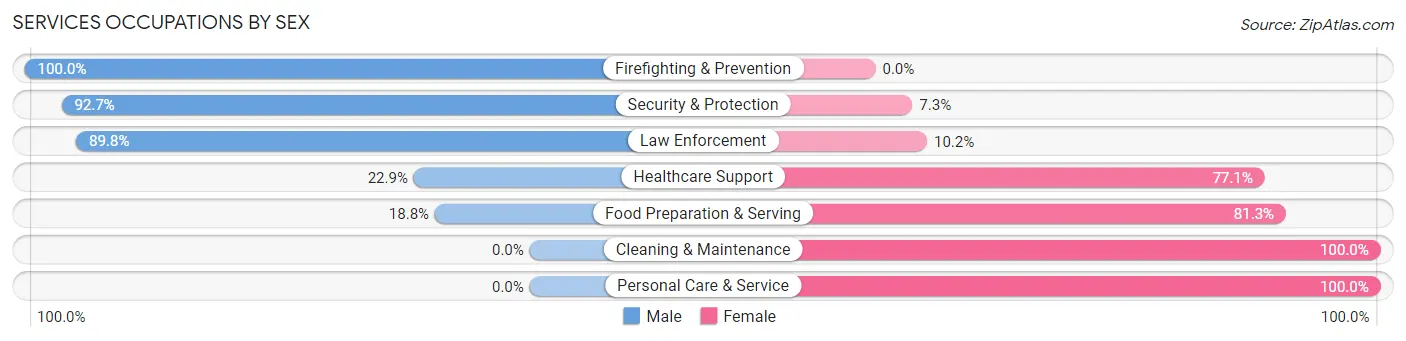
Services Occupations by Sex
Within the Services occupations in Walton Park, the most male-oriented occupations are Firefighting & Prevention (100.0%), Security & Protection (92.7%), and Law Enforcement (89.8%), while the most female-oriented occupations are Cleaning & Maintenance (100.0%), Personal Care & Service (100.0%), and Food Preparation & Serving (81.2%).
| Occupation | Male | Female |
| Healthcare Support | 25 (22.9%) | 84 (77.1%) |
| Security & Protection | 127 (92.7%) | 10 (7.3%) |
| Firefighting & Prevention | 39 (100.0%) | 0 (0.0%) |
| Law Enforcement | 88 (89.8%) | 10 (10.2%) |
| Food Preparation & Serving | 9 (18.8%) | 39 (81.2%) |
| Cleaning & Maintenance | 0 (0.0%) | 25 (100.0%) |
| Personal Care & Service | 0 (0.0%) | 8 (100.0%) |
| Total (Category) | 161 (49.2%) | 166 (50.8%) |
| Total (Overall) | 1,090 (50.1%) | 1,084 (49.9%) |
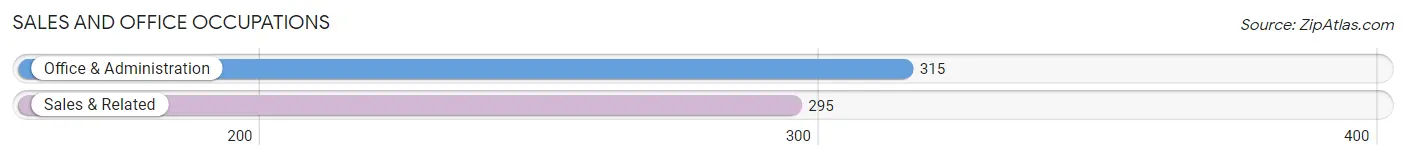
Sales and Office Occupations
The most common Sales and Office occupations in Walton Park are Office & Administration (315 | 14.5%), and Sales & Related (295 | 13.6%).
Sales and Office Occupations by Sex
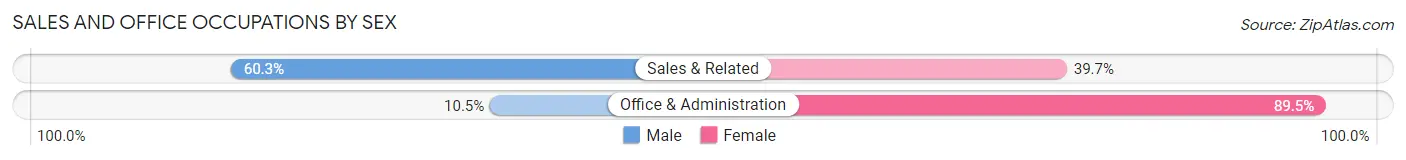
| Occupation | Male | Female |
| Sales & Related | 178 (60.3%) | 117 (39.7%) |
| Office & Administration | 33 (10.5%) | 282 (89.5%) |
| Total (Category) | 211 (34.6%) | 399 (65.4%) |
| Total (Overall) | 1,090 (50.1%) | 1,084 (49.9%) |
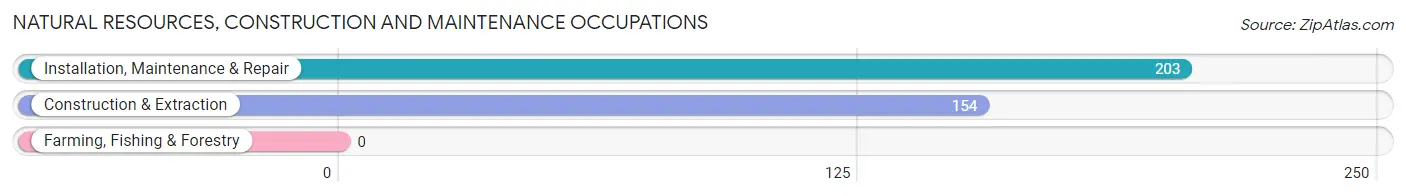
Natural Resources, Construction and Maintenance Occupations
The most common Natural Resources, Construction and Maintenance occupations in Walton Park are Installation, Maintenance & Repair (203 | 9.3%), and Construction & Extraction (154 | 7.1%).
Natural Resources, Construction and Maintenance Occupations by Sex
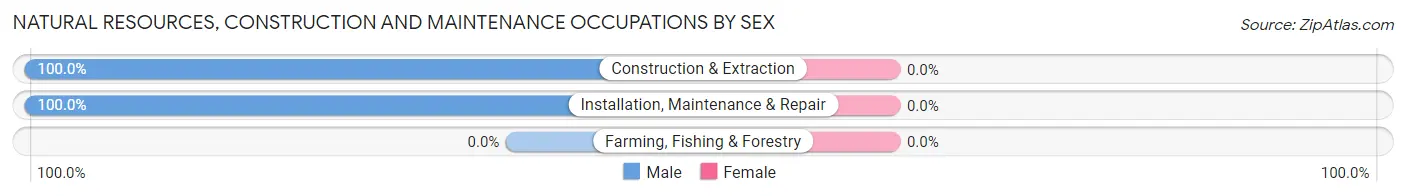
| Occupation | Male | Female |
| Farming, Fishing & Forestry | 0 (0.0%) | 0 (0.0%) |
| Construction & Extraction | 154 (100.0%) | 0 (0.0%) |
| Installation, Maintenance & Repair | 203 (100.0%) | 0 (0.0%) |
| Total (Category) | 357 (100.0%) | 0 (0.0%) |
| Total (Overall) | 1,090 (50.1%) | 1,084 (49.9%) |
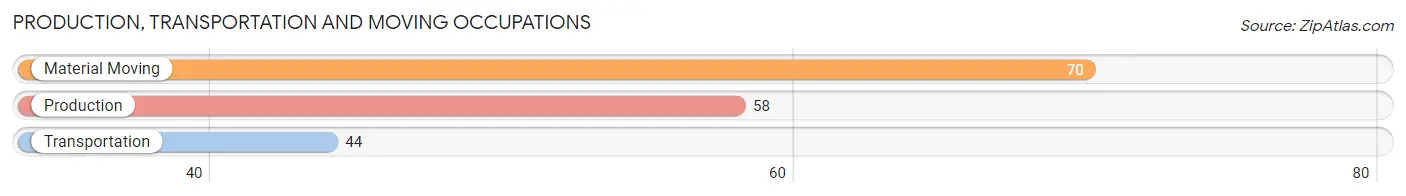
Production, Transportation and Moving Occupations
The most common Production, Transportation and Moving occupations in Walton Park are Material Moving (70 | 3.2%), Production (58 | 2.7%), and Transportation (44 | 2.0%).
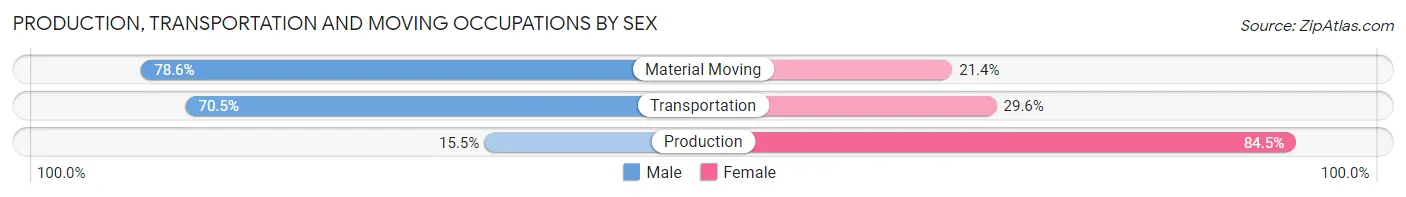
Production, Transportation and Moving Occupations by Sex
| Occupation | Male | Female |
| Production | 9 (15.5%) | 49 (84.5%) |
| Transportation | 31 (70.5%) | 13 (29.5%) |
| Material Moving | 55 (78.6%) | 15 (21.4%) |
| Total (Category) | 95 (55.2%) | 77 (44.8%) |
| Total (Overall) | 1,090 (50.1%) | 1,084 (49.9%) |
Employment Industries by Sex in Walton Park
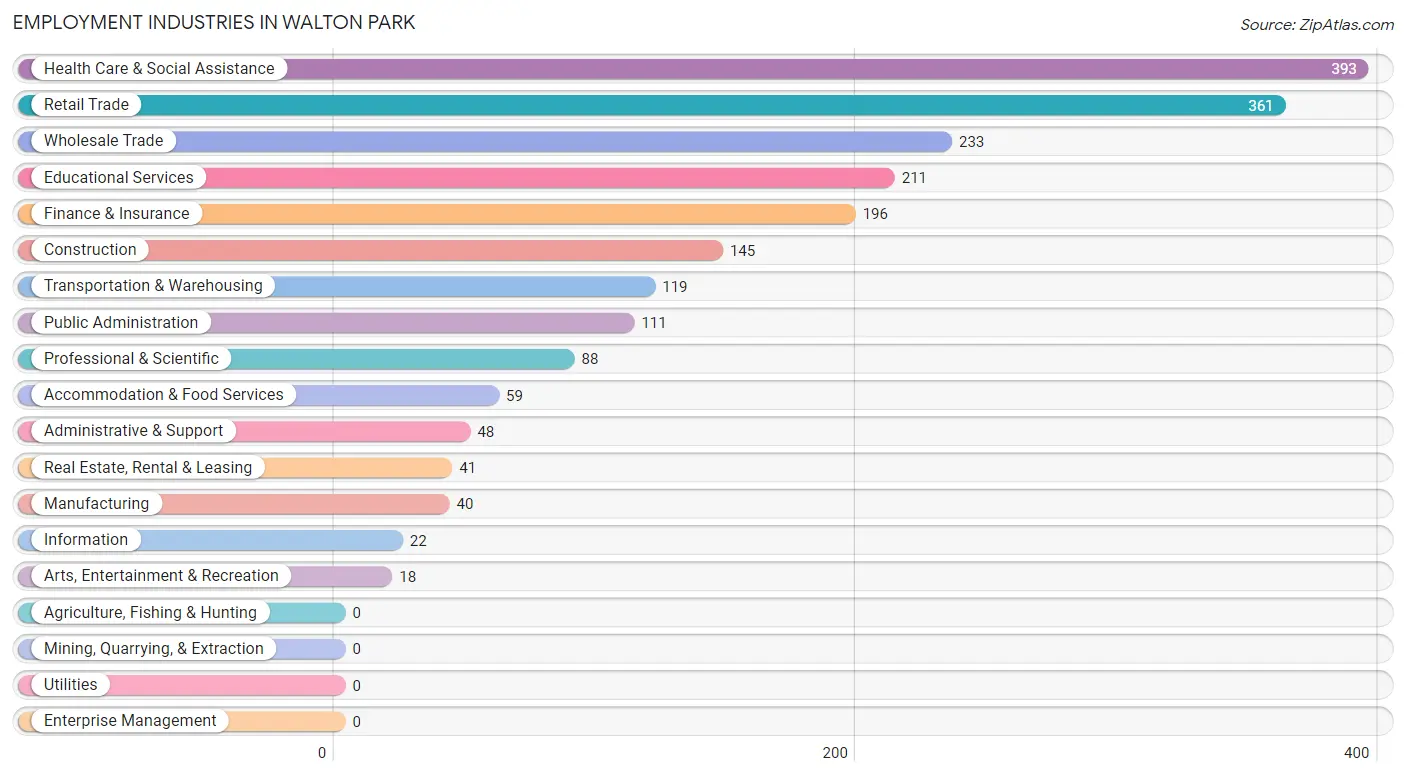
Employment Industries in Walton Park
The major employment industries in Walton Park include Health Care & Social Assistance (393 | 18.1%), Retail Trade (361 | 16.6%), Wholesale Trade (233 | 10.7%), Educational Services (211 | 9.7%), and Finance & Insurance (196 | 9.0%).
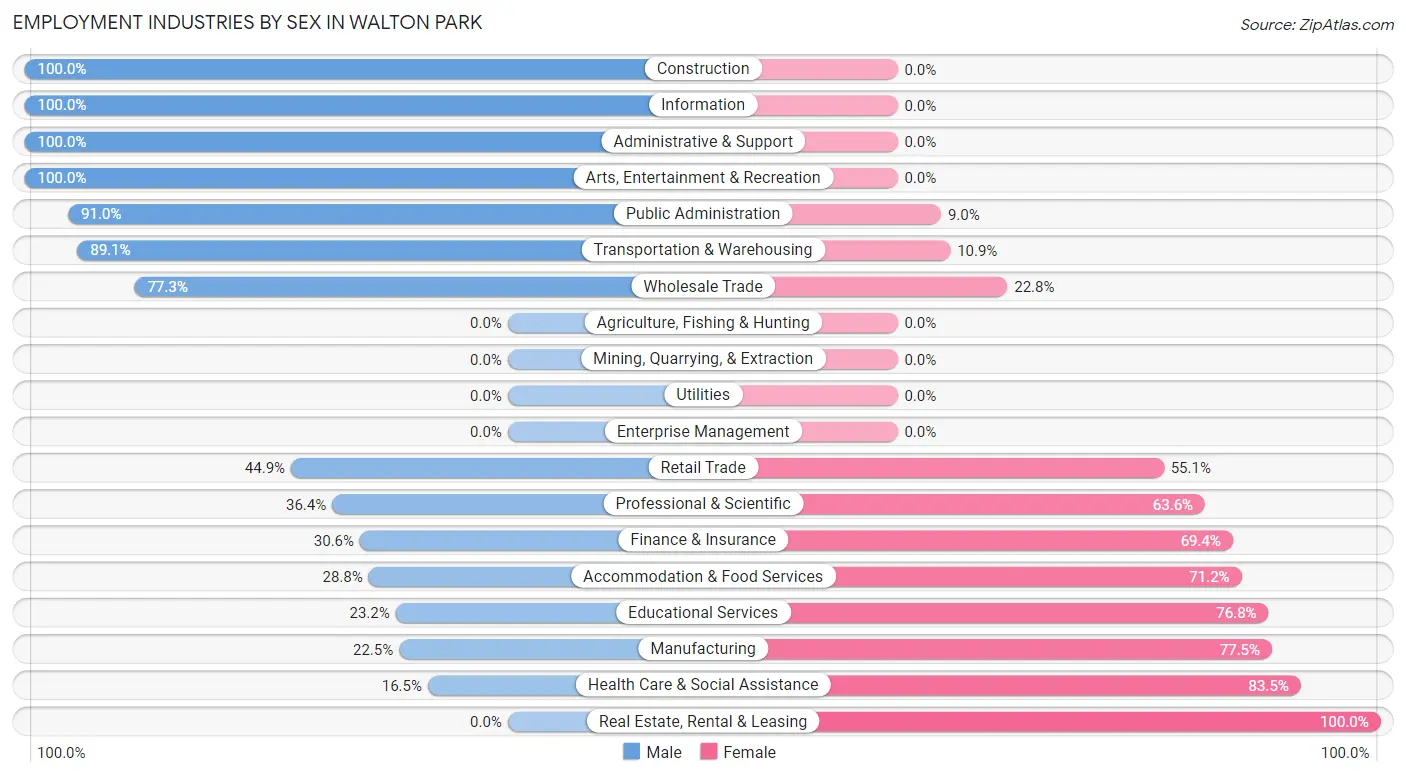
Employment Industries by Sex in Walton Park
The Walton Park industries that see more men than women are Construction (100.0%), Information (100.0%), and Administrative & Support (100.0%), whereas the industries that tend to have a higher number of women are Real Estate, Rental & Leasing (100.0%), Health Care & Social Assistance (83.5%), and Manufacturing (77.5%).
| Industry | Male | Female |
| Agriculture, Fishing & Hunting | 0 (0.0%) | 0 (0.0%) |
| Mining, Quarrying, & Extraction | 0 (0.0%) | 0 (0.0%) |
| Construction | 145 (100.0%) | 0 (0.0%) |
| Manufacturing | 9 (22.5%) | 31 (77.5%) |
| Wholesale Trade | 180 (77.2%) | 53 (22.8%) |
| Retail Trade | 162 (44.9%) | 199 (55.1%) |
| Transportation & Warehousing | 106 (89.1%) | 13 (10.9%) |
| Utilities | 0 (0.0%) | 0 (0.0%) |
| Information | 22 (100.0%) | 0 (0.0%) |
| Finance & Insurance | 60 (30.6%) | 136 (69.4%) |
| Real Estate, Rental & Leasing | 0 (0.0%) | 41 (100.0%) |
| Professional & Scientific | 32 (36.4%) | 56 (63.6%) |
| Enterprise Management | 0 (0.0%) | 0 (0.0%) |
| Administrative & Support | 48 (100.0%) | 0 (0.0%) |
| Educational Services | 49 (23.2%) | 162 (76.8%) |
| Health Care & Social Assistance | 65 (16.5%) | 328 (83.5%) |
| Arts, Entertainment & Recreation | 18 (100.0%) | 0 (0.0%) |
| Accommodation & Food Services | 17 (28.8%) | 42 (71.2%) |
| Public Administration | 101 (91.0%) | 10 (9.0%) |
| Total | 1,090 (50.1%) | 1,084 (49.9%) |
Education in Walton Park
School Enrollment in Walton Park
The most common levels of schooling among the 1,007 students in Walton Park are high school (268 | 26.6%), middle school (252 | 25.0%), and elementary school (209 | 20.7%).
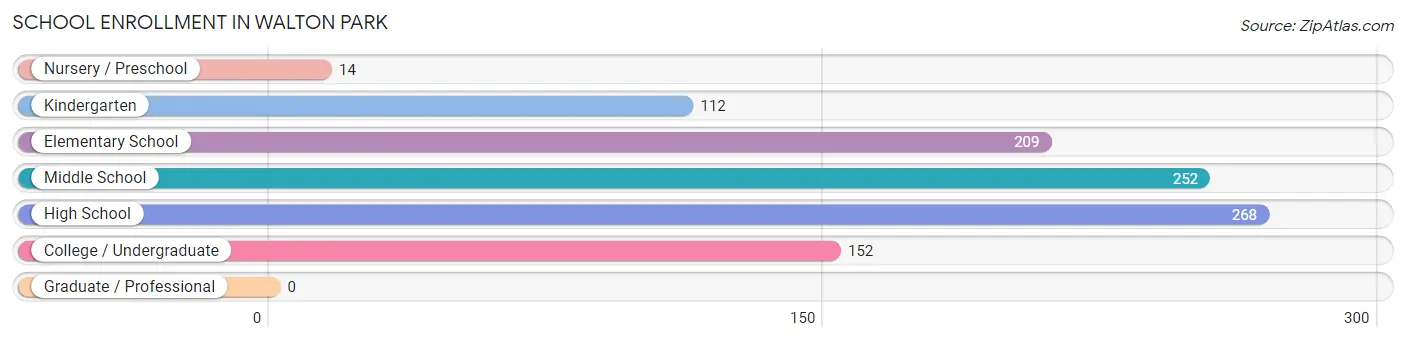
| School Level | # Students | % Students |
| Nursery / Preschool | 14 | 1.4% |
| Kindergarten | 112 | 11.1% |
| Elementary School | 209 | 20.7% |
| Middle School | 252 | 25.0% |
| High School | 268 | 26.6% |
| College / Undergraduate | 152 | 15.1% |
| Graduate / Professional | 0 | 0.0% |
| Total | 1,007 | 100.0% |
School Enrollment by Age by Funding Source in Walton Park
Out of a total of 1,007 students who are enrolled in schools in Walton Park, 151 (15.0%) attend a private institution, while the remaining 856 (85.0%) are enrolled in public schools. The age group of 20 to 24 year olds has the highest likelihood of being enrolled in private schools, with 71 (88.7% in the age bracket) enrolled. Conversely, the age group of 3 to 4 year olds has the lowest likelihood of being enrolled in a private school, with 67 (100.0% in the age bracket) attending a public institution.
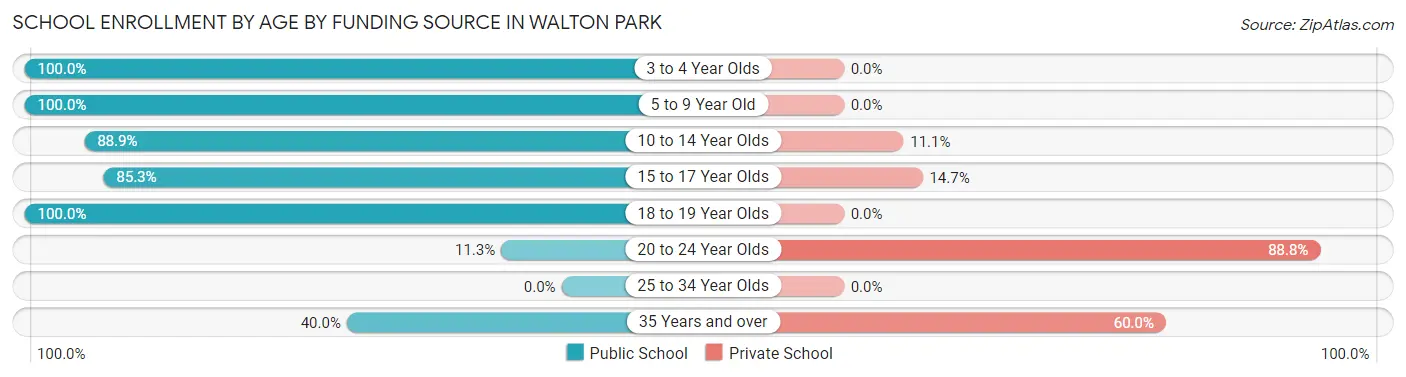
| Age Bracket | Public School | Private School |
| 3 to 4 Year Olds | 67 (100.0%) | 0 (0.0%) |
| 5 to 9 Year Old | 248 (100.0%) | 0 (0.0%) |
| 10 to 14 Year Olds | 240 (88.9%) | 30 (11.1%) |
| 15 to 17 Year Olds | 186 (85.3%) | 32 (14.7%) |
| 18 to 19 Year Olds | 94 (100.0%) | 0 (0.0%) |
| 20 to 24 Year Olds | 9 (11.3%) | 71 (88.7%) |
| 25 to 34 Year Olds | 0 (0.0%) | 0 (0.0%) |
| 35 Years and over | 12 (40.0%) | 18 (60.0%) |
| Total | 856 (85.0%) | 151 (15.0%) |
Educational Attainment by Field of Study in Walton Park
Business (391 | 29.4%), education (224 | 16.8%), social sciences (135 | 10.1%), engineering (111 | 8.3%), and science & technology (100 | 7.5%) are the most common fields of study among 1,331 individuals in Walton Park who have obtained a bachelor's degree or higher.
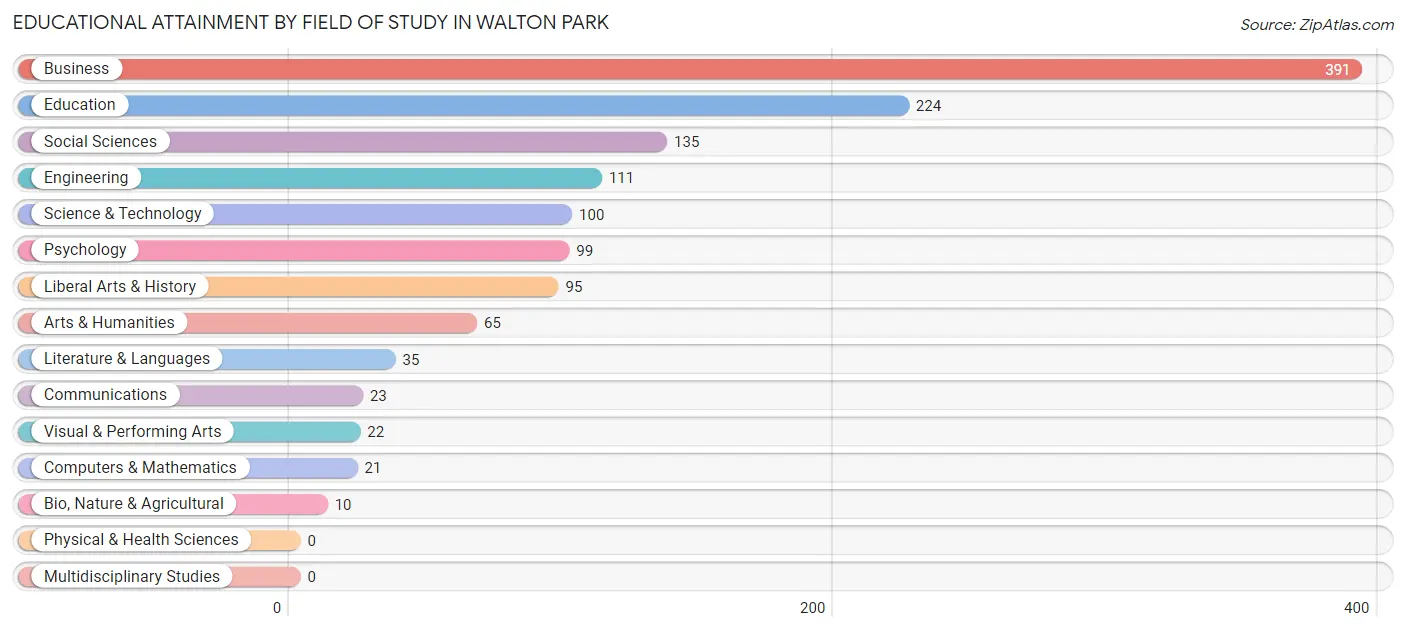
| Field of Study | # Graduates | % Graduates |
| Computers & Mathematics | 21 | 1.6% |
| Bio, Nature & Agricultural | 10 | 0.7% |
| Physical & Health Sciences | 0 | 0.0% |
| Psychology | 99 | 7.4% |
| Social Sciences | 135 | 10.1% |
| Engineering | 111 | 8.3% |
| Multidisciplinary Studies | 0 | 0.0% |
| Science & Technology | 100 | 7.5% |
| Business | 391 | 29.4% |
| Education | 224 | 16.8% |
| Literature & Languages | 35 | 2.6% |
| Liberal Arts & History | 95 | 7.1% |
| Visual & Performing Arts | 22 | 1.7% |
| Communications | 23 | 1.7% |
| Arts & Humanities | 65 | 4.9% |
| Total | 1,331 | 100.0% |
Transportation & Commute in Walton Park
Vehicle Availability by Sex in Walton Park
The most prevalent vehicle ownership categories in Walton Park are males with 3 vehicles (482, accounting for 45.1%) and females with 3 vehicles (405, making up 44.2%).
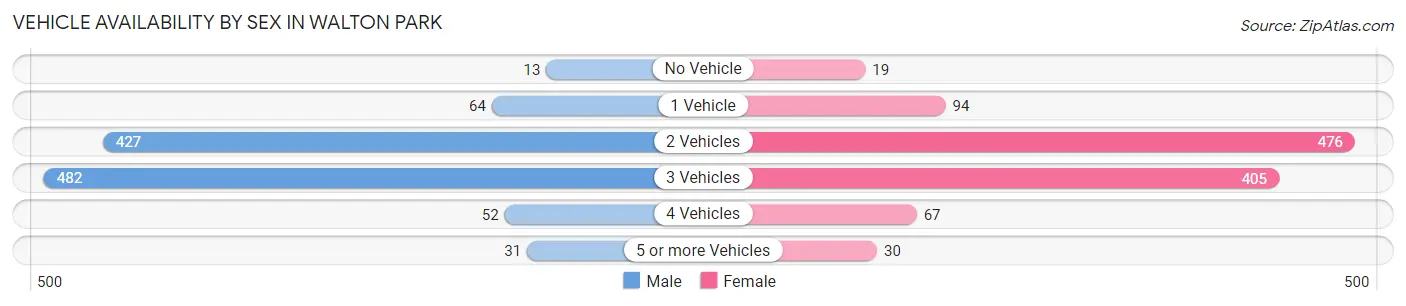
| Vehicles Available | Male | Female |
| No Vehicle | 13 (1.2%) | 19 (1.7%) |
| 1 Vehicle | 64 (6.0%) | 94 (8.6%) |
| 2 Vehicles | 427 (39.9%) | 476 (43.6%) |
| 3 Vehicles | 482 (45.1%) | 405 (37.1%) |
| 4 Vehicles | 52 (4.9%) | 67 (6.1%) |
| 5 or more Vehicles | 31 (2.9%) | 30 (2.8%) |
| Total | 1,069 (100.0%) | 1,091 (100.0%) |
Commute Time in Walton Park
The most frequently occuring commute durations in Walton Park are 60 to 89 minutes (508 commuters, 26.8%), 90 or more minutes (286 commuters, 15.1%), and 20 to 24 minutes (283 commuters, 14.9%).
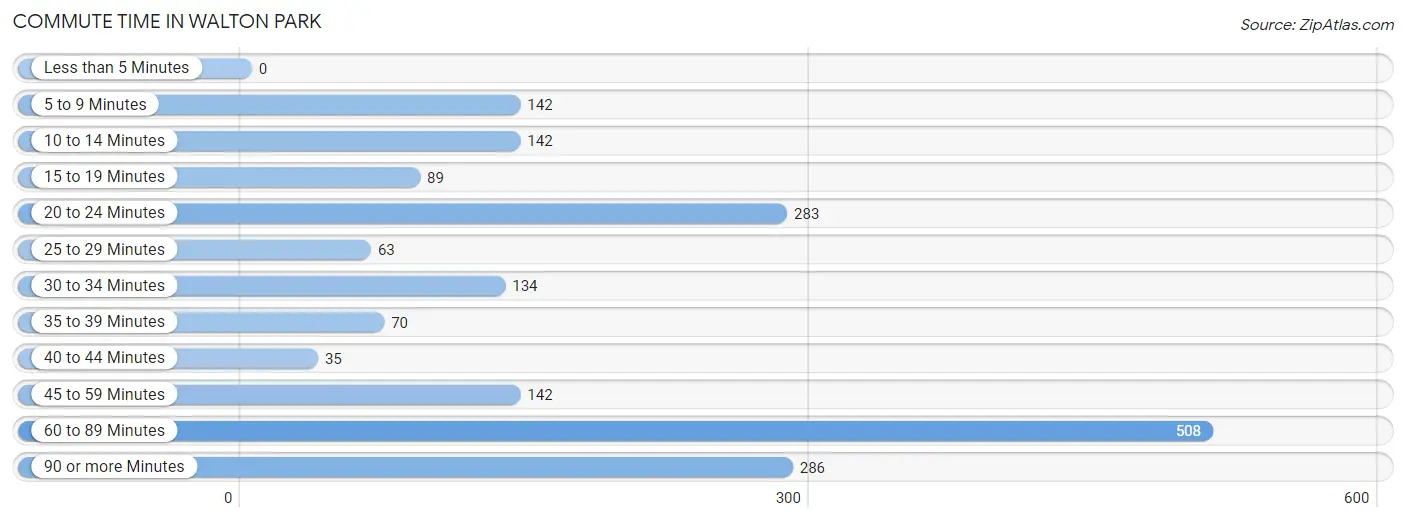
| Commute Time | # Commuters | % Commuters |
| Less than 5 Minutes | 0 | 0.0% |
| 5 to 9 Minutes | 142 | 7.5% |
| 10 to 14 Minutes | 142 | 7.5% |
| 15 to 19 Minutes | 89 | 4.7% |
| 20 to 24 Minutes | 283 | 14.9% |
| 25 to 29 Minutes | 63 | 3.3% |
| 30 to 34 Minutes | 134 | 7.1% |
| 35 to 39 Minutes | 70 | 3.7% |
| 40 to 44 Minutes | 35 | 1.8% |
| 45 to 59 Minutes | 142 | 7.5% |
| 60 to 89 Minutes | 508 | 26.8% |
| 90 or more Minutes | 286 | 15.1% |
Commute Time by Sex in Walton Park
The most common commute times in Walton Park are 60 to 89 minutes (383 commuters, 39.0%) for males and 20 to 24 minutes (179 commuters, 19.6%) for females.
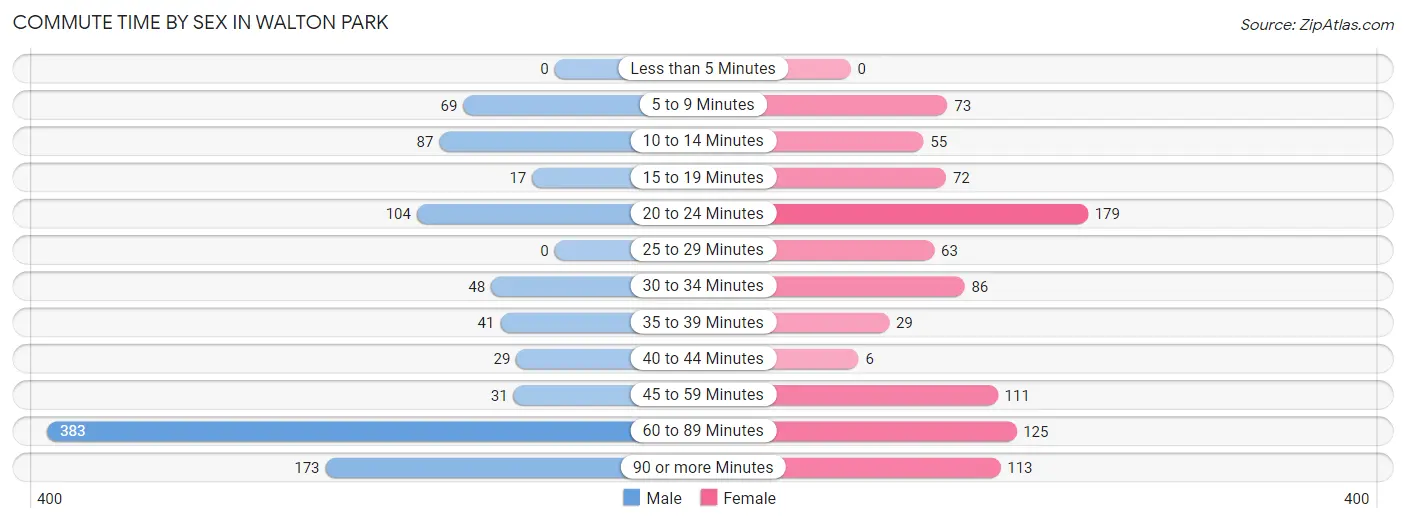
| Commute Time | Male | Female |
| Less than 5 Minutes | 0 (0.0%) | 0 (0.0%) |
| 5 to 9 Minutes | 69 (7.0%) | 73 (8.0%) |
| 10 to 14 Minutes | 87 (8.9%) | 55 (6.0%) |
| 15 to 19 Minutes | 17 (1.7%) | 72 (7.9%) |
| 20 to 24 Minutes | 104 (10.6%) | 179 (19.6%) |
| 25 to 29 Minutes | 0 (0.0%) | 63 (6.9%) |
| 30 to 34 Minutes | 48 (4.9%) | 86 (9.4%) |
| 35 to 39 Minutes | 41 (4.2%) | 29 (3.2%) |
| 40 to 44 Minutes | 29 (2.9%) | 6 (0.7%) |
| 45 to 59 Minutes | 31 (3.2%) | 111 (12.2%) |
| 60 to 89 Minutes | 383 (39.0%) | 125 (13.7%) |
| 90 or more Minutes | 173 (17.6%) | 113 (12.4%) |
Time of Departure to Work by Sex in Walton Park
The most frequent times of departure to work in Walton Park are 7:30 AM to 7:59 AM (200, 20.4%) for males and 7:00 AM to 7:29 AM (154, 16.9%) for females.
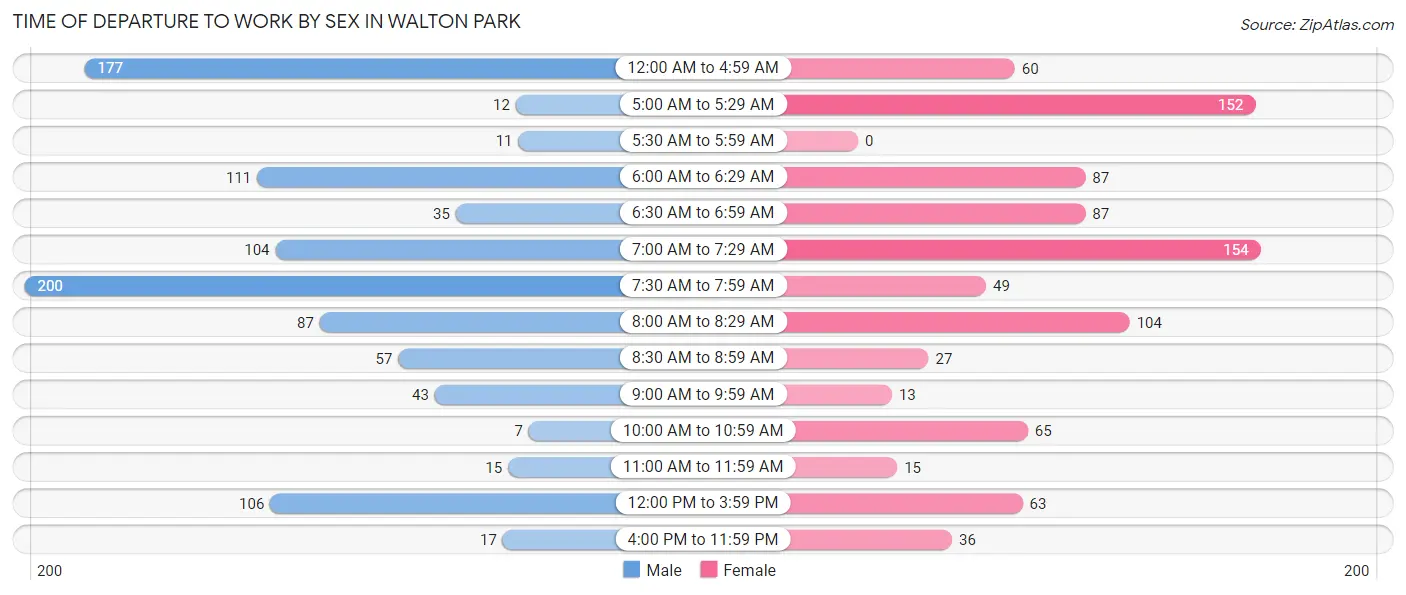
| Time of Departure | Male | Female |
| 12:00 AM to 4:59 AM | 177 (18.0%) | 60 (6.6%) |
| 5:00 AM to 5:29 AM | 12 (1.2%) | 152 (16.7%) |
| 5:30 AM to 5:59 AM | 11 (1.1%) | 0 (0.0%) |
| 6:00 AM to 6:29 AM | 111 (11.3%) | 87 (9.5%) |
| 6:30 AM to 6:59 AM | 35 (3.6%) | 87 (9.5%) |
| 7:00 AM to 7:29 AM | 104 (10.6%) | 154 (16.9%) |
| 7:30 AM to 7:59 AM | 200 (20.4%) | 49 (5.4%) |
| 8:00 AM to 8:29 AM | 87 (8.9%) | 104 (11.4%) |
| 8:30 AM to 8:59 AM | 57 (5.8%) | 27 (3.0%) |
| 9:00 AM to 9:59 AM | 43 (4.4%) | 13 (1.4%) |
| 10:00 AM to 10:59 AM | 7 (0.7%) | 65 (7.1%) |
| 11:00 AM to 11:59 AM | 15 (1.5%) | 15 (1.6%) |
| 12:00 PM to 3:59 PM | 106 (10.8%) | 63 (6.9%) |
| 4:00 PM to 11:59 PM | 17 (1.7%) | 36 (4.0%) |
| Total | 982 (100.0%) | 912 (100.0%) |
Housing Occupancy in Walton Park
Occupancy by Ownership in Walton Park
Of the total 1,482 dwellings in Walton Park, owner-occupied units account for 1,338 (90.3%), while renter-occupied units make up 144 (9.7%).
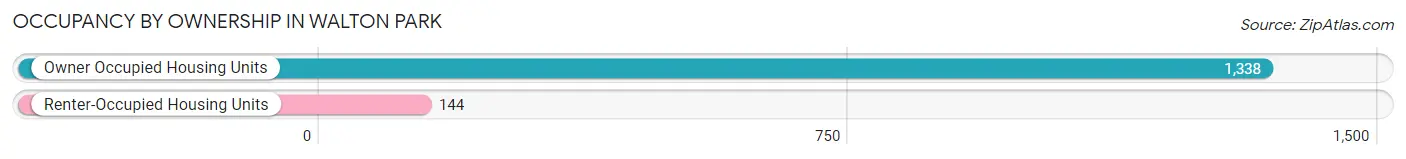
| Occupancy | # Housing Units | % Housing Units |
| Owner Occupied Housing Units | 1,338 | 90.3% |
| Renter-Occupied Housing Units | 144 | 9.7% |
| Total Occupied Housing Units | 1,482 | 100.0% |
Occupancy by Household Size in Walton Park
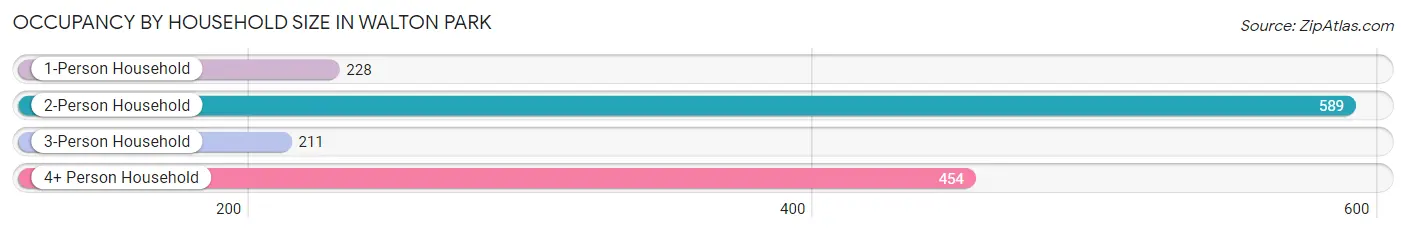
| Household Size | # Housing Units | % Housing Units |
| 1-Person Household | 228 | 15.4% |
| 2-Person Household | 589 | 39.7% |
| 3-Person Household | 211 | 14.2% |
| 4+ Person Household | 454 | 30.6% |
| Total Housing Units | 1,482 | 100.0% |
Occupancy by Ownership by Household Size in Walton Park
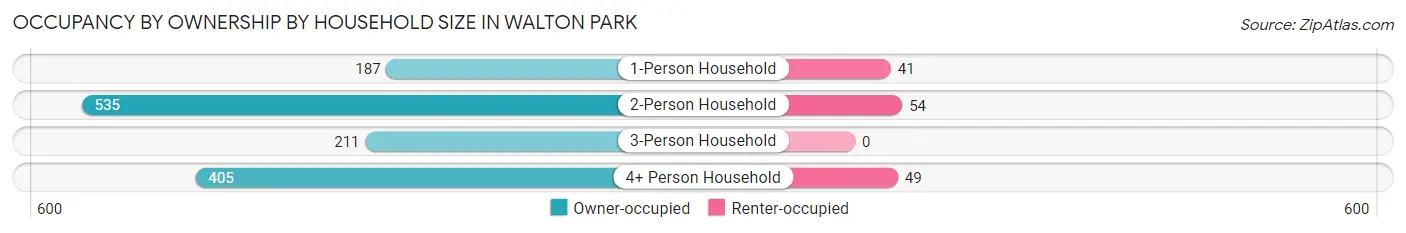
| Household Size | Owner-occupied | Renter-occupied |
| 1-Person Household | 187 (82.0%) | 41 (18.0%) |
| 2-Person Household | 535 (90.8%) | 54 (9.2%) |
| 3-Person Household | 211 (100.0%) | 0 (0.0%) |
| 4+ Person Household | 405 (89.2%) | 49 (10.8%) |
| Total Housing Units | 1,338 (90.3%) | 144 (9.7%) |
Occupancy by Educational Attainment in Walton Park
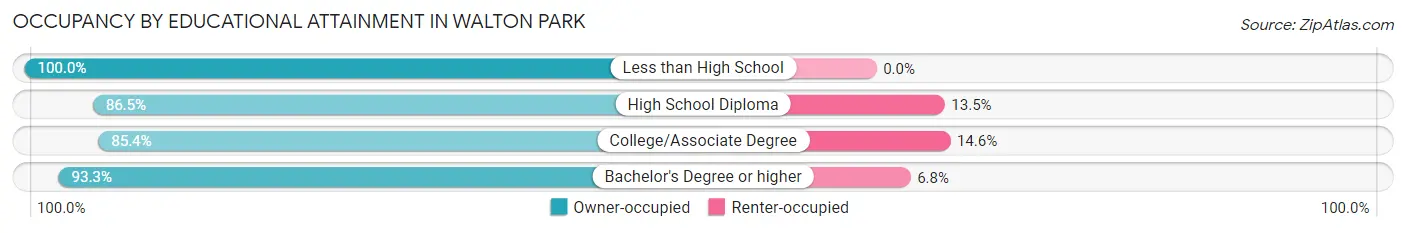
| Household Size | Owner-occupied | Renter-occupied |
| Less than High School | 84 (100.0%) | 0 (0.0%) |
| High School Diploma | 262 (86.5%) | 41 (13.5%) |
| College/Associate Degree | 315 (85.4%) | 54 (14.6%) |
| Bachelor's Degree or higher | 677 (93.2%) | 49 (6.8%) |
Occupancy by Age of Householder in Walton Park
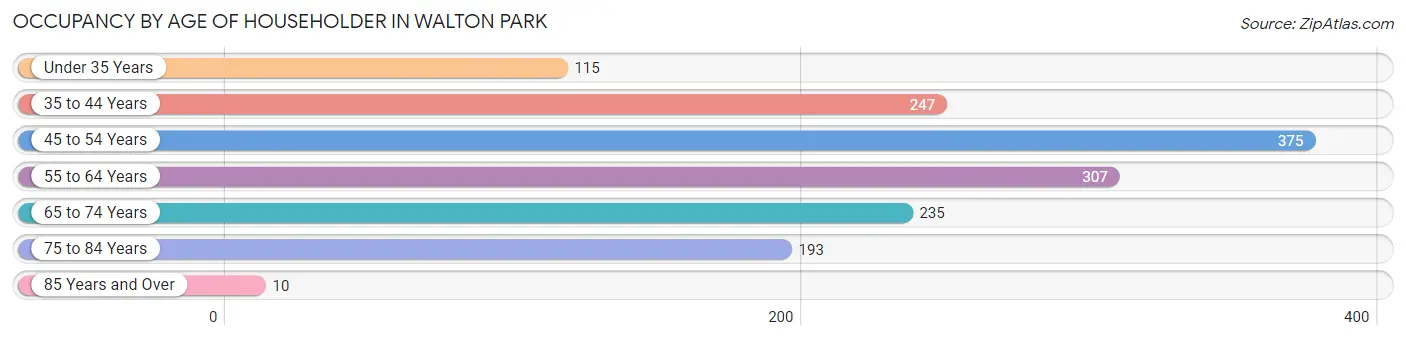
| Age Bracket | # Households | % Households |
| Under 35 Years | 115 | 7.8% |
| 35 to 44 Years | 247 | 16.7% |
| 45 to 54 Years | 375 | 25.3% |
| 55 to 64 Years | 307 | 20.7% |
| 65 to 74 Years | 235 | 15.9% |
| 75 to 84 Years | 193 | 13.0% |
| 85 Years and Over | 10 | 0.7% |
| Total | 1,482 | 100.0% |
Housing Finances in Walton Park
Median Income by Occupancy in Walton Park
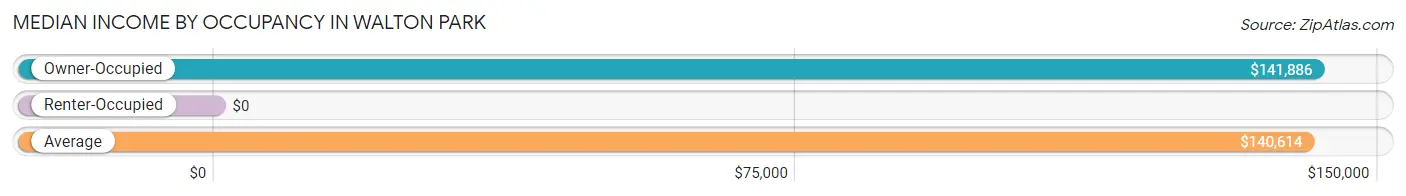
| Occupancy Type | # Households | Median Income |
| Owner-Occupied | 1,338 (90.3%) | $141,886 |
| Renter-Occupied | 144 (9.7%) | $0 |
| Average | 1,482 (100.0%) | $140,614 |
Occupancy by Householder Income Bracket in Walton Park
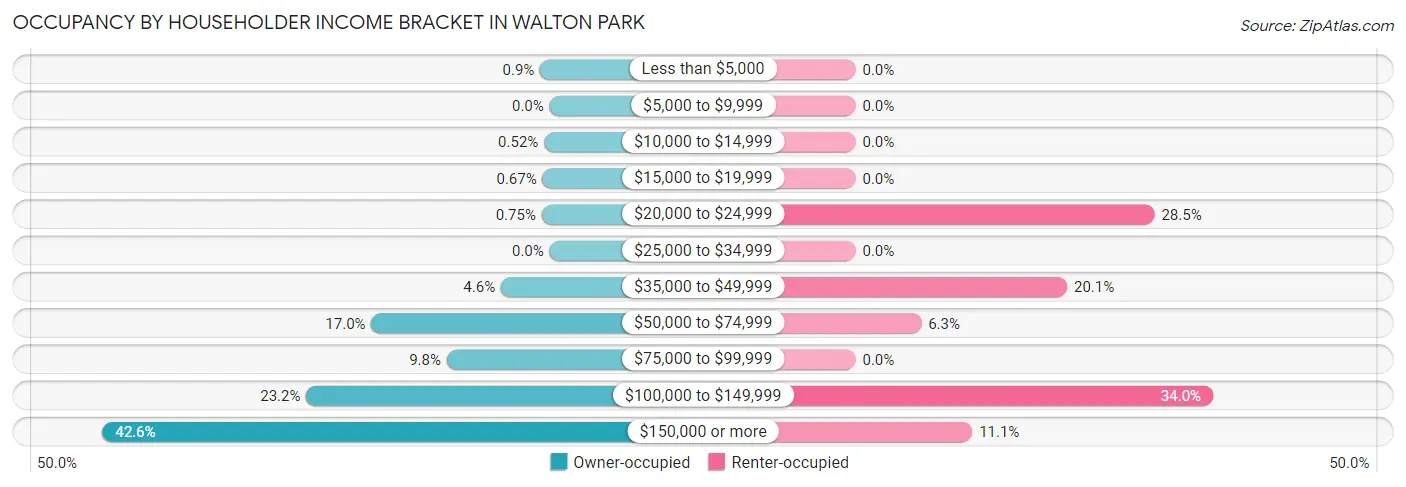
| Income Bracket | Owner-occupied | Renter-occupied |
| Less than $5,000 | 12 (0.9%) | 0 (0.0%) |
| $5,000 to $9,999 | 0 (0.0%) | 0 (0.0%) |
| $10,000 to $14,999 | 7 (0.5%) | 0 (0.0%) |
| $15,000 to $19,999 | 9 (0.7%) | 0 (0.0%) |
| $20,000 to $24,999 | 10 (0.7%) | 41 (28.5%) |
| $25,000 to $34,999 | 0 (0.0%) | 0 (0.0%) |
| $35,000 to $49,999 | 62 (4.6%) | 29 (20.1%) |
| $50,000 to $74,999 | 227 (17.0%) | 9 (6.2%) |
| $75,000 to $99,999 | 131 (9.8%) | 0 (0.0%) |
| $100,000 to $149,999 | 310 (23.2%) | 49 (34.0%) |
| $150,000 or more | 570 (42.6%) | 16 (11.1%) |
| Total | 1,338 (100.0%) | 144 (100.0%) |
Monthly Housing Cost Tiers in Walton Park
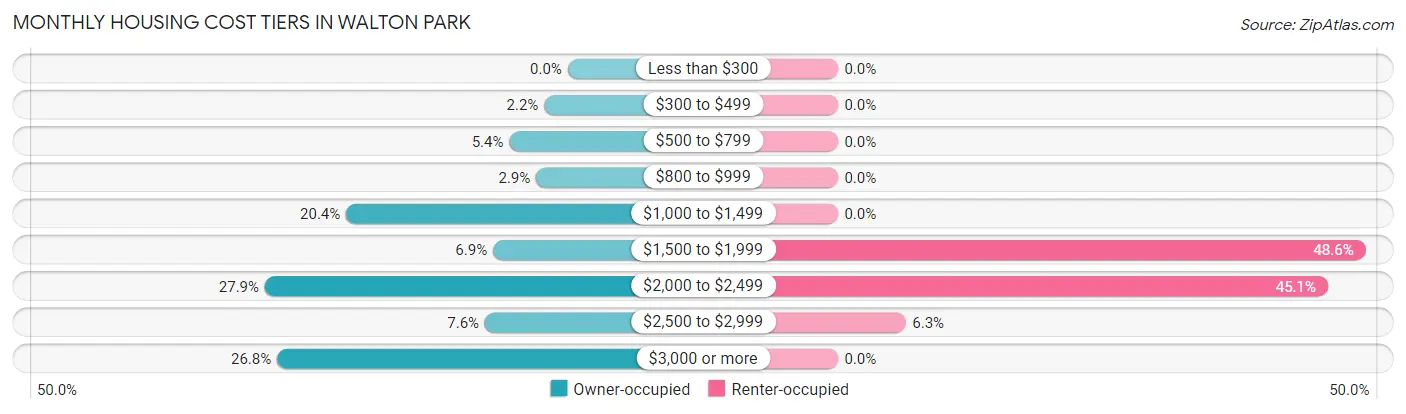
| Monthly Cost | Owner-occupied | Renter-occupied |
| Less than $300 | 0 (0.0%) | 0 (0.0%) |
| $300 to $499 | 29 (2.2%) | 0 (0.0%) |
| $500 to $799 | 72 (5.4%) | 0 (0.0%) |
| $800 to $999 | 39 (2.9%) | 0 (0.0%) |
| $1,000 to $1,499 | 273 (20.4%) | 0 (0.0%) |
| $1,500 to $1,999 | 92 (6.9%) | 70 (48.6%) |
| $2,000 to $2,499 | 373 (27.9%) | 65 (45.1%) |
| $2,500 to $2,999 | 102 (7.6%) | 9 (6.2%) |
| $3,000 or more | 358 (26.8%) | 0 (0.0%) |
| Total | 1,338 (100.0%) | 144 (100.0%) |
Physical Housing Characteristics in Walton Park
Housing Structures in Walton Park
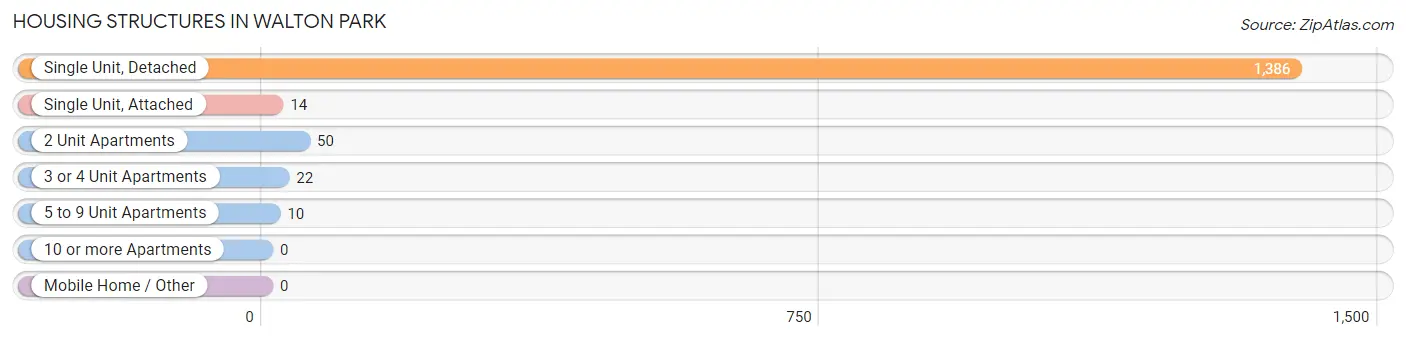
| Structure Type | # Housing Units | % Housing Units |
| Single Unit, Detached | 1,386 | 93.5% |
| Single Unit, Attached | 14 | 0.9% |
| 2 Unit Apartments | 50 | 3.4% |
| 3 or 4 Unit Apartments | 22 | 1.5% |
| 5 to 9 Unit Apartments | 10 | 0.7% |
| 10 or more Apartments | 0 | 0.0% |
| Mobile Home / Other | 0 | 0.0% |
| Total | 1,482 | 100.0% |
Housing Structures by Occupancy in Walton Park
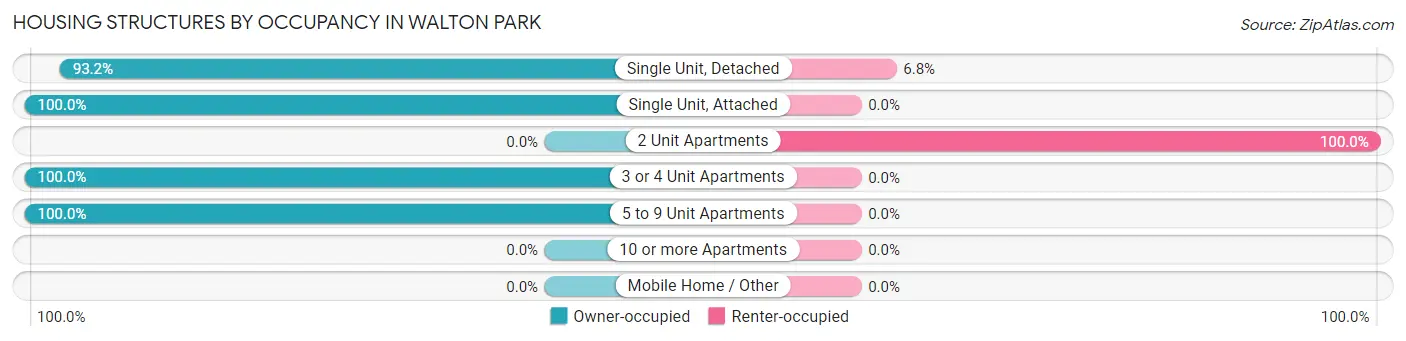
| Structure Type | Owner-occupied | Renter-occupied |
| Single Unit, Detached | 1,292 (93.2%) | 94 (6.8%) |
| Single Unit, Attached | 14 (100.0%) | 0 (0.0%) |
| 2 Unit Apartments | 0 (0.0%) | 50 (100.0%) |
| 3 or 4 Unit Apartments | 22 (100.0%) | 0 (0.0%) |
| 5 to 9 Unit Apartments | 10 (100.0%) | 0 (0.0%) |
| 10 or more Apartments | 0 (0.0%) | 0 (0.0%) |
| Mobile Home / Other | 0 (0.0%) | 0 (0.0%) |
| Total | 1,338 (90.3%) | 144 (9.7%) |
Housing Structures by Number of Rooms in Walton Park
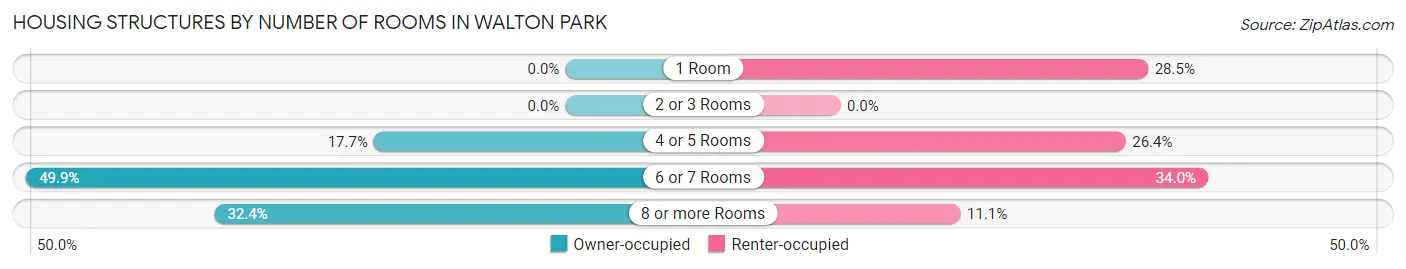
| Number of Rooms | Owner-occupied | Renter-occupied |
| 1 Room | 0 (0.0%) | 41 (28.5%) |
| 2 or 3 Rooms | 0 (0.0%) | 0 (0.0%) |
| 4 or 5 Rooms | 237 (17.7%) | 38 (26.4%) |
| 6 or 7 Rooms | 667 (49.8%) | 49 (34.0%) |
| 8 or more Rooms | 434 (32.4%) | 16 (11.1%) |
| Total | 1,338 (100.0%) | 144 (100.0%) |
Housing Structure by Heating Type in Walton Park
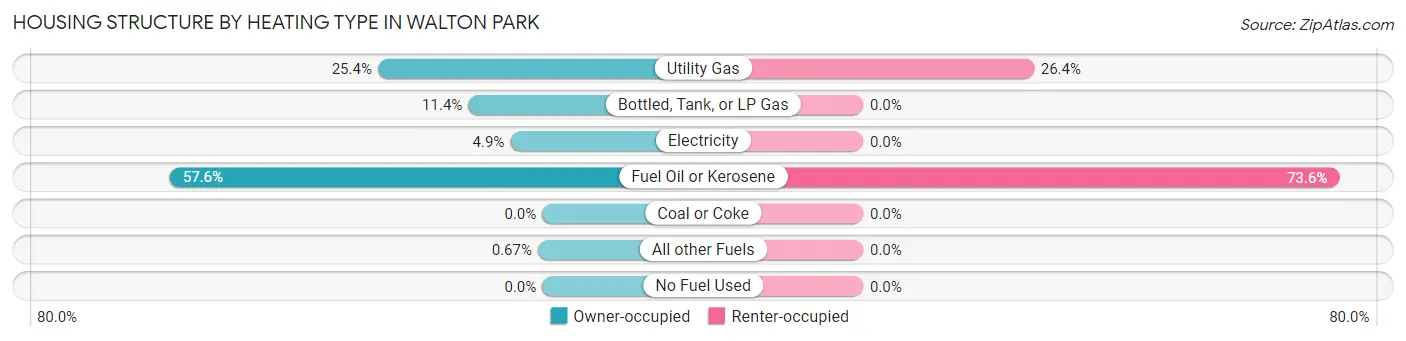
| Heating Type | Owner-occupied | Renter-occupied |
| Utility Gas | 340 (25.4%) | 38 (26.4%) |
| Bottled, Tank, or LP Gas | 153 (11.4%) | 0 (0.0%) |
| Electricity | 66 (4.9%) | 0 (0.0%) |
| Fuel Oil or Kerosene | 770 (57.6%) | 106 (73.6%) |
| Coal or Coke | 0 (0.0%) | 0 (0.0%) |
| All other Fuels | 9 (0.7%) | 0 (0.0%) |
| No Fuel Used | 0 (0.0%) | 0 (0.0%) |
| Total | 1,338 (100.0%) | 144 (100.0%) |
Household Vehicle Usage in Walton Park
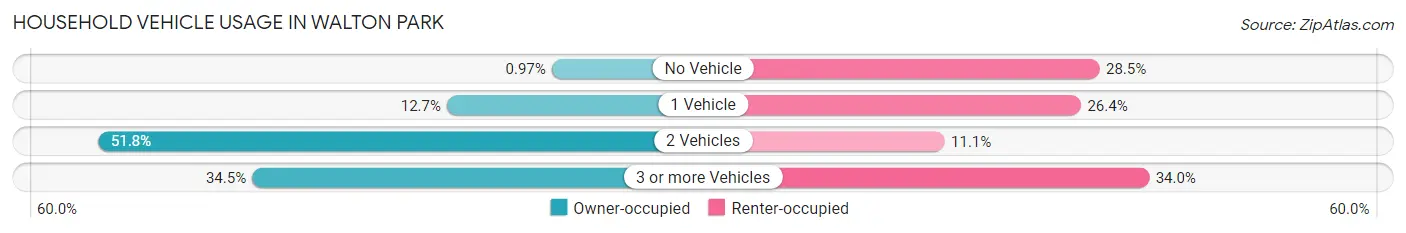
| Vehicles per Household | Owner-occupied | Renter-occupied |
| No Vehicle | 13 (1.0%) | 41 (28.5%) |
| 1 Vehicle | 170 (12.7%) | 38 (26.4%) |
| 2 Vehicles | 693 (51.8%) | 16 (11.1%) |
| 3 or more Vehicles | 462 (34.5%) | 49 (34.0%) |
| Total | 1,338 (100.0%) | 144 (100.0%) |
Real Estate & Mortgages in Walton Park
Real Estate and Mortgage Overview in Walton Park
| Characteristic | Without Mortgage | With Mortgage |
| Housing Units | 445 | 893 |
| Median Property Value | $341,500 | $392,200 |
| Median Household Income | $123,417 | $400 |
| Monthly Housing Costs | $1,067 | $358 |
| Real Estate Taxes | $6,555 | $0 |
Property Value by Mortgage Status in Walton Park
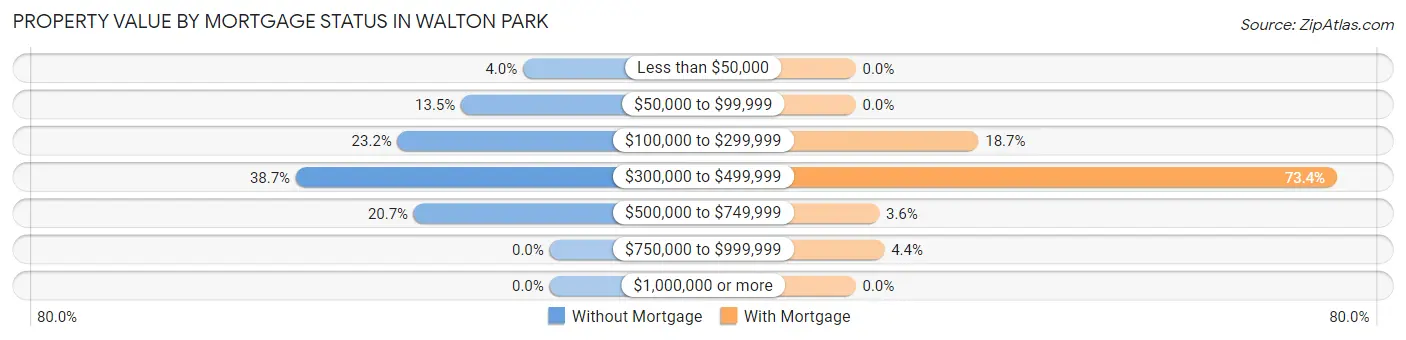
| Property Value | Without Mortgage | With Mortgage |
| Less than $50,000 | 18 (4.0%) | 0 (0.0%) |
| $50,000 to $99,999 | 60 (13.5%) | 0 (0.0%) |
| $100,000 to $299,999 | 103 (23.2%) | 167 (18.7%) |
| $300,000 to $499,999 | 172 (38.7%) | 655 (73.4%) |
| $500,000 to $749,999 | 92 (20.7%) | 32 (3.6%) |
| $750,000 to $999,999 | 0 (0.0%) | 39 (4.4%) |
| $1,000,000 or more | 0 (0.0%) | 0 (0.0%) |
| Total | 445 (100.0%) | 893 (100.0%) |
Household Income by Mortgage Status in Walton Park
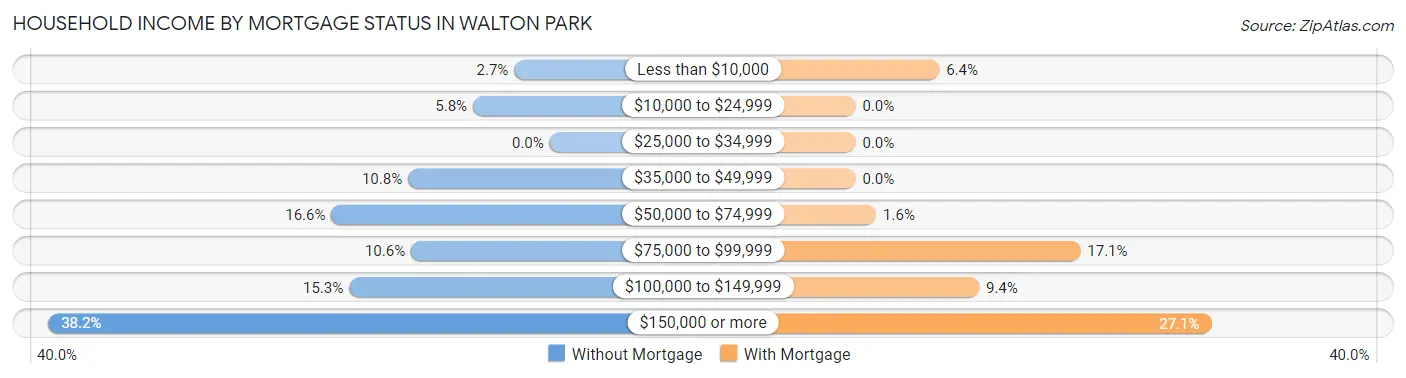
| Household Income | Without Mortgage | With Mortgage |
| Less than $10,000 | 12 (2.7%) | 57 (6.4%) |
| $10,000 to $24,999 | 26 (5.8%) | 0 (0.0%) |
| $25,000 to $34,999 | 0 (0.0%) | 0 (0.0%) |
| $35,000 to $49,999 | 48 (10.8%) | 0 (0.0%) |
| $50,000 to $74,999 | 74 (16.6%) | 14 (1.6%) |
| $75,000 to $99,999 | 47 (10.6%) | 153 (17.1%) |
| $100,000 to $149,999 | 68 (15.3%) | 84 (9.4%) |
| $150,000 or more | 170 (38.2%) | 242 (27.1%) |
| Total | 445 (100.0%) | 893 (100.0%) |
Property Value to Household Income Ratio in Walton Park
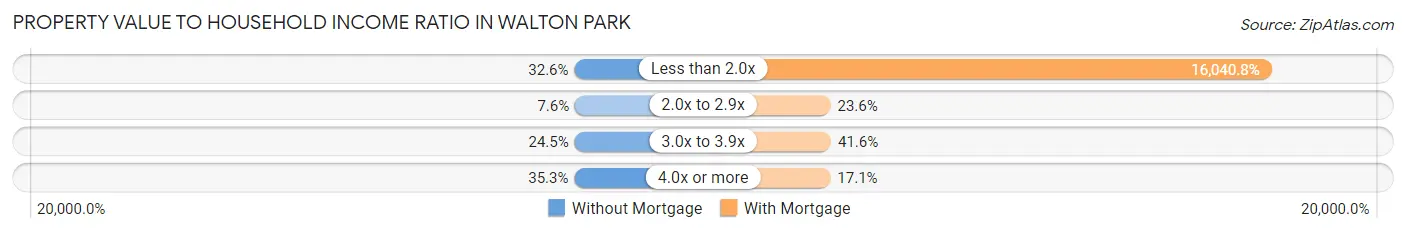
| Value-to-Income Ratio | Without Mortgage | With Mortgage |
| Less than 2.0x | 145 (32.6%) | 143,244 (16,040.8%) |
| 2.0x to 2.9x | 34 (7.6%) | 211 (23.6%) |
| 3.0x to 3.9x | 109 (24.5%) | 371 (41.5%) |
| 4.0x or more | 157 (35.3%) | 153 (17.1%) |
| Total | 445 (100.0%) | 893 (100.0%) |
Real Estate Taxes by Mortgage Status in Walton Park
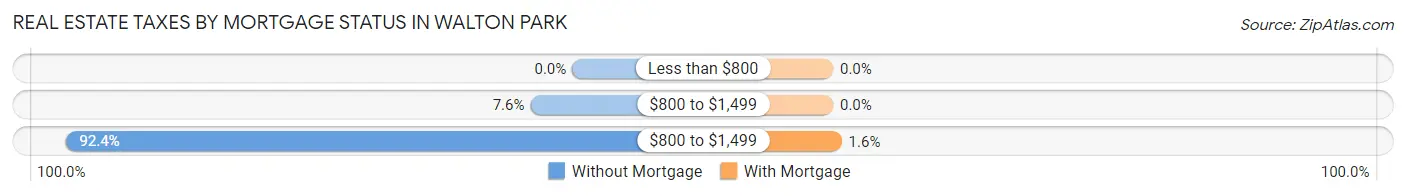
| Property Taxes | Without Mortgage | With Mortgage |
| Less than $800 | 0 (0.0%) | 0 (0.0%) |
| $800 to $1,499 | 34 (7.6%) | 0 (0.0%) |
| $800 to $1,499 | 411 (92.4%) | 14 (1.6%) |
| Total | 445 (100.0%) | 893 (100.0%) |
Health & Disability in Walton Park
Health Insurance Coverage by Age in Walton Park
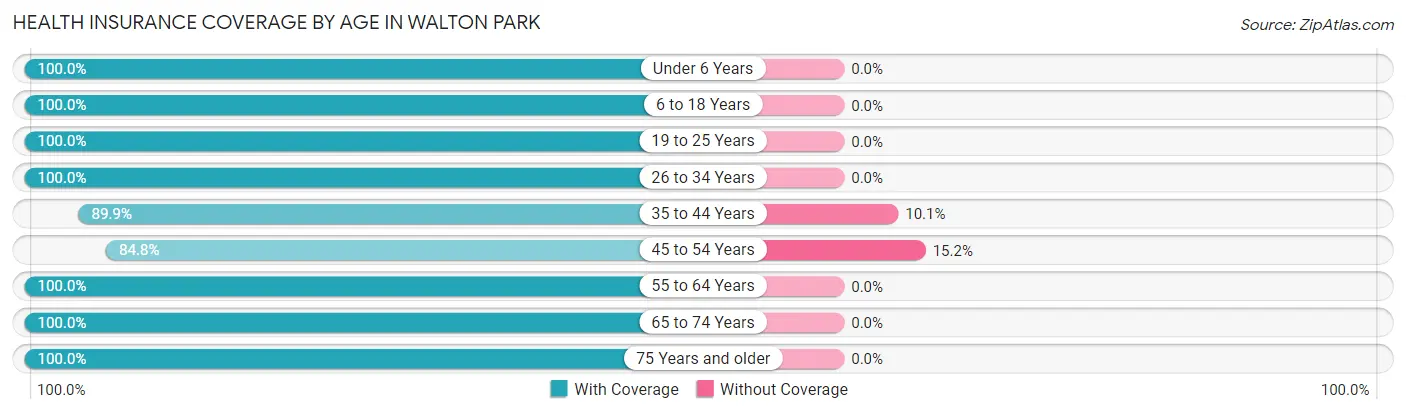
| Age Bracket | With Coverage | Without Coverage |
| Under 6 Years | 241 (100.0%) | 0 (0.0%) |
| 6 to 18 Years | 779 (100.0%) | 0 (0.0%) |
| 19 to 25 Years | 162 (100.0%) | 0 (0.0%) |
| 26 to 34 Years | 417 (100.0%) | 0 (0.0%) |
| 35 to 44 Years | 402 (89.9%) | 45 (10.1%) |
| 45 to 54 Years | 469 (84.8%) | 84 (15.2%) |
| 55 to 64 Years | 546 (100.0%) | 0 (0.0%) |
| 65 to 74 Years | 623 (100.0%) | 0 (0.0%) |
| 75 Years and older | 353 (100.0%) | 0 (0.0%) |
| Total | 3,992 (96.9%) | 129 (3.1%) |
Health Insurance Coverage by Citizenship Status in Walton Park
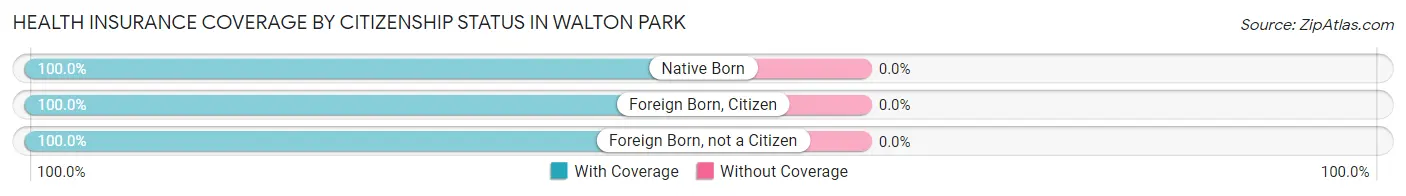
| Citizenship Status | With Coverage | Without Coverage |
| Native Born | 241 (100.0%) | 0 (0.0%) |
| Foreign Born, Citizen | 779 (100.0%) | 0 (0.0%) |
| Foreign Born, not a Citizen | 162 (100.0%) | 0 (0.0%) |
Health Insurance Coverage by Household Income in Walton Park
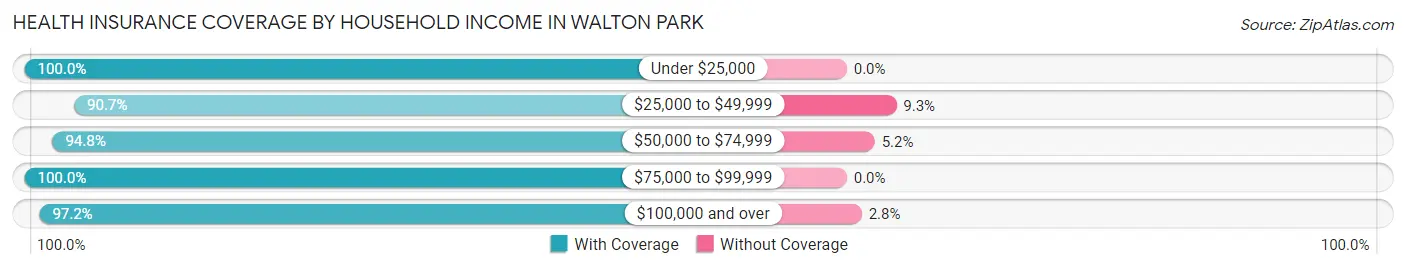
| Household Income | With Coverage | Without Coverage |
| Under $25,000 | 79 (100.0%) | 0 (0.0%) |
| $25,000 to $49,999 | 215 (90.7%) | 22 (9.3%) |
| $50,000 to $74,999 | 580 (94.8%) | 32 (5.2%) |
| $75,000 to $99,999 | 503 (100.0%) | 0 (0.0%) |
| $100,000 and over | 2,615 (97.2%) | 75 (2.8%) |
Public vs Private Health Insurance Coverage by Age in Walton Park
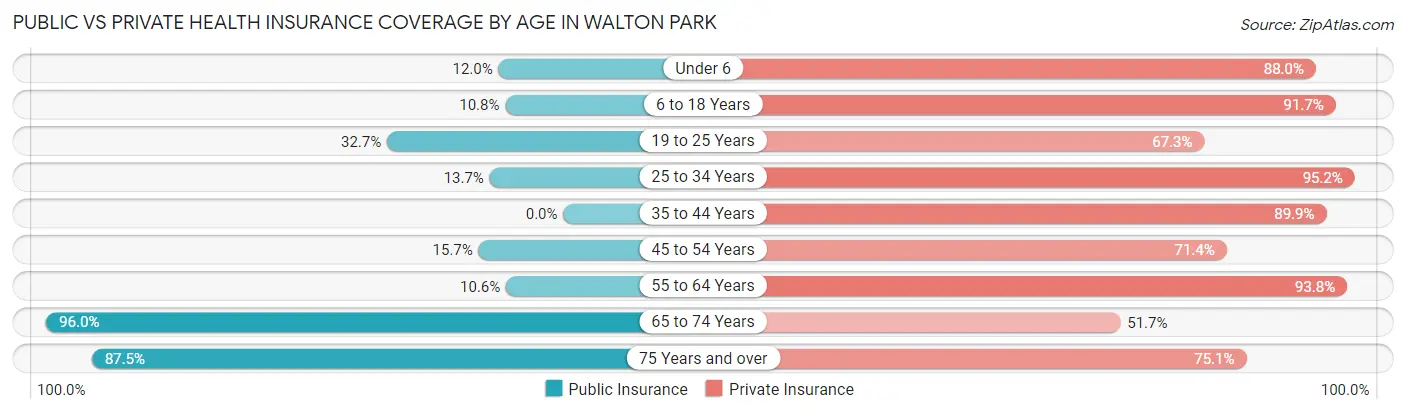
| Age Bracket | Public Insurance | Private Insurance |
| Under 6 | 29 (12.0%) | 212 (88.0%) |
| 6 to 18 Years | 84 (10.8%) | 714 (91.7%) |
| 19 to 25 Years | 53 (32.7%) | 109 (67.3%) |
| 25 to 34 Years | 57 (13.7%) | 397 (95.2%) |
| 35 to 44 Years | 0 (0.0%) | 402 (89.9%) |
| 45 to 54 Years | 87 (15.7%) | 395 (71.4%) |
| 55 to 64 Years | 58 (10.6%) | 512 (93.8%) |
| 65 to 74 Years | 598 (96.0%) | 322 (51.7%) |
| 75 Years and over | 309 (87.5%) | 265 (75.1%) |
| Total | 1,275 (30.9%) | 3,328 (80.8%) |
Disability Status by Sex by Age in Walton Park
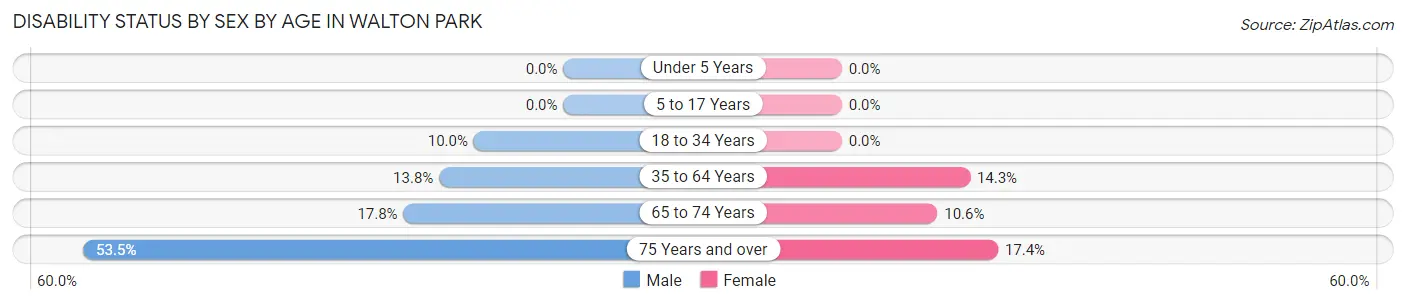
| Age Bracket | Male | Female |
| Under 5 Years | 0 (0.0%) | 0 (0.0%) |
| 5 to 17 Years | 0 (0.0%) | 0 (0.0%) |
| 18 to 34 Years | 37 (10.0%) | 0 (0.0%) |
| 35 to 64 Years | 112 (13.8%) | 105 (14.3%) |
| 65 to 74 Years | 44 (17.8%) | 40 (10.6%) |
| 75 Years and over | 115 (53.5%) | 24 (17.4%) |
Disability Class by Sex by Age in Walton Park
Disability Class: Hearing Difficulty

| Age Bracket | Male | Female |
| Under 5 Years | 0 (0.0%) | 0 (0.0%) |
| 5 to 17 Years | 0 (0.0%) | 0 (0.0%) |
| 18 to 34 Years | 0 (0.0%) | 0 (0.0%) |
| 35 to 64 Years | 67 (8.3%) | 98 (13.3%) |
| 65 to 74 Years | 24 (9.7%) | 4 (1.1%) |
| 75 Years and over | 59 (27.4%) | 24 (17.4%) |
Disability Class: Vision Difficulty
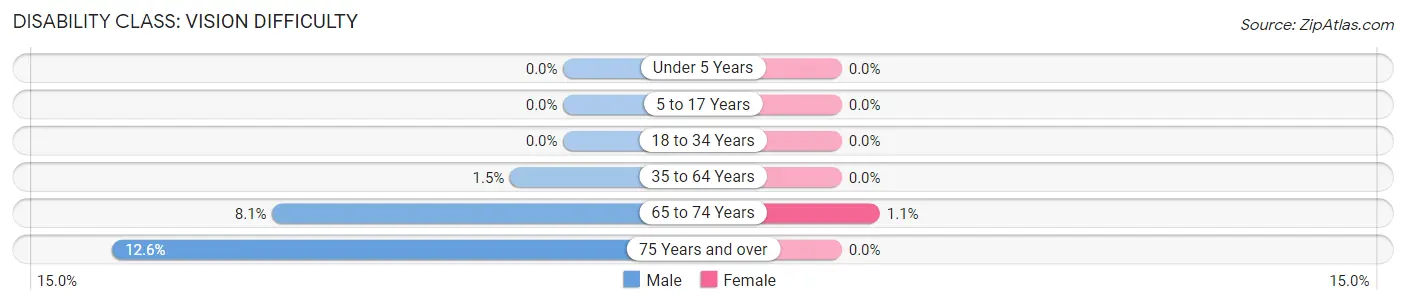
| Age Bracket | Male | Female |
| Under 5 Years | 0 (0.0%) | 0 (0.0%) |
| 5 to 17 Years | 0 (0.0%) | 0 (0.0%) |
| 18 to 34 Years | 0 (0.0%) | 0 (0.0%) |
| 35 to 64 Years | 12 (1.5%) | 0 (0.0%) |
| 65 to 74 Years | 20 (8.1%) | 4 (1.1%) |
| 75 Years and over | 27 (12.6%) | 0 (0.0%) |
Disability Class: Cognitive Difficulty
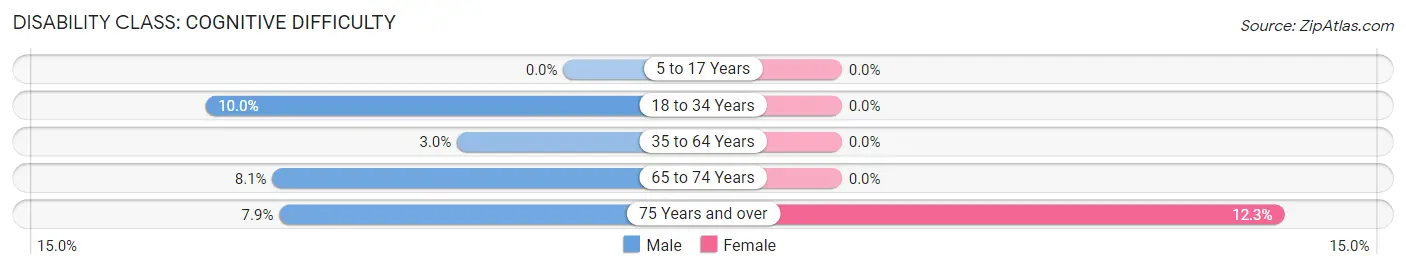
| Age Bracket | Male | Female |
| 5 to 17 Years | 0 (0.0%) | 0 (0.0%) |
| 18 to 34 Years | 37 (10.0%) | 0 (0.0%) |
| 35 to 64 Years | 24 (3.0%) | 0 (0.0%) |
| 65 to 74 Years | 20 (8.1%) | 0 (0.0%) |
| 75 Years and over | 17 (7.9%) | 17 (12.3%) |
Disability Class: Ambulatory Difficulty
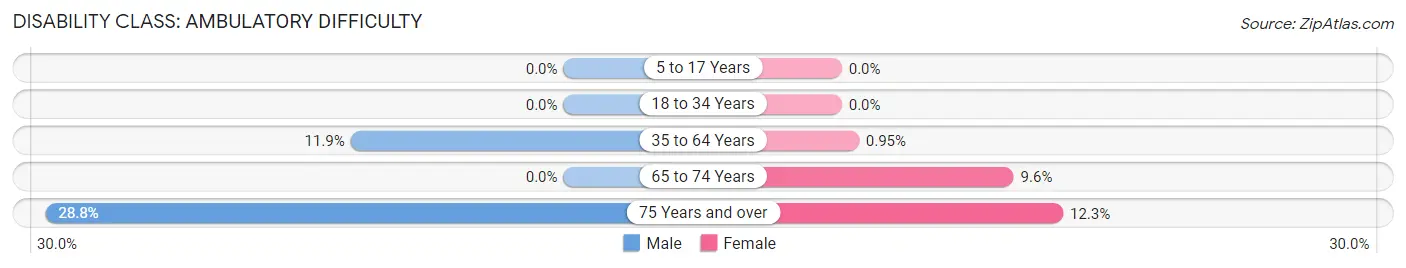
| Age Bracket | Male | Female |
| 5 to 17 Years | 0 (0.0%) | 0 (0.0%) |
| 18 to 34 Years | 0 (0.0%) | 0 (0.0%) |
| 35 to 64 Years | 96 (11.8%) | 7 (0.9%) |
| 65 to 74 Years | 0 (0.0%) | 36 (9.6%) |
| 75 Years and over | 62 (28.8%) | 17 (12.3%) |
Disability Class: Self-Care Difficulty
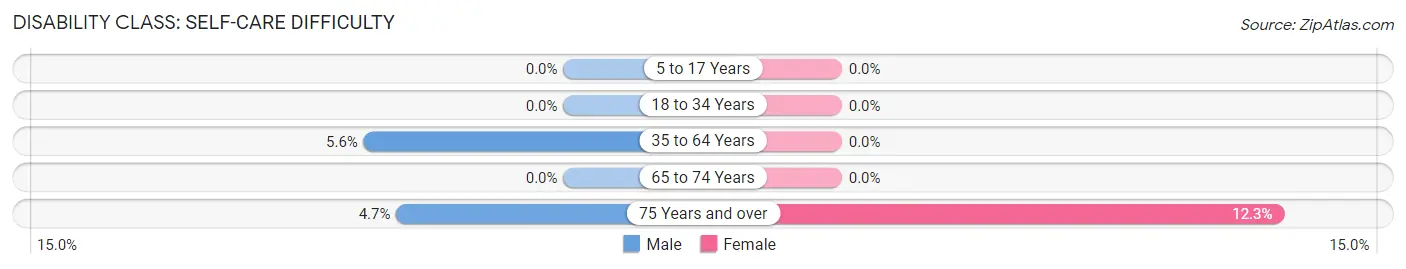
| Age Bracket | Male | Female |
| 5 to 17 Years | 0 (0.0%) | 0 (0.0%) |
| 18 to 34 Years | 0 (0.0%) | 0 (0.0%) |
| 35 to 64 Years | 45 (5.6%) | 0 (0.0%) |
| 65 to 74 Years | 0 (0.0%) | 0 (0.0%) |
| 75 Years and over | 10 (4.6%) | 17 (12.3%) |
Technology Access in Walton Park
Computing Device Access in Walton Park
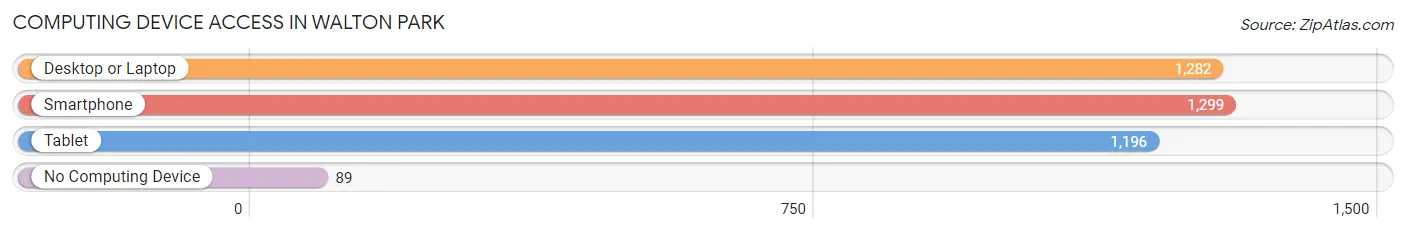
| Device Type | # Households | % Households |
| Desktop or Laptop | 1,282 | 86.5% |
| Smartphone | 1,299 | 87.6% |
| Tablet | 1,196 | 80.7% |
| No Computing Device | 89 | 6.0% |
| Total | 1,482 | 100.0% |
Internet Access in Walton Park
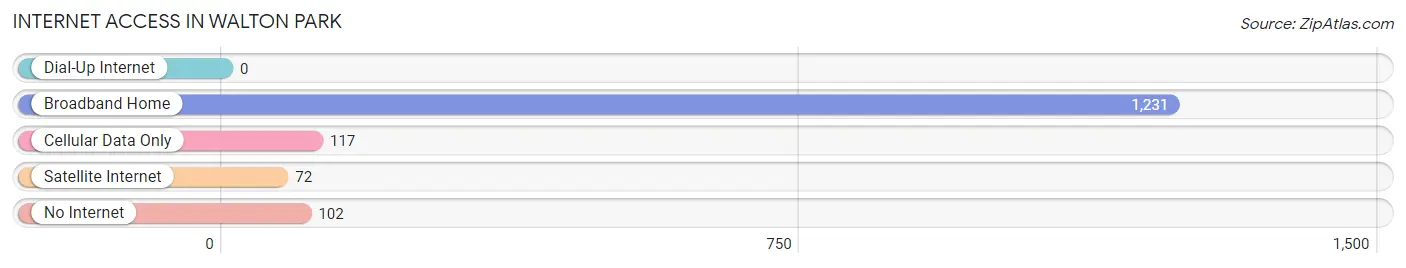
| Internet Type | # Households | % Households |
| Dial-Up Internet | 0 | 0.0% |
| Broadband Home | 1,231 | 83.1% |
| Cellular Data Only | 117 | 7.9% |
| Satellite Internet | 72 | 4.9% |
| No Internet | 102 | 6.9% |
| Total | 1,482 | 100.0% |
Walton Park Summary
Walton Park is a small village located in the town of Walton in Delaware County, New York. It is situated in the foothills of the Catskill Mountains, about 20 miles west of the city of Oneonta. The village is home to a population of approximately 1,000 people.
History
Walton Park was founded in 1820 by a group of settlers from Connecticut. The village was named after the Walton family, who were among the first settlers. The village was originally a farming community, but in the late 19th century, it began to develop into a small industrial center. The Walton Park Manufacturing Company was established in 1887 and produced a variety of products, including furniture, tools, and machinery. The company was the largest employer in the village until it closed in the early 20th century.
In the early 20th century, Walton Park began to develop into a tourist destination. The village was home to several resorts, including the Walton Park Hotel, which opened in 1910. The hotel was a popular destination for visitors from New York City and other parts of the country. The village also had a number of summer camps, including Camp Walton, which was established in 1912.
Geography
Walton Park is located in the foothills of the Catskill Mountains, about 20 miles west of the city of Oneonta. The village is situated at an elevation of 1,400 feet above sea level. The village is surrounded by rolling hills and forests, and is home to a number of small lakes and streams. The village is located in a rural area, and is home to a number of farms and small businesses.
Economy
The economy of Walton Park is largely based on tourism and agriculture. The village is home to a number of resorts and summer camps, which attract visitors from all over the country. The village is also home to a number of small farms, which produce a variety of crops, including corn, soybeans, and hay. In addition, the village is home to a number of small businesses, including restaurants, shops, and other services.
Demographics
As of the 2010 census, the population of Walton Park was 1,000. The population is largely white (94.2%), with small percentages of African American (2.2%), Asian (1.2%), and Hispanic (1.4%) residents. The median household income in the village is $41,250, and the median age is 43. The village is home to a number of churches, including the Walton Park United Methodist Church, which was established in 1820.
Common Questions
What is Per Capita Income in Walton Park?
Per Capita income in Walton Park is $53,677.
What is the Median Family Income in Walton Park?
Median Family Income in Walton Park is $135,441.
What is the Median Household income in Walton Park?
Median Household Income in Walton Park is $140,614.
What is Income or Wage Gap in Walton Park?
Income or Wage Gap in Walton Park is 42.3%.
Women in Walton Park earn 57.7 cents for every dollar earned by a man.
What is Inequality or Gini Index in Walton Park?
Inequality or Gini Index in Walton Park is 0.36.
What is the Total Population of Walton Park?
Total Population of Walton Park is 4,139.
What is the Total Male Population of Walton Park?
Total Male Population of Walton Park is 2,054.
What is the Total Female Population of Walton Park?
Total Female Population of Walton Park is 2,085.
What is the Ratio of Males per 100 Females in Walton Park?
There are 98.51 Males per 100 Females in Walton Park.
What is the Ratio of Females per 100 Males in Walton Park?
There are 101.51 Females per 100 Males in Walton Park.
What is the Median Population Age in Walton Park?
Median Population Age in Walton Park is 45.1 Years.
What is the Average Family Size in Walton Park
Average Family Size in Walton Park is 3.1 People.
What is the Average Household Size in Walton Park
Average Household Size in Walton Park is 2.8 People.
How Large is the Labor Force in Walton Park?
There are 2,305 People in the Labor Forcein in Walton Park.
What is the Percentage of People in the Labor Force in Walton Park?
67.7% of People are in the Labor Force in Walton Park.
What is the Unemployment Rate in Walton Park?
Unemployment Rate in Walton Park is 5.0%.