Mastic, NY Map & Demographics
Mastic Map
Mastic Overview
$35,839
PER CAPITA INCOME
$102,665
AVG FAMILY INCOME
$96,648
AVG HOUSEHOLD INCOME
24.1%
WAGE / INCOME GAP [ % ]
75.9¢/ $1
WAGE / INCOME GAP [ $ ]
0.40
INEQUALITY / GINI INDEX
14,968
TOTAL POPULATION
7,688
MALE POPULATION
7,280
FEMALE POPULATION
105.60
MALES / 100 FEMALES
94.69
FEMALES / 100 MALES
32.8
MEDIAN AGE
3.7
AVG FAMILY SIZE
3.4
AVG HOUSEHOLD SIZE
7,551
LABOR FORCE [ PEOPLE ]
64.1%
PERCENT IN LABOR FORCE
8.9%
UNEMPLOYMENT RATE
Mastic Zip Codes
Income in Mastic
Income Overview in Mastic
Per Capita Income in Mastic is $35,839, while median incomes of families and households are $102,665 and $96,648 respectively.
| Characteristic | Number | Measure |
| Per Capita Income | 14,968 | $35,839 |
| Median Family Income | 3,592 | $102,665 |
| Mean Family Income | 3,592 | $118,585 |
| Median Household Income | 4,334 | $96,648 |
| Mean Household Income | 4,334 | $116,178 |
| Income Deficit | 3,592 | $0 |
| Wage / Income Gap (%) | 14,968 | 24.06% |
| Wage / Income Gap ($) | 14,968 | 75.94¢ per $1 |
| Gini / Inequality Index | 14,968 | 0.40 |
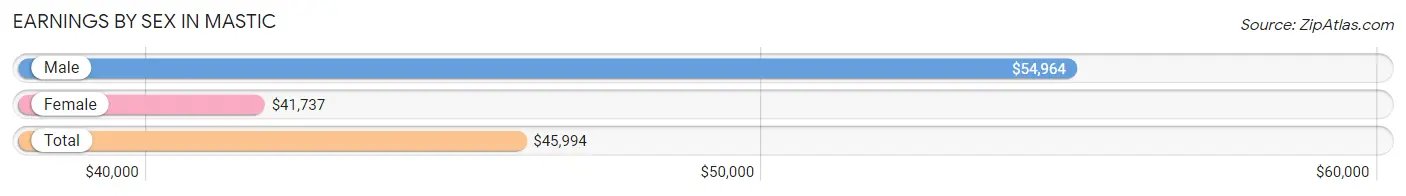
Earnings by Sex in Mastic
Average Earnings in Mastic are $45,994, $54,964 for men and $41,737 for women, a difference of 24.1%.
| Sex | Number | Average Earnings |
| Male | 4,091 (54.4%) | $54,964 |
| Female | 3,433 (45.6%) | $41,737 |
| Total | 7,524 (100.0%) | $45,994 |
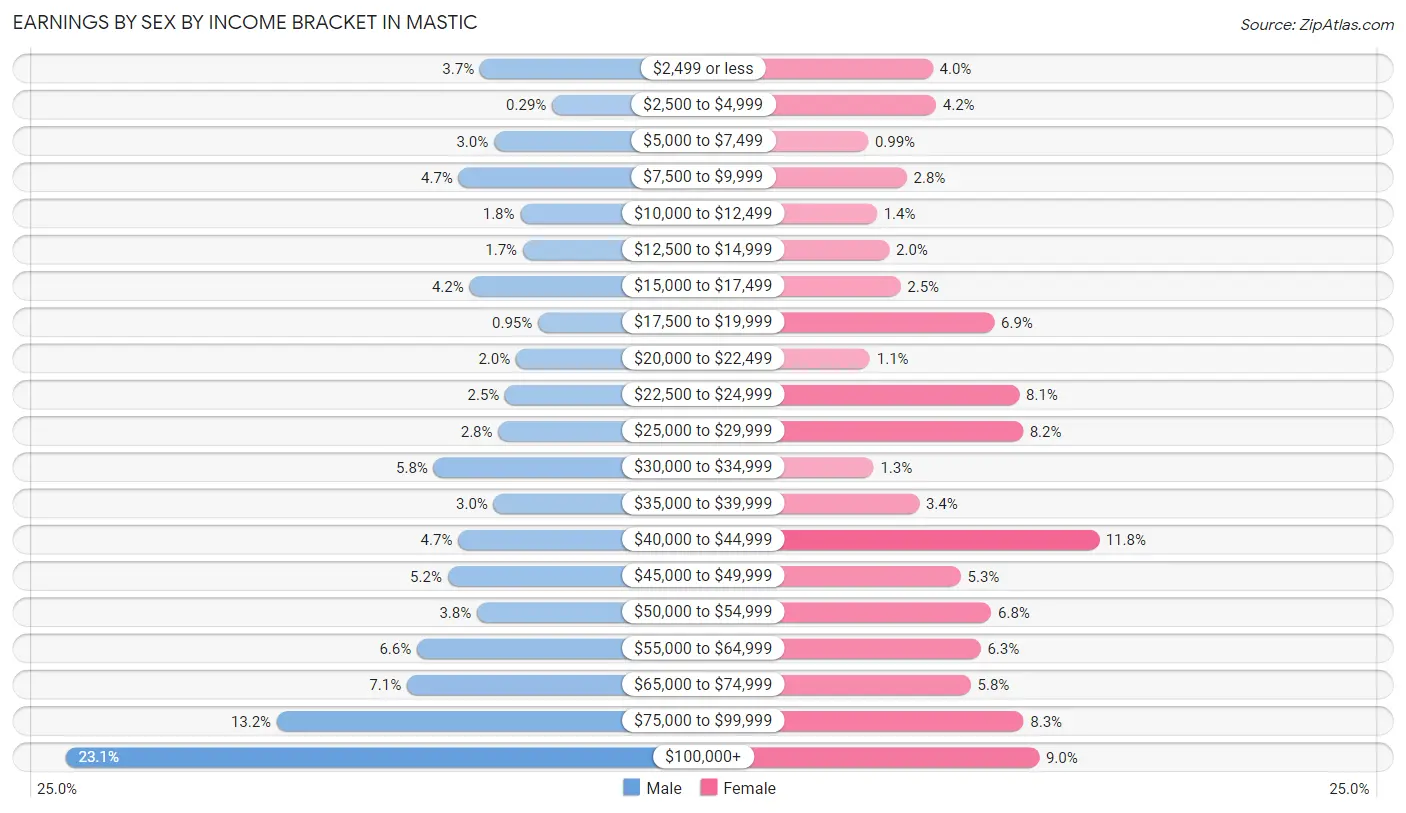
Earnings by Sex by Income Bracket in Mastic
The most common earnings brackets in Mastic are $100,000+ for men (944 | 23.1%) and $40,000 to $44,999 for women (405 | 11.8%).
| Income | Male | Female |
| $2,499 or less | 150 (3.7%) | 138 (4.0%) |
| $2,500 to $4,999 | 12 (0.3%) | 143 (4.2%) |
| $5,000 to $7,499 | 123 (3.0%) | 34 (1.0%) |
| $7,500 to $9,999 | 191 (4.7%) | 96 (2.8%) |
| $10,000 to $12,499 | 73 (1.8%) | 48 (1.4%) |
| $12,500 to $14,999 | 68 (1.7%) | 68 (2.0%) |
| $15,000 to $17,499 | 170 (4.2%) | 86 (2.5%) |
| $17,500 to $19,999 | 39 (0.9%) | 237 (6.9%) |
| $20,000 to $22,499 | 81 (2.0%) | 37 (1.1%) |
| $22,500 to $24,999 | 102 (2.5%) | 277 (8.1%) |
| $25,000 to $29,999 | 115 (2.8%) | 283 (8.2%) |
| $30,000 to $34,999 | 239 (5.8%) | 43 (1.3%) |
| $35,000 to $39,999 | 124 (3.0%) | 116 (3.4%) |
| $40,000 to $44,999 | 192 (4.7%) | 405 (11.8%) |
| $45,000 to $49,999 | 212 (5.2%) | 183 (5.3%) |
| $50,000 to $54,999 | 156 (3.8%) | 232 (6.8%) |
| $55,000 to $64,999 | 271 (6.6%) | 215 (6.3%) |
| $65,000 to $74,999 | 290 (7.1%) | 199 (5.8%) |
| $75,000 to $99,999 | 539 (13.2%) | 284 (8.3%) |
| $100,000+ | 944 (23.1%) | 309 (9.0%) |
| Total | 4,091 (100.0%) | 3,433 (100.0%) |
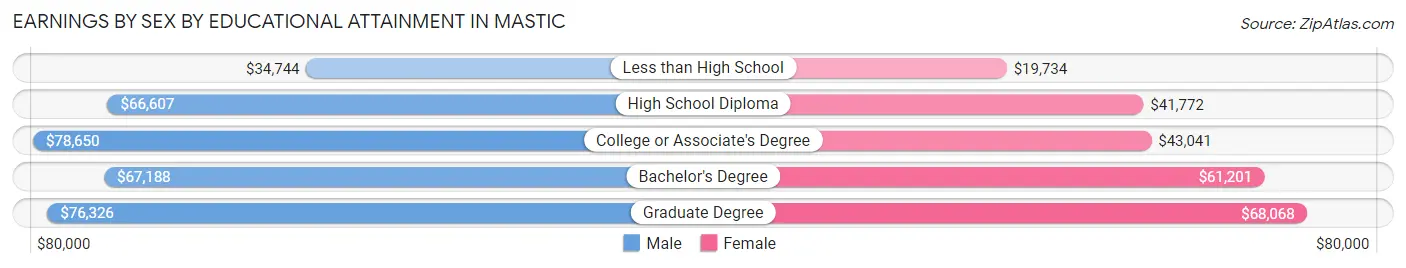
Earnings by Sex by Educational Attainment in Mastic
Average earnings in Mastic are $67,481 for men and $44,146 for women, a difference of 34.6%. Men with an educational attainment of college or associate's degree enjoy the highest average annual earnings of $78,650, while those with less than high school education earn the least with $34,744. Women with an educational attainment of graduate degree earn the most with the average annual earnings of $68,068, while those with less than high school education have the smallest earnings of $19,734.
| Educational Attainment | Male Income | Female Income |
| Less than High School | $34,744 | $19,734 |
| High School Diploma | $66,607 | $41,772 |
| College or Associate's Degree | $78,650 | $43,041 |
| Bachelor's Degree | $67,188 | $61,201 |
| Graduate Degree | $76,326 | $68,068 |
| Total | $67,481 | $44,146 |
Family Income in Mastic
Family Income Brackets in Mastic
According to the Mastic family income data, there are 887 families falling into the $100,000 to $149,999 income range, which is the most common income bracket and makes up 24.7% of all families. Conversely, the $10,000 to $14,999 income bracket is the least frequent group with only 29 families (0.8%) belonging to this category.
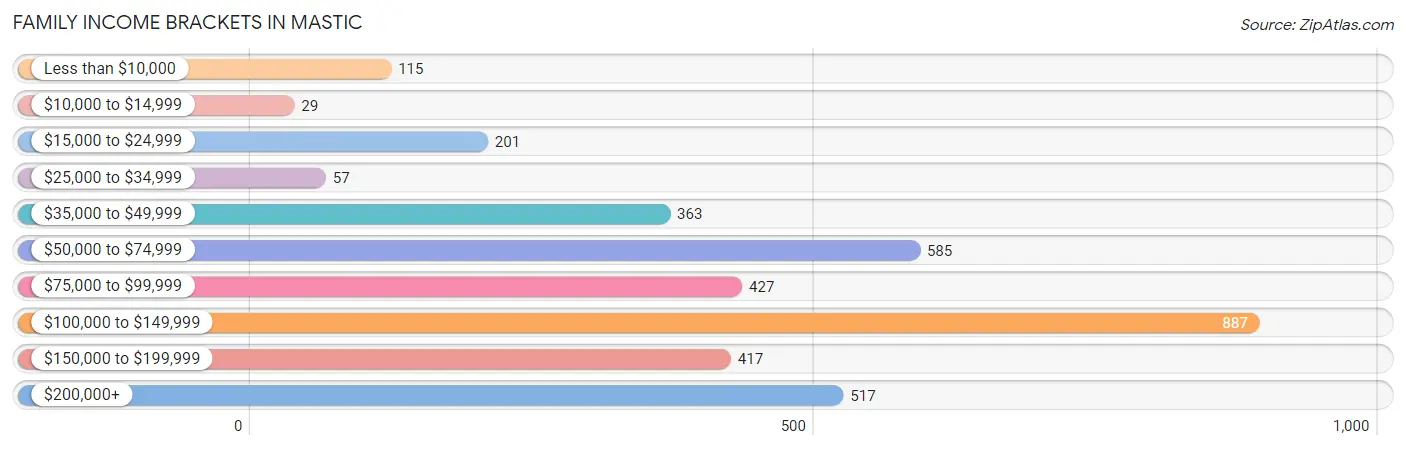
| Income Bracket | # Families | % Families |
| Less than $10,000 | 115 | 3.2% |
| $10,000 to $14,999 | 29 | 0.8% |
| $15,000 to $24,999 | 201 | 5.6% |
| $25,000 to $34,999 | 57 | 1.6% |
| $35,000 to $49,999 | 363 | 10.1% |
| $50,000 to $74,999 | 585 | 16.3% |
| $75,000 to $99,999 | 427 | 11.9% |
| $100,000 to $149,999 | 887 | 24.7% |
| $150,000 to $199,999 | 417 | 11.6% |
| $200,000+ | 517 | 14.4% |
Family Income by Famaliy Size in Mastic
7+ person families (65 | 1.8%) account for the highest median family income in Mastic with $198,063 per family, while 3-person families (1,039 | 28.9%) have the highest median income of $40,042 per family member.
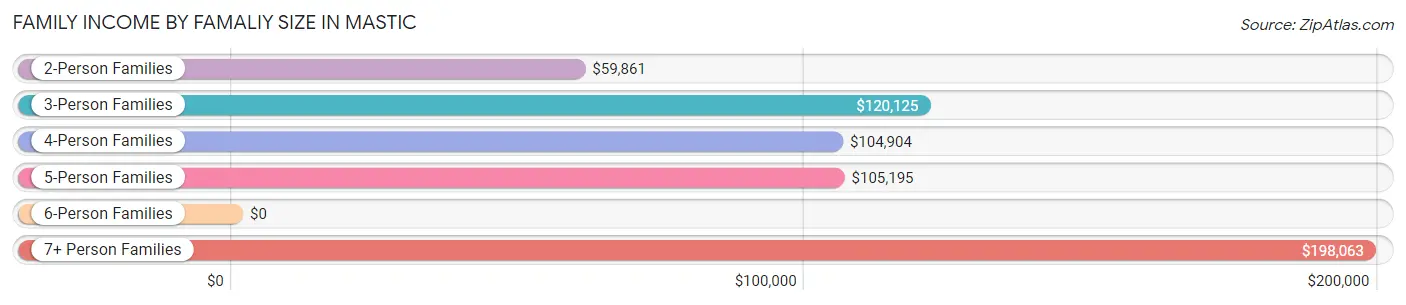
| Income Bracket | # Families | Median Income |
| 2-Person Families | 1,113 (31.0%) | $59,861 |
| 3-Person Families | 1,039 (28.9%) | $120,125 |
| 4-Person Families | 627 (17.5%) | $104,904 |
| 5-Person Families | 595 (16.6%) | $105,195 |
| 6-Person Families | 153 (4.3%) | $0 |
| 7+ Person Families | 65 (1.8%) | $198,063 |
| Total | 3,592 (100.0%) | $102,665 |
Family Income by Number of Earners in Mastic
The median family income in Mastic is $102,665, with families comprising 3+ earners (704) having the highest median family income of $149,551, while families with no earners (405) have the lowest median family income of $37,328, accounting for 19.6% and 11.3% of families, respectively.
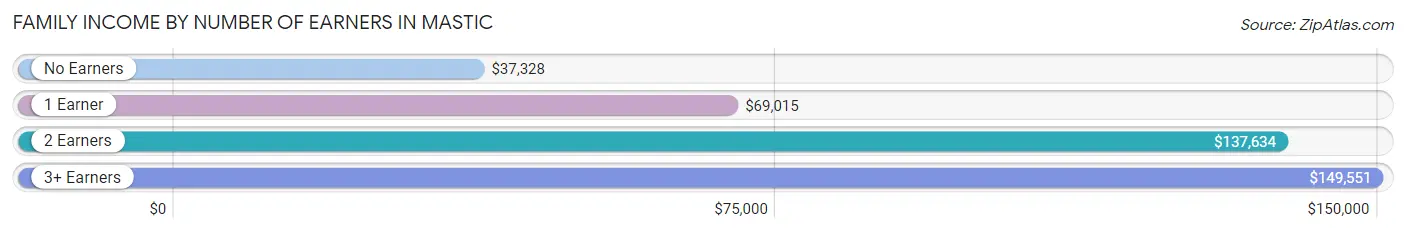
| Number of Earners | # Families | Median Income |
| No Earners | 405 (11.3%) | $37,328 |
| 1 Earner | 1,386 (38.6%) | $69,015 |
| 2 Earners | 1,097 (30.5%) | $137,634 |
| 3+ Earners | 704 (19.6%) | $149,551 |
| Total | 3,592 (100.0%) | $102,665 |
Household Income in Mastic
Household Income Brackets in Mastic
With 953 households falling in the category, the $100,000 to $149,999 income range is the most frequent in Mastic, accounting for 22.0% of all households. In contrast, only 69 households (1.6%) fall into the $10,000 to $14,999 income bracket, making it the least populous group.
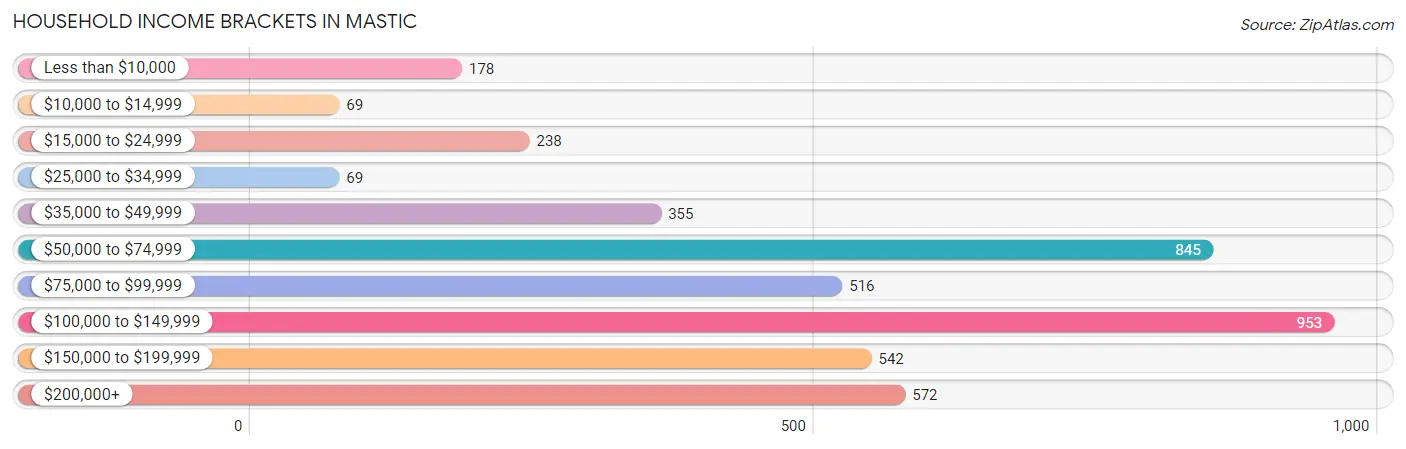
| Income Bracket | # Households | % Households |
| Less than $10,000 | 178 | 4.1% |
| $10,000 to $14,999 | 69 | 1.6% |
| $15,000 to $24,999 | 238 | 5.5% |
| $25,000 to $34,999 | 69 | 1.6% |
| $35,000 to $49,999 | 355 | 8.2% |
| $50,000 to $74,999 | 845 | 19.5% |
| $75,000 to $99,999 | 516 | 11.9% |
| $100,000 to $149,999 | 953 | 22.0% |
| $150,000 to $199,999 | 542 | 12.5% |
| $200,000+ | 572 | 13.2% |
Household Income by Householder Age in Mastic
The median household income in Mastic is $96,648, with the highest median household income of $115,391 found in the 45 to 64 years age bracket for the primary householder. A total of 2,015 households (46.5%) fall into this category. Meanwhile, the 65+ years age bracket for the primary householder has the lowest median household income of $68,750, with 820 households (18.9%) in this group.
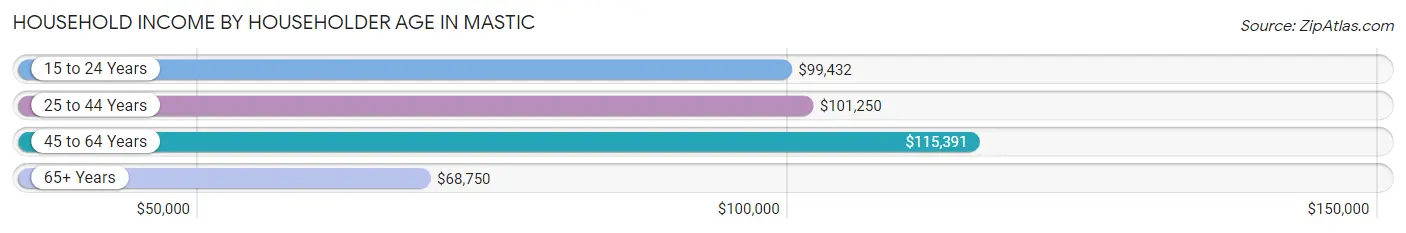
| Income Bracket | # Households | Median Income |
| 15 to 24 Years | 96 (2.2%) | $99,432 |
| 25 to 44 Years | 1,403 (32.4%) | $101,250 |
| 45 to 64 Years | 2,015 (46.5%) | $115,391 |
| 65+ Years | 820 (18.9%) | $68,750 |
| Total | 4,334 (100.0%) | $96,648 |
Poverty in Mastic
Income Below Poverty by Sex and Age in Mastic
With 12.4% poverty level for males and 11.1% for females among the residents of Mastic, 15 year old males and 12 to 14 year old females are the most vulnerable to poverty, with 80 males (33.2%) and 99 females (22.1%) in their respective age groups living below the poverty level.
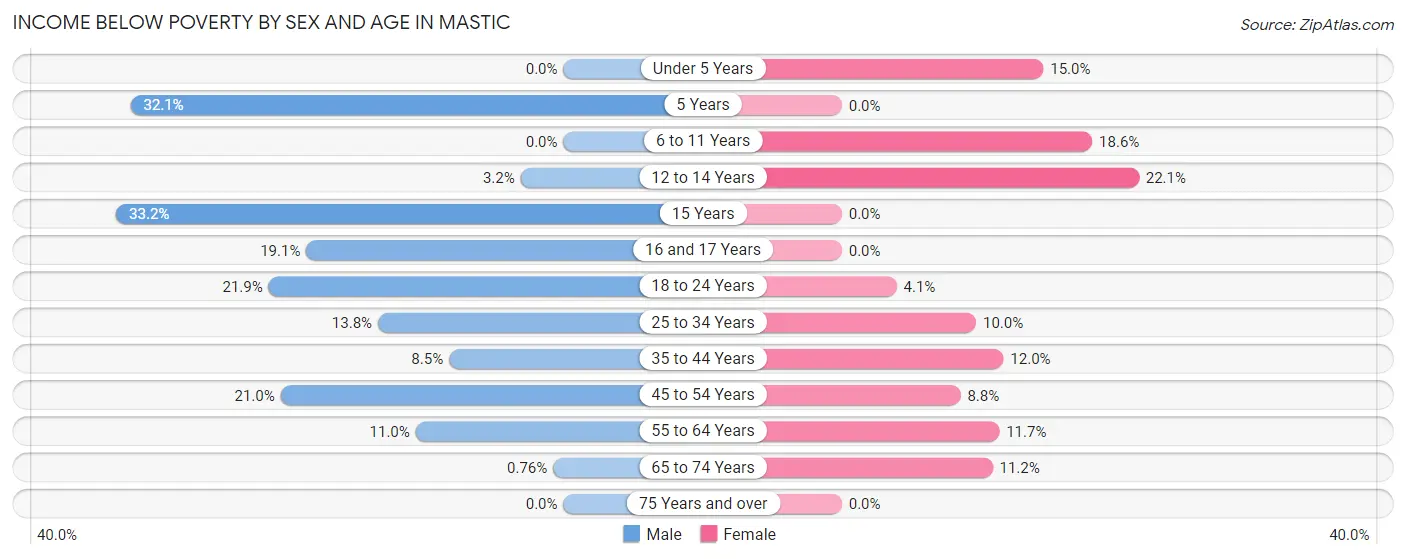
| Age Bracket | Male | Female |
| Under 5 Years | 0 (0.0%) | 86 (15.0%) |
| 5 Years | 9 (32.1%) | 0 (0.0%) |
| 6 to 11 Years | 0 (0.0%) | 92 (18.6%) |
| 12 to 14 Years | 11 (3.2%) | 99 (22.1%) |
| 15 Years | 80 (33.2%) | 0 (0.0%) |
| 16 and 17 Years | 80 (19.1%) | 0 (0.0%) |
| 18 to 24 Years | 236 (21.9%) | 27 (4.1%) |
| 25 to 34 Years | 159 (13.8%) | 125 (10.0%) |
| 35 to 44 Years | 74 (8.5%) | 111 (12.0%) |
| 45 to 54 Years | 198 (21.0%) | 78 (8.8%) |
| 55 to 64 Years | 103 (11.0%) | 114 (11.7%) |
| 65 to 74 Years | 4 (0.8%) | 76 (11.2%) |
| 75 Years and over | 0 (0.0%) | 0 (0.0%) |
| Total | 954 (12.4%) | 808 (11.1%) |
Income Above Poverty by Sex and Age in Mastic
According to the poverty statistics in Mastic, males aged under 5 years and females aged 5 years are the age groups that are most secure financially, with 100.0% of males and 100.0% of females in these age groups living above the poverty line.
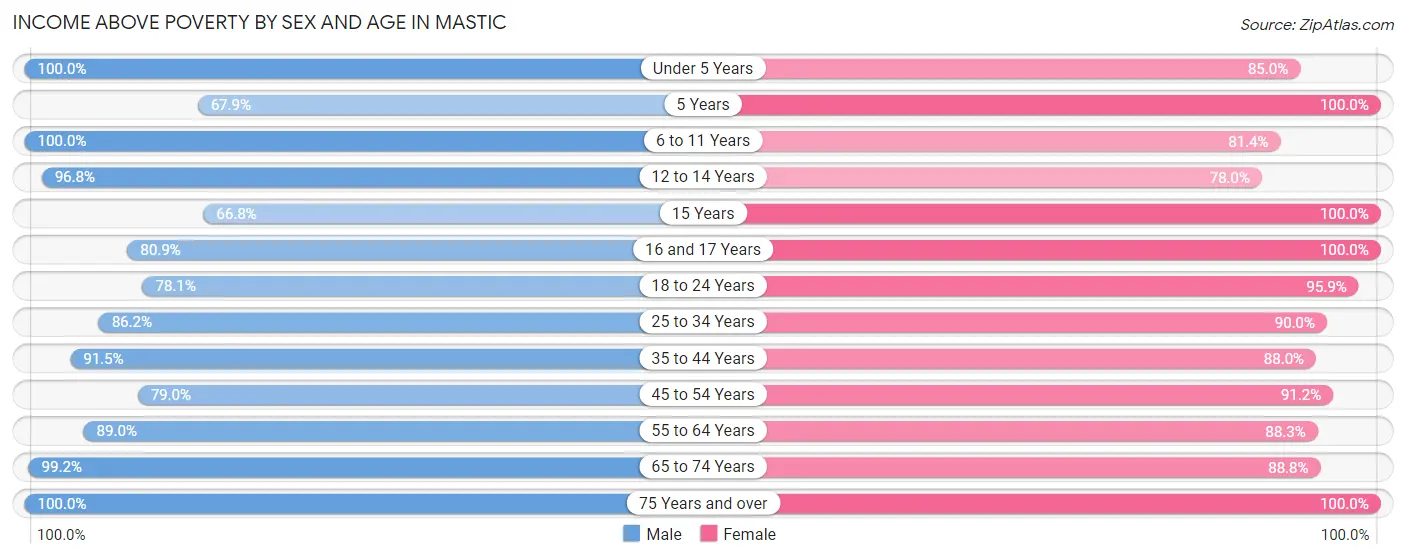
| Age Bracket | Male | Female |
| Under 5 Years | 232 (100.0%) | 489 (85.0%) |
| 5 Years | 19 (67.9%) | 48 (100.0%) |
| 6 to 11 Years | 715 (100.0%) | 403 (81.4%) |
| 12 to 14 Years | 335 (96.8%) | 350 (77.9%) |
| 15 Years | 161 (66.8%) | 18 (100.0%) |
| 16 and 17 Years | 339 (80.9%) | 155 (100.0%) |
| 18 to 24 Years | 842 (78.1%) | 636 (95.9%) |
| 25 to 34 Years | 996 (86.2%) | 1,129 (90.0%) |
| 35 to 44 Years | 798 (91.5%) | 814 (88.0%) |
| 45 to 54 Years | 745 (79.0%) | 807 (91.2%) |
| 55 to 64 Years | 836 (89.0%) | 861 (88.3%) |
| 65 to 74 Years | 519 (99.2%) | 603 (88.8%) |
| 75 Years and over | 180 (100.0%) | 135 (100.0%) |
| Total | 6,717 (87.6%) | 6,448 (88.9%) |
Income Below Poverty Among Married-Couple Families in Mastic
The poverty statistics for married-couple families in Mastic show that 4.2% or 102 of the total 2,408 families live below the poverty line. Families with no children have the highest poverty rate of 4.9%, comprising of 63 families. On the other hand, families with 3 or 4 children have the lowest poverty rate of 1.9%, which includes 6 families.
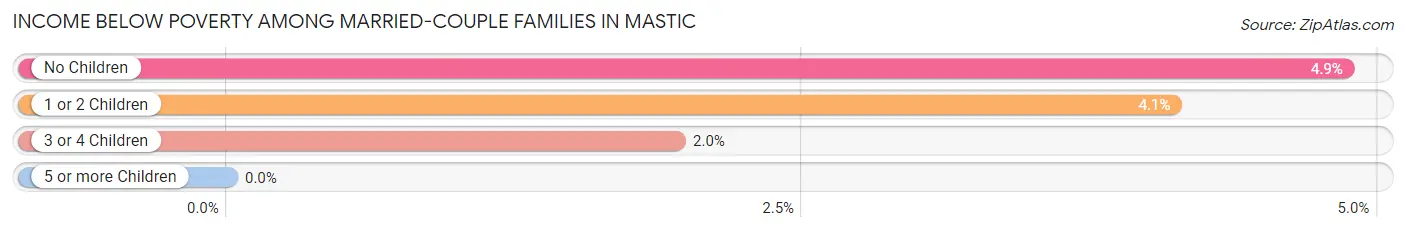
| Children | Above Poverty | Below Poverty |
| No Children | 1,234 (95.1%) | 63 (4.9%) |
| 1 or 2 Children | 770 (95.9%) | 33 (4.1%) |
| 3 or 4 Children | 302 (98.1%) | 6 (1.9%) |
| 5 or more Children | 0 (0.0%) | 0 (0.0%) |
| Total | 2,306 (95.8%) | 102 (4.2%) |
Income Below Poverty Among Single-Parent Households in Mastic
According to the poverty data in Mastic, 28.8% or 102 single-father households and 17.9% or 149 single-mother households are living below the poverty line. Among single-father households, those with 3 or 4 children have the highest poverty rate, with 85 households (86.7%) experiencing poverty. Likewise, among single-mother households, those with 3 or 4 children have the highest poverty rate, with 42 households (44.2%) falling below the poverty line.
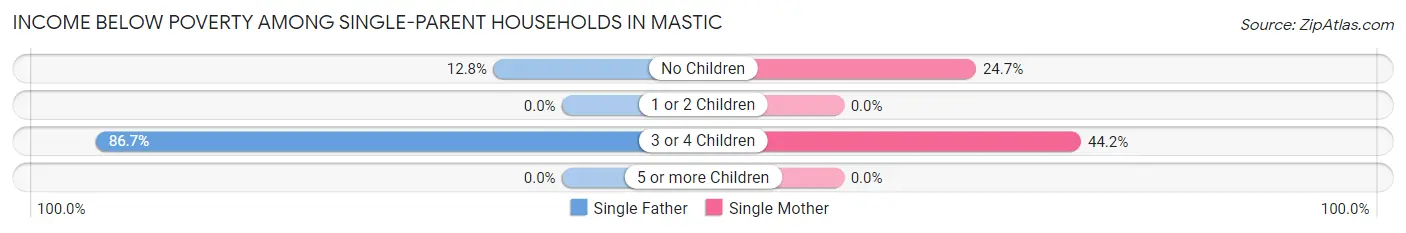
| Children | Single Father | Single Mother |
| No Children | 17 (12.8%) | 107 (24.6%) |
| 1 or 2 Children | 0 (0.0%) | 0 (0.0%) |
| 3 or 4 Children | 85 (86.7%) | 42 (44.2%) |
| 5 or more Children | 0 (0.0%) | 0 (0.0%) |
| Total | 102 (28.8%) | 149 (17.9%) |
Income Below Poverty Among Married-Couple vs Single-Parent Households in Mastic
The poverty data for Mastic shows that 102 of the married-couple family households (4.2%) and 251 of the single-parent households (21.2%) are living below the poverty level. Within the married-couple family households, those with no children have the highest poverty rate, with 63 households (4.9%) falling below the poverty line. Among the single-parent households, those with 3 or 4 children have the highest poverty rate, with 127 household (65.8%) living below poverty.
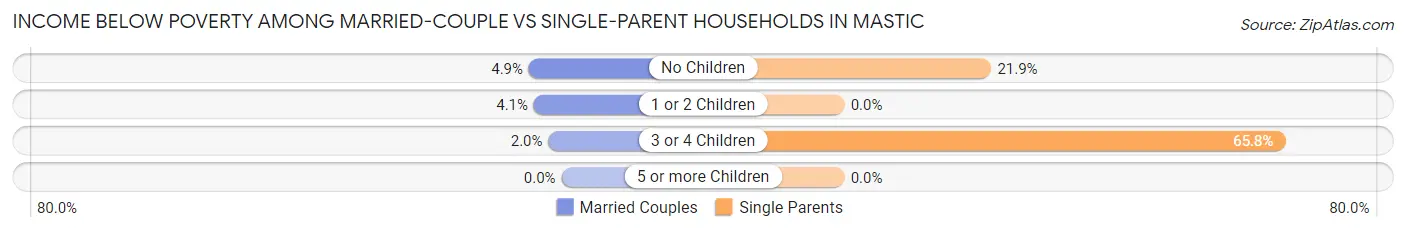
| Children | Married-Couple Families | Single-Parent Households |
| No Children | 63 (4.9%) | 124 (21.9%) |
| 1 or 2 Children | 33 (4.1%) | 0 (0.0%) |
| 3 or 4 Children | 6 (1.9%) | 127 (65.8%) |
| 5 or more Children | 0 (0.0%) | 0 (0.0%) |
| Total | 102 (4.2%) | 251 (21.2%) |
Race in Mastic
The most populous races in Mastic are White / Caucasian (12,033 | 80.4%), Hispanic or Latino (3,661 | 24.5%), and Two or more Races (1,191 | 8.0%).
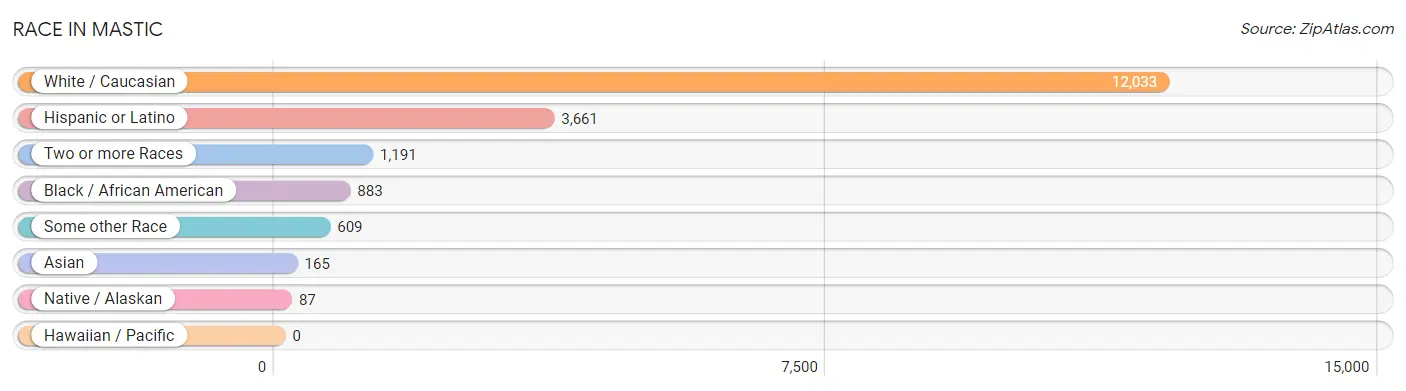
| Race | # Population | % Population |
| Asian | 165 | 1.1% |
| Black / African American | 883 | 5.9% |
| Hawaiian / Pacific | 0 | 0.0% |
| Hispanic or Latino | 3,661 | 24.5% |
| Native / Alaskan | 87 | 0.6% |
| White / Caucasian | 12,033 | 80.4% |
| Two or more Races | 1,191 | 8.0% |
| Some other Race | 609 | 4.1% |
| Total | 14,968 | 100.0% |
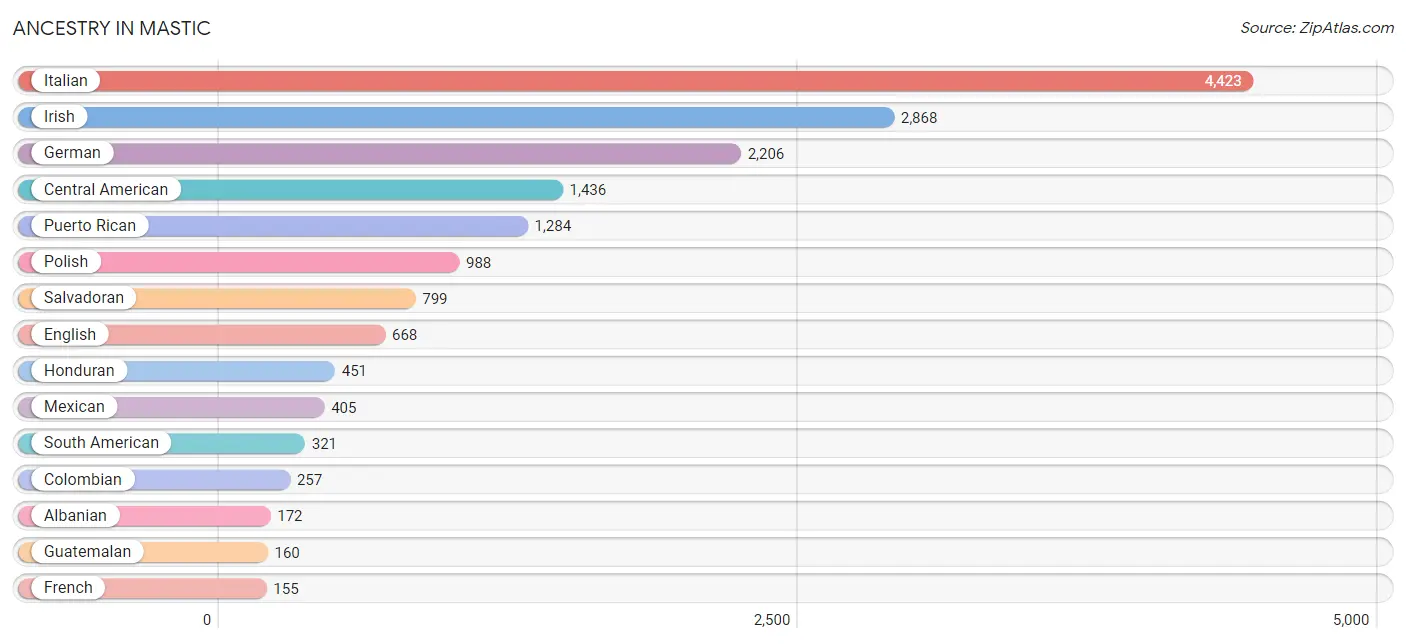
Ancestry in Mastic
The most populous ancestries reported in Mastic are Italian (4,423 | 29.5%), Irish (2,868 | 19.2%), German (2,206 | 14.7%), Central American (1,436 | 9.6%), and Puerto Rican (1,284 | 8.6%), together accounting for 81.6% of all Mastic residents.
| Ancestry | # Population | % Population |
| Albanian | 172 | 1.1% |
| American | 112 | 0.7% |
| Arab | 32 | 0.2% |
| Austrian | 17 | 0.1% |
| Burmese | 81 | 0.5% |
| Canadian | 140 | 0.9% |
| Central American | 1,436 | 9.6% |
| Central American Indian | 20 | 0.1% |
| Cherokee | 20 | 0.1% |
| Colombian | 257 | 1.7% |
| Czech | 20 | 0.1% |
| Czechoslovakian | 27 | 0.2% |
| Danish | 113 | 0.7% |
| Dominican | 70 | 0.5% |
| Dutch | 18 | 0.1% |
| Eastern European | 3 | 0.0% |
| Ecuadorian | 31 | 0.2% |
| English | 668 | 4.5% |
| European | 41 | 0.3% |
| French | 155 | 1.0% |
| French Canadian | 17 | 0.1% |
| German | 2,206 | 14.7% |
| Greek | 6 | 0.0% |
| Guatemalan | 160 | 1.1% |
| Guyanese | 16 | 0.1% |
| Honduran | 451 | 3.0% |
| Hungarian | 7 | 0.1% |
| Irish | 2,868 | 19.2% |
| Italian | 4,423 | 29.5% |
| Jamaican | 41 | 0.3% |
| Korean | 63 | 0.4% |
| Laotian | 39 | 0.3% |
| Lithuanian | 154 | 1.0% |
| Malaysian | 16 | 0.1% |
| Mexican | 405 | 2.7% |
| Mexican American Indian | 8 | 0.1% |
| Norwegian | 43 | 0.3% |
| Panamanian | 26 | 0.2% |
| Peruvian | 33 | 0.2% |
| Polish | 988 | 6.6% |
| Portuguese | 12 | 0.1% |
| Puerto Rican | 1,284 | 8.6% |
| Russian | 49 | 0.3% |
| Salvadoran | 799 | 5.3% |
| Scandinavian | 63 | 0.4% |
| Scottish | 55 | 0.4% |
| South American | 321 | 2.1% |
| Spaniard | 23 | 0.2% |
| Spanish | 92 | 0.6% |
| Sri Lankan | 16 | 0.1% |
| Swedish | 10 | 0.1% |
| Syrian | 32 | 0.2% |
| Thai | 57 | 0.4% |
| Ukrainian | 40 | 0.3% |
| Welsh | 4 | 0.0% | View All 55 Rows |
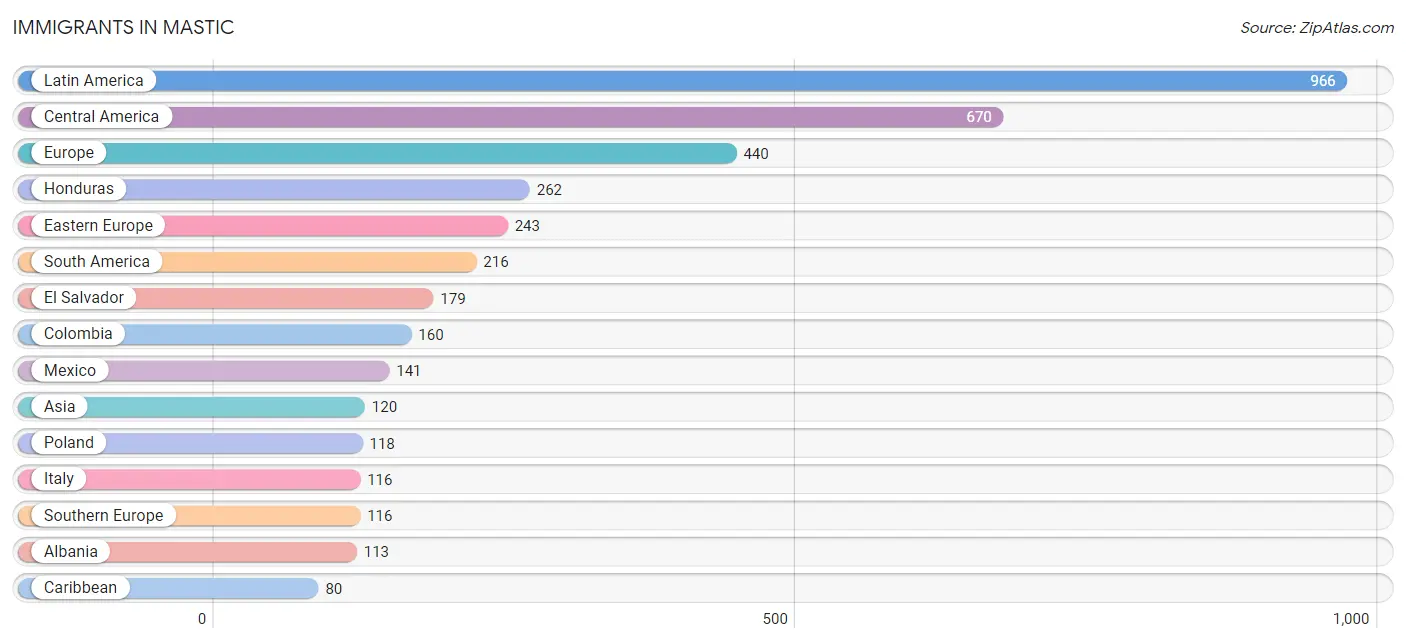
Immigrants in Mastic
The most numerous immigrant groups reported in Mastic came from Latin America (966 | 6.5%), Central America (670 | 4.5%), Europe (440 | 2.9%), Honduras (262 | 1.8%), and Eastern Europe (243 | 1.6%), together accounting for 17.2% of all Mastic residents.
| Immigration Origin | # Population | % Population |
| Albania | 113 | 0.7% |
| Asia | 120 | 0.8% |
| Brazil | 7 | 0.1% |
| Canada | 62 | 0.4% |
| Caribbean | 80 | 0.5% |
| Central America | 670 | 4.5% |
| Colombia | 160 | 1.1% |
| Dominican Republic | 18 | 0.1% |
| Eastern Asia | 29 | 0.2% |
| Eastern Europe | 243 | 1.6% |
| Ecuador | 20 | 0.1% |
| El Salvador | 179 | 1.2% |
| Europe | 440 | 2.9% |
| Germany | 66 | 0.4% |
| Guatemala | 62 | 0.4% |
| Haiti | 21 | 0.1% |
| Honduras | 262 | 1.8% |
| Indonesia | 20 | 0.1% |
| Italy | 116 | 0.8% |
| Jamaica | 41 | 0.3% |
| Korea | 29 | 0.2% |
| Laos | 6 | 0.0% |
| Latin America | 966 | 6.5% |
| Mexico | 141 | 0.9% |
| Northern Europe | 15 | 0.1% |
| Norway | 5 | 0.0% |
| Pakistan | 58 | 0.4% |
| Panama | 26 | 0.2% |
| Peru | 29 | 0.2% |
| Philippines | 7 | 0.1% |
| Poland | 118 | 0.8% |
| Russia | 12 | 0.1% |
| South America | 216 | 1.4% |
| South Central Asia | 58 | 0.4% |
| South Eastern Asia | 33 | 0.2% |
| Southern Europe | 116 | 0.8% |
| Western Europe | 66 | 0.4% | View All 37 Rows |
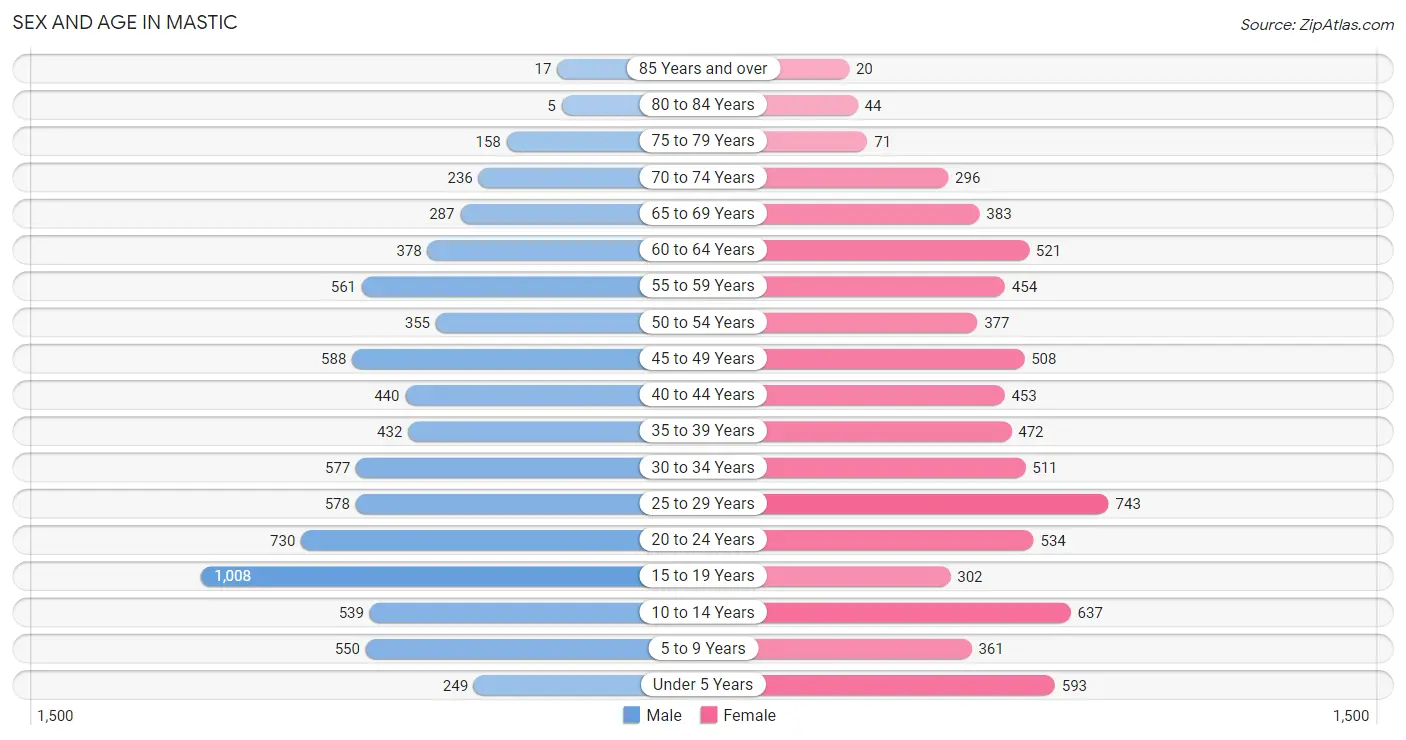
Sex and Age in Mastic
Sex and Age in Mastic
The most populous age groups in Mastic are 15 to 19 Years (1,008 | 13.1%) for men and 25 to 29 Years (743 | 10.2%) for women.
| Age Bracket | Male | Female |
| Under 5 Years | 249 (3.2%) | 593 (8.2%) |
| 5 to 9 Years | 550 (7.1%) | 361 (5.0%) |
| 10 to 14 Years | 539 (7.0%) | 637 (8.7%) |
| 15 to 19 Years | 1,008 (13.1%) | 302 (4.2%) |
| 20 to 24 Years | 730 (9.5%) | 534 (7.3%) |
| 25 to 29 Years | 578 (7.5%) | 743 (10.2%) |
| 30 to 34 Years | 577 (7.5%) | 511 (7.0%) |
| 35 to 39 Years | 432 (5.6%) | 472 (6.5%) |
| 40 to 44 Years | 440 (5.7%) | 453 (6.2%) |
| 45 to 49 Years | 588 (7.6%) | 508 (7.0%) |
| 50 to 54 Years | 355 (4.6%) | 377 (5.2%) |
| 55 to 59 Years | 561 (7.3%) | 454 (6.2%) |
| 60 to 64 Years | 378 (4.9%) | 521 (7.2%) |
| 65 to 69 Years | 287 (3.7%) | 383 (5.3%) |
| 70 to 74 Years | 236 (3.1%) | 296 (4.1%) |
| 75 to 79 Years | 158 (2.1%) | 71 (1.0%) |
| 80 to 84 Years | 5 (0.1%) | 44 (0.6%) |
| 85 Years and over | 17 (0.2%) | 20 (0.3%) |
| Total | 7,688 (100.0%) | 7,280 (100.0%) |
Families and Households in Mastic
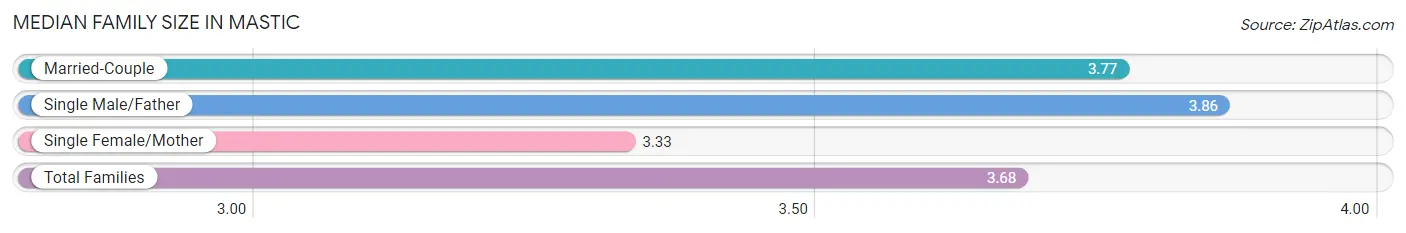
Median Family Size in Mastic
The median family size in Mastic is 3.68 persons per family, with single male/father families (354 | 9.9%) accounting for the largest median family size of 3.86 persons per family. On the other hand, single female/mother families (830 | 23.1%) represent the smallest median family size with 3.33 persons per family.
| Family Type | # Families | Family Size |
| Married-Couple | 2,408 (67.0%) | 3.77 |
| Single Male/Father | 354 (9.9%) | 3.86 |
| Single Female/Mother | 830 (23.1%) | 3.33 |
| Total Families | 3,592 (100.0%) | 3.68 |
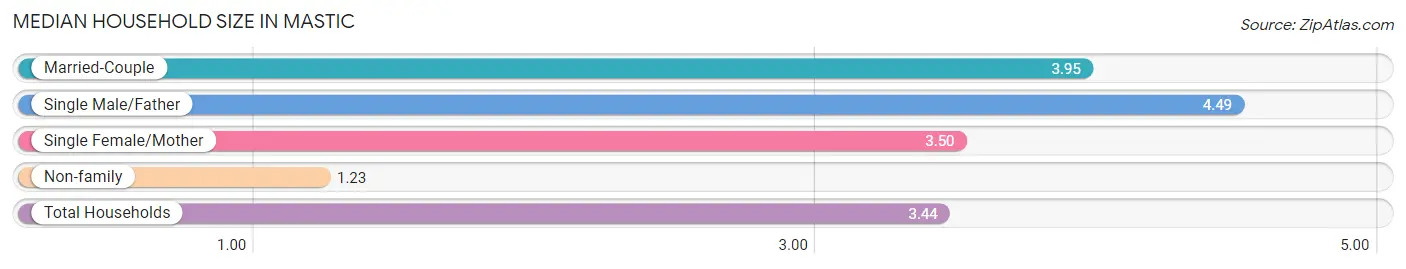
Median Household Size in Mastic
The median household size in Mastic is 3.44 persons per household, with single male/father households (354 | 8.2%) accounting for the largest median household size of 4.49 persons per household. non-family households (742 | 17.1%) represent the smallest median household size with 1.23 persons per household.
| Household Type | # Households | Household Size |
| Married-Couple | 2,408 (55.6%) | 3.95 |
| Single Male/Father | 354 (8.2%) | 4.49 |
| Single Female/Mother | 830 (19.2%) | 3.50 |
| Non-family | 742 (17.1%) | 1.23 |
| Total Households | 4,334 (100.0%) | 3.44 |
Household Size by Marriage Status in Mastic
Out of a total of 4,334 households in Mastic, 3,592 (82.9%) are family households, while 742 (17.1%) are nonfamily households. The most numerous type of family households are 2-person households, comprising 958, and the most common type of nonfamily households are 1-person households, comprising 587.
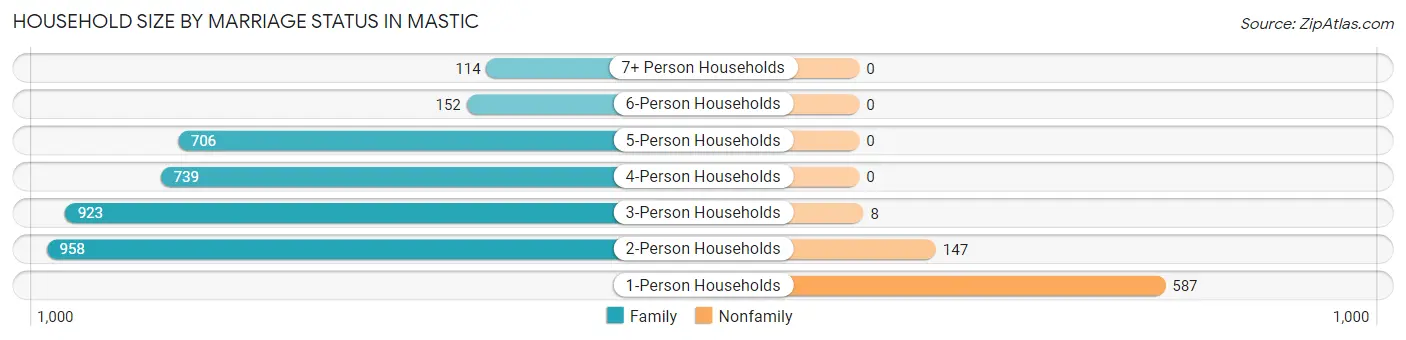
| Household Size | Family Households | Nonfamily Households |
| 1-Person Households | - | 587 (13.5%) |
| 2-Person Households | 958 (22.1%) | 147 (3.4%) |
| 3-Person Households | 923 (21.3%) | 8 (0.2%) |
| 4-Person Households | 739 (17.1%) | 0 (0.0%) |
| 5-Person Households | 706 (16.3%) | 0 (0.0%) |
| 6-Person Households | 152 (3.5%) | 0 (0.0%) |
| 7+ Person Households | 114 (2.6%) | 0 (0.0%) |
| Total | 3,592 (82.9%) | 742 (17.1%) |
Female Fertility in Mastic
Fertility by Age in Mastic
Average fertility rate in Mastic is 49.0 births per 1,000 women. Women in the age bracket of 20 to 34 years have the highest fertility rate with 79.0 births per 1,000 women. Women in the age bracket of 20 to 34 years acount for 80.1% of all women with births.
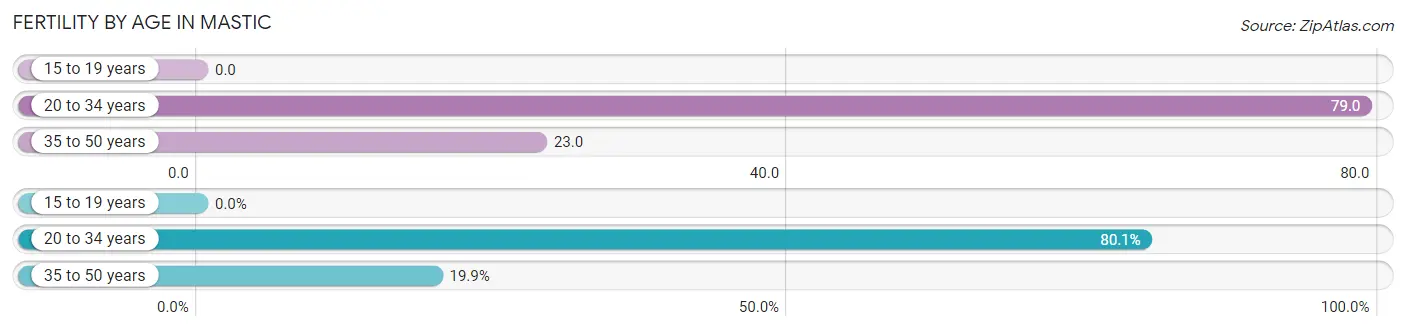
| Age Bracket | Women with Births | Births / 1,000 Women |
| 15 to 19 years | 0 (0.0%) | 0.0 |
| 20 to 34 years | 141 (80.1%) | 79.0 |
| 35 to 50 years | 35 (19.9%) | 23.0 |
| Total | 176 (100.0%) | 49.0 |
Fertility by Age by Marriage Status in Mastic
89.2% of women with births (176) in Mastic are married. The highest percentage of unmarried women with births falls into 20 to 34 years age bracket with 13.5% of them unmarried at the time of birth, while the lowest percentage of unmarried women with births belong to 35 to 50 years age bracket with 0.0% of them unmarried.
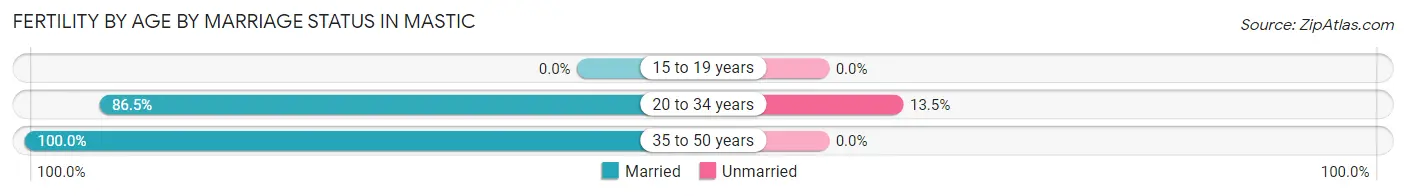
| Age Bracket | Married | Unmarried |
| 15 to 19 years | 0 (0.0%) | 0 (0.0%) |
| 20 to 34 years | 122 (86.5%) | 19 (13.5%) |
| 35 to 50 years | 35 (100.0%) | 0 (0.0%) |
| Total | 157 (89.2%) | 19 (10.8%) |
Fertility by Education in Mastic
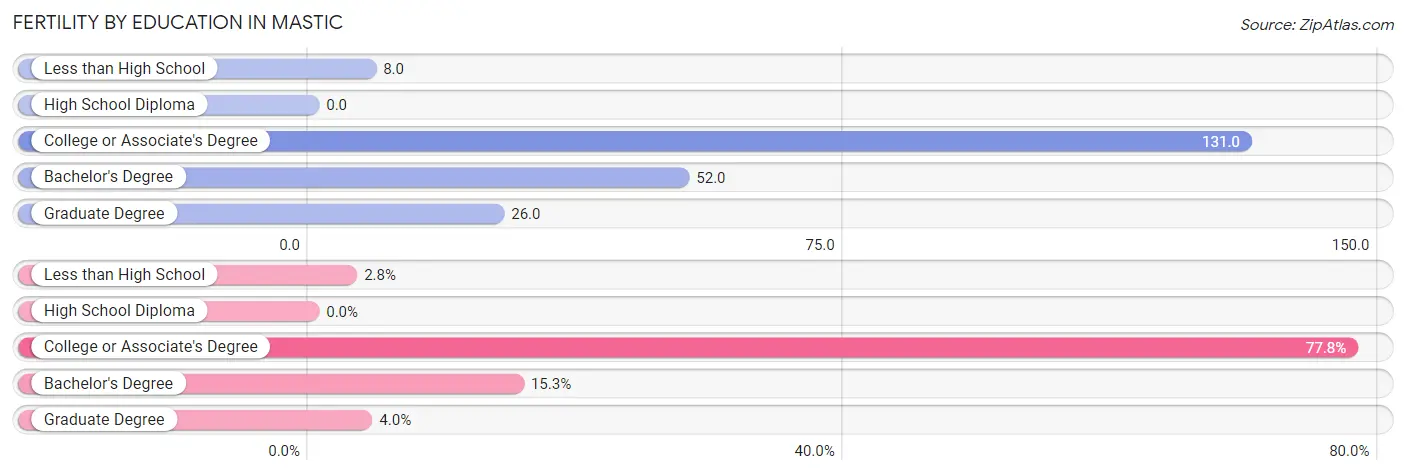
| Educational Attainment | Women with Births | Births / 1,000 Women |
| Less than High School | 5 (2.8%) | 8.0 |
| High School Diploma | 0 (0.0%) | 0.0 |
| College or Associate's Degree | 137 (77.8%) | 131.0 |
| Bachelor's Degree | 27 (15.3%) | 52.0 |
| Graduate Degree | 7 (4.0%) | 26.0 |
| Total | 176 (100.0%) | 49.0 |
Fertility by Education by Marriage Status in Mastic
10.8% of women with births in Mastic are unmarried. Women with the educational attainment of less than high school are most likely to be married with 100.0% of them married at childbirth, while women with the educational attainment of bachelor's degree are least likely to be married with 22.2% of them unmarried at childbirth.
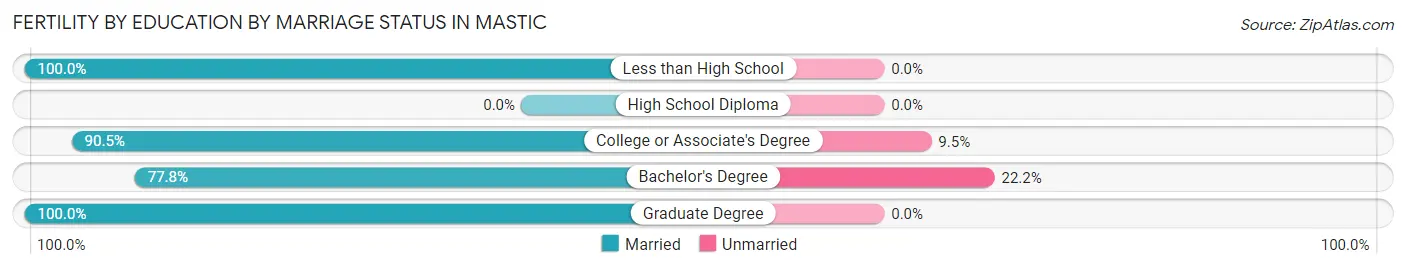
| Educational Attainment | Married | Unmarried |
| Less than High School | 5 (100.0%) | 0 (0.0%) |
| High School Diploma | 0 (0.0%) | 0 (0.0%) |
| College or Associate's Degree | 124 (90.5%) | 13 (9.5%) |
| Bachelor's Degree | 21 (77.8%) | 6 (22.2%) |
| Graduate Degree | 7 (100.0%) | 0 (0.0%) |
| Total | 157 (89.2%) | 19 (10.8%) |
Employment Characteristics in Mastic
Employment by Class of Employer in Mastic
Among the 6,758 employed individuals in Mastic, private company employees (4,514 | 66.8%), local government employees (590 | 8.7%), and not-for-profit organizations (551 | 8.2%) make up the most common classes of employment.
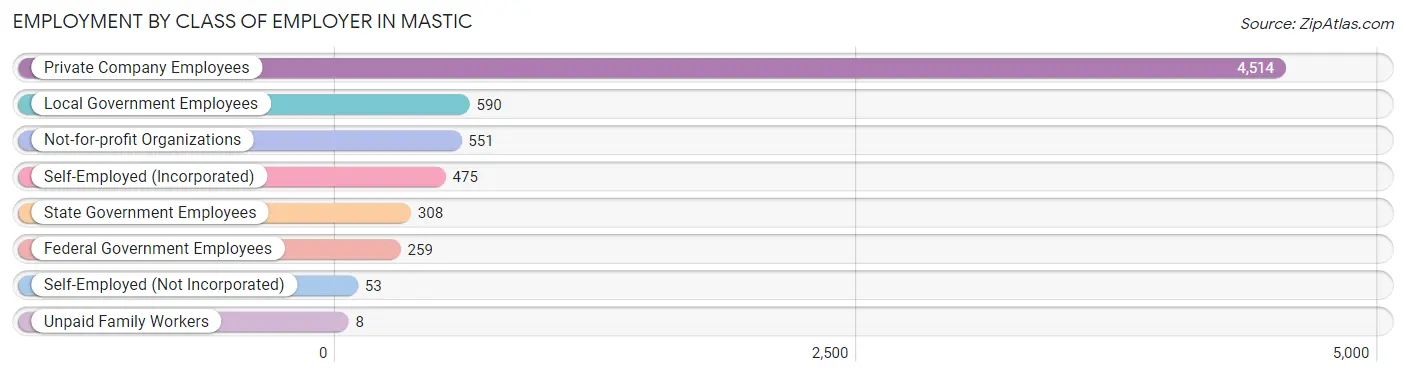
| Employer Class | # Employees | % Employees |
| Private Company Employees | 4,514 | 66.8% |
| Self-Employed (Incorporated) | 475 | 7.0% |
| Self-Employed (Not Incorporated) | 53 | 0.8% |
| Not-for-profit Organizations | 551 | 8.2% |
| Local Government Employees | 590 | 8.7% |
| State Government Employees | 308 | 4.6% |
| Federal Government Employees | 259 | 3.8% |
| Unpaid Family Workers | 8 | 0.1% |
| Total | 6,758 | 100.0% |
Employment Status by Age in Mastic
According to the labor force statistics for Mastic, out of the total population over 16 years of age (11,780), 64.1% or 7,551 individuals are in the labor force, with 8.9% or 672 of them unemployed. The age group with the highest labor force participation rate is 25 to 29 years, with 91.3% or 1,206 individuals in the labor force. Within the labor force, the 25 to 29 years age range has the highest percentage of unemployed individuals, with 22.7% or 274 of them being unemployed.
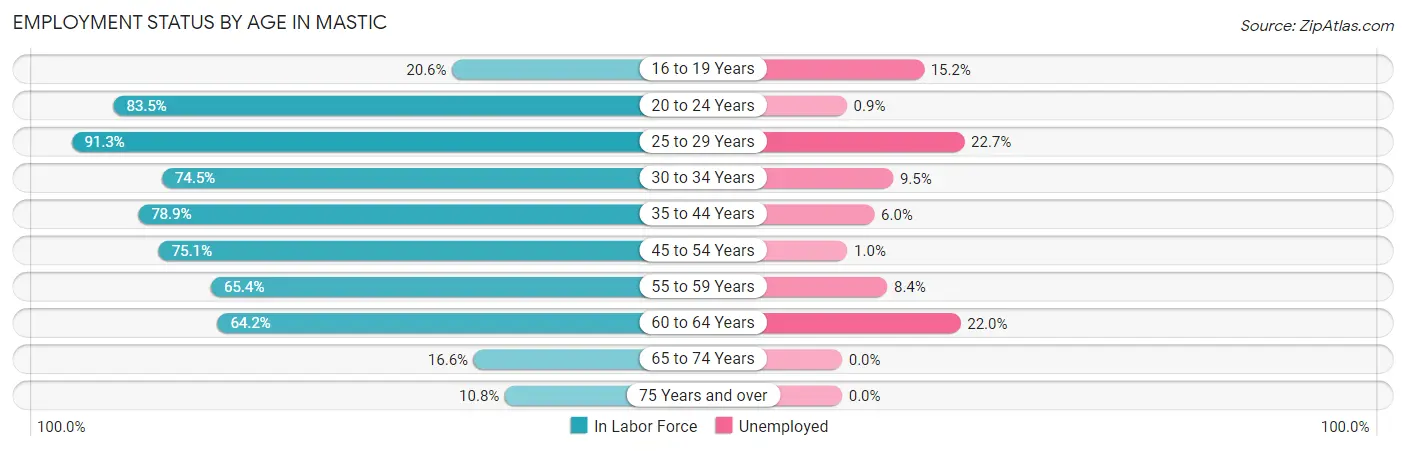
| Age Bracket | In Labor Force | Unemployed |
| 16 to 19 Years | 217 (20.6%) | 33 (15.2%) |
| 20 to 24 Years | 1,055 (83.5%) | 9 (0.9%) |
| 25 to 29 Years | 1,206 (91.3%) | 274 (22.7%) |
| 30 to 34 Years | 811 (74.5%) | 77 (9.5%) |
| 35 to 44 Years | 1,418 (78.9%) | 85 (6.0%) |
| 45 to 54 Years | 1,373 (75.1%) | 14 (1.0%) |
| 55 to 59 Years | 664 (65.4%) | 56 (8.4%) |
| 60 to 64 Years | 577 (64.2%) | 127 (22.0%) |
| 65 to 74 Years | 200 (16.6%) | 0 (0.0%) |
| 75 Years and over | 34 (10.8%) | 0 (0.0%) |
| Total | 7,551 (64.1%) | 672 (8.9%) |
Employment Status by Educational Attainment in Mastic
According to labor force statistics for Mastic, 76.1% of individuals (6,048) out of the total population between 25 and 64 years of age (7,948) are in the labor force, with 10.4% or 629 of them being unemployed. The group with the highest labor force participation rate are those with the educational attainment of bachelor's degree or higher, with 89.1% or 1,384 individuals in the labor force. Within the labor force, individuals with less than high school education have the highest percentage of unemployment, with 20.3% or 138 of them being unemployed.
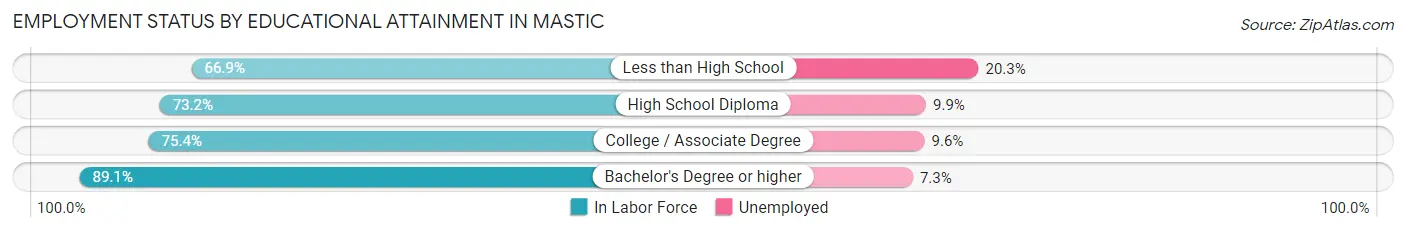
| Educational Attainment | In Labor Force | Unemployed |
| Less than High School | 679 (66.9%) | 206 (20.3%) |
| High School Diploma | 2,413 (73.2%) | 326 (9.9%) |
| College / Associate Degree | 1,571 (75.4%) | 200 (9.6%) |
| Bachelor's Degree or higher | 1,384 (89.1%) | 113 (7.3%) |
| Total | 6,048 (76.1%) | 827 (10.4%) |
Employment Occupations by Sex in Mastic
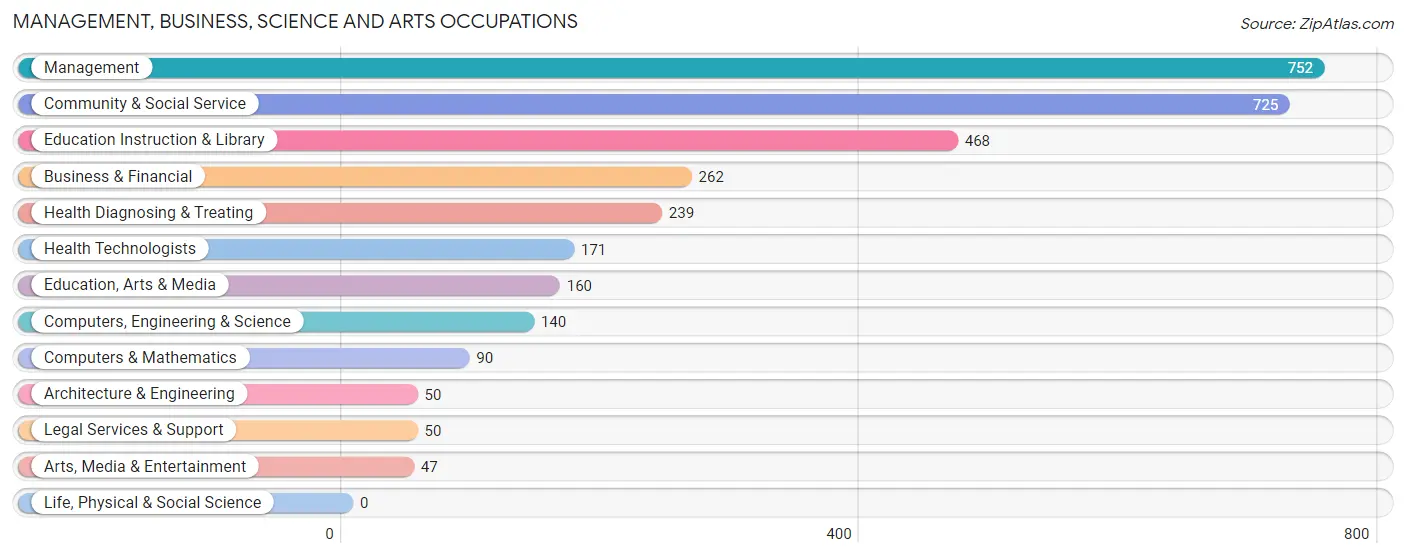
Management, Business, Science and Arts Occupations
The most common Management, Business, Science and Arts occupations in Mastic are Management (752 | 11.0%), Community & Social Service (725 | 10.6%), Education Instruction & Library (468 | 6.8%), Business & Financial (262 | 3.8%), and Health Diagnosing & Treating (239 | 3.5%).
Management, Business, Science and Arts Occupations by Sex
Within the Management, Business, Science and Arts occupations in Mastic, the most male-oriented occupations are Computers & Mathematics (100.0%), Computers, Engineering & Science (88.6%), and Business & Financial (70.6%), while the most female-oriented occupations are Arts, Media & Entertainment (100.0%), Community & Social Service (76.3%), and Education Instruction & Library (76.3%).
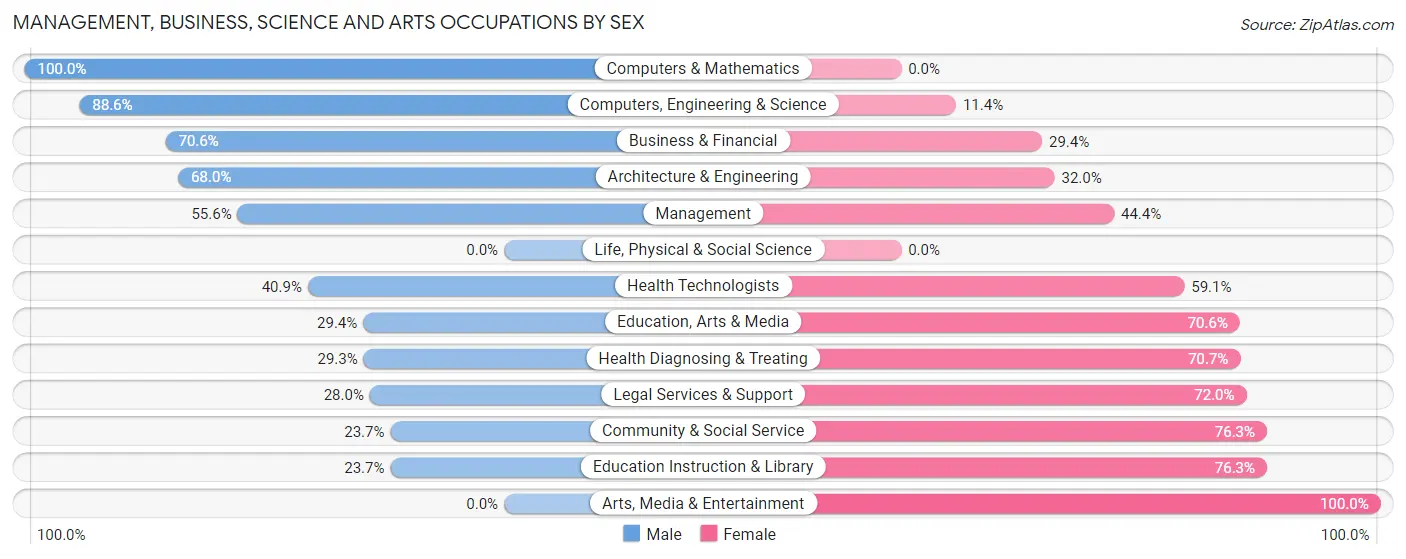
| Occupation | Male | Female |
| Management | 418 (55.6%) | 334 (44.4%) |
| Business & Financial | 185 (70.6%) | 77 (29.4%) |
| Computers, Engineering & Science | 124 (88.6%) | 16 (11.4%) |
| Computers & Mathematics | 90 (100.0%) | 0 (0.0%) |
| Architecture & Engineering | 34 (68.0%) | 16 (32.0%) |
| Life, Physical & Social Science | 0 (0.0%) | 0 (0.0%) |
| Community & Social Service | 172 (23.7%) | 553 (76.3%) |
| Education, Arts & Media | 47 (29.4%) | 113 (70.6%) |
| Legal Services & Support | 14 (28.0%) | 36 (72.0%) |
| Education Instruction & Library | 111 (23.7%) | 357 (76.3%) |
| Arts, Media & Entertainment | 0 (0.0%) | 47 (100.0%) |
| Health Diagnosing & Treating | 70 (29.3%) | 169 (70.7%) |
| Health Technologists | 70 (40.9%) | 101 (59.1%) |
| Total (Category) | 969 (45.8%) | 1,149 (54.2%) |
| Total (Overall) | 3,711 (54.1%) | 3,142 (45.9%) |
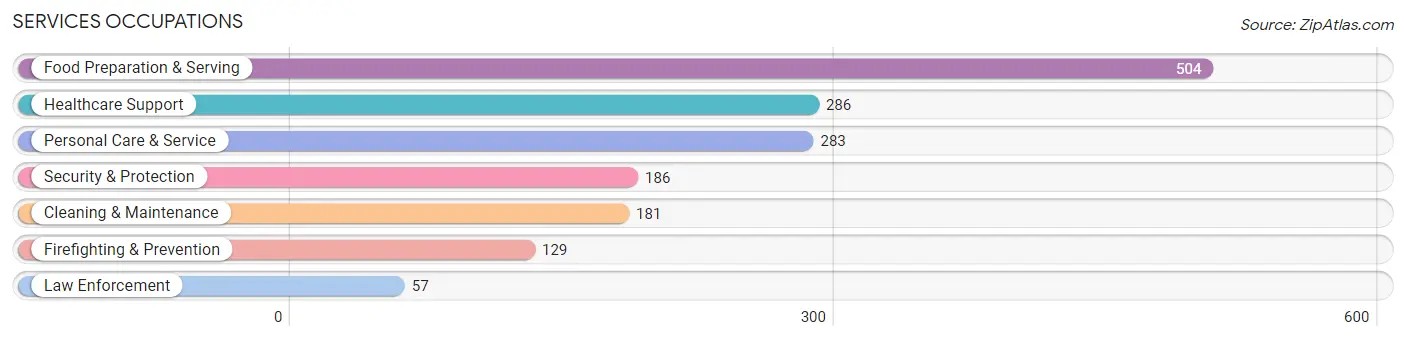
Services Occupations
The most common Services occupations in Mastic are Food Preparation & Serving (504 | 7.3%), Healthcare Support (286 | 4.2%), Personal Care & Service (283 | 4.1%), Security & Protection (186 | 2.7%), and Cleaning & Maintenance (181 | 2.6%).
Services Occupations by Sex
Within the Services occupations in Mastic, the most male-oriented occupations are Cleaning & Maintenance (87.3%), Firefighting & Prevention (70.5%), and Security & Protection (64.5%), while the most female-oriented occupations are Healthcare Support (95.1%), Personal Care & Service (89.0%), and Food Preparation & Serving (67.1%).
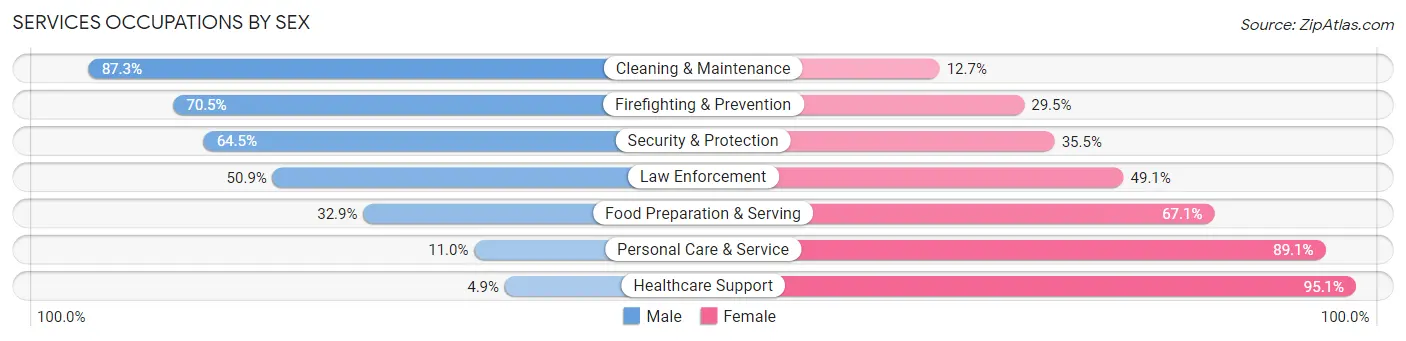
| Occupation | Male | Female |
| Healthcare Support | 14 (4.9%) | 272 (95.1%) |
| Security & Protection | 120 (64.5%) | 66 (35.5%) |
| Firefighting & Prevention | 91 (70.5%) | 38 (29.5%) |
| Law Enforcement | 29 (50.9%) | 28 (49.1%) |
| Food Preparation & Serving | 166 (32.9%) | 338 (67.1%) |
| Cleaning & Maintenance | 158 (87.3%) | 23 (12.7%) |
| Personal Care & Service | 31 (11.0%) | 252 (89.0%) |
| Total (Category) | 489 (34.0%) | 951 (66.0%) |
| Total (Overall) | 3,711 (54.1%) | 3,142 (45.9%) |
Sales and Office Occupations
The most common Sales and Office occupations in Mastic are Sales & Related (726 | 10.6%), and Office & Administration (650 | 9.5%).

Sales and Office Occupations by Sex
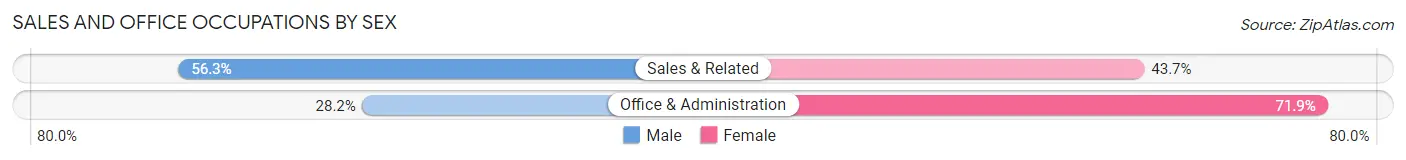
| Occupation | Male | Female |
| Sales & Related | 409 (56.3%) | 317 (43.7%) |
| Office & Administration | 183 (28.1%) | 467 (71.9%) |
| Total (Category) | 592 (43.0%) | 784 (57.0%) |
| Total (Overall) | 3,711 (54.1%) | 3,142 (45.9%) |
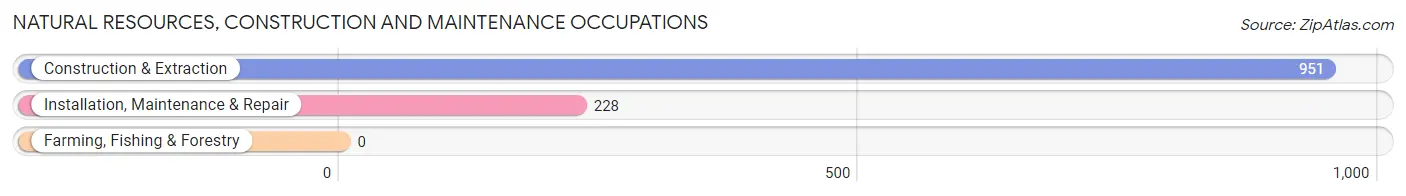
Natural Resources, Construction and Maintenance Occupations
The most common Natural Resources, Construction and Maintenance occupations in Mastic are Construction & Extraction (951 | 13.9%), and Installation, Maintenance & Repair (228 | 3.3%).
Natural Resources, Construction and Maintenance Occupations by Sex
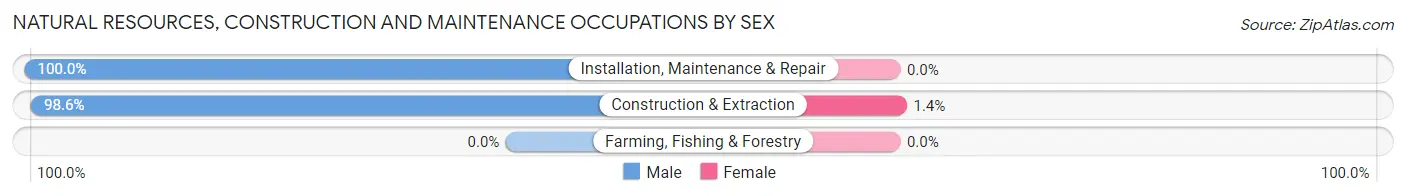
| Occupation | Male | Female |
| Farming, Fishing & Forestry | 0 (0.0%) | 0 (0.0%) |
| Construction & Extraction | 938 (98.6%) | 13 (1.4%) |
| Installation, Maintenance & Repair | 228 (100.0%) | 0 (0.0%) |
| Total (Category) | 1,166 (98.9%) | 13 (1.1%) |
| Total (Overall) | 3,711 (54.1%) | 3,142 (45.9%) |
Production, Transportation and Moving Occupations
The most common Production, Transportation and Moving occupations in Mastic are Material Moving (258 | 3.8%), Transportation (242 | 3.5%), and Production (240 | 3.5%).
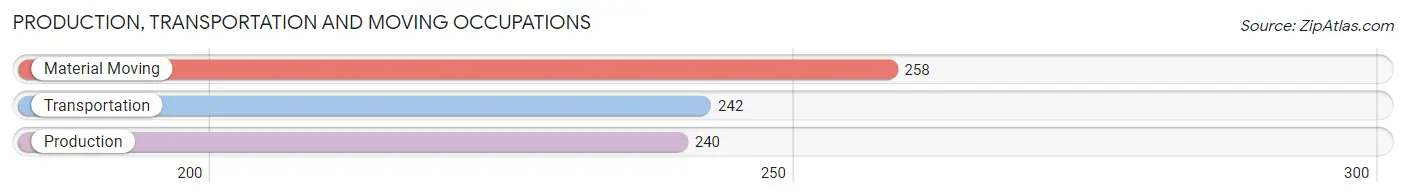
Production, Transportation and Moving Occupations by Sex
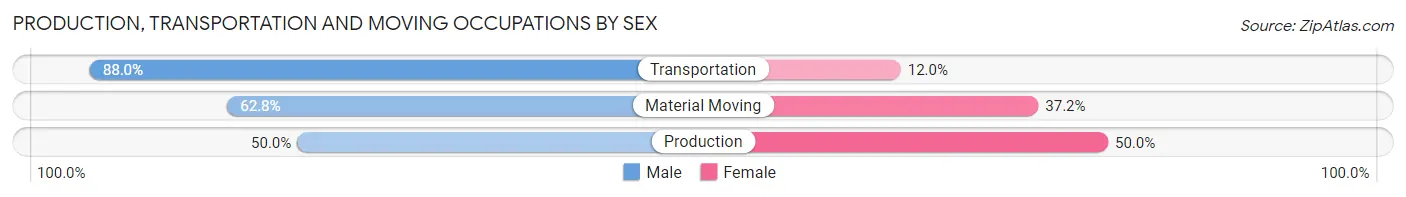
| Occupation | Male | Female |
| Production | 120 (50.0%) | 120 (50.0%) |
| Transportation | 213 (88.0%) | 29 (12.0%) |
| Material Moving | 162 (62.8%) | 96 (37.2%) |
| Total (Category) | 495 (66.9%) | 245 (33.1%) |
| Total (Overall) | 3,711 (54.1%) | 3,142 (45.9%) |
Employment Industries by Sex in Mastic
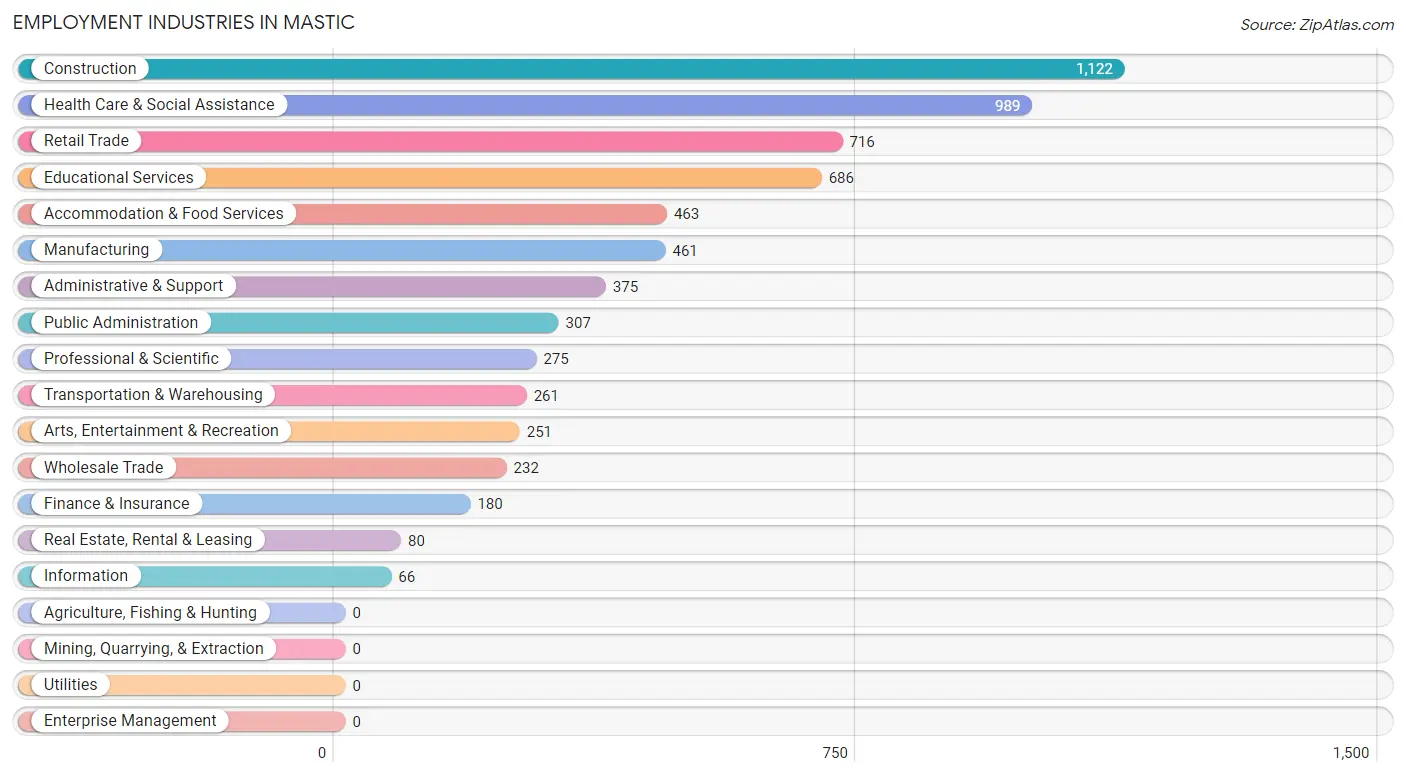
Employment Industries in Mastic
The major employment industries in Mastic include Construction (1,122 | 16.4%), Health Care & Social Assistance (989 | 14.4%), Retail Trade (716 | 10.4%), Educational Services (686 | 10.0%), and Accommodation & Food Services (463 | 6.8%).
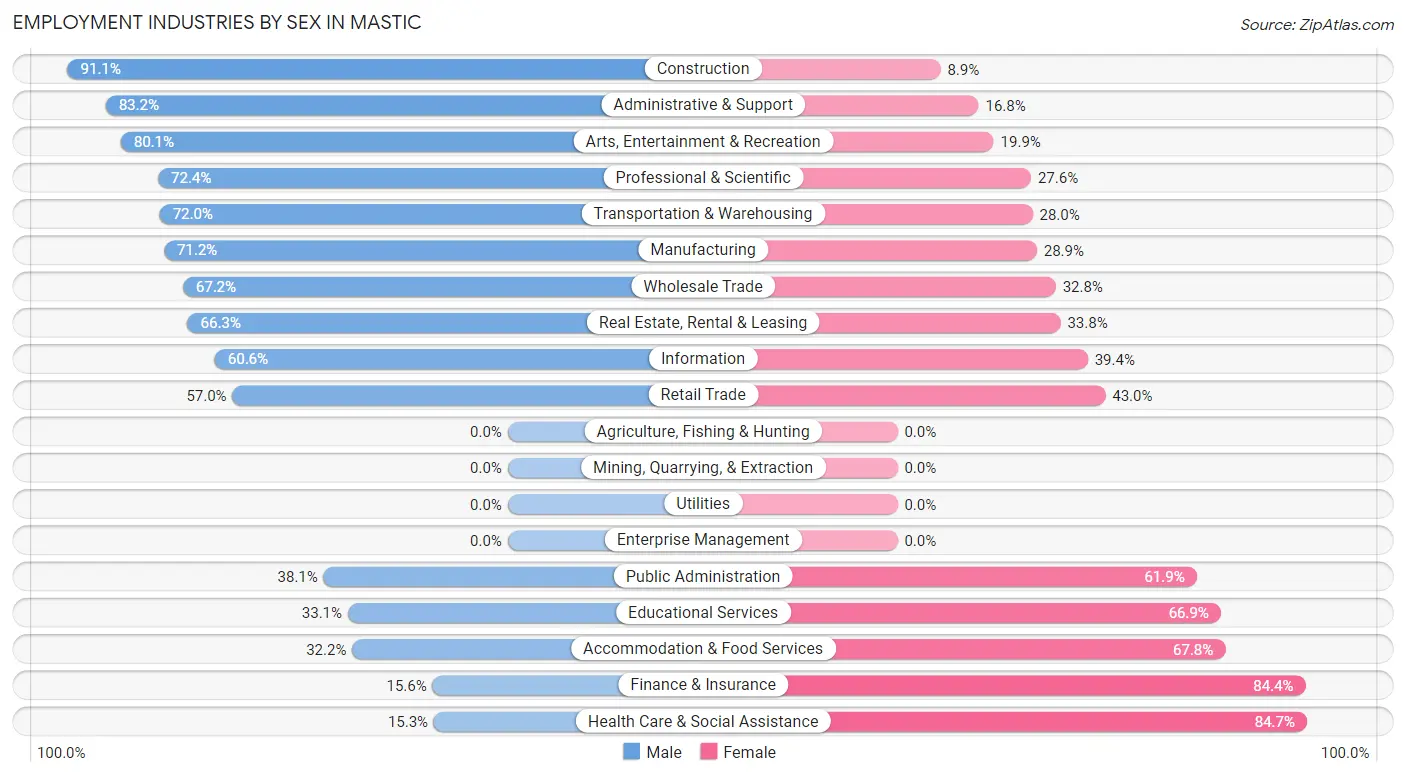
Employment Industries by Sex in Mastic
The Mastic industries that see more men than women are Construction (91.1%), Administrative & Support (83.2%), and Arts, Entertainment & Recreation (80.1%), whereas the industries that tend to have a higher number of women are Health Care & Social Assistance (84.7%), Finance & Insurance (84.4%), and Accommodation & Food Services (67.8%).
| Industry | Male | Female |
| Agriculture, Fishing & Hunting | 0 (0.0%) | 0 (0.0%) |
| Mining, Quarrying, & Extraction | 0 (0.0%) | 0 (0.0%) |
| Construction | 1,022 (91.1%) | 100 (8.9%) |
| Manufacturing | 328 (71.2%) | 133 (28.8%) |
| Wholesale Trade | 156 (67.2%) | 76 (32.8%) |
| Retail Trade | 408 (57.0%) | 308 (43.0%) |
| Transportation & Warehousing | 188 (72.0%) | 73 (28.0%) |
| Utilities | 0 (0.0%) | 0 (0.0%) |
| Information | 40 (60.6%) | 26 (39.4%) |
| Finance & Insurance | 28 (15.6%) | 152 (84.4%) |
| Real Estate, Rental & Leasing | 53 (66.2%) | 27 (33.8%) |
| Professional & Scientific | 199 (72.4%) | 76 (27.6%) |
| Enterprise Management | 0 (0.0%) | 0 (0.0%) |
| Administrative & Support | 312 (83.2%) | 63 (16.8%) |
| Educational Services | 227 (33.1%) | 459 (66.9%) |
| Health Care & Social Assistance | 151 (15.3%) | 838 (84.7%) |
| Arts, Entertainment & Recreation | 201 (80.1%) | 50 (19.9%) |
| Accommodation & Food Services | 149 (32.2%) | 314 (67.8%) |
| Public Administration | 117 (38.1%) | 190 (61.9%) |
| Total | 3,711 (54.1%) | 3,142 (45.9%) |
Education in Mastic
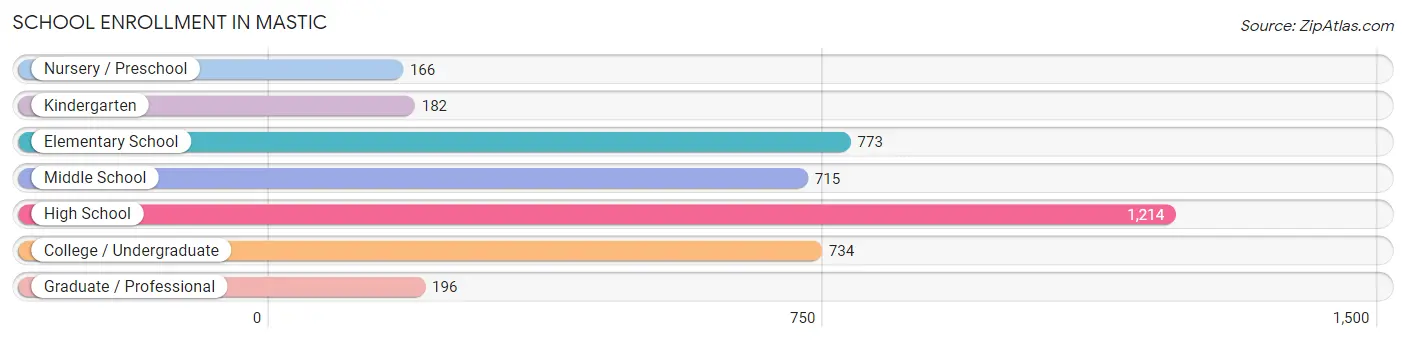
School Enrollment in Mastic
The most common levels of schooling among the 3,980 students in Mastic are high school (1,214 | 30.5%), elementary school (773 | 19.4%), and college / undergraduate (734 | 18.4%).
| School Level | # Students | % Students |
| Nursery / Preschool | 166 | 4.2% |
| Kindergarten | 182 | 4.6% |
| Elementary School | 773 | 19.4% |
| Middle School | 715 | 18.0% |
| High School | 1,214 | 30.5% |
| College / Undergraduate | 734 | 18.4% |
| Graduate / Professional | 196 | 4.9% |
| Total | 3,980 | 100.0% |
School Enrollment by Age by Funding Source in Mastic
Out of a total of 3,980 students who are enrolled in schools in Mastic, 438 (11.0%) attend a private institution, while the remaining 3,542 (89.0%) are enrolled in public schools. The age group of 20 to 24 year olds has the highest likelihood of being enrolled in private schools, with 234 (57.1% in the age bracket) enrolled. Conversely, the age group of 18 to 19 year olds has the lowest likelihood of being enrolled in a private school, with 318 (97.9% in the age bracket) attending a public institution.
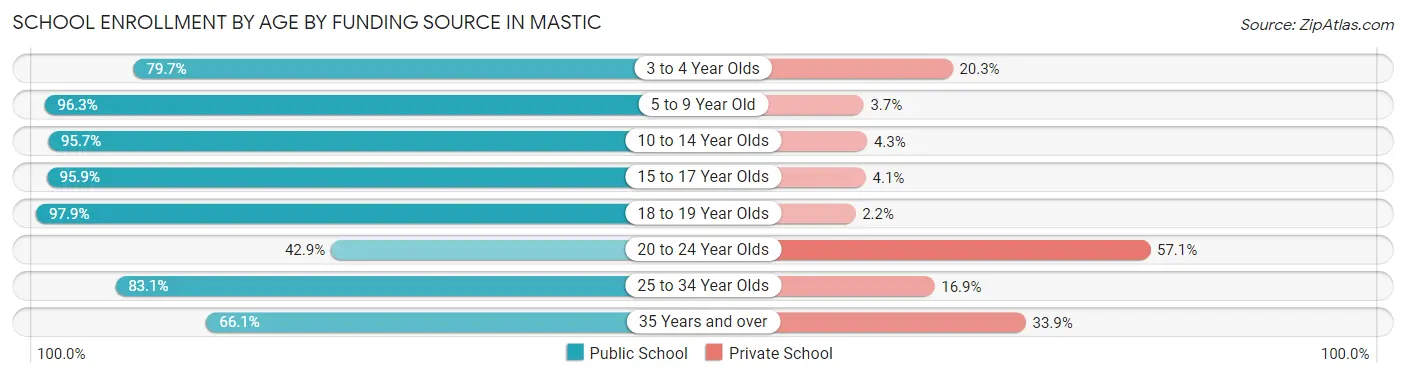
| Age Bracket | Public School | Private School |
| 3 to 4 Year Olds | 122 (79.7%) | 31 (20.3%) |
| 5 to 9 Year Old | 835 (96.3%) | 32 (3.7%) |
| 10 to 14 Year Olds | 1,125 (95.7%) | 51 (4.3%) |
| 15 to 17 Year Olds | 799 (95.9%) | 34 (4.1%) |
| 18 to 19 Year Olds | 318 (97.9%) | 7 (2.1%) |
| 20 to 24 Year Olds | 176 (42.9%) | 234 (57.1%) |
| 25 to 34 Year Olds | 128 (83.1%) | 26 (16.9%) |
| 35 Years and over | 41 (66.1%) | 21 (33.9%) |
| Total | 3,542 (89.0%) | 438 (11.0%) |
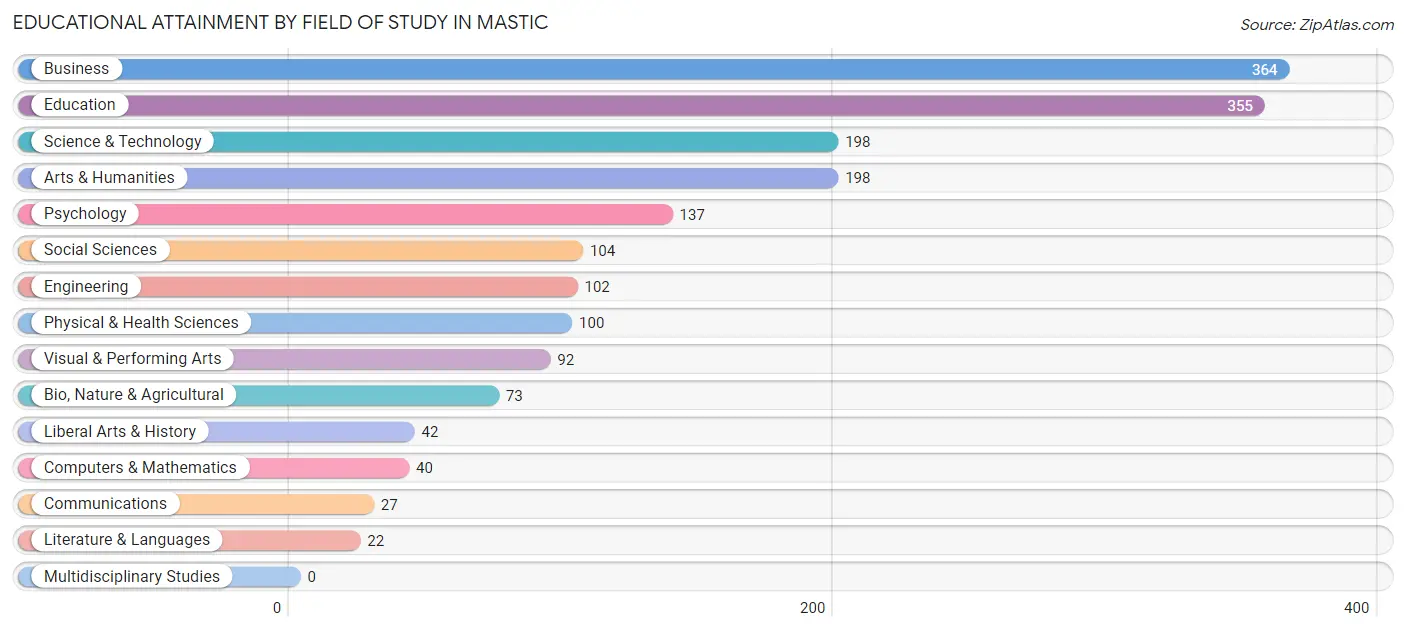
Educational Attainment by Field of Study in Mastic
Business (364 | 19.6%), education (355 | 19.2%), science & technology (198 | 10.7%), arts & humanities (198 | 10.7%), and psychology (137 | 7.4%) are the most common fields of study among 1,854 individuals in Mastic who have obtained a bachelor's degree or higher.
| Field of Study | # Graduates | % Graduates |
| Computers & Mathematics | 40 | 2.2% |
| Bio, Nature & Agricultural | 73 | 3.9% |
| Physical & Health Sciences | 100 | 5.4% |
| Psychology | 137 | 7.4% |
| Social Sciences | 104 | 5.6% |
| Engineering | 102 | 5.5% |
| Multidisciplinary Studies | 0 | 0.0% |
| Science & Technology | 198 | 10.7% |
| Business | 364 | 19.6% |
| Education | 355 | 19.2% |
| Literature & Languages | 22 | 1.2% |
| Liberal Arts & History | 42 | 2.3% |
| Visual & Performing Arts | 92 | 5.0% |
| Communications | 27 | 1.5% |
| Arts & Humanities | 198 | 10.7% |
| Total | 1,854 | 100.0% |
Transportation & Commute in Mastic
Vehicle Availability by Sex in Mastic
The most prevalent vehicle ownership categories in Mastic are males with 2 vehicles (1,477, accounting for 40.1%) and females with 2 vehicles (1,176, making up 48.3%).
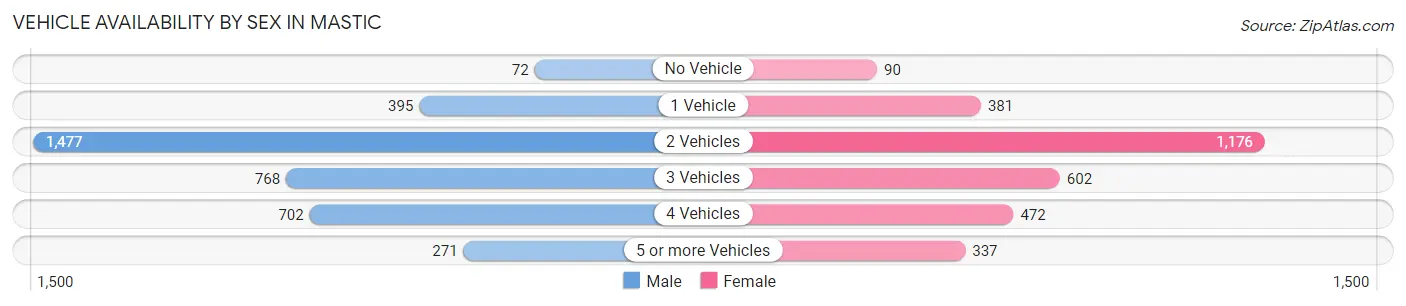
| Vehicles Available | Male | Female |
| No Vehicle | 72 (1.9%) | 90 (2.9%) |
| 1 Vehicle | 395 (10.7%) | 381 (12.5%) |
| 2 Vehicles | 1,477 (40.1%) | 1,176 (38.5%) |
| 3 Vehicles | 768 (20.8%) | 602 (19.7%) |
| 4 Vehicles | 702 (19.1%) | 472 (15.4%) |
| 5 or more Vehicles | 271 (7.3%) | 337 (11.0%) |
| Total | 3,685 (100.0%) | 3,058 (100.0%) |
Commute Time in Mastic
The most frequently occuring commute durations in Mastic are 30 to 34 minutes (1,579 commuters, 24.2%), 15 to 19 minutes (1,057 commuters, 16.2%), and 20 to 24 minutes (920 commuters, 14.1%).
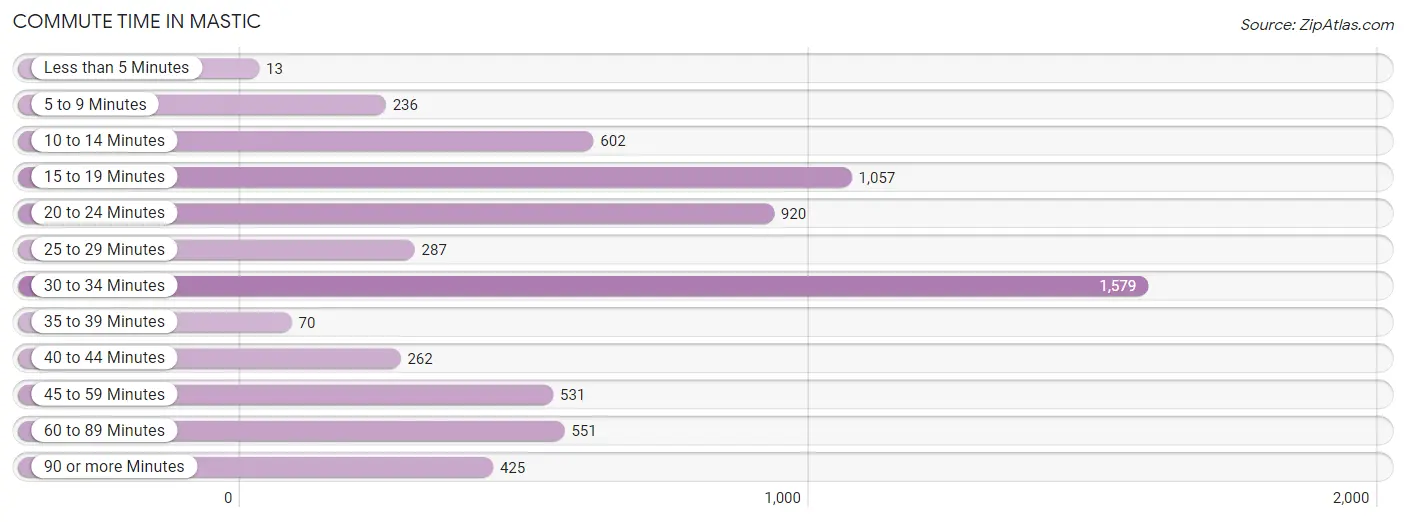
| Commute Time | # Commuters | % Commuters |
| Less than 5 Minutes | 13 | 0.2% |
| 5 to 9 Minutes | 236 | 3.6% |
| 10 to 14 Minutes | 602 | 9.2% |
| 15 to 19 Minutes | 1,057 | 16.2% |
| 20 to 24 Minutes | 920 | 14.1% |
| 25 to 29 Minutes | 287 | 4.4% |
| 30 to 34 Minutes | 1,579 | 24.2% |
| 35 to 39 Minutes | 70 | 1.1% |
| 40 to 44 Minutes | 262 | 4.0% |
| 45 to 59 Minutes | 531 | 8.1% |
| 60 to 89 Minutes | 551 | 8.4% |
| 90 or more Minutes | 425 | 6.5% |
Commute Time by Sex in Mastic
The most common commute times in Mastic are 30 to 34 minutes (973 commuters, 27.2%) for males and 30 to 34 minutes (606 commuters, 20.5%) for females.
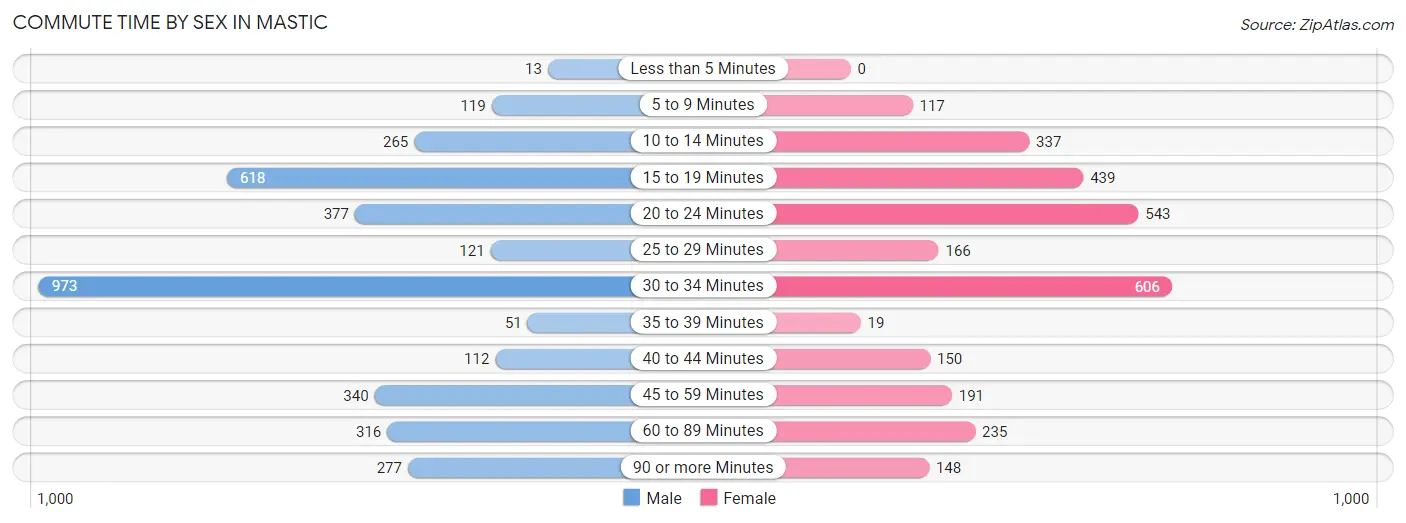
| Commute Time | Male | Female |
| Less than 5 Minutes | 13 (0.4%) | 0 (0.0%) |
| 5 to 9 Minutes | 119 (3.3%) | 117 (4.0%) |
| 10 to 14 Minutes | 265 (7.4%) | 337 (11.4%) |
| 15 to 19 Minutes | 618 (17.2%) | 439 (14.9%) |
| 20 to 24 Minutes | 377 (10.5%) | 543 (18.4%) |
| 25 to 29 Minutes | 121 (3.4%) | 166 (5.6%) |
| 30 to 34 Minutes | 973 (27.2%) | 606 (20.5%) |
| 35 to 39 Minutes | 51 (1.4%) | 19 (0.6%) |
| 40 to 44 Minutes | 112 (3.1%) | 150 (5.1%) |
| 45 to 59 Minutes | 340 (9.5%) | 191 (6.5%) |
| 60 to 89 Minutes | 316 (8.8%) | 235 (8.0%) |
| 90 or more Minutes | 277 (7.7%) | 148 (5.0%) |
Time of Departure to Work by Sex in Mastic
The most frequent times of departure to work in Mastic are 7:00 AM to 7:29 AM (773, 21.6%) for males and 8:00 AM to 8:29 AM (452, 15.3%) for females.
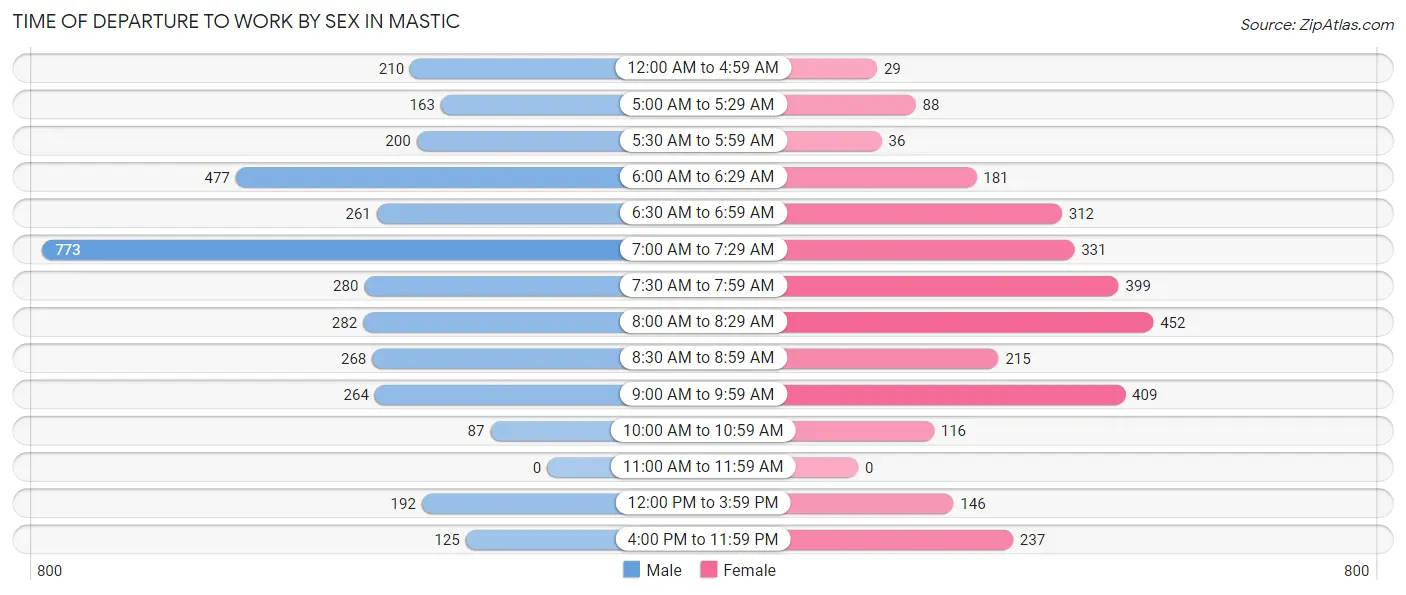
| Time of Departure | Male | Female |
| 12:00 AM to 4:59 AM | 210 (5.9%) | 29 (1.0%) |
| 5:00 AM to 5:29 AM | 163 (4.5%) | 88 (3.0%) |
| 5:30 AM to 5:59 AM | 200 (5.6%) | 36 (1.2%) |
| 6:00 AM to 6:29 AM | 477 (13.3%) | 181 (6.1%) |
| 6:30 AM to 6:59 AM | 261 (7.3%) | 312 (10.6%) |
| 7:00 AM to 7:29 AM | 773 (21.6%) | 331 (11.2%) |
| 7:30 AM to 7:59 AM | 280 (7.8%) | 399 (13.5%) |
| 8:00 AM to 8:29 AM | 282 (7.9%) | 452 (15.3%) |
| 8:30 AM to 8:59 AM | 268 (7.5%) | 215 (7.3%) |
| 9:00 AM to 9:59 AM | 264 (7.4%) | 409 (13.9%) |
| 10:00 AM to 10:59 AM | 87 (2.4%) | 116 (3.9%) |
| 11:00 AM to 11:59 AM | 0 (0.0%) | 0 (0.0%) |
| 12:00 PM to 3:59 PM | 192 (5.4%) | 146 (5.0%) |
| 4:00 PM to 11:59 PM | 125 (3.5%) | 237 (8.0%) |
| Total | 3,582 (100.0%) | 2,951 (100.0%) |
Housing Occupancy in Mastic
Occupancy by Ownership in Mastic
Of the total 4,334 dwellings in Mastic, owner-occupied units account for 3,503 (80.8%), while renter-occupied units make up 831 (19.2%).
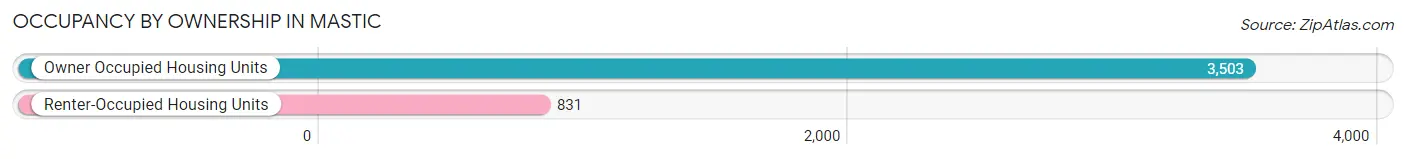
| Occupancy | # Housing Units | % Housing Units |
| Owner Occupied Housing Units | 3,503 | 80.8% |
| Renter-Occupied Housing Units | 831 | 19.2% |
| Total Occupied Housing Units | 4,334 | 100.0% |
Occupancy by Household Size in Mastic
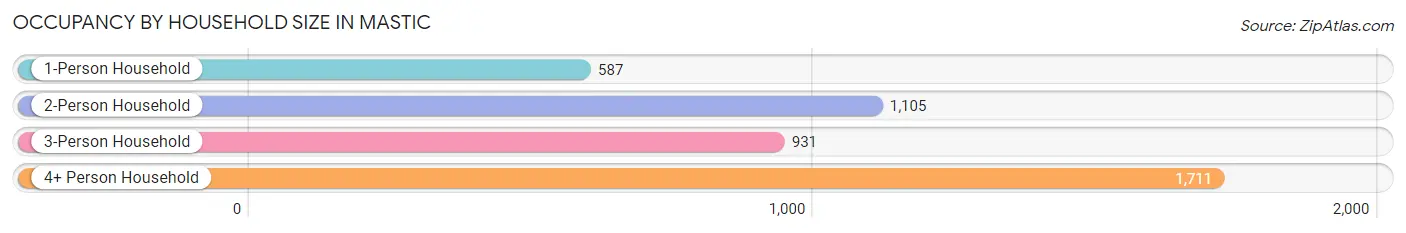
| Household Size | # Housing Units | % Housing Units |
| 1-Person Household | 587 | 13.5% |
| 2-Person Household | 1,105 | 25.5% |
| 3-Person Household | 931 | 21.5% |
| 4+ Person Household | 1,711 | 39.5% |
| Total Housing Units | 4,334 | 100.0% |
Occupancy by Ownership by Household Size in Mastic
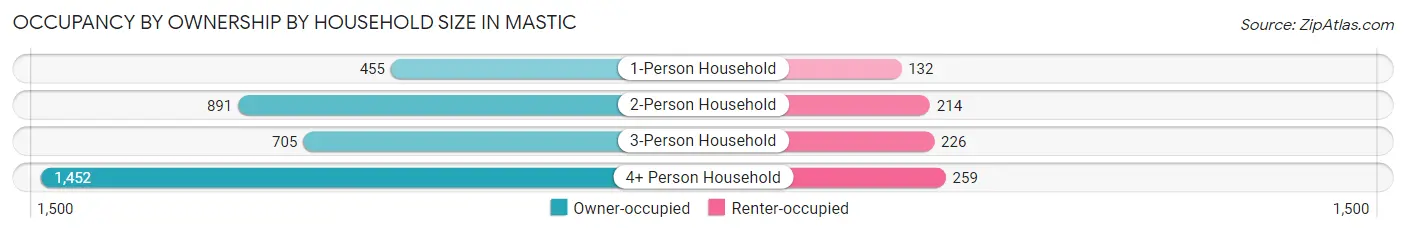
| Household Size | Owner-occupied | Renter-occupied |
| 1-Person Household | 455 (77.5%) | 132 (22.5%) |
| 2-Person Household | 891 (80.6%) | 214 (19.4%) |
| 3-Person Household | 705 (75.7%) | 226 (24.3%) |
| 4+ Person Household | 1,452 (84.9%) | 259 (15.1%) |
| Total Housing Units | 3,503 (80.8%) | 831 (19.2%) |
Occupancy by Educational Attainment in Mastic
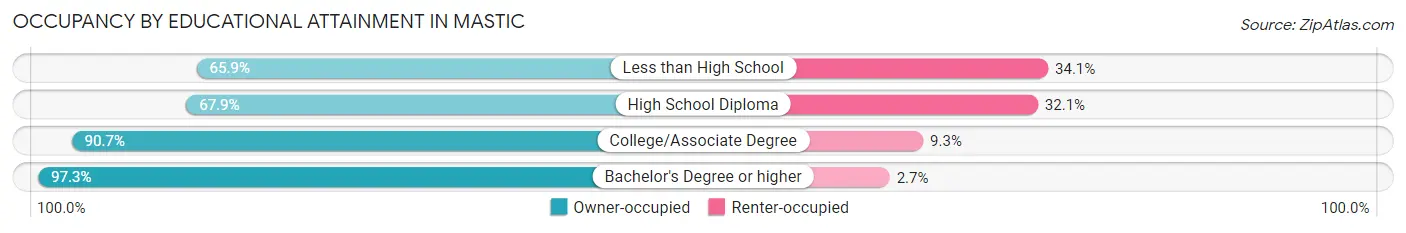
| Household Size | Owner-occupied | Renter-occupied |
| Less than High School | 348 (65.9%) | 180 (34.1%) |
| High School Diploma | 1,061 (67.9%) | 501 (32.1%) |
| College/Associate Degree | 1,226 (90.7%) | 126 (9.3%) |
| Bachelor's Degree or higher | 868 (97.3%) | 24 (2.7%) |
Occupancy by Age of Householder in Mastic
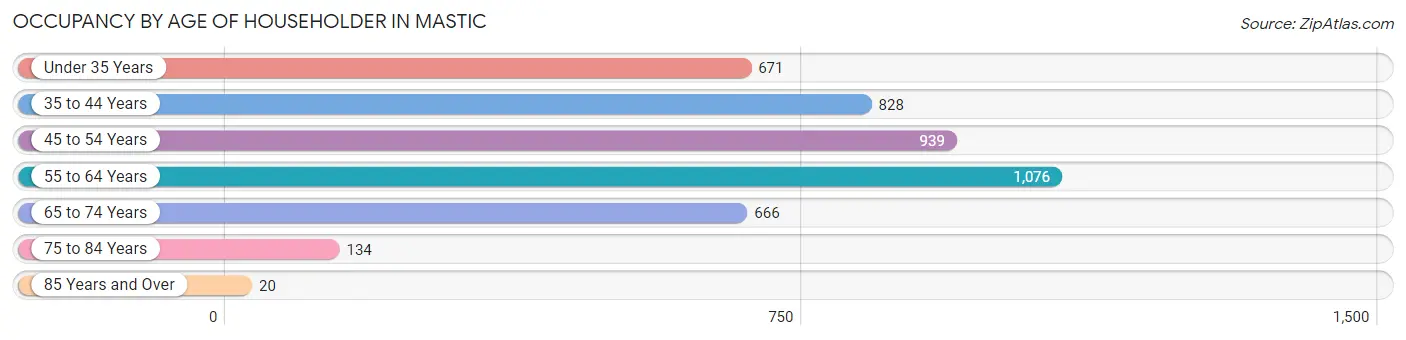
| Age Bracket | # Households | % Households |
| Under 35 Years | 671 | 15.5% |
| 35 to 44 Years | 828 | 19.1% |
| 45 to 54 Years | 939 | 21.7% |
| 55 to 64 Years | 1,076 | 24.8% |
| 65 to 74 Years | 666 | 15.4% |
| 75 to 84 Years | 134 | 3.1% |
| 85 Years and Over | 20 | 0.5% |
| Total | 4,334 | 100.0% |
Housing Finances in Mastic
Median Income by Occupancy in Mastic
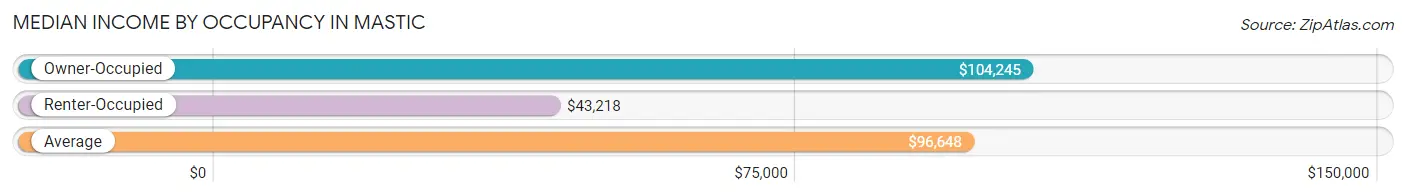
| Occupancy Type | # Households | Median Income |
| Owner-Occupied | 3,503 (80.8%) | $104,245 |
| Renter-Occupied | 831 (19.2%) | $43,218 |
| Average | 4,334 (100.0%) | $96,648 |
Occupancy by Householder Income Bracket in Mastic
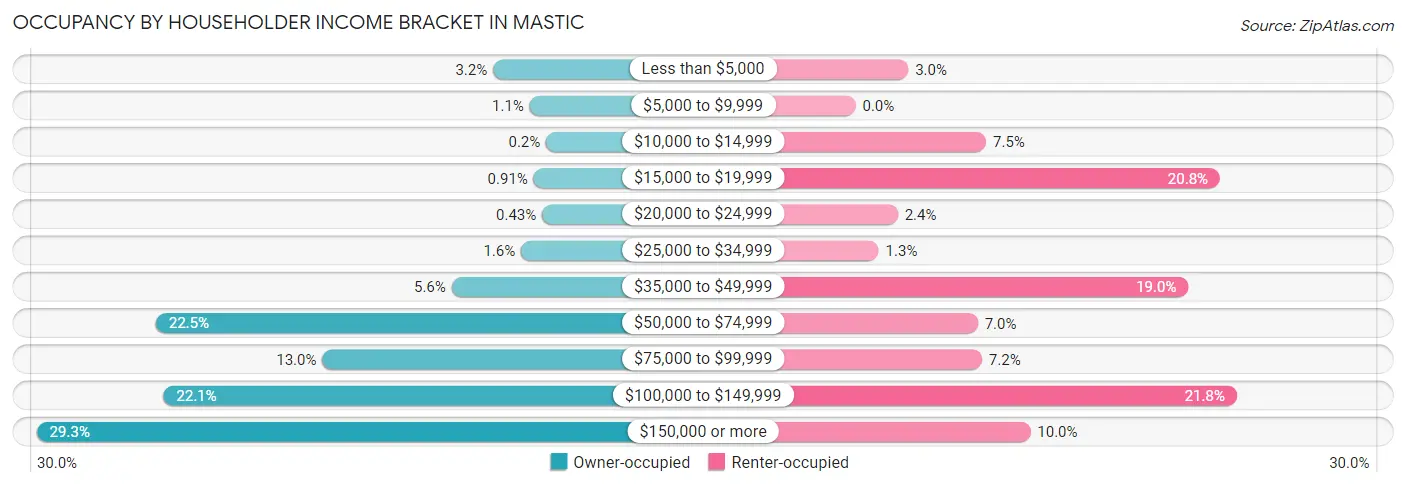
| Income Bracket | Owner-occupied | Renter-occupied |
| Less than $5,000 | 113 (3.2%) | 25 (3.0%) |
| $5,000 to $9,999 | 40 (1.1%) | 0 (0.0%) |
| $10,000 to $14,999 | 7 (0.2%) | 62 (7.5%) |
| $15,000 to $19,999 | 32 (0.9%) | 173 (20.8%) |
| $20,000 to $24,999 | 15 (0.4%) | 20 (2.4%) |
| $25,000 to $34,999 | 57 (1.6%) | 11 (1.3%) |
| $35,000 to $49,999 | 196 (5.6%) | 158 (19.0%) |
| $50,000 to $74,999 | 788 (22.5%) | 58 (7.0%) |
| $75,000 to $99,999 | 455 (13.0%) | 60 (7.2%) |
| $100,000 to $149,999 | 773 (22.1%) | 181 (21.8%) |
| $150,000 or more | 1,027 (29.3%) | 83 (10.0%) |
| Total | 3,503 (100.0%) | 831 (100.0%) |
Monthly Housing Cost Tiers in Mastic
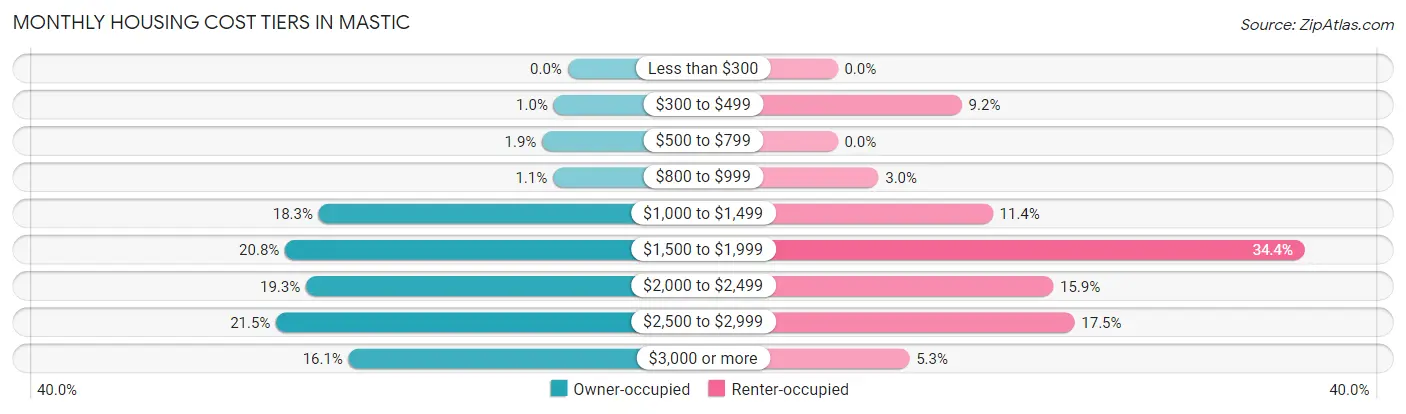
| Monthly Cost | Owner-occupied | Renter-occupied |
| Less than $300 | 0 (0.0%) | 0 (0.0%) |
| $300 to $499 | 36 (1.0%) | 76 (9.1%) |
| $500 to $799 | 66 (1.9%) | 0 (0.0%) |
| $800 to $999 | 38 (1.1%) | 25 (3.0%) |
| $1,000 to $1,499 | 642 (18.3%) | 95 (11.4%) |
| $1,500 to $1,999 | 729 (20.8%) | 286 (34.4%) |
| $2,000 to $2,499 | 675 (19.3%) | 132 (15.9%) |
| $2,500 to $2,999 | 752 (21.5%) | 145 (17.4%) |
| $3,000 or more | 565 (16.1%) | 44 (5.3%) |
| Total | 3,503 (100.0%) | 831 (100.0%) |
Physical Housing Characteristics in Mastic
Housing Structures in Mastic
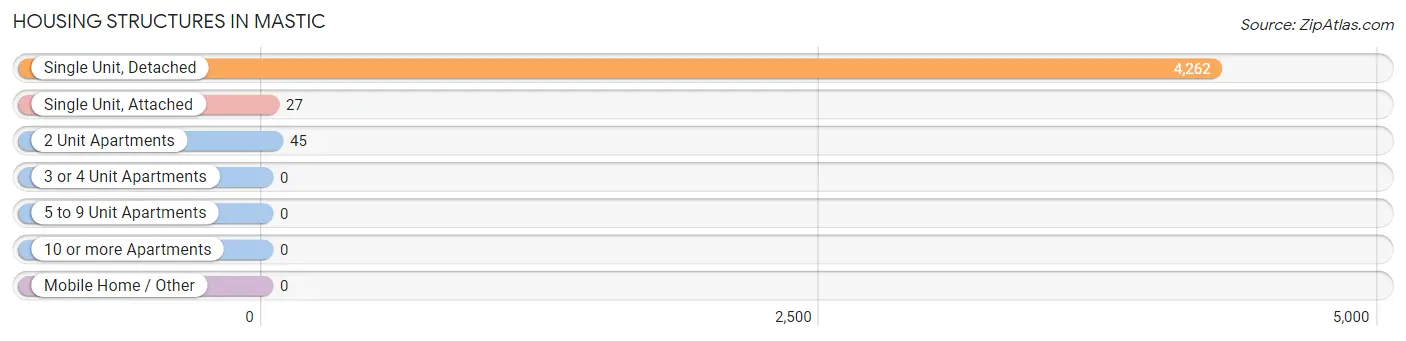
| Structure Type | # Housing Units | % Housing Units |
| Single Unit, Detached | 4,262 | 98.3% |
| Single Unit, Attached | 27 | 0.6% |
| 2 Unit Apartments | 45 | 1.0% |
| 3 or 4 Unit Apartments | 0 | 0.0% |
| 5 to 9 Unit Apartments | 0 | 0.0% |
| 10 or more Apartments | 0 | 0.0% |
| Mobile Home / Other | 0 | 0.0% |
| Total | 4,334 | 100.0% |
Housing Structures by Occupancy in Mastic
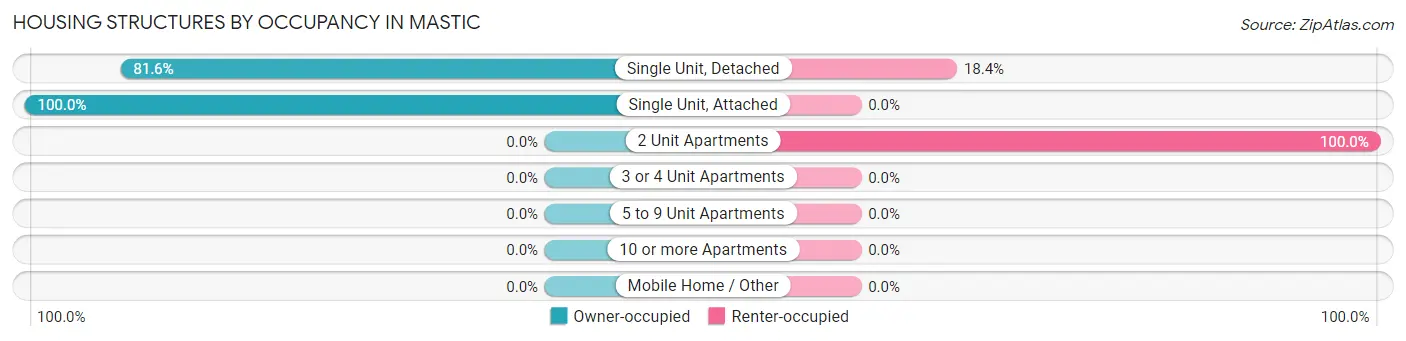
| Structure Type | Owner-occupied | Renter-occupied |
| Single Unit, Detached | 3,476 (81.6%) | 786 (18.4%) |
| Single Unit, Attached | 27 (100.0%) | 0 (0.0%) |
| 2 Unit Apartments | 0 (0.0%) | 45 (100.0%) |
| 3 or 4 Unit Apartments | 0 (0.0%) | 0 (0.0%) |
| 5 to 9 Unit Apartments | 0 (0.0%) | 0 (0.0%) |
| 10 or more Apartments | 0 (0.0%) | 0 (0.0%) |
| Mobile Home / Other | 0 (0.0%) | 0 (0.0%) |
| Total | 3,503 (80.8%) | 831 (19.2%) |
Housing Structures by Number of Rooms in Mastic
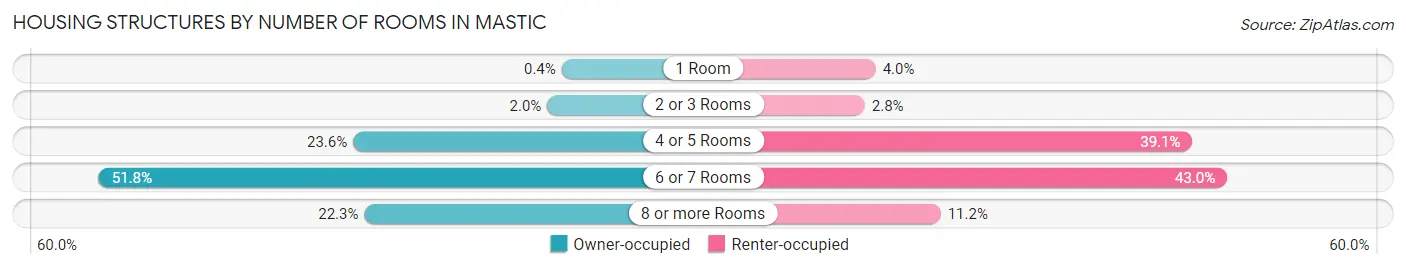
| Number of Rooms | Owner-occupied | Renter-occupied |
| 1 Room | 14 (0.4%) | 33 (4.0%) |
| 2 or 3 Rooms | 70 (2.0%) | 23 (2.8%) |
| 4 or 5 Rooms | 825 (23.5%) | 325 (39.1%) |
| 6 or 7 Rooms | 1,813 (51.8%) | 357 (43.0%) |
| 8 or more Rooms | 781 (22.3%) | 93 (11.2%) |
| Total | 3,503 (100.0%) | 831 (100.0%) |
Housing Structure by Heating Type in Mastic
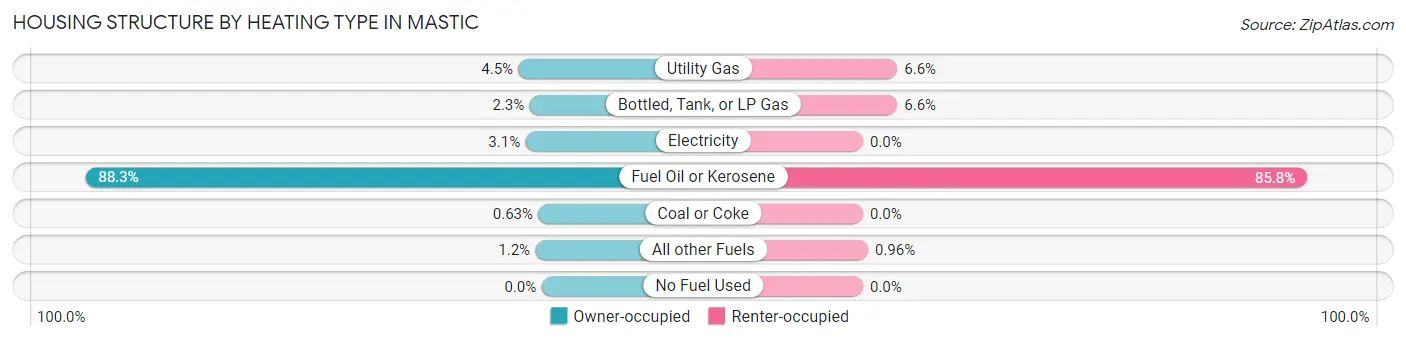
| Heating Type | Owner-occupied | Renter-occupied |
| Utility Gas | 157 (4.5%) | 55 (6.6%) |
| Bottled, Tank, or LP Gas | 81 (2.3%) | 55 (6.6%) |
| Electricity | 109 (3.1%) | 0 (0.0%) |
| Fuel Oil or Kerosene | 3,092 (88.3%) | 713 (85.8%) |
| Coal or Coke | 22 (0.6%) | 0 (0.0%) |
| All other Fuels | 42 (1.2%) | 8 (1.0%) |
| No Fuel Used | 0 (0.0%) | 0 (0.0%) |
| Total | 3,503 (100.0%) | 831 (100.0%) |
Household Vehicle Usage in Mastic
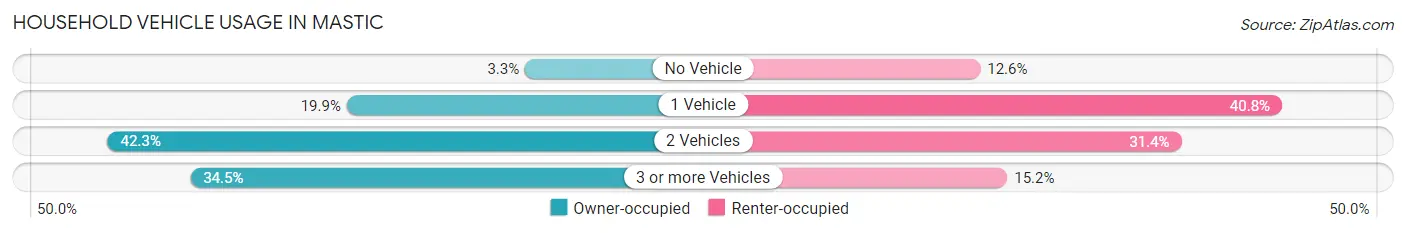
| Vehicles per Household | Owner-occupied | Renter-occupied |
| No Vehicle | 115 (3.3%) | 105 (12.6%) |
| 1 Vehicle | 698 (19.9%) | 339 (40.8%) |
| 2 Vehicles | 1,480 (42.2%) | 261 (31.4%) |
| 3 or more Vehicles | 1,210 (34.5%) | 126 (15.2%) |
| Total | 3,503 (100.0%) | 831 (100.0%) |
Real Estate & Mortgages in Mastic
Real Estate and Mortgage Overview in Mastic
| Characteristic | Without Mortgage | With Mortgage |
| Housing Units | 932 | 2,571 |
| Median Property Value | $331,100 | $316,200 |
| Median Household Income | $95,139 | $743 |
| Monthly Housing Costs | $1,340 | $565 |
| Real Estate Taxes | $8,877 | $33 |
Property Value by Mortgage Status in Mastic
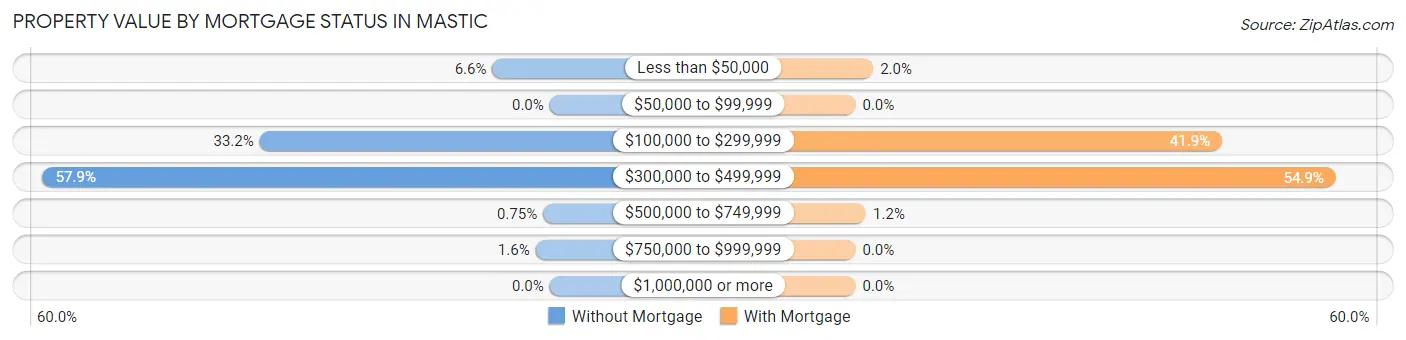
| Property Value | Without Mortgage | With Mortgage |
| Less than $50,000 | 61 (6.6%) | 52 (2.0%) |
| $50,000 to $99,999 | 0 (0.0%) | 0 (0.0%) |
| $100,000 to $299,999 | 309 (33.2%) | 1,077 (41.9%) |
| $300,000 to $499,999 | 540 (57.9%) | 1,411 (54.9%) |
| $500,000 to $749,999 | 7 (0.7%) | 31 (1.2%) |
| $750,000 to $999,999 | 15 (1.6%) | 0 (0.0%) |
| $1,000,000 or more | 0 (0.0%) | 0 (0.0%) |
| Total | 932 (100.0%) | 2,571 (100.0%) |
Household Income by Mortgage Status in Mastic
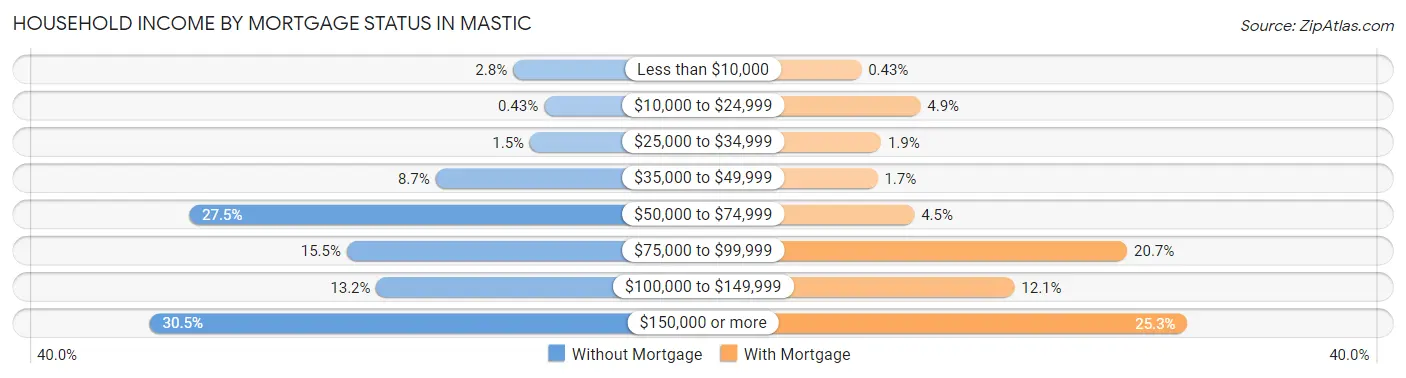
| Household Income | Without Mortgage | With Mortgage |
| Less than $10,000 | 26 (2.8%) | 11 (0.4%) |
| $10,000 to $24,999 | 4 (0.4%) | 127 (4.9%) |
| $25,000 to $34,999 | 14 (1.5%) | 50 (1.9%) |
| $35,000 to $49,999 | 81 (8.7%) | 43 (1.7%) |
| $50,000 to $74,999 | 256 (27.5%) | 115 (4.5%) |
| $75,000 to $99,999 | 144 (15.4%) | 532 (20.7%) |
| $100,000 to $149,999 | 123 (13.2%) | 311 (12.1%) |
| $150,000 or more | 284 (30.5%) | 650 (25.3%) |
| Total | 932 (100.0%) | 2,571 (100.0%) |
Property Value to Household Income Ratio in Mastic
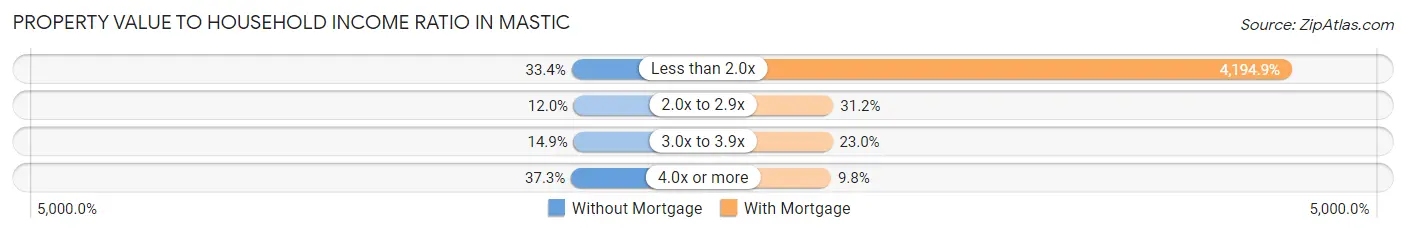
| Value-to-Income Ratio | Without Mortgage | With Mortgage |
| Less than 2.0x | 311 (33.4%) | 107,851 (4,194.9%) |
| 2.0x to 2.9x | 112 (12.0%) | 801 (31.2%) |
| 3.0x to 3.9x | 139 (14.9%) | 591 (23.0%) |
| 4.0x or more | 348 (37.3%) | 251 (9.8%) |
| Total | 932 (100.0%) | 2,571 (100.0%) |
Real Estate Taxes by Mortgage Status in Mastic

| Property Taxes | Without Mortgage | With Mortgage |
| Less than $800 | 0 (0.0%) | 91 (3.5%) |
| $800 to $1,499 | 0 (0.0%) | 112 (4.4%) |
| $800 to $1,499 | 891 (95.6%) | 28 (1.1%) |
| Total | 932 (100.0%) | 2,571 (100.0%) |
Health & Disability in Mastic
Health Insurance Coverage by Age in Mastic
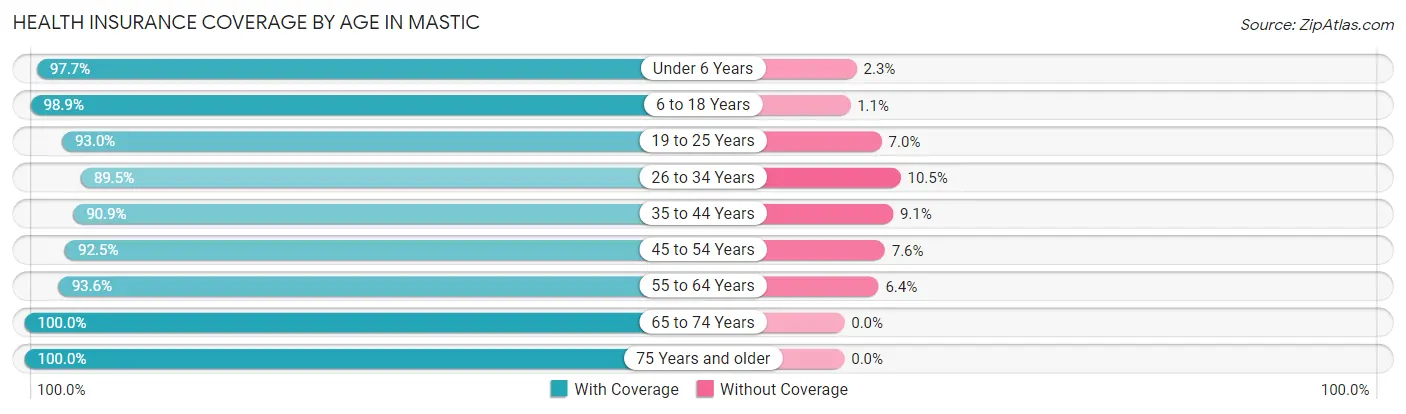
| Age Bracket | With Coverage | Without Coverage |
| Under 6 Years | 897 (97.7%) | 21 (2.3%) |
| 6 to 18 Years | 3,071 (98.9%) | 34 (1.1%) |
| 19 to 25 Years | 1,654 (93.0%) | 124 (7.0%) |
| 26 to 34 Years | 1,861 (89.5%) | 218 (10.5%) |
| 35 to 44 Years | 1,634 (90.9%) | 163 (9.1%) |
| 45 to 54 Years | 1,690 (92.4%) | 138 (7.5%) |
| 55 to 64 Years | 1,792 (93.6%) | 122 (6.4%) |
| 65 to 74 Years | 1,202 (100.0%) | 0 (0.0%) |
| 75 Years and older | 315 (100.0%) | 0 (0.0%) |
| Total | 14,116 (94.5%) | 820 (5.5%) |
Health Insurance Coverage by Citizenship Status in Mastic
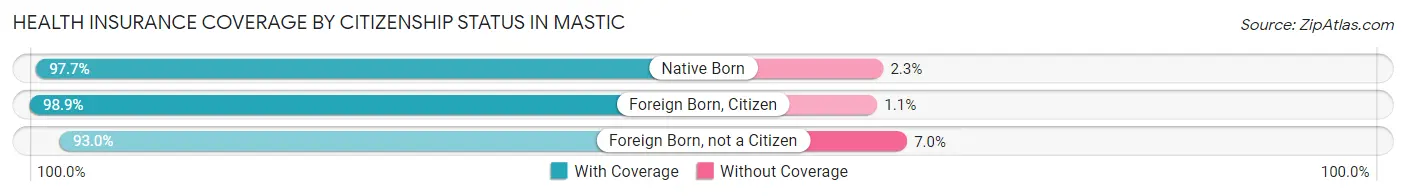
| Citizenship Status | With Coverage | Without Coverage |
| Native Born | 897 (97.7%) | 21 (2.3%) |
| Foreign Born, Citizen | 3,071 (98.9%) | 34 (1.1%) |
| Foreign Born, not a Citizen | 1,654 (93.0%) | 124 (7.0%) |
Health Insurance Coverage by Household Income in Mastic
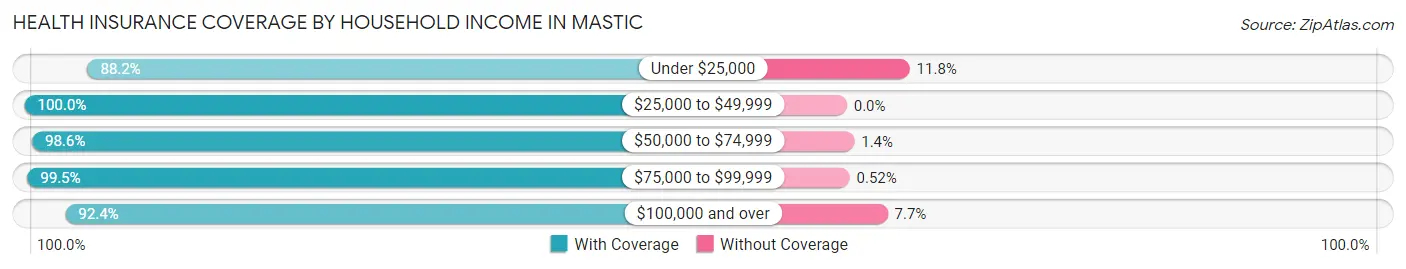
| Household Income | With Coverage | Without Coverage |
| Under $25,000 | 1,183 (88.2%) | 158 (11.8%) |
| $25,000 to $49,999 | 1,150 (100.0%) | 0 (0.0%) |
| $50,000 to $74,999 | 2,399 (98.6%) | 34 (1.4%) |
| $75,000 to $99,999 | 1,916 (99.5%) | 10 (0.5%) |
| $100,000 and over | 7,417 (92.3%) | 614 (7.6%) |
Public vs Private Health Insurance Coverage by Age in Mastic
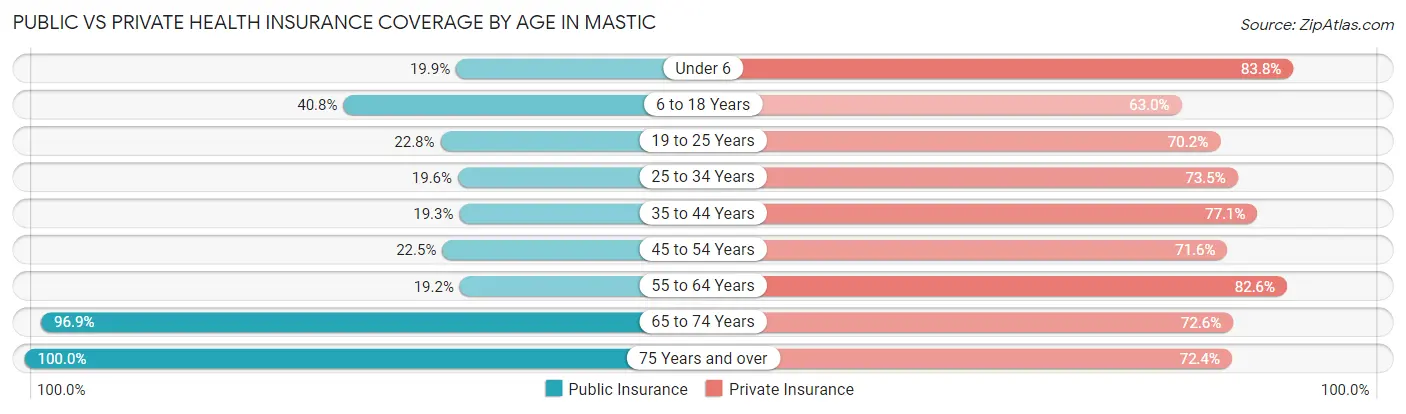
| Age Bracket | Public Insurance | Private Insurance |
| Under 6 | 183 (19.9%) | 769 (83.8%) |
| 6 to 18 Years | 1,268 (40.8%) | 1,957 (63.0%) |
| 19 to 25 Years | 406 (22.8%) | 1,248 (70.2%) |
| 25 to 34 Years | 407 (19.6%) | 1,527 (73.5%) |
| 35 to 44 Years | 347 (19.3%) | 1,386 (77.1%) |
| 45 to 54 Years | 411 (22.5%) | 1,308 (71.6%) |
| 55 to 64 Years | 368 (19.2%) | 1,581 (82.6%) |
| 65 to 74 Years | 1,165 (96.9%) | 873 (72.6%) |
| 75 Years and over | 315 (100.0%) | 228 (72.4%) |
| Total | 4,870 (32.6%) | 10,877 (72.8%) |
Disability Status by Sex by Age in Mastic
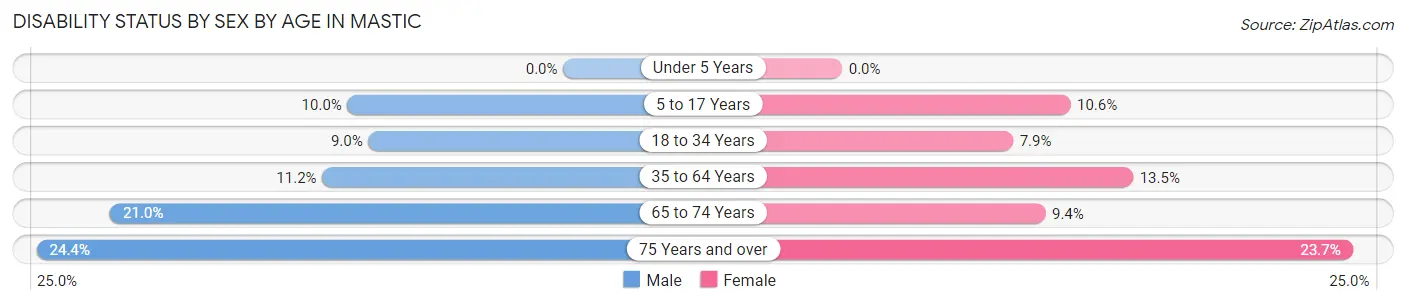
| Age Bracket | Male | Female |
| Under 5 Years | 0 (0.0%) | 0 (0.0%) |
| 5 to 17 Years | 175 (10.0%) | 124 (10.6%) |
| 18 to 34 Years | 199 (9.0%) | 152 (7.9%) |
| 35 to 64 Years | 308 (11.2%) | 376 (13.5%) |
| 65 to 74 Years | 110 (21.0%) | 64 (9.4%) |
| 75 Years and over | 44 (24.4%) | 32 (23.7%) |
Disability Class by Sex by Age in Mastic
Disability Class: Hearing Difficulty
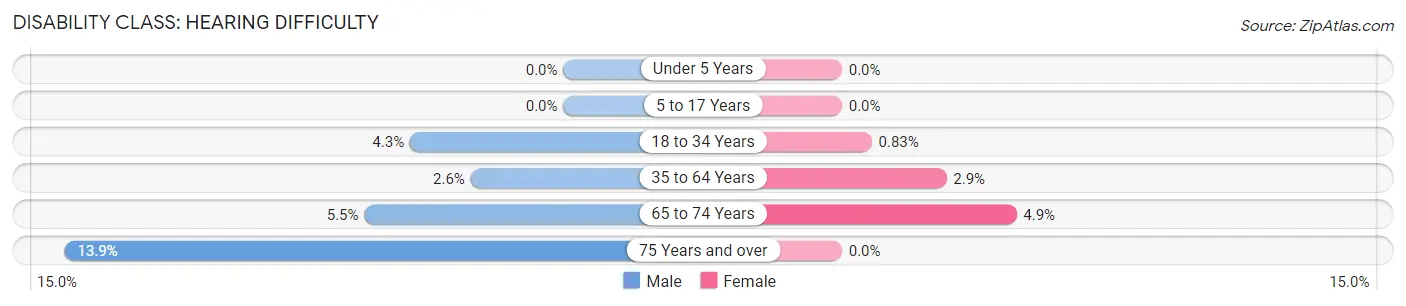
| Age Bracket | Male | Female |
| Under 5 Years | 0 (0.0%) | 0 (0.0%) |
| 5 to 17 Years | 0 (0.0%) | 0 (0.0%) |
| 18 to 34 Years | 94 (4.3%) | 16 (0.8%) |
| 35 to 64 Years | 71 (2.6%) | 81 (2.9%) |
| 65 to 74 Years | 29 (5.5%) | 33 (4.9%) |
| 75 Years and over | 25 (13.9%) | 0 (0.0%) |
Disability Class: Vision Difficulty
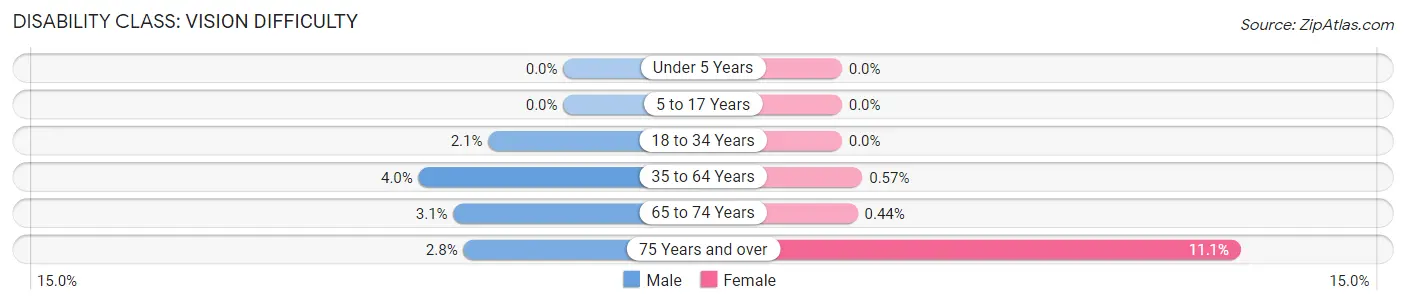
| Age Bracket | Male | Female |
| Under 5 Years | 0 (0.0%) | 0 (0.0%) |
| 5 to 17 Years | 0 (0.0%) | 0 (0.0%) |
| 18 to 34 Years | 46 (2.1%) | 0 (0.0%) |
| 35 to 64 Years | 111 (4.0%) | 16 (0.6%) |
| 65 to 74 Years | 16 (3.1%) | 3 (0.4%) |
| 75 Years and over | 5 (2.8%) | 15 (11.1%) |
Disability Class: Cognitive Difficulty
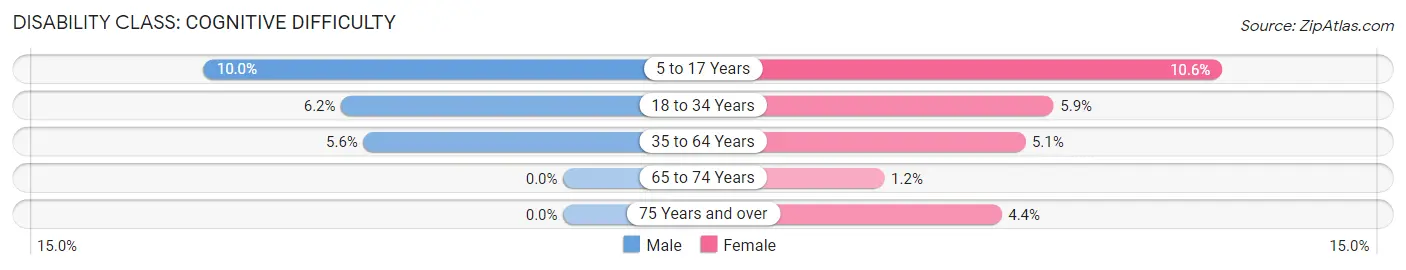
| Age Bracket | Male | Female |
| 5 to 17 Years | 175 (10.0%) | 124 (10.6%) |
| 18 to 34 Years | 136 (6.2%) | 113 (5.9%) |
| 35 to 64 Years | 153 (5.6%) | 142 (5.1%) |
| 65 to 74 Years | 0 (0.0%) | 8 (1.2%) |
| 75 Years and over | 0 (0.0%) | 6 (4.4%) |
Disability Class: Ambulatory Difficulty
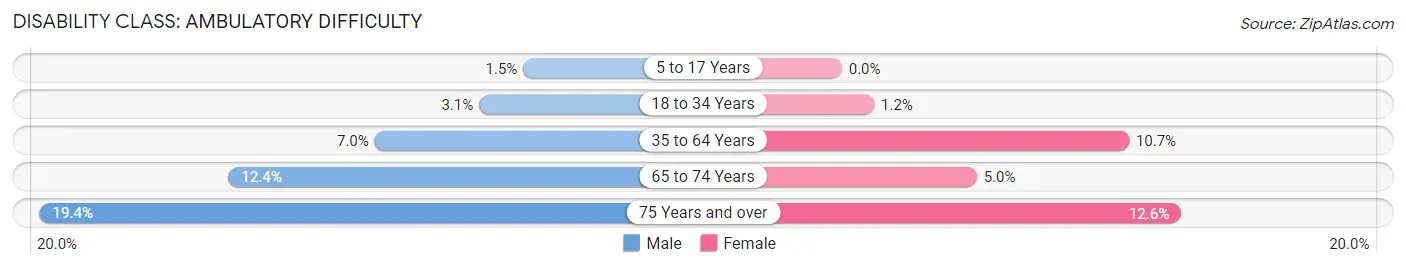
| Age Bracket | Male | Female |
| 5 to 17 Years | 26 (1.5%) | 0 (0.0%) |
| 18 to 34 Years | 69 (3.1%) | 23 (1.2%) |
| 35 to 64 Years | 193 (7.0%) | 297 (10.7%) |
| 65 to 74 Years | 65 (12.4%) | 34 (5.0%) |
| 75 Years and over | 35 (19.4%) | 17 (12.6%) |
Disability Class: Self-Care Difficulty
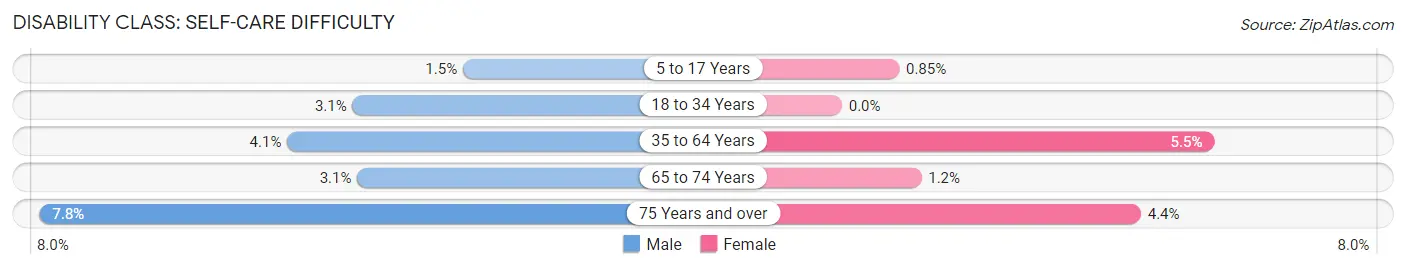
| Age Bracket | Male | Female |
| 5 to 17 Years | 26 (1.5%) | 10 (0.9%) |
| 18 to 34 Years | 69 (3.1%) | 0 (0.0%) |
| 35 to 64 Years | 113 (4.1%) | 154 (5.5%) |
| 65 to 74 Years | 16 (3.1%) | 8 (1.2%) |
| 75 Years and over | 14 (7.8%) | 6 (4.4%) |
Technology Access in Mastic
Computing Device Access in Mastic
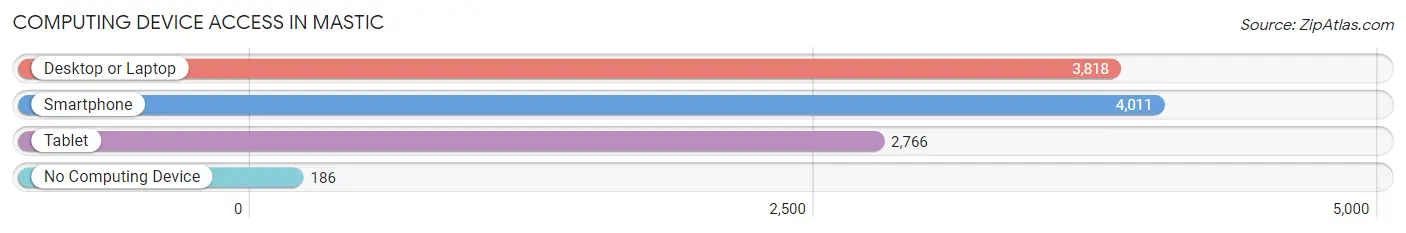
| Device Type | # Households | % Households |
| Desktop or Laptop | 3,818 | 88.1% |
| Smartphone | 4,011 | 92.5% |
| Tablet | 2,766 | 63.8% |
| No Computing Device | 186 | 4.3% |
| Total | 4,334 | 100.0% |
Internet Access in Mastic
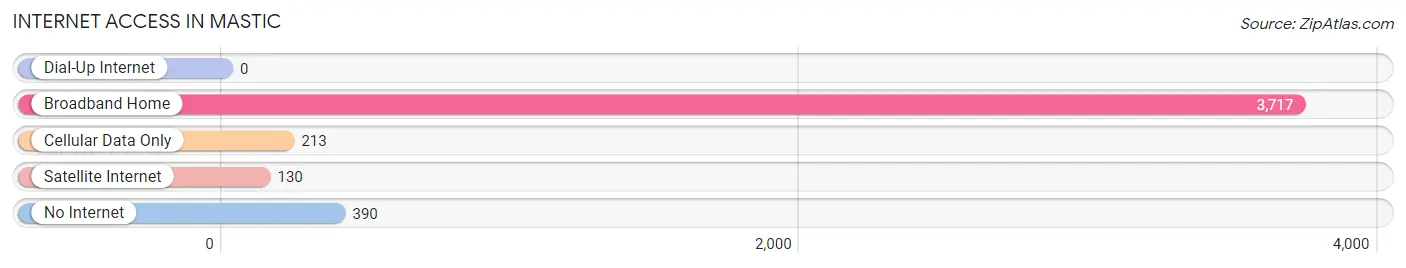
| Internet Type | # Households | % Households |
| Dial-Up Internet | 0 | 0.0% |
| Broadband Home | 3,717 | 85.8% |
| Cellular Data Only | 213 | 4.9% |
| Satellite Internet | 130 | 3.0% |
| No Internet | 390 | 9.0% |
| Total | 4,334 | 100.0% |
Mastic Summary
Mastic is a hamlet located in the Town of Brookhaven in Suffolk County, New York. It is situated on the south shore of Long Island, approximately 60 miles east of New York City. The hamlet is bordered by the hamlets of Shirley to the west, Mastic Beach to the east, and Moriches to the south.
History
The area now known as Mastic was originally inhabited by the Secatogue Indians, a sub-tribe of the Montaukett Indians. The Secatogue Indians were a peaceful tribe who lived off the land, fishing, hunting, and gathering wild plants. The first European settlers arrived in the area in the 1650s, and the hamlet was officially established in 1664. The hamlet was named after the Mastic tree, which was abundant in the area.
In the late 19th century, Mastic was a popular summer resort destination for wealthy New Yorkers. The area was known for its beautiful beaches and lush forests. In the early 20th century, the hamlet began to develop into a residential community. The population grew steadily throughout the 20th century, and by 2000, the population had reached 8,845.
Geography
Mastic is located on the south shore of Long Island, approximately 60 miles east of New York City. The hamlet is bordered by the hamlets of Shirley to the west, Mastic Beach to the east, and Moriches to the south. The hamlet is situated on a peninsula, with the Great South Bay to the north and the Atlantic Ocean to the south. The hamlet is located in the Town of Brookhaven, which is part of Suffolk County.
The terrain of Mastic is mostly flat, with some rolling hills. The area is heavily forested, with a variety of trees, including oak, maple, and pine. The hamlet is home to several parks, including the Mastic Beach Park and the William Floyd Estate.
Economy
The economy of Mastic is largely based on tourism and retail. The hamlet is home to several restaurants, bars, and shops, as well as a few small businesses. The hamlet is also home to several marinas, which provide services to boaters and fishermen.
The hamlet is also home to several manufacturing companies, including a plastics factory and a paper mill. The hamlet is also home to several farms, which produce a variety of fruits and vegetables.
Demographics
As of the 2010 census, the population of Mastic was 8,845. The racial makeup of the hamlet was 79.3% White, 11.2% African American, 0.7% Native American, 1.3% Asian, 0.1% Pacific Islander, and 6.4% from other races. Hispanic or Latino of any race were 11.7% of the population.
The median household income in Mastic was $63,917, and the median family income was $71,917. The per capita income was $27,917. About 8.3% of families and 10.2% of the population were below the poverty line.
The majority of the population of Mastic is employed in the service industry. The largest employers in the hamlet are the local restaurants, bars, and shops. The hamlet is also home to several manufacturing companies, as well as several farms.
Common Questions
What is Per Capita Income in Mastic?
Per Capita income in Mastic is $35,839.
What is the Median Family Income in Mastic?
Median Family Income in Mastic is $102,665.
What is the Median Household income in Mastic?
Median Household Income in Mastic is $96,648.
What is Income or Wage Gap in Mastic?
Income or Wage Gap in Mastic is 24.1%.
Women in Mastic earn 75.9 cents for every dollar earned by a man.
What is Inequality or Gini Index in Mastic?
Inequality or Gini Index in Mastic is 0.40.
What is the Total Population of Mastic?
Total Population of Mastic is 14,968.
What is the Total Male Population of Mastic?
Total Male Population of Mastic is 7,688.
What is the Total Female Population of Mastic?
Total Female Population of Mastic is 7,280.
What is the Ratio of Males per 100 Females in Mastic?
There are 105.60 Males per 100 Females in Mastic.
What is the Ratio of Females per 100 Males in Mastic?
There are 94.69 Females per 100 Males in Mastic.
What is the Median Population Age in Mastic?
Median Population Age in Mastic is 32.8 Years.
What is the Average Family Size in Mastic
Average Family Size in Mastic is 3.7 People.
What is the Average Household Size in Mastic
Average Household Size in Mastic is 3.4 People.
How Large is the Labor Force in Mastic?
There are 7,551 People in the Labor Forcein in Mastic.
What is the Percentage of People in the Labor Force in Mastic?
64.1% of People are in the Labor Force in Mastic.
What is the Unemployment Rate in Mastic?
Unemployment Rate in Mastic is 8.9%.