Gardnertown, NY Map & Demographics
Gardnertown Map
Gardnertown Overview
$40,706
PER CAPITA INCOME
$103,705
AVG FAMILY INCOME
$95,729
AVG HOUSEHOLD INCOME
21.4%
WAGE / INCOME GAP [ % ]
78.6¢/ $1
WAGE / INCOME GAP [ $ ]
0.37
INEQUALITY / GINI INDEX
3,943
TOTAL POPULATION
1,980
MALE POPULATION
1,963
FEMALE POPULATION
100.87
MALES / 100 FEMALES
99.14
FEMALES / 100 MALES
39.0
MEDIAN AGE
3.2
AVG FAMILY SIZE
2.8
AVG HOUSEHOLD SIZE
2,077
LABOR FORCE [ PEOPLE ]
67.7%
PERCENT IN LABOR FORCE
4.6%
UNEMPLOYMENT RATE
Income in Gardnertown
Income Overview in Gardnertown
Per Capita Income in Gardnertown is $40,706, while median incomes of families and households are $103,705 and $95,729 respectively.
| Characteristic | Number | Measure |
| Per Capita Income | 3,943 | $40,706 |
| Median Family Income | 1,123 | $103,705 |
| Mean Family Income | 1,123 | $116,607 |
| Median Household Income | 1,391 | $95,729 |
| Mean Household Income | 1,391 | $112,494 |
| Income Deficit | 1,123 | $0 |
| Wage / Income Gap (%) | 3,943 | 21.44% |
| Wage / Income Gap ($) | 3,943 | 78.56¢ per $1 |
| Gini / Inequality Index | 3,943 | 0.37 |
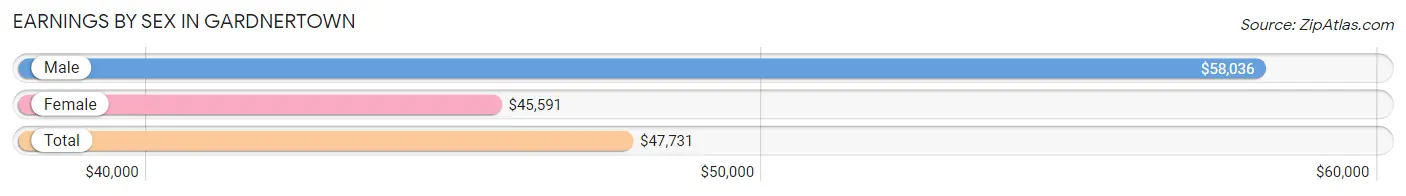
Earnings by Sex in Gardnertown
Average Earnings in Gardnertown are $47,731, $58,036 for men and $45,591 for women, a difference of 21.4%.
| Sex | Number | Average Earnings |
| Male | 1,083 (50.2%) | $58,036 |
| Female | 1,073 (49.8%) | $45,591 |
| Total | 2,156 (100.0%) | $47,731 |
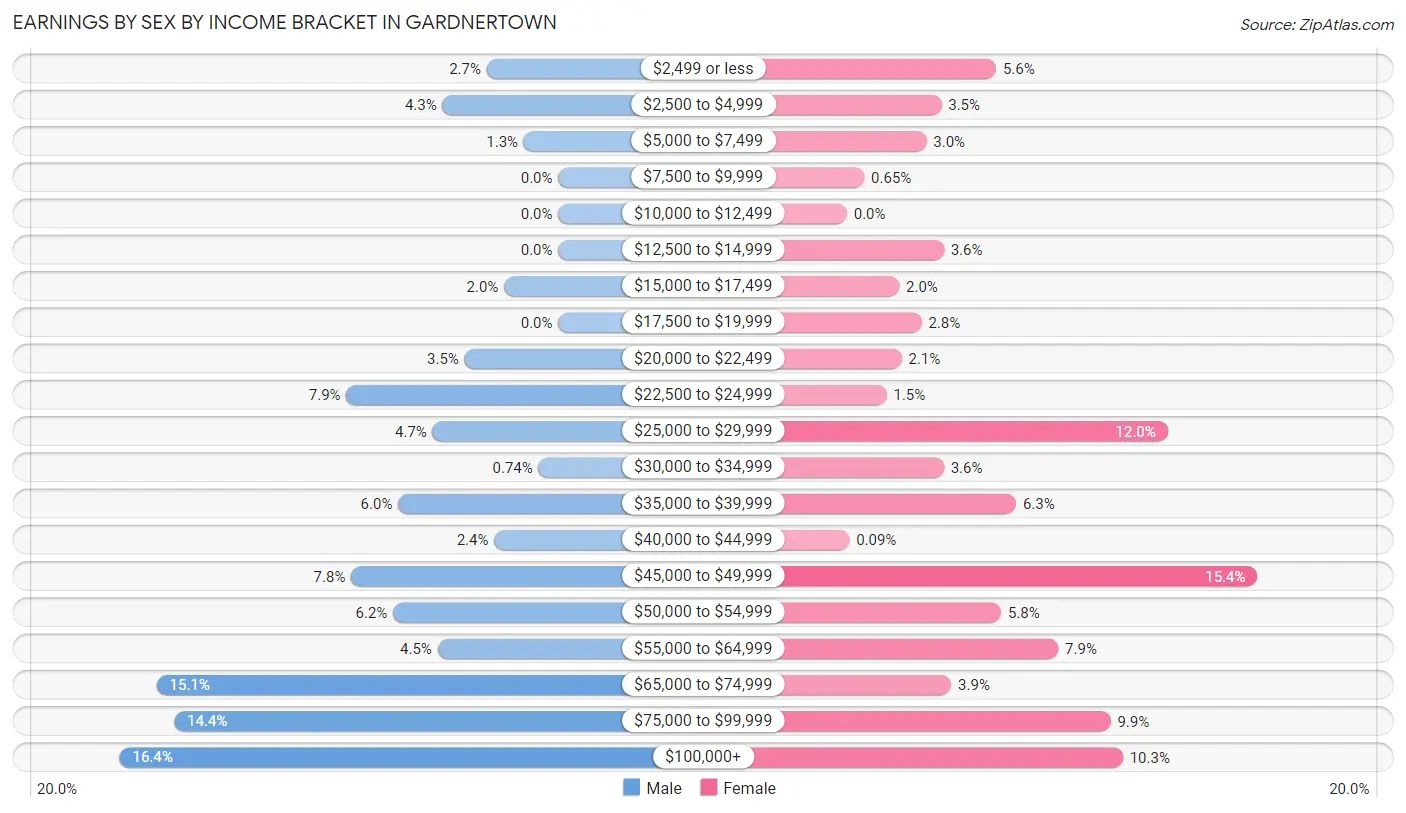
Earnings by Sex by Income Bracket in Gardnertown
The most common earnings brackets in Gardnertown are $100,000+ for men (178 | 16.4%) and $45,000 to $49,999 for women (165 | 15.4%).
| Income | Male | Female |
| $2,499 or less | 29 (2.7%) | 60 (5.6%) |
| $2,500 to $4,999 | 47 (4.3%) | 38 (3.5%) |
| $5,000 to $7,499 | 14 (1.3%) | 32 (3.0%) |
| $7,500 to $9,999 | 0 (0.0%) | 7 (0.6%) |
| $10,000 to $12,499 | 0 (0.0%) | 0 (0.0%) |
| $12,500 to $14,999 | 0 (0.0%) | 39 (3.6%) |
| $15,000 to $17,499 | 22 (2.0%) | 21 (2.0%) |
| $17,500 to $19,999 | 0 (0.0%) | 30 (2.8%) |
| $20,000 to $22,499 | 38 (3.5%) | 22 (2.1%) |
| $22,500 to $24,999 | 86 (7.9%) | 16 (1.5%) |
| $25,000 to $29,999 | 51 (4.7%) | 129 (12.0%) |
| $30,000 to $34,999 | 8 (0.7%) | 39 (3.6%) |
| $35,000 to $39,999 | 65 (6.0%) | 68 (6.3%) |
| $40,000 to $44,999 | 26 (2.4%) | 1 (0.1%) |
| $45,000 to $49,999 | 84 (7.8%) | 165 (15.4%) |
| $50,000 to $54,999 | 67 (6.2%) | 62 (5.8%) |
| $55,000 to $64,999 | 49 (4.5%) | 85 (7.9%) |
| $65,000 to $74,999 | 163 (15.0%) | 42 (3.9%) |
| $75,000 to $99,999 | 156 (14.4%) | 106 (9.9%) |
| $100,000+ | 178 (16.4%) | 111 (10.3%) |
| Total | 1,083 (100.0%) | 1,073 (100.0%) |
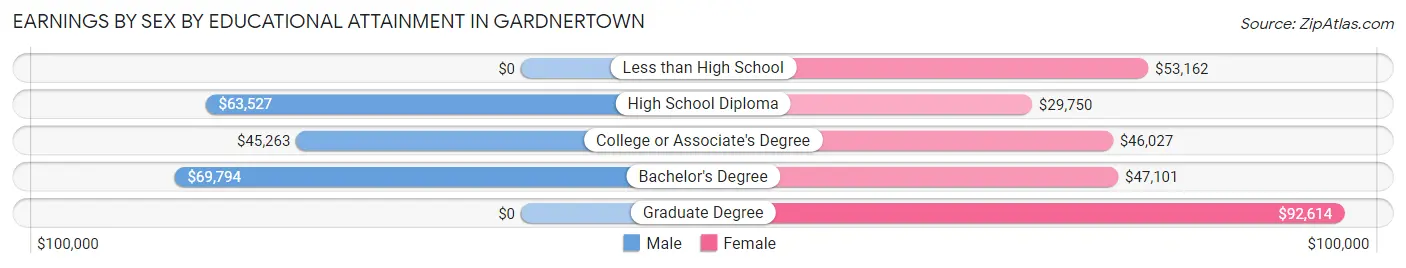
Earnings by Sex by Educational Attainment in Gardnertown
Average earnings in Gardnertown are $64,554 for men and $46,849 for women, a difference of 27.4%. Men with an educational attainment of bachelor's degree enjoy the highest average annual earnings of $69,794, while those with college or associate's degree education earn the least with $45,263. Women with an educational attainment of graduate degree earn the most with the average annual earnings of $92,614, while those with high school diploma education have the smallest earnings of $29,750.
| Educational Attainment | Male Income | Female Income |
| Less than High School | - | - |
| High School Diploma | $63,527 | $29,750 |
| College or Associate's Degree | $45,263 | $46,027 |
| Bachelor's Degree | $69,794 | $47,101 |
| Graduate Degree | - | - |
| Total | $64,554 | $46,849 |
Family Income in Gardnertown
Family Income Brackets in Gardnertown
According to the Gardnertown family income data, there are 334 families falling into the $100,000 to $149,999 income range, which is the most common income bracket and makes up 29.7% of all families.
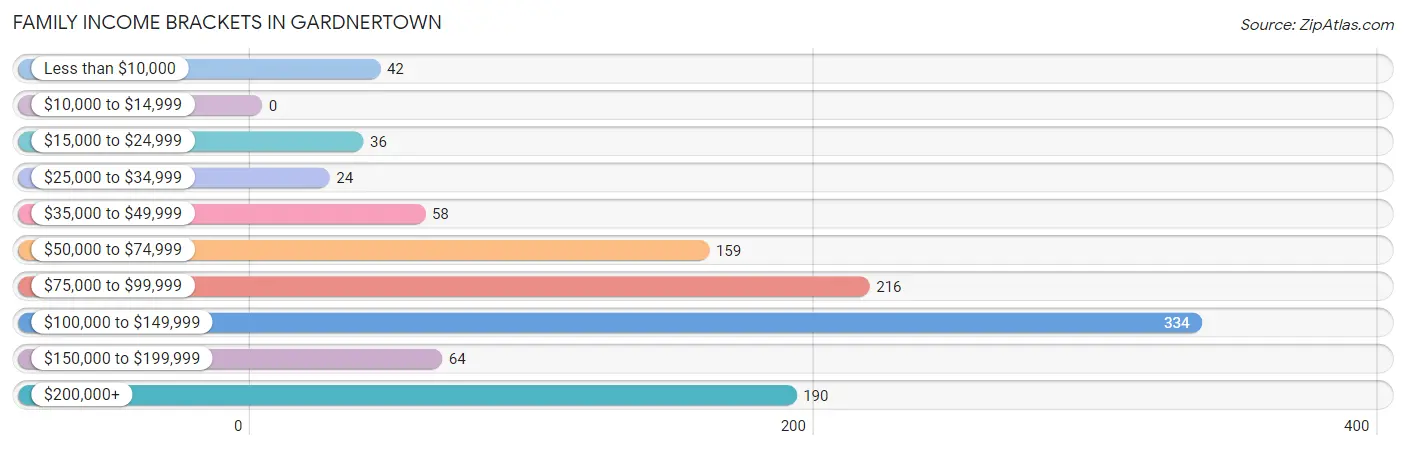
| Income Bracket | # Families | % Families |
| Less than $10,000 | 42 | 3.7% |
| $10,000 to $14,999 | 0 | 0.0% |
| $15,000 to $24,999 | 36 | 3.2% |
| $25,000 to $34,999 | 24 | 2.1% |
| $35,000 to $49,999 | 58 | 5.2% |
| $50,000 to $74,999 | 159 | 14.2% |
| $75,000 to $99,999 | 216 | 19.2% |
| $100,000 to $149,999 | 334 | 29.7% |
| $150,000 to $199,999 | 64 | 5.7% |
| $200,000+ | 190 | 16.9% |
Family Income by Famaliy Size in Gardnertown
4-person families (255 | 22.7%) account for the highest median family income in Gardnertown with $139,653 per family, while 2-person families (475 | 42.3%) have the highest median income of $41,430 per family member.
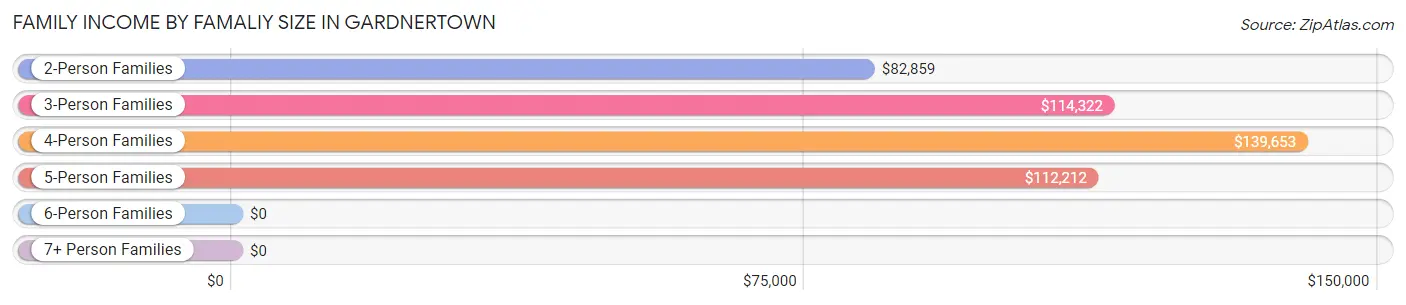
| Income Bracket | # Families | Median Income |
| 2-Person Families | 475 (42.3%) | $82,859 |
| 3-Person Families | 291 (25.9%) | $114,322 |
| 4-Person Families | 255 (22.7%) | $139,653 |
| 5-Person Families | 45 (4.0%) | $112,212 |
| 6-Person Families | 39 (3.5%) | $0 |
| 7+ Person Families | 18 (1.6%) | $0 |
| Total | 1,123 (100.0%) | $103,705 |
Family Income by Number of Earners in Gardnertown
The median family income in Gardnertown is $103,705, with families comprising 3+ earners (164) having the highest median family income of $166,250, while families with no earners (136) have the lowest median family income of $53,333, accounting for 14.6% and 12.1% of families, respectively.
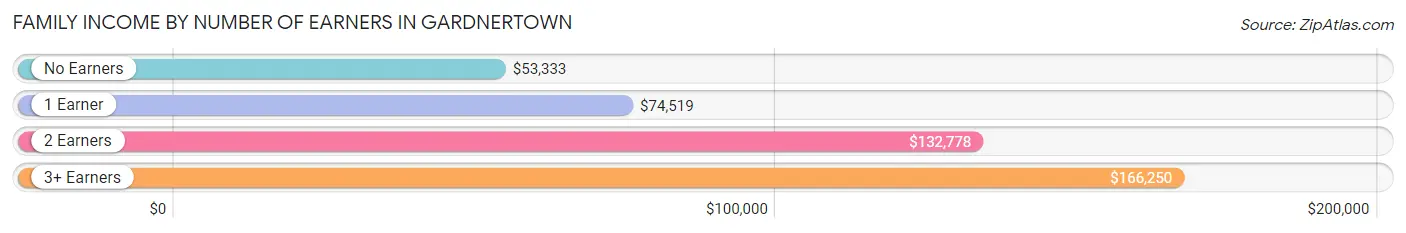
| Number of Earners | # Families | Median Income |
| No Earners | 136 (12.1%) | $53,333 |
| 1 Earner | 377 (33.6%) | $74,519 |
| 2 Earners | 446 (39.7%) | $132,778 |
| 3+ Earners | 164 (14.6%) | $166,250 |
| Total | 1,123 (100.0%) | $103,705 |
Household Income in Gardnertown
Household Income Brackets in Gardnertown
With 374 households falling in the category, the $100,000 to $149,999 income range is the most frequent in Gardnertown, accounting for 26.9% of all households. In contrast, only 8 households (0.6%) fall into the $10,000 to $14,999 income bracket, making it the least populous group.
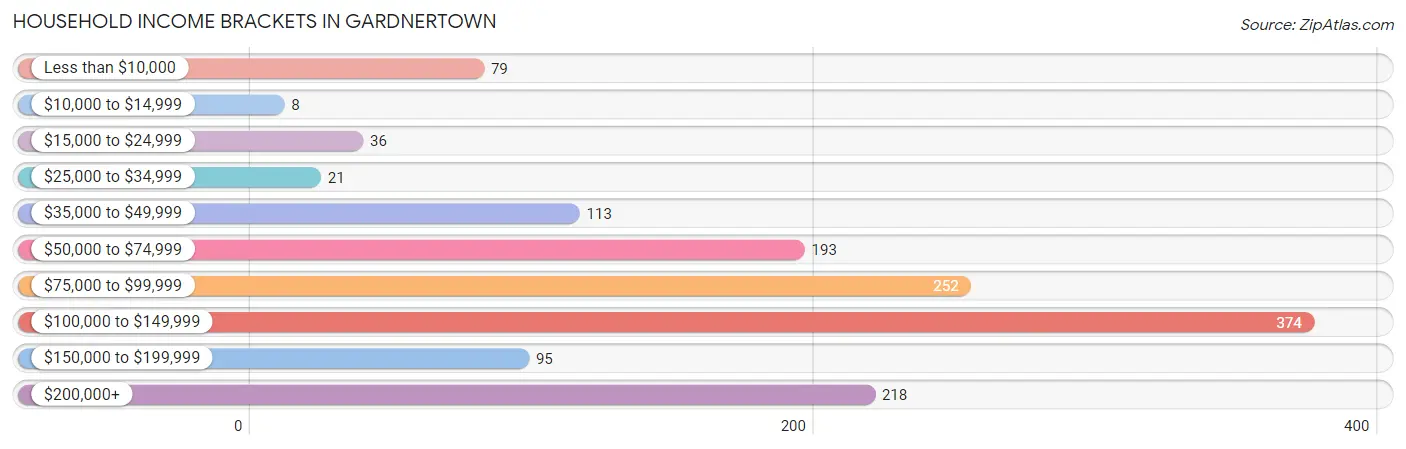
| Income Bracket | # Households | % Households |
| Less than $10,000 | 79 | 5.7% |
| $10,000 to $14,999 | 8 | 0.6% |
| $15,000 to $24,999 | 36 | 2.6% |
| $25,000 to $34,999 | 21 | 1.5% |
| $35,000 to $49,999 | 113 | 8.1% |
| $50,000 to $74,999 | 193 | 13.9% |
| $75,000 to $99,999 | 252 | 18.1% |
| $100,000 to $149,999 | 374 | 26.9% |
| $150,000 to $199,999 | 95 | 6.8% |
| $200,000+ | 218 | 15.7% |
Household Income by Householder Age in Gardnertown
The median household income in Gardnertown is $95,729, with the highest median household income of $112,718 found in the 25 to 44 years age bracket for the primary householder. A total of 542 households (39.0%) fall into this category.
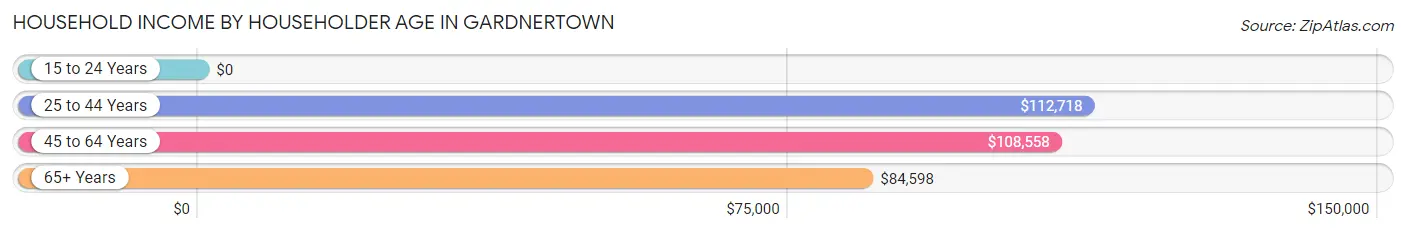
| Income Bracket | # Households | Median Income |
| 15 to 24 Years | 0 (0.0%) | $0 |
| 25 to 44 Years | 542 (39.0%) | $112,718 |
| 45 to 64 Years | 469 (33.7%) | $108,558 |
| 65+ Years | 380 (27.3%) | $84,598 |
| Total | 1,391 (100.0%) | $95,729 |
Poverty in Gardnertown
Income Below Poverty by Sex and Age in Gardnertown
With 6.7% poverty level for males and 7.8% for females among the residents of Gardnertown, 12 to 14 year old males and 5 year old females are the most vulnerable to poverty, with 39 males (53.4%) and 10 females (35.7%) in their respective age groups living below the poverty level.
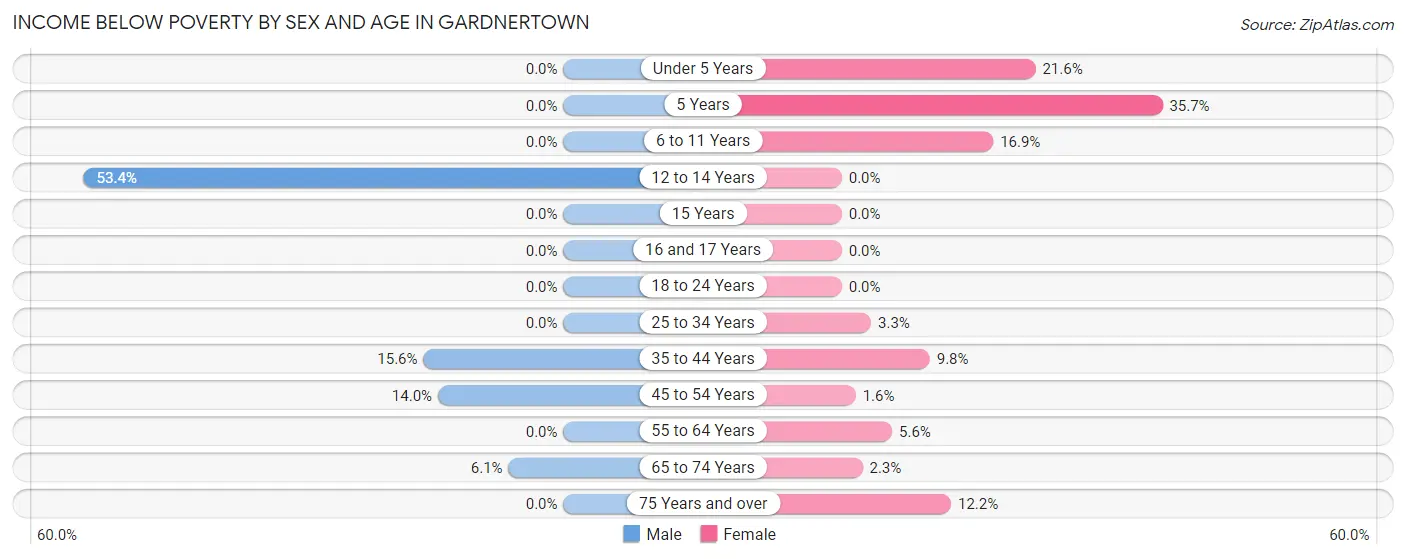
| Age Bracket | Male | Female |
| Under 5 Years | 0 (0.0%) | 11 (21.6%) |
| 5 Years | 0 (0.0%) | 10 (35.7%) |
| 6 to 11 Years | 0 (0.0%) | 44 (16.9%) |
| 12 to 14 Years | 39 (53.4%) | 0 (0.0%) |
| 15 Years | 0 (0.0%) | 0 (0.0%) |
| 16 and 17 Years | 0 (0.0%) | 0 (0.0%) |
| 18 to 24 Years | 0 (0.0%) | 0 (0.0%) |
| 25 to 34 Years | 0 (0.0%) | 10 (3.3%) |
| 35 to 44 Years | 65 (15.6%) | 35 (9.8%) |
| 45 to 54 Years | 19 (14.0%) | 3 (1.5%) |
| 55 to 64 Years | 0 (0.0%) | 14 (5.6%) |
| 65 to 74 Years | 9 (6.1%) | 3 (2.3%) |
| 75 Years and over | 0 (0.0%) | 23 (12.2%) |
| Total | 132 (6.7%) | 153 (7.8%) |
Income Above Poverty by Sex and Age in Gardnertown
According to the poverty statistics in Gardnertown, males aged under 5 years and females aged 12 to 14 years are the age groups that are most secure financially, with 100.0% of males and 100.0% of females in these age groups living above the poverty line.
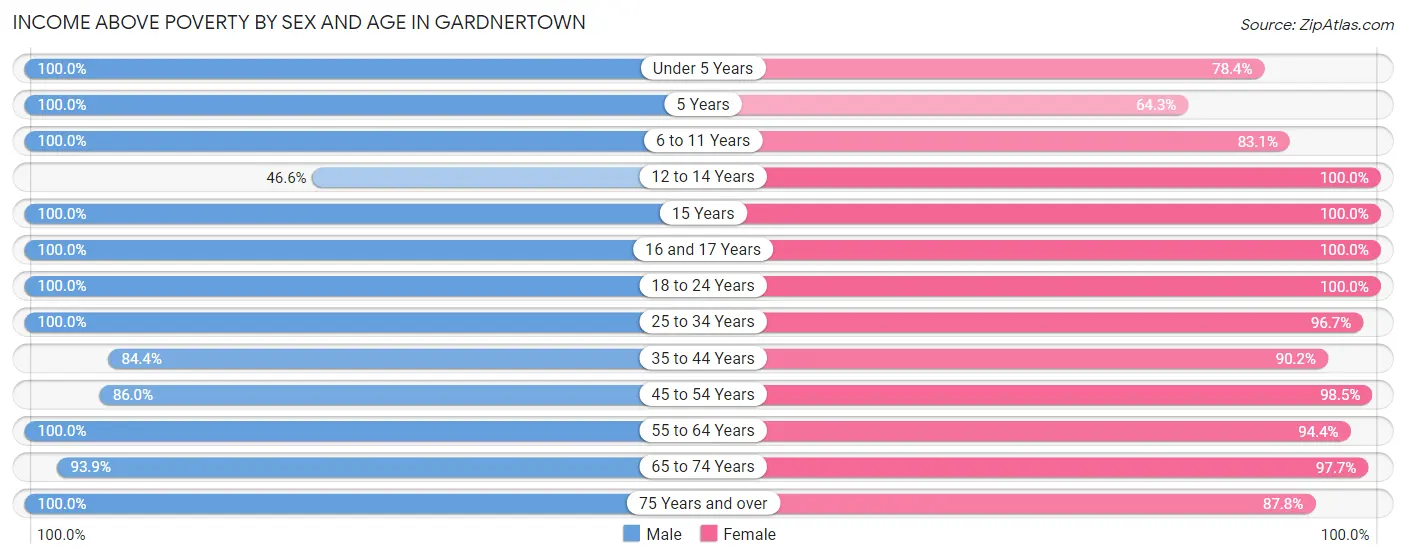
| Age Bracket | Male | Female |
| Under 5 Years | 256 (100.0%) | 40 (78.4%) |
| 5 Years | 11 (100.0%) | 18 (64.3%) |
| 6 to 11 Years | 126 (100.0%) | 217 (83.1%) |
| 12 to 14 Years | 34 (46.6%) | 39 (100.0%) |
| 15 Years | 9 (100.0%) | 1 (100.0%) |
| 16 and 17 Years | 24 (100.0%) | 18 (100.0%) |
| 18 to 24 Years | 88 (100.0%) | 138 (100.0%) |
| 25 to 34 Years | 227 (100.0%) | 297 (96.7%) |
| 35 to 44 Years | 352 (84.4%) | 322 (90.2%) |
| 45 to 54 Years | 117 (86.0%) | 191 (98.5%) |
| 55 to 64 Years | 265 (100.0%) | 236 (94.4%) |
| 65 to 74 Years | 138 (93.9%) | 127 (97.7%) |
| 75 Years and over | 181 (100.0%) | 166 (87.8%) |
| Total | 1,828 (93.3%) | 1,810 (92.2%) |
Income Below Poverty Among Married-Couple Families in Gardnertown
The poverty statistics for married-couple families in Gardnertown show that 5.0% or 42 of the total 835 families live below the poverty line. Families with 1 or 2 children have the highest poverty rate of 11.2%, comprising of 42 families. On the other hand, families with no children have the lowest poverty rate of 0.0%, which includes 0 families.
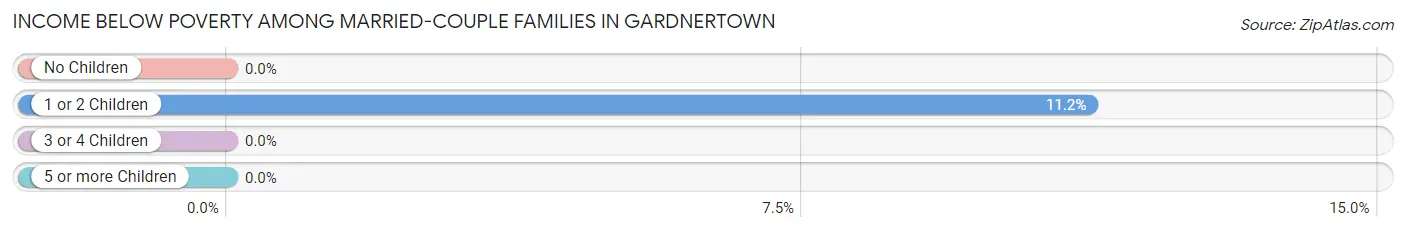
| Children | Above Poverty | Below Poverty |
| No Children | 452 (100.0%) | 0 (0.0%) |
| 1 or 2 Children | 332 (88.8%) | 42 (11.2%) |
| 3 or 4 Children | 9 (100.0%) | 0 (0.0%) |
| 5 or more Children | 0 (0.0%) | 0 (0.0%) |
| Total | 793 (95.0%) | 42 (5.0%) |
Income Below Poverty Among Single-Parent Households in Gardnertown
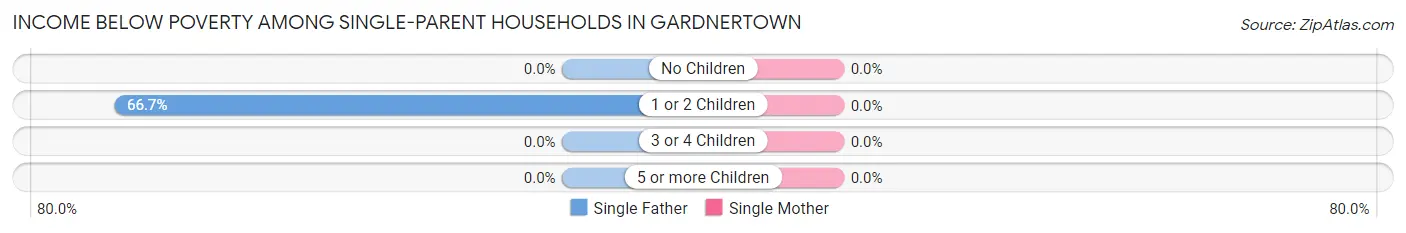
| Children | Single Father | Single Mother |
| No Children | 0 (0.0%) | 0 (0.0%) |
| 1 or 2 Children | 36 (66.7%) | 0 (0.0%) |
| 3 or 4 Children | 0 (0.0%) | 0 (0.0%) |
| 5 or more Children | 0 (0.0%) | 0 (0.0%) |
| Total | 36 (30.0%) | 0 (0.0%) |
Income Below Poverty Among Married-Couple vs Single-Parent Households in Gardnertown
The poverty data for Gardnertown shows that 42 of the married-couple family households (5.0%) and 36 of the single-parent households (12.5%) are living below the poverty level. Within the married-couple family households, those with 1 or 2 children have the highest poverty rate, with 42 households (11.2%) falling below the poverty line. Among the single-parent households, those with 1 or 2 children have the highest poverty rate, with 36 household (34.9%) living below poverty.
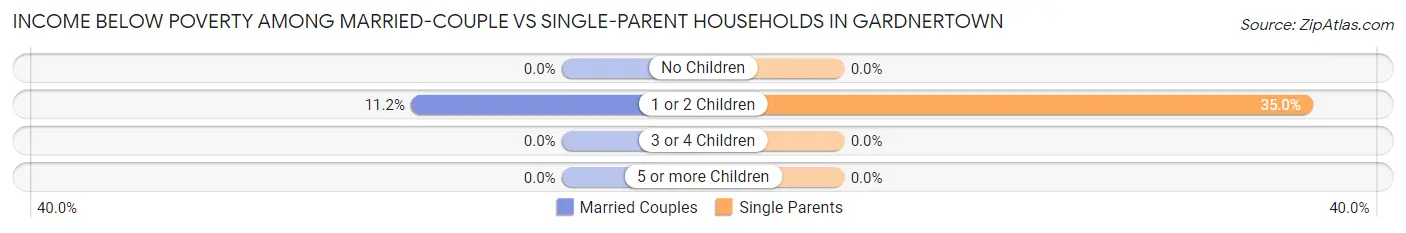
| Children | Married-Couple Families | Single-Parent Households |
| No Children | 0 (0.0%) | 0 (0.0%) |
| 1 or 2 Children | 42 (11.2%) | 36 (34.9%) |
| 3 or 4 Children | 0 (0.0%) | 0 (0.0%) |
| 5 or more Children | 0 (0.0%) | 0 (0.0%) |
| Total | 42 (5.0%) | 36 (12.5%) |
Race in Gardnertown
The most populous races in Gardnertown are White / Caucasian (2,468 | 62.6%), Hispanic or Latino (1,276 | 32.4%), and Some other Race (703 | 17.8%).
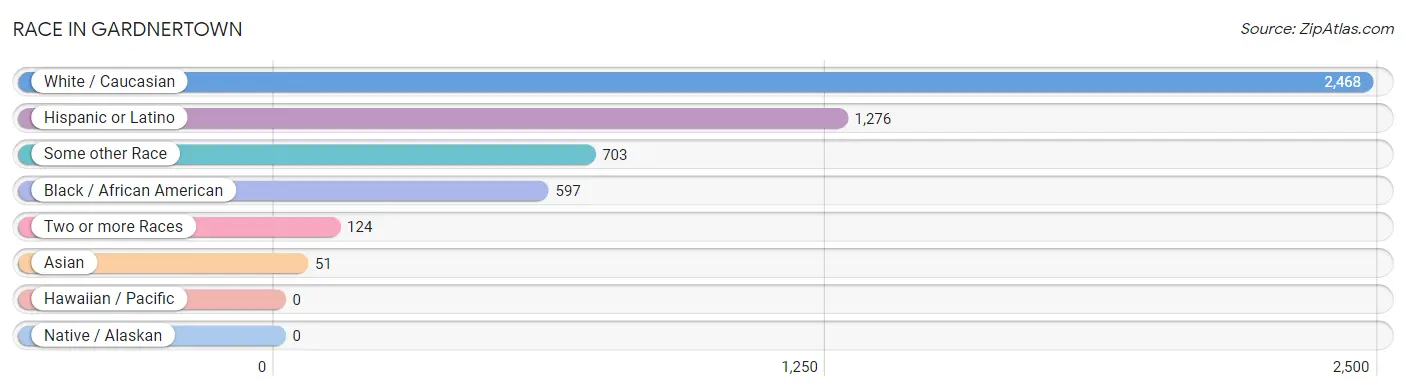
| Race | # Population | % Population |
| Asian | 51 | 1.3% |
| Black / African American | 597 | 15.1% |
| Hawaiian / Pacific | 0 | 0.0% |
| Hispanic or Latino | 1,276 | 32.4% |
| Native / Alaskan | 0 | 0.0% |
| White / Caucasian | 2,468 | 62.6% |
| Two or more Races | 124 | 3.1% |
| Some other Race | 703 | 17.8% |
| Total | 3,943 | 100.0% |
Ancestry in Gardnertown
The most populous ancestries reported in Gardnertown are Italian (552 | 14.0%), Irish (452 | 11.5%), Puerto Rican (451 | 11.4%), Mexican (431 | 10.9%), and German (302 | 7.7%), together accounting for 55.5% of all Gardnertown residents.
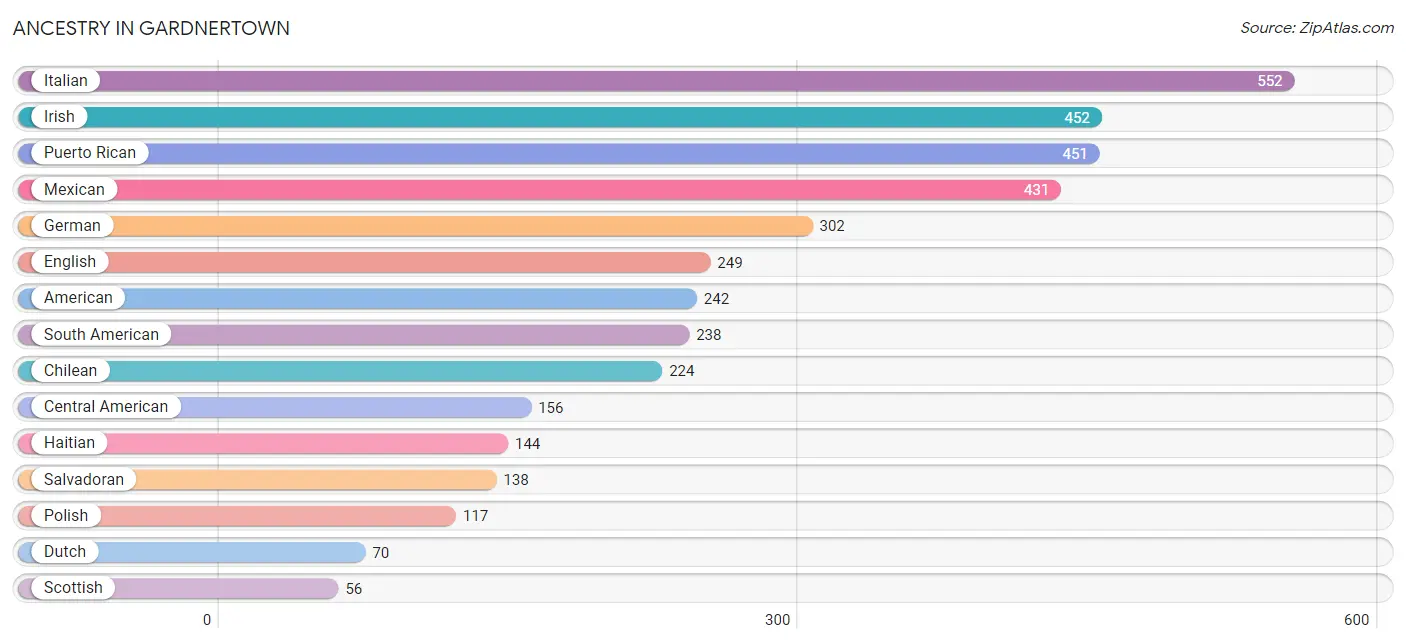
| Ancestry | # Population | % Population |
| American | 242 | 6.1% |
| Austrian | 22 | 0.6% |
| Bhutanese | 16 | 0.4% |
| Brazilian | 7 | 0.2% |
| British West Indian | 9 | 0.2% |
| Burmese | 19 | 0.5% |
| Canadian | 13 | 0.3% |
| Central American | 156 | 4.0% |
| Chilean | 224 | 5.7% |
| Colombian | 14 | 0.4% |
| Danish | 6 | 0.2% |
| Dutch | 70 | 1.8% |
| English | 249 | 6.3% |
| European | 51 | 1.3% |
| French | 17 | 0.4% |
| French Canadian | 13 | 0.3% |
| German | 302 | 7.7% |
| Haitian | 144 | 3.6% |
| Honduran | 18 | 0.5% |
| Hungarian | 33 | 0.8% |
| Indian (Asian) | 6 | 0.2% |
| Irish | 452 | 11.5% |
| Iroquois | 11 | 0.3% |
| Israeli | 11 | 0.3% |
| Italian | 552 | 14.0% |
| Korean | 22 | 0.6% |
| Mexican | 431 | 10.9% |
| Northern European | 42 | 1.1% |
| Polish | 117 | 3.0% |
| Puerto Rican | 451 | 11.4% |
| Russian | 14 | 0.4% |
| Salvadoran | 138 | 3.5% |
| Scotch-Irish | 29 | 0.7% |
| Scottish | 56 | 1.4% |
| Slavic | 8 | 0.2% |
| South American | 238 | 6.0% |
| Swedish | 20 | 0.5% |
| West Indian | 22 | 0.6% | View All 38 Rows |
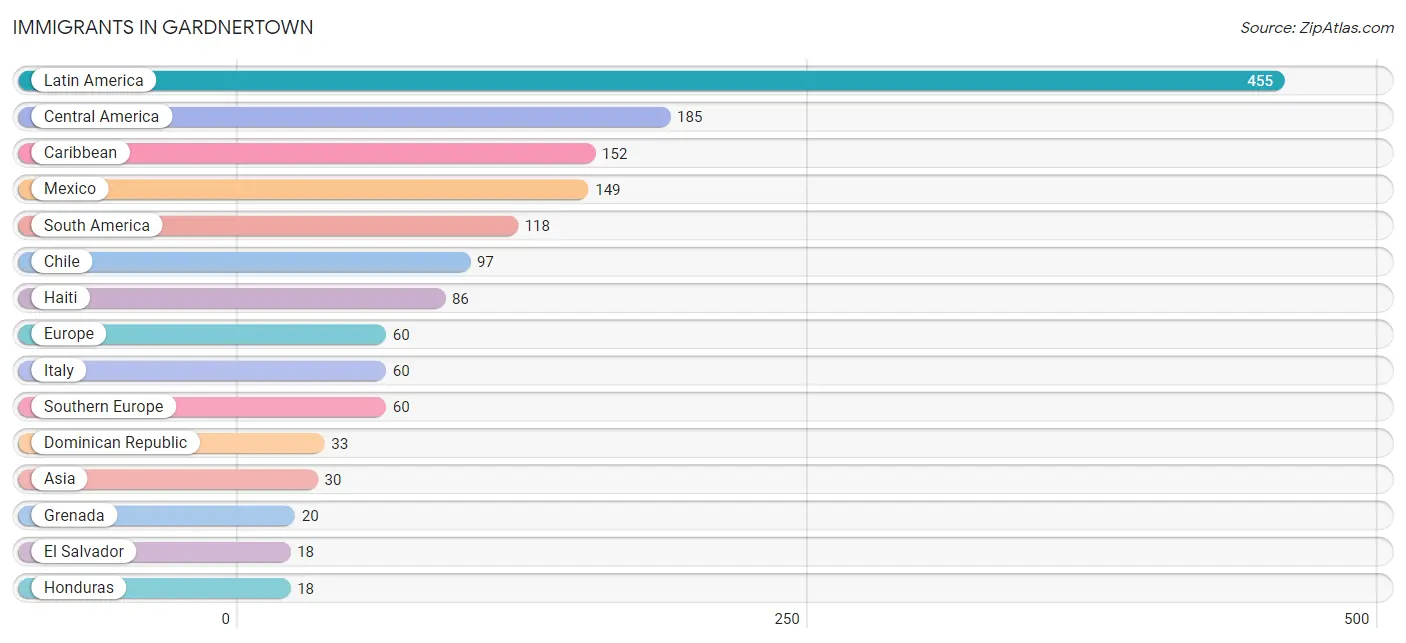
Immigrants in Gardnertown
The most numerous immigrant groups reported in Gardnertown came from Latin America (455 | 11.5%), Central America (185 | 4.7%), Caribbean (152 | 3.8%), Mexico (149 | 3.8%), and South America (118 | 3.0%), together accounting for 26.9% of all Gardnertown residents.
| Immigration Origin | # Population | % Population |
| Asia | 30 | 0.8% |
| Brazil | 7 | 0.2% |
| Canada | 13 | 0.3% |
| Caribbean | 152 | 3.8% |
| Central America | 185 | 4.7% |
| Chile | 97 | 2.5% |
| Colombia | 14 | 0.4% |
| Dominican Republic | 33 | 0.8% |
| Eastern Asia | 7 | 0.2% |
| El Salvador | 18 | 0.5% |
| Europe | 60 | 1.5% |
| Grenada | 20 | 0.5% |
| Haiti | 86 | 2.2% |
| Honduras | 18 | 0.5% |
| Israel | 11 | 0.3% |
| Italy | 60 | 1.5% |
| Jamaica | 13 | 0.3% |
| Korea | 7 | 0.2% |
| Latin America | 455 | 11.5% |
| Mexico | 149 | 3.8% |
| Philippines | 12 | 0.3% |
| South America | 118 | 3.0% |
| South Eastern Asia | 12 | 0.3% |
| Southern Europe | 60 | 1.5% |
| Western Asia | 11 | 0.3% | View All 25 Rows |
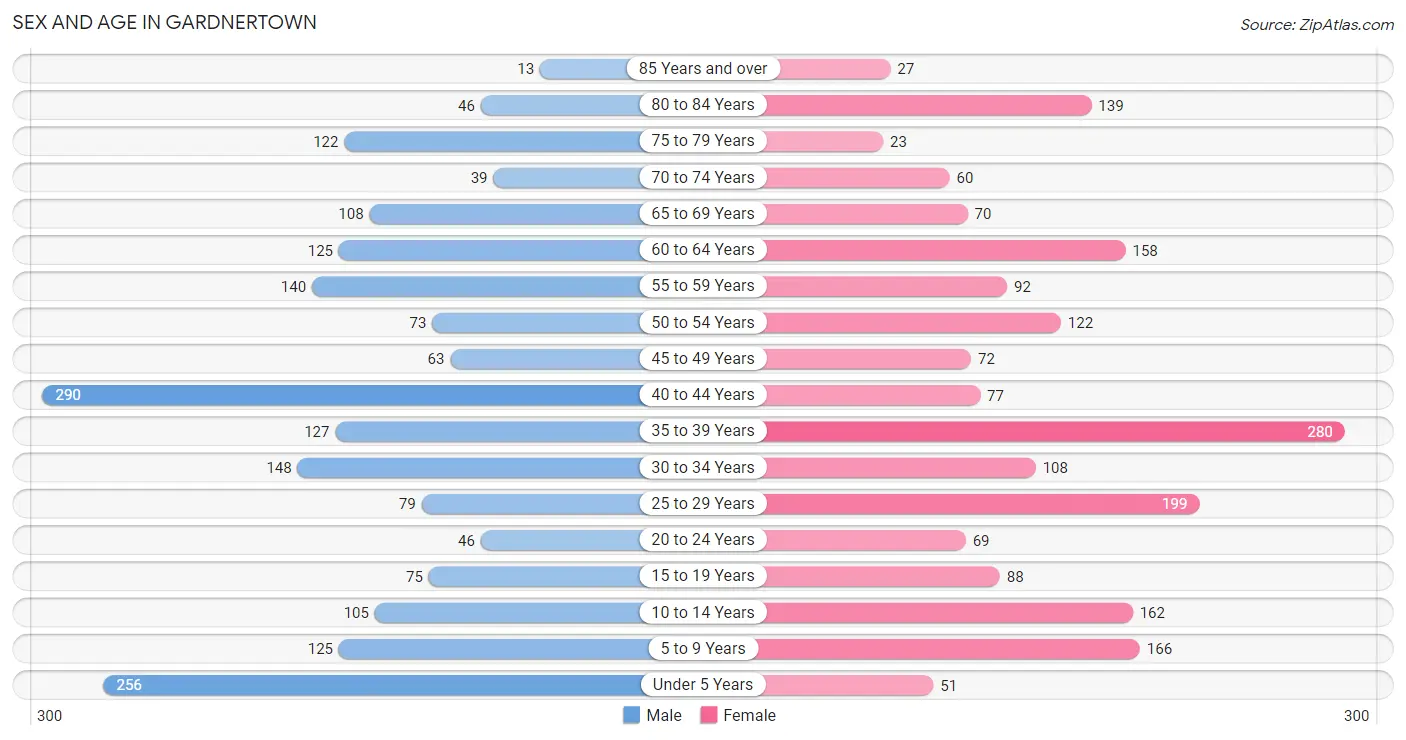
Sex and Age in Gardnertown
Sex and Age in Gardnertown
The most populous age groups in Gardnertown are 40 to 44 Years (290 | 14.6%) for men and 35 to 39 Years (280 | 14.3%) for women.
| Age Bracket | Male | Female |
| Under 5 Years | 256 (12.9%) | 51 (2.6%) |
| 5 to 9 Years | 125 (6.3%) | 166 (8.5%) |
| 10 to 14 Years | 105 (5.3%) | 162 (8.3%) |
| 15 to 19 Years | 75 (3.8%) | 88 (4.5%) |
| 20 to 24 Years | 46 (2.3%) | 69 (3.5%) |
| 25 to 29 Years | 79 (4.0%) | 199 (10.1%) |
| 30 to 34 Years | 148 (7.5%) | 108 (5.5%) |
| 35 to 39 Years | 127 (6.4%) | 280 (14.3%) |
| 40 to 44 Years | 290 (14.6%) | 77 (3.9%) |
| 45 to 49 Years | 63 (3.2%) | 72 (3.7%) |
| 50 to 54 Years | 73 (3.7%) | 122 (6.2%) |
| 55 to 59 Years | 140 (7.1%) | 92 (4.7%) |
| 60 to 64 Years | 125 (6.3%) | 158 (8.1%) |
| 65 to 69 Years | 108 (5.4%) | 70 (3.6%) |
| 70 to 74 Years | 39 (2.0%) | 60 (3.1%) |
| 75 to 79 Years | 122 (6.2%) | 23 (1.2%) |
| 80 to 84 Years | 46 (2.3%) | 139 (7.1%) |
| 85 Years and over | 13 (0.7%) | 27 (1.4%) |
| Total | 1,980 (100.0%) | 1,963 (100.0%) |
Families and Households in Gardnertown
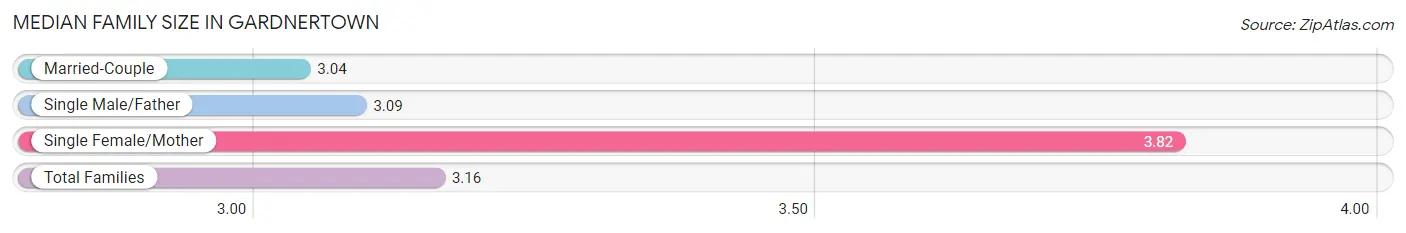
Median Family Size in Gardnertown
The median family size in Gardnertown is 3.16 persons per family, with single female/mother families (168 | 15.0%) accounting for the largest median family size of 3.82 persons per family. On the other hand, married-couple families (835 | 74.4%) represent the smallest median family size with 3.04 persons per family.
| Family Type | # Families | Family Size |
| Married-Couple | 835 (74.4%) | 3.04 |
| Single Male/Father | 120 (10.7%) | 3.09 |
| Single Female/Mother | 168 (15.0%) | 3.82 |
| Total Families | 1,123 (100.0%) | 3.16 |
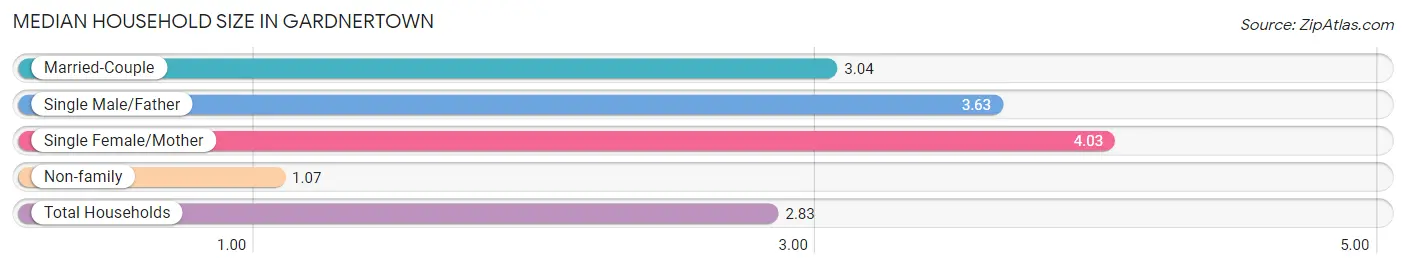
Median Household Size in Gardnertown
The median household size in Gardnertown is 2.83 persons per household, with single female/mother households (168 | 12.1%) accounting for the largest median household size of 4.03 persons per household. non-family households (268 | 19.3%) represent the smallest median household size with 1.07 persons per household.
| Household Type | # Households | Household Size |
| Married-Couple | 835 (60.0%) | 3.04 |
| Single Male/Father | 120 (8.6%) | 3.63 |
| Single Female/Mother | 168 (12.1%) | 4.03 |
| Non-family | 268 (19.3%) | 1.07 |
| Total Households | 1,391 (100.0%) | 2.83 |
Household Size by Marriage Status in Gardnertown
Out of a total of 1,391 households in Gardnertown, 1,123 (80.7%) are family households, while 268 (19.3%) are nonfamily households. The most numerous type of family households are 2-person households, comprising 428, and the most common type of nonfamily households are 1-person households, comprising 247.
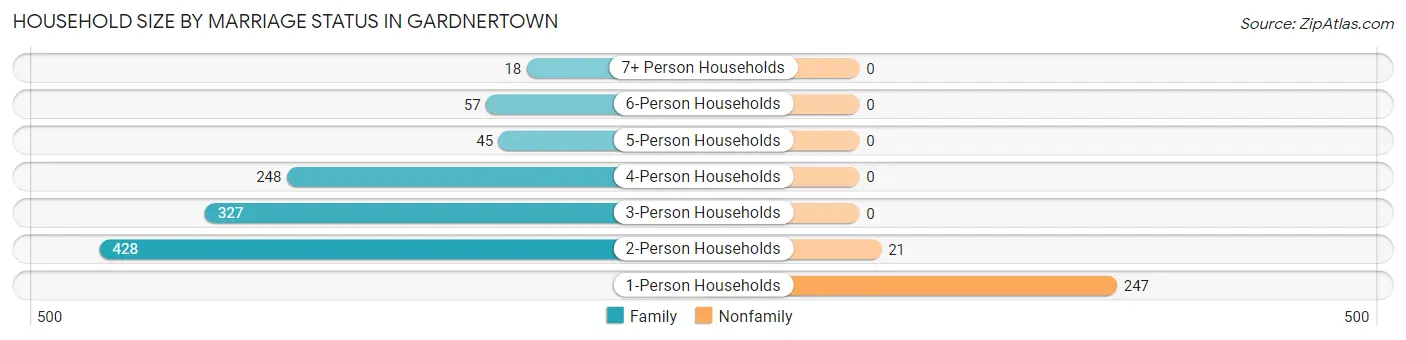
| Household Size | Family Households | Nonfamily Households |
| 1-Person Households | - | 247 (17.8%) |
| 2-Person Households | 428 (30.8%) | 21 (1.5%) |
| 3-Person Households | 327 (23.5%) | 0 (0.0%) |
| 4-Person Households | 248 (17.8%) | 0 (0.0%) |
| 5-Person Households | 45 (3.2%) | 0 (0.0%) |
| 6-Person Households | 57 (4.1%) | 0 (0.0%) |
| 7+ Person Households | 18 (1.3%) | 0 (0.0%) |
| Total | 1,123 (80.7%) | 268 (19.3%) |
Female Fertility in Gardnertown
Fertility by Age in Gardnertown
Average fertility rate in Gardnertown is 66.0 births per 1,000 women. Women in the age bracket of 20 to 34 years have the highest fertility rate with 136.0 births per 1,000 women. Women in the age bracket of 20 to 34 years acount for 85.0% of all women with births.
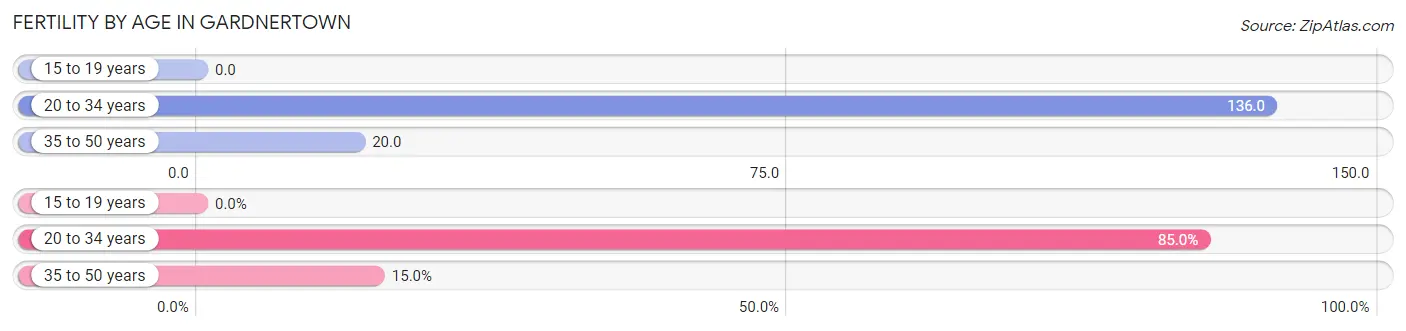
| Age Bracket | Women with Births | Births / 1,000 Women |
| 15 to 19 years | 0 (0.0%) | 0.0 |
| 20 to 34 years | 51 (85.0%) | 136.0 |
| 35 to 50 years | 9 (15.0%) | 20.0 |
| Total | 60 (100.0%) | 66.0 |
Fertility by Age by Marriage Status in Gardnertown
28.3% of women with births (60) in Gardnertown are married. The highest percentage of unmarried women with births falls into 20 to 34 years age bracket with 84.3% of them unmarried at the time of birth, while the lowest percentage of unmarried women with births belong to 35 to 50 years age bracket with 0.0% of them unmarried.
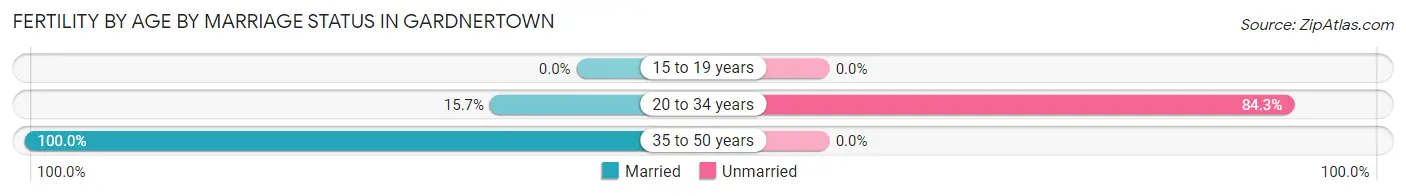
| Age Bracket | Married | Unmarried |
| 15 to 19 years | 0 (0.0%) | 0 (0.0%) |
| 20 to 34 years | 8 (15.7%) | 43 (84.3%) |
| 35 to 50 years | 9 (100.0%) | 0 (0.0%) |
| Total | 17 (28.3%) | 43 (71.7%) |
Fertility by Education in Gardnertown
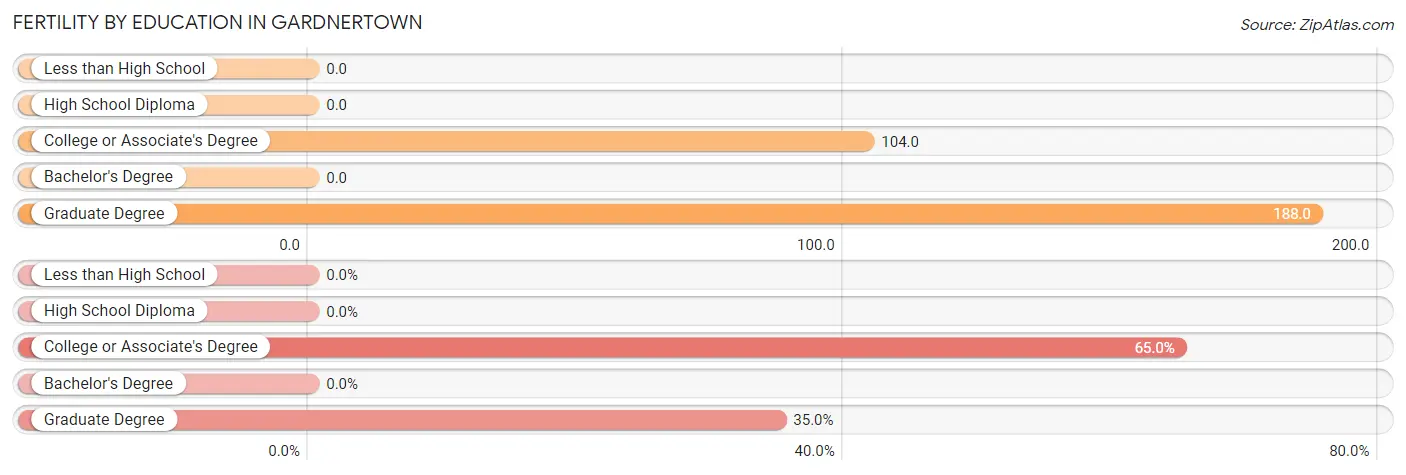
| Educational Attainment | Women with Births | Births / 1,000 Women |
| Less than High School | 0 (0.0%) | 0.0 |
| High School Diploma | 0 (0.0%) | 0.0 |
| College or Associate's Degree | 39 (65.0%) | 104.0 |
| Bachelor's Degree | 0 (0.0%) | 0.0 |
| Graduate Degree | 21 (35.0%) | 188.0 |
| Total | 60 (100.0%) | 66.0 |
Fertility by Education by Marriage Status in Gardnertown
71.7% of women with births in Gardnertown are unmarried. Women with the educational attainment of graduate degree are most likely to be married with 38.1% of them married at childbirth, while women with the educational attainment of college or associate's degree are least likely to be married with 76.9% of them unmarried at childbirth.
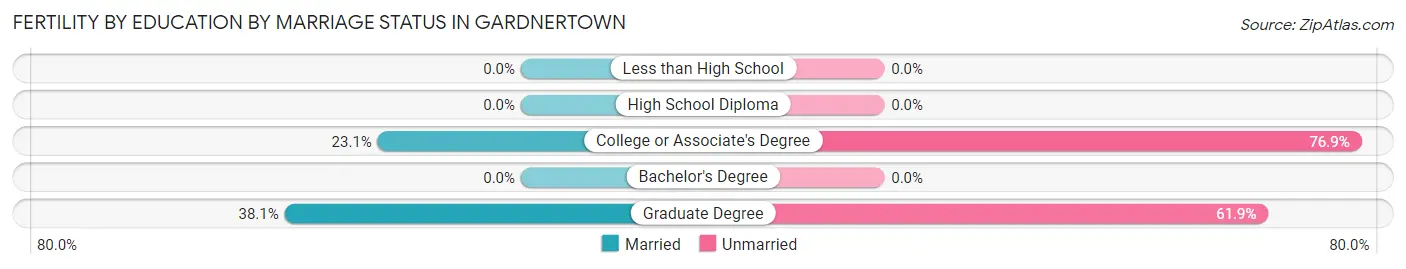
| Educational Attainment | Married | Unmarried |
| Less than High School | 0 (0.0%) | 0 (0.0%) |
| High School Diploma | 0 (0.0%) | 0 (0.0%) |
| College or Associate's Degree | 9 (23.1%) | 30 (76.9%) |
| Bachelor's Degree | 0 (0.0%) | 0 (0.0%) |
| Graduate Degree | 8 (38.1%) | 13 (61.9%) |
| Total | 17 (28.3%) | 43 (71.7%) |
Employment Characteristics in Gardnertown
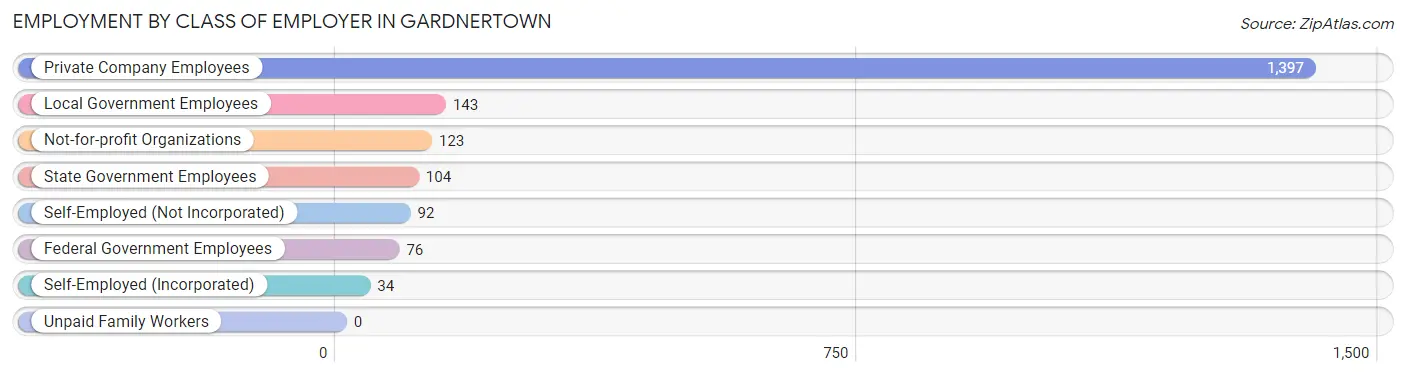
Employment by Class of Employer in Gardnertown
Among the 1,969 employed individuals in Gardnertown, private company employees (1,397 | 71.0%), local government employees (143 | 7.3%), and not-for-profit organizations (123 | 6.2%) make up the most common classes of employment.
| Employer Class | # Employees | % Employees |
| Private Company Employees | 1,397 | 71.0% |
| Self-Employed (Incorporated) | 34 | 1.7% |
| Self-Employed (Not Incorporated) | 92 | 4.7% |
| Not-for-profit Organizations | 123 | 6.2% |
| Local Government Employees | 143 | 7.3% |
| State Government Employees | 104 | 5.3% |
| Federal Government Employees | 76 | 3.9% |
| Unpaid Family Workers | 0 | 0.0% |
| Total | 1,969 | 100.0% |
Employment Status by Age in Gardnertown
According to the labor force statistics for Gardnertown, out of the total population over 16 years of age (3,068), 67.7% or 2,077 individuals are in the labor force, with 4.6% or 96 of them unemployed. The age group with the highest labor force participation rate is 45 to 54 years, with 93.3% or 308 individuals in the labor force. Within the labor force, the 30 to 34 years age range has the highest percentage of unemployed individuals, with 15.6% or 35 of them being unemployed.
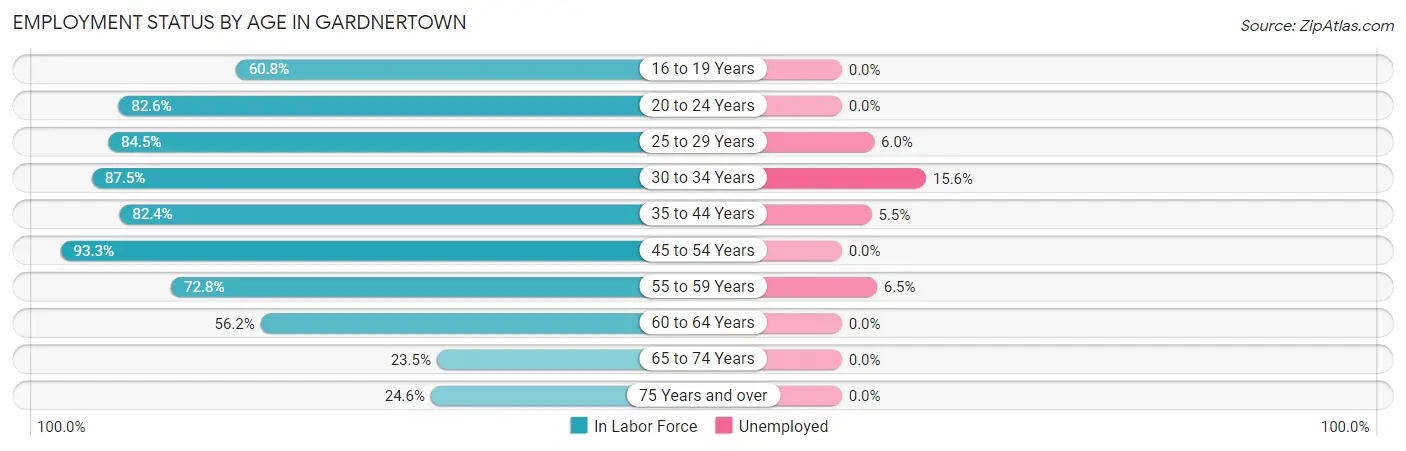
| Age Bracket | In Labor Force | Unemployed |
| 16 to 19 Years | 93 (60.8%) | 0 (0.0%) |
| 20 to 24 Years | 95 (82.6%) | 0 (0.0%) |
| 25 to 29 Years | 235 (84.5%) | 14 (6.0%) |
| 30 to 34 Years | 224 (87.5%) | 35 (15.6%) |
| 35 to 44 Years | 638 (82.4%) | 35 (5.5%) |
| 45 to 54 Years | 308 (93.3%) | 0 (0.0%) |
| 55 to 59 Years | 169 (72.8%) | 11 (6.5%) |
| 60 to 64 Years | 159 (56.2%) | 0 (0.0%) |
| 65 to 74 Years | 65 (23.5%) | 0 (0.0%) |
| 75 Years and over | 91 (24.6%) | 0 (0.0%) |
| Total | 2,077 (67.7%) | 96 (4.6%) |
Employment Status by Educational Attainment in Gardnertown
According to labor force statistics for Gardnertown, 80.5% of individuals (1,733) out of the total population between 25 and 64 years of age (2,153) are in the labor force, with 5.5% or 95 of them being unemployed. The group with the highest labor force participation rate are those with the educational attainment of bachelor's degree or higher, with 86.7% or 646 individuals in the labor force. Within the labor force, individuals with high school diploma education have the highest percentage of unemployment, with 12.6% or 43 of them being unemployed.
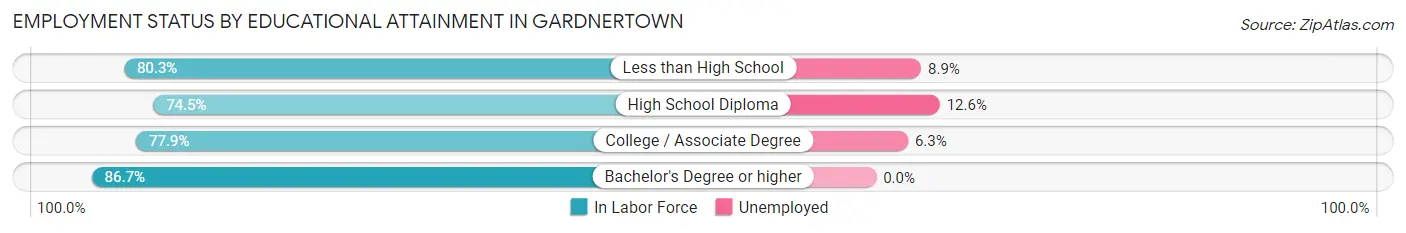
| Educational Attainment | In Labor Force | Unemployed |
| Less than High School | 192 (80.3%) | 21 (8.9%) |
| High School Diploma | 341 (74.5%) | 58 (12.6%) |
| College / Associate Degree | 554 (77.9%) | 45 (6.3%) |
| Bachelor's Degree or higher | 646 (86.7%) | 0 (0.0%) |
| Total | 1,733 (80.5%) | 118 (5.5%) |
Employment Occupations by Sex in Gardnertown
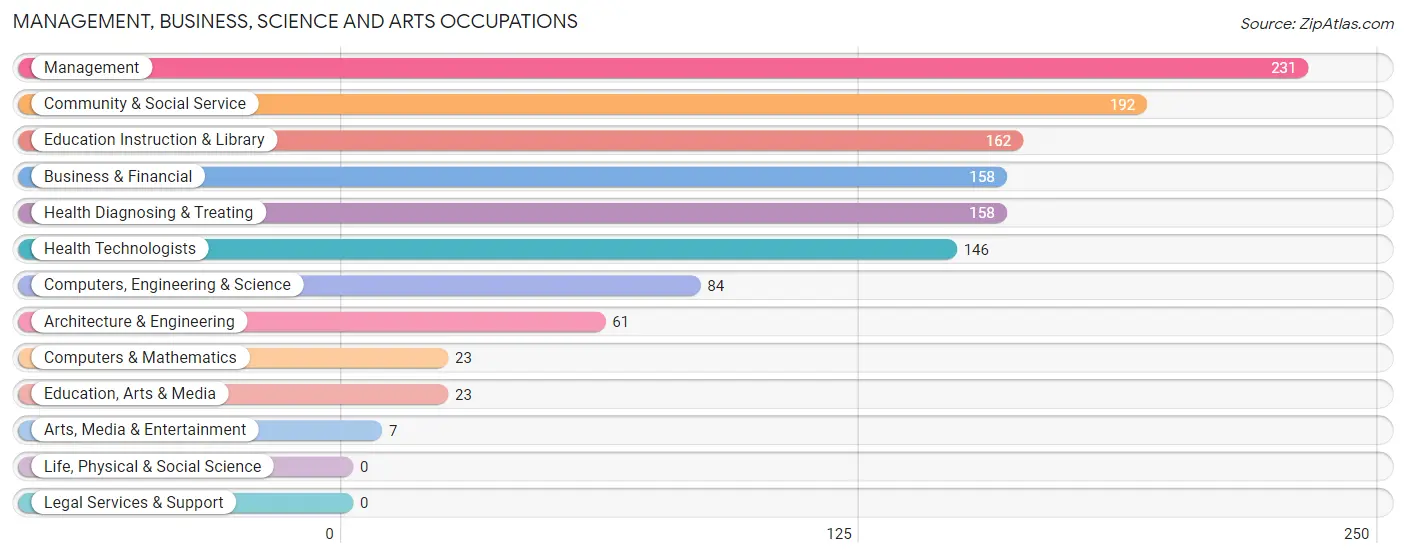
Management, Business, Science and Arts Occupations
The most common Management, Business, Science and Arts occupations in Gardnertown are Management (231 | 11.7%), Community & Social Service (192 | 9.7%), Education Instruction & Library (162 | 8.2%), Business & Financial (158 | 8.0%), and Health Diagnosing & Treating (158 | 8.0%).
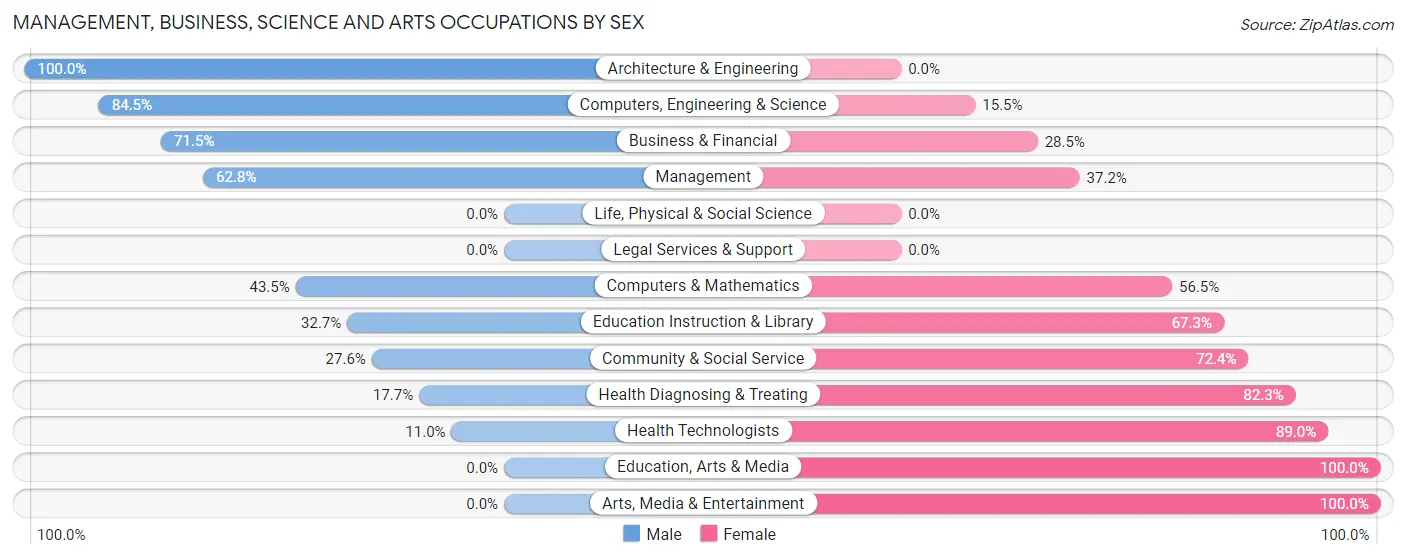
Management, Business, Science and Arts Occupations by Sex
Within the Management, Business, Science and Arts occupations in Gardnertown, the most male-oriented occupations are Architecture & Engineering (100.0%), Computers, Engineering & Science (84.5%), and Business & Financial (71.5%), while the most female-oriented occupations are Education, Arts & Media (100.0%), Arts, Media & Entertainment (100.0%), and Health Technologists (89.0%).
| Occupation | Male | Female |
| Management | 145 (62.8%) | 86 (37.2%) |
| Business & Financial | 113 (71.5%) | 45 (28.5%) |
| Computers, Engineering & Science | 71 (84.5%) | 13 (15.5%) |
| Computers & Mathematics | 10 (43.5%) | 13 (56.5%) |
| Architecture & Engineering | 61 (100.0%) | 0 (0.0%) |
| Life, Physical & Social Science | 0 (0.0%) | 0 (0.0%) |
| Community & Social Service | 53 (27.6%) | 139 (72.4%) |
| Education, Arts & Media | 0 (0.0%) | 23 (100.0%) |
| Legal Services & Support | 0 (0.0%) | 0 (0.0%) |
| Education Instruction & Library | 53 (32.7%) | 109 (67.3%) |
| Arts, Media & Entertainment | 0 (0.0%) | 7 (100.0%) |
| Health Diagnosing & Treating | 28 (17.7%) | 130 (82.3%) |
| Health Technologists | 16 (11.0%) | 130 (89.0%) |
| Total (Category) | 410 (49.8%) | 413 (50.2%) |
| Total (Overall) | 1,016 (51.3%) | 966 (48.7%) |
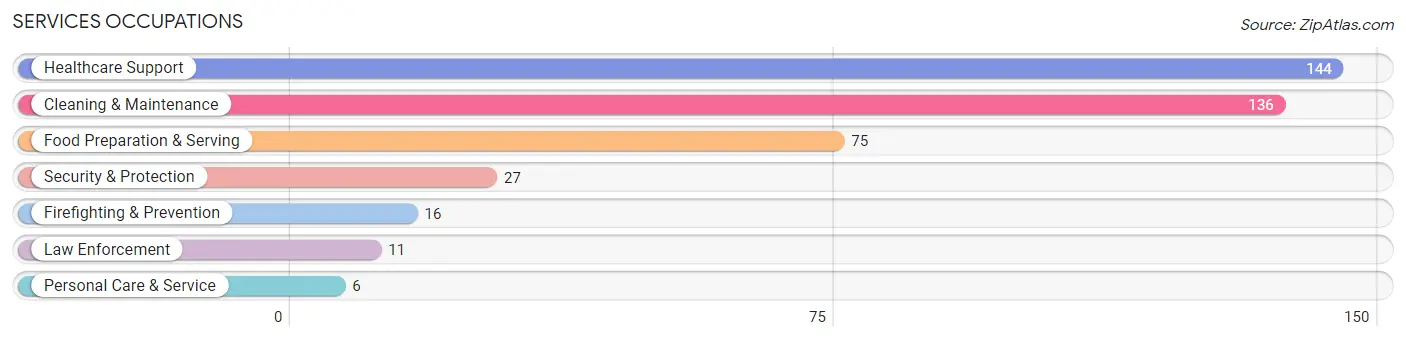
Services Occupations
The most common Services occupations in Gardnertown are Healthcare Support (144 | 7.3%), Cleaning & Maintenance (136 | 6.9%), Food Preparation & Serving (75 | 3.8%), Security & Protection (27 | 1.4%), and Firefighting & Prevention (16 | 0.8%).
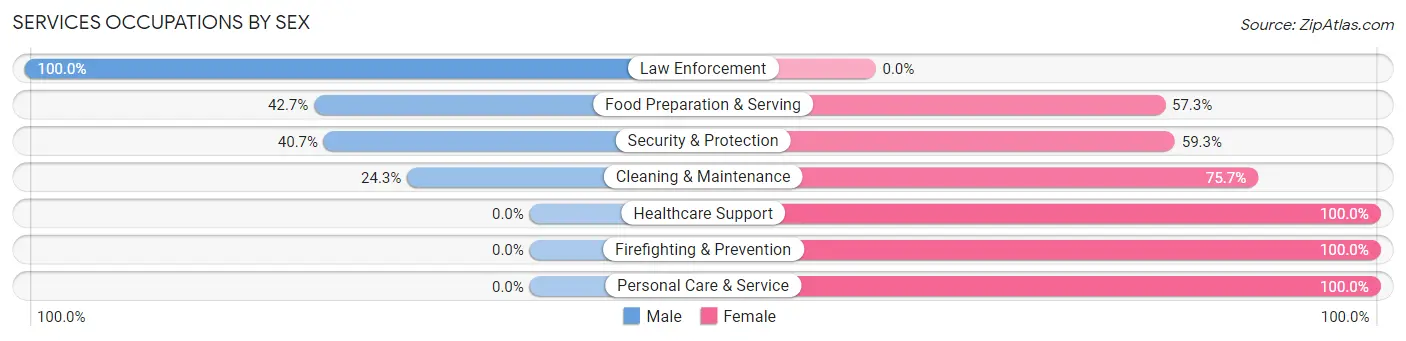
Services Occupations by Sex
Within the Services occupations in Gardnertown, the most male-oriented occupations are Law Enforcement (100.0%), Food Preparation & Serving (42.7%), and Security & Protection (40.7%), while the most female-oriented occupations are Healthcare Support (100.0%), Firefighting & Prevention (100.0%), and Personal Care & Service (100.0%).
| Occupation | Male | Female |
| Healthcare Support | 0 (0.0%) | 144 (100.0%) |
| Security & Protection | 11 (40.7%) | 16 (59.3%) |
| Firefighting & Prevention | 0 (0.0%) | 16 (100.0%) |
| Law Enforcement | 11 (100.0%) | 0 (0.0%) |
| Food Preparation & Serving | 32 (42.7%) | 43 (57.3%) |
| Cleaning & Maintenance | 33 (24.3%) | 103 (75.7%) |
| Personal Care & Service | 0 (0.0%) | 6 (100.0%) |
| Total (Category) | 76 (19.6%) | 312 (80.4%) |
| Total (Overall) | 1,016 (51.3%) | 966 (48.7%) |
Sales and Office Occupations
The most common Sales and Office occupations in Gardnertown are Sales & Related (244 | 12.3%), and Office & Administration (121 | 6.1%).
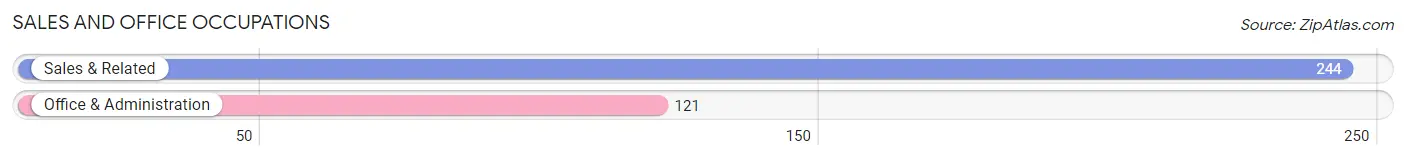
Sales and Office Occupations by Sex
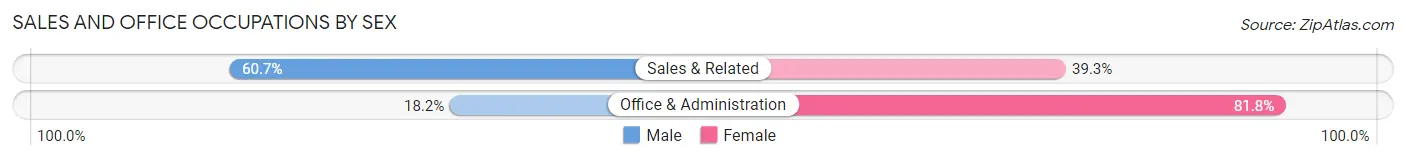
| Occupation | Male | Female |
| Sales & Related | 148 (60.7%) | 96 (39.3%) |
| Office & Administration | 22 (18.2%) | 99 (81.8%) |
| Total (Category) | 170 (46.6%) | 195 (53.4%) |
| Total (Overall) | 1,016 (51.3%) | 966 (48.7%) |
Natural Resources, Construction and Maintenance Occupations
The most common Natural Resources, Construction and Maintenance occupations in Gardnertown are Construction & Extraction (190 | 9.6%), and Installation, Maintenance & Repair (10 | 0.5%).
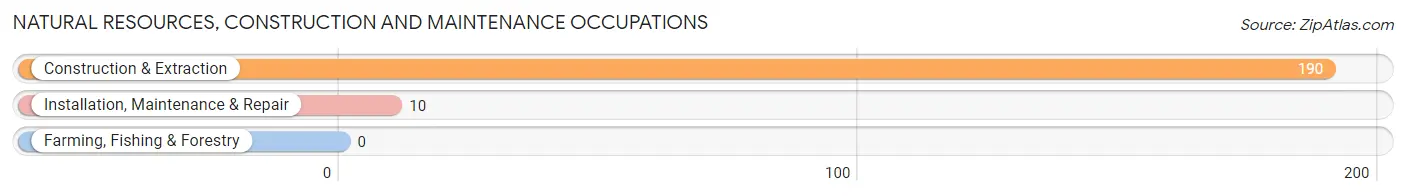
Natural Resources, Construction and Maintenance Occupations by Sex
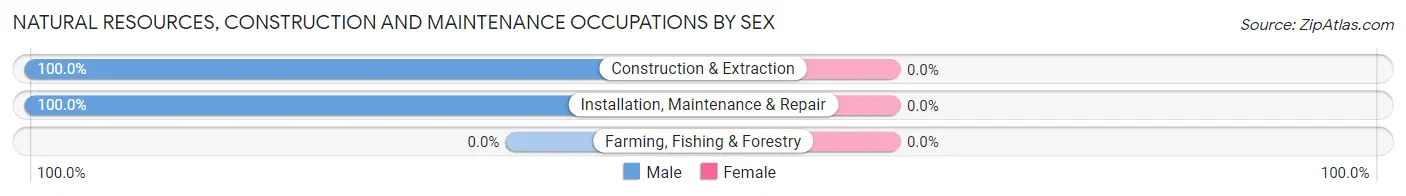
| Occupation | Male | Female |
| Farming, Fishing & Forestry | 0 (0.0%) | 0 (0.0%) |
| Construction & Extraction | 190 (100.0%) | 0 (0.0%) |
| Installation, Maintenance & Repair | 10 (100.0%) | 0 (0.0%) |
| Total (Category) | 200 (100.0%) | 0 (0.0%) |
| Total (Overall) | 1,016 (51.3%) | 966 (48.7%) |
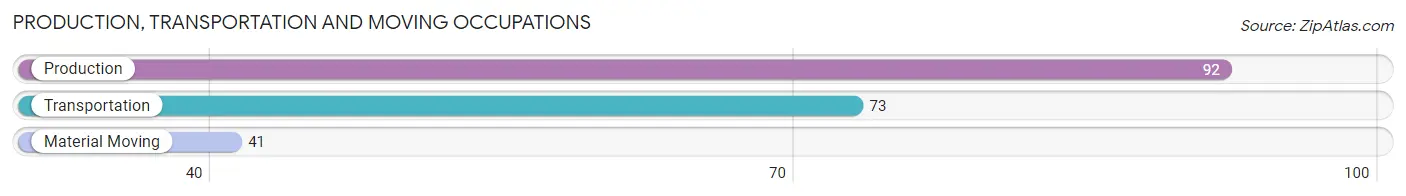
Production, Transportation and Moving Occupations
The most common Production, Transportation and Moving occupations in Gardnertown are Production (92 | 4.6%), Transportation (73 | 3.7%), and Material Moving (41 | 2.1%).
Production, Transportation and Moving Occupations by Sex
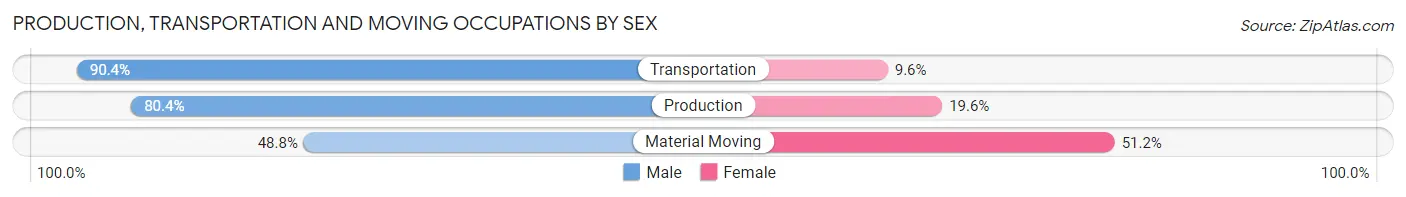
| Occupation | Male | Female |
| Production | 74 (80.4%) | 18 (19.6%) |
| Transportation | 66 (90.4%) | 7 (9.6%) |
| Material Moving | 20 (48.8%) | 21 (51.2%) |
| Total (Category) | 160 (77.7%) | 46 (22.3%) |
| Total (Overall) | 1,016 (51.3%) | 966 (48.7%) |
Employment Industries by Sex in Gardnertown
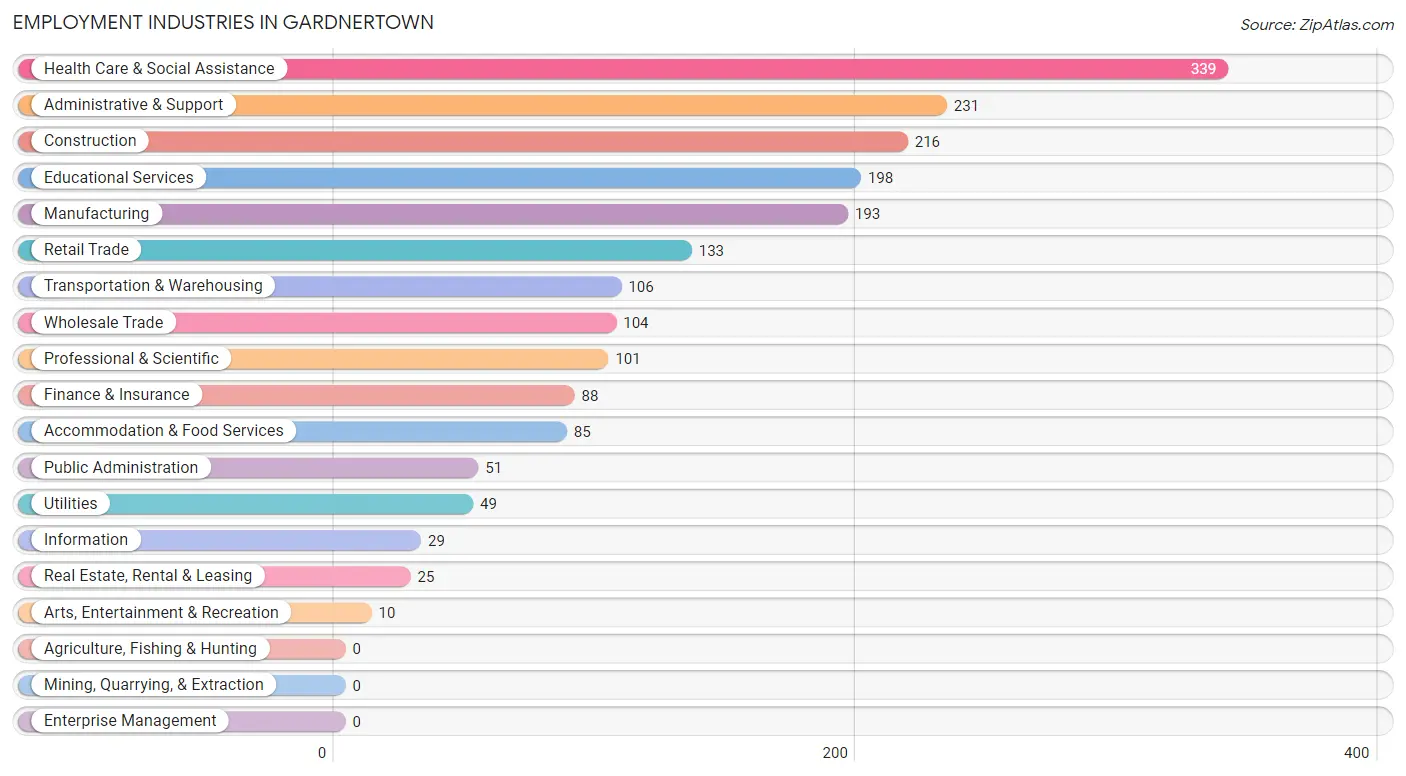
Employment Industries in Gardnertown
The major employment industries in Gardnertown include Health Care & Social Assistance (339 | 17.1%), Administrative & Support (231 | 11.7%), Construction (216 | 10.9%), Educational Services (198 | 10.0%), and Manufacturing (193 | 9.7%).
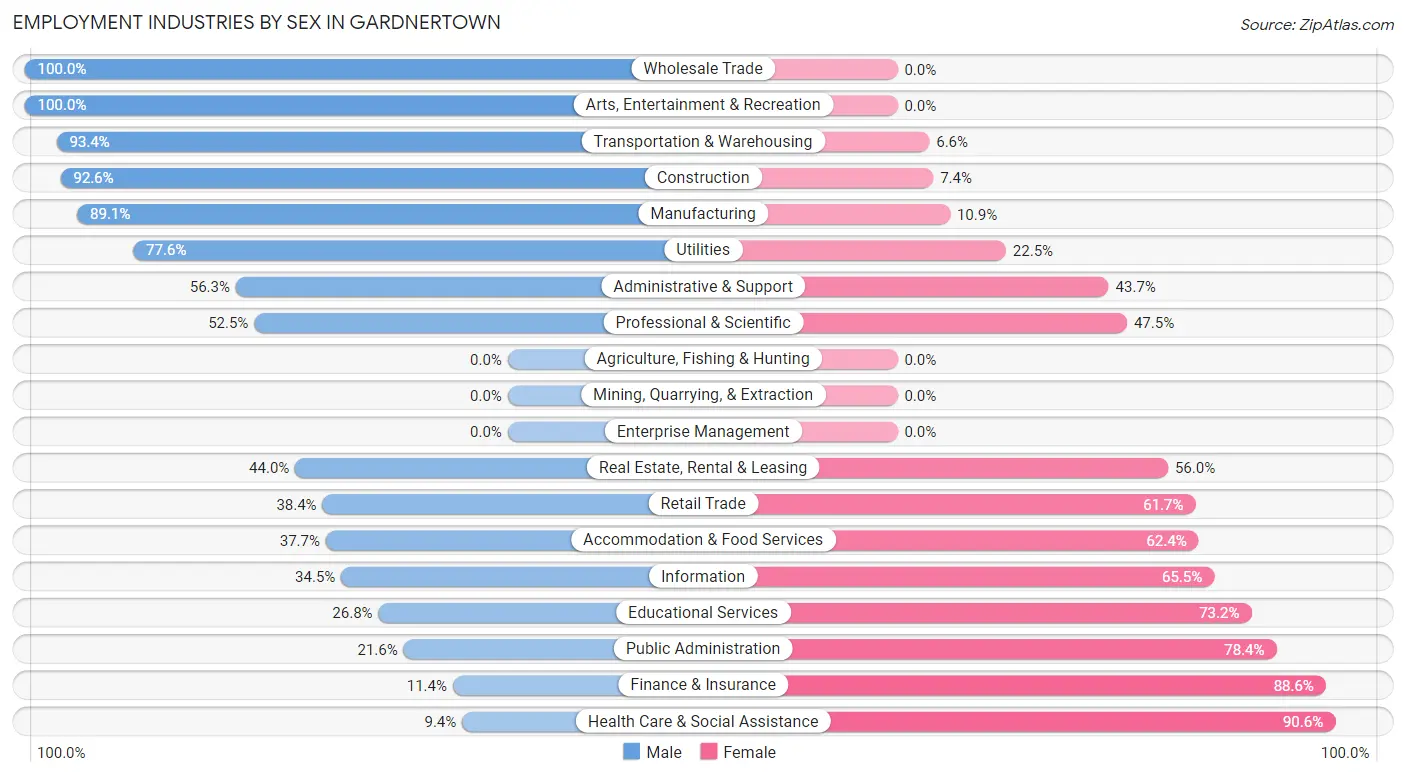
Employment Industries by Sex in Gardnertown
The Gardnertown industries that see more men than women are Wholesale Trade (100.0%), Arts, Entertainment & Recreation (100.0%), and Transportation & Warehousing (93.4%), whereas the industries that tend to have a higher number of women are Health Care & Social Assistance (90.6%), Finance & Insurance (88.6%), and Public Administration (78.4%).
| Industry | Male | Female |
| Agriculture, Fishing & Hunting | 0 (0.0%) | 0 (0.0%) |
| Mining, Quarrying, & Extraction | 0 (0.0%) | 0 (0.0%) |
| Construction | 200 (92.6%) | 16 (7.4%) |
| Manufacturing | 172 (89.1%) | 21 (10.9%) |
| Wholesale Trade | 104 (100.0%) | 0 (0.0%) |
| Retail Trade | 51 (38.4%) | 82 (61.7%) |
| Transportation & Warehousing | 99 (93.4%) | 7 (6.6%) |
| Utilities | 38 (77.5%) | 11 (22.5%) |
| Information | 10 (34.5%) | 19 (65.5%) |
| Finance & Insurance | 10 (11.4%) | 78 (88.6%) |
| Real Estate, Rental & Leasing | 11 (44.0%) | 14 (56.0%) |
| Professional & Scientific | 53 (52.5%) | 48 (47.5%) |
| Enterprise Management | 0 (0.0%) | 0 (0.0%) |
| Administrative & Support | 130 (56.3%) | 101 (43.7%) |
| Educational Services | 53 (26.8%) | 145 (73.2%) |
| Health Care & Social Assistance | 32 (9.4%) | 307 (90.6%) |
| Arts, Entertainment & Recreation | 10 (100.0%) | 0 (0.0%) |
| Accommodation & Food Services | 32 (37.7%) | 53 (62.4%) |
| Public Administration | 11 (21.6%) | 40 (78.4%) |
| Total | 1,016 (51.3%) | 966 (48.7%) |
Education in Gardnertown
School Enrollment in Gardnertown
The most common levels of schooling among the 954 students in Gardnertown are middle school (268 | 28.1%), nursery / preschool (198 | 20.7%), and elementary school (189 | 19.8%).
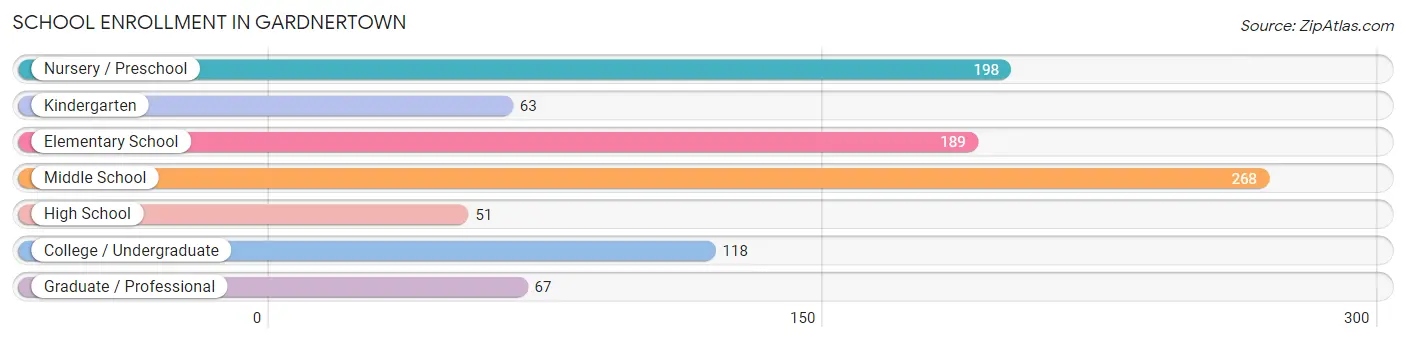
| School Level | # Students | % Students |
| Nursery / Preschool | 198 | 20.7% |
| Kindergarten | 63 | 6.6% |
| Elementary School | 189 | 19.8% |
| Middle School | 268 | 28.1% |
| High School | 51 | 5.3% |
| College / Undergraduate | 118 | 12.4% |
| Graduate / Professional | 67 | 7.0% |
| Total | 954 | 100.0% |
School Enrollment by Age by Funding Source in Gardnertown
Out of a total of 954 students who are enrolled in schools in Gardnertown, 98 (10.3%) attend a private institution, while the remaining 856 (89.7%) are enrolled in public schools. The age group of 25 to 34 year olds has the highest likelihood of being enrolled in private schools, with 43 (86.0% in the age bracket) enrolled. Conversely, the age group of 3 to 4 year olds has the lowest likelihood of being enrolled in a private school, with 159 (100.0% in the age bracket) attending a public institution.
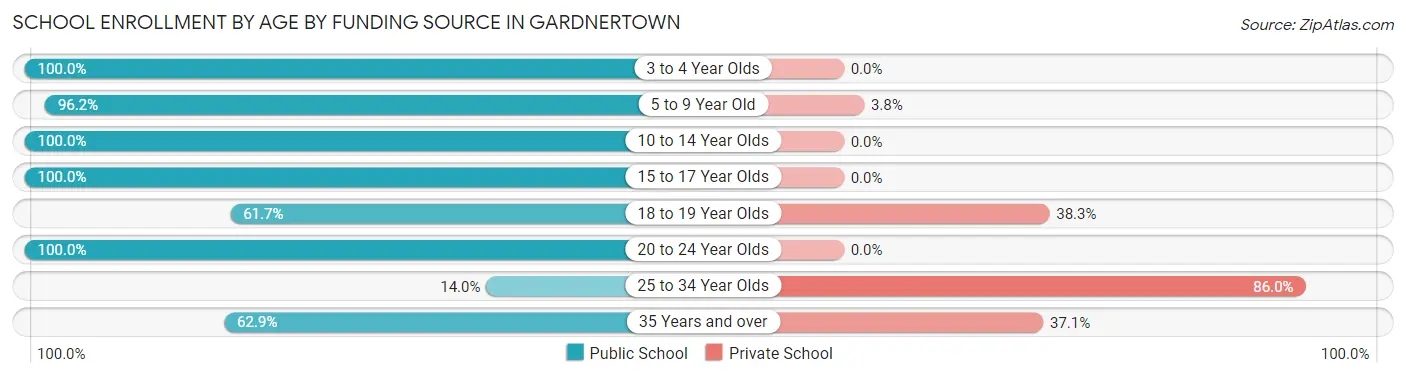
| Age Bracket | Public School | Private School |
| 3 to 4 Year Olds | 159 (100.0%) | 0 (0.0%) |
| 5 to 9 Year Old | 280 (96.2%) | 11 (3.8%) |
| 10 to 14 Year Olds | 267 (100.0%) | 0 (0.0%) |
| 15 to 17 Year Olds | 52 (100.0%) | 0 (0.0%) |
| 18 to 19 Year Olds | 29 (61.7%) | 18 (38.3%) |
| 20 to 24 Year Olds | 18 (100.0%) | 0 (0.0%) |
| 25 to 34 Year Olds | 7 (14.0%) | 43 (86.0%) |
| 35 Years and over | 44 (62.9%) | 26 (37.1%) |
| Total | 856 (89.7%) | 98 (10.3%) |
Educational Attainment by Field of Study in Gardnertown
Business (307 | 34.3%), science & technology (157 | 17.5%), bio, nature & agricultural (136 | 15.2%), education (78 | 8.7%), and literature & languages (46 | 5.1%) are the most common fields of study among 895 individuals in Gardnertown who have obtained a bachelor's degree or higher.
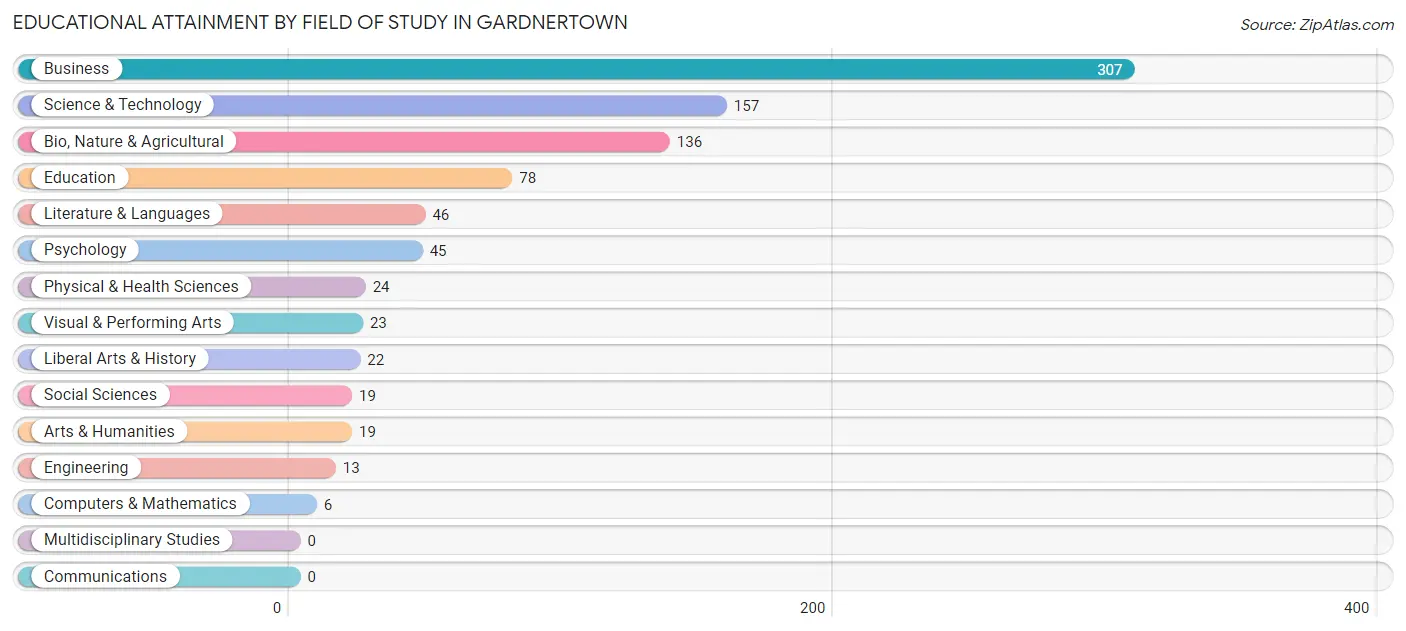
| Field of Study | # Graduates | % Graduates |
| Computers & Mathematics | 6 | 0.7% |
| Bio, Nature & Agricultural | 136 | 15.2% |
| Physical & Health Sciences | 24 | 2.7% |
| Psychology | 45 | 5.0% |
| Social Sciences | 19 | 2.1% |
| Engineering | 13 | 1.5% |
| Multidisciplinary Studies | 0 | 0.0% |
| Science & Technology | 157 | 17.5% |
| Business | 307 | 34.3% |
| Education | 78 | 8.7% |
| Literature & Languages | 46 | 5.1% |
| Liberal Arts & History | 22 | 2.5% |
| Visual & Performing Arts | 23 | 2.6% |
| Communications | 0 | 0.0% |
| Arts & Humanities | 19 | 2.1% |
| Total | 895 | 100.0% |
Transportation & Commute in Gardnertown
Vehicle Availability by Sex in Gardnertown
The most prevalent vehicle ownership categories in Gardnertown are males with 2 vehicles (504, accounting for 49.6%) and females with 2 vehicles (418, making up 52.9%).
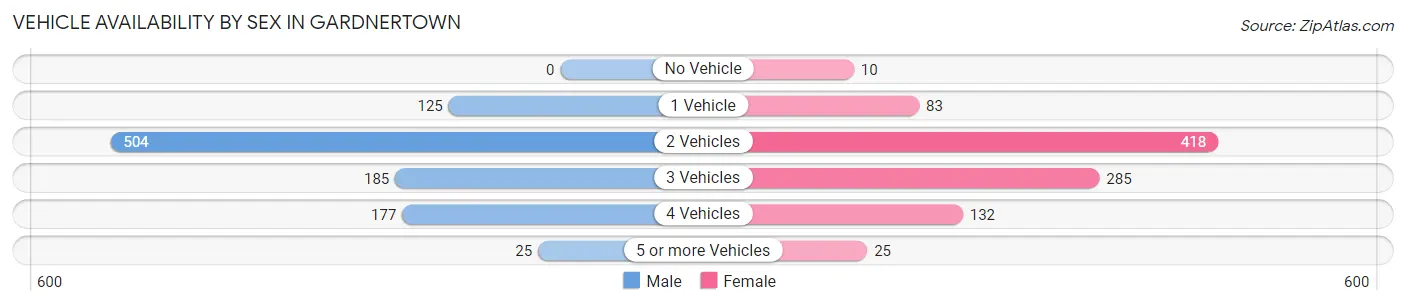
| Vehicles Available | Male | Female |
| No Vehicle | 0 (0.0%) | 10 (1.1%) |
| 1 Vehicle | 125 (12.3%) | 83 (8.7%) |
| 2 Vehicles | 504 (49.6%) | 418 (43.9%) |
| 3 Vehicles | 185 (18.2%) | 285 (29.9%) |
| 4 Vehicles | 177 (17.4%) | 132 (13.9%) |
| 5 or more Vehicles | 25 (2.5%) | 25 (2.6%) |
| Total | 1,016 (100.0%) | 953 (100.0%) |
Commute Time in Gardnertown
The most frequently occuring commute durations in Gardnertown are 20 to 24 minutes (338 commuters, 18.1%), 30 to 34 minutes (291 commuters, 15.6%), and 15 to 19 minutes (243 commuters, 13.0%).
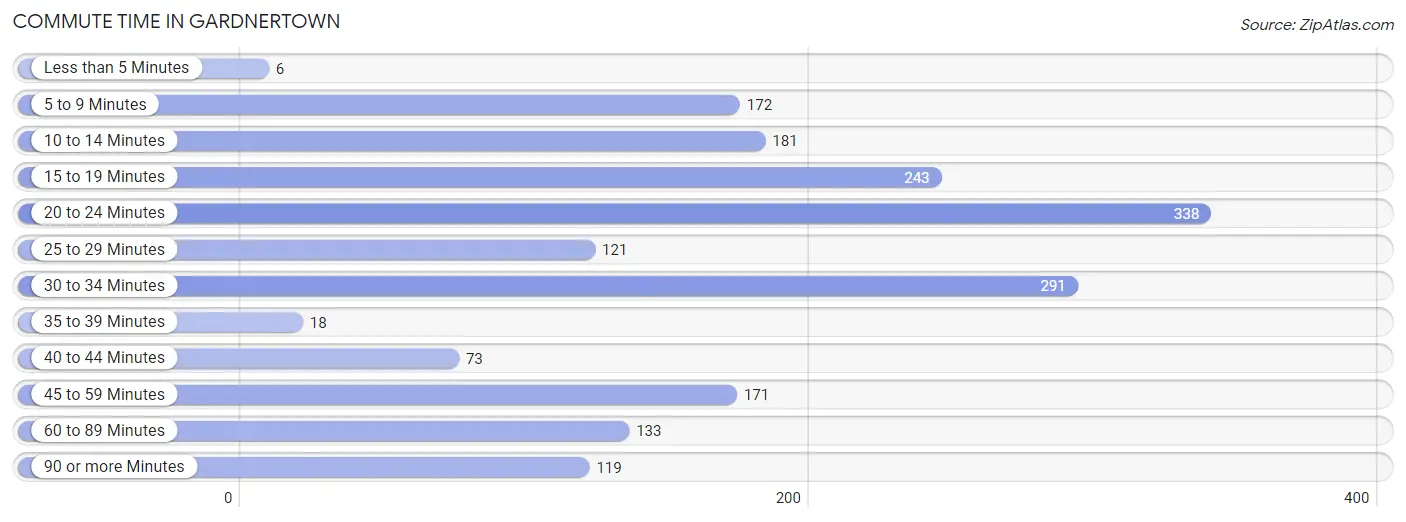
| Commute Time | # Commuters | % Commuters |
| Less than 5 Minutes | 6 | 0.3% |
| 5 to 9 Minutes | 172 | 9.2% |
| 10 to 14 Minutes | 181 | 9.7% |
| 15 to 19 Minutes | 243 | 13.0% |
| 20 to 24 Minutes | 338 | 18.1% |
| 25 to 29 Minutes | 121 | 6.5% |
| 30 to 34 Minutes | 291 | 15.6% |
| 35 to 39 Minutes | 18 | 1.0% |
| 40 to 44 Minutes | 73 | 3.9% |
| 45 to 59 Minutes | 171 | 9.2% |
| 60 to 89 Minutes | 133 | 7.1% |
| 90 or more Minutes | 119 | 6.4% |
Commute Time by Sex in Gardnertown
The most common commute times in Gardnertown are 30 to 34 minutes (217 commuters, 21.4%) for males and 20 to 24 minutes (178 commuters, 20.9%) for females.
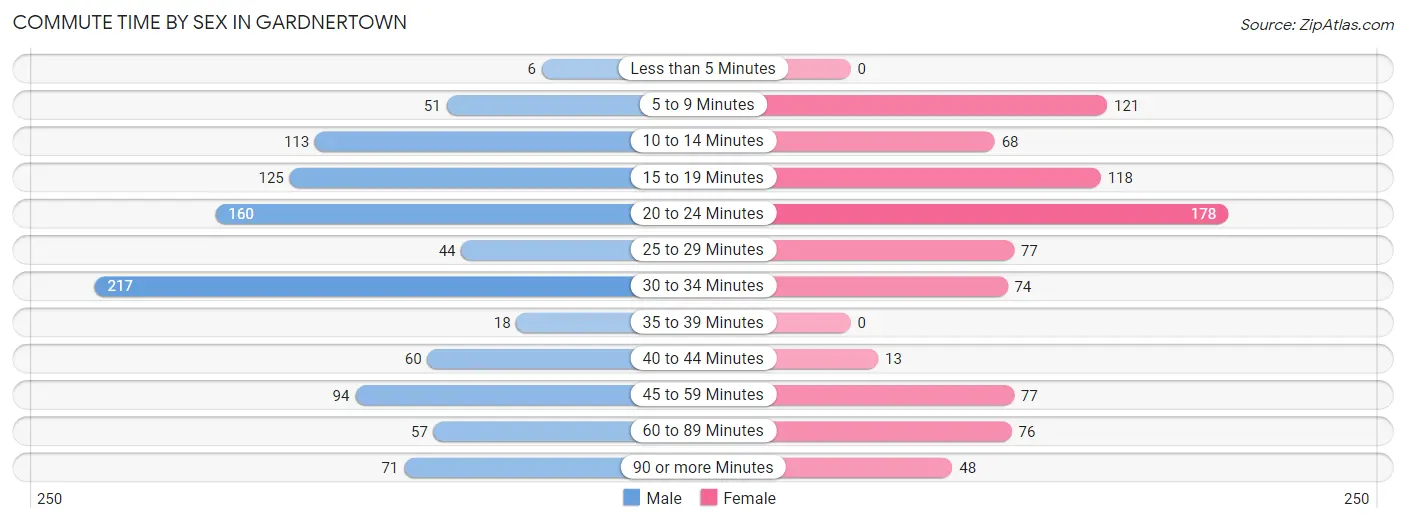
| Commute Time | Male | Female |
| Less than 5 Minutes | 6 (0.6%) | 0 (0.0%) |
| 5 to 9 Minutes | 51 (5.0%) | 121 (14.2%) |
| 10 to 14 Minutes | 113 (11.1%) | 68 (8.0%) |
| 15 to 19 Minutes | 125 (12.3%) | 118 (13.9%) |
| 20 to 24 Minutes | 160 (15.8%) | 178 (20.9%) |
| 25 to 29 Minutes | 44 (4.3%) | 77 (9.1%) |
| 30 to 34 Minutes | 217 (21.4%) | 74 (8.7%) |
| 35 to 39 Minutes | 18 (1.8%) | 0 (0.0%) |
| 40 to 44 Minutes | 60 (5.9%) | 13 (1.5%) |
| 45 to 59 Minutes | 94 (9.2%) | 77 (9.1%) |
| 60 to 89 Minutes | 57 (5.6%) | 76 (8.9%) |
| 90 or more Minutes | 71 (7.0%) | 48 (5.7%) |
Time of Departure to Work by Sex in Gardnertown
The most frequent times of departure to work in Gardnertown are 5:00 AM to 5:29 AM (209, 20.6%) for males and 8:00 AM to 8:29 AM (155, 18.2%) for females.
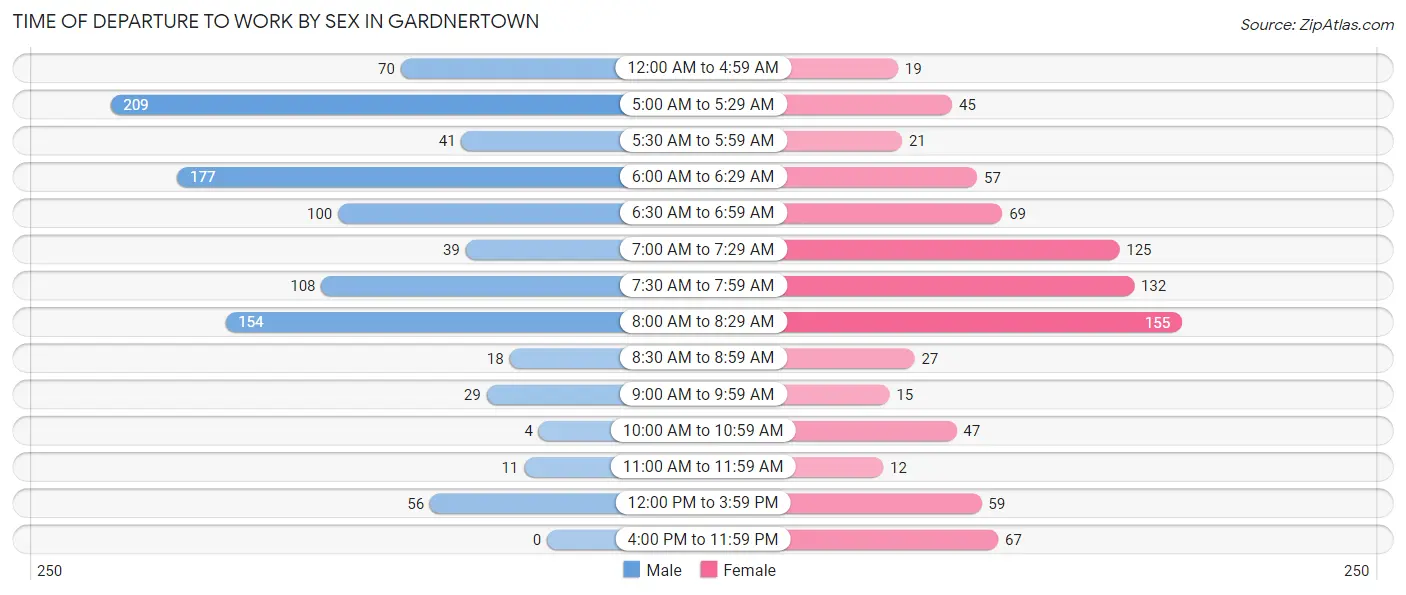
| Time of Departure | Male | Female |
| 12:00 AM to 4:59 AM | 70 (6.9%) | 19 (2.2%) |
| 5:00 AM to 5:29 AM | 209 (20.6%) | 45 (5.3%) |
| 5:30 AM to 5:59 AM | 41 (4.0%) | 21 (2.5%) |
| 6:00 AM to 6:29 AM | 177 (17.4%) | 57 (6.7%) |
| 6:30 AM to 6:59 AM | 100 (9.8%) | 69 (8.1%) |
| 7:00 AM to 7:29 AM | 39 (3.8%) | 125 (14.7%) |
| 7:30 AM to 7:59 AM | 108 (10.6%) | 132 (15.5%) |
| 8:00 AM to 8:29 AM | 154 (15.2%) | 155 (18.2%) |
| 8:30 AM to 8:59 AM | 18 (1.8%) | 27 (3.2%) |
| 9:00 AM to 9:59 AM | 29 (2.9%) | 15 (1.8%) |
| 10:00 AM to 10:59 AM | 4 (0.4%) | 47 (5.5%) |
| 11:00 AM to 11:59 AM | 11 (1.1%) | 12 (1.4%) |
| 12:00 PM to 3:59 PM | 56 (5.5%) | 59 (6.9%) |
| 4:00 PM to 11:59 PM | 0 (0.0%) | 67 (7.9%) |
| Total | 1,016 (100.0%) | 850 (100.0%) |
Housing Occupancy in Gardnertown
Occupancy by Ownership in Gardnertown
Of the total 1,391 dwellings in Gardnertown, owner-occupied units account for 1,182 (85.0%), while renter-occupied units make up 209 (15.0%).
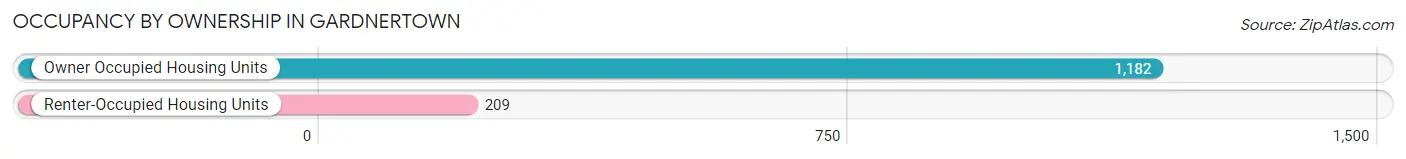
| Occupancy | # Housing Units | % Housing Units |
| Owner Occupied Housing Units | 1,182 | 85.0% |
| Renter-Occupied Housing Units | 209 | 15.0% |
| Total Occupied Housing Units | 1,391 | 100.0% |
Occupancy by Household Size in Gardnertown
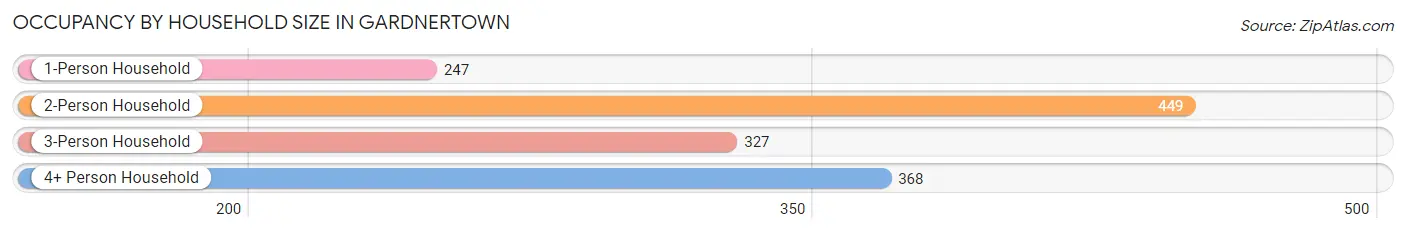
| Household Size | # Housing Units | % Housing Units |
| 1-Person Household | 247 | 17.8% |
| 2-Person Household | 449 | 32.3% |
| 3-Person Household | 327 | 23.5% |
| 4+ Person Household | 368 | 26.5% |
| Total Housing Units | 1,391 | 100.0% |
Occupancy by Ownership by Household Size in Gardnertown
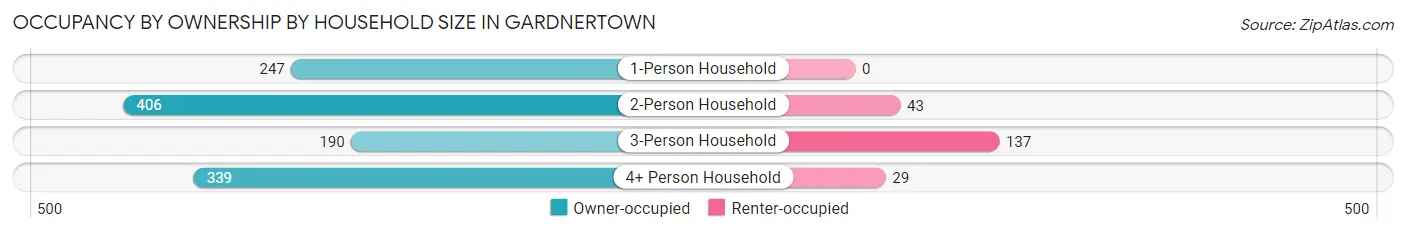
| Household Size | Owner-occupied | Renter-occupied |
| 1-Person Household | 247 (100.0%) | 0 (0.0%) |
| 2-Person Household | 406 (90.4%) | 43 (9.6%) |
| 3-Person Household | 190 (58.1%) | 137 (41.9%) |
| 4+ Person Household | 339 (92.1%) | 29 (7.9%) |
| Total Housing Units | 1,182 (85.0%) | 209 (15.0%) |
Occupancy by Educational Attainment in Gardnertown
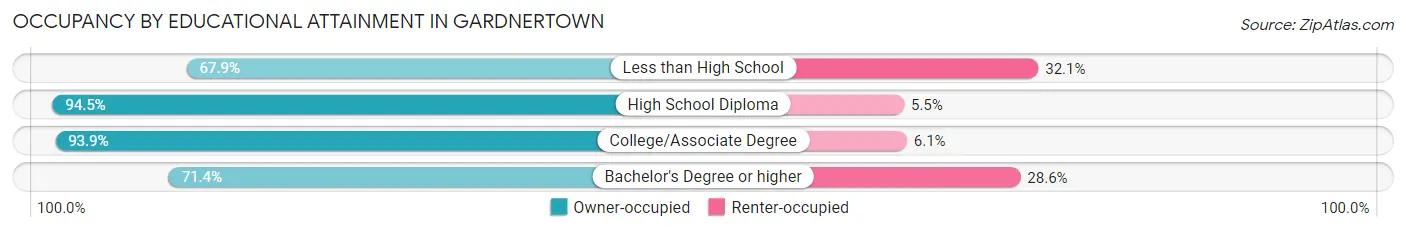
| Household Size | Owner-occupied | Renter-occupied |
| Less than High School | 76 (67.9%) | 36 (32.1%) |
| High School Diploma | 274 (94.5%) | 16 (5.5%) |
| College/Associate Degree | 525 (93.9%) | 34 (6.1%) |
| Bachelor's Degree or higher | 307 (71.4%) | 123 (28.6%) |
Occupancy by Age of Householder in Gardnertown
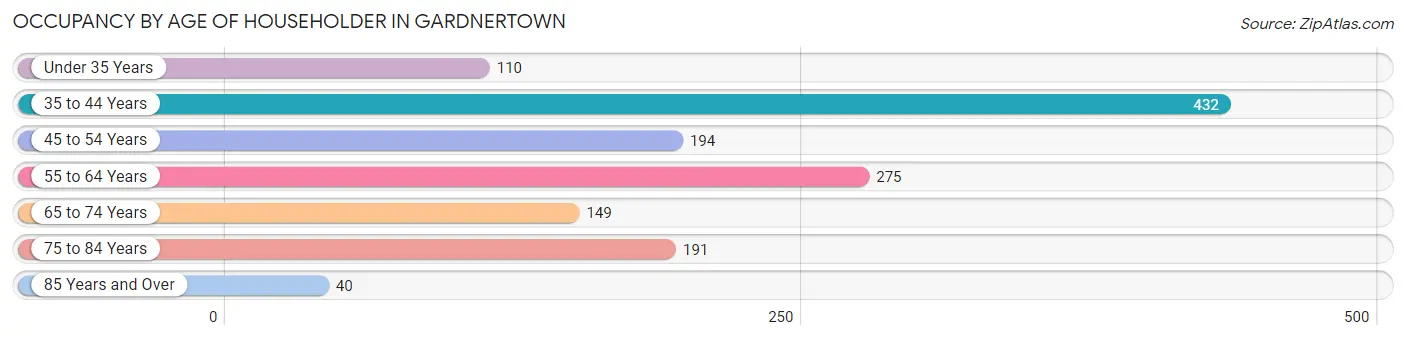
| Age Bracket | # Households | % Households |
| Under 35 Years | 110 | 7.9% |
| 35 to 44 Years | 432 | 31.1% |
| 45 to 54 Years | 194 | 14.0% |
| 55 to 64 Years | 275 | 19.8% |
| 65 to 74 Years | 149 | 10.7% |
| 75 to 84 Years | 191 | 13.7% |
| 85 Years and Over | 40 | 2.9% |
| Total | 1,391 | 100.0% |
Housing Finances in Gardnertown
Median Income by Occupancy in Gardnertown
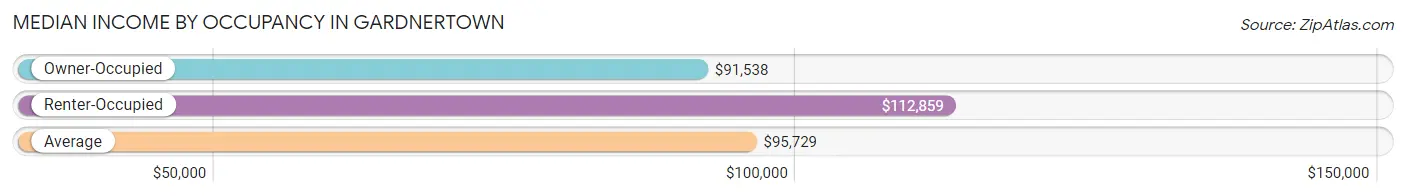
| Occupancy Type | # Households | Median Income |
| Owner-Occupied | 1,182 (85.0%) | $91,538 |
| Renter-Occupied | 209 (15.0%) | $112,859 |
| Average | 1,391 (100.0%) | $95,729 |
Occupancy by Householder Income Bracket in Gardnertown
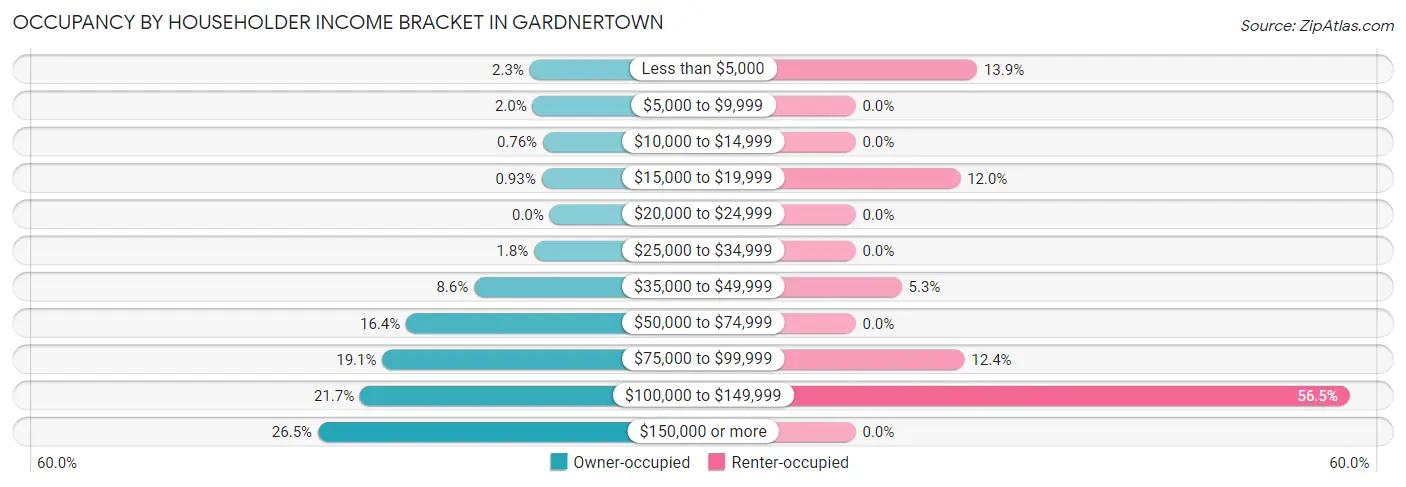
| Income Bracket | Owner-occupied | Renter-occupied |
| Less than $5,000 | 27 (2.3%) | 29 (13.9%) |
| $5,000 to $9,999 | 23 (1.9%) | 0 (0.0%) |
| $10,000 to $14,999 | 9 (0.8%) | 0 (0.0%) |
| $15,000 to $19,999 | 11 (0.9%) | 25 (12.0%) |
| $20,000 to $24,999 | 0 (0.0%) | 0 (0.0%) |
| $25,000 to $34,999 | 21 (1.8%) | 0 (0.0%) |
| $35,000 to $49,999 | 102 (8.6%) | 11 (5.3%) |
| $50,000 to $74,999 | 194 (16.4%) | 0 (0.0%) |
| $75,000 to $99,999 | 226 (19.1%) | 26 (12.4%) |
| $100,000 to $149,999 | 256 (21.7%) | 118 (56.5%) |
| $150,000 or more | 313 (26.5%) | 0 (0.0%) |
| Total | 1,182 (100.0%) | 209 (100.0%) |
Monthly Housing Cost Tiers in Gardnertown
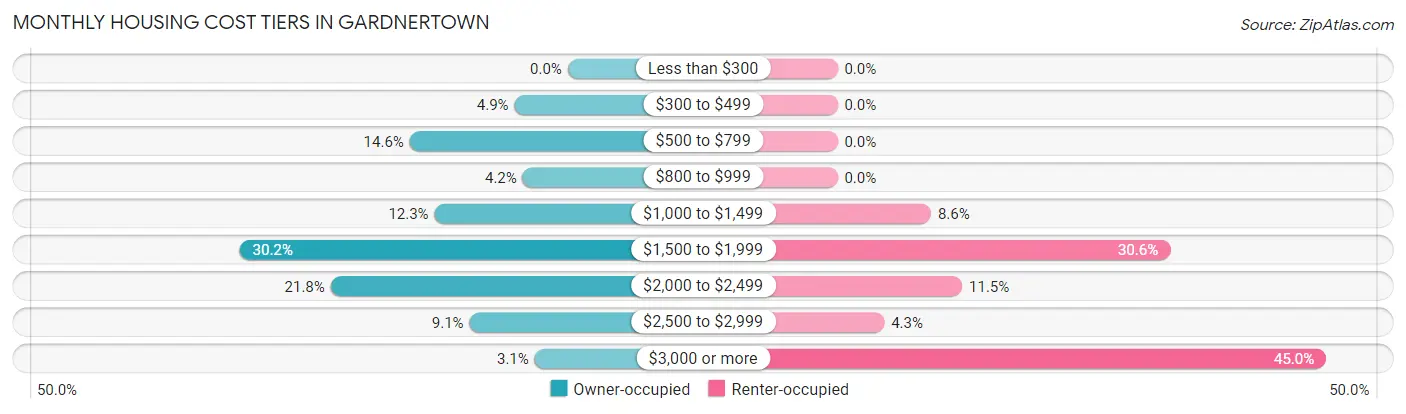
| Monthly Cost | Owner-occupied | Renter-occupied |
| Less than $300 | 0 (0.0%) | 0 (0.0%) |
| $300 to $499 | 58 (4.9%) | 0 (0.0%) |
| $500 to $799 | 172 (14.5%) | 0 (0.0%) |
| $800 to $999 | 49 (4.2%) | 0 (0.0%) |
| $1,000 to $1,499 | 145 (12.3%) | 18 (8.6%) |
| $1,500 to $1,999 | 357 (30.2%) | 64 (30.6%) |
| $2,000 to $2,499 | 258 (21.8%) | 24 (11.5%) |
| $2,500 to $2,999 | 107 (9.0%) | 9 (4.3%) |
| $3,000 or more | 36 (3.0%) | 94 (45.0%) |
| Total | 1,182 (100.0%) | 209 (100.0%) |
Physical Housing Characteristics in Gardnertown
Housing Structures in Gardnertown
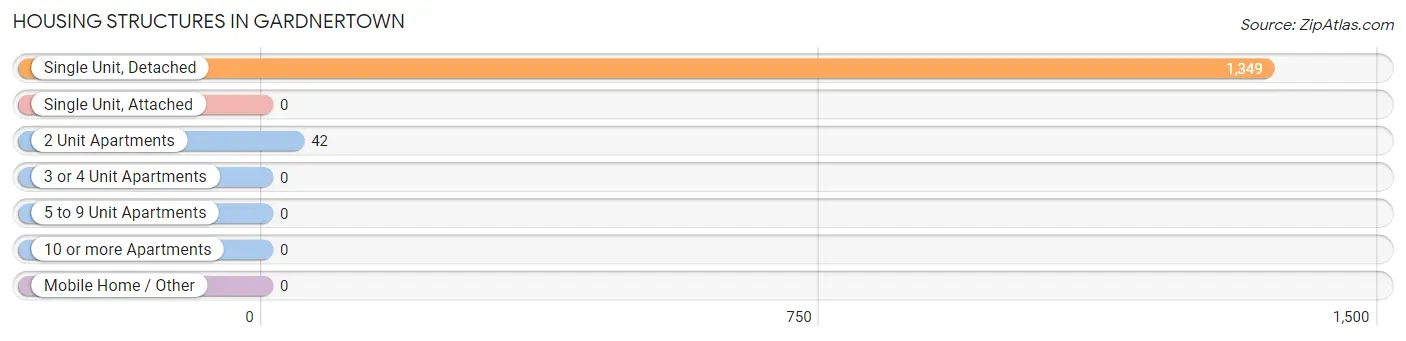
| Structure Type | # Housing Units | % Housing Units |
| Single Unit, Detached | 1,349 | 97.0% |
| Single Unit, Attached | 0 | 0.0% |
| 2 Unit Apartments | 42 | 3.0% |
| 3 or 4 Unit Apartments | 0 | 0.0% |
| 5 to 9 Unit Apartments | 0 | 0.0% |
| 10 or more Apartments | 0 | 0.0% |
| Mobile Home / Other | 0 | 0.0% |
| Total | 1,391 | 100.0% |
Housing Structures by Occupancy in Gardnertown
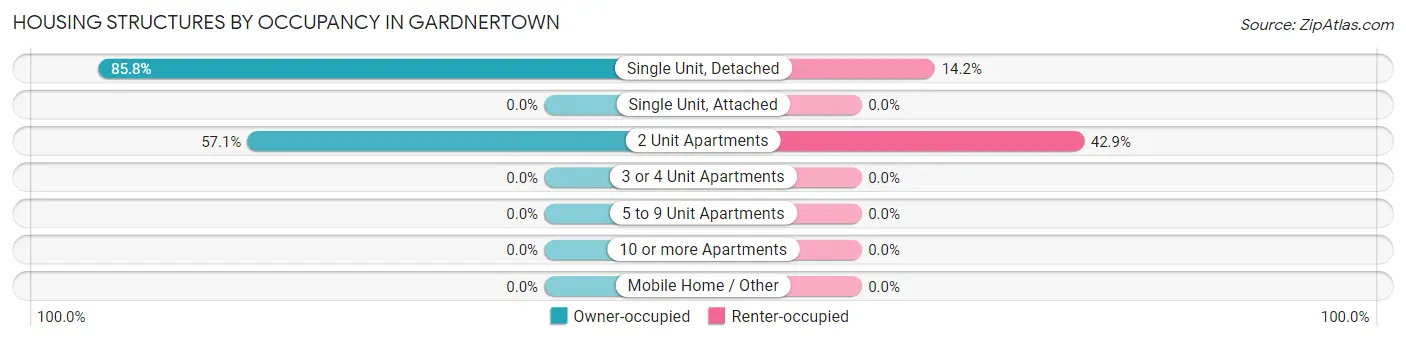
| Structure Type | Owner-occupied | Renter-occupied |
| Single Unit, Detached | 1,158 (85.8%) | 191 (14.2%) |
| Single Unit, Attached | 0 (0.0%) | 0 (0.0%) |
| 2 Unit Apartments | 24 (57.1%) | 18 (42.9%) |
| 3 or 4 Unit Apartments | 0 (0.0%) | 0 (0.0%) |
| 5 to 9 Unit Apartments | 0 (0.0%) | 0 (0.0%) |
| 10 or more Apartments | 0 (0.0%) | 0 (0.0%) |
| Mobile Home / Other | 0 (0.0%) | 0 (0.0%) |
| Total | 1,182 (85.0%) | 209 (15.0%) |
Housing Structures by Number of Rooms in Gardnertown
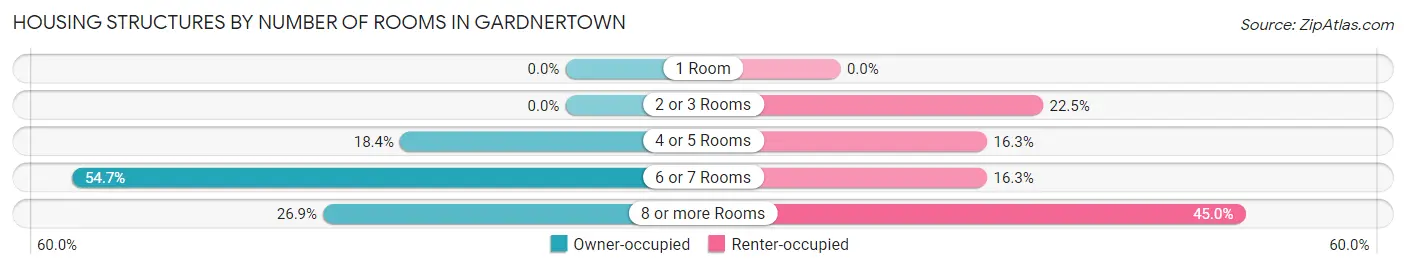
| Number of Rooms | Owner-occupied | Renter-occupied |
| 1 Room | 0 (0.0%) | 0 (0.0%) |
| 2 or 3 Rooms | 0 (0.0%) | 47 (22.5%) |
| 4 or 5 Rooms | 217 (18.4%) | 34 (16.3%) |
| 6 or 7 Rooms | 647 (54.7%) | 34 (16.3%) |
| 8 or more Rooms | 318 (26.9%) | 94 (45.0%) |
| Total | 1,182 (100.0%) | 209 (100.0%) |
Housing Structure by Heating Type in Gardnertown
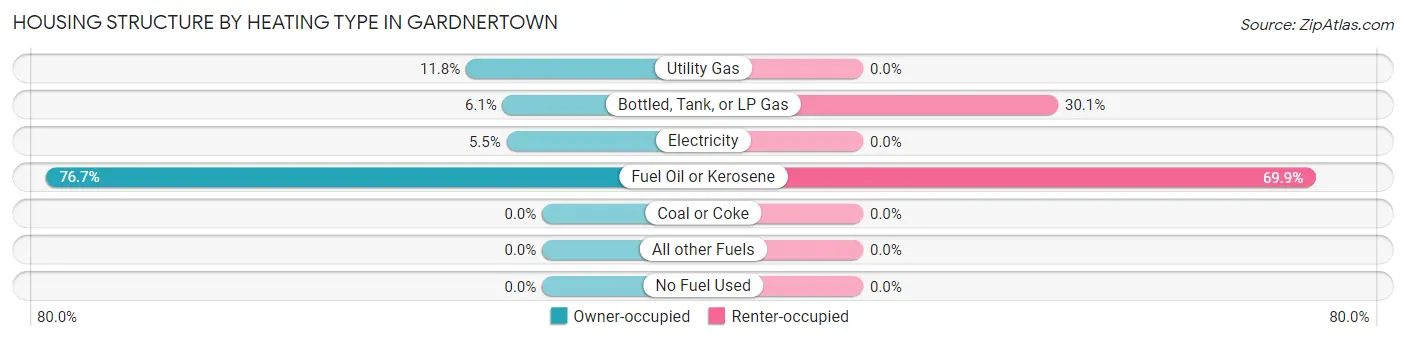
| Heating Type | Owner-occupied | Renter-occupied |
| Utility Gas | 139 (11.8%) | 0 (0.0%) |
| Bottled, Tank, or LP Gas | 72 (6.1%) | 63 (30.1%) |
| Electricity | 65 (5.5%) | 0 (0.0%) |
| Fuel Oil or Kerosene | 906 (76.6%) | 146 (69.9%) |
| Coal or Coke | 0 (0.0%) | 0 (0.0%) |
| All other Fuels | 0 (0.0%) | 0 (0.0%) |
| No Fuel Used | 0 (0.0%) | 0 (0.0%) |
| Total | 1,182 (100.0%) | 209 (100.0%) |
Household Vehicle Usage in Gardnertown
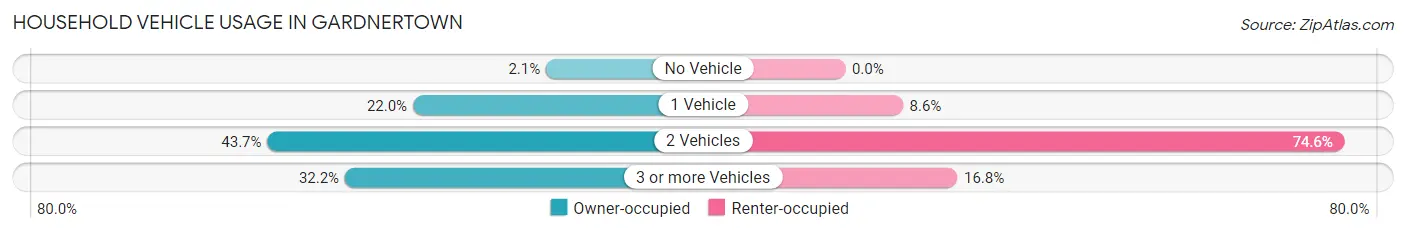
| Vehicles per Household | Owner-occupied | Renter-occupied |
| No Vehicle | 25 (2.1%) | 0 (0.0%) |
| 1 Vehicle | 260 (22.0%) | 18 (8.6%) |
| 2 Vehicles | 517 (43.7%) | 156 (74.6%) |
| 3 or more Vehicles | 380 (32.2%) | 35 (16.8%) |
| Total | 1,182 (100.0%) | 209 (100.0%) |
Real Estate & Mortgages in Gardnertown
Real Estate and Mortgage Overview in Gardnertown
| Characteristic | Without Mortgage | With Mortgage |
| Housing Units | 383 | 799 |
| Median Property Value | $280,100 | $256,300 |
| Median Household Income | $84,583 | $182 |
| Monthly Housing Costs | $746 | $24 |
| Real Estate Taxes | $4,693 | $15 |
Property Value by Mortgage Status in Gardnertown
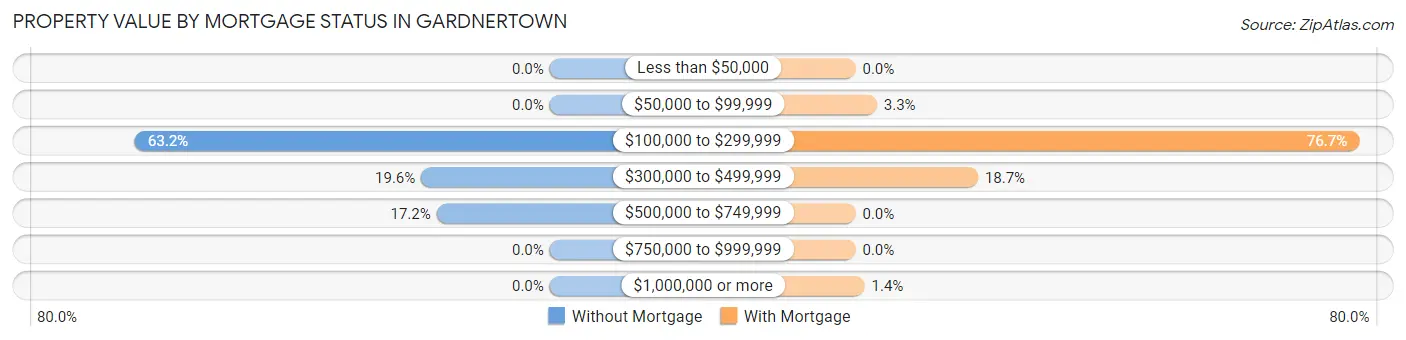
| Property Value | Without Mortgage | With Mortgage |
| Less than $50,000 | 0 (0.0%) | 0 (0.0%) |
| $50,000 to $99,999 | 0 (0.0%) | 26 (3.3%) |
| $100,000 to $299,999 | 242 (63.2%) | 613 (76.7%) |
| $300,000 to $499,999 | 75 (19.6%) | 149 (18.6%) |
| $500,000 to $749,999 | 66 (17.2%) | 0 (0.0%) |
| $750,000 to $999,999 | 0 (0.0%) | 0 (0.0%) |
| $1,000,000 or more | 0 (0.0%) | 11 (1.4%) |
| Total | 383 (100.0%) | 799 (100.0%) |
Household Income by Mortgage Status in Gardnertown
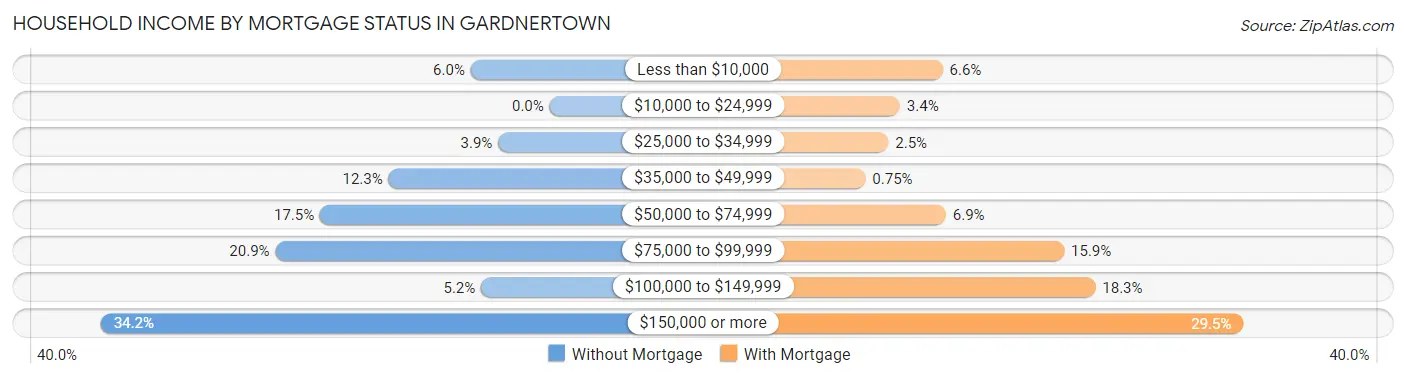
| Household Income | Without Mortgage | With Mortgage |
| Less than $10,000 | 23 (6.0%) | 53 (6.6%) |
| $10,000 to $24,999 | 0 (0.0%) | 27 (3.4%) |
| $25,000 to $34,999 | 15 (3.9%) | 20 (2.5%) |
| $35,000 to $49,999 | 47 (12.3%) | 6 (0.7%) |
| $50,000 to $74,999 | 67 (17.5%) | 55 (6.9%) |
| $75,000 to $99,999 | 80 (20.9%) | 127 (15.9%) |
| $100,000 to $149,999 | 20 (5.2%) | 146 (18.3%) |
| $150,000 or more | 131 (34.2%) | 236 (29.5%) |
| Total | 383 (100.0%) | 799 (100.0%) |
Property Value to Household Income Ratio in Gardnertown
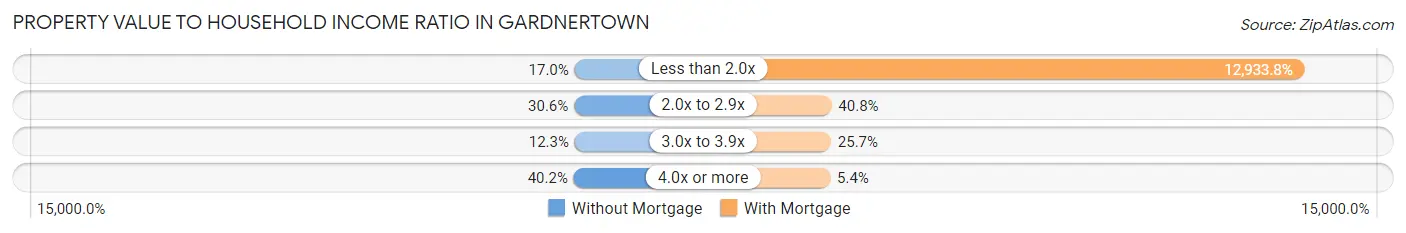
| Value-to-Income Ratio | Without Mortgage | With Mortgage |
| Less than 2.0x | 65 (17.0%) | 103,341 (12,933.8%) |
| 2.0x to 2.9x | 117 (30.5%) | 326 (40.8%) |
| 3.0x to 3.9x | 47 (12.3%) | 205 (25.7%) |
| 4.0x or more | 154 (40.2%) | 43 (5.4%) |
| Total | 383 (100.0%) | 799 (100.0%) |
Real Estate Taxes by Mortgage Status in Gardnertown
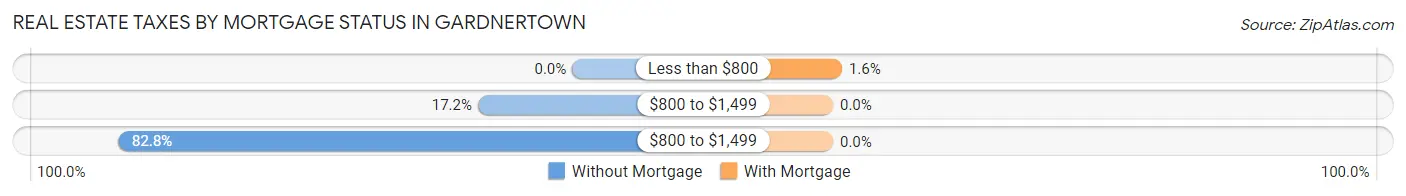
| Property Taxes | Without Mortgage | With Mortgage |
| Less than $800 | 0 (0.0%) | 13 (1.6%) |
| $800 to $1,499 | 66 (17.2%) | 0 (0.0%) |
| $800 to $1,499 | 317 (82.8%) | 0 (0.0%) |
| Total | 383 (100.0%) | 799 (100.0%) |
Health & Disability in Gardnertown
Health Insurance Coverage by Age in Gardnertown
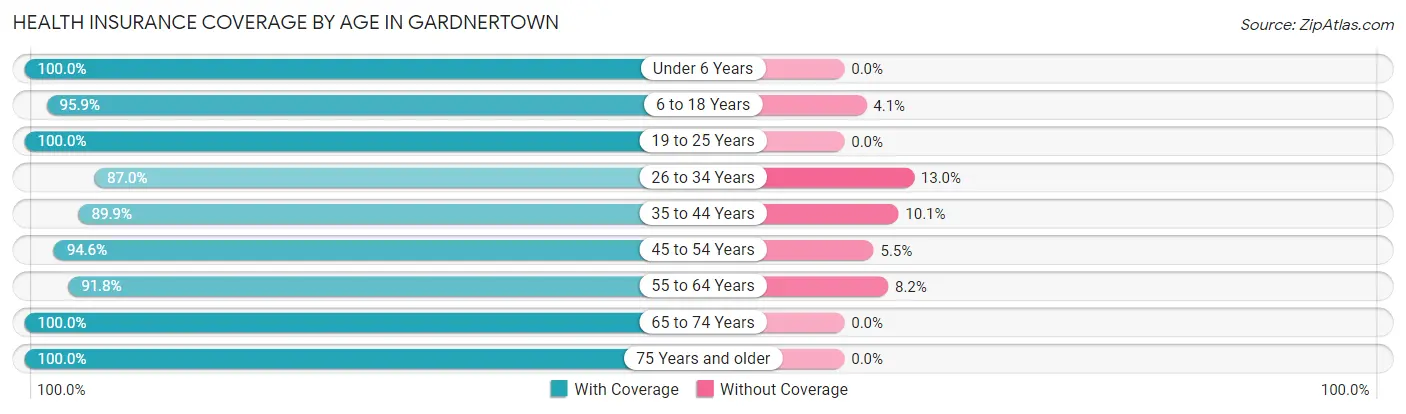
| Age Bracket | With Coverage | Without Coverage |
| Under 6 Years | 346 (100.0%) | 0 (0.0%) |
| 6 to 18 Years | 606 (95.9%) | 26 (4.1%) |
| 19 to 25 Years | 198 (100.0%) | 0 (0.0%) |
| 26 to 34 Years | 436 (87.0%) | 65 (13.0%) |
| 35 to 44 Years | 696 (89.9%) | 78 (10.1%) |
| 45 to 54 Years | 312 (94.6%) | 18 (5.4%) |
| 55 to 64 Years | 473 (91.8%) | 42 (8.2%) |
| 65 to 74 Years | 277 (100.0%) | 0 (0.0%) |
| 75 Years and older | 370 (100.0%) | 0 (0.0%) |
| Total | 3,714 (94.2%) | 229 (5.8%) |
Health Insurance Coverage by Citizenship Status in Gardnertown
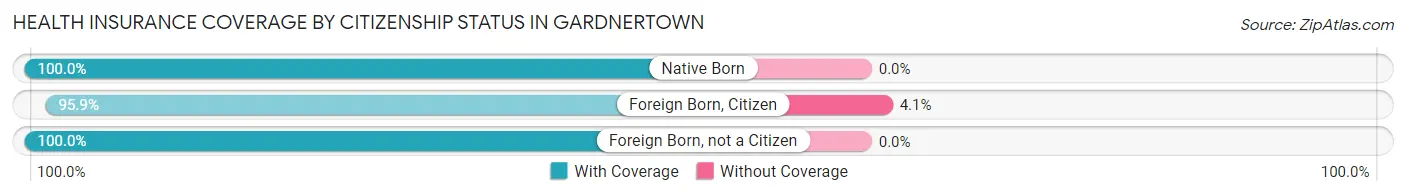
| Citizenship Status | With Coverage | Without Coverage |
| Native Born | 346 (100.0%) | 0 (0.0%) |
| Foreign Born, Citizen | 606 (95.9%) | 26 (4.1%) |
| Foreign Born, not a Citizen | 198 (100.0%) | 0 (0.0%) |
Health Insurance Coverage by Household Income in Gardnertown
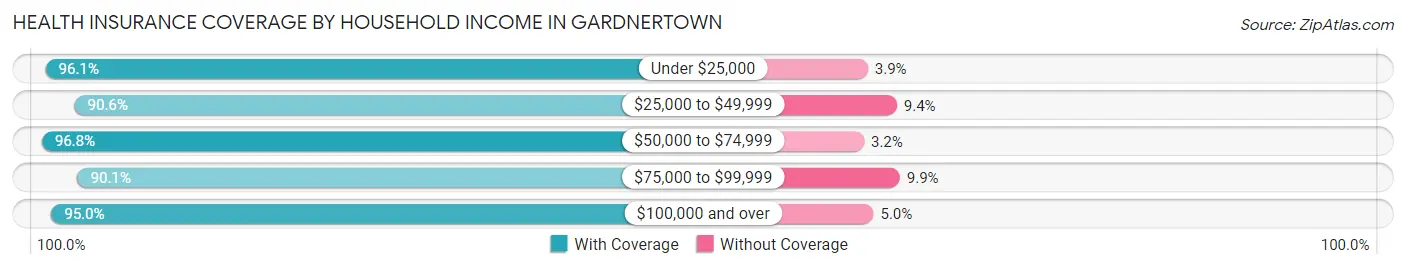
| Household Income | With Coverage | Without Coverage |
| Under $25,000 | 268 (96.1%) | 11 (3.9%) |
| $25,000 to $49,999 | 174 (90.6%) | 18 (9.4%) |
| $50,000 to $74,999 | 450 (96.8%) | 15 (3.2%) |
| $75,000 to $99,999 | 634 (90.1%) | 70 (9.9%) |
| $100,000 and over | 2,181 (95.0%) | 115 (5.0%) |
Public vs Private Health Insurance Coverage by Age in Gardnertown
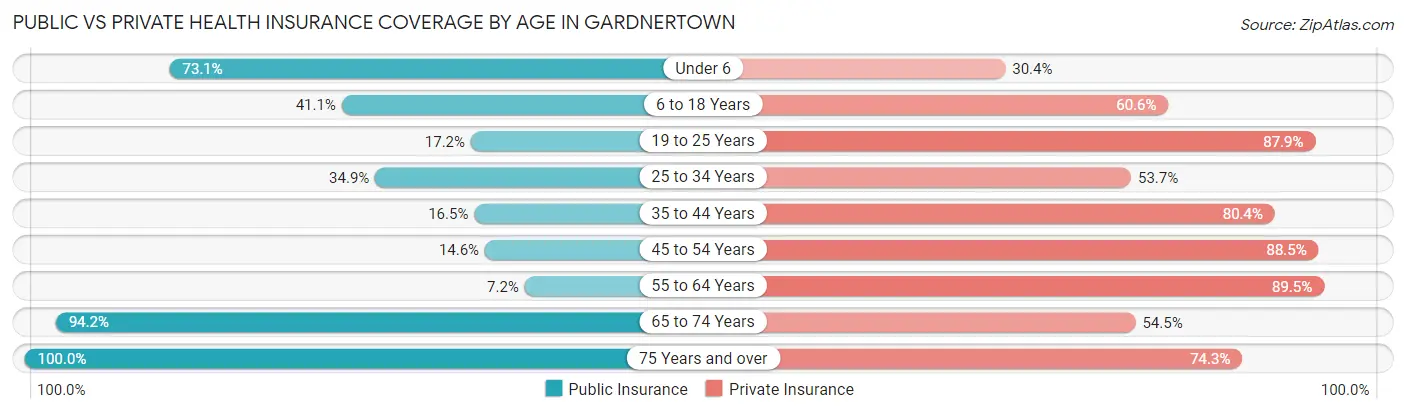
| Age Bracket | Public Insurance | Private Insurance |
| Under 6 | 253 (73.1%) | 105 (30.3%) |
| 6 to 18 Years | 260 (41.1%) | 383 (60.6%) |
| 19 to 25 Years | 34 (17.2%) | 174 (87.9%) |
| 25 to 34 Years | 175 (34.9%) | 269 (53.7%) |
| 35 to 44 Years | 128 (16.5%) | 622 (80.4%) |
| 45 to 54 Years | 48 (14.5%) | 292 (88.5%) |
| 55 to 64 Years | 37 (7.2%) | 461 (89.5%) |
| 65 to 74 Years | 261 (94.2%) | 151 (54.5%) |
| 75 Years and over | 370 (100.0%) | 275 (74.3%) |
| Total | 1,566 (39.7%) | 2,732 (69.3%) |
Disability Status by Sex by Age in Gardnertown
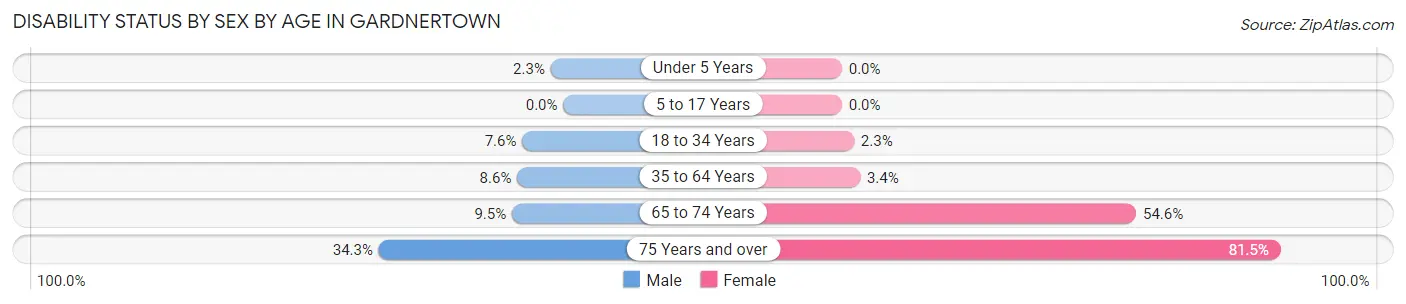
| Age Bracket | Male | Female |
| Under 5 Years | 6 (2.3%) | 0 (0.0%) |
| 5 to 17 Years | 0 (0.0%) | 0 (0.0%) |
| 18 to 34 Years | 24 (7.6%) | 10 (2.2%) |
| 35 to 64 Years | 70 (8.6%) | 27 (3.4%) |
| 65 to 74 Years | 14 (9.5%) | 71 (54.6%) |
| 75 Years and over | 62 (34.3%) | 154 (81.5%) |
Disability Class by Sex by Age in Gardnertown
Disability Class: Hearing Difficulty
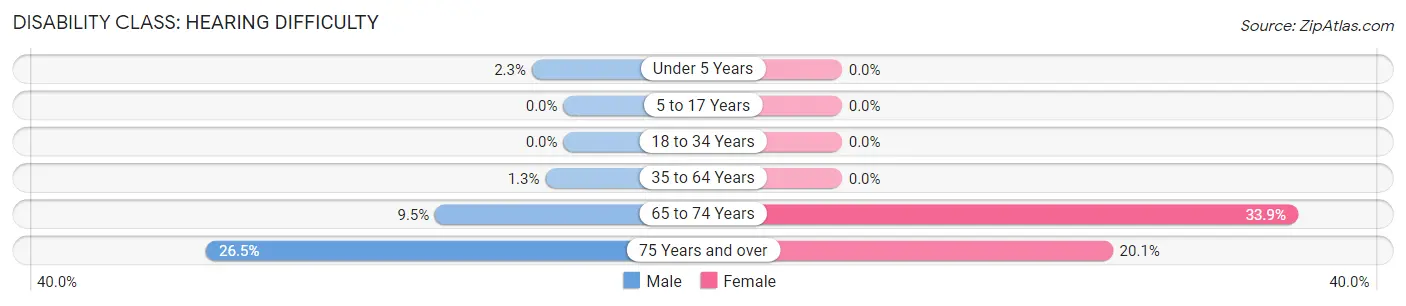
| Age Bracket | Male | Female |
| Under 5 Years | 6 (2.3%) | 0 (0.0%) |
| 5 to 17 Years | 0 (0.0%) | 0 (0.0%) |
| 18 to 34 Years | 0 (0.0%) | 0 (0.0%) |
| 35 to 64 Years | 11 (1.3%) | 0 (0.0%) |
| 65 to 74 Years | 14 (9.5%) | 44 (33.9%) |
| 75 Years and over | 48 (26.5%) | 38 (20.1%) |
Disability Class: Vision Difficulty
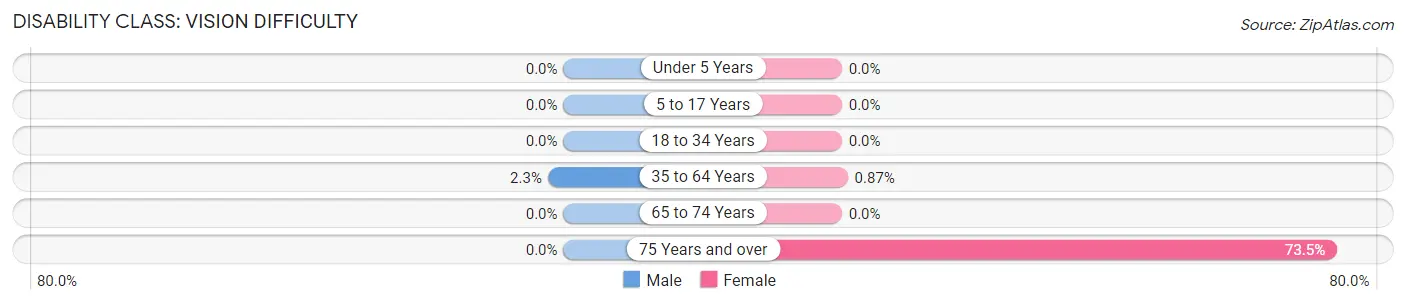
| Age Bracket | Male | Female |
| Under 5 Years | 0 (0.0%) | 0 (0.0%) |
| 5 to 17 Years | 0 (0.0%) | 0 (0.0%) |
| 18 to 34 Years | 0 (0.0%) | 0 (0.0%) |
| 35 to 64 Years | 19 (2.3%) | 7 (0.9%) |
| 65 to 74 Years | 0 (0.0%) | 0 (0.0%) |
| 75 Years and over | 0 (0.0%) | 139 (73.5%) |
Disability Class: Cognitive Difficulty
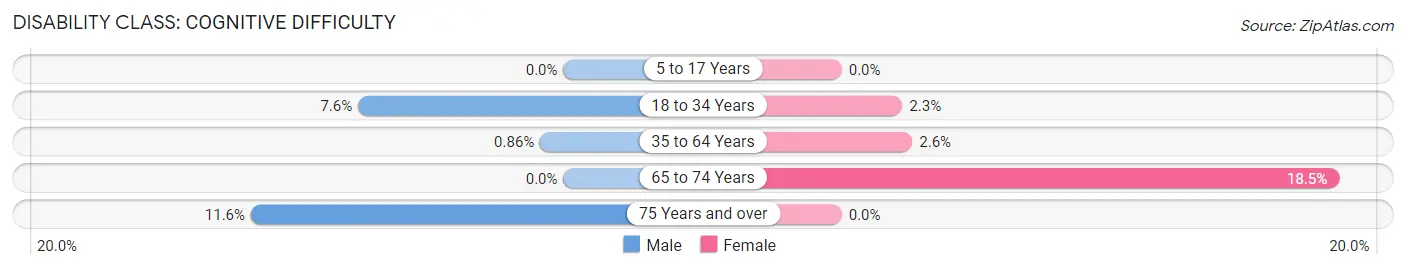
| Age Bracket | Male | Female |
| 5 to 17 Years | 0 (0.0%) | 0 (0.0%) |
| 18 to 34 Years | 24 (7.6%) | 10 (2.2%) |
| 35 to 64 Years | 7 (0.9%) | 21 (2.6%) |
| 65 to 74 Years | 0 (0.0%) | 24 (18.5%) |
| 75 Years and over | 21 (11.6%) | 0 (0.0%) |
Disability Class: Ambulatory Difficulty
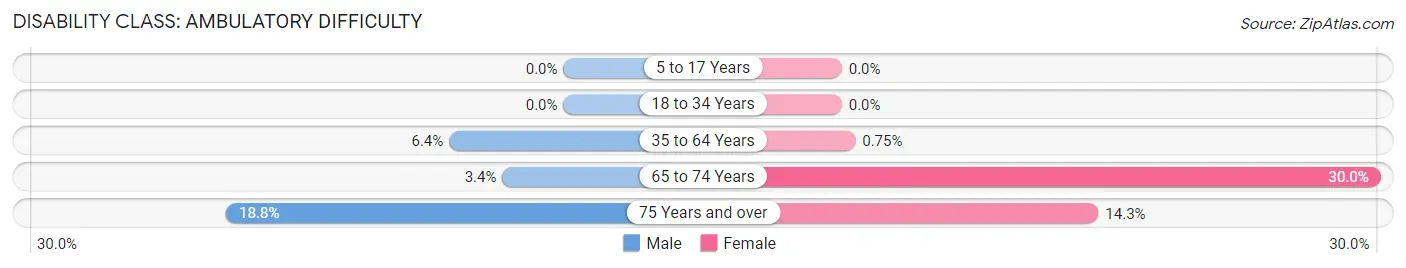
| Age Bracket | Male | Female |
| 5 to 17 Years | 0 (0.0%) | 0 (0.0%) |
| 18 to 34 Years | 0 (0.0%) | 0 (0.0%) |
| 35 to 64 Years | 52 (6.4%) | 6 (0.7%) |
| 65 to 74 Years | 5 (3.4%) | 39 (30.0%) |
| 75 Years and over | 34 (18.8%) | 27 (14.3%) |
Disability Class: Self-Care Difficulty
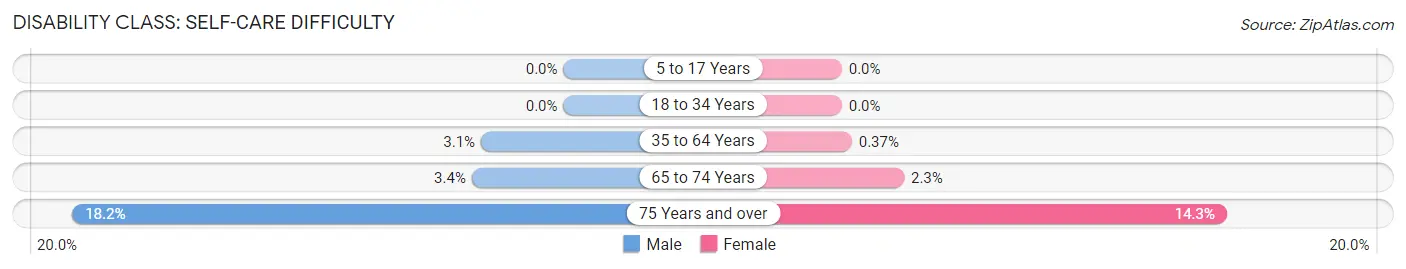
| Age Bracket | Male | Female |
| 5 to 17 Years | 0 (0.0%) | 0 (0.0%) |
| 18 to 34 Years | 0 (0.0%) | 0 (0.0%) |
| 35 to 64 Years | 25 (3.1%) | 3 (0.4%) |
| 65 to 74 Years | 5 (3.4%) | 3 (2.3%) |
| 75 Years and over | 33 (18.2%) | 27 (14.3%) |
Technology Access in Gardnertown
Computing Device Access in Gardnertown
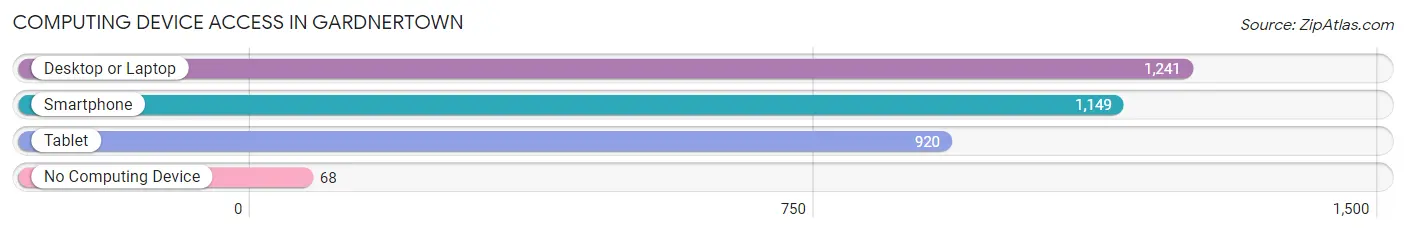
| Device Type | # Households | % Households |
| Desktop or Laptop | 1,241 | 89.2% |
| Smartphone | 1,149 | 82.6% |
| Tablet | 920 | 66.1% |
| No Computing Device | 68 | 4.9% |
| Total | 1,391 | 100.0% |
Internet Access in Gardnertown
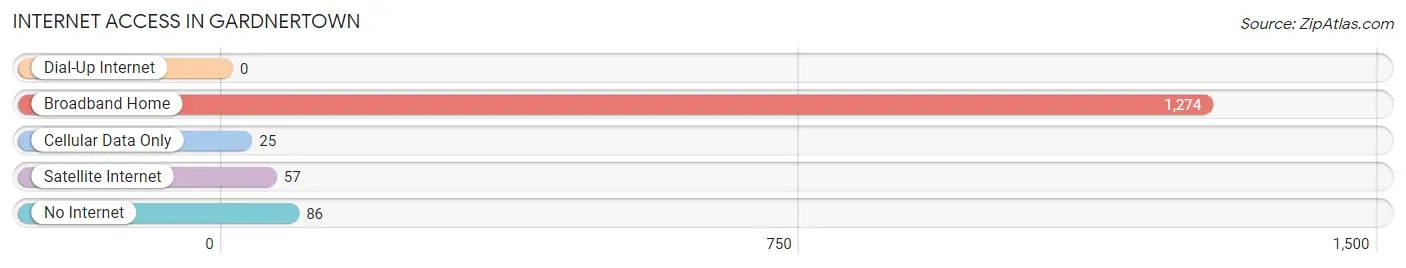
| Internet Type | # Households | % Households |
| Dial-Up Internet | 0 | 0.0% |
| Broadband Home | 1,274 | 91.6% |
| Cellular Data Only | 25 | 1.8% |
| Satellite Internet | 57 | 4.1% |
| No Internet | 86 | 6.2% |
| Total | 1,391 | 100.0% |
Gardnertown Summary
Gardnertown is a hamlet located in the Town of Newburgh in Orange County, New York. It is situated on the east side of the Hudson River, about 60 miles north of New York City. The hamlet is bordered by the Town of Newburgh to the north, the Town of Marlborough to the east, the Town of Montgomery to the south, and the Town of Shawangunk to the west.
History
Gardnertown was first settled in the late 1700s by the Gardiner family, who were among the first settlers in the area. The hamlet was originally known as Gardiner’s Town, and was later shortened to Gardnertown. The hamlet was officially incorporated in 1809.
In the early 1800s, Gardnertown was a thriving agricultural community, with many farms and orchards. The hamlet was also home to several mills, including a grist mill, a saw mill, and a paper mill.
In the late 1800s, Gardnertown began to experience a period of growth and development. The hamlet was connected to the rest of Orange County by the Newburgh and New York Railroad in 1871, and the Newburgh and Gardnertown Railroad in 1876. This allowed for increased trade and commerce in the area.
In the early 1900s, Gardnertown experienced a period of decline. The hamlet’s population decreased, and many of the businesses and mills closed. In the mid-1900s, the hamlet began to experience a period of revitalization. The hamlet’s population began to increase, and new businesses began to open.
Geography
Gardnertown is located in the Town of Newburgh in Orange County, New York. The hamlet is situated on the east side of the Hudson River, about 60 miles north of New York City. The hamlet is bordered by the Town of Newburgh to the north, the Town of Marlborough to the east, the Town of Montgomery to the south, and the Town of Shawangunk to the west.
Gardnertown is located in a hilly region of the Hudson Valley. The hamlet is situated on a plateau, with elevations ranging from 500 to 800 feet above sea level. The hamlet is located in a temperate climate, with hot summers and cold winters.
Economy
Gardnertown’s economy is largely based on agriculture and tourism. The hamlet is home to several farms and orchards, which produce a variety of fruits and vegetables. The hamlet is also home to several wineries, which produce a variety of wines.
Gardnertown is also a popular tourist destination. The hamlet is home to several historic sites, including the Gardnertown Historical Society Museum and the Gardnertown Cemetery. The hamlet is also home to several parks and recreational areas, including the Gardnertown Nature Preserve and the Gardnertown State Park.
Demographics
As of the 2010 census, Gardnertown had a population of 1,845. The population is largely white (94.3%), with small percentages of African American (2.2%), Asian (1.2%), and Hispanic (1.2%) residents. The median household income is $60,000, and the median home value is $250,000.
Conclusion
Gardnertown is a hamlet located in the Town of Newburgh in Orange County, New York. The hamlet was first settled in the late 1700s, and was officially incorporated in 1809. Gardnertown is situated on the east side of the Hudson River, about 60 miles north of New York City. The hamlet’s economy is largely based on agriculture and tourism, and the population is largely white. Gardnertown is a popular tourist destination, and is home to several historic sites, parks, and recreational areas.
Common Questions
What is Per Capita Income in Gardnertown?
Per Capita income in Gardnertown is $40,706.
What is the Median Family Income in Gardnertown?
Median Family Income in Gardnertown is $103,705.
What is the Median Household income in Gardnertown?
Median Household Income in Gardnertown is $95,729.
What is Income or Wage Gap in Gardnertown?
Income or Wage Gap in Gardnertown is 21.4%.
Women in Gardnertown earn 78.6 cents for every dollar earned by a man.
What is Inequality or Gini Index in Gardnertown?
Inequality or Gini Index in Gardnertown is 0.37.
What is the Total Population of Gardnertown?
Total Population of Gardnertown is 3,943.
What is the Total Male Population of Gardnertown?
Total Male Population of Gardnertown is 1,980.
What is the Total Female Population of Gardnertown?
Total Female Population of Gardnertown is 1,963.
What is the Ratio of Males per 100 Females in Gardnertown?
There are 100.87 Males per 100 Females in Gardnertown.
What is the Ratio of Females per 100 Males in Gardnertown?
There are 99.14 Females per 100 Males in Gardnertown.
What is the Median Population Age in Gardnertown?
Median Population Age in Gardnertown is 39.0 Years.
What is the Average Family Size in Gardnertown
Average Family Size in Gardnertown is 3.2 People.
What is the Average Household Size in Gardnertown
Average Household Size in Gardnertown is 2.8 People.
How Large is the Labor Force in Gardnertown?
There are 2,077 People in the Labor Forcein in Gardnertown.
What is the Percentage of People in the Labor Force in Gardnertown?
67.7% of People are in the Labor Force in Gardnertown.
What is the Unemployment Rate in Gardnertown?
Unemployment Rate in Gardnertown is 4.6%.