White Plains, NY Map & Demographics
White Plains Map
White Plains Overview
$65,846
PER CAPITA INCOME
$141,335
AVG FAMILY INCOME
$109,551
AVG HOUSEHOLD INCOME
26.0%
WAGE / INCOME GAP [ % ]
74.0¢/ $1
WAGE / INCOME GAP [ $ ]
0.51
INEQUALITY / GINI INDEX
59,421
TOTAL POPULATION
28,337
MALE POPULATION
31,084
FEMALE POPULATION
91.16
MALES / 100 FEMALES
109.69
FEMALES / 100 MALES
41.4
MEDIAN AGE
3.1
AVG FAMILY SIZE
2.4
AVG HOUSEHOLD SIZE
32,750
LABOR FORCE [ PEOPLE ]
65.5%
PERCENT IN LABOR FORCE
5.4%
UNEMPLOYMENT RATE
Income in White Plains
Income Overview in White Plains
Per Capita Income in White Plains is $65,846, while median incomes of families and households are $141,335 and $109,551 respectively.
| Characteristic | Number | Measure |
| Per Capita Income | 59,421 | $65,846 |
| Median Family Income | 14,437 | $141,335 |
| Mean Family Income | 14,437 | $186,970 |
| Median Household Income | 24,062 | $109,551 |
| Mean Household Income | 24,062 | $158,516 |
| Income Deficit | 14,437 | $0 |
| Wage / Income Gap (%) | 59,421 | 25.98% |
| Wage / Income Gap ($) | 59,421 | 74.02¢ per $1 |
| Gini / Inequality Index | 59,421 | 0.51 |
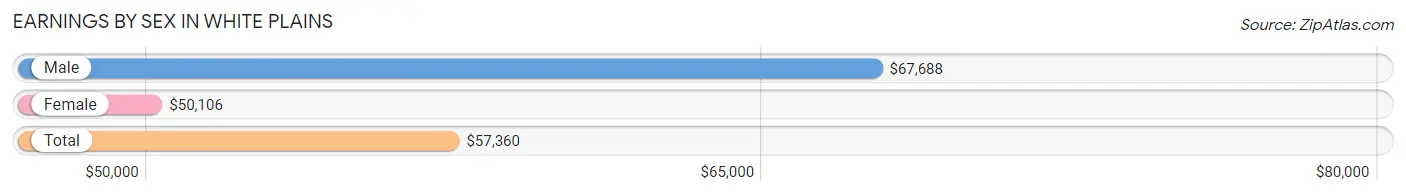
Earnings by Sex in White Plains
Average Earnings in White Plains are $57,360, $67,688 for men and $50,106 for women, a difference of 26.0%.
| Sex | Number | Average Earnings |
| Male | 18,177 (52.8%) | $67,688 |
| Female | 16,221 (47.2%) | $50,106 |
| Total | 34,398 (100.0%) | $57,360 |
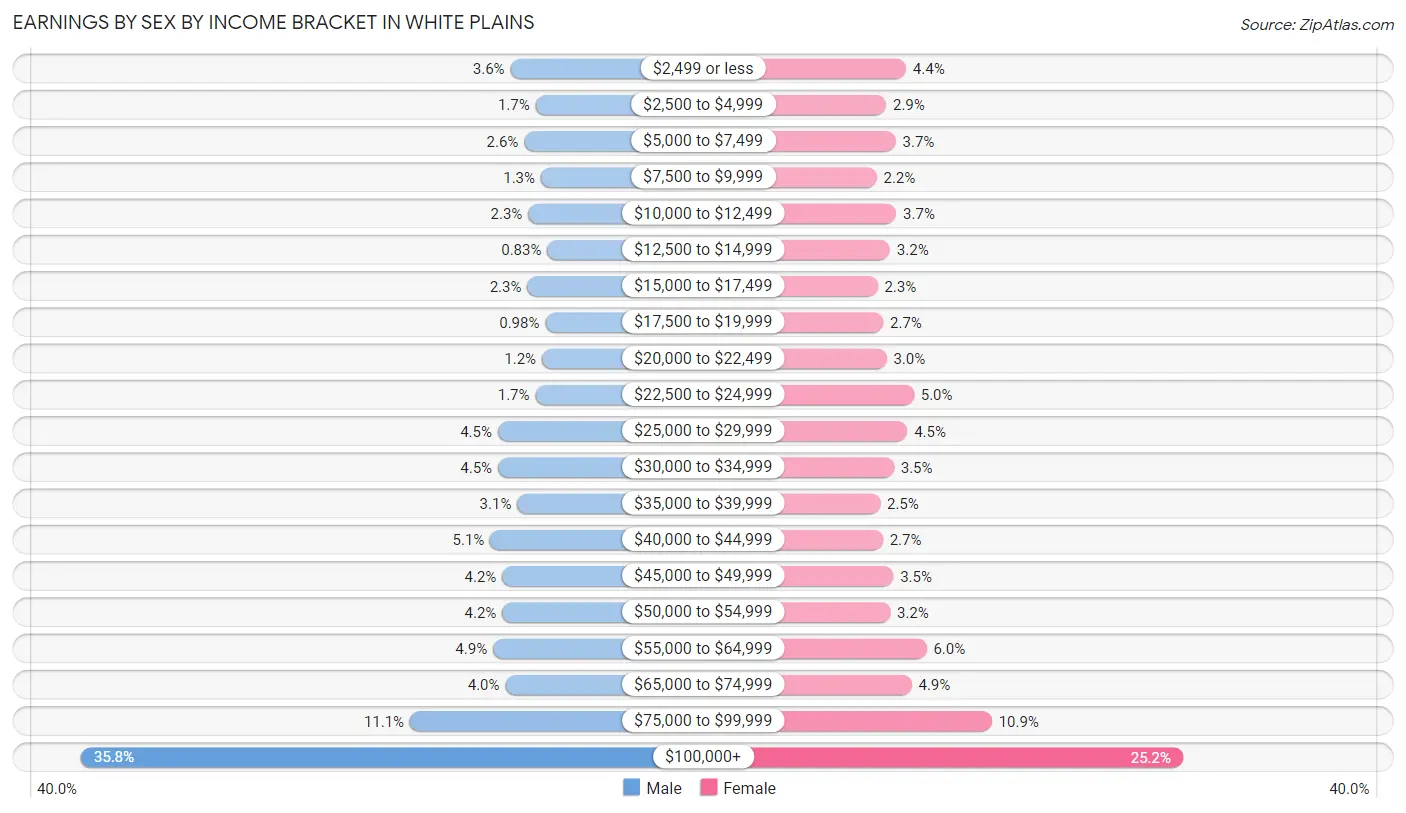
Earnings by Sex by Income Bracket in White Plains
The most common earnings brackets in White Plains are $100,000+ for men (6,504 | 35.8%) and $100,000+ for women (4,084 | 25.2%).
| Income | Male | Female |
| $2,499 or less | 653 (3.6%) | 718 (4.4%) |
| $2,500 to $4,999 | 311 (1.7%) | 477 (2.9%) |
| $5,000 to $7,499 | 466 (2.6%) | 593 (3.7%) |
| $7,500 to $9,999 | 238 (1.3%) | 361 (2.2%) |
| $10,000 to $12,499 | 411 (2.3%) | 600 (3.7%) |
| $12,500 to $14,999 | 151 (0.8%) | 524 (3.2%) |
| $15,000 to $17,499 | 424 (2.3%) | 373 (2.3%) |
| $17,500 to $19,999 | 179 (1.0%) | 441 (2.7%) |
| $20,000 to $22,499 | 224 (1.2%) | 482 (3.0%) |
| $22,500 to $24,999 | 312 (1.7%) | 815 (5.0%) |
| $25,000 to $29,999 | 826 (4.5%) | 735 (4.5%) |
| $30,000 to $34,999 | 824 (4.5%) | 571 (3.5%) |
| $35,000 to $39,999 | 560 (3.1%) | 404 (2.5%) |
| $40,000 to $44,999 | 929 (5.1%) | 436 (2.7%) |
| $45,000 to $49,999 | 765 (4.2%) | 565 (3.5%) |
| $50,000 to $54,999 | 765 (4.2%) | 526 (3.2%) |
| $55,000 to $64,999 | 891 (4.9%) | 968 (6.0%) |
| $65,000 to $74,999 | 722 (4.0%) | 787 (4.9%) |
| $75,000 to $99,999 | 2,022 (11.1%) | 1,761 (10.9%) |
| $100,000+ | 6,504 (35.8%) | 4,084 (25.2%) |
| Total | 18,177 (100.0%) | 16,221 (100.0%) |
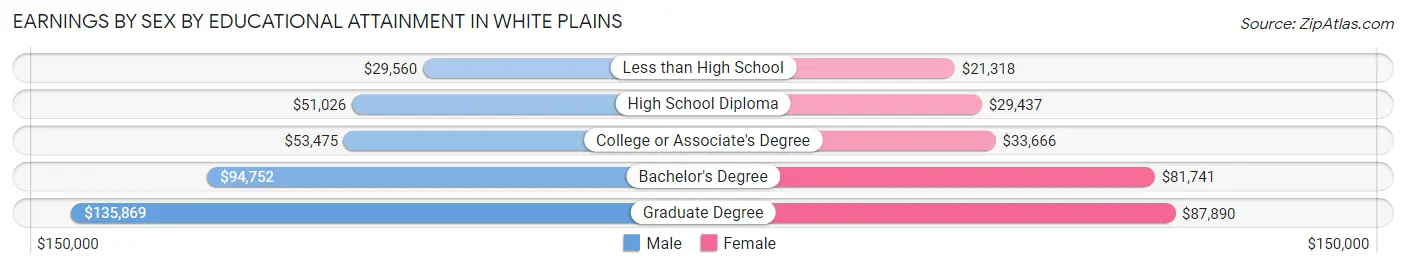
Earnings by Sex by Educational Attainment in White Plains
Average earnings in White Plains are $79,588 for men and $57,783 for women, a difference of 27.4%. Men with an educational attainment of graduate degree enjoy the highest average annual earnings of $135,869, while those with less than high school education earn the least with $29,560. Women with an educational attainment of graduate degree earn the most with the average annual earnings of $87,890, while those with less than high school education have the smallest earnings of $21,318.
| Educational Attainment | Male Income | Female Income |
| Less than High School | $29,560 | $21,318 |
| High School Diploma | $51,026 | $29,437 |
| College or Associate's Degree | $53,475 | $33,666 |
| Bachelor's Degree | $94,752 | $81,741 |
| Graduate Degree | $135,869 | $87,890 |
| Total | $79,588 | $57,783 |
Family Income in White Plains
Family Income Brackets in White Plains
According to the White Plains family income data, there are 4,663 families falling into the $200,000+ income range, which is the most common income bracket and makes up 32.3% of all families. Conversely, the $10,000 to $14,999 income bracket is the least frequent group with only 173 families (1.2%) belonging to this category.
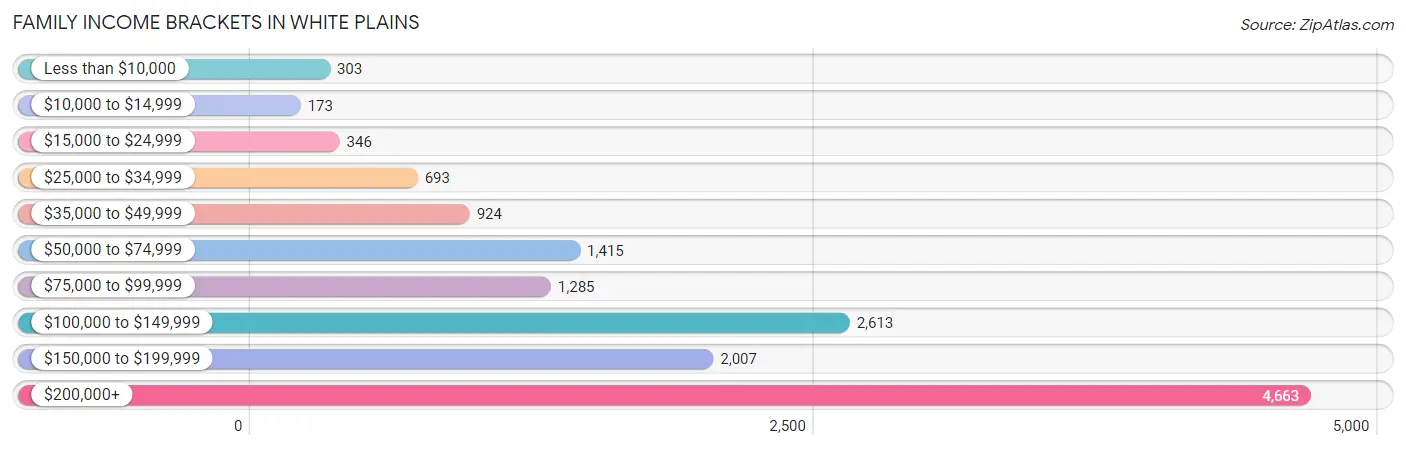
| Income Bracket | # Families | % Families |
| Less than $10,000 | 303 | 2.1% |
| $10,000 to $14,999 | 173 | 1.2% |
| $15,000 to $24,999 | 346 | 2.4% |
| $25,000 to $34,999 | 693 | 4.8% |
| $35,000 to $49,999 | 924 | 6.4% |
| $50,000 to $74,999 | 1,415 | 9.8% |
| $75,000 to $99,999 | 1,285 | 8.9% |
| $100,000 to $149,999 | 2,613 | 18.1% |
| $150,000 to $199,999 | 2,007 | 13.9% |
| $200,000+ | 4,663 | 32.3% |
Family Income by Famaliy Size in White Plains
7+ person families (100 | 0.7%) account for the highest median family income in White Plains with $184,722 per family, while 2-person families (6,278 | 43.5%) have the highest median income of $60,634 per family member.
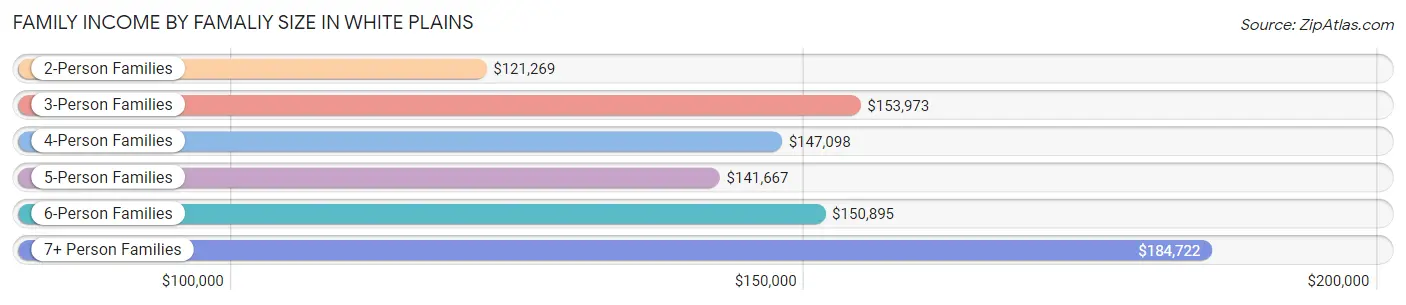
| Income Bracket | # Families | Median Income |
| 2-Person Families | 6,278 (43.5%) | $121,269 |
| 3-Person Families | 3,325 (23.0%) | $153,973 |
| 4-Person Families | 3,420 (23.7%) | $147,098 |
| 5-Person Families | 924 (6.4%) | $141,667 |
| 6-Person Families | 390 (2.7%) | $150,895 |
| 7+ Person Families | 100 (0.7%) | $184,722 |
| Total | 14,437 (100.0%) | $141,335 |
Family Income by Number of Earners in White Plains
The median family income in White Plains is $141,335, with families comprising 3+ earners (2,115) having the highest median family income of $187,161, while families with no earners (1,547) have the lowest median family income of $59,083, accounting for 14.6% and 10.7% of families, respectively.
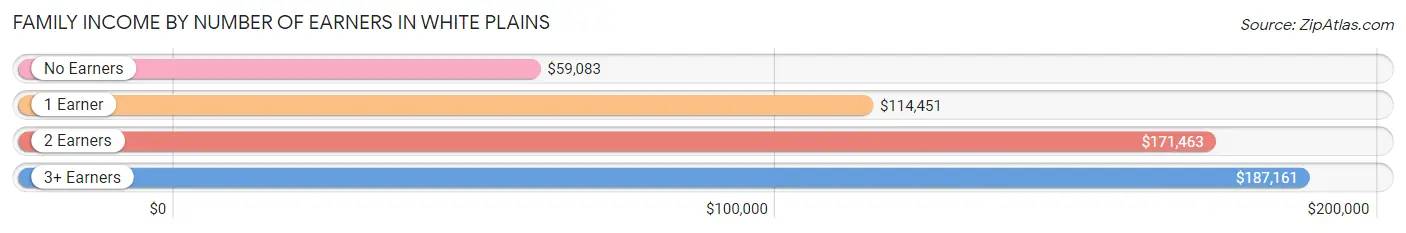
| Number of Earners | # Families | Median Income |
| No Earners | 1,547 (10.7%) | $59,083 |
| 1 Earner | 4,124 (28.6%) | $114,451 |
| 2 Earners | 6,651 (46.1%) | $171,463 |
| 3+ Earners | 2,115 (14.6%) | $187,161 |
| Total | 14,437 (100.0%) | $141,335 |
Household Income in White Plains
Household Income Brackets in White Plains
With 5,943 households falling in the category, the $200,000+ income range is the most frequent in White Plains, accounting for 24.7% of all households. In contrast, only 698 households (2.9%) fall into the $10,000 to $14,999 income bracket, making it the least populous group.
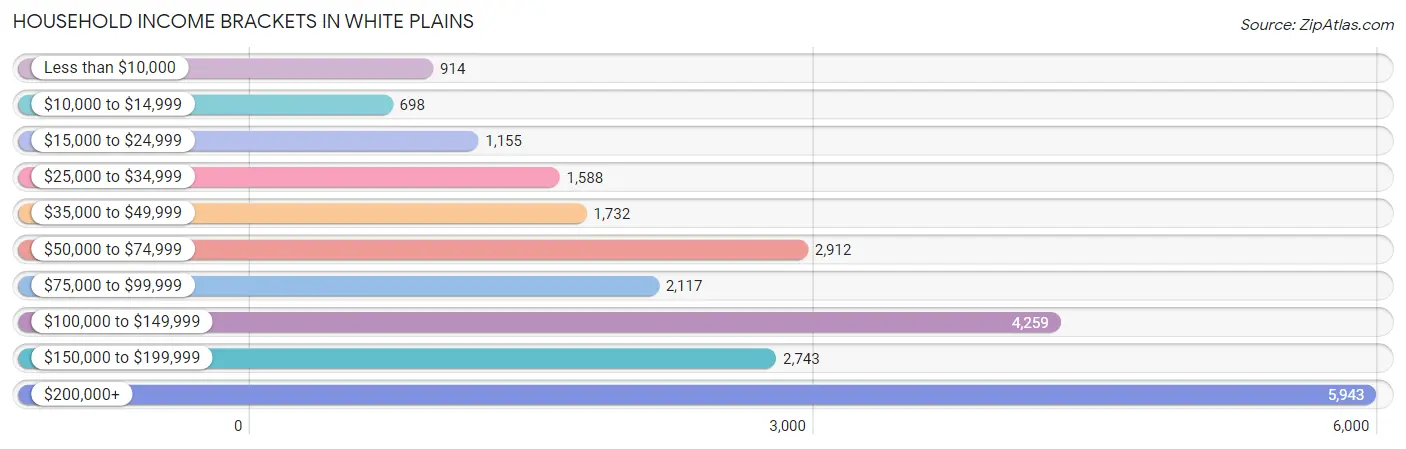
| Income Bracket | # Households | % Households |
| Less than $10,000 | 914 | 3.8% |
| $10,000 to $14,999 | 698 | 2.9% |
| $15,000 to $24,999 | 1,155 | 4.8% |
| $25,000 to $34,999 | 1,588 | 6.6% |
| $35,000 to $49,999 | 1,732 | 7.2% |
| $50,000 to $74,999 | 2,912 | 12.1% |
| $75,000 to $99,999 | 2,117 | 8.8% |
| $100,000 to $149,999 | 4,259 | 17.7% |
| $150,000 to $199,999 | 2,743 | 11.4% |
| $200,000+ | 5,943 | 24.7% |
Household Income by Householder Age in White Plains
The median household income in White Plains is $109,551, with the highest median household income of $131,610 found in the 45 to 64 years age bracket for the primary householder. A total of 8,195 households (34.1%) fall into this category. Meanwhile, the 15 to 24 years age bracket for the primary householder has the lowest median household income of $36,222, with 289 households (1.2%) in this group.
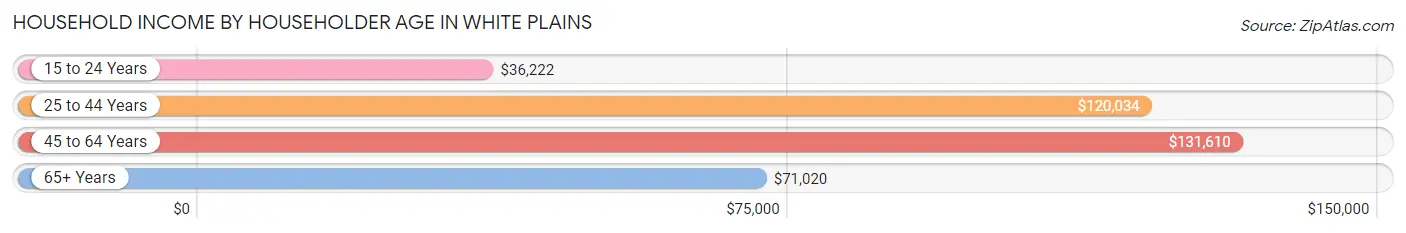
| Income Bracket | # Households | Median Income |
| 15 to 24 Years | 289 (1.2%) | $36,222 |
| 25 to 44 Years | 7,960 (33.1%) | $120,034 |
| 45 to 64 Years | 8,195 (34.1%) | $131,610 |
| 65+ Years | 7,618 (31.7%) | $71,020 |
| Total | 24,062 (100.0%) | $109,551 |
Poverty in White Plains
Income Below Poverty by Sex and Age in White Plains
With 7.0% poverty level for males and 12.8% for females among the residents of White Plains, 16 and 17 year old males and 16 and 17 year old females are the most vulnerable to poverty, with 129 males (26.1%) and 167 females (20.3%) in their respective age groups living below the poverty level.
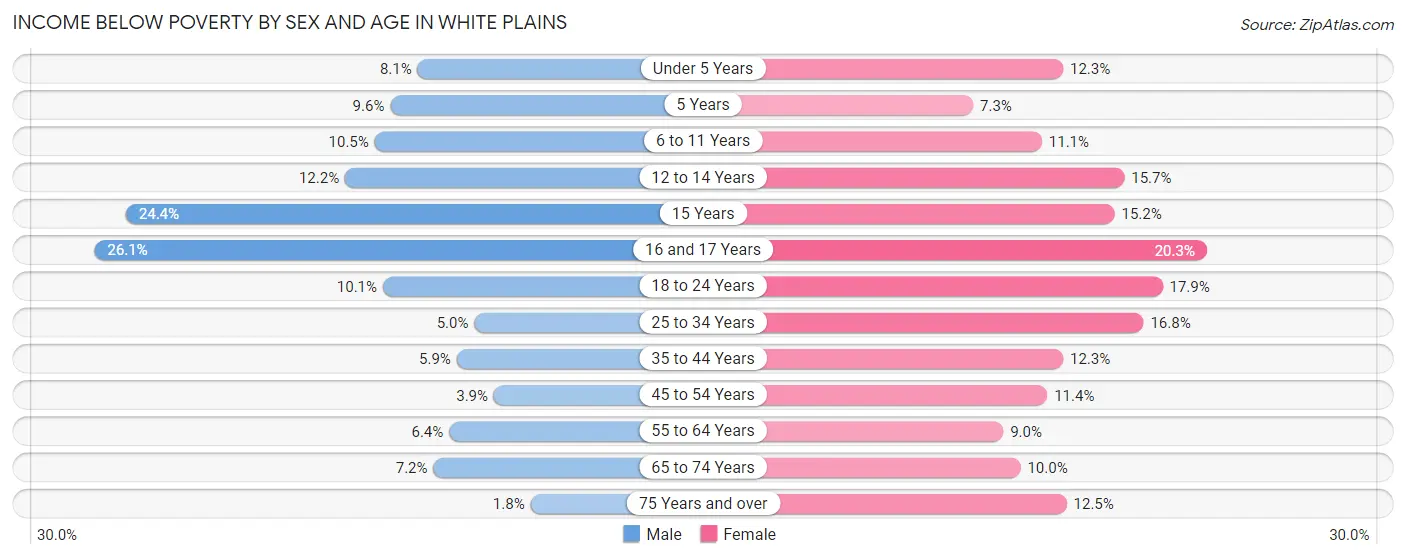
| Age Bracket | Male | Female |
| Under 5 Years | 109 (8.1%) | 181 (12.3%) |
| 5 Years | 27 (9.6%) | 19 (7.3%) |
| 6 to 11 Years | 205 (10.5%) | 167 (11.1%) |
| 12 to 14 Years | 107 (12.2%) | 132 (15.7%) |
| 15 Years | 86 (24.4%) | 60 (15.2%) |
| 16 and 17 Years | 129 (26.1%) | 167 (20.3%) |
| 18 to 24 Years | 232 (10.1%) | 449 (17.9%) |
| 25 to 34 Years | 238 (5.0%) | 710 (16.8%) |
| 35 to 44 Years | 224 (5.9%) | 446 (12.3%) |
| 45 to 54 Years | 131 (3.9%) | 416 (11.4%) |
| 55 to 64 Years | 240 (6.4%) | 397 (9.0%) |
| 65 to 74 Years | 208 (7.2%) | 375 (10.0%) |
| 75 Years and over | 33 (1.8%) | 398 (12.5%) |
| Total | 1,969 (7.0%) | 3,917 (12.8%) |
Income Above Poverty by Sex and Age in White Plains
According to the poverty statistics in White Plains, males aged 75 years and over and females aged 5 years are the age groups that are most secure financially, with 98.2% of males and 92.7% of females in these age groups living above the poverty line.
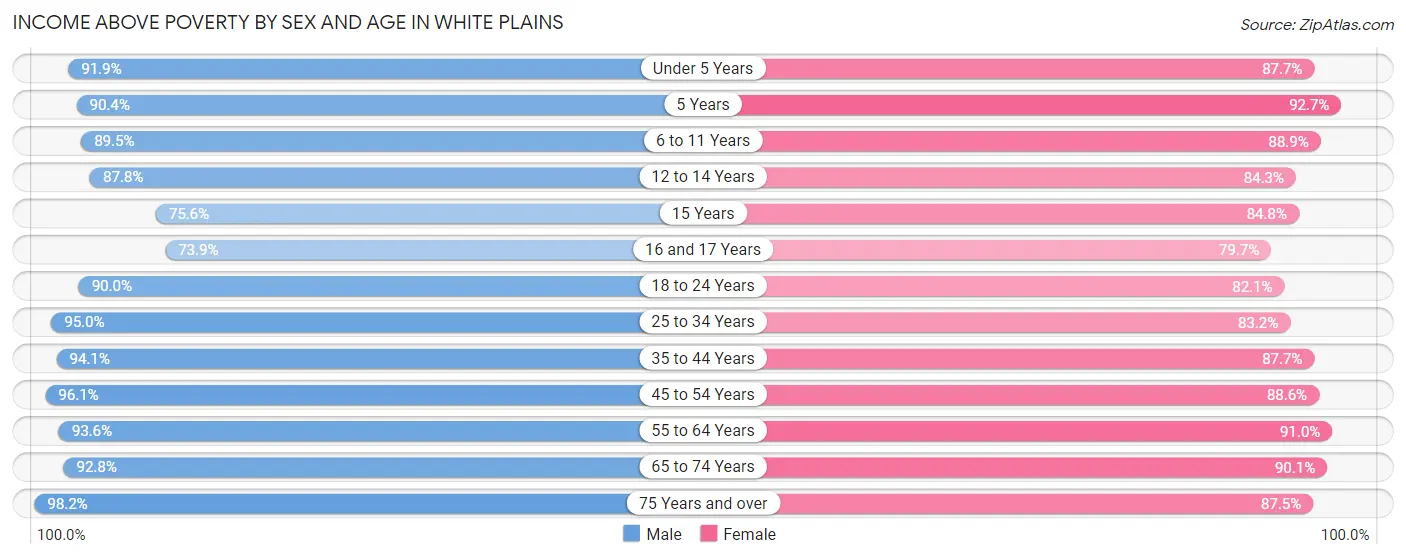
| Age Bracket | Male | Female |
| Under 5 Years | 1,233 (91.9%) | 1,288 (87.7%) |
| 5 Years | 253 (90.4%) | 241 (92.7%) |
| 6 to 11 Years | 1,745 (89.5%) | 1,332 (88.9%) |
| 12 to 14 Years | 773 (87.8%) | 707 (84.3%) |
| 15 Years | 267 (75.6%) | 335 (84.8%) |
| 16 and 17 Years | 365 (73.9%) | 655 (79.7%) |
| 18 to 24 Years | 2,077 (89.9%) | 2,065 (82.1%) |
| 25 to 34 Years | 4,563 (95.0%) | 3,516 (83.2%) |
| 35 to 44 Years | 3,545 (94.1%) | 3,173 (87.7%) |
| 45 to 54 Years | 3,252 (96.1%) | 3,221 (88.6%) |
| 55 to 64 Years | 3,534 (93.6%) | 4,019 (91.0%) |
| 65 to 74 Years | 2,665 (92.8%) | 3,392 (90.0%) |
| 75 Years and over | 1,766 (98.2%) | 2,780 (87.5%) |
| Total | 26,038 (93.0%) | 26,724 (87.2%) |
Income Below Poverty Among Married-Couple Families in White Plains
The poverty statistics for married-couple families in White Plains show that 5.1% or 559 of the total 10,978 families live below the poverty line. Families with 3 or 4 children have the highest poverty rate of 20.9%, comprising of 119 families. On the other hand, families with no children have the lowest poverty rate of 3.4%, which includes 224 families.
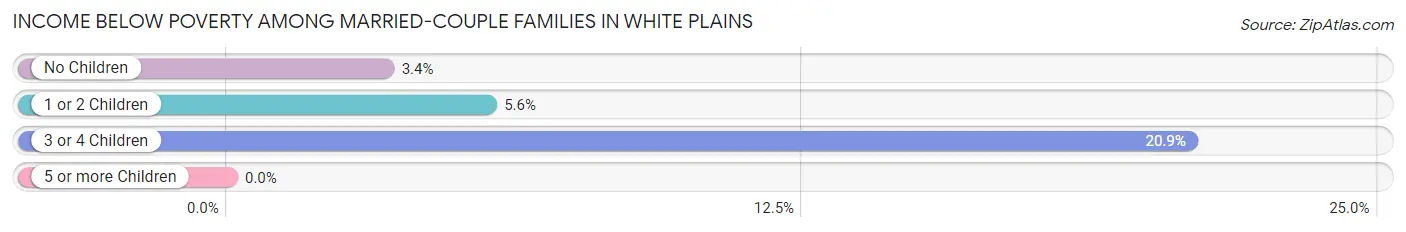
| Children | Above Poverty | Below Poverty |
| No Children | 6,354 (96.6%) | 224 (3.4%) |
| 1 or 2 Children | 3,614 (94.4%) | 216 (5.6%) |
| 3 or 4 Children | 451 (79.1%) | 119 (20.9%) |
| 5 or more Children | 0 (0.0%) | 0 (0.0%) |
| Total | 10,419 (94.9%) | 559 (5.1%) |
Income Below Poverty Among Single-Parent Households in White Plains
According to the poverty data in White Plains, 1.7% or 17 single-father households and 15.2% or 372 single-mother households are living below the poverty line. Among single-father households, those with 1 or 2 children have the highest poverty rate, with 17 households (3.0%) experiencing poverty. Likewise, among single-mother households, those with 3 or 4 children have the highest poverty rate, with 49 households (33.1%) falling below the poverty line.
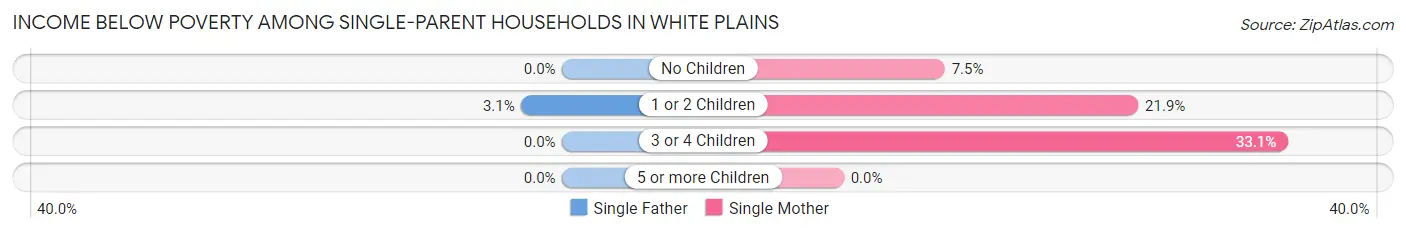
| Children | Single Father | Single Mother |
| No Children | 0 (0.0%) | 95 (7.5%) |
| 1 or 2 Children | 17 (3.0%) | 228 (21.9%) |
| 3 or 4 Children | 0 (0.0%) | 49 (33.1%) |
| 5 or more Children | 0 (0.0%) | 0 (0.0%) |
| Total | 17 (1.7%) | 372 (15.2%) |
Income Below Poverty Among Married-Couple vs Single-Parent Households in White Plains
The poverty data for White Plains shows that 559 of the married-couple family households (5.1%) and 389 of the single-parent households (11.3%) are living below the poverty level. Within the married-couple family households, those with 3 or 4 children have the highest poverty rate, with 119 households (20.9%) falling below the poverty line. Among the single-parent households, those with 3 or 4 children have the highest poverty rate, with 49 household (33.1%) living below poverty.
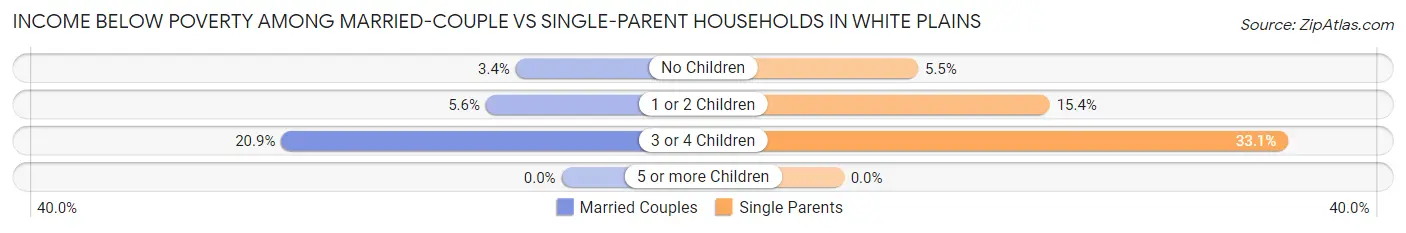
| Children | Married-Couple Families | Single-Parent Households |
| No Children | 224 (3.4%) | 95 (5.5%) |
| 1 or 2 Children | 216 (5.6%) | 245 (15.3%) |
| 3 or 4 Children | 119 (20.9%) | 49 (33.1%) |
| 5 or more Children | 0 (0.0%) | 0 (0.0%) |
| Total | 559 (5.1%) | 389 (11.3%) |
Race in White Plains
The most populous races in White Plains are White / Caucasian (31,392 | 52.8%), Hispanic or Latino (18,589 | 31.3%), and Some other Race (10,499 | 17.7%).
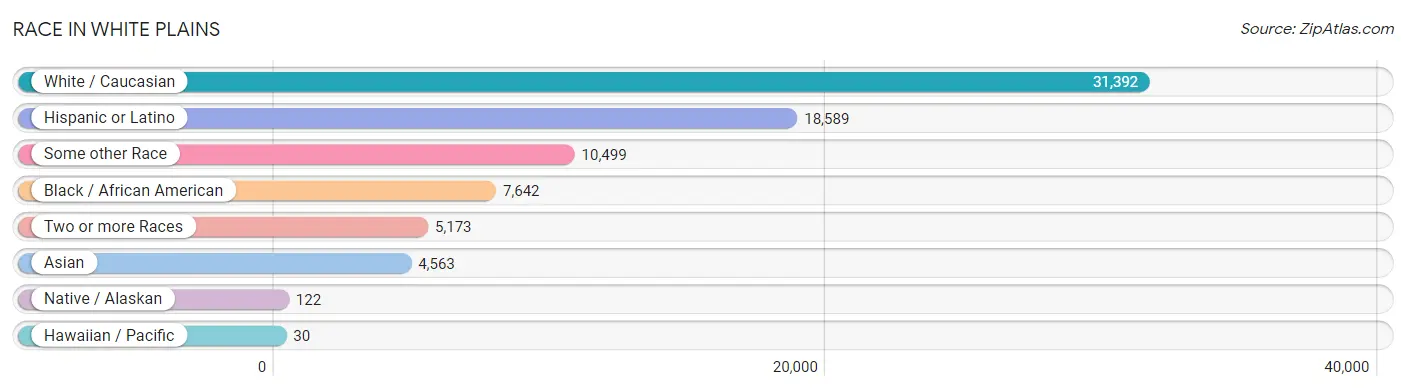
| Race | # Population | % Population |
| Asian | 4,563 | 7.7% |
| Black / African American | 7,642 | 12.9% |
| Hawaiian / Pacific | 30 | 0.1% |
| Hispanic or Latino | 18,589 | 31.3% |
| Native / Alaskan | 122 | 0.2% |
| White / Caucasian | 31,392 | 52.8% |
| Two or more Races | 5,173 | 8.7% |
| Some other Race | 10,499 | 17.7% |
| Total | 59,421 | 100.0% |
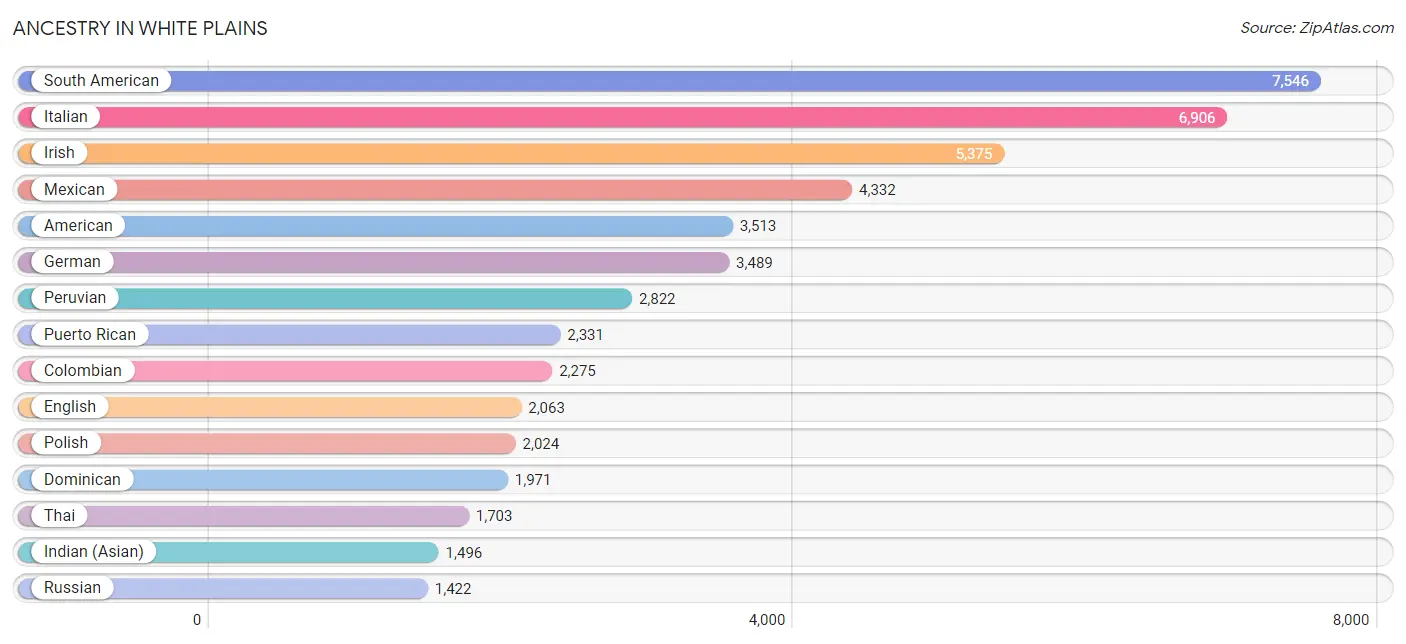
Ancestry in White Plains
The most populous ancestries reported in White Plains are South American (7,546 | 12.7%), Italian (6,906 | 11.6%), Irish (5,375 | 9.0%), Mexican (4,332 | 7.3%), and American (3,513 | 5.9%), together accounting for 46.6% of all White Plains residents.
| Ancestry | # Population | % Population |
| African | 480 | 0.8% |
| Albanian | 1,026 | 1.7% |
| Alsatian | 9 | 0.0% |
| American | 3,513 | 5.9% |
| Arab | 422 | 0.7% |
| Argentinean | 341 | 0.6% |
| Armenian | 120 | 0.2% |
| Australian | 140 | 0.2% |
| Austrian | 247 | 0.4% |
| Bahamian | 14 | 0.0% |
| Barbadian | 55 | 0.1% |
| Basque | 10 | 0.0% |
| Belgian | 11 | 0.0% |
| Bhutanese | 311 | 0.5% |
| Blackfeet | 10 | 0.0% |
| Bolivian | 180 | 0.3% |
| Brazilian | 460 | 0.8% |
| British | 248 | 0.4% |
| British West Indian | 51 | 0.1% |
| Burmese | 451 | 0.8% |
| Canadian | 117 | 0.2% |
| Celtic | 10 | 0.0% |
| Central American | 1,408 | 2.4% |
| Central American Indian | 14 | 0.0% |
| Cherokee | 76 | 0.1% |
| Chilean | 783 | 1.3% |
| Colombian | 2,275 | 3.8% |
| Costa Rican | 57 | 0.1% |
| Croatian | 50 | 0.1% |
| Cuban | 273 | 0.5% |
| Cypriot | 90 | 0.2% |
| Czech | 152 | 0.3% |
| Czechoslovakian | 46 | 0.1% |
| Danish | 100 | 0.2% |
| Dominican | 1,971 | 3.3% |
| Dutch | 126 | 0.2% |
| Eastern European | 1,034 | 1.7% |
| Ecuadorian | 830 | 1.4% |
| Egyptian | 71 | 0.1% |
| English | 2,063 | 3.5% |
| Estonian | 48 | 0.1% |
| Ethiopian | 28 | 0.1% |
| European | 582 | 1.0% |
| Filipino | 108 | 0.2% |
| Finnish | 58 | 0.1% |
| French | 521 | 0.9% |
| French Canadian | 103 | 0.2% |
| German | 3,489 | 5.9% |
| Ghanaian | 16 | 0.0% |
| Greek | 170 | 0.3% |
| Guamanian / Chamorro | 16 | 0.0% |
| Guatemalan | 893 | 1.5% |
| Guyanese | 71 | 0.1% |
| Haitian | 902 | 1.5% |
| Honduran | 117 | 0.2% |
| Hungarian | 270 | 0.4% |
| Indian (Asian) | 1,496 | 2.5% |
| Iranian | 27 | 0.1% |
| Iraqi | 10 | 0.0% |
| Irish | 5,375 | 9.0% |
| Israeli | 191 | 0.3% |
| Italian | 6,906 | 11.6% |
| Jamaican | 1,120 | 1.9% |
| Kenyan | 20 | 0.0% |
| Korean | 566 | 0.9% |
| Latvian | 7 | 0.0% |
| Lebanese | 82 | 0.1% |
| Lithuanian | 279 | 0.5% |
| Maltese | 78 | 0.1% |
| Mexican | 4,332 | 7.3% |
| Mexican American Indian | 166 | 0.3% |
| Mongolian | 14 | 0.0% |
| Moroccan | 102 | 0.2% |
| Native Hawaiian | 14 | 0.0% |
| Northern European | 63 | 0.1% |
| Norwegian | 134 | 0.2% |
| Pakistani | 113 | 0.2% |
| Panamanian | 109 | 0.2% |
| Paraguayan | 193 | 0.3% |
| Peruvian | 2,822 | 4.8% |
| Polish | 2,024 | 3.4% |
| Portuguese | 187 | 0.3% |
| Puerto Rican | 2,331 | 3.9% |
| Romanian | 93 | 0.2% |
| Russian | 1,422 | 2.4% |
| Salvadoran | 216 | 0.4% |
| Scandinavian | 24 | 0.0% |
| Scotch-Irish | 71 | 0.1% |
| Scottish | 539 | 0.9% |
| Serbian | 153 | 0.3% |
| Slavic | 7 | 0.0% |
| Slovak | 76 | 0.1% |
| Slovene | 11 | 0.0% |
| South African | 20 | 0.0% |
| South American | 7,546 | 12.7% |
| Spaniard | 188 | 0.3% |
| Spanish | 54 | 0.1% |
| Spanish American | 22 | 0.0% |
| Sri Lankan | 41 | 0.1% |
| Subsaharan African | 634 | 1.1% |
| Swedish | 160 | 0.3% |
| Swiss | 68 | 0.1% |
| Syrian | 50 | 0.1% |
| Thai | 1,703 | 2.9% |
| Trinidadian and Tobagonian | 25 | 0.0% |
| Turkish | 27 | 0.1% |
| Ukrainian | 389 | 0.6% |
| Uruguayan | 76 | 0.1% |
| Venezuelan | 46 | 0.1% |
| Vietnamese | 51 | 0.1% |
| Welsh | 144 | 0.2% |
| West Indian | 15 | 0.0% |
| Yugoslavian | 13 | 0.0% | View All 113 Rows |
Immigrants in White Plains
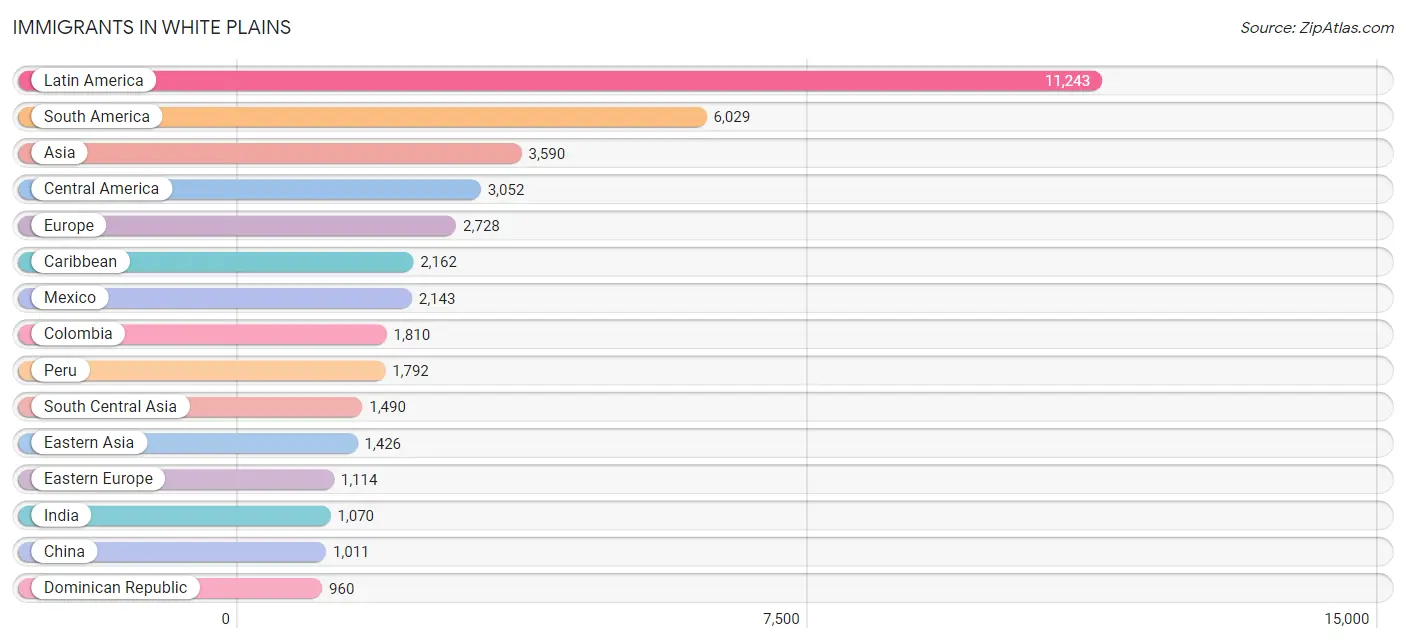
The most numerous immigrant groups reported in White Plains came from Latin America (11,243 | 18.9%), South America (6,029 | 10.2%), Asia (3,590 | 6.0%), Central America (3,052 | 5.1%), and Europe (2,728 | 4.6%), together accounting for 44.8% of all White Plains residents.
| Immigration Origin | # Population | % Population |
| Africa | 347 | 0.6% |
| Albania | 410 | 0.7% |
| Argentina | 180 | 0.3% |
| Armenia | 22 | 0.0% |
| Asia | 3,590 | 6.0% |
| Australia | 154 | 0.3% |
| Austria | 4 | 0.0% |
| Bahamas | 14 | 0.0% |
| Bangladesh | 185 | 0.3% |
| Barbados | 21 | 0.0% |
| Belgium | 32 | 0.1% |
| Bolivia | 122 | 0.2% |
| Brazil | 366 | 0.6% |
| Cambodia | 6 | 0.0% |
| Cameroon | 46 | 0.1% |
| Canada | 264 | 0.4% |
| Caribbean | 2,162 | 3.6% |
| Central America | 3,052 | 5.1% |
| Chile | 650 | 1.1% |
| China | 1,011 | 1.7% |
| Colombia | 1,810 | 3.0% |
| Costa Rica | 15 | 0.0% |
| Croatia | 40 | 0.1% |
| Cuba | 88 | 0.2% |
| Czechoslovakia | 16 | 0.0% |
| Denmark | 31 | 0.1% |
| Dominican Republic | 960 | 1.6% |
| Eastern Africa | 84 | 0.1% |
| Eastern Asia | 1,426 | 2.4% |
| Eastern Europe | 1,114 | 1.9% |
| Ecuador | 688 | 1.2% |
| El Salvador | 141 | 0.2% |
| England | 57 | 0.1% |
| Ethiopia | 36 | 0.1% |
| Europe | 2,728 | 4.6% |
| France | 51 | 0.1% |
| Germany | 391 | 0.7% |
| Ghana | 71 | 0.1% |
| Greece | 11 | 0.0% |
| Grenada | 11 | 0.0% |
| Guatemala | 680 | 1.1% |
| Guyana | 120 | 0.2% |
| Haiti | 459 | 0.8% |
| Honduras | 30 | 0.1% |
| Hong Kong | 160 | 0.3% |
| Hungary | 7 | 0.0% |
| India | 1,070 | 1.8% |
| Iran | 37 | 0.1% |
| Ireland | 128 | 0.2% |
| Israel | 144 | 0.2% |
| Italy | 438 | 0.7% |
| Jamaica | 556 | 0.9% |
| Japan | 172 | 0.3% |
| Kazakhstan | 11 | 0.0% |
| Kenya | 39 | 0.1% |
| Korea | 243 | 0.4% |
| Kuwait | 18 | 0.0% |
| Laos | 27 | 0.1% |
| Latin America | 11,243 | 18.9% |
| Lebanon | 18 | 0.0% |
| Liberia | 22 | 0.0% |
| Malaysia | 26 | 0.0% |
| Mexico | 2,143 | 3.6% |
| Middle Africa | 72 | 0.1% |
| Morocco | 8 | 0.0% |
| Nepal | 58 | 0.1% |
| Netherlands | 35 | 0.1% |
| Nigeria | 21 | 0.0% |
| Northern Africa | 21 | 0.0% |
| Northern Europe | 424 | 0.7% |
| Oceania | 154 | 0.3% |
| Pakistan | 119 | 0.2% |
| Panama | 43 | 0.1% |
| Peru | 1,792 | 3.0% |
| Philippines | 292 | 0.5% |
| Poland | 252 | 0.4% |
| Portugal | 17 | 0.0% |
| Romania | 23 | 0.0% |
| Russia | 92 | 0.2% |
| Scotland | 51 | 0.1% |
| Serbia | 16 | 0.0% |
| South Africa | 41 | 0.1% |
| South America | 6,029 | 10.2% |
| South Central Asia | 1,490 | 2.5% |
| South Eastern Asia | 398 | 0.7% |
| Southern Europe | 489 | 0.8% |
| Spain | 23 | 0.0% |
| Sweden | 36 | 0.1% |
| Switzerland | 27 | 0.1% |
| Syria | 6 | 0.0% |
| Taiwan | 176 | 0.3% |
| Thailand | 41 | 0.1% |
| Trinidad and Tobago | 28 | 0.1% |
| Turkey | 11 | 0.0% |
| Ukraine | 41 | 0.1% |
| Uruguay | 122 | 0.2% |
| Uzbekistan | 10 | 0.0% |
| Venezuela | 41 | 0.1% |
| Vietnam | 6 | 0.0% |
| Western Africa | 114 | 0.2% |
| Western Asia | 276 | 0.5% |
| Western Europe | 540 | 0.9% |
| Zaire | 26 | 0.0% |
| Zimbabwe | 9 | 0.0% | View All 104 Rows |
Sex and Age in White Plains
Sex and Age in White Plains
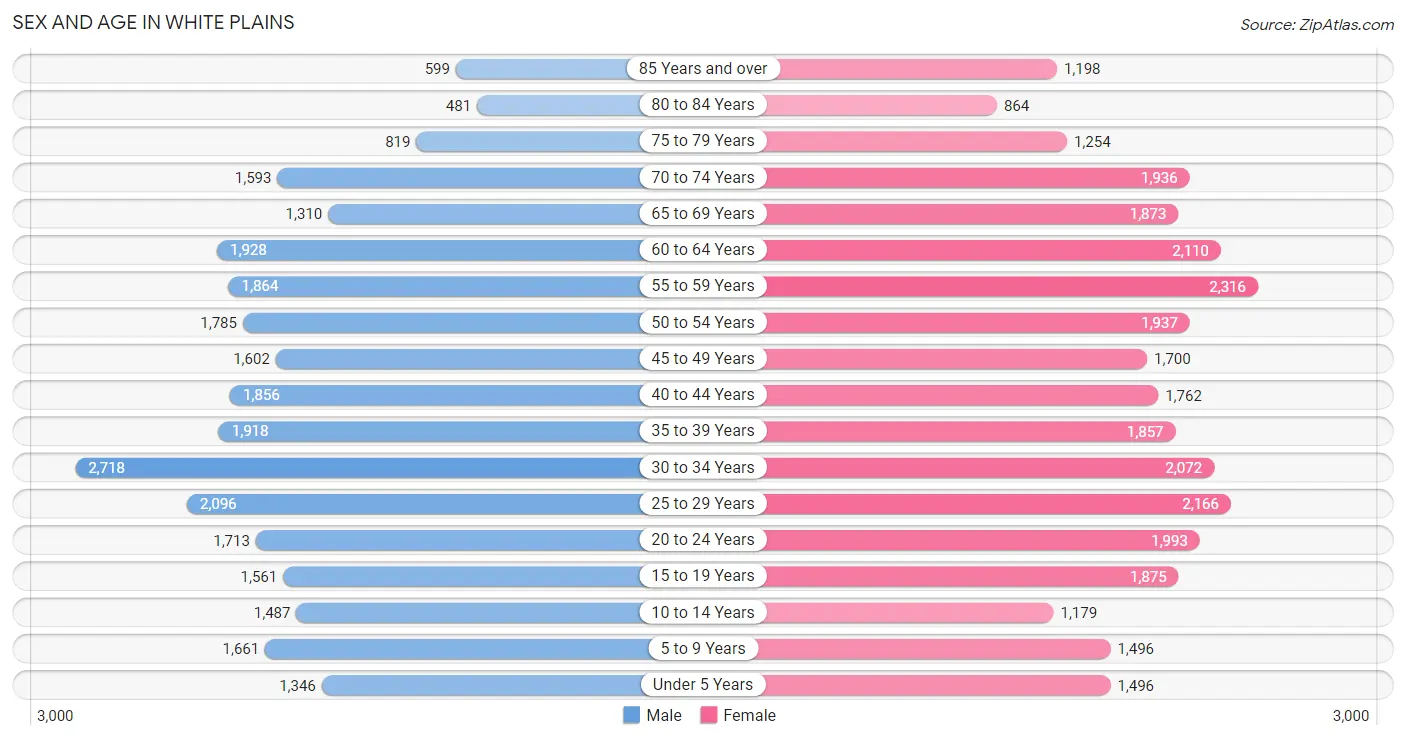
The most populous age groups in White Plains are 30 to 34 Years (2,718 | 9.6%) for men and 55 to 59 Years (2,316 | 7.4%) for women.
| Age Bracket | Male | Female |
| Under 5 Years | 1,346 (4.8%) | 1,496 (4.8%) |
| 5 to 9 Years | 1,661 (5.9%) | 1,496 (4.8%) |
| 10 to 14 Years | 1,487 (5.2%) | 1,179 (3.8%) |
| 15 to 19 Years | 1,561 (5.5%) | 1,875 (6.0%) |
| 20 to 24 Years | 1,713 (6.0%) | 1,993 (6.4%) |
| 25 to 29 Years | 2,096 (7.4%) | 2,166 (7.0%) |
| 30 to 34 Years | 2,718 (9.6%) | 2,072 (6.7%) |
| 35 to 39 Years | 1,918 (6.8%) | 1,857 (6.0%) |
| 40 to 44 Years | 1,856 (6.6%) | 1,762 (5.7%) |
| 45 to 49 Years | 1,602 (5.7%) | 1,700 (5.5%) |
| 50 to 54 Years | 1,785 (6.3%) | 1,937 (6.2%) |
| 55 to 59 Years | 1,864 (6.6%) | 2,316 (7.4%) |
| 60 to 64 Years | 1,928 (6.8%) | 2,110 (6.8%) |
| 65 to 69 Years | 1,310 (4.6%) | 1,873 (6.0%) |
| 70 to 74 Years | 1,593 (5.6%) | 1,936 (6.2%) |
| 75 to 79 Years | 819 (2.9%) | 1,254 (4.0%) |
| 80 to 84 Years | 481 (1.7%) | 864 (2.8%) |
| 85 Years and over | 599 (2.1%) | 1,198 (3.8%) |
| Total | 28,337 (100.0%) | 31,084 (100.0%) |
Families and Households in White Plains
Median Family Size in White Plains
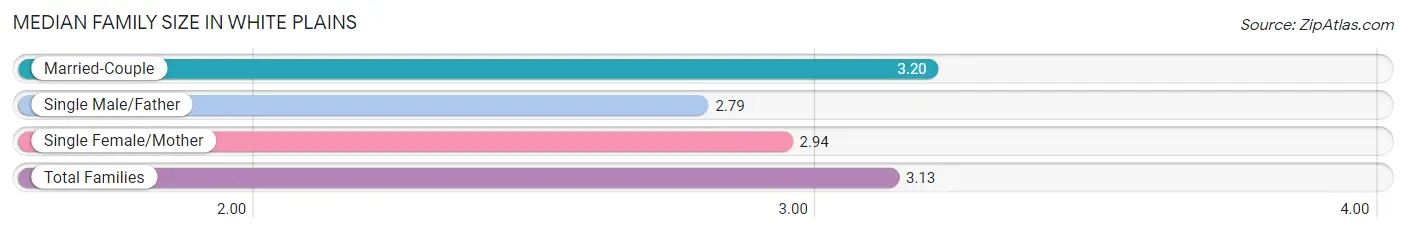
The median family size in White Plains is 3.13 persons per family, with married-couple families (10,978 | 76.0%) accounting for the largest median family size of 3.2 persons per family. On the other hand, single male/father families (1,011 | 7.0%) represent the smallest median family size with 2.79 persons per family.
| Family Type | # Families | Family Size |
| Married-Couple | 10,978 (76.0%) | 3.20 |
| Single Male/Father | 1,011 (7.0%) | 2.79 |
| Single Female/Mother | 2,448 (17.0%) | 2.94 |
| Total Families | 14,437 (100.0%) | 3.13 |
Median Household Size in White Plains
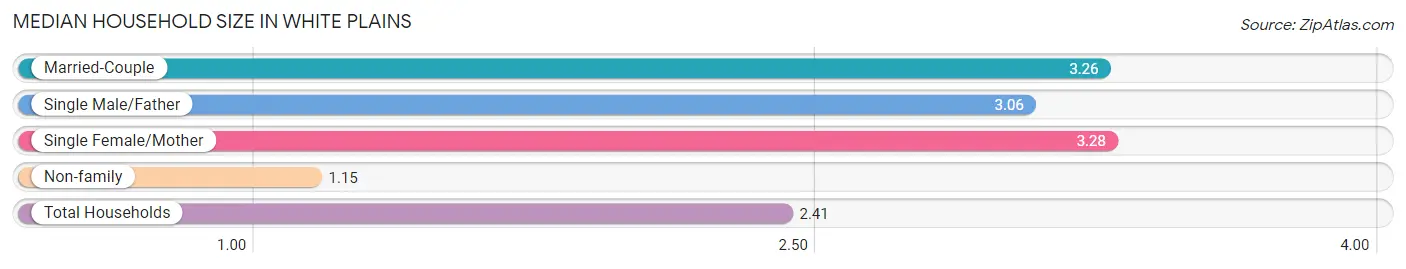
The median household size in White Plains is 2.41 persons per household, with single female/mother households (2,448 | 10.2%) accounting for the largest median household size of 3.28 persons per household. non-family households (9,625 | 40.0%) represent the smallest median household size with 1.15 persons per household.
| Household Type | # Households | Household Size |
| Married-Couple | 10,978 (45.6%) | 3.26 |
| Single Male/Father | 1,011 (4.2%) | 3.06 |
| Single Female/Mother | 2,448 (10.2%) | 3.28 |
| Non-family | 9,625 (40.0%) | 1.15 |
| Total Households | 24,062 (100.0%) | 2.41 |
Household Size by Marriage Status in White Plains
Out of a total of 24,062 households in White Plains, 14,437 (60.0%) are family households, while 9,625 (40.0%) are nonfamily households. The most numerous type of family households are 2-person households, comprising 5,851, and the most common type of nonfamily households are 1-person households, comprising 8,075.
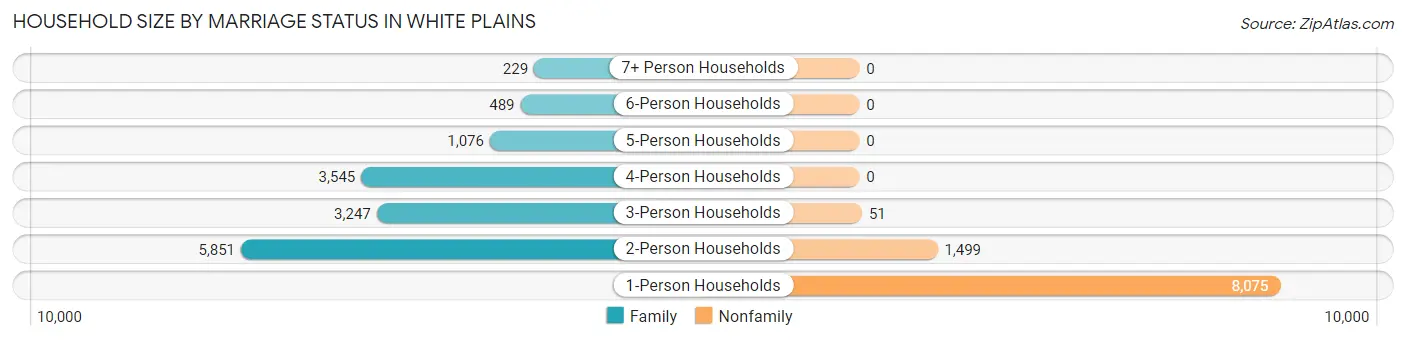
| Household Size | Family Households | Nonfamily Households |
| 1-Person Households | - | 8,075 (33.6%) |
| 2-Person Households | 5,851 (24.3%) | 1,499 (6.2%) |
| 3-Person Households | 3,247 (13.5%) | 51 (0.2%) |
| 4-Person Households | 3,545 (14.7%) | 0 (0.0%) |
| 5-Person Households | 1,076 (4.5%) | 0 (0.0%) |
| 6-Person Households | 489 (2.0%) | 0 (0.0%) |
| 7+ Person Households | 229 (0.9%) | 0 (0.0%) |
| Total | 14,437 (60.0%) | 9,625 (40.0%) |
Female Fertility in White Plains
Fertility by Age in White Plains
Average fertility rate in White Plains is 32.0 births per 1,000 women. Women in the age bracket of 35 to 50 years have the highest fertility rate with 43.0 births per 1,000 women. Women in the age bracket of 35 to 50 years acount for 56.3% of all women with births.
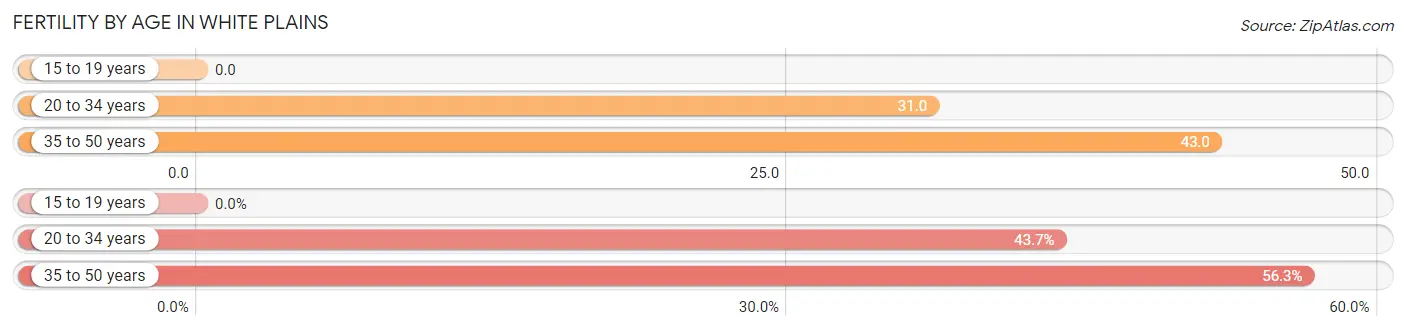
| Age Bracket | Women with Births | Births / 1,000 Women |
| 15 to 19 years | 0 (0.0%) | 0.0 |
| 20 to 34 years | 194 (43.7%) | 31.0 |
| 35 to 50 years | 250 (56.3%) | 43.0 |
| Total | 444 (100.0%) | 32.0 |
Fertility by Age by Marriage Status in White Plains
81.5% of women with births (444) in White Plains are married. The highest percentage of unmarried women with births falls into 35 to 50 years age bracket with 27.6% of them unmarried at the time of birth, while the lowest percentage of unmarried women with births belong to 20 to 34 years age bracket with 6.7% of them unmarried.
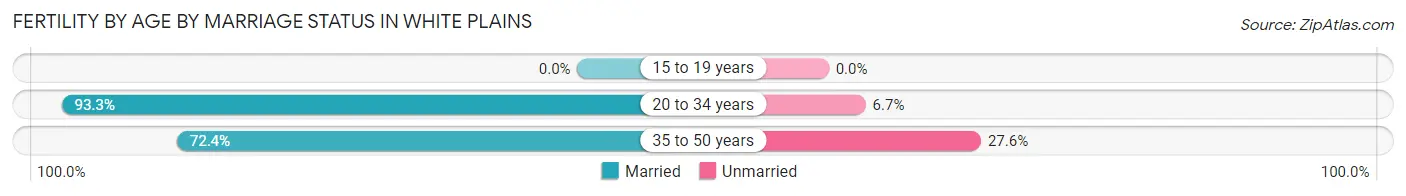
| Age Bracket | Married | Unmarried |
| 15 to 19 years | 0 (0.0%) | 0 (0.0%) |
| 20 to 34 years | 181 (93.3%) | 13 (6.7%) |
| 35 to 50 years | 181 (72.4%) | 69 (27.6%) |
| Total | 362 (81.5%) | 82 (18.5%) |
Fertility by Education in White Plains
Average fertility rate in White Plains is 32.0 births per 1,000 women. Women with the education attainment of graduate degree have the highest fertility rate of 58.0 births per 1,000 women, while women with the education attainment of less than high school have the lowest fertility at 1.0 births per 1,000 women. Women with the education attainment of graduate degree represent 47.5% of all women with births.
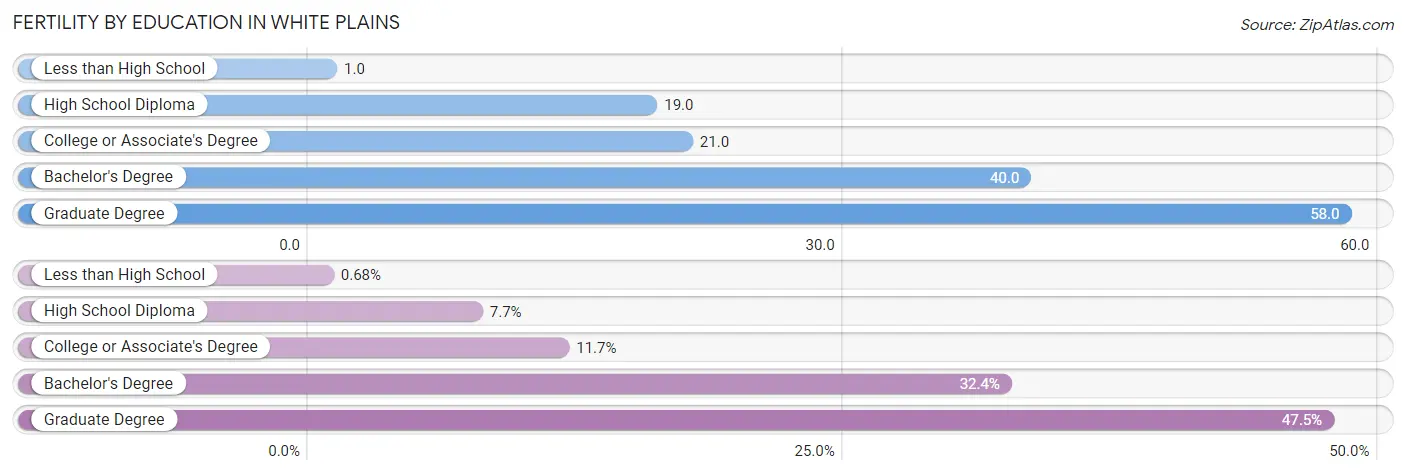
| Educational Attainment | Women with Births | Births / 1,000 Women |
| Less than High School | 3 (0.7%) | 1.0 |
| High School Diploma | 34 (7.7%) | 19.0 |
| College or Associate's Degree | 52 (11.7%) | 21.0 |
| Bachelor's Degree | 144 (32.4%) | 40.0 |
| Graduate Degree | 211 (47.5%) | 58.0 |
| Total | 444 (100.0%) | 32.0 |
Fertility by Education by Marriage Status in White Plains
18.5% of women with births in White Plains are unmarried. Women with the educational attainment of less than high school are most likely to be married with 100.0% of them married at childbirth, while women with the educational attainment of college or associate's degree are least likely to be married with 65.4% of them unmarried at childbirth.
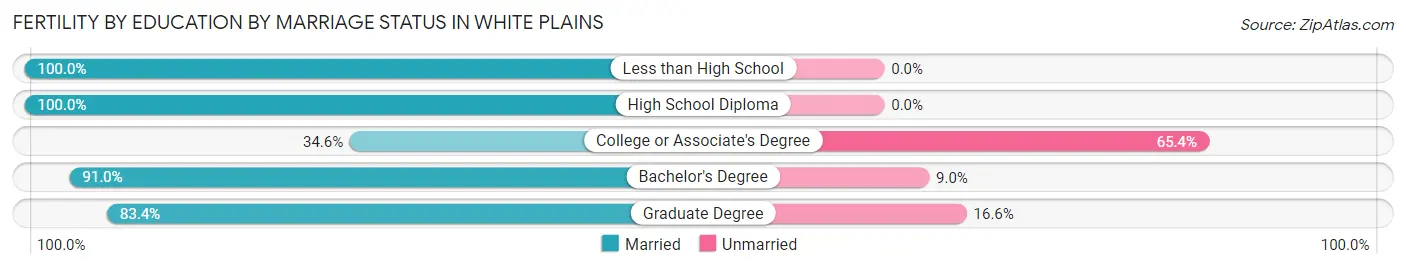
| Educational Attainment | Married | Unmarried |
| Less than High School | 3 (100.0%) | 0 (0.0%) |
| High School Diploma | 34 (100.0%) | 0 (0.0%) |
| College or Associate's Degree | 18 (34.6%) | 34 (65.4%) |
| Bachelor's Degree | 131 (91.0%) | 13 (9.0%) |
| Graduate Degree | 176 (83.4%) | 35 (16.6%) |
| Total | 362 (81.5%) | 82 (18.5%) |
Employment Characteristics in White Plains
Employment by Class of Employer in White Plains
Among the 30,536 employed individuals in White Plains, private company employees (19,504 | 63.9%), not-for-profit organizations (3,461 | 11.3%), and local government employees (2,885 | 9.5%) make up the most common classes of employment.
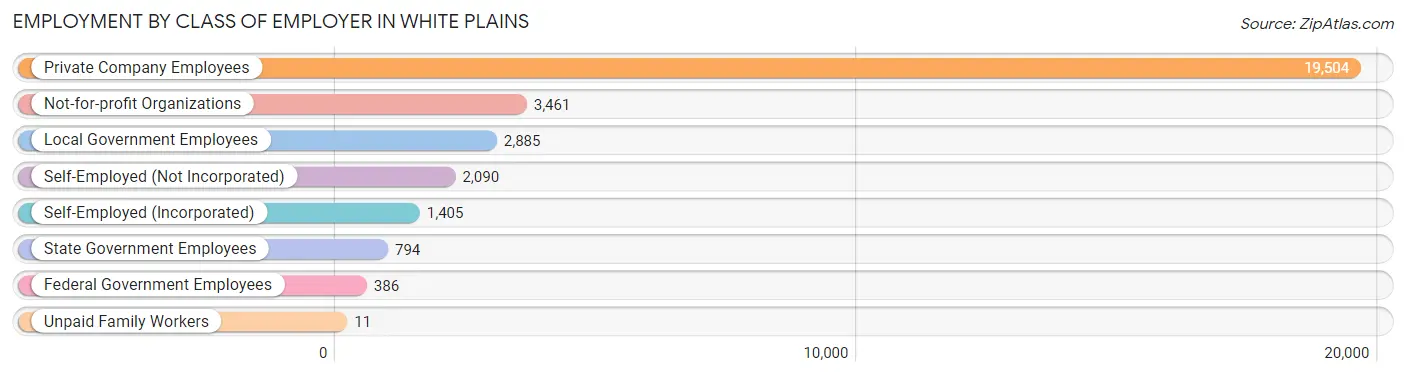
| Employer Class | # Employees | % Employees |
| Private Company Employees | 19,504 | 63.9% |
| Self-Employed (Incorporated) | 1,405 | 4.6% |
| Self-Employed (Not Incorporated) | 2,090 | 6.8% |
| Not-for-profit Organizations | 3,461 | 11.3% |
| Local Government Employees | 2,885 | 9.5% |
| State Government Employees | 794 | 2.6% |
| Federal Government Employees | 386 | 1.3% |
| Unpaid Family Workers | 11 | 0.0% |
| Total | 30,536 | 100.0% |
Employment Status by Age in White Plains
According to the labor force statistics for White Plains, out of the total population over 16 years of age (50,000), 65.5% or 32,750 individuals are in the labor force, with 5.4% or 1,768 of them unemployed. The age group with the highest labor force participation rate is 35 to 44 years, with 88.4% or 6,535 individuals in the labor force. Within the labor force, the 16 to 19 years age range has the highest percentage of unemployed individuals, with 24.8% or 149 of them being unemployed.
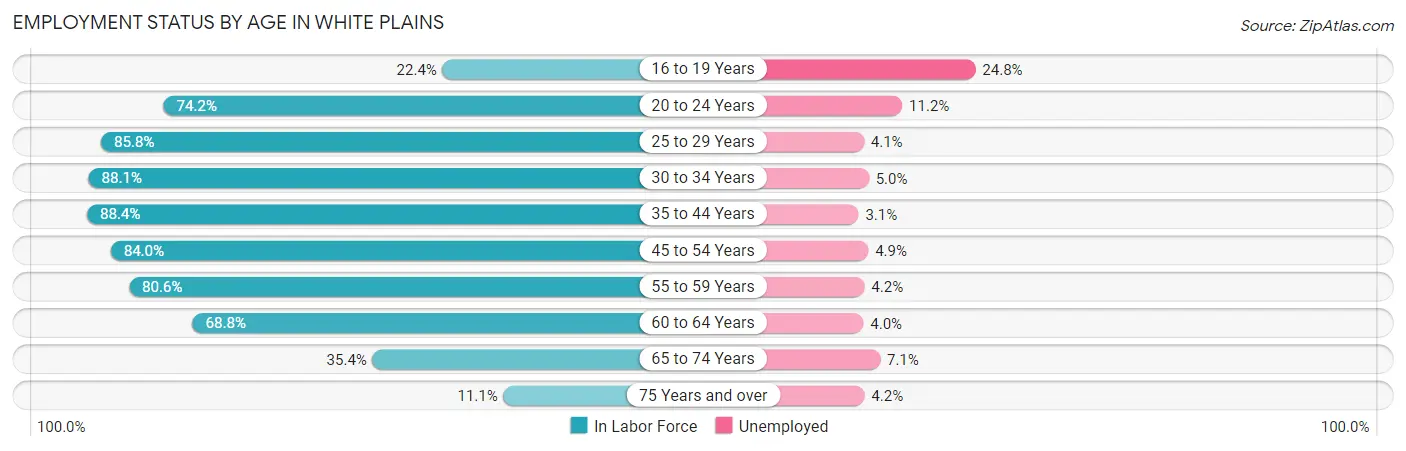
| Age Bracket | In Labor Force | Unemployed |
| 16 to 19 Years | 600 (22.4%) | 149 (24.8%) |
| 20 to 24 Years | 2,750 (74.2%) | 308 (11.2%) |
| 25 to 29 Years | 3,657 (85.8%) | 150 (4.1%) |
| 30 to 34 Years | 4,220 (88.1%) | 211 (5.0%) |
| 35 to 44 Years | 6,535 (88.4%) | 203 (3.1%) |
| 45 to 54 Years | 5,900 (84.0%) | 289 (4.9%) |
| 55 to 59 Years | 3,369 (80.6%) | 141 (4.2%) |
| 60 to 64 Years | 2,778 (68.8%) | 111 (4.0%) |
| 65 to 74 Years | 2,376 (35.4%) | 169 (7.1%) |
| 75 Years and over | 579 (11.1%) | 24 (4.2%) |
| Total | 32,750 (65.5%) | 1,768 (5.4%) |
Employment Status by Educational Attainment in White Plains
According to labor force statistics for White Plains, 83.5% of individuals (26,459) out of the total population between 25 and 64 years of age (31,687) are in the labor force, with 4.2% or 1,111 of them being unemployed. The group with the highest labor force participation rate are those with the educational attainment of bachelor's degree or higher, with 90.1% or 15,959 individuals in the labor force. Within the labor force, individuals with college / associate degree education have the highest percentage of unemployment, with 4.7% or 207 of them being unemployed.
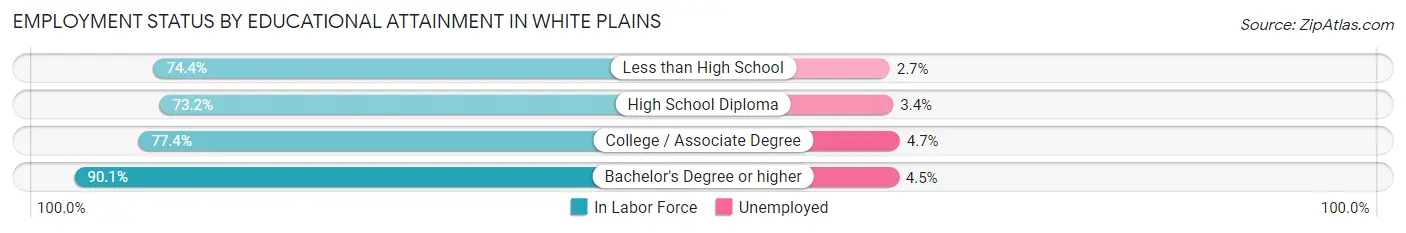
| Educational Attainment | In Labor Force | Unemployed |
| Less than High School | 2,451 (74.4%) | 89 (2.7%) |
| High School Diploma | 3,658 (73.2%) | 170 (3.4%) |
| College / Associate Degree | 4,399 (77.4%) | 267 (4.7%) |
| Bachelor's Degree or higher | 15,959 (90.1%) | 797 (4.5%) |
| Total | 26,459 (83.5%) | 1,331 (4.2%) |
Employment Occupations by Sex in White Plains
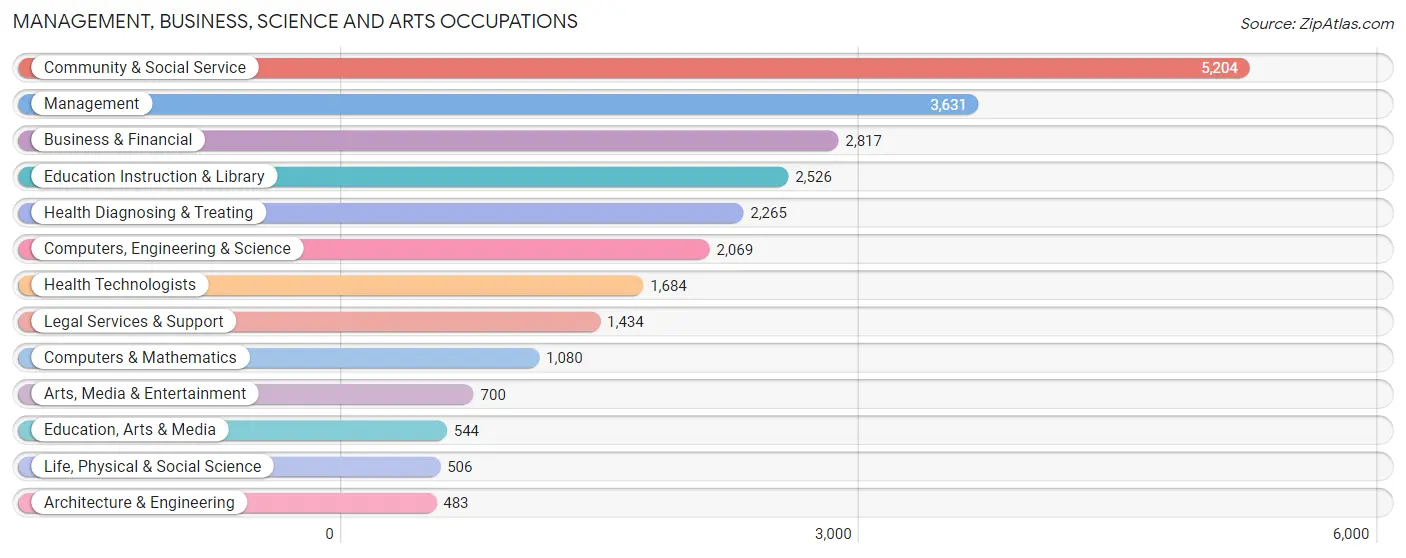
Management, Business, Science and Arts Occupations
The most common Management, Business, Science and Arts occupations in White Plains are Community & Social Service (5,204 | 16.8%), Management (3,631 | 11.7%), Business & Financial (2,817 | 9.1%), Education Instruction & Library (2,526 | 8.2%), and Health Diagnosing & Treating (2,265 | 7.3%).
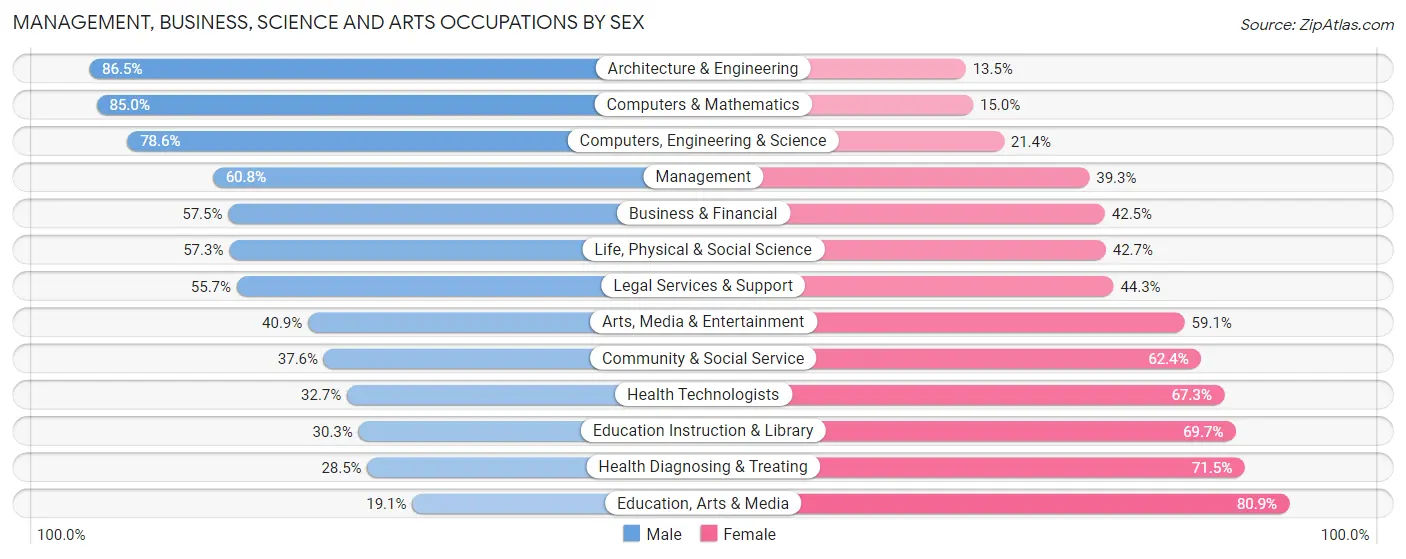
Management, Business, Science and Arts Occupations by Sex
Within the Management, Business, Science and Arts occupations in White Plains, the most male-oriented occupations are Architecture & Engineering (86.5%), Computers & Mathematics (85.0%), and Computers, Engineering & Science (78.6%), while the most female-oriented occupations are Education, Arts & Media (80.9%), Health Diagnosing & Treating (71.5%), and Education Instruction & Library (69.7%).
| Occupation | Male | Female |
| Management | 2,206 (60.8%) | 1,425 (39.3%) |
| Business & Financial | 1,620 (57.5%) | 1,197 (42.5%) |
| Computers, Engineering & Science | 1,626 (78.6%) | 443 (21.4%) |
| Computers & Mathematics | 918 (85.0%) | 162 (15.0%) |
| Architecture & Engineering | 418 (86.5%) | 65 (13.5%) |
| Life, Physical & Social Science | 290 (57.3%) | 216 (42.7%) |
| Community & Social Service | 1,955 (37.6%) | 3,249 (62.4%) |
| Education, Arts & Media | 104 (19.1%) | 440 (80.9%) |
| Legal Services & Support | 799 (55.7%) | 635 (44.3%) |
| Education Instruction & Library | 766 (30.3%) | 1,760 (69.7%) |
| Arts, Media & Entertainment | 286 (40.9%) | 414 (59.1%) |
| Health Diagnosing & Treating | 645 (28.5%) | 1,620 (71.5%) |
| Health Technologists | 551 (32.7%) | 1,133 (67.3%) |
| Total (Category) | 8,052 (50.4%) | 7,934 (49.6%) |
| Total (Overall) | 16,515 (53.3%) | 14,471 (46.7%) |
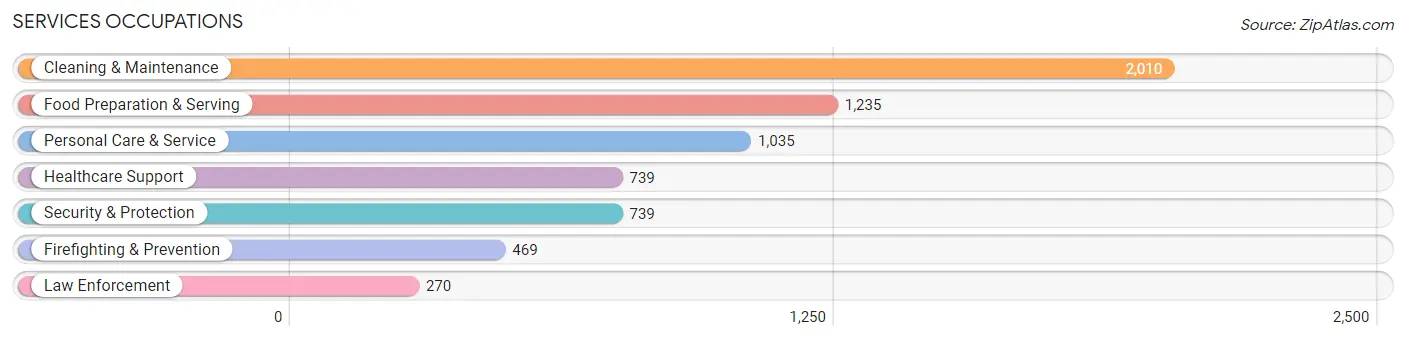
Services Occupations
The most common Services occupations in White Plains are Cleaning & Maintenance (2,010 | 6.5%), Food Preparation & Serving (1,235 | 4.0%), Personal Care & Service (1,035 | 3.3%), Healthcare Support (739 | 2.4%), and Security & Protection (739 | 2.4%).
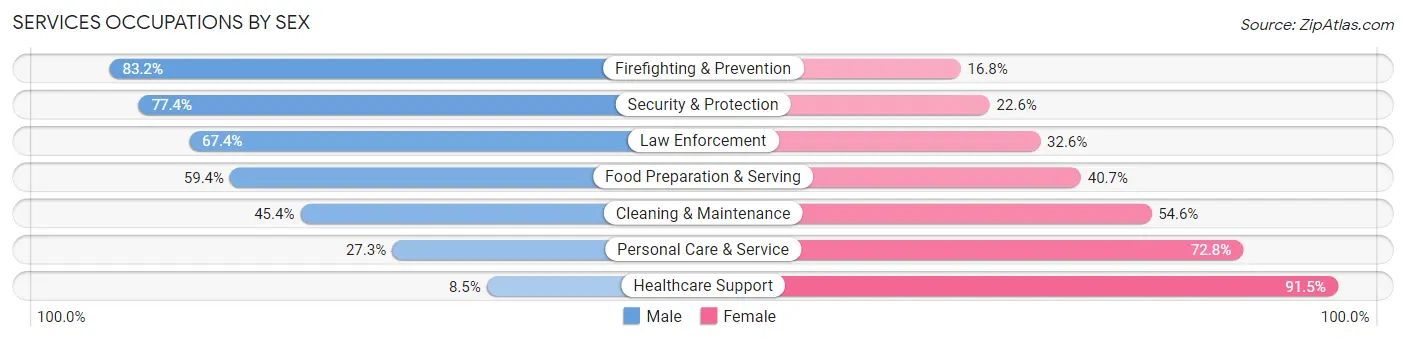
Services Occupations by Sex
Within the Services occupations in White Plains, the most male-oriented occupations are Firefighting & Prevention (83.2%), Security & Protection (77.4%), and Law Enforcement (67.4%), while the most female-oriented occupations are Healthcare Support (91.5%), Personal Care & Service (72.8%), and Cleaning & Maintenance (54.6%).
| Occupation | Male | Female |
| Healthcare Support | 63 (8.5%) | 676 (91.5%) |
| Security & Protection | 572 (77.4%) | 167 (22.6%) |
| Firefighting & Prevention | 390 (83.2%) | 79 (16.8%) |
| Law Enforcement | 182 (67.4%) | 88 (32.6%) |
| Food Preparation & Serving | 733 (59.4%) | 502 (40.6%) |
| Cleaning & Maintenance | 913 (45.4%) | 1,097 (54.6%) |
| Personal Care & Service | 282 (27.3%) | 753 (72.8%) |
| Total (Category) | 2,563 (44.5%) | 3,195 (55.5%) |
| Total (Overall) | 16,515 (53.3%) | 14,471 (46.7%) |
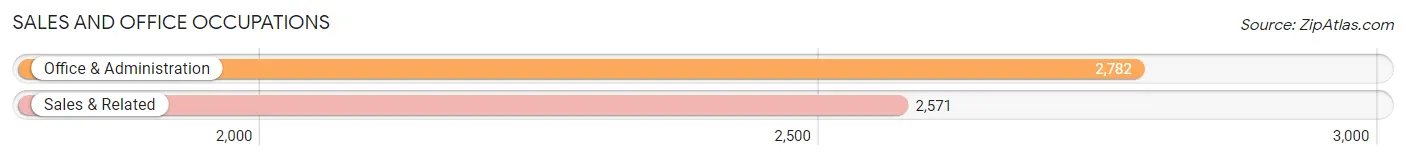
Sales and Office Occupations
The most common Sales and Office occupations in White Plains are Office & Administration (2,782 | 9.0%), and Sales & Related (2,571 | 8.3%).
Sales and Office Occupations by Sex
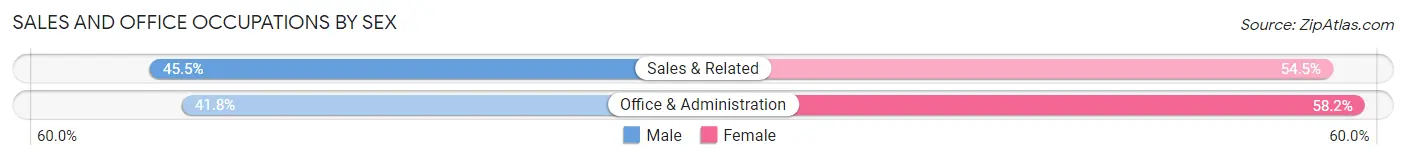
| Occupation | Male | Female |
| Sales & Related | 1,170 (45.5%) | 1,401 (54.5%) |
| Office & Administration | 1,164 (41.8%) | 1,618 (58.2%) |
| Total (Category) | 2,334 (43.6%) | 3,019 (56.4%) |
| Total (Overall) | 16,515 (53.3%) | 14,471 (46.7%) |
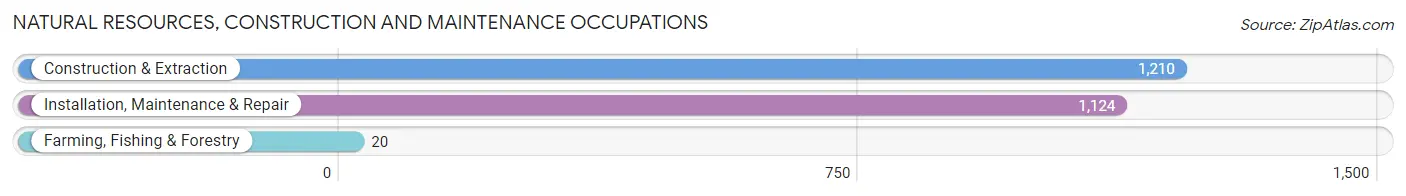
Natural Resources, Construction and Maintenance Occupations
The most common Natural Resources, Construction and Maintenance occupations in White Plains are Construction & Extraction (1,210 | 3.9%), Installation, Maintenance & Repair (1,124 | 3.6%), and Farming, Fishing & Forestry (20 | 0.1%).
Natural Resources, Construction and Maintenance Occupations by Sex
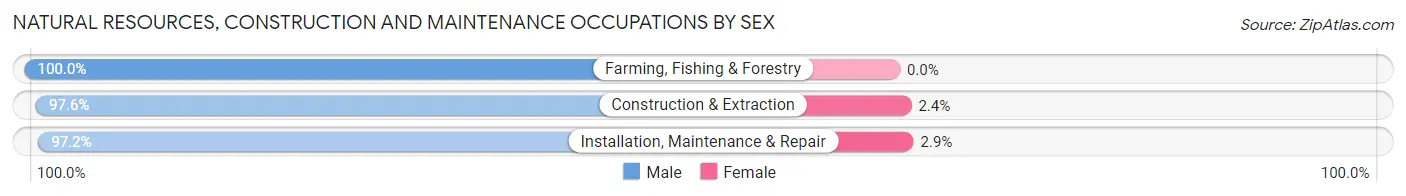
| Occupation | Male | Female |
| Farming, Fishing & Forestry | 20 (100.0%) | 0 (0.0%) |
| Construction & Extraction | 1,181 (97.6%) | 29 (2.4%) |
| Installation, Maintenance & Repair | 1,092 (97.2%) | 32 (2.9%) |
| Total (Category) | 2,293 (97.4%) | 61 (2.6%) |
| Total (Overall) | 16,515 (53.3%) | 14,471 (46.7%) |
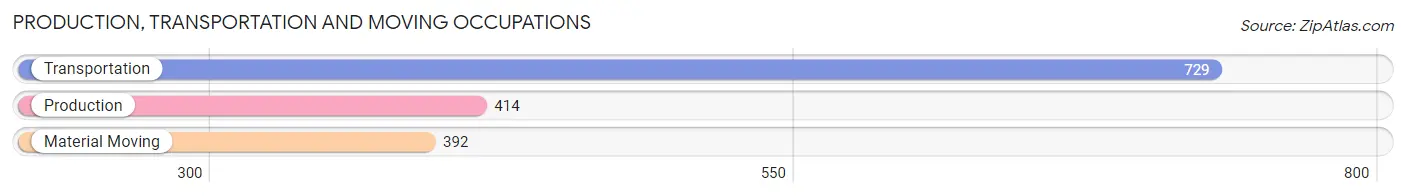
Production, Transportation and Moving Occupations
The most common Production, Transportation and Moving occupations in White Plains are Transportation (729 | 2.4%), Production (414 | 1.3%), and Material Moving (392 | 1.3%).
Production, Transportation and Moving Occupations by Sex
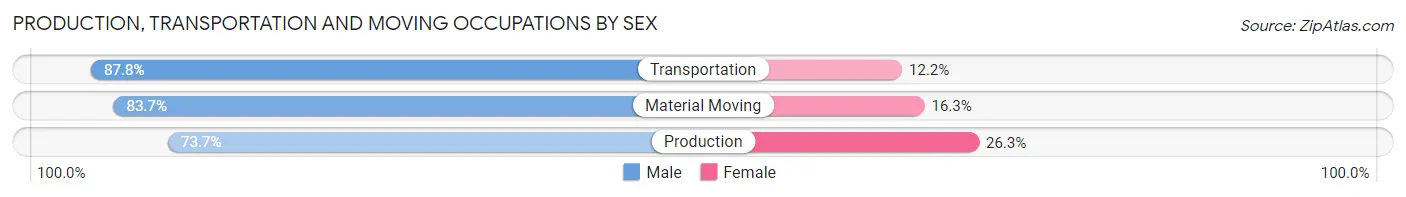
| Occupation | Male | Female |
| Production | 305 (73.7%) | 109 (26.3%) |
| Transportation | 640 (87.8%) | 89 (12.2%) |
| Material Moving | 328 (83.7%) | 64 (16.3%) |
| Total (Category) | 1,273 (82.9%) | 262 (17.1%) |
| Total (Overall) | 16,515 (53.3%) | 14,471 (46.7%) |
Employment Industries by Sex in White Plains
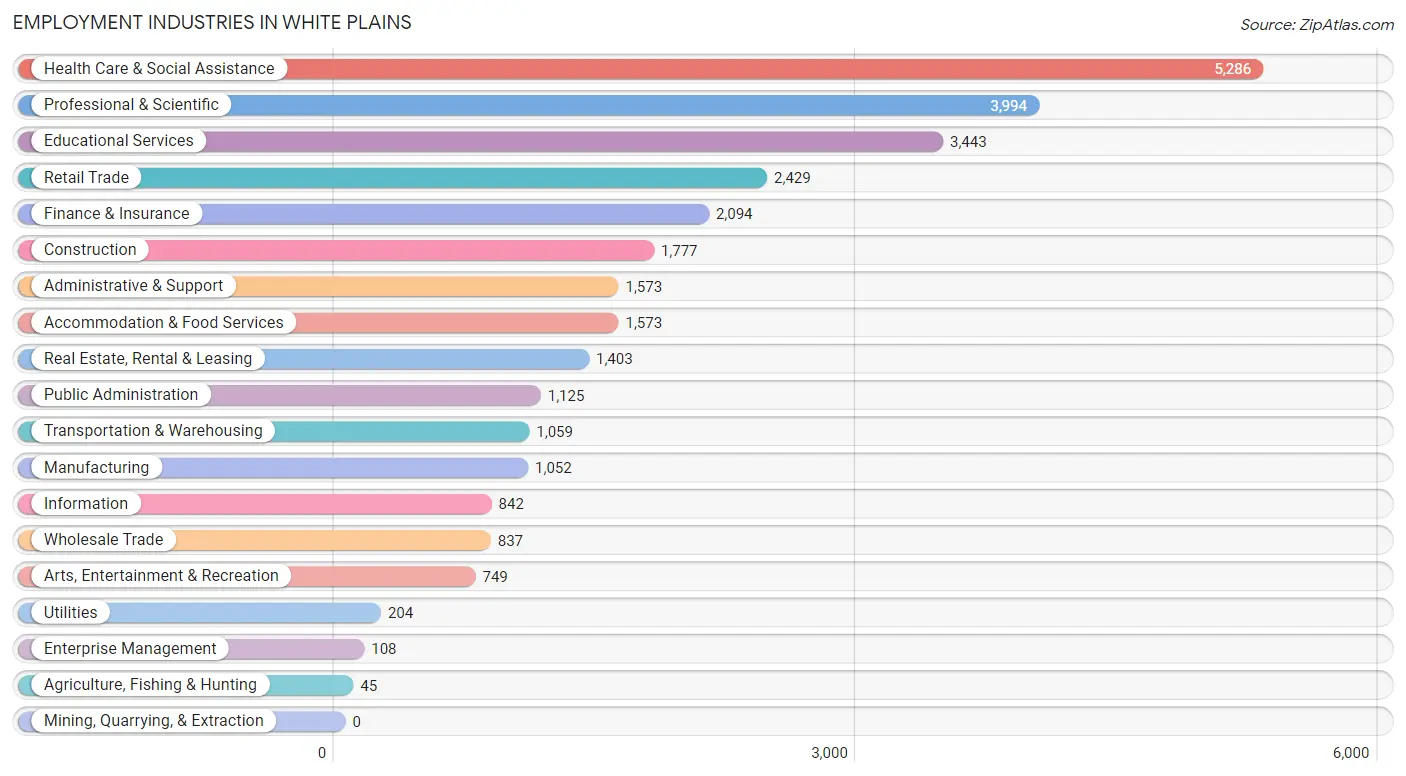
Employment Industries in White Plains
The major employment industries in White Plains include Health Care & Social Assistance (5,286 | 17.1%), Professional & Scientific (3,994 | 12.9%), Educational Services (3,443 | 11.1%), Retail Trade (2,429 | 7.8%), and Finance & Insurance (2,094 | 6.8%).
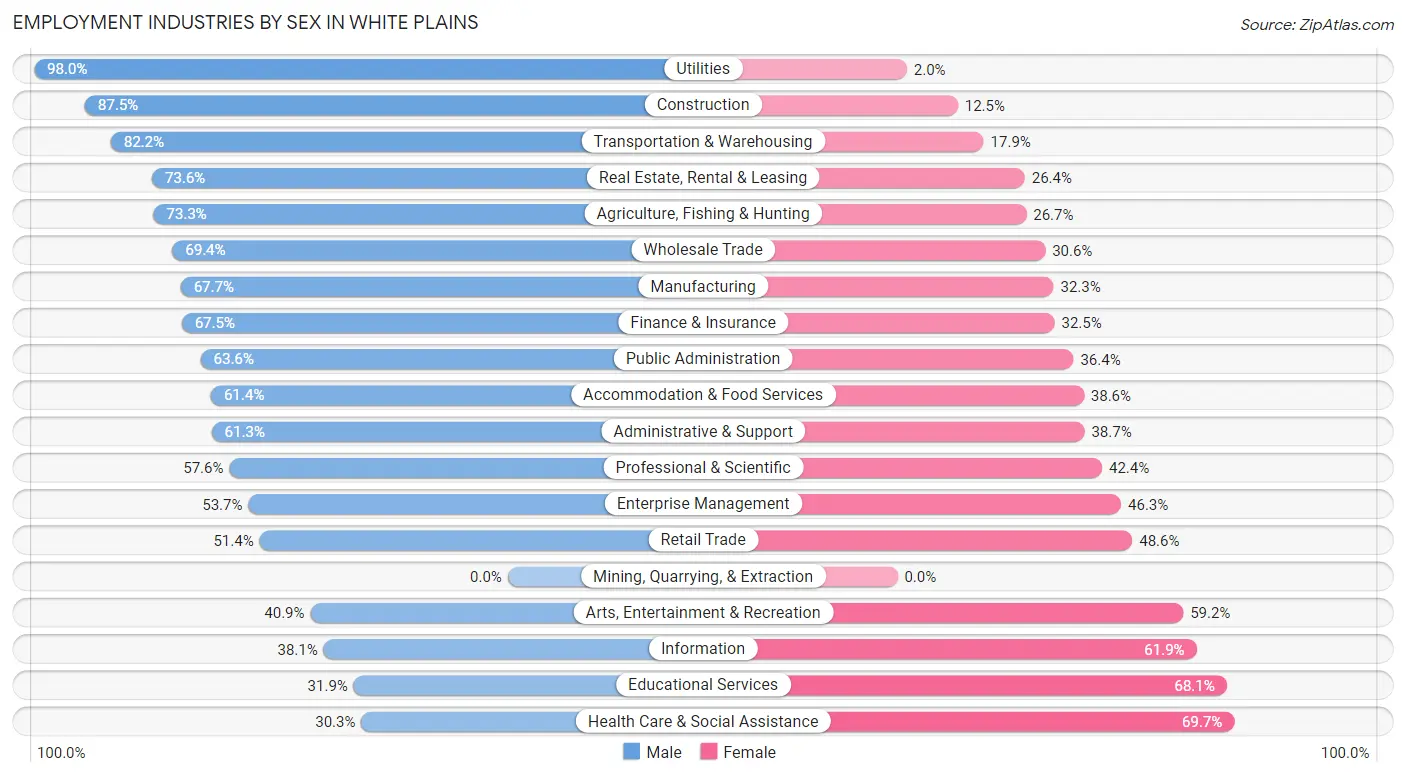
Employment Industries by Sex in White Plains
The White Plains industries that see more men than women are Utilities (98.0%), Construction (87.5%), and Transportation & Warehousing (82.2%), whereas the industries that tend to have a higher number of women are Health Care & Social Assistance (69.7%), Educational Services (68.1%), and Information (61.9%).
| Industry | Male | Female |
| Agriculture, Fishing & Hunting | 33 (73.3%) | 12 (26.7%) |
| Mining, Quarrying, & Extraction | 0 (0.0%) | 0 (0.0%) |
| Construction | 1,555 (87.5%) | 222 (12.5%) |
| Manufacturing | 712 (67.7%) | 340 (32.3%) |
| Wholesale Trade | 581 (69.4%) | 256 (30.6%) |
| Retail Trade | 1,248 (51.4%) | 1,181 (48.6%) |
| Transportation & Warehousing | 870 (82.2%) | 189 (17.8%) |
| Utilities | 200 (98.0%) | 4 (2.0%) |
| Information | 321 (38.1%) | 521 (61.9%) |
| Finance & Insurance | 1,413 (67.5%) | 681 (32.5%) |
| Real Estate, Rental & Leasing | 1,033 (73.6%) | 370 (26.4%) |
| Professional & Scientific | 2,302 (57.6%) | 1,692 (42.4%) |
| Enterprise Management | 58 (53.7%) | 50 (46.3%) |
| Administrative & Support | 964 (61.3%) | 609 (38.7%) |
| Educational Services | 1,098 (31.9%) | 2,345 (68.1%) |
| Health Care & Social Assistance | 1,602 (30.3%) | 3,684 (69.7%) |
| Arts, Entertainment & Recreation | 306 (40.8%) | 443 (59.2%) |
| Accommodation & Food Services | 966 (61.4%) | 607 (38.6%) |
| Public Administration | 715 (63.6%) | 410 (36.4%) |
| Total | 16,515 (53.3%) | 14,471 (46.7%) |
Education in White Plains
School Enrollment in White Plains
The most common levels of schooling among the 12,842 students in White Plains are high school (2,958 | 23.0%), college / undergraduate (2,926 | 22.8%), and elementary school (2,652 | 20.6%).
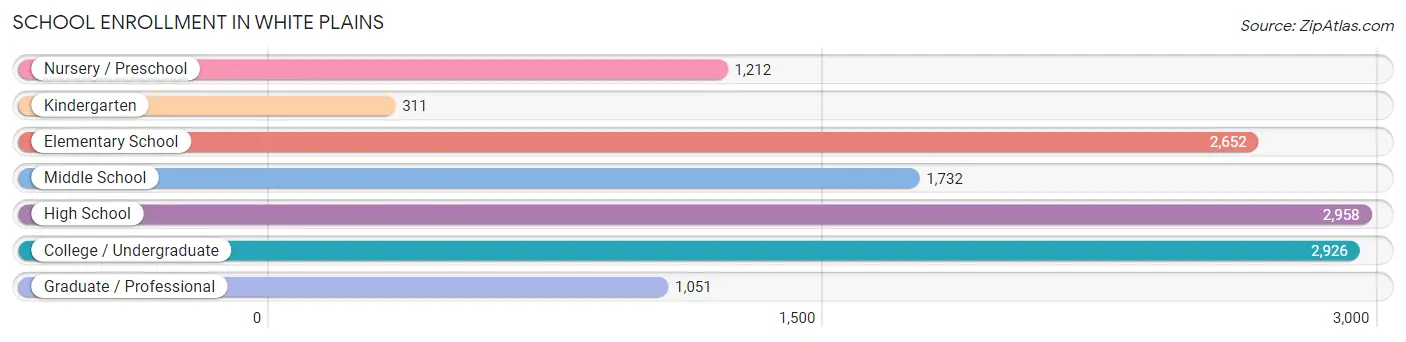
| School Level | # Students | % Students |
| Nursery / Preschool | 1,212 | 9.4% |
| Kindergarten | 311 | 2.4% |
| Elementary School | 2,652 | 20.6% |
| Middle School | 1,732 | 13.5% |
| High School | 2,958 | 23.0% |
| College / Undergraduate | 2,926 | 22.8% |
| Graduate / Professional | 1,051 | 8.2% |
| Total | 12,842 | 100.0% |
School Enrollment by Age by Funding Source in White Plains
Out of a total of 12,842 students who are enrolled in schools in White Plains, 3,904 (30.4%) attend a private institution, while the remaining 8,938 (69.6%) are enrolled in public schools. The age group of 25 to 34 year olds has the highest likelihood of being enrolled in private schools, with 636 (56.8% in the age bracket) enrolled. Conversely, the age group of 15 to 17 year olds has the lowest likelihood of being enrolled in a private school, with 1,742 (84.0% in the age bracket) attending a public institution.
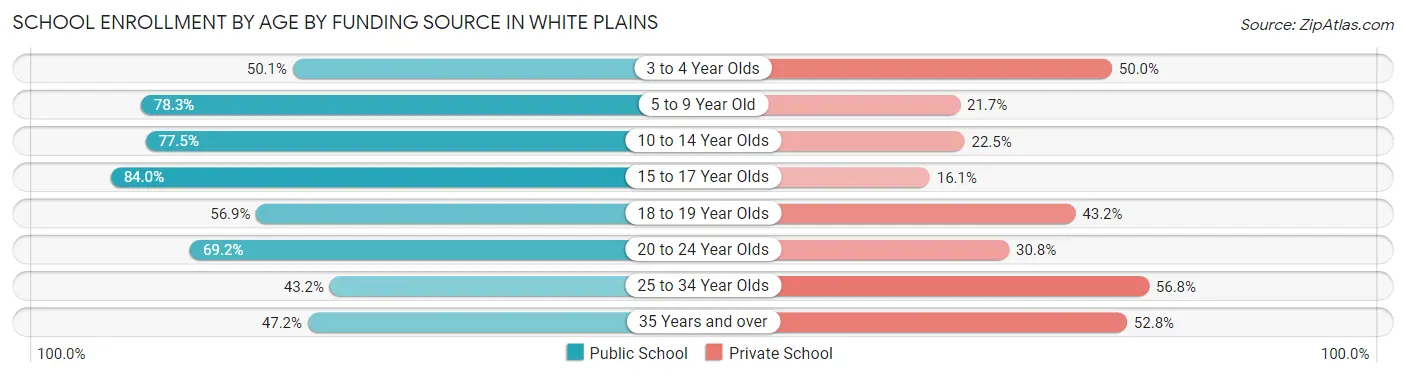
| Age Bracket | Public School | Private School |
| 3 to 4 Year Olds | 504 (50.0%) | 503 (49.9%) |
| 5 to 9 Year Old | 2,375 (78.3%) | 657 (21.7%) |
| 10 to 14 Year Olds | 1,927 (77.5%) | 560 (22.5%) |
| 15 to 17 Year Olds | 1,742 (84.0%) | 333 (16.1%) |
| 18 to 19 Year Olds | 685 (56.9%) | 520 (43.1%) |
| 20 to 24 Year Olds | 1,013 (69.2%) | 451 (30.8%) |
| 25 to 34 Year Olds | 483 (43.2%) | 636 (56.8%) |
| 35 Years and over | 214 (47.2%) | 239 (52.8%) |
| Total | 8,938 (69.6%) | 3,904 (30.4%) |
Educational Attainment by Field of Study in White Plains
Business (4,916 | 19.8%), social sciences (3,215 | 12.9%), education (2,129 | 8.6%), science & technology (1,648 | 6.6%), and engineering (1,634 | 6.6%) are the most common fields of study among 24,887 individuals in White Plains who have obtained a bachelor's degree or higher.
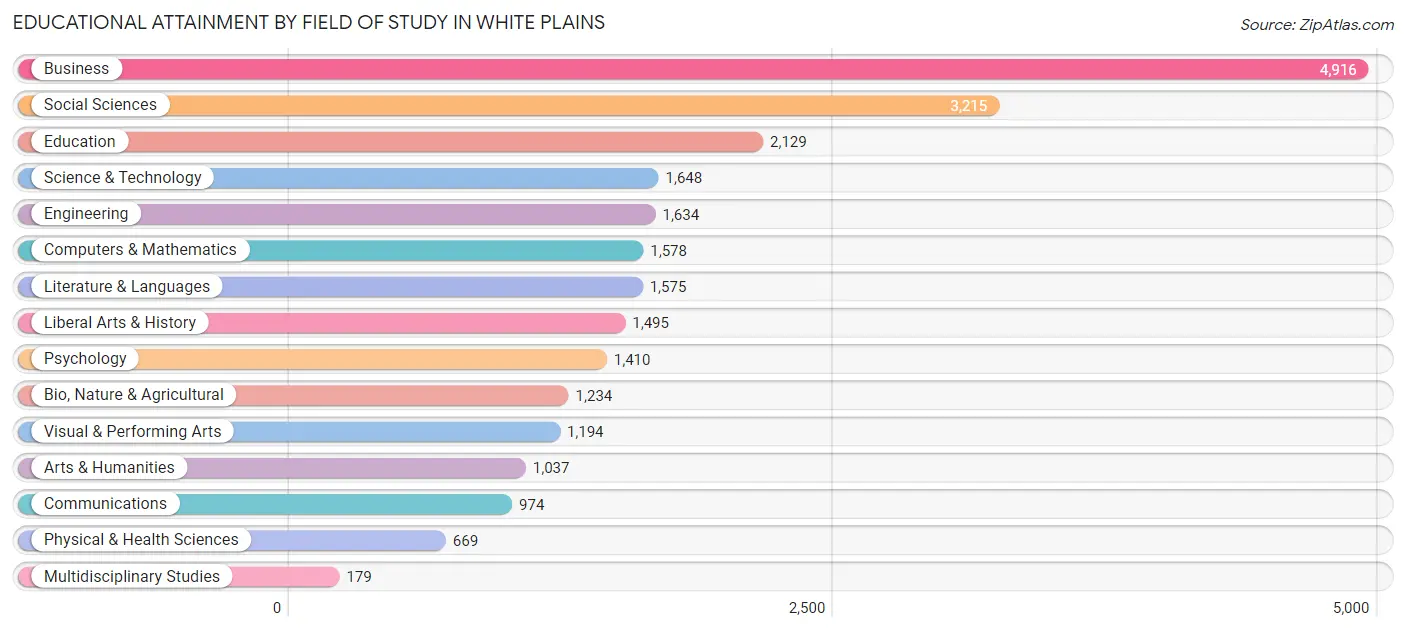
| Field of Study | # Graduates | % Graduates |
| Computers & Mathematics | 1,578 | 6.3% |
| Bio, Nature & Agricultural | 1,234 | 5.0% |
| Physical & Health Sciences | 669 | 2.7% |
| Psychology | 1,410 | 5.7% |
| Social Sciences | 3,215 | 12.9% |
| Engineering | 1,634 | 6.6% |
| Multidisciplinary Studies | 179 | 0.7% |
| Science & Technology | 1,648 | 6.6% |
| Business | 4,916 | 19.8% |
| Education | 2,129 | 8.6% |
| Literature & Languages | 1,575 | 6.3% |
| Liberal Arts & History | 1,495 | 6.0% |
| Visual & Performing Arts | 1,194 | 4.8% |
| Communications | 974 | 3.9% |
| Arts & Humanities | 1,037 | 4.2% |
| Total | 24,887 | 100.0% |
Transportation & Commute in White Plains
Vehicle Availability by Sex in White Plains
The most prevalent vehicle ownership categories in White Plains are males with 2 vehicles (6,440, accounting for 39.5%) and females with 2 vehicles (4,711, making up 45.9%).
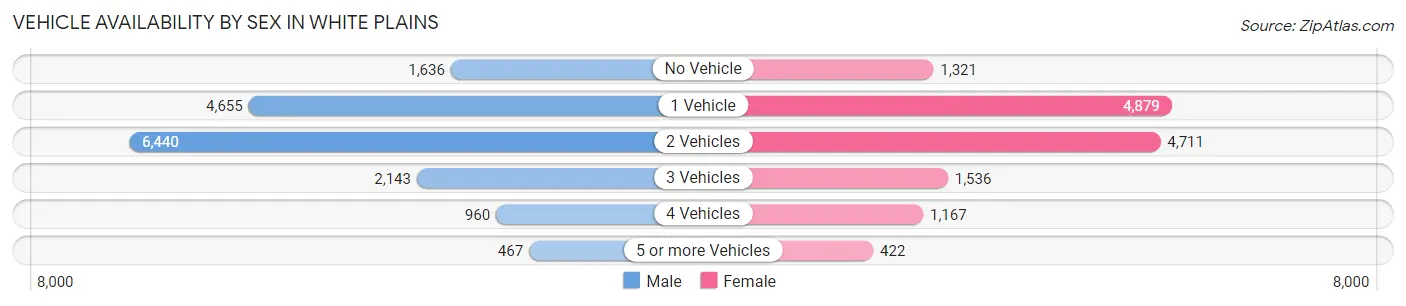
| Vehicles Available | Male | Female |
| No Vehicle | 1,636 (10.0%) | 1,321 (9.4%) |
| 1 Vehicle | 4,655 (28.6%) | 4,879 (34.8%) |
| 2 Vehicles | 6,440 (39.5%) | 4,711 (33.6%) |
| 3 Vehicles | 2,143 (13.2%) | 1,536 (10.9%) |
| 4 Vehicles | 960 (5.9%) | 1,167 (8.3%) |
| 5 or more Vehicles | 467 (2.9%) | 422 (3.0%) |
| Total | 16,301 (100.0%) | 14,036 (100.0%) |
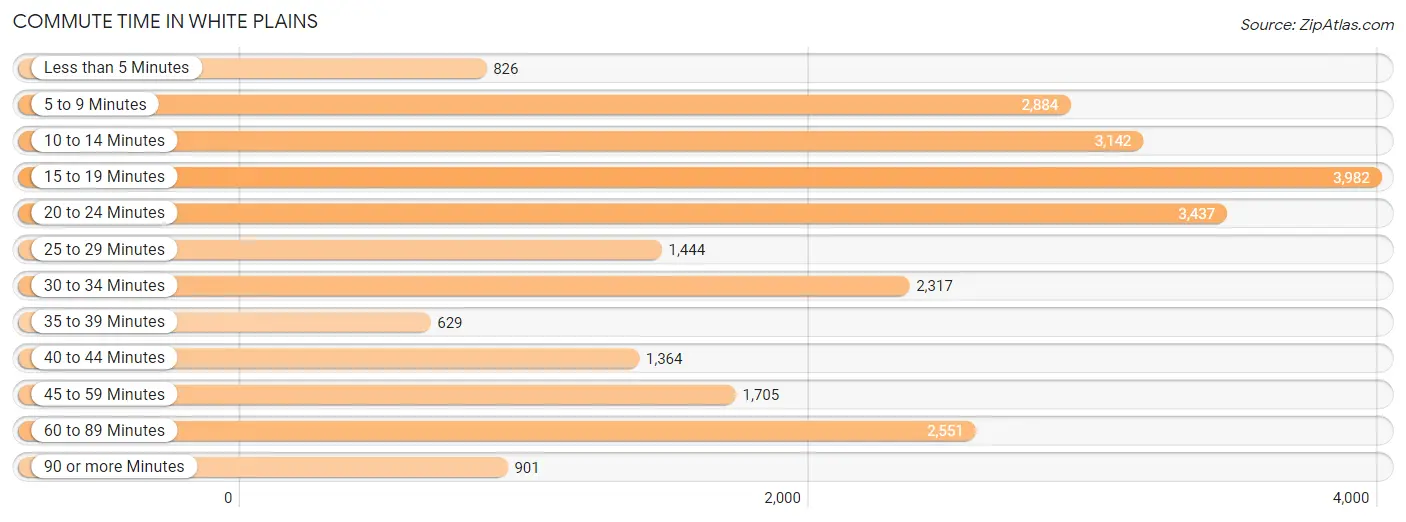
Commute Time in White Plains
The most frequently occuring commute durations in White Plains are 15 to 19 minutes (3,982 commuters, 15.8%), 20 to 24 minutes (3,437 commuters, 13.7%), and 10 to 14 minutes (3,142 commuters, 12.5%).
| Commute Time | # Commuters | % Commuters |
| Less than 5 Minutes | 826 | 3.3% |
| 5 to 9 Minutes | 2,884 | 11.5% |
| 10 to 14 Minutes | 3,142 | 12.5% |
| 15 to 19 Minutes | 3,982 | 15.8% |
| 20 to 24 Minutes | 3,437 | 13.7% |
| 25 to 29 Minutes | 1,444 | 5.7% |
| 30 to 34 Minutes | 2,317 | 9.2% |
| 35 to 39 Minutes | 629 | 2.5% |
| 40 to 44 Minutes | 1,364 | 5.4% |
| 45 to 59 Minutes | 1,705 | 6.8% |
| 60 to 89 Minutes | 2,551 | 10.1% |
| 90 or more Minutes | 901 | 3.6% |
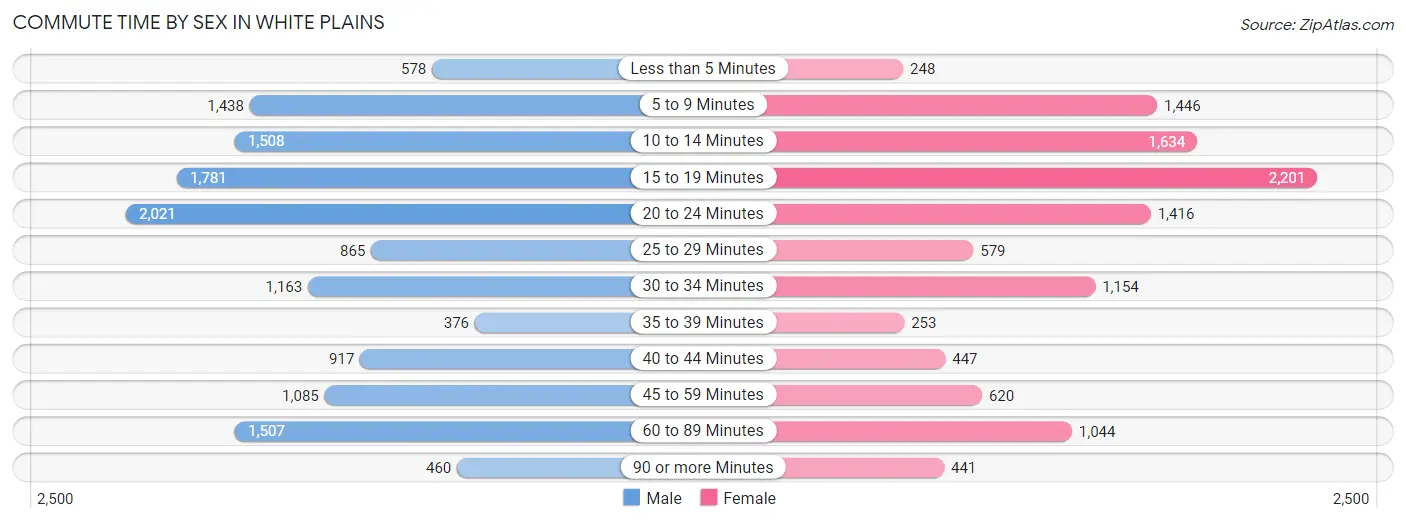
Commute Time by Sex in White Plains
The most common commute times in White Plains are 20 to 24 minutes (2,021 commuters, 14.7%) for males and 15 to 19 minutes (2,201 commuters, 19.2%) for females.
| Commute Time | Male | Female |
| Less than 5 Minutes | 578 (4.2%) | 248 (2.2%) |
| 5 to 9 Minutes | 1,438 (10.5%) | 1,446 (12.6%) |
| 10 to 14 Minutes | 1,508 (11.0%) | 1,634 (14.2%) |
| 15 to 19 Minutes | 1,781 (13.0%) | 2,201 (19.2%) |
| 20 to 24 Minutes | 2,021 (14.7%) | 1,416 (12.3%) |
| 25 to 29 Minutes | 865 (6.3%) | 579 (5.0%) |
| 30 to 34 Minutes | 1,163 (8.5%) | 1,154 (10.1%) |
| 35 to 39 Minutes | 376 (2.7%) | 253 (2.2%) |
| 40 to 44 Minutes | 917 (6.7%) | 447 (3.9%) |
| 45 to 59 Minutes | 1,085 (7.9%) | 620 (5.4%) |
| 60 to 89 Minutes | 1,507 (11.0%) | 1,044 (9.1%) |
| 90 or more Minutes | 460 (3.4%) | 441 (3.8%) |
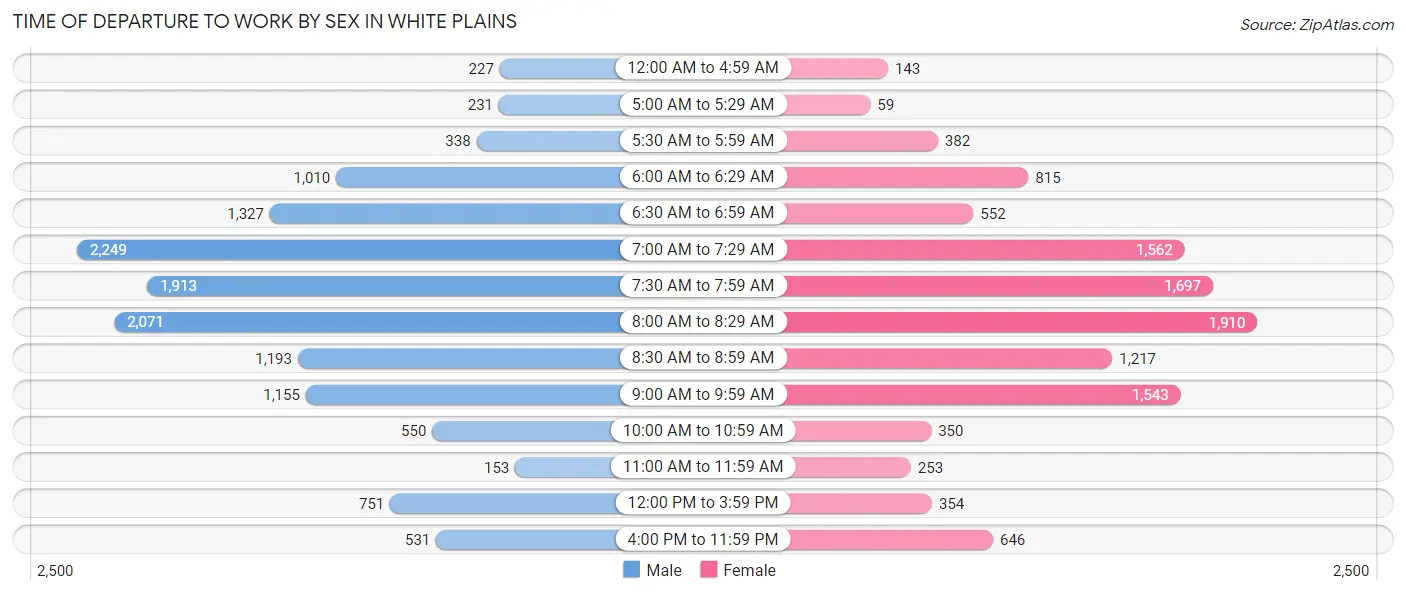
Time of Departure to Work by Sex in White Plains
The most frequent times of departure to work in White Plains are 7:00 AM to 7:29 AM (2,249, 16.4%) for males and 8:00 AM to 8:29 AM (1,910, 16.6%) for females.
| Time of Departure | Male | Female |
| 12:00 AM to 4:59 AM | 227 (1.7%) | 143 (1.3%) |
| 5:00 AM to 5:29 AM | 231 (1.7%) | 59 (0.5%) |
| 5:30 AM to 5:59 AM | 338 (2.5%) | 382 (3.3%) |
| 6:00 AM to 6:29 AM | 1,010 (7.4%) | 815 (7.1%) |
| 6:30 AM to 6:59 AM | 1,327 (9.7%) | 552 (4.8%) |
| 7:00 AM to 7:29 AM | 2,249 (16.4%) | 1,562 (13.6%) |
| 7:30 AM to 7:59 AM | 1,913 (14.0%) | 1,697 (14.8%) |
| 8:00 AM to 8:29 AM | 2,071 (15.1%) | 1,910 (16.6%) |
| 8:30 AM to 8:59 AM | 1,193 (8.7%) | 1,217 (10.6%) |
| 9:00 AM to 9:59 AM | 1,155 (8.4%) | 1,543 (13.4%) |
| 10:00 AM to 10:59 AM | 550 (4.0%) | 350 (3.0%) |
| 11:00 AM to 11:59 AM | 153 (1.1%) | 253 (2.2%) |
| 12:00 PM to 3:59 PM | 751 (5.5%) | 354 (3.1%) |
| 4:00 PM to 11:59 PM | 531 (3.9%) | 646 (5.6%) |
| Total | 13,699 (100.0%) | 11,483 (100.0%) |
Housing Occupancy in White Plains
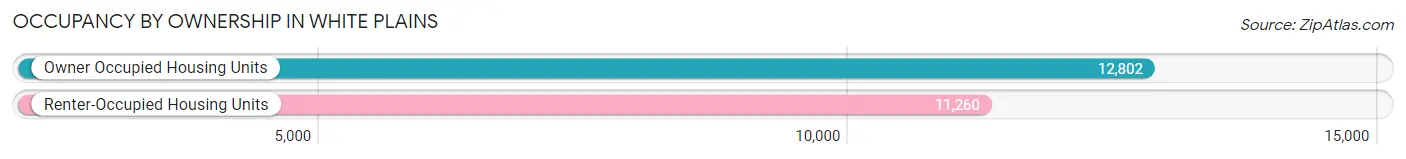
Occupancy by Ownership in White Plains
Of the total 24,062 dwellings in White Plains, owner-occupied units account for 12,802 (53.2%), while renter-occupied units make up 11,260 (46.8%).
| Occupancy | # Housing Units | % Housing Units |
| Owner Occupied Housing Units | 12,802 | 53.2% |
| Renter-Occupied Housing Units | 11,260 | 46.8% |
| Total Occupied Housing Units | 24,062 | 100.0% |
Occupancy by Household Size in White Plains
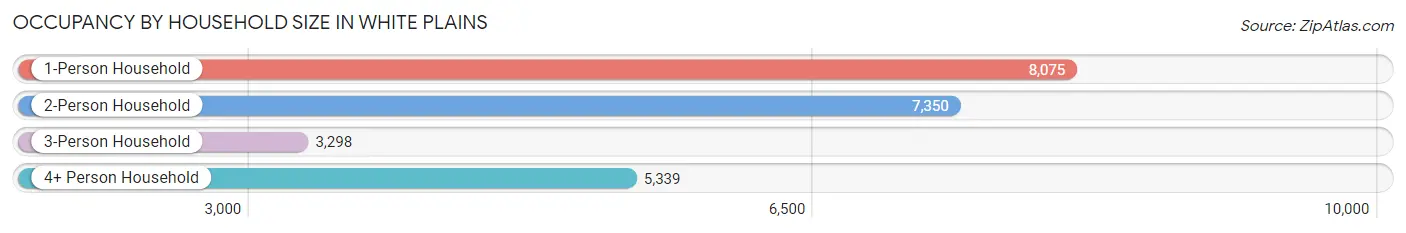
| Household Size | # Housing Units | % Housing Units |
| 1-Person Household | 8,075 | 33.6% |
| 2-Person Household | 7,350 | 30.5% |
| 3-Person Household | 3,298 | 13.7% |
| 4+ Person Household | 5,339 | 22.2% |
| Total Housing Units | 24,062 | 100.0% |
Occupancy by Ownership by Household Size in White Plains
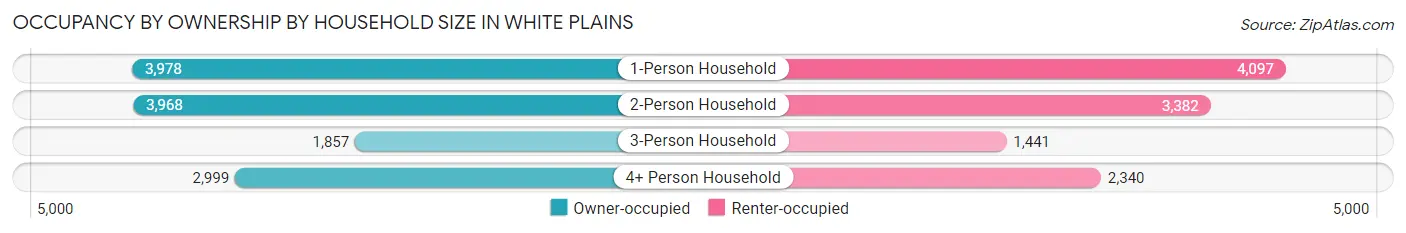
| Household Size | Owner-occupied | Renter-occupied |
| 1-Person Household | 3,978 (49.3%) | 4,097 (50.7%) |
| 2-Person Household | 3,968 (54.0%) | 3,382 (46.0%) |
| 3-Person Household | 1,857 (56.3%) | 1,441 (43.7%) |
| 4+ Person Household | 2,999 (56.2%) | 2,340 (43.8%) |
| Total Housing Units | 12,802 (53.2%) | 11,260 (46.8%) |
Occupancy by Educational Attainment in White Plains
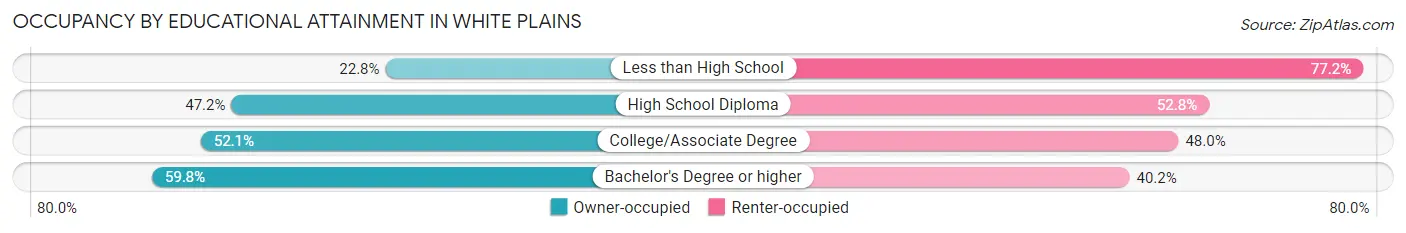
| Household Size | Owner-occupied | Renter-occupied |
| Less than High School | 493 (22.8%) | 1,671 (77.2%) |
| High School Diploma | 1,623 (47.2%) | 1,814 (52.8%) |
| College/Associate Degree | 2,388 (52.0%) | 2,200 (47.9%) |
| Bachelor's Degree or higher | 8,298 (59.8%) | 5,575 (40.2%) |
Occupancy by Age of Householder in White Plains
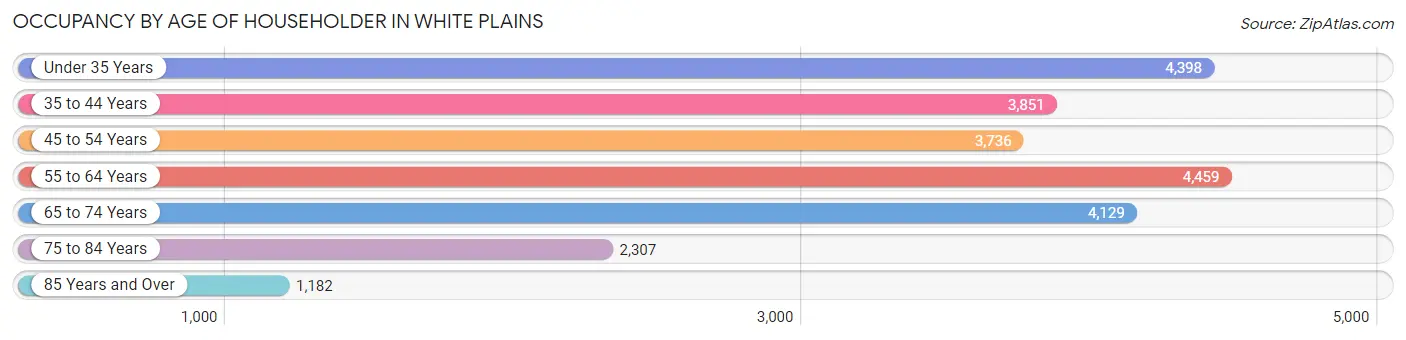
| Age Bracket | # Households | % Households |
| Under 35 Years | 4,398 | 18.3% |
| 35 to 44 Years | 3,851 | 16.0% |
| 45 to 54 Years | 3,736 | 15.5% |
| 55 to 64 Years | 4,459 | 18.5% |
| 65 to 74 Years | 4,129 | 17.2% |
| 75 to 84 Years | 2,307 | 9.6% |
| 85 Years and Over | 1,182 | 4.9% |
| Total | 24,062 | 100.0% |
Housing Finances in White Plains
Median Income by Occupancy in White Plains
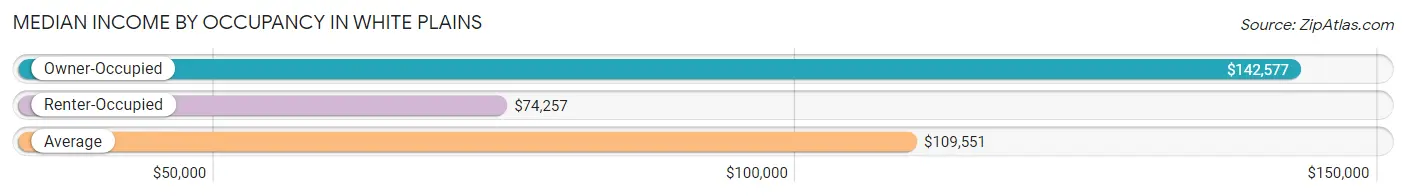
| Occupancy Type | # Households | Median Income |
| Owner-Occupied | 12,802 (53.2%) | $142,577 |
| Renter-Occupied | 11,260 (46.8%) | $74,257 |
| Average | 24,062 (100.0%) | $109,551 |
Occupancy by Householder Income Bracket in White Plains
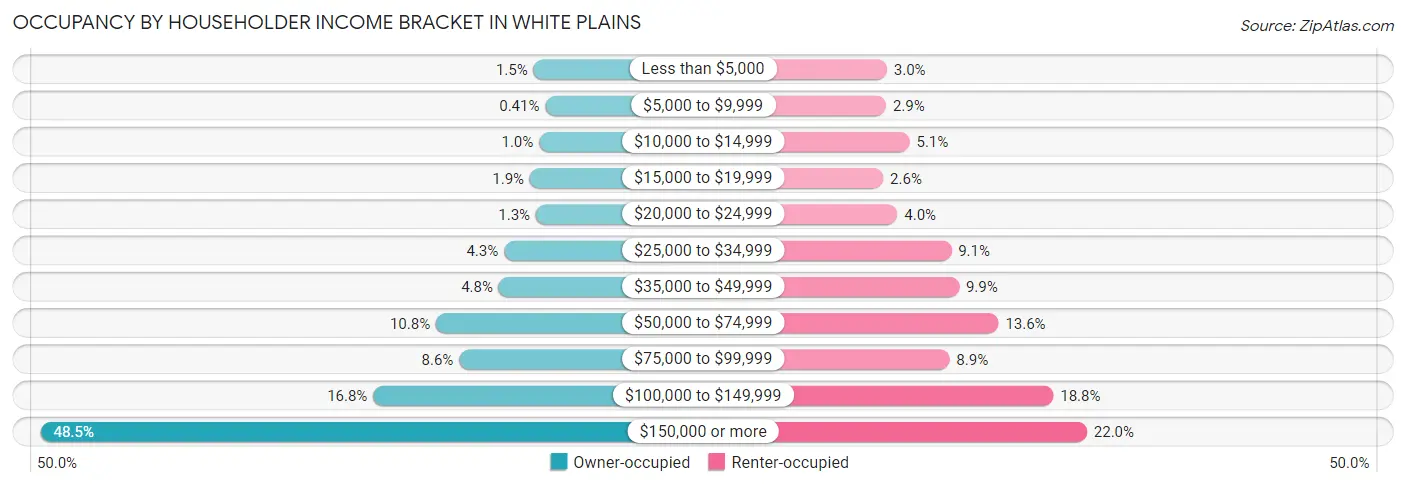
| Income Bracket | Owner-occupied | Renter-occupied |
| Less than $5,000 | 196 (1.5%) | 335 (3.0%) |
| $5,000 to $9,999 | 52 (0.4%) | 327 (2.9%) |
| $10,000 to $14,999 | 128 (1.0%) | 579 (5.1%) |
| $15,000 to $19,999 | 239 (1.9%) | 296 (2.6%) |
| $20,000 to $24,999 | 167 (1.3%) | 448 (4.0%) |
| $25,000 to $34,999 | 555 (4.3%) | 1,026 (9.1%) |
| $35,000 to $49,999 | 620 (4.8%) | 1,109 (9.9%) |
| $50,000 to $74,999 | 1,385 (10.8%) | 1,532 (13.6%) |
| $75,000 to $99,999 | 1,102 (8.6%) | 1,007 (8.9%) |
| $100,000 to $149,999 | 2,151 (16.8%) | 2,120 (18.8%) |
| $150,000 or more | 6,207 (48.5%) | 2,481 (22.0%) |
| Total | 12,802 (100.0%) | 11,260 (100.0%) |
Monthly Housing Cost Tiers in White Plains
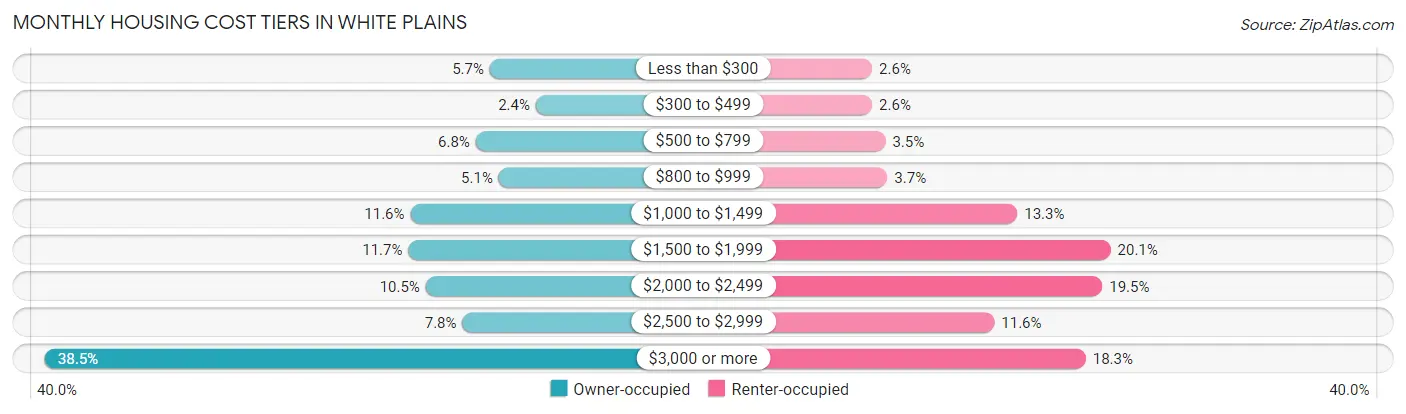
| Monthly Cost | Owner-occupied | Renter-occupied |
| Less than $300 | 735 (5.7%) | 288 (2.6%) |
| $300 to $499 | 301 (2.4%) | 288 (2.6%) |
| $500 to $799 | 868 (6.8%) | 399 (3.5%) |
| $800 to $999 | 650 (5.1%) | 414 (3.7%) |
| $1,000 to $1,499 | 1,484 (11.6%) | 1,492 (13.3%) |
| $1,500 to $1,999 | 1,503 (11.7%) | 2,266 (20.1%) |
| $2,000 to $2,499 | 1,339 (10.5%) | 2,197 (19.5%) |
| $2,500 to $2,999 | 993 (7.8%) | 1,302 (11.6%) |
| $3,000 or more | 4,929 (38.5%) | 2,059 (18.3%) |
| Total | 12,802 (100.0%) | 11,260 (100.0%) |
Physical Housing Characteristics in White Plains
Housing Structures in White Plains
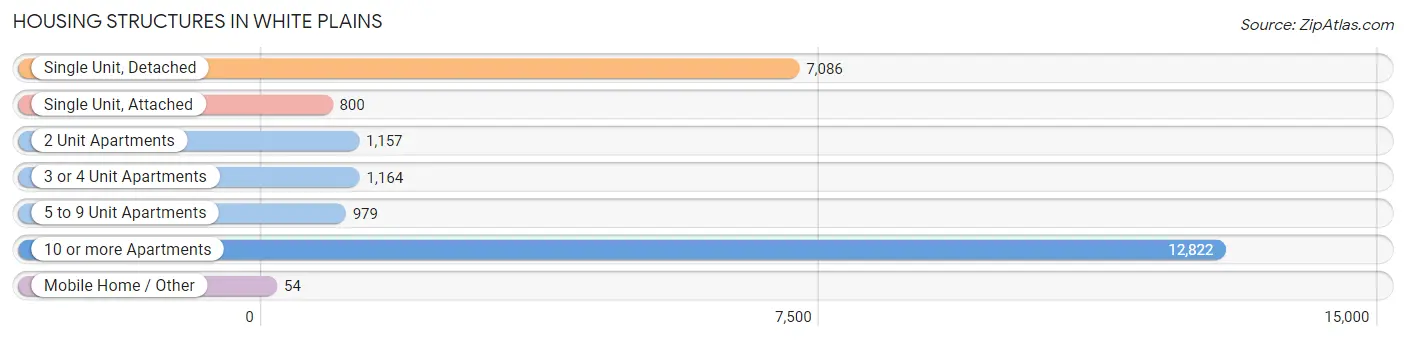
| Structure Type | # Housing Units | % Housing Units |
| Single Unit, Detached | 7,086 | 29.4% |
| Single Unit, Attached | 800 | 3.3% |
| 2 Unit Apartments | 1,157 | 4.8% |
| 3 or 4 Unit Apartments | 1,164 | 4.8% |
| 5 to 9 Unit Apartments | 979 | 4.1% |
| 10 or more Apartments | 12,822 | 53.3% |
| Mobile Home / Other | 54 | 0.2% |
| Total | 24,062 | 100.0% |
Housing Structures by Occupancy in White Plains
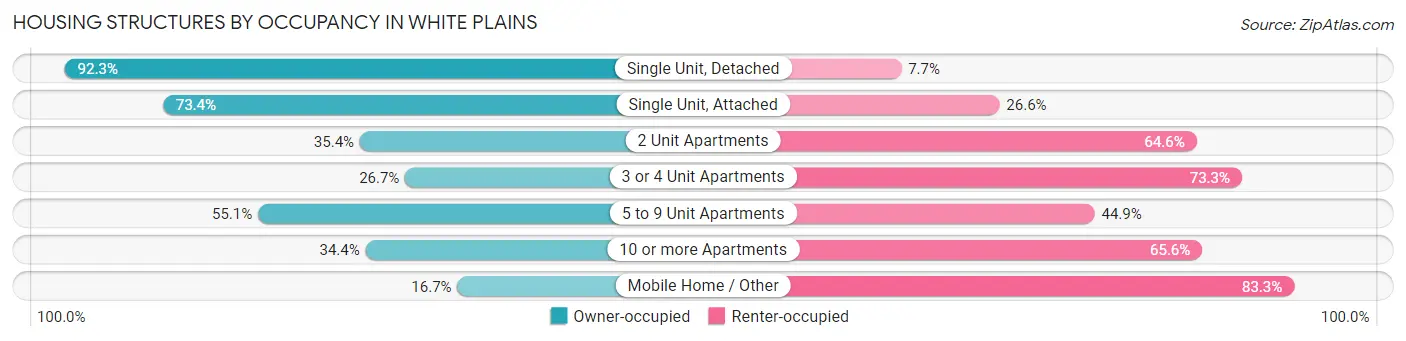
| Structure Type | Owner-occupied | Renter-occupied |
| Single Unit, Detached | 6,540 (92.3%) | 546 (7.7%) |
| Single Unit, Attached | 587 (73.4%) | 213 (26.6%) |
| 2 Unit Apartments | 410 (35.4%) | 747 (64.6%) |
| 3 or 4 Unit Apartments | 311 (26.7%) | 853 (73.3%) |
| 5 to 9 Unit Apartments | 539 (55.1%) | 440 (44.9%) |
| 10 or more Apartments | 4,406 (34.4%) | 8,416 (65.6%) |
| Mobile Home / Other | 9 (16.7%) | 45 (83.3%) |
| Total | 12,802 (53.2%) | 11,260 (46.8%) |
Housing Structures by Number of Rooms in White Plains
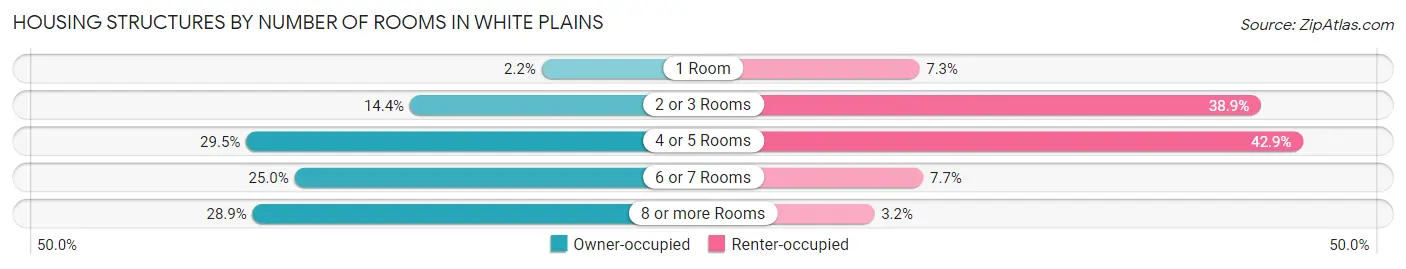
| Number of Rooms | Owner-occupied | Renter-occupied |
| 1 Room | 279 (2.2%) | 827 (7.3%) |
| 2 or 3 Rooms | 1,839 (14.4%) | 4,385 (38.9%) |
| 4 or 5 Rooms | 3,778 (29.5%) | 4,825 (42.8%) |
| 6 or 7 Rooms | 3,204 (25.0%) | 866 (7.7%) |
| 8 or more Rooms | 3,702 (28.9%) | 357 (3.2%) |
| Total | 12,802 (100.0%) | 11,260 (100.0%) |
Housing Structure by Heating Type in White Plains
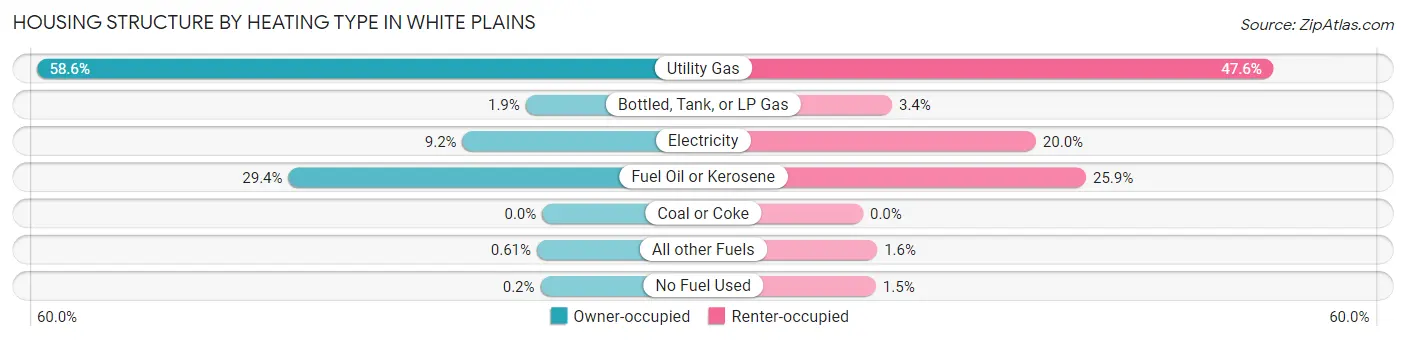
| Heating Type | Owner-occupied | Renter-occupied |
| Utility Gas | 7,504 (58.6%) | 5,360 (47.6%) |
| Bottled, Tank, or LP Gas | 245 (1.9%) | 378 (3.4%) |
| Electricity | 1,183 (9.2%) | 2,257 (20.0%) |
| Fuel Oil or Kerosene | 3,766 (29.4%) | 2,912 (25.9%) |
| Coal or Coke | 0 (0.0%) | 0 (0.0%) |
| All other Fuels | 78 (0.6%) | 185 (1.6%) |
| No Fuel Used | 26 (0.2%) | 168 (1.5%) |
| Total | 12,802 (100.0%) | 11,260 (100.0%) |
Household Vehicle Usage in White Plains
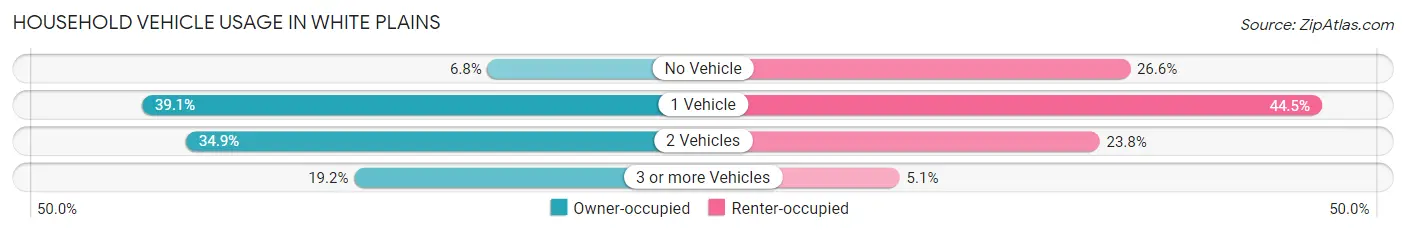
| Vehicles per Household | Owner-occupied | Renter-occupied |
| No Vehicle | 868 (6.8%) | 2,996 (26.6%) |
| 1 Vehicle | 4,999 (39.1%) | 5,012 (44.5%) |
| 2 Vehicles | 4,473 (34.9%) | 2,677 (23.8%) |
| 3 or more Vehicles | 2,462 (19.2%) | 575 (5.1%) |
| Total | 12,802 (100.0%) | 11,260 (100.0%) |
Real Estate & Mortgages in White Plains
Real Estate and Mortgage Overview in White Plains
| Characteristic | Without Mortgage | With Mortgage |
| Housing Units | 5,375 | 7,427 |
| Median Property Value | $541,300 | $652,200 |
| Median Household Income | $120,288 | $4,009 |
| Monthly Housing Costs | $1,381 | $4,459 |
| Real Estate Taxes | $9,716 | $924 |
Property Value by Mortgage Status in White Plains
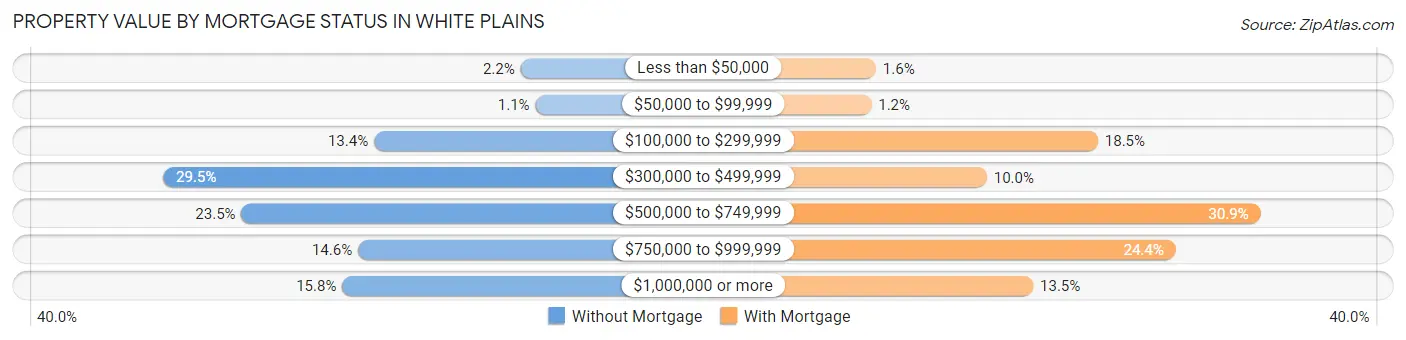
| Property Value | Without Mortgage | With Mortgage |
| Less than $50,000 | 119 (2.2%) | 115 (1.5%) |
| $50,000 to $99,999 | 58 (1.1%) | 89 (1.2%) |
| $100,000 to $299,999 | 719 (13.4%) | 1,371 (18.5%) |
| $300,000 to $499,999 | 1,583 (29.4%) | 743 (10.0%) |
| $500,000 to $749,999 | 1,262 (23.5%) | 2,292 (30.9%) |
| $750,000 to $999,999 | 785 (14.6%) | 1,812 (24.4%) |
| $1,000,000 or more | 849 (15.8%) | 1,005 (13.5%) |
| Total | 5,375 (100.0%) | 7,427 (100.0%) |
Household Income by Mortgage Status in White Plains
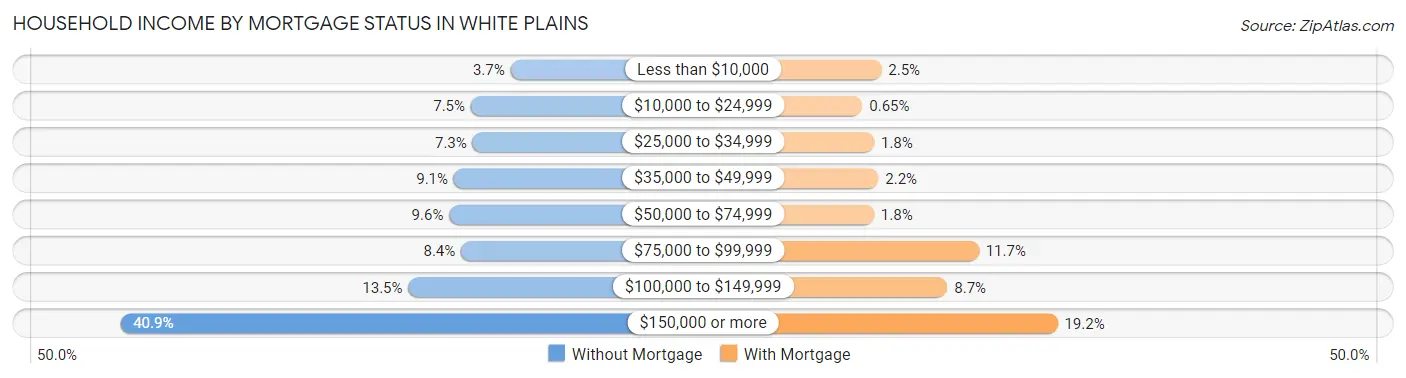
| Household Income | Without Mortgage | With Mortgage |
| Less than $10,000 | 200 (3.7%) | 183 (2.5%) |
| $10,000 to $24,999 | 403 (7.5%) | 48 (0.6%) |
| $25,000 to $34,999 | 394 (7.3%) | 131 (1.8%) |
| $35,000 to $49,999 | 490 (9.1%) | 161 (2.2%) |
| $50,000 to $74,999 | 514 (9.6%) | 130 (1.8%) |
| $75,000 to $99,999 | 453 (8.4%) | 871 (11.7%) |
| $100,000 to $149,999 | 723 (13.5%) | 649 (8.7%) |
| $150,000 or more | 2,198 (40.9%) | 1,428 (19.2%) |
| Total | 5,375 (100.0%) | 7,427 (100.0%) |
Property Value to Household Income Ratio in White Plains
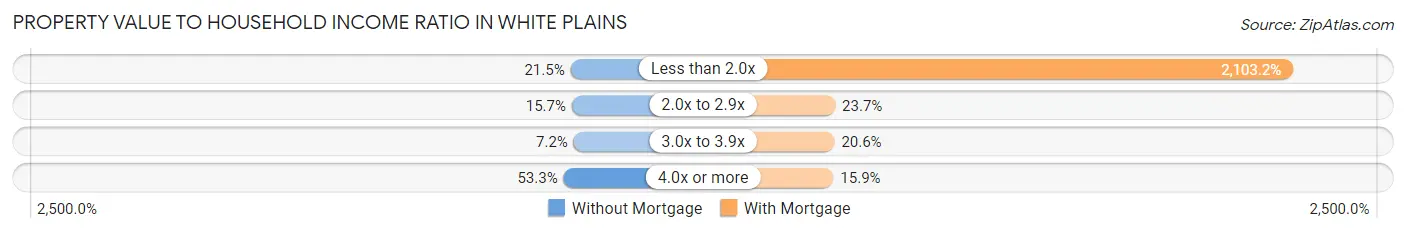
| Value-to-Income Ratio | Without Mortgage | With Mortgage |
| Less than 2.0x | 1,157 (21.5%) | 156,202 (2,103.2%) |
| 2.0x to 2.9x | 846 (15.7%) | 1,760 (23.7%) |
| 3.0x to 3.9x | 386 (7.2%) | 1,531 (20.6%) |
| 4.0x or more | 2,866 (53.3%) | 1,179 (15.9%) |
| Total | 5,375 (100.0%) | 7,427 (100.0%) |
Real Estate Taxes by Mortgage Status in White Plains
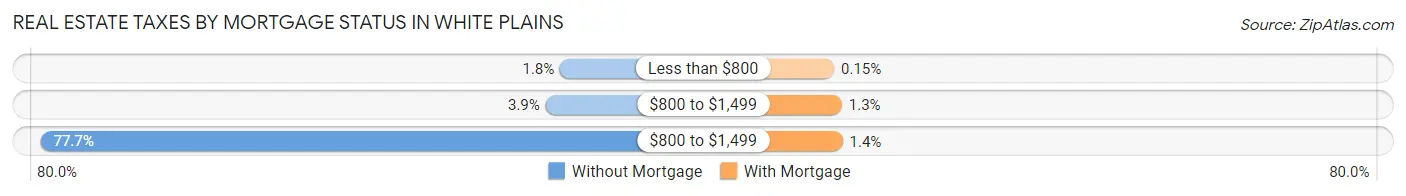
| Property Taxes | Without Mortgage | With Mortgage |
| Less than $800 | 94 (1.8%) | 11 (0.2%) |
| $800 to $1,499 | 208 (3.9%) | 96 (1.3%) |
| $800 to $1,499 | 4,174 (77.7%) | 104 (1.4%) |
| Total | 5,375 (100.0%) | 7,427 (100.0%) |
Health & Disability in White Plains
Health Insurance Coverage by Age in White Plains
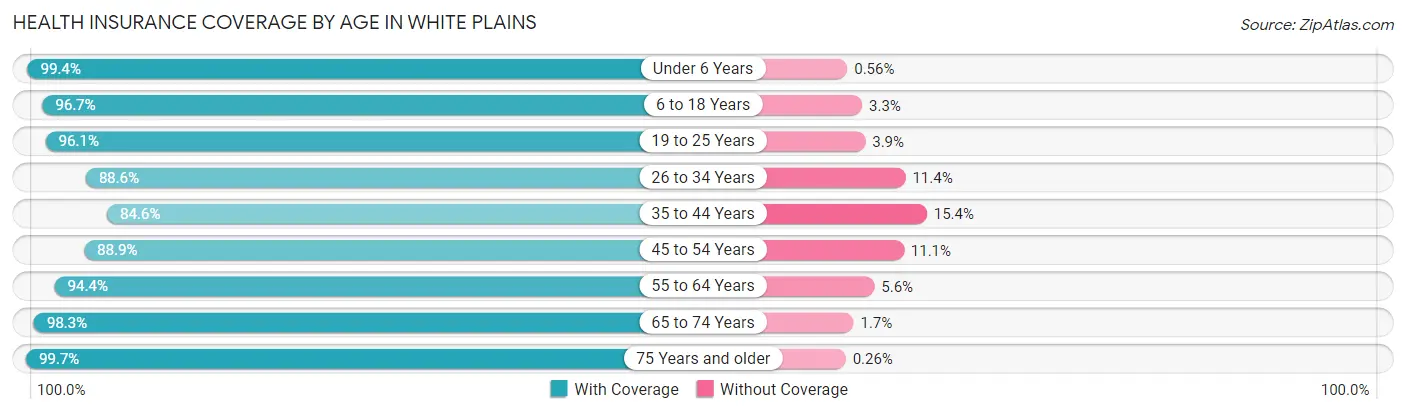
| Age Bracket | With Coverage | Without Coverage |
| Under 6 Years | 3,388 (99.4%) | 19 (0.6%) |
| 6 to 18 Years | 7,783 (96.7%) | 267 (3.3%) |
| 19 to 25 Years | 5,215 (96.1%) | 212 (3.9%) |
| 26 to 34 Years | 7,011 (88.6%) | 903 (11.4%) |
| 35 to 44 Years | 6,252 (84.6%) | 1,136 (15.4%) |
| 45 to 54 Years | 6,240 (88.9%) | 780 (11.1%) |
| 55 to 64 Years | 7,731 (94.4%) | 459 (5.6%) |
| 65 to 74 Years | 6,526 (98.3%) | 114 (1.7%) |
| 75 Years and older | 4,964 (99.7%) | 13 (0.3%) |
| Total | 55,110 (93.4%) | 3,903 (6.6%) |
Health Insurance Coverage by Citizenship Status in White Plains
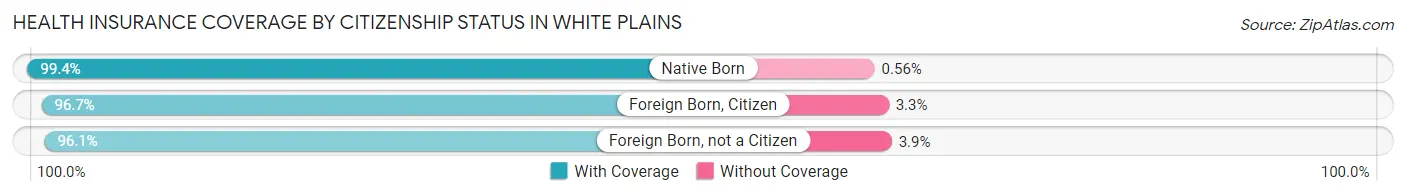
| Citizenship Status | With Coverage | Without Coverage |
| Native Born | 3,388 (99.4%) | 19 (0.6%) |
| Foreign Born, Citizen | 7,783 (96.7%) | 267 (3.3%) |
| Foreign Born, not a Citizen | 5,215 (96.1%) | 212 (3.9%) |
Health Insurance Coverage by Household Income in White Plains
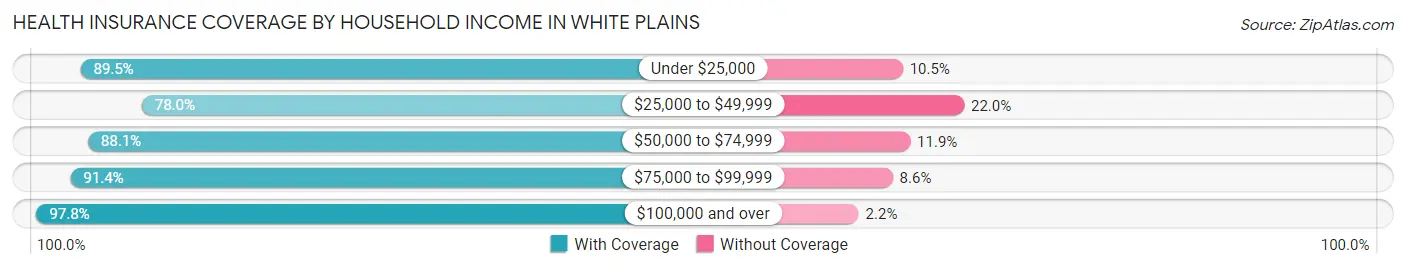
| Household Income | With Coverage | Without Coverage |
| Under $25,000 | 3,977 (89.5%) | 465 (10.5%) |
| $25,000 to $49,999 | 5,106 (78.0%) | 1,437 (22.0%) |
| $50,000 to $74,999 | 4,981 (88.1%) | 671 (11.9%) |
| $75,000 to $99,999 | 4,917 (91.4%) | 462 (8.6%) |
| $100,000 and over | 35,210 (97.8%) | 799 (2.2%) |
Public vs Private Health Insurance Coverage by Age in White Plains
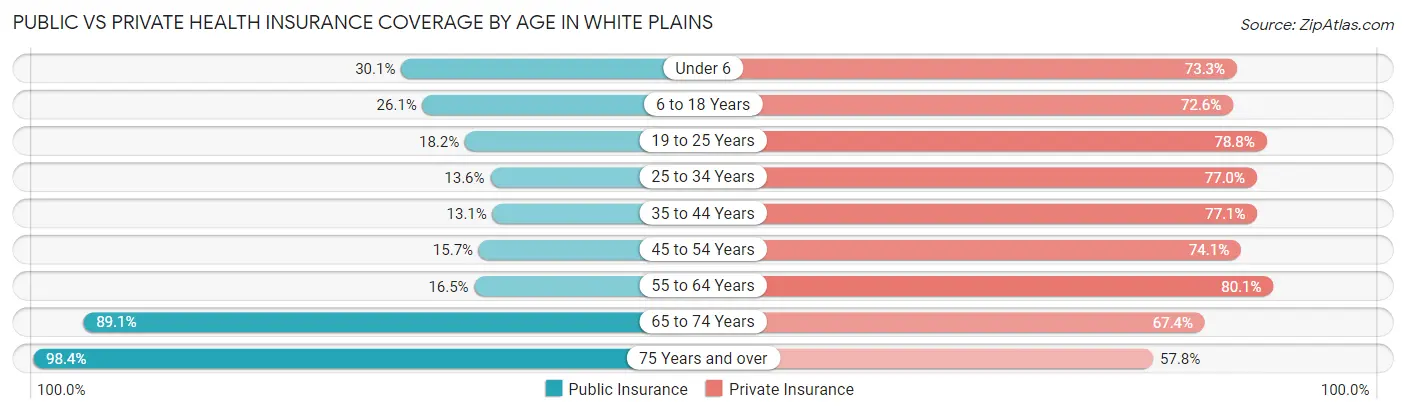
| Age Bracket | Public Insurance | Private Insurance |
| Under 6 | 1,025 (30.1%) | 2,498 (73.3%) |
| 6 to 18 Years | 2,102 (26.1%) | 5,847 (72.6%) |
| 19 to 25 Years | 990 (18.2%) | 4,278 (78.8%) |
| 25 to 34 Years | 1,072 (13.6%) | 6,097 (77.0%) |
| 35 to 44 Years | 970 (13.1%) | 5,698 (77.1%) |
| 45 to 54 Years | 1,100 (15.7%) | 5,201 (74.1%) |
| 55 to 64 Years | 1,351 (16.5%) | 6,560 (80.1%) |
| 65 to 74 Years | 5,917 (89.1%) | 4,474 (67.4%) |
| 75 Years and over | 4,898 (98.4%) | 2,876 (57.8%) |
| Total | 19,425 (32.9%) | 43,529 (73.8%) |
Disability Status by Sex by Age in White Plains
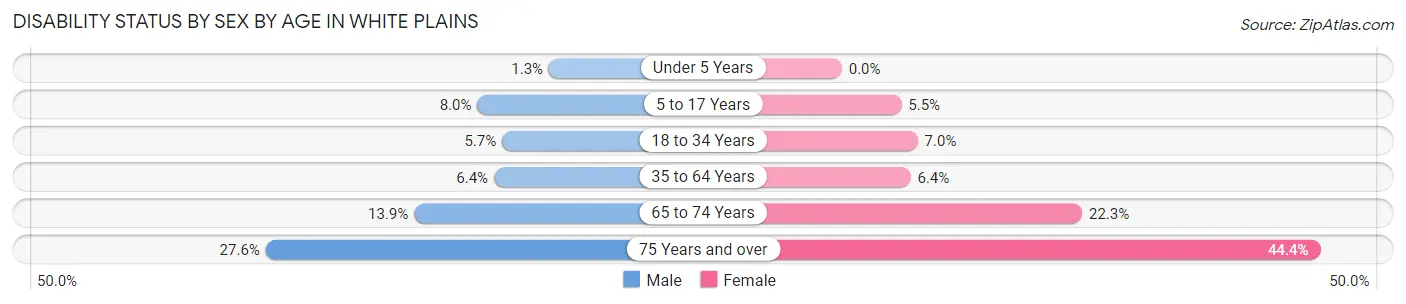
| Age Bracket | Male | Female |
| Under 5 Years | 18 (1.3%) | 0 (0.0%) |
| 5 to 17 Years | 319 (8.0%) | 215 (5.5%) |
| 18 to 34 Years | 409 (5.7%) | 485 (7.0%) |
| 35 to 64 Years | 704 (6.4%) | 745 (6.4%) |
| 65 to 74 Years | 398 (13.9%) | 840 (22.3%) |
| 75 Years and over | 497 (27.6%) | 1,411 (44.4%) |
Disability Class by Sex by Age in White Plains
Disability Class: Hearing Difficulty
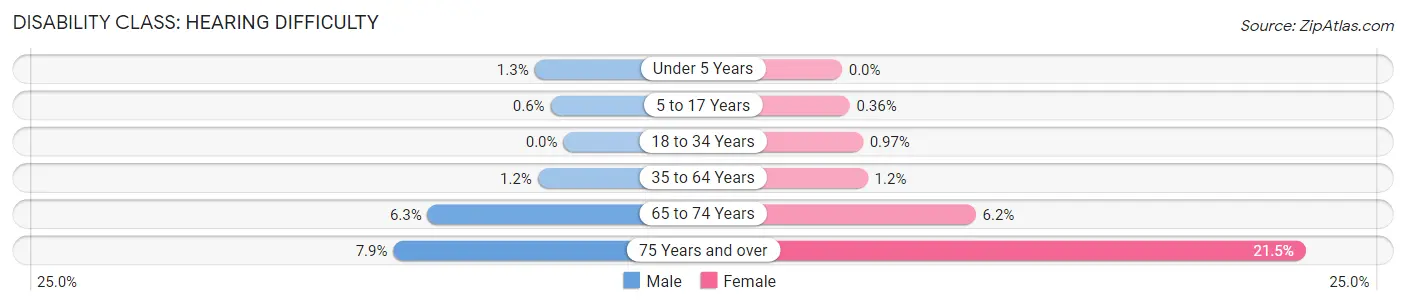
| Age Bracket | Male | Female |
| Under 5 Years | 18 (1.3%) | 0 (0.0%) |
| 5 to 17 Years | 24 (0.6%) | 14 (0.4%) |
| 18 to 34 Years | 0 (0.0%) | 67 (1.0%) |
| 35 to 64 Years | 130 (1.2%) | 140 (1.2%) |
| 65 to 74 Years | 181 (6.3%) | 234 (6.2%) |
| 75 Years and over | 142 (7.9%) | 684 (21.5%) |
Disability Class: Vision Difficulty
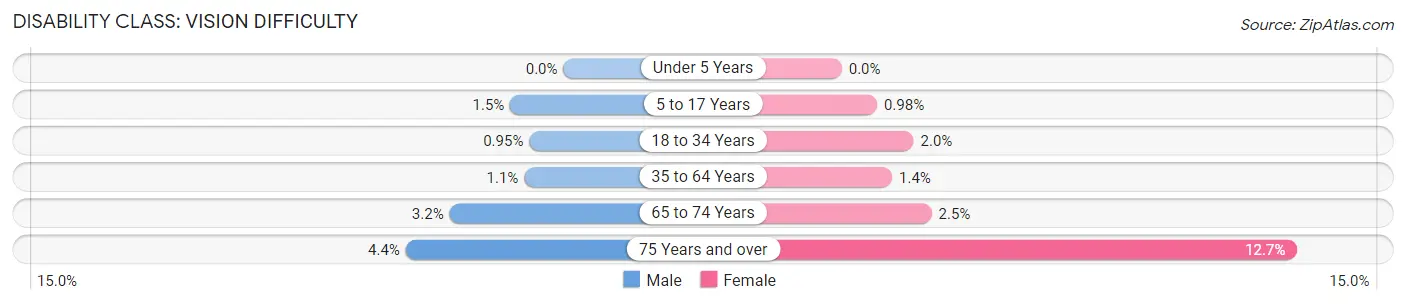
| Age Bracket | Male | Female |
| Under 5 Years | 0 (0.0%) | 0 (0.0%) |
| 5 to 17 Years | 59 (1.5%) | 38 (1.0%) |
| 18 to 34 Years | 68 (0.9%) | 138 (2.0%) |
| 35 to 64 Years | 119 (1.1%) | 163 (1.4%) |
| 65 to 74 Years | 91 (3.2%) | 94 (2.5%) |
| 75 Years and over | 79 (4.4%) | 403 (12.7%) |
Disability Class: Cognitive Difficulty
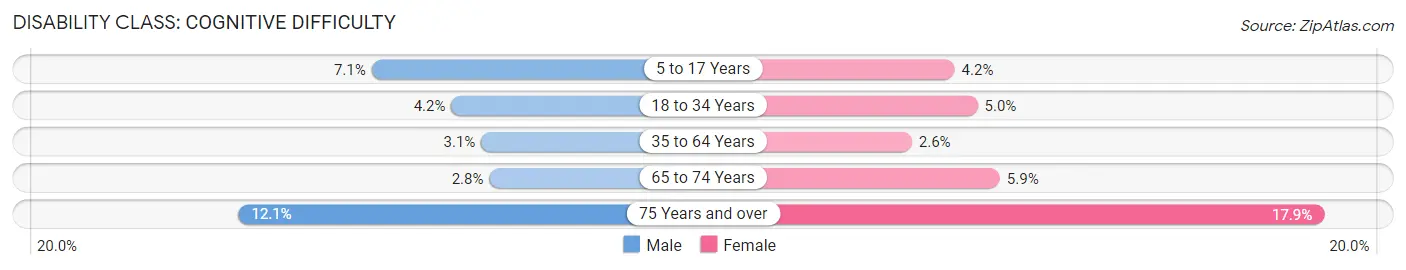
| Age Bracket | Male | Female |
| 5 to 17 Years | 284 (7.1%) | 163 (4.2%) |
| 18 to 34 Years | 299 (4.2%) | 347 (5.0%) |
| 35 to 64 Years | 333 (3.0%) | 304 (2.6%) |
| 65 to 74 Years | 79 (2.8%) | 221 (5.9%) |
| 75 Years and over | 217 (12.1%) | 569 (17.9%) |
Disability Class: Ambulatory Difficulty
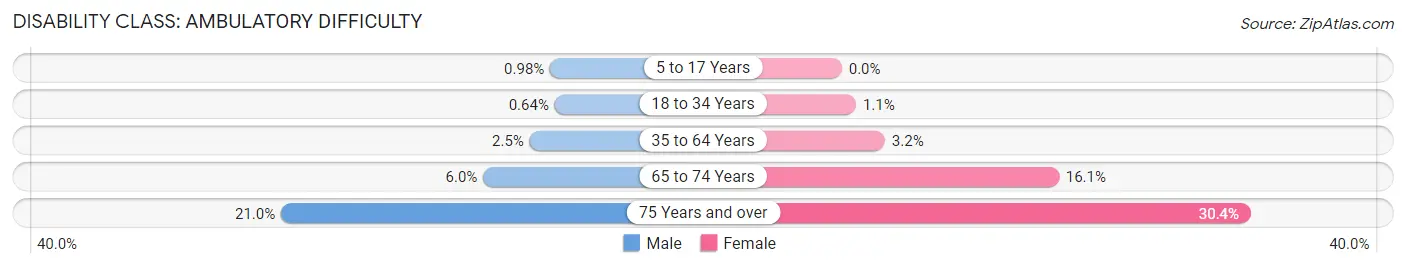
| Age Bracket | Male | Female |
| 5 to 17 Years | 39 (1.0%) | 0 (0.0%) |
| 18 to 34 Years | 46 (0.6%) | 72 (1.1%) |
| 35 to 64 Years | 273 (2.5%) | 373 (3.2%) |
| 65 to 74 Years | 171 (5.9%) | 607 (16.1%) |
| 75 Years and over | 377 (21.0%) | 965 (30.4%) |
Disability Class: Self-Care Difficulty
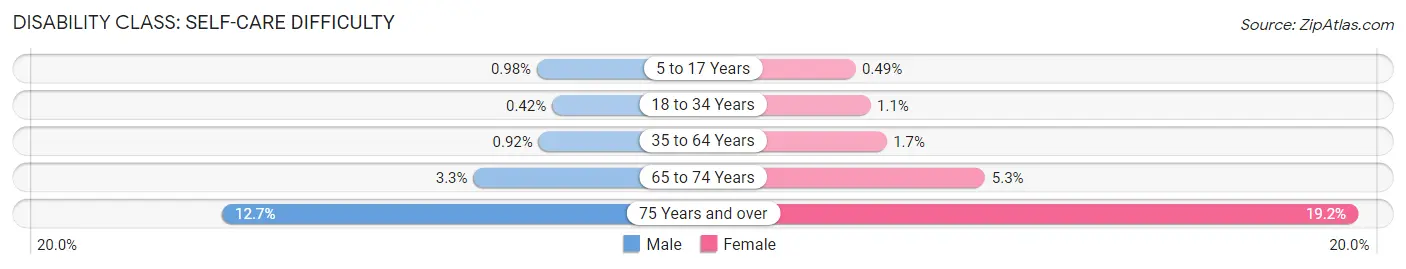
| Age Bracket | Male | Female |
| 5 to 17 Years | 39 (1.0%) | 19 (0.5%) |
| 18 to 34 Years | 30 (0.4%) | 72 (1.1%) |
| 35 to 64 Years | 100 (0.9%) | 193 (1.7%) |
| 65 to 74 Years | 96 (3.3%) | 200 (5.3%) |
| 75 Years and over | 228 (12.7%) | 609 (19.2%) |
Technology Access in White Plains
Computing Device Access in White Plains
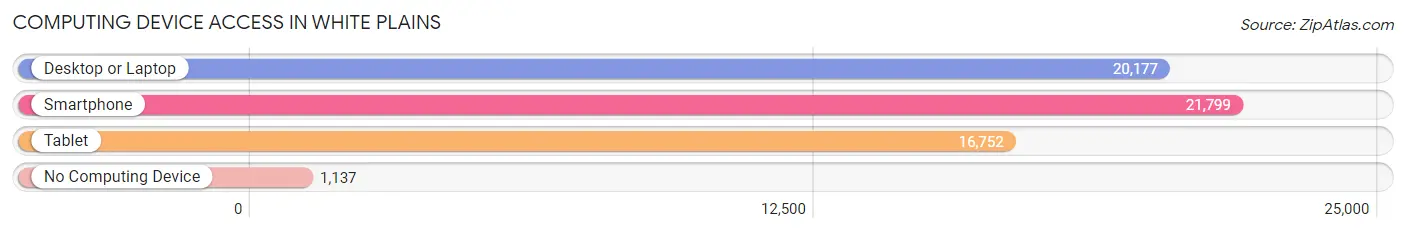
| Device Type | # Households | % Households |
| Desktop or Laptop | 20,177 | 83.9% |
| Smartphone | 21,799 | 90.6% |
| Tablet | 16,752 | 69.6% |
| No Computing Device | 1,137 | 4.7% |
| Total | 24,062 | 100.0% |
Internet Access in White Plains
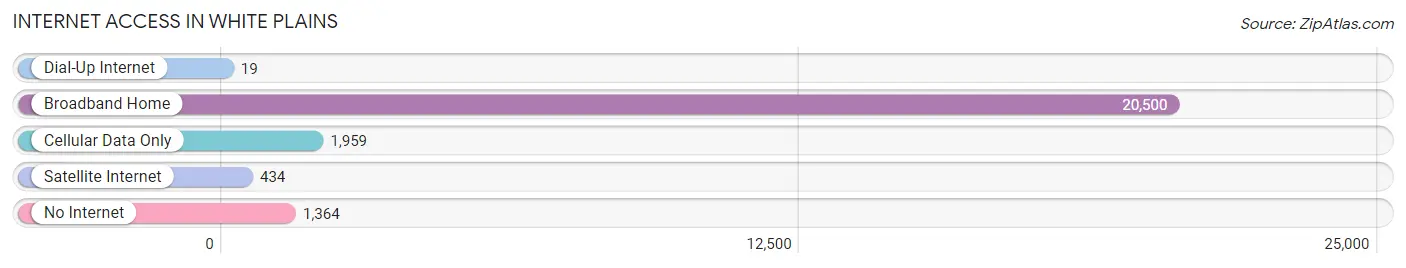
| Internet Type | # Households | % Households |
| Dial-Up Internet | 19 | 0.1% |
| Broadband Home | 20,500 | 85.2% |
| Cellular Data Only | 1,959 | 8.1% |
| Satellite Internet | 434 | 1.8% |
| No Internet | 1,364 | 5.7% |
| Total | 24,062 | 100.0% |
White Plains Summary
White Plains, NY is a city located in Westchester County, New York, United States. It is the county seat and commercial hub of Westchester, an affluent suburban county just north of New York City that is home to almost one million people. White Plains is located approximately 25 miles north of Midtown Manhattan. As of the 2010 census, the city had a total population of 56,853.
Geography
White Plains is located at 41°2′N 73°45′W (41.03, -73.75). According to the United States Census Bureau, the city has a total area of 11.2 square miles (29 km2), of which 10.9 square miles (28 km2) is land and 0.3 square miles (0.78 km2) (2.67%) is water.
White Plains is bordered to the north by the town of North Castle, to the east by the town of Harrison, to the south by the town of Greenburgh, and to the west by the town of Scarsdale.
History
White Plains was first settled in 1683 by a group of Quakers from Rye, New York. The town was officially incorporated in 1721. During the American Revolution, White Plains was a major battlefield in the Battle of White Plains. The city was the site of the first public reading of the Declaration of Independence in New York.
In the 19th century, White Plains became a popular summer resort for wealthy New Yorkers. The city was also the site of the first golf course in the United States, the St. Andrew's Golf Club, which opened in 1888.
Economy
White Plains is a major commercial and retail hub for Westchester County. The city is home to the Westchester Mall, the largest shopping mall in the county, as well as numerous other retail stores and restaurants. The city is also home to several corporate headquarters, including Heineken USA, PepsiCo, and IBM.
White Plains is also home to several hospitals, including the Westchester Medical Center, a major regional medical center. The city is also home to Pace University's Westchester campus.
Demographics
As of the 2010 census, the city had a total population of 56,853. The racial makeup of the city was 57.2% White, 22.3% African American, 0.2% Native American, 8.5% Asian, 0.1% Pacific Islander, 8.1% from other races, and 3.6% from two or more races. Hispanic or Latino of any race were 22.2% of the population.
The median income for a household in the city was $68,824, and the median income for a family was $83,919. The per capita income for the city was $37,845. About 8.2% of families and 11.2% of the population were below the poverty line, including 15.2% of those under age 18 and 8.2% of those age 65 or over.
Common Questions
What is Per Capita Income in White Plains?
Per Capita income in White Plains is $65,846.
What is the Median Family Income in White Plains?
Median Family Income in White Plains is $141,335.
What is the Median Household income in White Plains?
Median Household Income in White Plains is $109,551.
What is Income or Wage Gap in White Plains?
Income or Wage Gap in White Plains is 26.0%.
Women in White Plains earn 74.0 cents for every dollar earned by a man.
What is Inequality or Gini Index in White Plains?
Inequality or Gini Index in White Plains is 0.51.
What is the Total Population of White Plains?
Total Population of White Plains is 59,421.
What is the Total Male Population of White Plains?
Total Male Population of White Plains is 28,337.
What is the Total Female Population of White Plains?
Total Female Population of White Plains is 31,084.
What is the Ratio of Males per 100 Females in White Plains?
There are 91.16 Males per 100 Females in White Plains.
What is the Ratio of Females per 100 Males in White Plains?
There are 109.69 Females per 100 Males in White Plains.
What is the Median Population Age in White Plains?
Median Population Age in White Plains is 41.4 Years.
What is the Average Family Size in White Plains
Average Family Size in White Plains is 3.1 People.
What is the Average Household Size in White Plains
Average Household Size in White Plains is 2.4 People.
How Large is the Labor Force in White Plains?
There are 32,750 People in the Labor Forcein in White Plains.
What is the Percentage of People in the Labor Force in White Plains?
65.5% of People are in the Labor Force in White Plains.
What is the Unemployment Rate in White Plains?
Unemployment Rate in White Plains is 5.4%.