Putnam Lake, NY Map & Demographics
Putnam Lake Map
Putnam Lake Overview
$42,320
PER CAPITA INCOME
$92,155
AVG FAMILY INCOME
$92,112
AVG HOUSEHOLD INCOME
53.8%
WAGE / INCOME GAP [ % ]
46.2¢/ $1
WAGE / INCOME GAP [ $ ]
$7,732
FAMILY INCOME DEFICIT
0.39
INEQUALITY / GINI INDEX
3,826
TOTAL POPULATION
1,916
MALE POPULATION
1,910
FEMALE POPULATION
100.31
MALES / 100 FEMALES
99.69
FEMALES / 100 MALES
46.2
MEDIAN AGE
2.9
AVG FAMILY SIZE
2.7
AVG HOUSEHOLD SIZE
2,125
LABOR FORCE [ PEOPLE ]
63.4%
PERCENT IN LABOR FORCE
7.2%
UNEMPLOYMENT RATE
Income in Putnam Lake
Income Overview in Putnam Lake
Per Capita Income in Putnam Lake is $42,320, while median incomes of families and households are $92,155 and $92,112 respectively.
| Characteristic | Number | Measure |
| Per Capita Income | 3,826 | $42,320 |
| Median Family Income | 1,196 | $92,155 |
| Mean Family Income | 1,196 | $111,037 |
| Median Household Income | 1,389 | $92,112 |
| Mean Household Income | 1,389 | $107,917 |
| Income Deficit | 1,196 | $7,732 |
| Wage / Income Gap (%) | 3,826 | 53.81% |
| Wage / Income Gap ($) | 3,826 | 46.19¢ per $1 |
| Gini / Inequality Index | 3,826 | 0.39 |
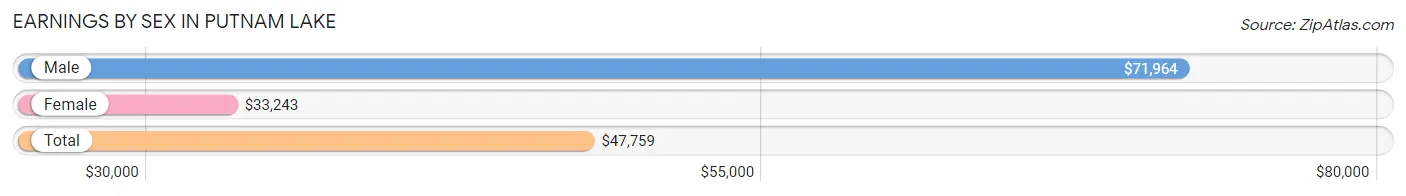
Earnings by Sex in Putnam Lake
Average Earnings in Putnam Lake are $47,759, $71,964 for men and $33,243 for women, a difference of 53.8%.
| Sex | Number | Average Earnings |
| Male | 1,102 (52.1%) | $71,964 |
| Female | 1,012 (47.9%) | $33,243 |
| Total | 2,114 (100.0%) | $47,759 |
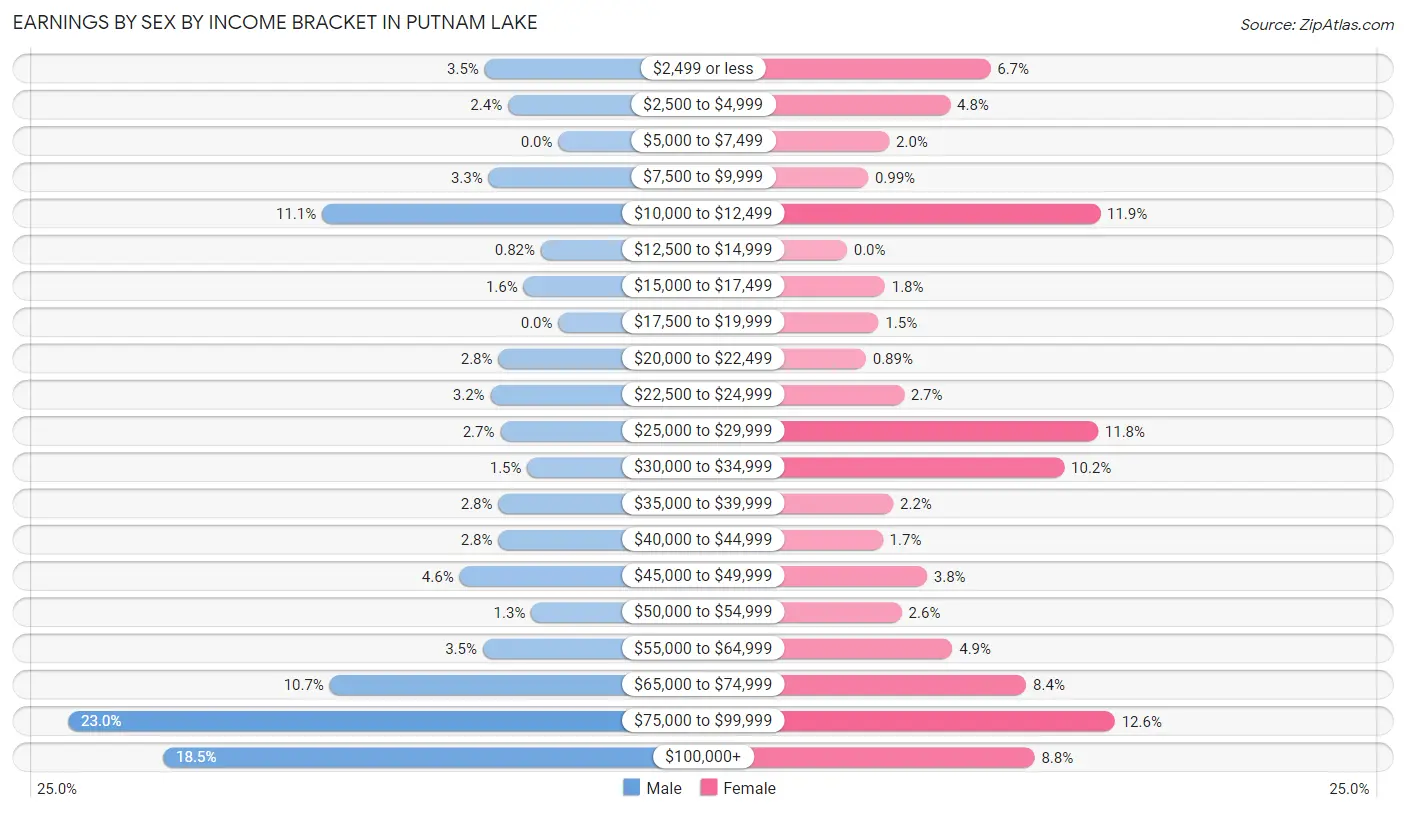
Earnings by Sex by Income Bracket in Putnam Lake
The most common earnings brackets in Putnam Lake are $75,000 to $99,999 for men (253 | 23.0%) and $75,000 to $99,999 for women (127 | 12.6%).
| Income | Male | Female |
| $2,499 or less | 38 (3.5%) | 68 (6.7%) |
| $2,500 to $4,999 | 26 (2.4%) | 49 (4.8%) |
| $5,000 to $7,499 | 0 (0.0%) | 20 (2.0%) |
| $7,500 to $9,999 | 36 (3.3%) | 10 (1.0%) |
| $10,000 to $12,499 | 122 (11.1%) | 120 (11.9%) |
| $12,500 to $14,999 | 9 (0.8%) | 0 (0.0%) |
| $15,000 to $17,499 | 18 (1.6%) | 18 (1.8%) |
| $17,500 to $19,999 | 0 (0.0%) | 15 (1.5%) |
| $20,000 to $22,499 | 31 (2.8%) | 9 (0.9%) |
| $22,500 to $24,999 | 35 (3.2%) | 27 (2.7%) |
| $25,000 to $29,999 | 30 (2.7%) | 119 (11.8%) |
| $30,000 to $34,999 | 16 (1.5%) | 103 (10.2%) |
| $35,000 to $39,999 | 31 (2.8%) | 22 (2.2%) |
| $40,000 to $44,999 | 31 (2.8%) | 17 (1.7%) |
| $45,000 to $49,999 | 51 (4.6%) | 38 (3.7%) |
| $50,000 to $54,999 | 14 (1.3%) | 26 (2.6%) |
| $55,000 to $64,999 | 39 (3.5%) | 50 (4.9%) |
| $65,000 to $74,999 | 118 (10.7%) | 85 (8.4%) |
| $75,000 to $99,999 | 253 (23.0%) | 127 (12.6%) |
| $100,000+ | 204 (18.5%) | 89 (8.8%) |
| Total | 1,102 (100.0%) | 1,012 (100.0%) |
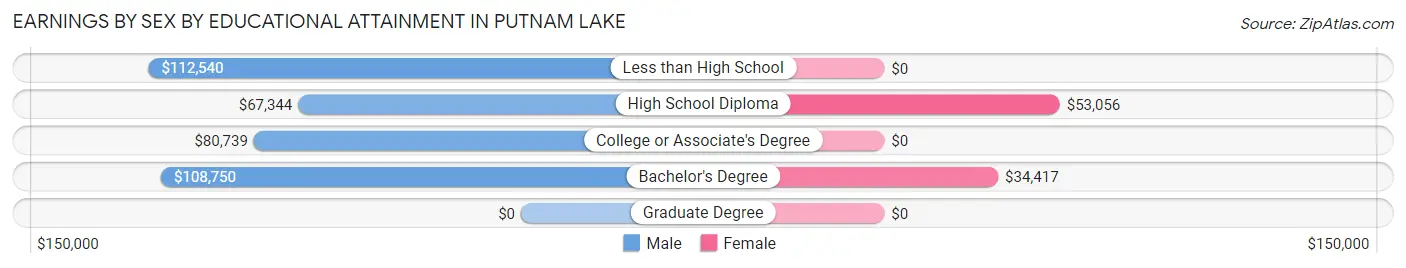
Earnings by Sex by Educational Attainment in Putnam Lake
Average earnings in Putnam Lake are $73,626 for men and $35,625 for women, a difference of 51.6%. Men with an educational attainment of less than high school enjoy the highest average annual earnings of $112,540, while those with high school diploma education earn the least with $67,344. Women with an educational attainment of high school diploma earn the most with the average annual earnings of $53,056, while those with bachelor's degree education have the smallest earnings of $34,417.
| Educational Attainment | Male Income | Female Income |
| Less than High School | $112,540 | $0 |
| High School Diploma | $67,344 | $53,056 |
| College or Associate's Degree | $80,739 | $0 |
| Bachelor's Degree | $108,750 | $34,417 |
| Graduate Degree | - | - |
| Total | $73,626 | $35,625 |
Family Income in Putnam Lake
Family Income Brackets in Putnam Lake
According to the Putnam Lake family income data, there are 283 families falling into the $50,000 to $74,999 income range, which is the most common income bracket and makes up 23.7% of all families.
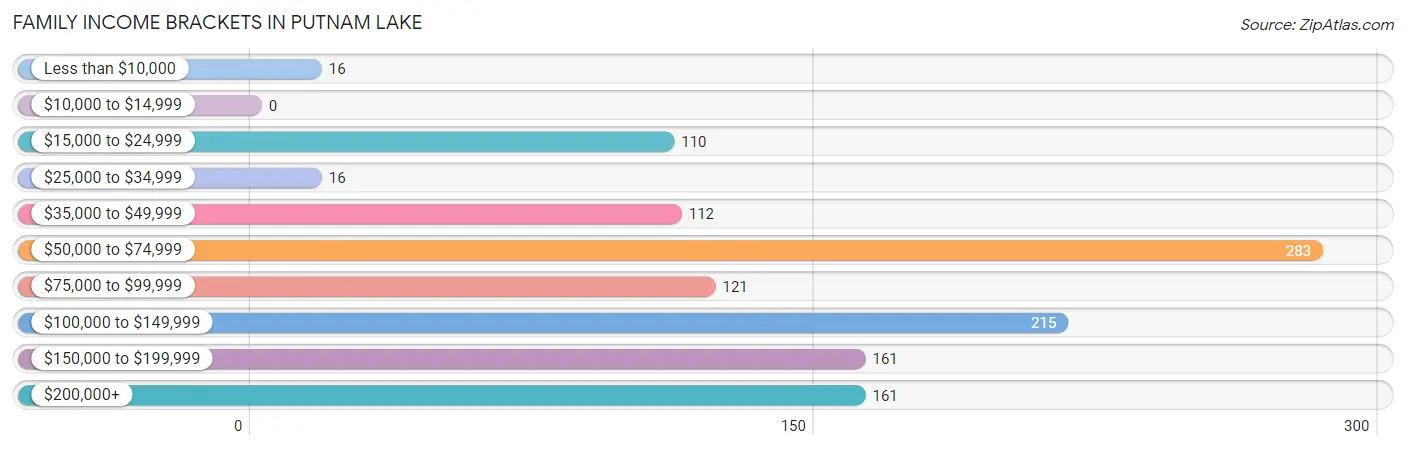
| Income Bracket | # Families | % Families |
| Less than $10,000 | 16 | 1.3% |
| $10,000 to $14,999 | 0 | 0.0% |
| $15,000 to $24,999 | 110 | 9.2% |
| $25,000 to $34,999 | 16 | 1.3% |
| $35,000 to $49,999 | 112 | 9.4% |
| $50,000 to $74,999 | 283 | 23.7% |
| $75,000 to $99,999 | 121 | 10.1% |
| $100,000 to $149,999 | 215 | 18.0% |
| $150,000 to $199,999 | 161 | 13.5% |
| $200,000+ | 161 | 13.5% |
Family Income by Famaliy Size in Putnam Lake
4-person families (168 | 14.1%) account for the highest median family income in Putnam Lake with $147,917 per family, while 4-person families (168 | 14.1%) have the highest median income of $36,979 per family member.
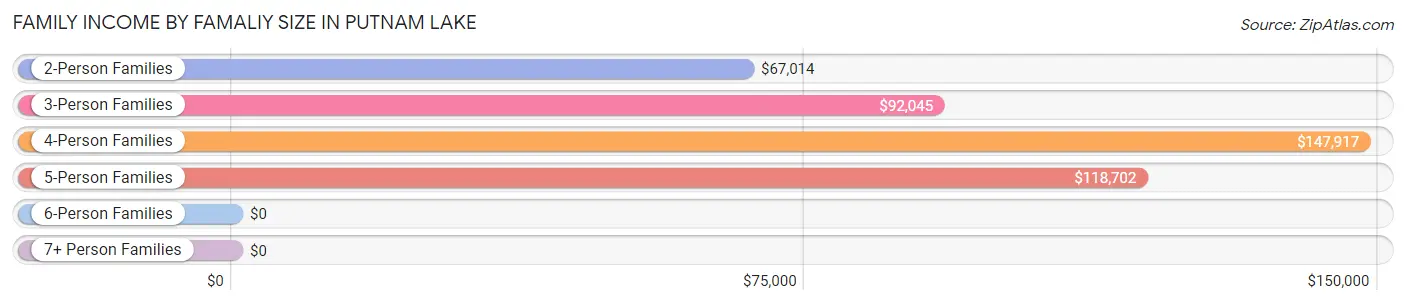
| Income Bracket | # Families | Median Income |
| 2-Person Families | 655 (54.8%) | $67,014 |
| 3-Person Families | 250 (20.9%) | $92,045 |
| 4-Person Families | 168 (14.1%) | $147,917 |
| 5-Person Families | 123 (10.3%) | $118,702 |
| 6-Person Families | 0 (0.0%) | $0 |
| 7+ Person Families | 0 (0.0%) | $0 |
| Total | 1,196 (100.0%) | $92,155 |
Family Income by Number of Earners in Putnam Lake
The median family income in Putnam Lake is $92,155, with families comprising 3+ earners (147) having the highest median family income of $193,906, while families with no earners (239) have the lowest median family income of $53,802, accounting for 12.3% and 20.0% of families, respectively.
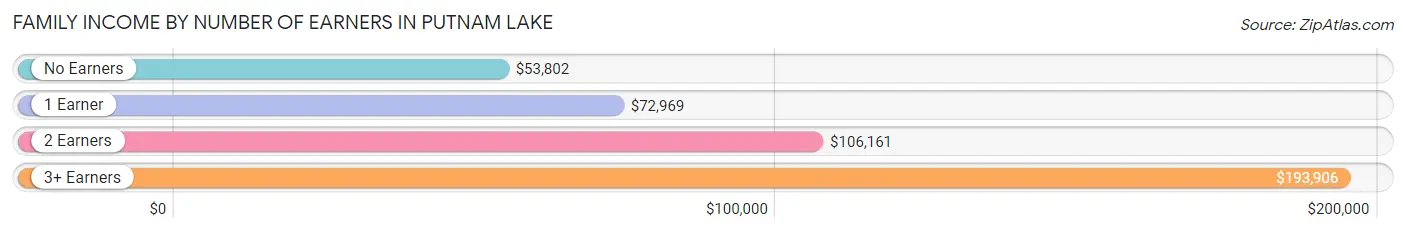
| Number of Earners | # Families | Median Income |
| No Earners | 239 (20.0%) | $53,802 |
| 1 Earner | 344 (28.8%) | $72,969 |
| 2 Earners | 466 (39.0%) | $106,161 |
| 3+ Earners | 147 (12.3%) | $193,906 |
| Total | 1,196 (100.0%) | $92,155 |
Household Income in Putnam Lake
Household Income Brackets in Putnam Lake
With 293 households falling in the category, the $50,000 to $74,999 income range is the most frequent in Putnam Lake, accounting for 21.1% of all households.
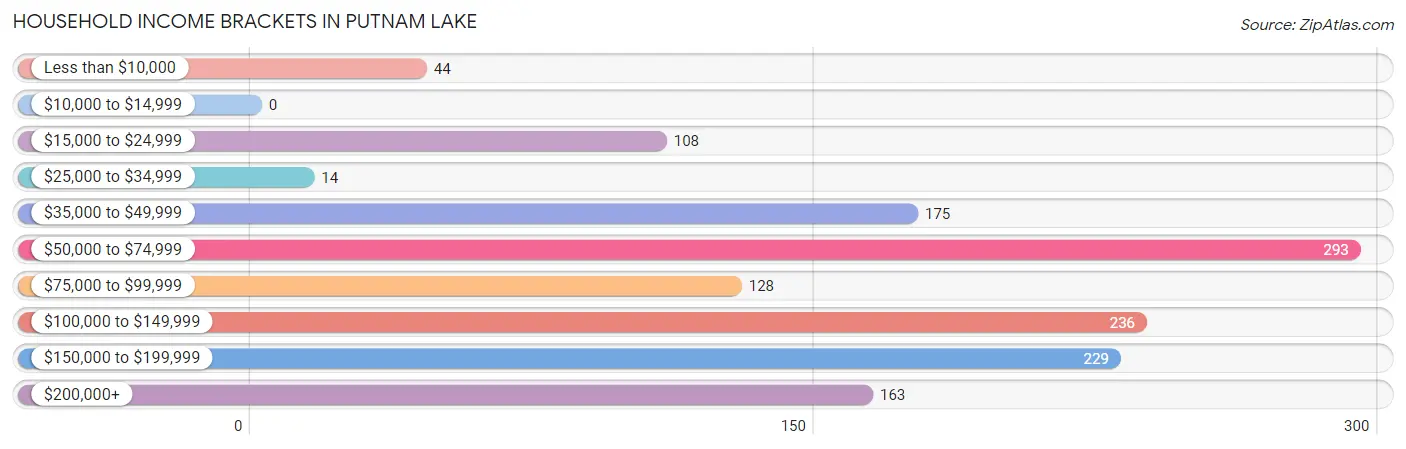
| Income Bracket | # Households | % Households |
| Less than $10,000 | 44 | 3.2% |
| $10,000 to $14,999 | 0 | 0.0% |
| $15,000 to $24,999 | 108 | 7.8% |
| $25,000 to $34,999 | 14 | 1.0% |
| $35,000 to $49,999 | 175 | 12.6% |
| $50,000 to $74,999 | 293 | 21.1% |
| $75,000 to $99,999 | 128 | 9.2% |
| $100,000 to $149,999 | 236 | 17.0% |
| $150,000 to $199,999 | 229 | 16.5% |
| $200,000+ | 163 | 11.7% |
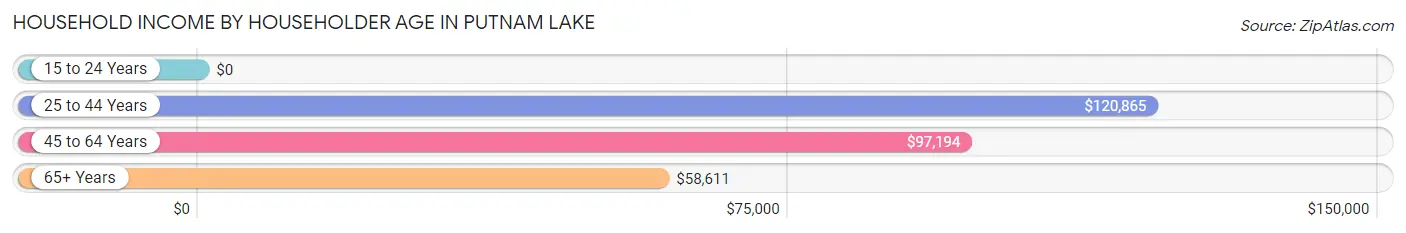
Household Income by Householder Age in Putnam Lake
The median household income in Putnam Lake is $92,112, with the highest median household income of $120,865 found in the 25 to 44 years age bracket for the primary householder. A total of 295 households (21.2%) fall into this category.
| Income Bracket | # Households | Median Income |
| 15 to 24 Years | 0 (0.0%) | $0 |
| 25 to 44 Years | 295 (21.2%) | $120,865 |
| 45 to 64 Years | 632 (45.5%) | $97,194 |
| 65+ Years | 462 (33.3%) | $58,611 |
| Total | 1,389 (100.0%) | $92,112 |
Poverty in Putnam Lake
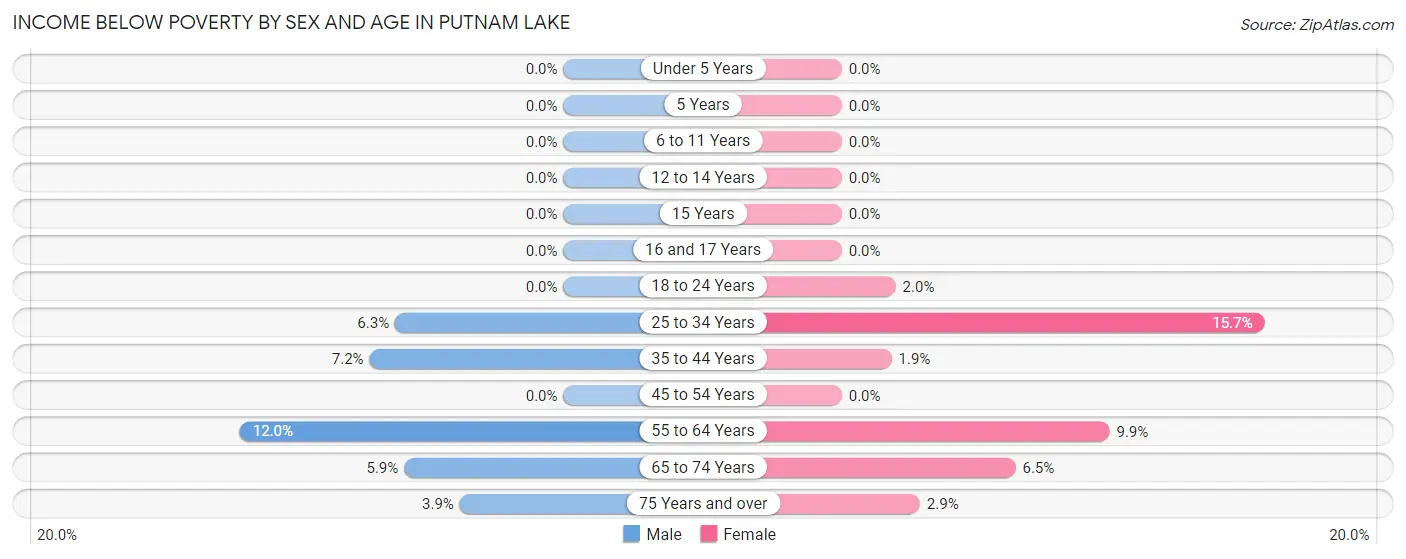
Income Below Poverty by Sex and Age in Putnam Lake
With 4.8% poverty level for males and 4.8% for females among the residents of Putnam Lake, 55 to 64 year old males and 25 to 34 year old females are the most vulnerable to poverty, with 37 males (12.0%) and 32 females (15.7%) in their respective age groups living below the poverty level.
| Age Bracket | Male | Female |
| Under 5 Years | 0 (0.0%) | 0 (0.0%) |
| 5 Years | 0 (0.0%) | 0 (0.0%) |
| 6 to 11 Years | 0 (0.0%) | 0 (0.0%) |
| 12 to 14 Years | 0 (0.0%) | 0 (0.0%) |
| 15 Years | 0 (0.0%) | 0 (0.0%) |
| 16 and 17 Years | 0 (0.0%) | 0 (0.0%) |
| 18 to 24 Years | 0 (0.0%) | 3 (2.0%) |
| 25 to 34 Years | 13 (6.2%) | 32 (15.7%) |
| 35 to 44 Years | 19 (7.2%) | 4 (1.8%) |
| 45 to 54 Years | 0 (0.0%) | 0 (0.0%) |
| 55 to 64 Years | 37 (12.0%) | 32 (9.9%) |
| 65 to 74 Years | 15 (5.9%) | 14 (6.5%) |
| 75 Years and over | 7 (3.8%) | 7 (2.9%) |
| Total | 91 (4.8%) | 92 (4.8%) |
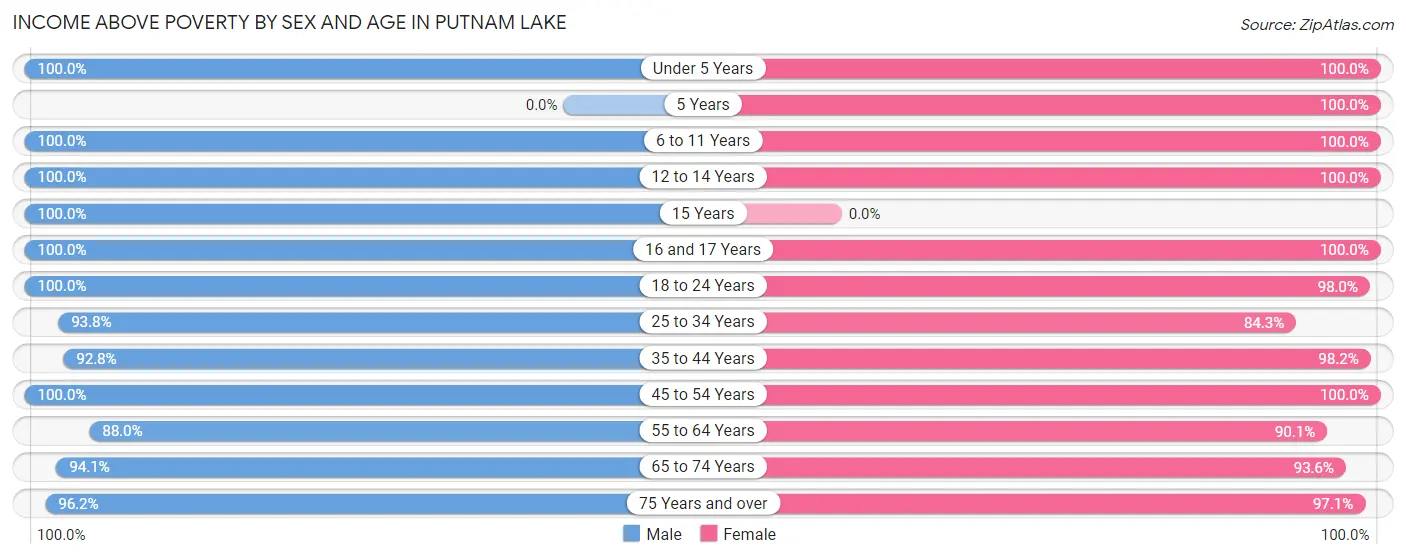
Income Above Poverty by Sex and Age in Putnam Lake
According to the poverty statistics in Putnam Lake, males aged under 5 years and females aged under 5 years are the age groups that are most secure financially, with 100.0% of males and 100.0% of females in these age groups living above the poverty line.
| Age Bracket | Male | Female |
| Under 5 Years | 50 (100.0%) | 70 (100.0%) |
| 5 Years | 0 (0.0%) | 19 (100.0%) |
| 6 to 11 Years | 97 (100.0%) | 115 (100.0%) |
| 12 to 14 Years | 46 (100.0%) | 62 (100.0%) |
| 15 Years | 5 (100.0%) | 0 (0.0%) |
| 16 and 17 Years | 49 (100.0%) | 18 (100.0%) |
| 18 to 24 Years | 173 (100.0%) | 147 (98.0%) |
| 25 to 34 Years | 195 (93.8%) | 172 (84.3%) |
| 35 to 44 Years | 245 (92.8%) | 212 (98.2%) |
| 45 to 54 Years | 272 (100.0%) | 266 (100.0%) |
| 55 to 64 Years | 271 (88.0%) | 290 (90.1%) |
| 65 to 74 Years | 239 (94.1%) | 203 (93.5%) |
| 75 Years and over | 175 (96.2%) | 234 (97.1%) |
| Total | 1,817 (95.2%) | 1,808 (95.2%) |
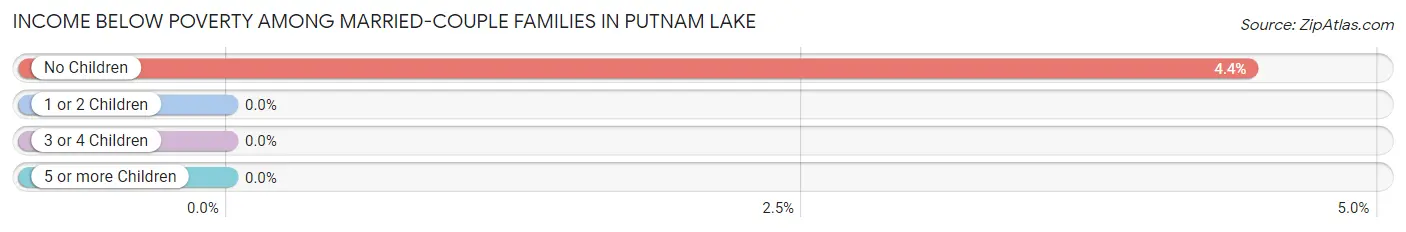
Income Below Poverty Among Married-Couple Families in Putnam Lake
The poverty statistics for married-couple families in Putnam Lake show that 3.3% or 31 of the total 951 families live below the poverty line. Families with no children have the highest poverty rate of 4.4%, comprising of 31 families. On the other hand, families with 1 or 2 children have the lowest poverty rate of 0.0%, which includes 0 families.
| Children | Above Poverty | Below Poverty |
| No Children | 667 (95.6%) | 31 (4.4%) |
| 1 or 2 Children | 209 (100.0%) | 0 (0.0%) |
| 3 or 4 Children | 44 (100.0%) | 0 (0.0%) |
| 5 or more Children | 0 (0.0%) | 0 (0.0%) |
| Total | 920 (96.7%) | 31 (3.3%) |
Income Below Poverty Among Single-Parent Households in Putnam Lake
| Children | Single Father | Single Mother |
| No Children | 0 (0.0%) | 0 (0.0%) |
| 1 or 2 Children | 0 (0.0%) | 0 (0.0%) |
| 3 or 4 Children | 0 (0.0%) | 0 (0.0%) |
| 5 or more Children | 0 (0.0%) | 0 (0.0%) |
| Total | 0 (0.0%) | 0 (0.0%) |
Income Below Poverty Among Married-Couple vs Single-Parent Households in Putnam Lake
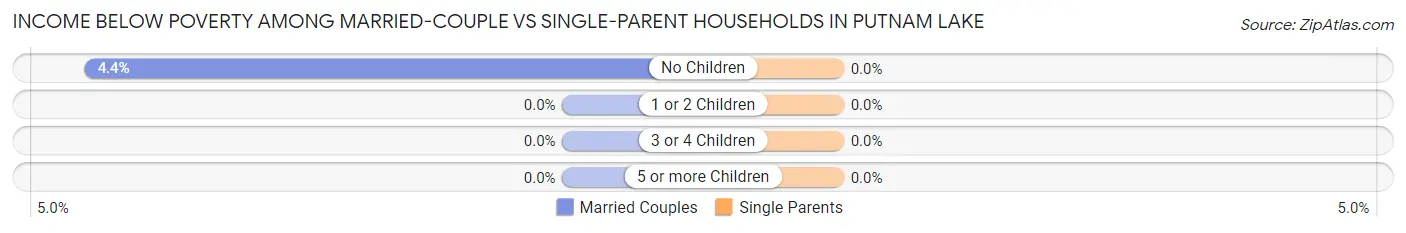
| Children | Married-Couple Families | Single-Parent Households |
| No Children | 31 (4.4%) | 0 (0.0%) |
| 1 or 2 Children | 0 (0.0%) | 0 (0.0%) |
| 3 or 4 Children | 0 (0.0%) | 0 (0.0%) |
| 5 or more Children | 0 (0.0%) | 0 (0.0%) |
| Total | 31 (3.3%) | 0 (0.0%) |
Race in Putnam Lake
The most populous races in Putnam Lake are White / Caucasian (2,829 | 73.9%), Hispanic or Latino (1,043 | 27.3%), and Some other Race (492 | 12.9%).
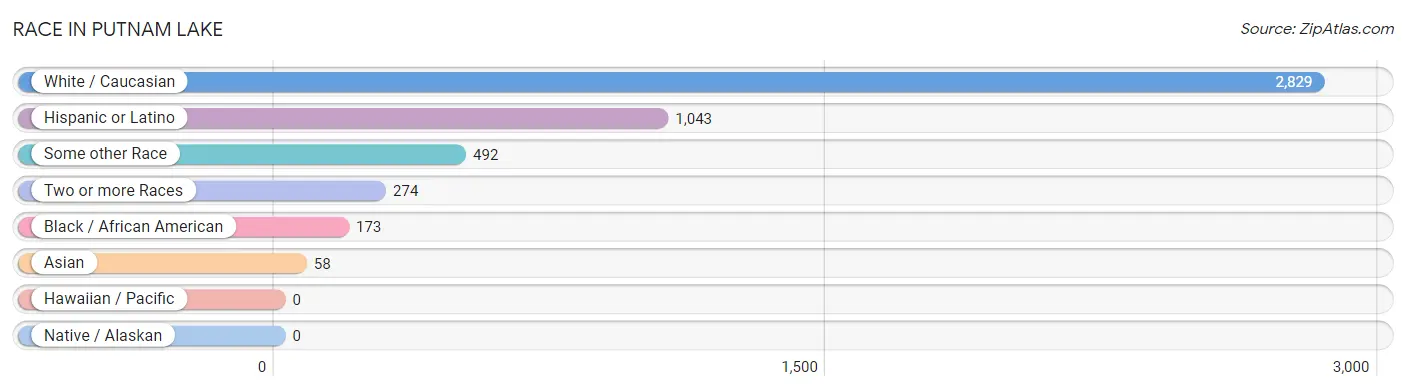
| Race | # Population | % Population |
| Asian | 58 | 1.5% |
| Black / African American | 173 | 4.5% |
| Hawaiian / Pacific | 0 | 0.0% |
| Hispanic or Latino | 1,043 | 27.3% |
| Native / Alaskan | 0 | 0.0% |
| White / Caucasian | 2,829 | 73.9% |
| Two or more Races | 274 | 7.2% |
| Some other Race | 492 | 12.9% |
| Total | 3,826 | 100.0% |
Ancestry in Putnam Lake
The most populous ancestries reported in Putnam Lake are Italian (686 | 17.9%), Irish (650 | 17.0%), Puerto Rican (406 | 10.6%), German (334 | 8.7%), and American (310 | 8.1%), together accounting for 62.4% of all Putnam Lake residents.
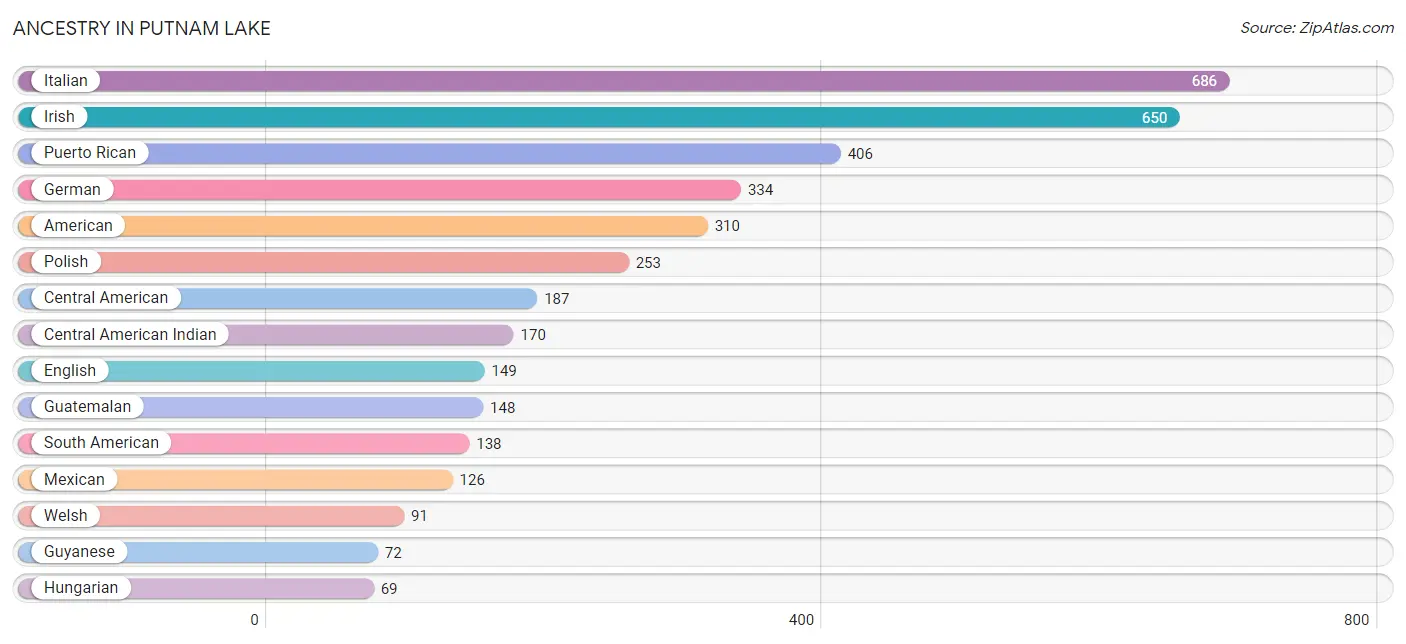
| Ancestry | # Population | % Population |
| American | 310 | 8.1% |
| Argentinean | 51 | 1.3% |
| British | 16 | 0.4% |
| Central American | 187 | 4.9% |
| Central American Indian | 170 | 4.4% |
| Cherokee | 7 | 0.2% |
| Chilean | 20 | 0.5% |
| Chippewa | 8 | 0.2% |
| Colombian | 5 | 0.1% |
| Cuban | 39 | 1.0% |
| Danish | 17 | 0.4% |
| Dominican | 66 | 1.7% |
| Dutch | 7 | 0.2% |
| Eastern European | 7 | 0.2% |
| Ecuadorian | 62 | 1.6% |
| English | 149 | 3.9% |
| European | 10 | 0.3% |
| French | 38 | 1.0% |
| French Canadian | 20 | 0.5% |
| German | 334 | 8.7% |
| Greek | 7 | 0.2% |
| Guatemalan | 148 | 3.9% |
| Guyanese | 72 | 1.9% |
| Honduran | 20 | 0.5% |
| Hungarian | 69 | 1.8% |
| Indian (Asian) | 20 | 0.5% |
| Irish | 650 | 17.0% |
| Israeli | 3 | 0.1% |
| Italian | 686 | 17.9% |
| Latvian | 11 | 0.3% |
| Lithuanian | 12 | 0.3% |
| Mexican | 126 | 3.3% |
| Northern European | 7 | 0.2% |
| Polish | 253 | 6.6% |
| Portuguese | 6 | 0.2% |
| Puerto Rican | 406 | 10.6% |
| Russian | 3 | 0.1% |
| Salvadoran | 19 | 0.5% |
| Scotch-Irish | 14 | 0.4% |
| Scottish | 39 | 1.0% |
| South American | 138 | 3.6% |
| Sri Lankan | 9 | 0.2% |
| Swedish | 61 | 1.6% |
| Thai | 32 | 0.8% |
| Turkish | 64 | 1.7% |
| Ukrainian | 9 | 0.2% |
| Welsh | 91 | 2.4% | View All 47 Rows |
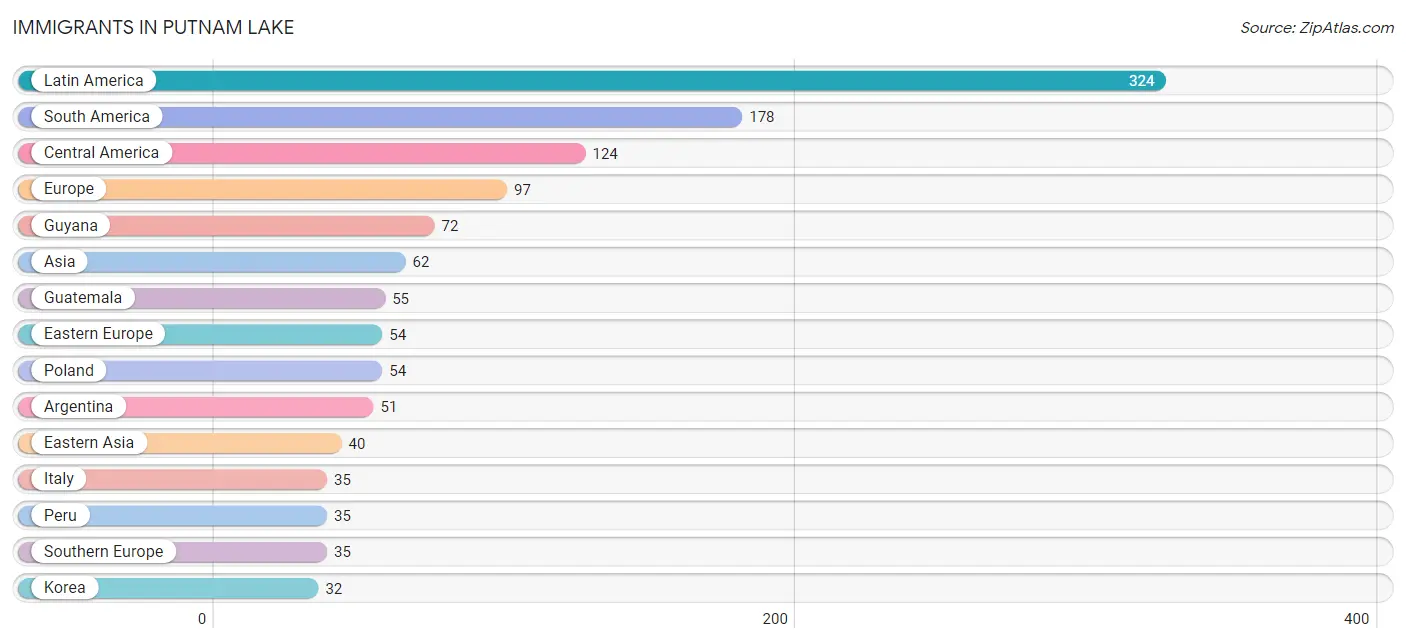
Immigrants in Putnam Lake
The most numerous immigrant groups reported in Putnam Lake came from Latin America (324 | 8.5%), South America (178 | 4.6%), Central America (124 | 3.2%), Europe (97 | 2.5%), and Guyana (72 | 1.9%), together accounting for 20.8% of all Putnam Lake residents.
| Immigration Origin | # Population | % Population |
| Africa | 8 | 0.2% |
| Argentina | 51 | 1.3% |
| Asia | 62 | 1.6% |
| Belize | 30 | 0.8% |
| Caribbean | 22 | 0.6% |
| Central America | 124 | 3.2% |
| Chile | 20 | 0.5% |
| China | 8 | 0.2% |
| Dominican Republic | 22 | 0.6% |
| Eastern Asia | 40 | 1.1% |
| Eastern Europe | 54 | 1.4% |
| El Salvador | 19 | 0.5% |
| Europe | 97 | 2.5% |
| Guatemala | 55 | 1.4% |
| Guyana | 72 | 1.9% |
| Honduras | 20 | 0.5% |
| India | 19 | 0.5% |
| Ireland | 8 | 0.2% |
| Israel | 3 | 0.1% |
| Italy | 35 | 0.9% |
| Korea | 32 | 0.8% |
| Latin America | 324 | 8.5% |
| Morocco | 8 | 0.2% |
| Northern Africa | 8 | 0.2% |
| Northern Europe | 8 | 0.2% |
| Peru | 35 | 0.9% |
| Poland | 54 | 1.4% |
| South America | 178 | 4.6% |
| South Central Asia | 19 | 0.5% |
| Southern Europe | 35 | 0.9% |
| Western Asia | 3 | 0.1% | View All 31 Rows |
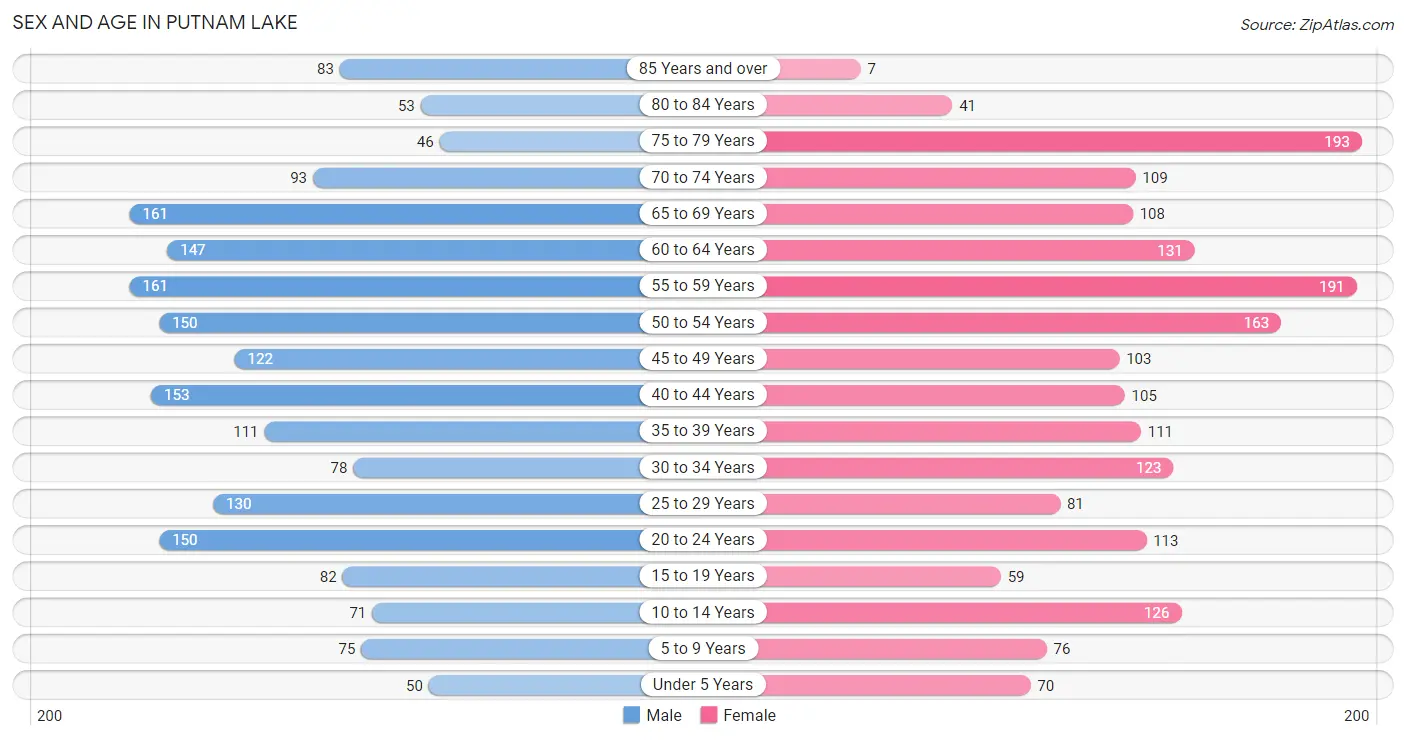
Sex and Age in Putnam Lake
Sex and Age in Putnam Lake
The most populous age groups in Putnam Lake are 55 to 59 Years (161 | 8.4%) for men and 75 to 79 Years (193 | 10.1%) for women.
| Age Bracket | Male | Female |
| Under 5 Years | 50 (2.6%) | 70 (3.7%) |
| 5 to 9 Years | 75 (3.9%) | 76 (4.0%) |
| 10 to 14 Years | 71 (3.7%) | 126 (6.6%) |
| 15 to 19 Years | 82 (4.3%) | 59 (3.1%) |
| 20 to 24 Years | 150 (7.8%) | 113 (5.9%) |
| 25 to 29 Years | 130 (6.8%) | 81 (4.2%) |
| 30 to 34 Years | 78 (4.1%) | 123 (6.4%) |
| 35 to 39 Years | 111 (5.8%) | 111 (5.8%) |
| 40 to 44 Years | 153 (8.0%) | 105 (5.5%) |
| 45 to 49 Years | 122 (6.4%) | 103 (5.4%) |
| 50 to 54 Years | 150 (7.8%) | 163 (8.5%) |
| 55 to 59 Years | 161 (8.4%) | 191 (10.0%) |
| 60 to 64 Years | 147 (7.7%) | 131 (6.9%) |
| 65 to 69 Years | 161 (8.4%) | 108 (5.7%) |
| 70 to 74 Years | 93 (4.9%) | 109 (5.7%) |
| 75 to 79 Years | 46 (2.4%) | 193 (10.1%) |
| 80 to 84 Years | 53 (2.8%) | 41 (2.1%) |
| 85 Years and over | 83 (4.3%) | 7 (0.4%) |
| Total | 1,916 (100.0%) | 1,910 (100.0%) |
Families and Households in Putnam Lake
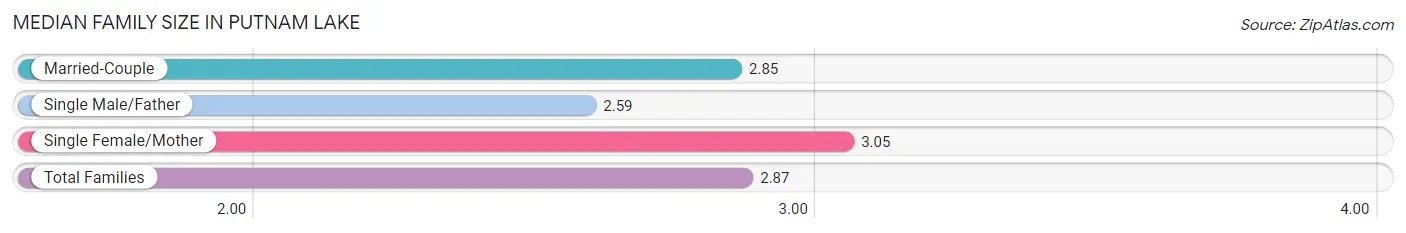
Median Family Size in Putnam Lake
The median family size in Putnam Lake is 2.87 persons per family, with single female/mother families (194 | 16.2%) accounting for the largest median family size of 3.05 persons per family. On the other hand, single male/father families (51 | 4.3%) represent the smallest median family size with 2.59 persons per family.
| Family Type | # Families | Family Size |
| Married-Couple | 951 (79.5%) | 2.85 |
| Single Male/Father | 51 (4.3%) | 2.59 |
| Single Female/Mother | 194 (16.2%) | 3.05 |
| Total Families | 1,196 (100.0%) | 2.87 |
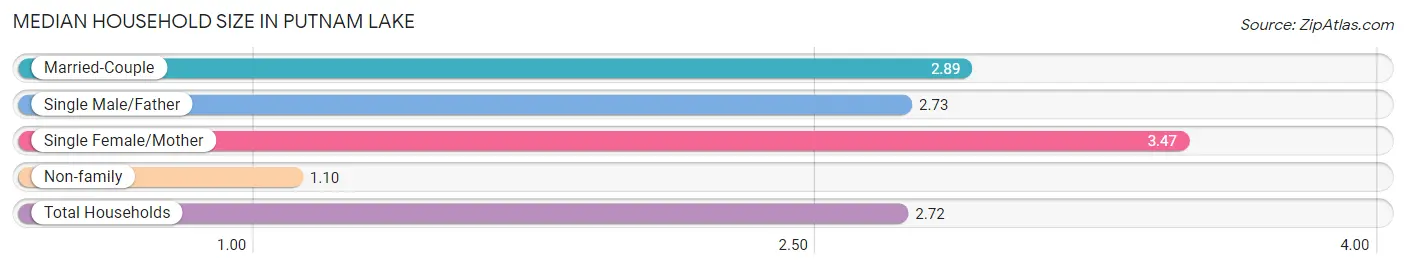
Median Household Size in Putnam Lake
The median household size in Putnam Lake is 2.72 persons per household, with single female/mother households (194 | 14.0%) accounting for the largest median household size of 3.47 persons per household. non-family households (193 | 13.9%) represent the smallest median household size with 1.10 persons per household.
| Household Type | # Households | Household Size |
| Married-Couple | 951 (68.5%) | 2.89 |
| Single Male/Father | 51 (3.7%) | 2.73 |
| Single Female/Mother | 194 (14.0%) | 3.47 |
| Non-family | 193 (13.9%) | 1.10 |
| Total Households | 1,389 (100.0%) | 2.72 |
Household Size by Marriage Status in Putnam Lake
Out of a total of 1,389 households in Putnam Lake, 1,196 (86.1%) are family households, while 193 (13.9%) are nonfamily households. The most numerous type of family households are 2-person households, comprising 602, and the most common type of nonfamily households are 1-person households, comprising 168.
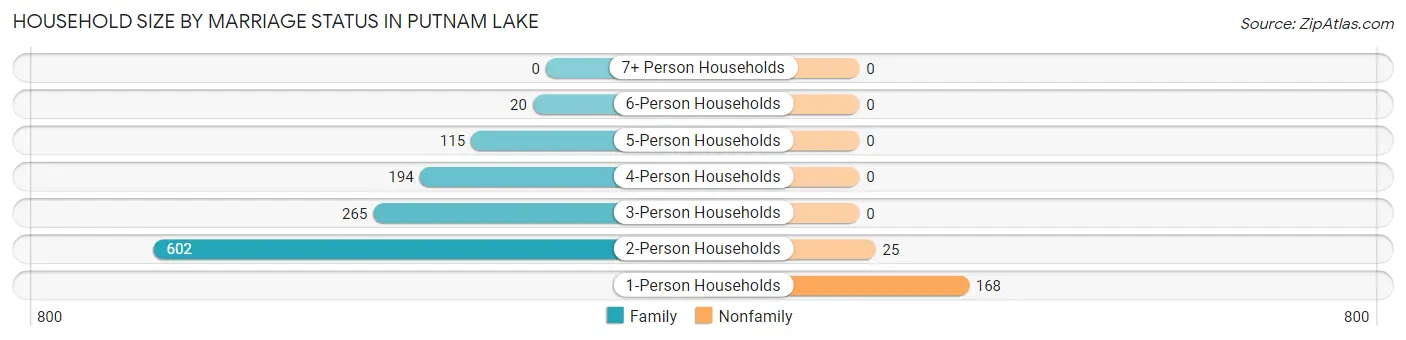
| Household Size | Family Households | Nonfamily Households |
| 1-Person Households | - | 168 (12.1%) |
| 2-Person Households | 602 (43.3%) | 25 (1.8%) |
| 3-Person Households | 265 (19.1%) | 0 (0.0%) |
| 4-Person Households | 194 (14.0%) | 0 (0.0%) |
| 5-Person Households | 115 (8.3%) | 0 (0.0%) |
| 6-Person Households | 20 (1.4%) | 0 (0.0%) |
| 7+ Person Households | 0 (0.0%) | 0 (0.0%) |
| Total | 1,196 (86.1%) | 193 (13.9%) |
Female Fertility in Putnam Lake
Fertility by Age in Putnam Lake
Average fertility rate in Putnam Lake is 102.0 births per 1,000 women. Women in the age bracket of 20 to 34 years have the highest fertility rate with 123.0 births per 1,000 women. Women in the age bracket of 20 to 34 years acount for 54.9% of all women with births.
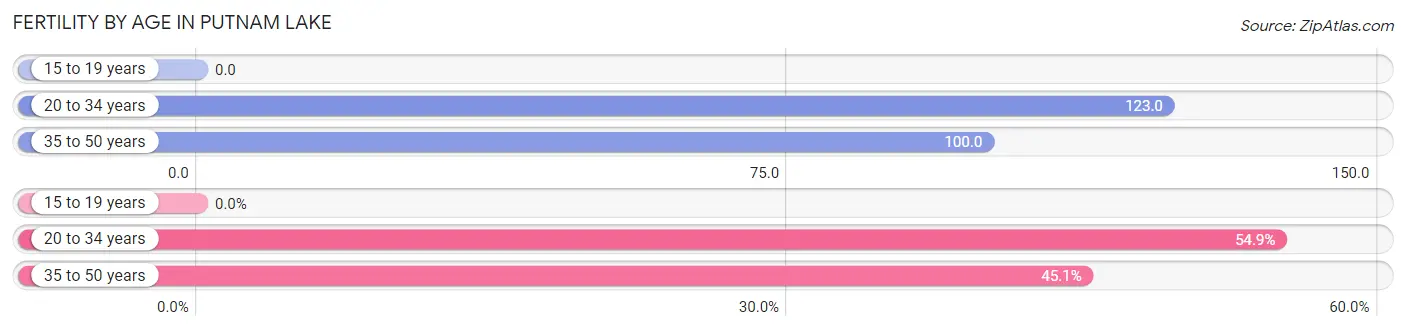
| Age Bracket | Women with Births | Births / 1,000 Women |
| 15 to 19 years | 0 (0.0%) | 0.0 |
| 20 to 34 years | 39 (54.9%) | 123.0 |
| 35 to 50 years | 32 (45.1%) | 100.0 |
| Total | 71 (100.0%) | 102.0 |
Fertility by Age by Marriage Status in Putnam Lake
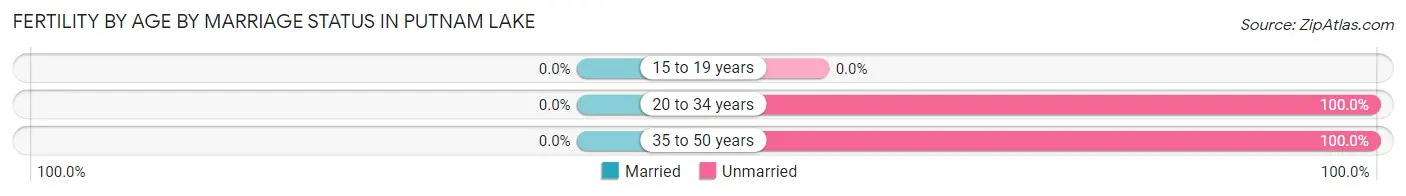
| Age Bracket | Married | Unmarried |
| 15 to 19 years | 0 (0.0%) | 0 (0.0%) |
| 20 to 34 years | 0 (0.0%) | 39 (100.0%) |
| 35 to 50 years | 0 (0.0%) | 32 (100.0%) |
| Total | 0 (0.0%) | 71 (100.0%) |
Fertility by Education in Putnam Lake
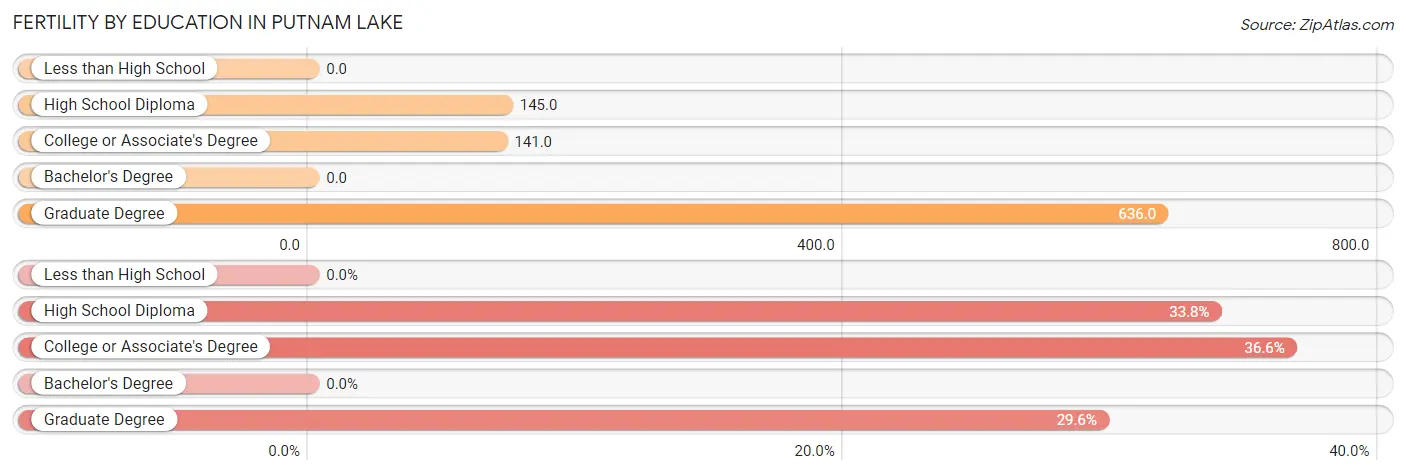
| Educational Attainment | Women with Births | Births / 1,000 Women |
| Less than High School | 0 (0.0%) | 0.0 |
| High School Diploma | 24 (33.8%) | 145.0 |
| College or Associate's Degree | 26 (36.6%) | 141.0 |
| Bachelor's Degree | 0 (0.0%) | 0.0 |
| Graduate Degree | 21 (29.6%) | 636.0 |
| Total | 71 (100.0%) | 102.0 |
Fertility by Education by Marriage Status in Putnam Lake
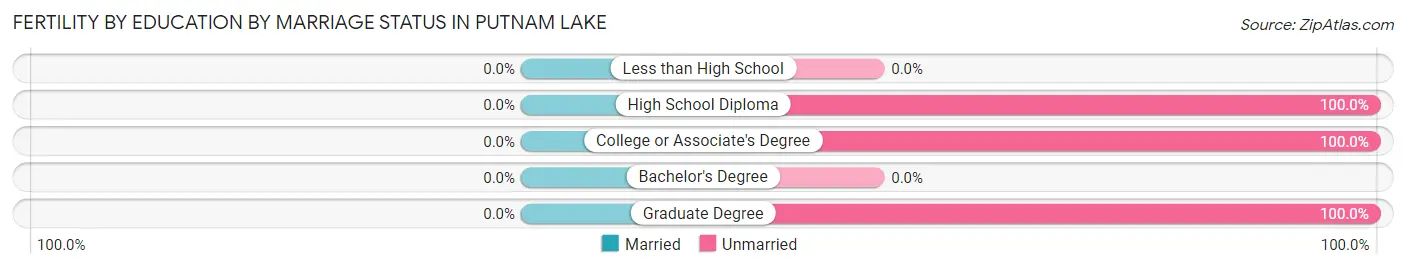
| Educational Attainment | Married | Unmarried |
| Less than High School | 0 (0.0%) | 0 (0.0%) |
| High School Diploma | 0 (0.0%) | 24 (100.0%) |
| College or Associate's Degree | 0 (0.0%) | 26 (100.0%) |
| Bachelor's Degree | 0 (0.0%) | 0 (0.0%) |
| Graduate Degree | 0 (0.0%) | 21 (100.0%) |
| Total | 0 (0.0%) | 71 (100.0%) |
Employment Characteristics in Putnam Lake
Employment by Class of Employer in Putnam Lake
Among the 1,933 employed individuals in Putnam Lake, private company employees (1,067 | 55.2%), local government employees (353 | 18.3%), and not-for-profit organizations (242 | 12.5%) make up the most common classes of employment.
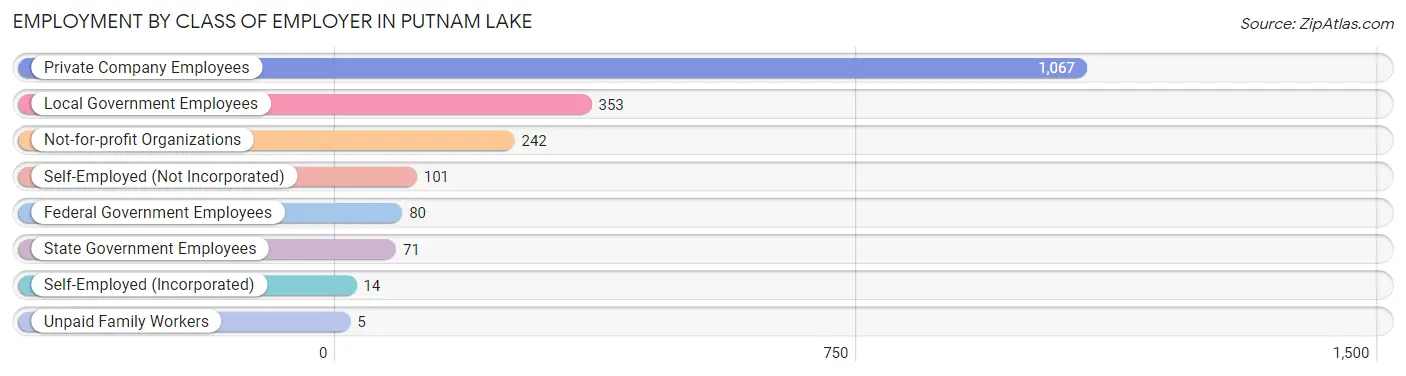
| Employer Class | # Employees | % Employees |
| Private Company Employees | 1,067 | 55.2% |
| Self-Employed (Incorporated) | 14 | 0.7% |
| Self-Employed (Not Incorporated) | 101 | 5.2% |
| Not-for-profit Organizations | 242 | 12.5% |
| Local Government Employees | 353 | 18.3% |
| State Government Employees | 71 | 3.7% |
| Federal Government Employees | 80 | 4.1% |
| Unpaid Family Workers | 5 | 0.3% |
| Total | 1,933 | 100.0% |
Employment Status by Age in Putnam Lake
According to the labor force statistics for Putnam Lake, out of the total population over 16 years of age (3,352), 63.4% or 2,125 individuals are in the labor force, with 7.2% or 153 of them unemployed. The age group with the highest labor force participation rate is 25 to 29 years, with 98.6% or 208 individuals in the labor force. Within the labor force, the 55 to 59 years age range has the highest percentage of unemployed individuals, with 28.1% or 92 of them being unemployed.
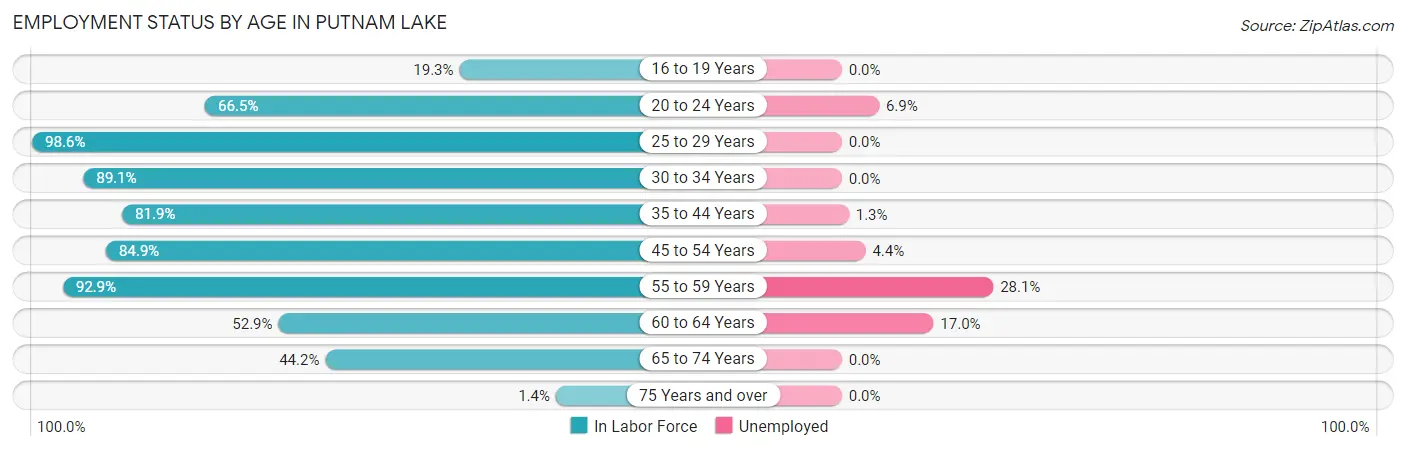
| Age Bracket | In Labor Force | Unemployed |
| 16 to 19 Years | 26 (19.3%) | 0 (0.0%) |
| 20 to 24 Years | 175 (66.5%) | 12 (6.9%) |
| 25 to 29 Years | 208 (98.6%) | 0 (0.0%) |
| 30 to 34 Years | 179 (89.1%) | 0 (0.0%) |
| 35 to 44 Years | 393 (81.9%) | 5 (1.3%) |
| 45 to 54 Years | 457 (84.9%) | 20 (4.4%) |
| 55 to 59 Years | 327 (92.9%) | 92 (28.1%) |
| 60 to 64 Years | 147 (52.9%) | 25 (17.0%) |
| 65 to 74 Years | 208 (44.2%) | 0 (0.0%) |
| 75 Years and over | 6 (1.4%) | 0 (0.0%) |
| Total | 2,125 (63.4%) | 153 (7.2%) |
Employment Status by Educational Attainment in Putnam Lake
According to labor force statistics for Putnam Lake, 83.1% of individuals (1,712) out of the total population between 25 and 64 years of age (2,060) are in the labor force, with 8.3% or 142 of them being unemployed. The group with the highest labor force participation rate are those with the educational attainment of college / associate degree, with 89.0% or 591 individuals in the labor force. Within the labor force, individuals with college / associate degree education have the highest percentage of unemployment, with 19.8% or 117 of them being unemployed.
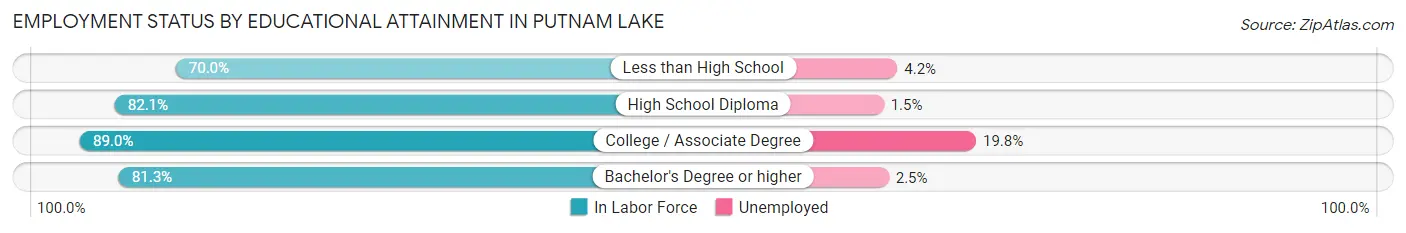
| Educational Attainment | In Labor Force | Unemployed |
| Less than High School | 119 (70.0%) | 7 (4.2%) |
| High School Diploma | 481 (82.1%) | 9 (1.5%) |
| College / Associate Degree | 591 (89.0%) | 131 (19.8%) |
| Bachelor's Degree or higher | 520 (81.3%) | 16 (2.5%) |
| Total | 1,712 (83.1%) | 171 (8.3%) |
Employment Occupations by Sex in Putnam Lake
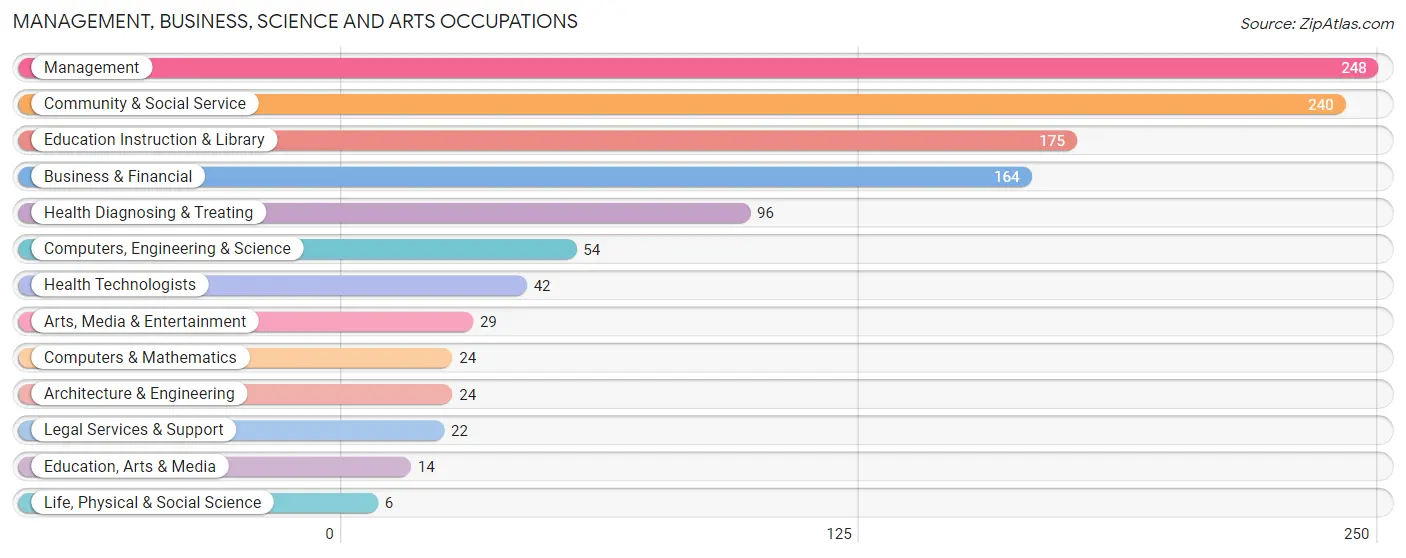
Management, Business, Science and Arts Occupations
The most common Management, Business, Science and Arts occupations in Putnam Lake are Management (248 | 12.6%), Community & Social Service (240 | 12.2%), Education Instruction & Library (175 | 8.9%), Business & Financial (164 | 8.3%), and Health Diagnosing & Treating (96 | 4.9%).
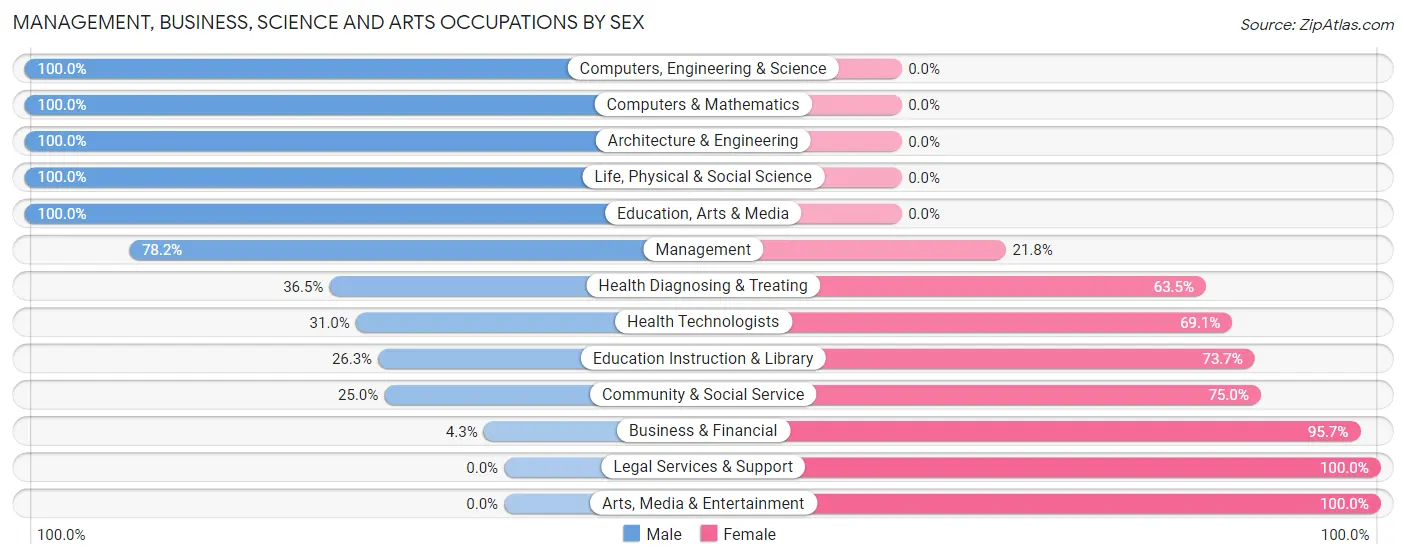
Management, Business, Science and Arts Occupations by Sex
Within the Management, Business, Science and Arts occupations in Putnam Lake, the most male-oriented occupations are Computers, Engineering & Science (100.0%), Computers & Mathematics (100.0%), and Architecture & Engineering (100.0%), while the most female-oriented occupations are Legal Services & Support (100.0%), Arts, Media & Entertainment (100.0%), and Business & Financial (95.7%).
| Occupation | Male | Female |
| Management | 194 (78.2%) | 54 (21.8%) |
| Business & Financial | 7 (4.3%) | 157 (95.7%) |
| Computers, Engineering & Science | 54 (100.0%) | 0 (0.0%) |
| Computers & Mathematics | 24 (100.0%) | 0 (0.0%) |
| Architecture & Engineering | 24 (100.0%) | 0 (0.0%) |
| Life, Physical & Social Science | 6 (100.0%) | 0 (0.0%) |
| Community & Social Service | 60 (25.0%) | 180 (75.0%) |
| Education, Arts & Media | 14 (100.0%) | 0 (0.0%) |
| Legal Services & Support | 0 (0.0%) | 22 (100.0%) |
| Education Instruction & Library | 46 (26.3%) | 129 (73.7%) |
| Arts, Media & Entertainment | 0 (0.0%) | 29 (100.0%) |
| Health Diagnosing & Treating | 35 (36.5%) | 61 (63.5%) |
| Health Technologists | 13 (30.9%) | 29 (69.1%) |
| Total (Category) | 350 (43.6%) | 452 (56.4%) |
| Total (Overall) | 1,051 (53.3%) | 921 (46.7%) |
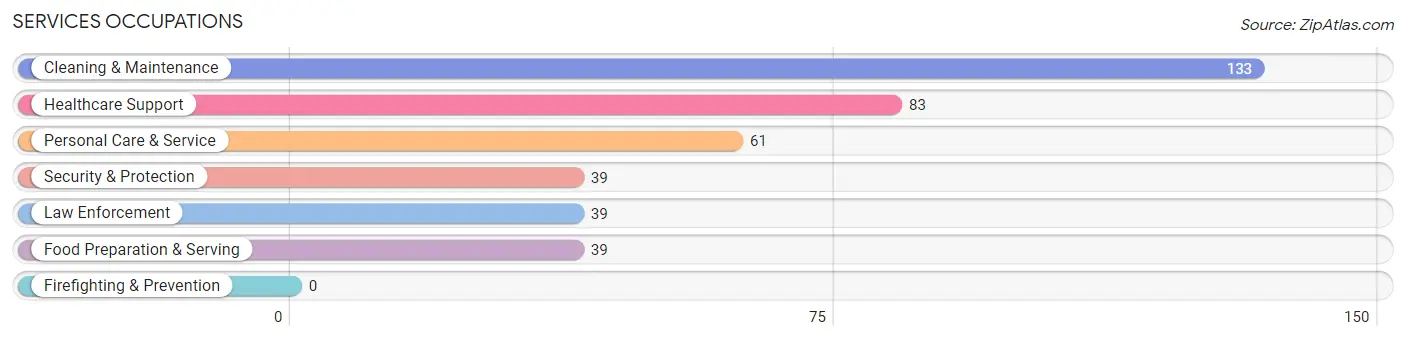
Services Occupations
The most common Services occupations in Putnam Lake are Cleaning & Maintenance (133 | 6.7%), Healthcare Support (83 | 4.2%), Personal Care & Service (61 | 3.1%), Security & Protection (39 | 2.0%), and Law Enforcement (39 | 2.0%).
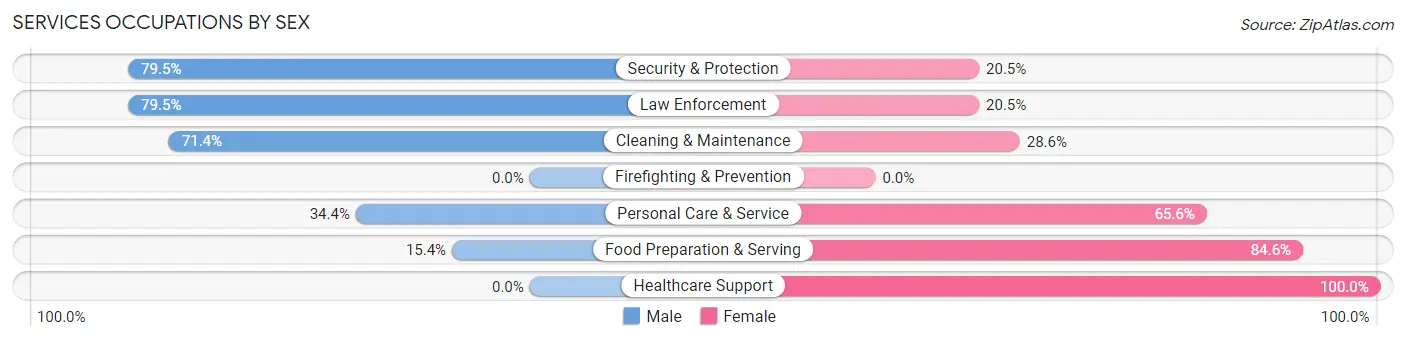
Services Occupations by Sex
Within the Services occupations in Putnam Lake, the most male-oriented occupations are Security & Protection (79.5%), Law Enforcement (79.5%), and Cleaning & Maintenance (71.4%), while the most female-oriented occupations are Healthcare Support (100.0%), Food Preparation & Serving (84.6%), and Personal Care & Service (65.6%).
| Occupation | Male | Female |
| Healthcare Support | 0 (0.0%) | 83 (100.0%) |
| Security & Protection | 31 (79.5%) | 8 (20.5%) |
| Firefighting & Prevention | 0 (0.0%) | 0 (0.0%) |
| Law Enforcement | 31 (79.5%) | 8 (20.5%) |
| Food Preparation & Serving | 6 (15.4%) | 33 (84.6%) |
| Cleaning & Maintenance | 95 (71.4%) | 38 (28.6%) |
| Personal Care & Service | 21 (34.4%) | 40 (65.6%) |
| Total (Category) | 153 (43.1%) | 202 (56.9%) |
| Total (Overall) | 1,051 (53.3%) | 921 (46.7%) |
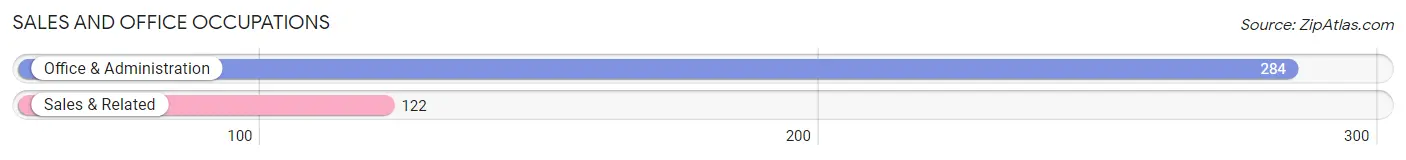
Sales and Office Occupations
The most common Sales and Office occupations in Putnam Lake are Office & Administration (284 | 14.4%), and Sales & Related (122 | 6.2%).
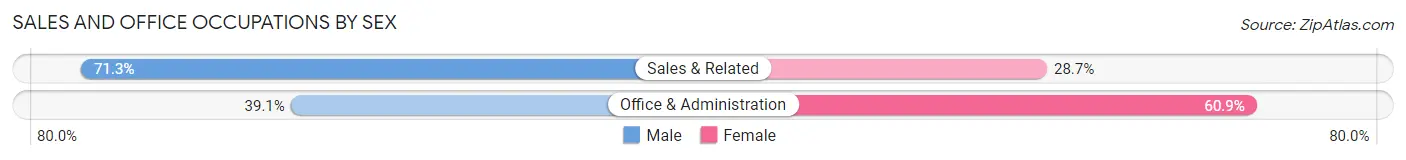
Sales and Office Occupations by Sex
| Occupation | Male | Female |
| Sales & Related | 87 (71.3%) | 35 (28.7%) |
| Office & Administration | 111 (39.1%) | 173 (60.9%) |
| Total (Category) | 198 (48.8%) | 208 (51.2%) |
| Total (Overall) | 1,051 (53.3%) | 921 (46.7%) |
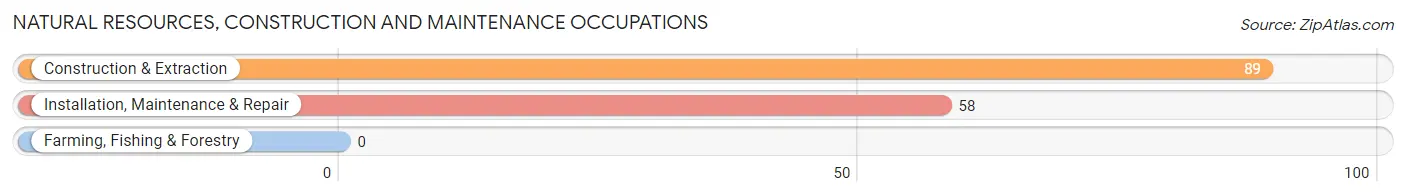
Natural Resources, Construction and Maintenance Occupations
The most common Natural Resources, Construction and Maintenance occupations in Putnam Lake are Construction & Extraction (89 | 4.5%), and Installation, Maintenance & Repair (58 | 2.9%).
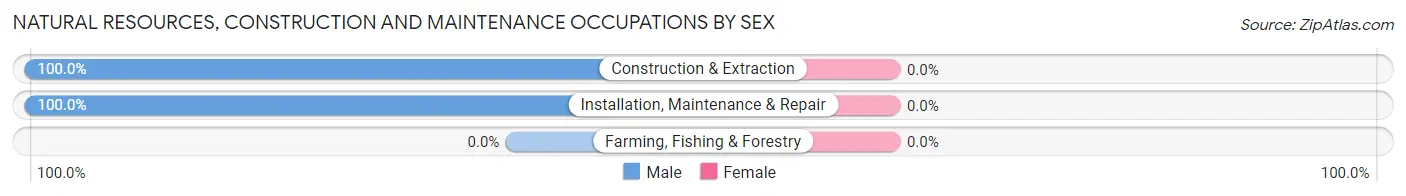
Natural Resources, Construction and Maintenance Occupations by Sex
| Occupation | Male | Female |
| Farming, Fishing & Forestry | 0 (0.0%) | 0 (0.0%) |
| Construction & Extraction | 89 (100.0%) | 0 (0.0%) |
| Installation, Maintenance & Repair | 58 (100.0%) | 0 (0.0%) |
| Total (Category) | 147 (100.0%) | 0 (0.0%) |
| Total (Overall) | 1,051 (53.3%) | 921 (46.7%) |
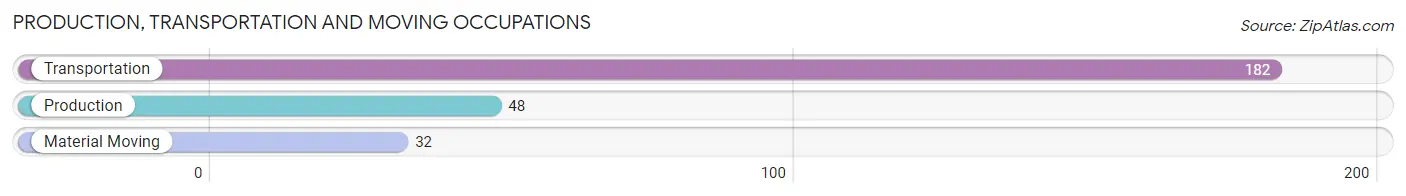
Production, Transportation and Moving Occupations
The most common Production, Transportation and Moving occupations in Putnam Lake are Transportation (182 | 9.2%), Production (48 | 2.4%), and Material Moving (32 | 1.6%).
Production, Transportation and Moving Occupations by Sex
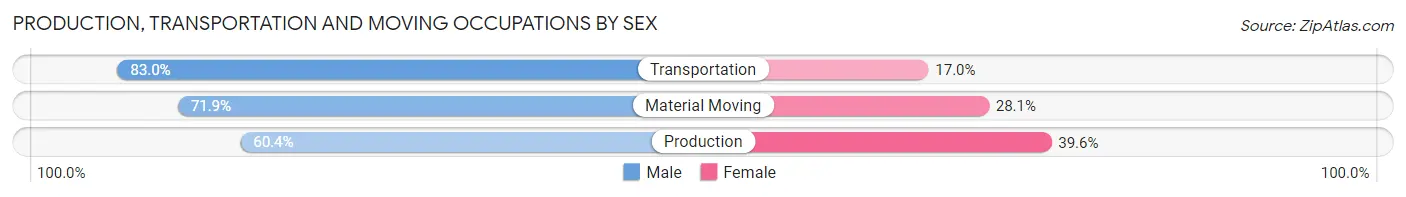
| Occupation | Male | Female |
| Production | 29 (60.4%) | 19 (39.6%) |
| Transportation | 151 (83.0%) | 31 (17.0%) |
| Material Moving | 23 (71.9%) | 9 (28.1%) |
| Total (Category) | 203 (77.5%) | 59 (22.5%) |
| Total (Overall) | 1,051 (53.3%) | 921 (46.7%) |
Employment Industries by Sex in Putnam Lake
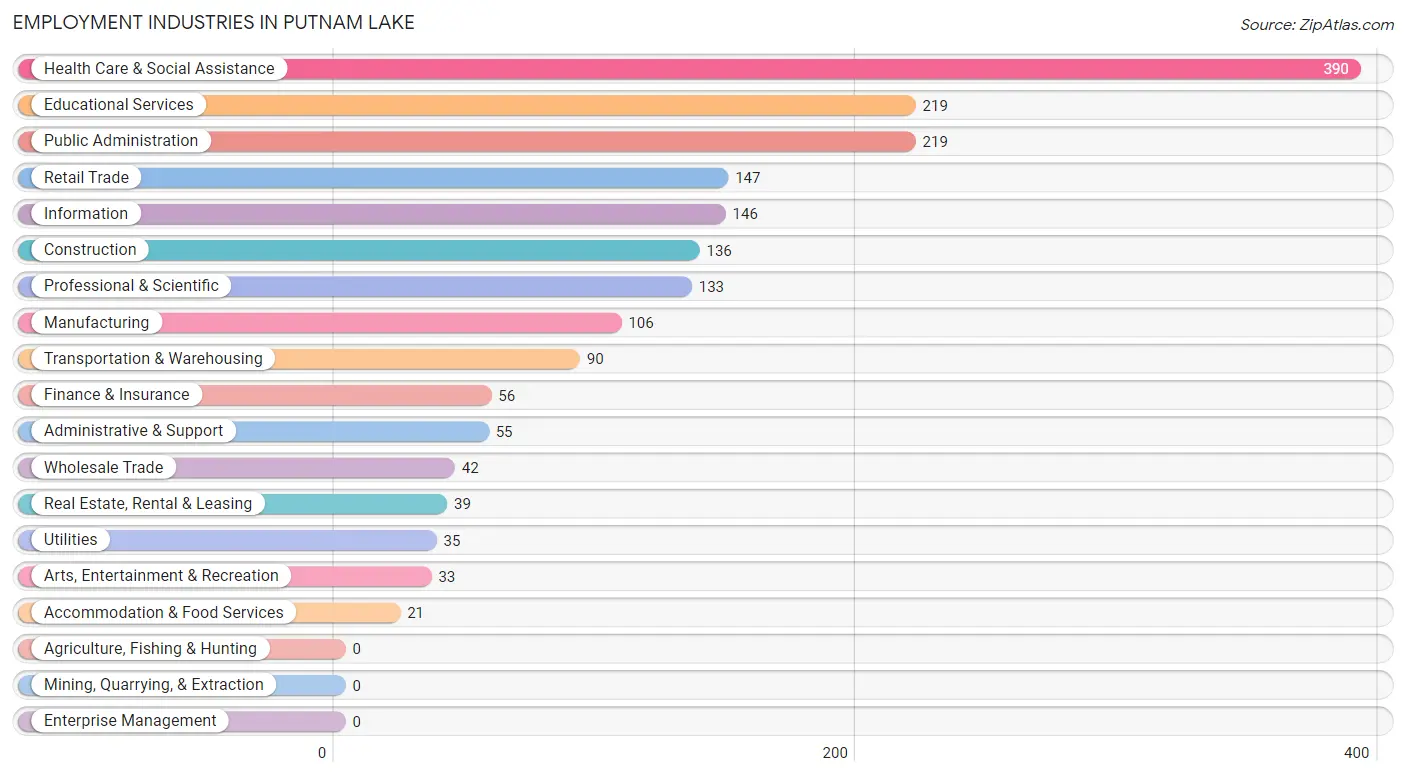
Employment Industries in Putnam Lake
The major employment industries in Putnam Lake include Health Care & Social Assistance (390 | 19.8%), Educational Services (219 | 11.1%), Public Administration (219 | 11.1%), Retail Trade (147 | 7.4%), and Information (146 | 7.4%).
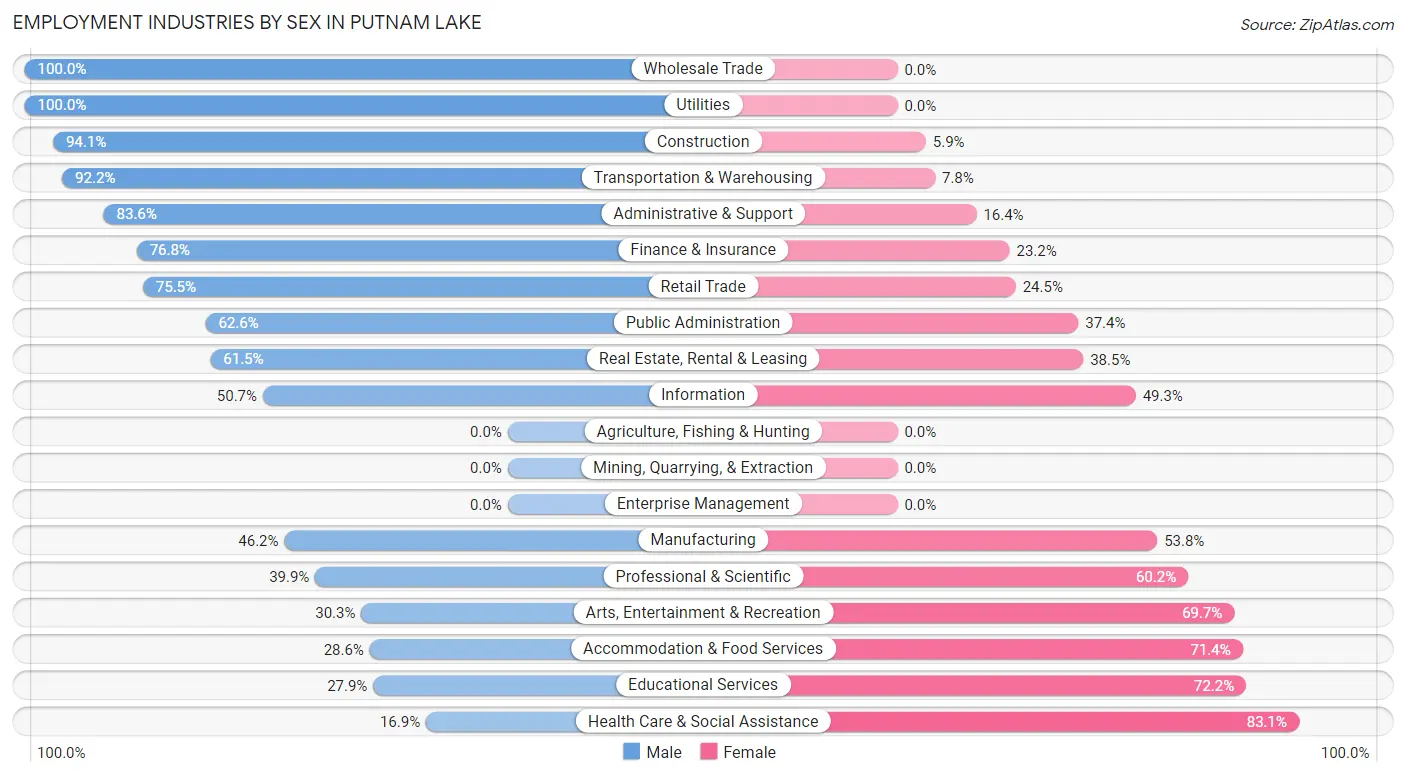
Employment Industries by Sex in Putnam Lake
The Putnam Lake industries that see more men than women are Wholesale Trade (100.0%), Utilities (100.0%), and Construction (94.1%), whereas the industries that tend to have a higher number of women are Health Care & Social Assistance (83.1%), Educational Services (72.2%), and Accommodation & Food Services (71.4%).
| Industry | Male | Female |
| Agriculture, Fishing & Hunting | 0 (0.0%) | 0 (0.0%) |
| Mining, Quarrying, & Extraction | 0 (0.0%) | 0 (0.0%) |
| Construction | 128 (94.1%) | 8 (5.9%) |
| Manufacturing | 49 (46.2%) | 57 (53.8%) |
| Wholesale Trade | 42 (100.0%) | 0 (0.0%) |
| Retail Trade | 111 (75.5%) | 36 (24.5%) |
| Transportation & Warehousing | 83 (92.2%) | 7 (7.8%) |
| Utilities | 35 (100.0%) | 0 (0.0%) |
| Information | 74 (50.7%) | 72 (49.3%) |
| Finance & Insurance | 43 (76.8%) | 13 (23.2%) |
| Real Estate, Rental & Leasing | 24 (61.5%) | 15 (38.5%) |
| Professional & Scientific | 53 (39.9%) | 80 (60.2%) |
| Enterprise Management | 0 (0.0%) | 0 (0.0%) |
| Administrative & Support | 46 (83.6%) | 9 (16.4%) |
| Educational Services | 61 (27.9%) | 158 (72.2%) |
| Health Care & Social Assistance | 66 (16.9%) | 324 (83.1%) |
| Arts, Entertainment & Recreation | 10 (30.3%) | 23 (69.7%) |
| Accommodation & Food Services | 6 (28.6%) | 15 (71.4%) |
| Public Administration | 137 (62.6%) | 82 (37.4%) |
| Total | 1,051 (53.3%) | 921 (46.7%) |
Education in Putnam Lake
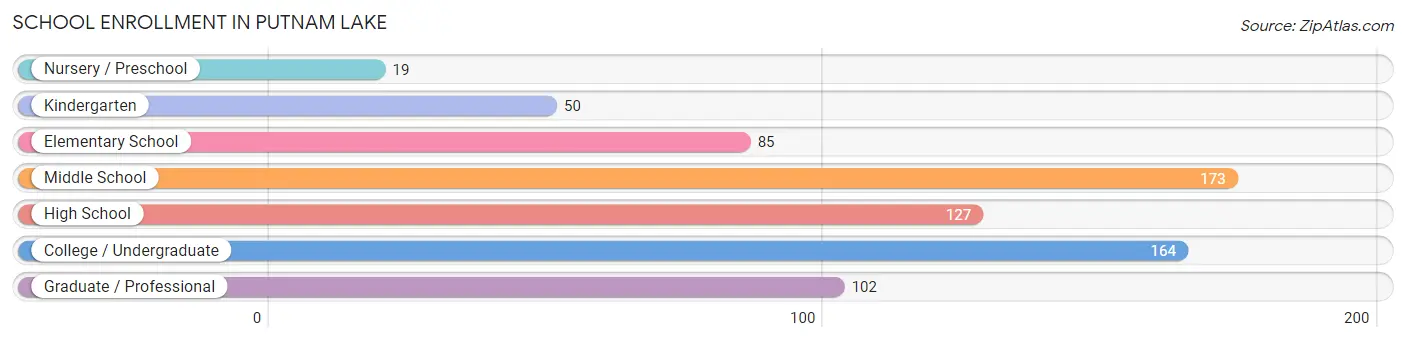
School Enrollment in Putnam Lake
The most common levels of schooling among the 720 students in Putnam Lake are middle school (173 | 24.0%), college / undergraduate (164 | 22.8%), and high school (127 | 17.6%).
| School Level | # Students | % Students |
| Nursery / Preschool | 19 | 2.6% |
| Kindergarten | 50 | 6.9% |
| Elementary School | 85 | 11.8% |
| Middle School | 173 | 24.0% |
| High School | 127 | 17.6% |
| College / Undergraduate | 164 | 22.8% |
| Graduate / Professional | 102 | 14.2% |
| Total | 720 | 100.0% |
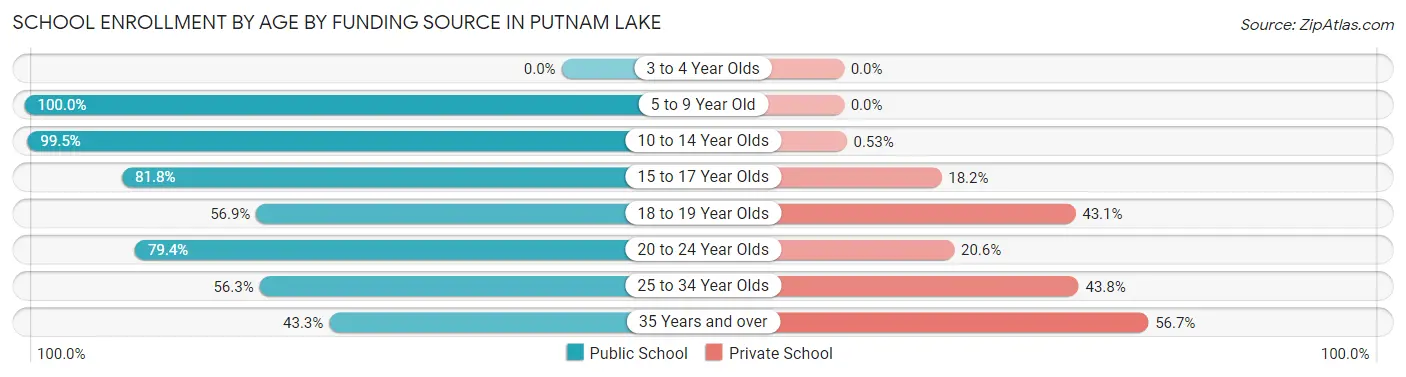
School Enrollment by Age by Funding Source in Putnam Lake
Out of a total of 720 students who are enrolled in schools in Putnam Lake, 132 (18.3%) attend a private institution, while the remaining 588 (81.7%) are enrolled in public schools. The age group of 35 years and over has the highest likelihood of being enrolled in private schools, with 38 (56.7% in the age bracket) enrolled. Conversely, the age group of 5 to 9 year old has the lowest likelihood of being enrolled in a private school, with 151 (100.0% in the age bracket) attending a public institution.
| Age Bracket | Public School | Private School |
| 3 to 4 Year Olds | 0 (0.0%) | 0 (0.0%) |
| 5 to 9 Year Old | 151 (100.0%) | 0 (0.0%) |
| 10 to 14 Year Olds | 186 (99.5%) | 1 (0.5%) |
| 15 to 17 Year Olds | 63 (81.8%) | 14 (18.2%) |
| 18 to 19 Year Olds | 29 (56.9%) | 22 (43.1%) |
| 20 to 24 Year Olds | 85 (79.4%) | 22 (20.6%) |
| 25 to 34 Year Olds | 45 (56.2%) | 35 (43.8%) |
| 35 Years and over | 29 (43.3%) | 38 (56.7%) |
| Total | 588 (81.7%) | 132 (18.3%) |
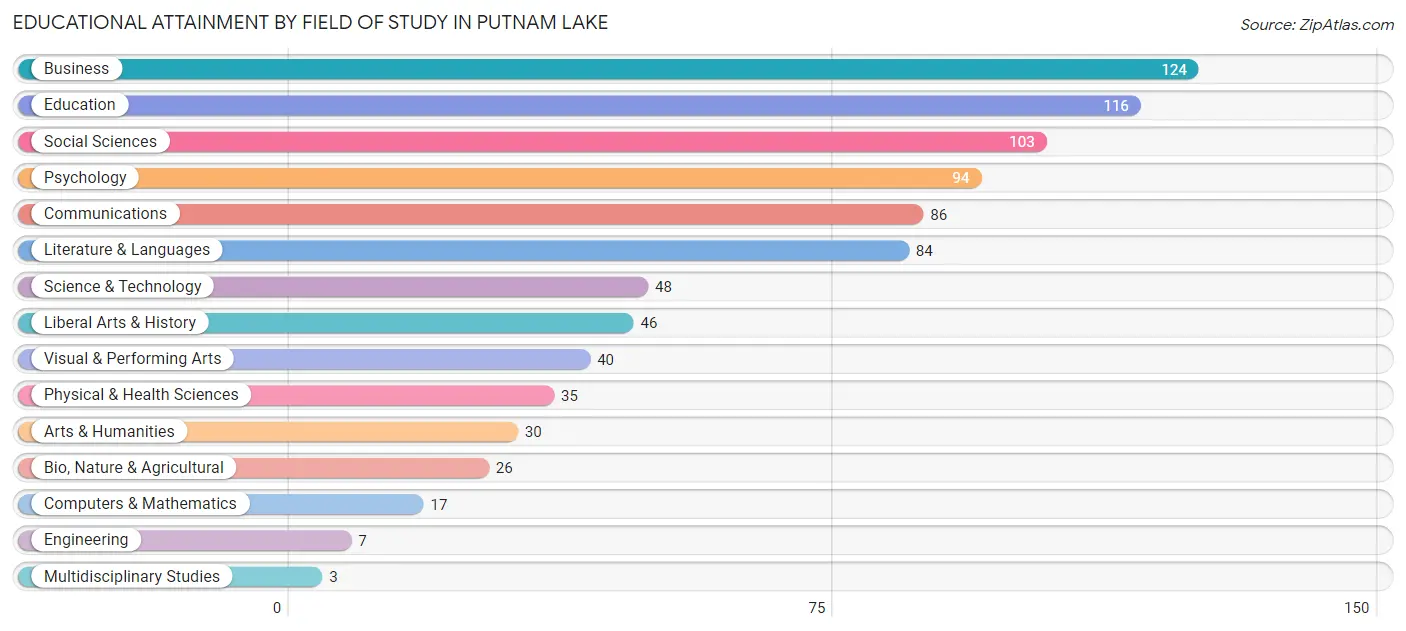
Educational Attainment by Field of Study in Putnam Lake
Business (124 | 14.4%), education (116 | 13.5%), social sciences (103 | 12.0%), psychology (94 | 10.9%), and communications (86 | 10.0%) are the most common fields of study among 859 individuals in Putnam Lake who have obtained a bachelor's degree or higher.
| Field of Study | # Graduates | % Graduates |
| Computers & Mathematics | 17 | 2.0% |
| Bio, Nature & Agricultural | 26 | 3.0% |
| Physical & Health Sciences | 35 | 4.1% |
| Psychology | 94 | 10.9% |
| Social Sciences | 103 | 12.0% |
| Engineering | 7 | 0.8% |
| Multidisciplinary Studies | 3 | 0.4% |
| Science & Technology | 48 | 5.6% |
| Business | 124 | 14.4% |
| Education | 116 | 13.5% |
| Literature & Languages | 84 | 9.8% |
| Liberal Arts & History | 46 | 5.4% |
| Visual & Performing Arts | 40 | 4.7% |
| Communications | 86 | 10.0% |
| Arts & Humanities | 30 | 3.5% |
| Total | 859 | 100.0% |
Transportation & Commute in Putnam Lake
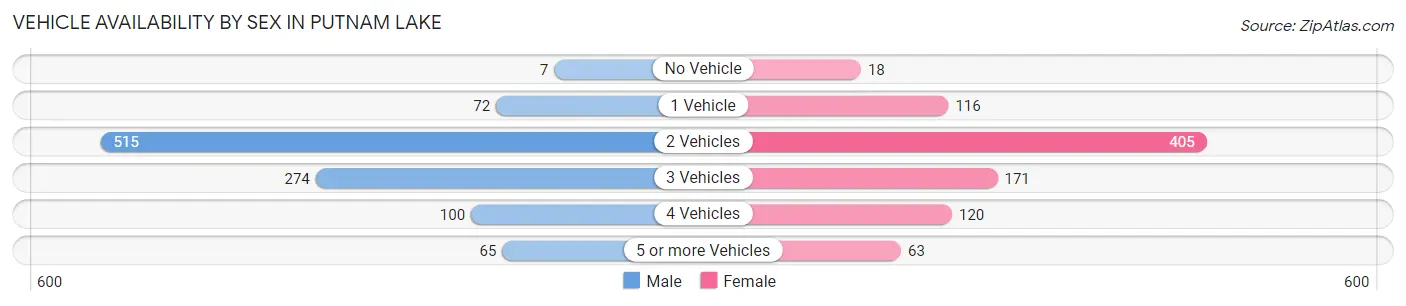
Vehicle Availability by Sex in Putnam Lake
The most prevalent vehicle ownership categories in Putnam Lake are males with 2 vehicles (515, accounting for 49.8%) and females with 2 vehicles (405, making up 57.7%).
| Vehicles Available | Male | Female |
| No Vehicle | 7 (0.7%) | 18 (2.0%) |
| 1 Vehicle | 72 (7.0%) | 116 (13.0%) |
| 2 Vehicles | 515 (49.8%) | 405 (45.4%) |
| 3 Vehicles | 274 (26.5%) | 171 (19.2%) |
| 4 Vehicles | 100 (9.7%) | 120 (13.4%) |
| 5 or more Vehicles | 65 (6.3%) | 63 (7.0%) |
| Total | 1,033 (100.0%) | 893 (100.0%) |
Commute Time in Putnam Lake
The most frequently occuring commute durations in Putnam Lake are 45 to 59 minutes (335 commuters, 19.3%), 30 to 34 minutes (298 commuters, 17.2%), and 10 to 14 minutes (221 commuters, 12.7%).
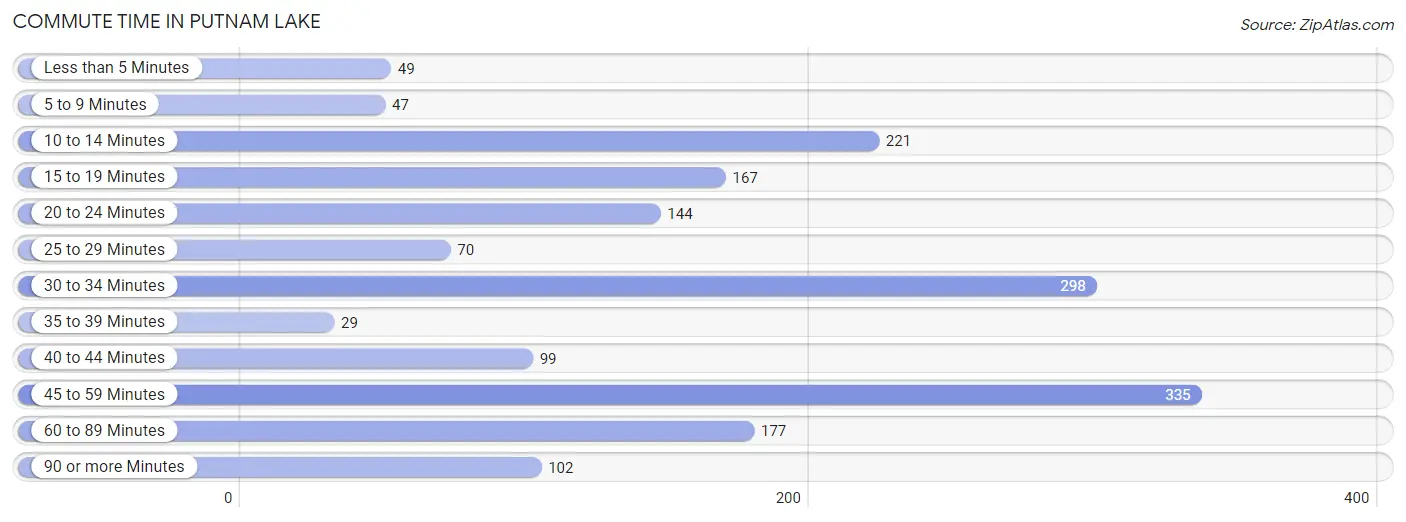
| Commute Time | # Commuters | % Commuters |
| Less than 5 Minutes | 49 | 2.8% |
| 5 to 9 Minutes | 47 | 2.7% |
| 10 to 14 Minutes | 221 | 12.7% |
| 15 to 19 Minutes | 167 | 9.6% |
| 20 to 24 Minutes | 144 | 8.3% |
| 25 to 29 Minutes | 70 | 4.0% |
| 30 to 34 Minutes | 298 | 17.2% |
| 35 to 39 Minutes | 29 | 1.7% |
| 40 to 44 Minutes | 99 | 5.7% |
| 45 to 59 Minutes | 335 | 19.3% |
| 60 to 89 Minutes | 177 | 10.2% |
| 90 or more Minutes | 102 | 5.9% |
Commute Time by Sex in Putnam Lake
The most common commute times in Putnam Lake are 45 to 59 minutes (282 commuters, 30.0%) for males and 30 to 34 minutes (122 commuters, 15.3%) for females.
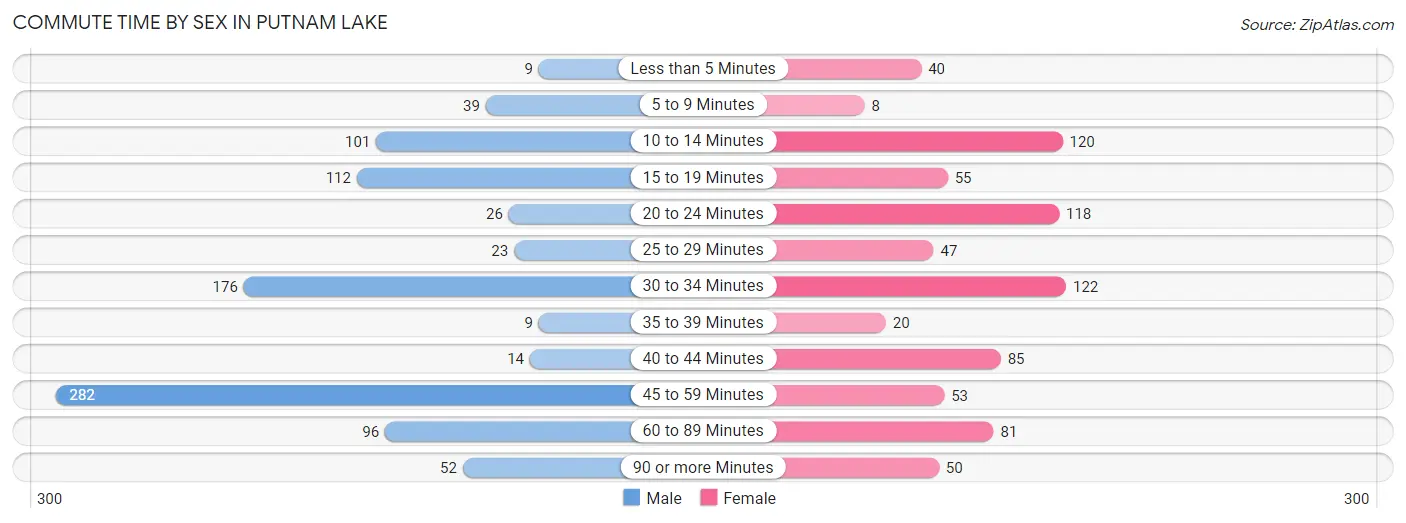
| Commute Time | Male | Female |
| Less than 5 Minutes | 9 (1.0%) | 40 (5.0%) |
| 5 to 9 Minutes | 39 (4.2%) | 8 (1.0%) |
| 10 to 14 Minutes | 101 (10.8%) | 120 (15.0%) |
| 15 to 19 Minutes | 112 (11.9%) | 55 (6.9%) |
| 20 to 24 Minutes | 26 (2.8%) | 118 (14.8%) |
| 25 to 29 Minutes | 23 (2.5%) | 47 (5.9%) |
| 30 to 34 Minutes | 176 (18.7%) | 122 (15.3%) |
| 35 to 39 Minutes | 9 (1.0%) | 20 (2.5%) |
| 40 to 44 Minutes | 14 (1.5%) | 85 (10.6%) |
| 45 to 59 Minutes | 282 (30.0%) | 53 (6.6%) |
| 60 to 89 Minutes | 96 (10.2%) | 81 (10.1%) |
| 90 or more Minutes | 52 (5.5%) | 50 (6.3%) |
Time of Departure to Work by Sex in Putnam Lake
The most frequent times of departure to work in Putnam Lake are 6:30 AM to 6:59 AM (140, 14.9%) for males and 8:00 AM to 8:29 AM (158, 19.8%) for females.
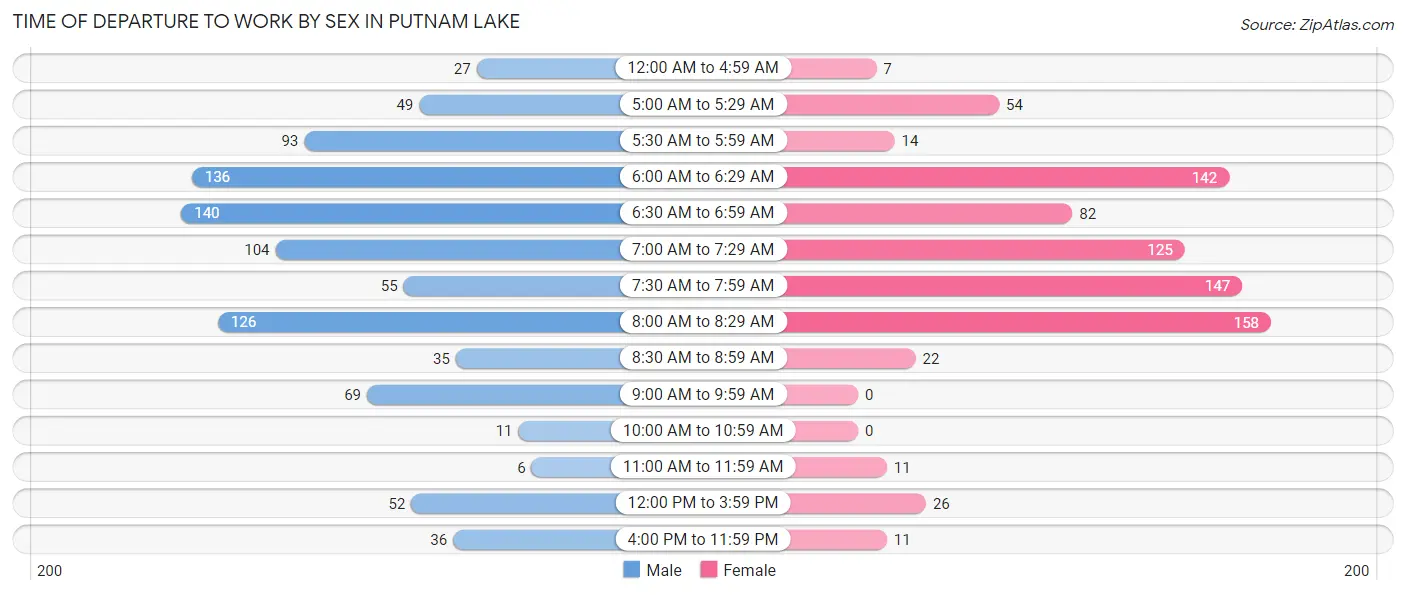
| Time of Departure | Male | Female |
| 12:00 AM to 4:59 AM | 27 (2.9%) | 7 (0.9%) |
| 5:00 AM to 5:29 AM | 49 (5.2%) | 54 (6.8%) |
| 5:30 AM to 5:59 AM | 93 (9.9%) | 14 (1.8%) |
| 6:00 AM to 6:29 AM | 136 (14.5%) | 142 (17.8%) |
| 6:30 AM to 6:59 AM | 140 (14.9%) | 82 (10.3%) |
| 7:00 AM to 7:29 AM | 104 (11.1%) | 125 (15.6%) |
| 7:30 AM to 7:59 AM | 55 (5.9%) | 147 (18.4%) |
| 8:00 AM to 8:29 AM | 126 (13.4%) | 158 (19.8%) |
| 8:30 AM to 8:59 AM | 35 (3.7%) | 22 (2.8%) |
| 9:00 AM to 9:59 AM | 69 (7.3%) | 0 (0.0%) |
| 10:00 AM to 10:59 AM | 11 (1.2%) | 0 (0.0%) |
| 11:00 AM to 11:59 AM | 6 (0.6%) | 11 (1.4%) |
| 12:00 PM to 3:59 PM | 52 (5.5%) | 26 (3.3%) |
| 4:00 PM to 11:59 PM | 36 (3.8%) | 11 (1.4%) |
| Total | 939 (100.0%) | 799 (100.0%) |
Housing Occupancy in Putnam Lake
Occupancy by Ownership in Putnam Lake
Of the total 1,389 dwellings in Putnam Lake, owner-occupied units account for 1,244 (89.6%), while renter-occupied units make up 145 (10.4%).
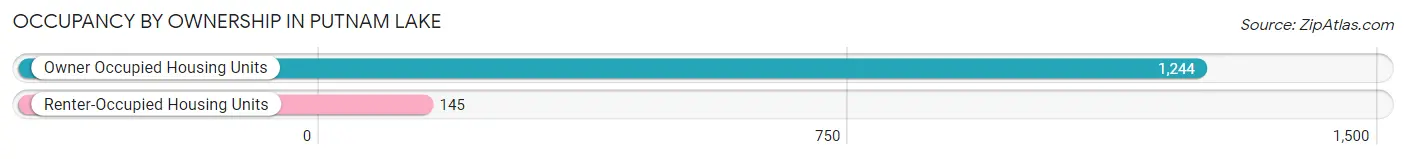
| Occupancy | # Housing Units | % Housing Units |
| Owner Occupied Housing Units | 1,244 | 89.6% |
| Renter-Occupied Housing Units | 145 | 10.4% |
| Total Occupied Housing Units | 1,389 | 100.0% |
Occupancy by Household Size in Putnam Lake
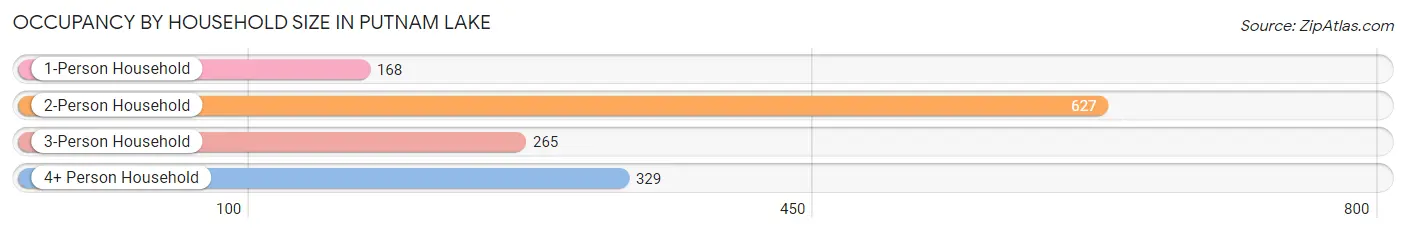
| Household Size | # Housing Units | % Housing Units |
| 1-Person Household | 168 | 12.1% |
| 2-Person Household | 627 | 45.1% |
| 3-Person Household | 265 | 19.1% |
| 4+ Person Household | 329 | 23.7% |
| Total Housing Units | 1,389 | 100.0% |
Occupancy by Ownership by Household Size in Putnam Lake
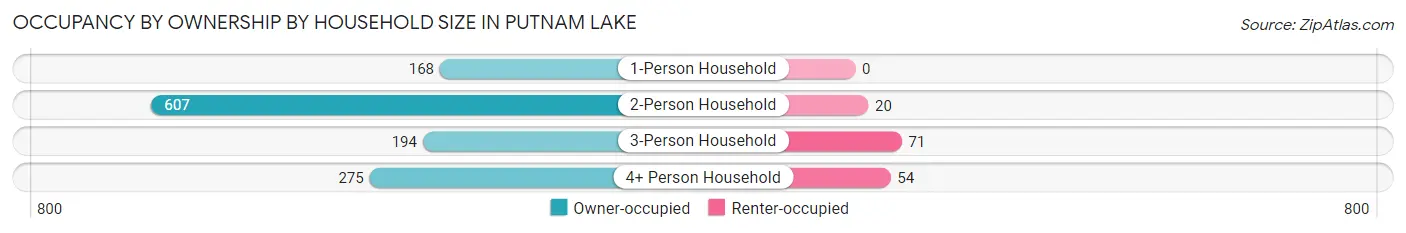
| Household Size | Owner-occupied | Renter-occupied |
| 1-Person Household | 168 (100.0%) | 0 (0.0%) |
| 2-Person Household | 607 (96.8%) | 20 (3.2%) |
| 3-Person Household | 194 (73.2%) | 71 (26.8%) |
| 4+ Person Household | 275 (83.6%) | 54 (16.4%) |
| Total Housing Units | 1,244 (89.6%) | 145 (10.4%) |
Occupancy by Educational Attainment in Putnam Lake
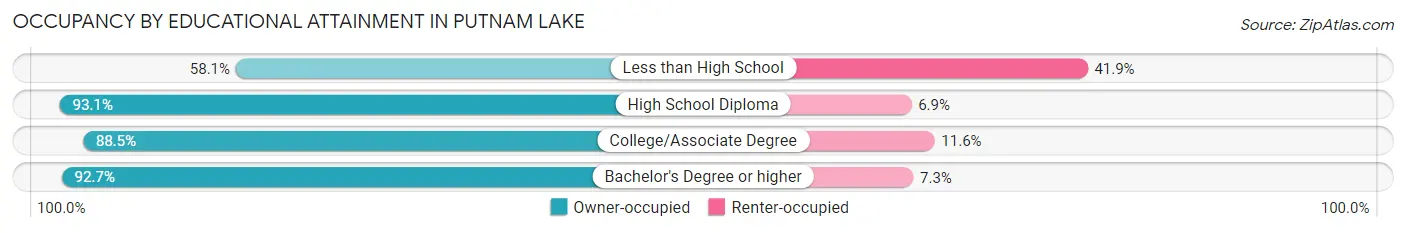
| Household Size | Owner-occupied | Renter-occupied |
| Less than High School | 43 (58.1%) | 31 (41.9%) |
| High School Diploma | 416 (93.1%) | 31 (6.9%) |
| College/Associate Degree | 406 (88.4%) | 53 (11.6%) |
| Bachelor's Degree or higher | 379 (92.7%) | 30 (7.3%) |
Occupancy by Age of Householder in Putnam Lake
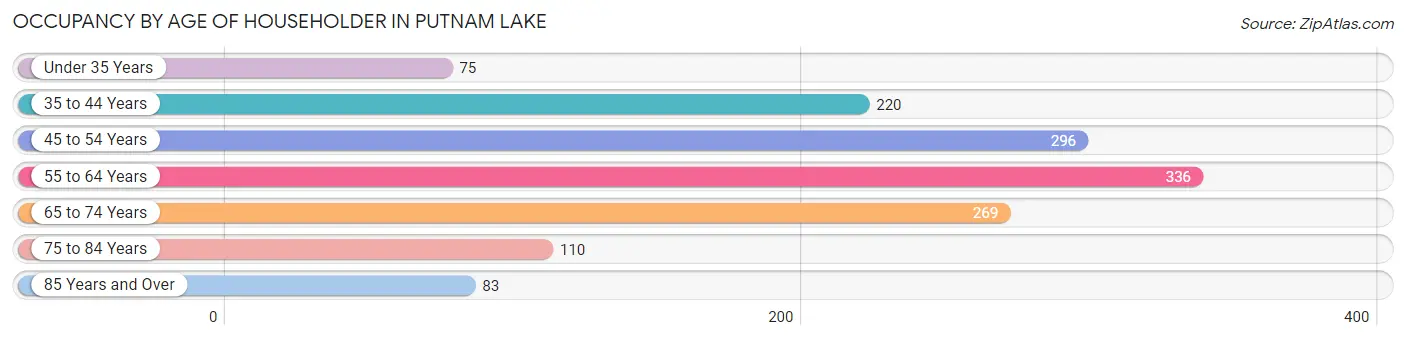
| Age Bracket | # Households | % Households |
| Under 35 Years | 75 | 5.4% |
| 35 to 44 Years | 220 | 15.8% |
| 45 to 54 Years | 296 | 21.3% |
| 55 to 64 Years | 336 | 24.2% |
| 65 to 74 Years | 269 | 19.4% |
| 75 to 84 Years | 110 | 7.9% |
| 85 Years and Over | 83 | 6.0% |
| Total | 1,389 | 100.0% |
Housing Finances in Putnam Lake
Median Income by Occupancy in Putnam Lake
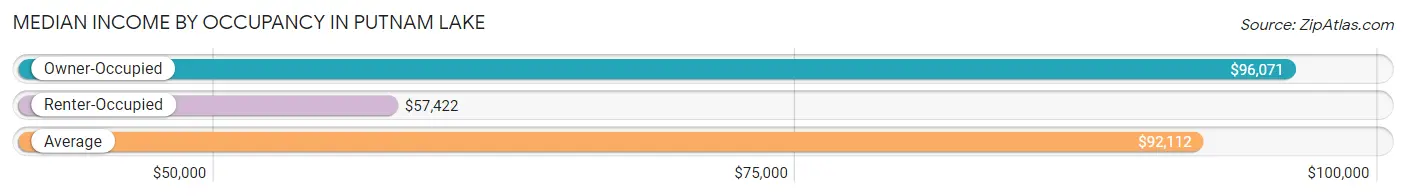
| Occupancy Type | # Households | Median Income |
| Owner-Occupied | 1,244 (89.6%) | $96,071 |
| Renter-Occupied | 145 (10.4%) | $57,422 |
| Average | 1,389 (100.0%) | $92,112 |
Occupancy by Householder Income Bracket in Putnam Lake
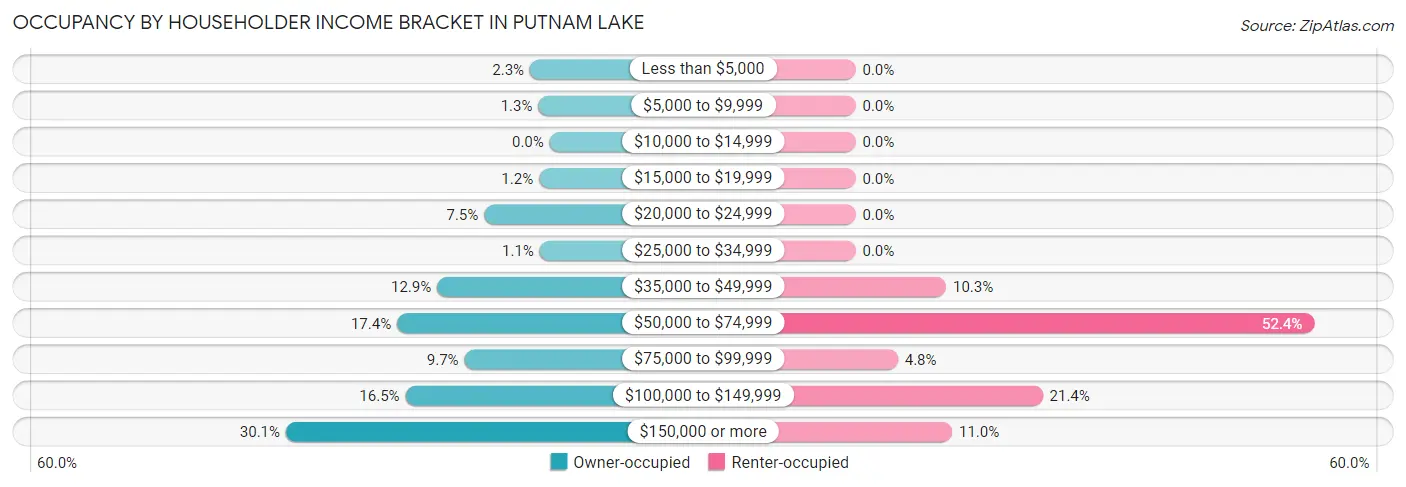
| Income Bracket | Owner-occupied | Renter-occupied |
| Less than $5,000 | 28 (2.2%) | 0 (0.0%) |
| $5,000 to $9,999 | 16 (1.3%) | 0 (0.0%) |
| $10,000 to $14,999 | 0 (0.0%) | 0 (0.0%) |
| $15,000 to $19,999 | 15 (1.2%) | 0 (0.0%) |
| $20,000 to $24,999 | 93 (7.5%) | 0 (0.0%) |
| $25,000 to $34,999 | 14 (1.1%) | 0 (0.0%) |
| $35,000 to $49,999 | 160 (12.9%) | 15 (10.3%) |
| $50,000 to $74,999 | 217 (17.4%) | 76 (52.4%) |
| $75,000 to $99,999 | 121 (9.7%) | 7 (4.8%) |
| $100,000 to $149,999 | 205 (16.5%) | 31 (21.4%) |
| $150,000 or more | 375 (30.1%) | 16 (11.0%) |
| Total | 1,244 (100.0%) | 145 (100.0%) |
Monthly Housing Cost Tiers in Putnam Lake
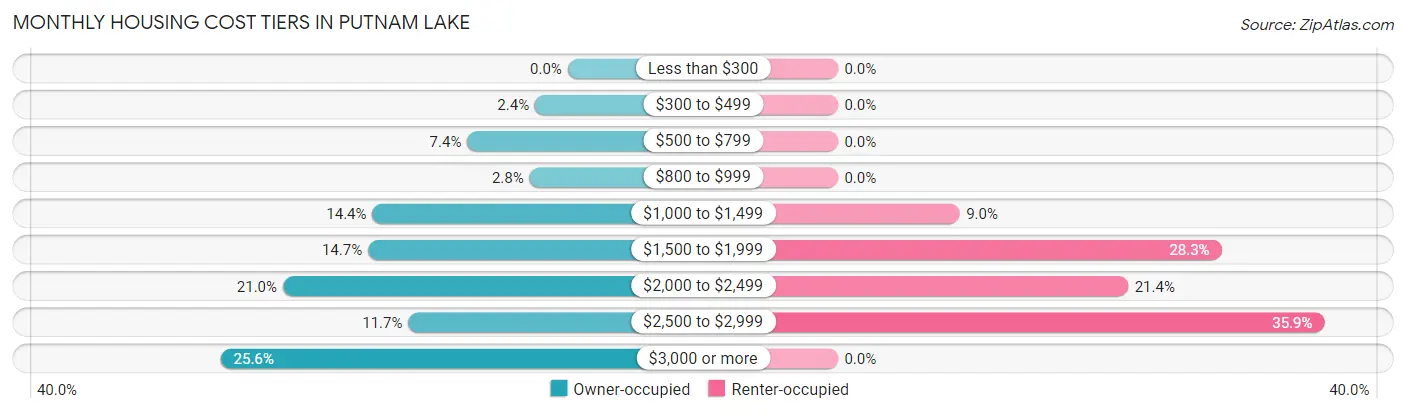
| Monthly Cost | Owner-occupied | Renter-occupied |
| Less than $300 | 0 (0.0%) | 0 (0.0%) |
| $300 to $499 | 30 (2.4%) | 0 (0.0%) |
| $500 to $799 | 92 (7.4%) | 0 (0.0%) |
| $800 to $999 | 35 (2.8%) | 0 (0.0%) |
| $1,000 to $1,499 | 179 (14.4%) | 13 (9.0%) |
| $1,500 to $1,999 | 183 (14.7%) | 41 (28.3%) |
| $2,000 to $2,499 | 261 (21.0%) | 31 (21.4%) |
| $2,500 to $2,999 | 146 (11.7%) | 52 (35.9%) |
| $3,000 or more | 318 (25.6%) | 0 (0.0%) |
| Total | 1,244 (100.0%) | 145 (100.0%) |
Physical Housing Characteristics in Putnam Lake
Housing Structures in Putnam Lake
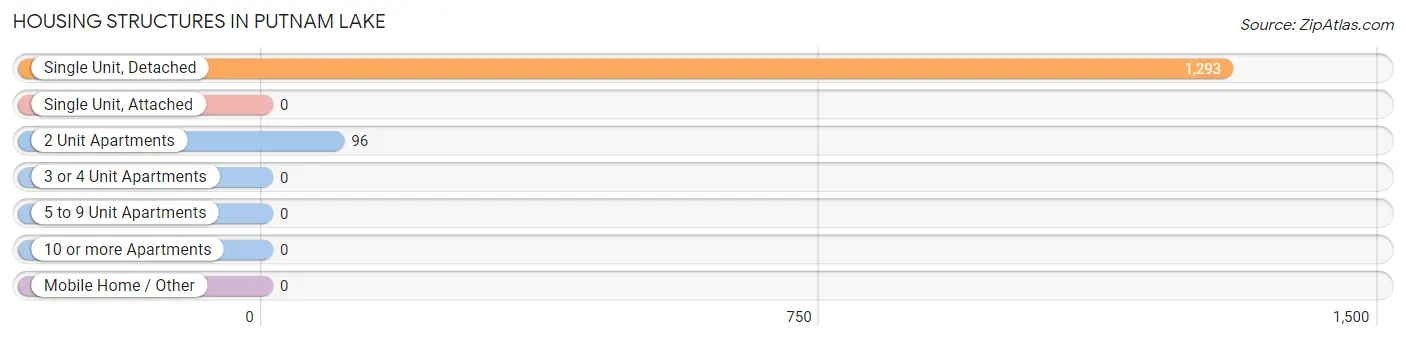
| Structure Type | # Housing Units | % Housing Units |
| Single Unit, Detached | 1,293 | 93.1% |
| Single Unit, Attached | 0 | 0.0% |
| 2 Unit Apartments | 96 | 6.9% |
| 3 or 4 Unit Apartments | 0 | 0.0% |
| 5 to 9 Unit Apartments | 0 | 0.0% |
| 10 or more Apartments | 0 | 0.0% |
| Mobile Home / Other | 0 | 0.0% |
| Total | 1,389 | 100.0% |
Housing Structures by Occupancy in Putnam Lake
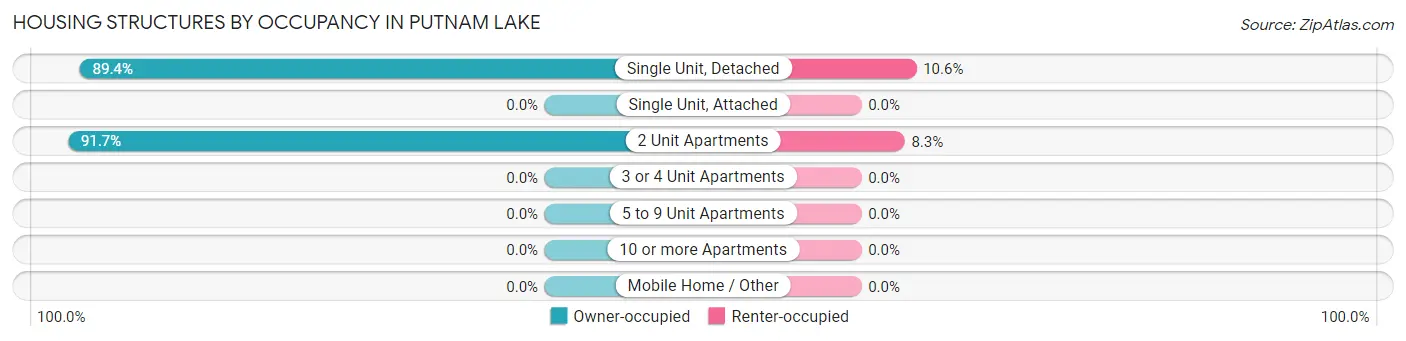
| Structure Type | Owner-occupied | Renter-occupied |
| Single Unit, Detached | 1,156 (89.4%) | 137 (10.6%) |
| Single Unit, Attached | 0 (0.0%) | 0 (0.0%) |
| 2 Unit Apartments | 88 (91.7%) | 8 (8.3%) |
| 3 or 4 Unit Apartments | 0 (0.0%) | 0 (0.0%) |
| 5 to 9 Unit Apartments | 0 (0.0%) | 0 (0.0%) |
| 10 or more Apartments | 0 (0.0%) | 0 (0.0%) |
| Mobile Home / Other | 0 (0.0%) | 0 (0.0%) |
| Total | 1,244 (89.6%) | 145 (10.4%) |
Housing Structures by Number of Rooms in Putnam Lake
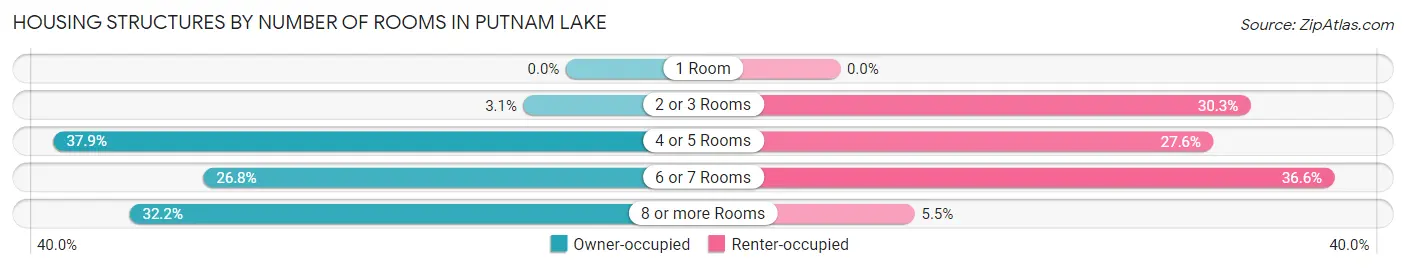
| Number of Rooms | Owner-occupied | Renter-occupied |
| 1 Room | 0 (0.0%) | 0 (0.0%) |
| 2 or 3 Rooms | 39 (3.1%) | 44 (30.3%) |
| 4 or 5 Rooms | 471 (37.9%) | 40 (27.6%) |
| 6 or 7 Rooms | 333 (26.8%) | 53 (36.5%) |
| 8 or more Rooms | 401 (32.2%) | 8 (5.5%) |
| Total | 1,244 (100.0%) | 145 (100.0%) |
Housing Structure by Heating Type in Putnam Lake
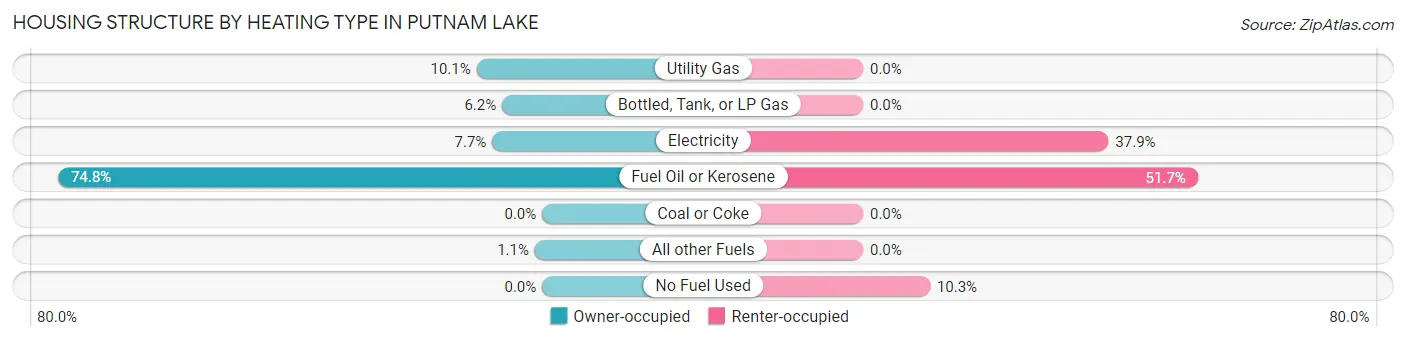
| Heating Type | Owner-occupied | Renter-occupied |
| Utility Gas | 126 (10.1%) | 0 (0.0%) |
| Bottled, Tank, or LP Gas | 77 (6.2%) | 0 (0.0%) |
| Electricity | 96 (7.7%) | 55 (37.9%) |
| Fuel Oil or Kerosene | 931 (74.8%) | 75 (51.7%) |
| Coal or Coke | 0 (0.0%) | 0 (0.0%) |
| All other Fuels | 14 (1.1%) | 0 (0.0%) |
| No Fuel Used | 0 (0.0%) | 15 (10.3%) |
| Total | 1,244 (100.0%) | 145 (100.0%) |
Household Vehicle Usage in Putnam Lake
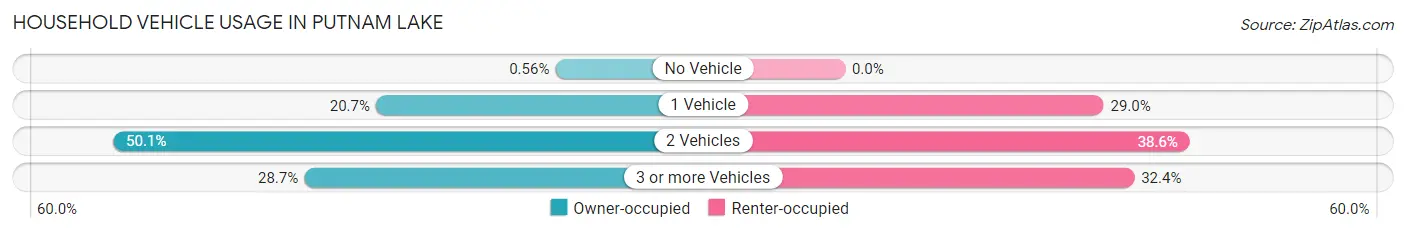
| Vehicles per Household | Owner-occupied | Renter-occupied |
| No Vehicle | 7 (0.6%) | 0 (0.0%) |
| 1 Vehicle | 257 (20.7%) | 42 (29.0%) |
| 2 Vehicles | 623 (50.1%) | 56 (38.6%) |
| 3 or more Vehicles | 357 (28.7%) | 47 (32.4%) |
| Total | 1,244 (100.0%) | 145 (100.0%) |
Real Estate & Mortgages in Putnam Lake
Real Estate and Mortgage Overview in Putnam Lake
| Characteristic | Without Mortgage | With Mortgage |
| Housing Units | 266 | 978 |
| Median Property Value | $333,300 | $310,500 |
| Median Household Income | $72,656 | $323 |
| Monthly Housing Costs | $950 | $311 |
| Real Estate Taxes | $6,470 | $8 |
Property Value by Mortgage Status in Putnam Lake
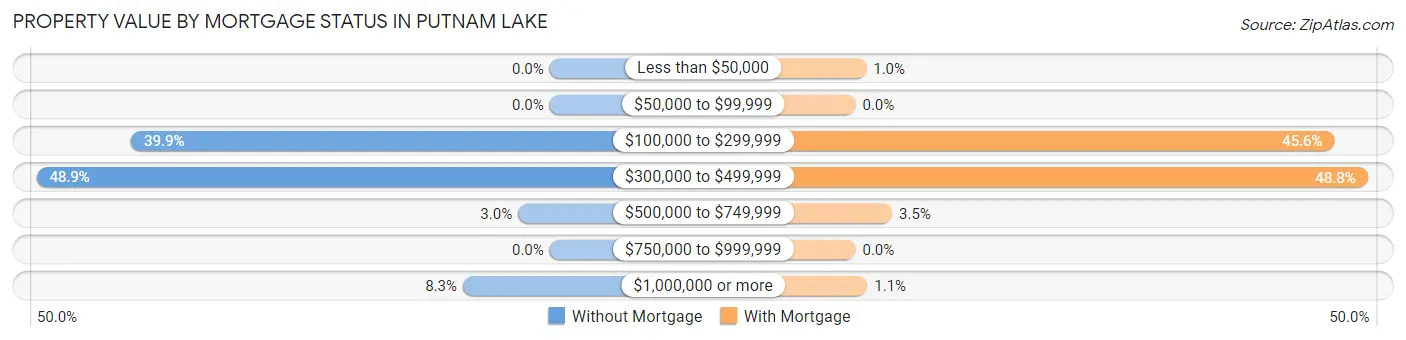
| Property Value | Without Mortgage | With Mortgage |
| Less than $50,000 | 0 (0.0%) | 10 (1.0%) |
| $50,000 to $99,999 | 0 (0.0%) | 0 (0.0%) |
| $100,000 to $299,999 | 106 (39.9%) | 446 (45.6%) |
| $300,000 to $499,999 | 130 (48.9%) | 477 (48.8%) |
| $500,000 to $749,999 | 8 (3.0%) | 34 (3.5%) |
| $750,000 to $999,999 | 0 (0.0%) | 0 (0.0%) |
| $1,000,000 or more | 22 (8.3%) | 11 (1.1%) |
| Total | 266 (100.0%) | 978 (100.0%) |
Household Income by Mortgage Status in Putnam Lake
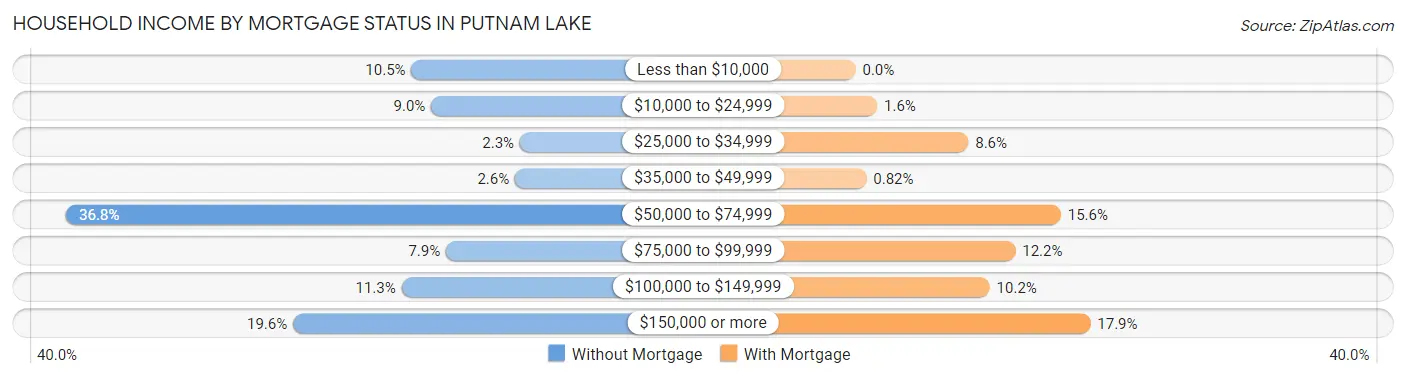
| Household Income | Without Mortgage | With Mortgage |
| Less than $10,000 | 28 (10.5%) | 0 (0.0%) |
| $10,000 to $24,999 | 24 (9.0%) | 16 (1.6%) |
| $25,000 to $34,999 | 6 (2.3%) | 84 (8.6%) |
| $35,000 to $49,999 | 7 (2.6%) | 8 (0.8%) |
| $50,000 to $74,999 | 98 (36.8%) | 153 (15.6%) |
| $75,000 to $99,999 | 21 (7.9%) | 119 (12.2%) |
| $100,000 to $149,999 | 30 (11.3%) | 100 (10.2%) |
| $150,000 or more | 52 (19.6%) | 175 (17.9%) |
| Total | 266 (100.0%) | 978 (100.0%) |
Property Value to Household Income Ratio in Putnam Lake
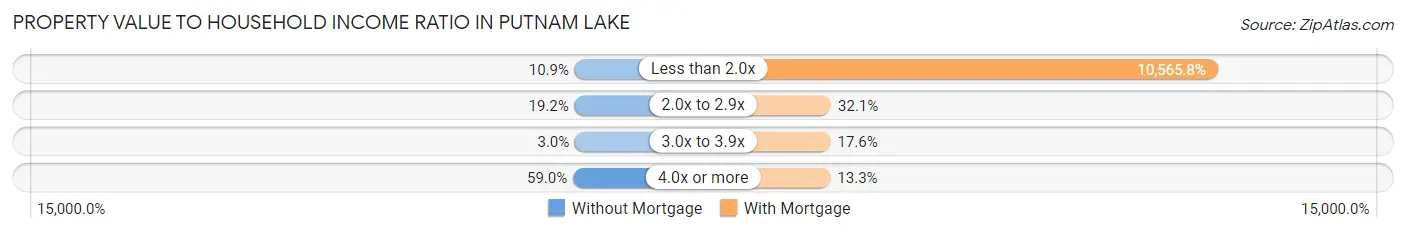
| Value-to-Income Ratio | Without Mortgage | With Mortgage |
| Less than 2.0x | 29 (10.9%) | 103,333 (10,565.7%) |
| 2.0x to 2.9x | 51 (19.2%) | 314 (32.1%) |
| 3.0x to 3.9x | 8 (3.0%) | 172 (17.6%) |
| 4.0x or more | 157 (59.0%) | 130 (13.3%) |
| Total | 266 (100.0%) | 978 (100.0%) |
Real Estate Taxes by Mortgage Status in Putnam Lake
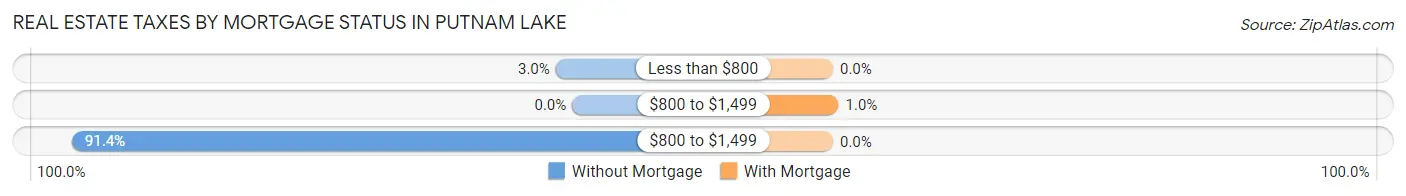
| Property Taxes | Without Mortgage | With Mortgage |
| Less than $800 | 8 (3.0%) | 0 (0.0%) |
| $800 to $1,499 | 0 (0.0%) | 10 (1.0%) |
| $800 to $1,499 | 243 (91.3%) | 0 (0.0%) |
| Total | 266 (100.0%) | 978 (100.0%) |
Health & Disability in Putnam Lake
Health Insurance Coverage by Age in Putnam Lake
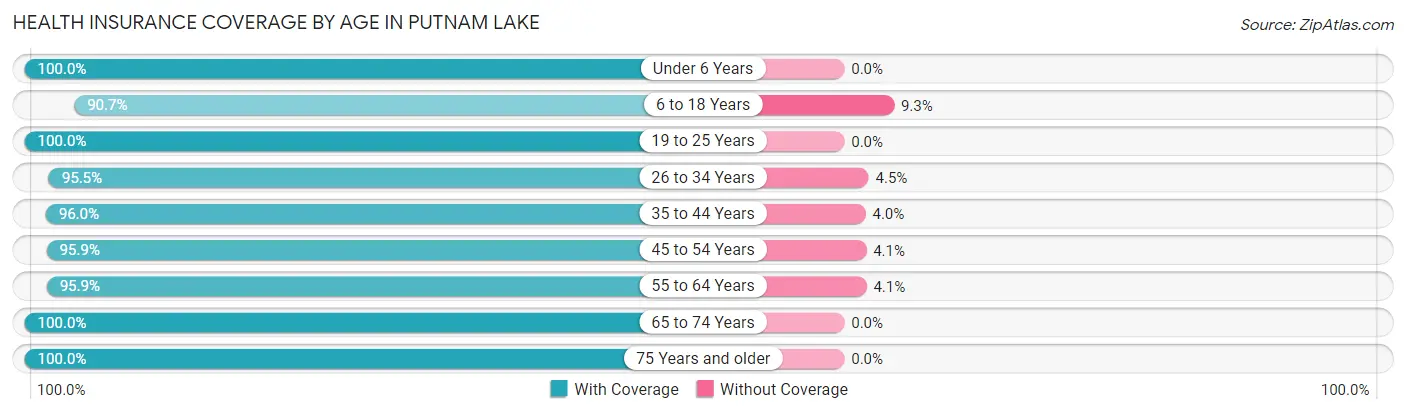
| Age Bracket | With Coverage | Without Coverage |
| Under 6 Years | 139 (100.0%) | 0 (0.0%) |
| 6 to 18 Years | 392 (90.7%) | 40 (9.3%) |
| 19 to 25 Years | 342 (100.0%) | 0 (0.0%) |
| 26 to 34 Years | 337 (95.5%) | 16 (4.5%) |
| 35 to 44 Years | 461 (96.0%) | 19 (4.0%) |
| 45 to 54 Years | 516 (95.9%) | 22 (4.1%) |
| 55 to 64 Years | 604 (95.9%) | 26 (4.1%) |
| 65 to 74 Years | 471 (100.0%) | 0 (0.0%) |
| 75 Years and older | 423 (100.0%) | 0 (0.0%) |
| Total | 3,685 (96.8%) | 123 (3.2%) |
Health Insurance Coverage by Citizenship Status in Putnam Lake
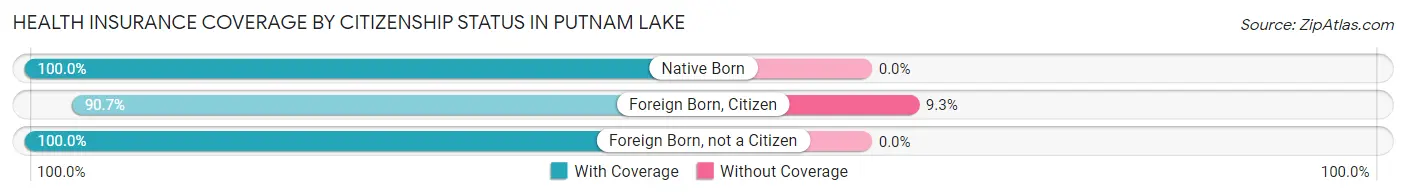
| Citizenship Status | With Coverage | Without Coverage |
| Native Born | 139 (100.0%) | 0 (0.0%) |
| Foreign Born, Citizen | 392 (90.7%) | 40 (9.3%) |
| Foreign Born, not a Citizen | 342 (100.0%) | 0 (0.0%) |
Health Insurance Coverage by Household Income in Putnam Lake
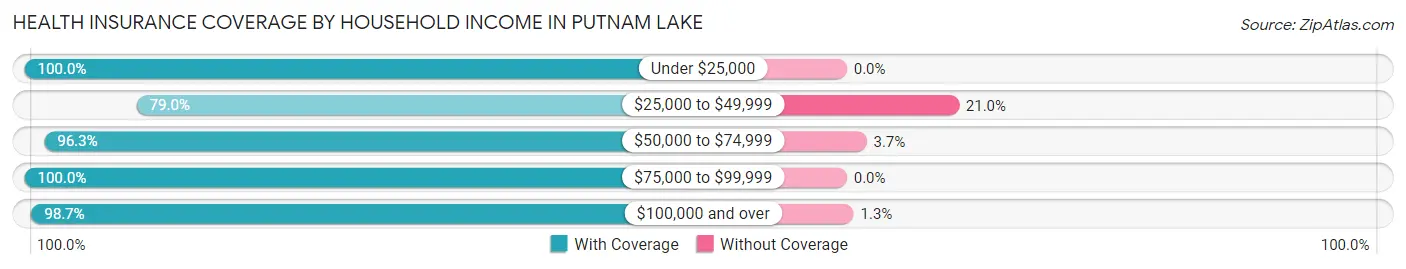
| Household Income | With Coverage | Without Coverage |
| Under $25,000 | 262 (100.0%) | 0 (0.0%) |
| $25,000 to $49,999 | 252 (79.0%) | 67 (21.0%) |
| $50,000 to $74,999 | 780 (96.3%) | 30 (3.7%) |
| $75,000 to $99,999 | 341 (100.0%) | 0 (0.0%) |
| $100,000 and over | 2,017 (98.7%) | 26 (1.3%) |
Public vs Private Health Insurance Coverage by Age in Putnam Lake
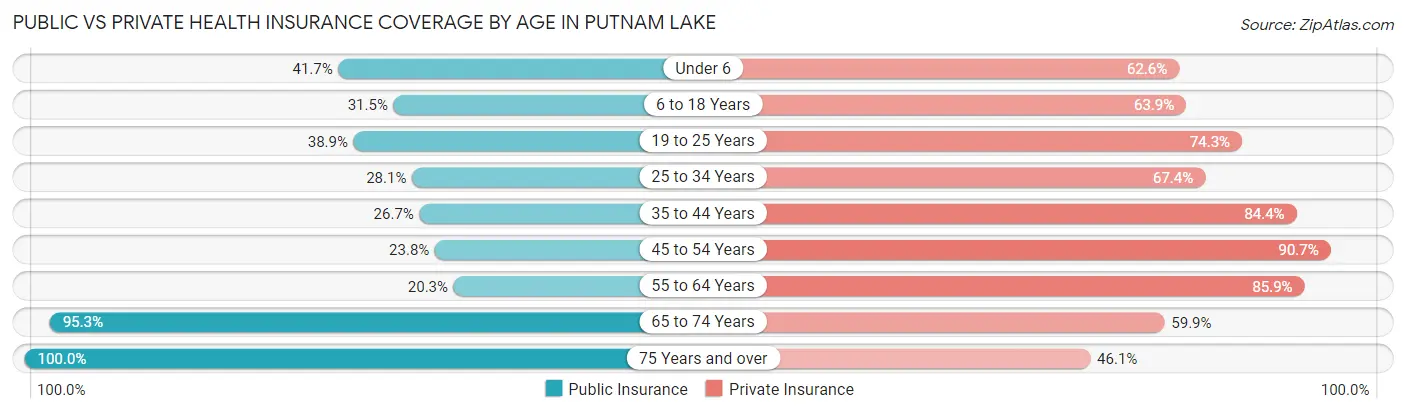
| Age Bracket | Public Insurance | Private Insurance |
| Under 6 | 58 (41.7%) | 87 (62.6%) |
| 6 to 18 Years | 136 (31.5%) | 276 (63.9%) |
| 19 to 25 Years | 133 (38.9%) | 254 (74.3%) |
| 25 to 34 Years | 99 (28.1%) | 238 (67.4%) |
| 35 to 44 Years | 128 (26.7%) | 405 (84.4%) |
| 45 to 54 Years | 128 (23.8%) | 488 (90.7%) |
| 55 to 64 Years | 128 (20.3%) | 541 (85.9%) |
| 65 to 74 Years | 449 (95.3%) | 282 (59.9%) |
| 75 Years and over | 423 (100.0%) | 195 (46.1%) |
| Total | 1,682 (44.2%) | 2,766 (72.6%) |
Disability Status by Sex by Age in Putnam Lake
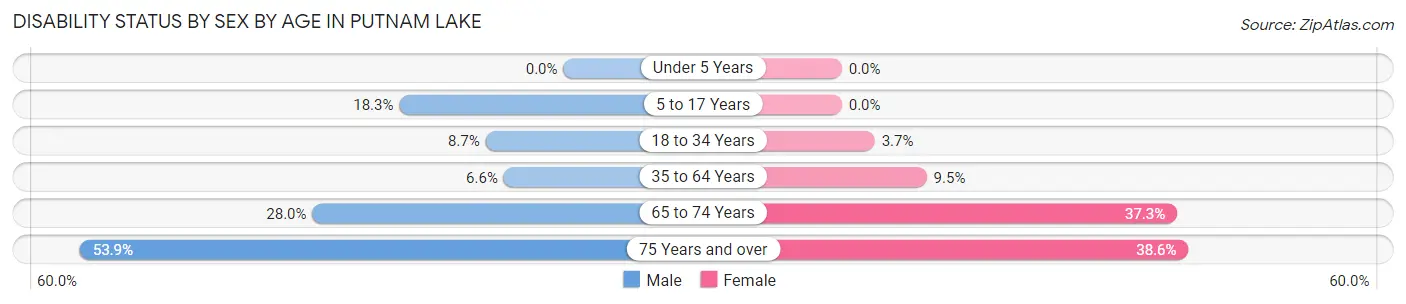
| Age Bracket | Male | Female |
| Under 5 Years | 0 (0.0%) | 0 (0.0%) |
| 5 to 17 Years | 36 (18.3%) | 0 (0.0%) |
| 18 to 34 Years | 33 (8.7%) | 13 (3.7%) |
| 35 to 64 Years | 56 (6.6%) | 76 (9.5%) |
| 65 to 74 Years | 71 (28.0%) | 81 (37.3%) |
| 75 Years and over | 98 (53.8%) | 93 (38.6%) |
Disability Class by Sex by Age in Putnam Lake
Disability Class: Hearing Difficulty
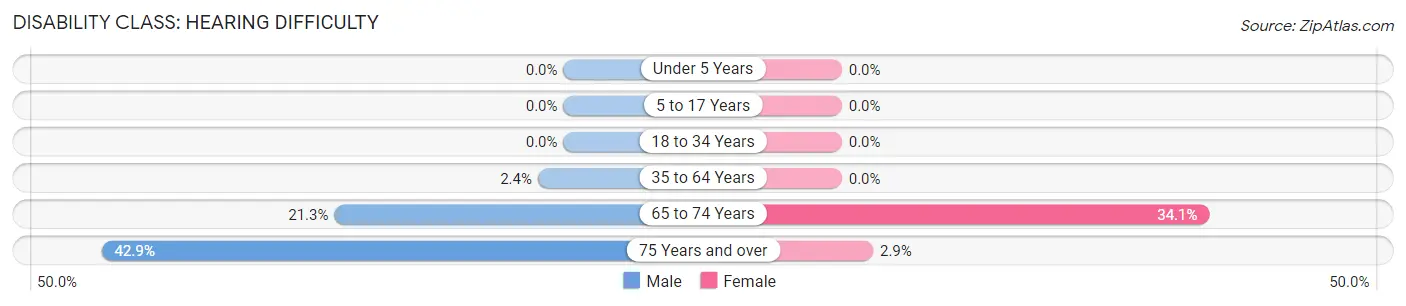
| Age Bracket | Male | Female |
| Under 5 Years | 0 (0.0%) | 0 (0.0%) |
| 5 to 17 Years | 0 (0.0%) | 0 (0.0%) |
| 18 to 34 Years | 0 (0.0%) | 0 (0.0%) |
| 35 to 64 Years | 20 (2.4%) | 0 (0.0%) |
| 65 to 74 Years | 54 (21.3%) | 74 (34.1%) |
| 75 Years and over | 78 (42.9%) | 7 (2.9%) |
Disability Class: Vision Difficulty
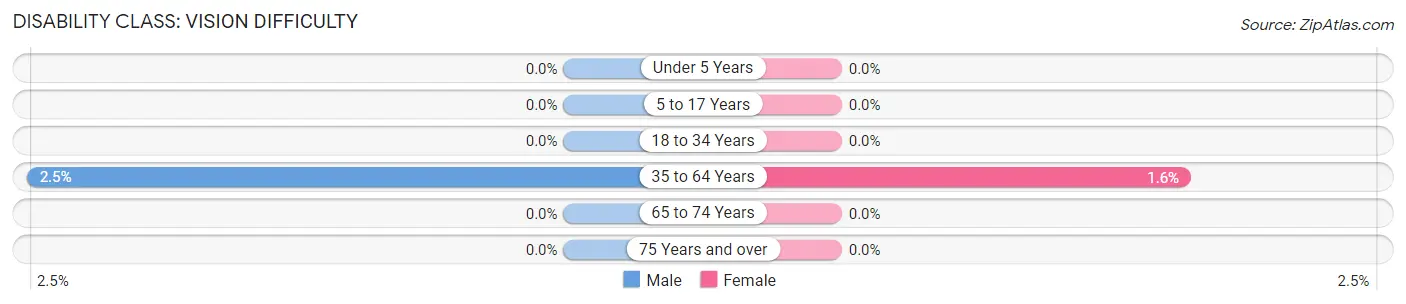
| Age Bracket | Male | Female |
| Under 5 Years | 0 (0.0%) | 0 (0.0%) |
| 5 to 17 Years | 0 (0.0%) | 0 (0.0%) |
| 18 to 34 Years | 0 (0.0%) | 0 (0.0%) |
| 35 to 64 Years | 21 (2.5%) | 13 (1.6%) |
| 65 to 74 Years | 0 (0.0%) | 0 (0.0%) |
| 75 Years and over | 0 (0.0%) | 0 (0.0%) |
Disability Class: Cognitive Difficulty
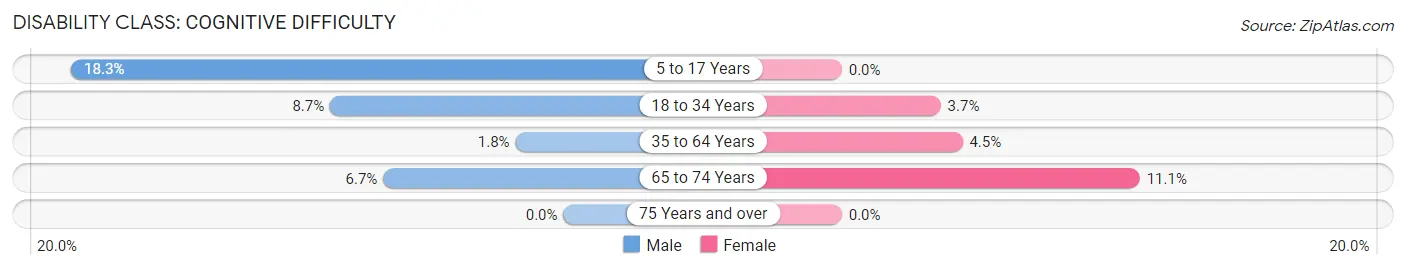
| Age Bracket | Male | Female |
| 5 to 17 Years | 36 (18.3%) | 0 (0.0%) |
| 18 to 34 Years | 33 (8.7%) | 13 (3.7%) |
| 35 to 64 Years | 15 (1.8%) | 36 (4.5%) |
| 65 to 74 Years | 17 (6.7%) | 24 (11.1%) |
| 75 Years and over | 0 (0.0%) | 0 (0.0%) |
Disability Class: Ambulatory Difficulty
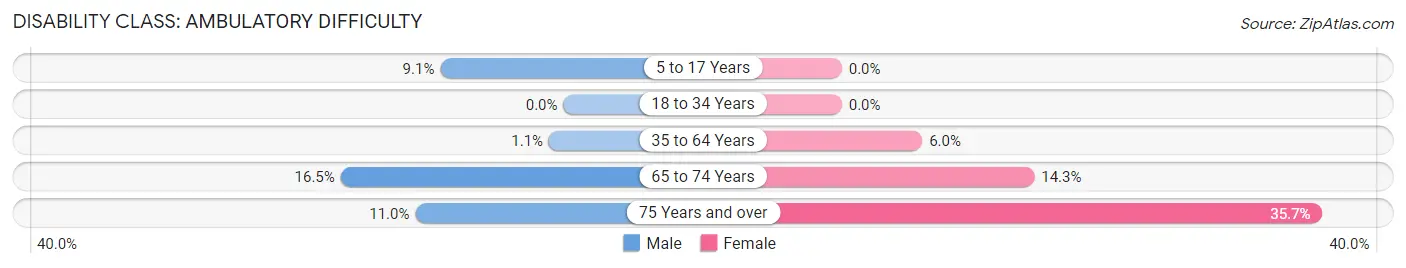
| Age Bracket | Male | Female |
| 5 to 17 Years | 18 (9.1%) | 0 (0.0%) |
| 18 to 34 Years | 0 (0.0%) | 0 (0.0%) |
| 35 to 64 Years | 9 (1.1%) | 48 (6.0%) |
| 65 to 74 Years | 42 (16.5%) | 31 (14.3%) |
| 75 Years and over | 20 (11.0%) | 86 (35.7%) |
Disability Class: Self-Care Difficulty
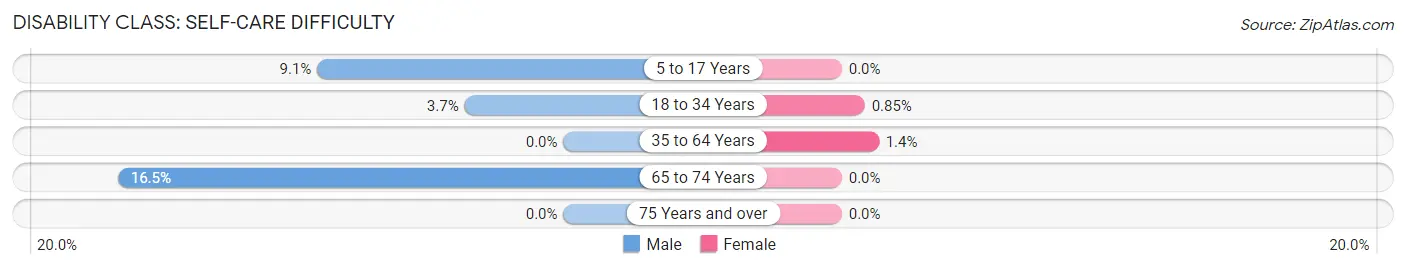
| Age Bracket | Male | Female |
| 5 to 17 Years | 18 (9.1%) | 0 (0.0%) |
| 18 to 34 Years | 14 (3.7%) | 3 (0.9%) |
| 35 to 64 Years | 0 (0.0%) | 11 (1.4%) |
| 65 to 74 Years | 42 (16.5%) | 0 (0.0%) |
| 75 Years and over | 0 (0.0%) | 0 (0.0%) |
Technology Access in Putnam Lake
Computing Device Access in Putnam Lake
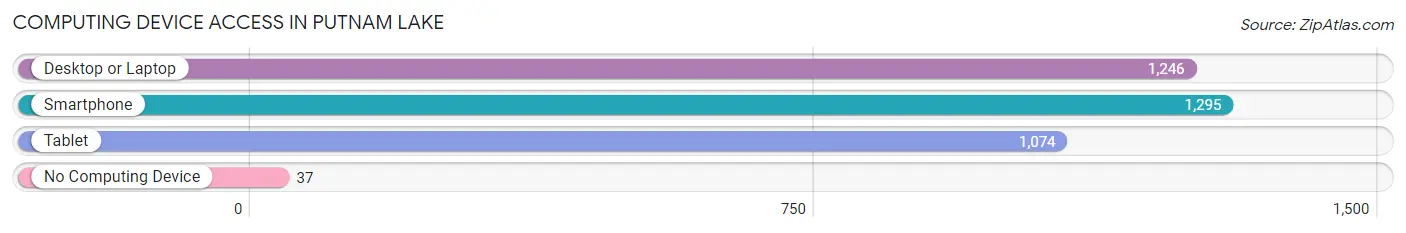
| Device Type | # Households | % Households |
| Desktop or Laptop | 1,246 | 89.7% |
| Smartphone | 1,295 | 93.2% |
| Tablet | 1,074 | 77.3% |
| No Computing Device | 37 | 2.7% |
| Total | 1,389 | 100.0% |
Internet Access in Putnam Lake
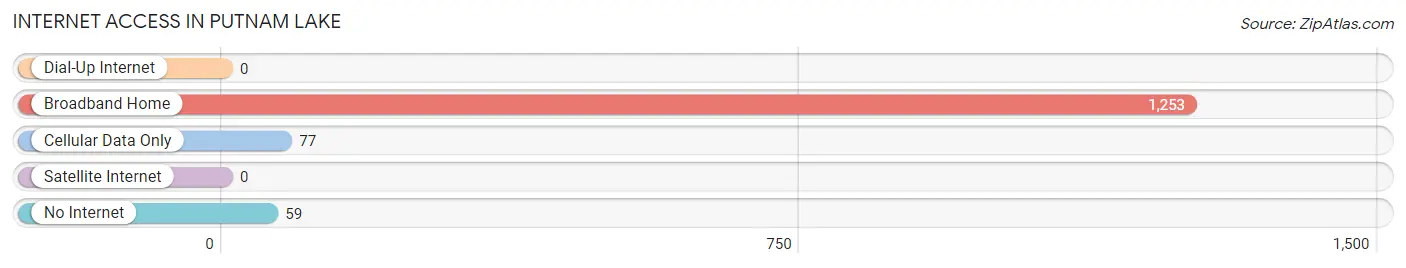
| Internet Type | # Households | % Households |
| Dial-Up Internet | 0 | 0.0% |
| Broadband Home | 1,253 | 90.2% |
| Cellular Data Only | 77 | 5.5% |
| Satellite Internet | 0 | 0.0% |
| No Internet | 59 | 4.3% |
| Total | 1,389 | 100.0% |
Putnam Lake Summary
Putnam Lake is a hamlet located in the town of Patterson, Putnam County, New York. It is situated in the southeastern corner of the county, approximately 50 miles north of New York City. Putnam Lake is a popular destination for outdoor recreation, with its proximity to the Appalachian Trail, the Hudson River, and numerous state parks.
History
The area that is now Putnam Lake was originally inhabited by the Wappinger Indians. The first European settlers arrived in the area in the late 1700s, and the hamlet was officially established in 1845. The hamlet was named after General Israel Putnam, a Revolutionary War hero.
In the late 1800s, Putnam Lake became a popular summer destination for wealthy New Yorkers. The area was known for its beautiful scenery and its many lakes, including Putnam Lake. The hamlet was also home to several resorts, including the Putnam Lake House, which was built in 1887.
In the early 1900s, Putnam Lake began to attract more year-round residents. The hamlet was home to several small businesses, including a general store, a post office, and a blacksmith shop.
Geography
Putnam Lake is located in the southeastern corner of Putnam County, approximately 50 miles north of New York City. The hamlet is situated in the foothills of the Appalachian Mountains, and is surrounded by several lakes, including Putnam Lake. The hamlet is also located near the Hudson River, and is within close proximity to several state parks, including Fahnestock State Park and Harriman State Park.
Economy
Putnam Lake is a primarily residential community, and the majority of its residents are employed in the nearby cities of New York City and White Plains. The hamlet is also home to several small businesses, including a general store, a post office, and a blacksmith shop.
Demographics
As of the 2010 census, the population of Putnam Lake was 1,845. The median household income was $76,250, and the median age was 44. The population was predominantly white (94.3%), with a small percentage of African Americans (2.2%) and Hispanics (2.2%).
Conclusion
Putnam Lake is a small hamlet located in the southeastern corner of Putnam County, New York. It is a popular destination for outdoor recreation, with its proximity to the Appalachian Trail, the Hudson River, and numerous state parks. The hamlet is primarily residential, and the majority of its residents are employed in the nearby cities of New York City and White Plains. As of the 2010 census, the population of Putnam Lake was 1,845, with a median household income of $76,250 and a median age of 44.
Common Questions
What is Per Capita Income in Putnam Lake?
Per Capita income in Putnam Lake is $42,320.
What is the Median Family Income in Putnam Lake?
Median Family Income in Putnam Lake is $92,155.
What is the Median Household income in Putnam Lake?
Median Household Income in Putnam Lake is $92,112.
What is Income or Wage Gap in Putnam Lake?
Income or Wage Gap in Putnam Lake is 53.8%.
Women in Putnam Lake earn 46.2 cents for every dollar earned by a man.
What is Family Income Deficit in Putnam Lake?
Family Income Deficit in Putnam Lake is $7,732.
Families that are below poverty line in Putnam Lake earn $7,732 less on average than the poverty threshold level.
What is Inequality or Gini Index in Putnam Lake?
Inequality or Gini Index in Putnam Lake is 0.39.
What is the Total Population of Putnam Lake?
Total Population of Putnam Lake is 3,826.
What is the Total Male Population of Putnam Lake?
Total Male Population of Putnam Lake is 1,916.
What is the Total Female Population of Putnam Lake?
Total Female Population of Putnam Lake is 1,910.
What is the Ratio of Males per 100 Females in Putnam Lake?
There are 100.31 Males per 100 Females in Putnam Lake.
What is the Ratio of Females per 100 Males in Putnam Lake?
There are 99.69 Females per 100 Males in Putnam Lake.
What is the Median Population Age in Putnam Lake?
Median Population Age in Putnam Lake is 46.2 Years.
What is the Average Family Size in Putnam Lake
Average Family Size in Putnam Lake is 2.9 People.
What is the Average Household Size in Putnam Lake
Average Household Size in Putnam Lake is 2.7 People.
How Large is the Labor Force in Putnam Lake?
There are 2,125 People in the Labor Forcein in Putnam Lake.
What is the Percentage of People in the Labor Force in Putnam Lake?
63.4% of People are in the Labor Force in Putnam Lake.
What is the Unemployment Rate in Putnam Lake?
Unemployment Rate in Putnam Lake is 7.2%.