North Lindenhurst, NY Map & Demographics
North Lindenhurst Map
North Lindenhurst Overview
$45,254
PER CAPITA INCOME
$138,138
AVG FAMILY INCOME
$118,177
AVG HOUSEHOLD INCOME
32.7%
WAGE / INCOME GAP [ % ]
67.3¢/ $1
WAGE / INCOME GAP [ $ ]
0.40
INEQUALITY / GINI INDEX
11,155
TOTAL POPULATION
5,628
MALE POPULATION
5,527
FEMALE POPULATION
101.83
MALES / 100 FEMALES
98.21
FEMALES / 100 MALES
42.6
MEDIAN AGE
3.4
AVG FAMILY SIZE
3.0
AVG HOUSEHOLD SIZE
6,636
LABOR FORCE [ PEOPLE ]
70.4%
PERCENT IN LABOR FORCE
3.5%
UNEMPLOYMENT RATE
Income in North Lindenhurst
Income Overview in North Lindenhurst
Per Capita Income in North Lindenhurst is $45,254, while median incomes of families and households are $138,138 and $118,177 respectively.
| Characteristic | Number | Measure |
| Per Capita Income | 11,155 | $45,254 |
| Median Family Income | 2,772 | $138,138 |
| Mean Family Income | 2,772 | $145,091 |
| Median Household Income | 3,745 | $118,177 |
| Mean Household Income | 3,745 | $132,358 |
| Income Deficit | 2,772 | $0 |
| Wage / Income Gap (%) | 11,155 | 32.66% |
| Wage / Income Gap ($) | 11,155 | 67.34¢ per $1 |
| Gini / Inequality Index | 11,155 | 0.40 |
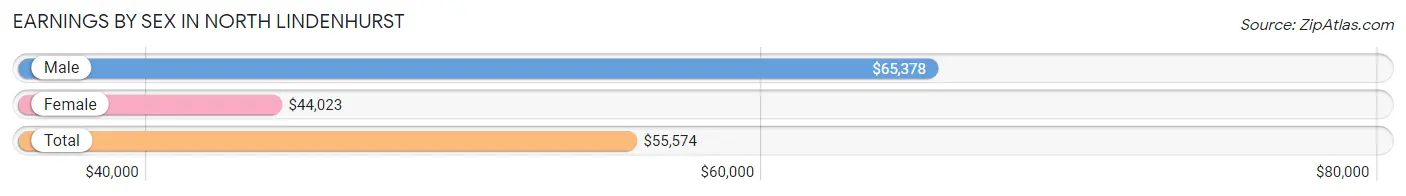
Earnings by Sex in North Lindenhurst
Average Earnings in North Lindenhurst are $55,574, $65,378 for men and $44,023 for women, a difference of 32.7%.
| Sex | Number | Average Earnings |
| Male | 3,607 (54.4%) | $65,378 |
| Female | 3,024 (45.6%) | $44,023 |
| Total | 6,631 (100.0%) | $55,574 |
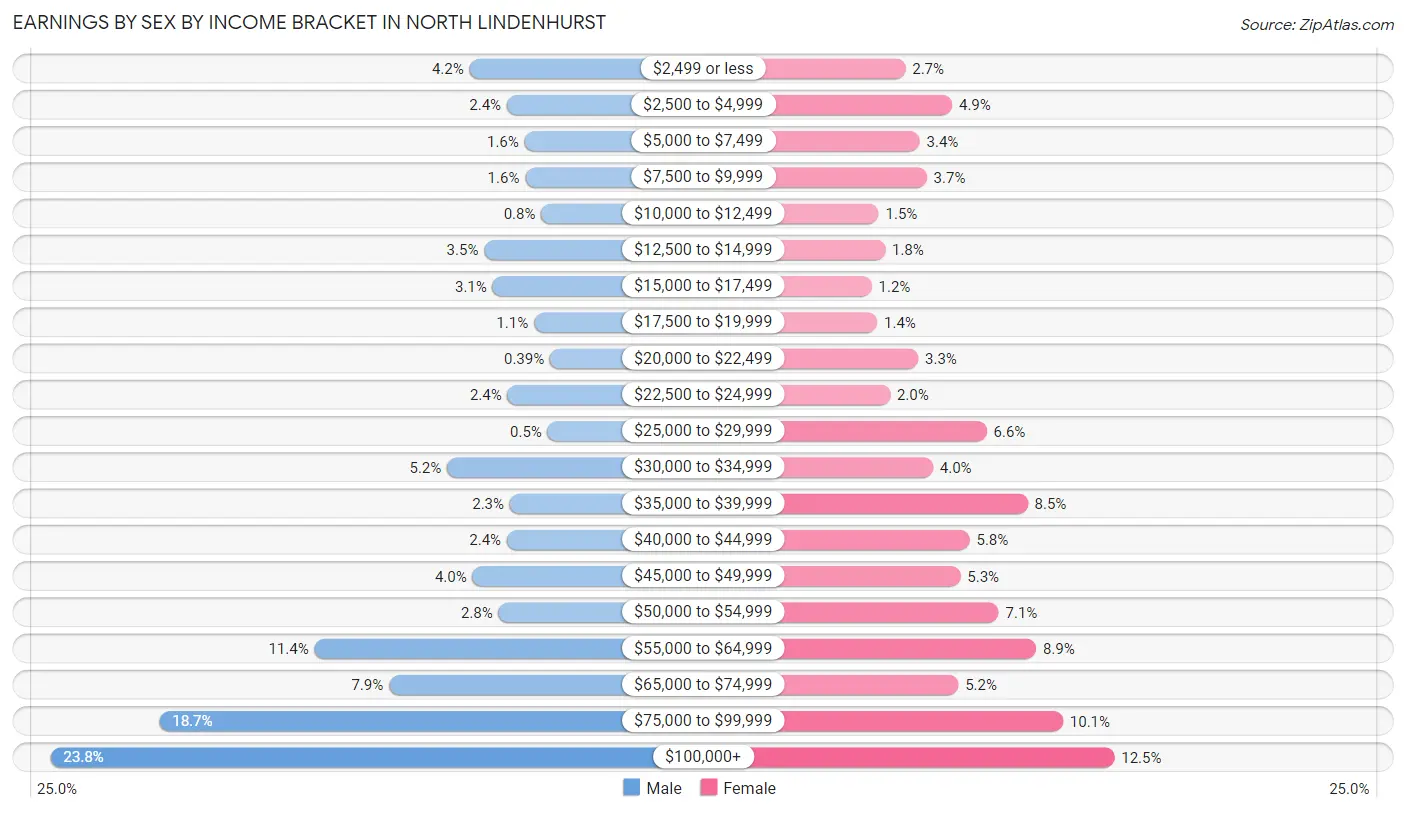
Earnings by Sex by Income Bracket in North Lindenhurst
The most common earnings brackets in North Lindenhurst are $100,000+ for men (858 | 23.8%) and $100,000+ for women (379 | 12.5%).
| Income | Male | Female |
| $2,499 or less | 150 (4.2%) | 83 (2.7%) |
| $2,500 to $4,999 | 87 (2.4%) | 149 (4.9%) |
| $5,000 to $7,499 | 57 (1.6%) | 103 (3.4%) |
| $7,500 to $9,999 | 56 (1.5%) | 113 (3.7%) |
| $10,000 to $12,499 | 29 (0.8%) | 45 (1.5%) |
| $12,500 to $14,999 | 125 (3.5%) | 54 (1.8%) |
| $15,000 to $17,499 | 111 (3.1%) | 35 (1.2%) |
| $17,500 to $19,999 | 41 (1.1%) | 43 (1.4%) |
| $20,000 to $22,499 | 14 (0.4%) | 101 (3.3%) |
| $22,500 to $24,999 | 86 (2.4%) | 61 (2.0%) |
| $25,000 to $29,999 | 18 (0.5%) | 198 (6.6%) |
| $30,000 to $34,999 | 188 (5.2%) | 122 (4.0%) |
| $35,000 to $39,999 | 82 (2.3%) | 256 (8.5%) |
| $40,000 to $44,999 | 87 (2.4%) | 174 (5.8%) |
| $45,000 to $49,999 | 145 (4.0%) | 161 (5.3%) |
| $50,000 to $54,999 | 101 (2.8%) | 215 (7.1%) |
| $55,000 to $64,999 | 412 (11.4%) | 268 (8.9%) |
| $65,000 to $74,999 | 286 (7.9%) | 158 (5.2%) |
| $75,000 to $99,999 | 674 (18.7%) | 306 (10.1%) |
| $100,000+ | 858 (23.8%) | 379 (12.5%) |
| Total | 3,607 (100.0%) | 3,024 (100.0%) |
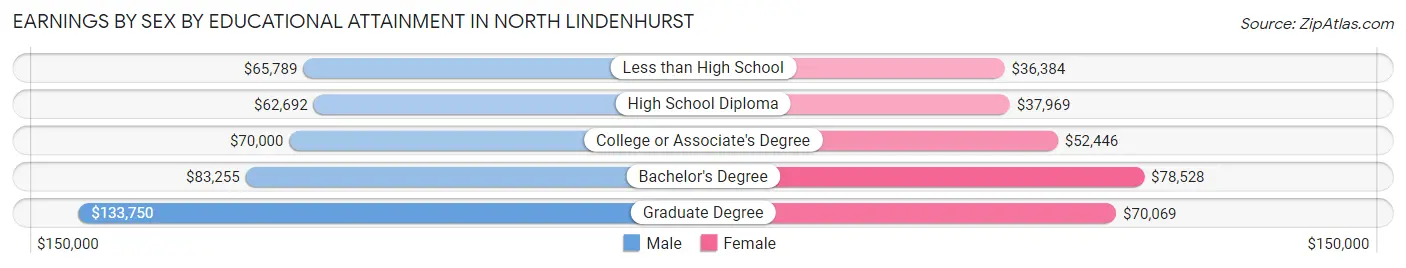
Earnings by Sex by Educational Attainment in North Lindenhurst
Average earnings in North Lindenhurst are $71,056 for men and $49,540 for women, a difference of 30.3%. Men with an educational attainment of graduate degree enjoy the highest average annual earnings of $133,750, while those with high school diploma education earn the least with $62,692. Women with an educational attainment of bachelor's degree earn the most with the average annual earnings of $78,528, while those with less than high school education have the smallest earnings of $36,384.
| Educational Attainment | Male Income | Female Income |
| Less than High School | $65,789 | $36,384 |
| High School Diploma | $62,692 | $37,969 |
| College or Associate's Degree | $70,000 | $52,446 |
| Bachelor's Degree | $83,255 | $78,528 |
| Graduate Degree | $133,750 | $70,069 |
| Total | $71,056 | $49,540 |
Family Income in North Lindenhurst
Family Income Brackets in North Lindenhurst
According to the North Lindenhurst family income data, there are 837 families falling into the $150,000 to $199,999 income range, which is the most common income bracket and makes up 30.2% of all families. Conversely, the $10,000 to $14,999 income bracket is the least frequent group with only 6 families (0.2%) belonging to this category.
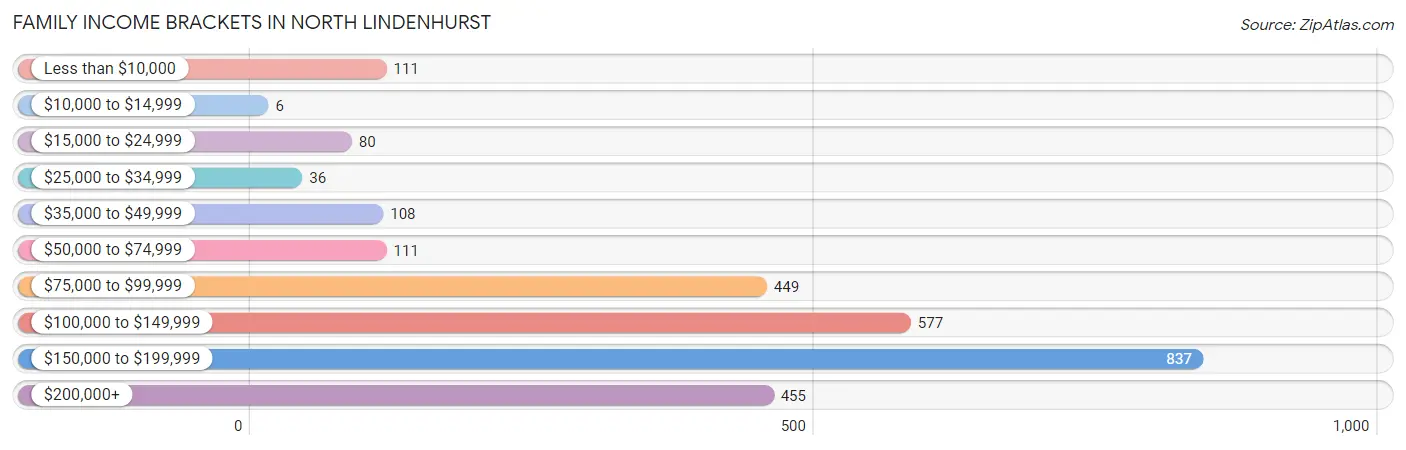
| Income Bracket | # Families | % Families |
| Less than $10,000 | 111 | 4.0% |
| $10,000 to $14,999 | 6 | 0.2% |
| $15,000 to $24,999 | 80 | 2.9% |
| $25,000 to $34,999 | 36 | 1.3% |
| $35,000 to $49,999 | 108 | 3.9% |
| $50,000 to $74,999 | 111 | 4.0% |
| $75,000 to $99,999 | 449 | 16.2% |
| $100,000 to $149,999 | 577 | 20.8% |
| $150,000 to $199,999 | 837 | 30.2% |
| $200,000+ | 455 | 16.4% |
Family Income by Famaliy Size in North Lindenhurst
6-person families (166 | 6.0%) account for the highest median family income in North Lindenhurst with $250,001 per family, while 3-person families (877 | 31.6%) have the highest median income of $50,486 per family member.
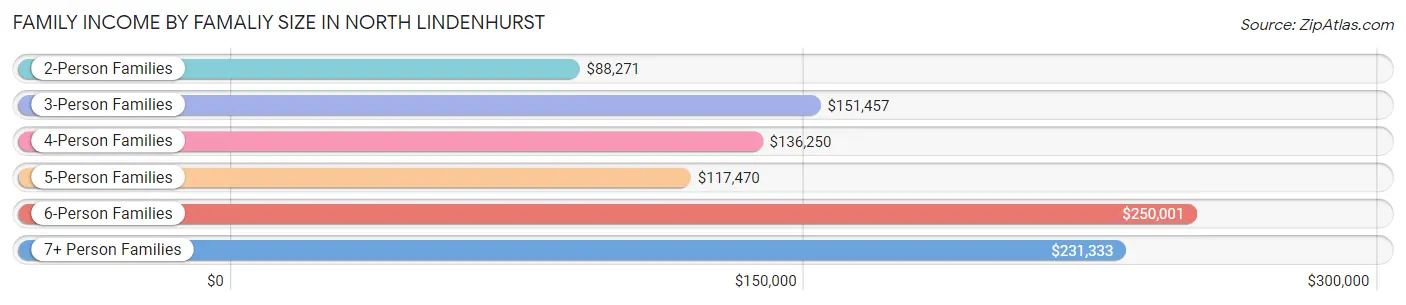
| Income Bracket | # Families | Median Income |
| 2-Person Families | 939 (33.9%) | $88,271 |
| 3-Person Families | 877 (31.6%) | $151,457 |
| 4-Person Families | 605 (21.8%) | $136,250 |
| 5-Person Families | 131 (4.7%) | $117,470 |
| 6-Person Families | 166 (6.0%) | $250,001 |
| 7+ Person Families | 54 (1.9%) | $231,333 |
| Total | 2,772 (100.0%) | $138,138 |
Family Income by Number of Earners in North Lindenhurst
The median family income in North Lindenhurst is $138,138, with families comprising 3+ earners (503) having the highest median family income of $208,125, while families with no earners (250) have the lowest median family income of $35,426, accounting for 18.1% and 9.0% of families, respectively.
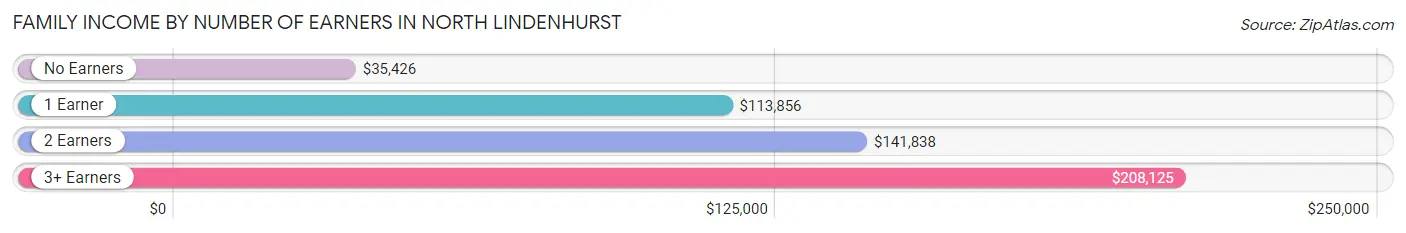
| Number of Earners | # Families | Median Income |
| No Earners | 250 (9.0%) | $35,426 |
| 1 Earner | 908 (32.8%) | $113,856 |
| 2 Earners | 1,111 (40.1%) | $141,838 |
| 3+ Earners | 503 (18.1%) | $208,125 |
| Total | 2,772 (100.0%) | $138,138 |
Household Income in North Lindenhurst
Household Income Brackets in North Lindenhurst
With 828 households falling in the category, the $150,000 to $199,999 income range is the most frequent in North Lindenhurst, accounting for 22.1% of all households. In contrast, only 45 households (1.2%) fall into the $10,000 to $14,999 income bracket, making it the least populous group.
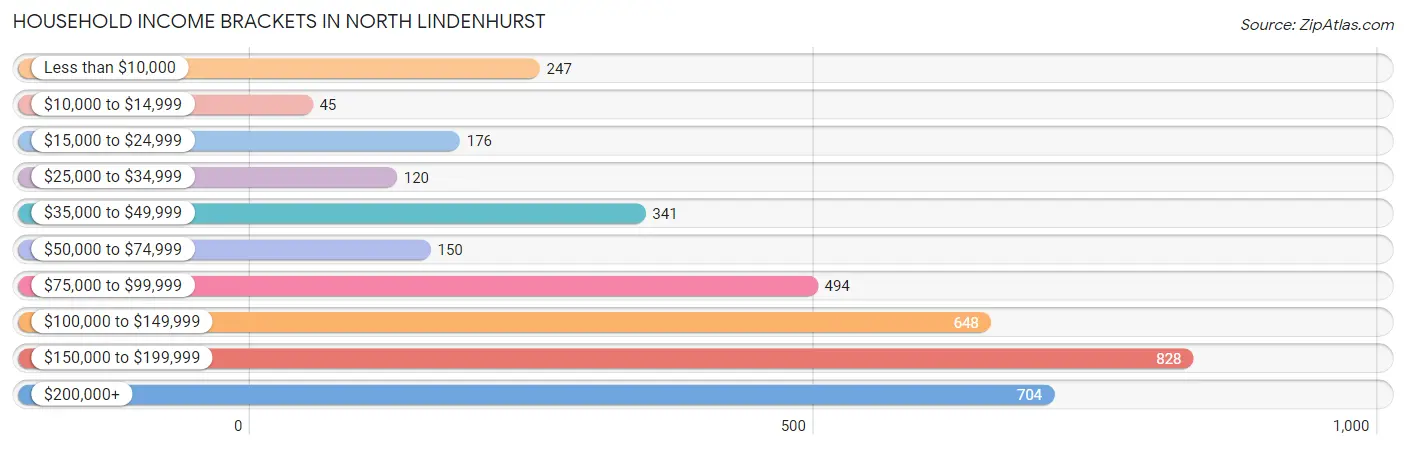
| Income Bracket | # Households | % Households |
| Less than $10,000 | 247 | 6.6% |
| $10,000 to $14,999 | 45 | 1.2% |
| $15,000 to $24,999 | 176 | 4.7% |
| $25,000 to $34,999 | 120 | 3.2% |
| $35,000 to $49,999 | 341 | 9.1% |
| $50,000 to $74,999 | 150 | 4.0% |
| $75,000 to $99,999 | 494 | 13.2% |
| $100,000 to $149,999 | 648 | 17.3% |
| $150,000 to $199,999 | 828 | 22.1% |
| $200,000+ | 704 | 18.8% |
Household Income by Householder Age in North Lindenhurst
The median household income in North Lindenhurst is $118,177, with the highest median household income of $151,180 found in the 45 to 64 years age bracket for the primary householder. A total of 1,686 households (45.0%) fall into this category. Meanwhile, the 15 to 24 years age bracket for the primary householder has the lowest median household income of $0, with 148 households (4.0%) in this group.
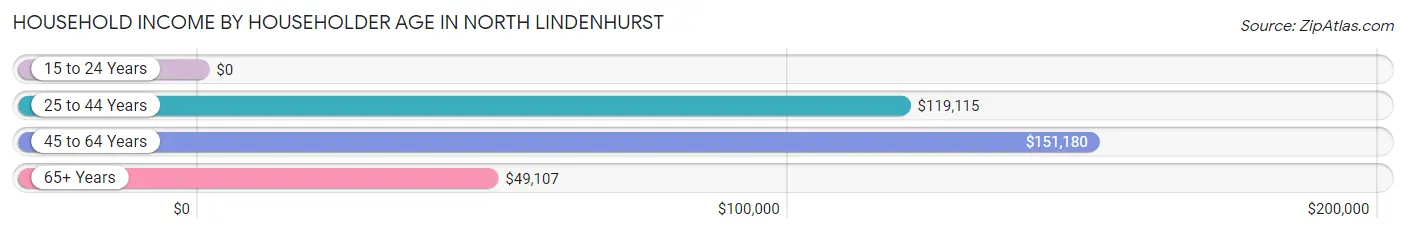
| Income Bracket | # Households | Median Income |
| 15 to 24 Years | 148 (4.0%) | $0 |
| 25 to 44 Years | 939 (25.1%) | $119,115 |
| 45 to 64 Years | 1,686 (45.0%) | $151,180 |
| 65+ Years | 972 (26.0%) | $49,107 |
| Total | 3,745 (100.0%) | $118,177 |
Poverty in North Lindenhurst
Income Below Poverty by Sex and Age in North Lindenhurst
With 9.3% poverty level for males and 5.7% for females among the residents of North Lindenhurst, under 5 year old males and 18 to 24 year old females are the most vulnerable to poverty, with 141 males (44.2%) and 94 females (28.3%) in their respective age groups living below the poverty level.
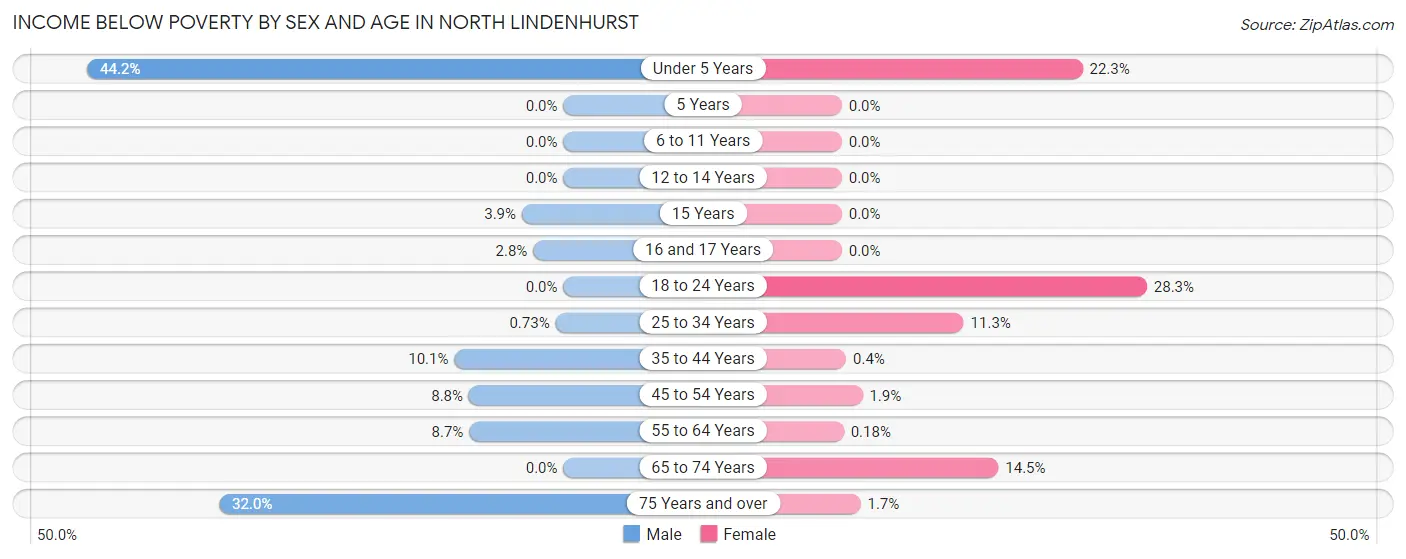
| Age Bracket | Male | Female |
| Under 5 Years | 141 (44.2%) | 44 (22.3%) |
| 5 Years | 0 (0.0%) | 0 (0.0%) |
| 6 to 11 Years | 0 (0.0%) | 0 (0.0%) |
| 12 to 14 Years | 0 (0.0%) | 0 (0.0%) |
| 15 Years | 4 (3.8%) | 0 (0.0%) |
| 16 and 17 Years | 4 (2.8%) | 0 (0.0%) |
| 18 to 24 Years | 0 (0.0%) | 94 (28.3%) |
| 25 to 34 Years | 5 (0.7%) | 81 (11.3%) |
| 35 to 44 Years | 104 (10.1%) | 2 (0.4%) |
| 45 to 54 Years | 77 (8.8%) | 14 (1.9%) |
| 55 to 64 Years | 82 (8.7%) | 2 (0.2%) |
| 65 to 74 Years | 0 (0.0%) | 68 (14.5%) |
| 75 Years and over | 108 (32.0%) | 12 (1.7%) |
| Total | 525 (9.3%) | 317 (5.7%) |
Income Above Poverty by Sex and Age in North Lindenhurst
According to the poverty statistics in North Lindenhurst, males aged 5 years and females aged 5 years are the age groups that are most secure financially, with 100.0% of males and 100.0% of females in these age groups living above the poverty line.
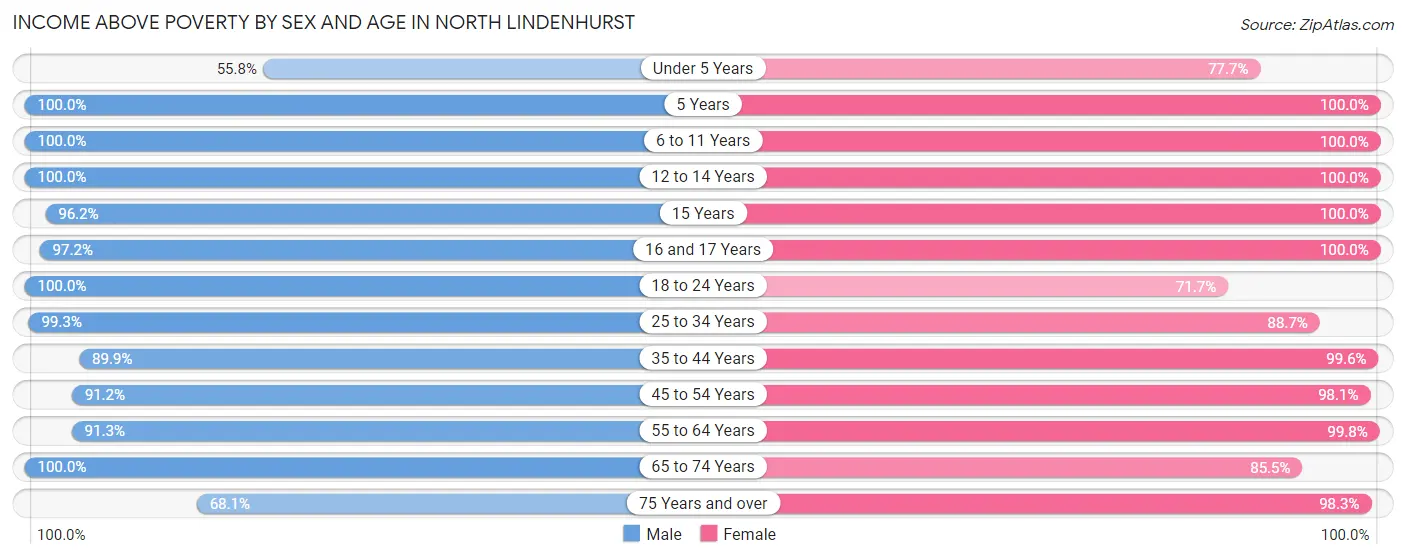
| Age Bracket | Male | Female |
| Under 5 Years | 178 (55.8%) | 153 (77.7%) |
| 5 Years | 28 (100.0%) | 19 (100.0%) |
| 6 to 11 Years | 238 (100.0%) | 494 (100.0%) |
| 12 to 14 Years | 148 (100.0%) | 160 (100.0%) |
| 15 Years | 100 (96.2%) | 22 (100.0%) |
| 16 and 17 Years | 139 (97.2%) | 77 (100.0%) |
| 18 to 24 Years | 474 (100.0%) | 238 (71.7%) |
| 25 to 34 Years | 677 (99.3%) | 635 (88.7%) |
| 35 to 44 Years | 924 (89.9%) | 496 (99.6%) |
| 45 to 54 Years | 801 (91.2%) | 716 (98.1%) |
| 55 to 64 Years | 856 (91.3%) | 1,122 (99.8%) |
| 65 to 74 Years | 310 (100.0%) | 400 (85.5%) |
| 75 Years and over | 230 (68.0%) | 678 (98.3%) |
| Total | 5,103 (90.7%) | 5,210 (94.3%) |
Income Below Poverty Among Married-Couple Families in North Lindenhurst
The poverty statistics for married-couple families in North Lindenhurst show that 4.5% or 88 of the total 1,952 families live below the poverty line. Families with 1 or 2 children have the highest poverty rate of 9.0%, comprising of 52 families. On the other hand, families with 3 or 4 children have the lowest poverty rate of 0.0%, which includes 0 families.
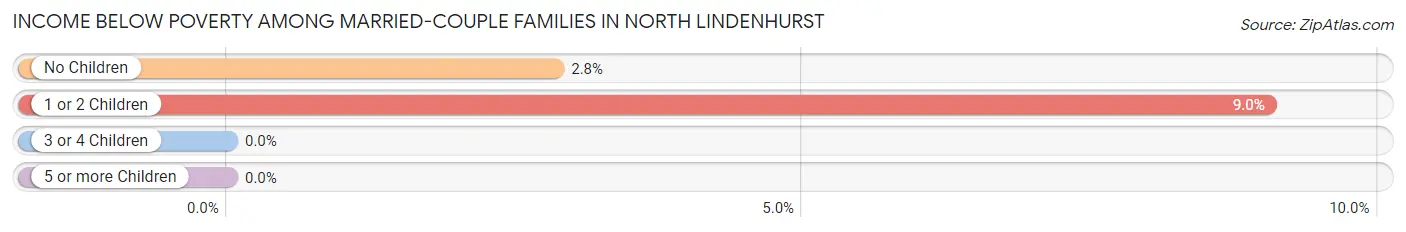
| Children | Above Poverty | Below Poverty |
| No Children | 1,233 (97.2%) | 36 (2.8%) |
| 1 or 2 Children | 523 (91.0%) | 52 (9.0%) |
| 3 or 4 Children | 108 (100.0%) | 0 (0.0%) |
| 5 or more Children | 0 (0.0%) | 0 (0.0%) |
| Total | 1,864 (95.5%) | 88 (4.5%) |
Income Below Poverty Among Single-Parent Households in North Lindenhurst
According to the poverty data in North Lindenhurst, 12.5% or 50 single-father households and 6.2% or 26 single-mother households are living below the poverty line. Among single-father households, those with 1 or 2 children have the highest poverty rate, with 50 households (28.1%) experiencing poverty. Likewise, among single-mother households, those with 1 or 2 children have the highest poverty rate, with 26 households (15.4%) falling below the poverty line.
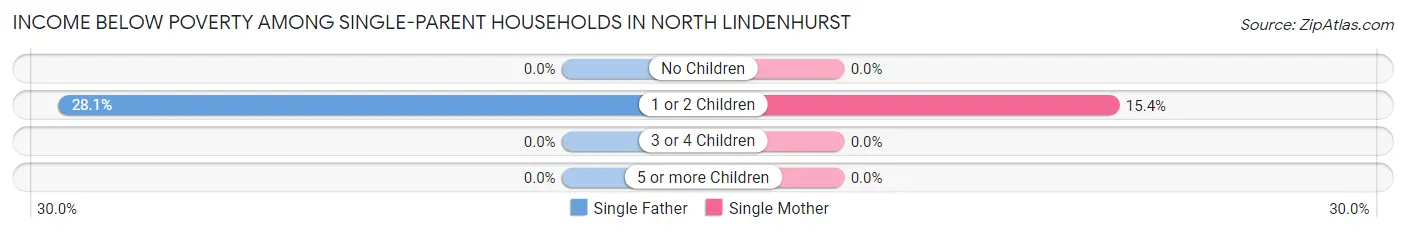
| Children | Single Father | Single Mother |
| No Children | 0 (0.0%) | 0 (0.0%) |
| 1 or 2 Children | 50 (28.1%) | 26 (15.4%) |
| 3 or 4 Children | 0 (0.0%) | 0 (0.0%) |
| 5 or more Children | 0 (0.0%) | 0 (0.0%) |
| Total | 50 (12.5%) | 26 (6.2%) |
Income Below Poverty Among Married-Couple vs Single-Parent Households in North Lindenhurst
The poverty data for North Lindenhurst shows that 88 of the married-couple family households (4.5%) and 76 of the single-parent households (9.3%) are living below the poverty level. Within the married-couple family households, those with 1 or 2 children have the highest poverty rate, with 52 households (9.0%) falling below the poverty line. Among the single-parent households, those with 1 or 2 children have the highest poverty rate, with 76 household (21.9%) living below poverty.
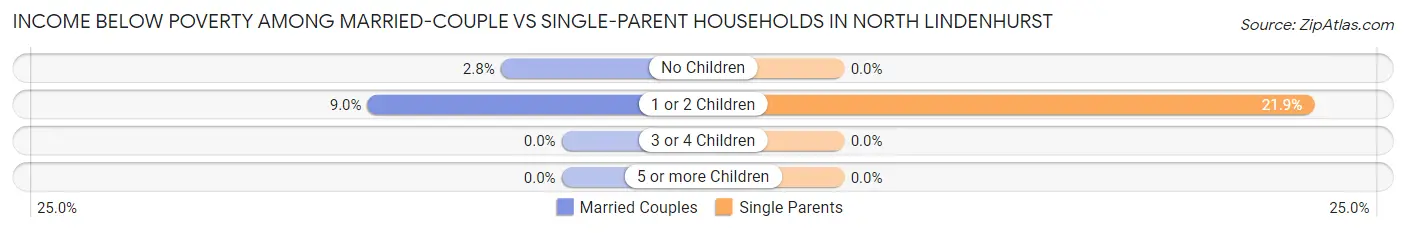
| Children | Married-Couple Families | Single-Parent Households |
| No Children | 36 (2.8%) | 0 (0.0%) |
| 1 or 2 Children | 52 (9.0%) | 76 (21.9%) |
| 3 or 4 Children | 0 (0.0%) | 0 (0.0%) |
| 5 or more Children | 0 (0.0%) | 0 (0.0%) |
| Total | 88 (4.5%) | 76 (9.3%) |
Race in North Lindenhurst
The most populous races in North Lindenhurst are White / Caucasian (8,193 | 73.5%), Hispanic or Latino (2,877 | 25.8%), and Two or more Races (956 | 8.6%).
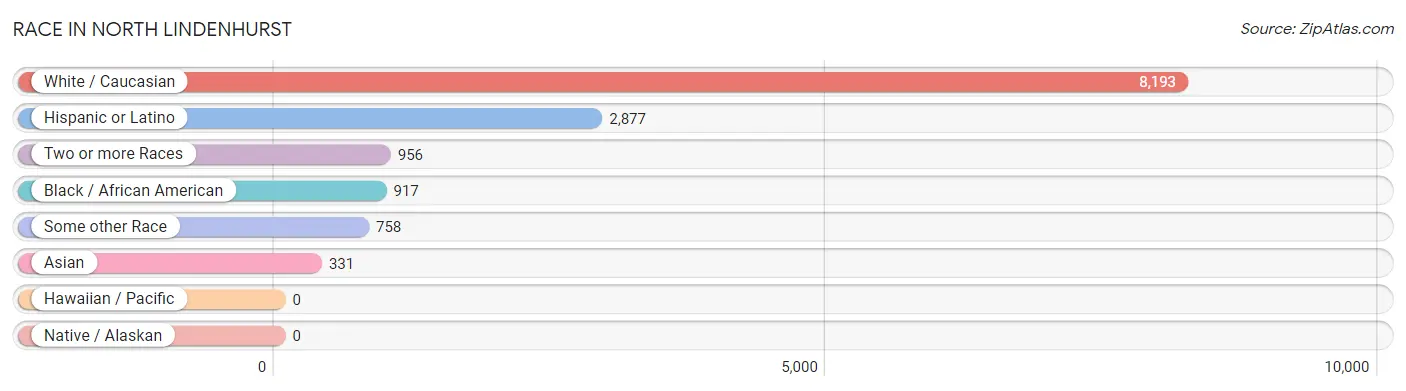
| Race | # Population | % Population |
| Asian | 331 | 3.0% |
| Black / African American | 917 | 8.2% |
| Hawaiian / Pacific | 0 | 0.0% |
| Hispanic or Latino | 2,877 | 25.8% |
| Native / Alaskan | 0 | 0.0% |
| White / Caucasian | 8,193 | 73.5% |
| Two or more Races | 956 | 8.6% |
| Some other Race | 758 | 6.8% |
| Total | 11,155 | 100.0% |
Ancestry in North Lindenhurst
The most populous ancestries reported in North Lindenhurst are Irish (1,939 | 17.4%), Italian (1,621 | 14.5%), Central American (884 | 7.9%), German (879 | 7.9%), and Puerto Rican (697 | 6.2%), together accounting for 54.0% of all North Lindenhurst residents.
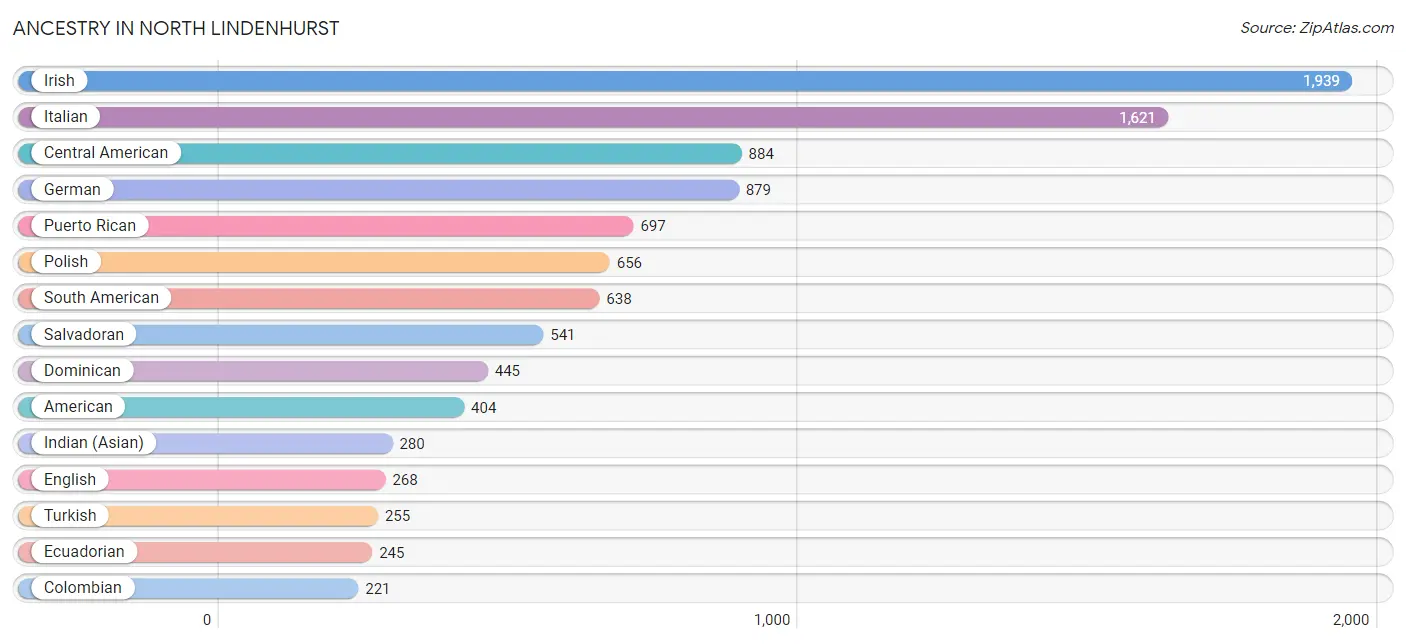
| Ancestry | # Population | % Population |
| American | 404 | 3.6% |
| Arab | 42 | 0.4% |
| Argentinean | 79 | 0.7% |
| Austrian | 24 | 0.2% |
| Bermudan | 10 | 0.1% |
| Bhutanese | 16 | 0.1% |
| Burmese | 55 | 0.5% |
| Canadian | 12 | 0.1% |
| Central American | 884 | 7.9% |
| Colombian | 221 | 2.0% |
| Czech | 149 | 1.3% |
| Dominican | 445 | 4.0% |
| Dutch | 66 | 0.6% |
| Eastern European | 55 | 0.5% |
| Ecuadorian | 245 | 2.2% |
| English | 268 | 2.4% |
| Finnish | 19 | 0.2% |
| French | 122 | 1.1% |
| German | 879 | 7.9% |
| Greek | 77 | 0.7% |
| Guatemalan | 91 | 0.8% |
| Guyanese | 57 | 0.5% |
| Haitian | 76 | 0.7% |
| Honduran | 218 | 1.9% |
| Hungarian | 42 | 0.4% |
| Indian (Asian) | 280 | 2.5% |
| Irish | 1,939 | 17.4% |
| Israeli | 22 | 0.2% |
| Italian | 1,621 | 14.5% |
| Korean | 19 | 0.2% |
| Latvian | 36 | 0.3% |
| Lithuanian | 120 | 1.1% |
| Mexican | 144 | 1.3% |
| Nicaraguan | 34 | 0.3% |
| Nigerian | 66 | 0.6% |
| Norwegian | 12 | 0.1% |
| Peruvian | 64 | 0.6% |
| Polish | 656 | 5.9% |
| Puerto Rican | 697 | 6.2% |
| Romanian | 8 | 0.1% |
| Russian | 207 | 1.9% |
| Salvadoran | 541 | 4.9% |
| Scandinavian | 36 | 0.3% |
| Scotch-Irish | 32 | 0.3% |
| Scottish | 54 | 0.5% |
| Slovak | 16 | 0.1% |
| South American | 638 | 5.7% |
| South American Indian | 6 | 0.1% |
| Spaniard | 28 | 0.3% |
| Spanish | 20 | 0.2% |
| Subsaharan African | 66 | 0.6% |
| Thai | 21 | 0.2% |
| Trinidadian and Tobagonian | 76 | 0.7% |
| Turkish | 255 | 2.3% |
| Ukrainian | 202 | 1.8% |
| Venezuelan | 29 | 0.3% |
| Vietnamese | 8 | 0.1% |
| Welsh | 60 | 0.5% | View All 58 Rows |
Immigrants in North Lindenhurst
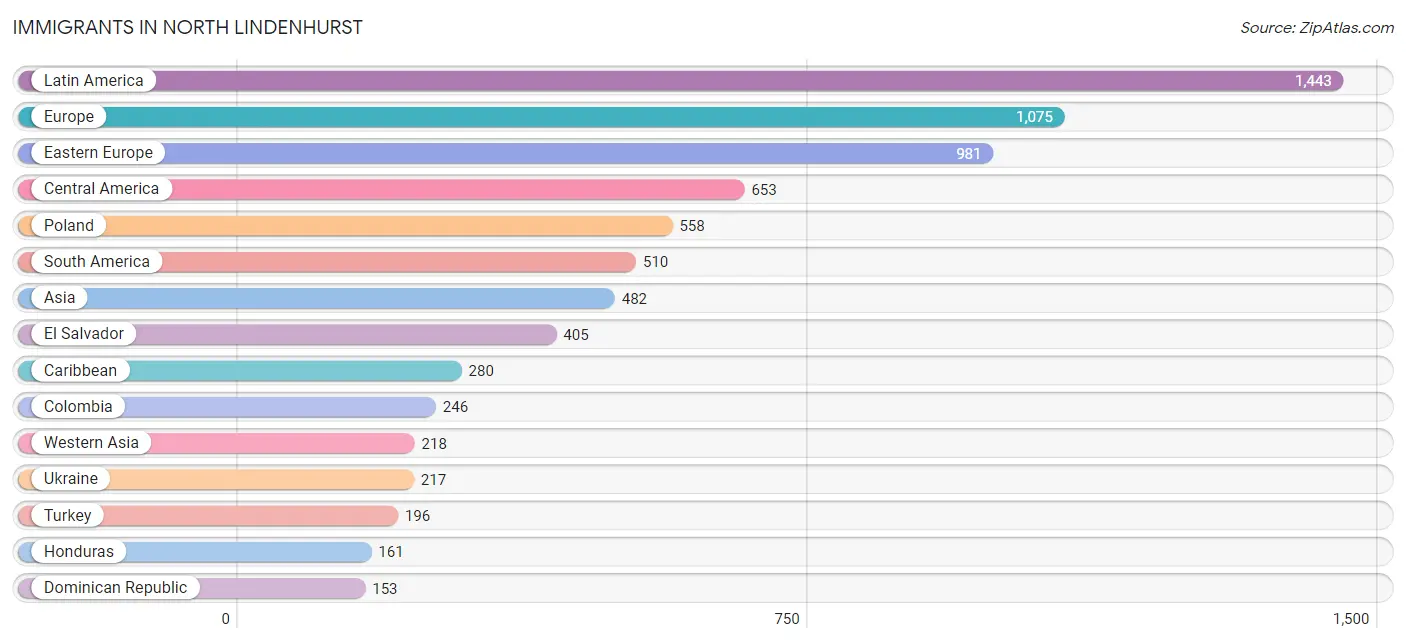
The most numerous immigrant groups reported in North Lindenhurst came from Latin America (1,443 | 12.9%), Europe (1,075 | 9.6%), Eastern Europe (981 | 8.8%), Central America (653 | 5.9%), and Poland (558 | 5.0%), together accounting for 42.2% of all North Lindenhurst residents.
| Immigration Origin | # Population | % Population |
| Africa | 33 | 0.3% |
| Argentina | 119 | 1.1% |
| Asia | 482 | 4.3% |
| Bangladesh | 8 | 0.1% |
| Barbados | 17 | 0.2% |
| Belize | 22 | 0.2% |
| Caribbean | 280 | 2.5% |
| Central America | 653 | 5.9% |
| China | 137 | 1.2% |
| Colombia | 246 | 2.2% |
| Czechoslovakia | 128 | 1.1% |
| Dominican Republic | 153 | 1.4% |
| Eastern Asia | 137 | 1.2% |
| Eastern Europe | 981 | 8.8% |
| Ecuador | 70 | 0.6% |
| El Salvador | 405 | 3.6% |
| Europe | 1,075 | 9.6% |
| Germany | 12 | 0.1% |
| Guatemala | 27 | 0.2% |
| Guyana | 13 | 0.1% |
| Haiti | 53 | 0.5% |
| Honduras | 161 | 1.4% |
| Hong Kong | 44 | 0.4% |
| Israel | 22 | 0.2% |
| Italy | 82 | 0.7% |
| Latin America | 1,443 | 12.9% |
| Latvia | 64 | 0.6% |
| Mexico | 38 | 0.3% |
| Nigeria | 33 | 0.3% |
| Pakistan | 31 | 0.3% |
| Peru | 33 | 0.3% |
| Philippines | 28 | 0.3% |
| Poland | 558 | 5.0% |
| Russia | 14 | 0.1% |
| South America | 510 | 4.6% |
| South Central Asia | 39 | 0.4% |
| South Eastern Asia | 28 | 0.3% |
| Southern Europe | 82 | 0.7% |
| Trinidad and Tobago | 57 | 0.5% |
| Turkey | 196 | 1.8% |
| Ukraine | 217 | 1.9% |
| Venezuela | 29 | 0.3% |
| Western Africa | 33 | 0.3% |
| Western Asia | 218 | 1.9% |
| Western Europe | 12 | 0.1% | View All 45 Rows |
Sex and Age in North Lindenhurst
Sex and Age in North Lindenhurst
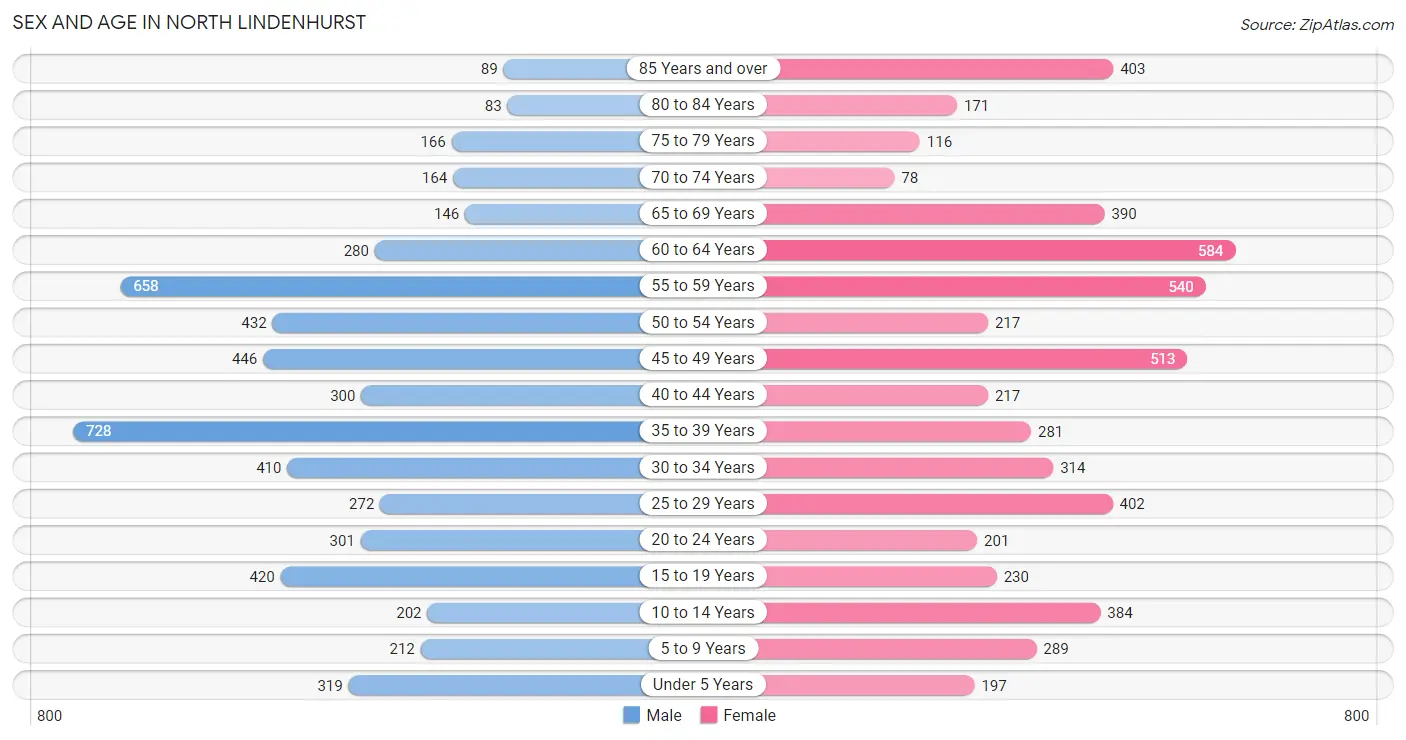
The most populous age groups in North Lindenhurst are 35 to 39 Years (728 | 12.9%) for men and 60 to 64 Years (584 | 10.6%) for women.
| Age Bracket | Male | Female |
| Under 5 Years | 319 (5.7%) | 197 (3.6%) |
| 5 to 9 Years | 212 (3.8%) | 289 (5.2%) |
| 10 to 14 Years | 202 (3.6%) | 384 (7.0%) |
| 15 to 19 Years | 420 (7.5%) | 230 (4.2%) |
| 20 to 24 Years | 301 (5.3%) | 201 (3.6%) |
| 25 to 29 Years | 272 (4.8%) | 402 (7.3%) |
| 30 to 34 Years | 410 (7.3%) | 314 (5.7%) |
| 35 to 39 Years | 728 (12.9%) | 281 (5.1%) |
| 40 to 44 Years | 300 (5.3%) | 217 (3.9%) |
| 45 to 49 Years | 446 (7.9%) | 513 (9.3%) |
| 50 to 54 Years | 432 (7.7%) | 217 (3.9%) |
| 55 to 59 Years | 658 (11.7%) | 540 (9.8%) |
| 60 to 64 Years | 280 (5.0%) | 584 (10.6%) |
| 65 to 69 Years | 146 (2.6%) | 390 (7.1%) |
| 70 to 74 Years | 164 (2.9%) | 78 (1.4%) |
| 75 to 79 Years | 166 (2.9%) | 116 (2.1%) |
| 80 to 84 Years | 83 (1.5%) | 171 (3.1%) |
| 85 Years and over | 89 (1.6%) | 403 (7.3%) |
| Total | 5,628 (100.0%) | 5,527 (100.0%) |
Families and Households in North Lindenhurst
Median Family Size in North Lindenhurst
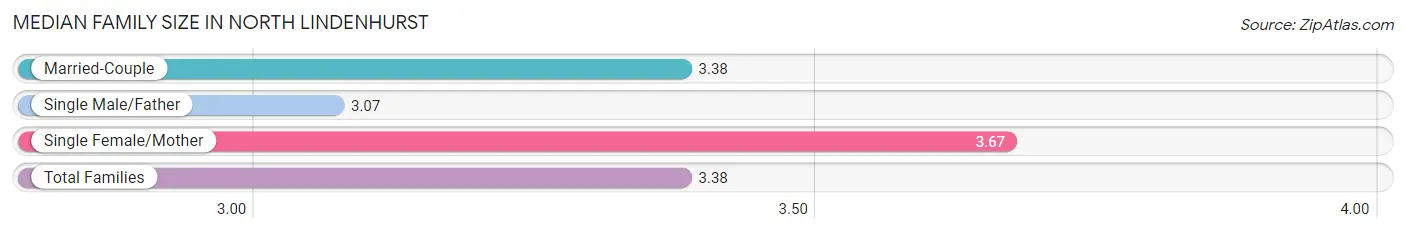
The median family size in North Lindenhurst is 3.38 persons per family, with single female/mother families (419 | 15.1%) accounting for the largest median family size of 3.67 persons per family. On the other hand, single male/father families (401 | 14.5%) represent the smallest median family size with 3.07 persons per family.
| Family Type | # Families | Family Size |
| Married-Couple | 1,952 (70.4%) | 3.38 |
| Single Male/Father | 401 (14.5%) | 3.07 |
| Single Female/Mother | 419 (15.1%) | 3.67 |
| Total Families | 2,772 (100.0%) | 3.38 |
Median Household Size in North Lindenhurst
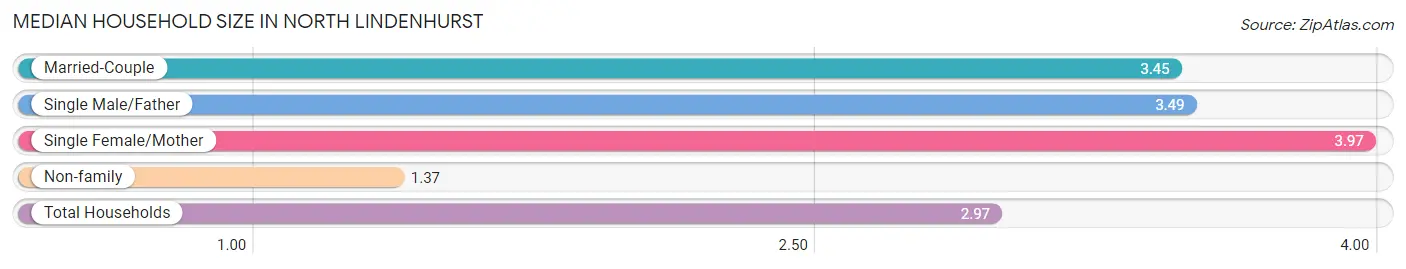
The median household size in North Lindenhurst is 2.97 persons per household, with single female/mother households (419 | 11.2%) accounting for the largest median household size of 3.97 persons per household. non-family households (973 | 26.0%) represent the smallest median household size with 1.37 persons per household.
| Household Type | # Households | Household Size |
| Married-Couple | 1,952 (52.1%) | 3.45 |
| Single Male/Father | 401 (10.7%) | 3.49 |
| Single Female/Mother | 419 (11.2%) | 3.97 |
| Non-family | 973 (26.0%) | 1.37 |
| Total Households | 3,745 (100.0%) | 2.97 |
Household Size by Marriage Status in North Lindenhurst
Out of a total of 3,745 households in North Lindenhurst, 2,772 (74.0%) are family households, while 973 (26.0%) are nonfamily households. The most numerous type of family households are 3-person households, comprising 847, and the most common type of nonfamily households are 1-person households, comprising 645.
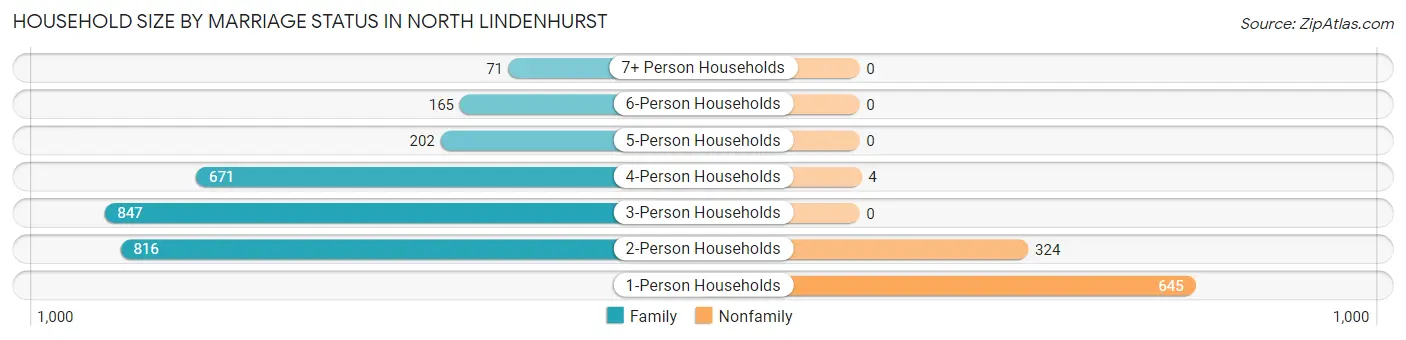
| Household Size | Family Households | Nonfamily Households |
| 1-Person Households | - | 645 (17.2%) |
| 2-Person Households | 816 (21.8%) | 324 (8.6%) |
| 3-Person Households | 847 (22.6%) | 0 (0.0%) |
| 4-Person Households | 671 (17.9%) | 4 (0.1%) |
| 5-Person Households | 202 (5.4%) | 0 (0.0%) |
| 6-Person Households | 165 (4.4%) | 0 (0.0%) |
| 7+ Person Households | 71 (1.9%) | 0 (0.0%) |
| Total | 2,772 (74.0%) | 973 (26.0%) |
Female Fertility in North Lindenhurst
Fertility by Age in North Lindenhurst
Average fertility rate in North Lindenhurst is 30.0 births per 1,000 women. Women in the age bracket of 20 to 34 years have the highest fertility rate with 44.0 births per 1,000 women. Women in the age bracket of 20 to 34 years acount for 60.6% of all women with births.
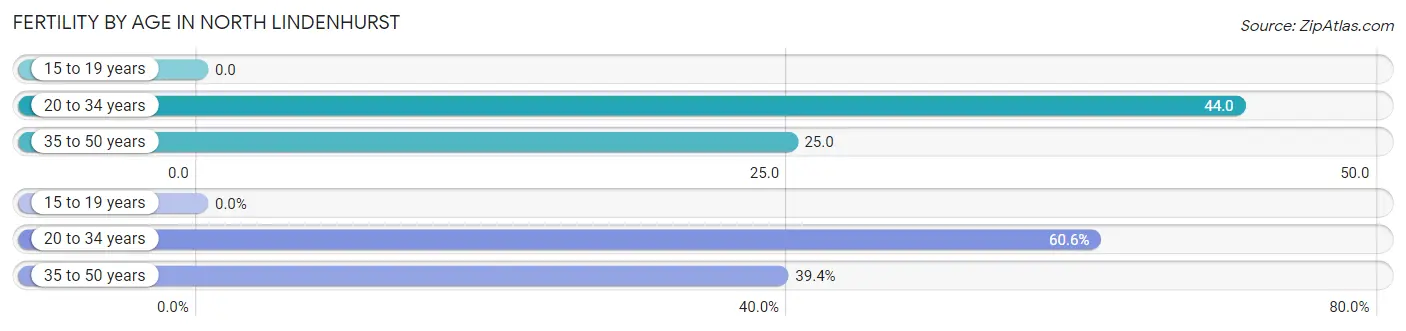
| Age Bracket | Women with Births | Births / 1,000 Women |
| 15 to 19 years | 0 (0.0%) | 0.0 |
| 20 to 34 years | 40 (60.6%) | 44.0 |
| 35 to 50 years | 26 (39.4%) | 25.0 |
| Total | 66 (100.0%) | 30.0 |
Fertility by Age by Marriage Status in North Lindenhurst
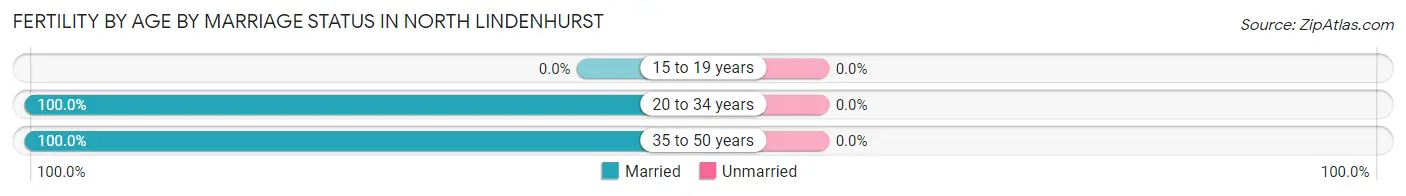
| Age Bracket | Married | Unmarried |
| 15 to 19 years | 0 (0.0%) | 0 (0.0%) |
| 20 to 34 years | 40 (100.0%) | 0 (0.0%) |
| 35 to 50 years | 26 (100.0%) | 0 (0.0%) |
| Total | 66 (100.0%) | 0 (0.0%) |
Fertility by Education in North Lindenhurst
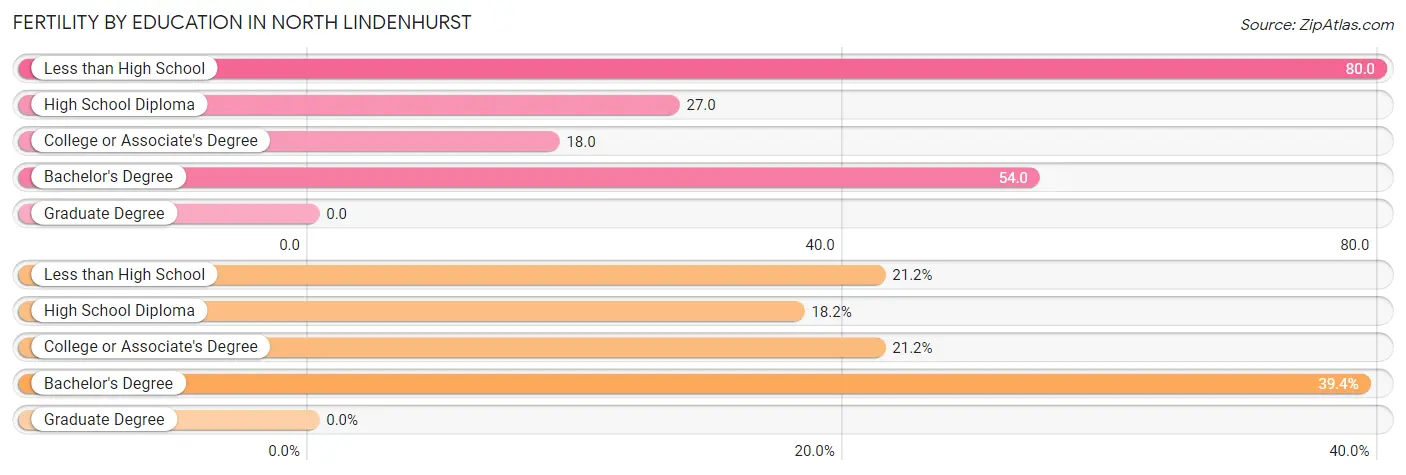
| Educational Attainment | Women with Births | Births / 1,000 Women |
| Less than High School | 14 (21.2%) | 80.0 |
| High School Diploma | 12 (18.2%) | 27.0 |
| College or Associate's Degree | 14 (21.2%) | 18.0 |
| Bachelor's Degree | 26 (39.4%) | 54.0 |
| Graduate Degree | 0 (0.0%) | 0.0 |
| Total | 66 (100.0%) | 30.0 |
Fertility by Education by Marriage Status in North Lindenhurst
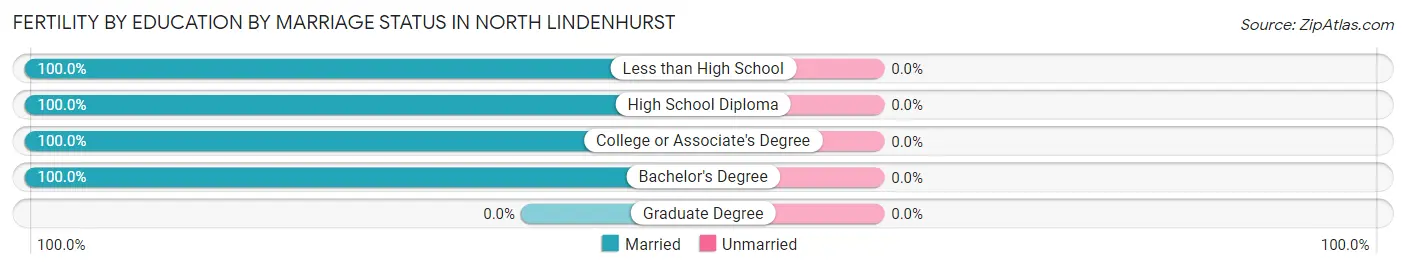
| Educational Attainment | Married | Unmarried |
| Less than High School | 14 (100.0%) | 0 (0.0%) |
| High School Diploma | 12 (100.0%) | 0 (0.0%) |
| College or Associate's Degree | 14 (100.0%) | 0 (0.0%) |
| Bachelor's Degree | 26 (100.0%) | 0 (0.0%) |
| Graduate Degree | 0 (0.0%) | 0 (0.0%) |
| Total | 66 (100.0%) | 0 (0.0%) |
Employment Characteristics in North Lindenhurst
Employment by Class of Employer in North Lindenhurst
Among the 6,141 employed individuals in North Lindenhurst, private company employees (4,145 | 67.5%), local government employees (493 | 8.0%), and not-for-profit organizations (387 | 6.3%) make up the most common classes of employment.
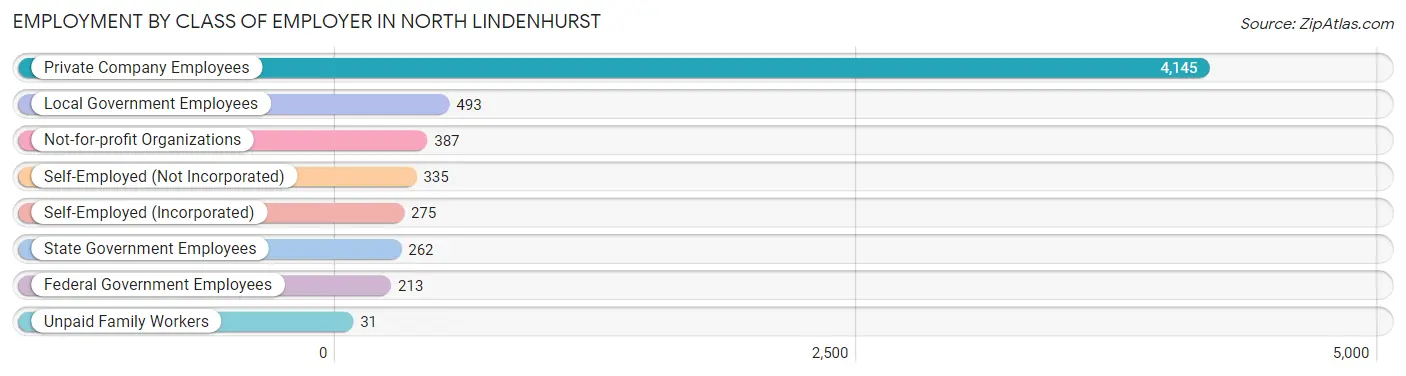
| Employer Class | # Employees | % Employees |
| Private Company Employees | 4,145 | 67.5% |
| Self-Employed (Incorporated) | 275 | 4.5% |
| Self-Employed (Not Incorporated) | 335 | 5.5% |
| Not-for-profit Organizations | 387 | 6.3% |
| Local Government Employees | 493 | 8.0% |
| State Government Employees | 262 | 4.3% |
| Federal Government Employees | 213 | 3.5% |
| Unpaid Family Workers | 31 | 0.5% |
| Total | 6,141 | 100.0% |
Employment Status by Age in North Lindenhurst
According to the labor force statistics for North Lindenhurst, out of the total population over 16 years of age (9,426), 70.4% or 6,636 individuals are in the labor force, with 3.5% or 232 of them unemployed. The age group with the highest labor force participation rate is 25 to 29 years, with 96.6% or 651 individuals in the labor force. Within the labor force, the 20 to 24 years age range has the highest percentage of unemployed individuals, with 15.6% or 73 of them being unemployed.
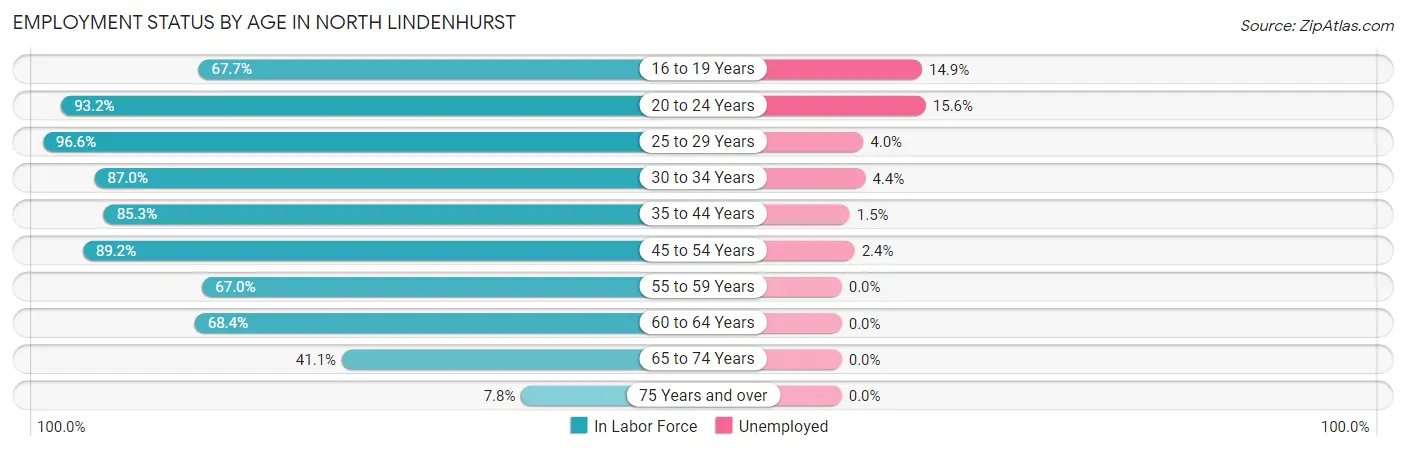
| Age Bracket | In Labor Force | Unemployed |
| 16 to 19 Years | 355 (67.7%) | 53 (14.9%) |
| 20 to 24 Years | 468 (93.2%) | 73 (15.6%) |
| 25 to 29 Years | 651 (96.6%) | 26 (4.0%) |
| 30 to 34 Years | 630 (87.0%) | 28 (4.4%) |
| 35 to 44 Years | 1,302 (85.3%) | 20 (1.5%) |
| 45 to 54 Years | 1,434 (89.2%) | 34 (2.4%) |
| 55 to 59 Years | 803 (67.0%) | 0 (0.0%) |
| 60 to 64 Years | 591 (68.4%) | 0 (0.0%) |
| 65 to 74 Years | 320 (41.1%) | 0 (0.0%) |
| 75 Years and over | 80 (7.8%) | 0 (0.0%) |
| Total | 6,636 (70.4%) | 232 (3.5%) |
Employment Status by Educational Attainment in North Lindenhurst
According to labor force statistics for North Lindenhurst, 82.1% of individuals (5,414) out of the total population between 25 and 64 years of age (6,594) are in the labor force, with 2.0% or 108 of them being unemployed. The group with the highest labor force participation rate are those with the educational attainment of college / associate degree, with 85.9% or 1,677 individuals in the labor force. Within the labor force, individuals with college / associate degree education have the highest percentage of unemployment, with 4.0% or 67 of them being unemployed.
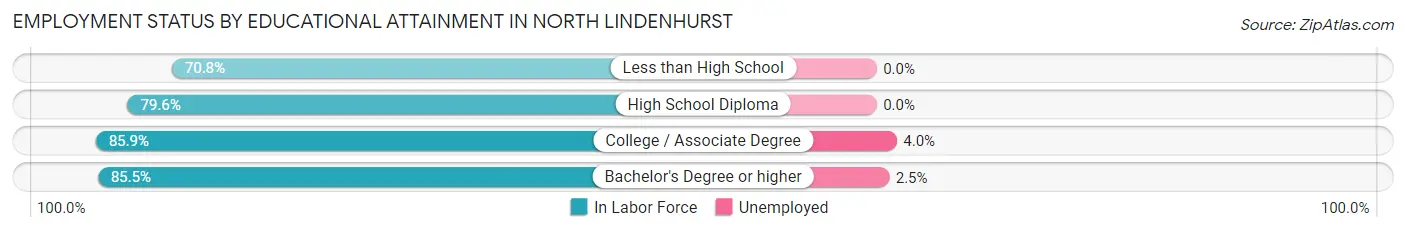
| Educational Attainment | In Labor Force | Unemployed |
| Less than High School | 571 (70.8%) | 0 (0.0%) |
| High School Diploma | 1,543 (79.6%) | 0 (0.0%) |
| College / Associate Degree | 1,677 (85.9%) | 78 (4.0%) |
| Bachelor's Degree or higher | 1,621 (85.5%) | 47 (2.5%) |
| Total | 5,414 (82.1%) | 132 (2.0%) |
Employment Occupations by Sex in North Lindenhurst
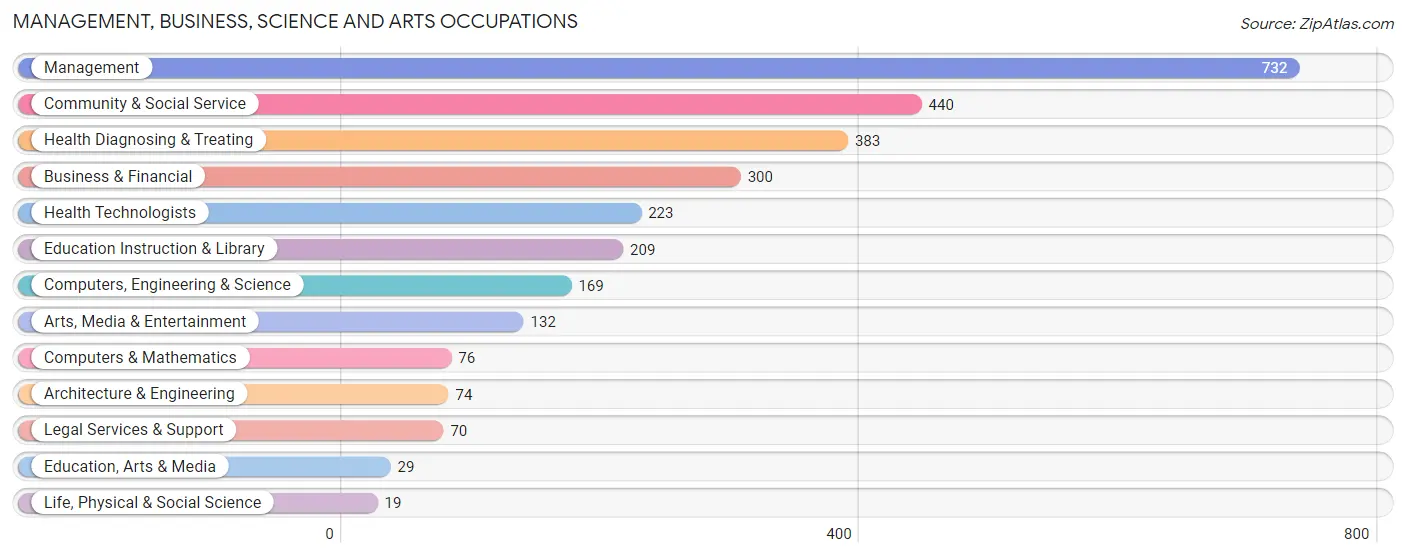
Management, Business, Science and Arts Occupations
The most common Management, Business, Science and Arts occupations in North Lindenhurst are Management (732 | 11.4%), Community & Social Service (440 | 6.9%), Health Diagnosing & Treating (383 | 6.0%), Business & Financial (300 | 4.7%), and Health Technologists (223 | 3.5%).
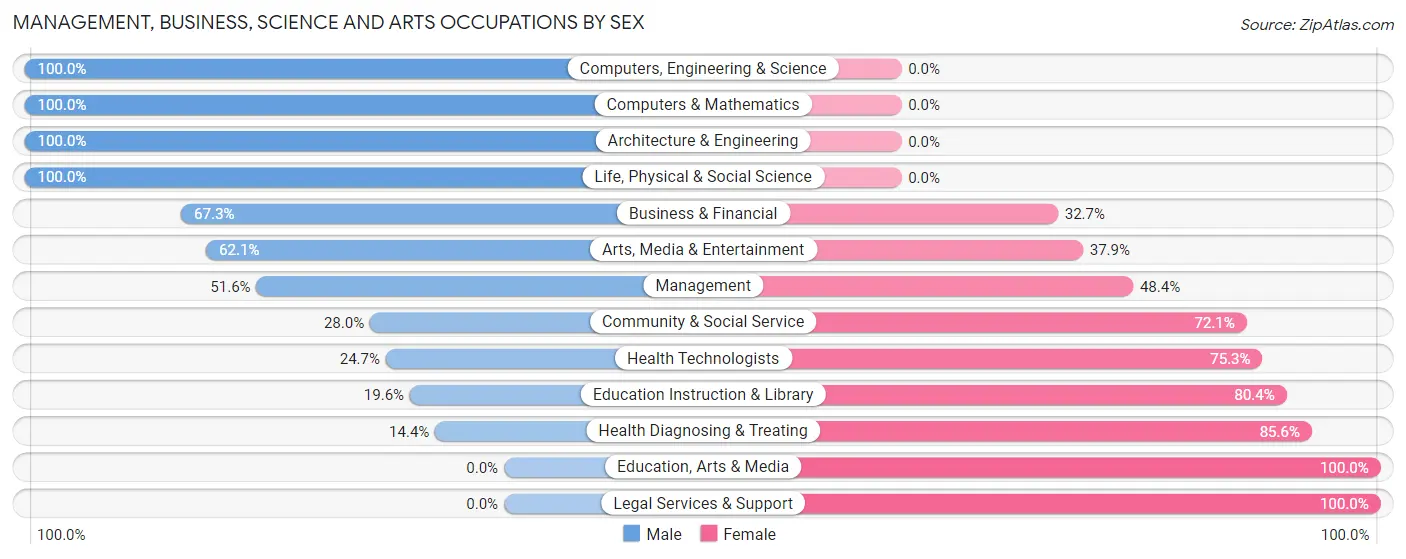
Management, Business, Science and Arts Occupations by Sex
Within the Management, Business, Science and Arts occupations in North Lindenhurst, the most male-oriented occupations are Computers, Engineering & Science (100.0%), Computers & Mathematics (100.0%), and Architecture & Engineering (100.0%), while the most female-oriented occupations are Education, Arts & Media (100.0%), Legal Services & Support (100.0%), and Health Diagnosing & Treating (85.6%).
| Occupation | Male | Female |
| Management | 378 (51.6%) | 354 (48.4%) |
| Business & Financial | 202 (67.3%) | 98 (32.7%) |
| Computers, Engineering & Science | 169 (100.0%) | 0 (0.0%) |
| Computers & Mathematics | 76 (100.0%) | 0 (0.0%) |
| Architecture & Engineering | 74 (100.0%) | 0 (0.0%) |
| Life, Physical & Social Science | 19 (100.0%) | 0 (0.0%) |
| Community & Social Service | 123 (28.0%) | 317 (72.1%) |
| Education, Arts & Media | 0 (0.0%) | 29 (100.0%) |
| Legal Services & Support | 0 (0.0%) | 70 (100.0%) |
| Education Instruction & Library | 41 (19.6%) | 168 (80.4%) |
| Arts, Media & Entertainment | 82 (62.1%) | 50 (37.9%) |
| Health Diagnosing & Treating | 55 (14.4%) | 328 (85.6%) |
| Health Technologists | 55 (24.7%) | 168 (75.3%) |
| Total (Category) | 927 (45.8%) | 1,097 (54.2%) |
| Total (Overall) | 3,498 (54.6%) | 2,903 (45.4%) |
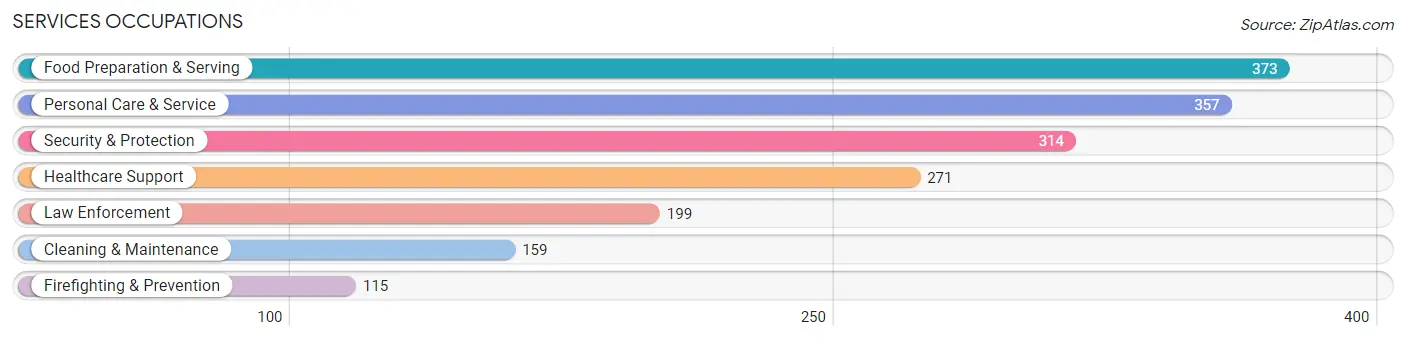
Services Occupations
The most common Services occupations in North Lindenhurst are Food Preparation & Serving (373 | 5.8%), Personal Care & Service (357 | 5.6%), Security & Protection (314 | 4.9%), Healthcare Support (271 | 4.2%), and Law Enforcement (199 | 3.1%).
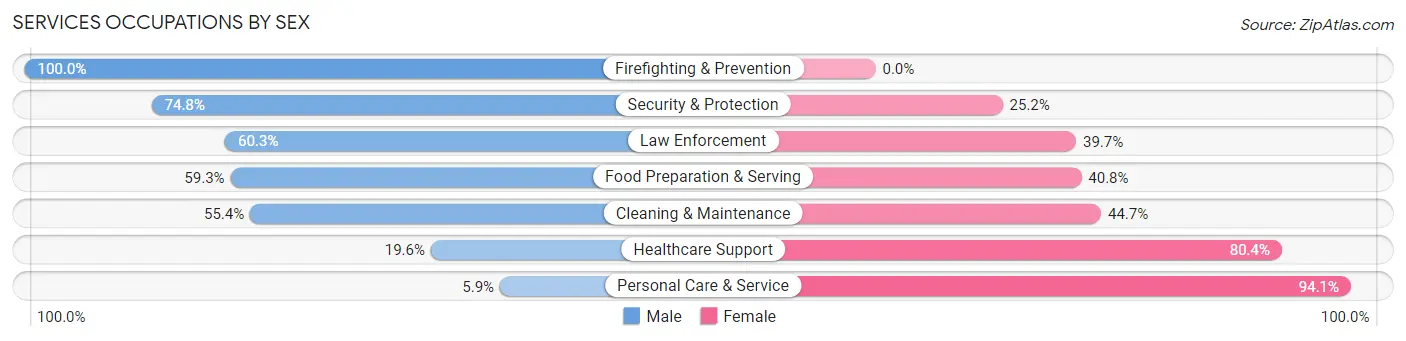
Services Occupations by Sex
Within the Services occupations in North Lindenhurst, the most male-oriented occupations are Firefighting & Prevention (100.0%), Security & Protection (74.8%), and Law Enforcement (60.3%), while the most female-oriented occupations are Personal Care & Service (94.1%), Healthcare Support (80.4%), and Cleaning & Maintenance (44.7%).
| Occupation | Male | Female |
| Healthcare Support | 53 (19.6%) | 218 (80.4%) |
| Security & Protection | 235 (74.8%) | 79 (25.2%) |
| Firefighting & Prevention | 115 (100.0%) | 0 (0.0%) |
| Law Enforcement | 120 (60.3%) | 79 (39.7%) |
| Food Preparation & Serving | 221 (59.3%) | 152 (40.7%) |
| Cleaning & Maintenance | 88 (55.3%) | 71 (44.7%) |
| Personal Care & Service | 21 (5.9%) | 336 (94.1%) |
| Total (Category) | 618 (41.9%) | 856 (58.1%) |
| Total (Overall) | 3,498 (54.6%) | 2,903 (45.4%) |
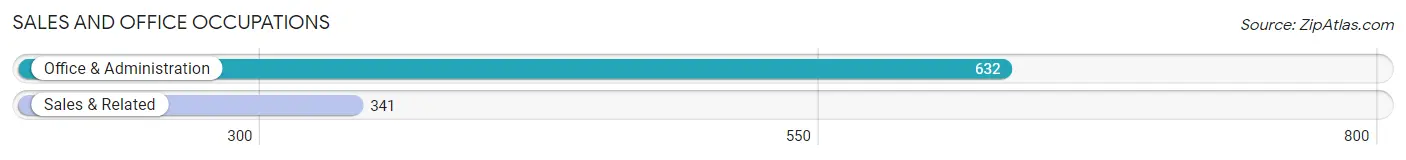
Sales and Office Occupations
The most common Sales and Office occupations in North Lindenhurst are Office & Administration (632 | 9.9%), and Sales & Related (341 | 5.3%).
Sales and Office Occupations by Sex
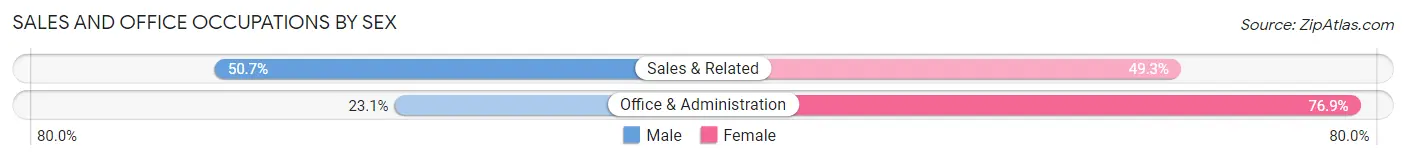
| Occupation | Male | Female |
| Sales & Related | 173 (50.7%) | 168 (49.3%) |
| Office & Administration | 146 (23.1%) | 486 (76.9%) |
| Total (Category) | 319 (32.8%) | 654 (67.2%) |
| Total (Overall) | 3,498 (54.6%) | 2,903 (45.4%) |
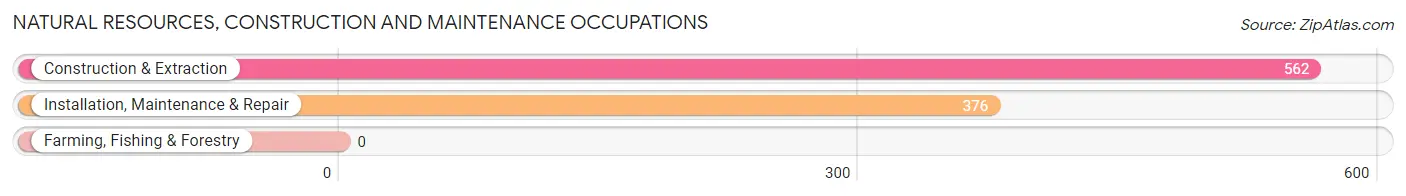
Natural Resources, Construction and Maintenance Occupations
The most common Natural Resources, Construction and Maintenance occupations in North Lindenhurst are Construction & Extraction (562 | 8.8%), and Installation, Maintenance & Repair (376 | 5.9%).
Natural Resources, Construction and Maintenance Occupations by Sex
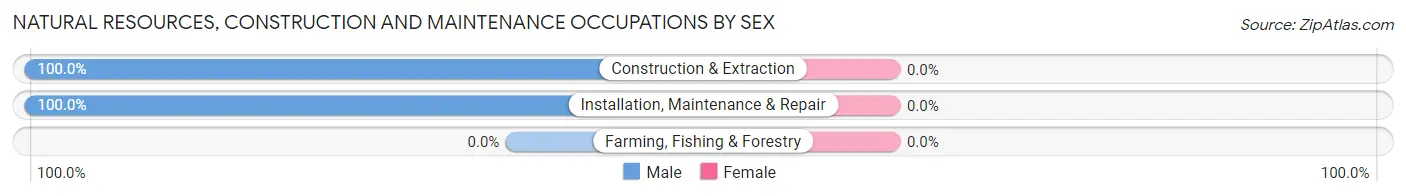
| Occupation | Male | Female |
| Farming, Fishing & Forestry | 0 (0.0%) | 0 (0.0%) |
| Construction & Extraction | 562 (100.0%) | 0 (0.0%) |
| Installation, Maintenance & Repair | 376 (100.0%) | 0 (0.0%) |
| Total (Category) | 938 (100.0%) | 0 (0.0%) |
| Total (Overall) | 3,498 (54.6%) | 2,903 (45.4%) |
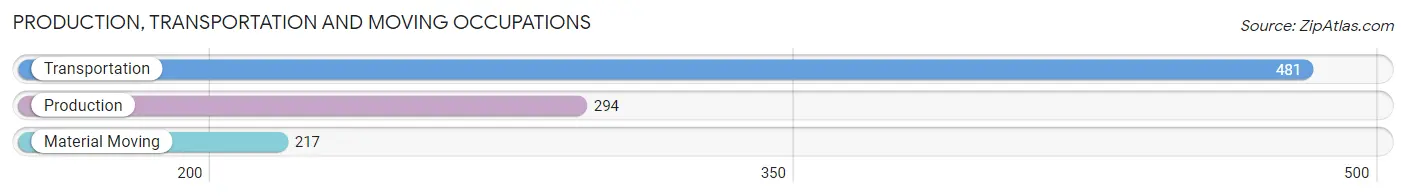
Production, Transportation and Moving Occupations
The most common Production, Transportation and Moving occupations in North Lindenhurst are Transportation (481 | 7.5%), Production (294 | 4.6%), and Material Moving (217 | 3.4%).
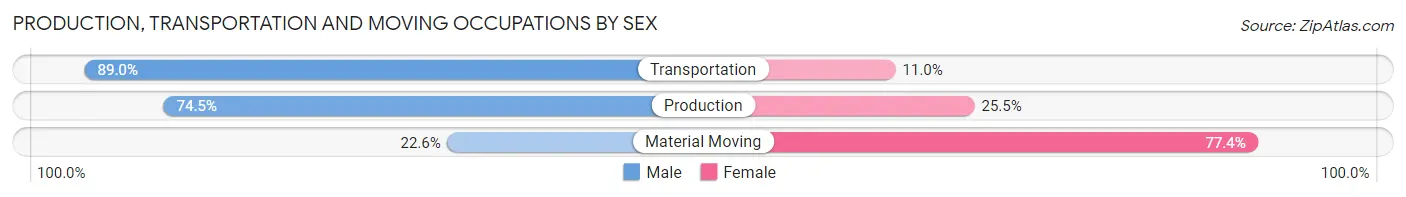
Production, Transportation and Moving Occupations by Sex
| Occupation | Male | Female |
| Production | 219 (74.5%) | 75 (25.5%) |
| Transportation | 428 (89.0%) | 53 (11.0%) |
| Material Moving | 49 (22.6%) | 168 (77.4%) |
| Total (Category) | 696 (70.2%) | 296 (29.8%) |
| Total (Overall) | 3,498 (54.6%) | 2,903 (45.4%) |
Employment Industries by Sex in North Lindenhurst
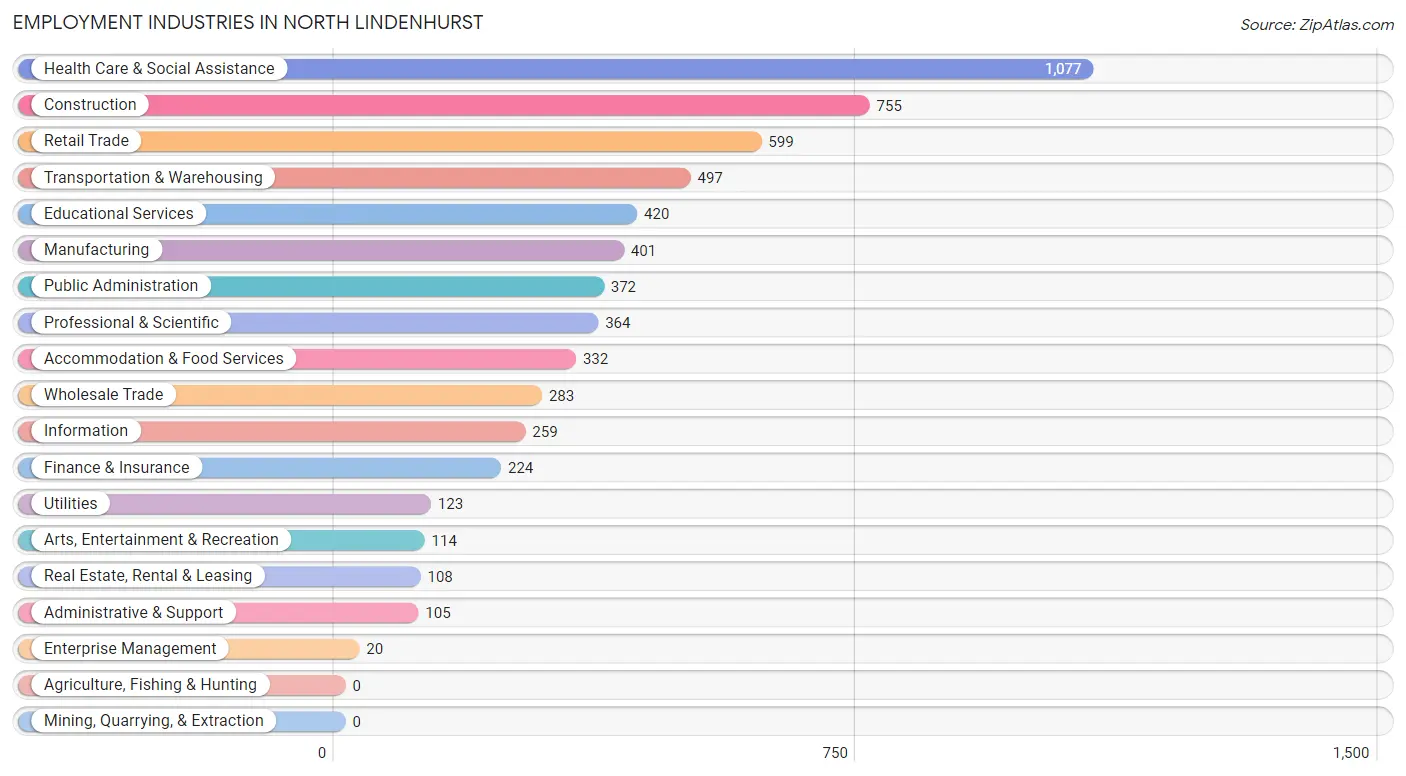
Employment Industries in North Lindenhurst
The major employment industries in North Lindenhurst include Health Care & Social Assistance (1,077 | 16.8%), Construction (755 | 11.8%), Retail Trade (599 | 9.4%), Transportation & Warehousing (497 | 7.8%), and Educational Services (420 | 6.6%).
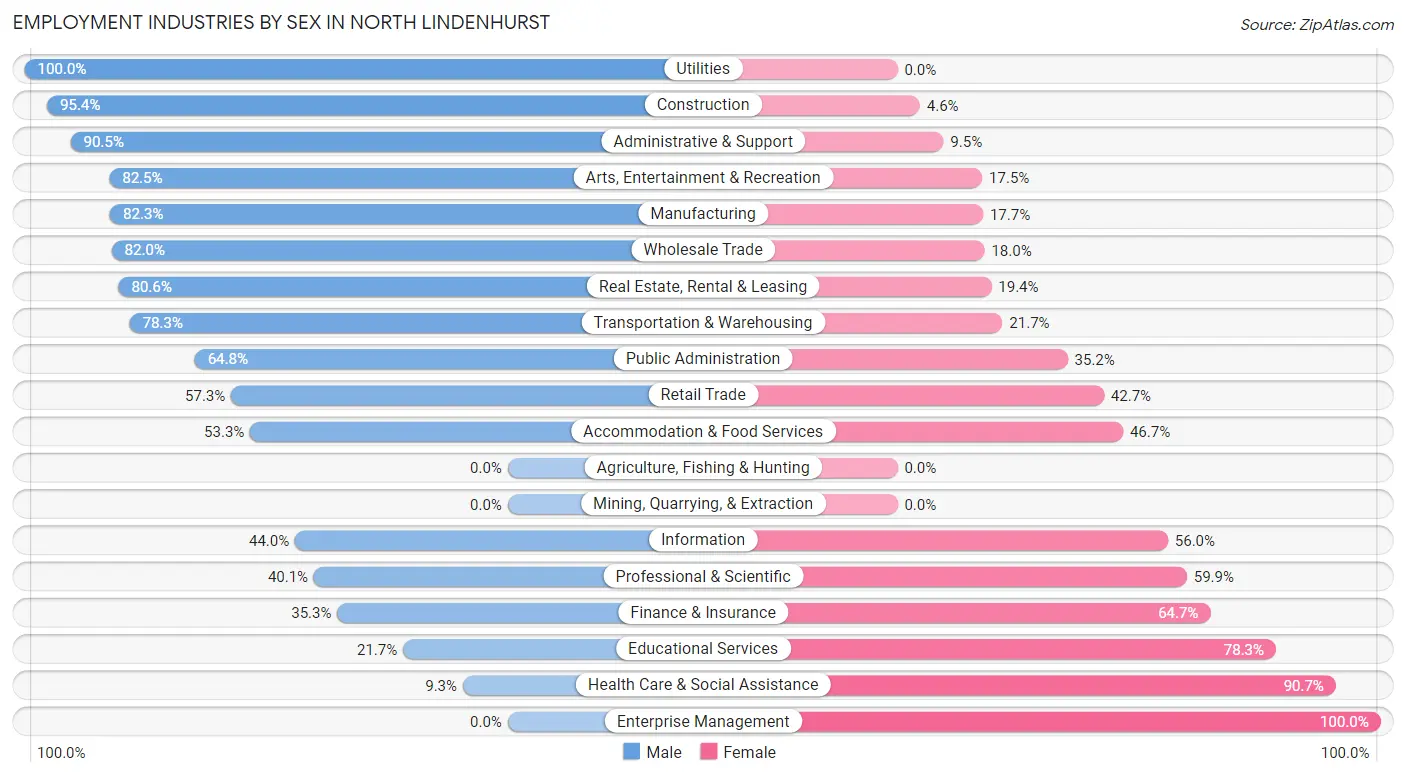
Employment Industries by Sex in North Lindenhurst
The North Lindenhurst industries that see more men than women are Utilities (100.0%), Construction (95.4%), and Administrative & Support (90.5%), whereas the industries that tend to have a higher number of women are Enterprise Management (100.0%), Health Care & Social Assistance (90.7%), and Educational Services (78.3%).
| Industry | Male | Female |
| Agriculture, Fishing & Hunting | 0 (0.0%) | 0 (0.0%) |
| Mining, Quarrying, & Extraction | 0 (0.0%) | 0 (0.0%) |
| Construction | 720 (95.4%) | 35 (4.6%) |
| Manufacturing | 330 (82.3%) | 71 (17.7%) |
| Wholesale Trade | 232 (82.0%) | 51 (18.0%) |
| Retail Trade | 343 (57.3%) | 256 (42.7%) |
| Transportation & Warehousing | 389 (78.3%) | 108 (21.7%) |
| Utilities | 123 (100.0%) | 0 (0.0%) |
| Information | 114 (44.0%) | 145 (56.0%) |
| Finance & Insurance | 79 (35.3%) | 145 (64.7%) |
| Real Estate, Rental & Leasing | 87 (80.6%) | 21 (19.4%) |
| Professional & Scientific | 146 (40.1%) | 218 (59.9%) |
| Enterprise Management | 0 (0.0%) | 20 (100.0%) |
| Administrative & Support | 95 (90.5%) | 10 (9.5%) |
| Educational Services | 91 (21.7%) | 329 (78.3%) |
| Health Care & Social Assistance | 100 (9.3%) | 977 (90.7%) |
| Arts, Entertainment & Recreation | 94 (82.5%) | 20 (17.5%) |
| Accommodation & Food Services | 177 (53.3%) | 155 (46.7%) |
| Public Administration | 241 (64.8%) | 131 (35.2%) |
| Total | 3,498 (54.6%) | 2,903 (45.4%) |
Education in North Lindenhurst
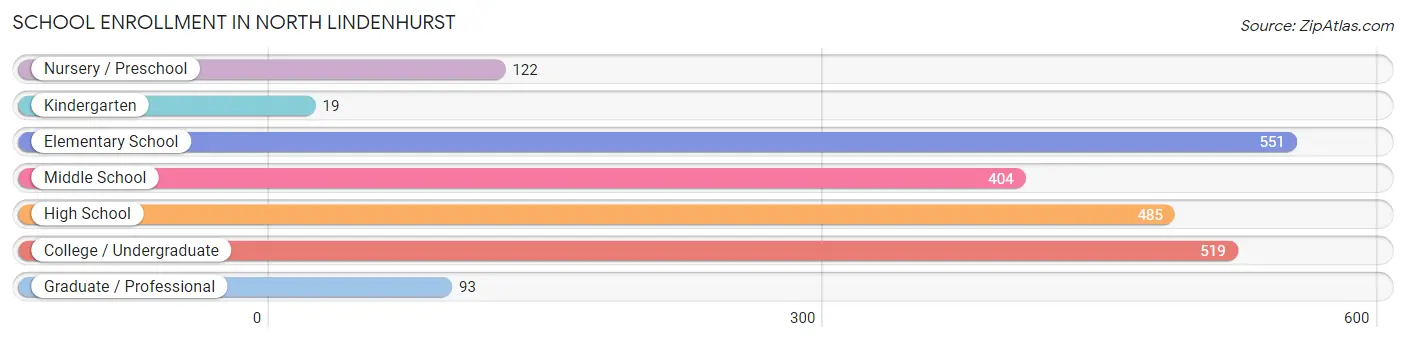
School Enrollment in North Lindenhurst
The most common levels of schooling among the 2,193 students in North Lindenhurst are elementary school (551 | 25.1%), college / undergraduate (519 | 23.7%), and high school (485 | 22.1%).
| School Level | # Students | % Students |
| Nursery / Preschool | 122 | 5.6% |
| Kindergarten | 19 | 0.9% |
| Elementary School | 551 | 25.1% |
| Middle School | 404 | 18.4% |
| High School | 485 | 22.1% |
| College / Undergraduate | 519 | 23.7% |
| Graduate / Professional | 93 | 4.2% |
| Total | 2,193 | 100.0% |
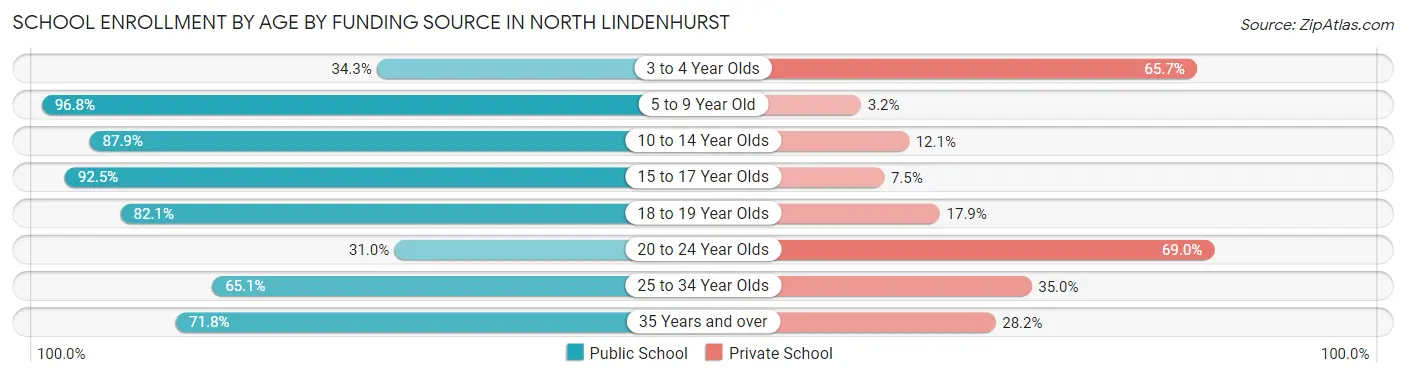
School Enrollment by Age by Funding Source in North Lindenhurst
Out of a total of 2,193 students who are enrolled in schools in North Lindenhurst, 443 (20.2%) attend a private institution, while the remaining 1,750 (79.8%) are enrolled in public schools. The age group of 20 to 24 year olds has the highest likelihood of being enrolled in private schools, with 158 (69.0% in the age bracket) enrolled. Conversely, the age group of 5 to 9 year old has the lowest likelihood of being enrolled in a private school, with 485 (96.8% in the age bracket) attending a public institution.
| Age Bracket | Public School | Private School |
| 3 to 4 Year Olds | 37 (34.3%) | 71 (65.7%) |
| 5 to 9 Year Old | 485 (96.8%) | 16 (3.2%) |
| 10 to 14 Year Olds | 515 (87.9%) | 71 (12.1%) |
| 15 to 17 Year Olds | 320 (92.5%) | 26 (7.5%) |
| 18 to 19 Year Olds | 193 (82.1%) | 42 (17.9%) |
| 20 to 24 Year Olds | 71 (31.0%) | 158 (69.0%) |
| 25 to 34 Year Olds | 67 (65.0%) | 36 (34.9%) |
| 35 Years and over | 61 (71.8%) | 24 (28.2%) |
| Total | 1,750 (79.8%) | 443 (20.2%) |
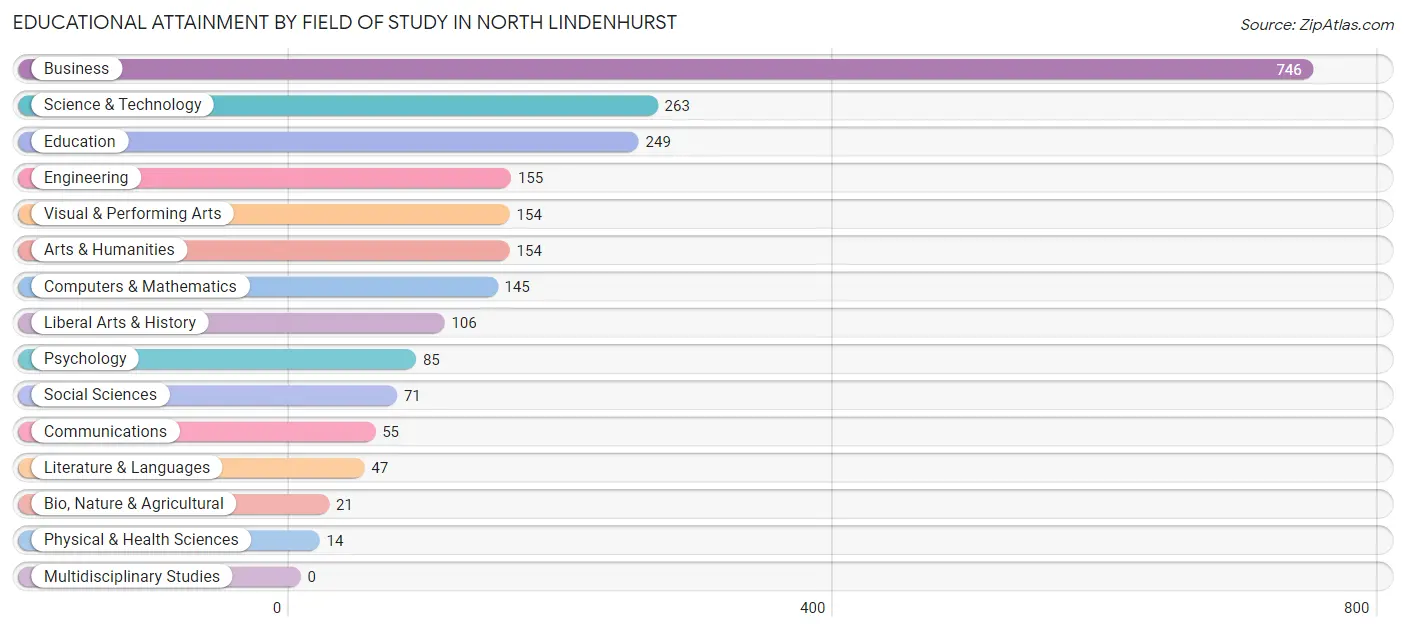
Educational Attainment by Field of Study in North Lindenhurst
Business (746 | 32.9%), science & technology (263 | 11.6%), education (249 | 11.0%), engineering (155 | 6.8%), and visual & performing arts (154 | 6.8%) are the most common fields of study among 2,265 individuals in North Lindenhurst who have obtained a bachelor's degree or higher.
| Field of Study | # Graduates | % Graduates |
| Computers & Mathematics | 145 | 6.4% |
| Bio, Nature & Agricultural | 21 | 0.9% |
| Physical & Health Sciences | 14 | 0.6% |
| Psychology | 85 | 3.7% |
| Social Sciences | 71 | 3.1% |
| Engineering | 155 | 6.8% |
| Multidisciplinary Studies | 0 | 0.0% |
| Science & Technology | 263 | 11.6% |
| Business | 746 | 32.9% |
| Education | 249 | 11.0% |
| Literature & Languages | 47 | 2.1% |
| Liberal Arts & History | 106 | 4.7% |
| Visual & Performing Arts | 154 | 6.8% |
| Communications | 55 | 2.4% |
| Arts & Humanities | 154 | 6.8% |
| Total | 2,265 | 100.0% |
Transportation & Commute in North Lindenhurst
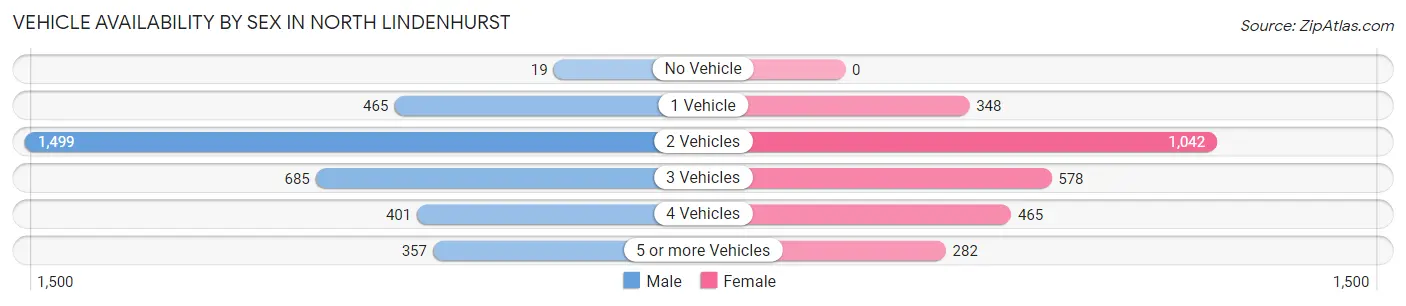
Vehicle Availability by Sex in North Lindenhurst
The most prevalent vehicle ownership categories in North Lindenhurst are males with 2 vehicles (1,499, accounting for 43.8%) and females with 2 vehicles (1,042, making up 55.2%).
| Vehicles Available | Male | Female |
| No Vehicle | 19 (0.5%) | 0 (0.0%) |
| 1 Vehicle | 465 (13.6%) | 348 (12.8%) |
| 2 Vehicles | 1,499 (43.8%) | 1,042 (38.4%) |
| 3 Vehicles | 685 (20.0%) | 578 (21.3%) |
| 4 Vehicles | 401 (11.7%) | 465 (17.1%) |
| 5 or more Vehicles | 357 (10.4%) | 282 (10.4%) |
| Total | 3,426 (100.0%) | 2,715 (100.0%) |
Commute Time in North Lindenhurst
The most frequently occuring commute durations in North Lindenhurst are 20 to 24 minutes (866 commuters, 15.0%), 15 to 19 minutes (823 commuters, 14.2%), and 30 to 34 minutes (807 commuters, 14.0%).
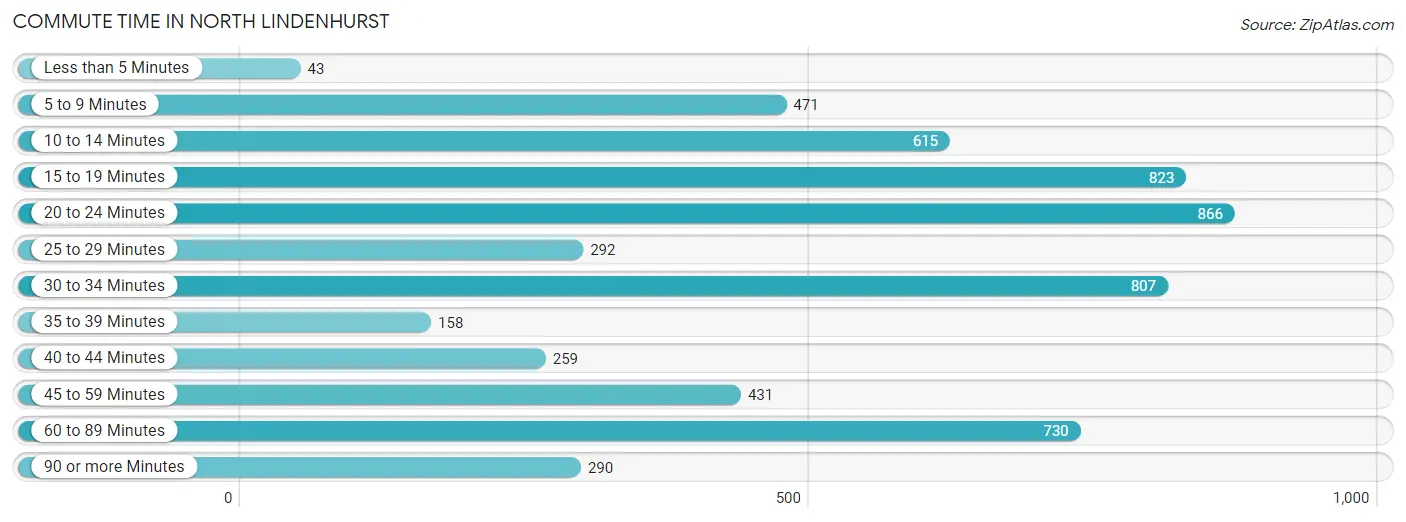
| Commute Time | # Commuters | % Commuters |
| Less than 5 Minutes | 43 | 0.7% |
| 5 to 9 Minutes | 471 | 8.1% |
| 10 to 14 Minutes | 615 | 10.6% |
| 15 to 19 Minutes | 823 | 14.2% |
| 20 to 24 Minutes | 866 | 15.0% |
| 25 to 29 Minutes | 292 | 5.1% |
| 30 to 34 Minutes | 807 | 14.0% |
| 35 to 39 Minutes | 158 | 2.7% |
| 40 to 44 Minutes | 259 | 4.5% |
| 45 to 59 Minutes | 431 | 7.4% |
| 60 to 89 Minutes | 730 | 12.6% |
| 90 or more Minutes | 290 | 5.0% |
Commute Time by Sex in North Lindenhurst
The most common commute times in North Lindenhurst are 60 to 89 minutes (529 commuters, 16.7%) for males and 20 to 24 minutes (489 commuters, 18.7%) for females.
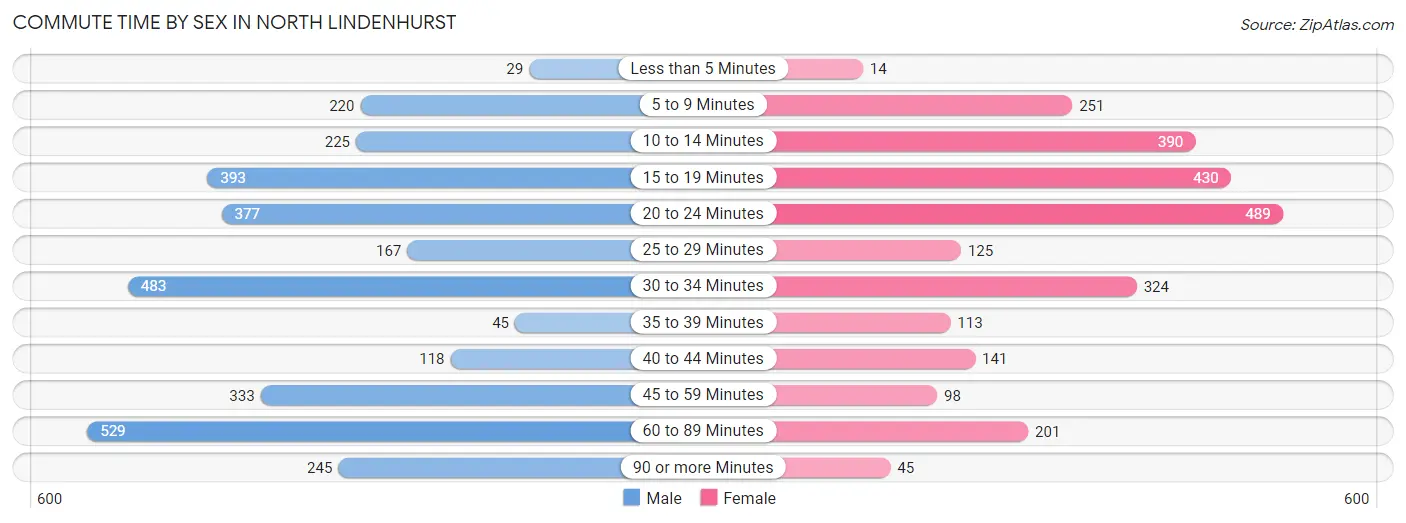
| Commute Time | Male | Female |
| Less than 5 Minutes | 29 (0.9%) | 14 (0.5%) |
| 5 to 9 Minutes | 220 (7.0%) | 251 (9.6%) |
| 10 to 14 Minutes | 225 (7.1%) | 390 (14.9%) |
| 15 to 19 Minutes | 393 (12.4%) | 430 (16.4%) |
| 20 to 24 Minutes | 377 (11.9%) | 489 (18.7%) |
| 25 to 29 Minutes | 167 (5.3%) | 125 (4.8%) |
| 30 to 34 Minutes | 483 (15.3%) | 324 (12.4%) |
| 35 to 39 Minutes | 45 (1.4%) | 113 (4.3%) |
| 40 to 44 Minutes | 118 (3.7%) | 141 (5.4%) |
| 45 to 59 Minutes | 333 (10.5%) | 98 (3.7%) |
| 60 to 89 Minutes | 529 (16.7%) | 201 (7.7%) |
| 90 or more Minutes | 245 (7.7%) | 45 (1.7%) |
Time of Departure to Work by Sex in North Lindenhurst
The most frequent times of departure to work in North Lindenhurst are 6:30 AM to 6:59 AM (596, 18.8%) for males and 8:00 AM to 8:29 AM (468, 17.9%) for females.
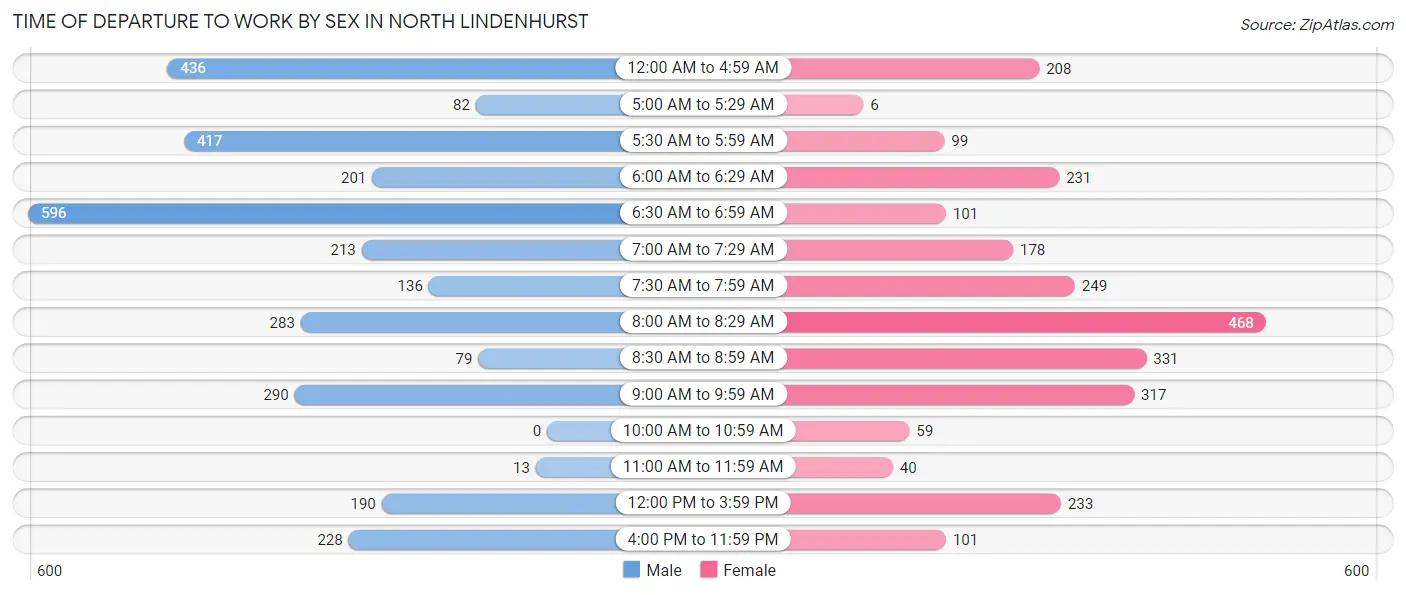
| Time of Departure | Male | Female |
| 12:00 AM to 4:59 AM | 436 (13.8%) | 208 (7.9%) |
| 5:00 AM to 5:29 AM | 82 (2.6%) | 6 (0.2%) |
| 5:30 AM to 5:59 AM | 417 (13.2%) | 99 (3.8%) |
| 6:00 AM to 6:29 AM | 201 (6.4%) | 231 (8.8%) |
| 6:30 AM to 6:59 AM | 596 (18.8%) | 101 (3.8%) |
| 7:00 AM to 7:29 AM | 213 (6.7%) | 178 (6.8%) |
| 7:30 AM to 7:59 AM | 136 (4.3%) | 249 (9.5%) |
| 8:00 AM to 8:29 AM | 283 (8.9%) | 468 (17.9%) |
| 8:30 AM to 8:59 AM | 79 (2.5%) | 331 (12.6%) |
| 9:00 AM to 9:59 AM | 290 (9.2%) | 317 (12.1%) |
| 10:00 AM to 10:59 AM | 0 (0.0%) | 59 (2.2%) |
| 11:00 AM to 11:59 AM | 13 (0.4%) | 40 (1.5%) |
| 12:00 PM to 3:59 PM | 190 (6.0%) | 233 (8.9%) |
| 4:00 PM to 11:59 PM | 228 (7.2%) | 101 (3.8%) |
| Total | 3,164 (100.0%) | 2,621 (100.0%) |
Housing Occupancy in North Lindenhurst
Occupancy by Ownership in North Lindenhurst
Of the total 3,745 dwellings in North Lindenhurst, owner-occupied units account for 2,968 (79.2%), while renter-occupied units make up 777 (20.7%).
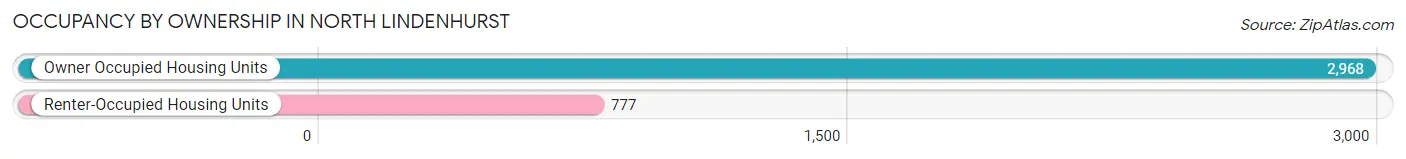
| Occupancy | # Housing Units | % Housing Units |
| Owner Occupied Housing Units | 2,968 | 79.2% |
| Renter-Occupied Housing Units | 777 | 20.7% |
| Total Occupied Housing Units | 3,745 | 100.0% |
Occupancy by Household Size in North Lindenhurst
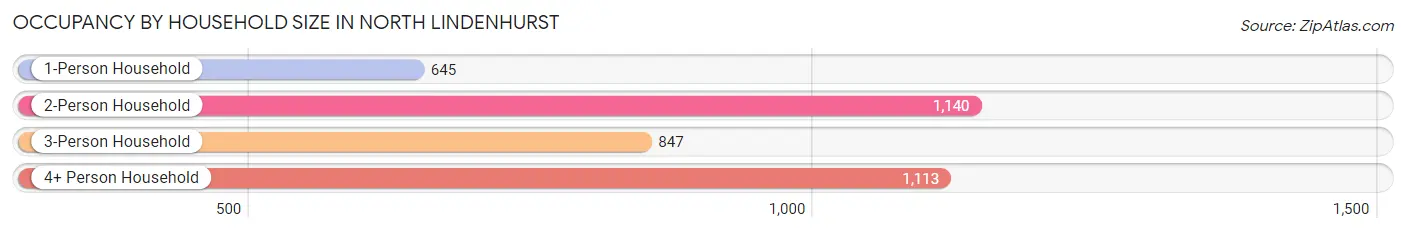
| Household Size | # Housing Units | % Housing Units |
| 1-Person Household | 645 | 17.2% |
| 2-Person Household | 1,140 | 30.4% |
| 3-Person Household | 847 | 22.6% |
| 4+ Person Household | 1,113 | 29.7% |
| Total Housing Units | 3,745 | 100.0% |
Occupancy by Ownership by Household Size in North Lindenhurst
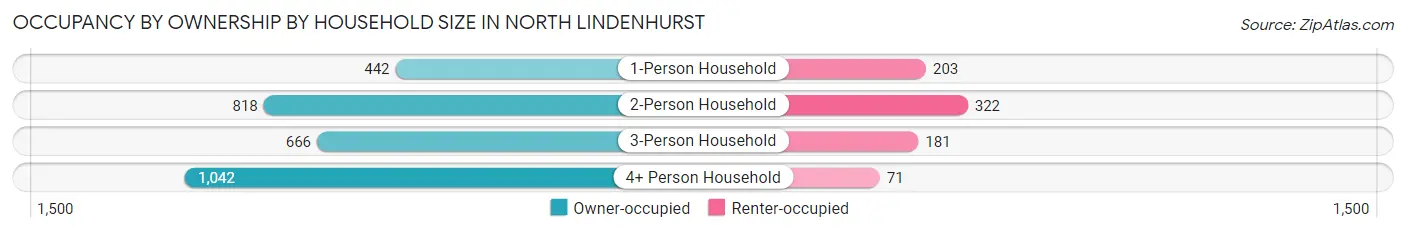
| Household Size | Owner-occupied | Renter-occupied |
| 1-Person Household | 442 (68.5%) | 203 (31.5%) |
| 2-Person Household | 818 (71.8%) | 322 (28.2%) |
| 3-Person Household | 666 (78.6%) | 181 (21.4%) |
| 4+ Person Household | 1,042 (93.6%) | 71 (6.4%) |
| Total Housing Units | 2,968 (79.2%) | 777 (20.7%) |
Occupancy by Educational Attainment in North Lindenhurst
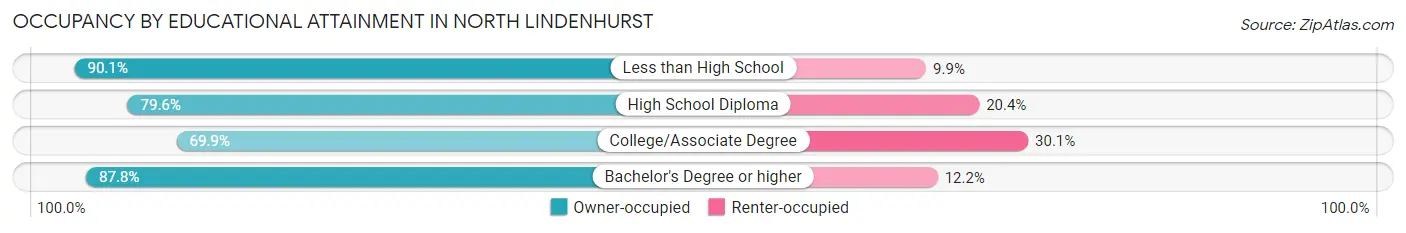
| Household Size | Owner-occupied | Renter-occupied |
| Less than High School | 391 (90.1%) | 43 (9.9%) |
| High School Diploma | 1,005 (79.6%) | 258 (20.4%) |
| College/Associate Degree | 881 (69.9%) | 380 (30.1%) |
| Bachelor's Degree or higher | 691 (87.8%) | 96 (12.2%) |
Occupancy by Age of Householder in North Lindenhurst
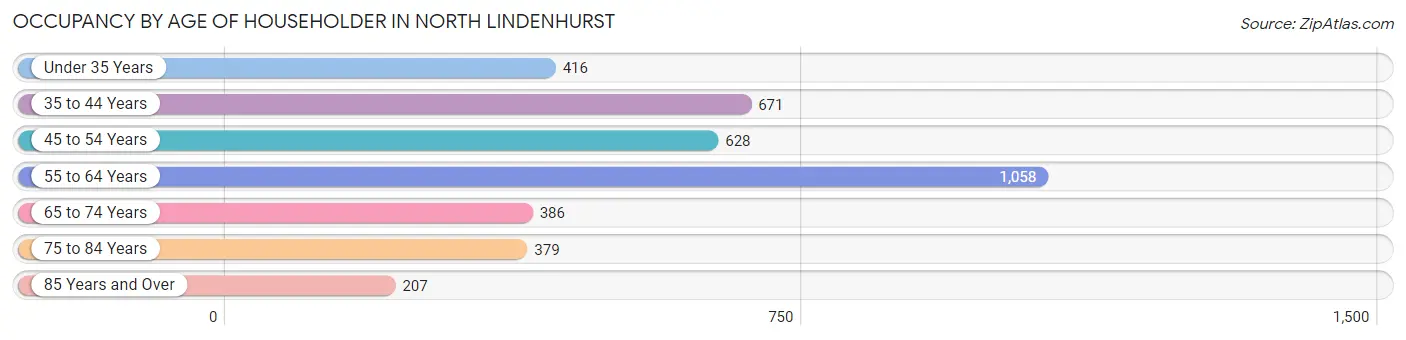
| Age Bracket | # Households | % Households |
| Under 35 Years | 416 | 11.1% |
| 35 to 44 Years | 671 | 17.9% |
| 45 to 54 Years | 628 | 16.8% |
| 55 to 64 Years | 1,058 | 28.2% |
| 65 to 74 Years | 386 | 10.3% |
| 75 to 84 Years | 379 | 10.1% |
| 85 Years and Over | 207 | 5.5% |
| Total | 3,745 | 100.0% |
Housing Finances in North Lindenhurst
Median Income by Occupancy in North Lindenhurst
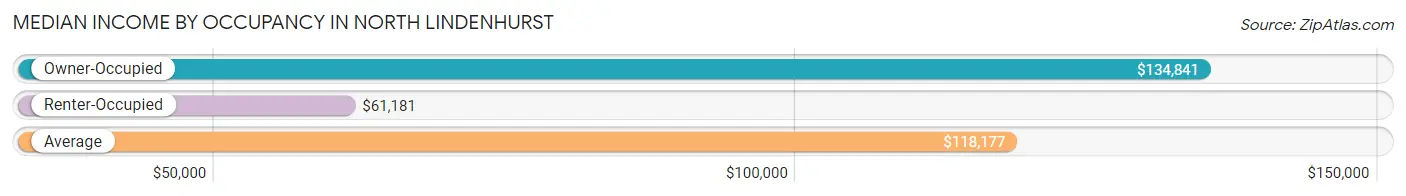
| Occupancy Type | # Households | Median Income |
| Owner-Occupied | 2,968 (79.2%) | $134,841 |
| Renter-Occupied | 777 (20.7%) | $61,181 |
| Average | 3,745 (100.0%) | $118,177 |
Occupancy by Householder Income Bracket in North Lindenhurst
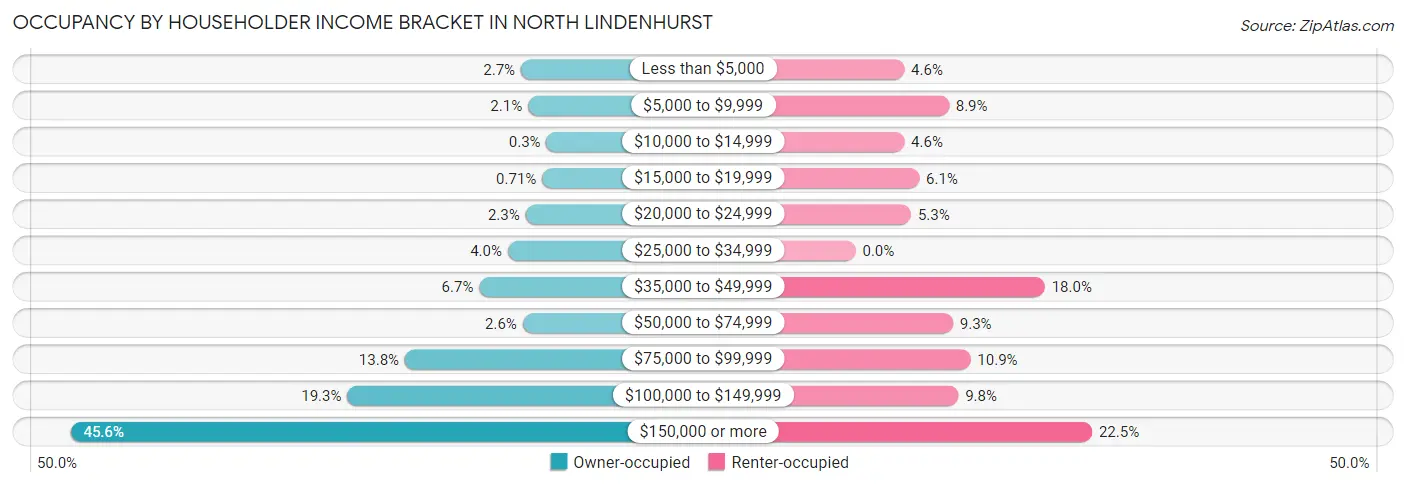
| Income Bracket | Owner-occupied | Renter-occupied |
| Less than $5,000 | 81 (2.7%) | 36 (4.6%) |
| $5,000 to $9,999 | 61 (2.1%) | 69 (8.9%) |
| $10,000 to $14,999 | 9 (0.3%) | 36 (4.6%) |
| $15,000 to $19,999 | 21 (0.7%) | 47 (6.0%) |
| $20,000 to $24,999 | 68 (2.3%) | 41 (5.3%) |
| $25,000 to $34,999 | 118 (4.0%) | 0 (0.0%) |
| $35,000 to $49,999 | 199 (6.7%) | 140 (18.0%) |
| $50,000 to $74,999 | 76 (2.6%) | 72 (9.3%) |
| $75,000 to $99,999 | 409 (13.8%) | 85 (10.9%) |
| $100,000 to $149,999 | 572 (19.3%) | 76 (9.8%) |
| $150,000 or more | 1,354 (45.6%) | 175 (22.5%) |
| Total | 2,968 (100.0%) | 777 (100.0%) |
Monthly Housing Cost Tiers in North Lindenhurst
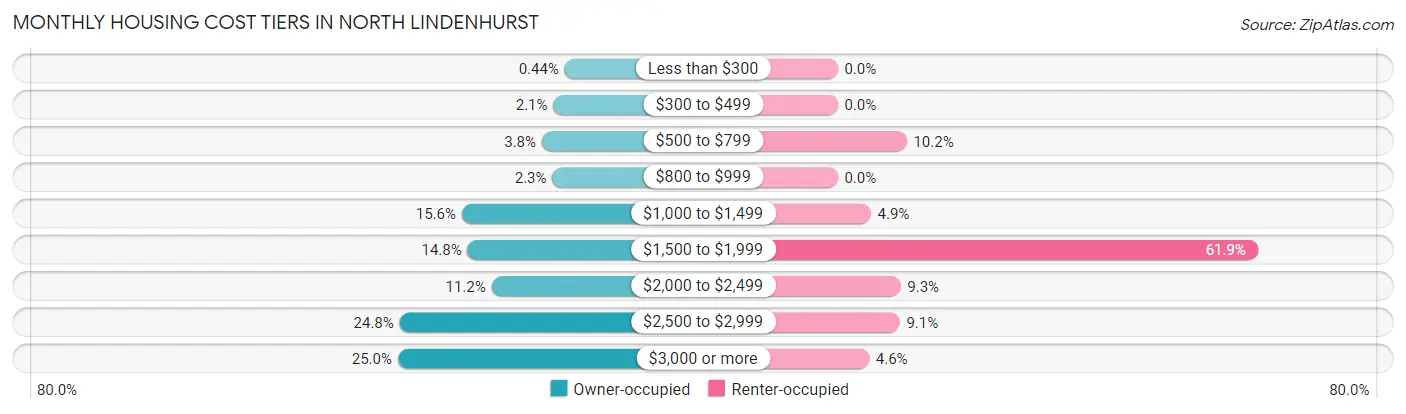
| Monthly Cost | Owner-occupied | Renter-occupied |
| Less than $300 | 13 (0.4%) | 0 (0.0%) |
| $300 to $499 | 63 (2.1%) | 0 (0.0%) |
| $500 to $799 | 113 (3.8%) | 79 (10.2%) |
| $800 to $999 | 67 (2.3%) | 0 (0.0%) |
| $1,000 to $1,499 | 463 (15.6%) | 38 (4.9%) |
| $1,500 to $1,999 | 438 (14.8%) | 481 (61.9%) |
| $2,000 to $2,499 | 333 (11.2%) | 72 (9.3%) |
| $2,500 to $2,999 | 735 (24.8%) | 71 (9.1%) |
| $3,000 or more | 743 (25.0%) | 36 (4.6%) |
| Total | 2,968 (100.0%) | 777 (100.0%) |
Physical Housing Characteristics in North Lindenhurst
Housing Structures in North Lindenhurst
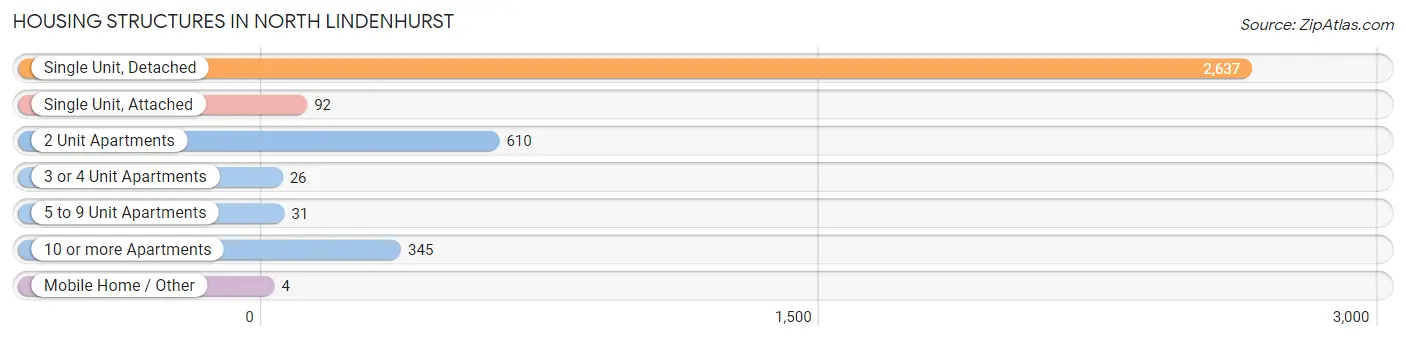
| Structure Type | # Housing Units | % Housing Units |
| Single Unit, Detached | 2,637 | 70.4% |
| Single Unit, Attached | 92 | 2.5% |
| 2 Unit Apartments | 610 | 16.3% |
| 3 or 4 Unit Apartments | 26 | 0.7% |
| 5 to 9 Unit Apartments | 31 | 0.8% |
| 10 or more Apartments | 345 | 9.2% |
| Mobile Home / Other | 4 | 0.1% |
| Total | 3,745 | 100.0% |
Housing Structures by Occupancy in North Lindenhurst
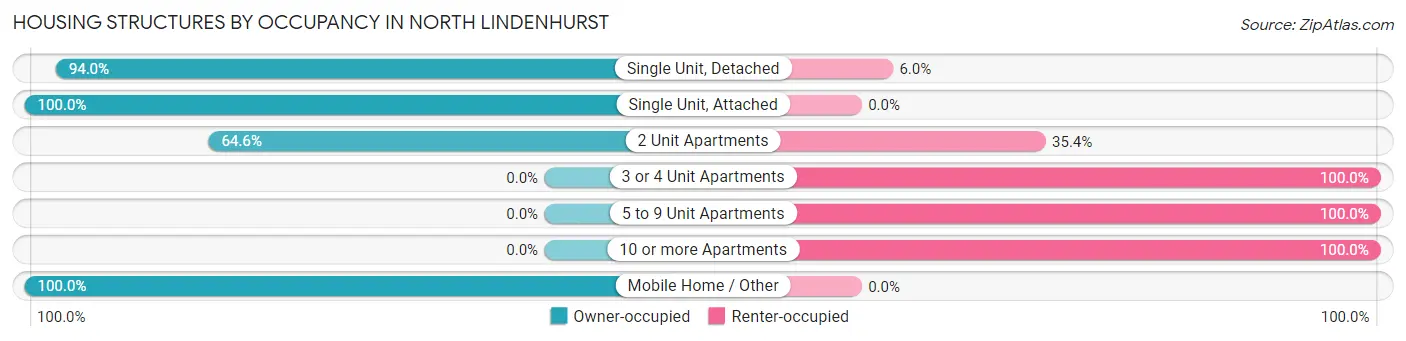
| Structure Type | Owner-occupied | Renter-occupied |
| Single Unit, Detached | 2,478 (94.0%) | 159 (6.0%) |
| Single Unit, Attached | 92 (100.0%) | 0 (0.0%) |
| 2 Unit Apartments | 394 (64.6%) | 216 (35.4%) |
| 3 or 4 Unit Apartments | 0 (0.0%) | 26 (100.0%) |
| 5 to 9 Unit Apartments | 0 (0.0%) | 31 (100.0%) |
| 10 or more Apartments | 0 (0.0%) | 345 (100.0%) |
| Mobile Home / Other | 4 (100.0%) | 0 (0.0%) |
| Total | 2,968 (79.2%) | 777 (20.7%) |
Housing Structures by Number of Rooms in North Lindenhurst
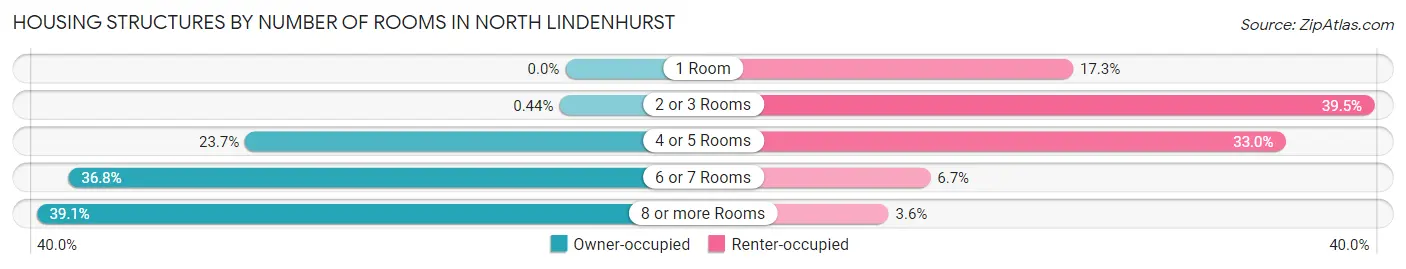
| Number of Rooms | Owner-occupied | Renter-occupied |
| 1 Room | 0 (0.0%) | 134 (17.2%) |
| 2 or 3 Rooms | 13 (0.4%) | 307 (39.5%) |
| 4 or 5 Rooms | 703 (23.7%) | 256 (33.0%) |
| 6 or 7 Rooms | 1,091 (36.8%) | 52 (6.7%) |
| 8 or more Rooms | 1,161 (39.1%) | 28 (3.6%) |
| Total | 2,968 (100.0%) | 777 (100.0%) |
Housing Structure by Heating Type in North Lindenhurst
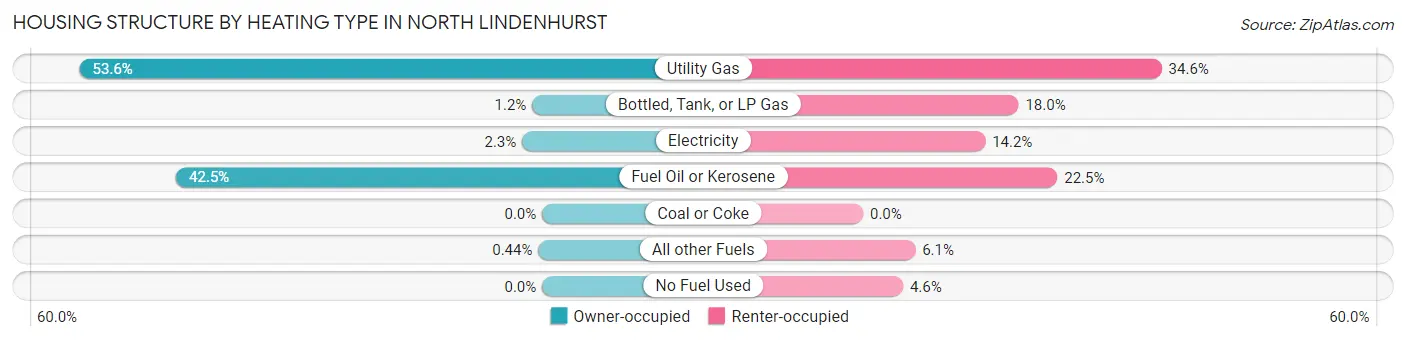
| Heating Type | Owner-occupied | Renter-occupied |
| Utility Gas | 1,592 (53.6%) | 269 (34.6%) |
| Bottled, Tank, or LP Gas | 34 (1.1%) | 140 (18.0%) |
| Electricity | 69 (2.3%) | 110 (14.2%) |
| Fuel Oil or Kerosene | 1,260 (42.4%) | 175 (22.5%) |
| Coal or Coke | 0 (0.0%) | 0 (0.0%) |
| All other Fuels | 13 (0.4%) | 47 (6.0%) |
| No Fuel Used | 0 (0.0%) | 36 (4.6%) |
| Total | 2,968 (100.0%) | 777 (100.0%) |
Household Vehicle Usage in North Lindenhurst
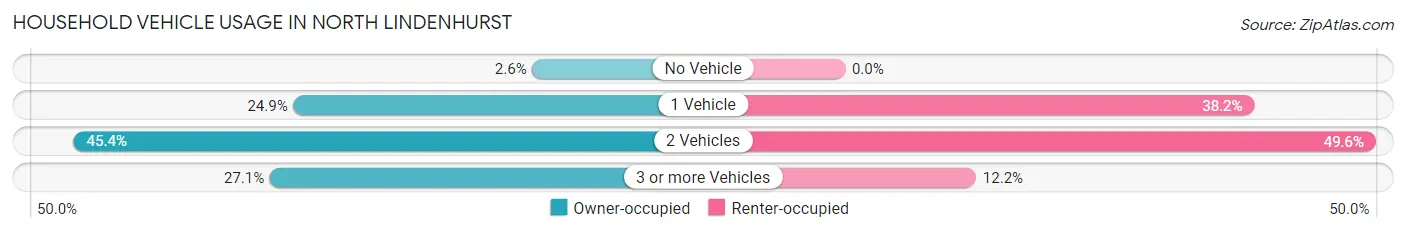
| Vehicles per Household | Owner-occupied | Renter-occupied |
| No Vehicle | 77 (2.6%) | 0 (0.0%) |
| 1 Vehicle | 739 (24.9%) | 297 (38.2%) |
| 2 Vehicles | 1,348 (45.4%) | 385 (49.5%) |
| 3 or more Vehicles | 804 (27.1%) | 95 (12.2%) |
| Total | 2,968 (100.0%) | 777 (100.0%) |
Real Estate & Mortgages in North Lindenhurst
Real Estate and Mortgage Overview in North Lindenhurst
| Characteristic | Without Mortgage | With Mortgage |
| Housing Units | 1,001 | 1,967 |
| Median Property Value | $431,600 | $435,200 |
| Median Household Income | $97,054 | $952 |
| Monthly Housing Costs | $1,394 | $743 |
| Real Estate Taxes | $10,001 | $48 |
Property Value by Mortgage Status in North Lindenhurst
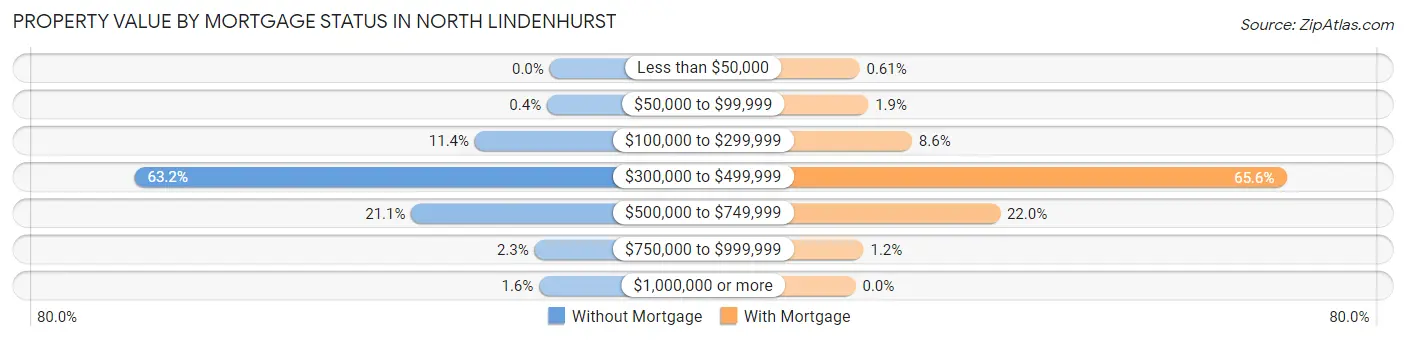
| Property Value | Without Mortgage | With Mortgage |
| Less than $50,000 | 0 (0.0%) | 12 (0.6%) |
| $50,000 to $99,999 | 4 (0.4%) | 38 (1.9%) |
| $100,000 to $299,999 | 114 (11.4%) | 169 (8.6%) |
| $300,000 to $499,999 | 633 (63.2%) | 1,291 (65.6%) |
| $500,000 to $749,999 | 211 (21.1%) | 433 (22.0%) |
| $750,000 to $999,999 | 23 (2.3%) | 24 (1.2%) |
| $1,000,000 or more | 16 (1.6%) | 0 (0.0%) |
| Total | 1,001 (100.0%) | 1,967 (100.0%) |
Household Income by Mortgage Status in North Lindenhurst
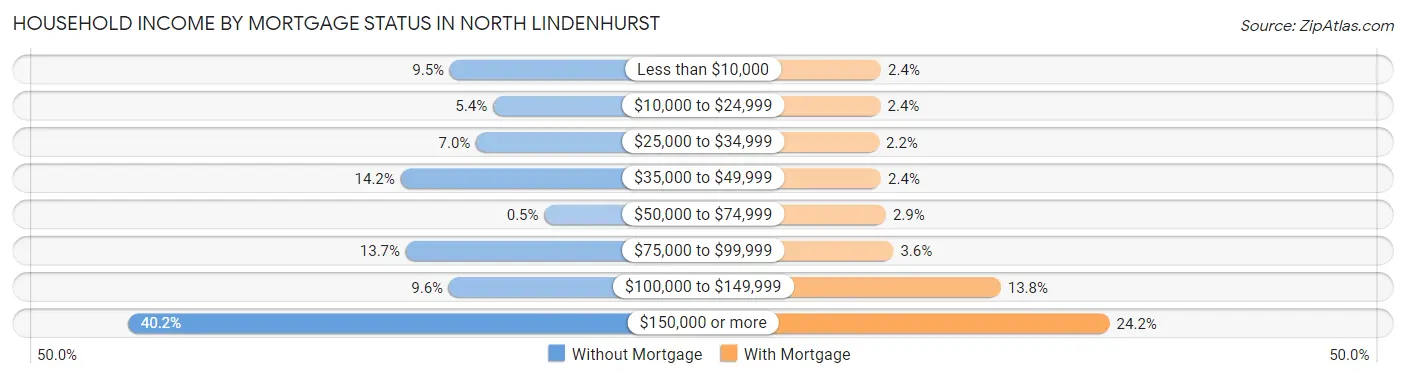
| Household Income | Without Mortgage | With Mortgage |
| Less than $10,000 | 95 (9.5%) | 48 (2.4%) |
| $10,000 to $24,999 | 54 (5.4%) | 47 (2.4%) |
| $25,000 to $34,999 | 70 (7.0%) | 44 (2.2%) |
| $35,000 to $49,999 | 142 (14.2%) | 48 (2.4%) |
| $50,000 to $74,999 | 5 (0.5%) | 57 (2.9%) |
| $75,000 to $99,999 | 137 (13.7%) | 71 (3.6%) |
| $100,000 to $149,999 | 96 (9.6%) | 272 (13.8%) |
| $150,000 or more | 402 (40.2%) | 476 (24.2%) |
| Total | 1,001 (100.0%) | 1,967 (100.0%) |
Property Value to Household Income Ratio in North Lindenhurst
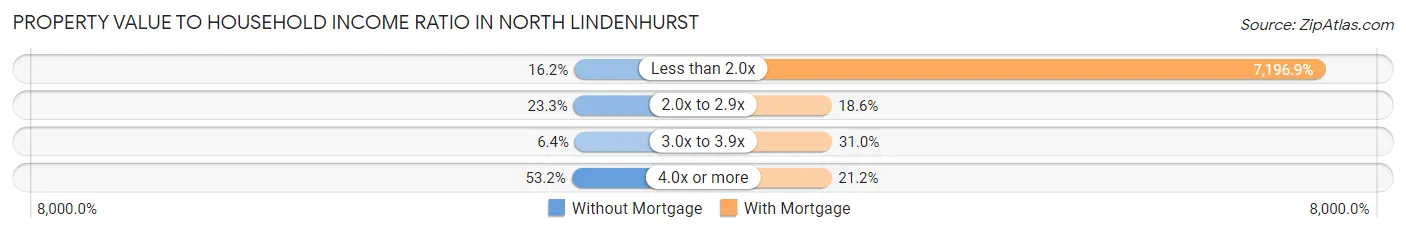
| Value-to-Income Ratio | Without Mortgage | With Mortgage |
| Less than 2.0x | 162 (16.2%) | 141,563 (7,196.9%) |
| 2.0x to 2.9x | 233 (23.3%) | 365 (18.6%) |
| 3.0x to 3.9x | 64 (6.4%) | 609 (31.0%) |
| 4.0x or more | 532 (53.1%) | 417 (21.2%) |
| Total | 1,001 (100.0%) | 1,967 (100.0%) |
Real Estate Taxes by Mortgage Status in North Lindenhurst
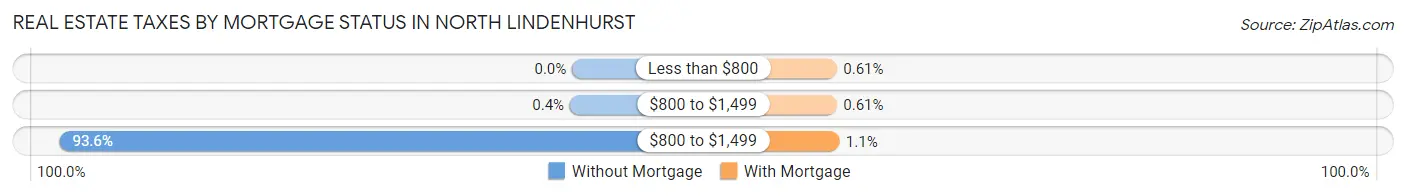
| Property Taxes | Without Mortgage | With Mortgage |
| Less than $800 | 0 (0.0%) | 12 (0.6%) |
| $800 to $1,499 | 4 (0.4%) | 12 (0.6%) |
| $800 to $1,499 | 937 (93.6%) | 21 (1.1%) |
| Total | 1,001 (100.0%) | 1,967 (100.0%) |
Health & Disability in North Lindenhurst
Health Insurance Coverage by Age in North Lindenhurst
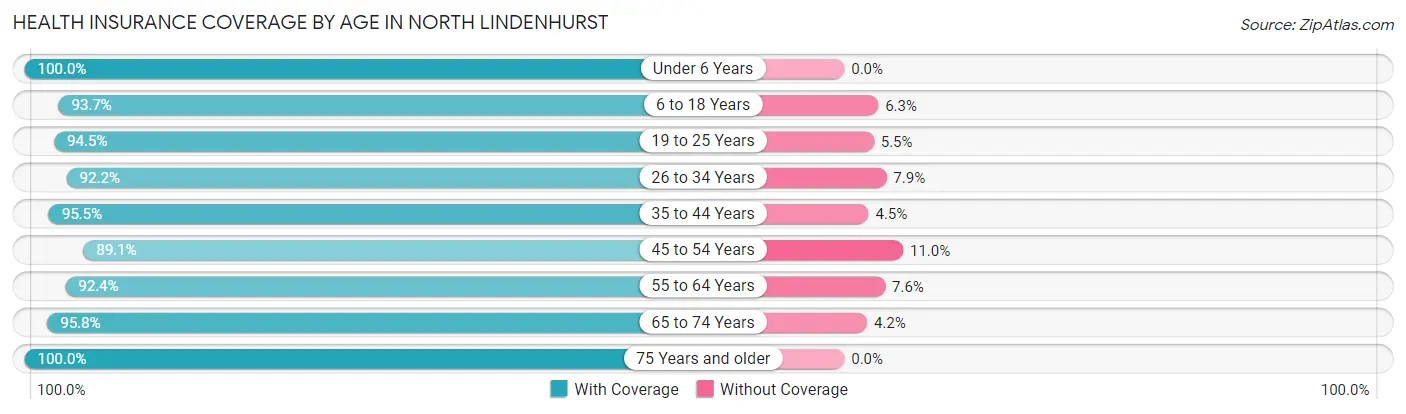
| Age Bracket | With Coverage | Without Coverage |
| Under 6 Years | 563 (100.0%) | 0 (0.0%) |
| 6 to 18 Years | 1,439 (93.7%) | 97 (6.3%) |
| 19 to 25 Years | 773 (94.5%) | 45 (5.5%) |
| 26 to 34 Years | 1,139 (92.1%) | 97 (7.9%) |
| 35 to 44 Years | 1,457 (95.5%) | 69 (4.5%) |
| 45 to 54 Years | 1,432 (89.0%) | 176 (11.0%) |
| 55 to 64 Years | 1,905 (92.4%) | 157 (7.6%) |
| 65 to 74 Years | 745 (95.8%) | 33 (4.2%) |
| 75 Years and older | 1,028 (100.0%) | 0 (0.0%) |
| Total | 10,481 (94.0%) | 674 (6.0%) |
Health Insurance Coverage by Citizenship Status in North Lindenhurst
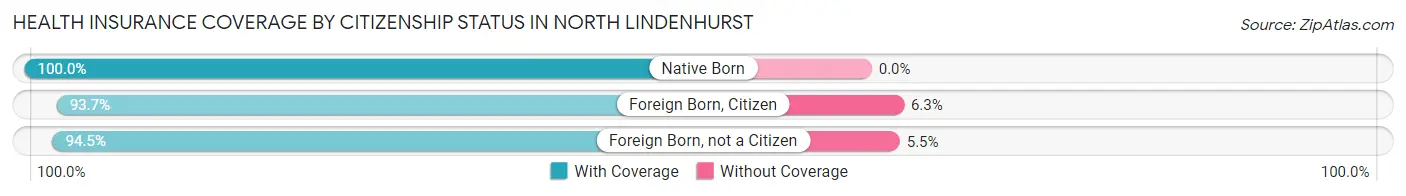
| Citizenship Status | With Coverage | Without Coverage |
| Native Born | 563 (100.0%) | 0 (0.0%) |
| Foreign Born, Citizen | 1,439 (93.7%) | 97 (6.3%) |
| Foreign Born, not a Citizen | 773 (94.5%) | 45 (5.5%) |
Health Insurance Coverage by Household Income in North Lindenhurst
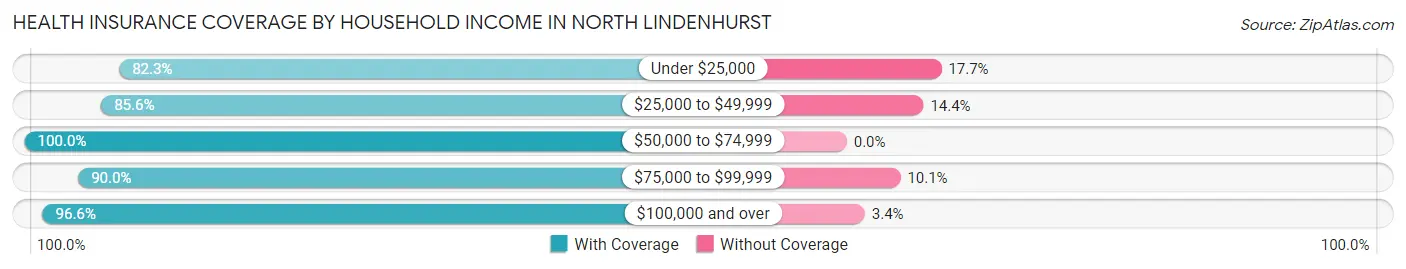
| Household Income | With Coverage | Without Coverage |
| Under $25,000 | 733 (82.3%) | 158 (17.7%) |
| $25,000 to $49,999 | 626 (85.6%) | 105 (14.4%) |
| $50,000 to $74,999 | 236 (100.0%) | 0 (0.0%) |
| $75,000 to $99,999 | 1,315 (89.9%) | 147 (10.1%) |
| $100,000 and over | 7,551 (96.6%) | 264 (3.4%) |
Public vs Private Health Insurance Coverage by Age in North Lindenhurst
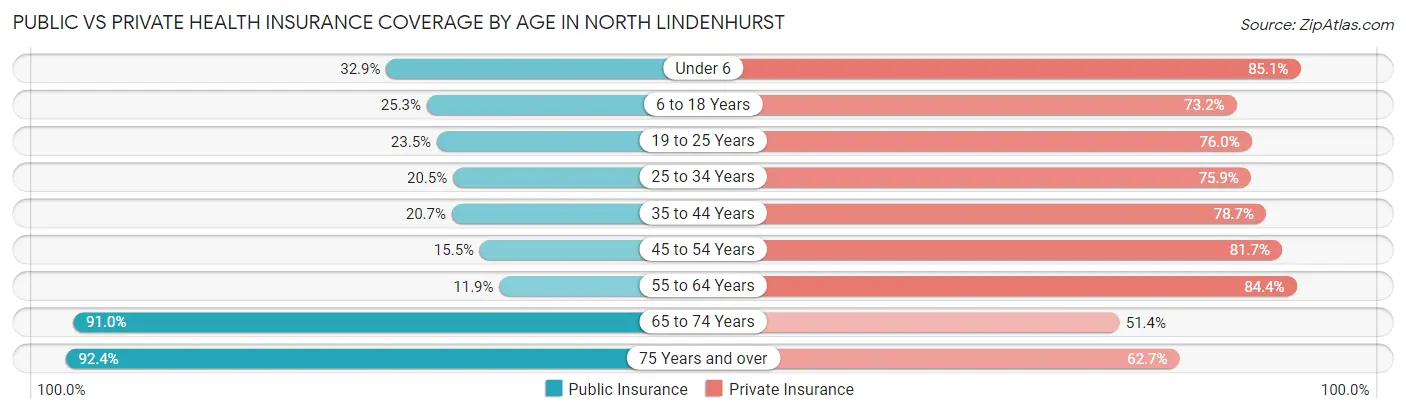
| Age Bracket | Public Insurance | Private Insurance |
| Under 6 | 185 (32.9%) | 479 (85.1%) |
| 6 to 18 Years | 389 (25.3%) | 1,125 (73.2%) |
| 19 to 25 Years | 192 (23.5%) | 622 (76.0%) |
| 25 to 34 Years | 253 (20.5%) | 938 (75.9%) |
| 35 to 44 Years | 316 (20.7%) | 1,201 (78.7%) |
| 45 to 54 Years | 249 (15.5%) | 1,313 (81.7%) |
| 55 to 64 Years | 245 (11.9%) | 1,740 (84.4%) |
| 65 to 74 Years | 708 (91.0%) | 400 (51.4%) |
| 75 Years and over | 950 (92.4%) | 644 (62.6%) |
| Total | 3,487 (31.3%) | 8,462 (75.9%) |
Disability Status by Sex by Age in North Lindenhurst
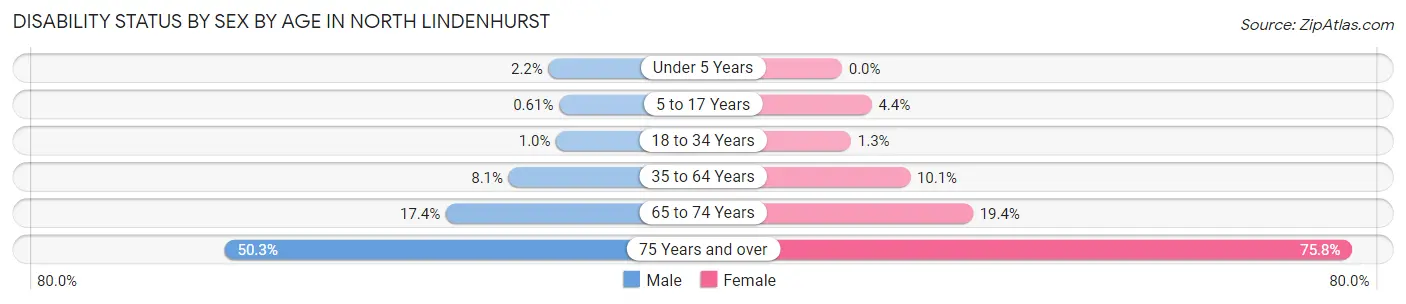
| Age Bracket | Male | Female |
| Under 5 Years | 7 (2.2%) | 0 (0.0%) |
| 5 to 17 Years | 4 (0.6%) | 34 (4.4%) |
| 18 to 34 Years | 12 (1.0%) | 14 (1.3%) |
| 35 to 64 Years | 230 (8.1%) | 238 (10.1%) |
| 65 to 74 Years | 54 (17.4%) | 91 (19.4%) |
| 75 Years and over | 170 (50.3%) | 523 (75.8%) |
Disability Class by Sex by Age in North Lindenhurst
Disability Class: Hearing Difficulty
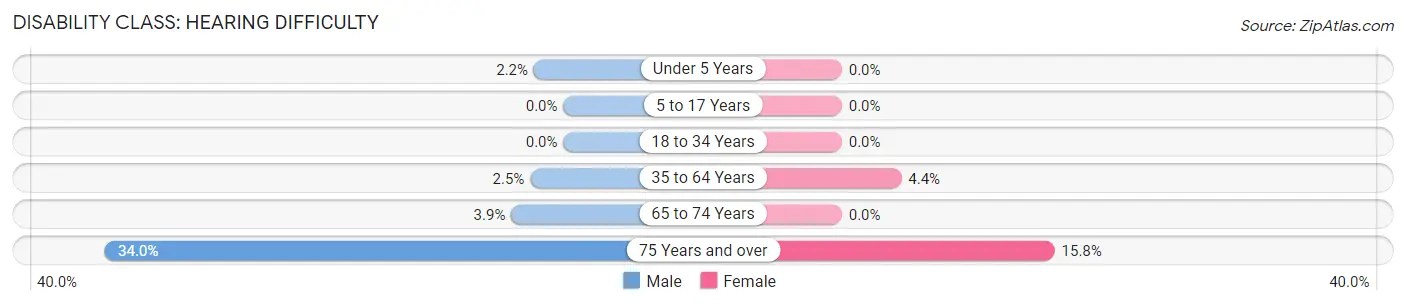
| Age Bracket | Male | Female |
| Under 5 Years | 7 (2.2%) | 0 (0.0%) |
| 5 to 17 Years | 0 (0.0%) | 0 (0.0%) |
| 18 to 34 Years | 0 (0.0%) | 0 (0.0%) |
| 35 to 64 Years | 70 (2.5%) | 104 (4.4%) |
| 65 to 74 Years | 12 (3.9%) | 0 (0.0%) |
| 75 Years and over | 115 (34.0%) | 109 (15.8%) |
Disability Class: Vision Difficulty
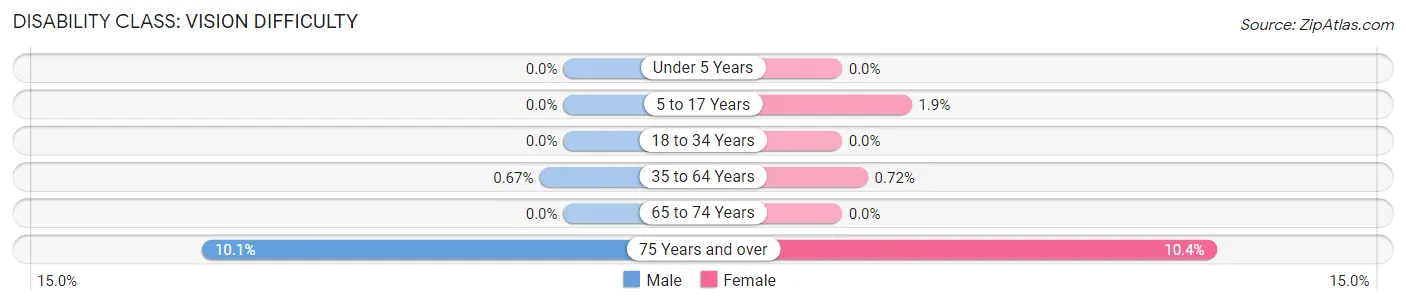
| Age Bracket | Male | Female |
| Under 5 Years | 0 (0.0%) | 0 (0.0%) |
| 5 to 17 Years | 0 (0.0%) | 15 (1.9%) |
| 18 to 34 Years | 0 (0.0%) | 0 (0.0%) |
| 35 to 64 Years | 19 (0.7%) | 17 (0.7%) |
| 65 to 74 Years | 0 (0.0%) | 0 (0.0%) |
| 75 Years and over | 34 (10.1%) | 72 (10.4%) |
Disability Class: Cognitive Difficulty
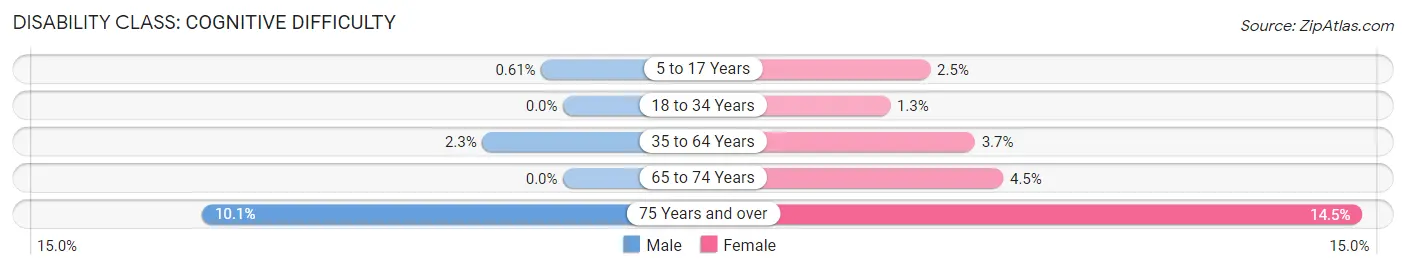
| Age Bracket | Male | Female |
| 5 to 17 Years | 4 (0.6%) | 19 (2.5%) |
| 18 to 34 Years | 0 (0.0%) | 14 (1.3%) |
| 35 to 64 Years | 64 (2.2%) | 87 (3.7%) |
| 65 to 74 Years | 0 (0.0%) | 21 (4.5%) |
| 75 Years and over | 34 (10.1%) | 100 (14.5%) |
Disability Class: Ambulatory Difficulty
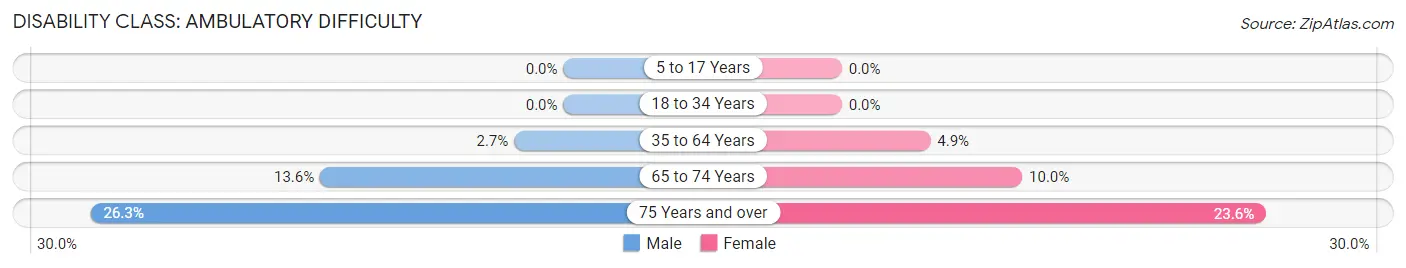
| Age Bracket | Male | Female |
| 5 to 17 Years | 0 (0.0%) | 0 (0.0%) |
| 18 to 34 Years | 0 (0.0%) | 0 (0.0%) |
| 35 to 64 Years | 78 (2.7%) | 116 (4.9%) |
| 65 to 74 Years | 42 (13.6%) | 47 (10.0%) |
| 75 Years and over | 89 (26.3%) | 163 (23.6%) |
Disability Class: Self-Care Difficulty
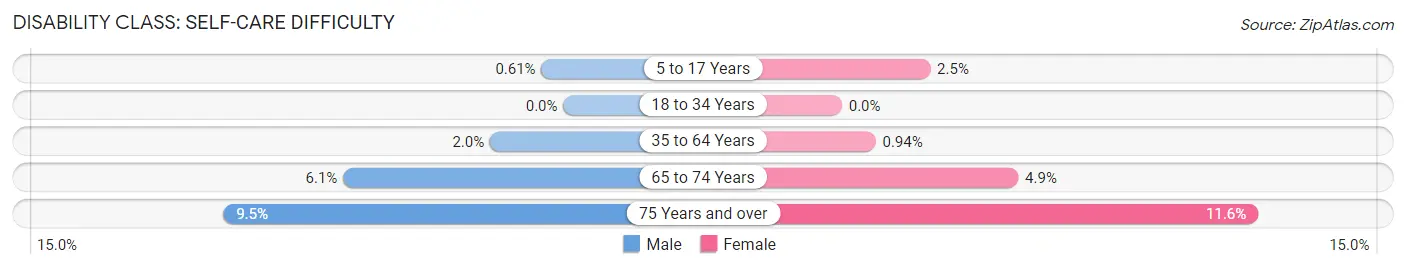
| Age Bracket | Male | Female |
| 5 to 17 Years | 4 (0.6%) | 19 (2.5%) |
| 18 to 34 Years | 0 (0.0%) | 0 (0.0%) |
| 35 to 64 Years | 58 (2.0%) | 22 (0.9%) |
| 65 to 74 Years | 19 (6.1%) | 23 (4.9%) |
| 75 Years and over | 32 (9.5%) | 80 (11.6%) |
Technology Access in North Lindenhurst
Computing Device Access in North Lindenhurst
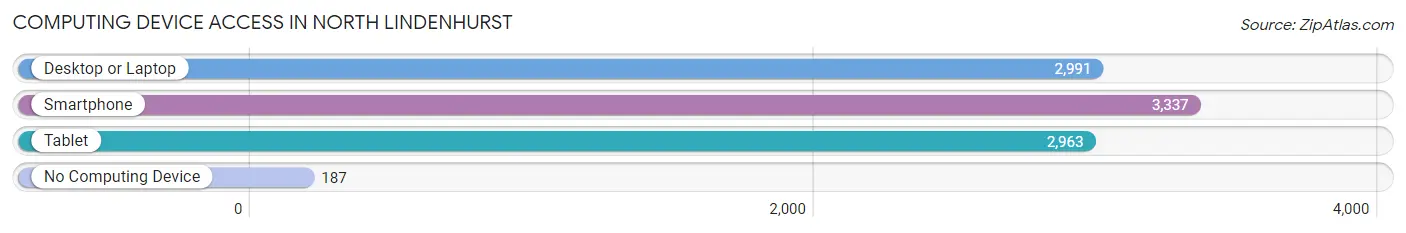
| Device Type | # Households | % Households |
| Desktop or Laptop | 2,991 | 79.9% |
| Smartphone | 3,337 | 89.1% |
| Tablet | 2,963 | 79.1% |
| No Computing Device | 187 | 5.0% |
| Total | 3,745 | 100.0% |
Internet Access in North Lindenhurst
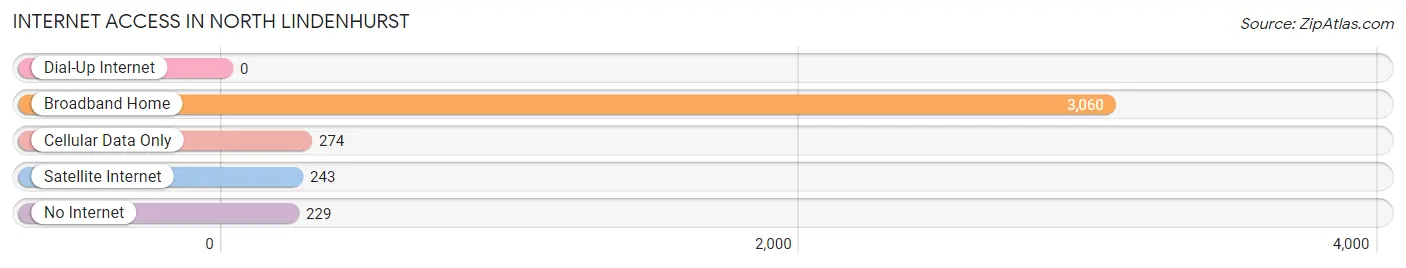
| Internet Type | # Households | % Households |
| Dial-Up Internet | 0 | 0.0% |
| Broadband Home | 3,060 | 81.7% |
| Cellular Data Only | 274 | 7.3% |
| Satellite Internet | 243 | 6.5% |
| No Internet | 229 | 6.1% |
| Total | 3,745 | 100.0% |
North Lindenhurst Summary
Lindenhurst is a hamlet located in the Town of Babylon in Suffolk County, New York, United States. It is located on the South Shore of Long Island, approximately 50 miles east of Manhattan. The hamlet is part of the Town of Babylon, which is one of ten towns in Suffolk County.
History
The area now known as North Lindenhurst was originally inhabited by the Secatogue Indians, a branch of the Algonquin tribe. The Secatogue Indians were a peaceful tribe that lived off the land, fishing, hunting, and gathering. The Secatogue Indians were eventually displaced by European settlers in the late 1600s.
The first European settlers in the area were Dutch and English farmers who arrived in the late 1600s. The area was originally known as “Little Neck” and was part of the Town of Huntington. In 1873, the area was renamed “Lindenhurst” after the many linden trees that grew in the area.
In the late 1800s, the area began to develop as a summer resort destination. The area was known for its many beaches, fishing, and boating. In the early 1900s, the area began to develop as a residential community. The first post office was established in Lindenhurst in 1906.
In the 1950s, the area began to experience rapid growth as more people moved to the area. The population of Lindenhurst increased from 1,000 in 1950 to over 10,000 in 1960.
Geography
North Lindenhurst is located on the South Shore of Long Island, approximately 50 miles east of Manhattan. The hamlet is part of the Town of Babylon, which is one of ten towns in Suffolk County.
The hamlet is bordered by the hamlets of Copiague to the west, Amityville to the north, and East Farmingdale to the east. The hamlet is located on the Great South Bay, which is part of the Atlantic Ocean.
The area is mostly flat, with some low hills in the northern part of the hamlet. The highest point in the hamlet is approximately 50 feet above sea level.
Economy
The economy of North Lindenhurst is largely based on retail and services. The hamlet is home to several shopping centers, including the Lindenhurst Shopping Center, the Lindenhurst Plaza, and the Lindenhurst Mall.
The hamlet is also home to several industrial parks, including the Lindenhurst Industrial Park and the North Lindenhurst Industrial Park. These industrial parks are home to a variety of businesses, including manufacturing, warehousing, and distribution.
Demographics
As of the 2010 census, the population of North Lindenhurst was 11,945. The population is largely white (83.3%), with smaller percentages of African Americans (7.2%), Hispanics (5.2%), and Asians (3.3%).
The median household income in North Lindenhurst is $77,945, which is higher than the national median of $53,482. The median home value in the hamlet is $372,400, which is higher than the national median of $184,700.
Conclusion
North Lindenhurst is a hamlet located in the Town of Babylon in Suffolk County, New York. The hamlet has a rich history, dating back to the 1600s when it was inhabited by the Secatogue Indians. The area has since developed into a residential community and a popular summer resort destination. The economy of North Lindenhurst is largely based on retail and services, with several shopping centers and industrial parks located in the hamlet. The population of North Lindenhurst is largely white, with smaller percentages of African Americans, Hispanics, and Asians. The median household income in the hamlet is higher than the national median, and the median home value is also higher than the national median.
Common Questions
What is Per Capita Income in North Lindenhurst?
Per Capita income in North Lindenhurst is $45,254.
What is the Median Family Income in North Lindenhurst?
Median Family Income in North Lindenhurst is $138,138.
What is the Median Household income in North Lindenhurst?
Median Household Income in North Lindenhurst is $118,177.
What is Income or Wage Gap in North Lindenhurst?
Income or Wage Gap in North Lindenhurst is 32.7%.
Women in North Lindenhurst earn 67.3 cents for every dollar earned by a man.
What is Inequality or Gini Index in North Lindenhurst?
Inequality or Gini Index in North Lindenhurst is 0.40.
What is the Total Population of North Lindenhurst?
Total Population of North Lindenhurst is 11,155.
What is the Total Male Population of North Lindenhurst?
Total Male Population of North Lindenhurst is 5,628.
What is the Total Female Population of North Lindenhurst?
Total Female Population of North Lindenhurst is 5,527.
What is the Ratio of Males per 100 Females in North Lindenhurst?
There are 101.83 Males per 100 Females in North Lindenhurst.
What is the Ratio of Females per 100 Males in North Lindenhurst?
There are 98.21 Females per 100 Males in North Lindenhurst.
What is the Median Population Age in North Lindenhurst?
Median Population Age in North Lindenhurst is 42.6 Years.
What is the Average Family Size in North Lindenhurst
Average Family Size in North Lindenhurst is 3.4 People.
What is the Average Household Size in North Lindenhurst
Average Household Size in North Lindenhurst is 3.0 People.
How Large is the Labor Force in North Lindenhurst?
There are 6,636 People in the Labor Forcein in North Lindenhurst.
What is the Percentage of People in the Labor Force in North Lindenhurst?
70.4% of People are in the Labor Force in North Lindenhurst.
What is the Unemployment Rate in North Lindenhurst?
Unemployment Rate in North Lindenhurst is 3.5%.