Flanders, NY Map & Demographics
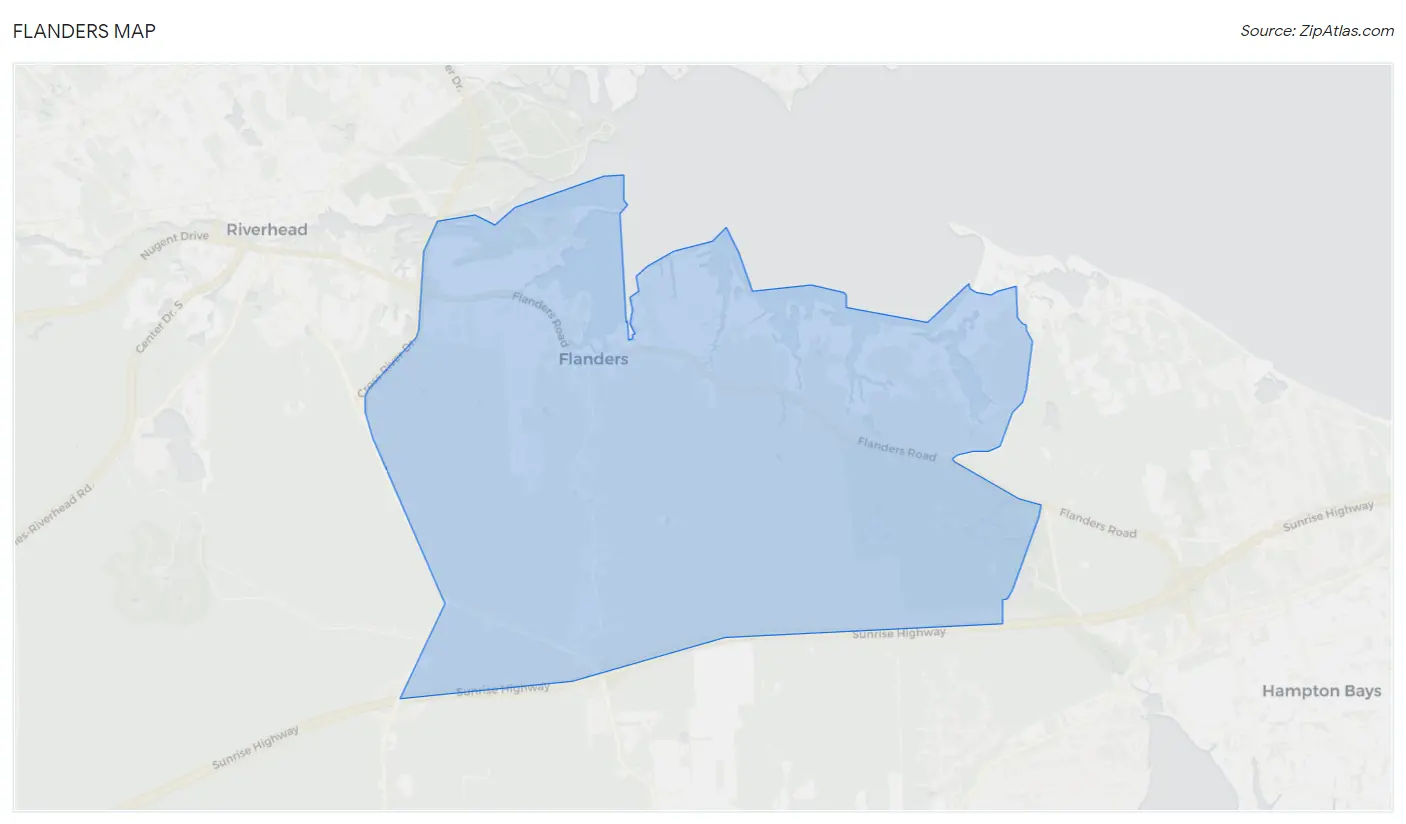
Flanders Map
Flanders Overview
$29,613
PER CAPITA INCOME
$98,545
AVG FAMILY INCOME
$79,100
AVG HOUSEHOLD INCOME
45.2%
WAGE / INCOME GAP [ % ]
54.8¢/ $1
WAGE / INCOME GAP [ $ ]
0.38
INEQUALITY / GINI INDEX
6,411
TOTAL POPULATION
3,524
MALE POPULATION
2,887
FEMALE POPULATION
122.06
MALES / 100 FEMALES
81.92
FEMALES / 100 MALES
32.3
MEDIAN AGE
3.8
AVG FAMILY SIZE
3.1
AVG HOUSEHOLD SIZE
3,161
LABOR FORCE [ PEOPLE ]
66.4%
PERCENT IN LABOR FORCE
2.6%
UNEMPLOYMENT RATE
Flanders Area Codes
Income in Flanders
Income Overview in Flanders
Per Capita Income in Flanders is $29,613, while median incomes of families and households are $98,545 and $79,100 respectively.
| Characteristic | Number | Measure |
| Per Capita Income | 6,411 | $29,613 |
| Median Family Income | 1,366 | $98,545 |
| Mean Family Income | 1,366 | $101,517 |
| Median Household Income | 2,056 | $79,100 |
| Mean Household Income | 2,056 | $90,966 |
| Income Deficit | 1,366 | $0 |
| Wage / Income Gap (%) | 6,411 | 45.16% |
| Wage / Income Gap ($) | 6,411 | 54.84¢ per $1 |
| Gini / Inequality Index | 6,411 | 0.38 |
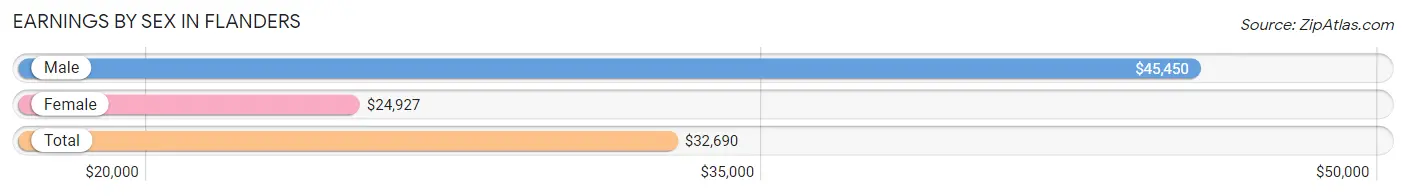
Earnings by Sex in Flanders
Average Earnings in Flanders are $32,690, $45,450 for men and $24,927 for women, a difference of 45.2%.
| Sex | Number | Average Earnings |
| Male | 1,848 (54.8%) | $45,450 |
| Female | 1,521 (45.2%) | $24,927 |
| Total | 3,369 (100.0%) | $32,690 |
Earnings by Sex by Income Bracket in Flanders
The most common earnings brackets in Flanders are $45,000 to $49,999 for men (209 | 11.3%) and $30,000 to $34,999 for women (227 | 14.9%).
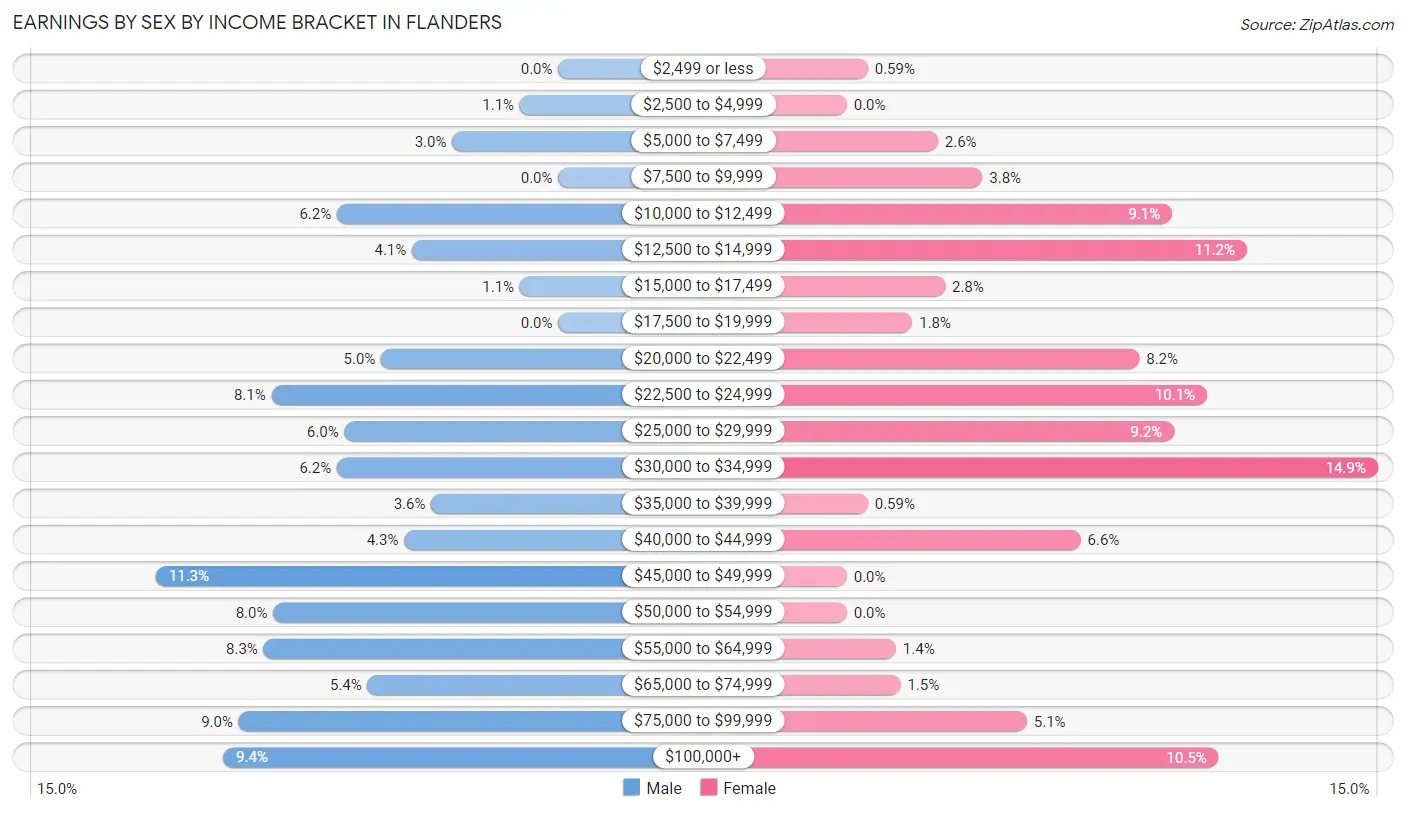
| Income | Male | Female |
| $2,499 or less | 0 (0.0%) | 9 (0.6%) |
| $2,500 to $4,999 | 20 (1.1%) | 0 (0.0%) |
| $5,000 to $7,499 | 55 (3.0%) | 39 (2.6%) |
| $7,500 to $9,999 | 0 (0.0%) | 58 (3.8%) |
| $10,000 to $12,499 | 115 (6.2%) | 139 (9.1%) |
| $12,500 to $14,999 | 76 (4.1%) | 171 (11.2%) |
| $15,000 to $17,499 | 20 (1.1%) | 42 (2.8%) |
| $17,500 to $19,999 | 0 (0.0%) | 28 (1.8%) |
| $20,000 to $22,499 | 92 (5.0%) | 125 (8.2%) |
| $22,500 to $24,999 | 149 (8.1%) | 154 (10.1%) |
| $25,000 to $29,999 | 111 (6.0%) | 140 (9.2%) |
| $30,000 to $34,999 | 115 (6.2%) | 227 (14.9%) |
| $35,000 to $39,999 | 66 (3.6%) | 9 (0.6%) |
| $40,000 to $44,999 | 80 (4.3%) | 100 (6.6%) |
| $45,000 to $49,999 | 209 (11.3%) | 0 (0.0%) |
| $50,000 to $54,999 | 148 (8.0%) | 0 (0.0%) |
| $55,000 to $64,999 | 153 (8.3%) | 21 (1.4%) |
| $65,000 to $74,999 | 99 (5.4%) | 23 (1.5%) |
| $75,000 to $99,999 | 166 (9.0%) | 77 (5.1%) |
| $100,000+ | 174 (9.4%) | 159 (10.4%) |
| Total | 1,848 (100.0%) | 1,521 (100.0%) |
Earnings by Sex by Educational Attainment in Flanders
Average earnings in Flanders are $48,107 for men and $26,447 for women, a difference of 45.0%. Men with an educational attainment of college or associate's degree enjoy the highest average annual earnings of $83,315, while those with less than high school education earn the least with $30,167. Women with an educational attainment of graduate degree earn the most with the average annual earnings of $133,142, while those with less than high school education have the smallest earnings of $24,399.
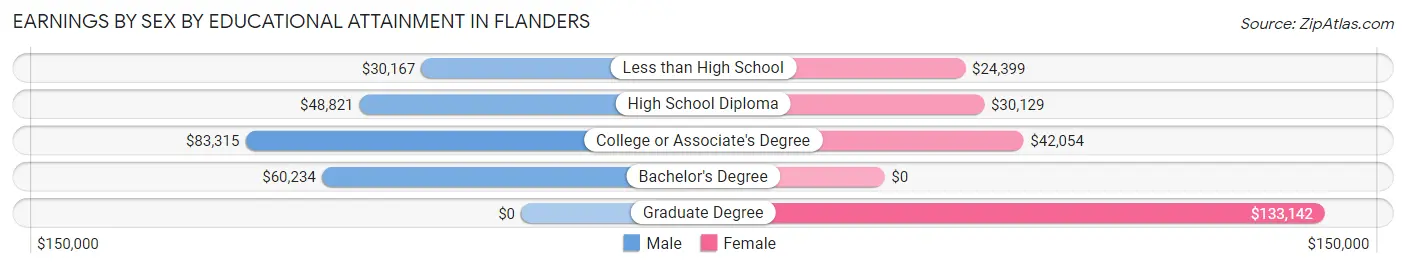
| Educational Attainment | Male Income | Female Income |
| Less than High School | $30,167 | $24,399 |
| High School Diploma | $48,821 | $30,129 |
| College or Associate's Degree | $83,315 | $42,054 |
| Bachelor's Degree | $60,234 | $0 |
| Graduate Degree | - | - |
| Total | $48,107 | $26,447 |
Family Income in Flanders
Family Income Brackets in Flanders
According to the Flanders family income data, there are 342 families falling into the $100,000 to $149,999 income range, which is the most common income bracket and makes up 25.0% of all families.
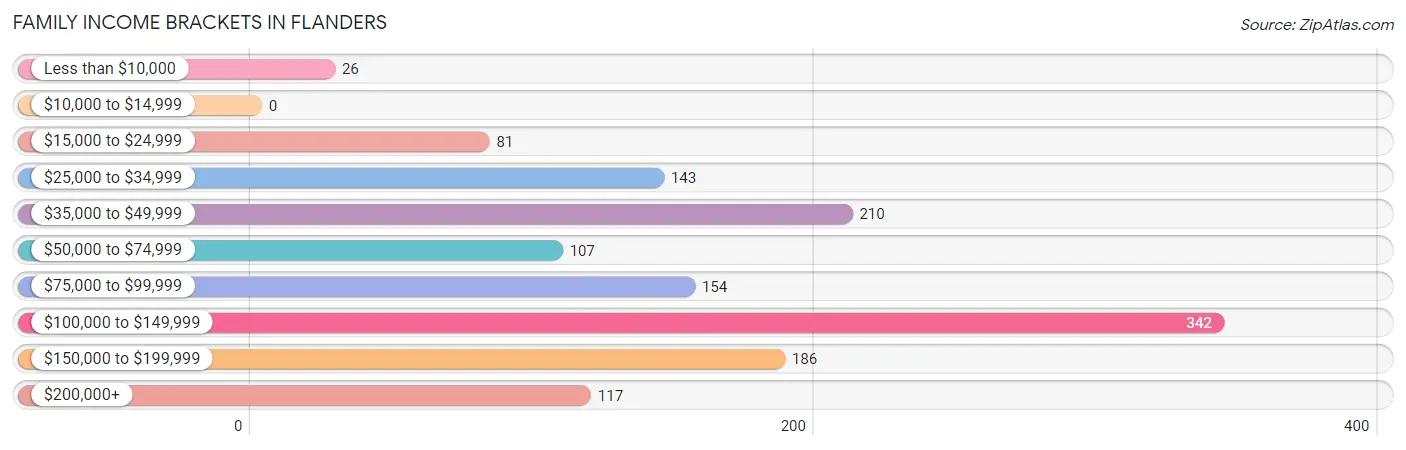
| Income Bracket | # Families | % Families |
| Less than $10,000 | 26 | 1.9% |
| $10,000 to $14,999 | 0 | 0.0% |
| $15,000 to $24,999 | 81 | 5.9% |
| $25,000 to $34,999 | 143 | 10.5% |
| $35,000 to $49,999 | 210 | 15.4% |
| $50,000 to $74,999 | 107 | 7.8% |
| $75,000 to $99,999 | 154 | 11.3% |
| $100,000 to $149,999 | 342 | 25.0% |
| $150,000 to $199,999 | 186 | 13.6% |
| $200,000+ | 117 | 8.6% |
Family Income by Famaliy Size in Flanders
4-person families (190 | 13.9%) account for the highest median family income in Flanders with $160,227 per family, while 4-person families (190 | 13.9%) have the highest median income of $40,057 per family member.
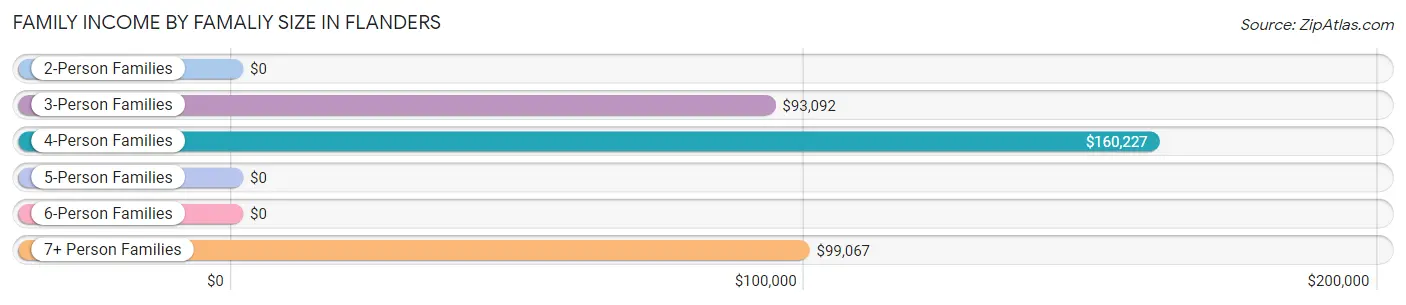
| Income Bracket | # Families | Median Income |
| 2-Person Families | 446 (32.7%) | $0 |
| 3-Person Families | 301 (22.0%) | $93,092 |
| 4-Person Families | 190 (13.9%) | $160,227 |
| 5-Person Families | 345 (25.3%) | $0 |
| 6-Person Families | 0 (0.0%) | $0 |
| 7+ Person Families | 84 (6.1%) | $99,067 |
| Total | 1,366 (100.0%) | $98,545 |
Family Income by Number of Earners in Flanders
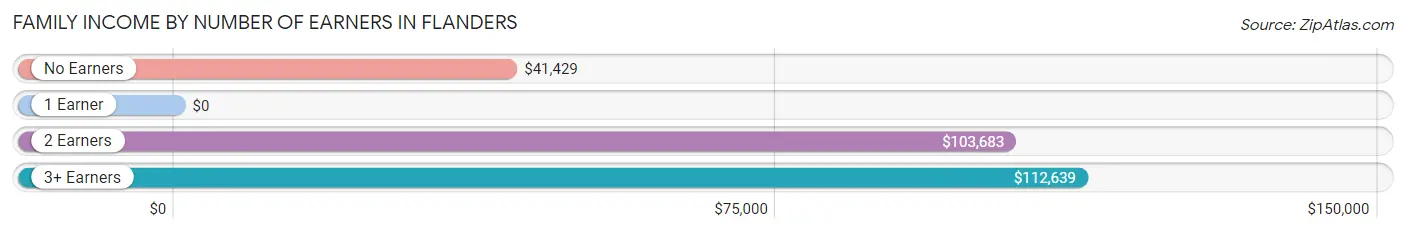
| Number of Earners | # Families | Median Income |
| No Earners | 170 (12.4%) | $41,429 |
| 1 Earner | 416 (30.4%) | $0 |
| 2 Earners | 397 (29.1%) | $103,683 |
| 3+ Earners | 383 (28.0%) | $112,639 |
| Total | 1,366 (100.0%) | $98,545 |
Household Income in Flanders
Household Income Brackets in Flanders
With 471 households falling in the category, the $100,000 to $149,999 income range is the most frequent in Flanders, accounting for 22.9% of all households. In contrast, only 16 households (0.8%) fall into the $25,000 to $34,999 income bracket, making it the least populous group.
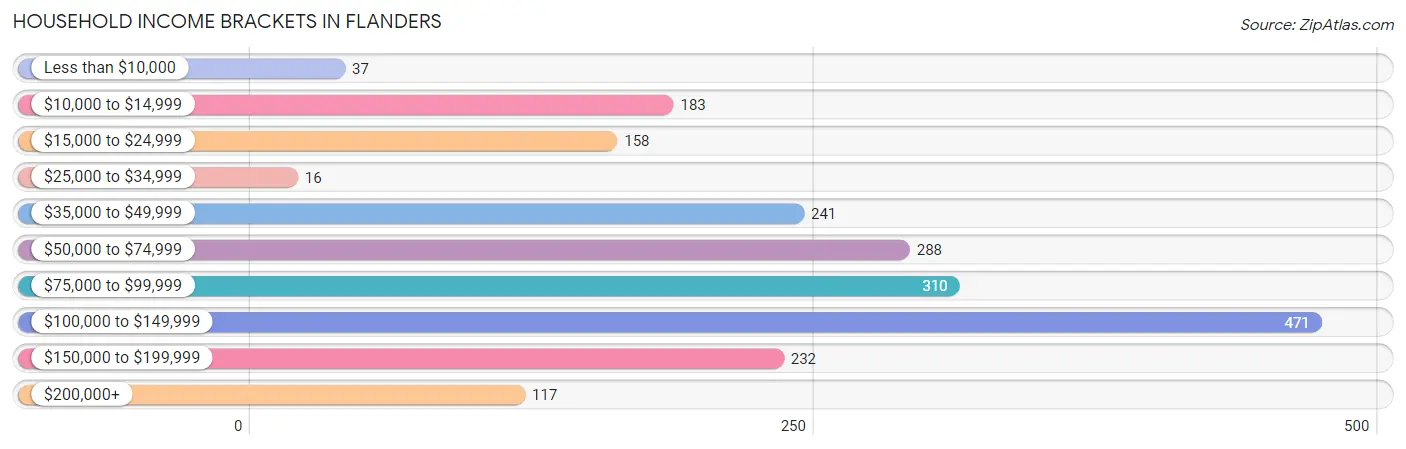
| Income Bracket | # Households | % Households |
| Less than $10,000 | 37 | 1.8% |
| $10,000 to $14,999 | 183 | 8.9% |
| $15,000 to $24,999 | 158 | 7.7% |
| $25,000 to $34,999 | 16 | 0.8% |
| $35,000 to $49,999 | 241 | 11.7% |
| $50,000 to $74,999 | 288 | 14.0% |
| $75,000 to $99,999 | 310 | 15.1% |
| $100,000 to $149,999 | 471 | 22.9% |
| $150,000 to $199,999 | 232 | 11.3% |
| $200,000+ | 117 | 5.7% |
Household Income by Householder Age in Flanders
The median household income in Flanders is $79,100, with the highest median household income of $114,444 found in the 45 to 64 years age bracket for the primary householder. A total of 690 households (33.6%) fall into this category. Meanwhile, the 15 to 24 years age bracket for the primary householder has the lowest median household income of $0, with 118 households (5.7%) in this group.
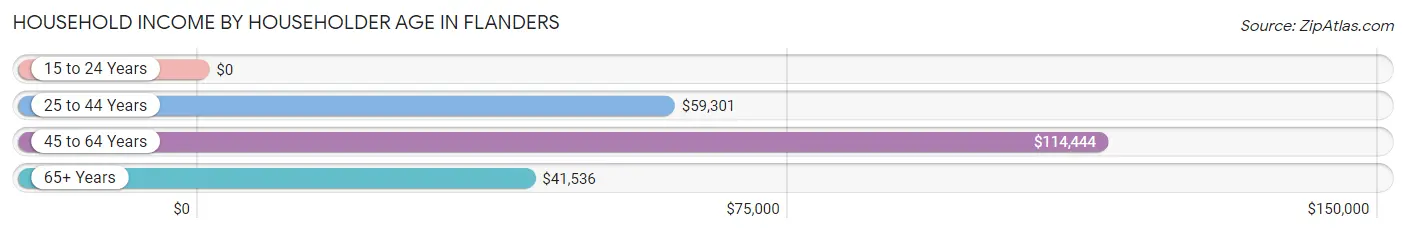
| Income Bracket | # Households | Median Income |
| 15 to 24 Years | 118 (5.7%) | $0 |
| 25 to 44 Years | 588 (28.6%) | $59,301 |
| 45 to 64 Years | 690 (33.6%) | $114,444 |
| 65+ Years | 660 (32.1%) | $41,536 |
| Total | 2,056 (100.0%) | $79,100 |
Poverty in Flanders
Income Below Poverty by Sex and Age in Flanders
With 24.9% poverty level for males and 16.2% for females among the residents of Flanders, 12 to 14 year old males and 25 to 34 year old females are the most vulnerable to poverty, with 52 males (98.1%) and 204 females (44.1%) in their respective age groups living below the poverty level.
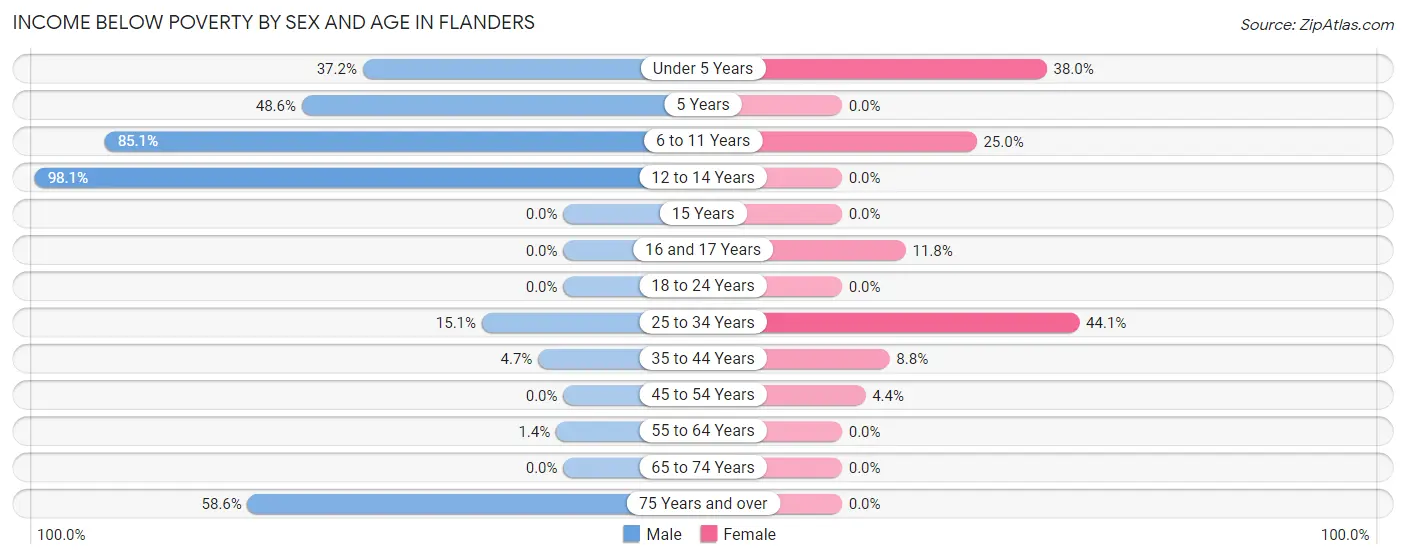
| Age Bracket | Male | Female |
| Under 5 Years | 108 (37.2%) | 209 (38.0%) |
| 5 Years | 117 (48.5%) | 0 (0.0%) |
| 6 to 11 Years | 326 (85.1%) | 7 (25.0%) |
| 12 to 14 Years | 52 (98.1%) | 0 (0.0%) |
| 15 Years | 0 (0.0%) | 0 (0.0%) |
| 16 and 17 Years | 0 (0.0%) | 11 (11.8%) |
| 18 to 24 Years | 0 (0.0%) | 0 (0.0%) |
| 25 to 34 Years | 90 (15.1%) | 204 (44.1%) |
| 35 to 44 Years | 21 (4.7%) | 26 (8.8%) |
| 45 to 54 Years | 0 (0.0%) | 10 (4.3%) |
| 55 to 64 Years | 5 (1.4%) | 0 (0.0%) |
| 65 to 74 Years | 0 (0.0%) | 0 (0.0%) |
| 75 Years and over | 160 (58.6%) | 0 (0.0%) |
| Total | 879 (24.9%) | 467 (16.2%) |
Income Above Poverty by Sex and Age in Flanders
According to the poverty statistics in Flanders, males aged 16 and 17 years and females aged 5 years are the age groups that are most secure financially, with 100.0% of males and 100.0% of females in these age groups living above the poverty line.
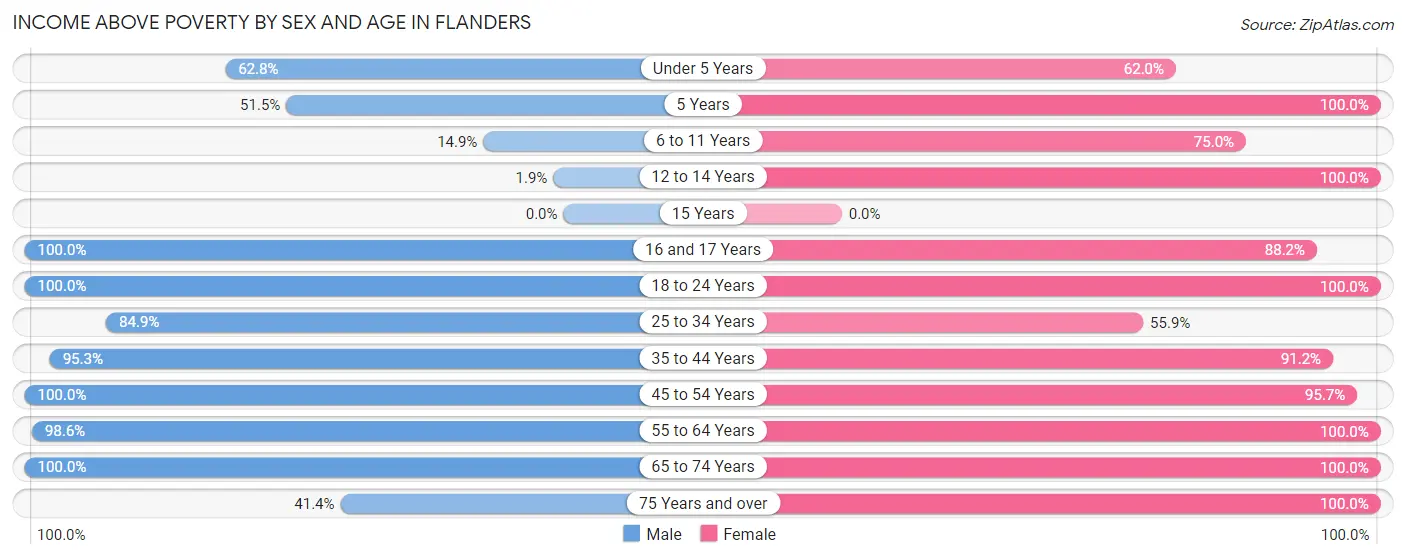
| Age Bracket | Male | Female |
| Under 5 Years | 182 (62.8%) | 341 (62.0%) |
| 5 Years | 124 (51.4%) | 21 (100.0%) |
| 6 to 11 Years | 57 (14.9%) | 21 (75.0%) |
| 12 to 14 Years | 1 (1.9%) | 75 (100.0%) |
| 15 Years | 0 (0.0%) | 0 (0.0%) |
| 16 and 17 Years | 22 (100.0%) | 82 (88.2%) |
| 18 to 24 Years | 253 (100.0%) | 396 (100.0%) |
| 25 to 34 Years | 505 (84.9%) | 259 (55.9%) |
| 35 to 44 Years | 429 (95.3%) | 268 (91.2%) |
| 45 to 54 Years | 253 (100.0%) | 220 (95.7%) |
| 55 to 64 Years | 363 (98.6%) | 314 (100.0%) |
| 65 to 74 Years | 343 (100.0%) | 335 (100.0%) |
| 75 Years and over | 113 (41.4%) | 78 (100.0%) |
| Total | 2,645 (75.1%) | 2,410 (83.8%) |
Income Below Poverty Among Married-Couple Families in Flanders
The poverty statistics for married-couple families in Flanders show that 7.6% or 72 of the total 946 families live below the poverty line. Families with 3 or 4 children have the highest poverty rate of 51.4%, comprising of 72 families. On the other hand, families with no children have the lowest poverty rate of 0.0%, which includes 0 families.
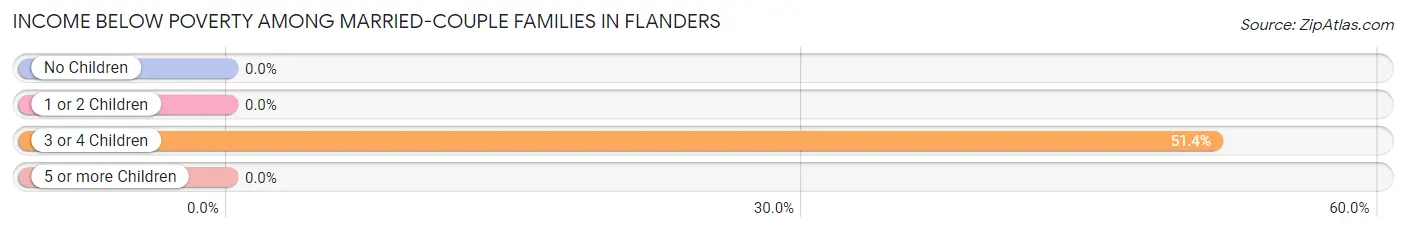
| Children | Above Poverty | Below Poverty |
| No Children | 596 (100.0%) | 0 (0.0%) |
| 1 or 2 Children | 210 (100.0%) | 0 (0.0%) |
| 3 or 4 Children | 68 (48.6%) | 72 (51.4%) |
| 5 or more Children | 0 (0.0%) | 0 (0.0%) |
| Total | 874 (92.4%) | 72 (7.6%) |
Income Below Poverty Among Single-Parent Households in Flanders
According to the poverty data in Flanders, 15.3% or 21 single-father households and 37.8% or 107 single-mother households are living below the poverty line. Among single-father households, those with 1 or 2 children have the highest poverty rate, with 21 households (18.8%) experiencing poverty. Likewise, among single-mother households, those with 3 or 4 children have the highest poverty rate, with 102 households (100.0%) falling below the poverty line.
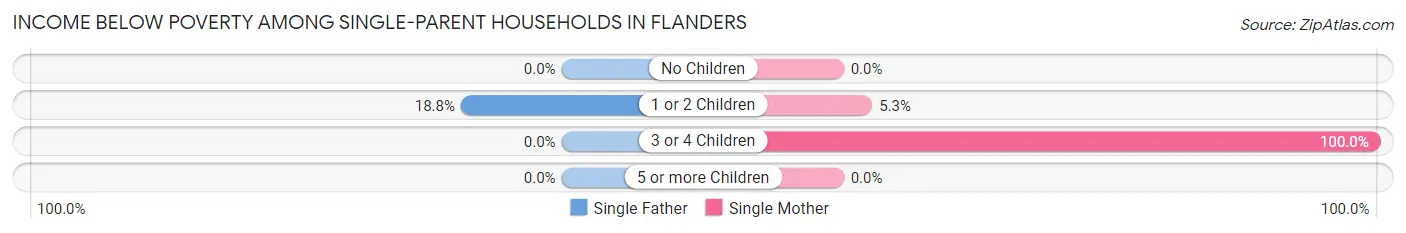
| Children | Single Father | Single Mother |
| No Children | 0 (0.0%) | 0 (0.0%) |
| 1 or 2 Children | 21 (18.8%) | 5 (5.3%) |
| 3 or 4 Children | 0 (0.0%) | 102 (100.0%) |
| 5 or more Children | 0 (0.0%) | 0 (0.0%) |
| Total | 21 (15.3%) | 107 (37.8%) |
Income Below Poverty Among Married-Couple vs Single-Parent Households in Flanders
The poverty data for Flanders shows that 72 of the married-couple family households (7.6%) and 128 of the single-parent households (30.5%) are living below the poverty level. Within the married-couple family households, those with 3 or 4 children have the highest poverty rate, with 72 households (51.4%) falling below the poverty line. Among the single-parent households, those with 3 or 4 children have the highest poverty rate, with 102 household (100.0%) living below poverty.
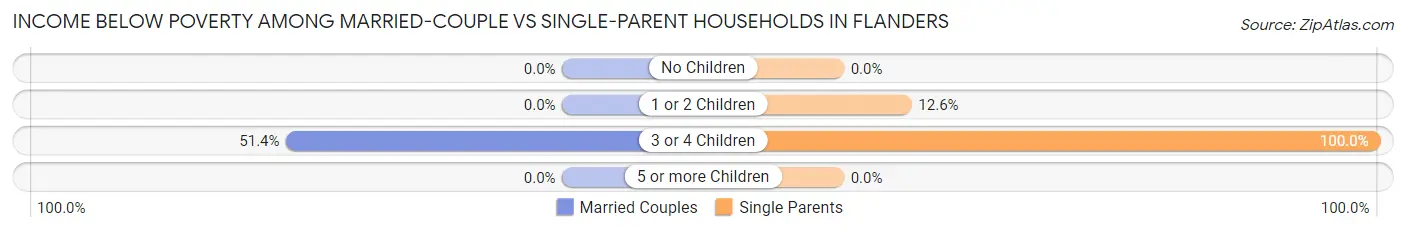
| Children | Married-Couple Families | Single-Parent Households |
| No Children | 0 (0.0%) | 0 (0.0%) |
| 1 or 2 Children | 0 (0.0%) | 26 (12.6%) |
| 3 or 4 Children | 72 (51.4%) | 102 (100.0%) |
| 5 or more Children | 0 (0.0%) | 0 (0.0%) |
| Total | 72 (7.6%) | 128 (30.5%) |
Race in Flanders
The most populous races in Flanders are Hispanic or Latino (3,510 | 54.7%), White / Caucasian (3,492 | 54.5%), and Two or more Races (1,718 | 26.8%).
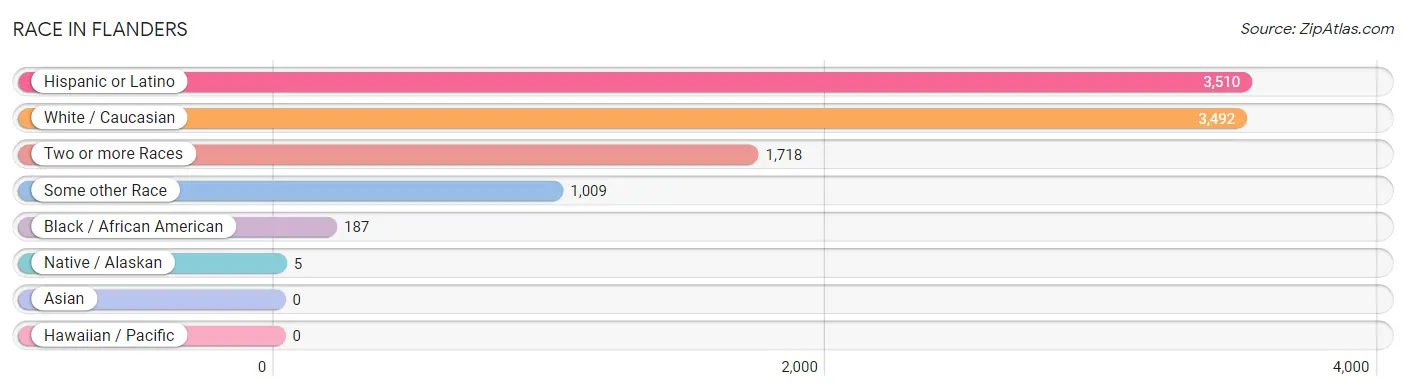
| Race | # Population | % Population |
| Asian | 0 | 0.0% |
| Black / African American | 187 | 2.9% |
| Hawaiian / Pacific | 0 | 0.0% |
| Hispanic or Latino | 3,510 | 54.7% |
| Native / Alaskan | 5 | 0.1% |
| White / Caucasian | 3,492 | 54.5% |
| Two or more Races | 1,718 | 26.8% |
| Some other Race | 1,009 | 15.7% |
| Total | 6,411 | 100.0% |
Ancestry in Flanders
The most populous ancestries reported in Flanders are Central American (1,343 | 20.9%), Guatemalan (1,199 | 18.7%), South American (991 | 15.5%), Ecuadorian (841 | 13.1%), and Mexican (821 | 12.8%), together accounting for 81.0% of all Flanders residents.
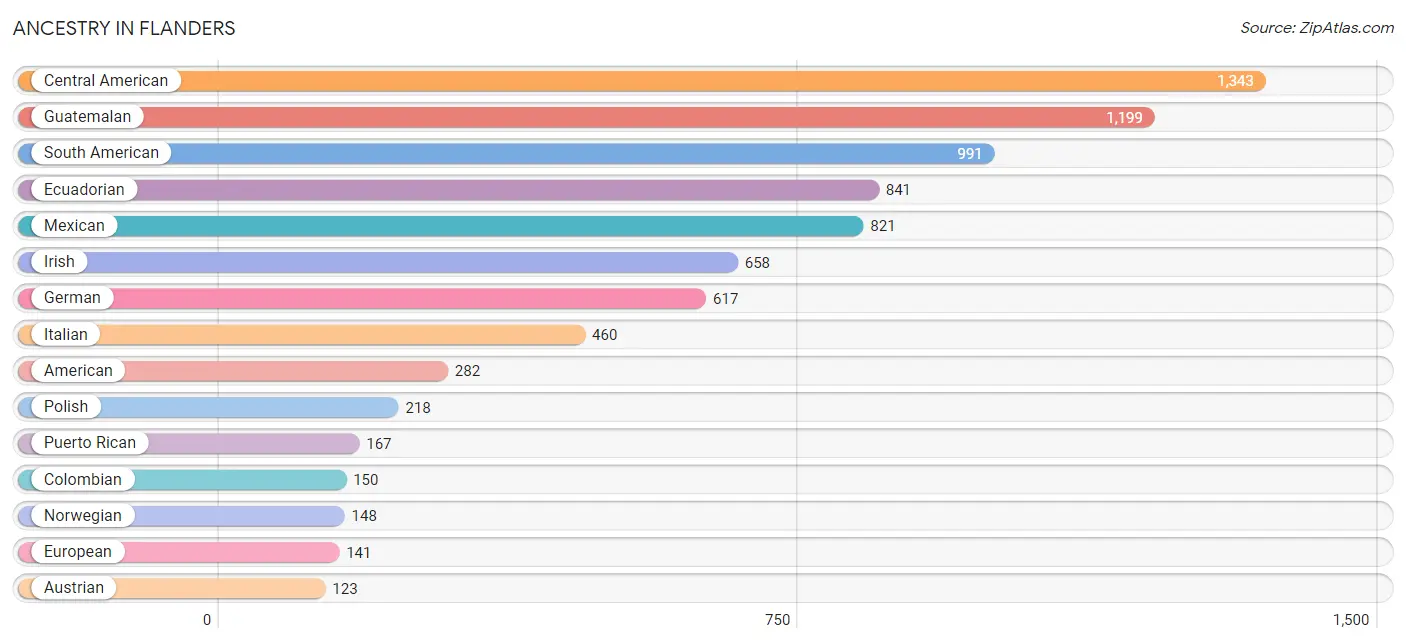
| Ancestry | # Population | % Population |
| Albanian | 58 | 0.9% |
| American | 282 | 4.4% |
| Arab | 12 | 0.2% |
| Austrian | 123 | 1.9% |
| Brazilian | 57 | 0.9% |
| Central American | 1,343 | 20.9% |
| Cherokee | 5 | 0.1% |
| Colombian | 150 | 2.3% |
| Dutch | 24 | 0.4% |
| Ecuadorian | 841 | 13.1% |
| English | 35 | 0.5% |
| European | 141 | 2.2% |
| French | 43 | 0.7% |
| French Canadian | 22 | 0.3% |
| German | 617 | 9.6% |
| Greek | 24 | 0.4% |
| Guatemalan | 1,199 | 18.7% |
| Haitian | 3 | 0.1% |
| Honduran | 98 | 1.5% |
| Irish | 658 | 10.3% |
| Italian | 460 | 7.2% |
| Lithuanian | 25 | 0.4% |
| Mexican | 821 | 12.8% |
| Norwegian | 148 | 2.3% |
| Polish | 218 | 3.4% |
| Puerto Rican | 167 | 2.6% |
| Russian | 52 | 0.8% |
| Salvadoran | 46 | 0.7% |
| Scotch-Irish | 26 | 0.4% |
| Scottish | 34 | 0.5% |
| South American | 991 | 15.5% |
| Spanish | 37 | 0.6% |
| Subsaharan African | 38 | 0.6% |
| Swedish | 46 | 0.7% | View All 34 Rows |
Immigrants in Flanders
The most numerous immigrant groups reported in Flanders came from Latin America (2,104 | 32.8%), Central America (1,450 | 22.6%), Guatemala (704 | 11.0%), South America (651 | 10.2%), and Mexico (648 | 10.1%), together accounting for 86.7% of all Flanders residents.
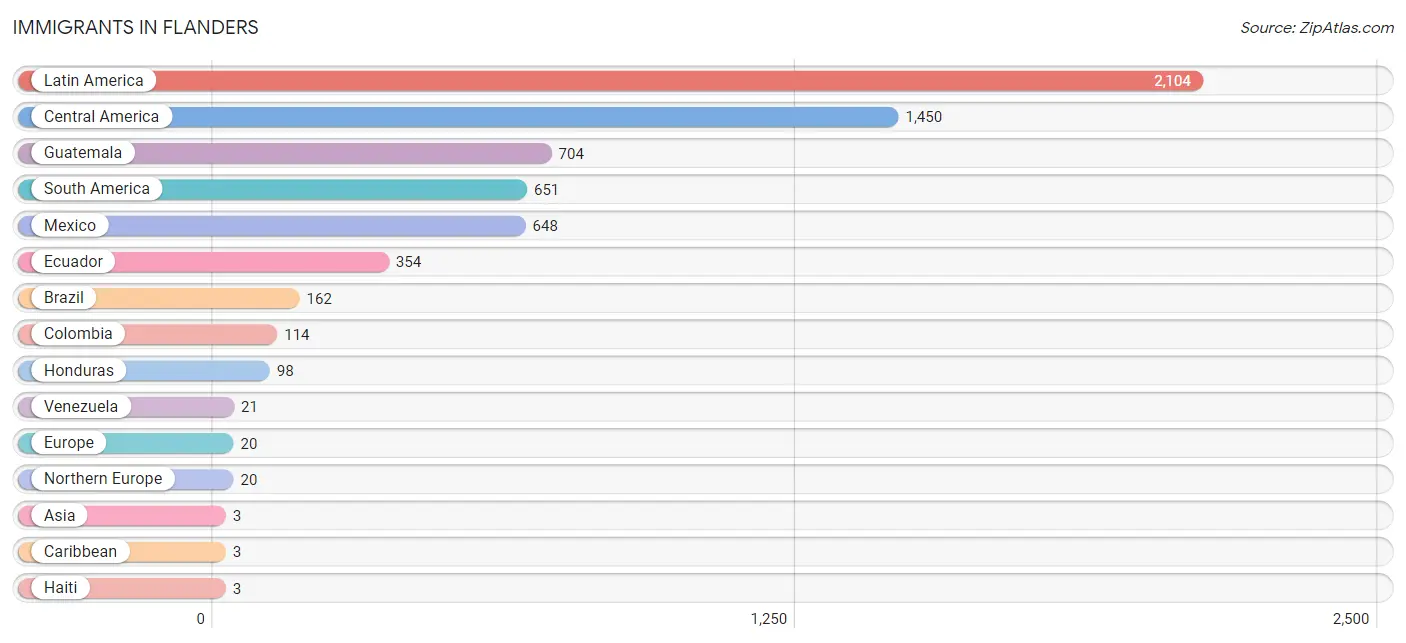
| Immigration Origin | # Population | % Population |
| Asia | 3 | 0.1% |
| Brazil | 162 | 2.5% |
| Caribbean | 3 | 0.1% |
| Central America | 1,450 | 22.6% |
| Colombia | 114 | 1.8% |
| Ecuador | 354 | 5.5% |
| Europe | 20 | 0.3% |
| Guatemala | 704 | 11.0% |
| Haiti | 3 | 0.1% |
| Honduras | 98 | 1.5% |
| Jordan | 2 | 0.0% |
| Latin America | 2,104 | 32.8% |
| Mexico | 648 | 10.1% |
| Northern Europe | 20 | 0.3% |
| South America | 651 | 10.2% |
| Venezuela | 21 | 0.3% |
| Western Asia | 2 | 0.0% | View All 17 Rows |
Sex and Age in Flanders
Sex and Age in Flanders
The most populous age groups in Flanders are 30 to 34 Years (408 | 11.6%) for men and Under 5 Years (550 | 19.1%) for women.
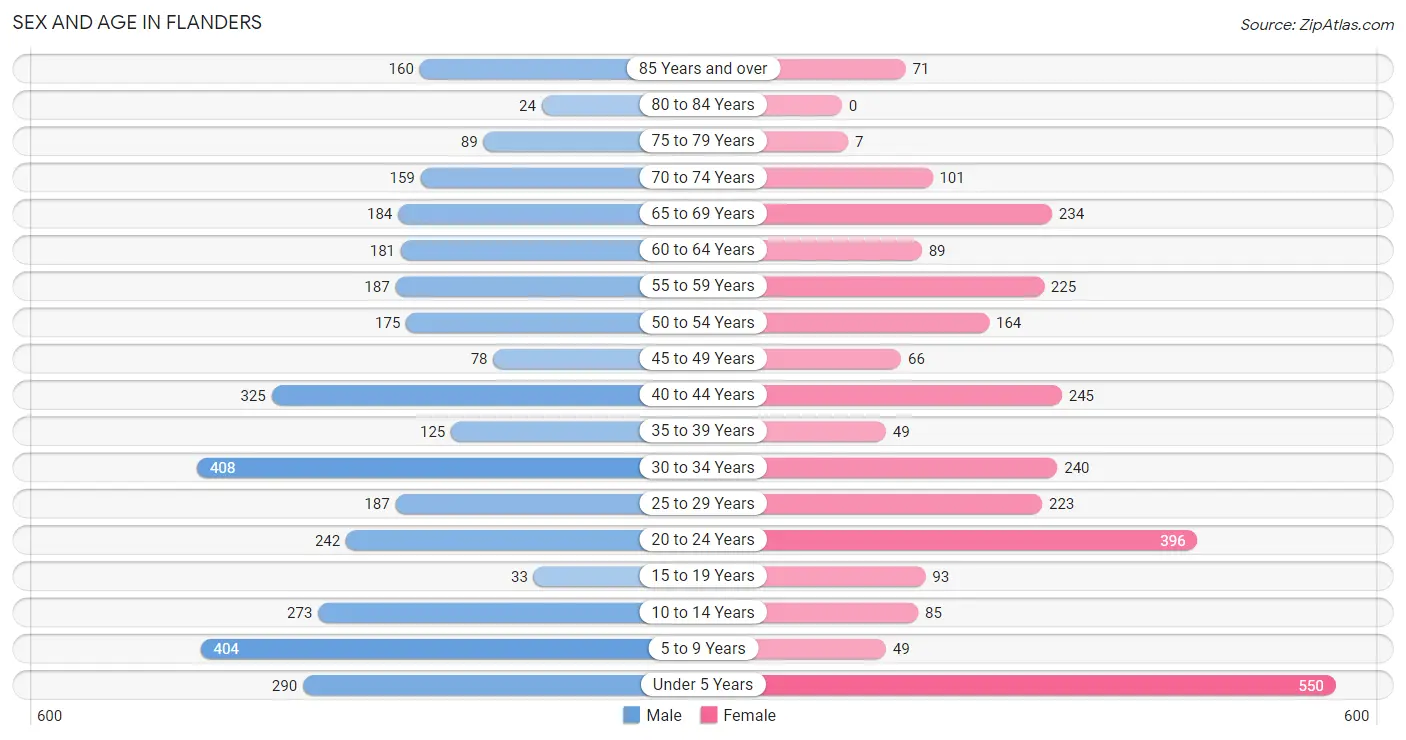
| Age Bracket | Male | Female |
| Under 5 Years | 290 (8.2%) | 550 (19.1%) |
| 5 to 9 Years | 404 (11.5%) | 49 (1.7%) |
| 10 to 14 Years | 273 (7.7%) | 85 (2.9%) |
| 15 to 19 Years | 33 (0.9%) | 93 (3.2%) |
| 20 to 24 Years | 242 (6.9%) | 396 (13.7%) |
| 25 to 29 Years | 187 (5.3%) | 223 (7.7%) |
| 30 to 34 Years | 408 (11.6%) | 240 (8.3%) |
| 35 to 39 Years | 125 (3.5%) | 49 (1.7%) |
| 40 to 44 Years | 325 (9.2%) | 245 (8.5%) |
| 45 to 49 Years | 78 (2.2%) | 66 (2.3%) |
| 50 to 54 Years | 175 (5.0%) | 164 (5.7%) |
| 55 to 59 Years | 187 (5.3%) | 225 (7.8%) |
| 60 to 64 Years | 181 (5.1%) | 89 (3.1%) |
| 65 to 69 Years | 184 (5.2%) | 234 (8.1%) |
| 70 to 74 Years | 159 (4.5%) | 101 (3.5%) |
| 75 to 79 Years | 89 (2.5%) | 7 (0.2%) |
| 80 to 84 Years | 24 (0.7%) | 0 (0.0%) |
| 85 Years and over | 160 (4.5%) | 71 (2.5%) |
| Total | 3,524 (100.0%) | 2,887 (100.0%) |
Families and Households in Flanders
Median Family Size in Flanders
The median family size in Flanders is 3.83 persons per family, with single female/mother families (283 | 20.7%) accounting for the largest median family size of 4.53 persons per family. On the other hand, single male/father families (137 | 10.0%) represent the smallest median family size with 2.91 persons per family.
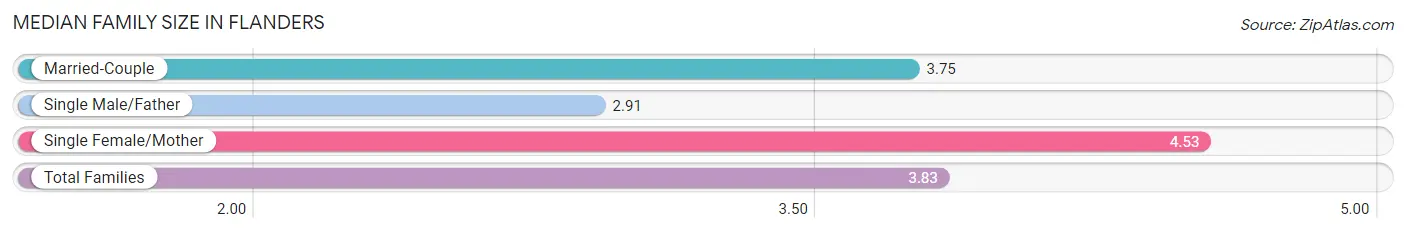
| Family Type | # Families | Family Size |
| Married-Couple | 946 (69.3%) | 3.75 |
| Single Male/Father | 137 (10.0%) | 2.91 |
| Single Female/Mother | 283 (20.7%) | 4.53 |
| Total Families | 1,366 (100.0%) | 3.83 |
Median Household Size in Flanders
The median household size in Flanders is 3.10 persons per household, with single female/mother households (283 | 13.8%) accounting for the largest median household size of 5.52 persons per household. non-family households (690 | 33.6%) represent the smallest median household size with 1.11 persons per household.
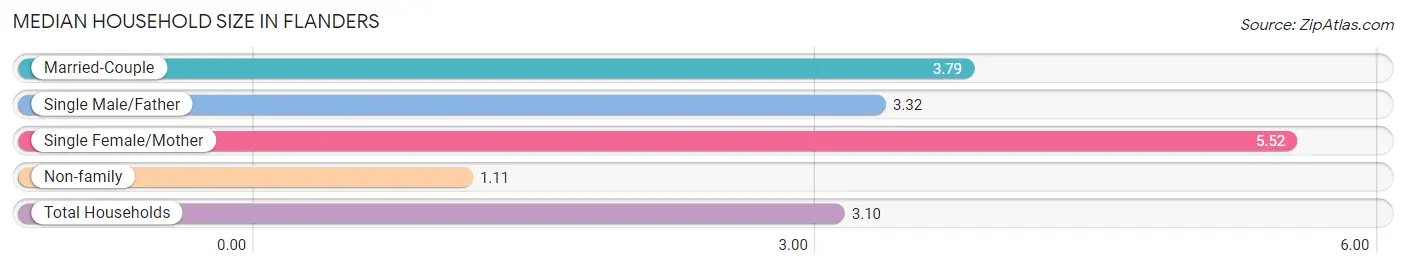
| Household Type | # Households | Household Size |
| Married-Couple | 946 (46.0%) | 3.79 |
| Single Male/Father | 137 (6.7%) | 3.32 |
| Single Female/Mother | 283 (13.8%) | 5.52 |
| Non-family | 690 (33.6%) | 1.11 |
| Total Households | 2,056 (100.0%) | 3.10 |
Household Size by Marriage Status in Flanders
Out of a total of 2,056 households in Flanders, 1,366 (66.4%) are family households, while 690 (33.6%) are nonfamily households. The most numerous type of family households are 2-person households, comprising 428, and the most common type of nonfamily households are 1-person households, comprising 613.
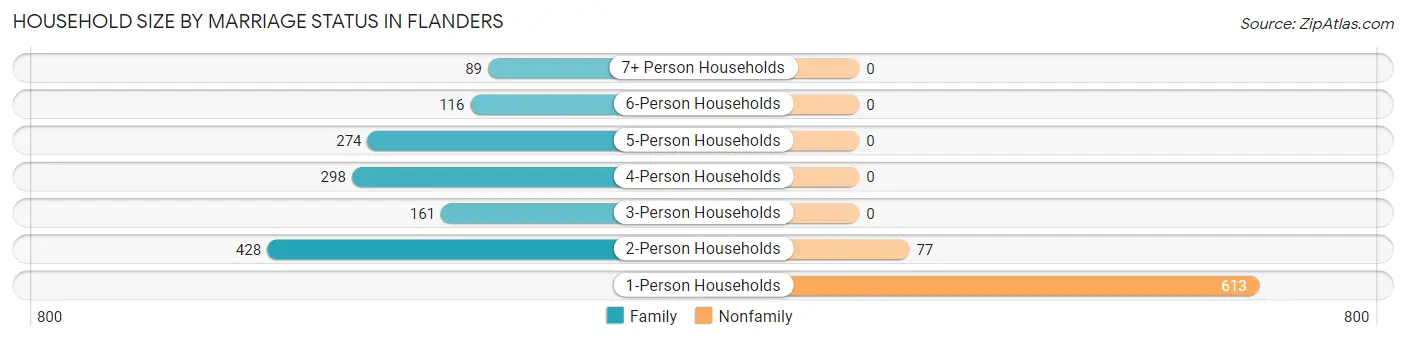
| Household Size | Family Households | Nonfamily Households |
| 1-Person Households | - | 613 (29.8%) |
| 2-Person Households | 428 (20.8%) | 77 (3.7%) |
| 3-Person Households | 161 (7.8%) | 0 (0.0%) |
| 4-Person Households | 298 (14.5%) | 0 (0.0%) |
| 5-Person Households | 274 (13.3%) | 0 (0.0%) |
| 6-Person Households | 116 (5.6%) | 0 (0.0%) |
| 7+ Person Households | 89 (4.3%) | 0 (0.0%) |
| Total | 1,366 (66.4%) | 690 (33.6%) |
Female Fertility in Flanders
Fertility by Age in Flanders
Average fertility rate in Flanders is 135.0 births per 1,000 women. Women in the age bracket of 20 to 34 years have the highest fertility rate with 180.0 births per 1,000 women. Women in the age bracket of 20 to 34 years acount for 86.1% of all women with births.
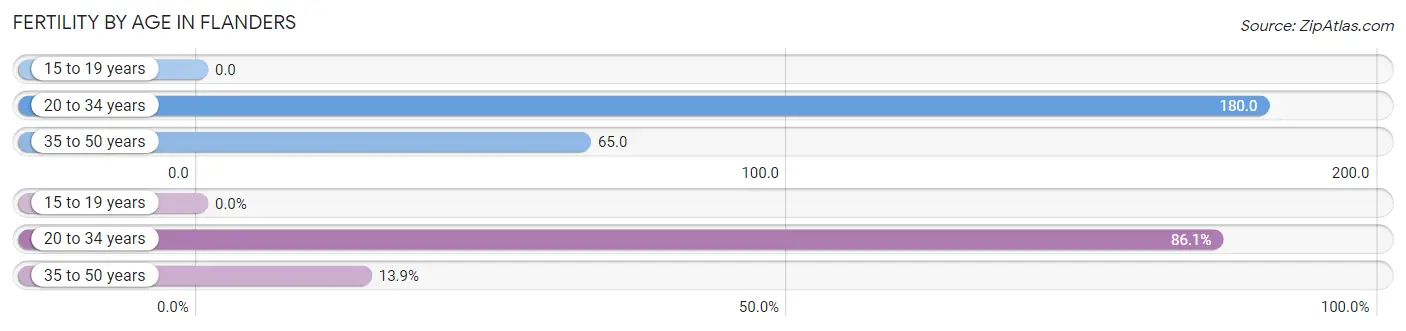
| Age Bracket | Women with Births | Births / 1,000 Women |
| 15 to 19 years | 0 (0.0%) | 0.0 |
| 20 to 34 years | 155 (86.1%) | 180.0 |
| 35 to 50 years | 25 (13.9%) | 65.0 |
| Total | 180 (100.0%) | 135.0 |
Fertility by Age by Marriage Status in Flanders
46.1% of women with births (180) in Flanders are married. The highest percentage of unmarried women with births falls into 20 to 34 years age bracket with 56.8% of them unmarried at the time of birth, while the lowest percentage of unmarried women with births belong to 35 to 50 years age bracket with 36.0% of them unmarried.
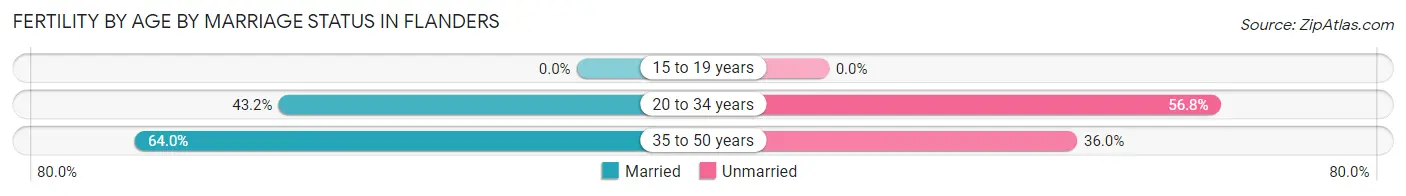
| Age Bracket | Married | Unmarried |
| 15 to 19 years | 0 (0.0%) | 0 (0.0%) |
| 20 to 34 years | 67 (43.2%) | 88 (56.8%) |
| 35 to 50 years | 16 (64.0%) | 9 (36.0%) |
| Total | 83 (46.1%) | 97 (53.9%) |
Fertility by Education in Flanders
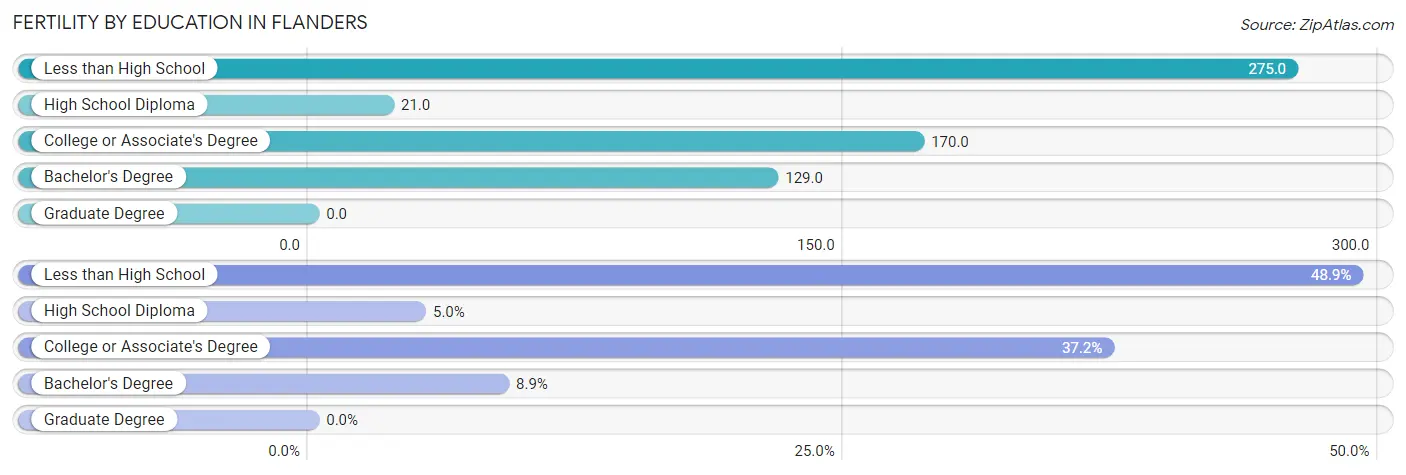
| Educational Attainment | Women with Births | Births / 1,000 Women |
| Less than High School | 88 (48.9%) | 275.0 |
| High School Diploma | 9 (5.0%) | 21.0 |
| College or Associate's Degree | 67 (37.2%) | 170.0 |
| Bachelor's Degree | 16 (8.9%) | 129.0 |
| Graduate Degree | 0 (0.0%) | 0.0 |
| Total | 180 (100.0%) | 135.0 |
Fertility by Education by Marriage Status in Flanders
53.9% of women with births in Flanders are unmarried. Women with the educational attainment of college or associate's degree are most likely to be married with 100.0% of them married at childbirth, while women with the educational attainment of less than high school are least likely to be married with 100.0% of them unmarried at childbirth.
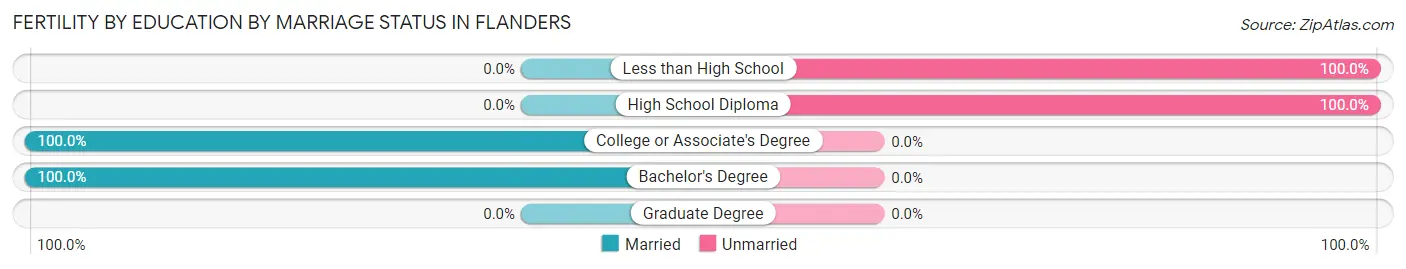
| Educational Attainment | Married | Unmarried |
| Less than High School | 0 (0.0%) | 88 (100.0%) |
| High School Diploma | 0 (0.0%) | 9 (100.0%) |
| College or Associate's Degree | 67 (100.0%) | 0 (0.0%) |
| Bachelor's Degree | 16 (100.0%) | 0 (0.0%) |
| Graduate Degree | 0 (0.0%) | 0 (0.0%) |
| Total | 83 (46.1%) | 97 (53.9%) |
Employment Characteristics in Flanders
Employment by Class of Employer in Flanders
Among the 3,052 employed individuals in Flanders, private company employees (2,257 | 74.0%), self-employed (incorporated) (228 | 7.5%), and not-for-profit organizations (179 | 5.9%) make up the most common classes of employment.
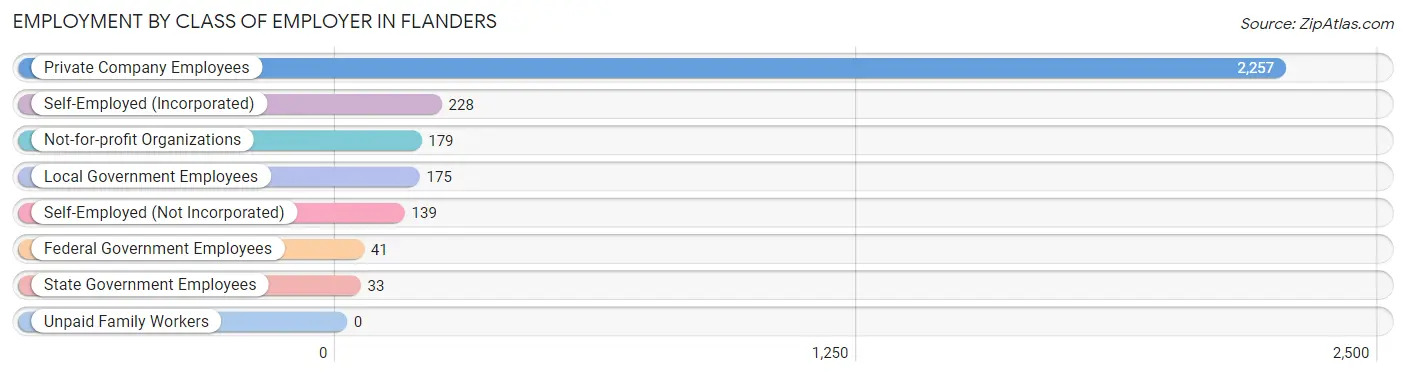
| Employer Class | # Employees | % Employees |
| Private Company Employees | 2,257 | 74.0% |
| Self-Employed (Incorporated) | 228 | 7.5% |
| Self-Employed (Not Incorporated) | 139 | 4.5% |
| Not-for-profit Organizations | 179 | 5.9% |
| Local Government Employees | 175 | 5.7% |
| State Government Employees | 33 | 1.1% |
| Federal Government Employees | 41 | 1.3% |
| Unpaid Family Workers | 0 | 0.0% |
| Total | 3,052 | 100.0% |
Employment Status by Age in Flanders
According to the labor force statistics for Flanders, out of the total population over 16 years of age (4,760), 66.4% or 3,161 individuals are in the labor force, with 2.6% or 82 of them unemployed. The age group with the highest labor force participation rate is 55 to 59 years, with 98.1% or 404 individuals in the labor force. Within the labor force, the 35 to 44 years age range has the highest percentage of unemployed individuals, with 10.0% or 67 of them being unemployed.
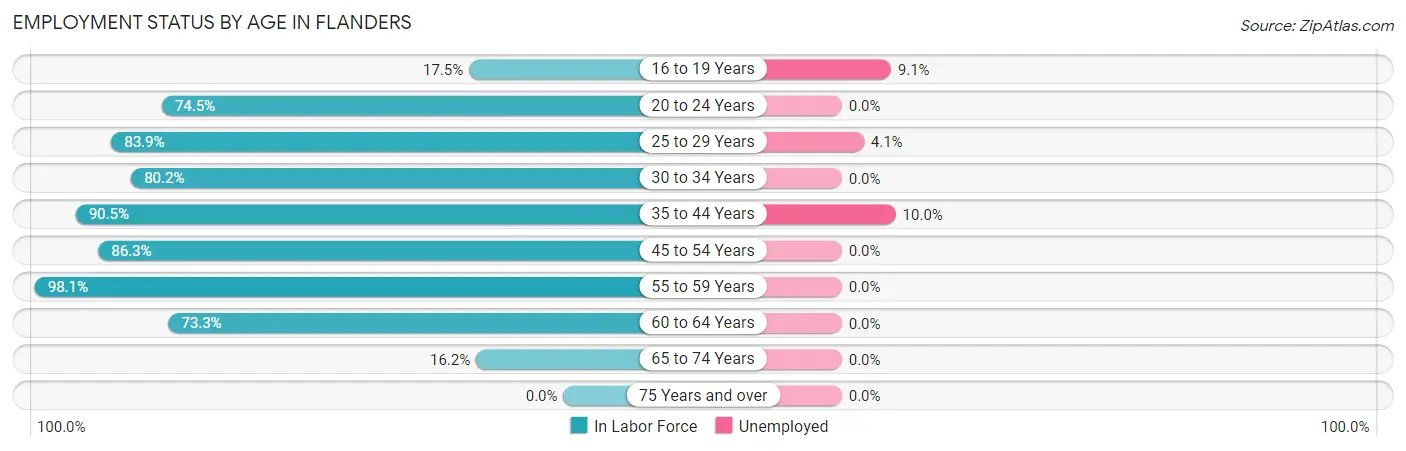
| Age Bracket | In Labor Force | Unemployed |
| 16 to 19 Years | 22 (17.5%) | 2 (9.1%) |
| 20 to 24 Years | 475 (74.5%) | 0 (0.0%) |
| 25 to 29 Years | 344 (83.9%) | 14 (4.1%) |
| 30 to 34 Years | 520 (80.2%) | 0 (0.0%) |
| 35 to 44 Years | 673 (90.5%) | 67 (10.0%) |
| 45 to 54 Years | 417 (86.3%) | 0 (0.0%) |
| 55 to 59 Years | 404 (98.1%) | 0 (0.0%) |
| 60 to 64 Years | 198 (73.3%) | 0 (0.0%) |
| 65 to 74 Years | 110 (16.2%) | 0 (0.0%) |
| 75 Years and over | 0 (0.0%) | 0 (0.0%) |
| Total | 3,161 (66.4%) | 82 (2.6%) |
Employment Status by Educational Attainment in Flanders
According to labor force statistics for Flanders, 86.1% of individuals (2,555) out of the total population between 25 and 64 years of age (2,967) are in the labor force, with 3.2% or 82 of them being unemployed. The group with the highest labor force participation rate are those with the educational attainment of bachelor's degree or higher, with 100.0% or 430 individuals in the labor force. Within the labor force, individuals with bachelor's degree or higher education have the highest percentage of unemployment, with 16.5% or 71 of them being unemployed.
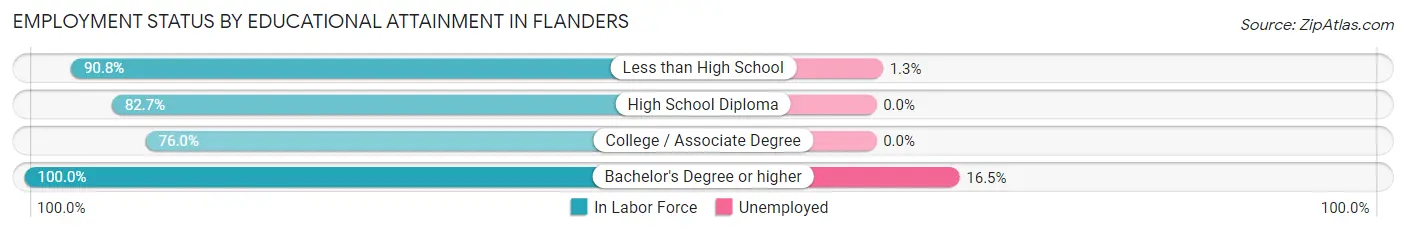
| Educational Attainment | In Labor Force | Unemployed |
| Less than High School | 786 (90.8%) | 11 (1.3%) |
| High School Diploma | 861 (82.7%) | 0 (0.0%) |
| College / Associate Degree | 479 (76.0%) | 0 (0.0%) |
| Bachelor's Degree or higher | 430 (100.0%) | 71 (16.5%) |
| Total | 2,555 (86.1%) | 95 (3.2%) |
Employment Occupations by Sex in Flanders
Management, Business, Science and Arts Occupations
The most common Management, Business, Science and Arts occupations in Flanders are Community & Social Service (218 | 7.1%), Management (184 | 6.0%), Education Instruction & Library (113 | 3.7%), Computers, Engineering & Science (70 | 2.3%), and Legal Services & Support (69 | 2.2%).
Management, Business, Science and Arts Occupations by Sex
Within the Management, Business, Science and Arts occupations in Flanders, the most male-oriented occupations are Architecture & Engineering (100.0%), Management (89.7%), and Computers, Engineering & Science (51.4%), while the most female-oriented occupations are Business & Financial (100.0%), Education, Arts & Media (100.0%), and Legal Services & Support (100.0%).
| Occupation | Male | Female |
| Management | 165 (89.7%) | 19 (10.3%) |
| Business & Financial | 0 (0.0%) | 47 (100.0%) |
| Computers, Engineering & Science | 36 (51.4%) | 34 (48.6%) |
| Computers & Mathematics | 9 (20.9%) | 34 (79.1%) |
| Architecture & Engineering | 27 (100.0%) | 0 (0.0%) |
| Life, Physical & Social Science | 0 (0.0%) | 0 (0.0%) |
| Community & Social Service | 53 (24.3%) | 165 (75.7%) |
| Education, Arts & Media | 0 (0.0%) | 36 (100.0%) |
| Legal Services & Support | 0 (0.0%) | 69 (100.0%) |
| Education Instruction & Library | 53 (46.9%) | 60 (53.1%) |
| Arts, Media & Entertainment | 0 (0.0%) | 0 (0.0%) |
| Health Diagnosing & Treating | 0 (0.0%) | 69 (100.0%) |
| Health Technologists | 0 (0.0%) | 24 (100.0%) |
| Total (Category) | 254 (43.2%) | 334 (56.8%) |
| Total (Overall) | 1,664 (54.0%) | 1,416 (46.0%) |
Services Occupations
The most common Services occupations in Flanders are Cleaning & Maintenance (223 | 7.2%), Healthcare Support (188 | 6.1%), Food Preparation & Serving (184 | 6.0%), Personal Care & Service (114 | 3.7%), and Security & Protection (25 | 0.8%).
Services Occupations by Sex
Within the Services occupations in Flanders, the most male-oriented occupations are Security & Protection (100.0%), Law Enforcement (100.0%), and Cleaning & Maintenance (76.7%), while the most female-oriented occupations are Personal Care & Service (100.0%), Healthcare Support (95.2%), and Food Preparation & Serving (63.6%).
| Occupation | Male | Female |
| Healthcare Support | 9 (4.8%) | 179 (95.2%) |
| Security & Protection | 25 (100.0%) | 0 (0.0%) |
| Firefighting & Prevention | 0 (0.0%) | 0 (0.0%) |
| Law Enforcement | 25 (100.0%) | 0 (0.0%) |
| Food Preparation & Serving | 67 (36.4%) | 117 (63.6%) |
| Cleaning & Maintenance | 171 (76.7%) | 52 (23.3%) |
| Personal Care & Service | 0 (0.0%) | 114 (100.0%) |
| Total (Category) | 272 (37.1%) | 462 (62.9%) |
| Total (Overall) | 1,664 (54.0%) | 1,416 (46.0%) |
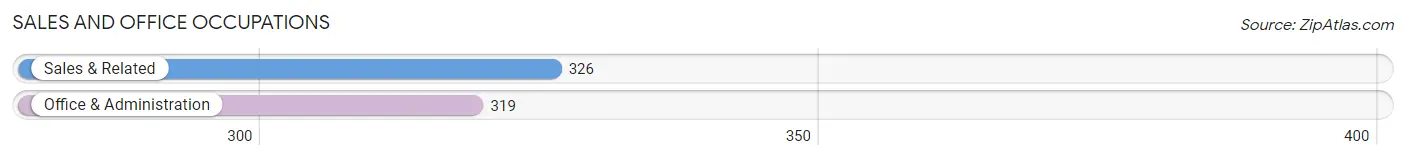
Sales and Office Occupations
The most common Sales and Office occupations in Flanders are Sales & Related (326 | 10.6%), and Office & Administration (319 | 10.4%).
Sales and Office Occupations by Sex
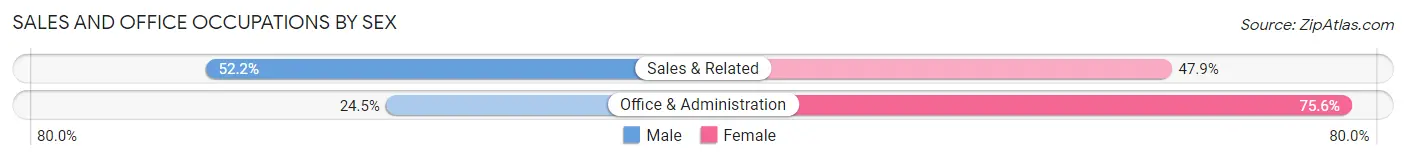
| Occupation | Male | Female |
| Sales & Related | 170 (52.1%) | 156 (47.8%) |
| Office & Administration | 78 (24.4%) | 241 (75.5%) |
| Total (Category) | 248 (38.5%) | 397 (61.6%) |
| Total (Overall) | 1,664 (54.0%) | 1,416 (46.0%) |
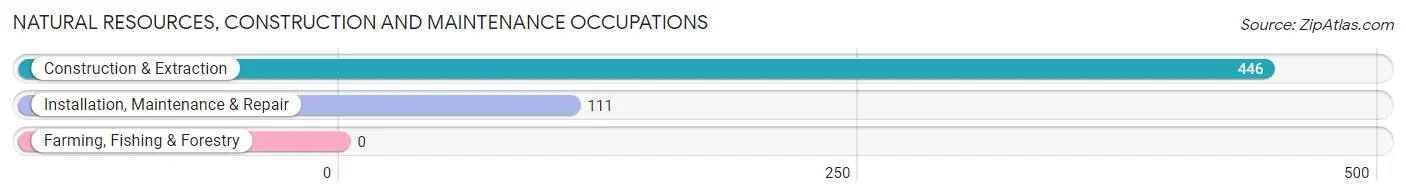
Natural Resources, Construction and Maintenance Occupations
The most common Natural Resources, Construction and Maintenance occupations in Flanders are Construction & Extraction (446 | 14.5%), and Installation, Maintenance & Repair (111 | 3.6%).
Natural Resources, Construction and Maintenance Occupations by Sex
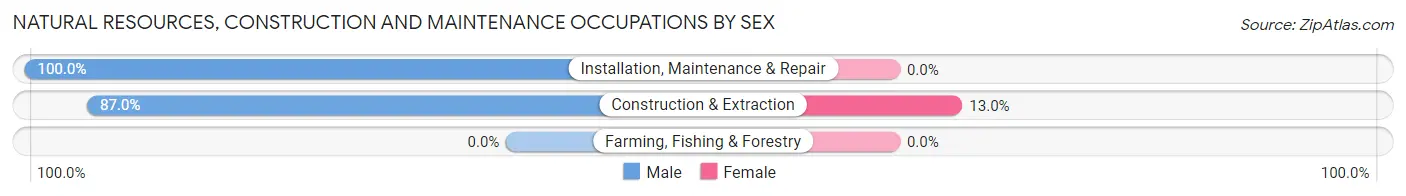
| Occupation | Male | Female |
| Farming, Fishing & Forestry | 0 (0.0%) | 0 (0.0%) |
| Construction & Extraction | 388 (87.0%) | 58 (13.0%) |
| Installation, Maintenance & Repair | 111 (100.0%) | 0 (0.0%) |
| Total (Category) | 499 (89.6%) | 58 (10.4%) |
| Total (Overall) | 1,664 (54.0%) | 1,416 (46.0%) |
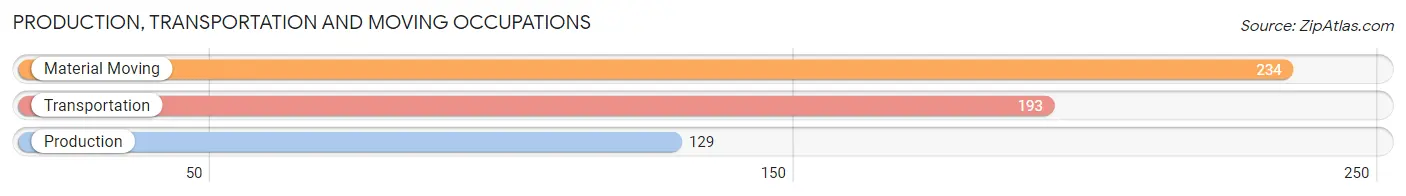
Production, Transportation and Moving Occupations
The most common Production, Transportation and Moving occupations in Flanders are Material Moving (234 | 7.6%), Transportation (193 | 6.3%), and Production (129 | 4.2%).
Production, Transportation and Moving Occupations by Sex
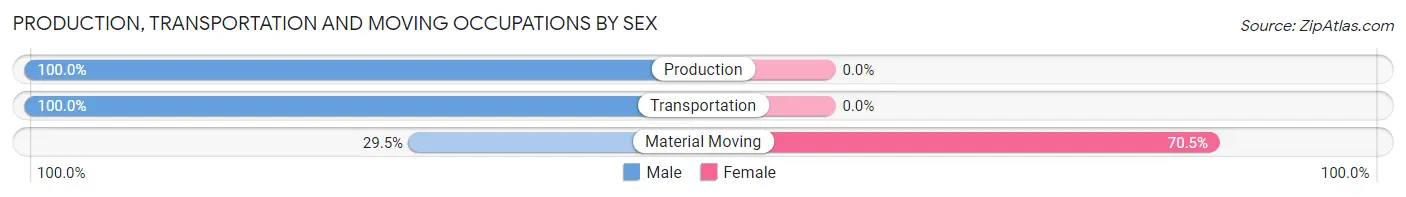
| Occupation | Male | Female |
| Production | 129 (100.0%) | 0 (0.0%) |
| Transportation | 193 (100.0%) | 0 (0.0%) |
| Material Moving | 69 (29.5%) | 165 (70.5%) |
| Total (Category) | 391 (70.3%) | 165 (29.7%) |
| Total (Overall) | 1,664 (54.0%) | 1,416 (46.0%) |
Employment Industries by Sex in Flanders
Employment Industries in Flanders
The major employment industries in Flanders include Retail Trade (853 | 27.7%), Construction (571 | 18.5%), Health Care & Social Assistance (269 | 8.7%), Administrative & Support (190 | 6.2%), and Transportation & Warehousing (185 | 6.0%).
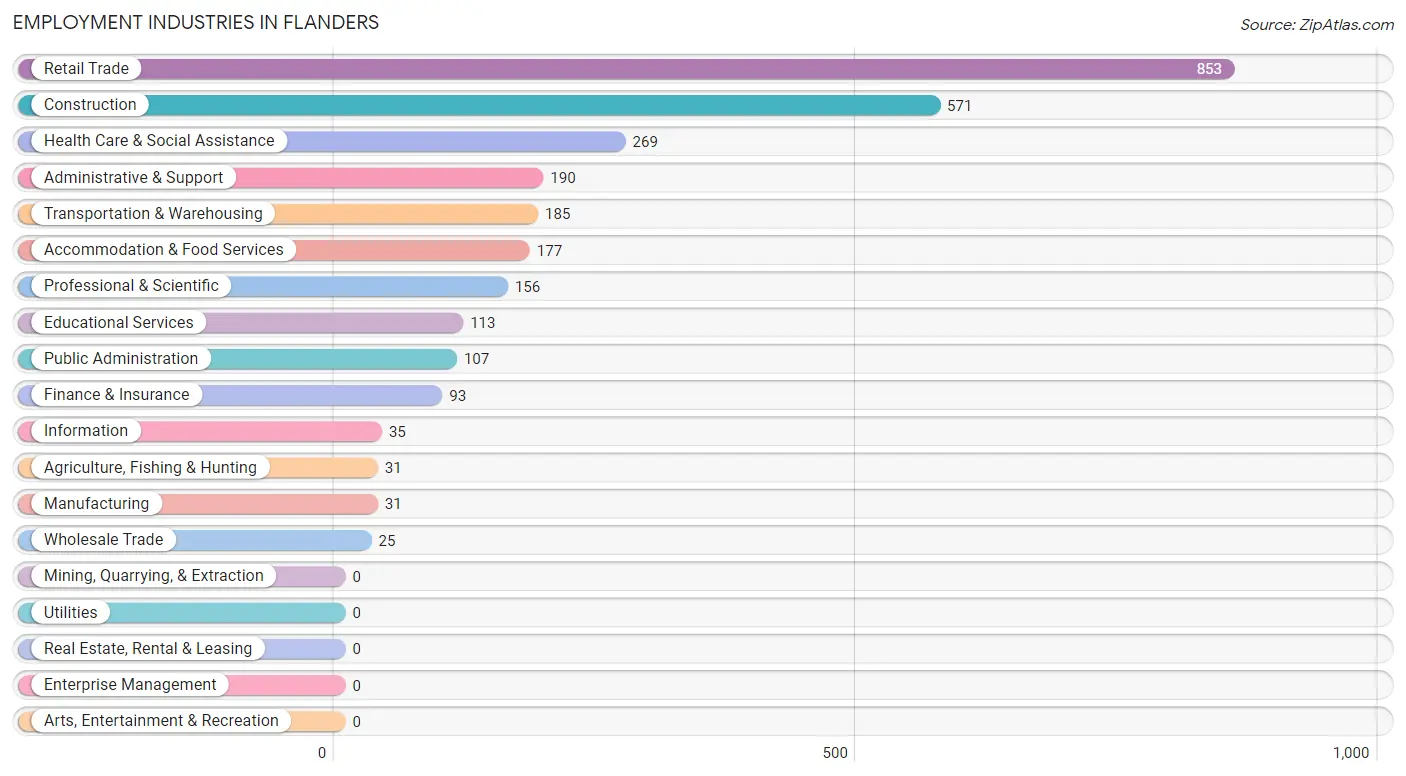
Employment Industries by Sex in Flanders
The Flanders industries that see more men than women are Agriculture, Fishing & Hunting (100.0%), Manufacturing (100.0%), and Transportation & Warehousing (100.0%), whereas the industries that tend to have a higher number of women are Wholesale Trade (100.0%), Health Care & Social Assistance (96.7%), and Accommodation & Food Services (81.4%).

| Industry | Male | Female |
| Agriculture, Fishing & Hunting | 31 (100.0%) | 0 (0.0%) |
| Mining, Quarrying, & Extraction | 0 (0.0%) | 0 (0.0%) |
| Construction | 513 (89.8%) | 58 (10.2%) |
| Manufacturing | 31 (100.0%) | 0 (0.0%) |
| Wholesale Trade | 0 (0.0%) | 25 (100.0%) |
| Retail Trade | 290 (34.0%) | 563 (66.0%) |
| Transportation & Warehousing | 185 (100.0%) | 0 (0.0%) |
| Utilities | 0 (0.0%) | 0 (0.0%) |
| Information | 16 (45.7%) | 19 (54.3%) |
| Finance & Insurance | 36 (38.7%) | 57 (61.3%) |
| Real Estate, Rental & Leasing | 0 (0.0%) | 0 (0.0%) |
| Professional & Scientific | 72 (46.2%) | 84 (53.8%) |
| Enterprise Management | 0 (0.0%) | 0 (0.0%) |
| Administrative & Support | 140 (73.7%) | 50 (26.3%) |
| Educational Services | 33 (29.2%) | 80 (70.8%) |
| Health Care & Social Assistance | 9 (3.4%) | 260 (96.7%) |
| Arts, Entertainment & Recreation | 0 (0.0%) | 0 (0.0%) |
| Accommodation & Food Services | 33 (18.6%) | 144 (81.4%) |
| Public Administration | 83 (77.6%) | 24 (22.4%) |
| Total | 1,664 (54.0%) | 1,416 (46.0%) |
Education in Flanders
School Enrollment in Flanders
The most common levels of schooling among the 1,250 students in Flanders are middle school (276 | 22.1%), elementary school (252 | 20.2%), and kindergarten (237 | 19.0%).
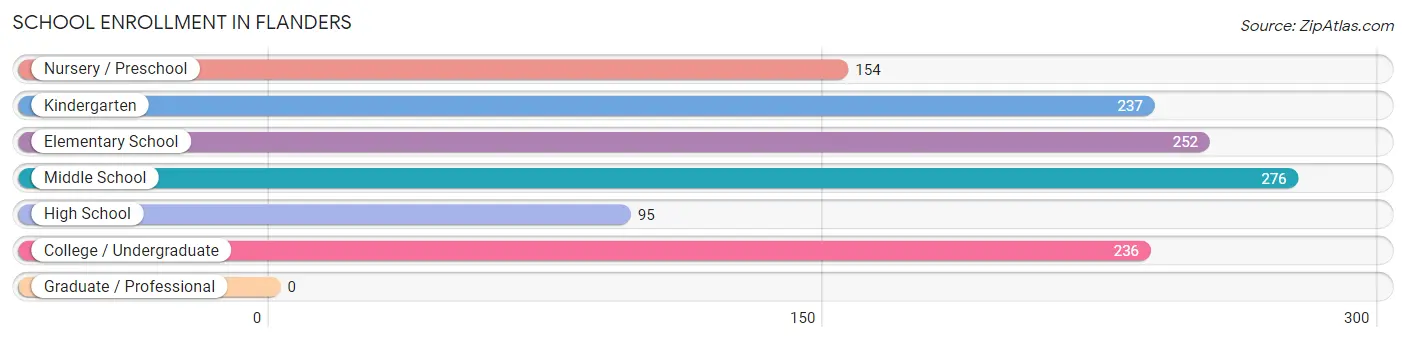
| School Level | # Students | % Students |
| Nursery / Preschool | 154 | 12.3% |
| Kindergarten | 237 | 19.0% |
| Elementary School | 252 | 20.2% |
| Middle School | 276 | 22.1% |
| High School | 95 | 7.6% |
| College / Undergraduate | 236 | 18.9% |
| Graduate / Professional | 0 | 0.0% |
| Total | 1,250 | 100.0% |
School Enrollment by Age by Funding Source in Flanders
Out of a total of 1,250 students who are enrolled in schools in Flanders, 196 (15.7%) attend a private institution, while the remaining 1,054 (84.3%) are enrolled in public schools. The age group of 20 to 24 year olds has the highest likelihood of being enrolled in private schools, with 150 (98.7% in the age bracket) enrolled. Conversely, the age group of 3 to 4 year olds has the lowest likelihood of being enrolled in a private school, with 108 (100.0% in the age bracket) attending a public institution.
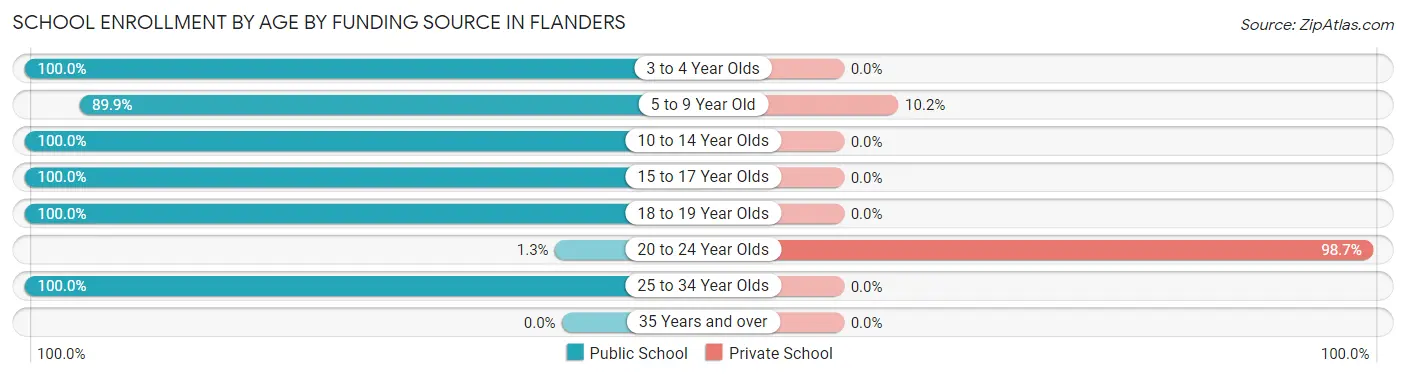
| Age Bracket | Public School | Private School |
| 3 to 4 Year Olds | 108 (100.0%) | 0 (0.0%) |
| 5 to 9 Year Old | 407 (89.8%) | 46 (10.2%) |
| 10 to 14 Year Olds | 358 (100.0%) | 0 (0.0%) |
| 15 to 17 Year Olds | 76 (100.0%) | 0 (0.0%) |
| 18 to 19 Year Olds | 2 (100.0%) | 0 (0.0%) |
| 20 to 24 Year Olds | 2 (1.3%) | 150 (98.7%) |
| 25 to 34 Year Olds | 101 (100.0%) | 0 (0.0%) |
| 35 Years and over | 0 (0.0%) | 0 (0.0%) |
| Total | 1,054 (84.3%) | 196 (15.7%) |
Educational Attainment by Field of Study in Flanders
Literature & languages (165 | 25.1%), business (155 | 23.6%), engineering (65 | 9.9%), communications (57 | 8.7%), and education (43 | 6.5%) are the most common fields of study among 658 individuals in Flanders who have obtained a bachelor's degree or higher.
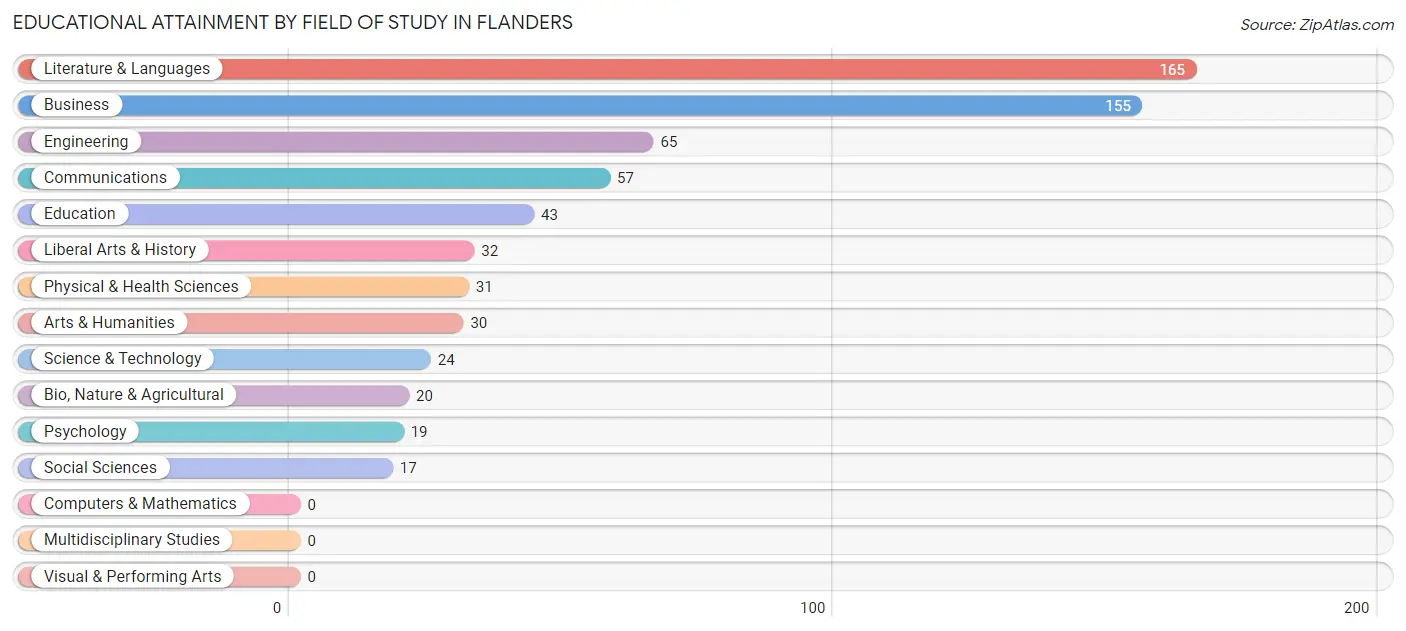
| Field of Study | # Graduates | % Graduates |
| Computers & Mathematics | 0 | 0.0% |
| Bio, Nature & Agricultural | 20 | 3.0% |
| Physical & Health Sciences | 31 | 4.7% |
| Psychology | 19 | 2.9% |
| Social Sciences | 17 | 2.6% |
| Engineering | 65 | 9.9% |
| Multidisciplinary Studies | 0 | 0.0% |
| Science & Technology | 24 | 3.6% |
| Business | 155 | 23.6% |
| Education | 43 | 6.5% |
| Literature & Languages | 165 | 25.1% |
| Liberal Arts & History | 32 | 4.9% |
| Visual & Performing Arts | 0 | 0.0% |
| Communications | 57 | 8.7% |
| Arts & Humanities | 30 | 4.6% |
| Total | 658 | 100.0% |
Transportation & Commute in Flanders
Vehicle Availability by Sex in Flanders
The most prevalent vehicle ownership categories in Flanders are males with 2 vehicles (469, accounting for 28.5%) and females with 2 vehicles (448, making up 33.3%).
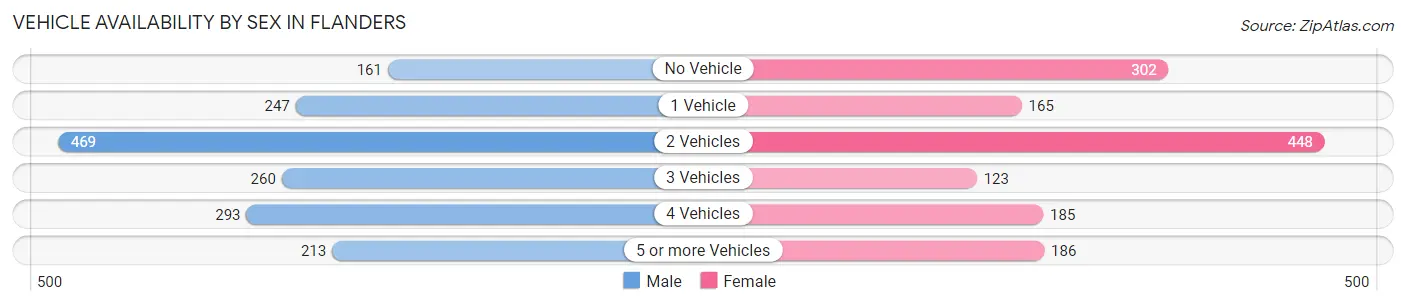
| Vehicles Available | Male | Female |
| No Vehicle | 161 (9.8%) | 302 (21.4%) |
| 1 Vehicle | 247 (15.0%) | 165 (11.7%) |
| 2 Vehicles | 469 (28.5%) | 448 (31.8%) |
| 3 Vehicles | 260 (15.8%) | 123 (8.7%) |
| 4 Vehicles | 293 (17.8%) | 185 (13.1%) |
| 5 or more Vehicles | 213 (13.0%) | 186 (13.2%) |
| Total | 1,643 (100.0%) | 1,409 (100.0%) |
Commute Time in Flanders
The most frequently occuring commute durations in Flanders are 15 to 19 minutes (599 commuters, 19.8%), 60 to 89 minutes (538 commuters, 17.7%), and 30 to 34 minutes (480 commuters, 15.8%).
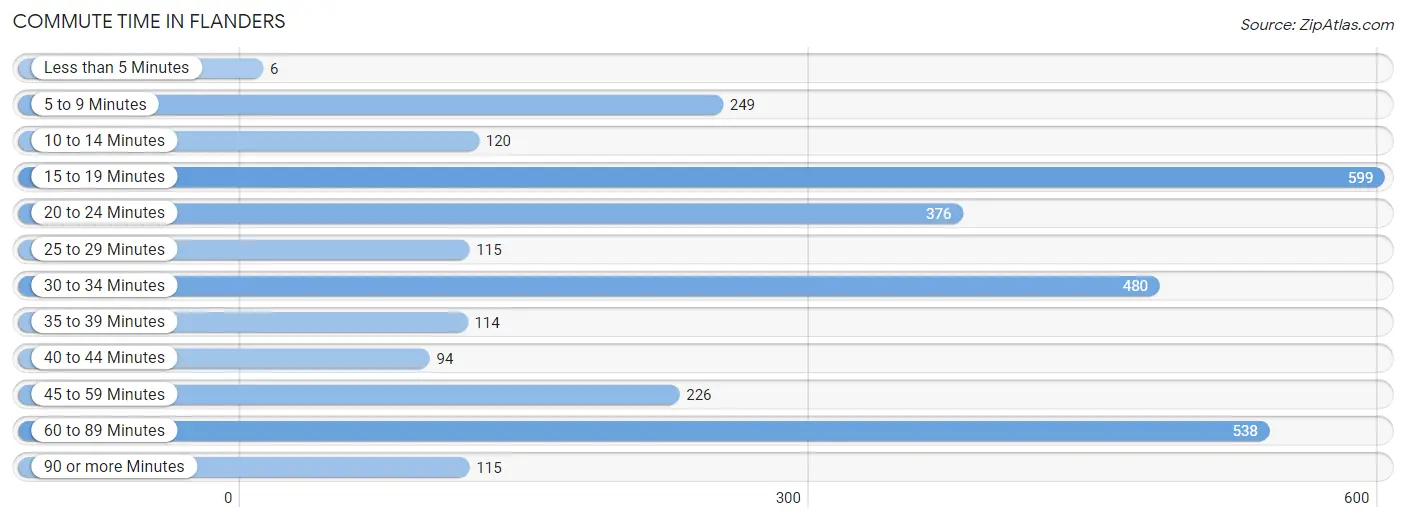
| Commute Time | # Commuters | % Commuters |
| Less than 5 Minutes | 6 | 0.2% |
| 5 to 9 Minutes | 249 | 8.2% |
| 10 to 14 Minutes | 120 | 4.0% |
| 15 to 19 Minutes | 599 | 19.8% |
| 20 to 24 Minutes | 376 | 12.4% |
| 25 to 29 Minutes | 115 | 3.8% |
| 30 to 34 Minutes | 480 | 15.8% |
| 35 to 39 Minutes | 114 | 3.8% |
| 40 to 44 Minutes | 94 | 3.1% |
| 45 to 59 Minutes | 226 | 7.4% |
| 60 to 89 Minutes | 538 | 17.7% |
| 90 or more Minutes | 115 | 3.8% |
Commute Time by Sex in Flanders
The most common commute times in Flanders are 30 to 34 minutes (324 commuters, 20.0%) for males and 15 to 19 minutes (279 commuters, 19.8%) for females.
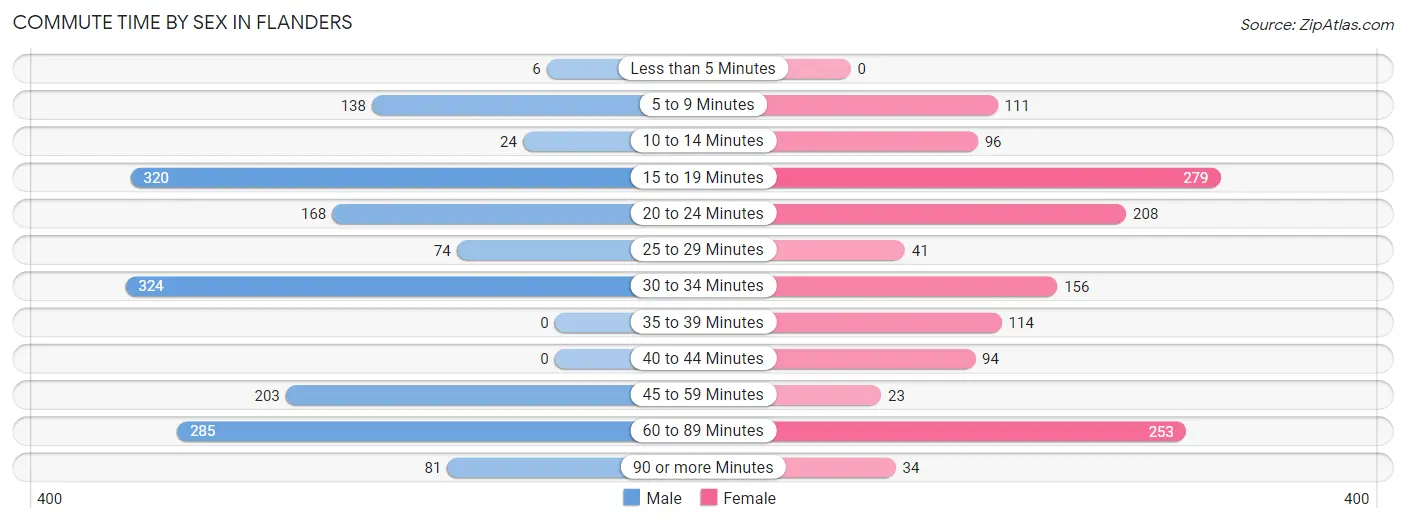
| Commute Time | Male | Female |
| Less than 5 Minutes | 6 (0.4%) | 0 (0.0%) |
| 5 to 9 Minutes | 138 (8.5%) | 111 (7.9%) |
| 10 to 14 Minutes | 24 (1.5%) | 96 (6.8%) |
| 15 to 19 Minutes | 320 (19.7%) | 279 (19.8%) |
| 20 to 24 Minutes | 168 (10.3%) | 208 (14.8%) |
| 25 to 29 Minutes | 74 (4.6%) | 41 (2.9%) |
| 30 to 34 Minutes | 324 (20.0%) | 156 (11.1%) |
| 35 to 39 Minutes | 0 (0.0%) | 114 (8.1%) |
| 40 to 44 Minutes | 0 (0.0%) | 94 (6.7%) |
| 45 to 59 Minutes | 203 (12.5%) | 23 (1.6%) |
| 60 to 89 Minutes | 285 (17.6%) | 253 (18.0%) |
| 90 or more Minutes | 81 (5.0%) | 34 (2.4%) |
Time of Departure to Work by Sex in Flanders
The most frequent times of departure to work in Flanders are 6:30 AM to 6:59 AM (237, 14.6%) for males and 12:00 PM to 3:59 PM (315, 22.4%) for females.
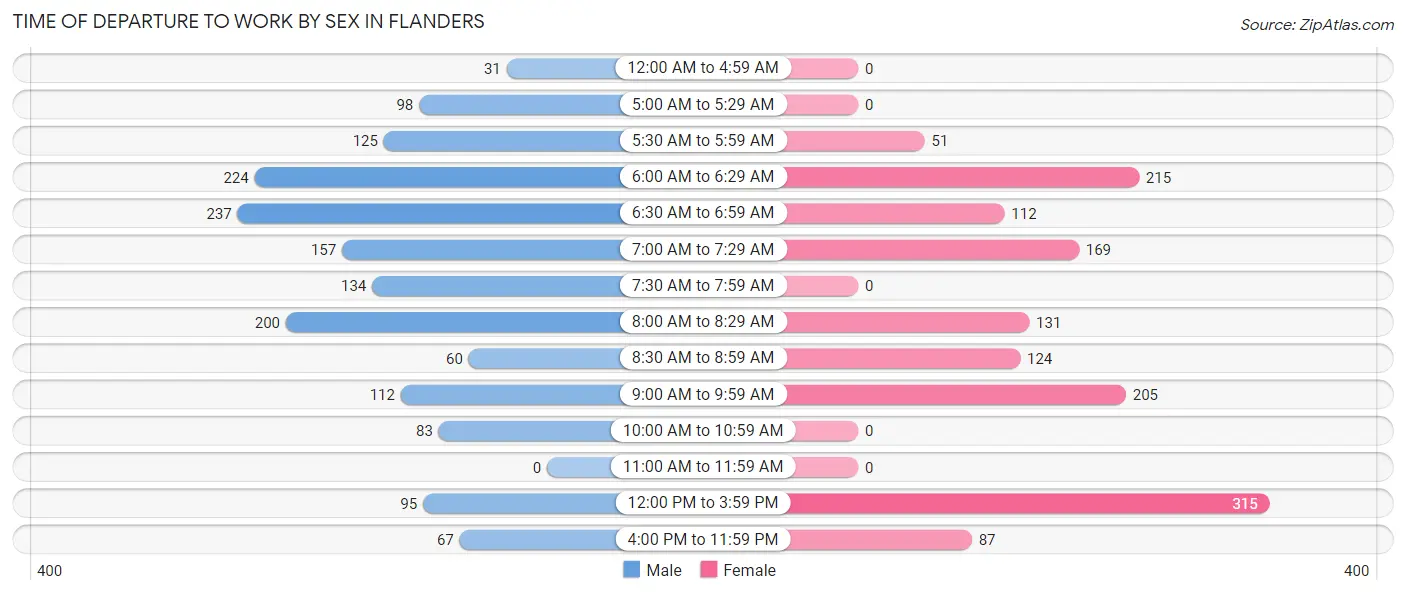
| Time of Departure | Male | Female |
| 12:00 AM to 4:59 AM | 31 (1.9%) | 0 (0.0%) |
| 5:00 AM to 5:29 AM | 98 (6.0%) | 0 (0.0%) |
| 5:30 AM to 5:59 AM | 125 (7.7%) | 51 (3.6%) |
| 6:00 AM to 6:29 AM | 224 (13.8%) | 215 (15.3%) |
| 6:30 AM to 6:59 AM | 237 (14.6%) | 112 (8.0%) |
| 7:00 AM to 7:29 AM | 157 (9.7%) | 169 (12.0%) |
| 7:30 AM to 7:59 AM | 134 (8.3%) | 0 (0.0%) |
| 8:00 AM to 8:29 AM | 200 (12.3%) | 131 (9.3%) |
| 8:30 AM to 8:59 AM | 60 (3.7%) | 124 (8.8%) |
| 9:00 AM to 9:59 AM | 112 (6.9%) | 205 (14.5%) |
| 10:00 AM to 10:59 AM | 83 (5.1%) | 0 (0.0%) |
| 11:00 AM to 11:59 AM | 0 (0.0%) | 0 (0.0%) |
| 12:00 PM to 3:59 PM | 95 (5.9%) | 315 (22.4%) |
| 4:00 PM to 11:59 PM | 67 (4.1%) | 87 (6.2%) |
| Total | 1,623 (100.0%) | 1,409 (100.0%) |
Housing Occupancy in Flanders
Occupancy by Ownership in Flanders
Of the total 2,056 dwellings in Flanders, owner-occupied units account for 1,298 (63.1%), while renter-occupied units make up 758 (36.9%).
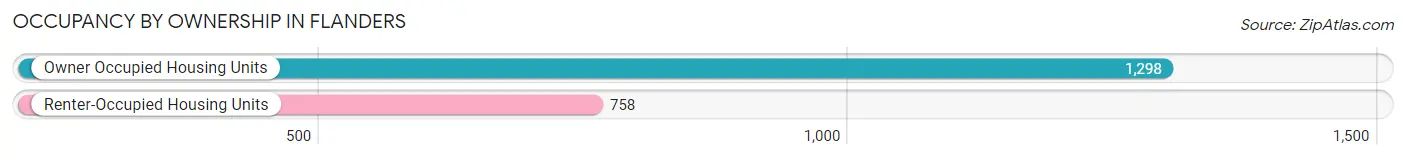
| Occupancy | # Housing Units | % Housing Units |
| Owner Occupied Housing Units | 1,298 | 63.1% |
| Renter-Occupied Housing Units | 758 | 36.9% |
| Total Occupied Housing Units | 2,056 | 100.0% |
Occupancy by Household Size in Flanders
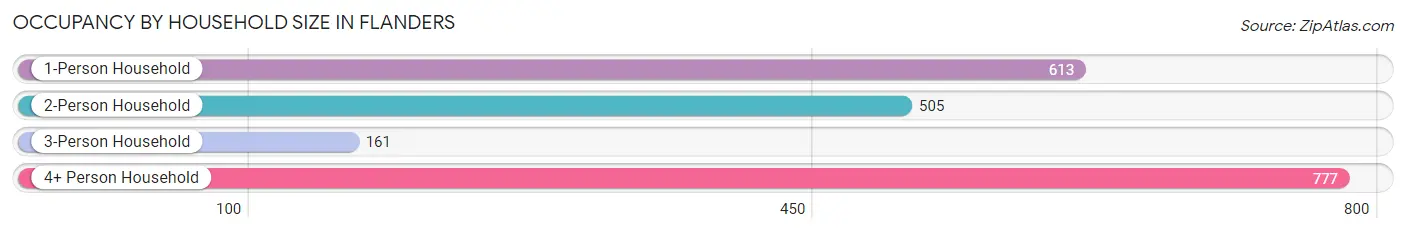
| Household Size | # Housing Units | % Housing Units |
| 1-Person Household | 613 | 29.8% |
| 2-Person Household | 505 | 24.6% |
| 3-Person Household | 161 | 7.8% |
| 4+ Person Household | 777 | 37.8% |
| Total Housing Units | 2,056 | 100.0% |
Occupancy by Ownership by Household Size in Flanders
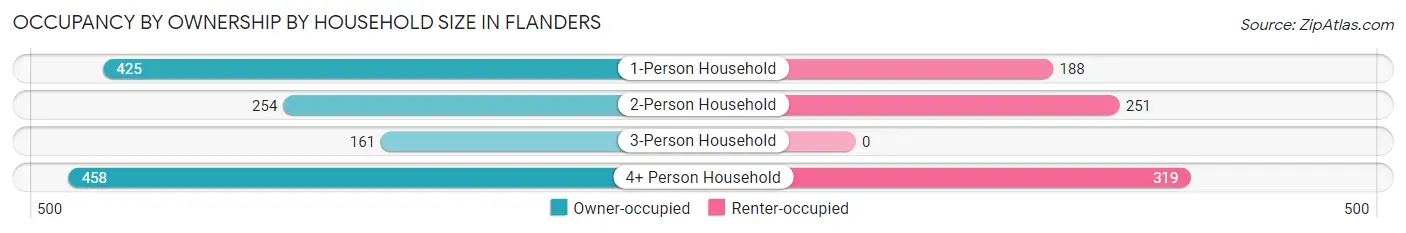
| Household Size | Owner-occupied | Renter-occupied |
| 1-Person Household | 425 (69.3%) | 188 (30.7%) |
| 2-Person Household | 254 (50.3%) | 251 (49.7%) |
| 3-Person Household | 161 (100.0%) | 0 (0.0%) |
| 4+ Person Household | 458 (58.9%) | 319 (41.1%) |
| Total Housing Units | 1,298 (63.1%) | 758 (36.9%) |
Occupancy by Educational Attainment in Flanders
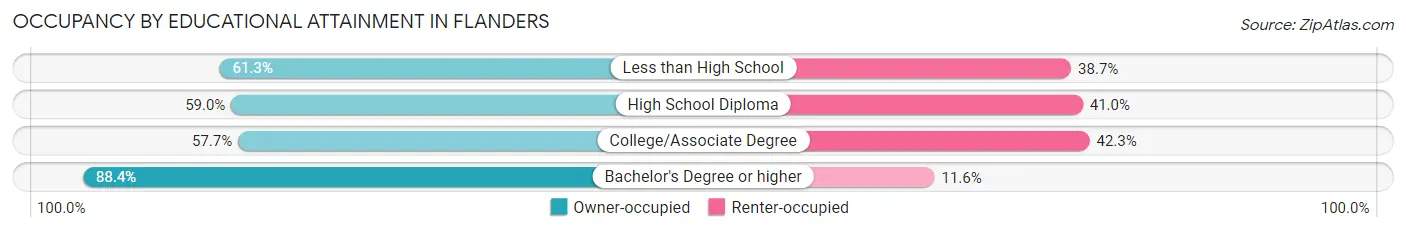
| Household Size | Owner-occupied | Renter-occupied |
| Less than High School | 330 (61.3%) | 208 (38.7%) |
| High School Diploma | 431 (59.0%) | 299 (41.0%) |
| College/Associate Degree | 300 (57.7%) | 220 (42.3%) |
| Bachelor's Degree or higher | 237 (88.4%) | 31 (11.6%) |
Occupancy by Age of Householder in Flanders
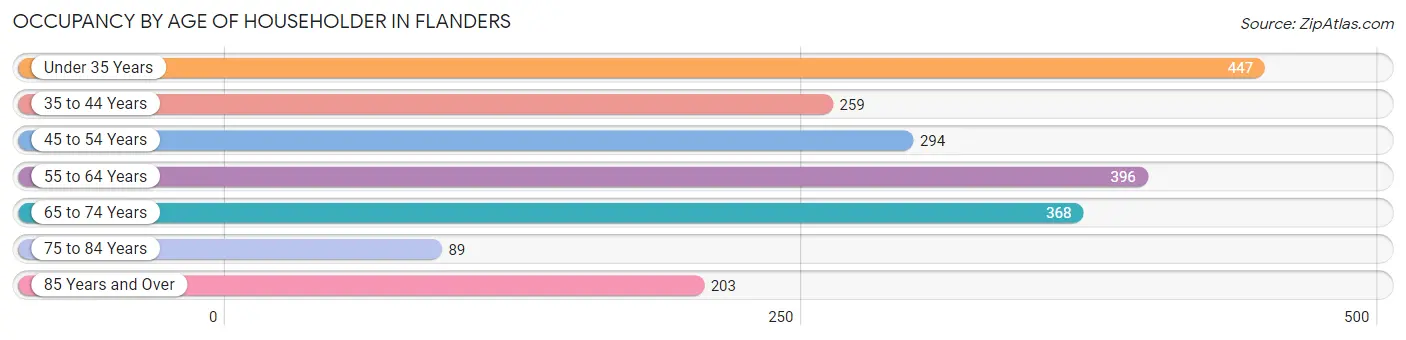
| Age Bracket | # Households | % Households |
| Under 35 Years | 447 | 21.7% |
| 35 to 44 Years | 259 | 12.6% |
| 45 to 54 Years | 294 | 14.3% |
| 55 to 64 Years | 396 | 19.3% |
| 65 to 74 Years | 368 | 17.9% |
| 75 to 84 Years | 89 | 4.3% |
| 85 Years and Over | 203 | 9.9% |
| Total | 2,056 | 100.0% |
Housing Finances in Flanders
Median Income by Occupancy in Flanders
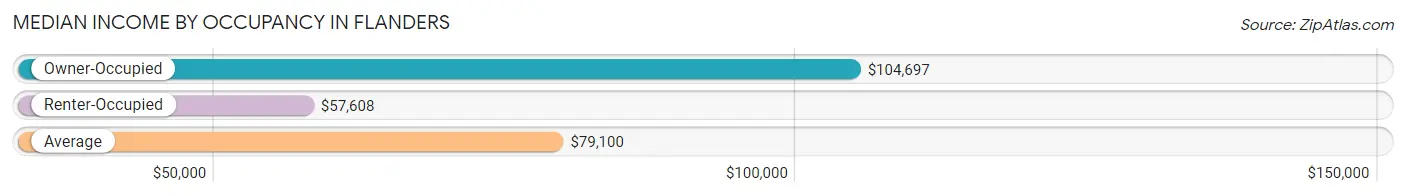
| Occupancy Type | # Households | Median Income |
| Owner-Occupied | 1,298 (63.1%) | $104,697 |
| Renter-Occupied | 758 (36.9%) | $57,608 |
| Average | 2,056 (100.0%) | $79,100 |
Occupancy by Householder Income Bracket in Flanders
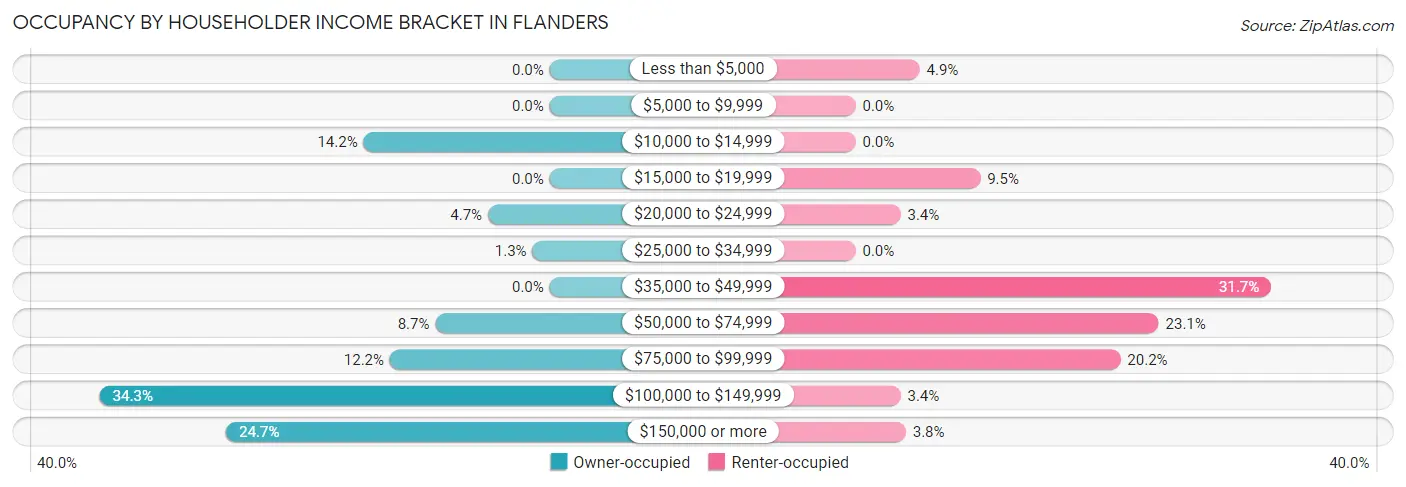
| Income Bracket | Owner-occupied | Renter-occupied |
| Less than $5,000 | 0 (0.0%) | 37 (4.9%) |
| $5,000 to $9,999 | 0 (0.0%) | 0 (0.0%) |
| $10,000 to $14,999 | 184 (14.2%) | 0 (0.0%) |
| $15,000 to $19,999 | 0 (0.0%) | 72 (9.5%) |
| $20,000 to $24,999 | 61 (4.7%) | 26 (3.4%) |
| $25,000 to $34,999 | 17 (1.3%) | 0 (0.0%) |
| $35,000 to $49,999 | 0 (0.0%) | 240 (31.7%) |
| $50,000 to $74,999 | 113 (8.7%) | 175 (23.1%) |
| $75,000 to $99,999 | 158 (12.2%) | 153 (20.2%) |
| $100,000 to $149,999 | 445 (34.3%) | 26 (3.4%) |
| $150,000 or more | 320 (24.6%) | 29 (3.8%) |
| Total | 1,298 (100.0%) | 758 (100.0%) |
Monthly Housing Cost Tiers in Flanders
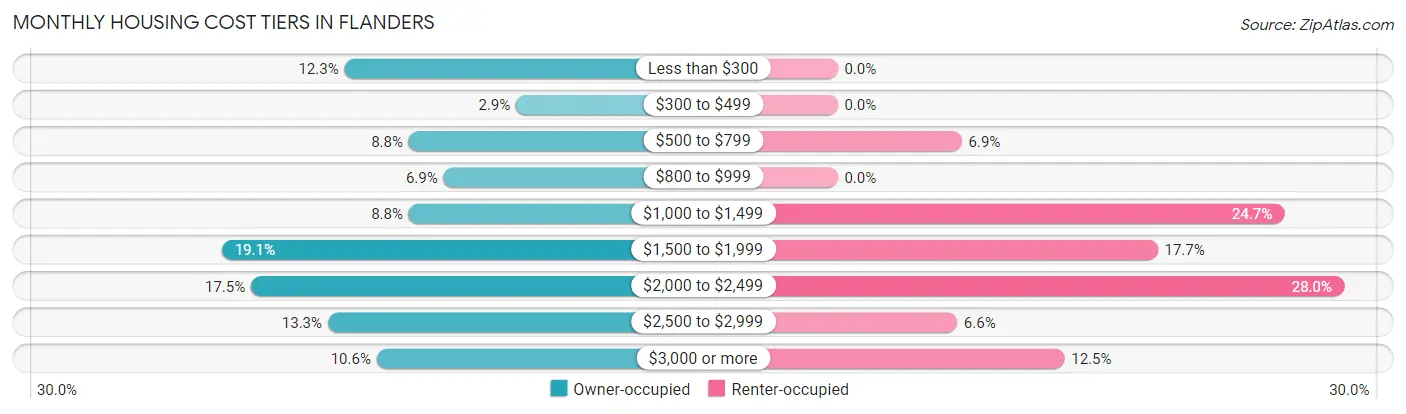
| Monthly Cost | Owner-occupied | Renter-occupied |
| Less than $300 | 160 (12.3%) | 0 (0.0%) |
| $300 to $499 | 37 (2.9%) | 0 (0.0%) |
| $500 to $799 | 114 (8.8%) | 52 (6.9%) |
| $800 to $999 | 89 (6.9%) | 0 (0.0%) |
| $1,000 to $1,499 | 114 (8.8%) | 187 (24.7%) |
| $1,500 to $1,999 | 248 (19.1%) | 134 (17.7%) |
| $2,000 to $2,499 | 227 (17.5%) | 212 (28.0%) |
| $2,500 to $2,999 | 172 (13.3%) | 50 (6.6%) |
| $3,000 or more | 137 (10.5%) | 95 (12.5%) |
| Total | 1,298 (100.0%) | 758 (100.0%) |
Physical Housing Characteristics in Flanders
Housing Structures in Flanders
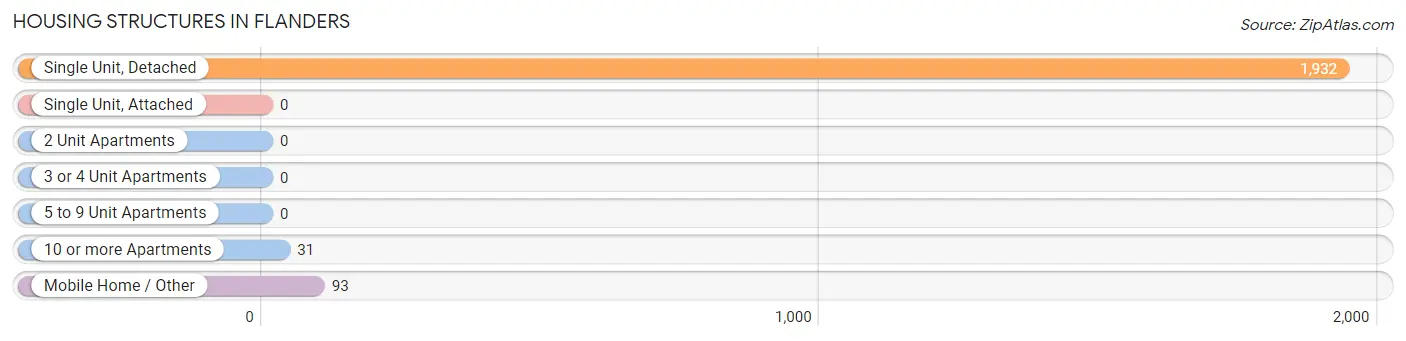
| Structure Type | # Housing Units | % Housing Units |
| Single Unit, Detached | 1,932 | 94.0% |
| Single Unit, Attached | 0 | 0.0% |
| 2 Unit Apartments | 0 | 0.0% |
| 3 or 4 Unit Apartments | 0 | 0.0% |
| 5 to 9 Unit Apartments | 0 | 0.0% |
| 10 or more Apartments | 31 | 1.5% |
| Mobile Home / Other | 93 | 4.5% |
| Total | 2,056 | 100.0% |
Housing Structures by Occupancy in Flanders
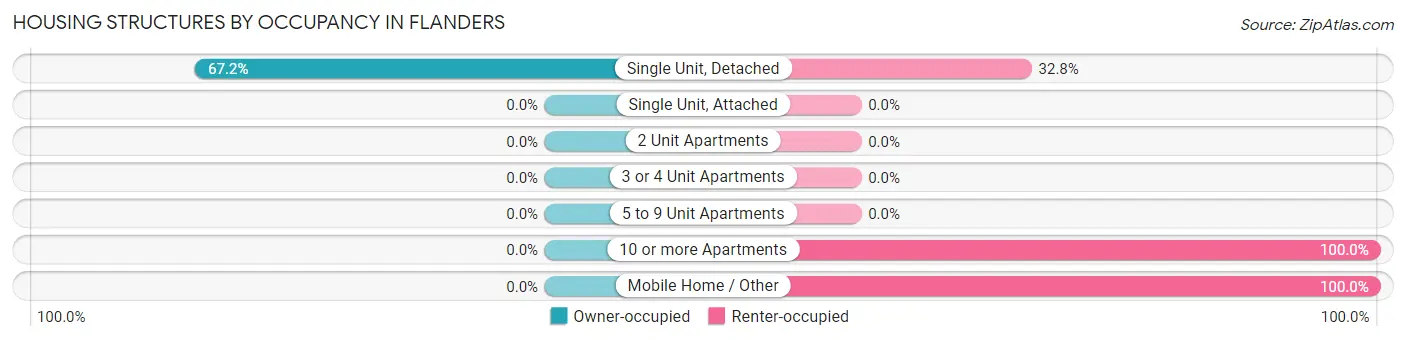
| Structure Type | Owner-occupied | Renter-occupied |
| Single Unit, Detached | 1,298 (67.2%) | 634 (32.8%) |
| Single Unit, Attached | 0 (0.0%) | 0 (0.0%) |
| 2 Unit Apartments | 0 (0.0%) | 0 (0.0%) |
| 3 or 4 Unit Apartments | 0 (0.0%) | 0 (0.0%) |
| 5 to 9 Unit Apartments | 0 (0.0%) | 0 (0.0%) |
| 10 or more Apartments | 0 (0.0%) | 31 (100.0%) |
| Mobile Home / Other | 0 (0.0%) | 93 (100.0%) |
| Total | 1,298 (63.1%) | 758 (36.9%) |
Housing Structures by Number of Rooms in Flanders
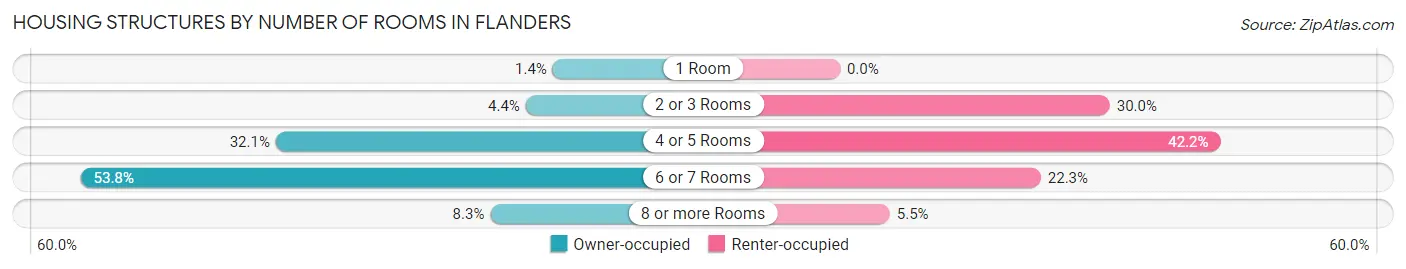
| Number of Rooms | Owner-occupied | Renter-occupied |
| 1 Room | 18 (1.4%) | 0 (0.0%) |
| 2 or 3 Rooms | 57 (4.4%) | 227 (29.9%) |
| 4 or 5 Rooms | 417 (32.1%) | 320 (42.2%) |
| 6 or 7 Rooms | 698 (53.8%) | 169 (22.3%) |
| 8 or more Rooms | 108 (8.3%) | 42 (5.5%) |
| Total | 1,298 (100.0%) | 758 (100.0%) |
Housing Structure by Heating Type in Flanders
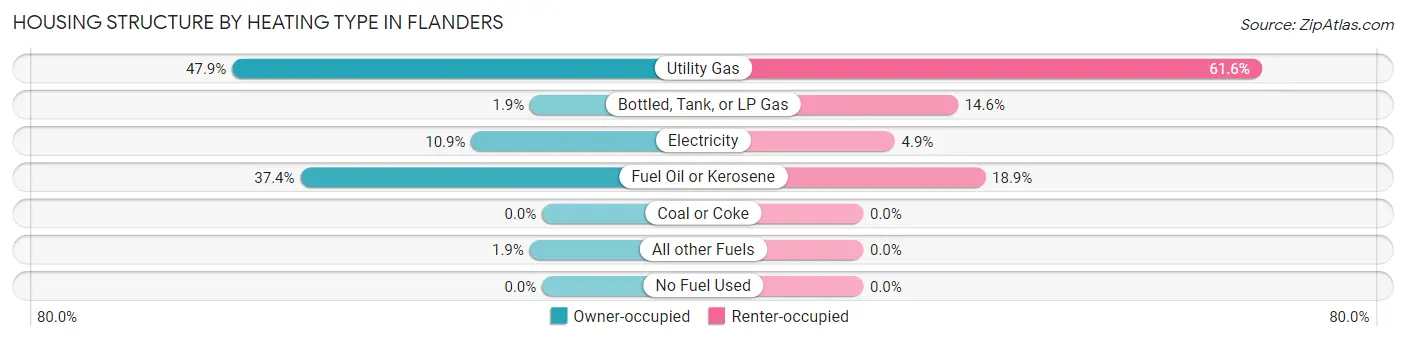
| Heating Type | Owner-occupied | Renter-occupied |
| Utility Gas | 622 (47.9%) | 467 (61.6%) |
| Bottled, Tank, or LP Gas | 24 (1.8%) | 111 (14.6%) |
| Electricity | 142 (10.9%) | 37 (4.9%) |
| Fuel Oil or Kerosene | 485 (37.4%) | 143 (18.9%) |
| Coal or Coke | 0 (0.0%) | 0 (0.0%) |
| All other Fuels | 25 (1.9%) | 0 (0.0%) |
| No Fuel Used | 0 (0.0%) | 0 (0.0%) |
| Total | 1,298 (100.0%) | 758 (100.0%) |
Household Vehicle Usage in Flanders
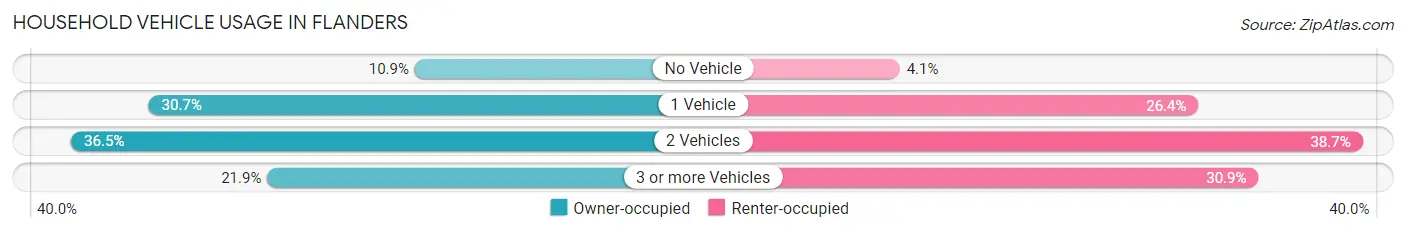
| Vehicles per Household | Owner-occupied | Renter-occupied |
| No Vehicle | 141 (10.9%) | 31 (4.1%) |
| 1 Vehicle | 399 (30.7%) | 200 (26.4%) |
| 2 Vehicles | 474 (36.5%) | 293 (38.7%) |
| 3 or more Vehicles | 284 (21.9%) | 234 (30.9%) |
| Total | 1,298 (100.0%) | 758 (100.0%) |
Real Estate & Mortgages in Flanders
Real Estate and Mortgage Overview in Flanders
| Characteristic | Without Mortgage | With Mortgage |
| Housing Units | 473 | 825 |
| Median Property Value | $386,000 | $369,000 |
| Median Household Income | - | - |
| Monthly Housing Costs | $735 | $137 |
| Real Estate Taxes | - | - |
Property Value by Mortgage Status in Flanders
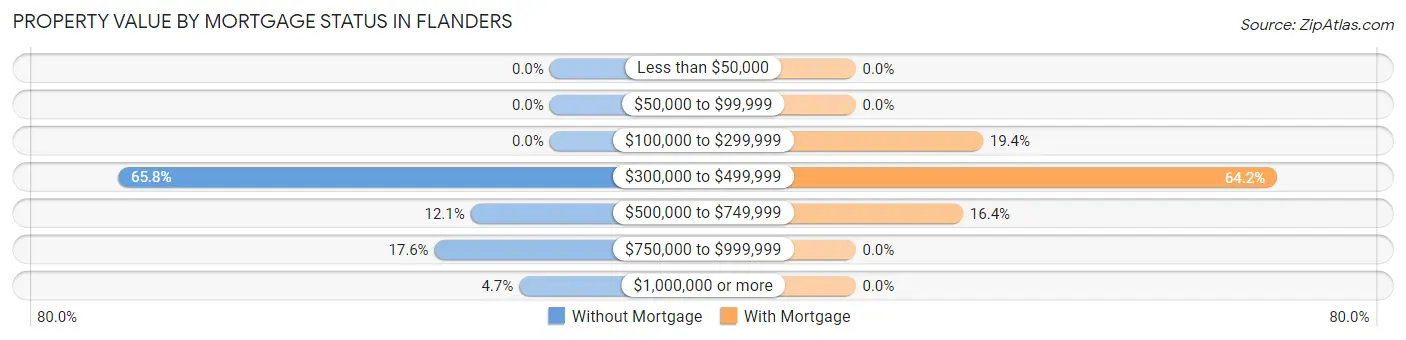
| Property Value | Without Mortgage | With Mortgage |
| Less than $50,000 | 0 (0.0%) | 0 (0.0%) |
| $50,000 to $99,999 | 0 (0.0%) | 0 (0.0%) |
| $100,000 to $299,999 | 0 (0.0%) | 160 (19.4%) |
| $300,000 to $499,999 | 311 (65.7%) | 530 (64.2%) |
| $500,000 to $749,999 | 57 (12.0%) | 135 (16.4%) |
| $750,000 to $999,999 | 83 (17.5%) | 0 (0.0%) |
| $1,000,000 or more | 22 (4.6%) | 0 (0.0%) |
| Total | 473 (100.0%) | 825 (100.0%) |
Household Income by Mortgage Status in Flanders
| Household Income | Without Mortgage | With Mortgage |
| Less than $10,000 | 0 (0.0%) | 0 (0.0%) |
| $10,000 to $24,999 | 203 (42.9%) | 0 (0.0%) |
| $25,000 to $34,999 | 17 (3.6%) | 42 (5.1%) |
| $35,000 to $49,999 | 0 (0.0%) | 0 (0.0%) |
| $50,000 to $74,999 | 19 (4.0%) | 0 (0.0%) |
| $75,000 to $99,999 | 18 (3.8%) | 94 (11.4%) |
| $100,000 to $149,999 | 73 (15.4%) | 140 (17.0%) |
| $150,000 or more | 143 (30.2%) | 372 (45.1%) |
| Total | 473 (100.0%) | 825 (100.0%) |
Property Value to Household Income Ratio in Flanders
| Value-to-Income Ratio | Without Mortgage | With Mortgage |
| Less than 2.0x | 20 (4.2%) | 110,750 (13,424.2%) |
| 2.0x to 2.9x | 56 (11.8%) | 100 (12.1%) |
| 3.0x to 3.9x | 80 (16.9%) | 244 (29.6%) |
| 4.0x or more | 317 (67.0%) | 214 (25.9%) |
| Total | 473 (100.0%) | 825 (100.0%) |
Real Estate Taxes by Mortgage Status in Flanders
| Property Taxes | Without Mortgage | With Mortgage |
| Less than $800 | 177 (37.4%) | 0 (0.0%) |
| $800 to $1,499 | 20 (4.2%) | 0 (0.0%) |
| $800 to $1,499 | 276 (58.4%) | 55 (6.7%) |
| Total | 473 (100.0%) | 825 (100.0%) |
Health & Disability in Flanders
Health Insurance Coverage by Age in Flanders
| Age Bracket | With Coverage | Without Coverage |
| Under 6 Years | 1,102 (100.0%) | 0 (0.0%) |
| 6 to 18 Years | 673 (100.0%) | 0 (0.0%) |
| 19 to 25 Years | 496 (67.0%) | 244 (33.0%) |
| 26 to 34 Years | 681 (71.1%) | 277 (28.9%) |
| 35 to 44 Years | 580 (78.0%) | 164 (22.0%) |
| 45 to 54 Years | 284 (58.8%) | 199 (41.2%) |
| 55 to 64 Years | 668 (98.0%) | 14 (2.1%) |
| 65 to 74 Years | 678 (100.0%) | 0 (0.0%) |
| 75 Years and older | 351 (100.0%) | 0 (0.0%) |
| Total | 5,513 (86.0%) | 898 (14.0%) |
Health Insurance Coverage by Citizenship Status in Flanders
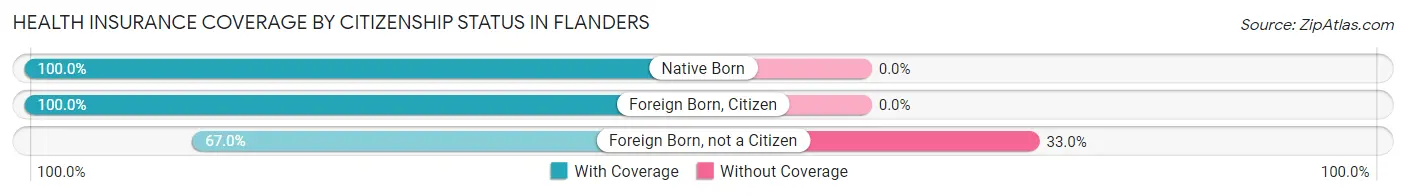
| Citizenship Status | With Coverage | Without Coverage |
| Native Born | 1,102 (100.0%) | 0 (0.0%) |
| Foreign Born, Citizen | 673 (100.0%) | 0 (0.0%) |
| Foreign Born, not a Citizen | 496 (67.0%) | 244 (33.0%) |
Health Insurance Coverage by Household Income in Flanders
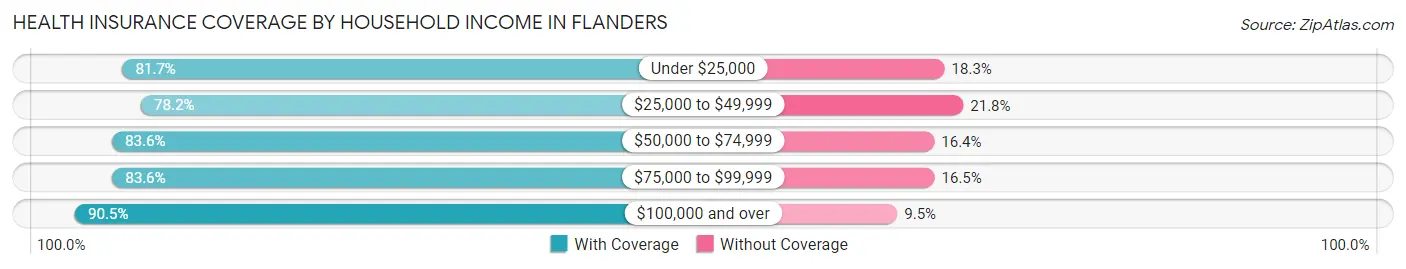
| Household Income | With Coverage | Without Coverage |
| Under $25,000 | 579 (81.7%) | 130 (18.3%) |
| $25,000 to $49,999 | 458 (78.2%) | 128 (21.8%) |
| $50,000 to $74,999 | 1,131 (83.6%) | 222 (16.4%) |
| $75,000 to $99,999 | 782 (83.6%) | 154 (16.5%) |
| $100,000 and over | 2,524 (90.5%) | 264 (9.5%) |
Public vs Private Health Insurance Coverage by Age in Flanders
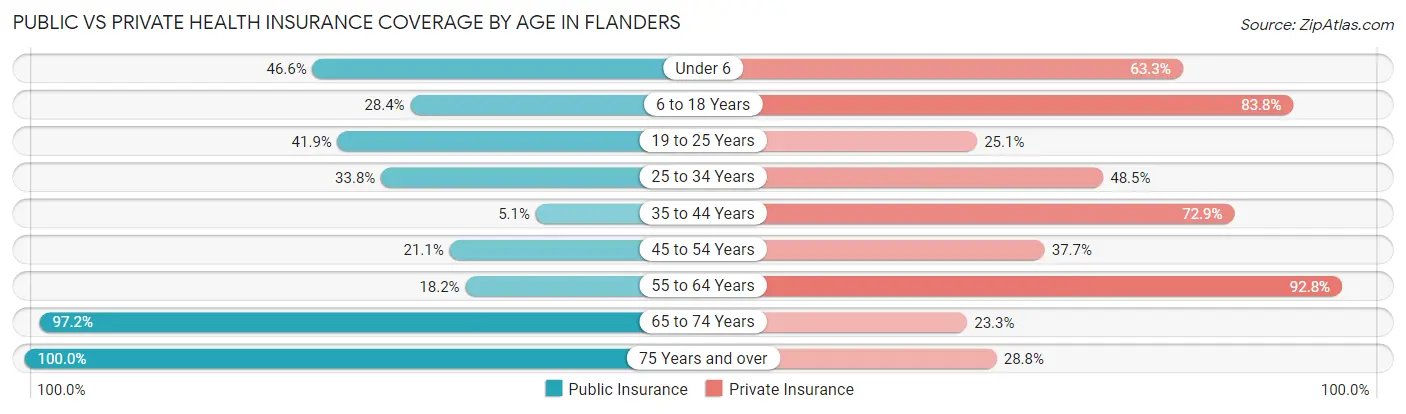
| Age Bracket | Public Insurance | Private Insurance |
| Under 6 | 513 (46.6%) | 697 (63.2%) |
| 6 to 18 Years | 191 (28.4%) | 564 (83.8%) |
| 19 to 25 Years | 310 (41.9%) | 186 (25.1%) |
| 25 to 34 Years | 324 (33.8%) | 465 (48.5%) |
| 35 to 44 Years | 38 (5.1%) | 542 (72.9%) |
| 45 to 54 Years | 102 (21.1%) | 182 (37.7%) |
| 55 to 64 Years | 124 (18.2%) | 633 (92.8%) |
| 65 to 74 Years | 659 (97.2%) | 158 (23.3%) |
| 75 Years and over | 351 (100.0%) | 101 (28.8%) |
| Total | 2,612 (40.7%) | 3,528 (55.0%) |
Disability Status by Sex by Age in Flanders
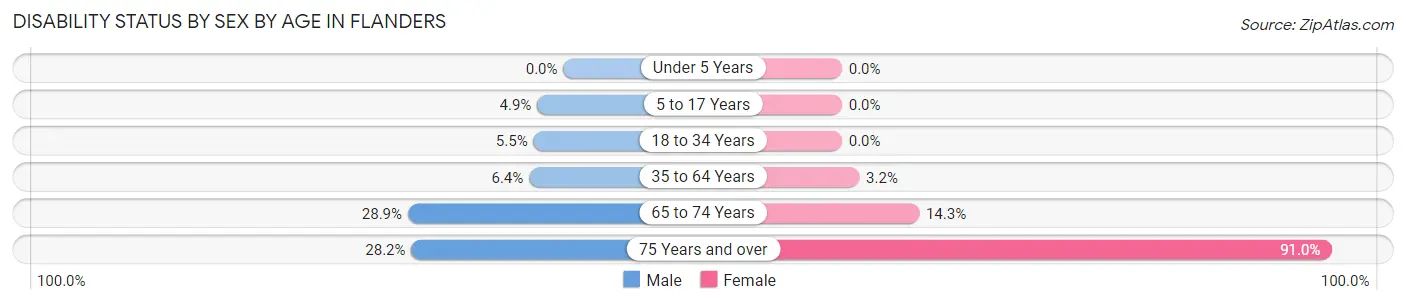
| Age Bracket | Male | Female |
| Under 5 Years | 0 (0.0%) | 0 (0.0%) |
| 5 to 17 Years | 34 (4.9%) | 0 (0.0%) |
| 18 to 34 Years | 47 (5.5%) | 0 (0.0%) |
| 35 to 64 Years | 68 (6.4%) | 27 (3.2%) |
| 65 to 74 Years | 99 (28.9%) | 48 (14.3%) |
| 75 Years and over | 77 (28.2%) | 71 (91.0%) |
Disability Class by Sex by Age in Flanders
Disability Class: Hearing Difficulty
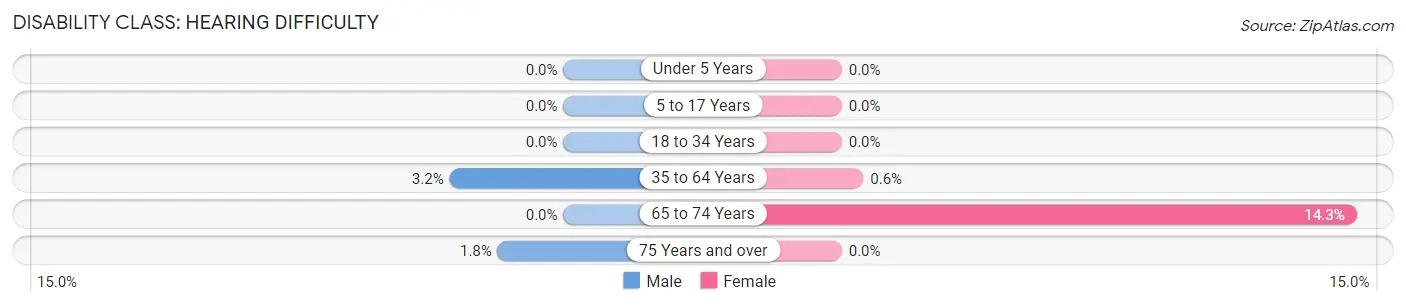
| Age Bracket | Male | Female |
| Under 5 Years | 0 (0.0%) | 0 (0.0%) |
| 5 to 17 Years | 0 (0.0%) | 0 (0.0%) |
| 18 to 34 Years | 0 (0.0%) | 0 (0.0%) |
| 35 to 64 Years | 34 (3.2%) | 5 (0.6%) |
| 65 to 74 Years | 0 (0.0%) | 48 (14.3%) |
| 75 Years and over | 5 (1.8%) | 0 (0.0%) |
Disability Class: Vision Difficulty
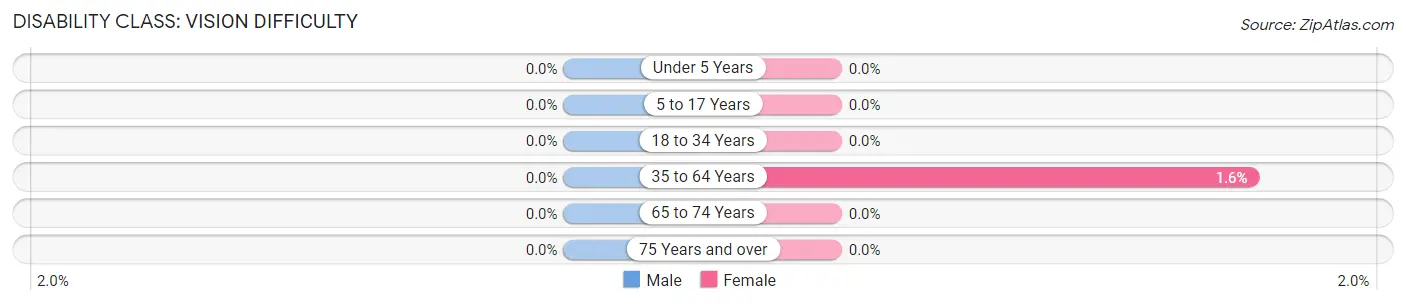
| Age Bracket | Male | Female |
| Under 5 Years | 0 (0.0%) | 0 (0.0%) |
| 5 to 17 Years | 0 (0.0%) | 0 (0.0%) |
| 18 to 34 Years | 0 (0.0%) | 0 (0.0%) |
| 35 to 64 Years | 0 (0.0%) | 13 (1.5%) |
| 65 to 74 Years | 0 (0.0%) | 0 (0.0%) |
| 75 Years and over | 0 (0.0%) | 0 (0.0%) |
Disability Class: Cognitive Difficulty
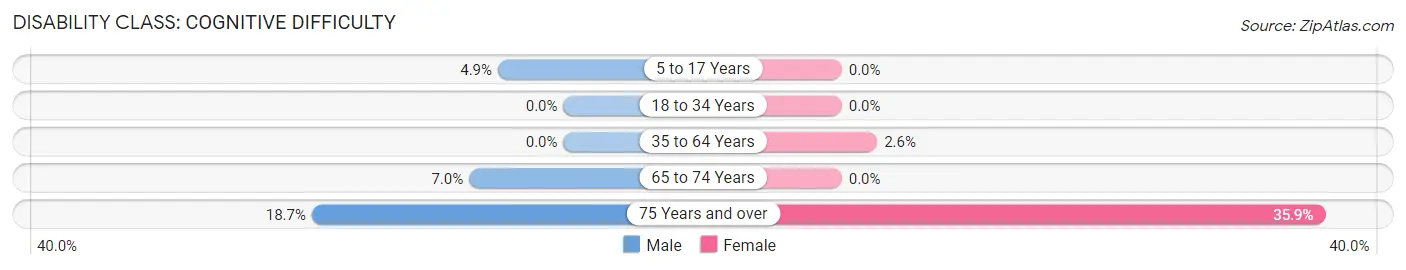
| Age Bracket | Male | Female |
| 5 to 17 Years | 34 (4.9%) | 0 (0.0%) |
| 18 to 34 Years | 0 (0.0%) | 0 (0.0%) |
| 35 to 64 Years | 0 (0.0%) | 22 (2.6%) |
| 65 to 74 Years | 24 (7.0%) | 0 (0.0%) |
| 75 Years and over | 51 (18.7%) | 28 (35.9%) |
Disability Class: Ambulatory Difficulty
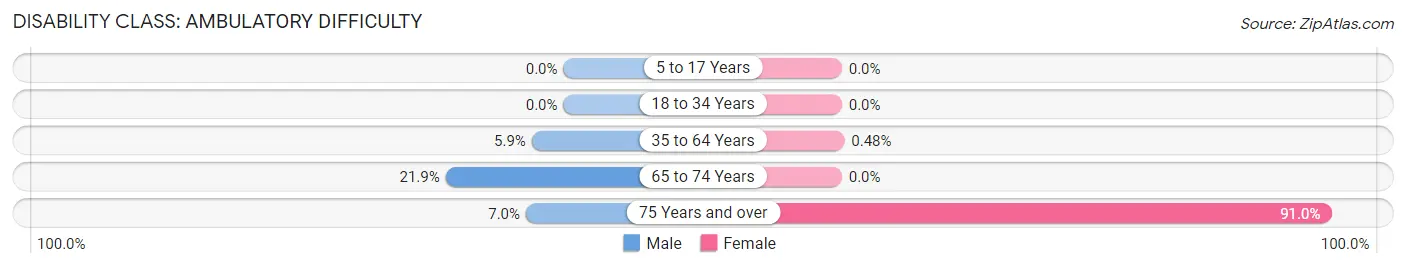
| Age Bracket | Male | Female |
| 5 to 17 Years | 0 (0.0%) | 0 (0.0%) |
| 18 to 34 Years | 0 (0.0%) | 0 (0.0%) |
| 35 to 64 Years | 63 (5.9%) | 4 (0.5%) |
| 65 to 74 Years | 75 (21.9%) | 0 (0.0%) |
| 75 Years and over | 19 (7.0%) | 71 (91.0%) |
Disability Class: Self-Care Difficulty
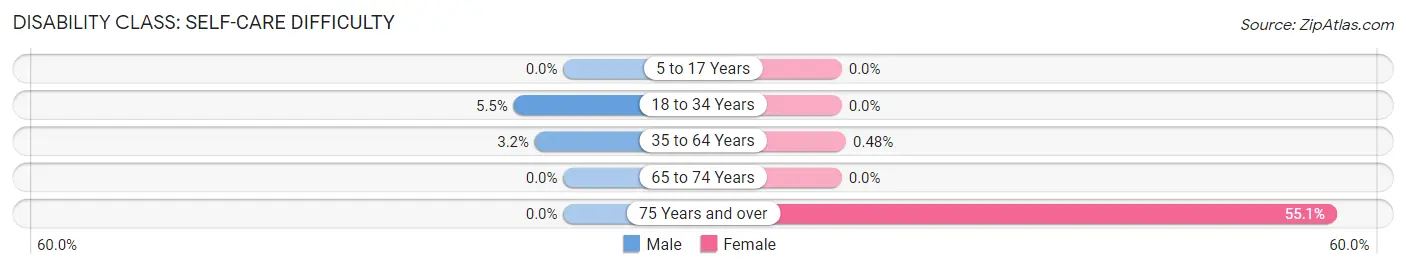
| Age Bracket | Male | Female |
| 5 to 17 Years | 0 (0.0%) | 0 (0.0%) |
| 18 to 34 Years | 47 (5.5%) | 0 (0.0%) |
| 35 to 64 Years | 34 (3.2%) | 4 (0.5%) |
| 65 to 74 Years | 0 (0.0%) | 0 (0.0%) |
| 75 Years and over | 0 (0.0%) | 43 (55.1%) |
Technology Access in Flanders
Computing Device Access in Flanders
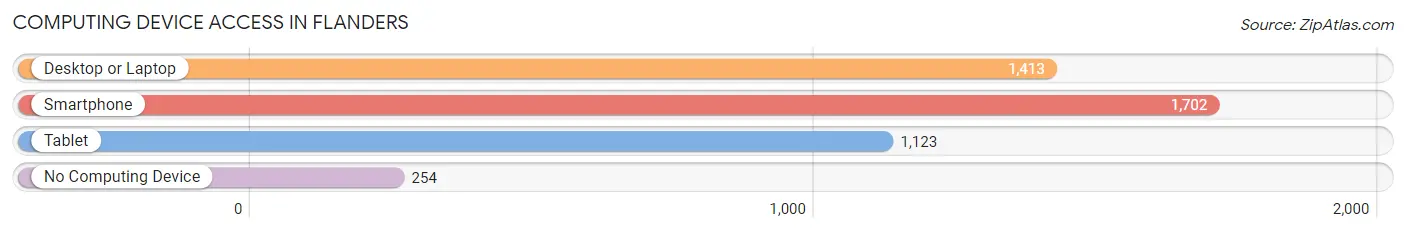
| Device Type | # Households | % Households |
| Desktop or Laptop | 1,413 | 68.7% |
| Smartphone | 1,702 | 82.8% |
| Tablet | 1,123 | 54.6% |
| No Computing Device | 254 | 12.3% |
| Total | 2,056 | 100.0% |
Internet Access in Flanders
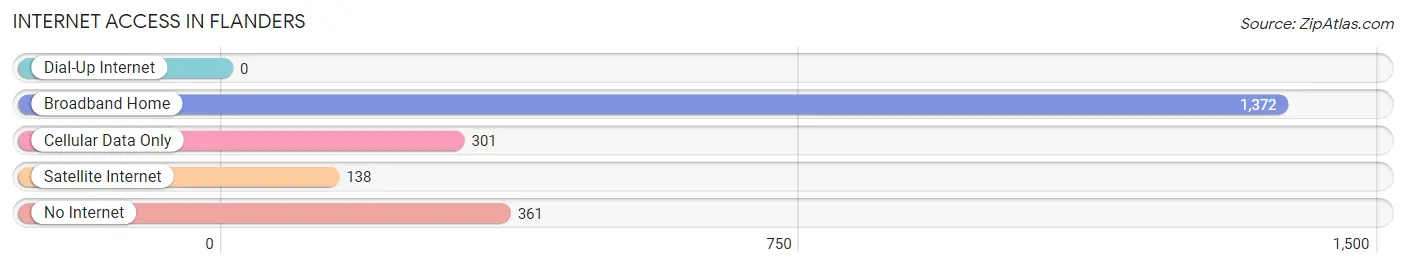
| Internet Type | # Households | % Households |
| Dial-Up Internet | 0 | 0.0% |
| Broadband Home | 1,372 | 66.7% |
| Cellular Data Only | 301 | 14.6% |
| Satellite Internet | 138 | 6.7% |
| No Internet | 361 | 17.6% |
| Total | 2,056 | 100.0% |
Flanders Summary
Flanders, New York is a hamlet located in the Town of Southampton in Suffolk County, New York. It is located on the South Fork of Long Island, approximately 90 miles east of New York City. Flanders is a small, rural community with a population of approximately 2,000 people.
History
Flanders was first settled in the late 1600s by English settlers. The area was originally known as “Flanders Fields” due to its resemblance to the flat, open fields of Flanders, Belgium. The area was primarily used for farming and fishing, and the first post office was established in 1845.
In the late 1800s, Flanders began to develop into a small resort community. The area was popular with wealthy New Yorkers who built large summer homes in the area. The area was also popular with artists and writers, who were drawn to the area’s natural beauty.
In the early 1900s, Flanders began to develop into a more permanent community. The area was home to a number of small businesses, including a general store, a blacksmith, and a post office. The area also had a number of churches, including the Flanders Methodist Church, which was established in 1891.
Geography
Flanders is located on the South Fork of Long Island, approximately 90 miles east of New York City. The area is bordered by the Shinnecock Bay to the north, the Peconic Bay to the east, and the Atlantic Ocean to the south. The area is mostly flat, with some rolling hills. The area is known for its natural beauty, with a number of parks and nature preserves in the area.
Economy
Flanders is a small, rural community with a primarily agricultural economy. The area is home to a number of farms, including vegetable farms, dairy farms, and horse farms. The area is also home to a number of small businesses, including restaurants, retail stores, and service businesses.
Demographics
As of the 2010 census, the population of Flanders was 2,000 people. The population is primarily white (90%), with a small percentage of African Americans (4%) and Hispanics (3%). The median household income is $50,000, and the median home value is $250,000. The area is primarily residential, with a small number of businesses.
Flanders is a small, rural community with a rich history and a strong sense of community. The area is known for its natural beauty and its agricultural economy. The area is home to a diverse population, with a mix of races and ethnicities. The area is a popular destination for tourists, who come to enjoy the area’s natural beauty and its small-town charm.
Common Questions
What is Per Capita Income in Flanders?
Per Capita income in Flanders is $29,613.
What is the Median Family Income in Flanders?
Median Family Income in Flanders is $98,545.
What is the Median Household income in Flanders?
Median Household Income in Flanders is $79,100.
What is Income or Wage Gap in Flanders?
Income or Wage Gap in Flanders is 45.2%.
Women in Flanders earn 54.8 cents for every dollar earned by a man.
What is Inequality or Gini Index in Flanders?
Inequality or Gini Index in Flanders is 0.38.
What is the Total Population of Flanders?
Total Population of Flanders is 6,411.
What is the Total Male Population of Flanders?
Total Male Population of Flanders is 3,524.
What is the Total Female Population of Flanders?
Total Female Population of Flanders is 2,887.
What is the Ratio of Males per 100 Females in Flanders?
There are 122.06 Males per 100 Females in Flanders.
What is the Ratio of Females per 100 Males in Flanders?
There are 81.92 Females per 100 Males in Flanders.
What is the Median Population Age in Flanders?
Median Population Age in Flanders is 32.3 Years.
What is the Average Family Size in Flanders
Average Family Size in Flanders is 3.8 People.
What is the Average Household Size in Flanders
Average Household Size in Flanders is 3.1 People.
How Large is the Labor Force in Flanders?
There are 3,161 People in the Labor Forcein in Flanders.
What is the Percentage of People in the Labor Force in Flanders?
66.4% of People are in the Labor Force in Flanders.
What is the Unemployment Rate in Flanders?
Unemployment Rate in Flanders is 2.6%.