Fort Montgomery, NY Map & Demographics
Fort Montgomery Map
Fort Montgomery Overview
$48,025
PER CAPITA INCOME
$145,978
AVG FAMILY INCOME
$86,293
AVG HOUSEHOLD INCOME
16.4%
WAGE / INCOME GAP [ % ]
83.6¢/ $1
WAGE / INCOME GAP [ $ ]
0.41
INEQUALITY / GINI INDEX
2,453
TOTAL POPULATION
1,415
MALE POPULATION
1,038
FEMALE POPULATION
136.32
MALES / 100 FEMALES
73.36
FEMALES / 100 MALES
44.5
MEDIAN AGE
3.5
AVG FAMILY SIZE
2.7
AVG HOUSEHOLD SIZE
1,477
LABOR FORCE [ PEOPLE ]
77.1%
PERCENT IN LABOR FORCE
3.8%
UNEMPLOYMENT RATE
Fort Montgomery Zip Codes
Fort Montgomery Area Codes
Income in Fort Montgomery
Income Overview in Fort Montgomery
Per Capita Income in Fort Montgomery is $48,025, while median incomes of families and households are $145,978 and $86,293 respectively.
| Characteristic | Number | Measure |
| Per Capita Income | 2,453 | $48,025 |
| Median Family Income | 580 | $145,978 |
| Mean Family Income | 580 | $160,003 |
| Median Household Income | 910 | $86,293 |
| Mean Household Income | 910 | $125,737 |
| Income Deficit | 580 | $0 |
| Wage / Income Gap (%) | 2,453 | 16.40% |
| Wage / Income Gap ($) | 2,453 | 83.60¢ per $1 |
| Gini / Inequality Index | 2,453 | 0.41 |
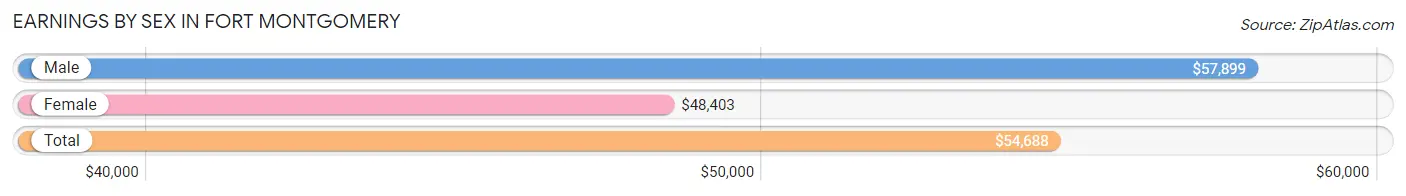
Earnings by Sex in Fort Montgomery
Average Earnings in Fort Montgomery are $54,688, $57,899 for men and $48,403 for women, a difference of 16.4%.
| Sex | Number | Average Earnings |
| Male | 931 (63.2%) | $57,899 |
| Female | 541 (36.7%) | $48,403 |
| Total | 1,472 (100.0%) | $54,688 |
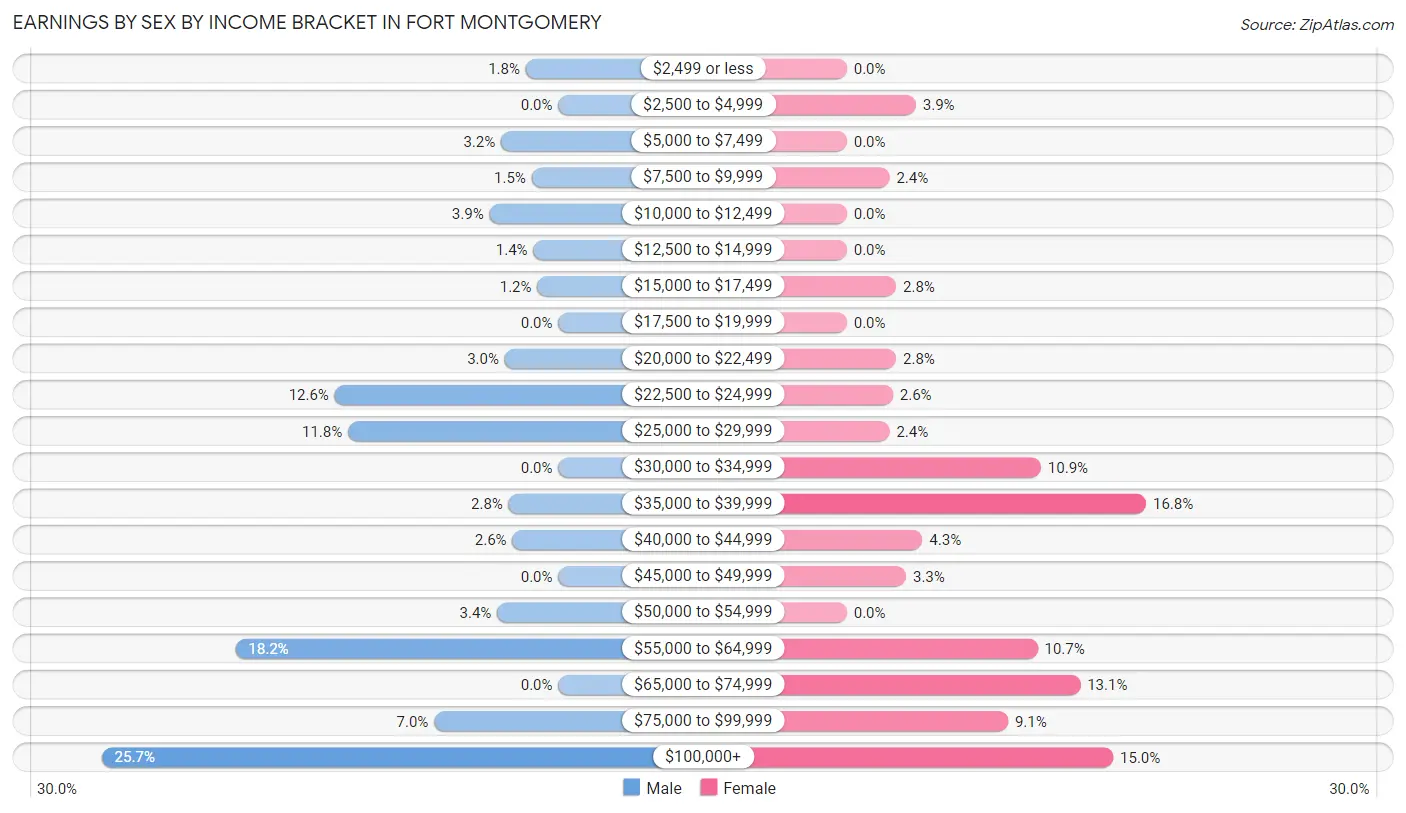
Earnings by Sex by Income Bracket in Fort Montgomery
The most common earnings brackets in Fort Montgomery are $100,000+ for men (239 | 25.7%) and $35,000 to $39,999 for women (91 | 16.8%).
| Income | Male | Female |
| $2,499 or less | 17 (1.8%) | 0 (0.0%) |
| $2,500 to $4,999 | 0 (0.0%) | 21 (3.9%) |
| $5,000 to $7,499 | 30 (3.2%) | 0 (0.0%) |
| $7,500 to $9,999 | 14 (1.5%) | 13 (2.4%) |
| $10,000 to $12,499 | 36 (3.9%) | 0 (0.0%) |
| $12,500 to $14,999 | 13 (1.4%) | 0 (0.0%) |
| $15,000 to $17,499 | 11 (1.2%) | 15 (2.8%) |
| $17,500 to $19,999 | 0 (0.0%) | 0 (0.0%) |
| $20,000 to $22,499 | 28 (3.0%) | 15 (2.8%) |
| $22,500 to $24,999 | 117 (12.6%) | 14 (2.6%) |
| $25,000 to $29,999 | 110 (11.8%) | 13 (2.4%) |
| $30,000 to $34,999 | 0 (0.0%) | 59 (10.9%) |
| $35,000 to $39,999 | 26 (2.8%) | 91 (16.8%) |
| $40,000 to $44,999 | 24 (2.6%) | 23 (4.3%) |
| $45,000 to $49,999 | 0 (0.0%) | 18 (3.3%) |
| $50,000 to $54,999 | 32 (3.4%) | 0 (0.0%) |
| $55,000 to $64,999 | 169 (18.1%) | 58 (10.7%) |
| $65,000 to $74,999 | 0 (0.0%) | 71 (13.1%) |
| $75,000 to $99,999 | 65 (7.0%) | 49 (9.1%) |
| $100,000+ | 239 (25.7%) | 81 (15.0%) |
| Total | 931 (100.0%) | 541 (100.0%) |
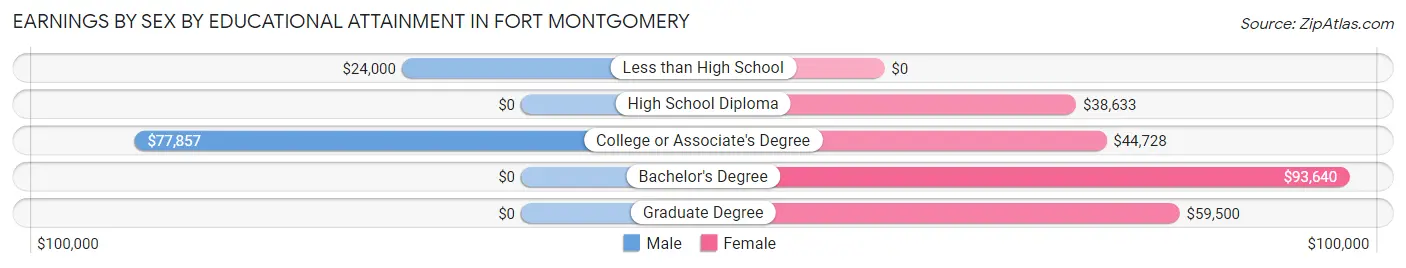
Earnings by Sex by Educational Attainment in Fort Montgomery
Average earnings in Fort Montgomery are $58,378 for men and $49,861 for women, a difference of 14.6%. Men with an educational attainment of college or associate's degree enjoy the highest average annual earnings of $77,857, while those with less than high school education earn the least with $24,000. Women with an educational attainment of bachelor's degree earn the most with the average annual earnings of $93,640, while those with high school diploma education have the smallest earnings of $38,633.
| Educational Attainment | Male Income | Female Income |
| Less than High School | $24,000 | $0 |
| High School Diploma | - | - |
| College or Associate's Degree | $77,857 | $44,728 |
| Bachelor's Degree | - | - |
| Graduate Degree | - | - |
| Total | $58,378 | $49,861 |
Family Income in Fort Montgomery
Family Income Brackets in Fort Montgomery
According to the Fort Montgomery family income data, there are 224 families falling into the $200,000+ income range, which is the most common income bracket and makes up 38.6% of all families.
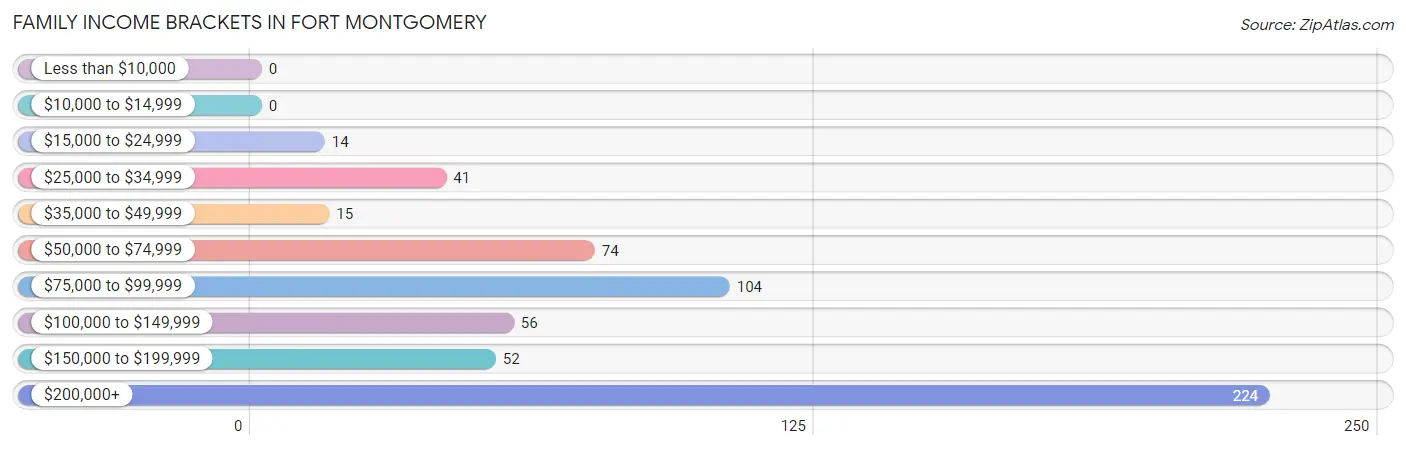
| Income Bracket | # Families | % Families |
| Less than $10,000 | 0 | 0.0% |
| $10,000 to $14,999 | 0 | 0.0% |
| $15,000 to $24,999 | 14 | 2.4% |
| $25,000 to $34,999 | 41 | 7.1% |
| $35,000 to $49,999 | 15 | 2.6% |
| $50,000 to $74,999 | 74 | 12.8% |
| $75,000 to $99,999 | 104 | 17.9% |
| $100,000 to $149,999 | 56 | 9.7% |
| $150,000 to $199,999 | 52 | 9.0% |
| $200,000+ | 224 | 38.6% |
Family Income by Famaliy Size in Fort Montgomery
3-person families (167 | 28.8%) account for the highest median family income in Fort Montgomery with $210,964 per family, while 3-person families (167 | 28.8%) have the highest median income of $70,321 per family member.
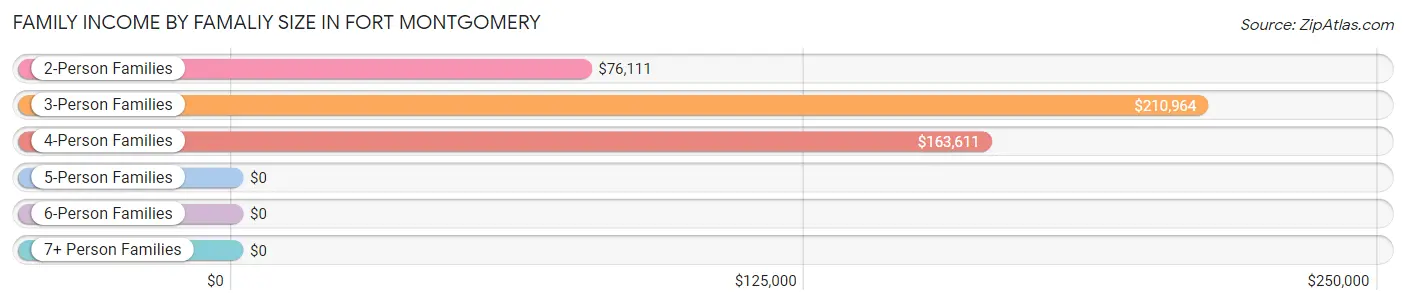
| Income Bracket | # Families | Median Income |
| 2-Person Families | 178 (30.7%) | $76,111 |
| 3-Person Families | 167 (28.8%) | $210,964 |
| 4-Person Families | 154 (26.6%) | $163,611 |
| 5-Person Families | 32 (5.5%) | $0 |
| 6-Person Families | 49 (8.5%) | $0 |
| 7+ Person Families | 0 (0.0%) | $0 |
| Total | 580 (100.0%) | $145,978 |
Family Income by Number of Earners in Fort Montgomery
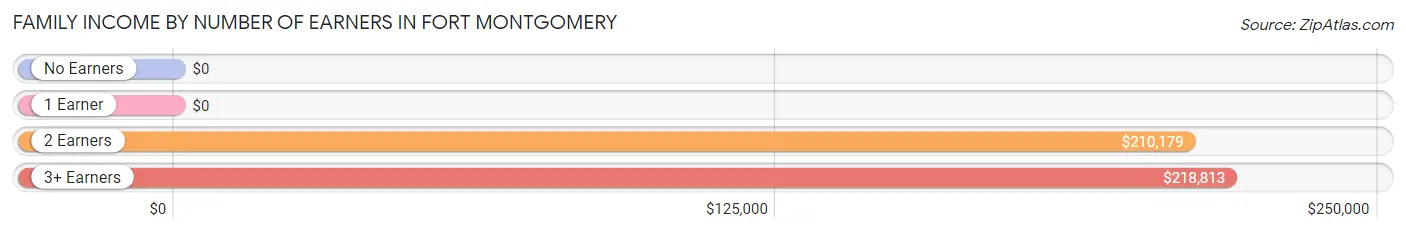
| Number of Earners | # Families | Median Income |
| No Earners | 44 (7.6%) | $0 |
| 1 Earner | 114 (19.7%) | $0 |
| 2 Earners | 311 (53.6%) | $210,179 |
| 3+ Earners | 111 (19.1%) | $218,813 |
| Total | 580 (100.0%) | $145,978 |
Household Income in Fort Montgomery
Household Income Brackets in Fort Montgomery
With 224 households falling in the category, the $200,000+ income range is the most frequent in Fort Montgomery, accounting for 24.6% of all households. In contrast, only 13 households (1.4%) fall into the $10,000 to $14,999 income bracket, making it the least populous group.
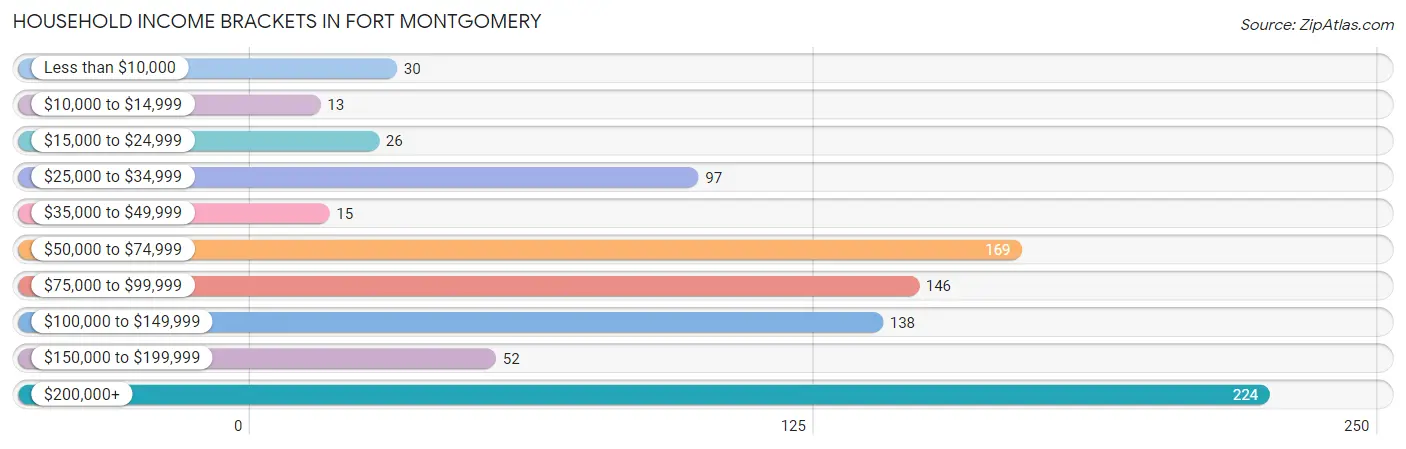
| Income Bracket | # Households | % Households |
| Less than $10,000 | 30 | 3.3% |
| $10,000 to $14,999 | 13 | 1.4% |
| $15,000 to $24,999 | 26 | 2.9% |
| $25,000 to $34,999 | 97 | 10.7% |
| $35,000 to $49,999 | 15 | 1.6% |
| $50,000 to $74,999 | 169 | 18.6% |
| $75,000 to $99,999 | 146 | 16.0% |
| $100,000 to $149,999 | 138 | 15.2% |
| $150,000 to $199,999 | 52 | 5.7% |
| $200,000+ | 224 | 24.6% |
Household Income by Householder Age in Fort Montgomery
The median household income in Fort Montgomery is $86,293, with the highest median household income of $143,947 found in the 45 to 64 years age bracket for the primary householder. A total of 382 households (42.0%) fall into this category.
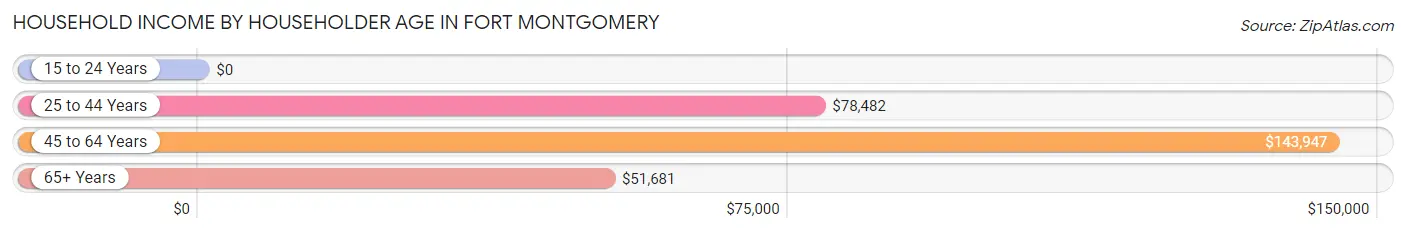
| Income Bracket | # Households | Median Income |
| 15 to 24 Years | 0 (0.0%) | $0 |
| 25 to 44 Years | 207 (22.8%) | $78,482 |
| 45 to 64 Years | 382 (42.0%) | $143,947 |
| 65+ Years | 321 (35.3%) | $51,681 |
| Total | 910 (100.0%) | $86,293 |
Poverty in Fort Montgomery
Income Below Poverty by Sex and Age in Fort Montgomery
With 4.0% poverty level for males and 4.0% for females among the residents of Fort Montgomery, 55 to 64 year old males and 75 year old and over females are the most vulnerable to poverty, with 14 males (10.8%) and 14 females (24.1%) in their respective age groups living below the poverty level.
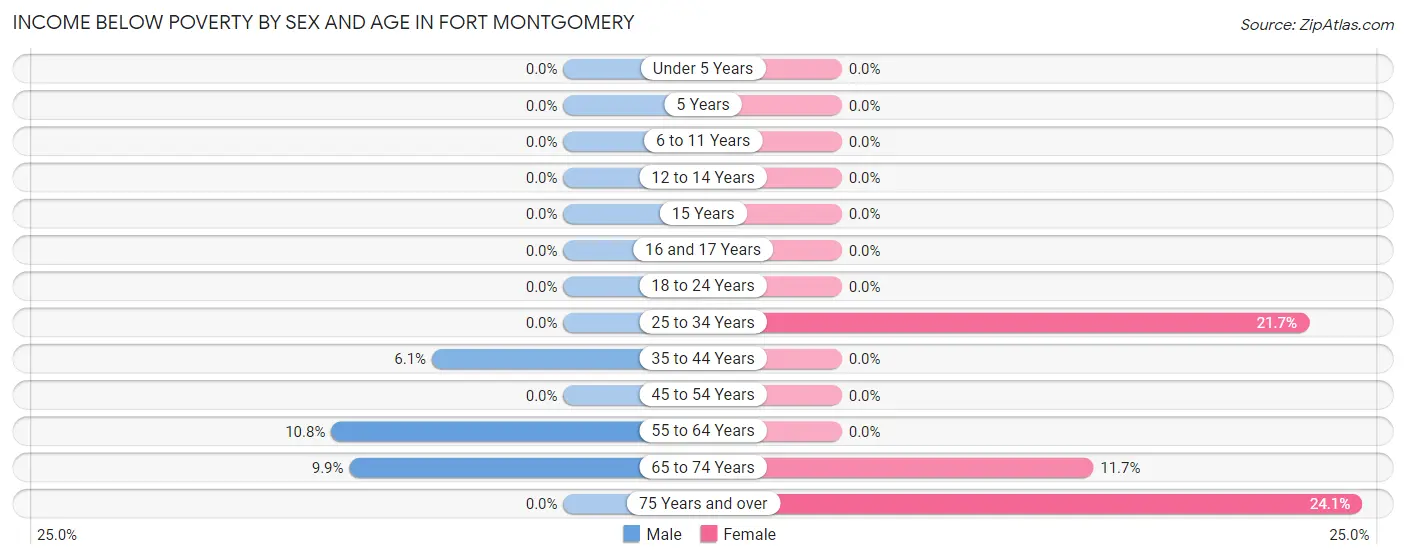
| Age Bracket | Male | Female |
| Under 5 Years | 0 (0.0%) | 0 (0.0%) |
| 5 Years | 0 (0.0%) | 0 (0.0%) |
| 6 to 11 Years | 0 (0.0%) | 0 (0.0%) |
| 12 to 14 Years | 0 (0.0%) | 0 (0.0%) |
| 15 Years | 0 (0.0%) | 0 (0.0%) |
| 16 and 17 Years | 0 (0.0%) | 0 (0.0%) |
| 18 to 24 Years | 0 (0.0%) | 0 (0.0%) |
| 25 to 34 Years | 0 (0.0%) | 13 (21.7%) |
| 35 to 44 Years | 13 (6.1%) | 0 (0.0%) |
| 45 to 54 Years | 0 (0.0%) | 0 (0.0%) |
| 55 to 64 Years | 14 (10.8%) | 0 (0.0%) |
| 65 to 74 Years | 30 (9.9%) | 14 (11.7%) |
| 75 Years and over | 0 (0.0%) | 14 (24.1%) |
| Total | 57 (4.0%) | 41 (4.0%) |
Income Above Poverty by Sex and Age in Fort Montgomery
According to the poverty statistics in Fort Montgomery, males aged under 5 years and females aged under 5 years are the age groups that are most secure financially, with 100.0% of males and 100.0% of females in these age groups living above the poverty line.
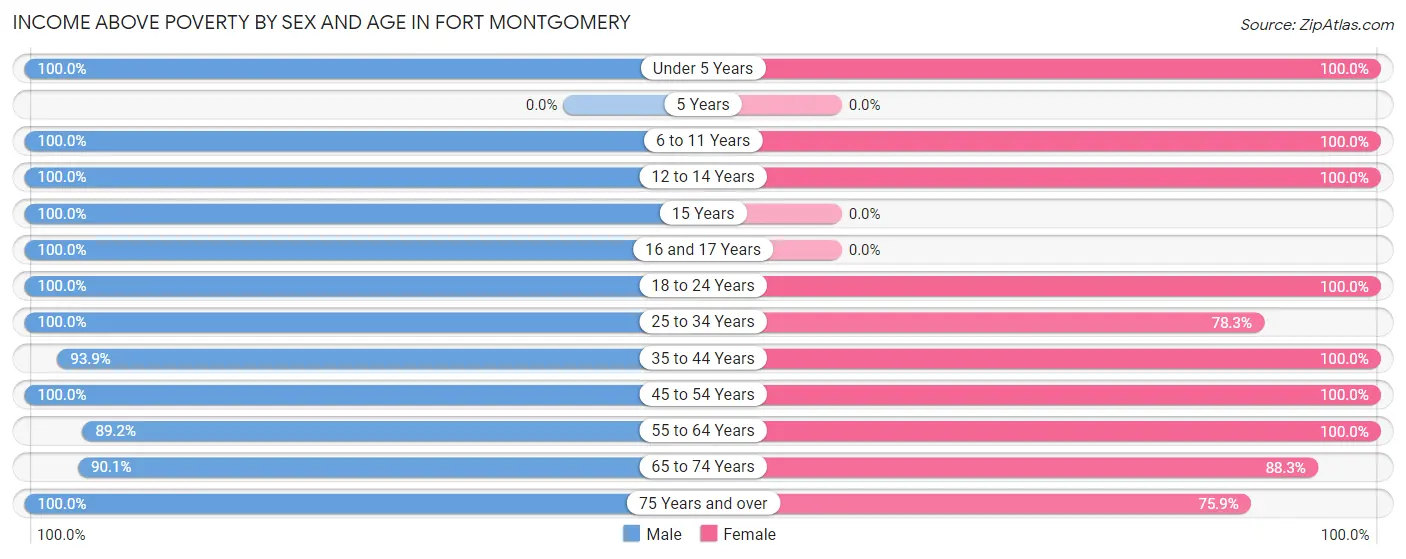
| Age Bracket | Male | Female |
| Under 5 Years | 75 (100.0%) | 150 (100.0%) |
| 5 Years | 0 (0.0%) | 0 (0.0%) |
| 6 to 11 Years | 84 (100.0%) | 73 (100.0%) |
| 12 to 14 Years | 49 (100.0%) | 27 (100.0%) |
| 15 Years | 79 (100.0%) | 0 (0.0%) |
| 16 and 17 Years | 30 (100.0%) | 0 (0.0%) |
| 18 to 24 Years | 138 (100.0%) | 21 (100.0%) |
| 25 to 34 Years | 61 (100.0%) | 47 (78.3%) |
| 35 to 44 Years | 200 (93.9%) | 229 (100.0%) |
| 45 to 54 Years | 243 (100.0%) | 163 (100.0%) |
| 55 to 64 Years | 116 (89.2%) | 137 (100.0%) |
| 65 to 74 Years | 272 (90.1%) | 106 (88.3%) |
| 75 Years and over | 11 (100.0%) | 44 (75.9%) |
| Total | 1,358 (96.0%) | 997 (96.1%) |
Income Below Poverty Among Married-Couple Families in Fort Montgomery
The poverty statistics for married-couple families in Fort Montgomery show that 2.7% or 14 of the total 524 families live below the poverty line. Families with no children have the highest poverty rate of 5.3%, comprising of 14 families. On the other hand, families with 1 or 2 children have the lowest poverty rate of 0.0%, which includes 0 families.
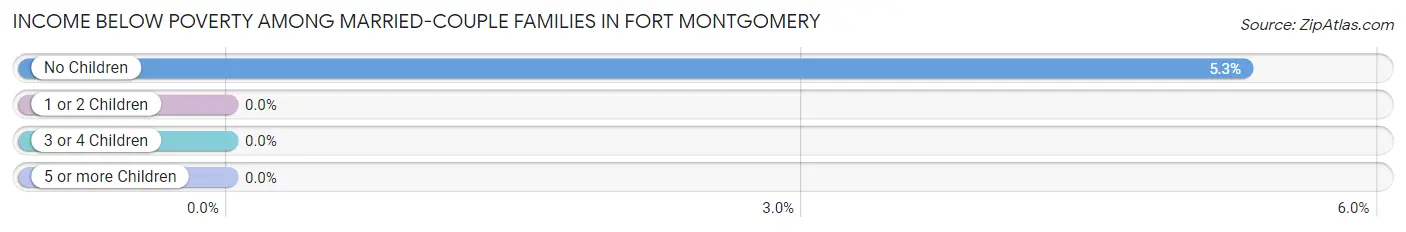
| Children | Above Poverty | Below Poverty |
| No Children | 250 (94.7%) | 14 (5.3%) |
| 1 or 2 Children | 211 (100.0%) | 0 (0.0%) |
| 3 or 4 Children | 49 (100.0%) | 0 (0.0%) |
| 5 or more Children | 0 (0.0%) | 0 (0.0%) |
| Total | 510 (97.3%) | 14 (2.7%) |
Income Below Poverty Among Single-Parent Households in Fort Montgomery
| Children | Single Father | Single Mother |
| No Children | 0 (0.0%) | 0 (0.0%) |
| 1 or 2 Children | 0 (0.0%) | 0 (0.0%) |
| 3 or 4 Children | 0 (0.0%) | 0 (0.0%) |
| 5 or more Children | 0 (0.0%) | 0 (0.0%) |
| Total | 0 (0.0%) | 0 (0.0%) |
Income Below Poverty Among Married-Couple vs Single-Parent Households in Fort Montgomery
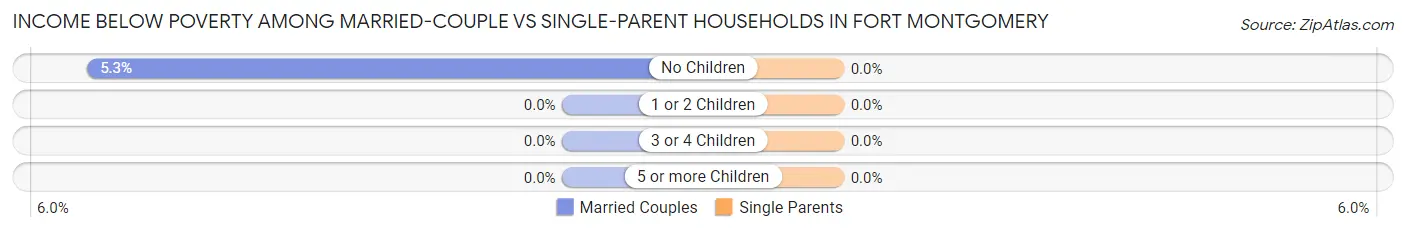
| Children | Married-Couple Families | Single-Parent Households |
| No Children | 14 (5.3%) | 0 (0.0%) |
| 1 or 2 Children | 0 (0.0%) | 0 (0.0%) |
| 3 or 4 Children | 0 (0.0%) | 0 (0.0%) |
| 5 or more Children | 0 (0.0%) | 0 (0.0%) |
| Total | 14 (2.7%) | 0 (0.0%) |
Race in Fort Montgomery
The most populous races in Fort Montgomery are White / Caucasian (1,445 | 58.9%), Hispanic or Latino (582 | 23.7%), and Two or more Races (488 | 19.9%).
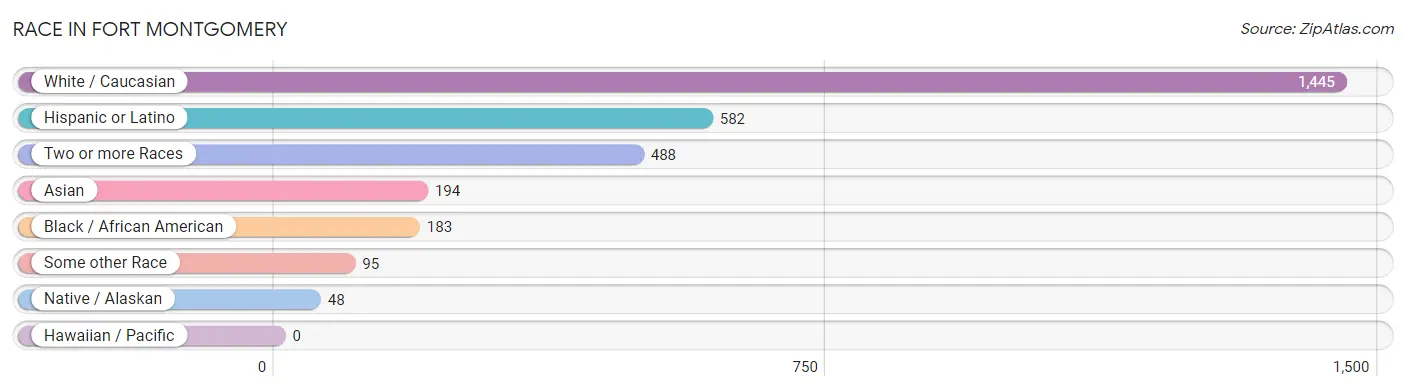
| Race | # Population | % Population |
| Asian | 194 | 7.9% |
| Black / African American | 183 | 7.5% |
| Hawaiian / Pacific | 0 | 0.0% |
| Hispanic or Latino | 582 | 23.7% |
| Native / Alaskan | 48 | 2.0% |
| White / Caucasian | 1,445 | 58.9% |
| Two or more Races | 488 | 19.9% |
| Some other Race | 95 | 3.9% |
| Total | 2,453 | 100.0% |
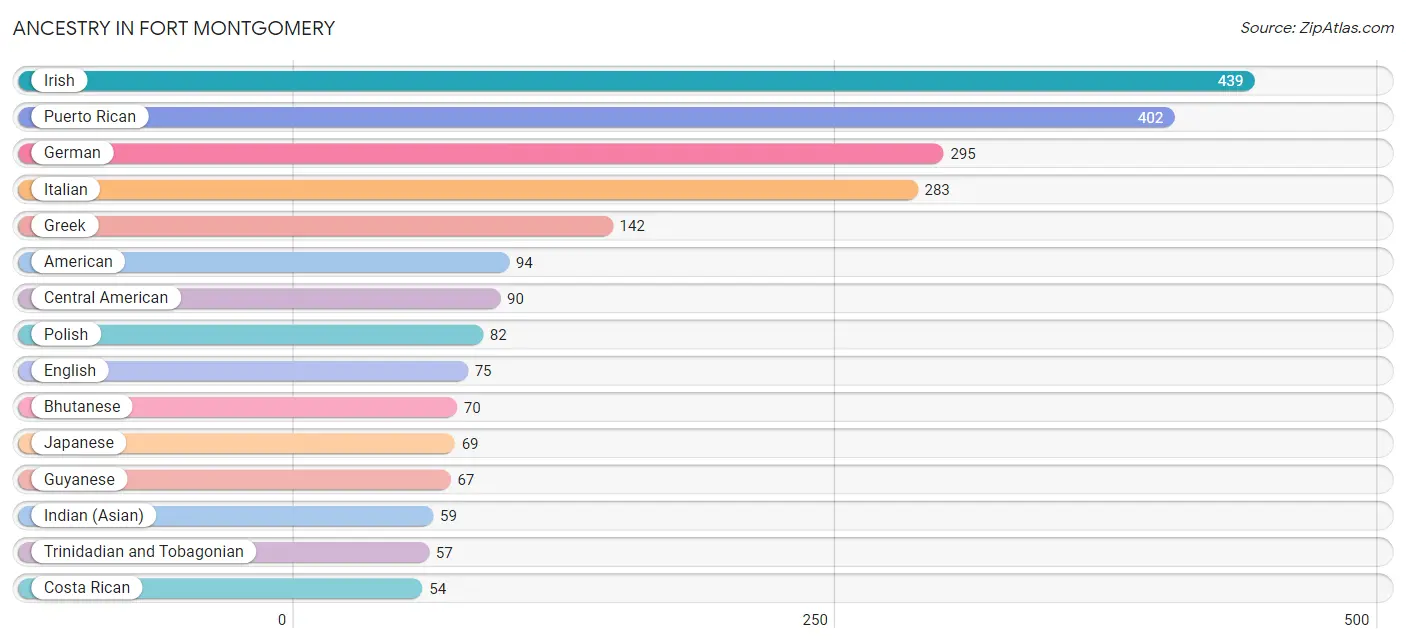
Ancestry in Fort Montgomery
The most populous ancestries reported in Fort Montgomery are Irish (439 | 17.9%), Puerto Rican (402 | 16.4%), German (295 | 12.0%), Italian (283 | 11.5%), and Greek (142 | 5.8%), together accounting for 63.6% of all Fort Montgomery residents.
| Ancestry | # Population | % Population |
| African | 37 | 1.5% |
| Albanian | 15 | 0.6% |
| American | 94 | 3.8% |
| Arab | 32 | 1.3% |
| Argentinean | 14 | 0.6% |
| Bhutanese | 70 | 2.9% |
| Central American | 90 | 3.7% |
| Costa Rican | 54 | 2.2% |
| Delaware | 6 | 0.2% |
| Dominican | 14 | 0.6% |
| Dutch | 15 | 0.6% |
| English | 75 | 3.1% |
| French | 38 | 1.5% |
| German | 295 | 12.0% |
| Greek | 142 | 5.8% |
| Guatemalan | 36 | 1.5% |
| Guyanese | 67 | 2.7% |
| Hungarian | 26 | 1.1% |
| Indian (Asian) | 59 | 2.4% |
| Irish | 439 | 17.9% |
| Italian | 283 | 11.5% |
| Japanese | 69 | 2.8% |
| Korean | 42 | 1.7% |
| Mexican | 42 | 1.7% |
| Osage | 42 | 1.7% |
| Polish | 82 | 3.3% |
| Puerto Rican | 402 | 16.4% |
| Romanian | 26 | 1.1% |
| Russian | 15 | 0.6% |
| Scotch-Irish | 26 | 1.1% |
| South American | 14 | 0.6% |
| Spaniard | 6 | 0.2% |
| Subsaharan African | 37 | 1.5% |
| Swedish | 30 | 1.2% |
| Thai | 14 | 0.6% |
| Trinidadian and Tobagonian | 57 | 2.3% | View All 36 Rows |
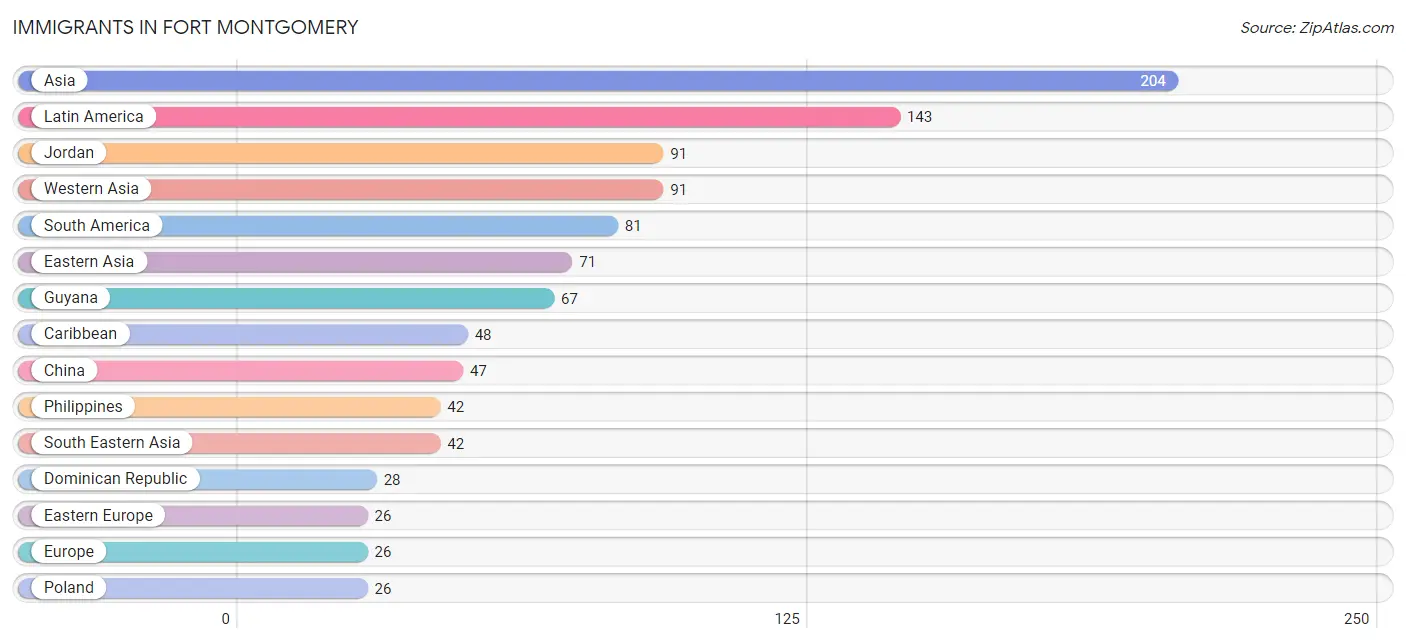
Immigrants in Fort Montgomery
The most numerous immigrant groups reported in Fort Montgomery came from Asia (204 | 8.3%), Latin America (143 | 5.8%), Jordan (91 | 3.7%), Western Asia (91 | 3.7%), and South America (81 | 3.3%), together accounting for 24.9% of all Fort Montgomery residents.
| Immigration Origin | # Population | % Population |
| Argentina | 14 | 0.6% |
| Asia | 204 | 8.3% |
| Caribbean | 48 | 2.0% |
| Central America | 14 | 0.6% |
| China | 47 | 1.9% |
| Dominican Republic | 28 | 1.1% |
| Eastern Asia | 71 | 2.9% |
| Eastern Europe | 26 | 1.1% |
| Europe | 26 | 1.1% |
| Guatemala | 14 | 0.6% |
| Guyana | 67 | 2.7% |
| Japan | 24 | 1.0% |
| Jordan | 91 | 3.7% |
| Latin America | 143 | 5.8% |
| Philippines | 42 | 1.7% |
| Poland | 26 | 1.1% |
| South America | 81 | 3.3% |
| South Eastern Asia | 42 | 1.7% |
| Trinidad and Tobago | 20 | 0.8% |
| Western Asia | 91 | 3.7% | View All 20 Rows |
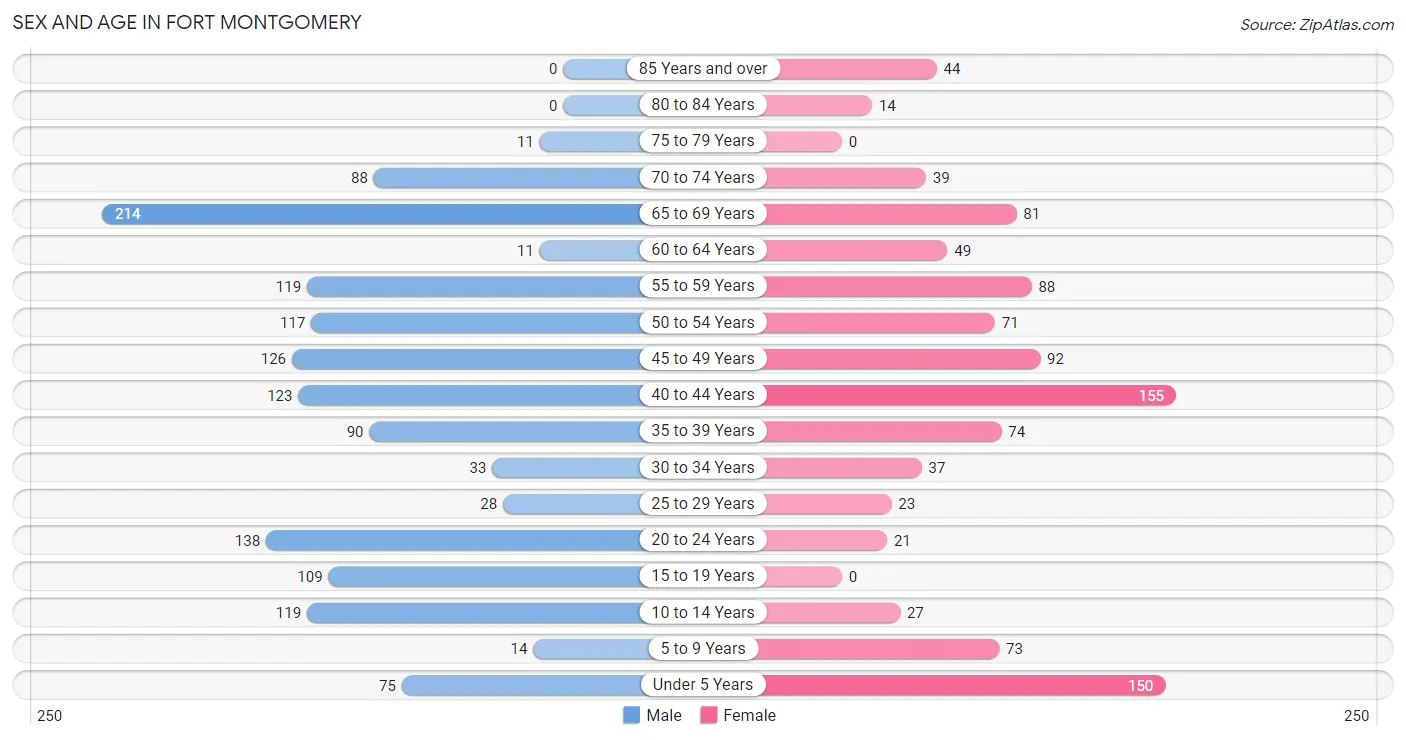
Sex and Age in Fort Montgomery
Sex and Age in Fort Montgomery
The most populous age groups in Fort Montgomery are 65 to 69 Years (214 | 15.1%) for men and 40 to 44 Years (155 | 14.9%) for women.
| Age Bracket | Male | Female |
| Under 5 Years | 75 (5.3%) | 150 (14.4%) |
| 5 to 9 Years | 14 (1.0%) | 73 (7.0%) |
| 10 to 14 Years | 119 (8.4%) | 27 (2.6%) |
| 15 to 19 Years | 109 (7.7%) | 0 (0.0%) |
| 20 to 24 Years | 138 (9.8%) | 21 (2.0%) |
| 25 to 29 Years | 28 (2.0%) | 23 (2.2%) |
| 30 to 34 Years | 33 (2.3%) | 37 (3.6%) |
| 35 to 39 Years | 90 (6.4%) | 74 (7.1%) |
| 40 to 44 Years | 123 (8.7%) | 155 (14.9%) |
| 45 to 49 Years | 126 (8.9%) | 92 (8.9%) |
| 50 to 54 Years | 117 (8.3%) | 71 (6.8%) |
| 55 to 59 Years | 119 (8.4%) | 88 (8.5%) |
| 60 to 64 Years | 11 (0.8%) | 49 (4.7%) |
| 65 to 69 Years | 214 (15.1%) | 81 (7.8%) |
| 70 to 74 Years | 88 (6.2%) | 39 (3.8%) |
| 75 to 79 Years | 11 (0.8%) | 0 (0.0%) |
| 80 to 84 Years | 0 (0.0%) | 14 (1.3%) |
| 85 Years and over | 0 (0.0%) | 44 (4.2%) |
| Total | 1,415 (100.0%) | 1,038 (100.0%) |
Families and Households in Fort Montgomery
Median Family Size in Fort Montgomery
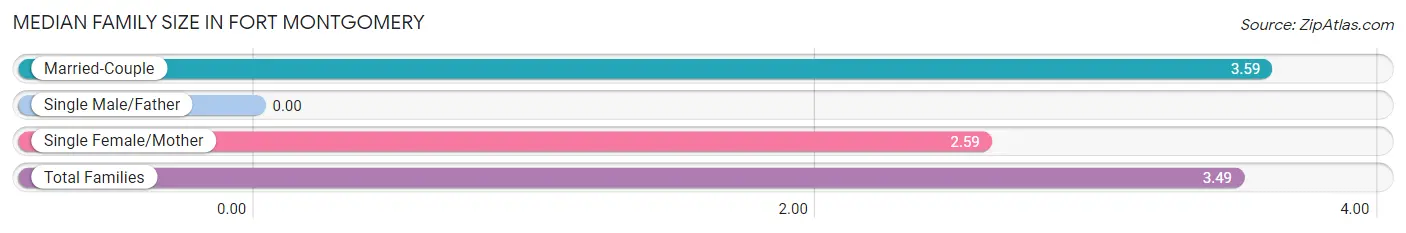
| Family Type | # Families | Family Size |
| Married-Couple | 524 (90.3%) | 3.59 |
| Single Male/Father | 0 (0.0%) | - |
| Single Female/Mother | 56 (9.7%) | 2.59 |
| Total Families | 580 (100.0%) | 3.49 |
Median Household Size in Fort Montgomery
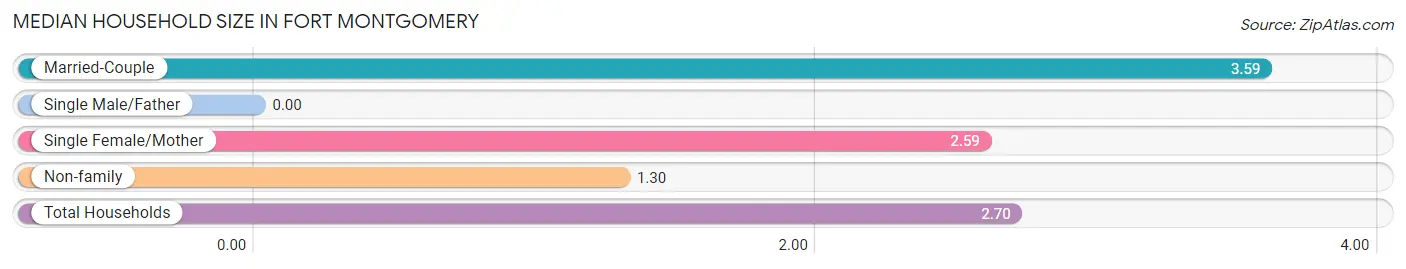
| Household Type | # Households | Household Size |
| Married-Couple | 524 (57.6%) | 3.59 |
| Single Male/Father | 0 (0.0%) | - |
| Single Female/Mother | 56 (6.1%) | 2.59 |
| Non-family | 330 (36.3%) | 1.30 |
| Total Households | 910 (100.0%) | 2.70 |
Household Size by Marriage Status in Fort Montgomery
Out of a total of 910 households in Fort Montgomery, 580 (63.7%) are family households, while 330 (36.3%) are nonfamily households. The most numerous type of family households are 2-person households, comprising 178, and the most common type of nonfamily households are 1-person households, comprising 228.
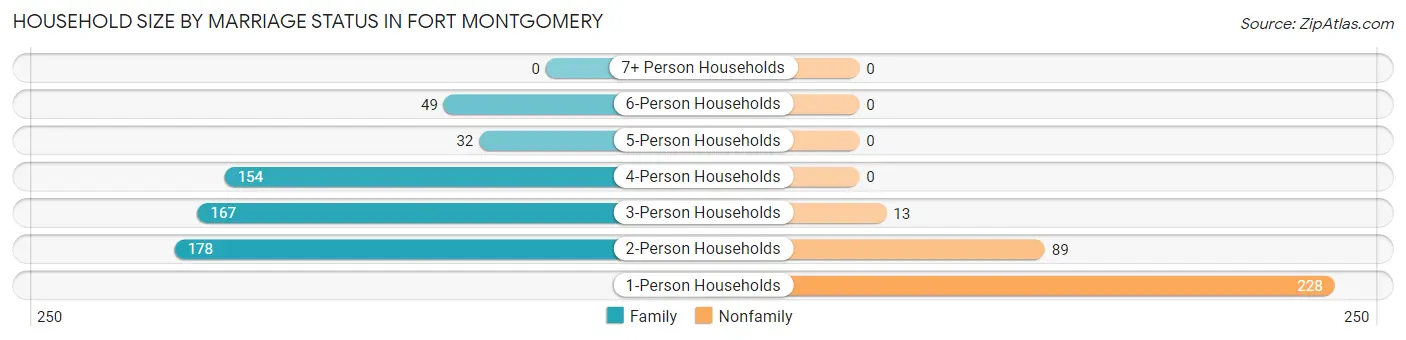
| Household Size | Family Households | Nonfamily Households |
| 1-Person Households | - | 228 (25.1%) |
| 2-Person Households | 178 (19.6%) | 89 (9.8%) |
| 3-Person Households | 167 (18.3%) | 13 (1.4%) |
| 4-Person Households | 154 (16.9%) | 0 (0.0%) |
| 5-Person Households | 32 (3.5%) | 0 (0.0%) |
| 6-Person Households | 49 (5.4%) | 0 (0.0%) |
| 7+ Person Households | 0 (0.0%) | 0 (0.0%) |
| Total | 580 (63.7%) | 330 (36.3%) |
Female Fertility in Fort Montgomery
Fertility by Age in Fort Montgomery
| Age Bracket | Women with Births | Births / 1,000 Women |
| 15 to 19 years | 0 (0.0%) | 0.0 |
| 20 to 34 years | 0 (0.0%) | 0.0 |
| 35 to 50 years | 0 (0.0%) | 0.0 |
| Total | 0 (0.0%) | 0.0 |
Fertility by Age by Marriage Status in Fort Montgomery
| Age Bracket | Married | Unmarried |
| 15 to 19 years | 0 (0.0%) | 0 (0.0%) |
| 20 to 34 years | 0 (0.0%) | 0 (0.0%) |
| 35 to 50 years | 0 (0.0%) | 0 (0.0%) |
| Total | 0 (0.0%) | 0 (0.0%) |
Fertility by Education in Fort Montgomery
| Educational Attainment | Women with Births | Births / 1,000 Women |
| Less than High School | 0 (0.0%) | 0.0 |
| High School Diploma | 0 (0.0%) | 0.0 |
| College or Associate's Degree | 0 (0.0%) | 0.0 |
| Bachelor's Degree | 0 (0.0%) | 0.0 |
| Graduate Degree | 0 (0.0%) | 0.0 |
| Total | 0 (0.0%) | 0.0 |
Fertility by Education by Marriage Status in Fort Montgomery
| Educational Attainment | Married | Unmarried |
| Less than High School | 0 (0.0%) | 0 (0.0%) |
| High School Diploma | 0 (0.0%) | 0 (0.0%) |
| College or Associate's Degree | 0 (0.0%) | 0 (0.0%) |
| Bachelor's Degree | 0 (0.0%) | 0 (0.0%) |
| Graduate Degree | 0 (0.0%) | 0 (0.0%) |
| Total | 0 (0.0%) | 0 (0.0%) |
Employment Characteristics in Fort Montgomery
Employment by Class of Employer in Fort Montgomery
Among the 1,410 employed individuals in Fort Montgomery, private company employees (882 | 62.5%), local government employees (161 | 11.4%), and not-for-profit organizations (150 | 10.6%) make up the most common classes of employment.
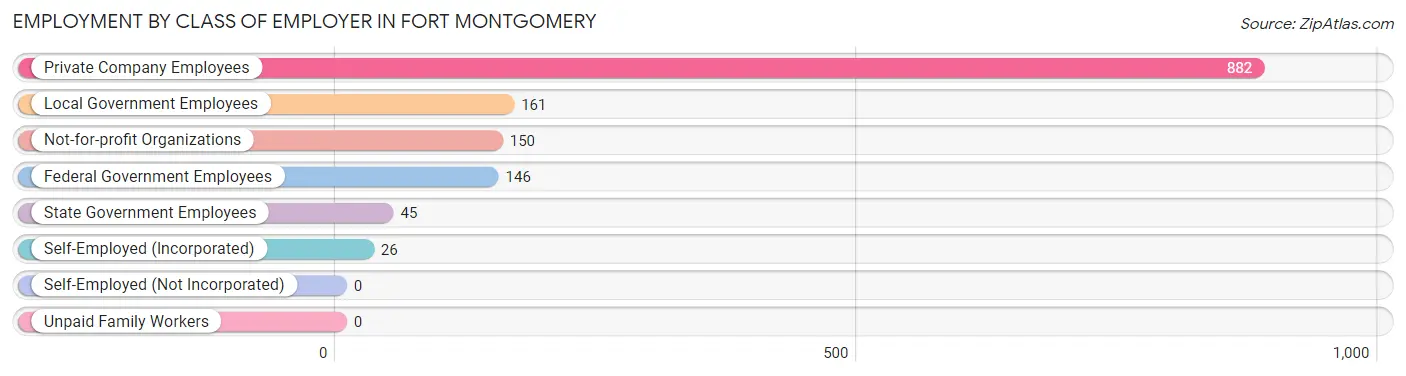
| Employer Class | # Employees | % Employees |
| Private Company Employees | 882 | 62.5% |
| Self-Employed (Incorporated) | 26 | 1.8% |
| Self-Employed (Not Incorporated) | 0 | 0.0% |
| Not-for-profit Organizations | 150 | 10.6% |
| Local Government Employees | 161 | 11.4% |
| State Government Employees | 45 | 3.2% |
| Federal Government Employees | 146 | 10.3% |
| Unpaid Family Workers | 0 | 0.0% |
| Total | 1,410 | 100.0% |
Employment Status by Age in Fort Montgomery
According to the labor force statistics for Fort Montgomery, out of the total population over 16 years of age (1,916), 77.1% or 1,477 individuals are in the labor force, with 3.8% or 56 of them unemployed. The age group with the highest labor force participation rate is 16 to 19 years, with 100.0% or 30 individuals in the labor force. Within the labor force, the 55 to 59 years age range has the highest percentage of unemployed individuals, with 19.3% or 28 of them being unemployed.
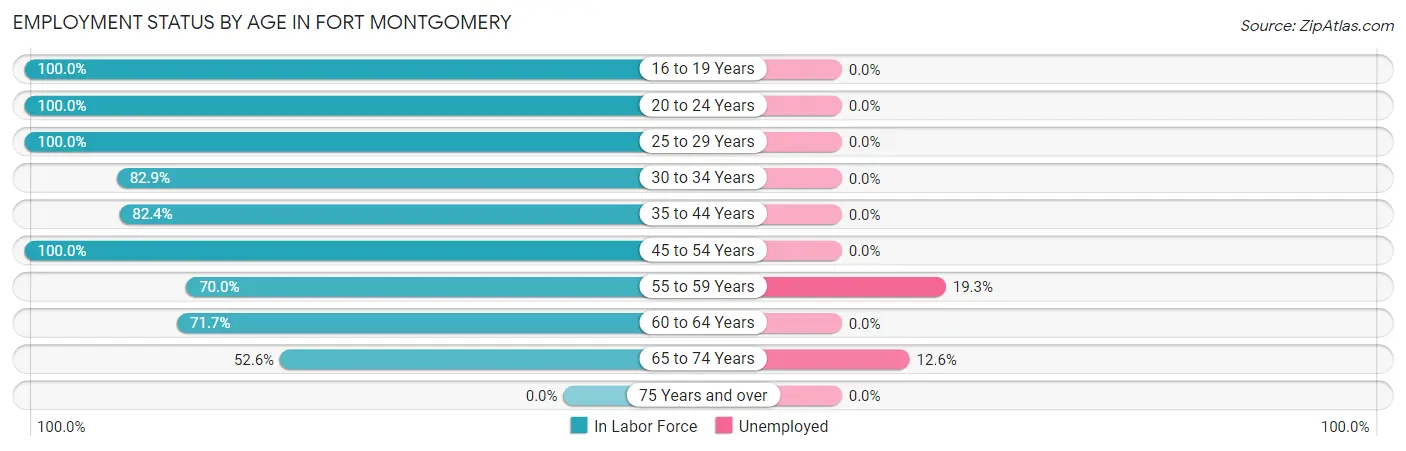
| Age Bracket | In Labor Force | Unemployed |
| 16 to 19 Years | 30 (100.0%) | 0 (0.0%) |
| 20 to 24 Years | 159 (100.0%) | 0 (0.0%) |
| 25 to 29 Years | 51 (100.0%) | 0 (0.0%) |
| 30 to 34 Years | 58 (82.9%) | 0 (0.0%) |
| 35 to 44 Years | 364 (82.4%) | 0 (0.0%) |
| 45 to 54 Years | 406 (100.0%) | 0 (0.0%) |
| 55 to 59 Years | 145 (70.0%) | 28 (19.3%) |
| 60 to 64 Years | 43 (71.7%) | 0 (0.0%) |
| 65 to 74 Years | 222 (52.6%) | 28 (12.6%) |
| 75 Years and over | 0 (0.0%) | 0 (0.0%) |
| Total | 1,477 (77.1%) | 56 (3.8%) |
Employment Status by Educational Attainment in Fort Montgomery
According to labor force statistics for Fort Montgomery, 86.3% of individuals (1,067) out of the total population between 25 and 64 years of age (1,236) are in the labor force, with 2.6% or 28 of them being unemployed. The group with the highest labor force participation rate are those with the educational attainment of less than high school, with 100.0% or 31 individuals in the labor force. Within the labor force, individuals with high school diploma education have the highest percentage of unemployment, with 7.6% or 28 of them being unemployed.
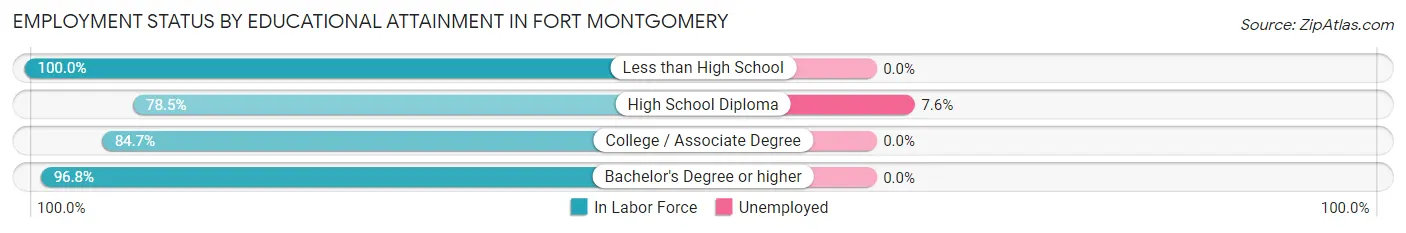
| Educational Attainment | In Labor Force | Unemployed |
| Less than High School | 31 (100.0%) | 0 (0.0%) |
| High School Diploma | 368 (78.5%) | 36 (7.6%) |
| College / Associate Degree | 310 (84.7%) | 0 (0.0%) |
| Bachelor's Degree or higher | 358 (96.8%) | 0 (0.0%) |
| Total | 1,067 (86.3%) | 32 (2.6%) |
Employment Occupations by Sex in Fort Montgomery
Management, Business, Science and Arts Occupations
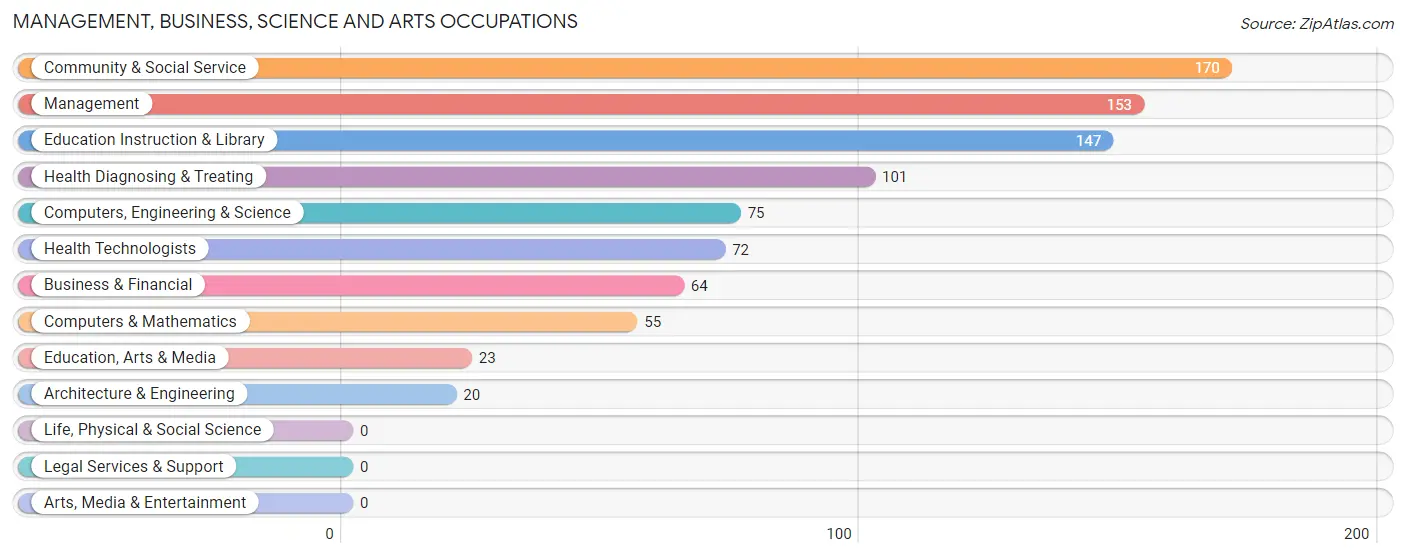
The most common Management, Business, Science and Arts occupations in Fort Montgomery are Community & Social Service (170 | 11.9%), Management (153 | 10.8%), Education Instruction & Library (147 | 10.3%), Health Diagnosing & Treating (101 | 7.1%), and Computers, Engineering & Science (75 | 5.3%).
Management, Business, Science and Arts Occupations by Sex
Within the Management, Business, Science and Arts occupations in Fort Montgomery, the most male-oriented occupations are Business & Financial (100.0%), Computers, Engineering & Science (100.0%), and Computers & Mathematics (100.0%), while the most female-oriented occupations are Education, Arts & Media (100.0%), Health Technologists (100.0%), and Community & Social Service (91.8%).
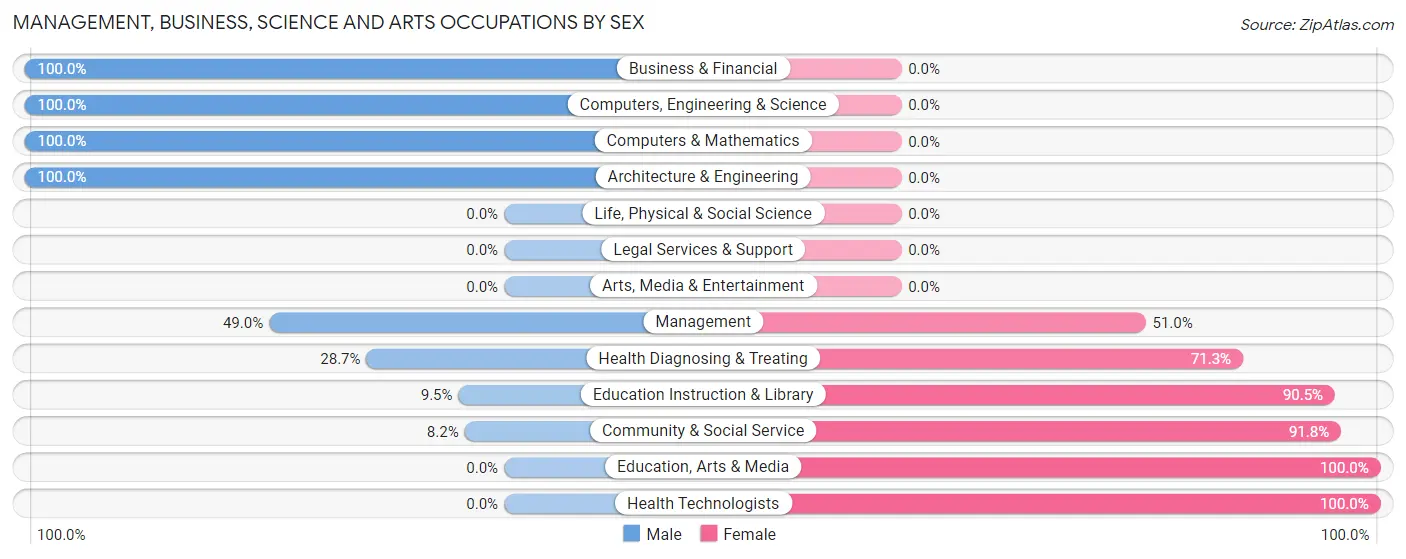
| Occupation | Male | Female |
| Management | 75 (49.0%) | 78 (51.0%) |
| Business & Financial | 64 (100.0%) | 0 (0.0%) |
| Computers, Engineering & Science | 75 (100.0%) | 0 (0.0%) |
| Computers & Mathematics | 55 (100.0%) | 0 (0.0%) |
| Architecture & Engineering | 20 (100.0%) | 0 (0.0%) |
| Life, Physical & Social Science | 0 (0.0%) | 0 (0.0%) |
| Community & Social Service | 14 (8.2%) | 156 (91.8%) |
| Education, Arts & Media | 0 (0.0%) | 23 (100.0%) |
| Legal Services & Support | 0 (0.0%) | 0 (0.0%) |
| Education Instruction & Library | 14 (9.5%) | 133 (90.5%) |
| Arts, Media & Entertainment | 0 (0.0%) | 0 (0.0%) |
| Health Diagnosing & Treating | 29 (28.7%) | 72 (71.3%) |
| Health Technologists | 0 (0.0%) | 72 (100.0%) |
| Total (Category) | 257 (45.7%) | 306 (54.3%) |
| Total (Overall) | 881 (62.0%) | 541 (38.1%) |
Services Occupations
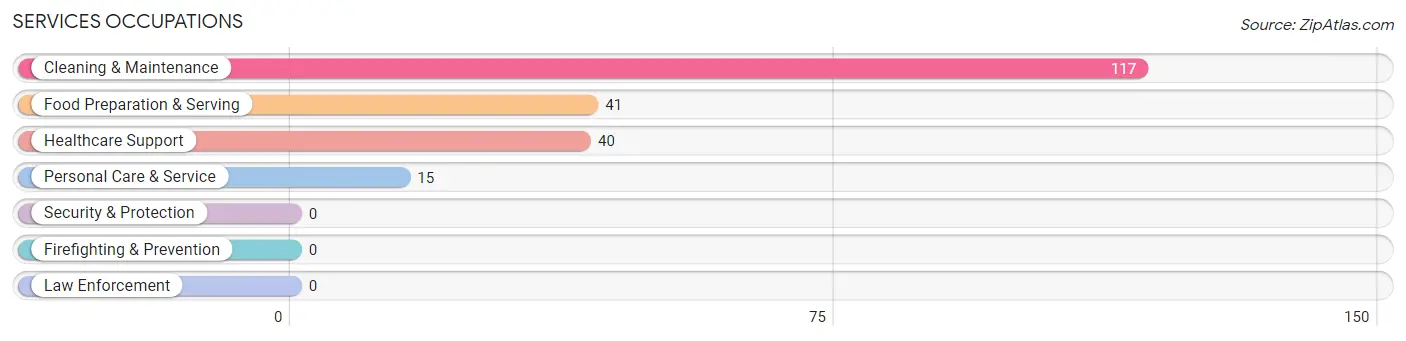
The most common Services occupations in Fort Montgomery are Cleaning & Maintenance (117 | 8.2%), Food Preparation & Serving (41 | 2.9%), Healthcare Support (40 | 2.8%), and Personal Care & Service (15 | 1.1%).
Services Occupations by Sex
Within the Services occupations in Fort Montgomery, the most male-oriented occupations are Healthcare Support (100.0%), Food Preparation & Serving (100.0%), and Cleaning & Maintenance (39.3%), while the most female-oriented occupations are Personal Care & Service (100.0%), and Cleaning & Maintenance (60.7%).
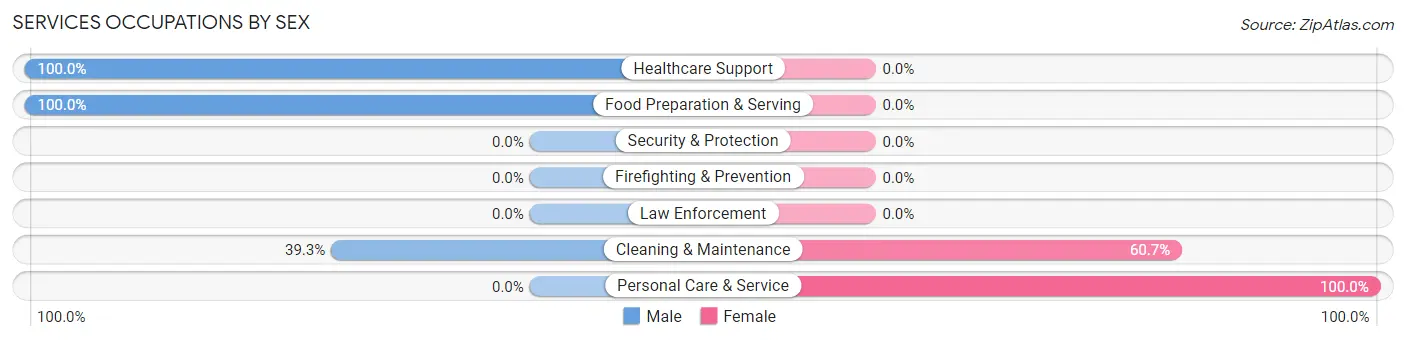
| Occupation | Male | Female |
| Healthcare Support | 40 (100.0%) | 0 (0.0%) |
| Security & Protection | 0 (0.0%) | 0 (0.0%) |
| Firefighting & Prevention | 0 (0.0%) | 0 (0.0%) |
| Law Enforcement | 0 (0.0%) | 0 (0.0%) |
| Food Preparation & Serving | 41 (100.0%) | 0 (0.0%) |
| Cleaning & Maintenance | 46 (39.3%) | 71 (60.7%) |
| Personal Care & Service | 0 (0.0%) | 15 (100.0%) |
| Total (Category) | 127 (59.6%) | 86 (40.4%) |
| Total (Overall) | 881 (62.0%) | 541 (38.1%) |
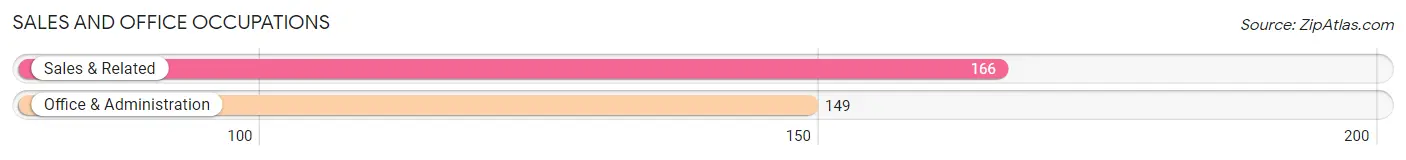
Sales and Office Occupations
The most common Sales and Office occupations in Fort Montgomery are Sales & Related (166 | 11.7%), and Office & Administration (149 | 10.5%).
Sales and Office Occupations by Sex
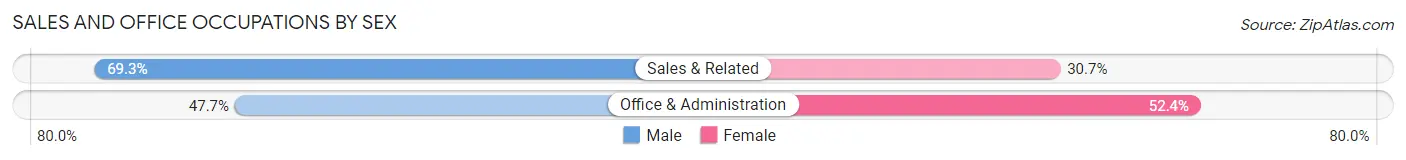
| Occupation | Male | Female |
| Sales & Related | 115 (69.3%) | 51 (30.7%) |
| Office & Administration | 71 (47.6%) | 78 (52.3%) |
| Total (Category) | 186 (59.1%) | 129 (40.9%) |
| Total (Overall) | 881 (62.0%) | 541 (38.1%) |
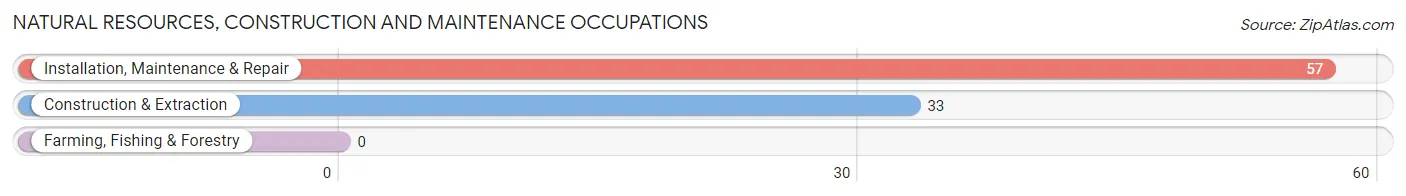
Natural Resources, Construction and Maintenance Occupations
The most common Natural Resources, Construction and Maintenance occupations in Fort Montgomery are Installation, Maintenance & Repair (57 | 4.0%), and Construction & Extraction (33 | 2.3%).
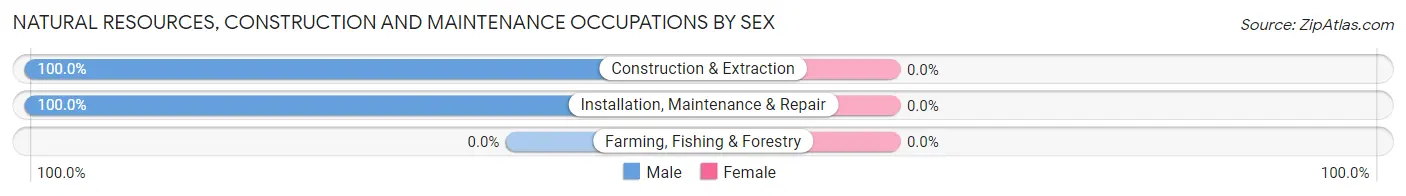
Natural Resources, Construction and Maintenance Occupations by Sex
| Occupation | Male | Female |
| Farming, Fishing & Forestry | 0 (0.0%) | 0 (0.0%) |
| Construction & Extraction | 33 (100.0%) | 0 (0.0%) |
| Installation, Maintenance & Repair | 57 (100.0%) | 0 (0.0%) |
| Total (Category) | 90 (100.0%) | 0 (0.0%) |
| Total (Overall) | 881 (62.0%) | 541 (38.1%) |
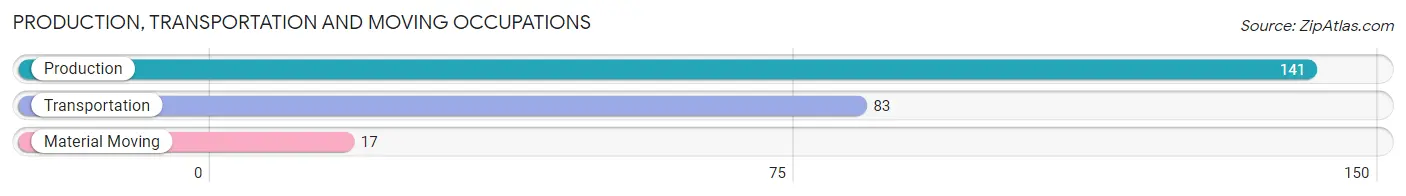
Production, Transportation and Moving Occupations
The most common Production, Transportation and Moving occupations in Fort Montgomery are Production (141 | 9.9%), Transportation (83 | 5.8%), and Material Moving (17 | 1.2%).
Production, Transportation and Moving Occupations by Sex
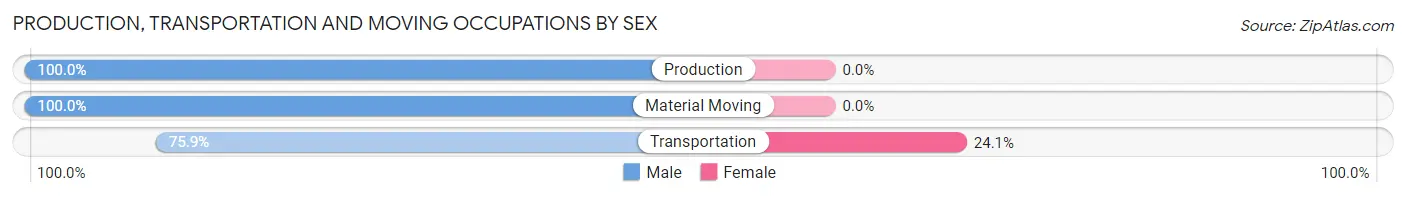
| Occupation | Male | Female |
| Production | 141 (100.0%) | 0 (0.0%) |
| Transportation | 63 (75.9%) | 20 (24.1%) |
| Material Moving | 17 (100.0%) | 0 (0.0%) |
| Total (Category) | 221 (91.7%) | 20 (8.3%) |
| Total (Overall) | 881 (62.0%) | 541 (38.1%) |
Employment Industries by Sex in Fort Montgomery
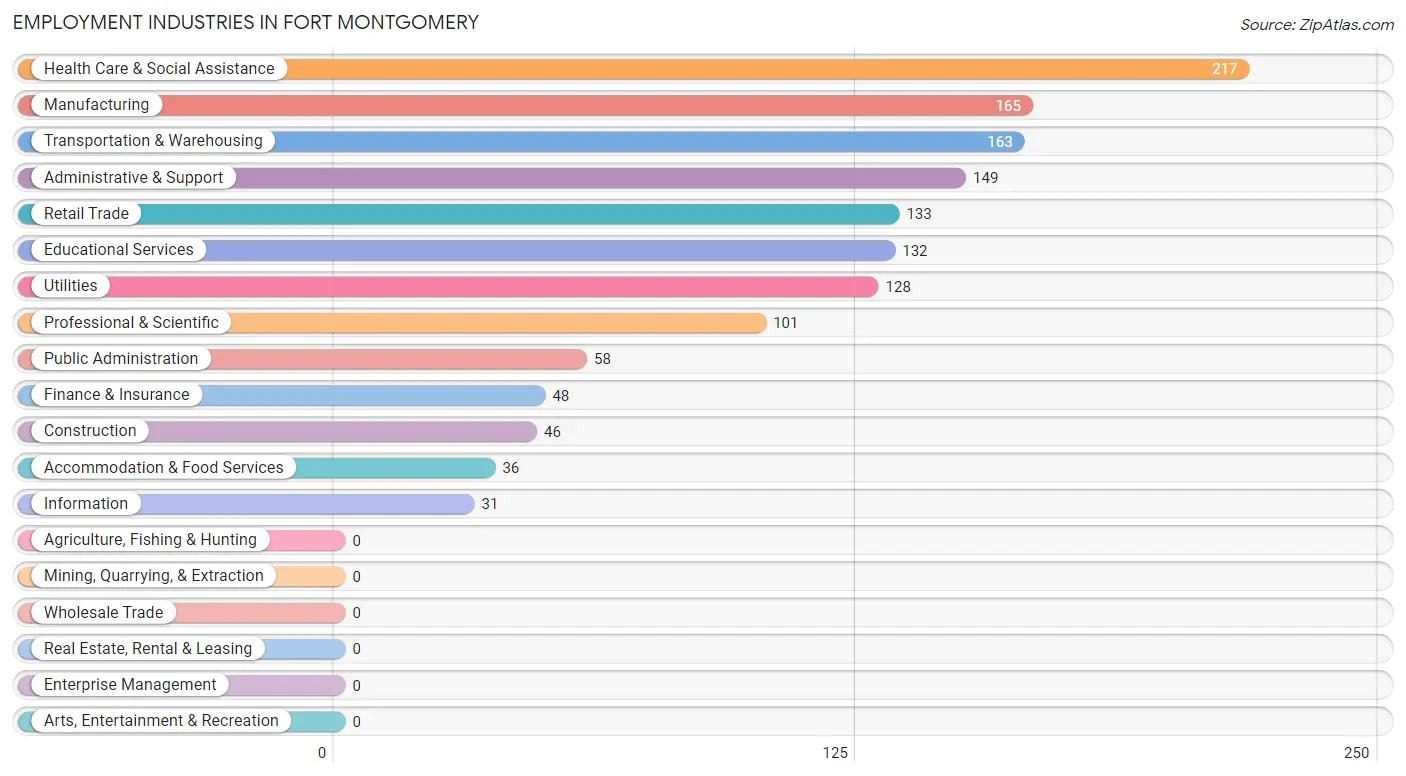
Employment Industries in Fort Montgomery
The major employment industries in Fort Montgomery include Health Care & Social Assistance (217 | 15.3%), Manufacturing (165 | 11.6%), Transportation & Warehousing (163 | 11.5%), Administrative & Support (149 | 10.5%), and Retail Trade (133 | 9.3%).
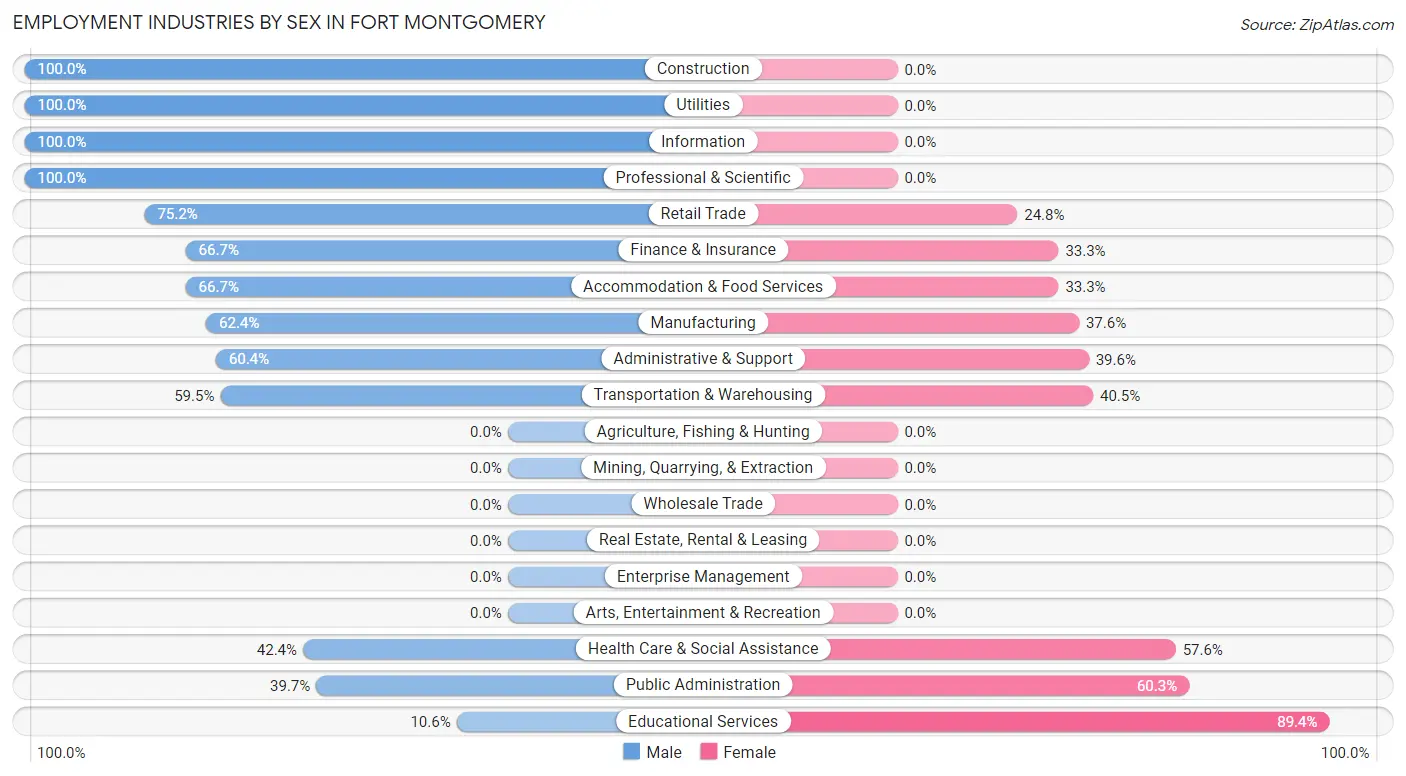
Employment Industries by Sex in Fort Montgomery
The Fort Montgomery industries that see more men than women are Construction (100.0%), Utilities (100.0%), and Information (100.0%), whereas the industries that tend to have a higher number of women are Educational Services (89.4%), Public Administration (60.3%), and Health Care & Social Assistance (57.6%).
| Industry | Male | Female |
| Agriculture, Fishing & Hunting | 0 (0.0%) | 0 (0.0%) |
| Mining, Quarrying, & Extraction | 0 (0.0%) | 0 (0.0%) |
| Construction | 46 (100.0%) | 0 (0.0%) |
| Manufacturing | 103 (62.4%) | 62 (37.6%) |
| Wholesale Trade | 0 (0.0%) | 0 (0.0%) |
| Retail Trade | 100 (75.2%) | 33 (24.8%) |
| Transportation & Warehousing | 97 (59.5%) | 66 (40.5%) |
| Utilities | 128 (100.0%) | 0 (0.0%) |
| Information | 31 (100.0%) | 0 (0.0%) |
| Finance & Insurance | 32 (66.7%) | 16 (33.3%) |
| Real Estate, Rental & Leasing | 0 (0.0%) | 0 (0.0%) |
| Professional & Scientific | 101 (100.0%) | 0 (0.0%) |
| Enterprise Management | 0 (0.0%) | 0 (0.0%) |
| Administrative & Support | 90 (60.4%) | 59 (39.6%) |
| Educational Services | 14 (10.6%) | 118 (89.4%) |
| Health Care & Social Assistance | 92 (42.4%) | 125 (57.6%) |
| Arts, Entertainment & Recreation | 0 (0.0%) | 0 (0.0%) |
| Accommodation & Food Services | 24 (66.7%) | 12 (33.3%) |
| Public Administration | 23 (39.7%) | 35 (60.3%) |
| Total | 881 (62.0%) | 541 (38.1%) |
Education in Fort Montgomery
School Enrollment in Fort Montgomery
The most common levels of schooling among the 392 students in Fort Montgomery are middle school (146 | 37.2%), high school (109 | 27.8%), and kindergarten (73 | 18.6%).
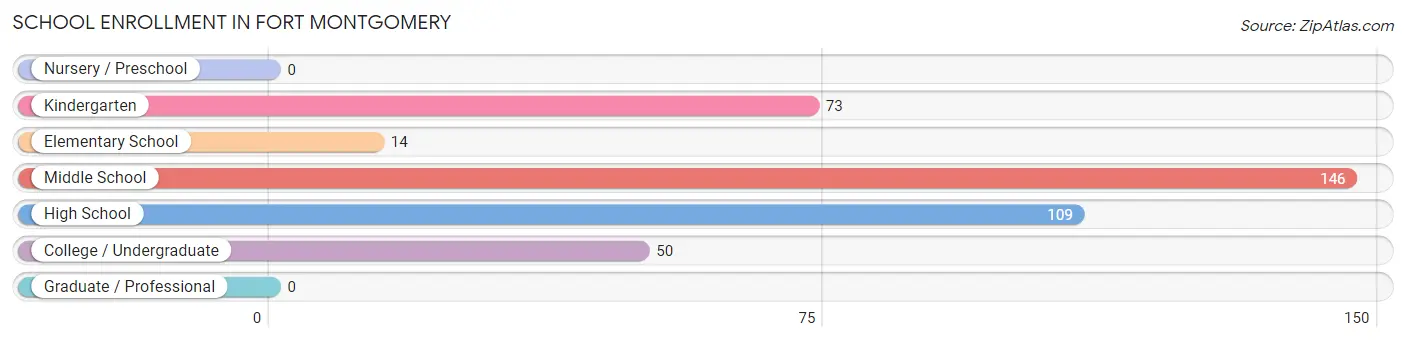
| School Level | # Students | % Students |
| Nursery / Preschool | 0 | 0.0% |
| Kindergarten | 73 | 18.6% |
| Elementary School | 14 | 3.6% |
| Middle School | 146 | 37.2% |
| High School | 109 | 27.8% |
| College / Undergraduate | 50 | 12.8% |
| Graduate / Professional | 0 | 0.0% |
| Total | 392 | 100.0% |
School Enrollment by Age by Funding Source in Fort Montgomery
Out of a total of 392 students who are enrolled in schools in Fort Montgomery, 73 (18.6%) attend a private institution, while the remaining 319 (81.4%) are enrolled in public schools. The age group of 5 to 9 year old has the highest likelihood of being enrolled in private schools, with 73 (83.9% in the age bracket) enrolled. Conversely, the age group of 10 to 14 year olds has the lowest likelihood of being enrolled in a private school, with 146 (100.0% in the age bracket) attending a public institution.
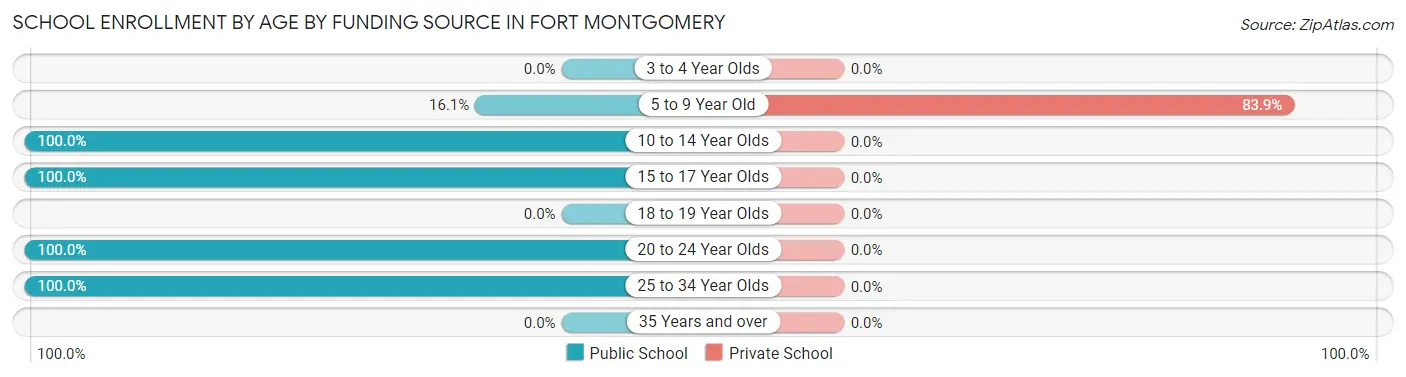
| Age Bracket | Public School | Private School |
| 3 to 4 Year Olds | 0 (0.0%) | 0 (0.0%) |
| 5 to 9 Year Old | 14 (16.1%) | 73 (83.9%) |
| 10 to 14 Year Olds | 146 (100.0%) | 0 (0.0%) |
| 15 to 17 Year Olds | 109 (100.0%) | 0 (0.0%) |
| 18 to 19 Year Olds | 0 (0.0%) | 0 (0.0%) |
| 20 to 24 Year Olds | 38 (100.0%) | 0 (0.0%) |
| 25 to 34 Year Olds | 12 (100.0%) | 0 (0.0%) |
| 35 Years and over | 0 (0.0%) | 0 (0.0%) |
| Total | 319 (81.4%) | 73 (18.6%) |
Educational Attainment by Field of Study in Fort Montgomery
Education (163 | 29.3%), business (62 | 11.1%), psychology (56 | 10.1%), engineering (53 | 9.5%), and computers & mathematics (51 | 9.2%) are the most common fields of study among 557 individuals in Fort Montgomery who have obtained a bachelor's degree or higher.
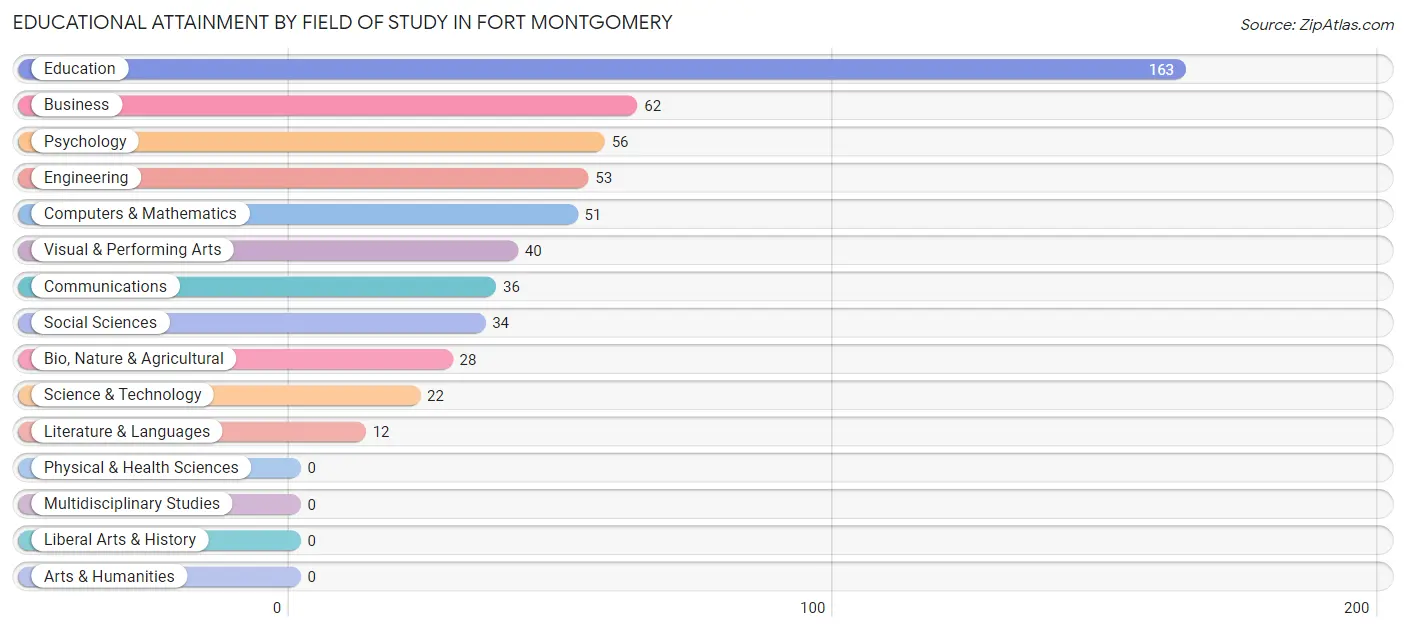
| Field of Study | # Graduates | % Graduates |
| Computers & Mathematics | 51 | 9.2% |
| Bio, Nature & Agricultural | 28 | 5.0% |
| Physical & Health Sciences | 0 | 0.0% |
| Psychology | 56 | 10.1% |
| Social Sciences | 34 | 6.1% |
| Engineering | 53 | 9.5% |
| Multidisciplinary Studies | 0 | 0.0% |
| Science & Technology | 22 | 4.0% |
| Business | 62 | 11.1% |
| Education | 163 | 29.3% |
| Literature & Languages | 12 | 2.1% |
| Liberal Arts & History | 0 | 0.0% |
| Visual & Performing Arts | 40 | 7.2% |
| Communications | 36 | 6.5% |
| Arts & Humanities | 0 | 0.0% |
| Total | 557 | 100.0% |
Transportation & Commute in Fort Montgomery
Vehicle Availability by Sex in Fort Montgomery
The most prevalent vehicle ownership categories in Fort Montgomery are males with 1 vehicle (296, accounting for 33.6%) and females with 1 vehicle (171, making up 55.9%).
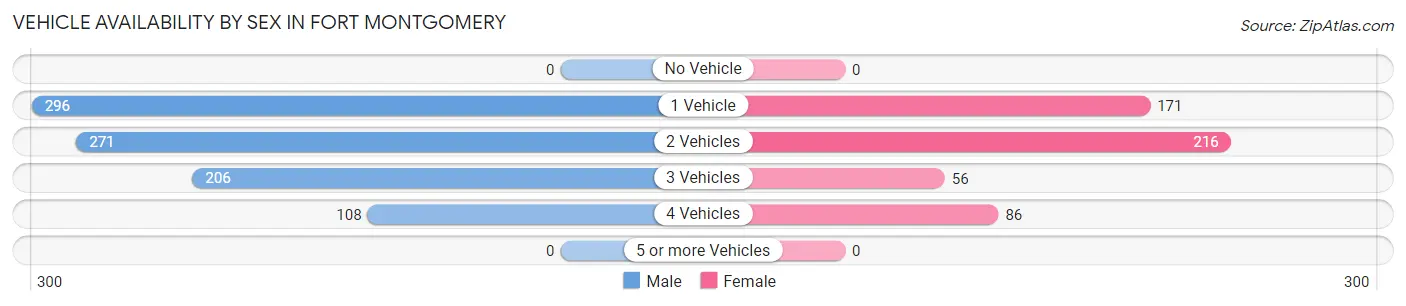
| Vehicles Available | Male | Female |
| No Vehicle | 0 (0.0%) | 0 (0.0%) |
| 1 Vehicle | 296 (33.6%) | 171 (32.3%) |
| 2 Vehicles | 271 (30.8%) | 216 (40.8%) |
| 3 Vehicles | 206 (23.4%) | 56 (10.6%) |
| 4 Vehicles | 108 (12.3%) | 86 (16.3%) |
| 5 or more Vehicles | 0 (0.0%) | 0 (0.0%) |
| Total | 881 (100.0%) | 529 (100.0%) |
Commute Time in Fort Montgomery
The most frequently occuring commute durations in Fort Montgomery are 10 to 14 minutes (209 commuters, 17.3%), 20 to 24 minutes (190 commuters, 15.7%), and 45 to 59 minutes (184 commuters, 15.2%).
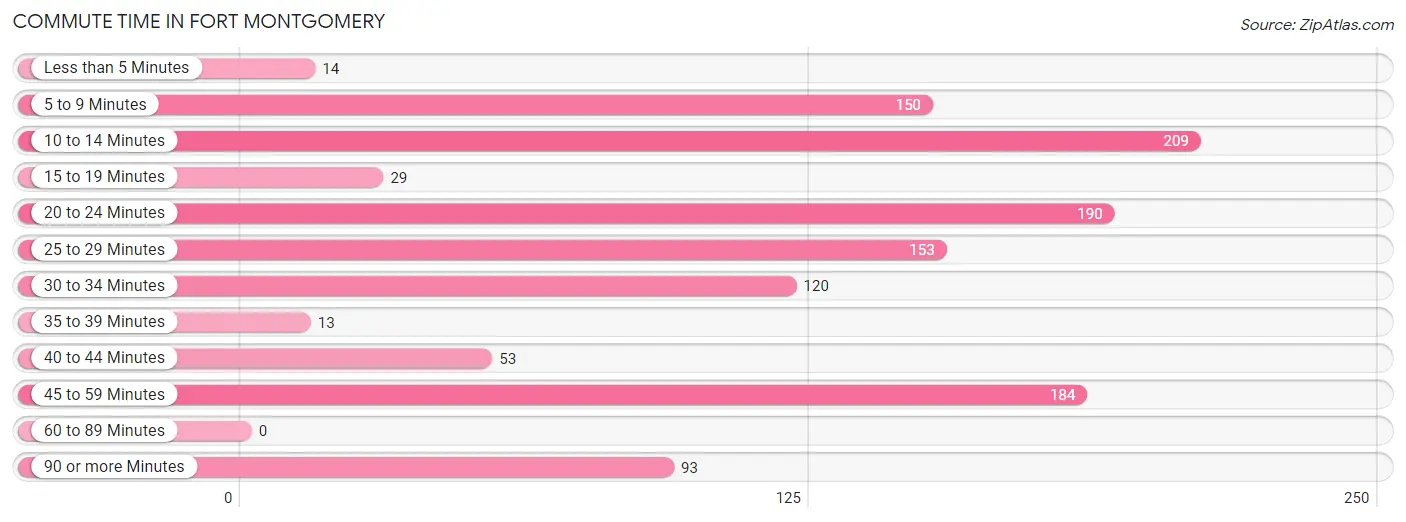
| Commute Time | # Commuters | % Commuters |
| Less than 5 Minutes | 14 | 1.2% |
| 5 to 9 Minutes | 150 | 12.4% |
| 10 to 14 Minutes | 209 | 17.3% |
| 15 to 19 Minutes | 29 | 2.4% |
| 20 to 24 Minutes | 190 | 15.7% |
| 25 to 29 Minutes | 153 | 12.7% |
| 30 to 34 Minutes | 120 | 9.9% |
| 35 to 39 Minutes | 13 | 1.1% |
| 40 to 44 Minutes | 53 | 4.4% |
| 45 to 59 Minutes | 184 | 15.2% |
| 60 to 89 Minutes | 0 | 0.0% |
| 90 or more Minutes | 93 | 7.7% |
Commute Time by Sex in Fort Montgomery
The most common commute times in Fort Montgomery are 5 to 9 minutes (130 commuters, 16.8%) for males and 10 to 14 minutes (127 commuters, 29.1%) for females.
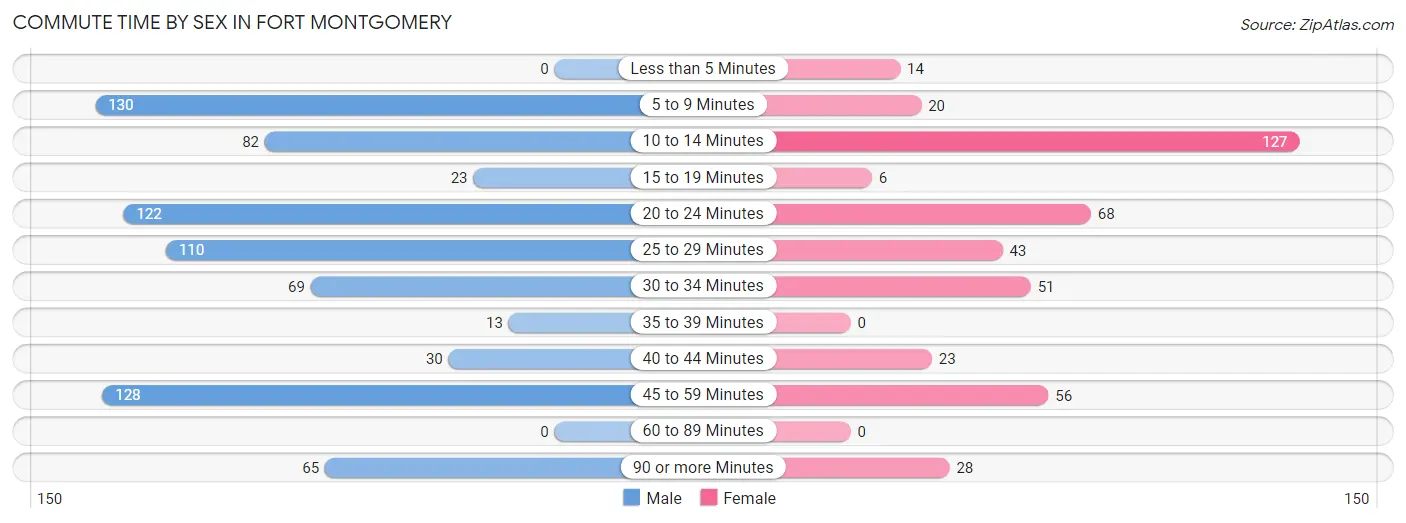
| Commute Time | Male | Female |
| Less than 5 Minutes | 0 (0.0%) | 14 (3.2%) |
| 5 to 9 Minutes | 130 (16.8%) | 20 (4.6%) |
| 10 to 14 Minutes | 82 (10.6%) | 127 (29.1%) |
| 15 to 19 Minutes | 23 (3.0%) | 6 (1.4%) |
| 20 to 24 Minutes | 122 (15.8%) | 68 (15.6%) |
| 25 to 29 Minutes | 110 (14.2%) | 43 (9.9%) |
| 30 to 34 Minutes | 69 (8.9%) | 51 (11.7%) |
| 35 to 39 Minutes | 13 (1.7%) | 0 (0.0%) |
| 40 to 44 Minutes | 30 (3.9%) | 23 (5.3%) |
| 45 to 59 Minutes | 128 (16.6%) | 56 (12.8%) |
| 60 to 89 Minutes | 0 (0.0%) | 0 (0.0%) |
| 90 or more Minutes | 65 (8.4%) | 28 (6.4%) |
Time of Departure to Work by Sex in Fort Montgomery
The most frequent times of departure to work in Fort Montgomery are 7:00 AM to 7:29 AM (270, 35.0%) for males and 6:30 AM to 6:59 AM (141, 32.3%) for females.
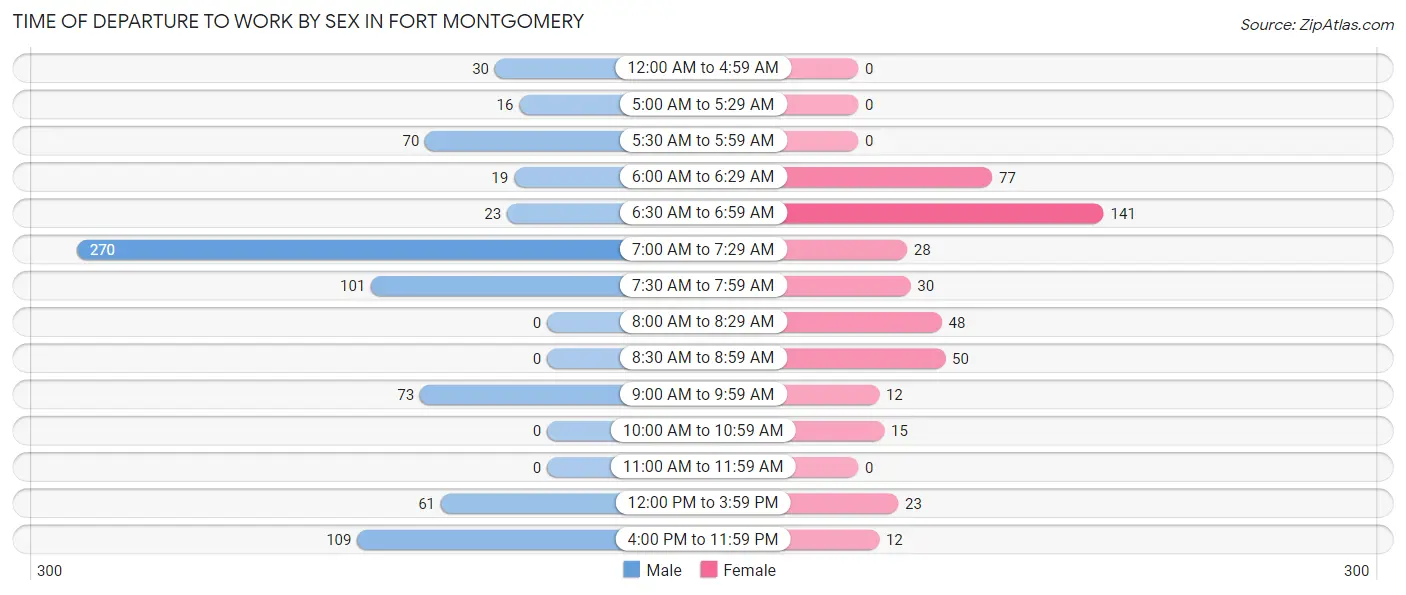
| Time of Departure | Male | Female |
| 12:00 AM to 4:59 AM | 30 (3.9%) | 0 (0.0%) |
| 5:00 AM to 5:29 AM | 16 (2.1%) | 0 (0.0%) |
| 5:30 AM to 5:59 AM | 70 (9.1%) | 0 (0.0%) |
| 6:00 AM to 6:29 AM | 19 (2.5%) | 77 (17.7%) |
| 6:30 AM to 6:59 AM | 23 (3.0%) | 141 (32.3%) |
| 7:00 AM to 7:29 AM | 270 (35.0%) | 28 (6.4%) |
| 7:30 AM to 7:59 AM | 101 (13.1%) | 30 (6.9%) |
| 8:00 AM to 8:29 AM | 0 (0.0%) | 48 (11.0%) |
| 8:30 AM to 8:59 AM | 0 (0.0%) | 50 (11.5%) |
| 9:00 AM to 9:59 AM | 73 (9.5%) | 12 (2.8%) |
| 10:00 AM to 10:59 AM | 0 (0.0%) | 15 (3.4%) |
| 11:00 AM to 11:59 AM | 0 (0.0%) | 0 (0.0%) |
| 12:00 PM to 3:59 PM | 61 (7.9%) | 23 (5.3%) |
| 4:00 PM to 11:59 PM | 109 (14.1%) | 12 (2.8%) |
| Total | 772 (100.0%) | 436 (100.0%) |
Housing Occupancy in Fort Montgomery
Occupancy by Ownership in Fort Montgomery
Of the total 910 dwellings in Fort Montgomery, owner-occupied units account for 493 (54.2%), while renter-occupied units make up 417 (45.8%).
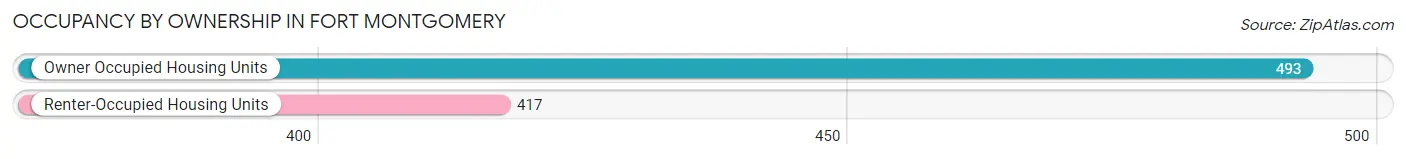
| Occupancy | # Housing Units | % Housing Units |
| Owner Occupied Housing Units | 493 | 54.2% |
| Renter-Occupied Housing Units | 417 | 45.8% |
| Total Occupied Housing Units | 910 | 100.0% |
Occupancy by Household Size in Fort Montgomery
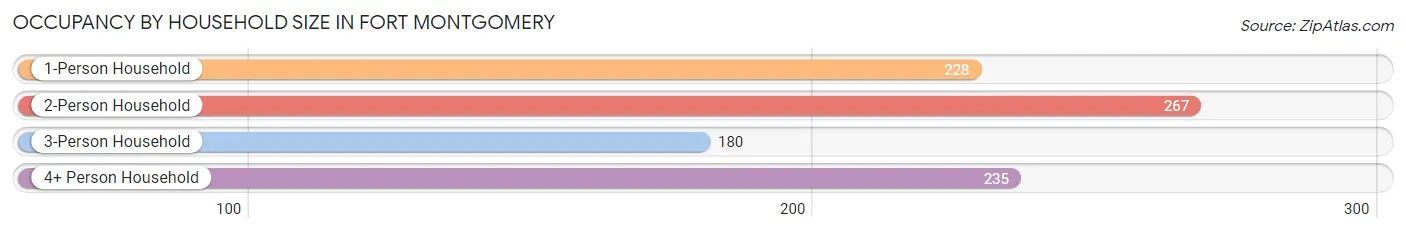
| Household Size | # Housing Units | % Housing Units |
| 1-Person Household | 228 | 25.1% |
| 2-Person Household | 267 | 29.3% |
| 3-Person Household | 180 | 19.8% |
| 4+ Person Household | 235 | 25.8% |
| Total Housing Units | 910 | 100.0% |
Occupancy by Ownership by Household Size in Fort Montgomery
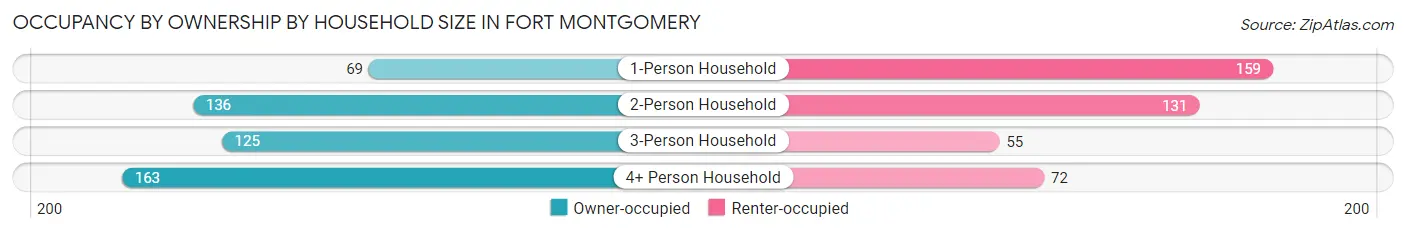
| Household Size | Owner-occupied | Renter-occupied |
| 1-Person Household | 69 (30.3%) | 159 (69.7%) |
| 2-Person Household | 136 (50.9%) | 131 (49.1%) |
| 3-Person Household | 125 (69.4%) | 55 (30.6%) |
| 4+ Person Household | 163 (69.4%) | 72 (30.6%) |
| Total Housing Units | 493 (54.2%) | 417 (45.8%) |
Occupancy by Educational Attainment in Fort Montgomery
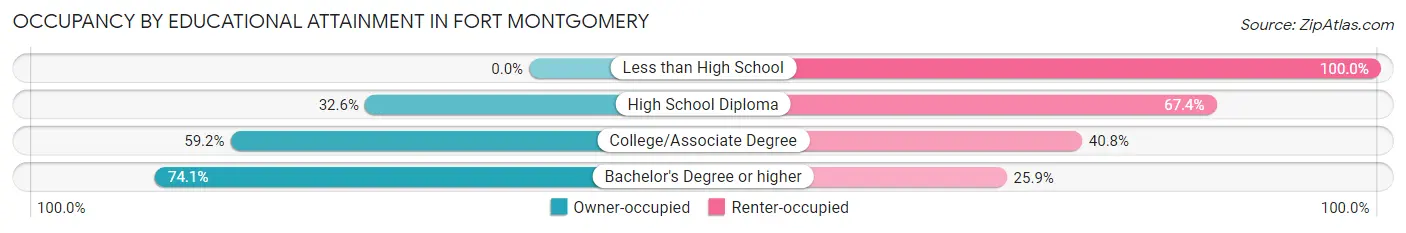
| Household Size | Owner-occupied | Renter-occupied |
| Less than High School | 0 (0.0%) | 14 (100.0%) |
| High School Diploma | 98 (32.6%) | 203 (67.4%) |
| College/Associate Degree | 183 (59.2%) | 126 (40.8%) |
| Bachelor's Degree or higher | 212 (74.1%) | 74 (25.9%) |
Occupancy by Age of Householder in Fort Montgomery
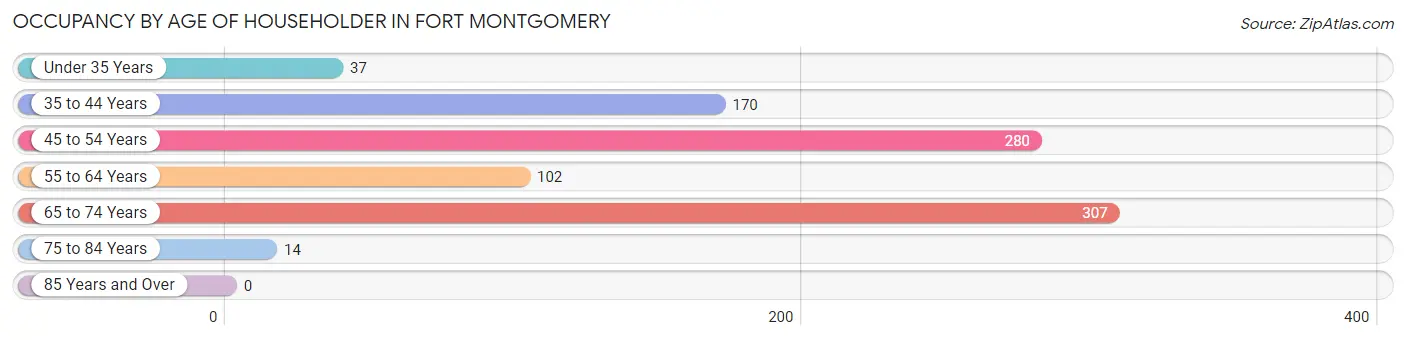
| Age Bracket | # Households | % Households |
| Under 35 Years | 37 | 4.1% |
| 35 to 44 Years | 170 | 18.7% |
| 45 to 54 Years | 280 | 30.8% |
| 55 to 64 Years | 102 | 11.2% |
| 65 to 74 Years | 307 | 33.7% |
| 75 to 84 Years | 14 | 1.5% |
| 85 Years and Over | 0 | 0.0% |
| Total | 910 | 100.0% |
Housing Finances in Fort Montgomery
Median Income by Occupancy in Fort Montgomery
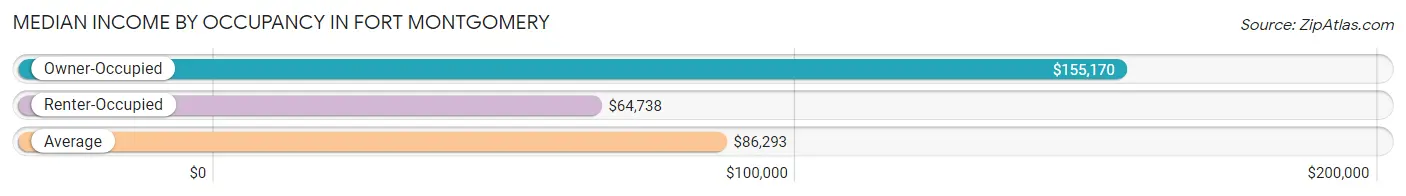
| Occupancy Type | # Households | Median Income |
| Owner-Occupied | 493 (54.2%) | $155,170 |
| Renter-Occupied | 417 (45.8%) | $64,738 |
| Average | 910 (100.0%) | $86,293 |
Occupancy by Householder Income Bracket in Fort Montgomery
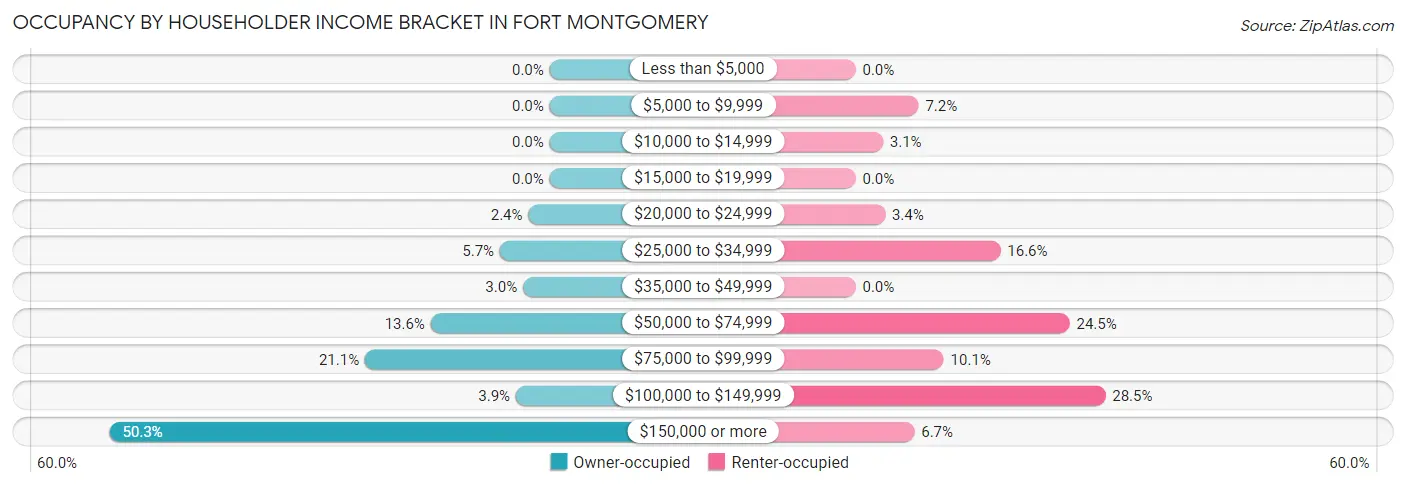
| Income Bracket | Owner-occupied | Renter-occupied |
| Less than $5,000 | 0 (0.0%) | 0 (0.0%) |
| $5,000 to $9,999 | 0 (0.0%) | 30 (7.2%) |
| $10,000 to $14,999 | 0 (0.0%) | 13 (3.1%) |
| $15,000 to $19,999 | 0 (0.0%) | 0 (0.0%) |
| $20,000 to $24,999 | 12 (2.4%) | 14 (3.4%) |
| $25,000 to $34,999 | 28 (5.7%) | 69 (16.6%) |
| $35,000 to $49,999 | 15 (3.0%) | 0 (0.0%) |
| $50,000 to $74,999 | 67 (13.6%) | 102 (24.5%) |
| $75,000 to $99,999 | 104 (21.1%) | 42 (10.1%) |
| $100,000 to $149,999 | 19 (3.8%) | 119 (28.5%) |
| $150,000 or more | 248 (50.3%) | 28 (6.7%) |
| Total | 493 (100.0%) | 417 (100.0%) |
Monthly Housing Cost Tiers in Fort Montgomery
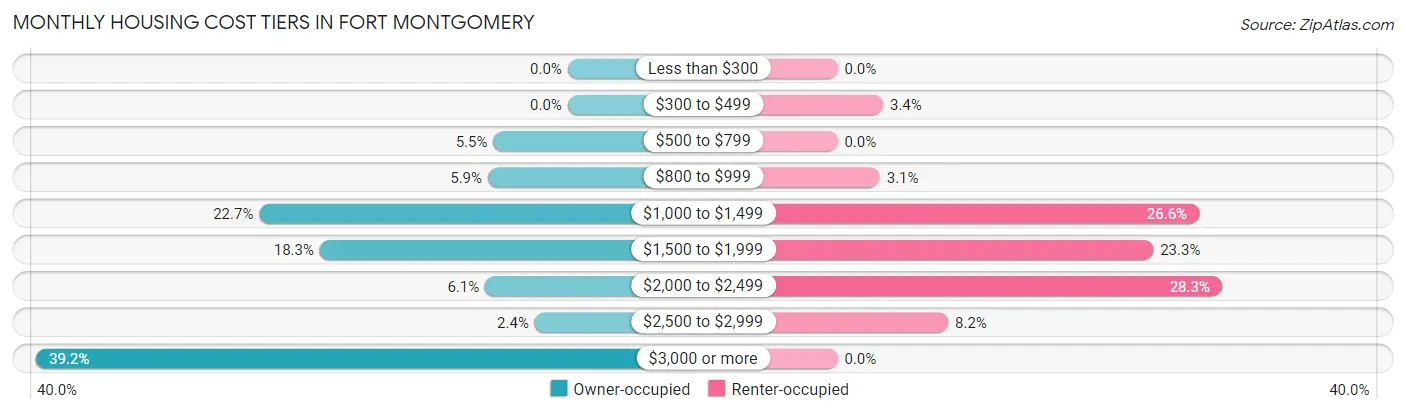
| Monthly Cost | Owner-occupied | Renter-occupied |
| Less than $300 | 0 (0.0%) | 0 (0.0%) |
| $300 to $499 | 0 (0.0%) | 14 (3.4%) |
| $500 to $799 | 27 (5.5%) | 0 (0.0%) |
| $800 to $999 | 29 (5.9%) | 13 (3.1%) |
| $1,000 to $1,499 | 112 (22.7%) | 111 (26.6%) |
| $1,500 to $1,999 | 90 (18.3%) | 97 (23.3%) |
| $2,000 to $2,499 | 30 (6.1%) | 118 (28.3%) |
| $2,500 to $2,999 | 12 (2.4%) | 34 (8.2%) |
| $3,000 or more | 193 (39.2%) | 0 (0.0%) |
| Total | 493 (100.0%) | 417 (100.0%) |
Physical Housing Characteristics in Fort Montgomery
Housing Structures in Fort Montgomery
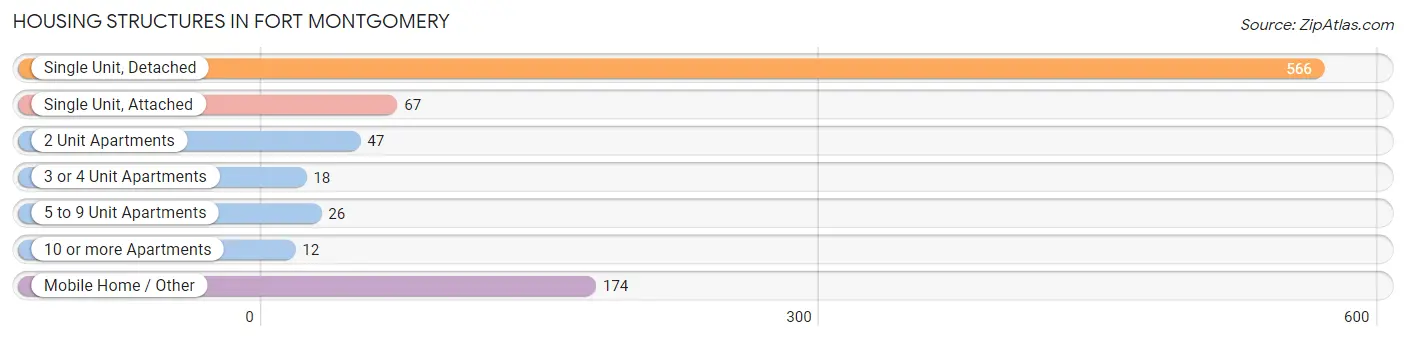
| Structure Type | # Housing Units | % Housing Units |
| Single Unit, Detached | 566 | 62.2% |
| Single Unit, Attached | 67 | 7.4% |
| 2 Unit Apartments | 47 | 5.2% |
| 3 or 4 Unit Apartments | 18 | 2.0% |
| 5 to 9 Unit Apartments | 26 | 2.9% |
| 10 or more Apartments | 12 | 1.3% |
| Mobile Home / Other | 174 | 19.1% |
| Total | 910 | 100.0% |
Housing Structures by Occupancy in Fort Montgomery
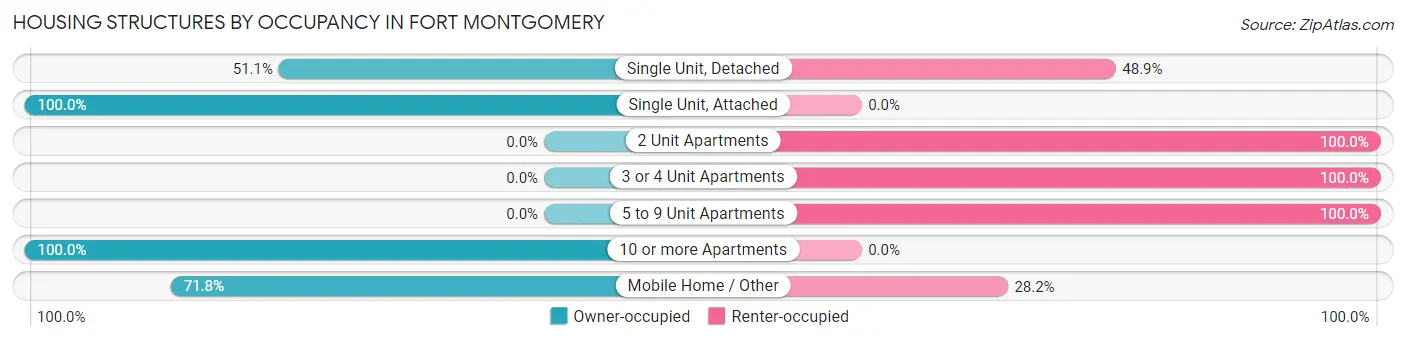
| Structure Type | Owner-occupied | Renter-occupied |
| Single Unit, Detached | 289 (51.1%) | 277 (48.9%) |
| Single Unit, Attached | 67 (100.0%) | 0 (0.0%) |
| 2 Unit Apartments | 0 (0.0%) | 47 (100.0%) |
| 3 or 4 Unit Apartments | 0 (0.0%) | 18 (100.0%) |
| 5 to 9 Unit Apartments | 0 (0.0%) | 26 (100.0%) |
| 10 or more Apartments | 12 (100.0%) | 0 (0.0%) |
| Mobile Home / Other | 125 (71.8%) | 49 (28.2%) |
| Total | 493 (54.2%) | 417 (45.8%) |
Housing Structures by Number of Rooms in Fort Montgomery
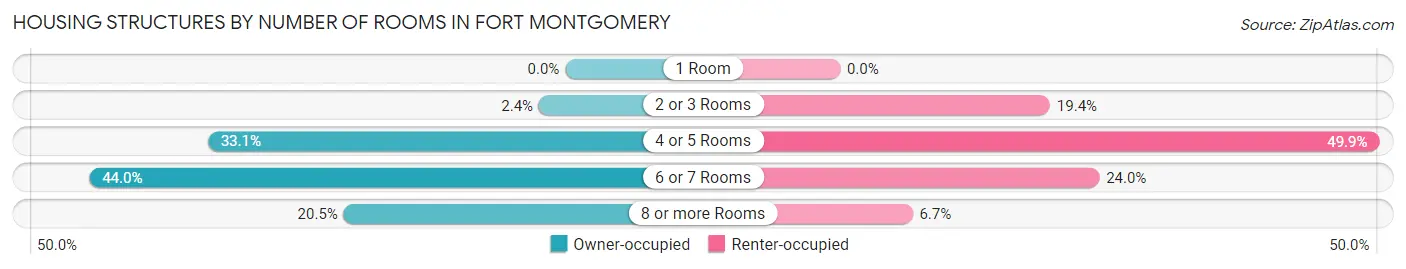
| Number of Rooms | Owner-occupied | Renter-occupied |
| 1 Room | 0 (0.0%) | 0 (0.0%) |
| 2 or 3 Rooms | 12 (2.4%) | 81 (19.4%) |
| 4 or 5 Rooms | 163 (33.1%) | 208 (49.9%) |
| 6 or 7 Rooms | 217 (44.0%) | 100 (24.0%) |
| 8 or more Rooms | 101 (20.5%) | 28 (6.7%) |
| Total | 493 (100.0%) | 417 (100.0%) |
Housing Structure by Heating Type in Fort Montgomery
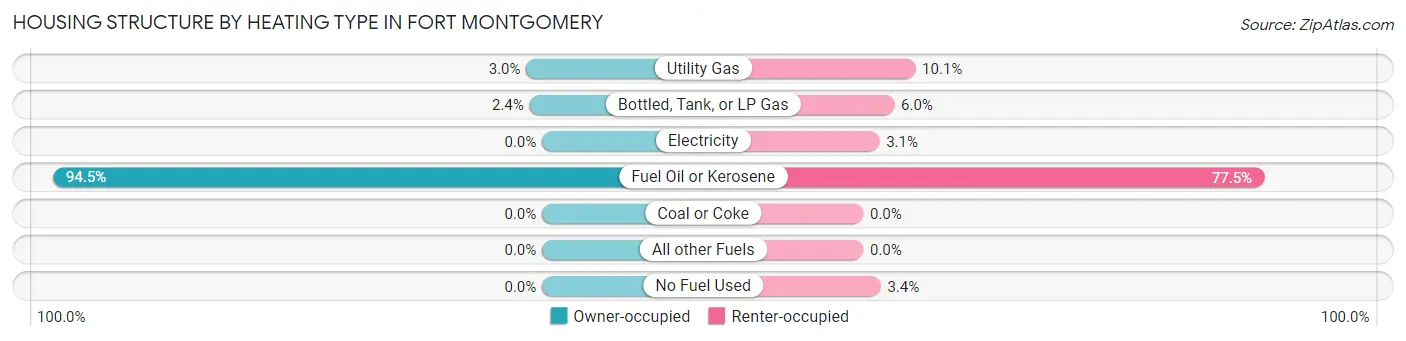
| Heating Type | Owner-occupied | Renter-occupied |
| Utility Gas | 15 (3.0%) | 42 (10.1%) |
| Bottled, Tank, or LP Gas | 12 (2.4%) | 25 (6.0%) |
| Electricity | 0 (0.0%) | 13 (3.1%) |
| Fuel Oil or Kerosene | 466 (94.5%) | 323 (77.5%) |
| Coal or Coke | 0 (0.0%) | 0 (0.0%) |
| All other Fuels | 0 (0.0%) | 0 (0.0%) |
| No Fuel Used | 0 (0.0%) | 14 (3.4%) |
| Total | 493 (100.0%) | 417 (100.0%) |
Household Vehicle Usage in Fort Montgomery
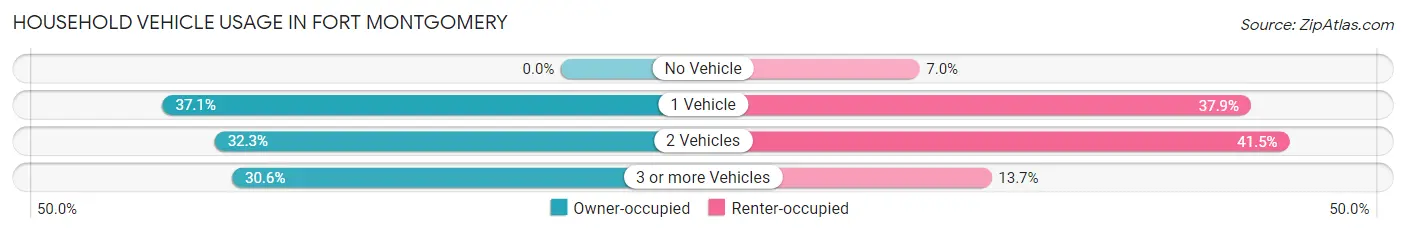
| Vehicles per Household | Owner-occupied | Renter-occupied |
| No Vehicle | 0 (0.0%) | 29 (7.0%) |
| 1 Vehicle | 183 (37.1%) | 158 (37.9%) |
| 2 Vehicles | 159 (32.3%) | 173 (41.5%) |
| 3 or more Vehicles | 151 (30.6%) | 57 (13.7%) |
| Total | 493 (100.0%) | 417 (100.0%) |
Real Estate & Mortgages in Fort Montgomery
Real Estate and Mortgage Overview in Fort Montgomery
| Characteristic | Without Mortgage | With Mortgage |
| Housing Units | 150 | 343 |
| Median Property Value | $225,900 | $324,700 |
| Median Household Income | $92,685 | $198 |
| Monthly Housing Costs | $1,248 | $193 |
| Real Estate Taxes | $7,315 | $52 |
Property Value by Mortgage Status in Fort Montgomery
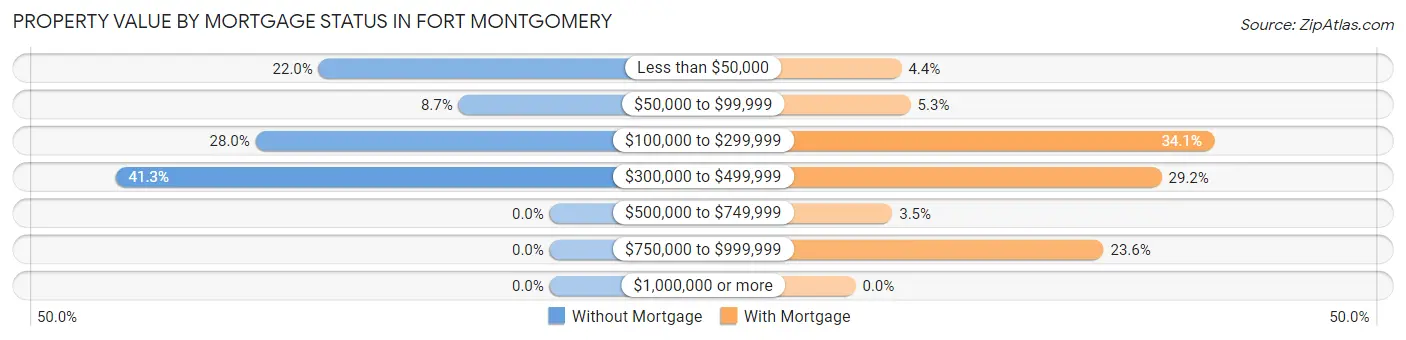
| Property Value | Without Mortgage | With Mortgage |
| Less than $50,000 | 33 (22.0%) | 15 (4.4%) |
| $50,000 to $99,999 | 13 (8.7%) | 18 (5.2%) |
| $100,000 to $299,999 | 42 (28.0%) | 117 (34.1%) |
| $300,000 to $499,999 | 62 (41.3%) | 100 (29.1%) |
| $500,000 to $749,999 | 0 (0.0%) | 12 (3.5%) |
| $750,000 to $999,999 | 0 (0.0%) | 81 (23.6%) |
| $1,000,000 or more | 0 (0.0%) | 0 (0.0%) |
| Total | 150 (100.0%) | 343 (100.0%) |
Household Income by Mortgage Status in Fort Montgomery
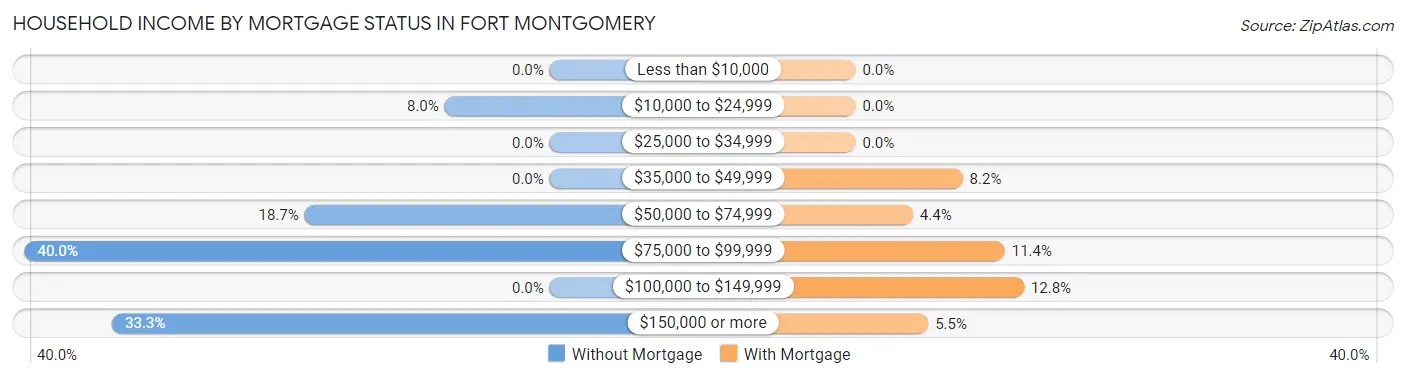
| Household Income | Without Mortgage | With Mortgage |
| Less than $10,000 | 0 (0.0%) | 0 (0.0%) |
| $10,000 to $24,999 | 12 (8.0%) | 0 (0.0%) |
| $25,000 to $34,999 | 0 (0.0%) | 0 (0.0%) |
| $35,000 to $49,999 | 0 (0.0%) | 28 (8.2%) |
| $50,000 to $74,999 | 28 (18.7%) | 15 (4.4%) |
| $75,000 to $99,999 | 60 (40.0%) | 39 (11.4%) |
| $100,000 to $149,999 | 0 (0.0%) | 44 (12.8%) |
| $150,000 or more | 50 (33.3%) | 19 (5.5%) |
| Total | 150 (100.0%) | 343 (100.0%) |
Property Value to Household Income Ratio in Fort Montgomery
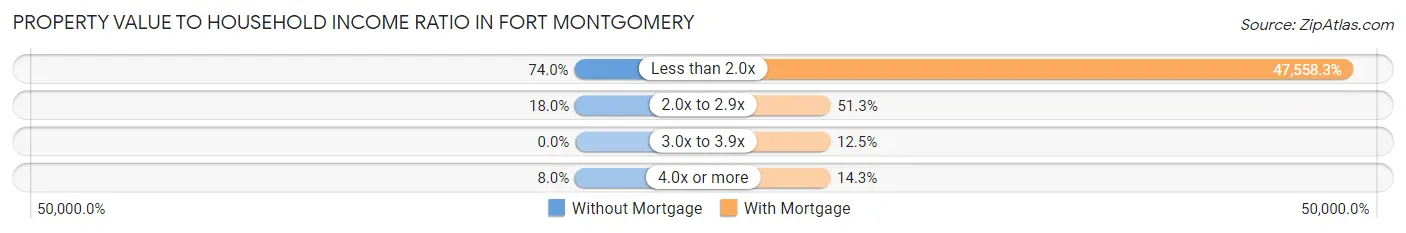
| Value-to-Income Ratio | Without Mortgage | With Mortgage |
| Less than 2.0x | 111 (74.0%) | 163,125 (47,558.3%) |
| 2.0x to 2.9x | 27 (18.0%) | 176 (51.3%) |
| 3.0x to 3.9x | 0 (0.0%) | 43 (12.5%) |
| 4.0x or more | 12 (8.0%) | 49 (14.3%) |
| Total | 150 (100.0%) | 343 (100.0%) |
Real Estate Taxes by Mortgage Status in Fort Montgomery
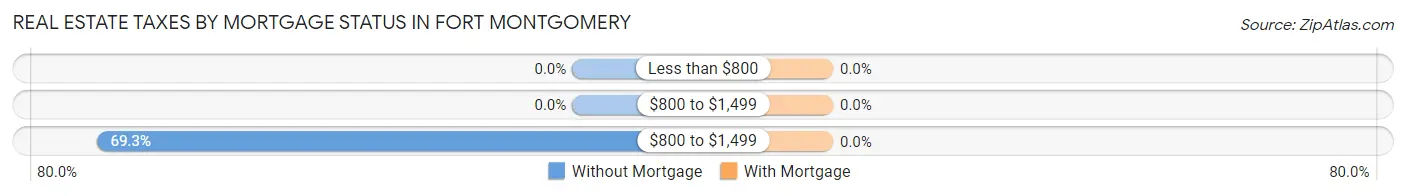
| Property Taxes | Without Mortgage | With Mortgage |
| Less than $800 | 0 (0.0%) | 0 (0.0%) |
| $800 to $1,499 | 0 (0.0%) | 0 (0.0%) |
| $800 to $1,499 | 104 (69.3%) | 0 (0.0%) |
| Total | 150 (100.0%) | 343 (100.0%) |
Health & Disability in Fort Montgomery
Health Insurance Coverage by Age in Fort Montgomery
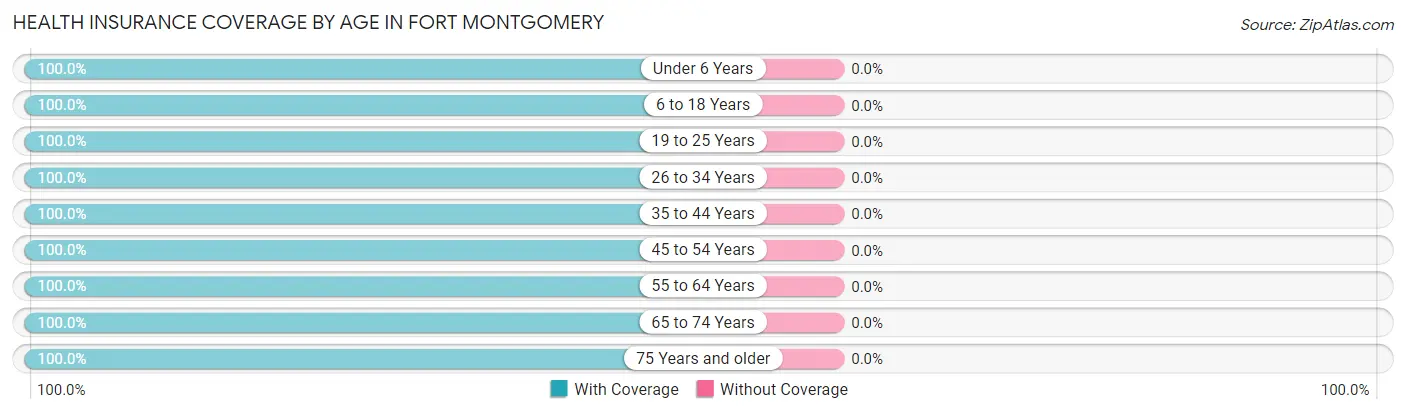
| Age Bracket | With Coverage | Without Coverage |
| Under 6 Years | 225 (100.0%) | 0 (0.0%) |
| 6 to 18 Years | 342 (100.0%) | 0 (0.0%) |
| 19 to 25 Years | 159 (100.0%) | 0 (0.0%) |
| 26 to 34 Years | 121 (100.0%) | 0 (0.0%) |
| 35 to 44 Years | 442 (100.0%) | 0 (0.0%) |
| 45 to 54 Years | 406 (100.0%) | 0 (0.0%) |
| 55 to 64 Years | 267 (100.0%) | 0 (0.0%) |
| 65 to 74 Years | 422 (100.0%) | 0 (0.0%) |
| 75 Years and older | 69 (100.0%) | 0 (0.0%) |
| Total | 2,453 (100.0%) | 0 (0.0%) |
Health Insurance Coverage by Citizenship Status in Fort Montgomery
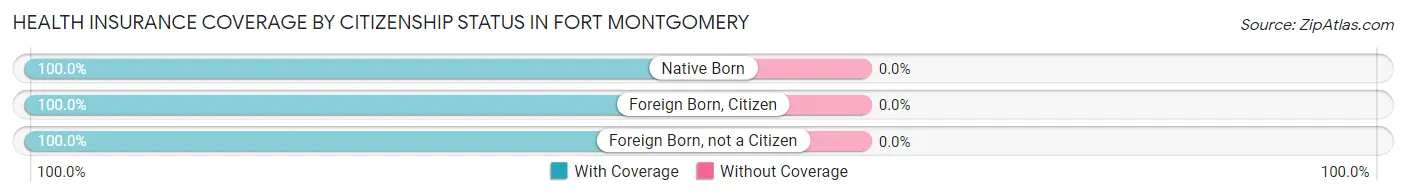
| Citizenship Status | With Coverage | Without Coverage |
| Native Born | 225 (100.0%) | 0 (0.0%) |
| Foreign Born, Citizen | 342 (100.0%) | 0 (0.0%) |
| Foreign Born, not a Citizen | 159 (100.0%) | 0 (0.0%) |
Health Insurance Coverage by Household Income in Fort Montgomery
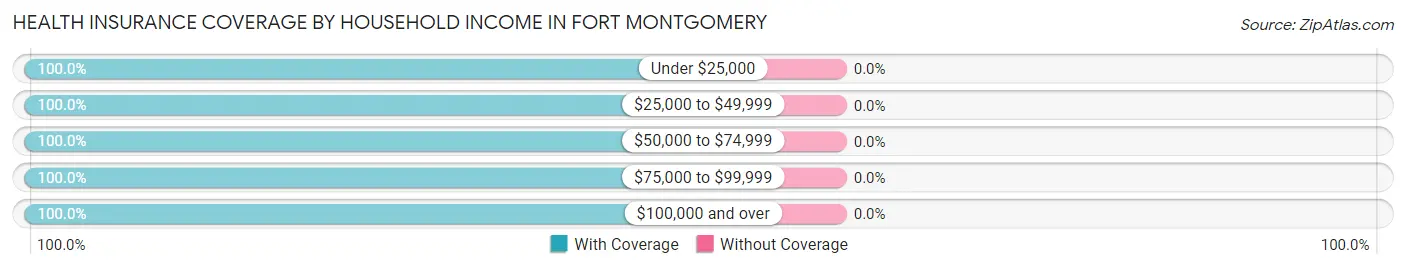
| Household Income | With Coverage | Without Coverage |
| Under $25,000 | 97 (100.0%) | 0 (0.0%) |
| $25,000 to $49,999 | 195 (100.0%) | 0 (0.0%) |
| $50,000 to $74,999 | 520 (100.0%) | 0 (0.0%) |
| $75,000 to $99,999 | 376 (100.0%) | 0 (0.0%) |
| $100,000 and over | 1,265 (100.0%) | 0 (0.0%) |
Public vs Private Health Insurance Coverage by Age in Fort Montgomery
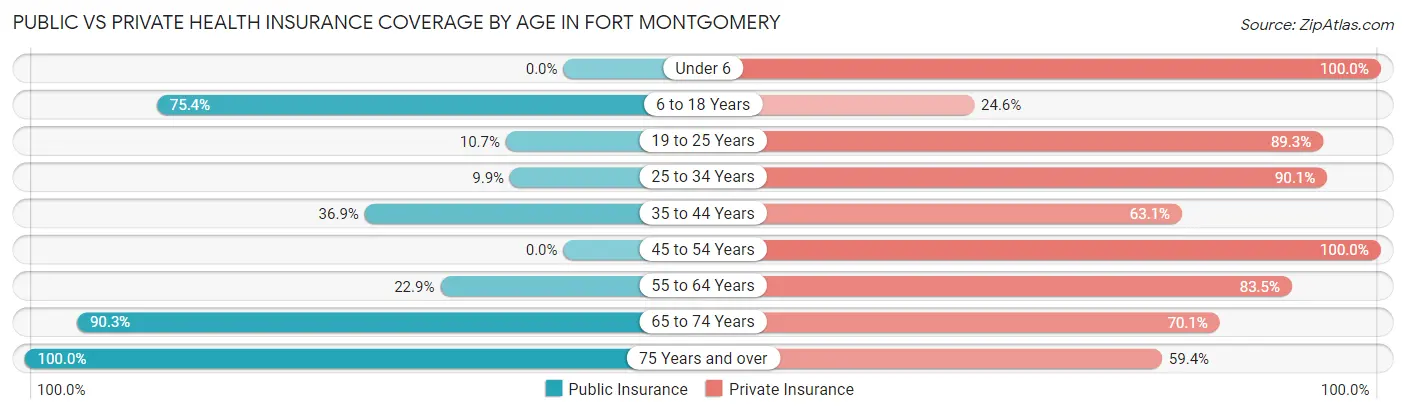
| Age Bracket | Public Insurance | Private Insurance |
| Under 6 | 0 (0.0%) | 225 (100.0%) |
| 6 to 18 Years | 258 (75.4%) | 84 (24.6%) |
| 19 to 25 Years | 17 (10.7%) | 142 (89.3%) |
| 25 to 34 Years | 12 (9.9%) | 109 (90.1%) |
| 35 to 44 Years | 163 (36.9%) | 279 (63.1%) |
| 45 to 54 Years | 0 (0.0%) | 406 (100.0%) |
| 55 to 64 Years | 61 (22.9%) | 223 (83.5%) |
| 65 to 74 Years | 381 (90.3%) | 296 (70.1%) |
| 75 Years and over | 69 (100.0%) | 41 (59.4%) |
| Total | 961 (39.2%) | 1,805 (73.6%) |
Disability Status by Sex by Age in Fort Montgomery
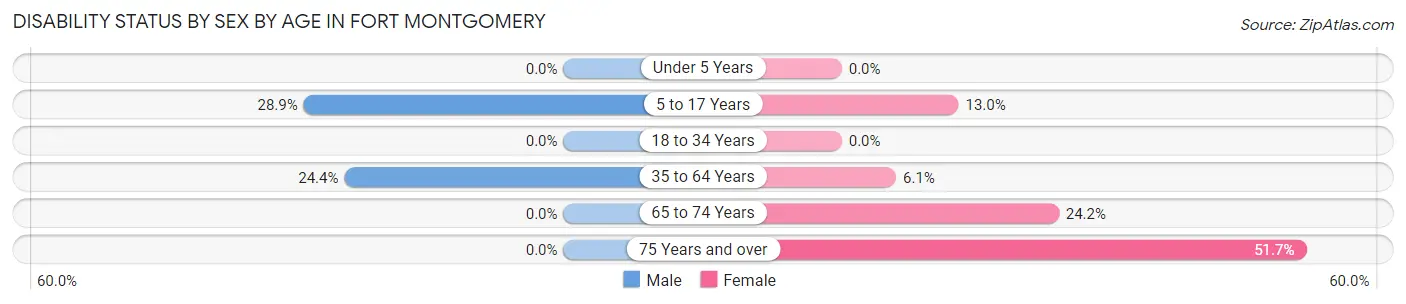
| Age Bracket | Male | Female |
| Under 5 Years | 0 (0.0%) | 0 (0.0%) |
| 5 to 17 Years | 70 (28.9%) | 13 (13.0%) |
| 18 to 34 Years | 0 (0.0%) | 0 (0.0%) |
| 35 to 64 Years | 143 (24.4%) | 32 (6.0%) |
| 65 to 74 Years | 0 (0.0%) | 29 (24.2%) |
| 75 Years and over | 0 (0.0%) | 30 (51.7%) |
Disability Class by Sex by Age in Fort Montgomery
Disability Class: Hearing Difficulty
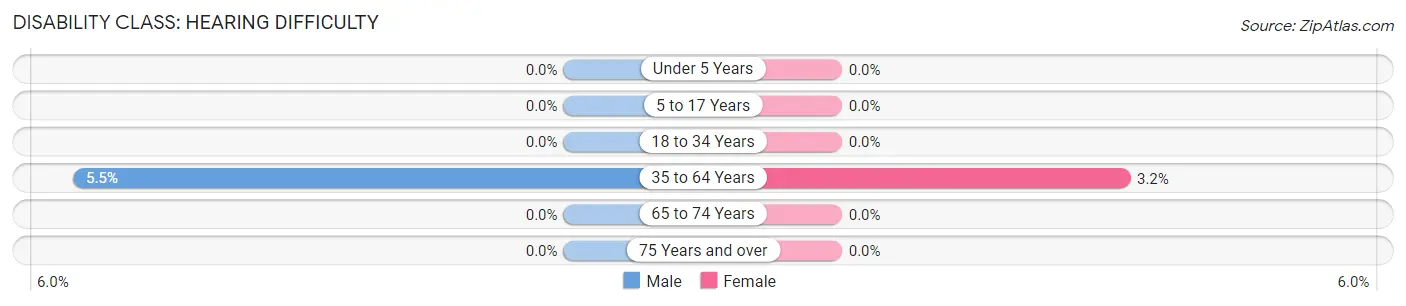
| Age Bracket | Male | Female |
| Under 5 Years | 0 (0.0%) | 0 (0.0%) |
| 5 to 17 Years | 0 (0.0%) | 0 (0.0%) |
| 18 to 34 Years | 0 (0.0%) | 0 (0.0%) |
| 35 to 64 Years | 32 (5.5%) | 17 (3.2%) |
| 65 to 74 Years | 0 (0.0%) | 0 (0.0%) |
| 75 Years and over | 0 (0.0%) | 0 (0.0%) |
Disability Class: Vision Difficulty
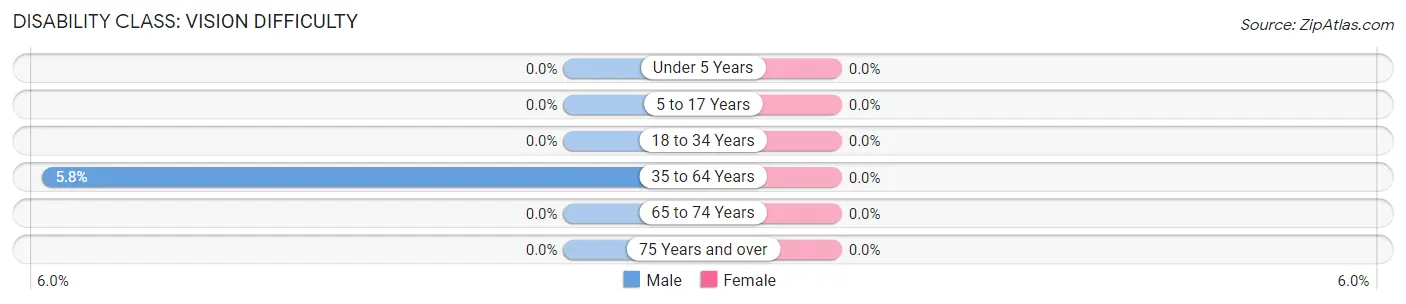
| Age Bracket | Male | Female |
| Under 5 Years | 0 (0.0%) | 0 (0.0%) |
| 5 to 17 Years | 0 (0.0%) | 0 (0.0%) |
| 18 to 34 Years | 0 (0.0%) | 0 (0.0%) |
| 35 to 64 Years | 34 (5.8%) | 0 (0.0%) |
| 65 to 74 Years | 0 (0.0%) | 0 (0.0%) |
| 75 Years and over | 0 (0.0%) | 0 (0.0%) |
Disability Class: Cognitive Difficulty
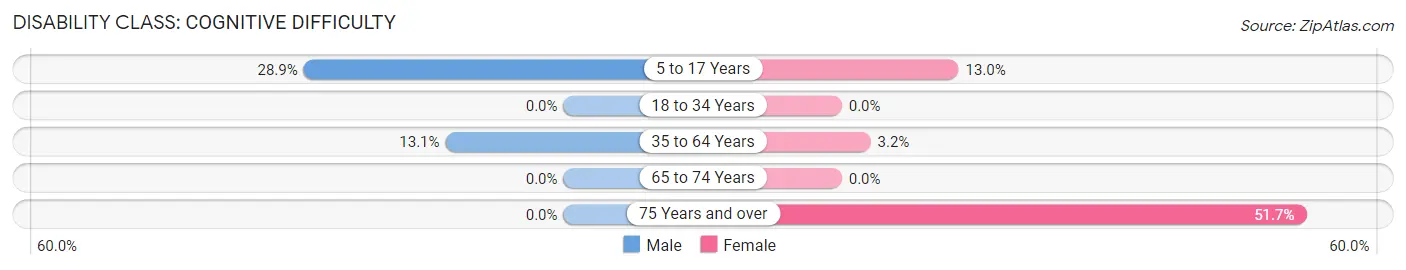
| Age Bracket | Male | Female |
| 5 to 17 Years | 70 (28.9%) | 13 (13.0%) |
| 18 to 34 Years | 0 (0.0%) | 0 (0.0%) |
| 35 to 64 Years | 77 (13.1%) | 17 (3.2%) |
| 65 to 74 Years | 0 (0.0%) | 0 (0.0%) |
| 75 Years and over | 0 (0.0%) | 30 (51.7%) |
Disability Class: Ambulatory Difficulty
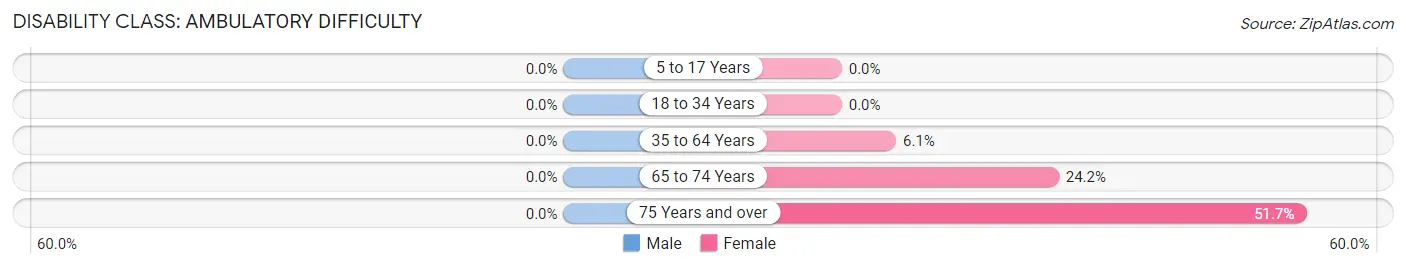
| Age Bracket | Male | Female |
| 5 to 17 Years | 0 (0.0%) | 0 (0.0%) |
| 18 to 34 Years | 0 (0.0%) | 0 (0.0%) |
| 35 to 64 Years | 0 (0.0%) | 32 (6.0%) |
| 65 to 74 Years | 0 (0.0%) | 29 (24.2%) |
| 75 Years and over | 0 (0.0%) | 30 (51.7%) |
Disability Class: Self-Care Difficulty
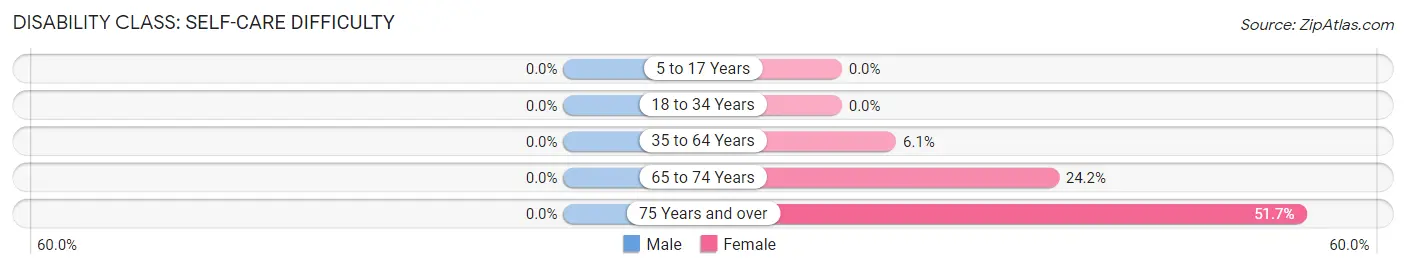
| Age Bracket | Male | Female |
| 5 to 17 Years | 0 (0.0%) | 0 (0.0%) |
| 18 to 34 Years | 0 (0.0%) | 0 (0.0%) |
| 35 to 64 Years | 0 (0.0%) | 32 (6.0%) |
| 65 to 74 Years | 0 (0.0%) | 29 (24.2%) |
| 75 Years and over | 0 (0.0%) | 30 (51.7%) |
Technology Access in Fort Montgomery
Computing Device Access in Fort Montgomery
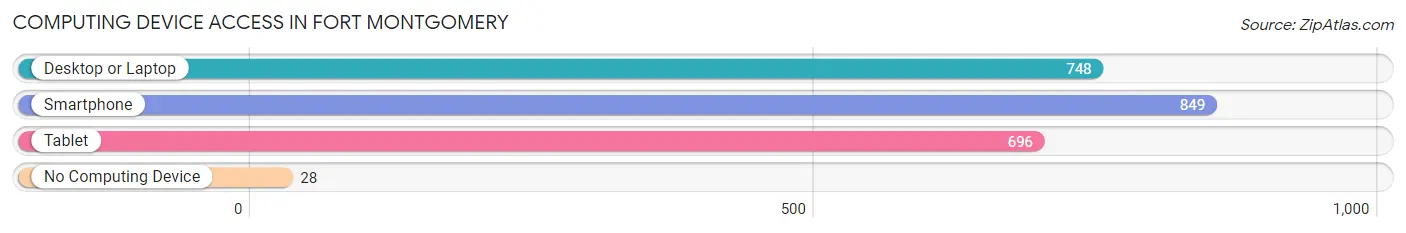
| Device Type | # Households | % Households |
| Desktop or Laptop | 748 | 82.2% |
| Smartphone | 849 | 93.3% |
| Tablet | 696 | 76.5% |
| No Computing Device | 28 | 3.1% |
| Total | 910 | 100.0% |
Internet Access in Fort Montgomery
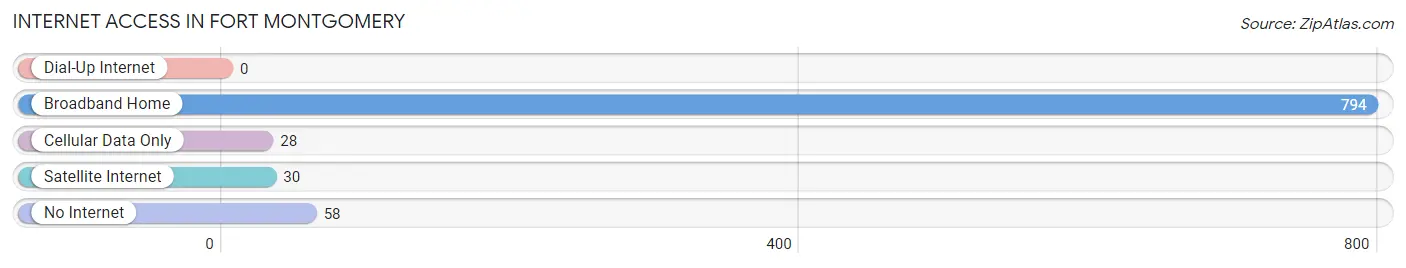
| Internet Type | # Households | % Households |
| Dial-Up Internet | 0 | 0.0% |
| Broadband Home | 794 | 87.3% |
| Cellular Data Only | 28 | 3.1% |
| Satellite Internet | 30 | 3.3% |
| No Internet | 58 | 6.4% |
| Total | 910 | 100.0% |
Fort Montgomery Summary
Montgomery, New York is a small hamlet located in the Town of Highlands in Orange County, New York. It is situated on the west bank of the Hudson River, approximately 60 miles north of New York City. The hamlet is named after General Richard Montgomery, who was killed in the Battle of Quebec during the Revolutionary War.
History
The area that is now Montgomery was originally inhabited by the Munsee Indians, a branch of the Lenape tribe. The first European settlers arrived in the area in the late 17th century, and the hamlet was officially established in 1772. The hamlet was originally known as “Smith’s Clove”, after the first settler, John Smith.
In 1777, the hamlet was renamed “Fort Montgomery” in honor of General Richard Montgomery, who was killed in the Battle of Quebec during the Revolutionary War. The fort was built to protect the Hudson River from British forces. The fort was destroyed by the British in 1777, but was rebuilt in 1778.
The hamlet was incorporated in 1809, and the name was changed to “Montgomery”. The hamlet grew steadily throughout the 19th century, and by the early 20th century, it had become a popular summer resort destination.
Geography
Montgomery is located in the Town of Highlands in Orange County, New York. It is situated on the west bank of the Hudson River, approximately 60 miles north of New York City. The hamlet is bordered by the Town of Newburgh to the north, the Town of Cornwall to the east, and the Town of Highlands to the south and west.
The terrain of Montgomery is mostly flat, with some rolling hills. The highest point in the hamlet is the summit of Mount Beacon, which rises to an elevation of 1,664 feet. The Hudson River forms the eastern boundary of the hamlet.
Economy
The economy of Montgomery is largely based on tourism. The hamlet is home to several popular attractions, including the Fort Montgomery State Historic Site, the Hudson Highlands State Park, and the Bear Mountain State Park. The hamlet is also home to several wineries, breweries, and distilleries.
The hamlet is also home to several small businesses, including restaurants, retail stores, and professional services. The hamlet is also home to several manufacturing companies, including a paper mill and a plastics factory.
Demographics
As of the 2010 census, the population of Montgomery was 2,845. The racial makeup of the hamlet was 94.3% White, 2.2% African American, 0.7% Native American, 0.7% Asian, 0.2% Pacific Islander, and 1.1% from other races. Hispanic or Latino of any race were 3.2% of the population.
The median household income in Montgomery was $50,972, and the median family income was $60,972. The per capita income was $25,972. About 8.2% of families and 10.2% of the population were below the poverty line, including 14.2% of those under age 18 and 5.2% of those age 65 or over.
The population of Montgomery is largely composed of families. About 33.2% of households have children under the age of 18 living with them, and the median age of the population is 40.7 years. The hamlet is also home to a large number of retirees, with about 20.2% of the population over the age of 65.
Common Questions
What is Per Capita Income in Fort Montgomery?
Per Capita income in Fort Montgomery is $48,025.
What is the Median Family Income in Fort Montgomery?
Median Family Income in Fort Montgomery is $145,978.
What is the Median Household income in Fort Montgomery?
Median Household Income in Fort Montgomery is $86,293.
What is Income or Wage Gap in Fort Montgomery?
Income or Wage Gap in Fort Montgomery is 16.4%.
Women in Fort Montgomery earn 83.6 cents for every dollar earned by a man.
What is Inequality or Gini Index in Fort Montgomery?
Inequality or Gini Index in Fort Montgomery is 0.41.
What is the Total Population of Fort Montgomery?
Total Population of Fort Montgomery is 2,453.
What is the Total Male Population of Fort Montgomery?
Total Male Population of Fort Montgomery is 1,415.
What is the Total Female Population of Fort Montgomery?
Total Female Population of Fort Montgomery is 1,038.
What is the Ratio of Males per 100 Females in Fort Montgomery?
There are 136.32 Males per 100 Females in Fort Montgomery.
What is the Ratio of Females per 100 Males in Fort Montgomery?
There are 73.36 Females per 100 Males in Fort Montgomery.
What is the Median Population Age in Fort Montgomery?
Median Population Age in Fort Montgomery is 44.5 Years.
What is the Average Family Size in Fort Montgomery
Average Family Size in Fort Montgomery is 3.5 People.
What is the Average Household Size in Fort Montgomery
Average Household Size in Fort Montgomery is 2.7 People.
How Large is the Labor Force in Fort Montgomery?
There are 1,477 People in the Labor Forcein in Fort Montgomery.
What is the Percentage of People in the Labor Force in Fort Montgomery?
77.1% of People are in the Labor Force in Fort Montgomery.
What is the Unemployment Rate in Fort Montgomery?
Unemployment Rate in Fort Montgomery is 3.8%.