New Cassel, NY Map & Demographics
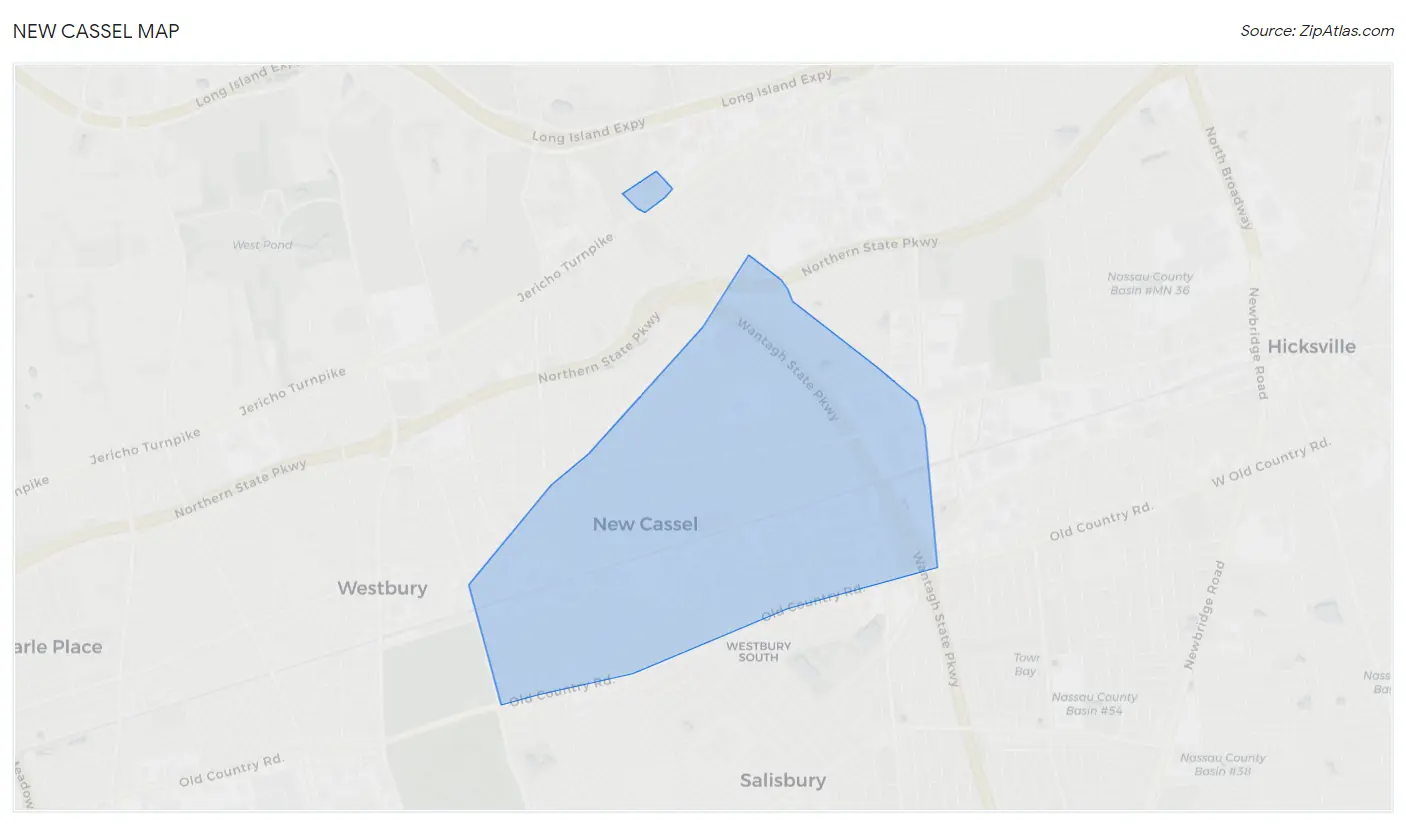
New Cassel Map
New Cassel Overview
$29,868
PER CAPITA INCOME
$115,776
AVG FAMILY INCOME
$112,569
AVG HOUSEHOLD INCOME
35.5%
WAGE / INCOME GAP [ % ]
64.5¢/ $1
WAGE / INCOME GAP [ $ ]
0.43
INEQUALITY / GINI INDEX
15,127
TOTAL POPULATION
7,414
MALE POPULATION
7,713
FEMALE POPULATION
96.12
MALES / 100 FEMALES
104.03
FEMALES / 100 MALES
29.0
MEDIAN AGE
4.9
AVG FAMILY SIZE
4.5
AVG HOUSEHOLD SIZE
7,944
LABOR FORCE [ PEOPLE ]
71.0%
PERCENT IN LABOR FORCE
3.1%
UNEMPLOYMENT RATE
Income in New Cassel
Income Overview in New Cassel
Per Capita Income in New Cassel is $29,868, while median incomes of families and households are $115,776 and $112,569 respectively.
| Characteristic | Number | Measure |
| Per Capita Income | 15,127 | $29,868 |
| Median Family Income | 2,774 | $115,776 |
| Mean Family Income | 2,774 | $133,458 |
| Median Household Income | 3,341 | $112,569 |
| Mean Household Income | 3,341 | $128,783 |
| Income Deficit | 2,774 | $0 |
| Wage / Income Gap (%) | 15,127 | 35.50% |
| Wage / Income Gap ($) | 15,127 | 64.50¢ per $1 |
| Gini / Inequality Index | 15,127 | 0.43 |
Earnings by Sex in New Cassel
Average Earnings in New Cassel are $34,861, $42,842 for men and $27,633 for women, a difference of 35.5%.
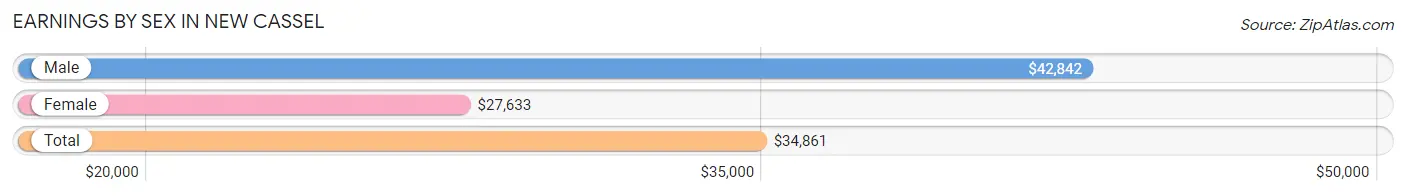
| Sex | Number | Average Earnings |
| Male | 4,251 (51.1%) | $42,842 |
| Female | 4,075 (48.9%) | $27,633 |
| Total | 8,326 (100.0%) | $34,861 |
Earnings by Sex by Income Bracket in New Cassel
The most common earnings brackets in New Cassel are $40,000 to $44,999 for men (442 | 10.4%) and $55,000 to $64,999 for women (396 | 9.7%).
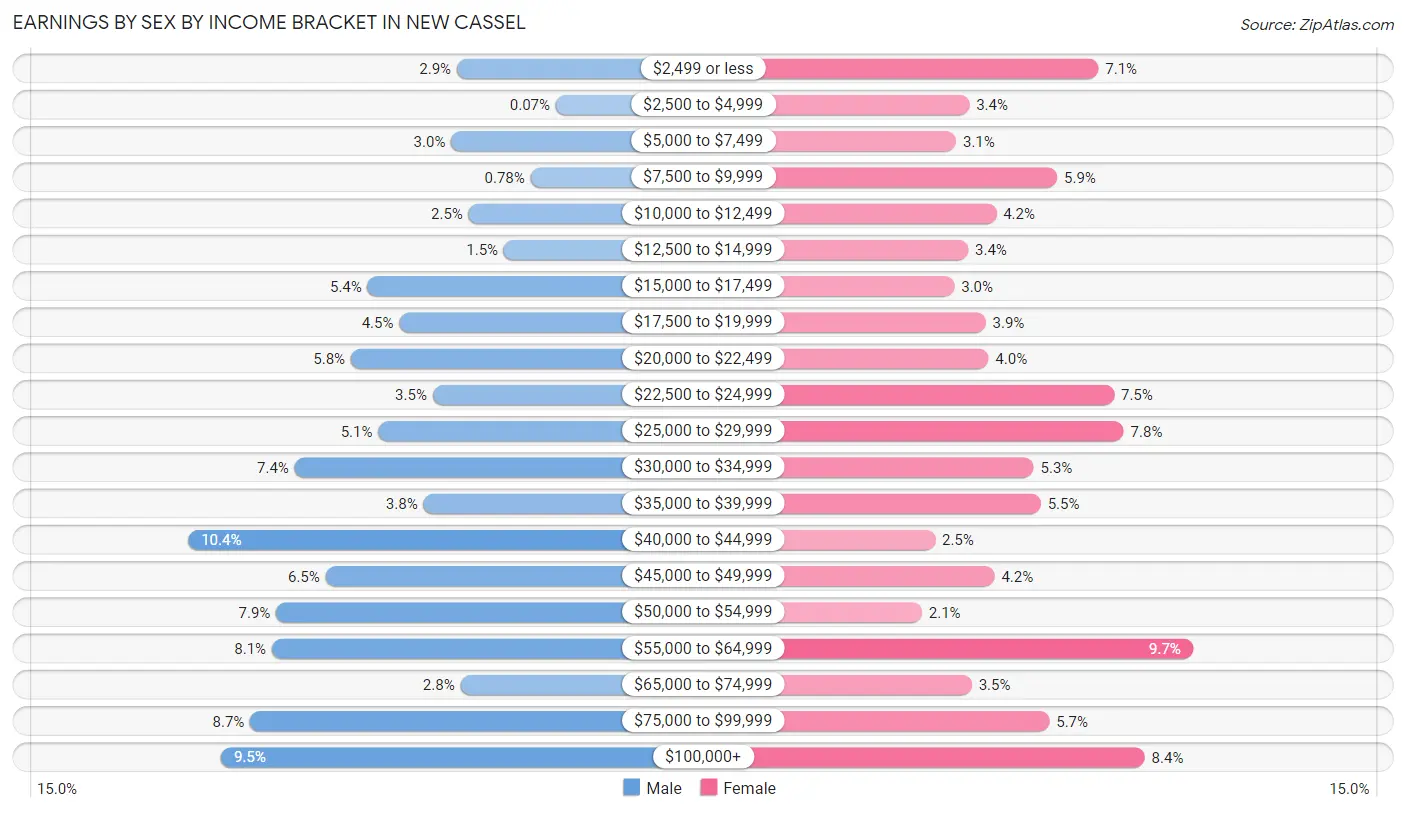
| Income | Male | Female |
| $2,499 or less | 121 (2.9%) | 288 (7.1%) |
| $2,500 to $4,999 | 3 (0.1%) | 140 (3.4%) |
| $5,000 to $7,499 | 128 (3.0%) | 125 (3.1%) |
| $7,500 to $9,999 | 33 (0.8%) | 241 (5.9%) |
| $10,000 to $12,499 | 107 (2.5%) | 171 (4.2%) |
| $12,500 to $14,999 | 65 (1.5%) | 139 (3.4%) |
| $15,000 to $17,499 | 228 (5.4%) | 123 (3.0%) |
| $17,500 to $19,999 | 190 (4.5%) | 159 (3.9%) |
| $20,000 to $22,499 | 248 (5.8%) | 162 (4.0%) |
| $22,500 to $24,999 | 150 (3.5%) | 306 (7.5%) |
| $25,000 to $29,999 | 215 (5.1%) | 317 (7.8%) |
| $30,000 to $34,999 | 315 (7.4%) | 214 (5.2%) |
| $35,000 to $39,999 | 161 (3.8%) | 222 (5.4%) |
| $40,000 to $44,999 | 442 (10.4%) | 101 (2.5%) |
| $45,000 to $49,999 | 278 (6.5%) | 169 (4.2%) |
| $50,000 to $54,999 | 337 (7.9%) | 86 (2.1%) |
| $55,000 to $64,999 | 342 (8.1%) | 396 (9.7%) |
| $65,000 to $74,999 | 117 (2.8%) | 143 (3.5%) |
| $75,000 to $99,999 | 368 (8.7%) | 232 (5.7%) |
| $100,000+ | 403 (9.5%) | 341 (8.4%) |
| Total | 4,251 (100.0%) | 4,075 (100.0%) |
Earnings by Sex by Educational Attainment in New Cassel
Average earnings in New Cassel are $45,909 for men and $37,979 for women, a difference of 17.3%. Men with an educational attainment of graduate degree enjoy the highest average annual earnings of $81,563, while those with less than high school education earn the least with $42,132. Women with an educational attainment of graduate degree earn the most with the average annual earnings of $73,681, while those with less than high school education have the smallest earnings of $28,676.
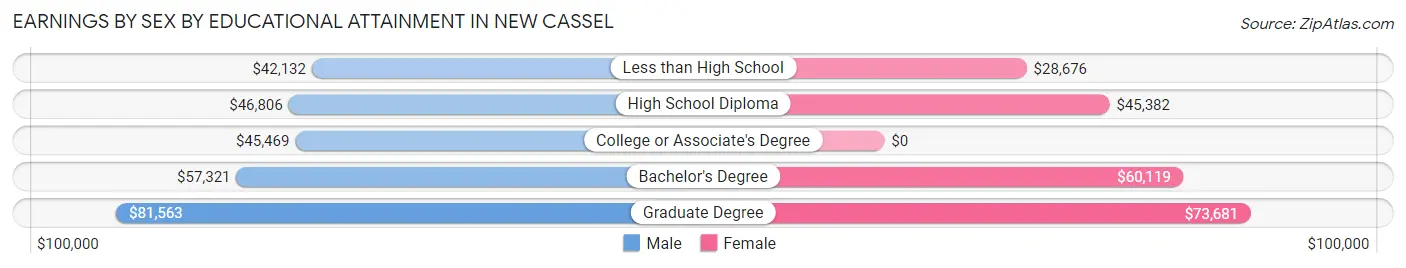
| Educational Attainment | Male Income | Female Income |
| Less than High School | $42,132 | $28,676 |
| High School Diploma | $46,806 | $45,382 |
| College or Associate's Degree | $45,469 | $0 |
| Bachelor's Degree | $57,321 | $60,119 |
| Graduate Degree | $81,563 | $73,681 |
| Total | $45,909 | $37,979 |
Family Income in New Cassel
Family Income Brackets in New Cassel
According to the New Cassel family income data, there are 627 families falling into the $100,000 to $149,999 income range, which is the most common income bracket and makes up 22.6% of all families. Conversely, the $10,000 to $14,999 income bracket is the least frequent group with only 25 families (0.9%) belonging to this category.
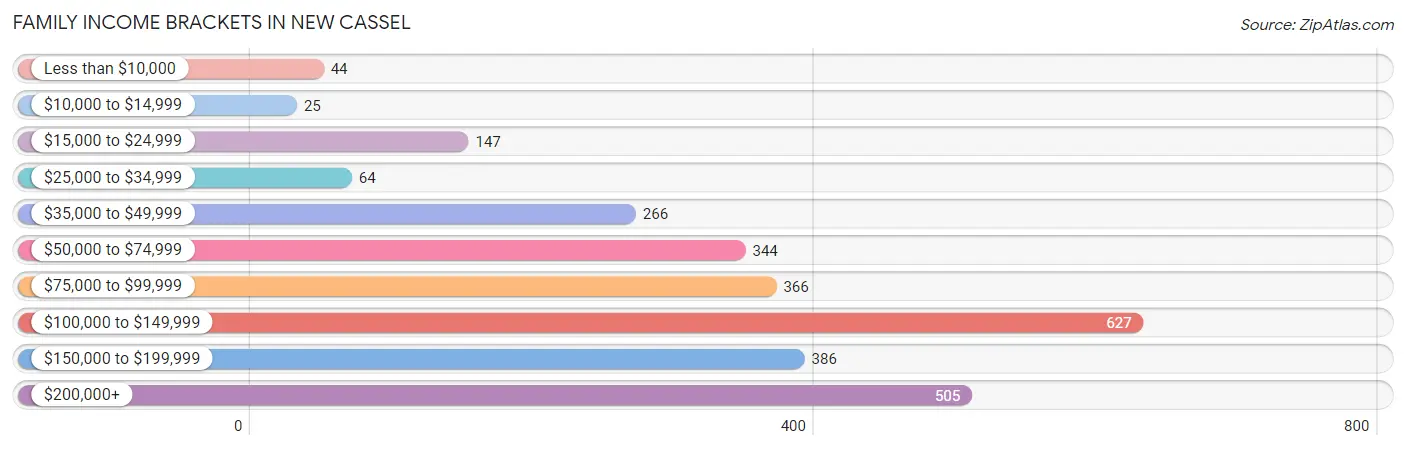
| Income Bracket | # Families | % Families |
| Less than $10,000 | 44 | 1.6% |
| $10,000 to $14,999 | 25 | 0.9% |
| $15,000 to $24,999 | 147 | 5.3% |
| $25,000 to $34,999 | 64 | 2.3% |
| $35,000 to $49,999 | 266 | 9.6% |
| $50,000 to $74,999 | 344 | 12.4% |
| $75,000 to $99,999 | 366 | 13.2% |
| $100,000 to $149,999 | 627 | 22.6% |
| $150,000 to $199,999 | 386 | 13.9% |
| $200,000+ | 505 | 18.2% |
Family Income by Famaliy Size in New Cassel
7+ person families (560 | 20.2%) account for the highest median family income in New Cassel with $165,038 per family, while 2-person families (589 | 21.2%) have the highest median income of $58,633 per family member.
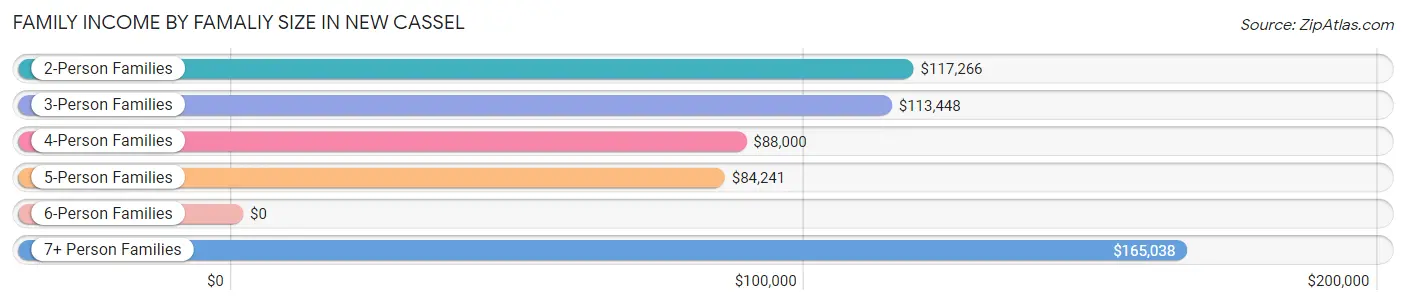
| Income Bracket | # Families | Median Income |
| 2-Person Families | 589 (21.2%) | $117,266 |
| 3-Person Families | 400 (14.4%) | $113,448 |
| 4-Person Families | 628 (22.6%) | $88,000 |
| 5-Person Families | 437 (15.8%) | $84,241 |
| 6-Person Families | 160 (5.8%) | $0 |
| 7+ Person Families | 560 (20.2%) | $165,038 |
| Total | 2,774 (100.0%) | $115,776 |
Family Income by Number of Earners in New Cassel
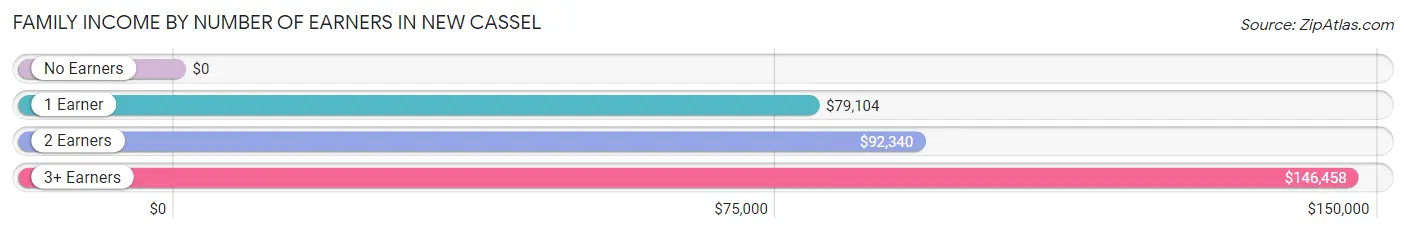
| Number of Earners | # Families | Median Income |
| No Earners | 185 (6.7%) | $0 |
| 1 Earner | 505 (18.2%) | $79,104 |
| 2 Earners | 937 (33.8%) | $92,340 |
| 3+ Earners | 1,147 (41.3%) | $146,458 |
| Total | 2,774 (100.0%) | $115,776 |
Household Income in New Cassel
Household Income Brackets in New Cassel
With 641 households falling in the category, the $200,000+ income range is the most frequent in New Cassel, accounting for 19.2% of all households. In contrast, only 63 households (1.9%) fall into the $10,000 to $14,999 income bracket, making it the least populous group.
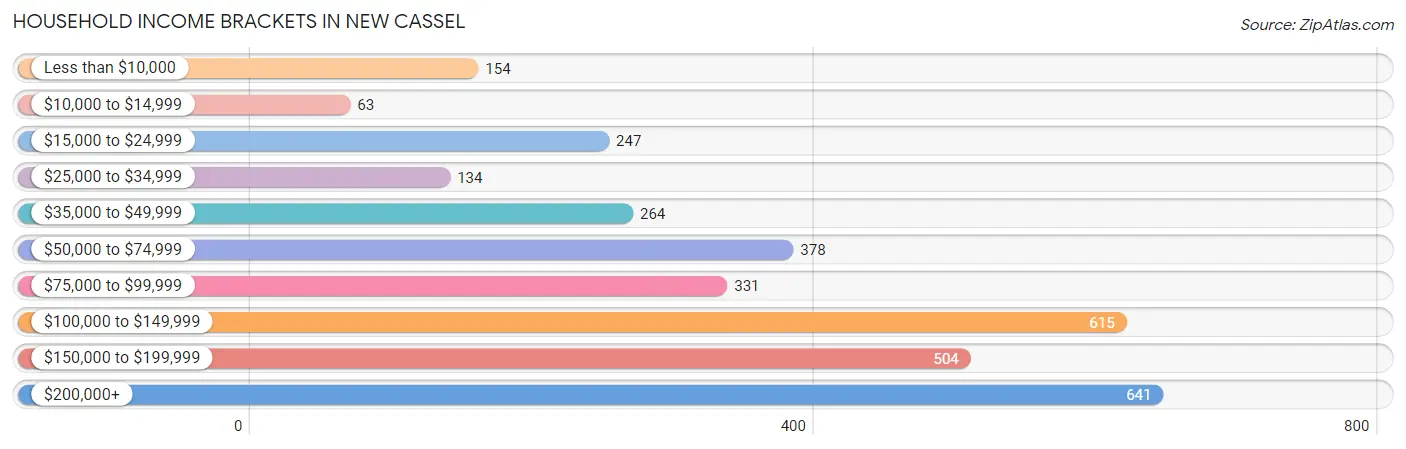
| Income Bracket | # Households | % Households |
| Less than $10,000 | 154 | 4.6% |
| $10,000 to $14,999 | 63 | 1.9% |
| $15,000 to $24,999 | 247 | 7.4% |
| $25,000 to $34,999 | 134 | 4.0% |
| $35,000 to $49,999 | 264 | 7.9% |
| $50,000 to $74,999 | 378 | 11.3% |
| $75,000 to $99,999 | 331 | 9.9% |
| $100,000 to $149,999 | 615 | 18.4% |
| $150,000 to $199,999 | 504 | 15.1% |
| $200,000+ | 641 | 19.2% |
Household Income by Householder Age in New Cassel
The median household income in New Cassel is $112,569, with the highest median household income of $136,923 found in the 45 to 64 years age bracket for the primary householder. A total of 1,360 households (40.7%) fall into this category. Meanwhile, the 65+ years age bracket for the primary householder has the lowest median household income of $72,118, with 767 households (23.0%) in this group.
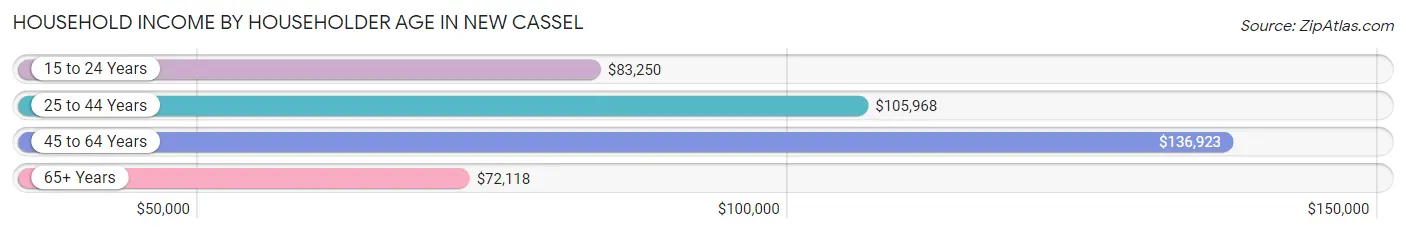
| Income Bracket | # Households | Median Income |
| 15 to 24 Years | 90 (2.7%) | $83,250 |
| 25 to 44 Years | 1,124 (33.6%) | $105,968 |
| 45 to 64 Years | 1,360 (40.7%) | $136,923 |
| 65+ Years | 767 (23.0%) | $72,118 |
| Total | 3,341 (100.0%) | $112,569 |
Poverty in New Cassel
Income Below Poverty by Sex and Age in New Cassel
With 8.8% poverty level for males and 12.8% for females among the residents of New Cassel, 12 to 14 year old males and 16 and 17 year old females are the most vulnerable to poverty, with 54 males (27.8%) and 159 females (71.0%) in their respective age groups living below the poverty level.
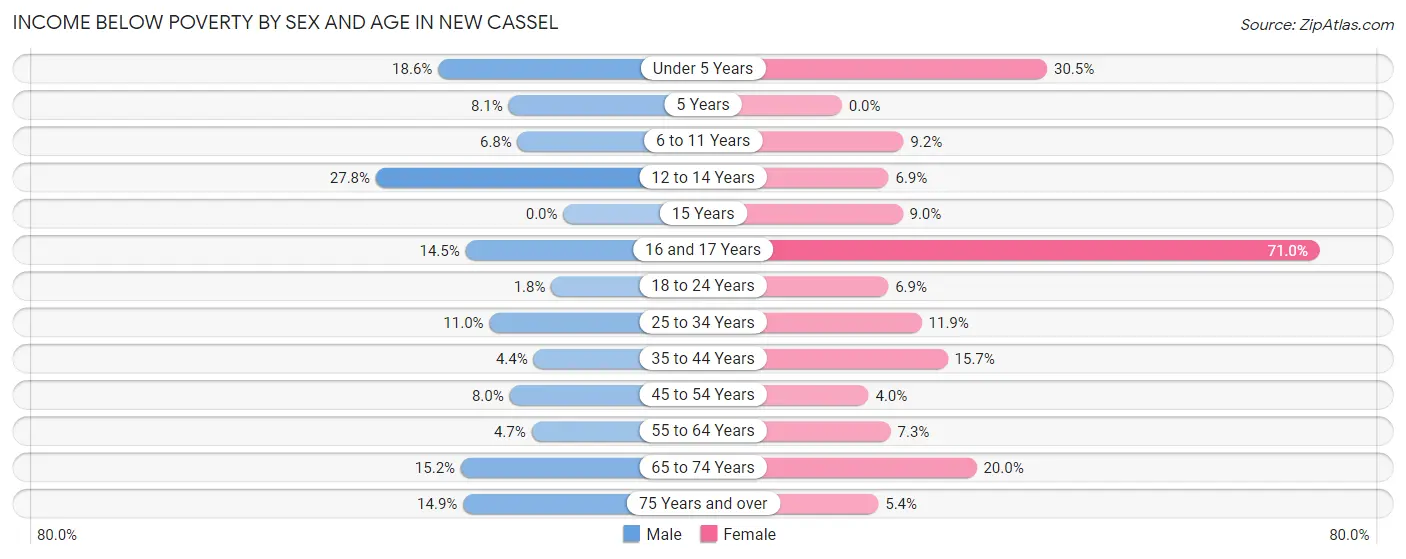
| Age Bracket | Male | Female |
| Under 5 Years | 145 (18.6%) | 146 (30.5%) |
| 5 Years | 7 (8.1%) | 0 (0.0%) |
| 6 to 11 Years | 68 (6.8%) | 46 (9.1%) |
| 12 to 14 Years | 54 (27.8%) | 12 (6.9%) |
| 15 Years | 0 (0.0%) | 22 (9.0%) |
| 16 and 17 Years | 27 (14.5%) | 159 (71.0%) |
| 18 to 24 Years | 16 (1.8%) | 79 (6.9%) |
| 25 to 34 Years | 115 (11.0%) | 141 (11.8%) |
| 35 to 44 Years | 50 (4.4%) | 153 (15.7%) |
| 45 to 54 Years | 73 (8.0%) | 36 (4.0%) |
| 55 to 64 Years | 24 (4.7%) | 54 (7.2%) |
| 65 to 74 Years | 33 (15.2%) | 99 (20.0%) |
| 75 Years and over | 25 (14.9%) | 24 (5.4%) |
| Total | 637 (8.8%) | 971 (12.8%) |
Income Above Poverty by Sex and Age in New Cassel
According to the poverty statistics in New Cassel, males aged 15 years and females aged 5 years are the age groups that are most secure financially, with 100.0% of males and 100.0% of females in these age groups living above the poverty line.
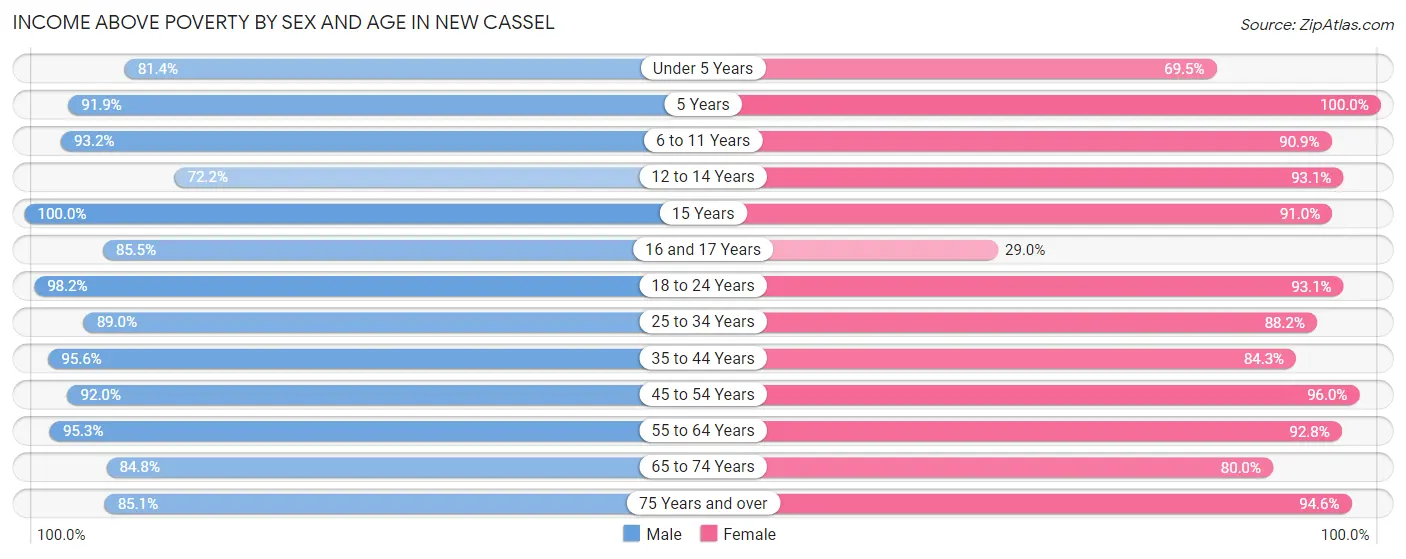
| Age Bracket | Male | Female |
| Under 5 Years | 635 (81.4%) | 333 (69.5%) |
| 5 Years | 79 (91.9%) | 92 (100.0%) |
| 6 to 11 Years | 934 (93.2%) | 457 (90.8%) |
| 12 to 14 Years | 140 (72.2%) | 161 (93.1%) |
| 15 Years | 142 (100.0%) | 222 (91.0%) |
| 16 and 17 Years | 159 (85.5%) | 65 (29.0%) |
| 18 to 24 Years | 879 (98.2%) | 1,068 (93.1%) |
| 25 to 34 Years | 932 (89.0%) | 1,049 (88.1%) |
| 35 to 44 Years | 1,079 (95.6%) | 821 (84.3%) |
| 45 to 54 Years | 841 (92.0%) | 871 (96.0%) |
| 55 to 64 Years | 484 (95.3%) | 691 (92.7%) |
| 65 to 74 Years | 184 (84.8%) | 396 (80.0%) |
| 75 Years and over | 143 (85.1%) | 419 (94.6%) |
| Total | 6,631 (91.2%) | 6,645 (87.3%) |
Income Below Poverty Among Married-Couple Families in New Cassel
The poverty statistics for married-couple families in New Cassel show that 5.9% or 91 of the total 1,552 families live below the poverty line. Families with 5 or more children have the highest poverty rate of 19.4%, comprising of 12 families. On the other hand, families with 1 or 2 children have the lowest poverty rate of 2.4%, which includes 13 families.
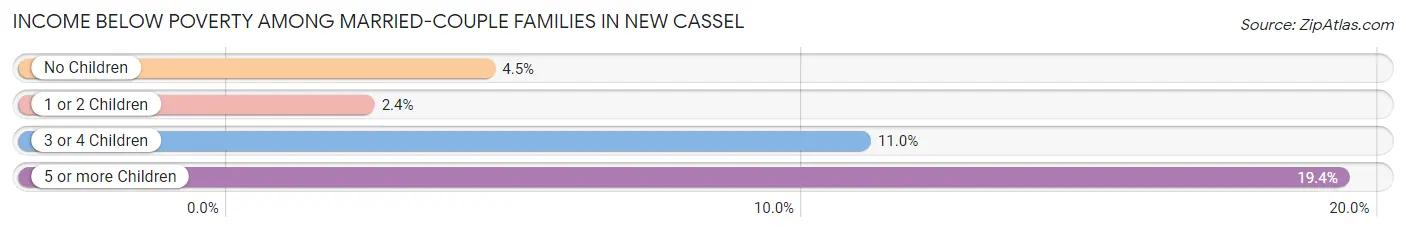
| Children | Above Poverty | Below Poverty |
| No Children | 555 (95.5%) | 26 (4.5%) |
| 1 or 2 Children | 533 (97.6%) | 13 (2.4%) |
| 3 or 4 Children | 323 (89.0%) | 40 (11.0%) |
| 5 or more Children | 50 (80.6%) | 12 (19.4%) |
| Total | 1,461 (94.1%) | 91 (5.9%) |
Income Below Poverty Among Single-Parent Households in New Cassel
According to the poverty data in New Cassel, 22.8% or 60 single-father households and 9.5% or 91 single-mother households are living below the poverty line. Among single-father households, those with 3 or 4 children have the highest poverty rate, with 60 households (59.4%) experiencing poverty. Likewise, among single-mother households, those with 3 or 4 children have the highest poverty rate, with 91 households (60.7%) falling below the poverty line.
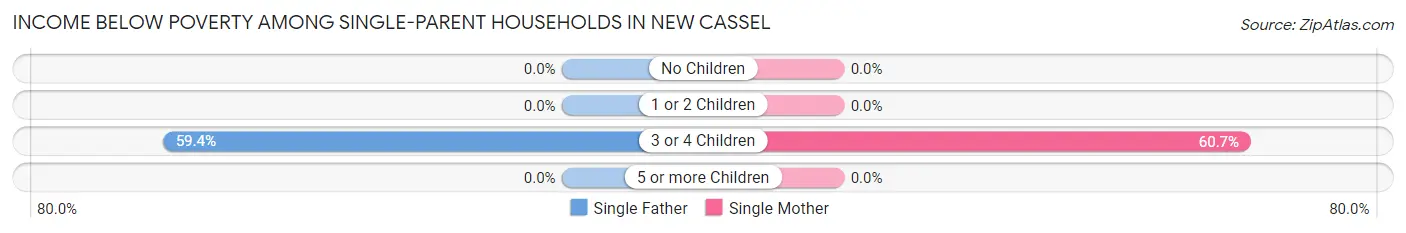
| Children | Single Father | Single Mother |
| No Children | 0 (0.0%) | 0 (0.0%) |
| 1 or 2 Children | 0 (0.0%) | 0 (0.0%) |
| 3 or 4 Children | 60 (59.4%) | 91 (60.7%) |
| 5 or more Children | 0 (0.0%) | 0 (0.0%) |
| Total | 60 (22.8%) | 91 (9.5%) |
Income Below Poverty Among Married-Couple vs Single-Parent Households in New Cassel
The poverty data for New Cassel shows that 91 of the married-couple family households (5.9%) and 151 of the single-parent households (12.4%) are living below the poverty level. Within the married-couple family households, those with 5 or more children have the highest poverty rate, with 12 households (19.4%) falling below the poverty line. Among the single-parent households, those with 3 or 4 children have the highest poverty rate, with 151 household (60.2%) living below poverty.
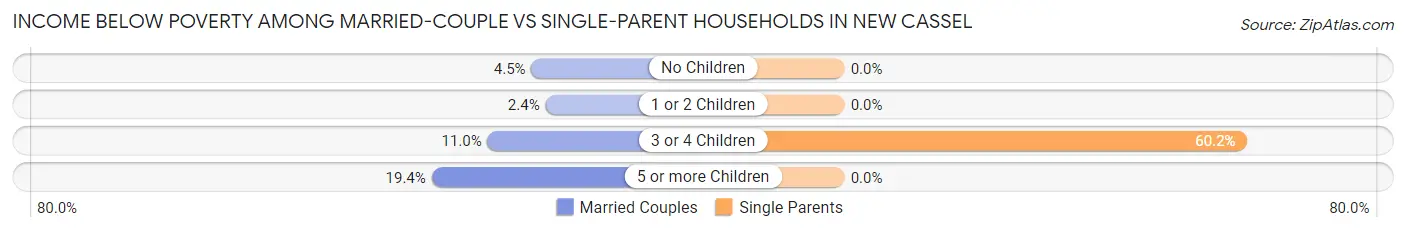
| Children | Married-Couple Families | Single-Parent Households |
| No Children | 26 (4.5%) | 0 (0.0%) |
| 1 or 2 Children | 13 (2.4%) | 0 (0.0%) |
| 3 or 4 Children | 40 (11.0%) | 151 (60.2%) |
| 5 or more Children | 12 (19.4%) | 0 (0.0%) |
| Total | 91 (5.9%) | 151 (12.4%) |
Race in New Cassel
The most populous races in New Cassel are Hispanic or Latino (8,422 | 55.7%), Black / African American (5,186 | 34.3%), and Some other Race (5,095 | 33.7%).
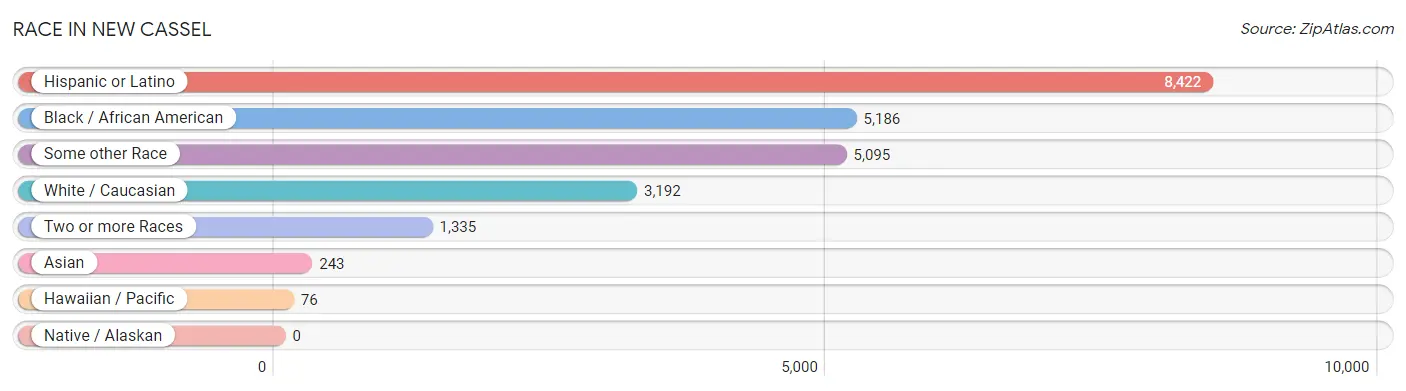
| Race | # Population | % Population |
| Asian | 243 | 1.6% |
| Black / African American | 5,186 | 34.3% |
| Hawaiian / Pacific | 76 | 0.5% |
| Hispanic or Latino | 8,422 | 55.7% |
| Native / Alaskan | 0 | 0.0% |
| White / Caucasian | 3,192 | 21.1% |
| Two or more Races | 1,335 | 8.8% |
| Some other Race | 5,095 | 33.7% |
| Total | 15,127 | 100.0% |
Ancestry in New Cassel
The most populous ancestries reported in New Cassel are Central American (5,542 | 36.6%), Salvadoran (4,688 | 31.0%), Mexican (1,403 | 9.3%), Haitian (1,232 | 8.1%), and Honduran (769 | 5.1%), together accounting for 90.1% of all New Cassel residents.
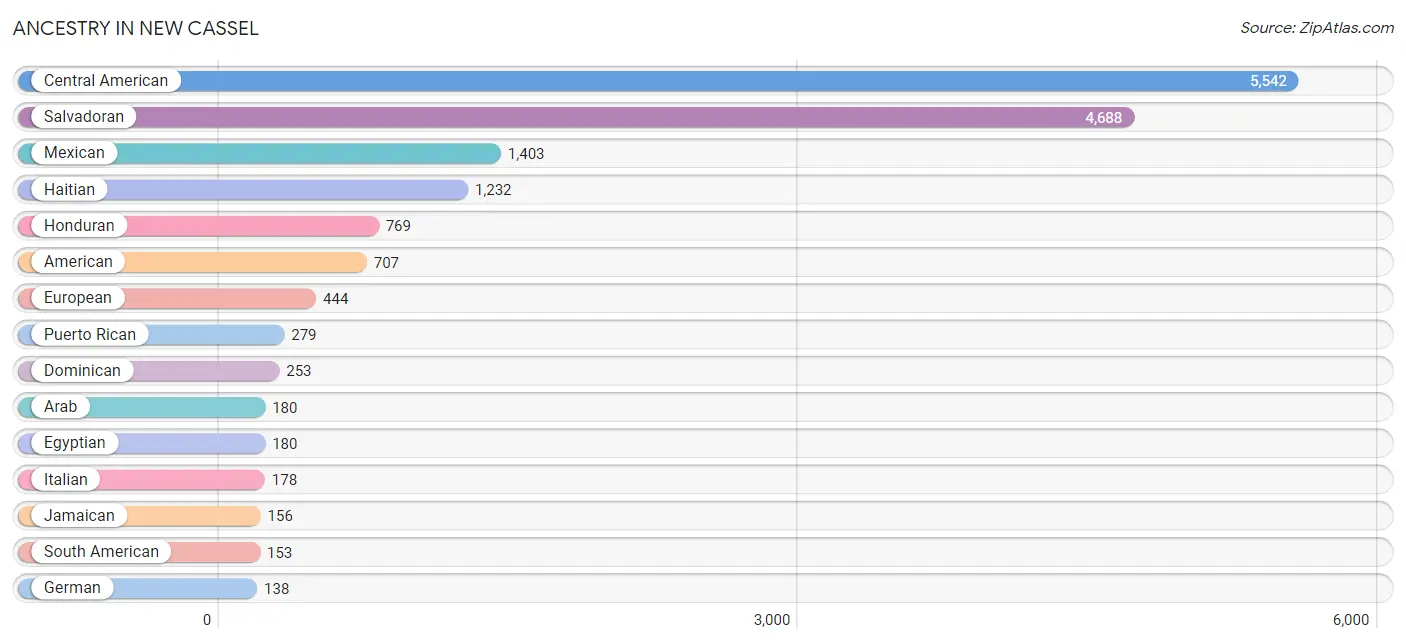
| Ancestry | # Population | % Population |
| African | 77 | 0.5% |
| Albanian | 18 | 0.1% |
| Alsatian | 12 | 0.1% |
| American | 707 | 4.7% |
| Arab | 180 | 1.2% |
| Argentinean | 2 | 0.0% |
| Barbadian | 26 | 0.2% |
| British West Indian | 120 | 0.8% |
| Burmese | 27 | 0.2% |
| Central American | 5,542 | 36.6% |
| Cherokee | 7 | 0.1% |
| Colombian | 83 | 0.5% |
| Costa Rican | 10 | 0.1% |
| Cuban | 80 | 0.5% |
| Czech | 2 | 0.0% |
| Dominican | 253 | 1.7% |
| Eastern European | 32 | 0.2% |
| Ecuadorian | 9 | 0.1% |
| Egyptian | 180 | 1.2% |
| English | 33 | 0.2% |
| European | 444 | 2.9% |
| French | 4 | 0.0% |
| German | 138 | 0.9% |
| Greek | 19 | 0.1% |
| Guamanian / Chamorro | 17 | 0.1% |
| Guatemalan | 16 | 0.1% |
| Haitian | 1,232 | 8.1% |
| Honduran | 769 | 5.1% |
| Indian (Asian) | 113 | 0.7% |
| Irish | 36 | 0.2% |
| Italian | 178 | 1.2% |
| Jamaican | 156 | 1.0% |
| Korean | 51 | 0.3% |
| Lithuanian | 10 | 0.1% |
| Mexican | 1,403 | 9.3% |
| Native Hawaiian | 59 | 0.4% |
| Nigerian | 25 | 0.2% |
| Norwegian | 45 | 0.3% |
| Panamanian | 59 | 0.4% |
| Peruvian | 50 | 0.3% |
| Polish | 43 | 0.3% |
| Portuguese | 13 | 0.1% |
| Puerto Rican | 279 | 1.8% |
| Romanian | 39 | 0.3% |
| Russian | 20 | 0.1% |
| Salvadoran | 4,688 | 31.0% |
| Scotch-Irish | 14 | 0.1% |
| Scottish | 14 | 0.1% |
| South American | 153 | 1.0% |
| Spaniard | 46 | 0.3% |
| Spanish American | 69 | 0.5% |
| Subsaharan African | 102 | 0.7% |
| Thai | 56 | 0.4% |
| Trinidadian and Tobagonian | 14 | 0.1% |
| Uruguayan | 9 | 0.1% |
| Vietnamese | 16 | 0.1% |
| West Indian | 71 | 0.5% | View All 57 Rows |
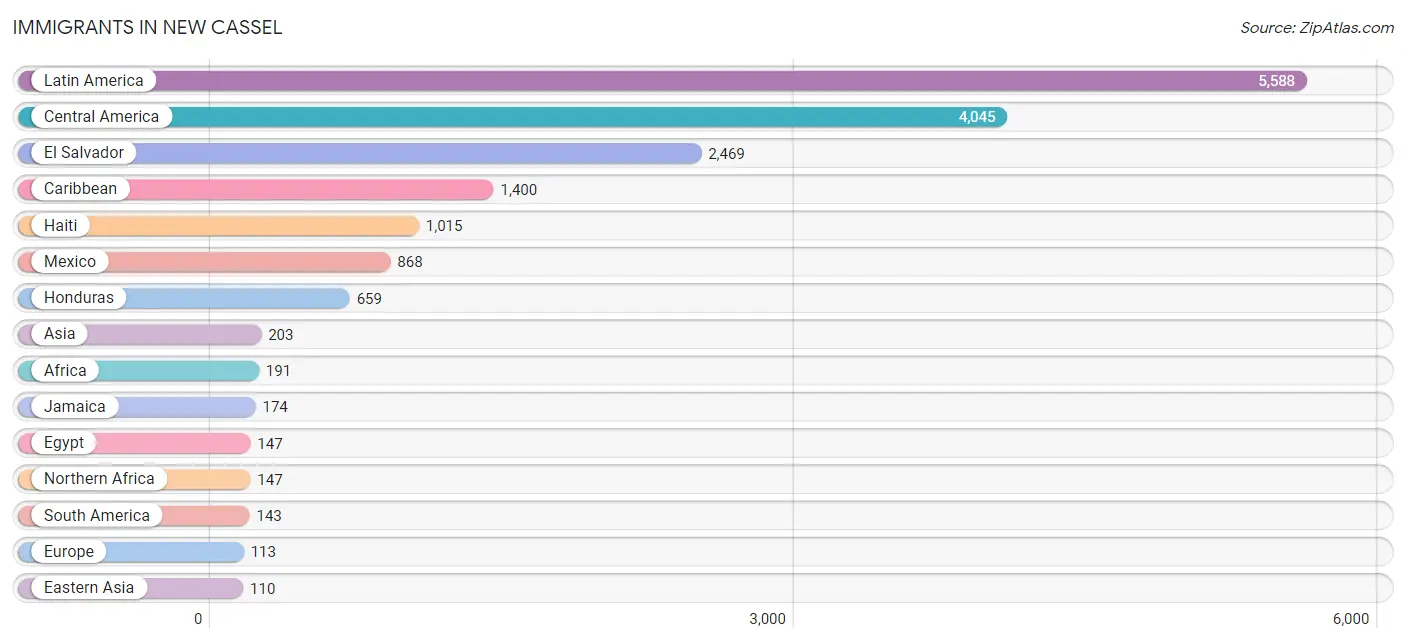
Immigrants in New Cassel
The most numerous immigrant groups reported in New Cassel came from Latin America (5,588 | 36.9%), Central America (4,045 | 26.7%), El Salvador (2,469 | 16.3%), Caribbean (1,400 | 9.2%), and Haiti (1,015 | 6.7%), together accounting for 96.0% of all New Cassel residents.
| Immigration Origin | # Population | % Population |
| Africa | 191 | 1.3% |
| Argentina | 2 | 0.0% |
| Asia | 203 | 1.3% |
| Bahamas | 33 | 0.2% |
| Bangladesh | 16 | 0.1% |
| Barbados | 13 | 0.1% |
| Canada | 10 | 0.1% |
| Caribbean | 1,400 | 9.2% |
| Central America | 4,045 | 26.7% |
| China | 55 | 0.4% |
| Colombia | 45 | 0.3% |
| Costa Rica | 12 | 0.1% |
| Cuba | 17 | 0.1% |
| Dominican Republic | 41 | 0.3% |
| Eastern Asia | 110 | 0.7% |
| Eastern Europe | 50 | 0.3% |
| Ecuador | 77 | 0.5% |
| Egypt | 147 | 1.0% |
| El Salvador | 2,469 | 16.3% |
| Europe | 113 | 0.7% |
| Grenada | 20 | 0.1% |
| Guatemala | 37 | 0.2% |
| Haiti | 1,015 | 6.7% |
| Honduras | 659 | 4.4% |
| India | 12 | 0.1% |
| Israel | 4 | 0.0% |
| Italy | 10 | 0.1% |
| Jamaica | 174 | 1.1% |
| Korea | 55 | 0.4% |
| Latin America | 5,588 | 36.9% |
| Mexico | 868 | 5.7% |
| Nigeria | 25 | 0.2% |
| Northern Africa | 147 | 1.0% |
| Northern Europe | 53 | 0.4% |
| Pakistan | 26 | 0.2% |
| Peru | 13 | 0.1% |
| Philippines | 31 | 0.2% |
| Poland | 5 | 0.0% |
| Romania | 39 | 0.3% |
| Russia | 6 | 0.0% |
| South America | 143 | 0.9% |
| South Central Asia | 54 | 0.4% |
| South Eastern Asia | 31 | 0.2% |
| Southern Europe | 10 | 0.1% |
| Taiwan | 27 | 0.2% |
| Trinidad and Tobago | 21 | 0.1% |
| Uruguay | 6 | 0.0% |
| West Indies | 26 | 0.2% |
| Western Africa | 25 | 0.2% |
| Western Asia | 8 | 0.1% | View All 50 Rows |
Sex and Age in New Cassel
Sex and Age in New Cassel
The most populous age groups in New Cassel are Under 5 Years (868 | 11.7%) for men and 15 to 19 Years (955 | 12.4%) for women.
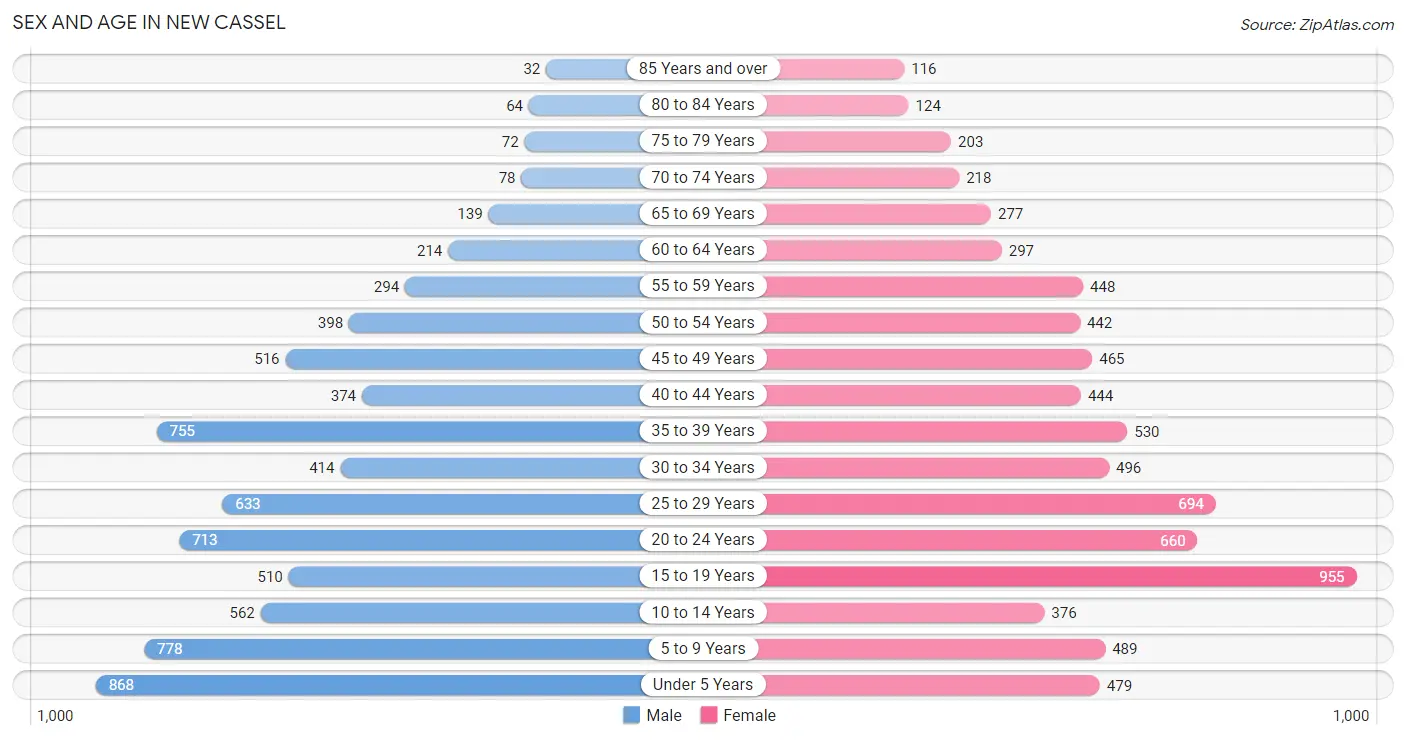
| Age Bracket | Male | Female |
| Under 5 Years | 868 (11.7%) | 479 (6.2%) |
| 5 to 9 Years | 778 (10.5%) | 489 (6.3%) |
| 10 to 14 Years | 562 (7.6%) | 376 (4.9%) |
| 15 to 19 Years | 510 (6.9%) | 955 (12.4%) |
| 20 to 24 Years | 713 (9.6%) | 660 (8.6%) |
| 25 to 29 Years | 633 (8.5%) | 694 (9.0%) |
| 30 to 34 Years | 414 (5.6%) | 496 (6.4%) |
| 35 to 39 Years | 755 (10.2%) | 530 (6.9%) |
| 40 to 44 Years | 374 (5.0%) | 444 (5.8%) |
| 45 to 49 Years | 516 (7.0%) | 465 (6.0%) |
| 50 to 54 Years | 398 (5.4%) | 442 (5.7%) |
| 55 to 59 Years | 294 (4.0%) | 448 (5.8%) |
| 60 to 64 Years | 214 (2.9%) | 297 (3.8%) |
| 65 to 69 Years | 139 (1.9%) | 277 (3.6%) |
| 70 to 74 Years | 78 (1.1%) | 218 (2.8%) |
| 75 to 79 Years | 72 (1.0%) | 203 (2.6%) |
| 80 to 84 Years | 64 (0.9%) | 124 (1.6%) |
| 85 Years and over | 32 (0.4%) | 116 (1.5%) |
| Total | 7,414 (100.0%) | 7,713 (100.0%) |
Families and Households in New Cassel
Median Family Size in New Cassel
The median family size in New Cassel is 4.86 persons per family, with married-couple families (1,552 | 55.9%) accounting for the largest median family size of 5.4 persons per family. On the other hand, single female/mother families (959 | 34.6%) represent the smallest median family size with 4.14 persons per family.
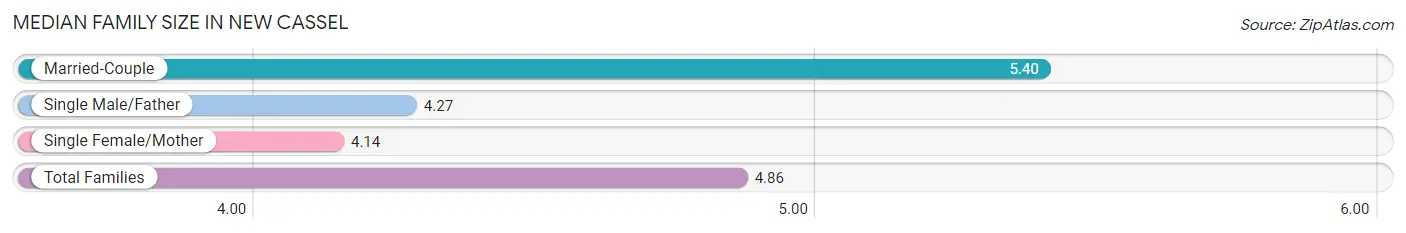
| Family Type | # Families | Family Size |
| Married-Couple | 1,552 (55.9%) | 5.40 |
| Single Male/Father | 263 (9.5%) | 4.27 |
| Single Female/Mother | 959 (34.6%) | 4.14 |
| Total Families | 2,774 (100.0%) | 4.86 |
Median Household Size in New Cassel
The median household size in New Cassel is 4.52 persons per household, with married-couple households (1,552 | 46.5%) accounting for the largest median household size of 5.69 persons per household. non-family households (567 | 17.0%) represent the smallest median household size with 1.11 persons per household.
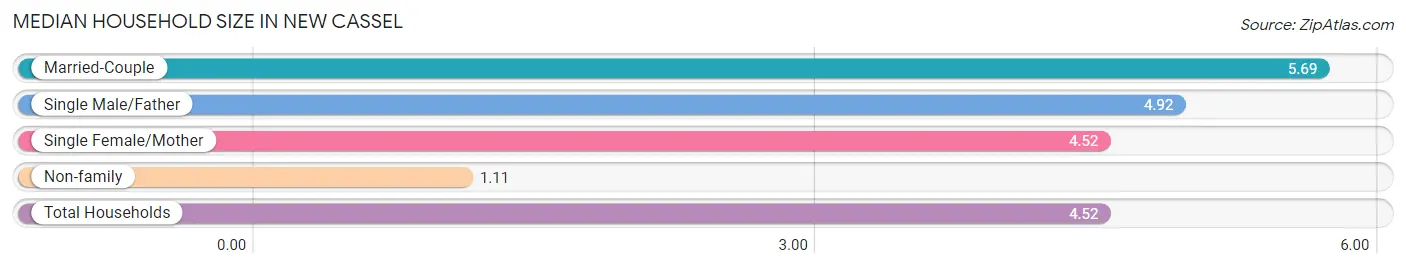
| Household Type | # Households | Household Size |
| Married-Couple | 1,552 (46.5%) | 5.69 |
| Single Male/Father | 263 (7.9%) | 4.92 |
| Single Female/Mother | 959 (28.7%) | 4.52 |
| Non-family | 567 (17.0%) | 1.11 |
| Total Households | 3,341 (100.0%) | 4.52 |
Household Size by Marriage Status in New Cassel
Out of a total of 3,341 households in New Cassel, 2,774 (83.0%) are family households, while 567 (17.0%) are nonfamily households. The most numerous type of family households are 7+ person households, comprising 728, and the most common type of nonfamily households are 1-person households, comprising 514.
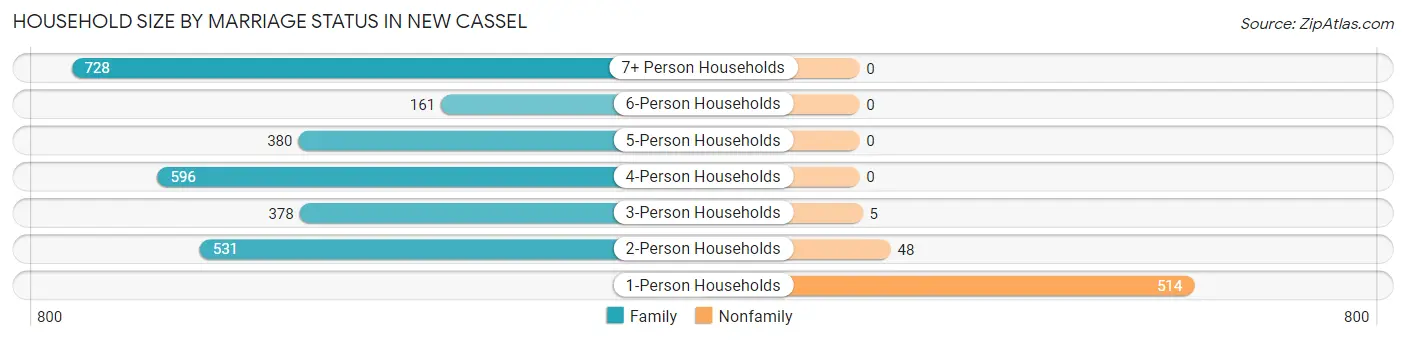
| Household Size | Family Households | Nonfamily Households |
| 1-Person Households | - | 514 (15.4%) |
| 2-Person Households | 531 (15.9%) | 48 (1.4%) |
| 3-Person Households | 378 (11.3%) | 5 (0.2%) |
| 4-Person Households | 596 (17.8%) | 0 (0.0%) |
| 5-Person Households | 380 (11.4%) | 0 (0.0%) |
| 6-Person Households | 161 (4.8%) | 0 (0.0%) |
| 7+ Person Households | 728 (21.8%) | 0 (0.0%) |
| Total | 2,774 (83.0%) | 567 (17.0%) |
Female Fertility in New Cassel
Fertility by Age in New Cassel
Average fertility rate in New Cassel is 93.0 births per 1,000 women. Women in the age bracket of 20 to 34 years have the highest fertility rate with 154.0 births per 1,000 women. Women in the age bracket of 20 to 34 years acount for 70.1% of all women with births.
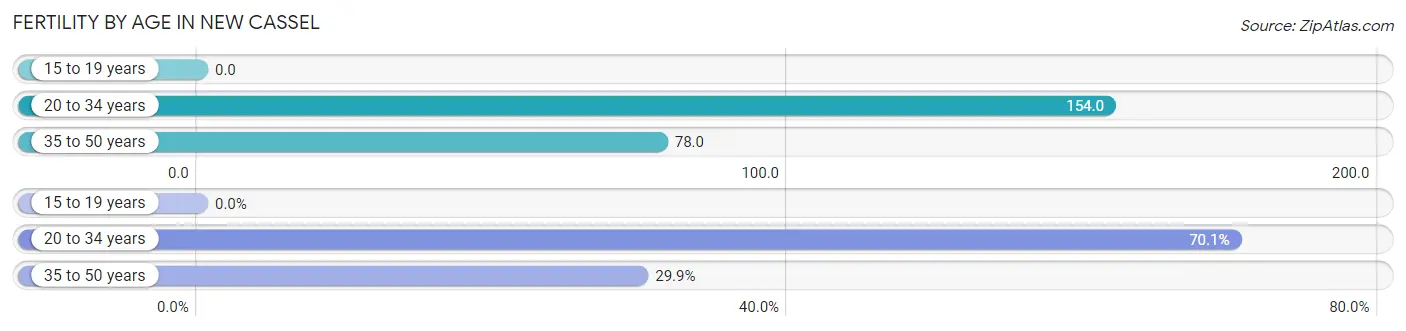
| Age Bracket | Women with Births | Births / 1,000 Women |
| 15 to 19 years | 0 (0.0%) | 0.0 |
| 20 to 34 years | 284 (70.1%) | 154.0 |
| 35 to 50 years | 121 (29.9%) | 78.0 |
| Total | 405 (100.0%) | 93.0 |
Fertility by Age by Marriage Status in New Cassel
27.7% of women with births (405) in New Cassel are married. The highest percentage of unmarried women with births falls into 20 to 34 years age bracket with 95.4% of them unmarried at the time of birth, while the lowest percentage of unmarried women with births belong to 35 to 50 years age bracket with 18.2% of them unmarried.
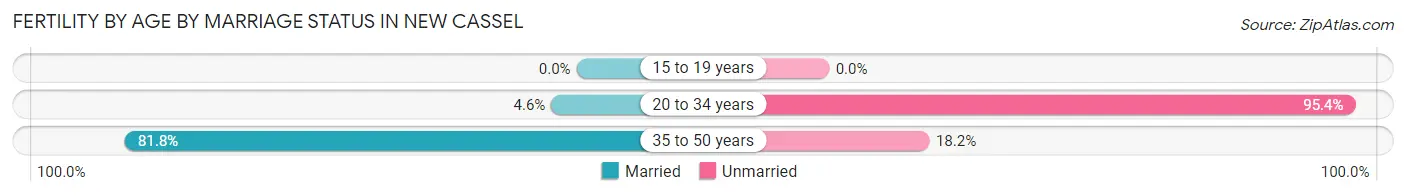
| Age Bracket | Married | Unmarried |
| 15 to 19 years | 0 (0.0%) | 0 (0.0%) |
| 20 to 34 years | 13 (4.6%) | 271 (95.4%) |
| 35 to 50 years | 99 (81.8%) | 22 (18.2%) |
| Total | 112 (27.7%) | 293 (72.4%) |
Fertility by Education in New Cassel
Average fertility rate in New Cassel is 93.0 births per 1,000 women. Women with the education attainment of high school diploma have the highest fertility rate of 155.0 births per 1,000 women, while women with the education attainment of bachelor's degree have the lowest fertility at 32.0 births per 1,000 women. Women with the education attainment of high school diploma represent 57.3% of all women with births.
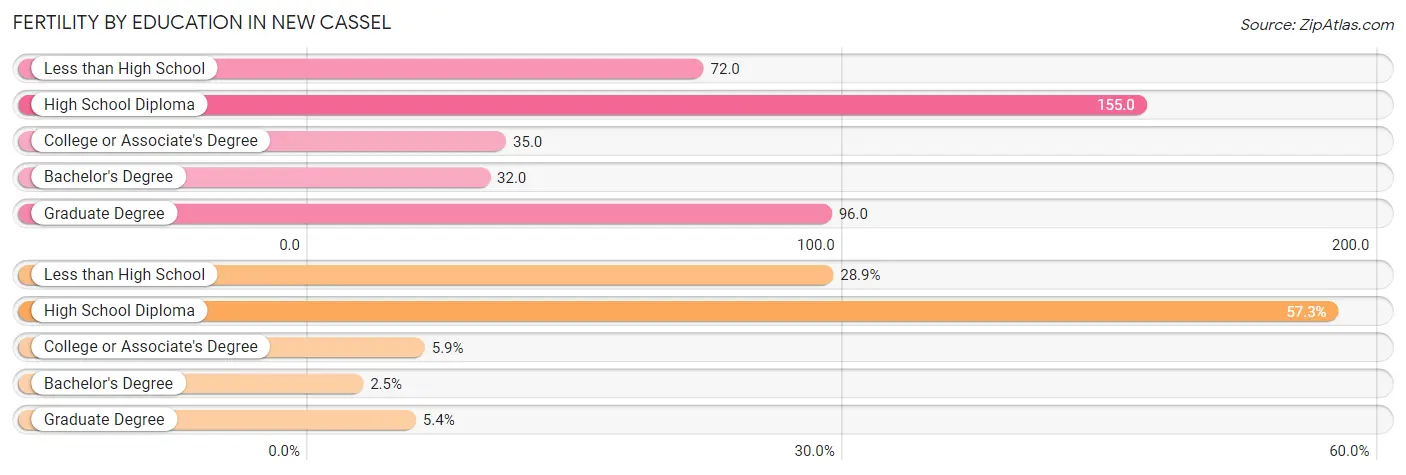
| Educational Attainment | Women with Births | Births / 1,000 Women |
| Less than High School | 117 (28.9%) | 72.0 |
| High School Diploma | 232 (57.3%) | 155.0 |
| College or Associate's Degree | 24 (5.9%) | 35.0 |
| Bachelor's Degree | 10 (2.5%) | 32.0 |
| Graduate Degree | 22 (5.4%) | 96.0 |
| Total | 405 (100.0%) | 93.0 |
Fertility by Education by Marriage Status in New Cassel
72.4% of women with births in New Cassel are unmarried. Women with the educational attainment of bachelor's degree are most likely to be married with 100.0% of them married at childbirth, while women with the educational attainment of high school diploma are least likely to be married with 100.0% of them unmarried at childbirth.
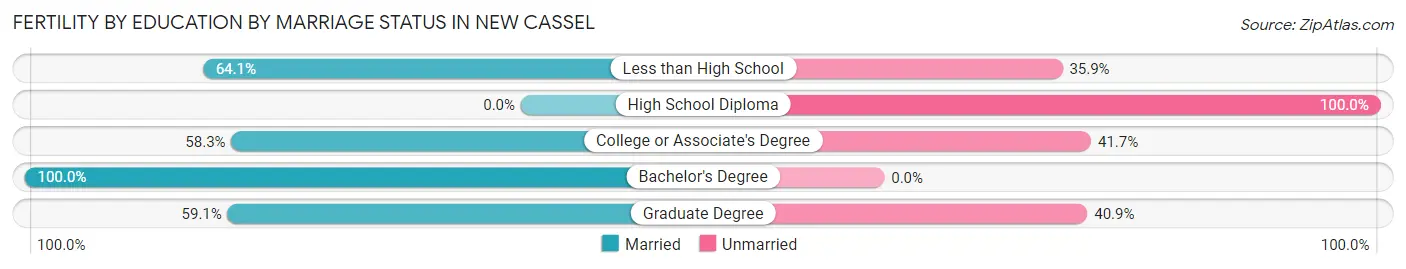
| Educational Attainment | Married | Unmarried |
| Less than High School | 75 (64.1%) | 42 (35.9%) |
| High School Diploma | 0 (0.0%) | 232 (100.0%) |
| College or Associate's Degree | 14 (58.3%) | 10 (41.7%) |
| Bachelor's Degree | 10 (100.0%) | 0 (0.0%) |
| Graduate Degree | 13 (59.1%) | 9 (40.9%) |
| Total | 112 (27.7%) | 293 (72.4%) |
Employment Characteristics in New Cassel
Employment by Class of Employer in New Cassel
Among the 7,587 employed individuals in New Cassel, private company employees (6,015 | 79.3%), not-for-profit organizations (515 | 6.8%), and local government employees (377 | 5.0%) make up the most common classes of employment.
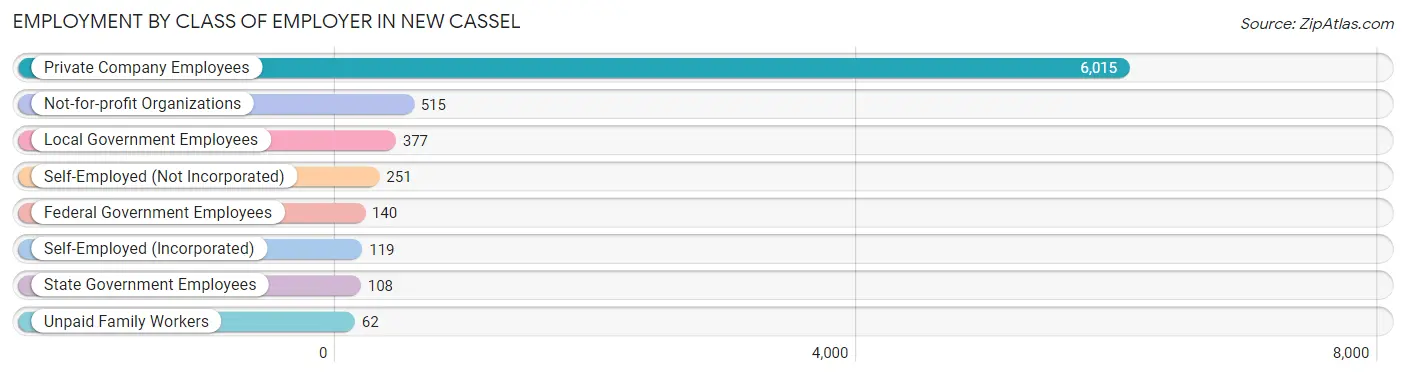
| Employer Class | # Employees | % Employees |
| Private Company Employees | 6,015 | 79.3% |
| Self-Employed (Incorporated) | 119 | 1.6% |
| Self-Employed (Not Incorporated) | 251 | 3.3% |
| Not-for-profit Organizations | 515 | 6.8% |
| Local Government Employees | 377 | 5.0% |
| State Government Employees | 108 | 1.4% |
| Federal Government Employees | 140 | 1.8% |
| Unpaid Family Workers | 62 | 0.8% |
| Total | 7,587 | 100.0% |
Employment Status by Age in New Cassel
According to the labor force statistics for New Cassel, out of the total population over 16 years of age (11,189), 71.0% or 7,944 individuals are in the labor force, with 3.1% or 246 of them unemployed. The age group with the highest labor force participation rate is 55 to 59 years, with 89.5% or 664 individuals in the labor force. Within the labor force, the 16 to 19 years age range has the highest percentage of unemployed individuals, with 20.2% or 91 of them being unemployed.
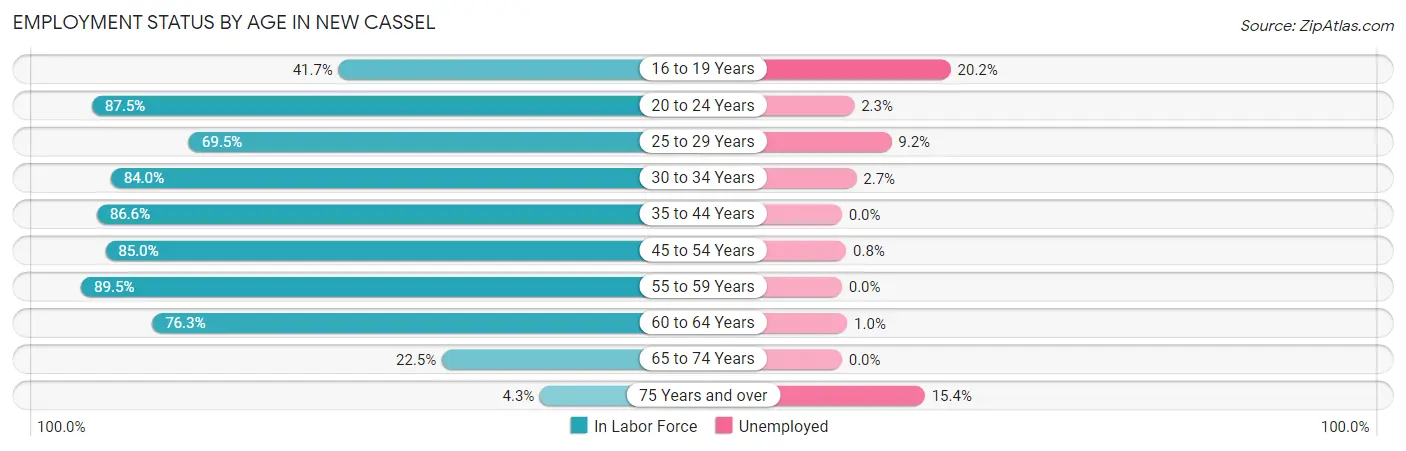
| Age Bracket | In Labor Force | Unemployed |
| 16 to 19 Years | 450 (41.7%) | 91 (20.2%) |
| 20 to 24 Years | 1,201 (87.5%) | 28 (2.3%) |
| 25 to 29 Years | 922 (69.5%) | 85 (9.2%) |
| 30 to 34 Years | 764 (84.0%) | 21 (2.7%) |
| 35 to 44 Years | 1,821 (86.6%) | 0 (0.0%) |
| 45 to 54 Years | 1,548 (85.0%) | 12 (0.8%) |
| 55 to 59 Years | 664 (89.5%) | 0 (0.0%) |
| 60 to 64 Years | 390 (76.3%) | 4 (1.0%) |
| 65 to 74 Years | 160 (22.5%) | 0 (0.0%) |
| 75 Years and over | 26 (4.3%) | 4 (15.4%) |
| Total | 7,944 (71.0%) | 246 (3.1%) |
Employment Status by Educational Attainment in New Cassel
According to labor force statistics for New Cassel, 82.4% of individuals (6,109) out of the total population between 25 and 64 years of age (7,414) are in the labor force, with 2.0% or 122 of them being unemployed. The group with the highest labor force participation rate are those with the educational attainment of bachelor's degree or higher, with 92.1% or 1,206 individuals in the labor force. Within the labor force, individuals with college / associate degree education have the highest percentage of unemployment, with 7.9% or 92 of them being unemployed.
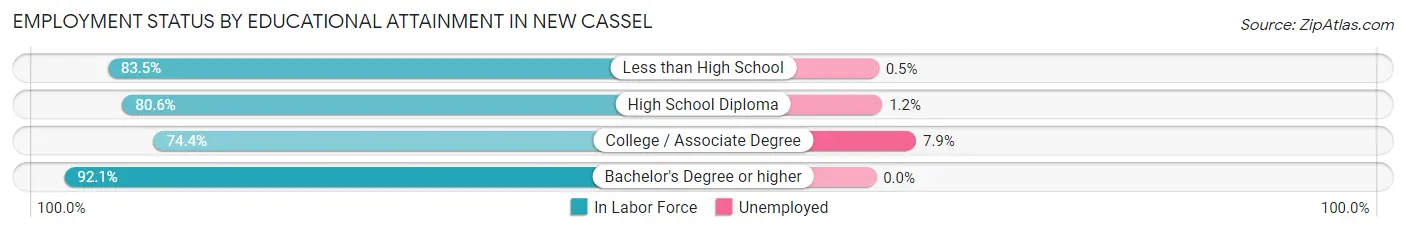
| Educational Attainment | In Labor Force | Unemployed |
| Less than High School | 2,219 (83.5%) | 13 (0.5%) |
| High School Diploma | 1,523 (80.6%) | 23 (1.2%) |
| College / Associate Degree | 1,159 (74.4%) | 123 (7.9%) |
| Bachelor's Degree or higher | 1,206 (92.1%) | 0 (0.0%) |
| Total | 6,109 (82.4%) | 148 (2.0%) |
Employment Occupations by Sex in New Cassel
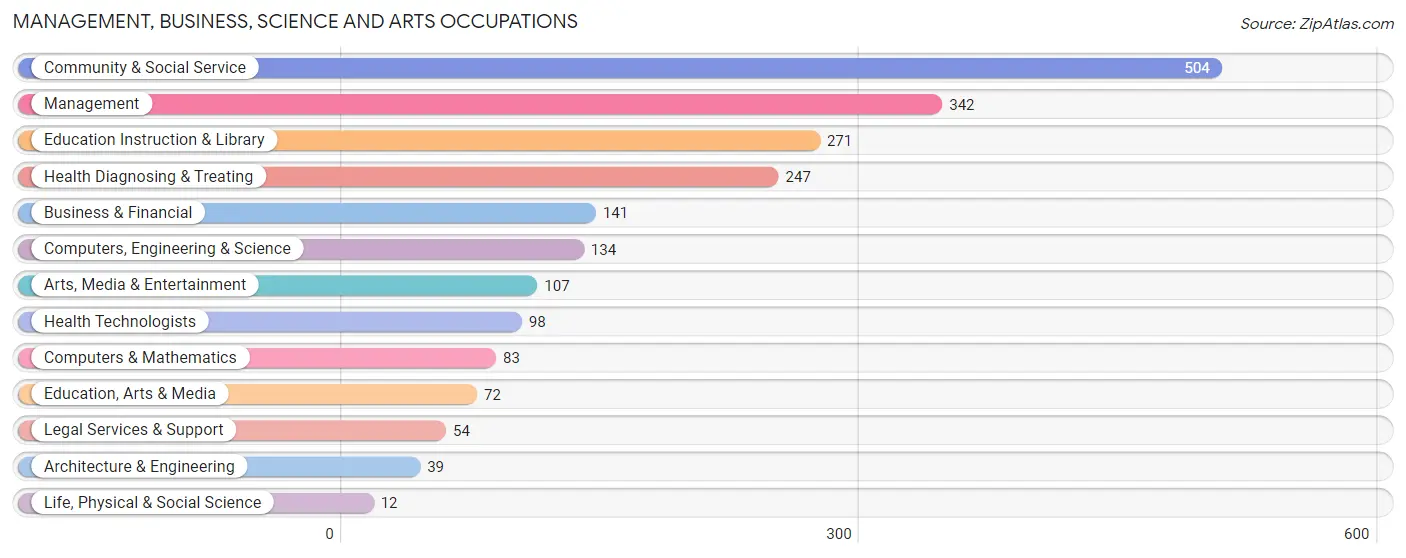
Management, Business, Science and Arts Occupations
The most common Management, Business, Science and Arts occupations in New Cassel are Community & Social Service (504 | 6.6%), Management (342 | 4.4%), Education Instruction & Library (271 | 3.5%), Health Diagnosing & Treating (247 | 3.2%), and Business & Financial (141 | 1.8%).
Management, Business, Science and Arts Occupations by Sex
Within the Management, Business, Science and Arts occupations in New Cassel, the most male-oriented occupations are Architecture & Engineering (100.0%), Life, Physical & Social Science (100.0%), and Computers, Engineering & Science (85.1%), while the most female-oriented occupations are Education Instruction & Library (93.0%), Business & Financial (87.9%), and Community & Social Service (73.0%).
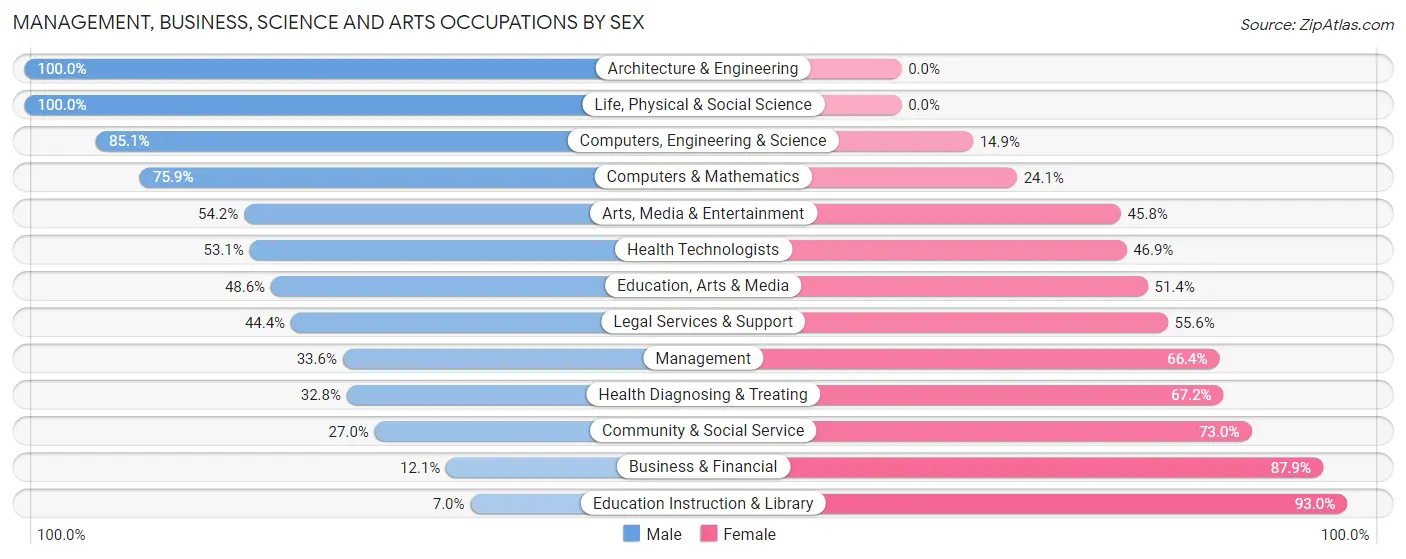
| Occupation | Male | Female |
| Management | 115 (33.6%) | 227 (66.4%) |
| Business & Financial | 17 (12.1%) | 124 (87.9%) |
| Computers, Engineering & Science | 114 (85.1%) | 20 (14.9%) |
| Computers & Mathematics | 63 (75.9%) | 20 (24.1%) |
| Architecture & Engineering | 39 (100.0%) | 0 (0.0%) |
| Life, Physical & Social Science | 12 (100.0%) | 0 (0.0%) |
| Community & Social Service | 136 (27.0%) | 368 (73.0%) |
| Education, Arts & Media | 35 (48.6%) | 37 (51.4%) |
| Legal Services & Support | 24 (44.4%) | 30 (55.6%) |
| Education Instruction & Library | 19 (7.0%) | 252 (93.0%) |
| Arts, Media & Entertainment | 58 (54.2%) | 49 (45.8%) |
| Health Diagnosing & Treating | 81 (32.8%) | 166 (67.2%) |
| Health Technologists | 52 (53.1%) | 46 (46.9%) |
| Total (Category) | 463 (33.9%) | 905 (66.1%) |
| Total (Overall) | 4,094 (53.2%) | 3,606 (46.8%) |
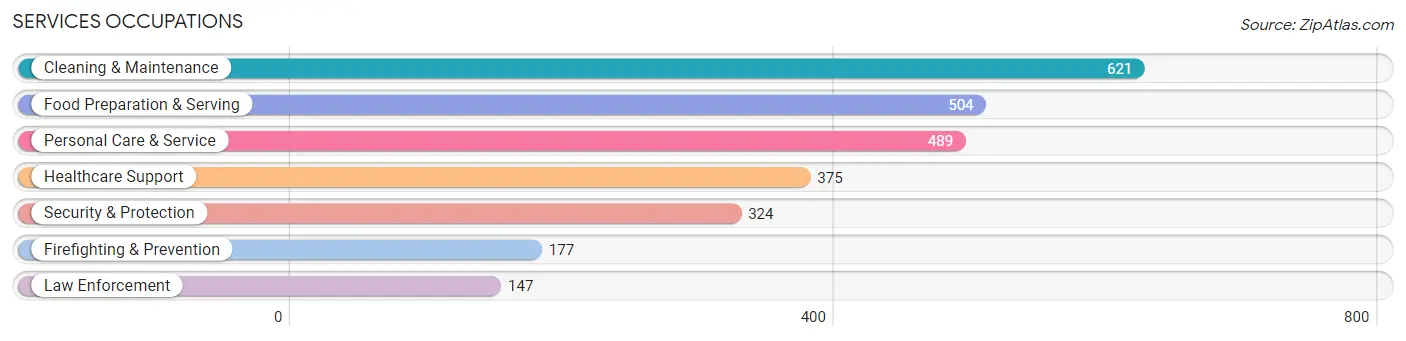
Services Occupations
The most common Services occupations in New Cassel are Cleaning & Maintenance (621 | 8.1%), Food Preparation & Serving (504 | 6.6%), Personal Care & Service (489 | 6.4%), Healthcare Support (375 | 4.9%), and Security & Protection (324 | 4.2%).
Services Occupations by Sex
Within the Services occupations in New Cassel, the most male-oriented occupations are Firefighting & Prevention (71.8%), Personal Care & Service (71.2%), and Security & Protection (66.0%), while the most female-oriented occupations are Healthcare Support (73.9%), Food Preparation & Serving (44.6%), and Cleaning & Maintenance (43.6%).
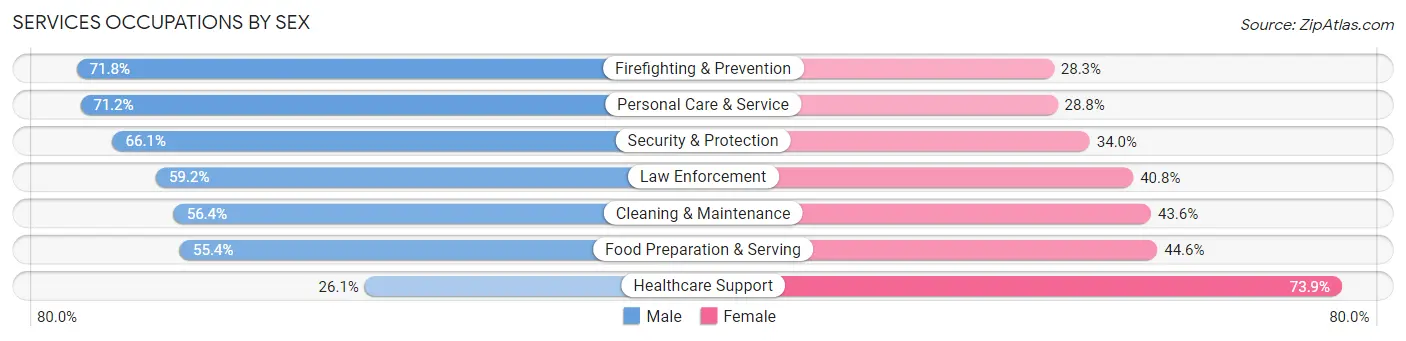
| Occupation | Male | Female |
| Healthcare Support | 98 (26.1%) | 277 (73.9%) |
| Security & Protection | 214 (66.0%) | 110 (34.0%) |
| Firefighting & Prevention | 127 (71.8%) | 50 (28.2%) |
| Law Enforcement | 87 (59.2%) | 60 (40.8%) |
| Food Preparation & Serving | 279 (55.4%) | 225 (44.6%) |
| Cleaning & Maintenance | 350 (56.4%) | 271 (43.6%) |
| Personal Care & Service | 348 (71.2%) | 141 (28.8%) |
| Total (Category) | 1,289 (55.7%) | 1,024 (44.3%) |
| Total (Overall) | 4,094 (53.2%) | 3,606 (46.8%) |
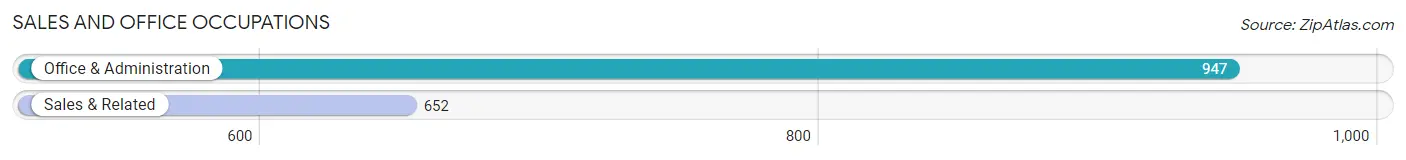
Sales and Office Occupations
The most common Sales and Office occupations in New Cassel are Office & Administration (947 | 12.3%), and Sales & Related (652 | 8.5%).
Sales and Office Occupations by Sex
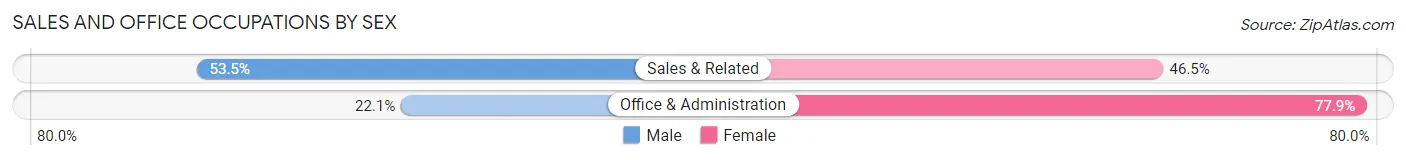
| Occupation | Male | Female |
| Sales & Related | 349 (53.5%) | 303 (46.5%) |
| Office & Administration | 209 (22.1%) | 738 (77.9%) |
| Total (Category) | 558 (34.9%) | 1,041 (65.1%) |
| Total (Overall) | 4,094 (53.2%) | 3,606 (46.8%) |
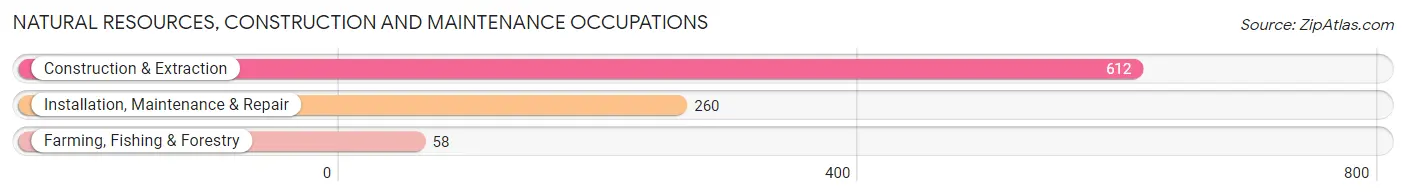
Natural Resources, Construction and Maintenance Occupations
The most common Natural Resources, Construction and Maintenance occupations in New Cassel are Construction & Extraction (612 | 8.0%), Installation, Maintenance & Repair (260 | 3.4%), and Farming, Fishing & Forestry (58 | 0.7%).
Natural Resources, Construction and Maintenance Occupations by Sex
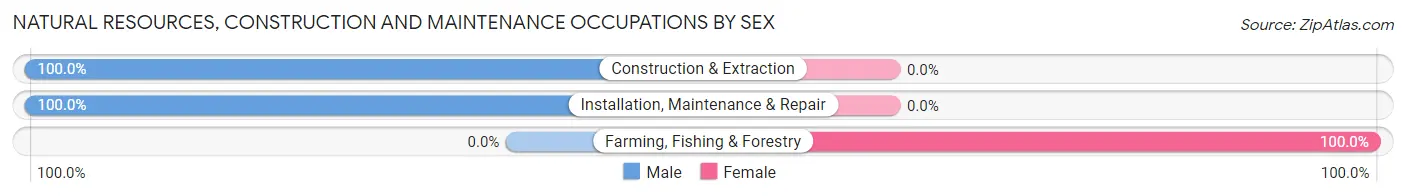
| Occupation | Male | Female |
| Farming, Fishing & Forestry | 0 (0.0%) | 58 (100.0%) |
| Construction & Extraction | 612 (100.0%) | 0 (0.0%) |
| Installation, Maintenance & Repair | 260 (100.0%) | 0 (0.0%) |
| Total (Category) | 872 (93.8%) | 58 (6.2%) |
| Total (Overall) | 4,094 (53.2%) | 3,606 (46.8%) |
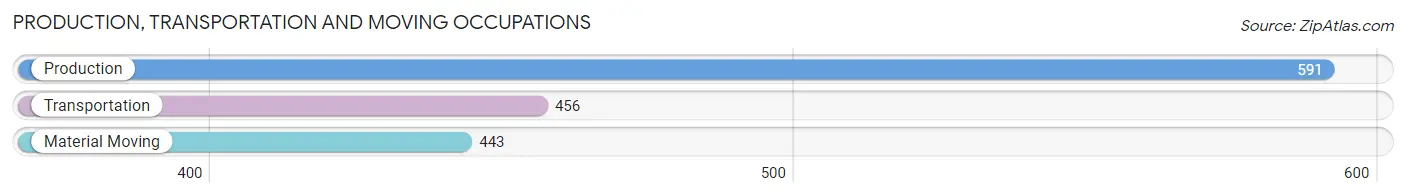
Production, Transportation and Moving Occupations
The most common Production, Transportation and Moving occupations in New Cassel are Production (591 | 7.7%), Transportation (456 | 5.9%), and Material Moving (443 | 5.8%).
Production, Transportation and Moving Occupations by Sex
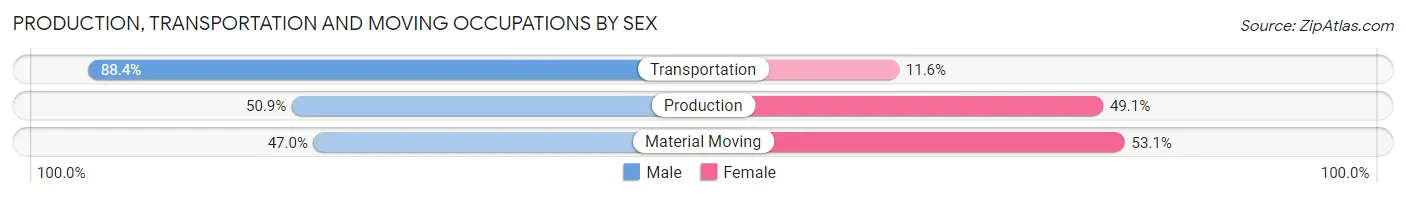
| Occupation | Male | Female |
| Production | 301 (50.9%) | 290 (49.1%) |
| Transportation | 403 (88.4%) | 53 (11.6%) |
| Material Moving | 208 (46.9%) | 235 (53.0%) |
| Total (Category) | 912 (61.2%) | 578 (38.8%) |
| Total (Overall) | 4,094 (53.2%) | 3,606 (46.8%) |
Employment Industries by Sex in New Cassel
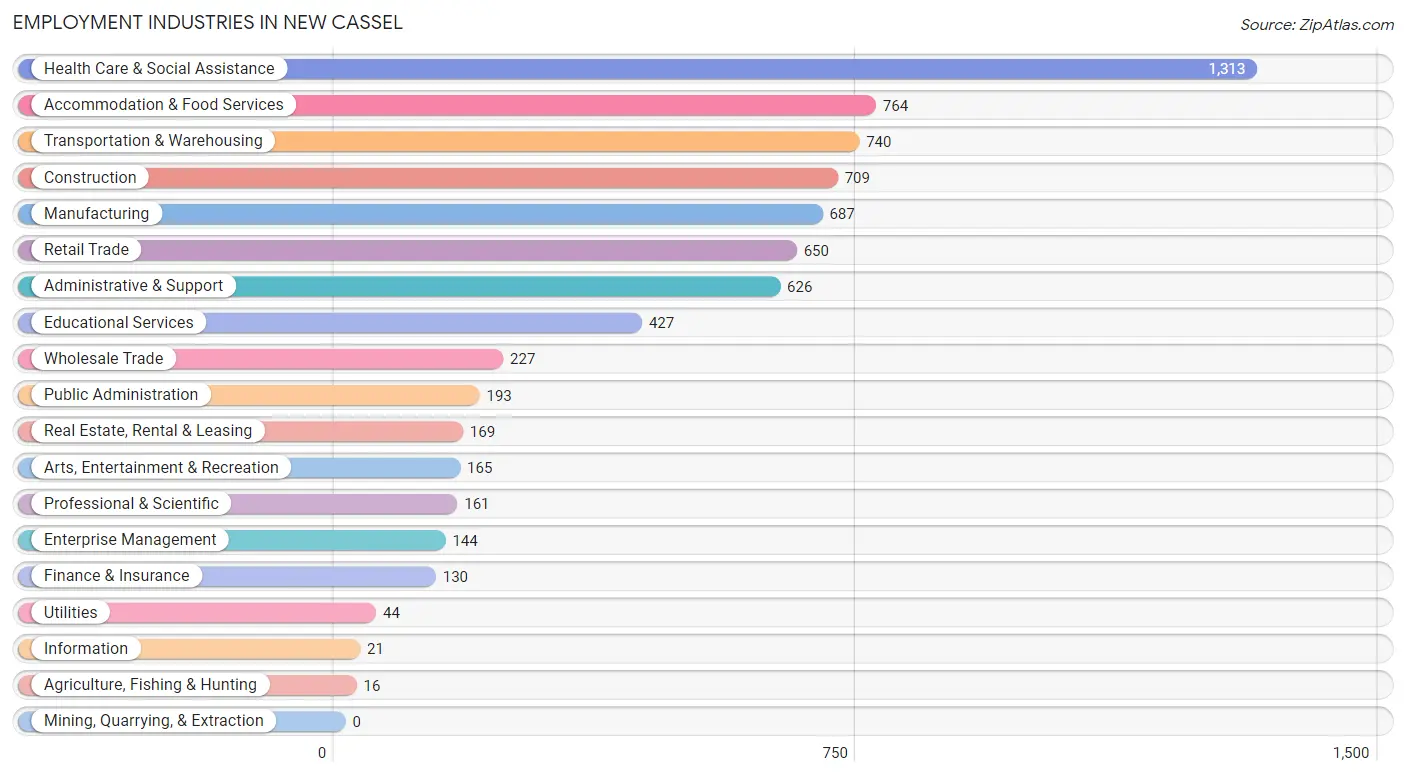
Employment Industries in New Cassel
The major employment industries in New Cassel include Health Care & Social Assistance (1,313 | 17.1%), Accommodation & Food Services (764 | 9.9%), Transportation & Warehousing (740 | 9.6%), Construction (709 | 9.2%), and Manufacturing (687 | 8.9%).
Employment Industries by Sex in New Cassel
The New Cassel industries that see more men than women are Enterprise Management (100.0%), Construction (99.3%), and Wholesale Trade (86.8%), whereas the industries that tend to have a higher number of women are Educational Services (81.5%), Manufacturing (80.9%), and Health Care & Social Assistance (74.5%).
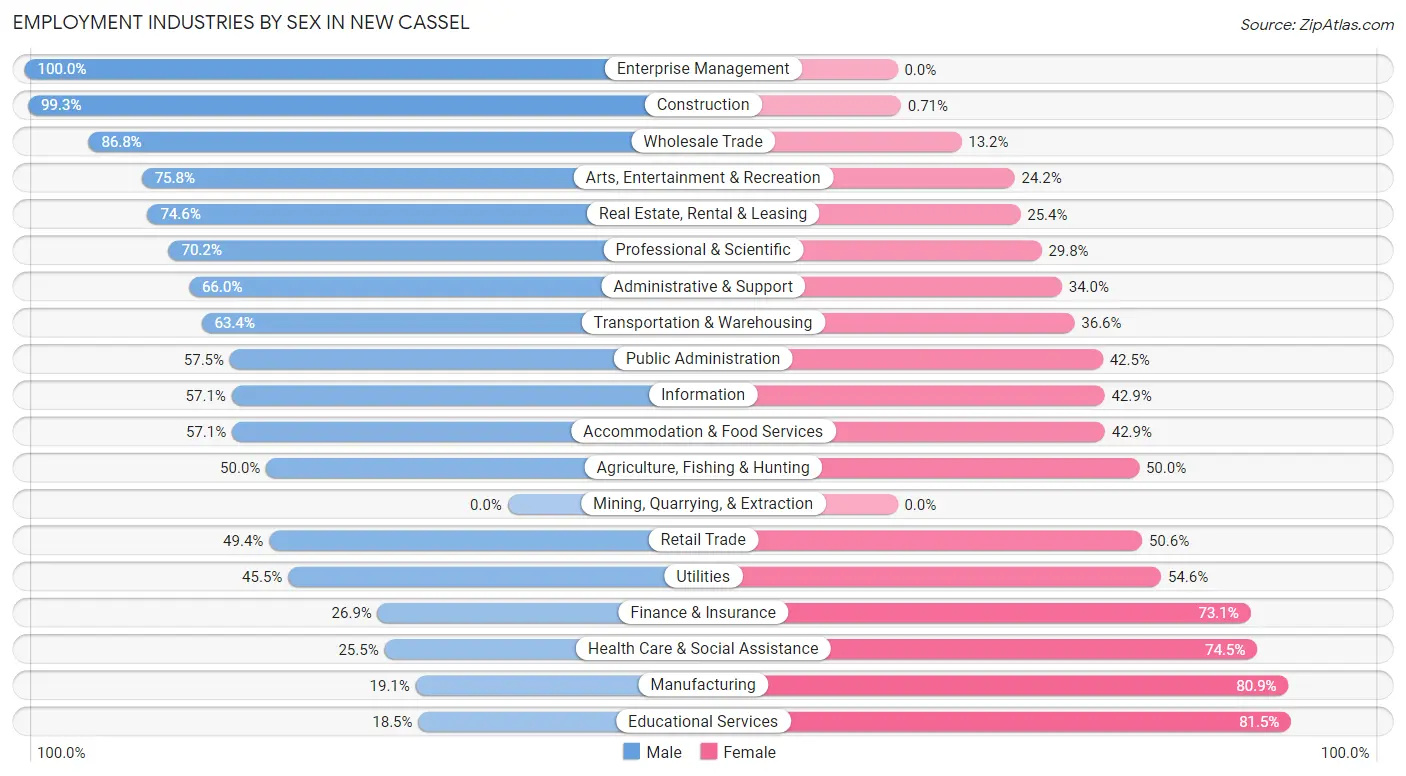
| Industry | Male | Female |
| Agriculture, Fishing & Hunting | 8 (50.0%) | 8 (50.0%) |
| Mining, Quarrying, & Extraction | 0 (0.0%) | 0 (0.0%) |
| Construction | 704 (99.3%) | 5 (0.7%) |
| Manufacturing | 131 (19.1%) | 556 (80.9%) |
| Wholesale Trade | 197 (86.8%) | 30 (13.2%) |
| Retail Trade | 321 (49.4%) | 329 (50.6%) |
| Transportation & Warehousing | 469 (63.4%) | 271 (36.6%) |
| Utilities | 20 (45.5%) | 24 (54.5%) |
| Information | 12 (57.1%) | 9 (42.9%) |
| Finance & Insurance | 35 (26.9%) | 95 (73.1%) |
| Real Estate, Rental & Leasing | 126 (74.6%) | 43 (25.4%) |
| Professional & Scientific | 113 (70.2%) | 48 (29.8%) |
| Enterprise Management | 144 (100.0%) | 0 (0.0%) |
| Administrative & Support | 413 (66.0%) | 213 (34.0%) |
| Educational Services | 79 (18.5%) | 348 (81.5%) |
| Health Care & Social Assistance | 335 (25.5%) | 978 (74.5%) |
| Arts, Entertainment & Recreation | 125 (75.8%) | 40 (24.2%) |
| Accommodation & Food Services | 436 (57.1%) | 328 (42.9%) |
| Public Administration | 111 (57.5%) | 82 (42.5%) |
| Total | 4,094 (53.2%) | 3,606 (46.8%) |
Education in New Cassel
School Enrollment in New Cassel
The most common levels of schooling among the 3,915 students in New Cassel are high school (1,132 | 28.9%), elementary school (1,108 | 28.3%), and college / undergraduate (659 | 16.8%).
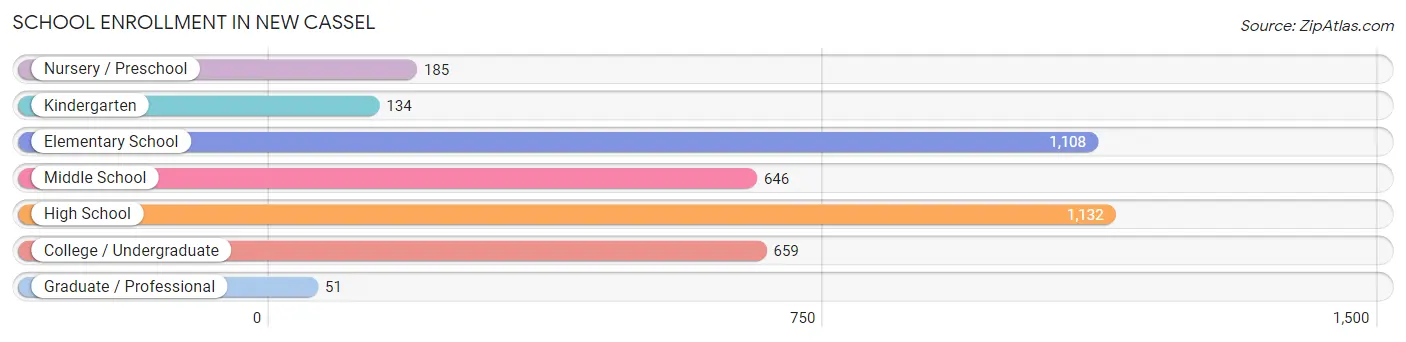
| School Level | # Students | % Students |
| Nursery / Preschool | 185 | 4.7% |
| Kindergarten | 134 | 3.4% |
| Elementary School | 1,108 | 28.3% |
| Middle School | 646 | 16.5% |
| High School | 1,132 | 28.9% |
| College / Undergraduate | 659 | 16.8% |
| Graduate / Professional | 51 | 1.3% |
| Total | 3,915 | 100.0% |
School Enrollment by Age by Funding Source in New Cassel
Out of a total of 3,915 students who are enrolled in schools in New Cassel, 771 (19.7%) attend a private institution, while the remaining 3,144 (80.3%) are enrolled in public schools. The age group of 35 years and over has the highest likelihood of being enrolled in private schools, with 108 (69.7% in the age bracket) enrolled. Conversely, the age group of 15 to 17 year olds has the lowest likelihood of being enrolled in a private school, with 748 (96.8% in the age bracket) attending a public institution.
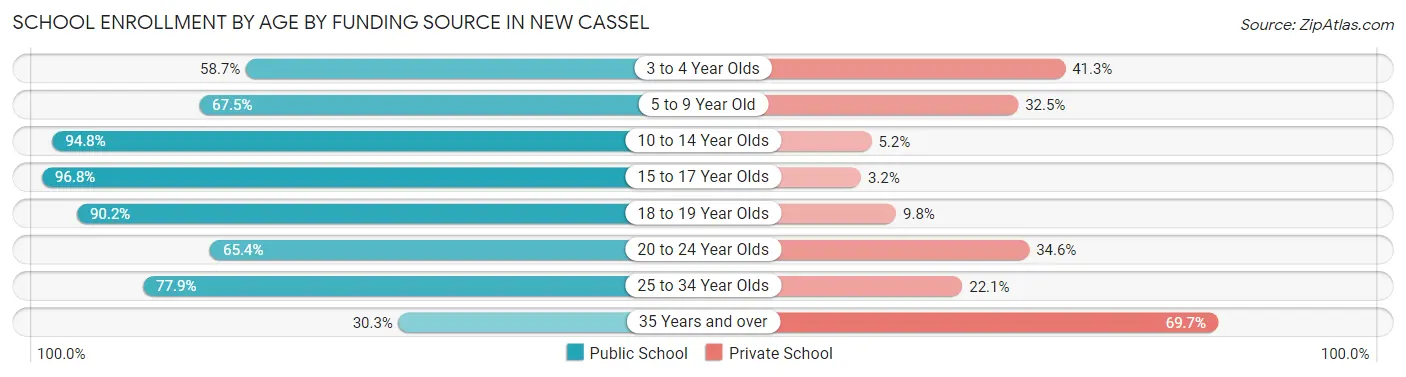
| Age Bracket | Public School | Private School |
| 3 to 4 Year Olds | 84 (58.7%) | 59 (41.3%) |
| 5 to 9 Year Old | 795 (67.5%) | 383 (32.5%) |
| 10 to 14 Year Olds | 861 (94.8%) | 47 (5.2%) |
| 15 to 17 Year Olds | 748 (96.8%) | 25 (3.2%) |
| 18 to 19 Year Olds | 333 (90.2%) | 36 (9.8%) |
| 20 to 24 Year Olds | 142 (65.4%) | 75 (34.6%) |
| 25 to 34 Year Olds | 134 (77.9%) | 38 (22.1%) |
| 35 Years and over | 47 (30.3%) | 108 (69.7%) |
| Total | 3,144 (80.3%) | 771 (19.7%) |
Educational Attainment by Field of Study in New Cassel
Business (376 | 21.3%), social sciences (197 | 11.2%), education (192 | 10.9%), science & technology (179 | 10.1%), and arts & humanities (172 | 9.7%) are the most common fields of study among 1,766 individuals in New Cassel who have obtained a bachelor's degree or higher.
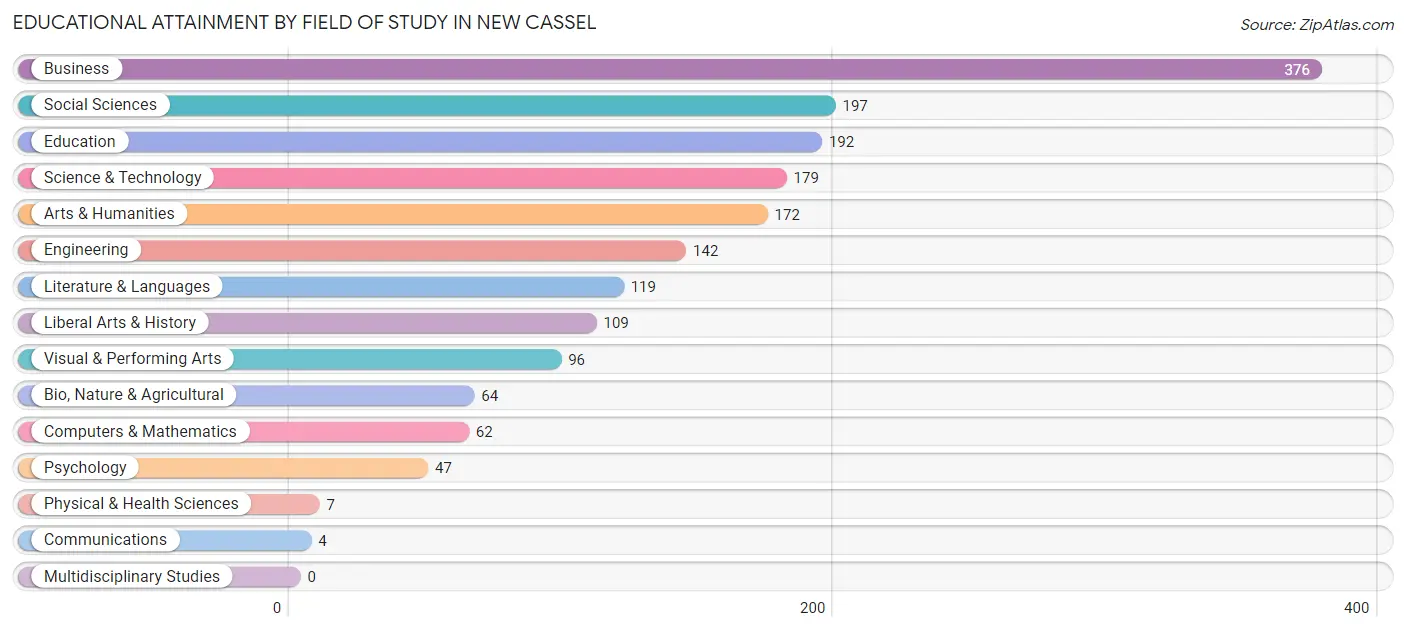
| Field of Study | # Graduates | % Graduates |
| Computers & Mathematics | 62 | 3.5% |
| Bio, Nature & Agricultural | 64 | 3.6% |
| Physical & Health Sciences | 7 | 0.4% |
| Psychology | 47 | 2.7% |
| Social Sciences | 197 | 11.2% |
| Engineering | 142 | 8.0% |
| Multidisciplinary Studies | 0 | 0.0% |
| Science & Technology | 179 | 10.1% |
| Business | 376 | 21.3% |
| Education | 192 | 10.9% |
| Literature & Languages | 119 | 6.7% |
| Liberal Arts & History | 109 | 6.2% |
| Visual & Performing Arts | 96 | 5.4% |
| Communications | 4 | 0.2% |
| Arts & Humanities | 172 | 9.7% |
| Total | 1,766 | 100.0% |
Transportation & Commute in New Cassel
Vehicle Availability by Sex in New Cassel
The most prevalent vehicle ownership categories in New Cassel are males with 3 vehicles (1,228, accounting for 30.1%) and females with 3 vehicles (939, making up 35.0%).
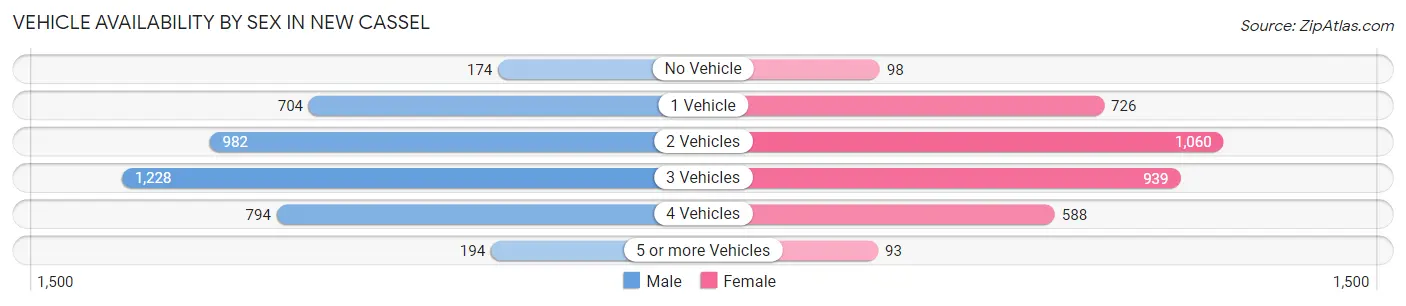
| Vehicles Available | Male | Female |
| No Vehicle | 174 (4.3%) | 98 (2.8%) |
| 1 Vehicle | 704 (17.3%) | 726 (20.7%) |
| 2 Vehicles | 982 (24.1%) | 1,060 (30.2%) |
| 3 Vehicles | 1,228 (30.1%) | 939 (26.8%) |
| 4 Vehicles | 794 (19.5%) | 588 (16.8%) |
| 5 or more Vehicles | 194 (4.8%) | 93 (2.6%) |
| Total | 4,076 (100.0%) | 3,504 (100.0%) |
Commute Time in New Cassel
The most frequently occuring commute durations in New Cassel are 10 to 14 minutes (1,481 commuters, 20.1%), 15 to 19 minutes (1,277 commuters, 17.3%), and 30 to 34 minutes (1,212 commuters, 16.4%).
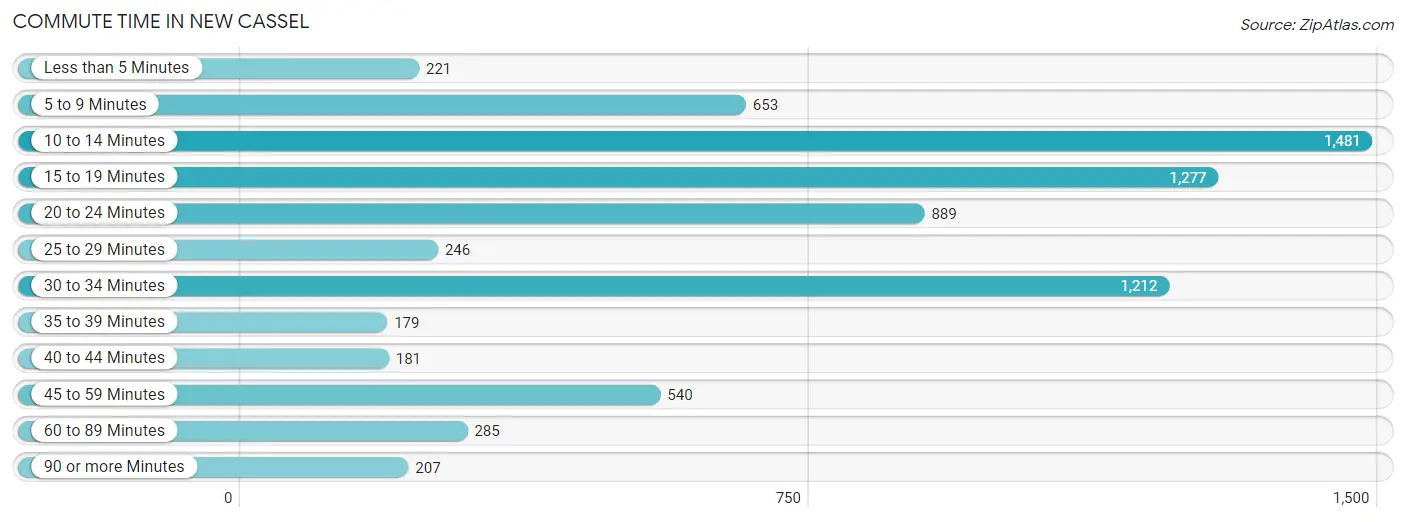
| Commute Time | # Commuters | % Commuters |
| Less than 5 Minutes | 221 | 3.0% |
| 5 to 9 Minutes | 653 | 8.9% |
| 10 to 14 Minutes | 1,481 | 20.1% |
| 15 to 19 Minutes | 1,277 | 17.3% |
| 20 to 24 Minutes | 889 | 12.1% |
| 25 to 29 Minutes | 246 | 3.3% |
| 30 to 34 Minutes | 1,212 | 16.4% |
| 35 to 39 Minutes | 179 | 2.4% |
| 40 to 44 Minutes | 181 | 2.5% |
| 45 to 59 Minutes | 540 | 7.3% |
| 60 to 89 Minutes | 285 | 3.9% |
| 90 or more Minutes | 207 | 2.8% |
Commute Time by Sex in New Cassel
The most common commute times in New Cassel are 10 to 14 minutes (901 commuters, 22.5%) for males and 15 to 19 minutes (752 commuters, 22.3%) for females.
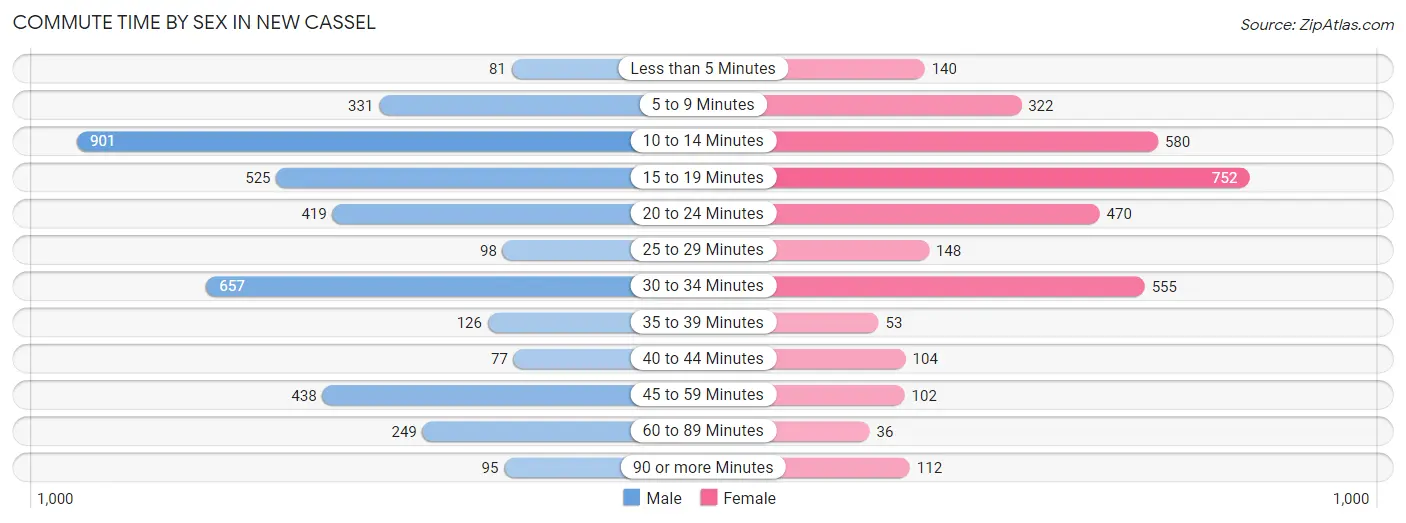
| Commute Time | Male | Female |
| Less than 5 Minutes | 81 (2.0%) | 140 (4.2%) |
| 5 to 9 Minutes | 331 (8.3%) | 322 (9.5%) |
| 10 to 14 Minutes | 901 (22.5%) | 580 (17.2%) |
| 15 to 19 Minutes | 525 (13.1%) | 752 (22.3%) |
| 20 to 24 Minutes | 419 (10.5%) | 470 (13.9%) |
| 25 to 29 Minutes | 98 (2.5%) | 148 (4.4%) |
| 30 to 34 Minutes | 657 (16.4%) | 555 (16.5%) |
| 35 to 39 Minutes | 126 (3.2%) | 53 (1.6%) |
| 40 to 44 Minutes | 77 (1.9%) | 104 (3.1%) |
| 45 to 59 Minutes | 438 (11.0%) | 102 (3.0%) |
| 60 to 89 Minutes | 249 (6.2%) | 36 (1.1%) |
| 90 or more Minutes | 95 (2.4%) | 112 (3.3%) |
Time of Departure to Work by Sex in New Cassel
The most frequent times of departure to work in New Cassel are 7:00 AM to 7:29 AM (1,541, 38.6%) for males and 7:00 AM to 7:29 AM (594, 17.6%) for females.
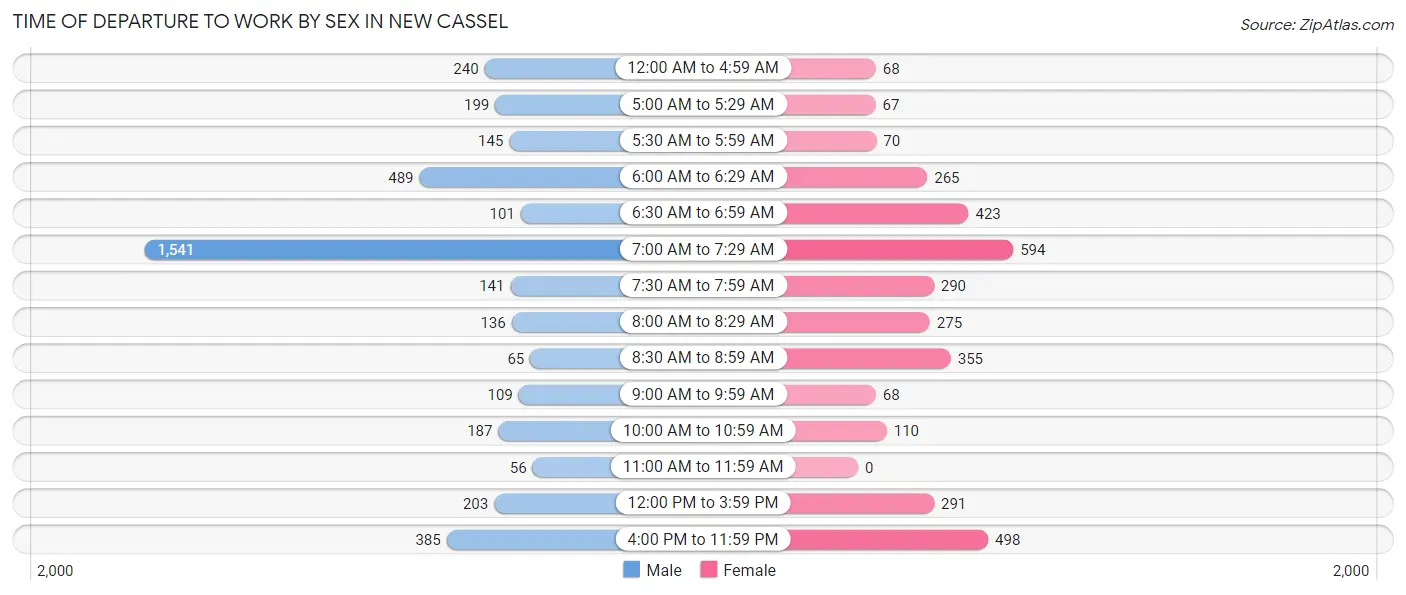
| Time of Departure | Male | Female |
| 12:00 AM to 4:59 AM | 240 (6.0%) | 68 (2.0%) |
| 5:00 AM to 5:29 AM | 199 (5.0%) | 67 (2.0%) |
| 5:30 AM to 5:59 AM | 145 (3.6%) | 70 (2.1%) |
| 6:00 AM to 6:29 AM | 489 (12.2%) | 265 (7.9%) |
| 6:30 AM to 6:59 AM | 101 (2.5%) | 423 (12.5%) |
| 7:00 AM to 7:29 AM | 1,541 (38.6%) | 594 (17.6%) |
| 7:30 AM to 7:59 AM | 141 (3.5%) | 290 (8.6%) |
| 8:00 AM to 8:29 AM | 136 (3.4%) | 275 (8.2%) |
| 8:30 AM to 8:59 AM | 65 (1.6%) | 355 (10.5%) |
| 9:00 AM to 9:59 AM | 109 (2.7%) | 68 (2.0%) |
| 10:00 AM to 10:59 AM | 187 (4.7%) | 110 (3.3%) |
| 11:00 AM to 11:59 AM | 56 (1.4%) | 0 (0.0%) |
| 12:00 PM to 3:59 PM | 203 (5.1%) | 291 (8.6%) |
| 4:00 PM to 11:59 PM | 385 (9.6%) | 498 (14.8%) |
| Total | 3,997 (100.0%) | 3,374 (100.0%) |
Housing Occupancy in New Cassel
Occupancy by Ownership in New Cassel
Of the total 3,341 dwellings in New Cassel, owner-occupied units account for 2,076 (62.1%), while renter-occupied units make up 1,265 (37.9%).
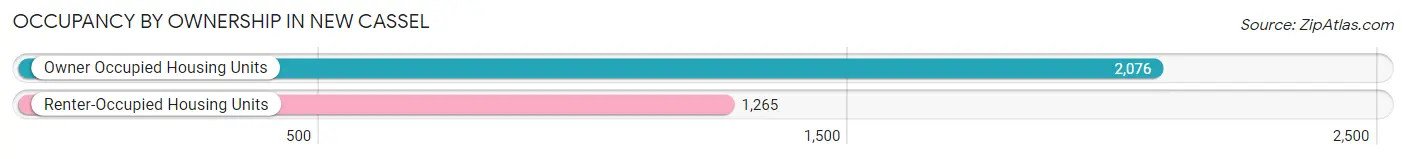
| Occupancy | # Housing Units | % Housing Units |
| Owner Occupied Housing Units | 2,076 | 62.1% |
| Renter-Occupied Housing Units | 1,265 | 37.9% |
| Total Occupied Housing Units | 3,341 | 100.0% |
Occupancy by Household Size in New Cassel
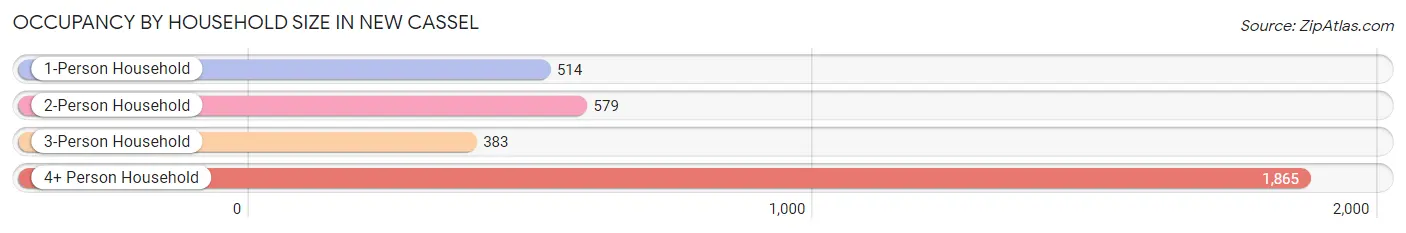
| Household Size | # Housing Units | % Housing Units |
| 1-Person Household | 514 | 15.4% |
| 2-Person Household | 579 | 17.3% |
| 3-Person Household | 383 | 11.5% |
| 4+ Person Household | 1,865 | 55.8% |
| Total Housing Units | 3,341 | 100.0% |
Occupancy by Ownership by Household Size in New Cassel
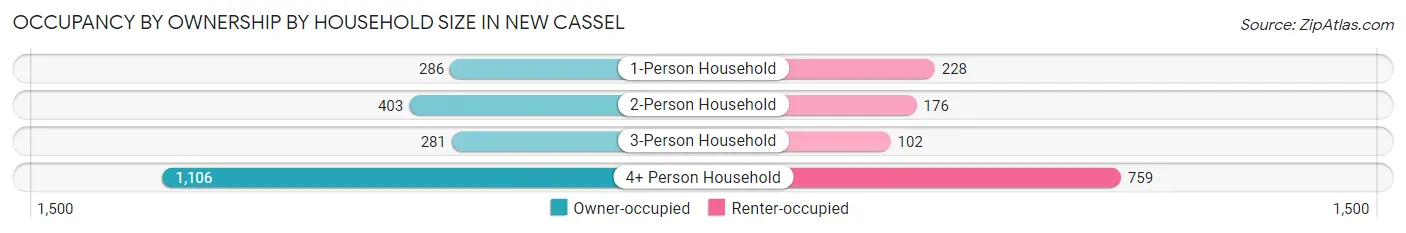
| Household Size | Owner-occupied | Renter-occupied |
| 1-Person Household | 286 (55.6%) | 228 (44.4%) |
| 2-Person Household | 403 (69.6%) | 176 (30.4%) |
| 3-Person Household | 281 (73.4%) | 102 (26.6%) |
| 4+ Person Household | 1,106 (59.3%) | 759 (40.7%) |
| Total Housing Units | 2,076 (62.1%) | 1,265 (37.9%) |
Occupancy by Educational Attainment in New Cassel
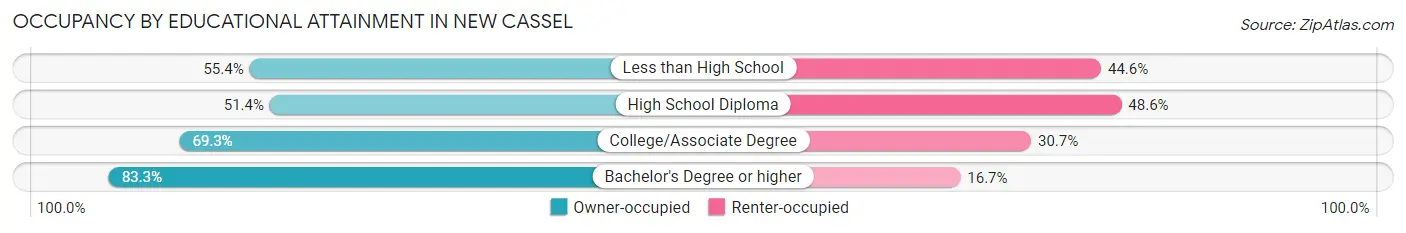
| Household Size | Owner-occupied | Renter-occupied |
| Less than High School | 676 (55.4%) | 544 (44.6%) |
| High School Diploma | 467 (51.4%) | 442 (48.6%) |
| College/Associate Degree | 379 (69.3%) | 168 (30.7%) |
| Bachelor's Degree or higher | 554 (83.3%) | 111 (16.7%) |
Occupancy by Age of Householder in New Cassel
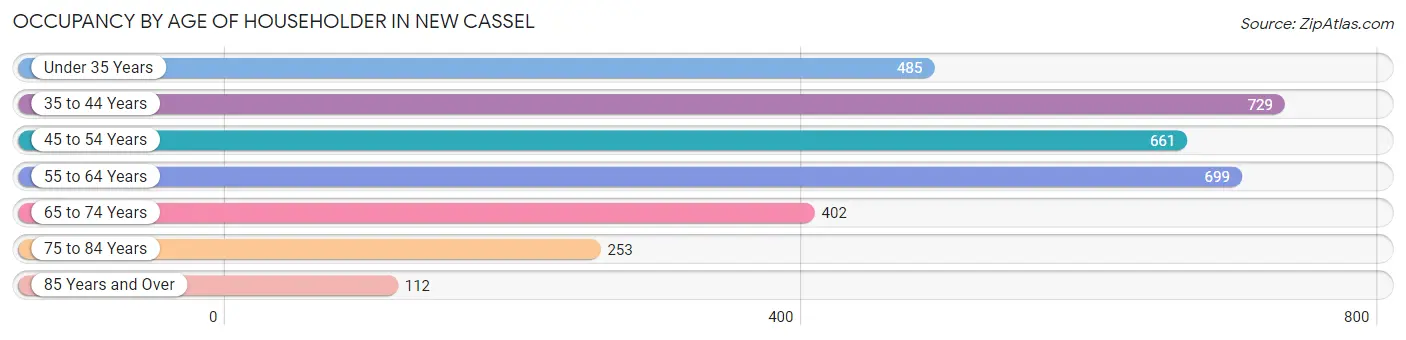
| Age Bracket | # Households | % Households |
| Under 35 Years | 485 | 14.5% |
| 35 to 44 Years | 729 | 21.8% |
| 45 to 54 Years | 661 | 19.8% |
| 55 to 64 Years | 699 | 20.9% |
| 65 to 74 Years | 402 | 12.0% |
| 75 to 84 Years | 253 | 7.6% |
| 85 Years and Over | 112 | 3.4% |
| Total | 3,341 | 100.0% |
Housing Finances in New Cassel
Median Income by Occupancy in New Cassel
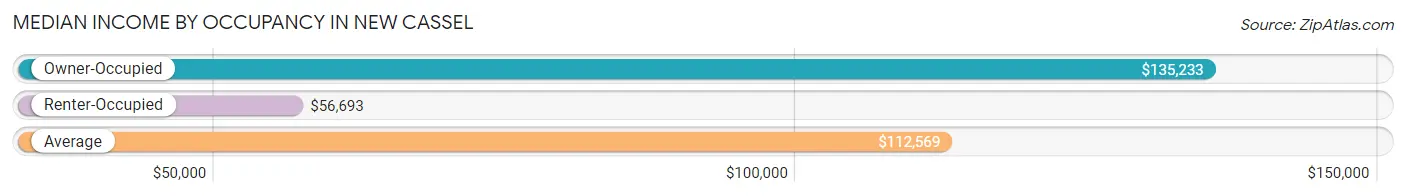
| Occupancy Type | # Households | Median Income |
| Owner-Occupied | 2,076 (62.1%) | $135,233 |
| Renter-Occupied | 1,265 (37.9%) | $56,693 |
| Average | 3,341 (100.0%) | $112,569 |
Occupancy by Householder Income Bracket in New Cassel
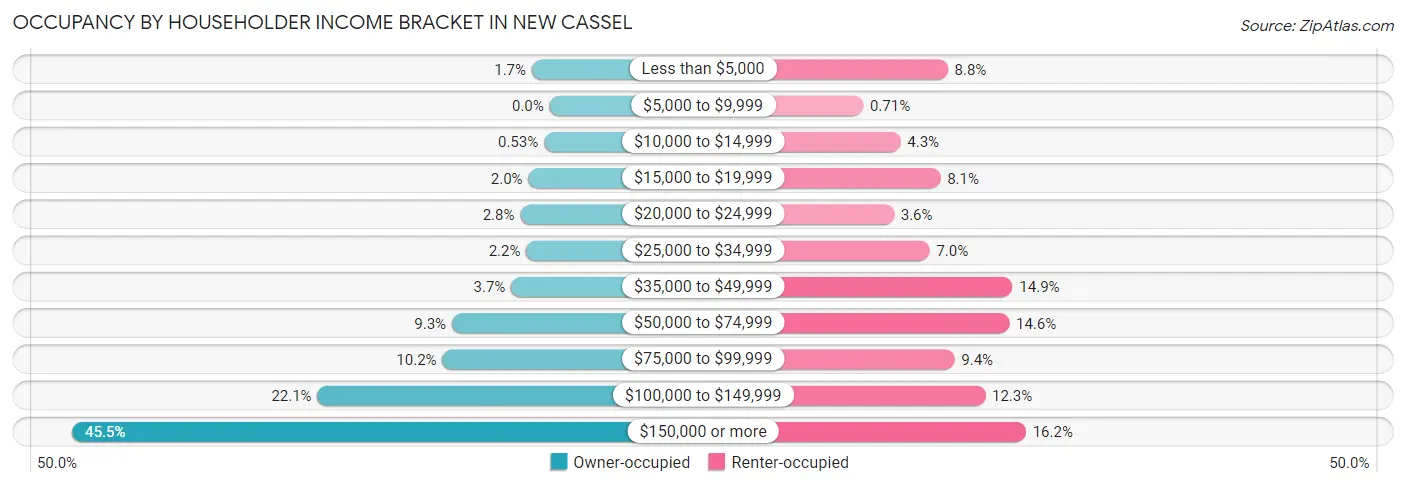
| Income Bracket | Owner-occupied | Renter-occupied |
| Less than $5,000 | 35 (1.7%) | 111 (8.8%) |
| $5,000 to $9,999 | 0 (0.0%) | 9 (0.7%) |
| $10,000 to $14,999 | 11 (0.5%) | 54 (4.3%) |
| $15,000 to $19,999 | 42 (2.0%) | 102 (8.1%) |
| $20,000 to $24,999 | 58 (2.8%) | 46 (3.6%) |
| $25,000 to $34,999 | 46 (2.2%) | 89 (7.0%) |
| $35,000 to $49,999 | 76 (3.7%) | 189 (14.9%) |
| $50,000 to $74,999 | 193 (9.3%) | 185 (14.6%) |
| $75,000 to $99,999 | 212 (10.2%) | 119 (9.4%) |
| $100,000 to $149,999 | 459 (22.1%) | 156 (12.3%) |
| $150,000 or more | 944 (45.5%) | 205 (16.2%) |
| Total | 2,076 (100.0%) | 1,265 (100.0%) |
Monthly Housing Cost Tiers in New Cassel
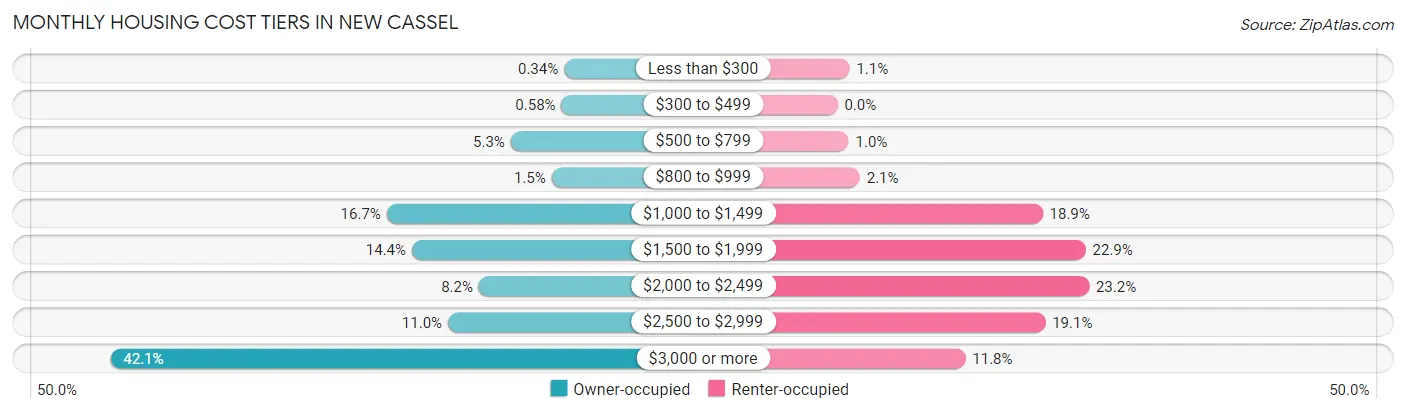
| Monthly Cost | Owner-occupied | Renter-occupied |
| Less than $300 | 7 (0.3%) | 14 (1.1%) |
| $300 to $499 | 12 (0.6%) | 0 (0.0%) |
| $500 to $799 | 109 (5.2%) | 13 (1.0%) |
| $800 to $999 | 31 (1.5%) | 26 (2.1%) |
| $1,000 to $1,499 | 346 (16.7%) | 239 (18.9%) |
| $1,500 to $1,999 | 298 (14.3%) | 289 (22.9%) |
| $2,000 to $2,499 | 170 (8.2%) | 293 (23.2%) |
| $2,500 to $2,999 | 229 (11.0%) | 242 (19.1%) |
| $3,000 or more | 874 (42.1%) | 149 (11.8%) |
| Total | 2,076 (100.0%) | 1,265 (100.0%) |
Physical Housing Characteristics in New Cassel
Housing Structures in New Cassel
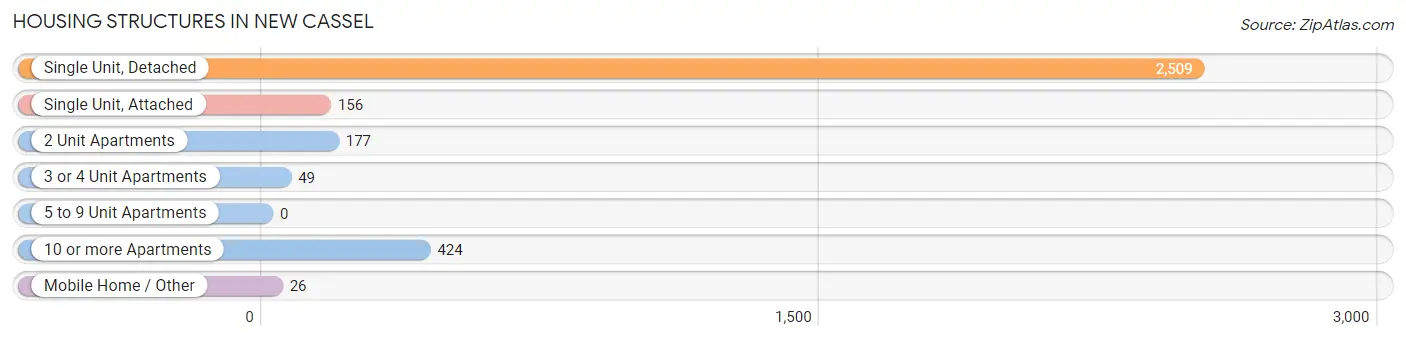
| Structure Type | # Housing Units | % Housing Units |
| Single Unit, Detached | 2,509 | 75.1% |
| Single Unit, Attached | 156 | 4.7% |
| 2 Unit Apartments | 177 | 5.3% |
| 3 or 4 Unit Apartments | 49 | 1.5% |
| 5 to 9 Unit Apartments | 0 | 0.0% |
| 10 or more Apartments | 424 | 12.7% |
| Mobile Home / Other | 26 | 0.8% |
| Total | 3,341 | 100.0% |
Housing Structures by Occupancy in New Cassel
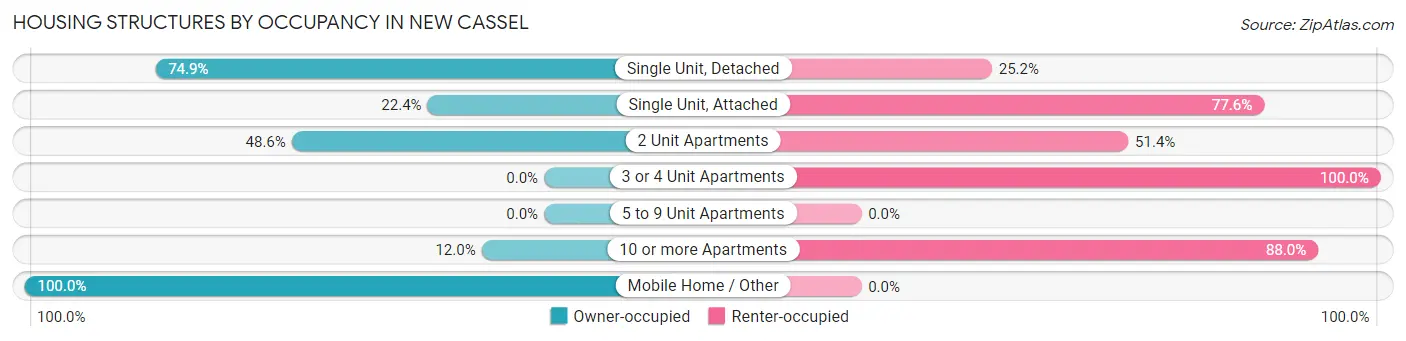
| Structure Type | Owner-occupied | Renter-occupied |
| Single Unit, Detached | 1,878 (74.9%) | 631 (25.2%) |
| Single Unit, Attached | 35 (22.4%) | 121 (77.6%) |
| 2 Unit Apartments | 86 (48.6%) | 91 (51.4%) |
| 3 or 4 Unit Apartments | 0 (0.0%) | 49 (100.0%) |
| 5 to 9 Unit Apartments | 0 (0.0%) | 0 (0.0%) |
| 10 or more Apartments | 51 (12.0%) | 373 (88.0%) |
| Mobile Home / Other | 26 (100.0%) | 0 (0.0%) |
| Total | 2,076 (62.1%) | 1,265 (37.9%) |
Housing Structures by Number of Rooms in New Cassel
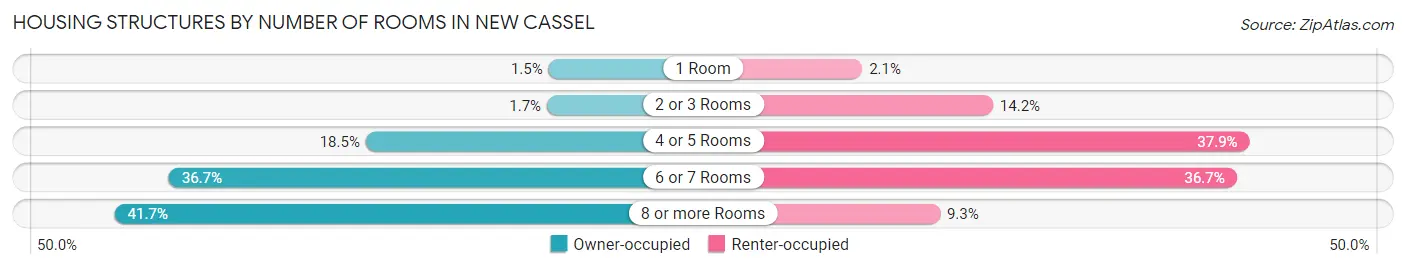
| Number of Rooms | Owner-occupied | Renter-occupied |
| 1 Room | 32 (1.5%) | 26 (2.1%) |
| 2 or 3 Rooms | 35 (1.7%) | 179 (14.1%) |
| 4 or 5 Rooms | 383 (18.4%) | 479 (37.9%) |
| 6 or 7 Rooms | 761 (36.7%) | 464 (36.7%) |
| 8 or more Rooms | 865 (41.7%) | 117 (9.2%) |
| Total | 2,076 (100.0%) | 1,265 (100.0%) |
Housing Structure by Heating Type in New Cassel
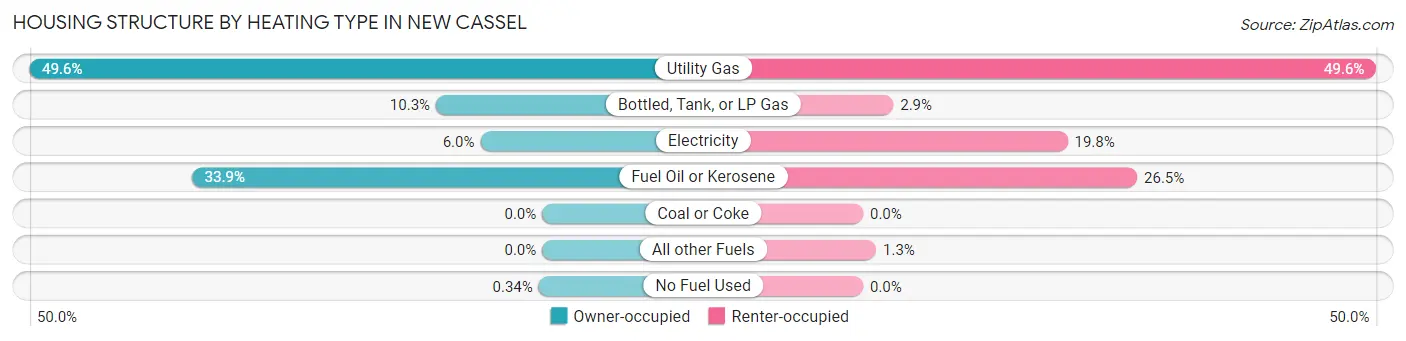
| Heating Type | Owner-occupied | Renter-occupied |
| Utility Gas | 1,029 (49.6%) | 627 (49.6%) |
| Bottled, Tank, or LP Gas | 213 (10.3%) | 37 (2.9%) |
| Electricity | 124 (6.0%) | 250 (19.8%) |
| Fuel Oil or Kerosene | 703 (33.9%) | 335 (26.5%) |
| Coal or Coke | 0 (0.0%) | 0 (0.0%) |
| All other Fuels | 0 (0.0%) | 16 (1.3%) |
| No Fuel Used | 7 (0.3%) | 0 (0.0%) |
| Total | 2,076 (100.0%) | 1,265 (100.0%) |
Household Vehicle Usage in New Cassel
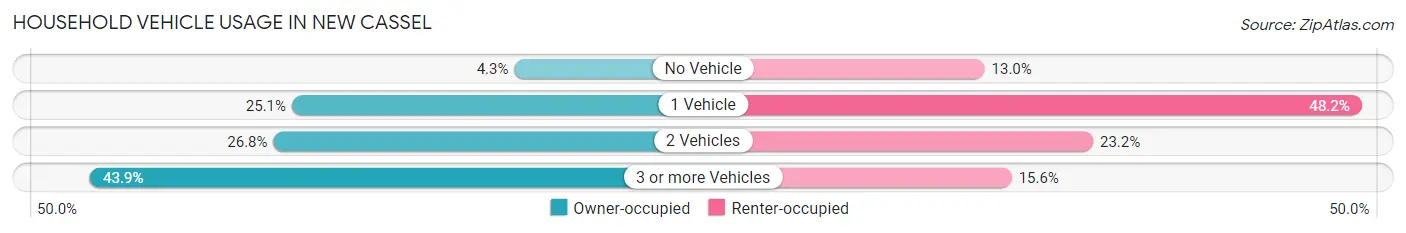
| Vehicles per Household | Owner-occupied | Renter-occupied |
| No Vehicle | 89 (4.3%) | 165 (13.0%) |
| 1 Vehicle | 520 (25.1%) | 610 (48.2%) |
| 2 Vehicles | 556 (26.8%) | 293 (23.2%) |
| 3 or more Vehicles | 911 (43.9%) | 197 (15.6%) |
| Total | 2,076 (100.0%) | 1,265 (100.0%) |
Real Estate & Mortgages in New Cassel
Real Estate and Mortgage Overview in New Cassel
| Characteristic | Without Mortgage | With Mortgage |
| Housing Units | 639 | 1,437 |
| Median Property Value | $464,900 | $482,200 |
| Median Household Income | $140,054 | $647 |
| Monthly Housing Costs | $1,376 | $874 |
| Real Estate Taxes | $10,001 | $12 |
Property Value by Mortgage Status in New Cassel
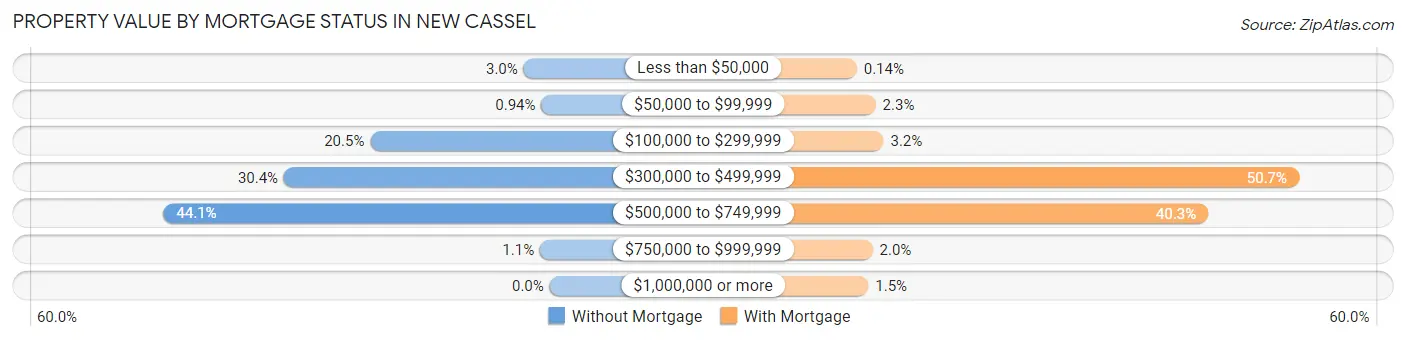
| Property Value | Without Mortgage | With Mortgage |
| Less than $50,000 | 19 (3.0%) | 2 (0.1%) |
| $50,000 to $99,999 | 6 (0.9%) | 33 (2.3%) |
| $100,000 to $299,999 | 131 (20.5%) | 46 (3.2%) |
| $300,000 to $499,999 | 194 (30.4%) | 728 (50.7%) |
| $500,000 to $749,999 | 282 (44.1%) | 579 (40.3%) |
| $750,000 to $999,999 | 7 (1.1%) | 28 (1.9%) |
| $1,000,000 or more | 0 (0.0%) | 21 (1.5%) |
| Total | 639 (100.0%) | 1,437 (100.0%) |
Household Income by Mortgage Status in New Cassel
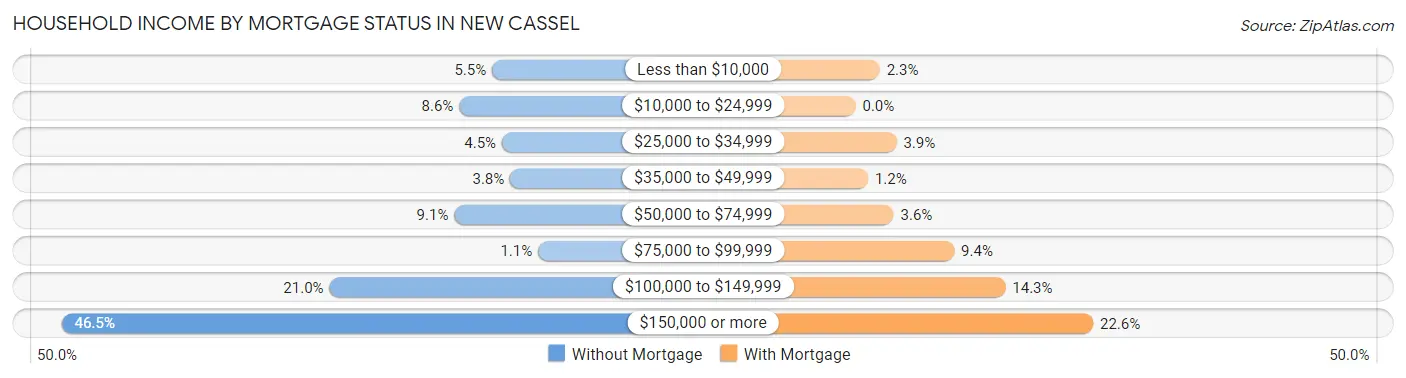
| Household Income | Without Mortgage | With Mortgage |
| Less than $10,000 | 35 (5.5%) | 33 (2.3%) |
| $10,000 to $24,999 | 55 (8.6%) | 0 (0.0%) |
| $25,000 to $34,999 | 29 (4.5%) | 56 (3.9%) |
| $35,000 to $49,999 | 24 (3.8%) | 17 (1.2%) |
| $50,000 to $74,999 | 58 (9.1%) | 52 (3.6%) |
| $75,000 to $99,999 | 7 (1.1%) | 135 (9.4%) |
| $100,000 to $149,999 | 134 (21.0%) | 205 (14.3%) |
| $150,000 or more | 297 (46.5%) | 325 (22.6%) |
| Total | 639 (100.0%) | 1,437 (100.0%) |
Property Value to Household Income Ratio in New Cassel
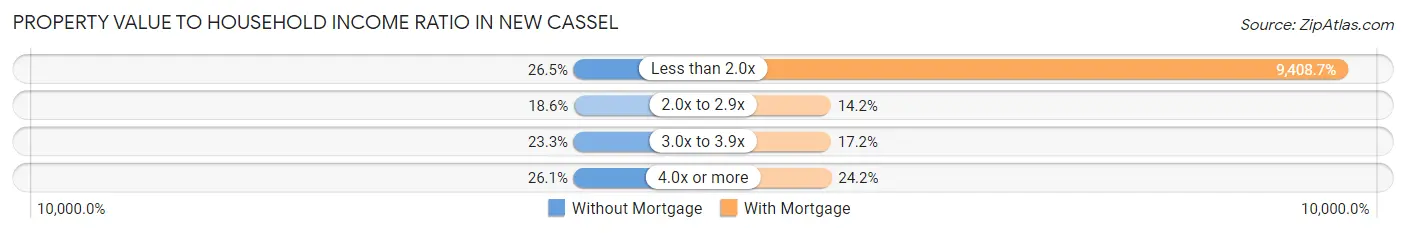
| Value-to-Income Ratio | Without Mortgage | With Mortgage |
| Less than 2.0x | 169 (26.5%) | 135,203 (9,408.7%) |
| 2.0x to 2.9x | 119 (18.6%) | 204 (14.2%) |
| 3.0x to 3.9x | 149 (23.3%) | 247 (17.2%) |
| 4.0x or more | 167 (26.1%) | 347 (24.1%) |
| Total | 639 (100.0%) | 1,437 (100.0%) |
Real Estate Taxes by Mortgage Status in New Cassel
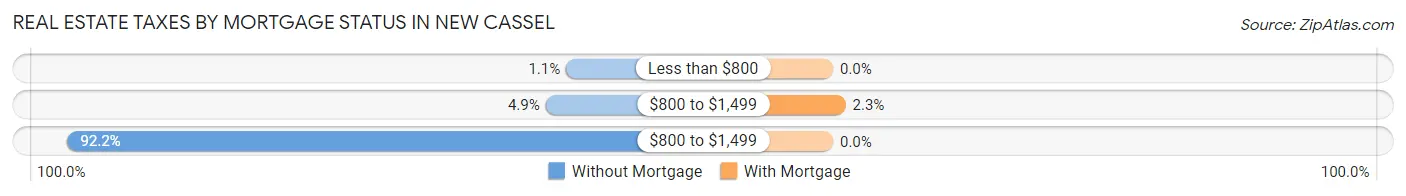
| Property Taxes | Without Mortgage | With Mortgage |
| Less than $800 | 7 (1.1%) | 0 (0.0%) |
| $800 to $1,499 | 31 (4.9%) | 33 (2.3%) |
| $800 to $1,499 | 589 (92.2%) | 0 (0.0%) |
| Total | 639 (100.0%) | 1,437 (100.0%) |
Health & Disability in New Cassel
Health Insurance Coverage by Age in New Cassel
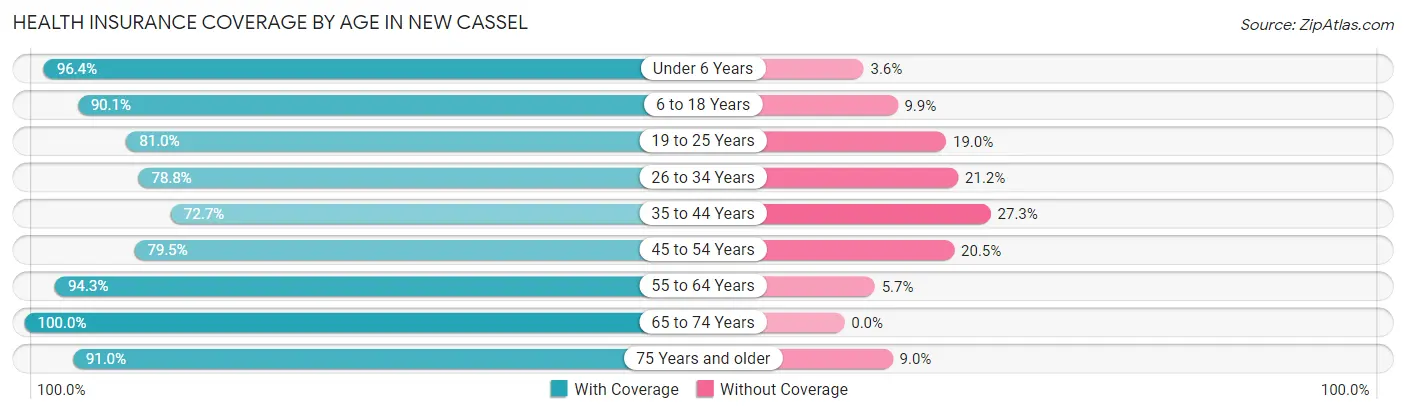
| Age Bracket | With Coverage | Without Coverage |
| Under 6 Years | 1,505 (96.4%) | 56 (3.6%) |
| 6 to 18 Years | 2,947 (90.1%) | 324 (9.9%) |
| 19 to 25 Years | 1,426 (81.0%) | 334 (19.0%) |
| 26 to 34 Years | 1,603 (78.8%) | 432 (21.2%) |
| 35 to 44 Years | 1,529 (72.7%) | 574 (27.3%) |
| 45 to 54 Years | 1,448 (79.5%) | 373 (20.5%) |
| 55 to 64 Years | 1,182 (94.3%) | 71 (5.7%) |
| 65 to 74 Years | 712 (100.0%) | 0 (0.0%) |
| 75 Years and older | 556 (91.0%) | 55 (9.0%) |
| Total | 12,908 (85.3%) | 2,219 (14.7%) |
Health Insurance Coverage by Citizenship Status in New Cassel
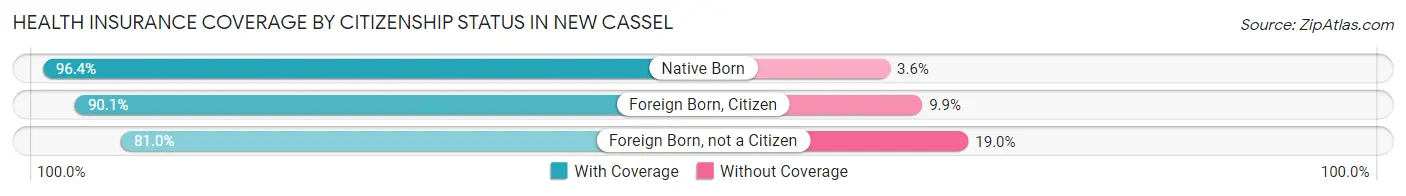
| Citizenship Status | With Coverage | Without Coverage |
| Native Born | 1,505 (96.4%) | 56 (3.6%) |
| Foreign Born, Citizen | 2,947 (90.1%) | 324 (9.9%) |
| Foreign Born, not a Citizen | 1,426 (81.0%) | 334 (19.0%) |
Health Insurance Coverage by Household Income in New Cassel
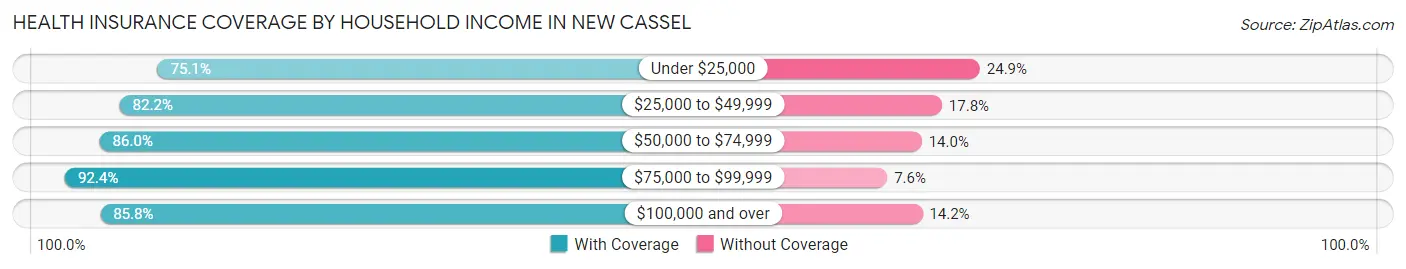
| Household Income | With Coverage | Without Coverage |
| Under $25,000 | 825 (75.1%) | 274 (24.9%) |
| $25,000 to $49,999 | 1,148 (82.2%) | 249 (17.8%) |
| $50,000 to $74,999 | 1,212 (86.0%) | 198 (14.0%) |
| $75,000 to $99,999 | 1,209 (92.4%) | 99 (7.6%) |
| $100,000 and over | 8,476 (85.8%) | 1,399 (14.2%) |
Public vs Private Health Insurance Coverage by Age in New Cassel
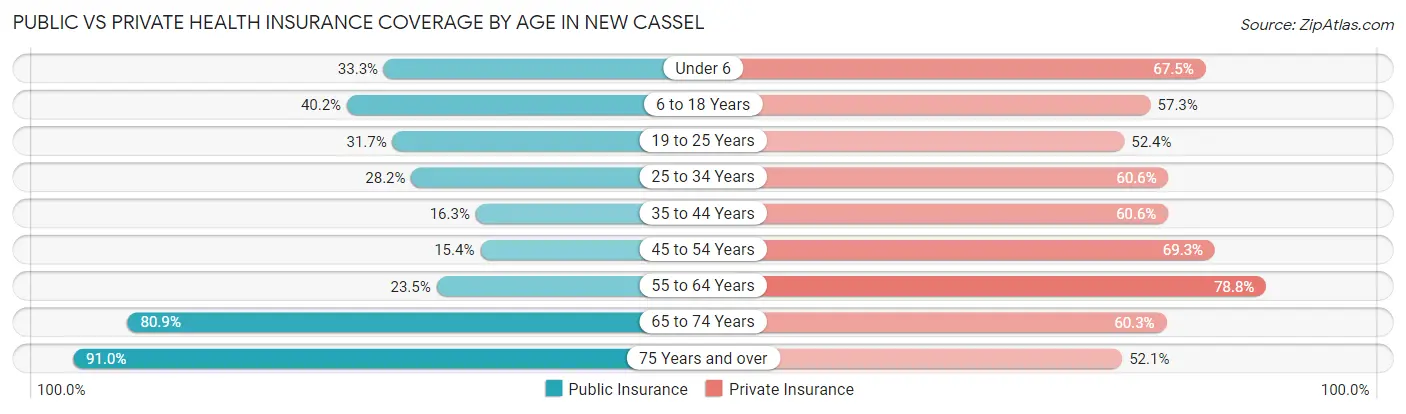
| Age Bracket | Public Insurance | Private Insurance |
| Under 6 | 520 (33.3%) | 1,054 (67.5%) |
| 6 to 18 Years | 1,314 (40.2%) | 1,875 (57.3%) |
| 19 to 25 Years | 558 (31.7%) | 923 (52.4%) |
| 25 to 34 Years | 574 (28.2%) | 1,234 (60.6%) |
| 35 to 44 Years | 342 (16.3%) | 1,274 (60.6%) |
| 45 to 54 Years | 281 (15.4%) | 1,261 (69.3%) |
| 55 to 64 Years | 295 (23.5%) | 987 (78.8%) |
| 65 to 74 Years | 576 (80.9%) | 429 (60.3%) |
| 75 Years and over | 556 (91.0%) | 318 (52.0%) |
| Total | 5,016 (33.2%) | 9,355 (61.8%) |
Disability Status by Sex by Age in New Cassel
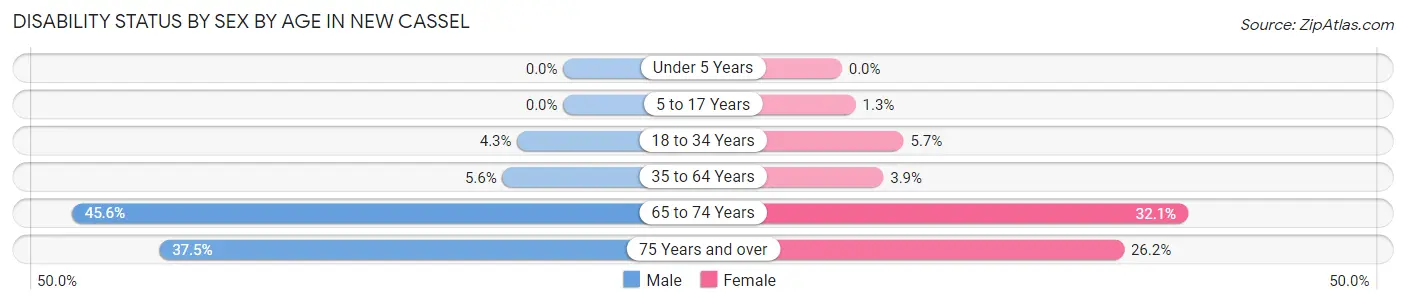
| Age Bracket | Male | Female |
| Under 5 Years | 0 (0.0%) | 0 (0.0%) |
| 5 to 17 Years | 0 (0.0%) | 17 (1.3%) |
| 18 to 34 Years | 83 (4.3%) | 134 (5.7%) |
| 35 to 64 Years | 144 (5.6%) | 101 (3.8%) |
| 65 to 74 Years | 99 (45.6%) | 159 (32.1%) |
| 75 Years and over | 63 (37.5%) | 116 (26.2%) |
Disability Class by Sex by Age in New Cassel
Disability Class: Hearing Difficulty
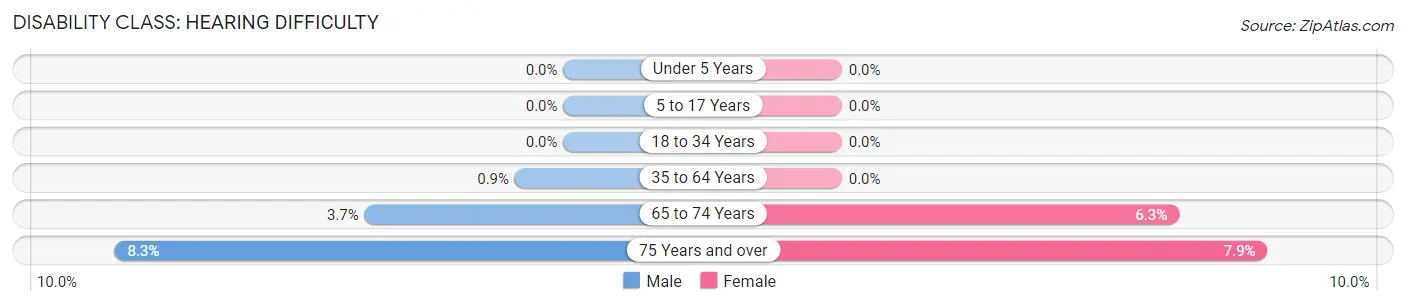
| Age Bracket | Male | Female |
| Under 5 Years | 0 (0.0%) | 0 (0.0%) |
| 5 to 17 Years | 0 (0.0%) | 0 (0.0%) |
| 18 to 34 Years | 0 (0.0%) | 0 (0.0%) |
| 35 to 64 Years | 23 (0.9%) | 0 (0.0%) |
| 65 to 74 Years | 8 (3.7%) | 31 (6.3%) |
| 75 Years and over | 14 (8.3%) | 35 (7.9%) |
Disability Class: Vision Difficulty
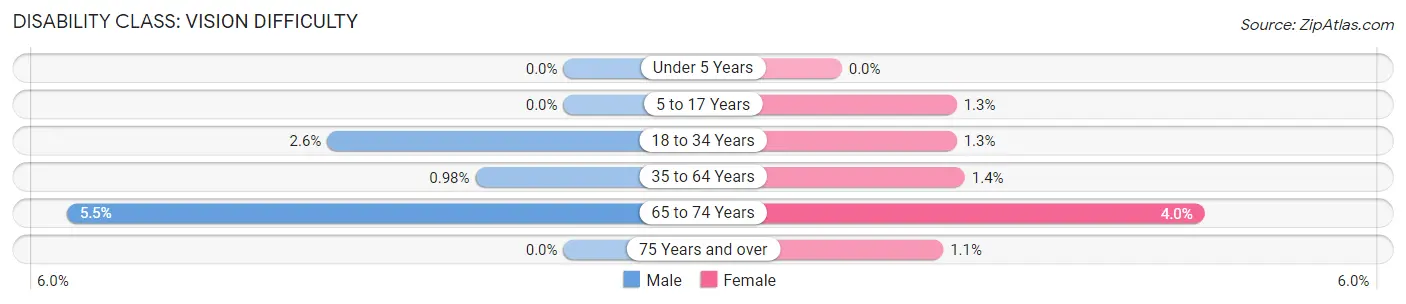
| Age Bracket | Male | Female |
| Under 5 Years | 0 (0.0%) | 0 (0.0%) |
| 5 to 17 Years | 0 (0.0%) | 17 (1.3%) |
| 18 to 34 Years | 51 (2.6%) | 30 (1.3%) |
| 35 to 64 Years | 25 (1.0%) | 36 (1.4%) |
| 65 to 74 Years | 12 (5.5%) | 20 (4.0%) |
| 75 Years and over | 0 (0.0%) | 5 (1.1%) |
Disability Class: Cognitive Difficulty
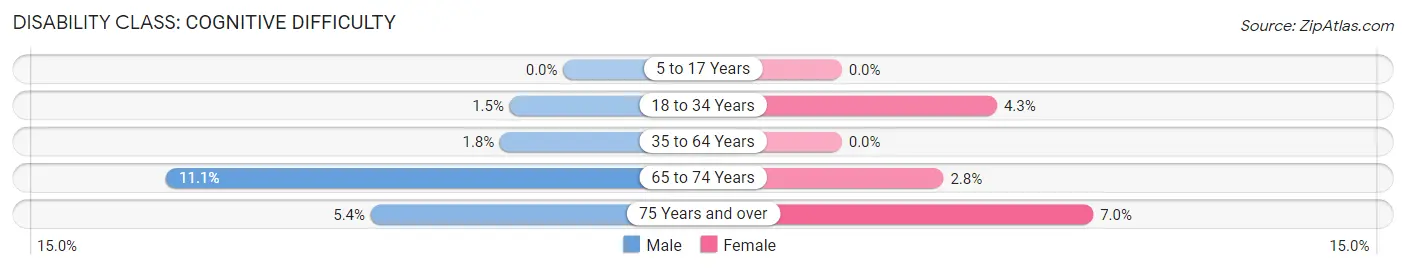
| Age Bracket | Male | Female |
| 5 to 17 Years | 0 (0.0%) | 0 (0.0%) |
| 18 to 34 Years | 29 (1.5%) | 101 (4.3%) |
| 35 to 64 Years | 45 (1.8%) | 0 (0.0%) |
| 65 to 74 Years | 24 (11.1%) | 14 (2.8%) |
| 75 Years and over | 9 (5.4%) | 31 (7.0%) |
Disability Class: Ambulatory Difficulty
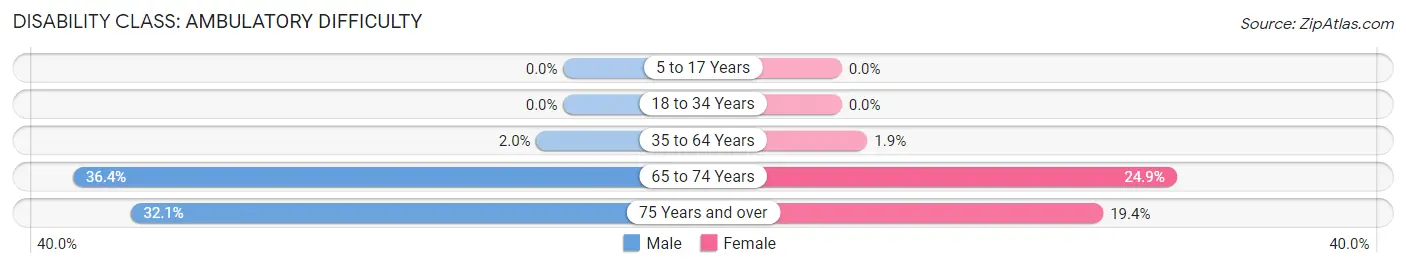
| Age Bracket | Male | Female |
| 5 to 17 Years | 0 (0.0%) | 0 (0.0%) |
| 18 to 34 Years | 0 (0.0%) | 0 (0.0%) |
| 35 to 64 Years | 51 (2.0%) | 50 (1.9%) |
| 65 to 74 Years | 79 (36.4%) | 123 (24.8%) |
| 75 Years and over | 54 (32.1%) | 86 (19.4%) |
Disability Class: Self-Care Difficulty
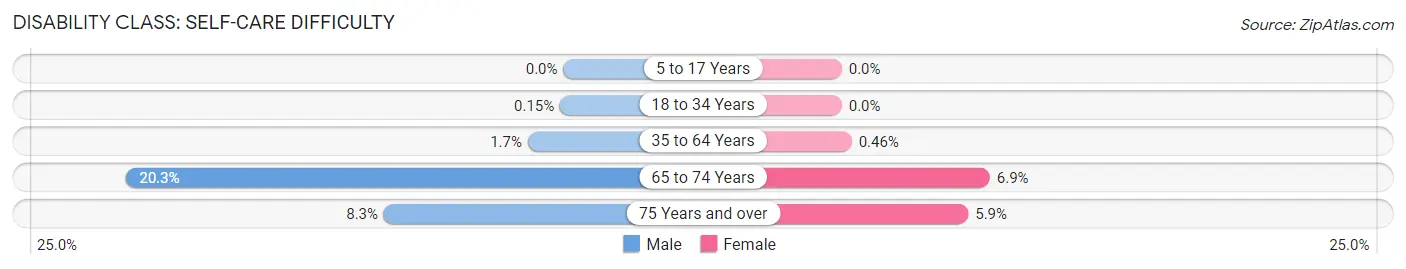
| Age Bracket | Male | Female |
| 5 to 17 Years | 0 (0.0%) | 0 (0.0%) |
| 18 to 34 Years | 3 (0.2%) | 0 (0.0%) |
| 35 to 64 Years | 42 (1.7%) | 12 (0.5%) |
| 65 to 74 Years | 44 (20.3%) | 34 (6.9%) |
| 75 Years and over | 14 (8.3%) | 26 (5.9%) |
Technology Access in New Cassel
Computing Device Access in New Cassel
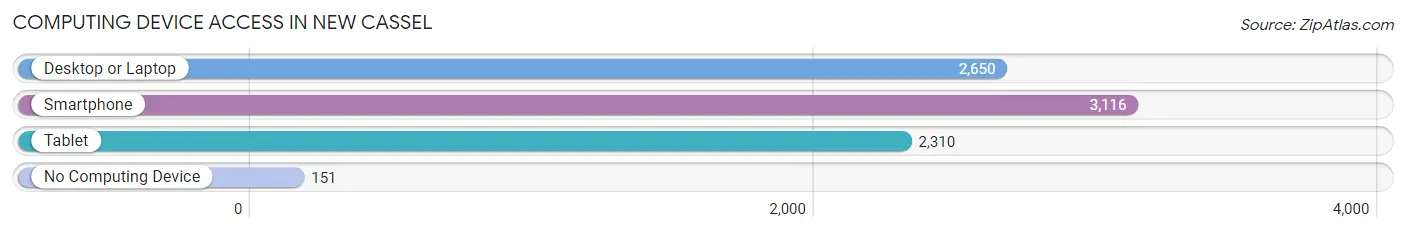
| Device Type | # Households | % Households |
| Desktop or Laptop | 2,650 | 79.3% |
| Smartphone | 3,116 | 93.3% |
| Tablet | 2,310 | 69.1% |
| No Computing Device | 151 | 4.5% |
| Total | 3,341 | 100.0% |
Internet Access in New Cassel
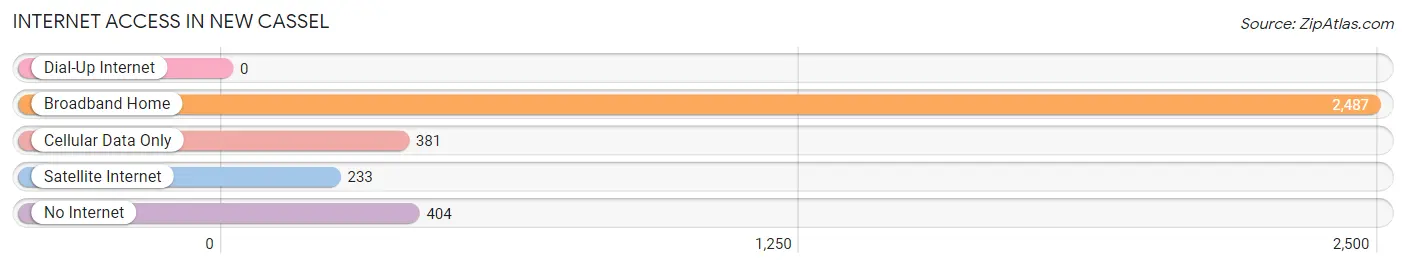
| Internet Type | # Households | % Households |
| Dial-Up Internet | 0 | 0.0% |
| Broadband Home | 2,487 | 74.4% |
| Cellular Data Only | 381 | 11.4% |
| Satellite Internet | 233 | 7.0% |
| No Internet | 404 | 12.1% |
| Total | 3,341 | 100.0% |
New Cassel Summary
Cassel, New York is a hamlet located in the Town of North Hempstead in Nassau County, New York. It is located on the north shore of Long Island, approximately 25 miles east of Manhattan. The hamlet is bordered by the hamlets of Westbury, Carle Place, and New Hyde Park. Cassel is home to a diverse population of approximately 8,000 people.
History
The area that is now Cassel was originally inhabited by the Matinecock Native American tribe. The first European settlers arrived in the area in the late 1600s. The hamlet was originally known as “Fosters Meadow” and was part of the Town of Hempstead. In 1873, the hamlet was renamed “Cassel” after a local landowner, John Cassel.
In the late 1800s, Cassel was a rural farming community. The hamlet was home to several farms, including the Cassel Farm, which was owned by the Cassel family. The Cassel family also owned a general store, which was located on the corner of Old Country Road and Jericho Turnpike.
In the early 1900s, Cassel began to experience rapid growth. The hamlet was home to several factories, including a paper mill, a brickyard, and a canning factory. The hamlet also had a post office, a bank, and several churches.
Geography
Cassel is located on the north shore of Long Island, approximately 25 miles east of Manhattan. The hamlet is bordered by the hamlets of Westbury, Carle Place, and New Hyde Park. Cassel is located in the Town of North Hempstead in Nassau County, New York.
The hamlet is situated on a flat plain, with an elevation of approximately 30 feet above sea level. The hamlet is located in the Peconic Bay watershed, and is home to several small streams and ponds.
Economy
Cassel is primarily a residential community, with a small commercial district located along Old Country Road. The hamlet is home to several small businesses, including restaurants, retail stores, and professional services.
The hamlet is also home to several industrial businesses, including a paper mill, a brickyard, and a canning factory. The hamlet is also home to a post office, a bank, and several churches.
Demographics
As of the 2010 census, Cassel had a population of 8,000 people. The population is diverse, with a mix of African-American, Hispanic, and Asian residents. The median household income is approximately $60,000, and the median home value is approximately $400,000.
The hamlet is served by the North Hempstead Union Free School District. The hamlet is also home to several churches, including the Cassel United Methodist Church and the Cassel Presbyterian Church.
Conclusion
Cassel, New York is a hamlet located in the Town of North Hempstead in Nassau County, New York. The hamlet is situated on a flat plain, with an elevation of approximately 30 feet above sea level. The hamlet is primarily a residential community, with a small commercial district located along Old Country Road. The hamlet is home to a diverse population of approximately 8,000 people, with a mix of African-American, Hispanic, and Asian residents. The hamlet is served by the North Hempstead Union Free School District, and is home to several churches, including the Cassel United Methodist Church and the Cassel Presbyterian Church.
Common Questions
What is Per Capita Income in New Cassel?
Per Capita income in New Cassel is $29,868.
What is the Median Family Income in New Cassel?
Median Family Income in New Cassel is $115,776.
What is the Median Household income in New Cassel?
Median Household Income in New Cassel is $112,569.
What is Income or Wage Gap in New Cassel?
Income or Wage Gap in New Cassel is 35.5%.
Women in New Cassel earn 64.5 cents for every dollar earned by a man.
What is Inequality or Gini Index in New Cassel?
Inequality or Gini Index in New Cassel is 0.43.
What is the Total Population of New Cassel?
Total Population of New Cassel is 15,127.
What is the Total Male Population of New Cassel?
Total Male Population of New Cassel is 7,414.
What is the Total Female Population of New Cassel?
Total Female Population of New Cassel is 7,713.
What is the Ratio of Males per 100 Females in New Cassel?
There are 96.12 Males per 100 Females in New Cassel.
What is the Ratio of Females per 100 Males in New Cassel?
There are 104.03 Females per 100 Males in New Cassel.
What is the Median Population Age in New Cassel?
Median Population Age in New Cassel is 29.0 Years.
What is the Average Family Size in New Cassel
Average Family Size in New Cassel is 4.9 People.
What is the Average Household Size in New Cassel
Average Household Size in New Cassel is 4.5 People.
How Large is the Labor Force in New Cassel?
There are 7,944 People in the Labor Forcein in New Cassel.
What is the Percentage of People in the Labor Force in New Cassel?
71.0% of People are in the Labor Force in New Cassel.
What is the Unemployment Rate in New Cassel?
Unemployment Rate in New Cassel is 3.1%.