Fire Island, NY Map & Demographics
Fire Island Map
Fire Island Overview
$50,928
PER CAPITA INCOME
$115,192
AVG FAMILY INCOME
$108,750
AVG HOUSEHOLD INCOME
43.7%
WAGE / INCOME GAP [ % ]
56.3¢/ $1
WAGE / INCOME GAP [ $ ]
0.44
INEQUALITY / GINI INDEX
298
TOTAL POPULATION
149
MALE POPULATION
149
FEMALE POPULATION
100.00
MALES / 100 FEMALES
100.00
FEMALES / 100 MALES
48.1
MEDIAN AGE
3.5
AVG FAMILY SIZE
3.2
AVG HOUSEHOLD SIZE
175
LABOR FORCE [ PEOPLE ]
71.1%
PERCENT IN LABOR FORCE
Income in Fire Island
Income Overview in Fire Island
Per Capita Income in Fire Island is $50,928, while median incomes of families and households are $115,192 and $108,750 respectively.
| Characteristic | Number | Measure |
| Per Capita Income | 298 | $50,928 |
| Median Family Income | 70 | $115,192 |
| Mean Family Income | 70 | $155,414 |
| Median Household Income | 92 | $108,750 |
| Mean Household Income | 92 | $141,460 |
| Income Deficit | 70 | $0 |
| Wage / Income Gap (%) | 298 | 43.66% |
| Wage / Income Gap ($) | 298 | 56.34¢ per $1 |
| Gini / Inequality Index | 298 | 0.44 |
Earnings by Sex in Fire Island
Average Earnings in Fire Island are $45,188, $78,026 for men and $43,958 for women, a difference of 43.7%.
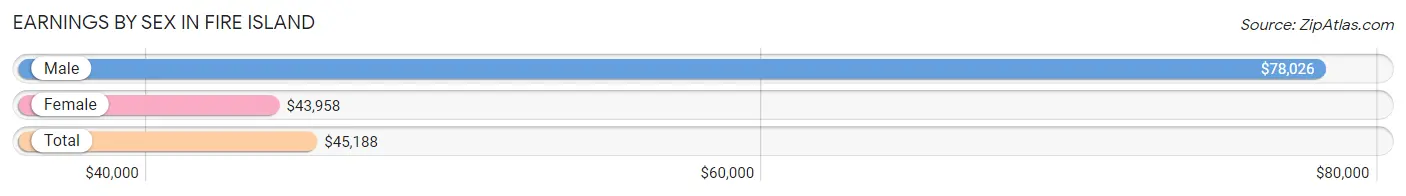
| Sex | Number | Average Earnings |
| Male | 88 (48.6%) | $78,026 |
| Female | 93 (51.4%) | $43,958 |
| Total | 181 (100.0%) | $45,188 |
Earnings by Sex by Income Bracket in Fire Island
The most common earnings brackets in Fire Island are $100,000+ for men (27 | 30.7%) and $45,000 to $49,999 for women (20 | 21.5%).
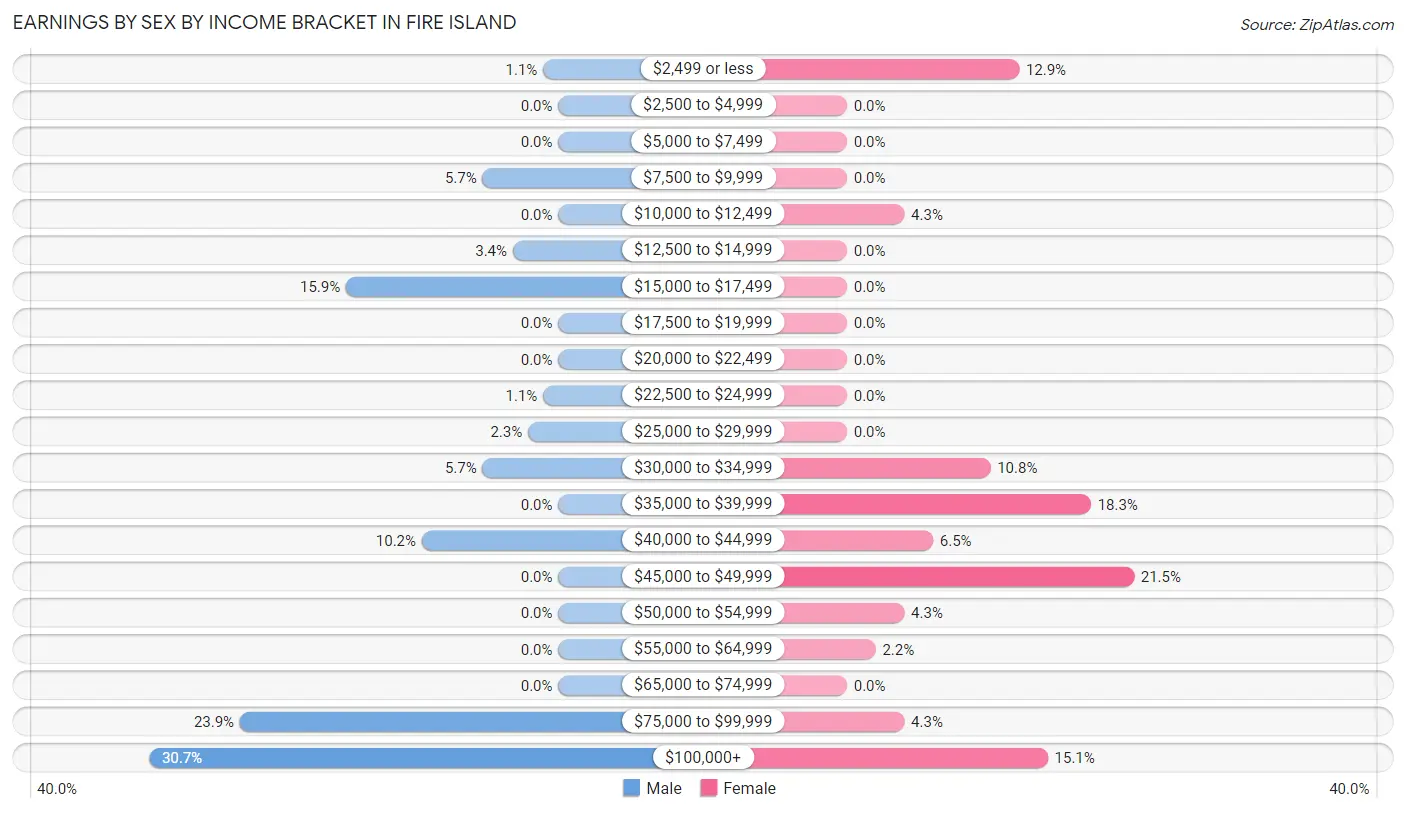
| Income | Male | Female |
| $2,499 or less | 1 (1.1%) | 12 (12.9%) |
| $2,500 to $4,999 | 0 (0.0%) | 0 (0.0%) |
| $5,000 to $7,499 | 0 (0.0%) | 0 (0.0%) |
| $7,500 to $9,999 | 5 (5.7%) | 0 (0.0%) |
| $10,000 to $12,499 | 0 (0.0%) | 4 (4.3%) |
| $12,500 to $14,999 | 3 (3.4%) | 0 (0.0%) |
| $15,000 to $17,499 | 14 (15.9%) | 0 (0.0%) |
| $17,500 to $19,999 | 0 (0.0%) | 0 (0.0%) |
| $20,000 to $22,499 | 0 (0.0%) | 0 (0.0%) |
| $22,500 to $24,999 | 1 (1.1%) | 0 (0.0%) |
| $25,000 to $29,999 | 2 (2.3%) | 0 (0.0%) |
| $30,000 to $34,999 | 5 (5.7%) | 10 (10.7%) |
| $35,000 to $39,999 | 0 (0.0%) | 17 (18.3%) |
| $40,000 to $44,999 | 9 (10.2%) | 6 (6.5%) |
| $45,000 to $49,999 | 0 (0.0%) | 20 (21.5%) |
| $50,000 to $54,999 | 0 (0.0%) | 4 (4.3%) |
| $55,000 to $64,999 | 0 (0.0%) | 2 (2.1%) |
| $65,000 to $74,999 | 0 (0.0%) | 0 (0.0%) |
| $75,000 to $99,999 | 21 (23.9%) | 4 (4.3%) |
| $100,000+ | 27 (30.7%) | 14 (15.0%) |
| Total | 88 (100.0%) | 93 (100.0%) |
Earnings by Sex by Educational Attainment in Fire Island
Average earnings in Fire Island are $78,553 for men and $43,958 for women, a difference of 44.0%. Men with an educational attainment of college or associate's degree enjoy the highest average annual earnings of $78,882, while those with less than high school education earn the least with $16,346. Women with an educational attainment of graduate degree earn the most with the average annual earnings of $46,875, while those with bachelor's degree education have the smallest earnings of $2,499.
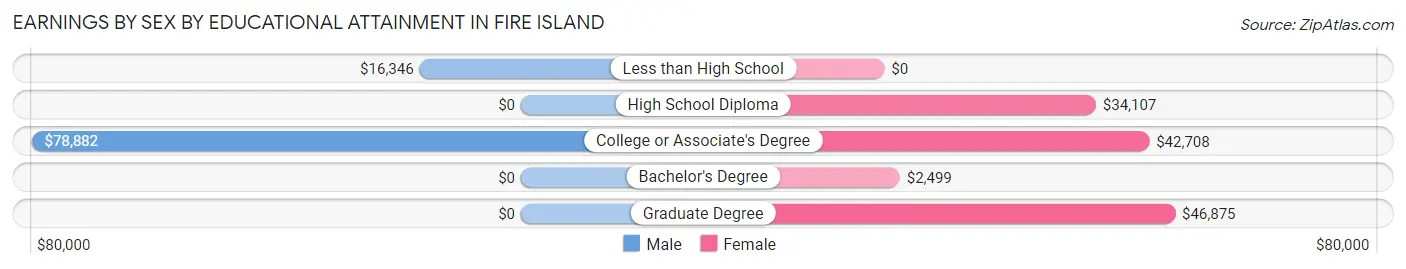
| Educational Attainment | Male Income | Female Income |
| Less than High School | $16,346 | $0 |
| High School Diploma | - | - |
| College or Associate's Degree | $78,882 | $42,708 |
| Bachelor's Degree | - | - |
| Graduate Degree | - | - |
| Total | $78,553 | $43,958 |
Family Income in Fire Island
Family Income Brackets in Fire Island
According to the Fire Island family income data, there are 23 families falling into the $100,000 to $149,999 income range, which is the most common income bracket and makes up 32.9% of all families.
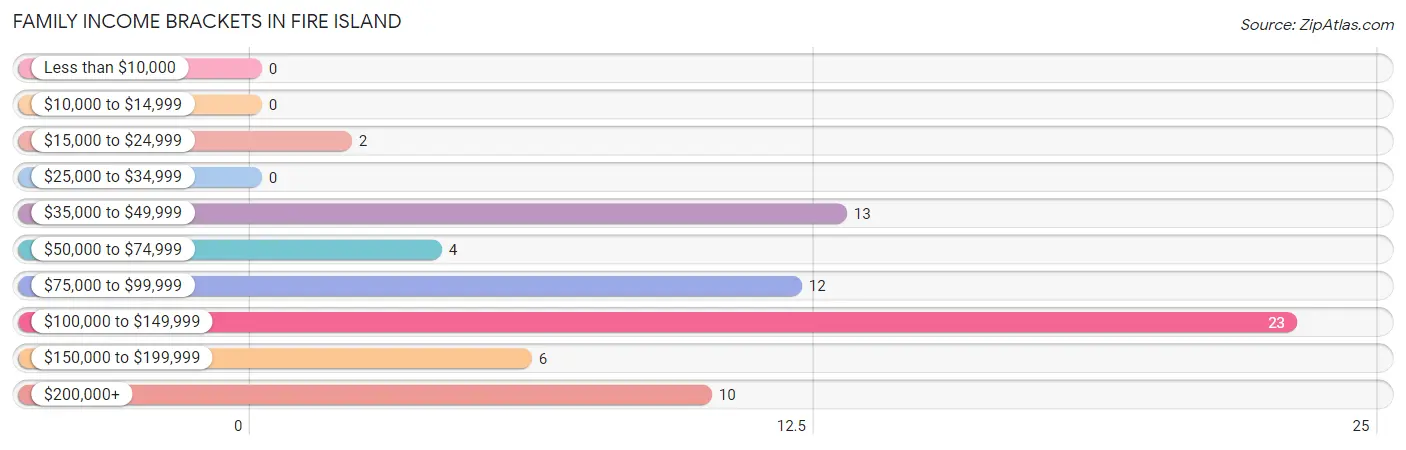
| Income Bracket | # Families | % Families |
| Less than $10,000 | 0 | 0.0% |
| $10,000 to $14,999 | 0 | 0.0% |
| $15,000 to $24,999 | 2 | 2.9% |
| $25,000 to $34,999 | 0 | 0.0% |
| $35,000 to $49,999 | 13 | 18.6% |
| $50,000 to $74,999 | 4 | 5.7% |
| $75,000 to $99,999 | 12 | 17.1% |
| $100,000 to $149,999 | 23 | 32.9% |
| $150,000 to $199,999 | 6 | 8.6% |
| $200,000+ | 10 | 14.3% |
Family Income by Famaliy Size in Fire Island
2-person families (35 | 50.0%) account for the highest median family income in Fire Island with $115,673 per family, while 2-person families (35 | 50.0%) have the highest median income of $57,836 per family member.
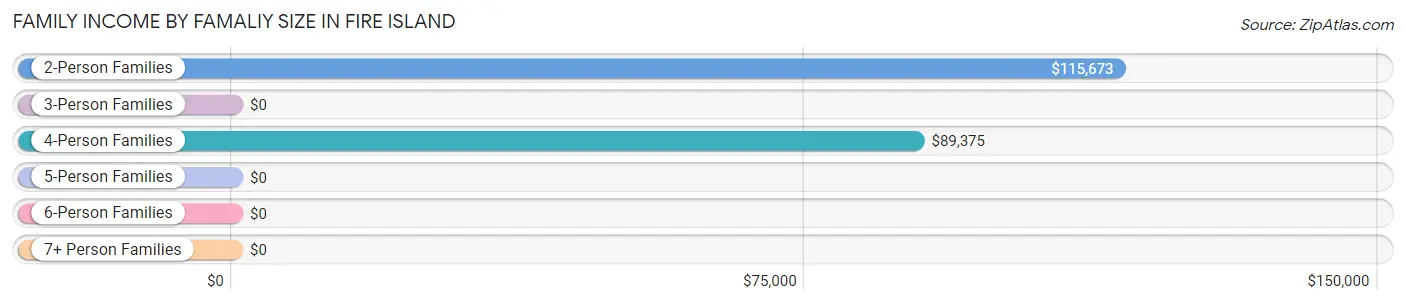
| Income Bracket | # Families | Median Income |
| 2-Person Families | 35 (50.0%) | $115,673 |
| 3-Person Families | 21 (30.0%) | $0 |
| 4-Person Families | 9 (12.9%) | $89,375 |
| 5-Person Families | 2 (2.9%) | $0 |
| 6-Person Families | 3 (4.3%) | $0 |
| 7+ Person Families | 0 (0.0%) | $0 |
| Total | 70 (100.0%) | $115,192 |
Family Income by Number of Earners in Fire Island
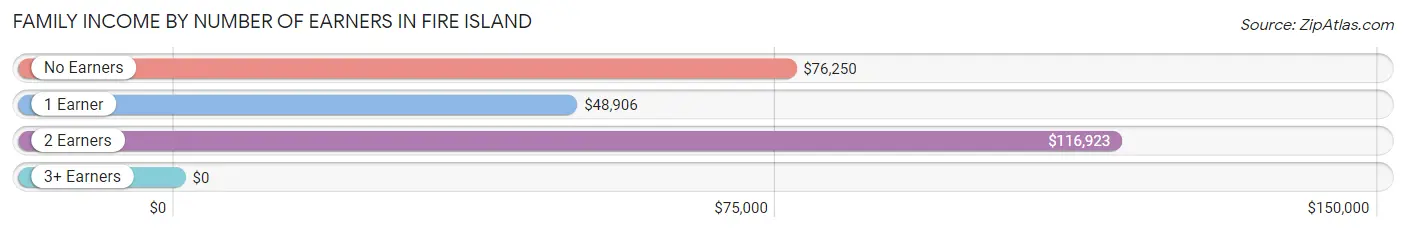
| Number of Earners | # Families | Median Income |
| No Earners | 9 (12.9%) | $76,250 |
| 1 Earner | 15 (21.4%) | $48,906 |
| 2 Earners | 44 (62.9%) | $116,923 |
| 3+ Earners | 2 (2.9%) | $0 |
| Total | 70 (100.0%) | $115,192 |
Household Income in Fire Island
Household Income Brackets in Fire Island
With 27 households falling in the category, the $100,000 to $149,999 income range is the most frequent in Fire Island, accounting for 29.3% of all households.
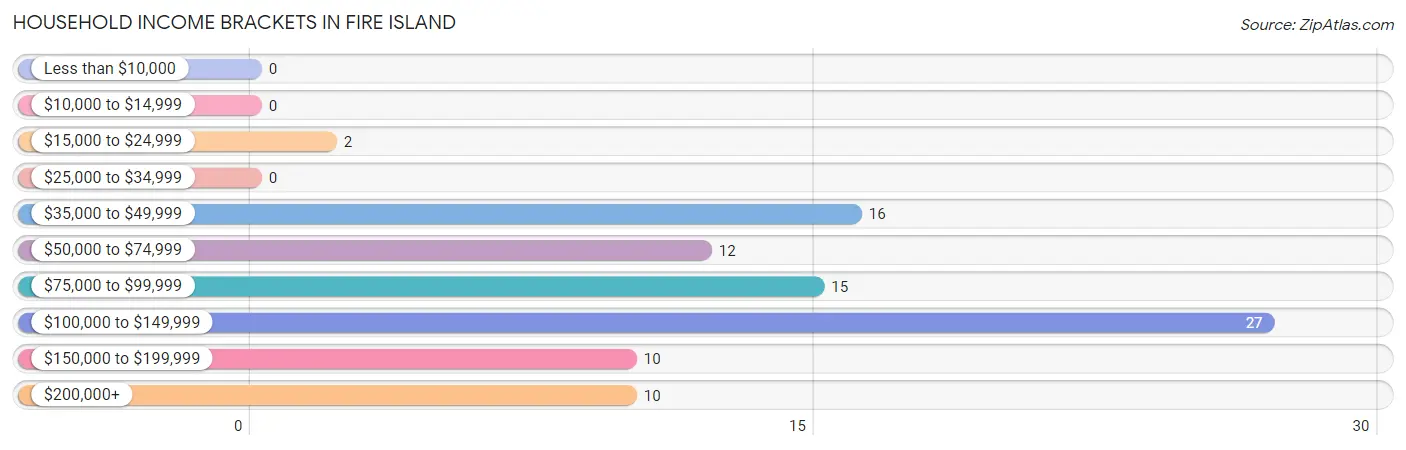
| Income Bracket | # Households | % Households |
| Less than $10,000 | 0 | 0.0% |
| $10,000 to $14,999 | 0 | 0.0% |
| $15,000 to $24,999 | 2 | 2.2% |
| $25,000 to $34,999 | 0 | 0.0% |
| $35,000 to $49,999 | 16 | 17.4% |
| $50,000 to $74,999 | 12 | 13.0% |
| $75,000 to $99,999 | 15 | 16.3% |
| $100,000 to $149,999 | 27 | 29.3% |
| $150,000 to $199,999 | 10 | 10.9% |
| $200,000+ | 10 | 10.9% |
Household Income by Householder Age in Fire Island
The median household income in Fire Island is $108,750, with the highest median household income of $116,827 found in the 45 to 64 years age bracket for the primary householder. A total of 43 households (46.7%) fall into this category.
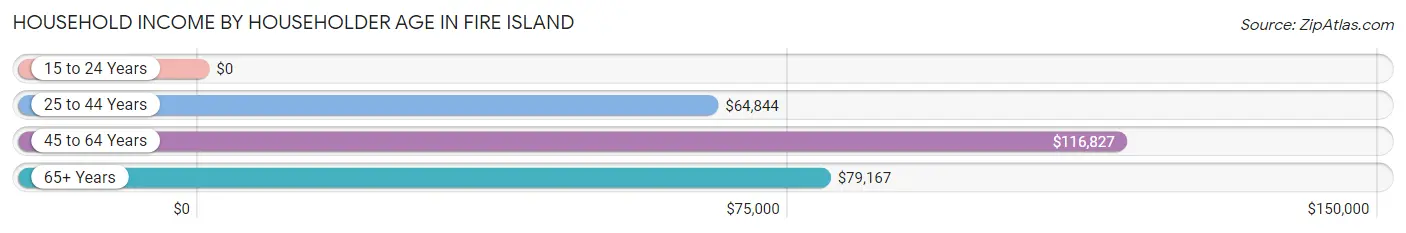
| Income Bracket | # Households | Median Income |
| 15 to 24 Years | 0 (0.0%) | $0 |
| 25 to 44 Years | 23 (25.0%) | $64,844 |
| 45 to 64 Years | 43 (46.7%) | $116,827 |
| 65+ Years | 26 (28.3%) | $79,167 |
| Total | 92 (100.0%) | $108,750 |
Poverty in Fire Island
Income Below Poverty by Sex and Age in Fire Island
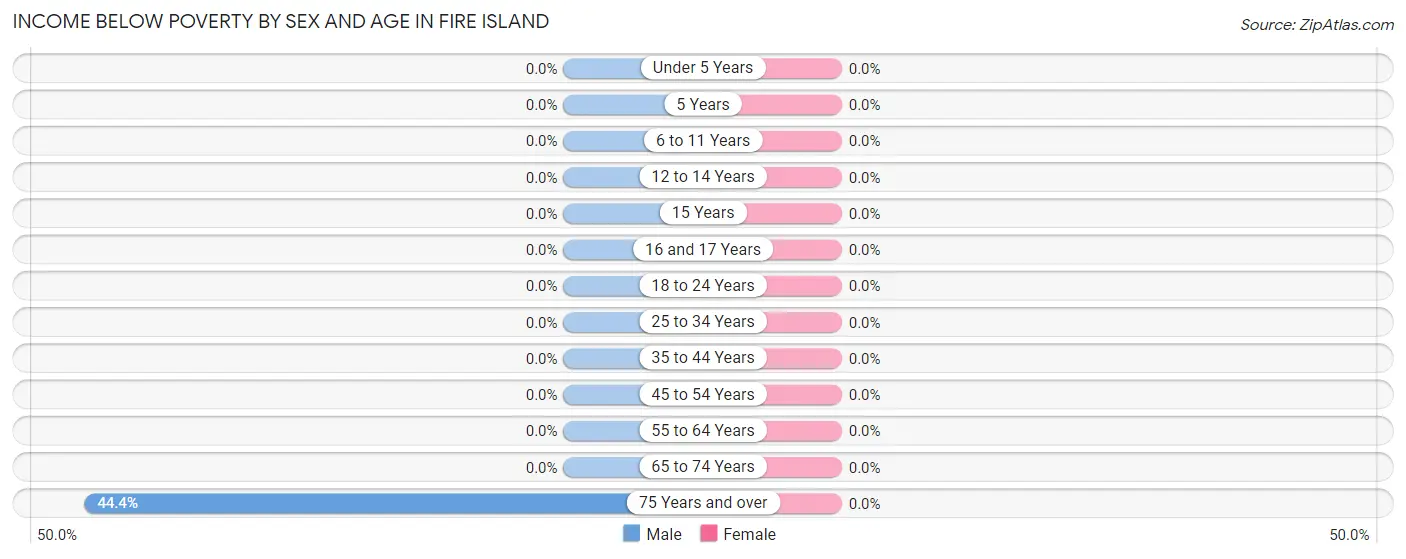
| Age Bracket | Male | Female |
| Under 5 Years | 0 (0.0%) | 0 (0.0%) |
| 5 Years | 0 (0.0%) | 0 (0.0%) |
| 6 to 11 Years | 0 (0.0%) | 0 (0.0%) |
| 12 to 14 Years | 0 (0.0%) | 0 (0.0%) |
| 15 Years | 0 (0.0%) | 0 (0.0%) |
| 16 and 17 Years | 0 (0.0%) | 0 (0.0%) |
| 18 to 24 Years | 0 (0.0%) | 0 (0.0%) |
| 25 to 34 Years | 0 (0.0%) | 0 (0.0%) |
| 35 to 44 Years | 0 (0.0%) | 0 (0.0%) |
| 45 to 54 Years | 0 (0.0%) | 0 (0.0%) |
| 55 to 64 Years | 0 (0.0%) | 0 (0.0%) |
| 65 to 74 Years | 0 (0.0%) | 0 (0.0%) |
| 75 Years and over | 4 (44.4%) | 0 (0.0%) |
| Total | 4 (2.8%) | 0 (0.0%) |
Income Above Poverty by Sex and Age in Fire Island
According to the poverty statistics in Fire Island, males aged under 5 years and females aged under 5 years are the age groups that are most secure financially, with 100.0% of males and 100.0% of females in these age groups living above the poverty line.
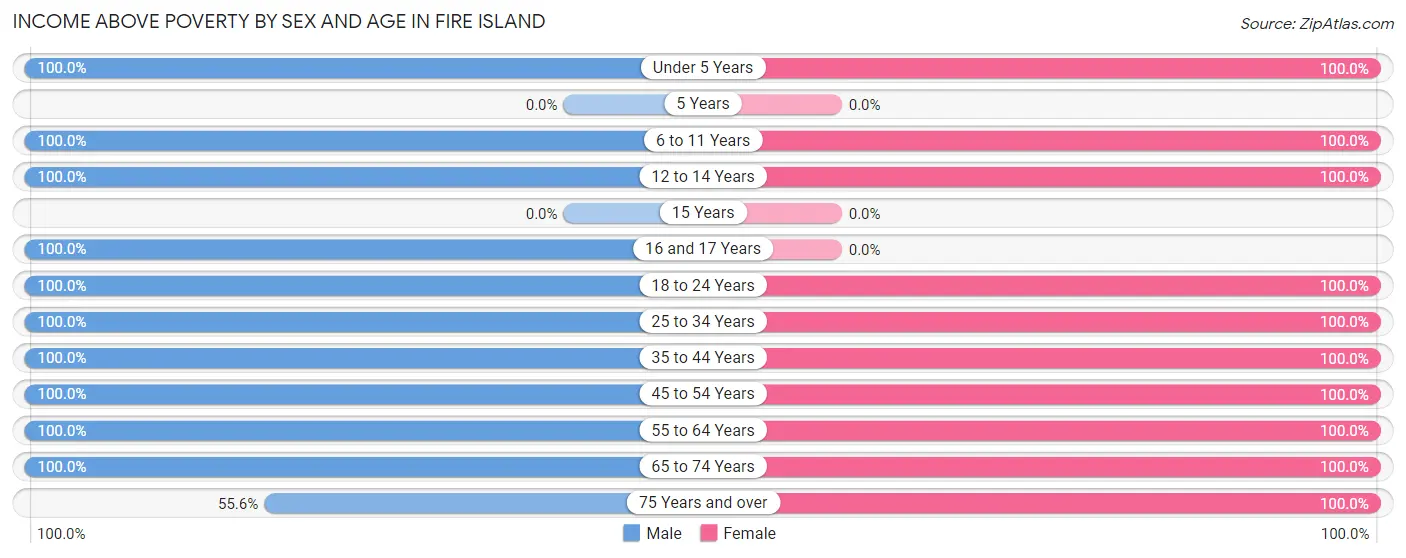
| Age Bracket | Male | Female |
| Under 5 Years | 4 (100.0%) | 4 (100.0%) |
| 5 Years | 0 (0.0%) | 0 (0.0%) |
| 6 to 11 Years | 13 (100.0%) | 3 (100.0%) |
| 12 to 14 Years | 3 (100.0%) | 23 (100.0%) |
| 15 Years | 0 (0.0%) | 0 (0.0%) |
| 16 and 17 Years | 3 (100.0%) | 0 (0.0%) |
| 18 to 24 Years | 12 (100.0%) | 8 (100.0%) |
| 25 to 34 Years | 2 (100.0%) | 9 (100.0%) |
| 35 to 44 Years | 14 (100.0%) | 26 (100.0%) |
| 45 to 54 Years | 32 (100.0%) | 33 (100.0%) |
| 55 to 64 Years | 31 (100.0%) | 27 (100.0%) |
| 65 to 74 Years | 18 (100.0%) | 7 (100.0%) |
| 75 Years and over | 5 (55.6%) | 9 (100.0%) |
| Total | 137 (97.2%) | 149 (100.0%) |
Income Below Poverty Among Married-Couple Families in Fire Island
The poverty statistics for married-couple families in Fire Island show that 3.6% or 2 of the total 56 families live below the poverty line. Families with no children have the highest poverty rate of 5.4%, comprising of 2 families. On the other hand, families with 1 or 2 children have the lowest poverty rate of 0.0%, which includes 0 families.
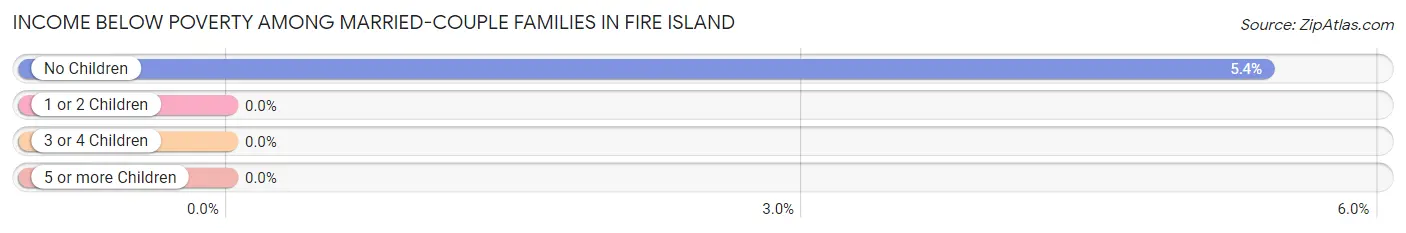
| Children | Above Poverty | Below Poverty |
| No Children | 35 (94.6%) | 2 (5.4%) |
| 1 or 2 Children | 14 (100.0%) | 0 (0.0%) |
| 3 or 4 Children | 5 (100.0%) | 0 (0.0%) |
| 5 or more Children | 0 (0.0%) | 0 (0.0%) |
| Total | 54 (96.4%) | 2 (3.6%) |
Income Below Poverty Among Single-Parent Households in Fire Island
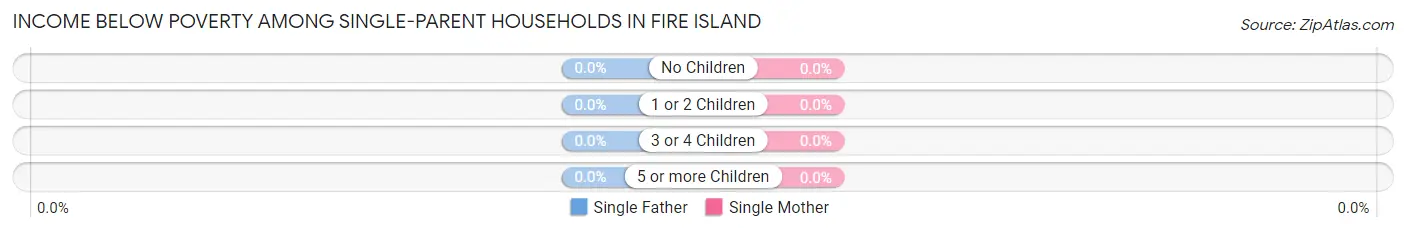
| Children | Single Father | Single Mother |
| No Children | 0 (0.0%) | 0 (0.0%) |
| 1 or 2 Children | 0 (0.0%) | 0 (0.0%) |
| 3 or 4 Children | 0 (0.0%) | 0 (0.0%) |
| 5 or more Children | 0 (0.0%) | 0 (0.0%) |
| Total | 0 (0.0%) | 0 (0.0%) |
Income Below Poverty Among Married-Couple vs Single-Parent Households in Fire Island
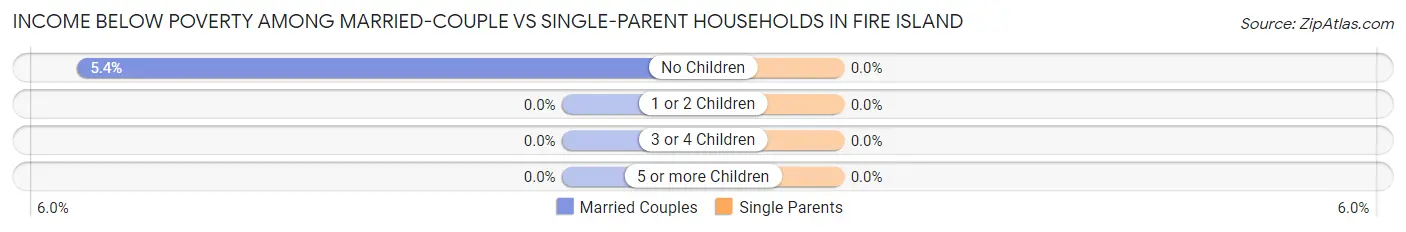
| Children | Married-Couple Families | Single-Parent Households |
| No Children | 2 (5.4%) | 0 (0.0%) |
| 1 or 2 Children | 0 (0.0%) | 0 (0.0%) |
| 3 or 4 Children | 0 (0.0%) | 0 (0.0%) |
| 5 or more Children | 0 (0.0%) | 0 (0.0%) |
| Total | 2 (3.6%) | 0 (0.0%) |
Race in Fire Island
The most populous races in Fire Island are White / Caucasian (205 | 68.8%), Hispanic or Latino (74 | 24.8%), and Black / African American (62 | 20.8%).
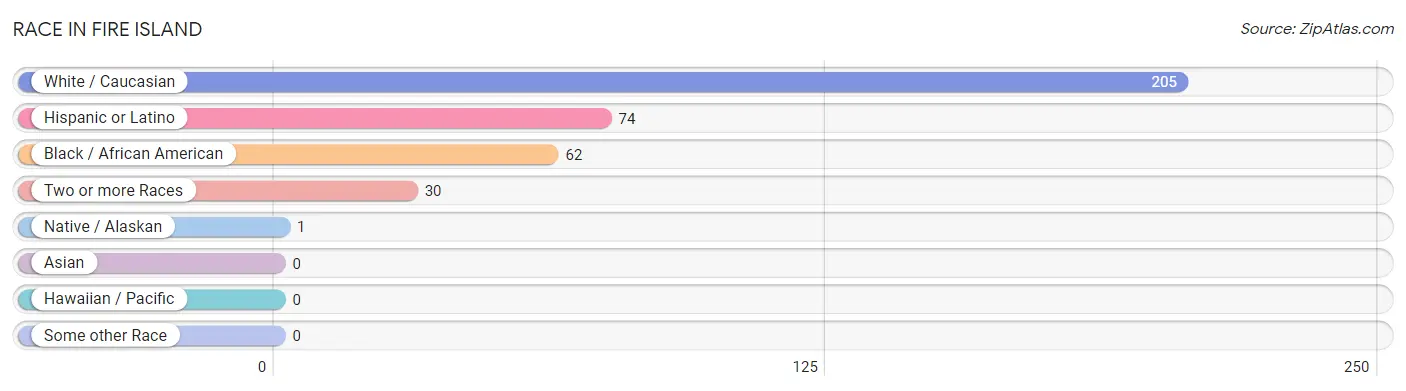
| Race | # Population | % Population |
| Asian | 0 | 0.0% |
| Black / African American | 62 | 20.8% |
| Hawaiian / Pacific | 0 | 0.0% |
| Hispanic or Latino | 74 | 24.8% |
| Native / Alaskan | 1 | 0.3% |
| White / Caucasian | 205 | 68.8% |
| Two or more Races | 30 | 10.1% |
| Some other Race | 0 | 0.0% |
| Total | 298 | 100.0% |
Ancestry in Fire Island
The most populous ancestries reported in Fire Island are Irish (55 | 18.5%), Italian (50 | 16.8%), German (45 | 15.1%), Puerto Rican (24 | 8.1%), and Central American (17 | 5.7%), together accounting for 64.1% of all Fire Island residents.
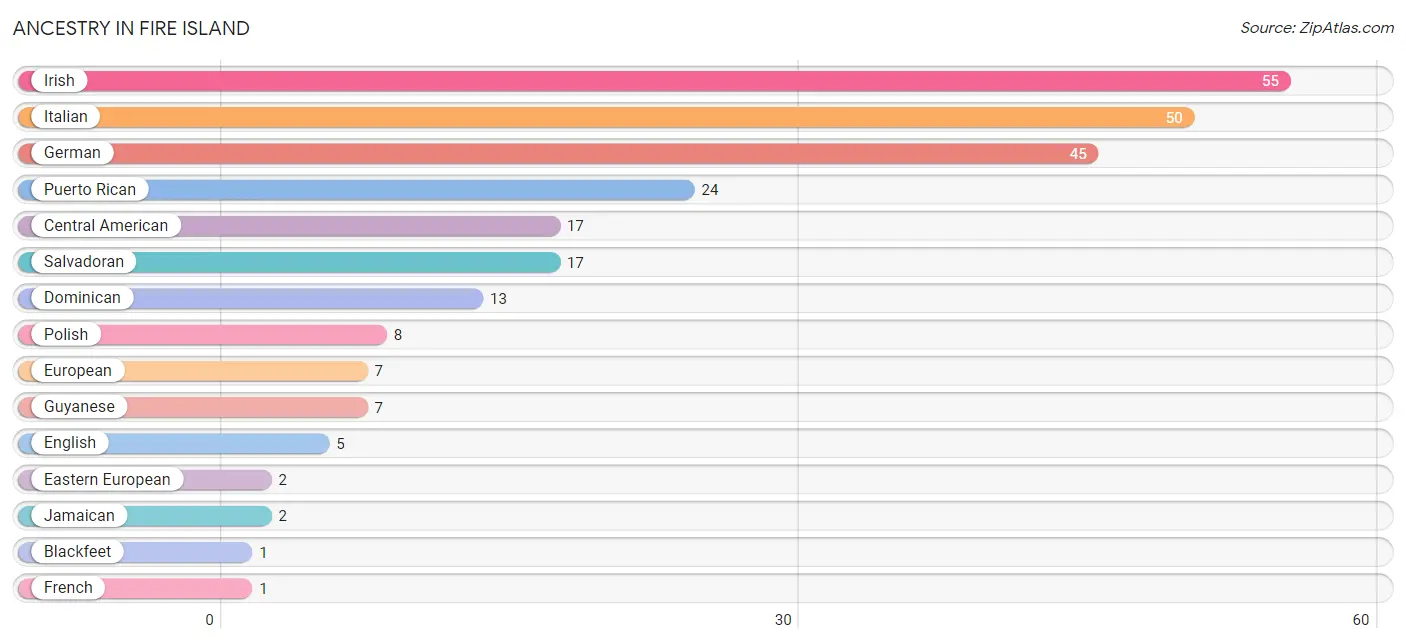
| Ancestry | # Population | % Population |
| Blackfeet | 1 | 0.3% |
| Central American | 17 | 5.7% |
| Dominican | 13 | 4.4% |
| Eastern European | 2 | 0.7% |
| English | 5 | 1.7% |
| European | 7 | 2.4% |
| French | 1 | 0.3% |
| German | 45 | 15.1% |
| Greek | 1 | 0.3% |
| Guyanese | 7 | 2.4% |
| Irish | 55 | 18.5% |
| Italian | 50 | 16.8% |
| Jamaican | 2 | 0.7% |
| Polish | 8 | 2.7% |
| Puerto Rican | 24 | 8.1% |
| Salvadoran | 17 | 5.7% |
| Slovak | 1 | 0.3% | View All 17 Rows |
Immigrants in Fire Island
The most numerous immigrant groups reported in Fire Island came from Latin America (21 | 7.0%), Central America (14 | 4.7%), El Salvador (11 | 3.7%), Guyana (7 | 2.4%), and South America (7 | 2.4%), together accounting for 20.1% of all Fire Island residents.
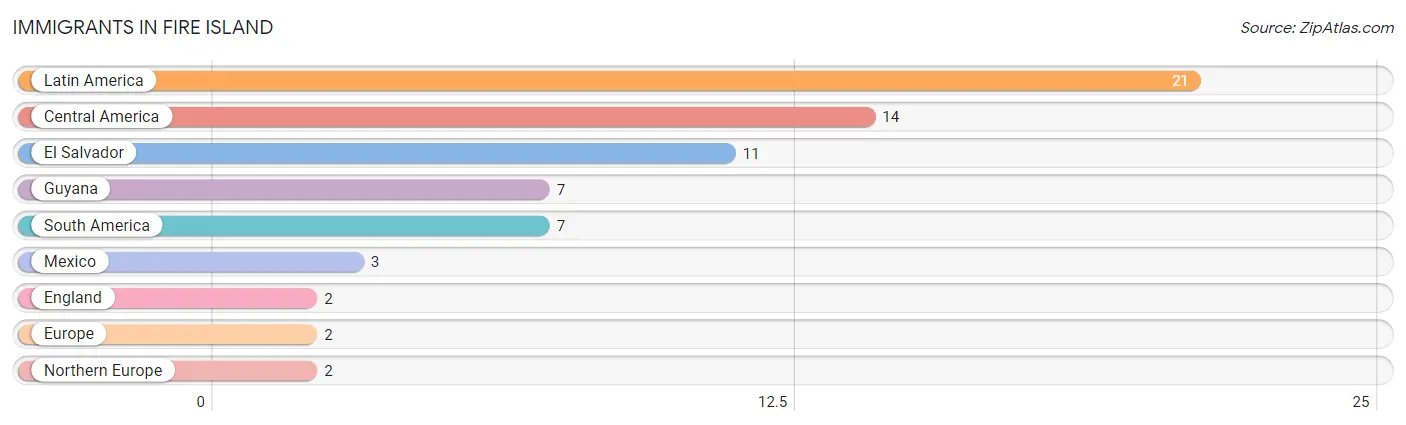
| Immigration Origin | # Population | % Population |
| Central America | 14 | 4.7% |
| El Salvador | 11 | 3.7% |
| England | 2 | 0.7% |
| Europe | 2 | 0.7% |
| Guyana | 7 | 2.4% |
| Latin America | 21 | 7.0% |
| Mexico | 3 | 1.0% |
| Northern Europe | 2 | 0.7% |
| South America | 7 | 2.4% | View All 9 Rows |
Sex and Age in Fire Island
Sex and Age in Fire Island
The most populous age groups in Fire Island are 60 to 64 Years (23 | 15.4%) for men and 45 to 49 Years (30 | 20.1%) for women.
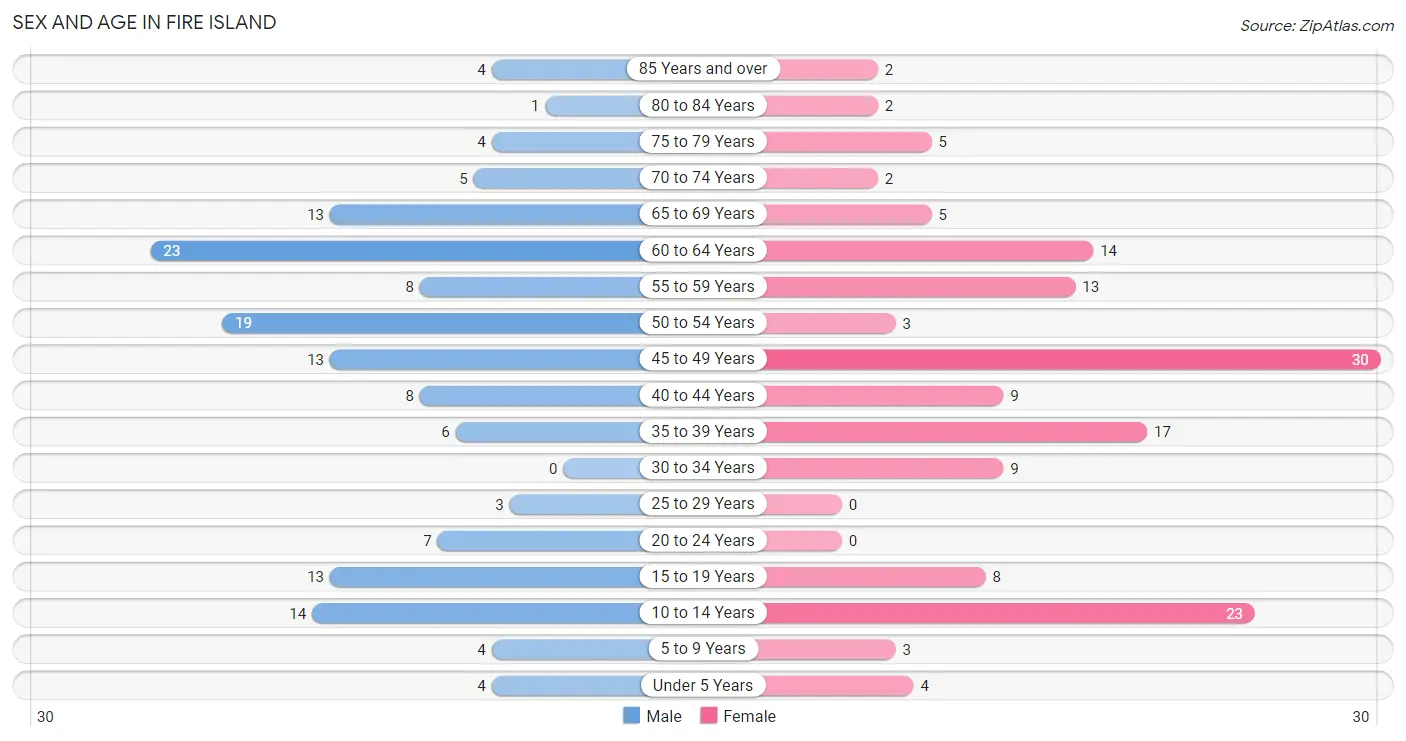
| Age Bracket | Male | Female |
| Under 5 Years | 4 (2.7%) | 4 (2.7%) |
| 5 to 9 Years | 4 (2.7%) | 3 (2.0%) |
| 10 to 14 Years | 14 (9.4%) | 23 (15.4%) |
| 15 to 19 Years | 13 (8.7%) | 8 (5.4%) |
| 20 to 24 Years | 7 (4.7%) | 0 (0.0%) |
| 25 to 29 Years | 3 (2.0%) | 0 (0.0%) |
| 30 to 34 Years | 0 (0.0%) | 9 (6.0%) |
| 35 to 39 Years | 6 (4.0%) | 17 (11.4%) |
| 40 to 44 Years | 8 (5.4%) | 9 (6.0%) |
| 45 to 49 Years | 13 (8.7%) | 30 (20.1%) |
| 50 to 54 Years | 19 (12.8%) | 3 (2.0%) |
| 55 to 59 Years | 8 (5.4%) | 13 (8.7%) |
| 60 to 64 Years | 23 (15.4%) | 14 (9.4%) |
| 65 to 69 Years | 13 (8.7%) | 5 (3.4%) |
| 70 to 74 Years | 5 (3.4%) | 2 (1.3%) |
| 75 to 79 Years | 4 (2.7%) | 5 (3.4%) |
| 80 to 84 Years | 1 (0.7%) | 2 (1.3%) |
| 85 Years and over | 4 (2.7%) | 2 (1.3%) |
| Total | 149 (100.0%) | 149 (100.0%) |
Families and Households in Fire Island
Median Family Size in Fire Island
The median family size in Fire Island is 3.50 persons per family, with single female/mother families (13 | 18.6%) accounting for the largest median family size of 6.23 persons per family. On the other hand, married-couple families (56 | 80.0%) represent the smallest median family size with 2.86 persons per family.
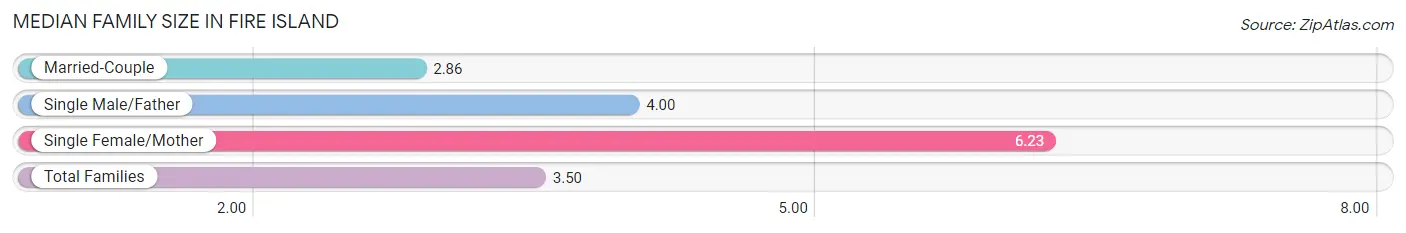
| Family Type | # Families | Family Size |
| Married-Couple | 56 (80.0%) | 2.86 |
| Single Male/Father | 1 (1.4%) | 4.00 |
| Single Female/Mother | 13 (18.6%) | 6.23 |
| Total Families | 70 (100.0%) | 3.50 |
Median Household Size in Fire Island
The median household size in Fire Island is 3.16 persons per household, with single female/mother households (13 | 14.1%) accounting for the largest median household size of 7.38 persons per household. non-family households (22 | 23.9%) represent the smallest median household size with 1.32 persons per household.
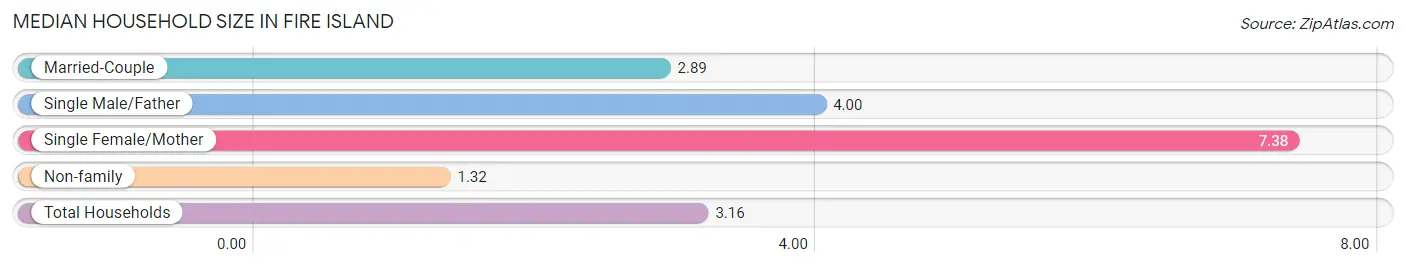
| Household Type | # Households | Household Size |
| Married-Couple | 56 (60.9%) | 2.89 |
| Single Male/Father | 1 (1.1%) | 4.00 |
| Single Female/Mother | 13 (14.1%) | 7.38 |
| Non-family | 22 (23.9%) | 1.32 |
| Total Households | 92 (100.0%) | 3.16 |
Household Size by Marriage Status in Fire Island
Out of a total of 92 households in Fire Island, 70 (76.1%) are family households, while 22 (23.9%) are nonfamily households. The most numerous type of family households are 2-person households, comprising 31, and the most common type of nonfamily households are 1-person households, comprising 18.
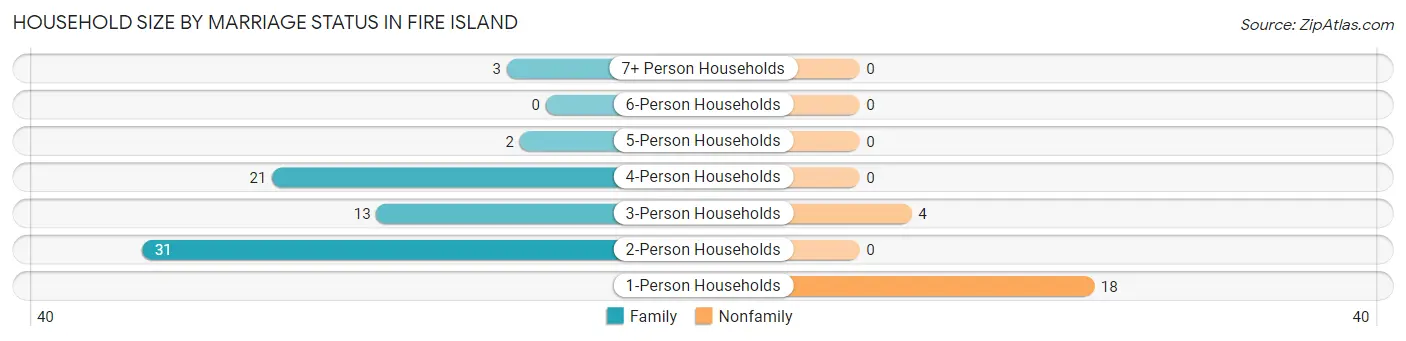
| Household Size | Family Households | Nonfamily Households |
| 1-Person Households | - | 18 (19.6%) |
| 2-Person Households | 31 (33.7%) | 0 (0.0%) |
| 3-Person Households | 13 (14.1%) | 4 (4.3%) |
| 4-Person Households | 21 (22.8%) | 0 (0.0%) |
| 5-Person Households | 2 (2.2%) | 0 (0.0%) |
| 6-Person Households | 0 (0.0%) | 0 (0.0%) |
| 7+ Person Households | 3 (3.3%) | 0 (0.0%) |
| Total | 70 (76.1%) | 22 (23.9%) |
Female Fertility in Fire Island
Fertility by Age in Fire Island
Average fertility rate in Fire Island is 27.0 births per 1,000 women. Women in the age bracket of 20 to 34 years have the highest fertility rate with 222.0 births per 1,000 women. Women in the age bracket of 20 to 34 years acount for 100.0% of all women with births.
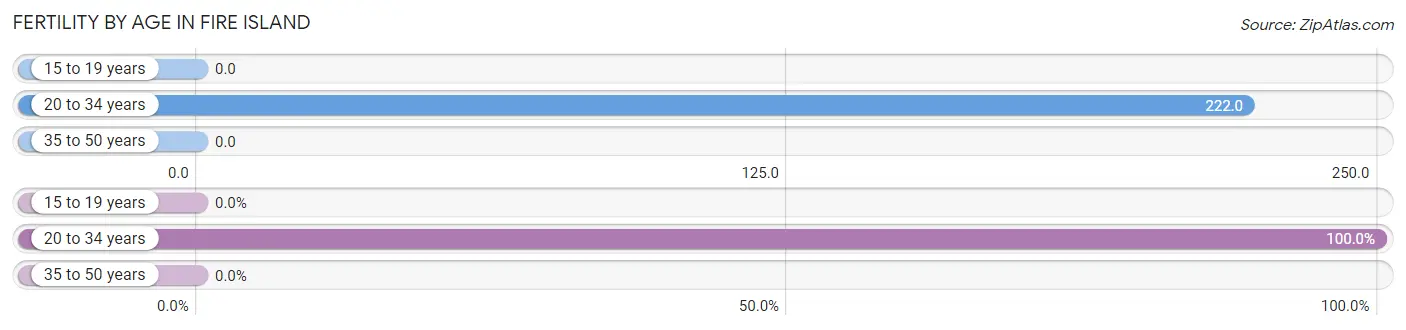
| Age Bracket | Women with Births | Births / 1,000 Women |
| 15 to 19 years | 0 (0.0%) | 0.0 |
| 20 to 34 years | 2 (100.0%) | 222.0 |
| 35 to 50 years | 0 (0.0%) | 0.0 |
| Total | 2 (100.0%) | 27.0 |
Fertility by Age by Marriage Status in Fire Island
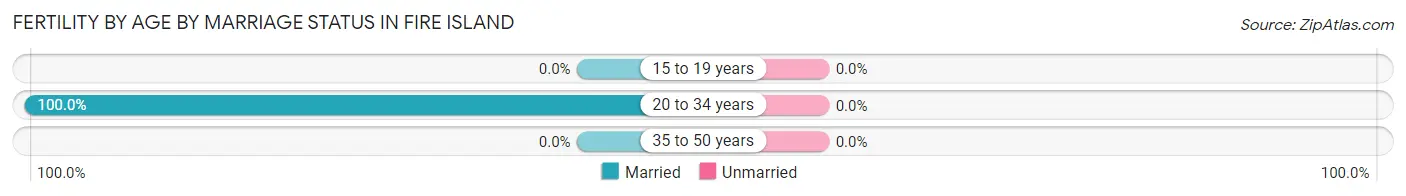
| Age Bracket | Married | Unmarried |
| 15 to 19 years | 0 (0.0%) | 0 (0.0%) |
| 20 to 34 years | 2 (100.0%) | 0 (0.0%) |
| 35 to 50 years | 0 (0.0%) | 0 (0.0%) |
| Total | 2 (100.0%) | 0 (0.0%) |
Fertility by Education in Fire Island
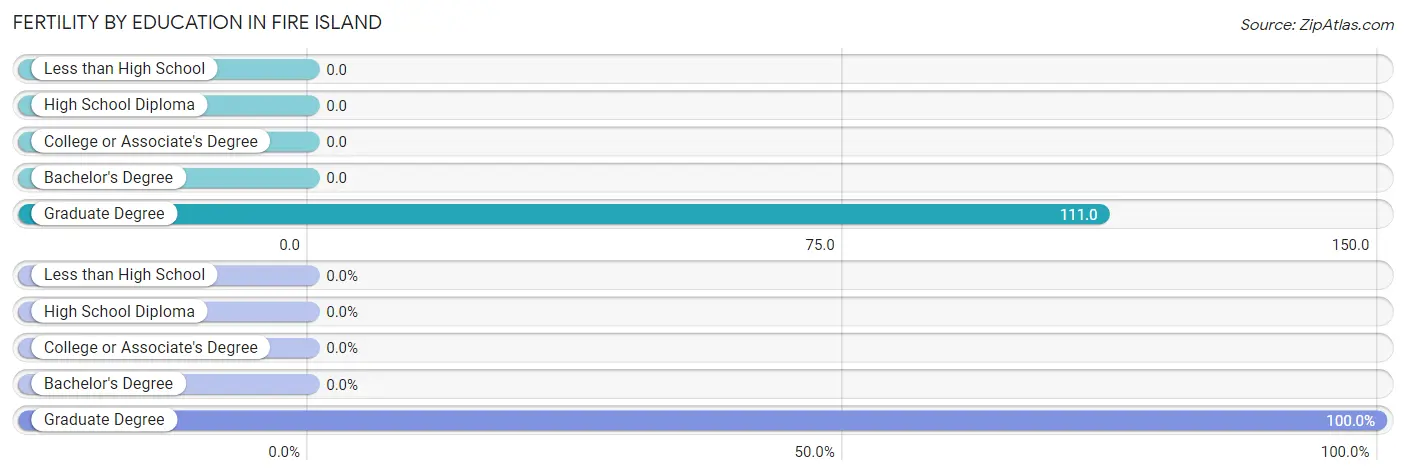
| Educational Attainment | Women with Births | Births / 1,000 Women |
| Less than High School | 0 (0.0%) | 0.0 |
| High School Diploma | 0 (0.0%) | 0.0 |
| College or Associate's Degree | 0 (0.0%) | 0.0 |
| Bachelor's Degree | 0 (0.0%) | 0.0 |
| Graduate Degree | 2 (100.0%) | 111.0 |
| Total | 2 (100.0%) | 27.0 |
Fertility by Education by Marriage Status in Fire Island
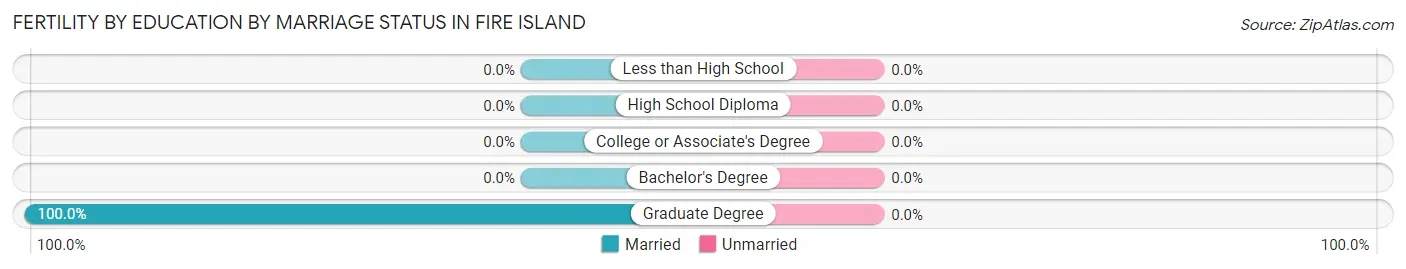
| Educational Attainment | Married | Unmarried |
| Less than High School | 0 (0.0%) | 0 (0.0%) |
| High School Diploma | 0 (0.0%) | 0 (0.0%) |
| College or Associate's Degree | 0 (0.0%) | 0 (0.0%) |
| Bachelor's Degree | 0 (0.0%) | 0 (0.0%) |
| Graduate Degree | 2 (100.0%) | 0 (0.0%) |
| Total | 2 (100.0%) | 0 (0.0%) |
Employment Characteristics in Fire Island
Employment by Class of Employer in Fire Island
Among the 160 employed individuals in Fire Island, private company employees (114 | 71.3%), not-for-profit organizations (16 | 10.0%), and federal government employees (13 | 8.1%) make up the most common classes of employment.
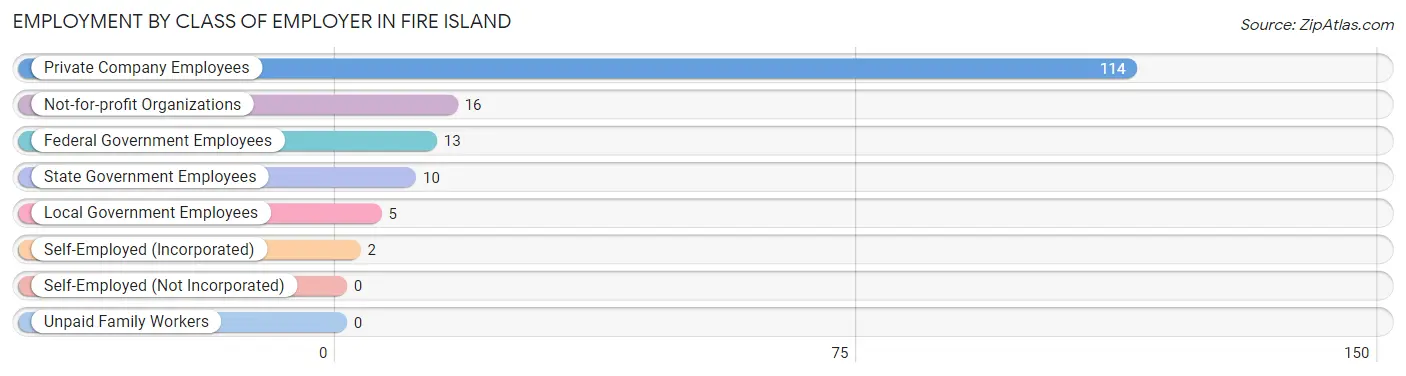
| Employer Class | # Employees | % Employees |
| Private Company Employees | 114 | 71.3% |
| Self-Employed (Incorporated) | 2 | 1.3% |
| Self-Employed (Not Incorporated) | 0 | 0.0% |
| Not-for-profit Organizations | 16 | 10.0% |
| Local Government Employees | 5 | 3.1% |
| State Government Employees | 10 | 6.2% |
| Federal Government Employees | 13 | 8.1% |
| Unpaid Family Workers | 0 | 0.0% |
| Total | 160 | 100.0% |
Employment Status by Age in Fire Island
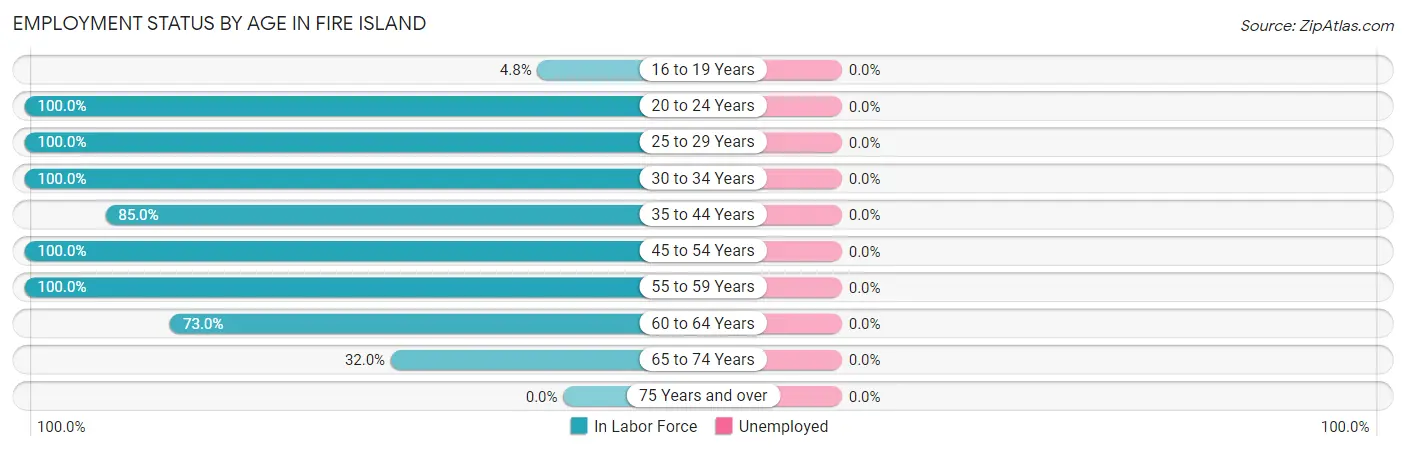
| Age Bracket | In Labor Force | Unemployed |
| 16 to 19 Years | 1 (4.8%) | 0 (0.0%) |
| 20 to 24 Years | 7 (100.0%) | 0 (0.0%) |
| 25 to 29 Years | 3 (100.0%) | 0 (0.0%) |
| 30 to 34 Years | 9 (100.0%) | 0 (0.0%) |
| 35 to 44 Years | 34 (85.0%) | 0 (0.0%) |
| 45 to 54 Years | 65 (100.0%) | 0 (0.0%) |
| 55 to 59 Years | 21 (100.0%) | 0 (0.0%) |
| 60 to 64 Years | 27 (73.0%) | 0 (0.0%) |
| 65 to 74 Years | 8 (32.0%) | 0 (0.0%) |
| 75 Years and over | 0 (0.0%) | 0 (0.0%) |
| Total | 175 (71.1%) | 0 (0.0%) |
Employment Status by Educational Attainment in Fire Island
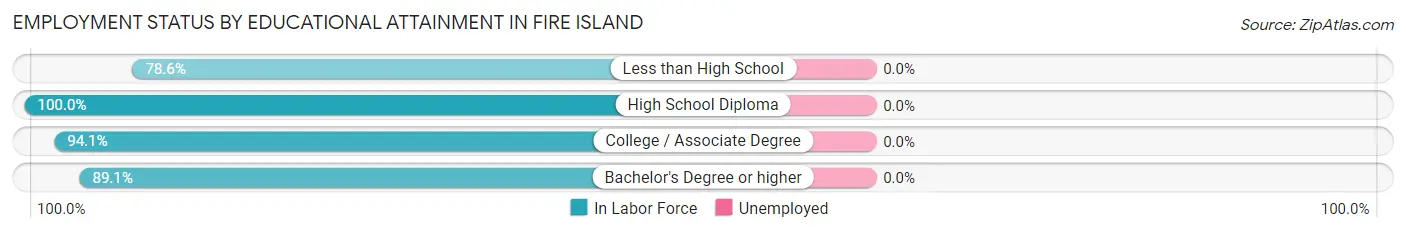
| Educational Attainment | In Labor Force | Unemployed |
| Less than High School | 22 (78.6%) | 0 (0.0%) |
| High School Diploma | 24 (100.0%) | 0 (0.0%) |
| College / Associate Degree | 64 (94.1%) | 0 (0.0%) |
| Bachelor's Degree or higher | 49 (89.1%) | 0 (0.0%) |
| Total | 159 (90.9%) | 0 (0.0%) |
Employment Occupations by Sex in Fire Island
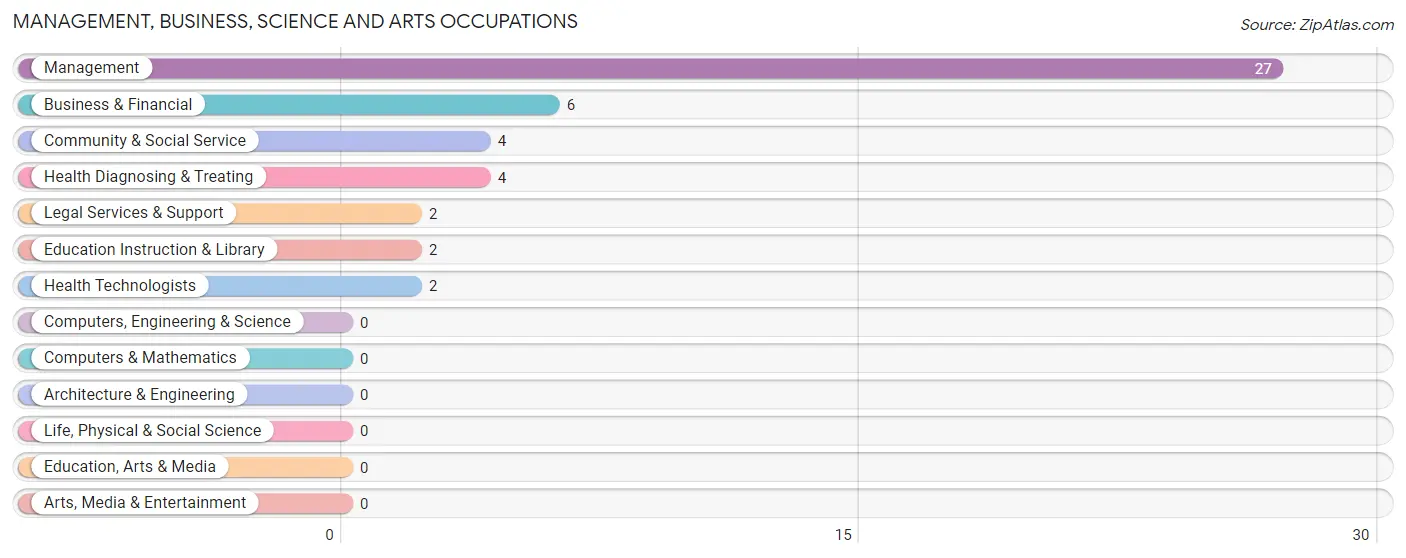
Management, Business, Science and Arts Occupations
The most common Management, Business, Science and Arts occupations in Fire Island are Management (27 | 16.6%), Business & Financial (6 | 3.7%), Community & Social Service (4 | 2.5%), Health Diagnosing & Treating (4 | 2.5%), and Legal Services & Support (2 | 1.2%).
Management, Business, Science and Arts Occupations by Sex
Within the Management, Business, Science and Arts occupations in Fire Island, the most male-oriented occupations are Legal Services & Support (100.0%), Community & Social Service (50.0%), and Management (29.6%), while the most female-oriented occupations are Business & Financial (100.0%), Education Instruction & Library (100.0%), and Health Diagnosing & Treating (100.0%).
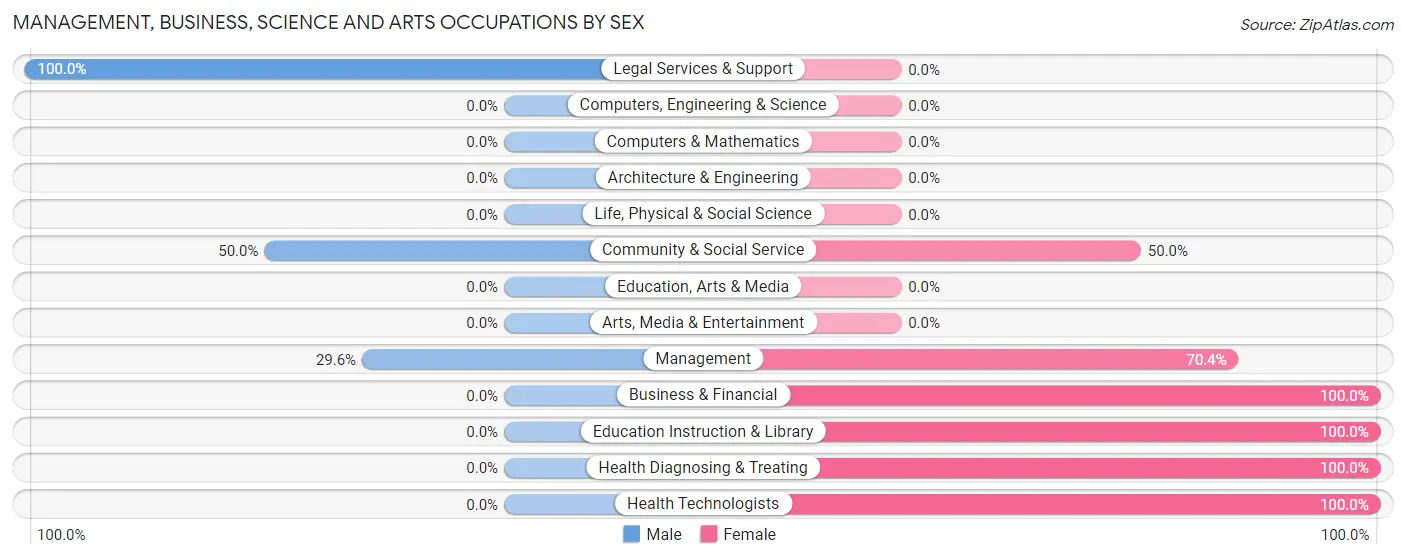
| Occupation | Male | Female |
| Management | 8 (29.6%) | 19 (70.4%) |
| Business & Financial | 0 (0.0%) | 6 (100.0%) |
| Computers, Engineering & Science | 0 (0.0%) | 0 (0.0%) |
| Computers & Mathematics | 0 (0.0%) | 0 (0.0%) |
| Architecture & Engineering | 0 (0.0%) | 0 (0.0%) |
| Life, Physical & Social Science | 0 (0.0%) | 0 (0.0%) |
| Community & Social Service | 2 (50.0%) | 2 (50.0%) |
| Education, Arts & Media | 0 (0.0%) | 0 (0.0%) |
| Legal Services & Support | 2 (100.0%) | 0 (0.0%) |
| Education Instruction & Library | 0 (0.0%) | 2 (100.0%) |
| Arts, Media & Entertainment | 0 (0.0%) | 0 (0.0%) |
| Health Diagnosing & Treating | 0 (0.0%) | 4 (100.0%) |
| Health Technologists | 0 (0.0%) | 2 (100.0%) |
| Total (Category) | 10 (24.4%) | 31 (75.6%) |
| Total (Overall) | 76 (46.6%) | 87 (53.4%) |
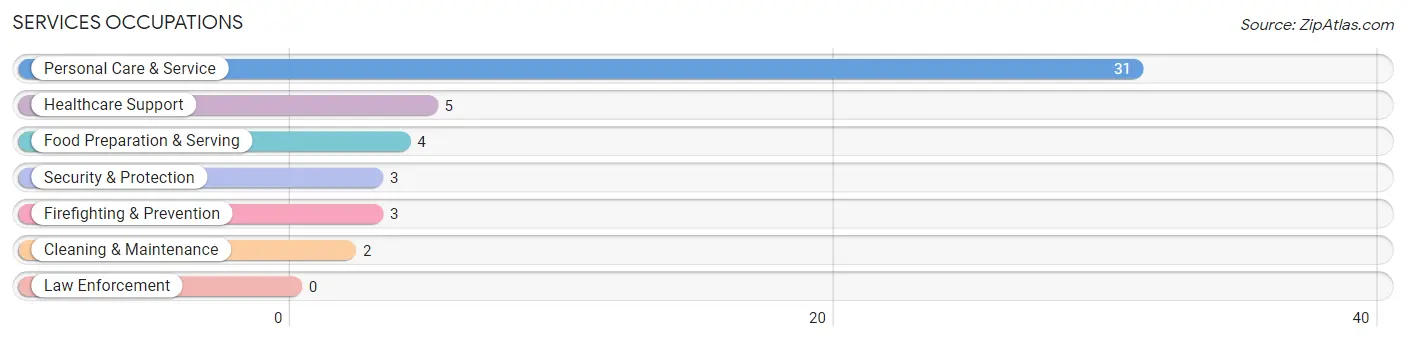
Services Occupations
The most common Services occupations in Fire Island are Personal Care & Service (31 | 19.0%), Healthcare Support (5 | 3.1%), Food Preparation & Serving (4 | 2.5%), Security & Protection (3 | 1.8%), and Firefighting & Prevention (3 | 1.8%).
Services Occupations by Sex
Within the Services occupations in Fire Island, the most male-oriented occupations are Security & Protection (100.0%), Firefighting & Prevention (100.0%), and Personal Care & Service (61.3%), while the most female-oriented occupations are Food Preparation & Serving (100.0%), Cleaning & Maintenance (100.0%), and Healthcare Support (60.0%).
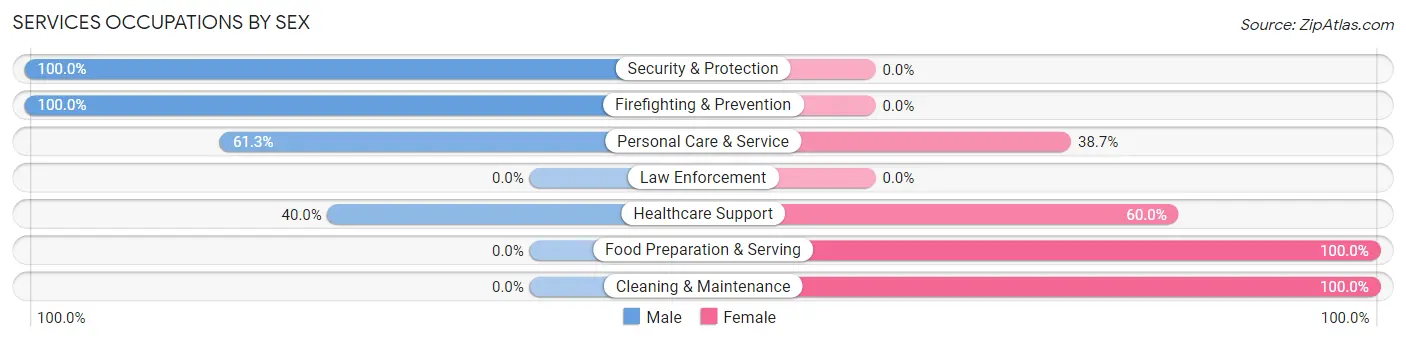
| Occupation | Male | Female |
| Healthcare Support | 2 (40.0%) | 3 (60.0%) |
| Security & Protection | 3 (100.0%) | 0 (0.0%) |
| Firefighting & Prevention | 3 (100.0%) | 0 (0.0%) |
| Law Enforcement | 0 (0.0%) | 0 (0.0%) |
| Food Preparation & Serving | 0 (0.0%) | 4 (100.0%) |
| Cleaning & Maintenance | 0 (0.0%) | 2 (100.0%) |
| Personal Care & Service | 19 (61.3%) | 12 (38.7%) |
| Total (Category) | 24 (53.3%) | 21 (46.7%) |
| Total (Overall) | 76 (46.6%) | 87 (53.4%) |
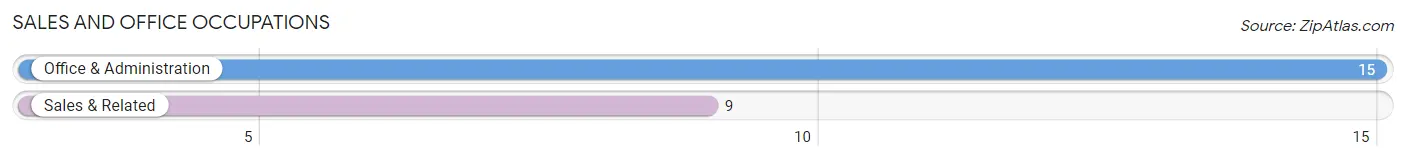
Sales and Office Occupations
The most common Sales and Office occupations in Fire Island are Office & Administration (15 | 9.2%), and Sales & Related (9 | 5.5%).
Sales and Office Occupations by Sex
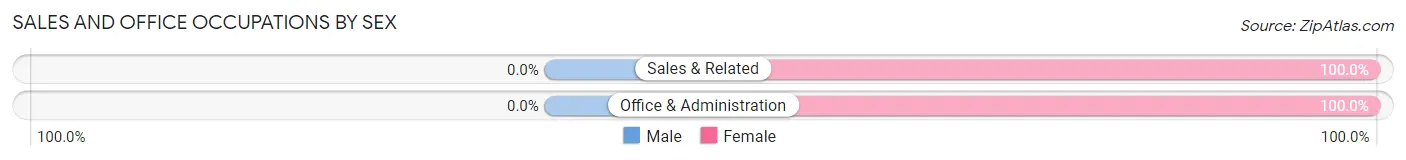
| Occupation | Male | Female |
| Sales & Related | 0 (0.0%) | 9 (100.0%) |
| Office & Administration | 0 (0.0%) | 15 (100.0%) |
| Total (Category) | 0 (0.0%) | 24 (100.0%) |
| Total (Overall) | 76 (46.6%) | 87 (53.4%) |
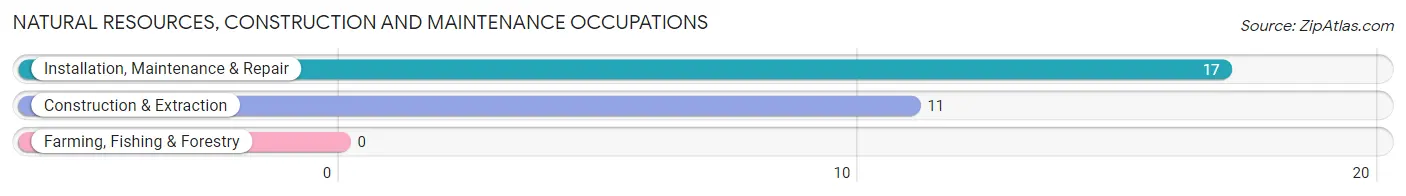
Natural Resources, Construction and Maintenance Occupations
The most common Natural Resources, Construction and Maintenance occupations in Fire Island are Installation, Maintenance & Repair (17 | 10.4%), and Construction & Extraction (11 | 6.8%).
Natural Resources, Construction and Maintenance Occupations by Sex
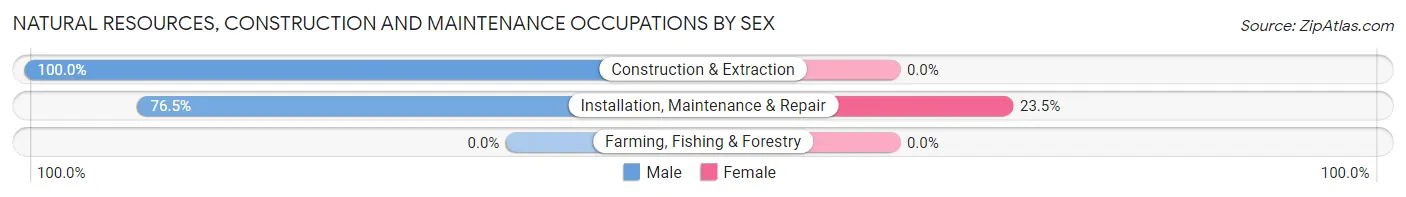
| Occupation | Male | Female |
| Farming, Fishing & Forestry | 0 (0.0%) | 0 (0.0%) |
| Construction & Extraction | 11 (100.0%) | 0 (0.0%) |
| Installation, Maintenance & Repair | 13 (76.5%) | 4 (23.5%) |
| Total (Category) | 24 (85.7%) | 4 (14.3%) |
| Total (Overall) | 76 (46.6%) | 87 (53.4%) |
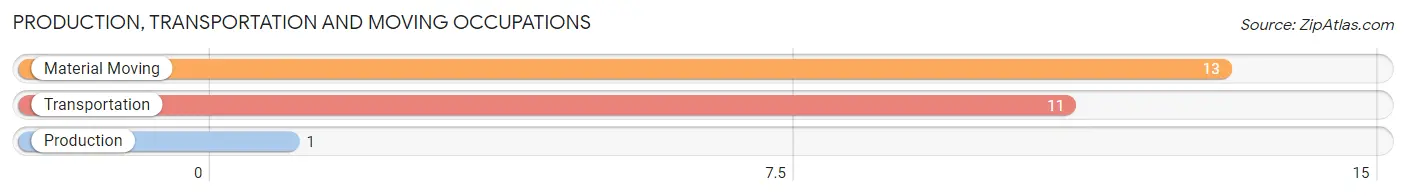
Production, Transportation and Moving Occupations
The most common Production, Transportation and Moving occupations in Fire Island are Material Moving (13 | 8.0%), Transportation (11 | 6.8%), and Production (1 | 0.6%).
Production, Transportation and Moving Occupations by Sex
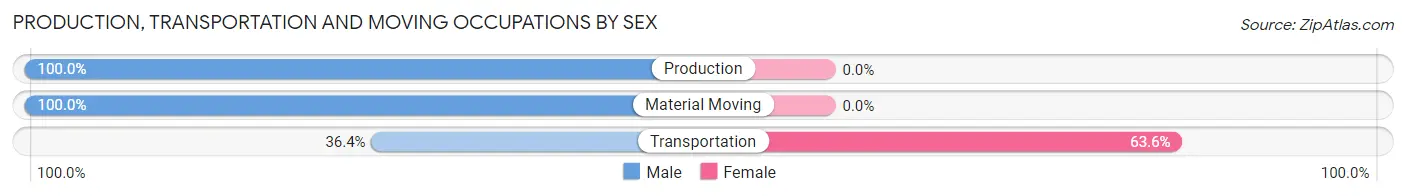
| Occupation | Male | Female |
| Production | 1 (100.0%) | 0 (0.0%) |
| Transportation | 4 (36.4%) | 7 (63.6%) |
| Material Moving | 13 (100.0%) | 0 (0.0%) |
| Total (Category) | 18 (72.0%) | 7 (28.0%) |
| Total (Overall) | 76 (46.6%) | 87 (53.4%) |
Employment Industries by Sex in Fire Island
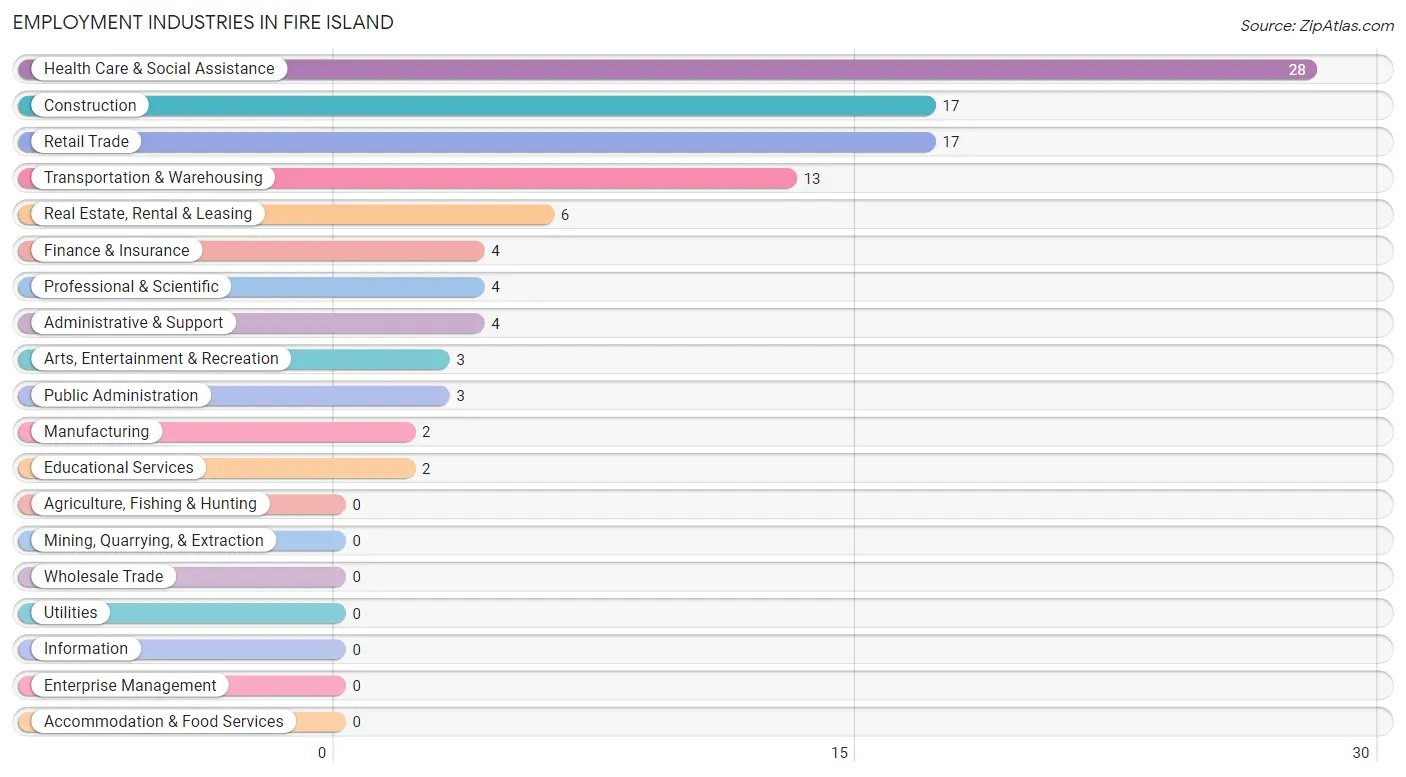
Employment Industries in Fire Island
The major employment industries in Fire Island include Health Care & Social Assistance (28 | 17.2%), Construction (17 | 10.4%), Retail Trade (17 | 10.4%), Transportation & Warehousing (13 | 8.0%), and Real Estate, Rental & Leasing (6 | 3.7%).
Employment Industries by Sex in Fire Island
The Fire Island industries that see more men than women are Manufacturing (100.0%), Transportation & Warehousing (100.0%), and Real Estate, Rental & Leasing (100.0%), whereas the industries that tend to have a higher number of women are Finance & Insurance (100.0%), Administrative & Support (100.0%), and Educational Services (100.0%).
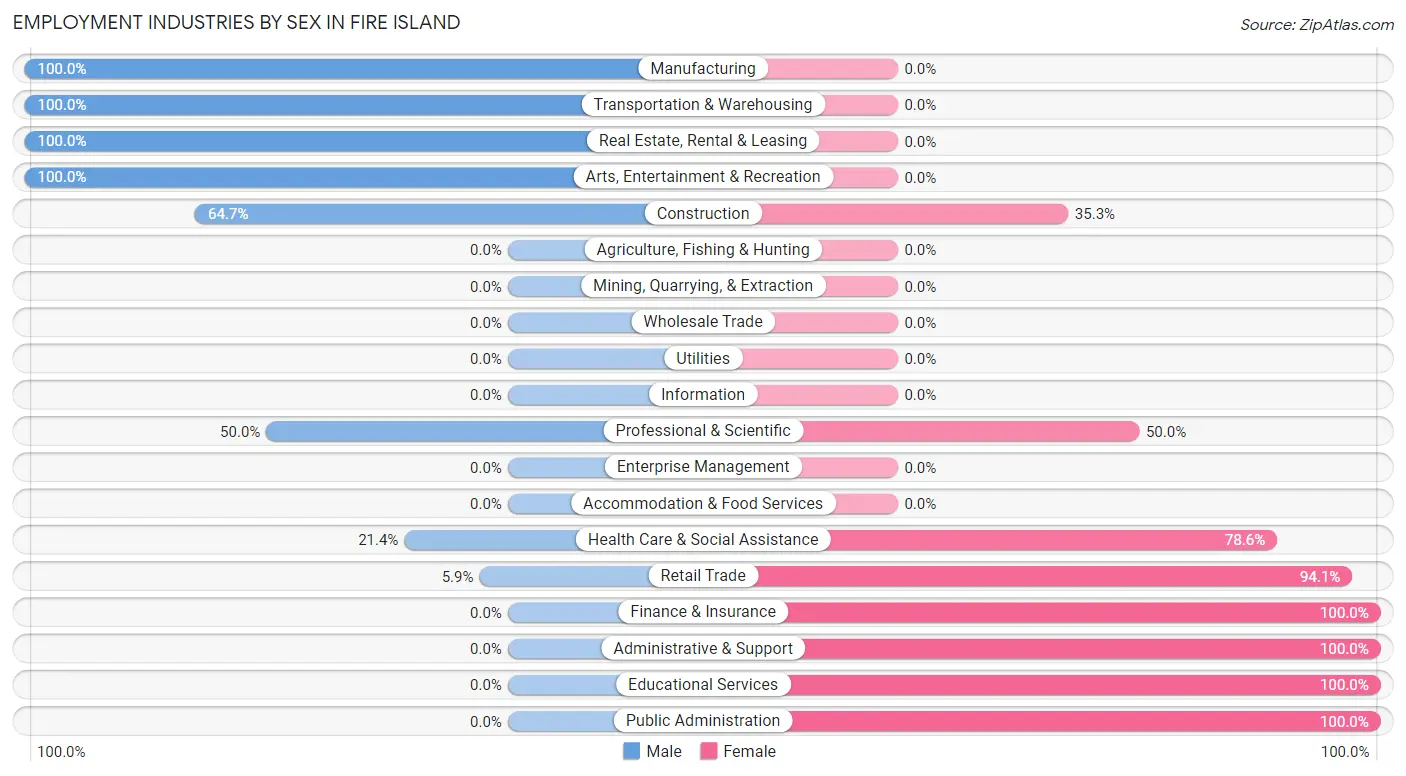
| Industry | Male | Female |
| Agriculture, Fishing & Hunting | 0 (0.0%) | 0 (0.0%) |
| Mining, Quarrying, & Extraction | 0 (0.0%) | 0 (0.0%) |
| Construction | 11 (64.7%) | 6 (35.3%) |
| Manufacturing | 2 (100.0%) | 0 (0.0%) |
| Wholesale Trade | 0 (0.0%) | 0 (0.0%) |
| Retail Trade | 1 (5.9%) | 16 (94.1%) |
| Transportation & Warehousing | 13 (100.0%) | 0 (0.0%) |
| Utilities | 0 (0.0%) | 0 (0.0%) |
| Information | 0 (0.0%) | 0 (0.0%) |
| Finance & Insurance | 0 (0.0%) | 4 (100.0%) |
| Real Estate, Rental & Leasing | 6 (100.0%) | 0 (0.0%) |
| Professional & Scientific | 2 (50.0%) | 2 (50.0%) |
| Enterprise Management | 0 (0.0%) | 0 (0.0%) |
| Administrative & Support | 0 (0.0%) | 4 (100.0%) |
| Educational Services | 0 (0.0%) | 2 (100.0%) |
| Health Care & Social Assistance | 6 (21.4%) | 22 (78.6%) |
| Arts, Entertainment & Recreation | 3 (100.0%) | 0 (0.0%) |
| Accommodation & Food Services | 0 (0.0%) | 0 (0.0%) |
| Public Administration | 0 (0.0%) | 3 (100.0%) |
| Total | 76 (46.6%) | 87 (53.4%) |
Education in Fire Island
School Enrollment in Fire Island
The most common levels of schooling among the 103 students in Fire Island are middle school (37 | 35.9%), graduate / professional (30 | 29.1%), and high school (20 | 19.4%).
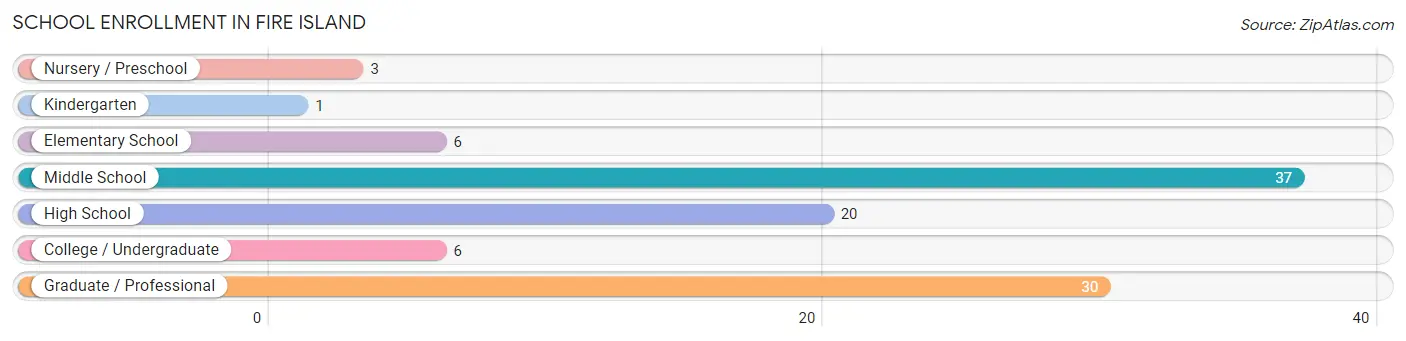
| School Level | # Students | % Students |
| Nursery / Preschool | 3 | 2.9% |
| Kindergarten | 1 | 1.0% |
| Elementary School | 6 | 5.8% |
| Middle School | 37 | 35.9% |
| High School | 20 | 19.4% |
| College / Undergraduate | 6 | 5.8% |
| Graduate / Professional | 30 | 29.1% |
| Total | 103 | 100.0% |
School Enrollment by Age by Funding Source in Fire Island
Out of a total of 103 students who are enrolled in schools in Fire Island, 35 (34.0%) attend a private institution, while the remaining 68 (66.0%) are enrolled in public schools. The age group of 10 to 14 year olds has the highest likelihood of being enrolled in private schools, with 21 (56.8% in the age bracket) enrolled. Conversely, the age group of 5 to 9 year old has the lowest likelihood of being enrolled in a private school, with 7 (100.0% in the age bracket) attending a public institution.
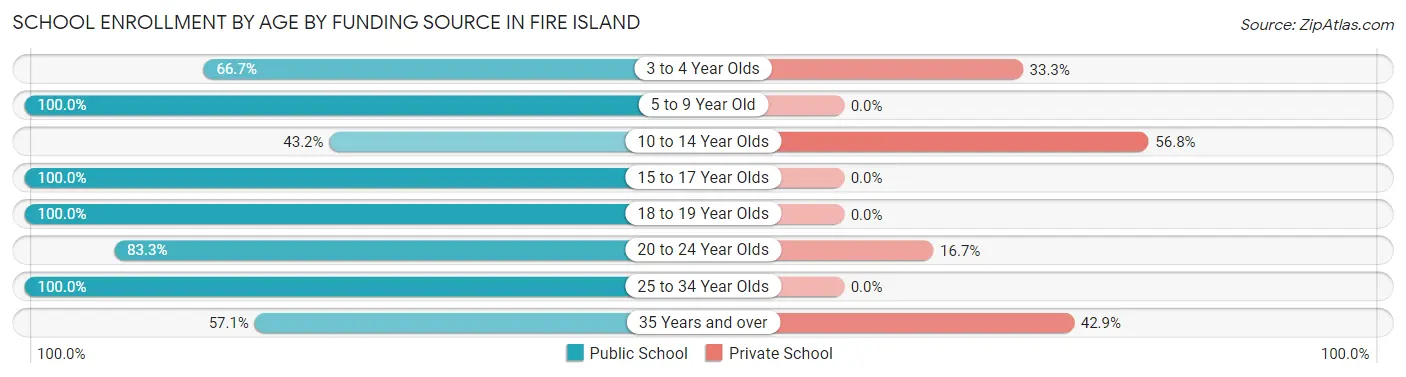
| Age Bracket | Public School | Private School |
| 3 to 4 Year Olds | 2 (66.7%) | 1 (33.3%) |
| 5 to 9 Year Old | 7 (100.0%) | 0 (0.0%) |
| 10 to 14 Year Olds | 16 (43.2%) | 21 (56.8%) |
| 15 to 17 Year Olds | 3 (100.0%) | 0 (0.0%) |
| 18 to 19 Year Olds | 17 (100.0%) | 0 (0.0%) |
| 20 to 24 Year Olds | 5 (83.3%) | 1 (16.7%) |
| 25 to 34 Year Olds | 2 (100.0%) | 0 (0.0%) |
| 35 Years and over | 16 (57.1%) | 12 (42.9%) |
| Total | 68 (66.0%) | 35 (34.0%) |
Educational Attainment by Field of Study in Fire Island
Science & technology (21 | 30.9%), business (16 | 23.5%), arts & humanities (12 | 17.6%), visual & performing arts (6 | 8.8%), and psychology (4 | 5.9%) are the most common fields of study among 68 individuals in Fire Island who have obtained a bachelor's degree or higher.
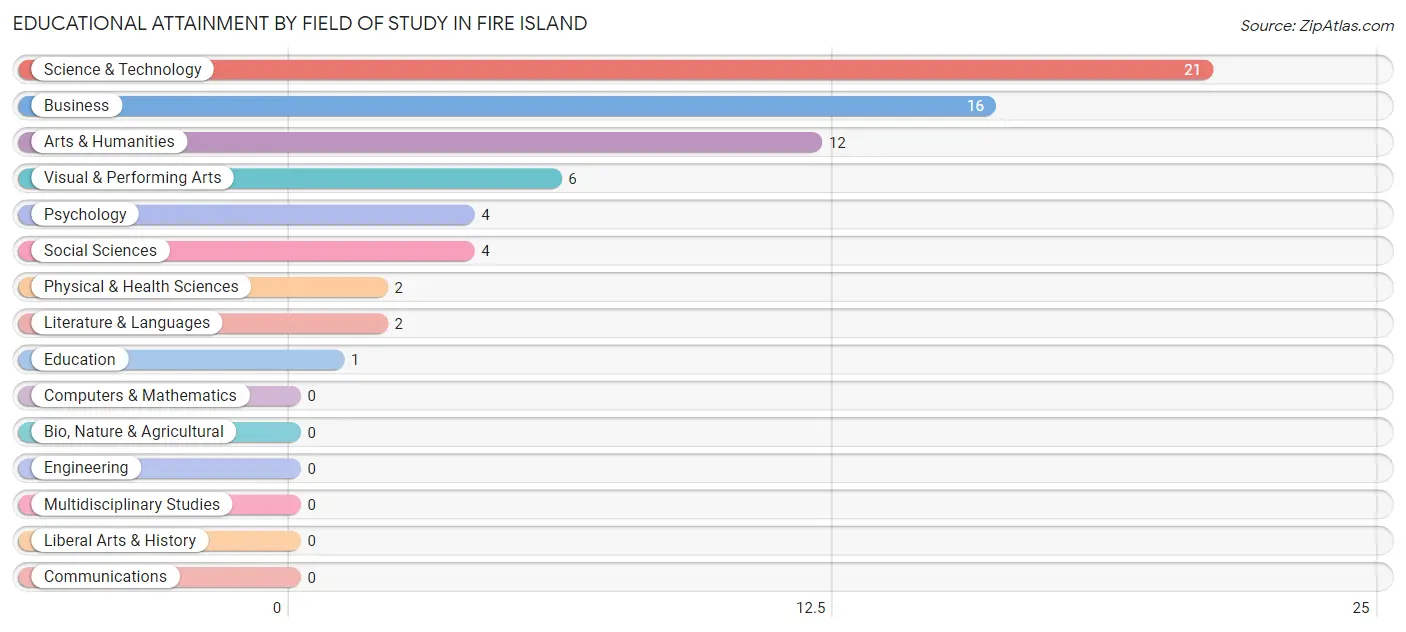
| Field of Study | # Graduates | % Graduates |
| Computers & Mathematics | 0 | 0.0% |
| Bio, Nature & Agricultural | 0 | 0.0% |
| Physical & Health Sciences | 2 | 2.9% |
| Psychology | 4 | 5.9% |
| Social Sciences | 4 | 5.9% |
| Engineering | 0 | 0.0% |
| Multidisciplinary Studies | 0 | 0.0% |
| Science & Technology | 21 | 30.9% |
| Business | 16 | 23.5% |
| Education | 1 | 1.5% |
| Literature & Languages | 2 | 2.9% |
| Liberal Arts & History | 0 | 0.0% |
| Visual & Performing Arts | 6 | 8.8% |
| Communications | 0 | 0.0% |
| Arts & Humanities | 12 | 17.6% |
| Total | 68 | 100.0% |
Transportation & Commute in Fire Island
Vehicle Availability by Sex in Fire Island
The most prevalent vehicle ownership categories in Fire Island are males with 2 vehicles (34, accounting for 49.3%) and females with 2 vehicles (43, making up 40.0%).
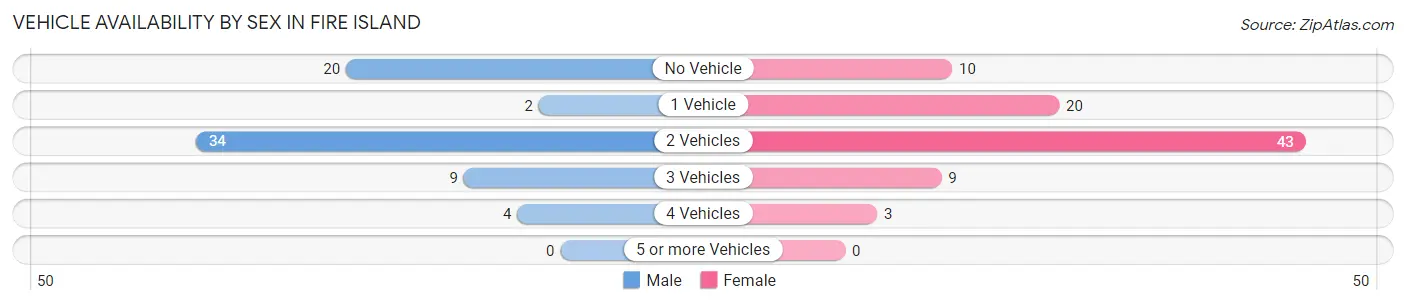
| Vehicles Available | Male | Female |
| No Vehicle | 20 (29.0%) | 10 (11.8%) |
| 1 Vehicle | 2 (2.9%) | 20 (23.5%) |
| 2 Vehicles | 34 (49.3%) | 43 (50.6%) |
| 3 Vehicles | 9 (13.0%) | 9 (10.6%) |
| 4 Vehicles | 4 (5.8%) | 3 (3.5%) |
| 5 or more Vehicles | 0 (0.0%) | 0 (0.0%) |
| Total | 69 (100.0%) | 85 (100.0%) |
Commute Time in Fire Island
The most frequently occuring commute durations in Fire Island are 30 to 34 minutes (41 commuters, 27.3%), 20 to 24 minutes (38 commuters, 25.3%), and 60 to 89 minutes (19 commuters, 12.7%).
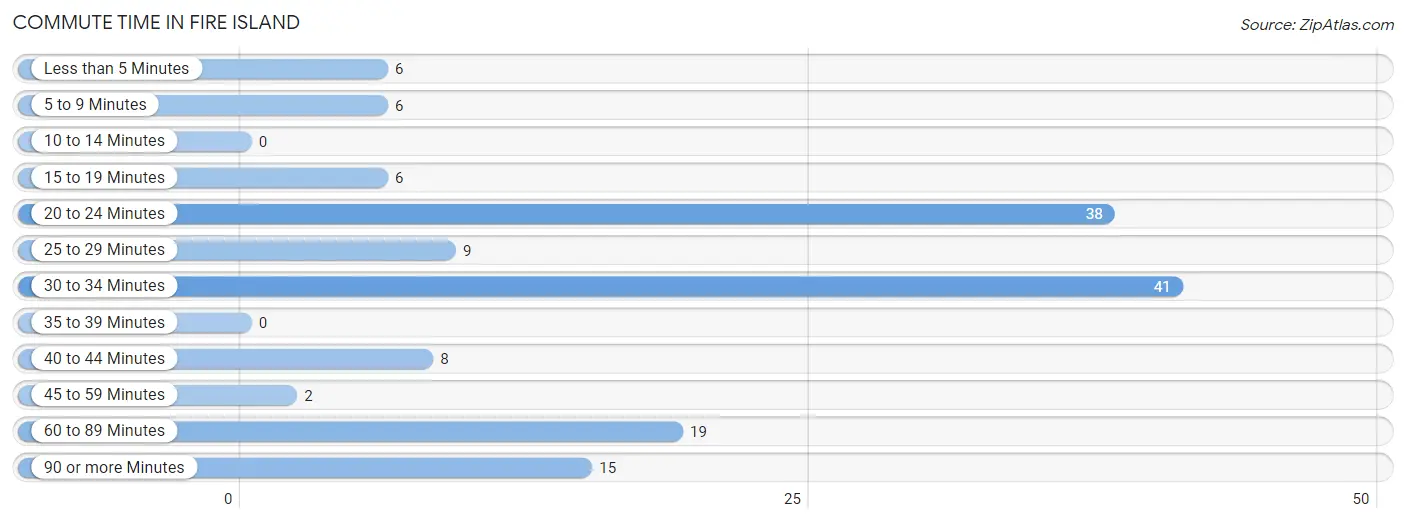
| Commute Time | # Commuters | % Commuters |
| Less than 5 Minutes | 6 | 4.0% |
| 5 to 9 Minutes | 6 | 4.0% |
| 10 to 14 Minutes | 0 | 0.0% |
| 15 to 19 Minutes | 6 | 4.0% |
| 20 to 24 Minutes | 38 | 25.3% |
| 25 to 29 Minutes | 9 | 6.0% |
| 30 to 34 Minutes | 41 | 27.3% |
| 35 to 39 Minutes | 0 | 0.0% |
| 40 to 44 Minutes | 8 | 5.3% |
| 45 to 59 Minutes | 2 | 1.3% |
| 60 to 89 Minutes | 19 | 12.7% |
| 90 or more Minutes | 15 | 10.0% |
Commute Time by Sex in Fire Island
The most common commute times in Fire Island are 60 to 89 minutes (19 commuters, 26.4%) for males and 20 to 24 minutes (31 commuters, 39.7%) for females.
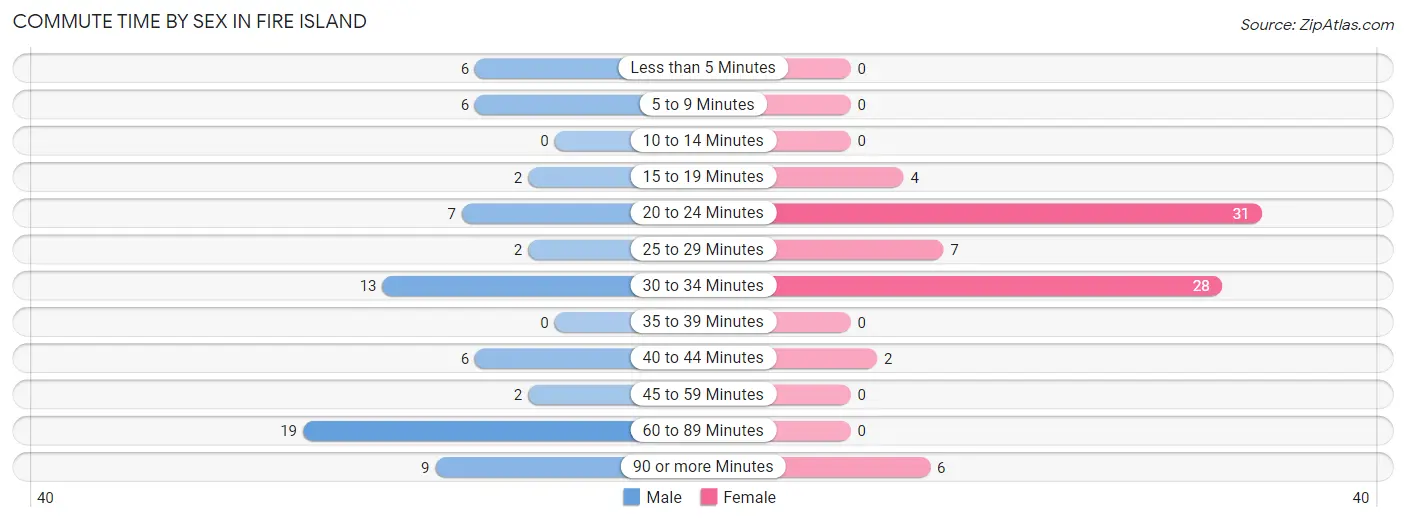
| Commute Time | Male | Female |
| Less than 5 Minutes | 6 (8.3%) | 0 (0.0%) |
| 5 to 9 Minutes | 6 (8.3%) | 0 (0.0%) |
| 10 to 14 Minutes | 0 (0.0%) | 0 (0.0%) |
| 15 to 19 Minutes | 2 (2.8%) | 4 (5.1%) |
| 20 to 24 Minutes | 7 (9.7%) | 31 (39.7%) |
| 25 to 29 Minutes | 2 (2.8%) | 7 (9.0%) |
| 30 to 34 Minutes | 13 (18.1%) | 28 (35.9%) |
| 35 to 39 Minutes | 0 (0.0%) | 0 (0.0%) |
| 40 to 44 Minutes | 6 (8.3%) | 2 (2.6%) |
| 45 to 59 Minutes | 2 (2.8%) | 0 (0.0%) |
| 60 to 89 Minutes | 19 (26.4%) | 0 (0.0%) |
| 90 or more Minutes | 9 (12.5%) | 6 (7.7%) |
Time of Departure to Work by Sex in Fire Island
The most frequent times of departure to work in Fire Island are 7:30 AM to 7:59 AM (29, 40.3%) for males and 12:00 PM to 3:59 PM (25, 32.1%) for females.
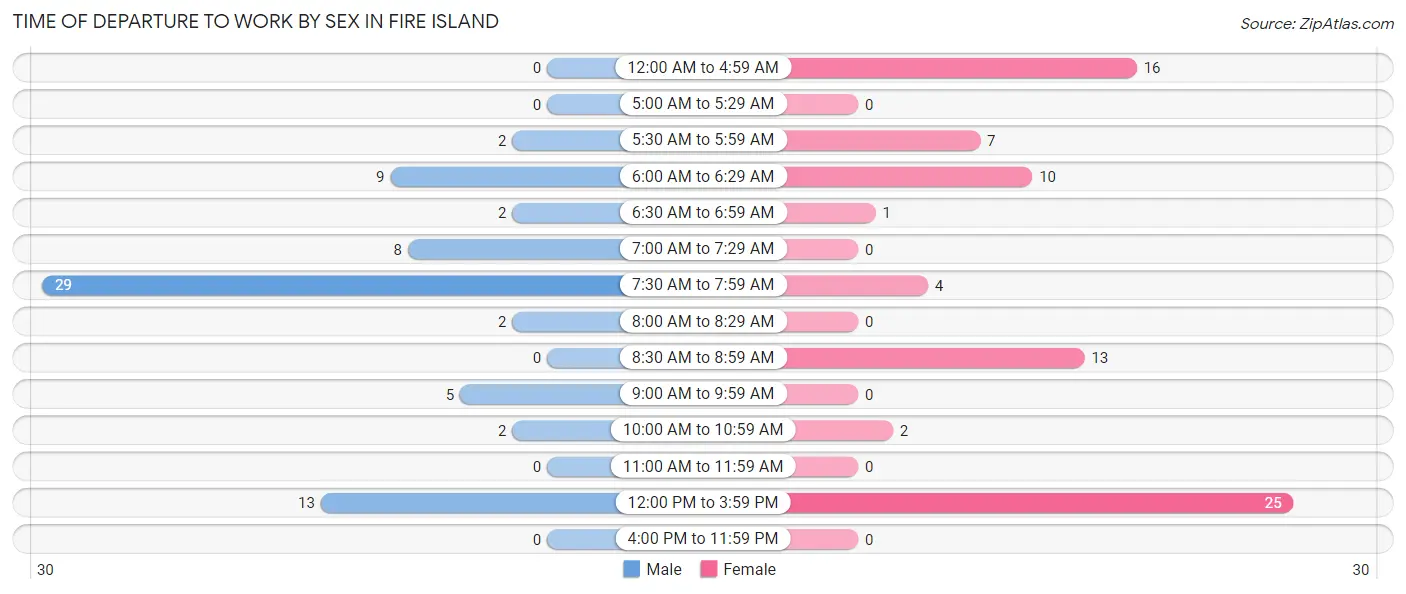
| Time of Departure | Male | Female |
| 12:00 AM to 4:59 AM | 0 (0.0%) | 16 (20.5%) |
| 5:00 AM to 5:29 AM | 0 (0.0%) | 0 (0.0%) |
| 5:30 AM to 5:59 AM | 2 (2.8%) | 7 (9.0%) |
| 6:00 AM to 6:29 AM | 9 (12.5%) | 10 (12.8%) |
| 6:30 AM to 6:59 AM | 2 (2.8%) | 1 (1.3%) |
| 7:00 AM to 7:29 AM | 8 (11.1%) | 0 (0.0%) |
| 7:30 AM to 7:59 AM | 29 (40.3%) | 4 (5.1%) |
| 8:00 AM to 8:29 AM | 2 (2.8%) | 0 (0.0%) |
| 8:30 AM to 8:59 AM | 0 (0.0%) | 13 (16.7%) |
| 9:00 AM to 9:59 AM | 5 (6.9%) | 0 (0.0%) |
| 10:00 AM to 10:59 AM | 2 (2.8%) | 2 (2.6%) |
| 11:00 AM to 11:59 AM | 0 (0.0%) | 0 (0.0%) |
| 12:00 PM to 3:59 PM | 13 (18.1%) | 25 (32.1%) |
| 4:00 PM to 11:59 PM | 0 (0.0%) | 0 (0.0%) |
| Total | 72 (100.0%) | 78 (100.0%) |
Housing Occupancy in Fire Island
Occupancy by Ownership in Fire Island
Of the total 92 dwellings in Fire Island, owner-occupied units account for 63 (68.5%), while renter-occupied units make up 29 (31.5%).
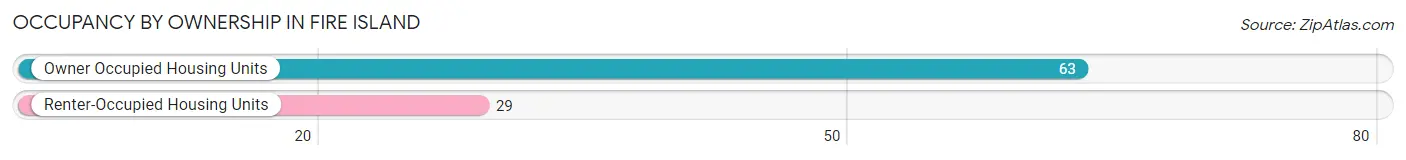
| Occupancy | # Housing Units | % Housing Units |
| Owner Occupied Housing Units | 63 | 68.5% |
| Renter-Occupied Housing Units | 29 | 31.5% |
| Total Occupied Housing Units | 92 | 100.0% |
Occupancy by Household Size in Fire Island
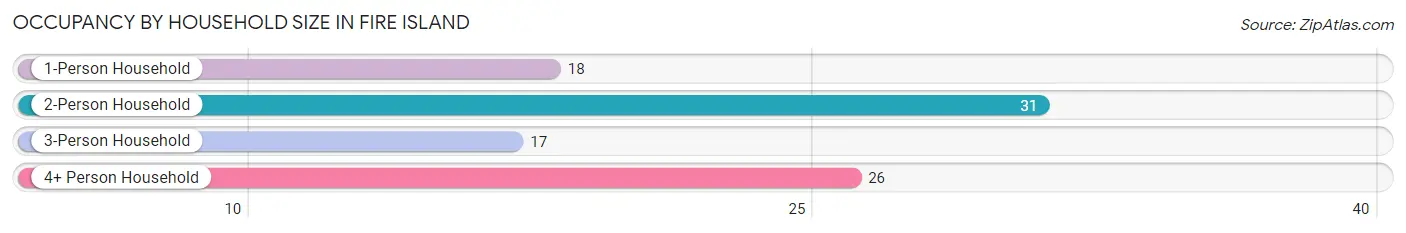
| Household Size | # Housing Units | % Housing Units |
| 1-Person Household | 18 | 19.6% |
| 2-Person Household | 31 | 33.7% |
| 3-Person Household | 17 | 18.5% |
| 4+ Person Household | 26 | 28.3% |
| Total Housing Units | 92 | 100.0% |
Occupancy by Ownership by Household Size in Fire Island
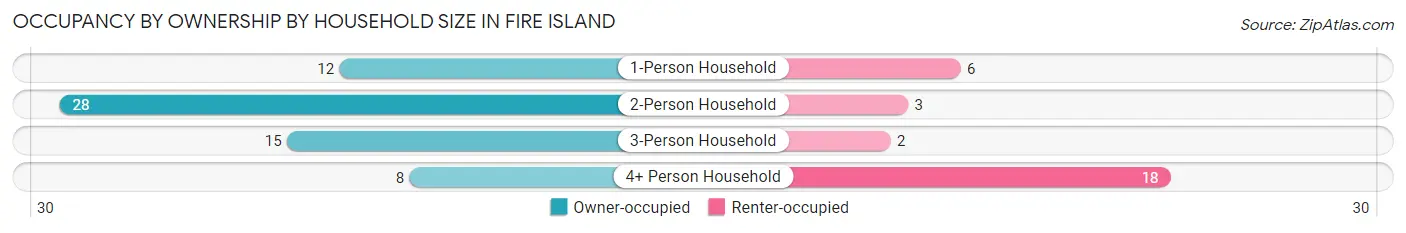
| Household Size | Owner-occupied | Renter-occupied |
| 1-Person Household | 12 (66.7%) | 6 (33.3%) |
| 2-Person Household | 28 (90.3%) | 3 (9.7%) |
| 3-Person Household | 15 (88.2%) | 2 (11.8%) |
| 4+ Person Household | 8 (30.8%) | 18 (69.2%) |
| Total Housing Units | 63 (68.5%) | 29 (31.5%) |
Occupancy by Educational Attainment in Fire Island
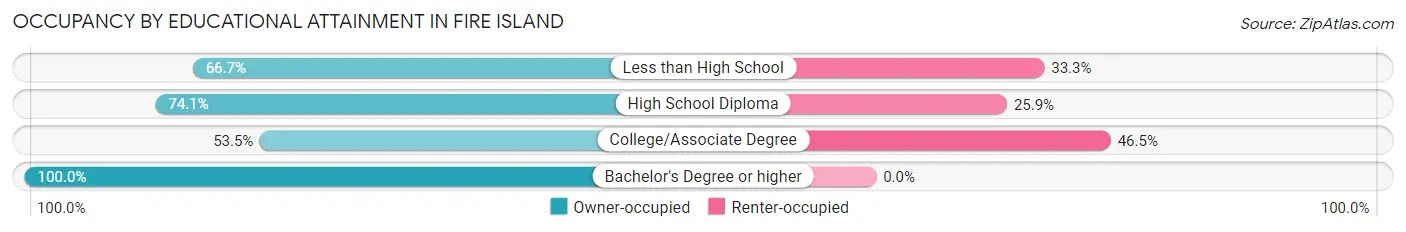
| Household Size | Owner-occupied | Renter-occupied |
| Less than High School | 4 (66.7%) | 2 (33.3%) |
| High School Diploma | 20 (74.1%) | 7 (25.9%) |
| College/Associate Degree | 23 (53.5%) | 20 (46.5%) |
| Bachelor's Degree or higher | 16 (100.0%) | 0 (0.0%) |
Occupancy by Age of Householder in Fire Island
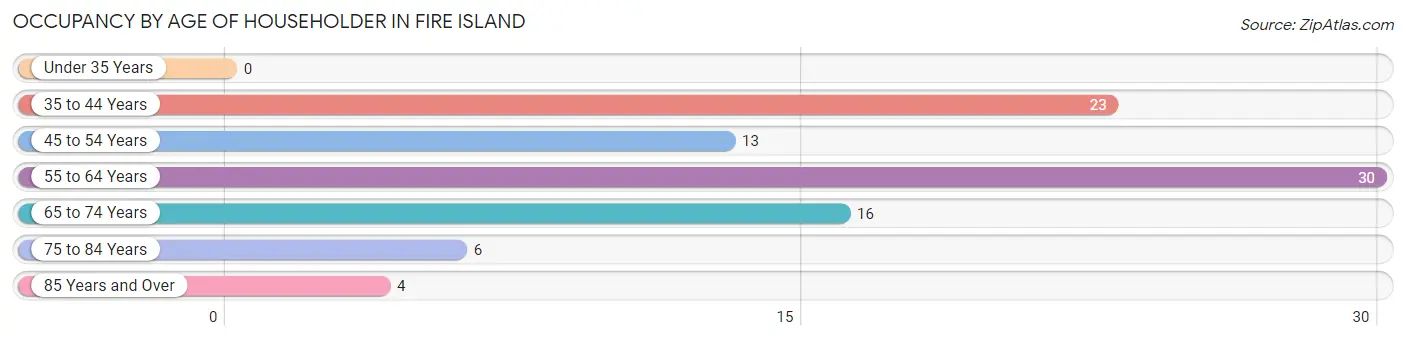
| Age Bracket | # Households | % Households |
| Under 35 Years | 0 | 0.0% |
| 35 to 44 Years | 23 | 25.0% |
| 45 to 54 Years | 13 | 14.1% |
| 55 to 64 Years | 30 | 32.6% |
| 65 to 74 Years | 16 | 17.4% |
| 75 to 84 Years | 6 | 6.5% |
| 85 Years and Over | 4 | 4.3% |
| Total | 92 | 100.0% |
Housing Finances in Fire Island
Median Income by Occupancy in Fire Island
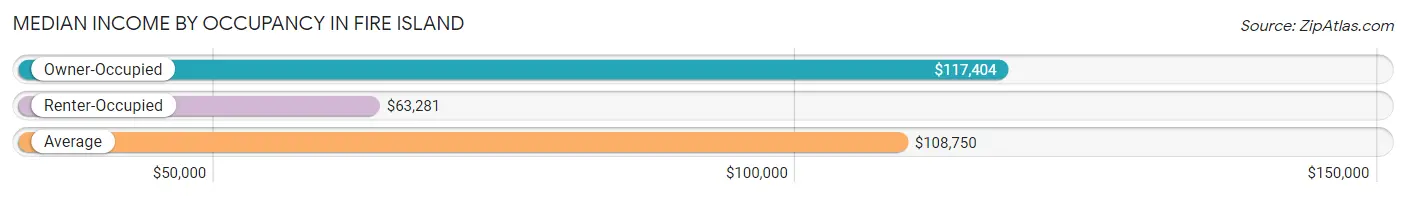
| Occupancy Type | # Households | Median Income |
| Owner-Occupied | 63 (68.5%) | $117,404 |
| Renter-Occupied | 29 (31.5%) | $63,281 |
| Average | 92 (100.0%) | $108,750 |
Occupancy by Householder Income Bracket in Fire Island
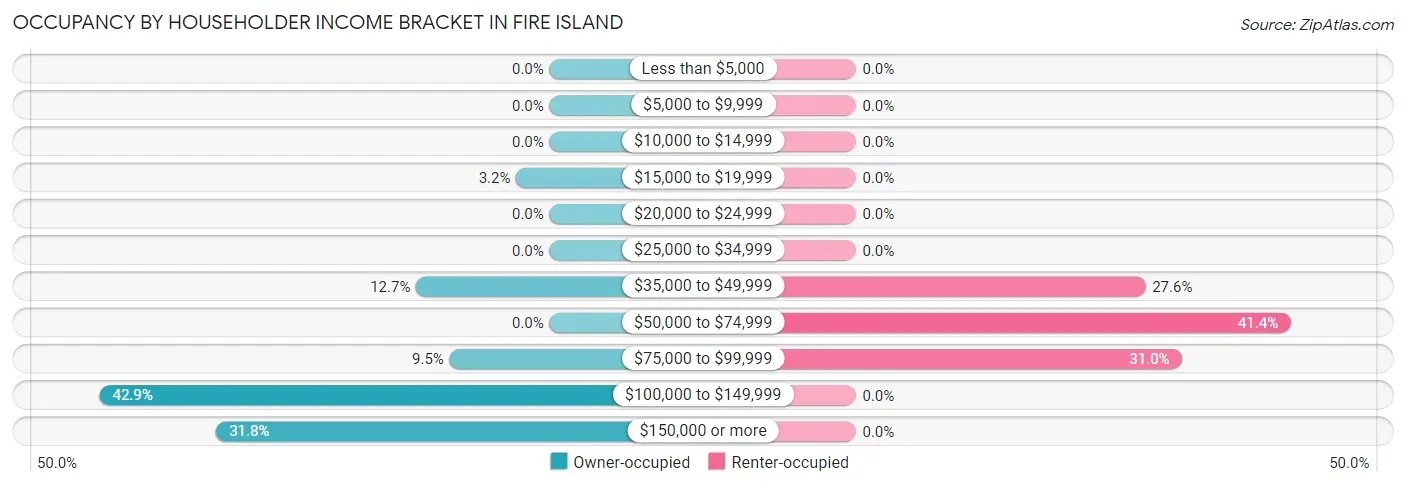
| Income Bracket | Owner-occupied | Renter-occupied |
| Less than $5,000 | 0 (0.0%) | 0 (0.0%) |
| $5,000 to $9,999 | 0 (0.0%) | 0 (0.0%) |
| $10,000 to $14,999 | 0 (0.0%) | 0 (0.0%) |
| $15,000 to $19,999 | 2 (3.2%) | 0 (0.0%) |
| $20,000 to $24,999 | 0 (0.0%) | 0 (0.0%) |
| $25,000 to $34,999 | 0 (0.0%) | 0 (0.0%) |
| $35,000 to $49,999 | 8 (12.7%) | 8 (27.6%) |
| $50,000 to $74,999 | 0 (0.0%) | 12 (41.4%) |
| $75,000 to $99,999 | 6 (9.5%) | 9 (31.0%) |
| $100,000 to $149,999 | 27 (42.9%) | 0 (0.0%) |
| $150,000 or more | 20 (31.8%) | 0 (0.0%) |
| Total | 63 (100.0%) | 29 (100.0%) |
Monthly Housing Cost Tiers in Fire Island
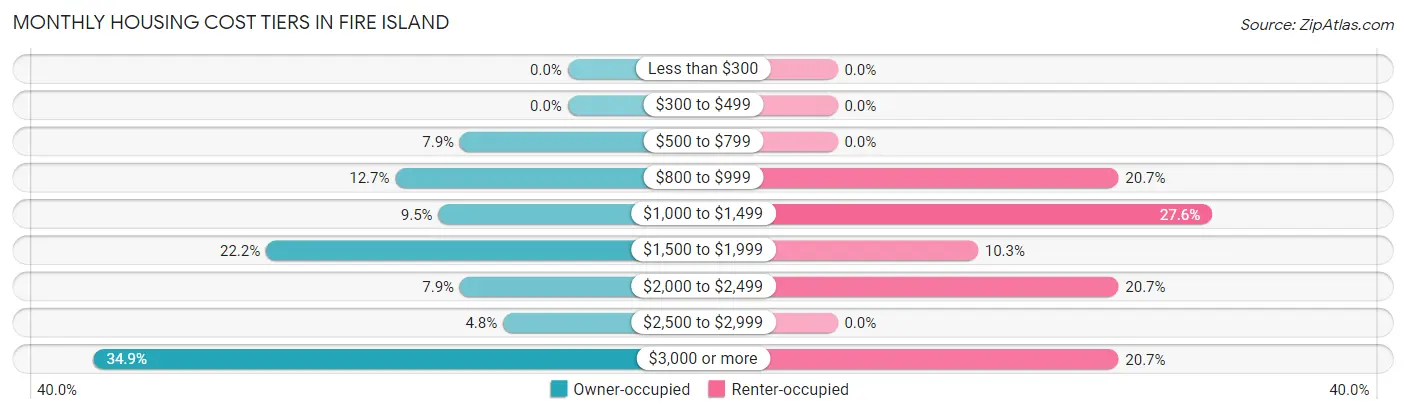
| Monthly Cost | Owner-occupied | Renter-occupied |
| Less than $300 | 0 (0.0%) | 0 (0.0%) |
| $300 to $499 | 0 (0.0%) | 0 (0.0%) |
| $500 to $799 | 5 (7.9%) | 0 (0.0%) |
| $800 to $999 | 8 (12.7%) | 6 (20.7%) |
| $1,000 to $1,499 | 6 (9.5%) | 8 (27.6%) |
| $1,500 to $1,999 | 14 (22.2%) | 3 (10.3%) |
| $2,000 to $2,499 | 5 (7.9%) | 6 (20.7%) |
| $2,500 to $2,999 | 3 (4.8%) | 0 (0.0%) |
| $3,000 or more | 22 (34.9%) | 6 (20.7%) |
| Total | 63 (100.0%) | 29 (100.0%) |
Physical Housing Characteristics in Fire Island
Housing Structures in Fire Island
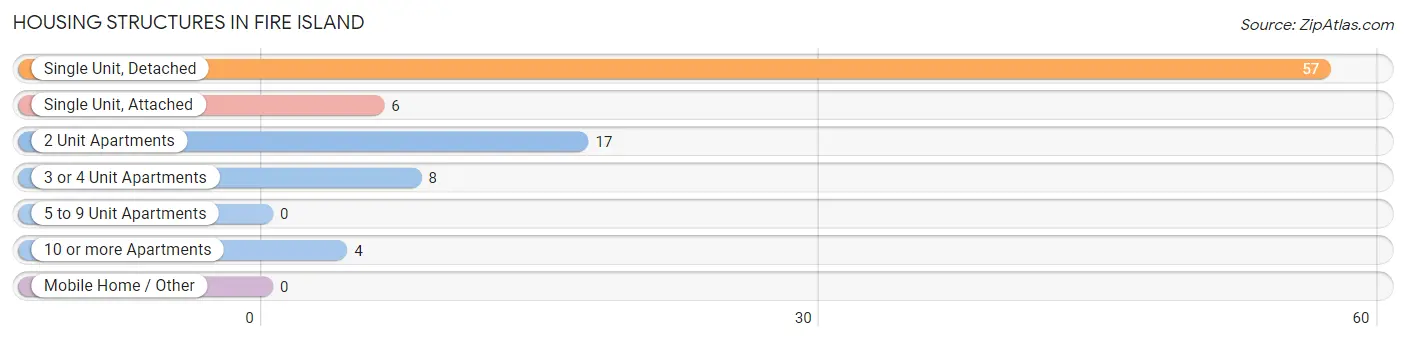
| Structure Type | # Housing Units | % Housing Units |
| Single Unit, Detached | 57 | 62.0% |
| Single Unit, Attached | 6 | 6.5% |
| 2 Unit Apartments | 17 | 18.5% |
| 3 or 4 Unit Apartments | 8 | 8.7% |
| 5 to 9 Unit Apartments | 0 | 0.0% |
| 10 or more Apartments | 4 | 4.3% |
| Mobile Home / Other | 0 | 0.0% |
| Total | 92 | 100.0% |
Housing Structures by Occupancy in Fire Island
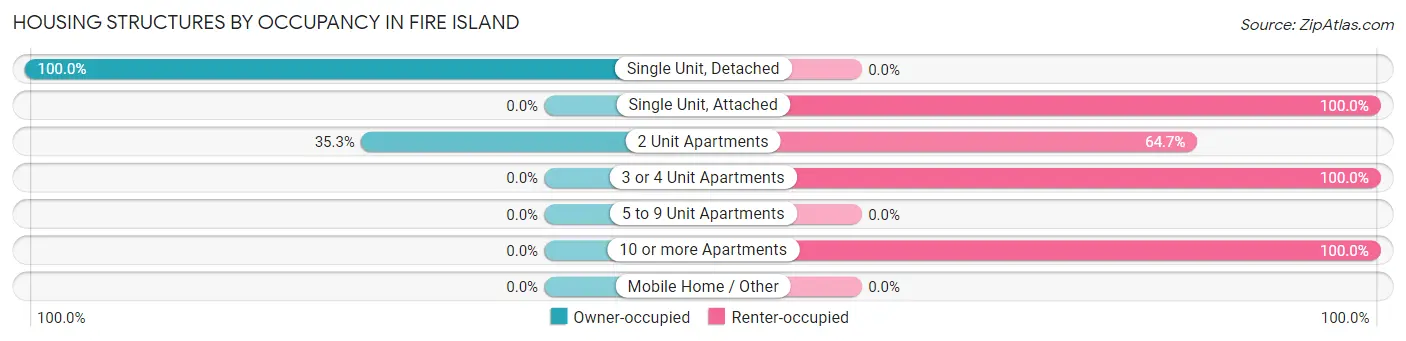
| Structure Type | Owner-occupied | Renter-occupied |
| Single Unit, Detached | 57 (100.0%) | 0 (0.0%) |
| Single Unit, Attached | 0 (0.0%) | 6 (100.0%) |
| 2 Unit Apartments | 6 (35.3%) | 11 (64.7%) |
| 3 or 4 Unit Apartments | 0 (0.0%) | 8 (100.0%) |
| 5 to 9 Unit Apartments | 0 (0.0%) | 0 (0.0%) |
| 10 or more Apartments | 0 (0.0%) | 4 (100.0%) |
| Mobile Home / Other | 0 (0.0%) | 0 (0.0%) |
| Total | 63 (68.5%) | 29 (31.5%) |
Housing Structures by Number of Rooms in Fire Island
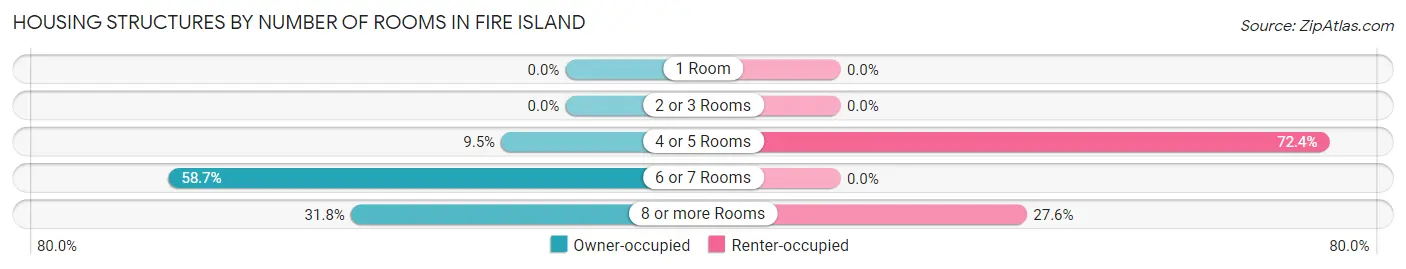
| Number of Rooms | Owner-occupied | Renter-occupied |
| 1 Room | 0 (0.0%) | 0 (0.0%) |
| 2 or 3 Rooms | 0 (0.0%) | 0 (0.0%) |
| 4 or 5 Rooms | 6 (9.5%) | 21 (72.4%) |
| 6 or 7 Rooms | 37 (58.7%) | 0 (0.0%) |
| 8 or more Rooms | 20 (31.8%) | 8 (27.6%) |
| Total | 63 (100.0%) | 29 (100.0%) |
Housing Structure by Heating Type in Fire Island
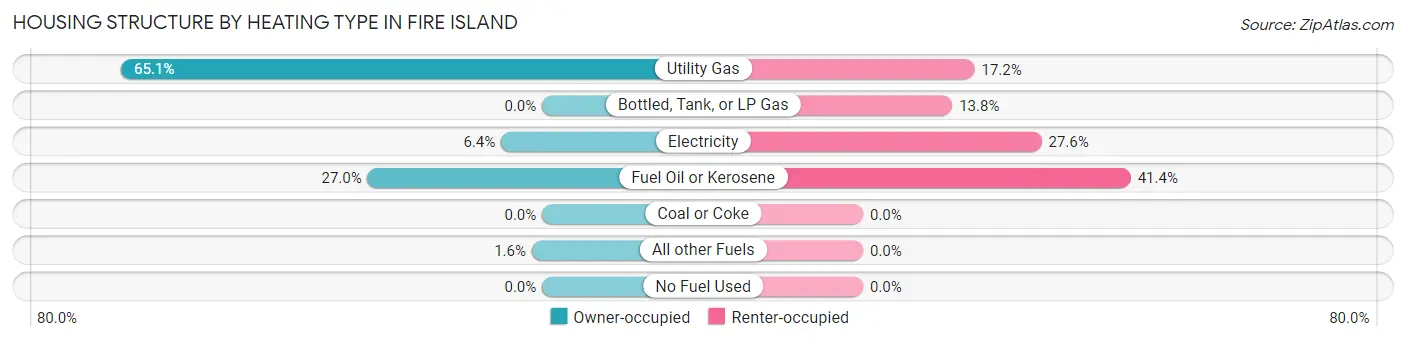
| Heating Type | Owner-occupied | Renter-occupied |
| Utility Gas | 41 (65.1%) | 5 (17.2%) |
| Bottled, Tank, or LP Gas | 0 (0.0%) | 4 (13.8%) |
| Electricity | 4 (6.4%) | 8 (27.6%) |
| Fuel Oil or Kerosene | 17 (27.0%) | 12 (41.4%) |
| Coal or Coke | 0 (0.0%) | 0 (0.0%) |
| All other Fuels | 1 (1.6%) | 0 (0.0%) |
| No Fuel Used | 0 (0.0%) | 0 (0.0%) |
| Total | 63 (100.0%) | 29 (100.0%) |
Household Vehicle Usage in Fire Island
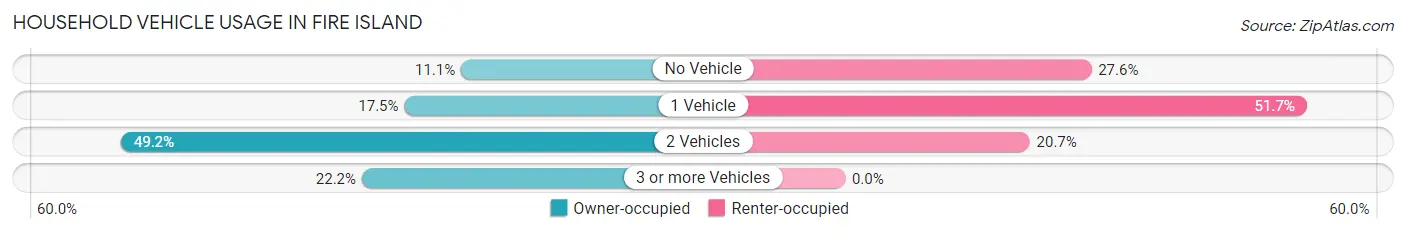
| Vehicles per Household | Owner-occupied | Renter-occupied |
| No Vehicle | 7 (11.1%) | 8 (27.6%) |
| 1 Vehicle | 11 (17.5%) | 15 (51.7%) |
| 2 Vehicles | 31 (49.2%) | 6 (20.7%) |
| 3 or more Vehicles | 14 (22.2%) | 0 (0.0%) |
| Total | 63 (100.0%) | 29 (100.0%) |
Real Estate & Mortgages in Fire Island
Real Estate and Mortgage Overview in Fire Island
| Characteristic | Without Mortgage | With Mortgage |
| Housing Units | 33 | 30 |
| Median Property Value | $510,400 | $447,100 |
| Median Household Income | $110,625 | $12 |
| Monthly Housing Costs | $1,175 | $22 |
| Real Estate Taxes | $9,375 | $0 |
Property Value by Mortgage Status in Fire Island
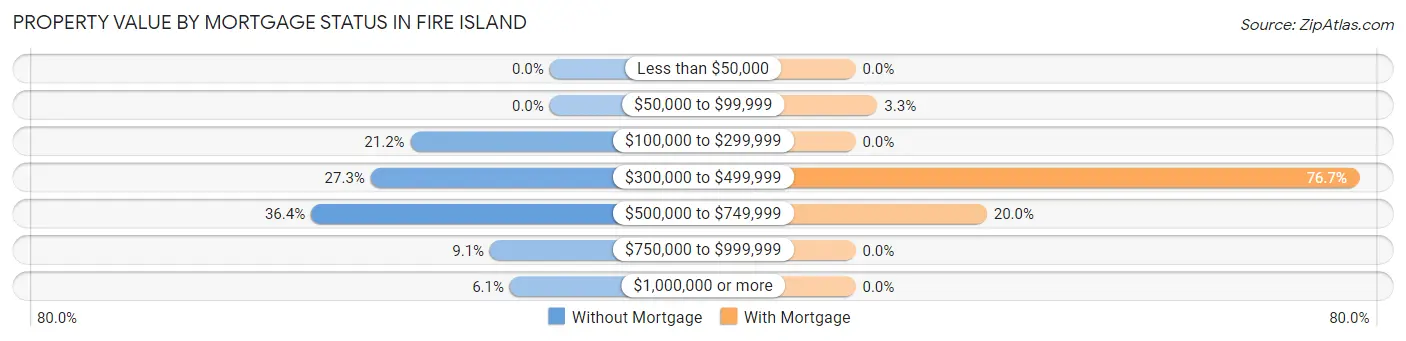
| Property Value | Without Mortgage | With Mortgage |
| Less than $50,000 | 0 (0.0%) | 0 (0.0%) |
| $50,000 to $99,999 | 0 (0.0%) | 1 (3.3%) |
| $100,000 to $299,999 | 7 (21.2%) | 0 (0.0%) |
| $300,000 to $499,999 | 9 (27.3%) | 23 (76.7%) |
| $500,000 to $749,999 | 12 (36.4%) | 6 (20.0%) |
| $750,000 to $999,999 | 3 (9.1%) | 0 (0.0%) |
| $1,000,000 or more | 2 (6.1%) | 0 (0.0%) |
| Total | 33 (100.0%) | 30 (100.0%) |
Household Income by Mortgage Status in Fire Island
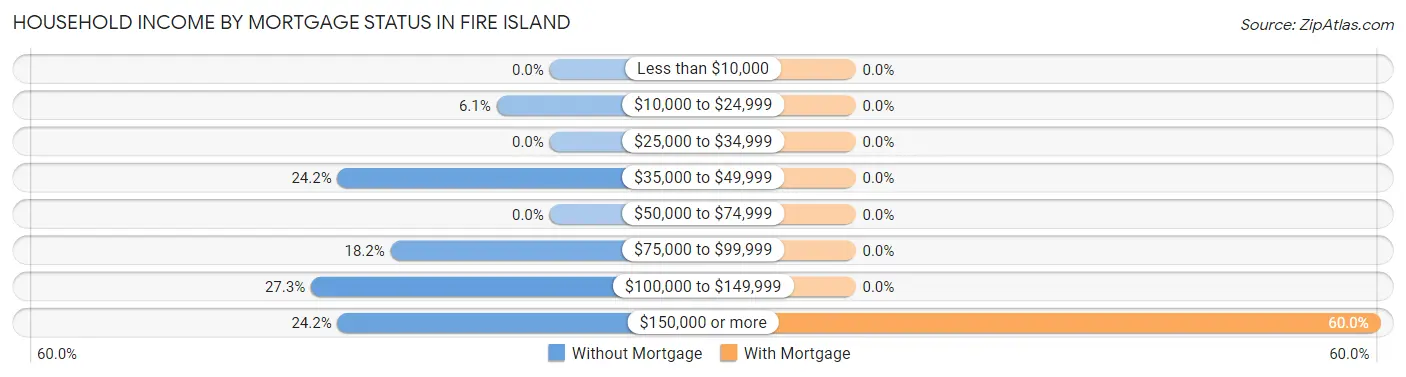
| Household Income | Without Mortgage | With Mortgage |
| Less than $10,000 | 0 (0.0%) | 0 (0.0%) |
| $10,000 to $24,999 | 2 (6.1%) | 0 (0.0%) |
| $25,000 to $34,999 | 0 (0.0%) | 0 (0.0%) |
| $35,000 to $49,999 | 8 (24.2%) | 0 (0.0%) |
| $50,000 to $74,999 | 0 (0.0%) | 0 (0.0%) |
| $75,000 to $99,999 | 6 (18.2%) | 0 (0.0%) |
| $100,000 to $149,999 | 9 (27.3%) | 0 (0.0%) |
| $150,000 or more | 8 (24.2%) | 18 (60.0%) |
| Total | 33 (100.0%) | 30 (100.0%) |
Property Value to Household Income Ratio in Fire Island
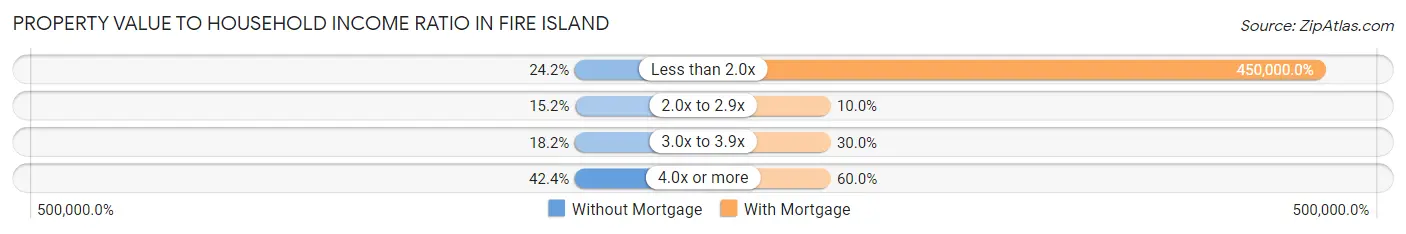
| Value-to-Income Ratio | Without Mortgage | With Mortgage |
| Less than 2.0x | 8 (24.2%) | 135,000 (450,000.0%) |
| 2.0x to 2.9x | 5 (15.1%) | 3 (10.0%) |
| 3.0x to 3.9x | 6 (18.2%) | 9 (30.0%) |
| 4.0x or more | 14 (42.4%) | 18 (60.0%) |
| Total | 33 (100.0%) | 30 (100.0%) |
Real Estate Taxes by Mortgage Status in Fire Island
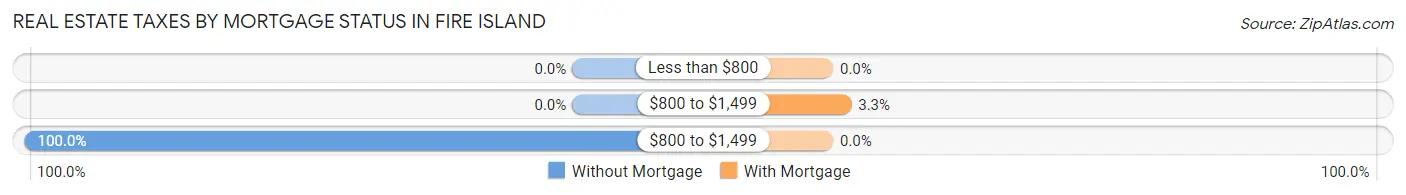
| Property Taxes | Without Mortgage | With Mortgage |
| Less than $800 | 0 (0.0%) | 0 (0.0%) |
| $800 to $1,499 | 0 (0.0%) | 1 (3.3%) |
| $800 to $1,499 | 33 (100.0%) | 0 (0.0%) |
| Total | 33 (100.0%) | 30 (100.0%) |
Health & Disability in Fire Island
Health Insurance Coverage by Age in Fire Island
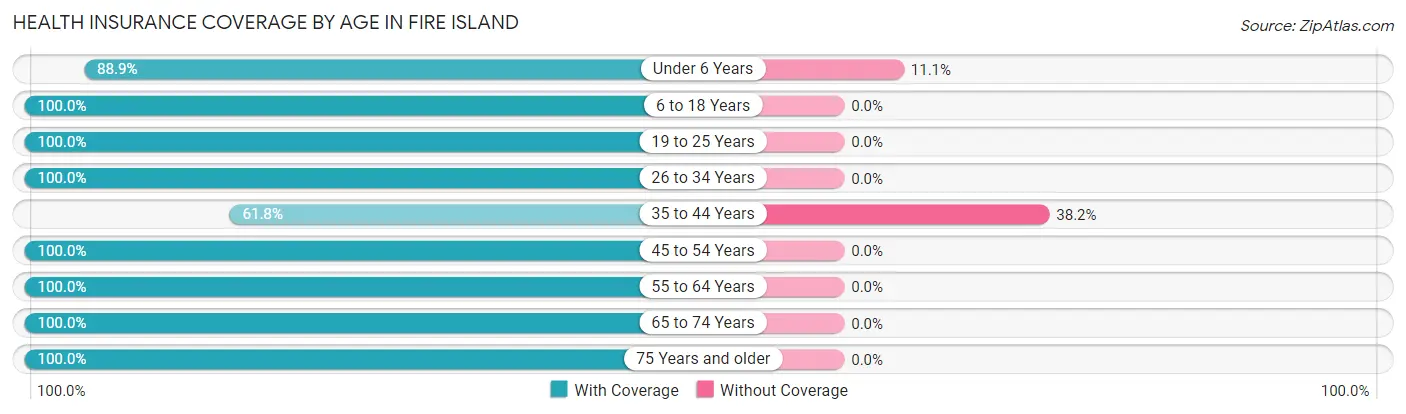
| Age Bracket | With Coverage | Without Coverage |
| Under 6 Years | 8 (88.9%) | 1 (11.1%) |
| 6 to 18 Years | 63 (100.0%) | 0 (0.0%) |
| 19 to 25 Years | 5 (100.0%) | 0 (0.0%) |
| 26 to 34 Years | 9 (100.0%) | 0 (0.0%) |
| 35 to 44 Years | 21 (61.8%) | 13 (38.2%) |
| 45 to 54 Years | 65 (100.0%) | 0 (0.0%) |
| 55 to 64 Years | 58 (100.0%) | 0 (0.0%) |
| 65 to 74 Years | 25 (100.0%) | 0 (0.0%) |
| 75 Years and older | 18 (100.0%) | 0 (0.0%) |
| Total | 272 (95.1%) | 14 (4.9%) |
Health Insurance Coverage by Citizenship Status in Fire Island
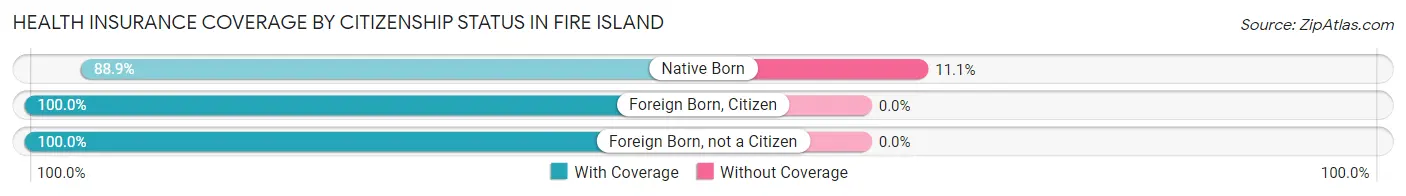
| Citizenship Status | With Coverage | Without Coverage |
| Native Born | 8 (88.9%) | 1 (11.1%) |
| Foreign Born, Citizen | 63 (100.0%) | 0 (0.0%) |
| Foreign Born, not a Citizen | 5 (100.0%) | 0 (0.0%) |
Health Insurance Coverage by Household Income in Fire Island
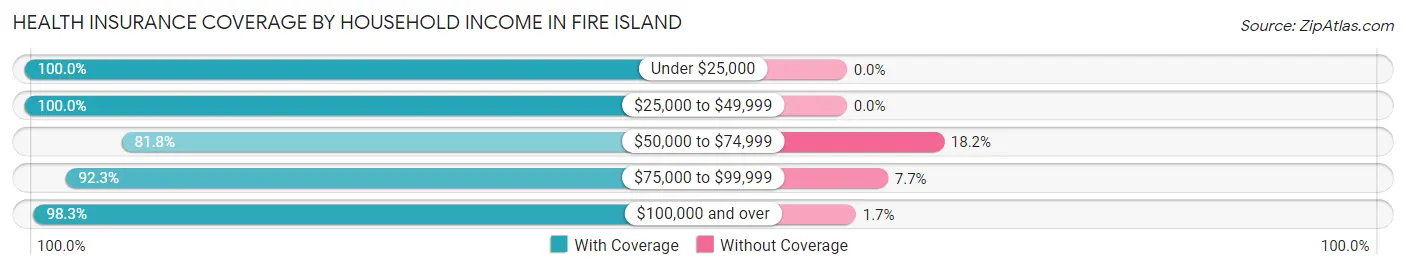
| Household Income | With Coverage | Without Coverage |
| Under $25,000 | 4 (100.0%) | 0 (0.0%) |
| $25,000 to $49,999 | 20 (100.0%) | 0 (0.0%) |
| $50,000 to $74,999 | 36 (81.8%) | 8 (18.2%) |
| $75,000 to $99,999 | 36 (92.3%) | 3 (7.7%) |
| $100,000 and over | 175 (98.3%) | 3 (1.7%) |
Public vs Private Health Insurance Coverage by Age in Fire Island
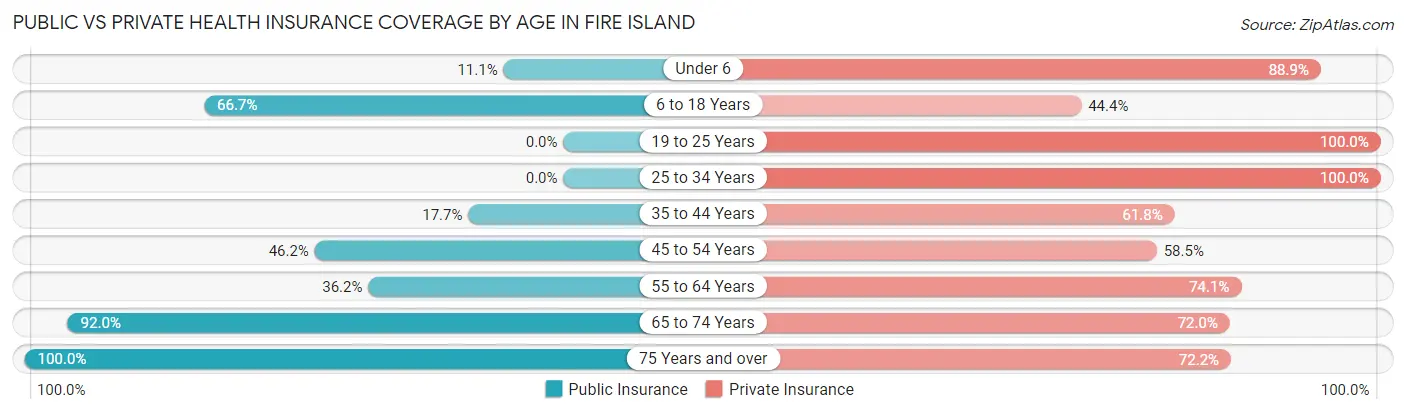
| Age Bracket | Public Insurance | Private Insurance |
| Under 6 | 1 (11.1%) | 8 (88.9%) |
| 6 to 18 Years | 42 (66.7%) | 28 (44.4%) |
| 19 to 25 Years | 0 (0.0%) | 5 (100.0%) |
| 25 to 34 Years | 0 (0.0%) | 9 (100.0%) |
| 35 to 44 Years | 6 (17.6%) | 21 (61.8%) |
| 45 to 54 Years | 30 (46.2%) | 38 (58.5%) |
| 55 to 64 Years | 21 (36.2%) | 43 (74.1%) |
| 65 to 74 Years | 23 (92.0%) | 18 (72.0%) |
| 75 Years and over | 18 (100.0%) | 13 (72.2%) |
| Total | 141 (49.3%) | 183 (64.0%) |
Disability Status by Sex by Age in Fire Island
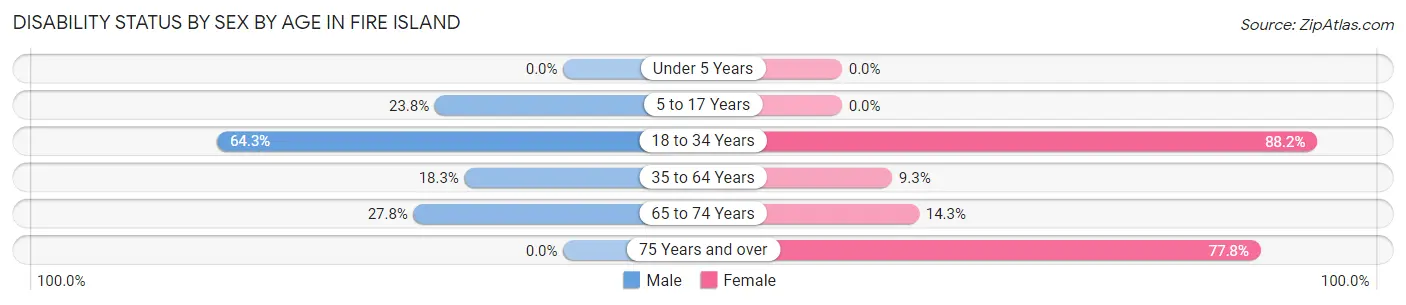
| Age Bracket | Male | Female |
| Under 5 Years | 0 (0.0%) | 0 (0.0%) |
| 5 to 17 Years | 5 (23.8%) | 0 (0.0%) |
| 18 to 34 Years | 9 (64.3%) | 15 (88.2%) |
| 35 to 64 Years | 13 (18.3%) | 8 (9.3%) |
| 65 to 74 Years | 5 (27.8%) | 1 (14.3%) |
| 75 Years and over | 0 (0.0%) | 7 (77.8%) |
Disability Class by Sex by Age in Fire Island
Disability Class: Hearing Difficulty
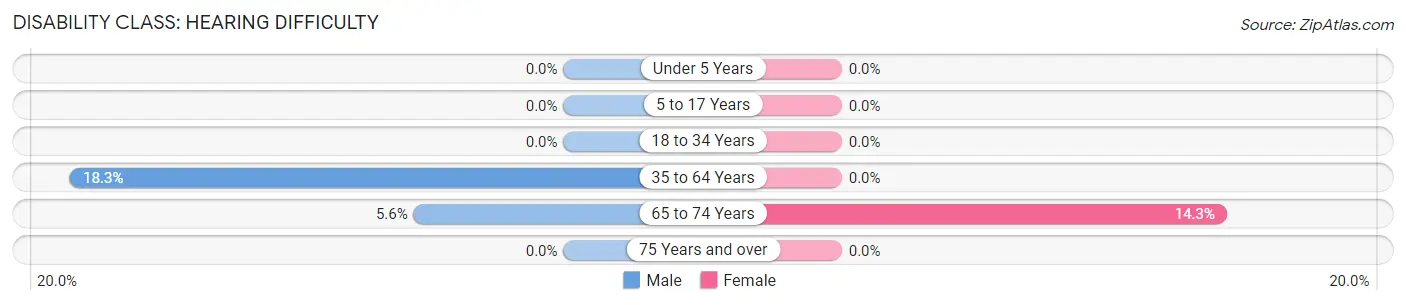
| Age Bracket | Male | Female |
| Under 5 Years | 0 (0.0%) | 0 (0.0%) |
| 5 to 17 Years | 0 (0.0%) | 0 (0.0%) |
| 18 to 34 Years | 0 (0.0%) | 0 (0.0%) |
| 35 to 64 Years | 13 (18.3%) | 0 (0.0%) |
| 65 to 74 Years | 1 (5.6%) | 1 (14.3%) |
| 75 Years and over | 0 (0.0%) | 0 (0.0%) |
Disability Class: Vision Difficulty
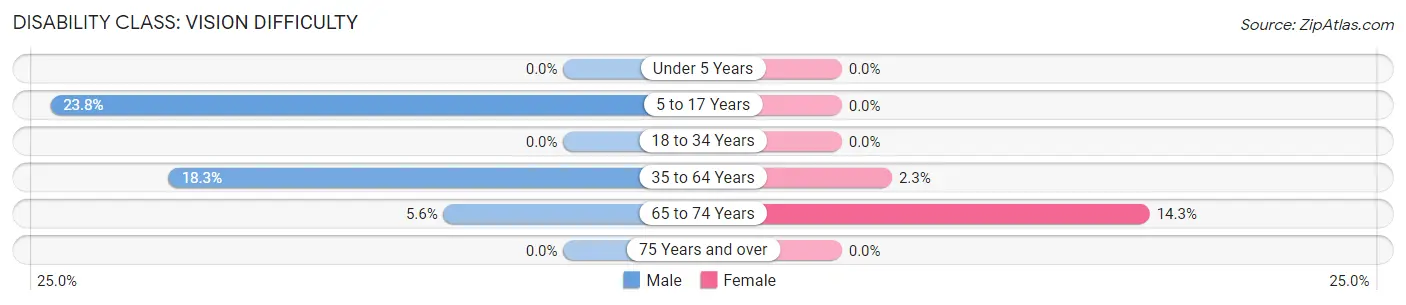
| Age Bracket | Male | Female |
| Under 5 Years | 0 (0.0%) | 0 (0.0%) |
| 5 to 17 Years | 5 (23.8%) | 0 (0.0%) |
| 18 to 34 Years | 0 (0.0%) | 0 (0.0%) |
| 35 to 64 Years | 13 (18.3%) | 2 (2.3%) |
| 65 to 74 Years | 1 (5.6%) | 1 (14.3%) |
| 75 Years and over | 0 (0.0%) | 0 (0.0%) |
Disability Class: Cognitive Difficulty
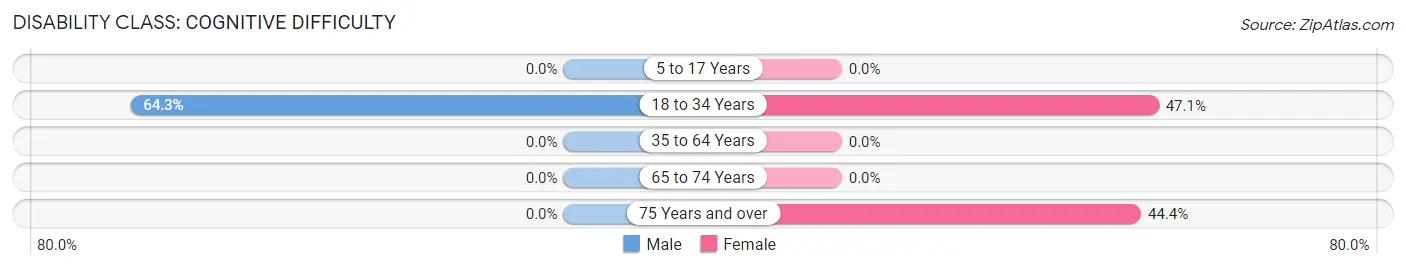
| Age Bracket | Male | Female |
| 5 to 17 Years | 0 (0.0%) | 0 (0.0%) |
| 18 to 34 Years | 9 (64.3%) | 8 (47.1%) |
| 35 to 64 Years | 0 (0.0%) | 0 (0.0%) |
| 65 to 74 Years | 0 (0.0%) | 0 (0.0%) |
| 75 Years and over | 0 (0.0%) | 4 (44.4%) |
Disability Class: Ambulatory Difficulty
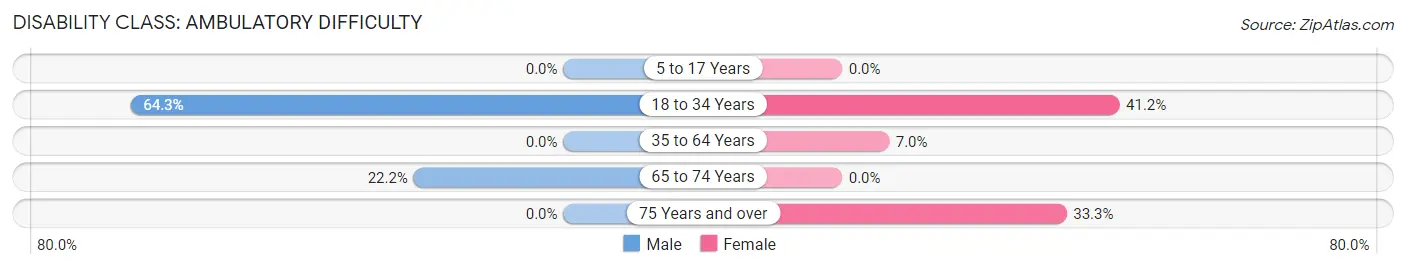
| Age Bracket | Male | Female |
| 5 to 17 Years | 0 (0.0%) | 0 (0.0%) |
| 18 to 34 Years | 9 (64.3%) | 7 (41.2%) |
| 35 to 64 Years | 0 (0.0%) | 6 (7.0%) |
| 65 to 74 Years | 4 (22.2%) | 0 (0.0%) |
| 75 Years and over | 0 (0.0%) | 3 (33.3%) |
Disability Class: Self-Care Difficulty
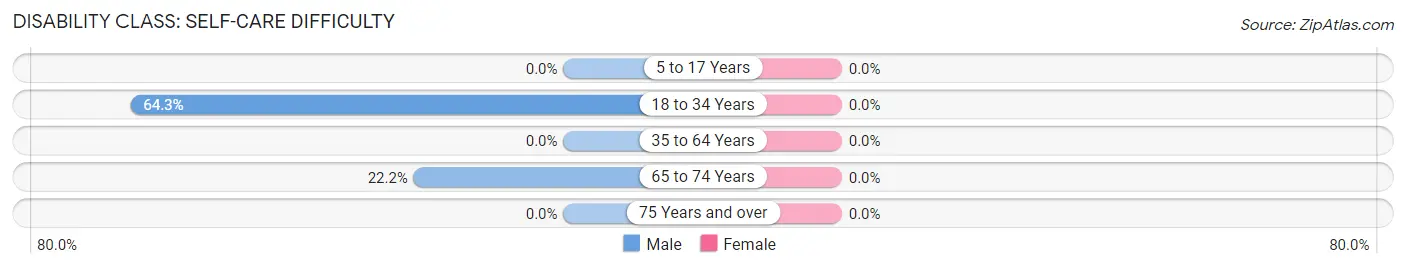
| Age Bracket | Male | Female |
| 5 to 17 Years | 0 (0.0%) | 0 (0.0%) |
| 18 to 34 Years | 9 (64.3%) | 0 (0.0%) |
| 35 to 64 Years | 0 (0.0%) | 0 (0.0%) |
| 65 to 74 Years | 4 (22.2%) | 0 (0.0%) |
| 75 Years and over | 0 (0.0%) | 0 (0.0%) |
Technology Access in Fire Island
Computing Device Access in Fire Island
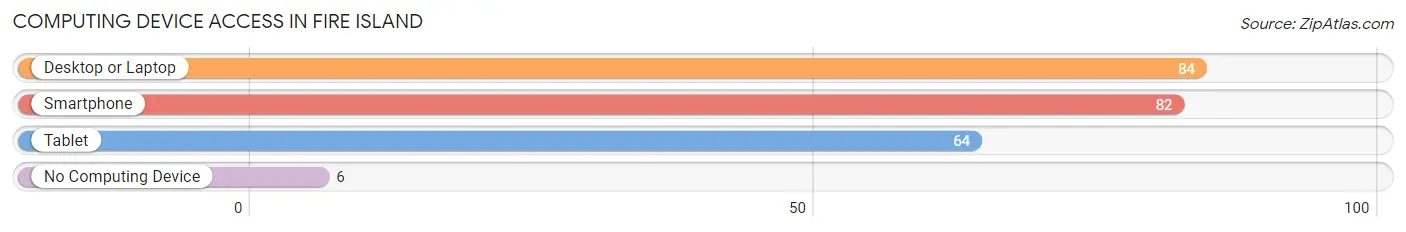
| Device Type | # Households | % Households |
| Desktop or Laptop | 84 | 91.3% |
| Smartphone | 82 | 89.1% |
| Tablet | 64 | 69.6% |
| No Computing Device | 6 | 6.5% |
| Total | 92 | 100.0% |
Internet Access in Fire Island
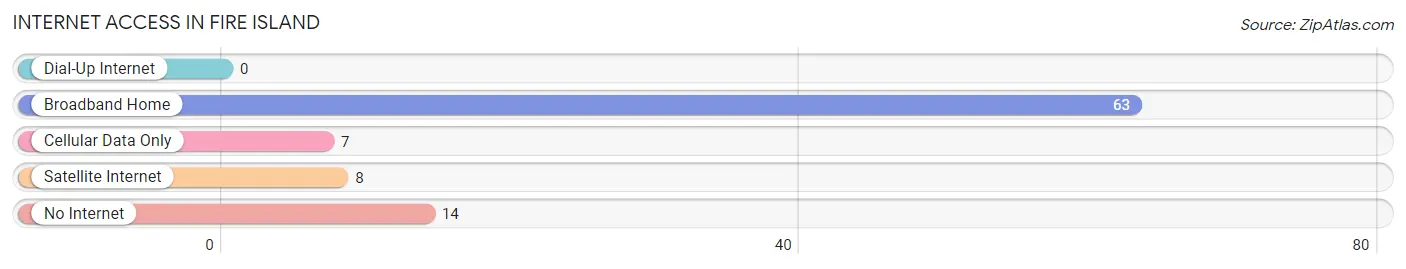
| Internet Type | # Households | % Households |
| Dial-Up Internet | 0 | 0.0% |
| Broadband Home | 63 | 68.5% |
| Cellular Data Only | 7 | 7.6% |
| Satellite Internet | 8 | 8.7% |
| No Internet | 14 | 15.2% |
| Total | 92 | 100.0% |
Fire Island Summary
History
The history of Fire Island, New York dates back to the 1600s when the area was inhabited by the Secatogue Indians. The Secatogue Indians were a part of the Algonquin Nation and were known for their fishing and hunting skills. The Secatogue Indians were eventually displaced by the English settlers in the late 1600s. The English settlers named the area Fire Island due to the abundance of wild fires that were seen in the area.
In the 1700s, Fire Island was used as a base for the British Navy during the American Revolution. The British Navy used the island as a staging area for their attacks on Long Island and New York City. After the war, Fire Island was used as a base for the United States Navy during the War of 1812.
In the 1800s, Fire Island became a popular destination for vacationers. The island was known for its beautiful beaches and its abundance of wildlife. The island was also home to a number of resorts and hotels.
In the 1900s, Fire Island became a popular destination for the wealthy. The island was home to a number of luxurious resorts and hotels. The island was also home to a number of exclusive clubs and restaurants.
In the 1950s, Fire Island became a popular destination for the LGBT community. The island was home to a number of gay bars and clubs. The island was also home to a number of LGBT-friendly resorts and hotels.
In the 1960s, Fire Island became a popular destination for the hippie movement. The island was home to a number of hippie communes and was known for its laid-back atmosphere.
In the 1970s, Fire Island became a popular destination for the punk rock movement. The island was home to a number of punk rock clubs and was known for its rebellious atmosphere.
In the 1980s, Fire Island became a popular destination for the yuppie movement. The island was home to a number of upscale restaurants and bars and was known for its trendy atmosphere.
In the 1990s, Fire Island became a popular destination for the hip-hop movement. The island was home to a number of hip-hop clubs and was known for its urban atmosphere.
Geography
Fire Island is located off the south shore of Long Island, New York. The island is approximately 31 miles long and varies in width from 0.5 miles to 2.5 miles. The island is separated from the mainland by the Great South Bay.
The island is composed of a number of barrier islands, including Davis Park, Ocean Beach, Kismet, Fair Harbor, Ocean Bay Park, and Saltaire. The island is home to a number of beaches, including Fire Island National Seashore, Robert Moses State Park, and Smith Point County Park.
The island is home to a number of lighthouses, including the Fire Island Lighthouse, the Robert Moses State Park Lighthouse, and the Smith Point County Park Lighthouse.
Economy
The economy of Fire Island is largely based on tourism. The island is home to a number of resorts and hotels, as well as a number of restaurants and bars. The island is also home to a number of retail stores, including souvenir shops and clothing stores.
The island is also home to a number of marinas, which provide services to boaters and fishermen. The island is also home to a number of charter fishing boats, which provide fishing trips to visitors.
Demographics
As of the 2010 census, the population of Fire Island was 1,567. The population is largely composed of white (90.2%) and Hispanic (7.2%) individuals. The median age of the population is 44.7 years.
The median household income of Fire Island is $68,750. The median home value is $717,500. The median rent is $1,500.
Conclusion
Fire Island, New York is a popular destination for vacationers and is known for its beautiful beaches and its abundance of wildlife. The island is home to a number of resorts and hotels, as well as a number of restaurants and bars. The island is also home to a number of marinas, which provide services to boaters and fishermen. The population of Fire Island is largely composed of white and Hispanic individuals, with a median age of 44.7 years. The median household income of Fire Island is $68,750 and the median home value is $717,500.
Common Questions
What is Per Capita Income in Fire Island?
Per Capita income in Fire Island is $50,928.
What is the Median Family Income in Fire Island?
Median Family Income in Fire Island is $115,192.
What is the Median Household income in Fire Island?
Median Household Income in Fire Island is $108,750.
What is Income or Wage Gap in Fire Island?
Income or Wage Gap in Fire Island is 43.7%.
Women in Fire Island earn 56.3 cents for every dollar earned by a man.
What is Inequality or Gini Index in Fire Island?
Inequality or Gini Index in Fire Island is 0.44.
What is the Total Population of Fire Island?
Total Population of Fire Island is 298.
What is the Total Male Population of Fire Island?
Total Male Population of Fire Island is 149.
What is the Total Female Population of Fire Island?
Total Female Population of Fire Island is 149.
What is the Ratio of Males per 100 Females in Fire Island?
There are 100.00 Males per 100 Females in Fire Island.
What is the Ratio of Females per 100 Males in Fire Island?
There are 100.00 Females per 100 Males in Fire Island.
What is the Median Population Age in Fire Island?
Median Population Age in Fire Island is 48.1 Years.
What is the Average Family Size in Fire Island
Average Family Size in Fire Island is 3.5 People.
What is the Average Household Size in Fire Island
Average Household Size in Fire Island is 3.2 People.
How Large is the Labor Force in Fire Island?
There are 175 People in the Labor Forcein in Fire Island.
What is the Percentage of People in the Labor Force in Fire Island?
71.1% of People are in the Labor Force in Fire Island.