Jefferson Heights, NY Map & Demographics
Jefferson Heights Map
Jefferson Heights Overview
$23,819
PER CAPITA INCOME
$79,250
AVG FAMILY INCOME
$66,023
AVG HOUSEHOLD INCOME
12.3%
WAGE / INCOME GAP [ % ]
87.7¢/ $1
WAGE / INCOME GAP [ $ ]
0.32
INEQUALITY / GINI INDEX
1,435
TOTAL POPULATION
506
MALE POPULATION
929
FEMALE POPULATION
54.47
MALES / 100 FEMALES
183.60
FEMALES / 100 MALES
50.1
MEDIAN AGE
3.4
AVG FAMILY SIZE
2.5
AVG HOUSEHOLD SIZE
528
LABOR FORCE [ PEOPLE ]
50.0%
PERCENT IN LABOR FORCE
1.9%
UNEMPLOYMENT RATE
Income in Jefferson Heights
Income Overview in Jefferson Heights
Per Capita Income in Jefferson Heights is $23,819, while median incomes of families and households are $79,250 and $66,023 respectively.
| Characteristic | Number | Measure |
| Per Capita Income | 1,435 | $23,819 |
| Median Family Income | 298 | $79,250 |
| Mean Family Income | 298 | $85,132 |
| Median Household Income | 469 | $66,023 |
| Mean Household Income | 469 | $68,755 |
| Income Deficit | 298 | $0 |
| Wage / Income Gap (%) | 1,435 | 12.31% |
| Wage / Income Gap ($) | 1,435 | 87.69¢ per $1 |
| Gini / Inequality Index | 1,435 | 0.32 |
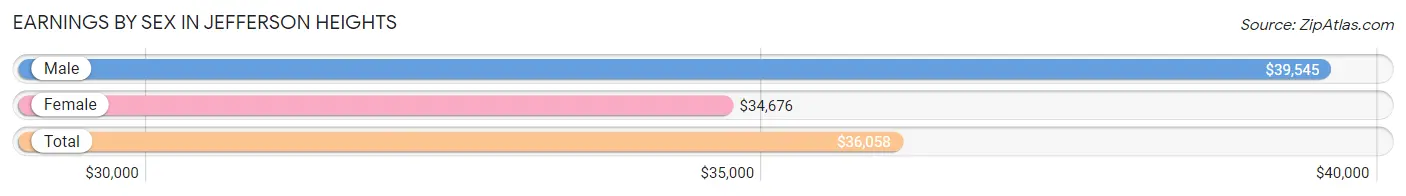
Earnings by Sex in Jefferson Heights
Average Earnings in Jefferson Heights are $36,058, $39,545 for men and $34,676 for women, a difference of 12.3%.
| Sex | Number | Average Earnings |
| Male | 176 (33.5%) | $39,545 |
| Female | 349 (66.5%) | $34,676 |
| Total | 525 (100.0%) | $36,058 |
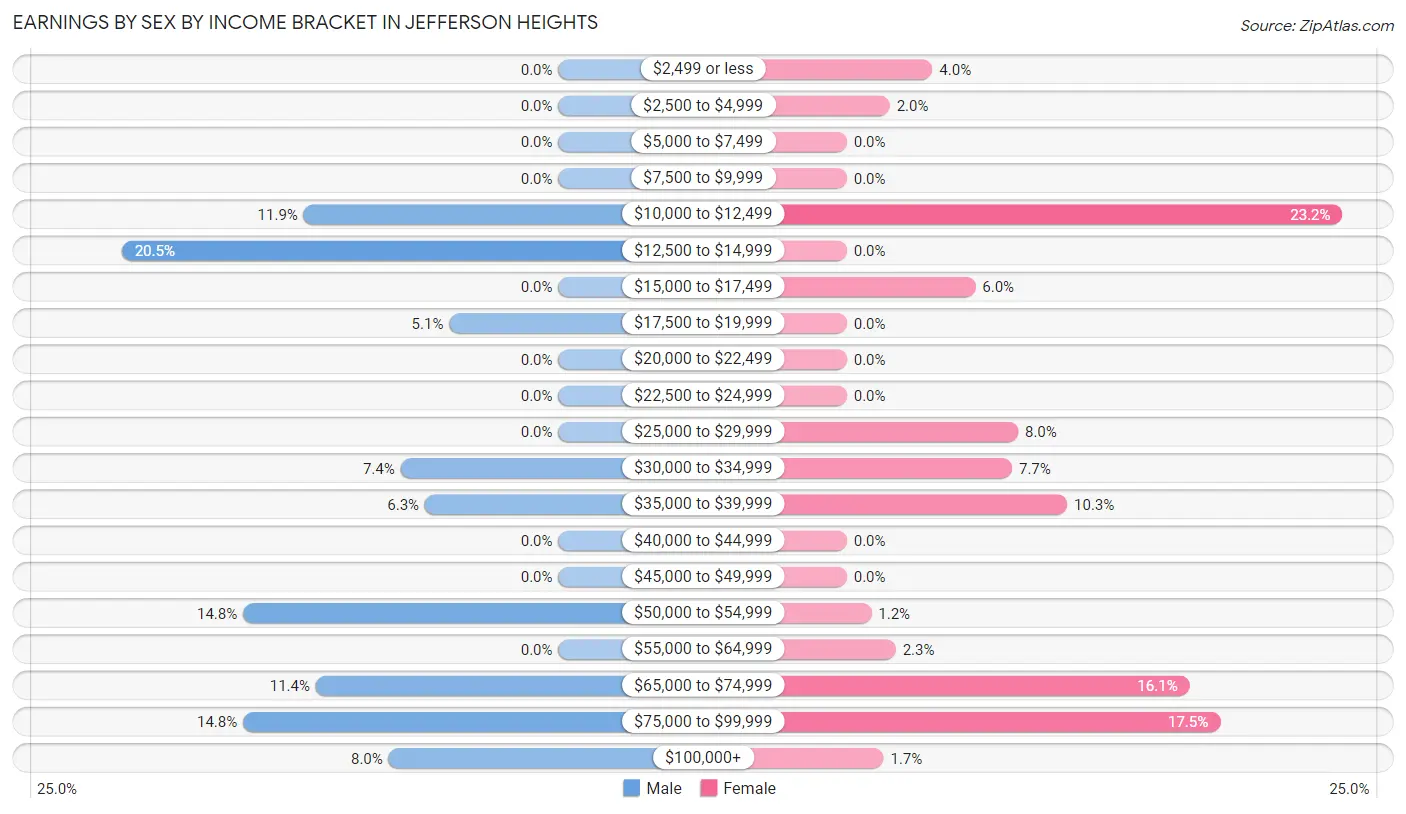
Earnings by Sex by Income Bracket in Jefferson Heights
The most common earnings brackets in Jefferson Heights are $12,500 to $14,999 for men (36 | 20.4%) and $10,000 to $12,499 for women (81 | 23.2%).
| Income | Male | Female |
| $2,499 or less | 0 (0.0%) | 14 (4.0%) |
| $2,500 to $4,999 | 0 (0.0%) | 7 (2.0%) |
| $5,000 to $7,499 | 0 (0.0%) | 0 (0.0%) |
| $7,500 to $9,999 | 0 (0.0%) | 0 (0.0%) |
| $10,000 to $12,499 | 21 (11.9%) | 81 (23.2%) |
| $12,500 to $14,999 | 36 (20.4%) | 0 (0.0%) |
| $15,000 to $17,499 | 0 (0.0%) | 21 (6.0%) |
| $17,500 to $19,999 | 9 (5.1%) | 0 (0.0%) |
| $20,000 to $22,499 | 0 (0.0%) | 0 (0.0%) |
| $22,500 to $24,999 | 0 (0.0%) | 0 (0.0%) |
| $25,000 to $29,999 | 0 (0.0%) | 28 (8.0%) |
| $30,000 to $34,999 | 13 (7.4%) | 27 (7.7%) |
| $35,000 to $39,999 | 11 (6.2%) | 36 (10.3%) |
| $40,000 to $44,999 | 0 (0.0%) | 0 (0.0%) |
| $45,000 to $49,999 | 0 (0.0%) | 0 (0.0%) |
| $50,000 to $54,999 | 26 (14.8%) | 4 (1.1%) |
| $55,000 to $64,999 | 0 (0.0%) | 8 (2.3%) |
| $65,000 to $74,999 | 20 (11.4%) | 56 (16.1%) |
| $75,000 to $99,999 | 26 (14.8%) | 61 (17.5%) |
| $100,000+ | 14 (8.0%) | 6 (1.7%) |
| Total | 176 (100.0%) | 349 (100.0%) |
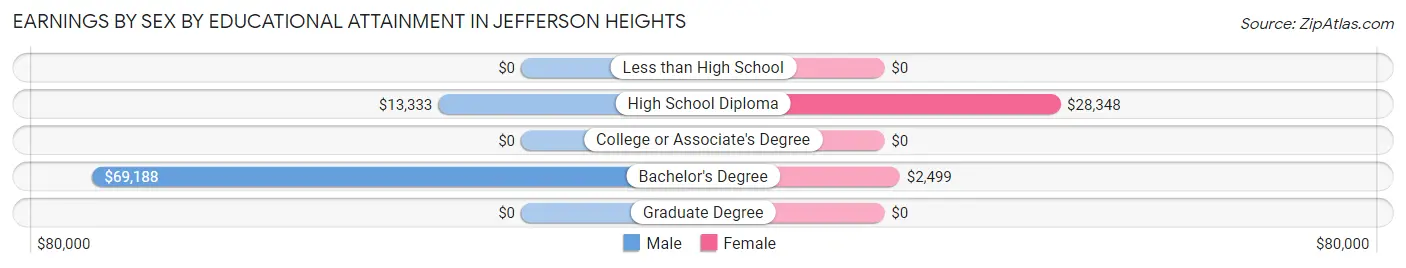
Earnings by Sex by Educational Attainment in Jefferson Heights
Average earnings in Jefferson Heights are $39,545 for men and $34,398 for women, a difference of 13.0%. Men with an educational attainment of bachelor's degree enjoy the highest average annual earnings of $69,188, while those with high school diploma education earn the least with $13,333. Women with an educational attainment of high school diploma earn the most with the average annual earnings of $28,348, while those with bachelor's degree education have the smallest earnings of $2,499.
| Educational Attainment | Male Income | Female Income |
| Less than High School | - | - |
| High School Diploma | $13,333 | $28,348 |
| College or Associate's Degree | - | - |
| Bachelor's Degree | $69,188 | $2,499 |
| Graduate Degree | - | - |
| Total | $39,545 | $34,398 |
Family Income in Jefferson Heights
Family Income Brackets in Jefferson Heights
According to the Jefferson Heights family income data, there are 99 families falling into the $75,000 to $99,999 income range, which is the most common income bracket and makes up 33.2% of all families.
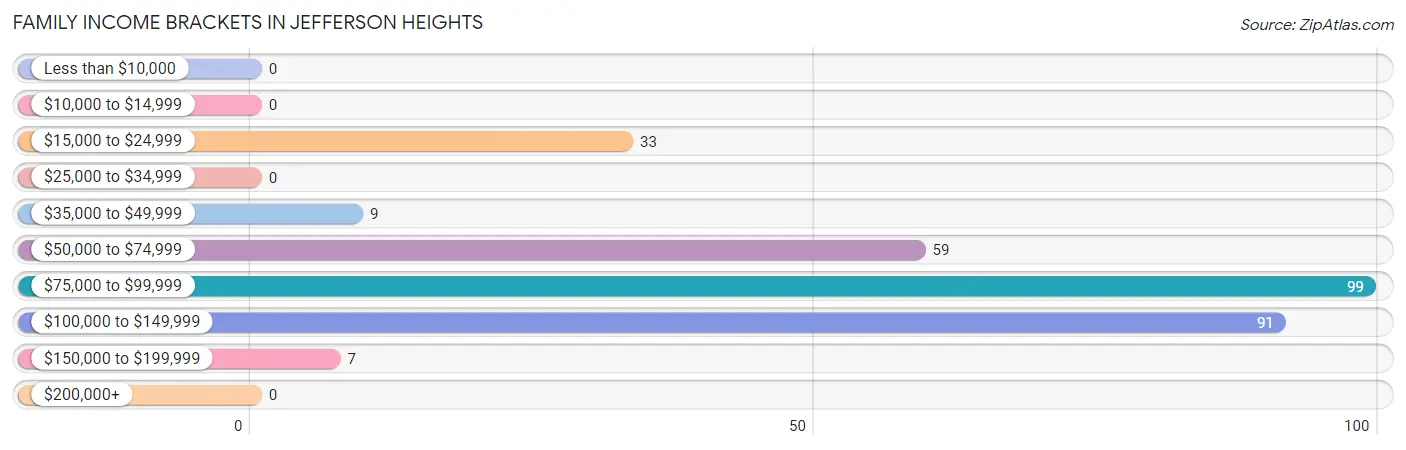
| Income Bracket | # Families | % Families |
| Less than $10,000 | 0 | 0.0% |
| $10,000 to $14,999 | 0 | 0.0% |
| $15,000 to $24,999 | 33 | 11.1% |
| $25,000 to $34,999 | 0 | 0.0% |
| $35,000 to $49,999 | 9 | 3.0% |
| $50,000 to $74,999 | 59 | 19.8% |
| $75,000 to $99,999 | 99 | 33.2% |
| $100,000 to $149,999 | 91 | 30.5% |
| $150,000 to $199,999 | 7 | 2.3% |
| $200,000+ | 0 | 0.0% |
Family Income by Famaliy Size in Jefferson Heights
2-person families (88 | 29.5%) account for the highest median family income in Jefferson Heights with $123,145 per family, while 2-person families (88 | 29.5%) have the highest median income of $61,572 per family member.
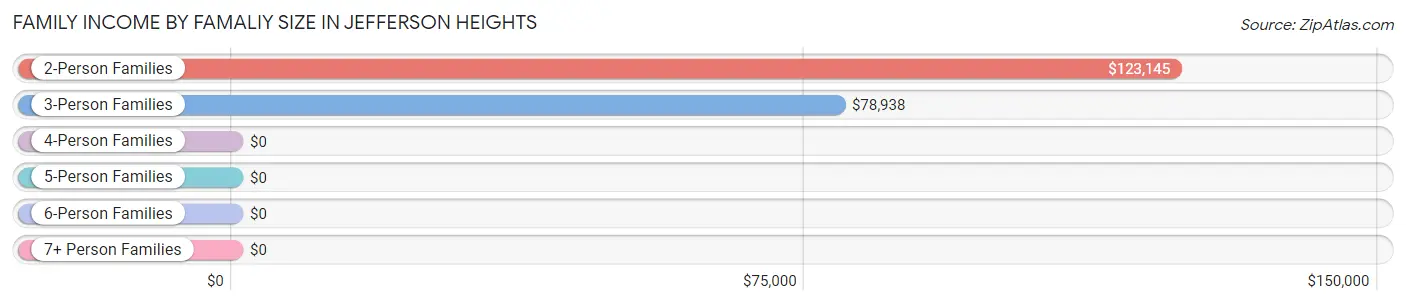
| Income Bracket | # Families | Median Income |
| 2-Person Families | 88 (29.5%) | $123,145 |
| 3-Person Families | 86 (28.9%) | $78,938 |
| 4-Person Families | 65 (21.8%) | $0 |
| 5-Person Families | 0 (0.0%) | $0 |
| 6-Person Families | 59 (19.8%) | $0 |
| 7+ Person Families | 0 (0.0%) | $0 |
| Total | 298 (100.0%) | $79,250 |
Family Income by Number of Earners in Jefferson Heights
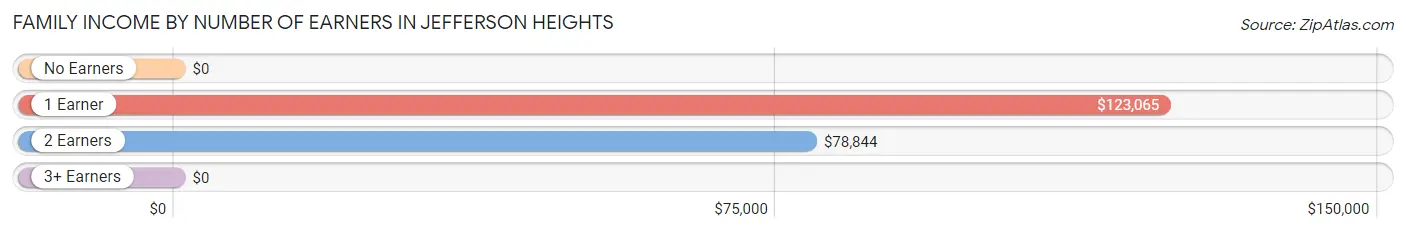
| Number of Earners | # Families | Median Income |
| No Earners | 40 (13.4%) | $0 |
| 1 Earner | 48 (16.1%) | $123,065 |
| 2 Earners | 201 (67.4%) | $78,844 |
| 3+ Earners | 9 (3.0%) | $0 |
| Total | 298 (100.0%) | $79,250 |
Household Income in Jefferson Heights
Household Income Brackets in Jefferson Heights
With 119 households falling in the category, the $50,000 to $74,999 income range is the most frequent in Jefferson Heights, accounting for 25.4% of all households.
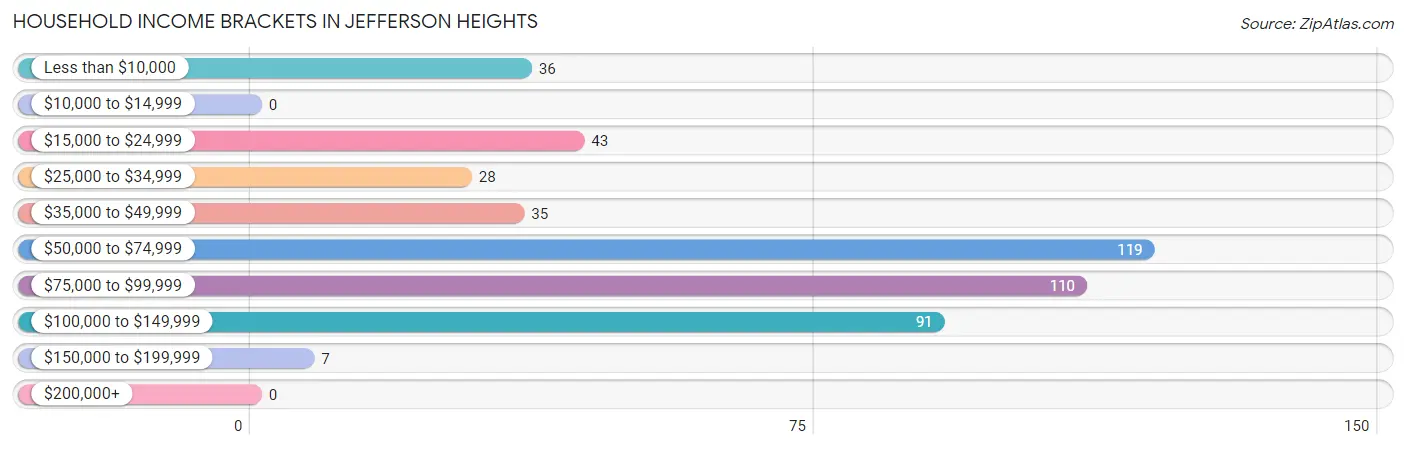
| Income Bracket | # Households | % Households |
| Less than $10,000 | 36 | 7.7% |
| $10,000 to $14,999 | 0 | 0.0% |
| $15,000 to $24,999 | 43 | 9.2% |
| $25,000 to $34,999 | 28 | 6.0% |
| $35,000 to $49,999 | 35 | 7.5% |
| $50,000 to $74,999 | 119 | 25.4% |
| $75,000 to $99,999 | 110 | 23.5% |
| $100,000 to $149,999 | 91 | 19.4% |
| $150,000 to $199,999 | 7 | 1.5% |
| $200,000+ | 0 | 0.0% |
Household Income by Householder Age in Jefferson Heights
The median household income in Jefferson Heights is $66,023, with the highest median household income of $76,813 found in the 45 to 64 years age bracket for the primary householder. A total of 185 households (39.5%) fall into this category. Meanwhile, the 15 to 24 years age bracket for the primary householder has the lowest median household income of $0, with 33 households (7.0%) in this group.
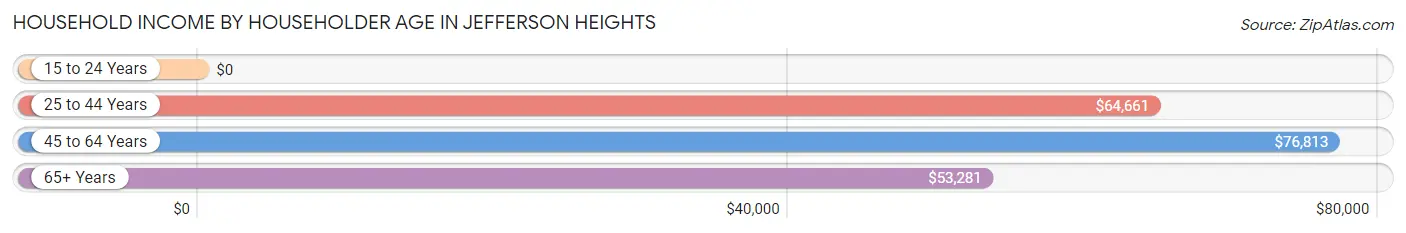
| Income Bracket | # Households | Median Income |
| 15 to 24 Years | 33 (7.0%) | $0 |
| 25 to 44 Years | 102 (21.7%) | $64,661 |
| 45 to 64 Years | 185 (39.5%) | $76,813 |
| 65+ Years | 149 (31.8%) | $53,281 |
| Total | 469 (100.0%) | $66,023 |
Poverty in Jefferson Heights
Income Below Poverty by Sex and Age in Jefferson Heights
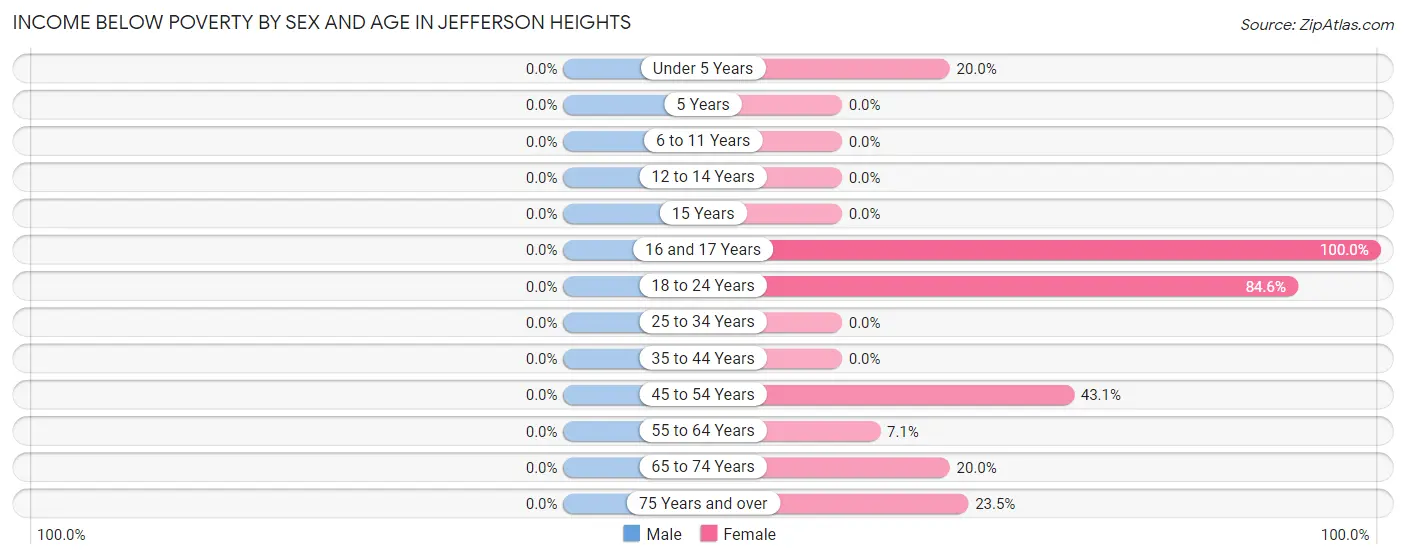
| Age Bracket | Male | Female |
| Under 5 Years | 0 (0.0%) | 29 (20.0%) |
| 5 Years | 0 (0.0%) | 0 (0.0%) |
| 6 to 11 Years | 0 (0.0%) | 0 (0.0%) |
| 12 to 14 Years | 0 (0.0%) | 0 (0.0%) |
| 15 Years | 0 (0.0%) | 0 (0.0%) |
| 16 and 17 Years | 0 (0.0%) | 11 (100.0%) |
| 18 to 24 Years | 0 (0.0%) | 33 (84.6%) |
| 25 to 34 Years | 0 (0.0%) | 0 (0.0%) |
| 35 to 44 Years | 0 (0.0%) | 0 (0.0%) |
| 45 to 54 Years | 0 (0.0%) | 31 (43.1%) |
| 55 to 64 Years | 0 (0.0%) | 12 (7.1%) |
| 65 to 74 Years | 0 (0.0%) | 7 (20.0%) |
| 75 Years and over | 0 (0.0%) | 19 (23.5%) |
| Total | 0 (0.0%) | 142 (18.1%) |
Income Above Poverty by Sex and Age in Jefferson Heights
According to the poverty statistics in Jefferson Heights, males aged under 5 years and females aged 5 years are the age groups that are most secure financially, with 100.0% of males and 100.0% of females in these age groups living above the poverty line.
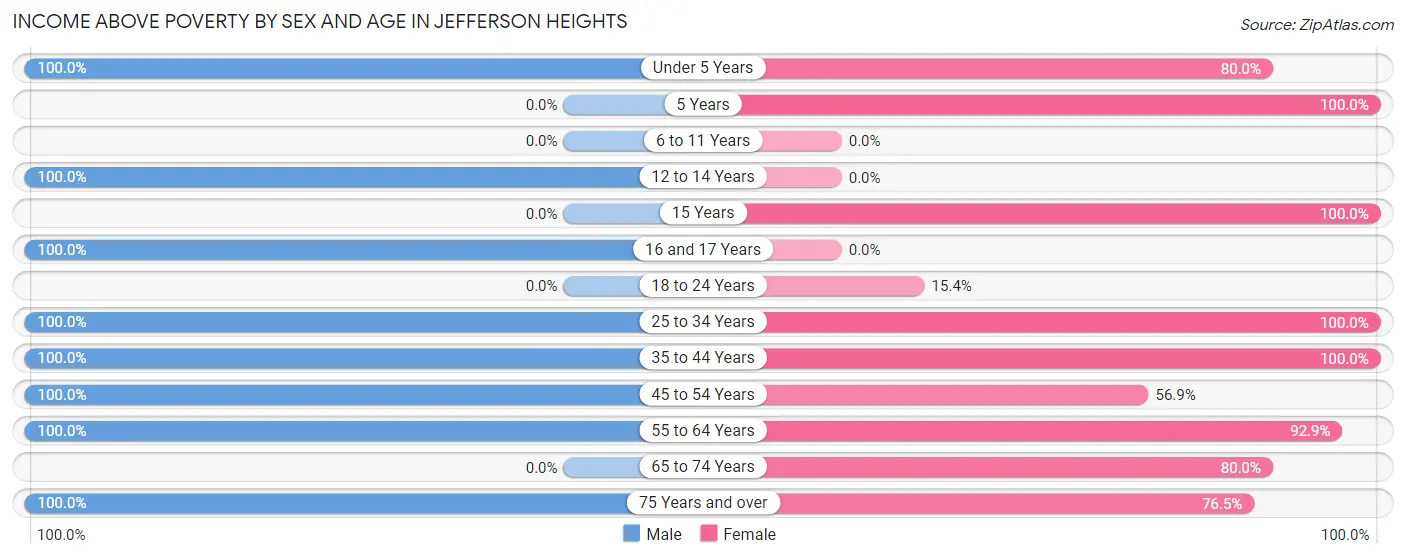
| Age Bracket | Male | Female |
| Under 5 Years | 51 (100.0%) | 116 (80.0%) |
| 5 Years | 0 (0.0%) | 43 (100.0%) |
| 6 to 11 Years | 0 (0.0%) | 0 (0.0%) |
| 12 to 14 Years | 61 (100.0%) | 0 (0.0%) |
| 15 Years | 0 (0.0%) | 67 (100.0%) |
| 16 and 17 Years | 16 (100.0%) | 0 (0.0%) |
| 18 to 24 Years | 0 (0.0%) | 6 (15.4%) |
| 25 to 34 Years | 52 (100.0%) | 108 (100.0%) |
| 35 to 44 Years | 14 (100.0%) | 16 (100.0%) |
| 45 to 54 Years | 78 (100.0%) | 41 (56.9%) |
| 55 to 64 Years | 63 (100.0%) | 157 (92.9%) |
| 65 to 74 Years | 0 (0.0%) | 28 (80.0%) |
| 75 Years and over | 68 (100.0%) | 62 (76.5%) |
| Total | 403 (100.0%) | 644 (81.9%) |
Income Below Poverty Among Married-Couple Families in Jefferson Heights
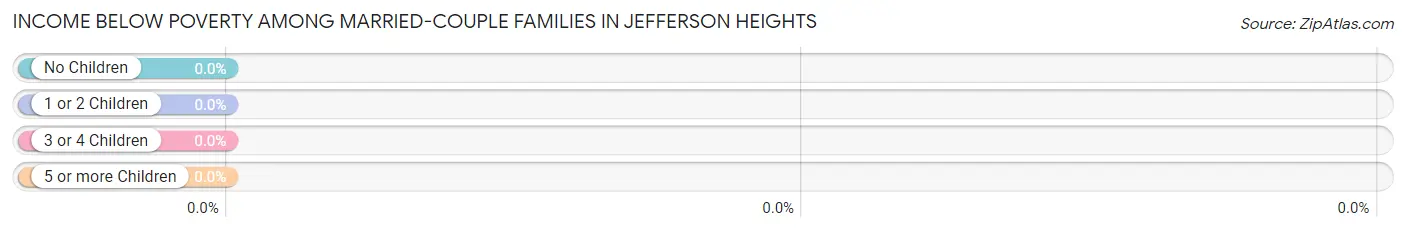
| Children | Above Poverty | Below Poverty |
| No Children | 50 (100.0%) | 0 (0.0%) |
| 1 or 2 Children | 101 (100.0%) | 0 (0.0%) |
| 3 or 4 Children | 59 (100.0%) | 0 (0.0%) |
| 5 or more Children | 0 (0.0%) | 0 (0.0%) |
| Total | 210 (100.0%) | 0 (0.0%) |
Income Below Poverty Among Single-Parent Households in Jefferson Heights
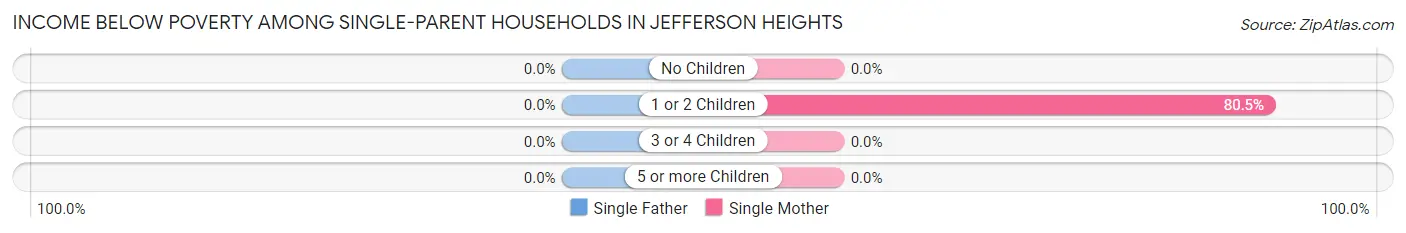
| Children | Single Father | Single Mother |
| No Children | 0 (0.0%) | 0 (0.0%) |
| 1 or 2 Children | 0 (0.0%) | 33 (80.5%) |
| 3 or 4 Children | 0 (0.0%) | 0 (0.0%) |
| 5 or more Children | 0 (0.0%) | 0 (0.0%) |
| Total | 0 (0.0%) | 33 (68.8%) |
Income Below Poverty Among Married-Couple vs Single-Parent Households in Jefferson Heights
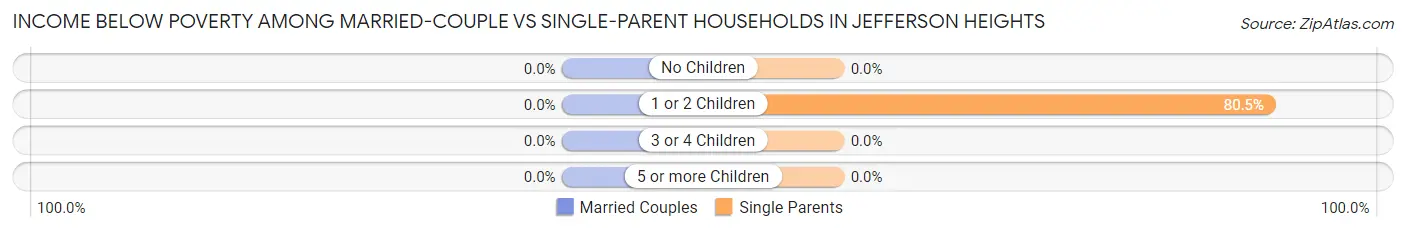
| Children | Married-Couple Families | Single-Parent Households |
| No Children | 0 (0.0%) | 0 (0.0%) |
| 1 or 2 Children | 0 (0.0%) | 33 (80.5%) |
| 3 or 4 Children | 0 (0.0%) | 0 (0.0%) |
| 5 or more Children | 0 (0.0%) | 0 (0.0%) |
| Total | 0 (0.0%) | 33 (37.5%) |
Race in Jefferson Heights
The most populous races in Jefferson Heights are White / Caucasian (1,010 | 70.4%), Hispanic or Latino (355 | 24.7%), and Black / African American (244 | 17.0%).
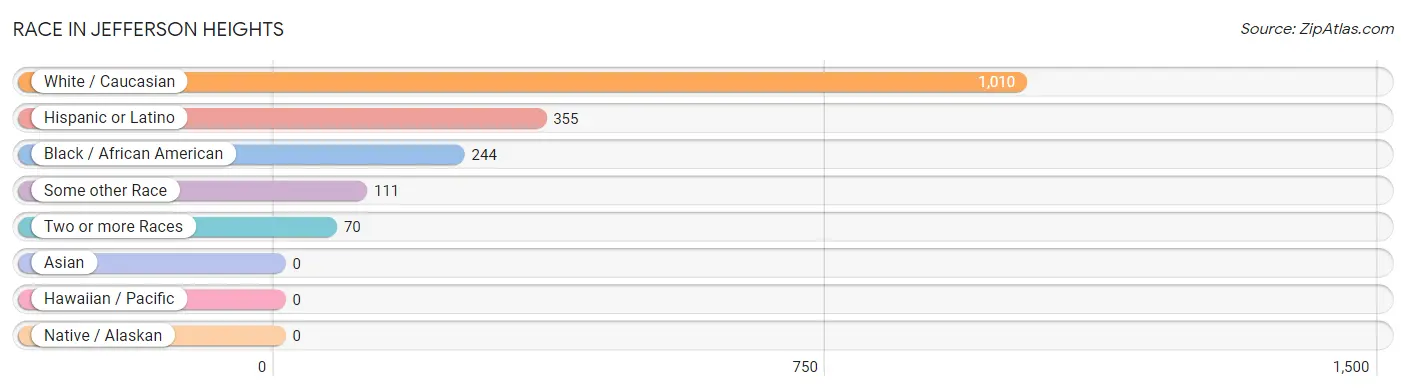
| Race | # Population | % Population |
| Asian | 0 | 0.0% |
| Black / African American | 244 | 17.0% |
| Hawaiian / Pacific | 0 | 0.0% |
| Hispanic or Latino | 355 | 24.7% |
| Native / Alaskan | 0 | 0.0% |
| White / Caucasian | 1,010 | 70.4% |
| Two or more Races | 70 | 4.9% |
| Some other Race | 111 | 7.7% |
| Total | 1,435 | 100.0% |
Ancestry in Jefferson Heights
The most populous ancestries reported in Jefferson Heights are Irish (330 | 23.0%), German (285 | 19.9%), Puerto Rican (277 | 19.3%), Nigerian (199 | 13.9%), and Subsaharan African (199 | 13.9%), together accounting for 89.9% of all Jefferson Heights residents.
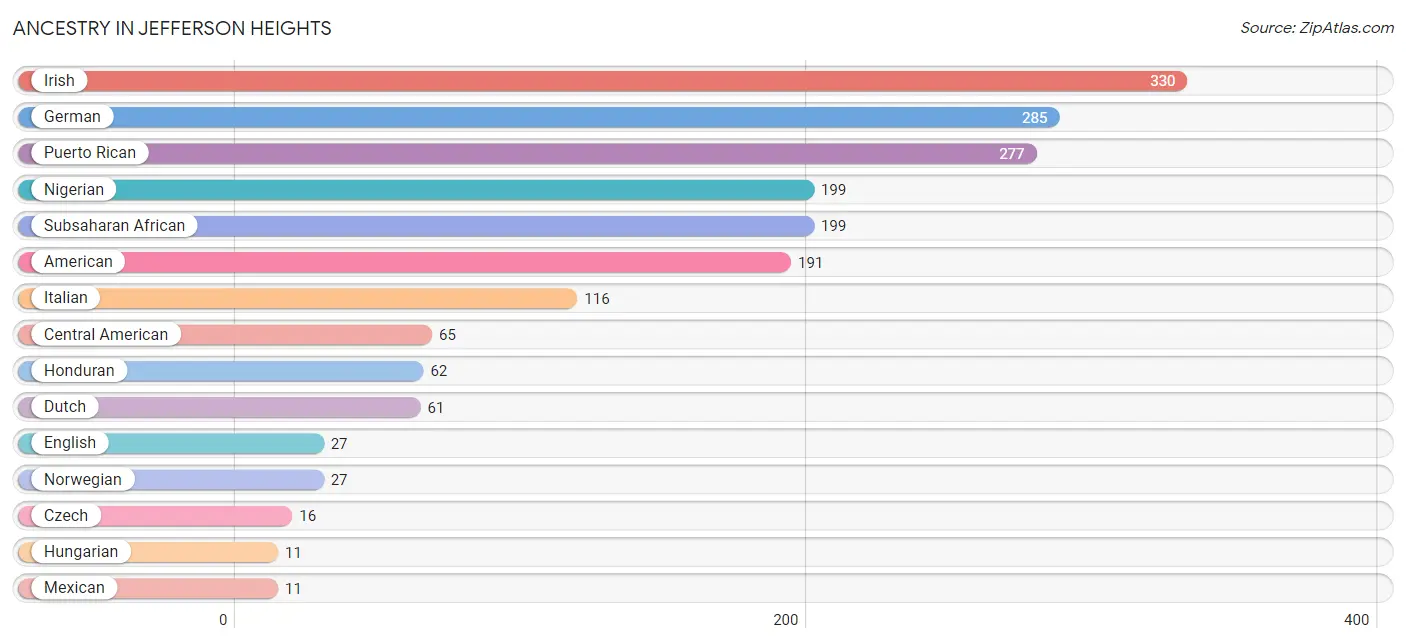
| Ancestry | # Population | % Population |
| American | 191 | 13.3% |
| Central American | 65 | 4.5% |
| Czech | 16 | 1.1% |
| Dominican | 2 | 0.1% |
| Dutch | 61 | 4.3% |
| English | 27 | 1.9% |
| German | 285 | 19.9% |
| Honduran | 62 | 4.3% |
| Hungarian | 11 | 0.8% |
| Irish | 330 | 23.0% |
| Italian | 116 | 8.1% |
| Mexican | 11 | 0.8% |
| Nigerian | 199 | 13.9% |
| Norwegian | 27 | 1.9% |
| Puerto Rican | 277 | 19.3% |
| Salvadoran | 3 | 0.2% |
| Scottish | 6 | 0.4% |
| Subsaharan African | 199 | 13.9% | View All 18 Rows |
Immigrants in Jefferson Heights
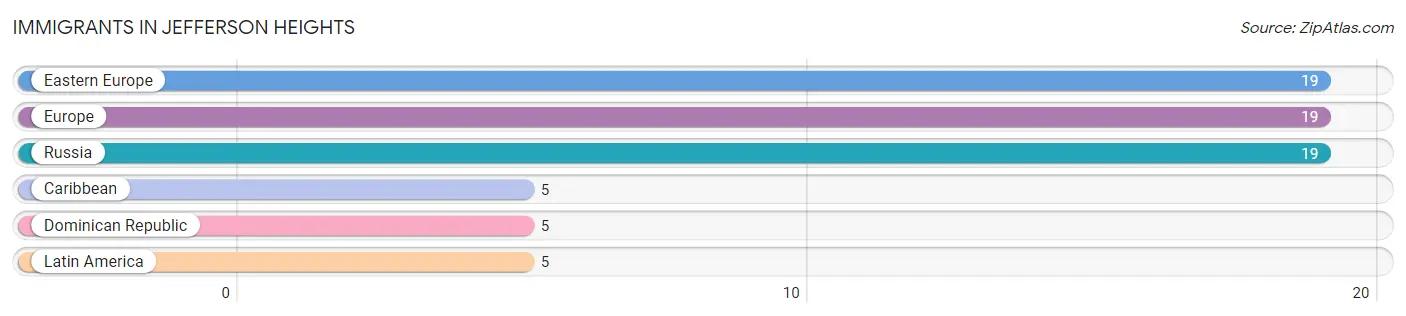
The most numerous immigrant groups reported in Jefferson Heights came from Eastern Europe (19 | 1.3%), Europe (19 | 1.3%), Russia (19 | 1.3%), Caribbean (5 | 0.4%), and Dominican Republic (5 | 0.4%), together accounting for 4.7% of all Jefferson Heights residents.
| Immigration Origin | # Population | % Population |
| Caribbean | 5 | 0.4% |
| Dominican Republic | 5 | 0.4% |
| Eastern Europe | 19 | 1.3% |
| Europe | 19 | 1.3% |
| Latin America | 5 | 0.4% |
| Russia | 19 | 1.3% | View All 6 Rows |
Sex and Age in Jefferson Heights
Sex and Age in Jefferson Heights
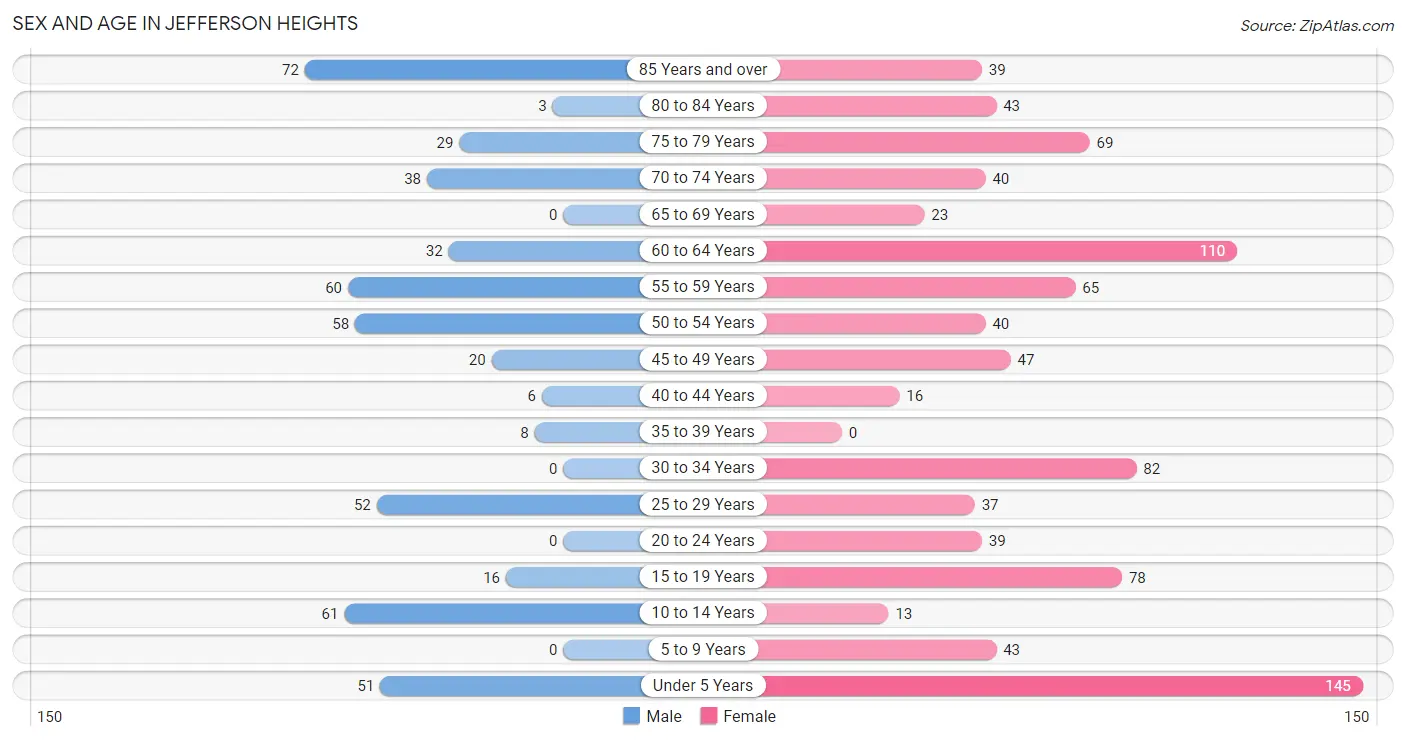
The most populous age groups in Jefferson Heights are 85 Years and over (72 | 14.2%) for men and Under 5 Years (145 | 15.6%) for women.
| Age Bracket | Male | Female |
| Under 5 Years | 51 (10.1%) | 145 (15.6%) |
| 5 to 9 Years | 0 (0.0%) | 43 (4.6%) |
| 10 to 14 Years | 61 (12.1%) | 13 (1.4%) |
| 15 to 19 Years | 16 (3.2%) | 78 (8.4%) |
| 20 to 24 Years | 0 (0.0%) | 39 (4.2%) |
| 25 to 29 Years | 52 (10.3%) | 37 (4.0%) |
| 30 to 34 Years | 0 (0.0%) | 82 (8.8%) |
| 35 to 39 Years | 8 (1.6%) | 0 (0.0%) |
| 40 to 44 Years | 6 (1.2%) | 16 (1.7%) |
| 45 to 49 Years | 20 (4.0%) | 47 (5.1%) |
| 50 to 54 Years | 58 (11.5%) | 40 (4.3%) |
| 55 to 59 Years | 60 (11.9%) | 65 (7.0%) |
| 60 to 64 Years | 32 (6.3%) | 110 (11.8%) |
| 65 to 69 Years | 0 (0.0%) | 23 (2.5%) |
| 70 to 74 Years | 38 (7.5%) | 40 (4.3%) |
| 75 to 79 Years | 29 (5.7%) | 69 (7.4%) |
| 80 to 84 Years | 3 (0.6%) | 43 (4.6%) |
| 85 Years and over | 72 (14.2%) | 39 (4.2%) |
| Total | 506 (100.0%) | 929 (100.0%) |
Families and Households in Jefferson Heights
Median Family Size in Jefferson Heights
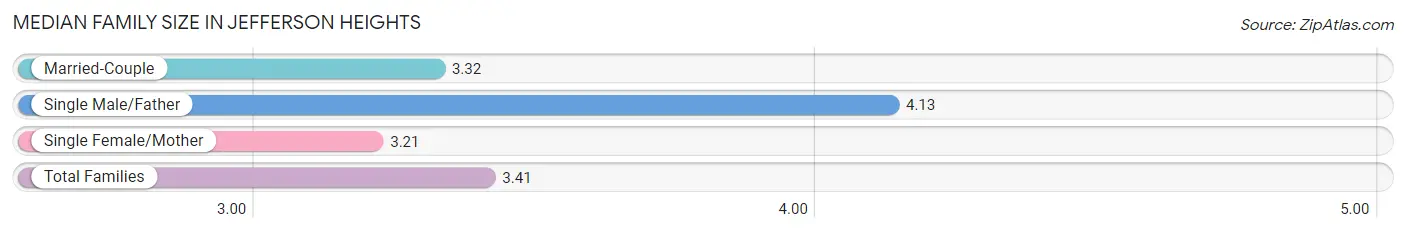
The median family size in Jefferson Heights is 3.41 persons per family, with single male/father families (40 | 13.4%) accounting for the largest median family size of 4.13 persons per family. On the other hand, single female/mother families (48 | 16.1%) represent the smallest median family size with 3.21 persons per family.
| Family Type | # Families | Family Size |
| Married-Couple | 210 (70.5%) | 3.32 |
| Single Male/Father | 40 (13.4%) | 4.13 |
| Single Female/Mother | 48 (16.1%) | 3.21 |
| Total Families | 298 (100.0%) | 3.41 |
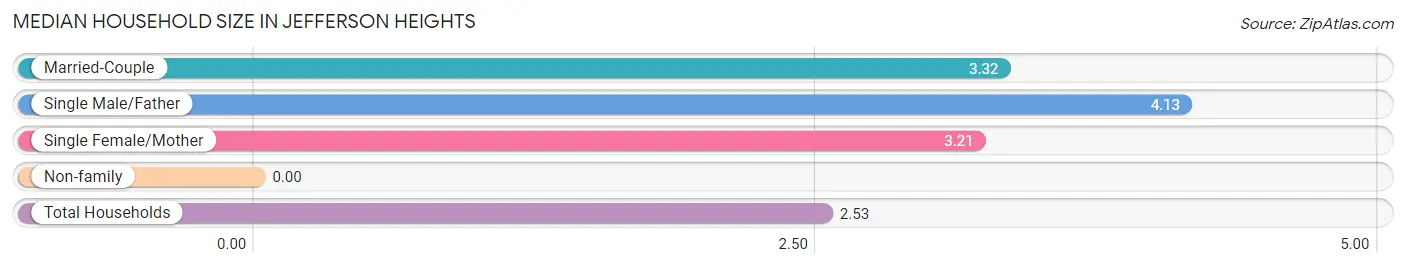
Median Household Size in Jefferson Heights
| Household Type | # Households | Household Size |
| Married-Couple | 210 (44.8%) | 3.32 |
| Single Male/Father | 40 (8.5%) | 4.13 |
| Single Female/Mother | 48 (10.2%) | 3.21 |
| Non-family | 171 (36.5%) | - |
| Total Households | 469 (100.0%) | 2.53 |
Household Size by Marriage Status in Jefferson Heights
Out of a total of 469 households in Jefferson Heights, 298 (63.5%) are family households, while 171 (36.5%) are nonfamily households. The most numerous type of family households are 2-person households, comprising 88, and the most common type of nonfamily households are 1-person households, comprising 171.
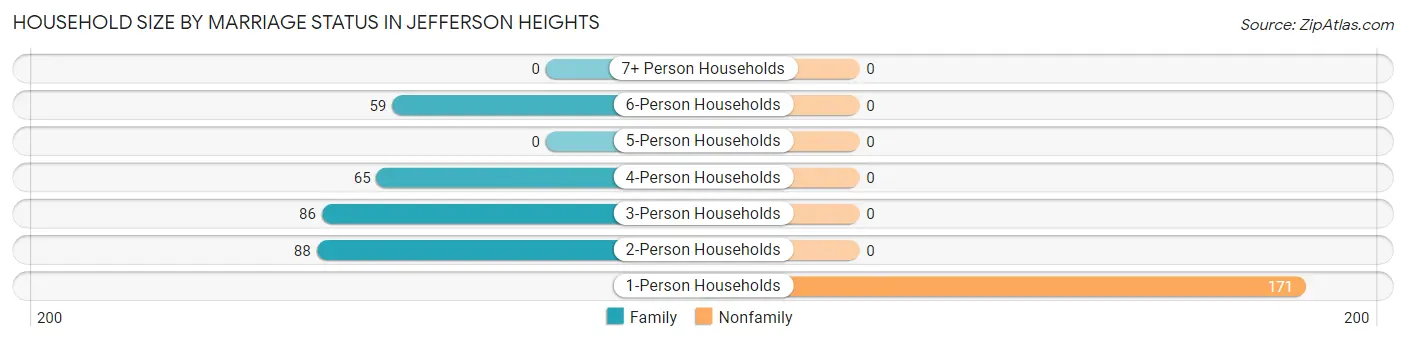
| Household Size | Family Households | Nonfamily Households |
| 1-Person Households | - | 171 (36.5%) |
| 2-Person Households | 88 (18.8%) | 0 (0.0%) |
| 3-Person Households | 86 (18.3%) | 0 (0.0%) |
| 4-Person Households | 65 (13.9%) | 0 (0.0%) |
| 5-Person Households | 0 (0.0%) | 0 (0.0%) |
| 6-Person Households | 59 (12.6%) | 0 (0.0%) |
| 7+ Person Households | 0 (0.0%) | 0 (0.0%) |
| Total | 298 (63.5%) | 171 (36.5%) |
Female Fertility in Jefferson Heights
Fertility by Age in Jefferson Heights
| Age Bracket | Women with Births | Births / 1,000 Women |
| 15 to 19 years | 0 (0.0%) | 0.0 |
| 20 to 34 years | 0 (0.0%) | 0.0 |
| 35 to 50 years | 0 (0.0%) | 0.0 |
| Total | 0 (0.0%) | 0.0 |
Fertility by Age by Marriage Status in Jefferson Heights
| Age Bracket | Married | Unmarried |
| 15 to 19 years | 0 (0.0%) | 0 (0.0%) |
| 20 to 34 years | 0 (0.0%) | 0 (0.0%) |
| 35 to 50 years | 0 (0.0%) | 0 (0.0%) |
| Total | 0 (0.0%) | 0 (0.0%) |
Fertility by Education in Jefferson Heights
| Educational Attainment | Women with Births | Births / 1,000 Women |
| Less than High School | 0 (0.0%) | 0.0 |
| High School Diploma | 0 (0.0%) | 0.0 |
| College or Associate's Degree | 0 (0.0%) | 0.0 |
| Bachelor's Degree | 0 (0.0%) | 0.0 |
| Graduate Degree | 0 (0.0%) | 0.0 |
| Total | 0 (0.0%) | 0.0 |
Fertility by Education by Marriage Status in Jefferson Heights
| Educational Attainment | Married | Unmarried |
| Less than High School | 0 (0.0%) | 0 (0.0%) |
| High School Diploma | 0 (0.0%) | 0 (0.0%) |
| College or Associate's Degree | 0 (0.0%) | 0 (0.0%) |
| Bachelor's Degree | 0 (0.0%) | 0 (0.0%) |
| Graduate Degree | 0 (0.0%) | 0 (0.0%) |
| Total | 0 (0.0%) | 0 (0.0%) |
Employment Characteristics in Jefferson Heights
Employment by Class of Employer in Jefferson Heights
Among the 518 employed individuals in Jefferson Heights, private company employees (213 | 41.1%), state government employees (95 | 18.3%), and self-employed (not incorporated) (84 | 16.2%) make up the most common classes of employment.
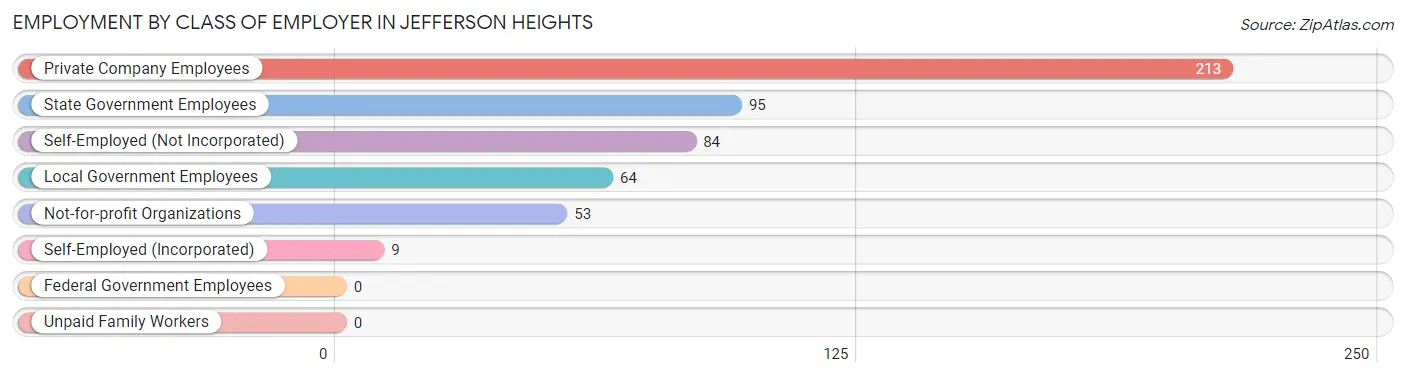
| Employer Class | # Employees | % Employees |
| Private Company Employees | 213 | 41.1% |
| Self-Employed (Incorporated) | 9 | 1.7% |
| Self-Employed (Not Incorporated) | 84 | 16.2% |
| Not-for-profit Organizations | 53 | 10.2% |
| Local Government Employees | 64 | 12.4% |
| State Government Employees | 95 | 18.3% |
| Federal Government Employees | 0 | 0.0% |
| Unpaid Family Workers | 0 | 0.0% |
| Total | 518 | 100.0% |
Employment Status by Age in Jefferson Heights
According to the labor force statistics for Jefferson Heights, out of the total population over 16 years of age (1,055), 50.0% or 528 individuals are in the labor force, with 1.9% or 10 of them unemployed. The age group with the highest labor force participation rate is 30 to 34 years, with 100.0% or 82 individuals in the labor force. Within the labor force, the 55 to 59 years age range has the highest percentage of unemployed individuals, with 12.8% or 10 of them being unemployed.
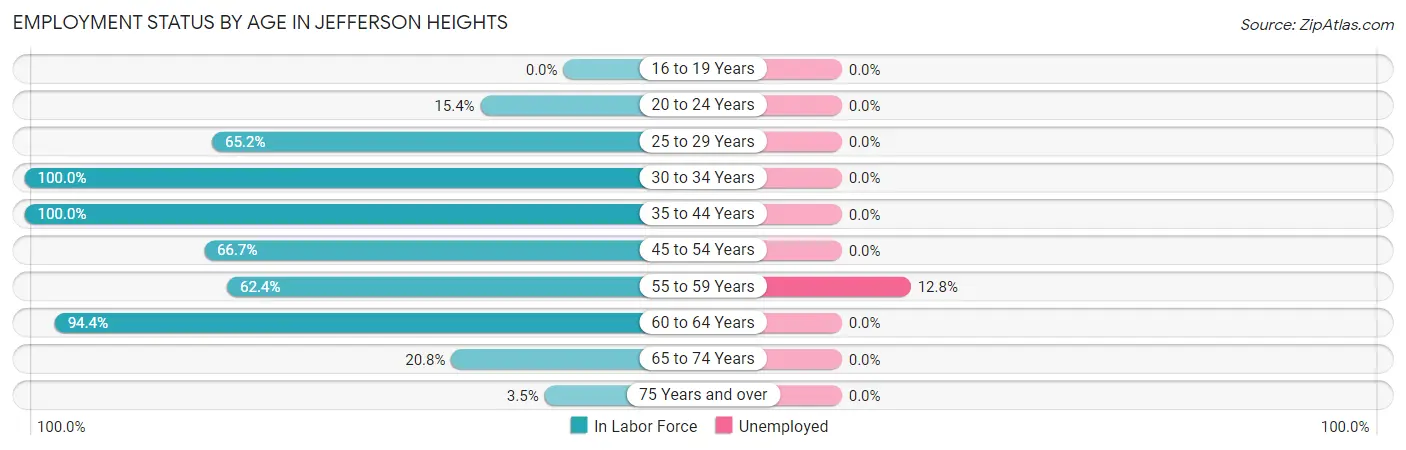
| Age Bracket | In Labor Force | Unemployed |
| 16 to 19 Years | 0 (0.0%) | 0 (0.0%) |
| 20 to 24 Years | 6 (15.4%) | 0 (0.0%) |
| 25 to 29 Years | 58 (65.2%) | 0 (0.0%) |
| 30 to 34 Years | 82 (100.0%) | 0 (0.0%) |
| 35 to 44 Years | 30 (100.0%) | 0 (0.0%) |
| 45 to 54 Years | 110 (66.7%) | 0 (0.0%) |
| 55 to 59 Years | 78 (62.4%) | 10 (12.8%) |
| 60 to 64 Years | 134 (94.4%) | 0 (0.0%) |
| 65 to 74 Years | 21 (20.8%) | 0 (0.0%) |
| 75 Years and over | 9 (3.5%) | 0 (0.0%) |
| Total | 528 (50.0%) | 10 (1.9%) |
Employment Status by Educational Attainment in Jefferson Heights
According to labor force statistics for Jefferson Heights, 77.7% of individuals (492) out of the total population between 25 and 64 years of age (633) are in the labor force, with 2.0% or 10 of them being unemployed. The group with the highest labor force participation rate are those with the educational attainment of bachelor's degree or higher, with 100.0% or 130 individuals in the labor force. Within the labor force, individuals with high school diploma education have the highest percentage of unemployment, with 7.7% or 10 of them being unemployed.
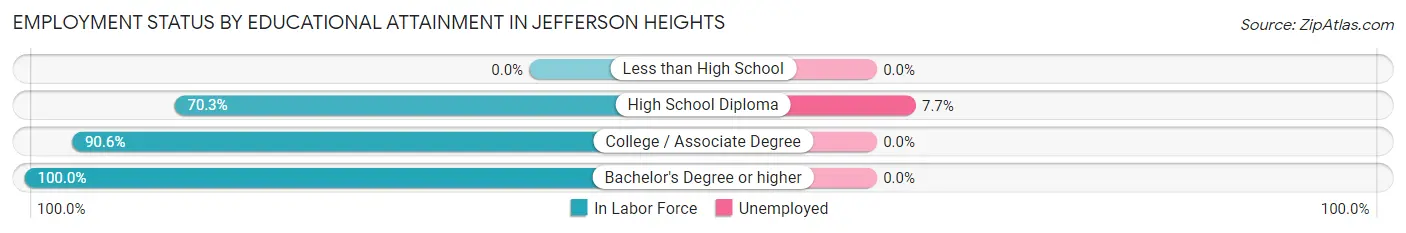
| Educational Attainment | In Labor Force | Unemployed |
| Less than High School | 0 (0.0%) | 0 (0.0%) |
| High School Diploma | 130 (70.3%) | 14 (7.7%) |
| College / Associate Degree | 232 (90.6%) | 0 (0.0%) |
| Bachelor's Degree or higher | 130 (100.0%) | 0 (0.0%) |
| Total | 492 (77.7%) | 13 (2.0%) |
Employment Occupations by Sex in Jefferson Heights
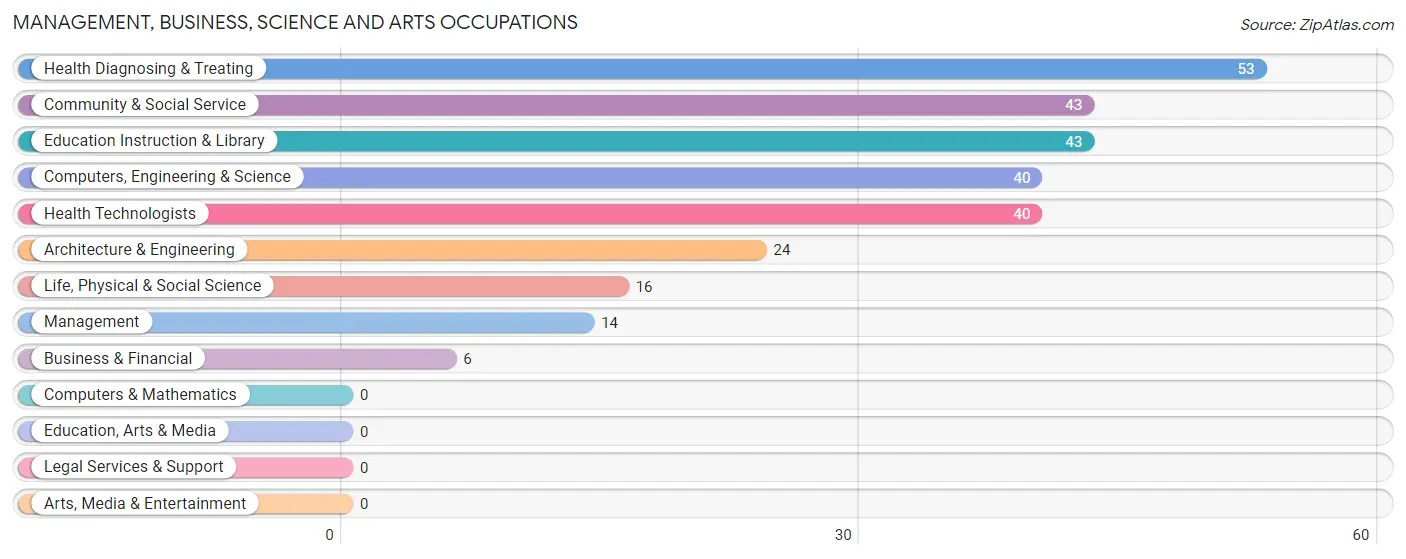
Management, Business, Science and Arts Occupations
The most common Management, Business, Science and Arts occupations in Jefferson Heights are Health Diagnosing & Treating (53 | 10.2%), Community & Social Service (43 | 8.3%), Education Instruction & Library (43 | 8.3%), Computers, Engineering & Science (40 | 7.7%), and Health Technologists (40 | 7.7%).
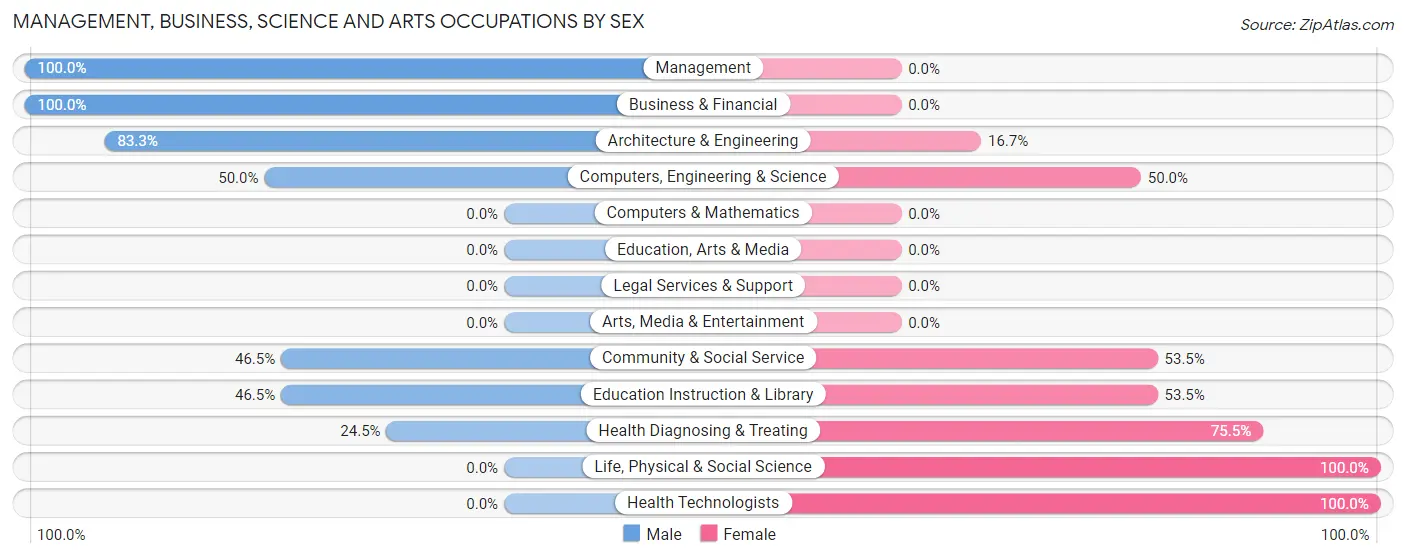
Management, Business, Science and Arts Occupations by Sex
Within the Management, Business, Science and Arts occupations in Jefferson Heights, the most male-oriented occupations are Management (100.0%), Business & Financial (100.0%), and Architecture & Engineering (83.3%), while the most female-oriented occupations are Life, Physical & Social Science (100.0%), Health Technologists (100.0%), and Health Diagnosing & Treating (75.5%).
| Occupation | Male | Female |
| Management | 14 (100.0%) | 0 (0.0%) |
| Business & Financial | 6 (100.0%) | 0 (0.0%) |
| Computers, Engineering & Science | 20 (50.0%) | 20 (50.0%) |
| Computers & Mathematics | 0 (0.0%) | 0 (0.0%) |
| Architecture & Engineering | 20 (83.3%) | 4 (16.7%) |
| Life, Physical & Social Science | 0 (0.0%) | 16 (100.0%) |
| Community & Social Service | 20 (46.5%) | 23 (53.5%) |
| Education, Arts & Media | 0 (0.0%) | 0 (0.0%) |
| Legal Services & Support | 0 (0.0%) | 0 (0.0%) |
| Education Instruction & Library | 20 (46.5%) | 23 (53.5%) |
| Arts, Media & Entertainment | 0 (0.0%) | 0 (0.0%) |
| Health Diagnosing & Treating | 13 (24.5%) | 40 (75.5%) |
| Health Technologists | 0 (0.0%) | 40 (100.0%) |
| Total (Category) | 73 (46.8%) | 83 (53.2%) |
| Total (Overall) | 176 (34.0%) | 342 (66.0%) |
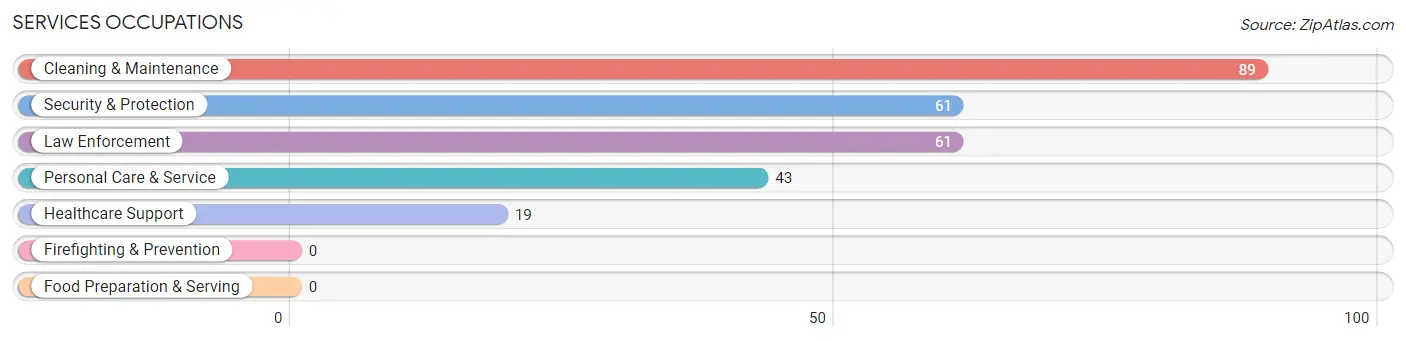
Services Occupations
The most common Services occupations in Jefferson Heights are Cleaning & Maintenance (89 | 17.2%), Security & Protection (61 | 11.8%), Law Enforcement (61 | 11.8%), Personal Care & Service (43 | 8.3%), and Healthcare Support (19 | 3.7%).
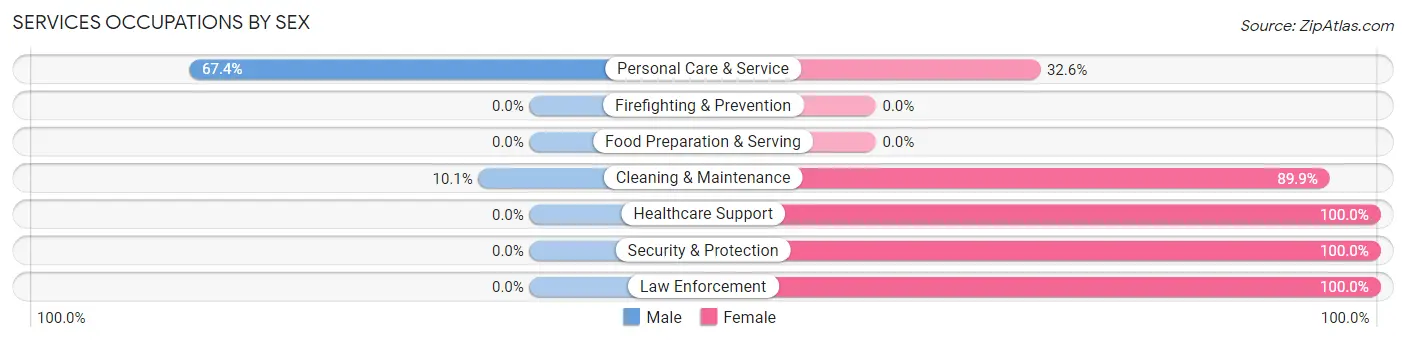
Services Occupations by Sex
Within the Services occupations in Jefferson Heights, the most male-oriented occupations are Personal Care & Service (67.4%), and Cleaning & Maintenance (10.1%), while the most female-oriented occupations are Healthcare Support (100.0%), Security & Protection (100.0%), and Law Enforcement (100.0%).
| Occupation | Male | Female |
| Healthcare Support | 0 (0.0%) | 19 (100.0%) |
| Security & Protection | 0 (0.0%) | 61 (100.0%) |
| Firefighting & Prevention | 0 (0.0%) | 0 (0.0%) |
| Law Enforcement | 0 (0.0%) | 61 (100.0%) |
| Food Preparation & Serving | 0 (0.0%) | 0 (0.0%) |
| Cleaning & Maintenance | 9 (10.1%) | 80 (89.9%) |
| Personal Care & Service | 29 (67.4%) | 14 (32.6%) |
| Total (Category) | 38 (17.9%) | 174 (82.1%) |
| Total (Overall) | 176 (34.0%) | 342 (66.0%) |
Sales and Office Occupations
The most common Sales and Office occupations in Jefferson Heights are Office & Administration (56 | 10.8%), and Sales & Related (36 | 7.0%).
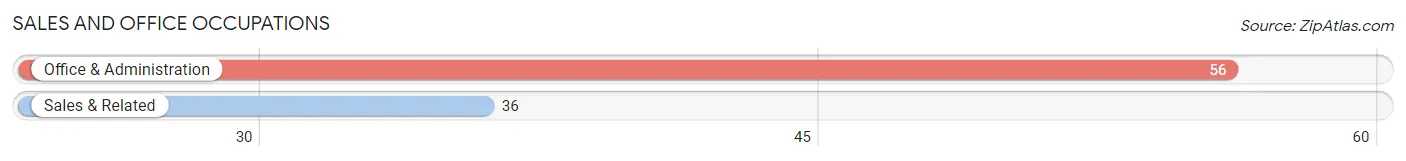
Sales and Office Occupations by Sex
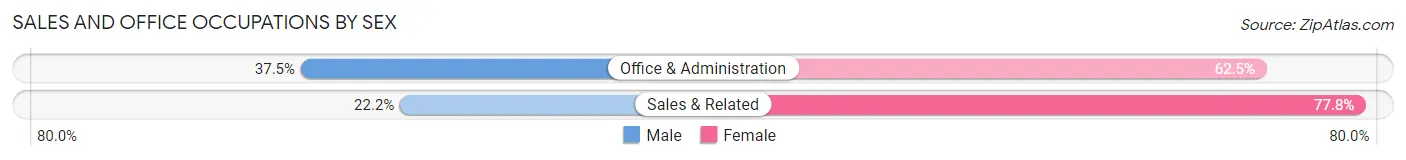
| Occupation | Male | Female |
| Sales & Related | 8 (22.2%) | 28 (77.8%) |
| Office & Administration | 21 (37.5%) | 35 (62.5%) |
| Total (Category) | 29 (31.5%) | 63 (68.5%) |
| Total (Overall) | 176 (34.0%) | 342 (66.0%) |
Natural Resources, Construction and Maintenance Occupations
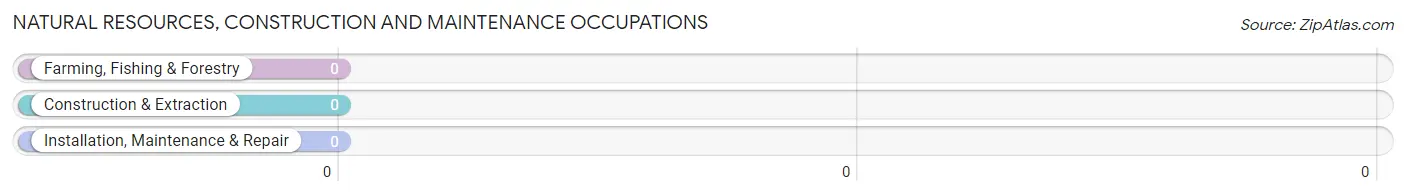
Natural Resources, Construction and Maintenance Occupations by Sex
| Occupation | Male | Female |
| Farming, Fishing & Forestry | 0 (0.0%) | 0 (0.0%) |
| Construction & Extraction | 0 (0.0%) | 0 (0.0%) |
| Installation, Maintenance & Repair | 0 (0.0%) | 0 (0.0%) |
| Total (Category) | 0 (0.0%) | 0 (0.0%) |
| Total (Overall) | 176 (34.0%) | 342 (66.0%) |
Production, Transportation and Moving Occupations
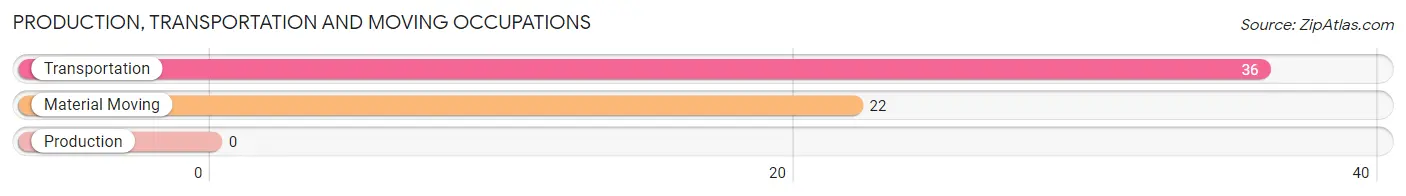
The most common Production, Transportation and Moving occupations in Jefferson Heights are Transportation (36 | 7.0%), and Material Moving (22 | 4.3%).
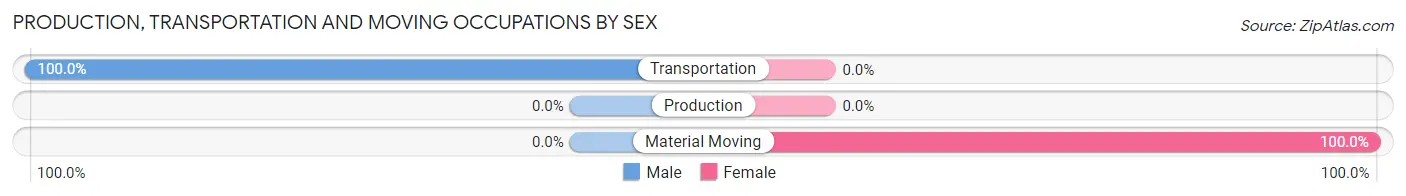
Production, Transportation and Moving Occupations by Sex
| Occupation | Male | Female |
| Production | 0 (0.0%) | 0 (0.0%) |
| Transportation | 36 (100.0%) | 0 (0.0%) |
| Material Moving | 0 (0.0%) | 22 (100.0%) |
| Total (Category) | 36 (62.1%) | 22 (37.9%) |
| Total (Overall) | 176 (34.0%) | 342 (66.0%) |
Employment Industries by Sex in Jefferson Heights
Employment Industries in Jefferson Heights
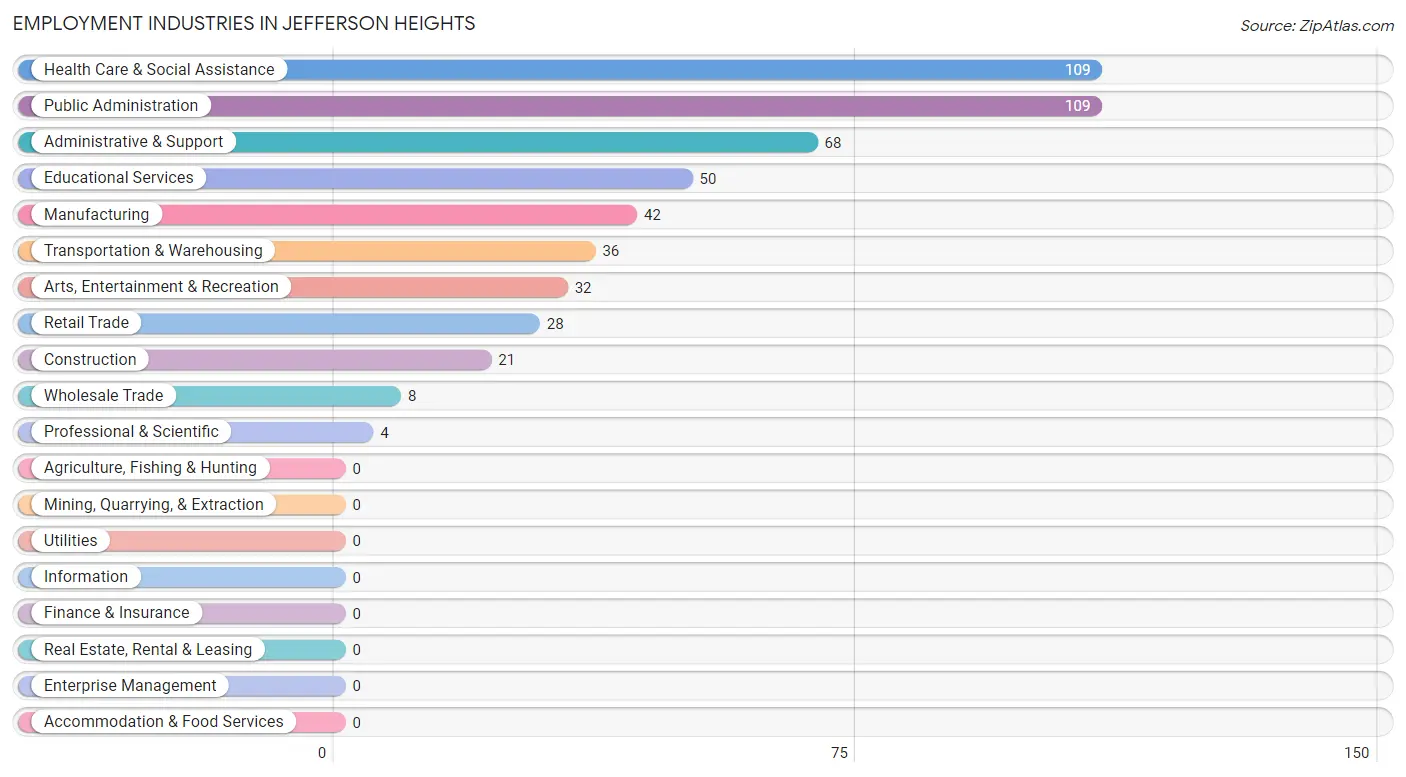
The major employment industries in Jefferson Heights include Health Care & Social Assistance (109 | 21.0%), Public Administration (109 | 21.0%), Administrative & Support (68 | 13.1%), Educational Services (50 | 9.7%), and Manufacturing (42 | 8.1%).
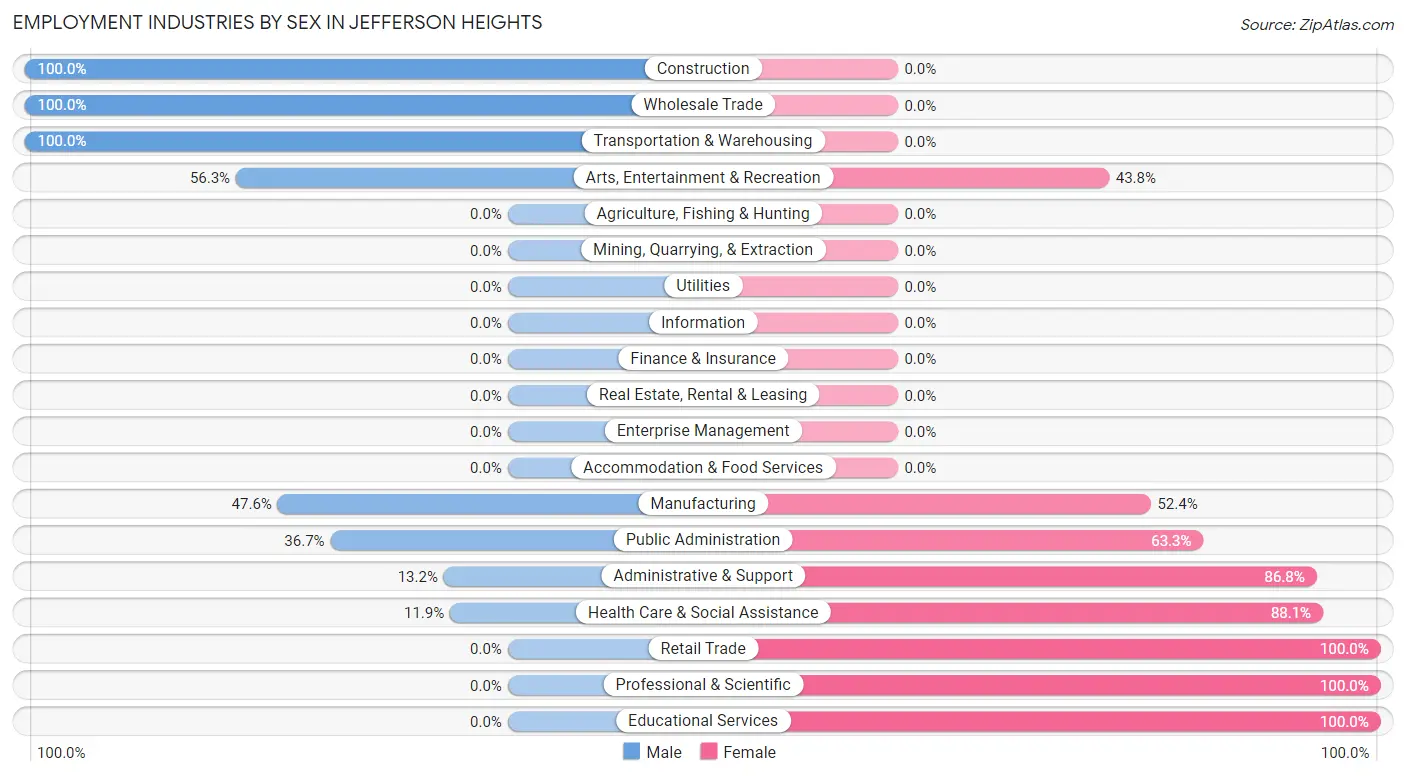
Employment Industries by Sex in Jefferson Heights
The Jefferson Heights industries that see more men than women are Construction (100.0%), Wholesale Trade (100.0%), and Transportation & Warehousing (100.0%), whereas the industries that tend to have a higher number of women are Retail Trade (100.0%), Professional & Scientific (100.0%), and Educational Services (100.0%).
| Industry | Male | Female |
| Agriculture, Fishing & Hunting | 0 (0.0%) | 0 (0.0%) |
| Mining, Quarrying, & Extraction | 0 (0.0%) | 0 (0.0%) |
| Construction | 21 (100.0%) | 0 (0.0%) |
| Manufacturing | 20 (47.6%) | 22 (52.4%) |
| Wholesale Trade | 8 (100.0%) | 0 (0.0%) |
| Retail Trade | 0 (0.0%) | 28 (100.0%) |
| Transportation & Warehousing | 36 (100.0%) | 0 (0.0%) |
| Utilities | 0 (0.0%) | 0 (0.0%) |
| Information | 0 (0.0%) | 0 (0.0%) |
| Finance & Insurance | 0 (0.0%) | 0 (0.0%) |
| Real Estate, Rental & Leasing | 0 (0.0%) | 0 (0.0%) |
| Professional & Scientific | 0 (0.0%) | 4 (100.0%) |
| Enterprise Management | 0 (0.0%) | 0 (0.0%) |
| Administrative & Support | 9 (13.2%) | 59 (86.8%) |
| Educational Services | 0 (0.0%) | 50 (100.0%) |
| Health Care & Social Assistance | 13 (11.9%) | 96 (88.1%) |
| Arts, Entertainment & Recreation | 18 (56.2%) | 14 (43.8%) |
| Accommodation & Food Services | 0 (0.0%) | 0 (0.0%) |
| Public Administration | 40 (36.7%) | 69 (63.3%) |
| Total | 176 (34.0%) | 342 (66.0%) |
Education in Jefferson Heights
School Enrollment in Jefferson Heights
The most common levels of schooling among the 240 students in Jefferson Heights are high school (107 | 44.6%), nursery / preschool (72 | 30.0%), and middle school (61 | 25.4%).
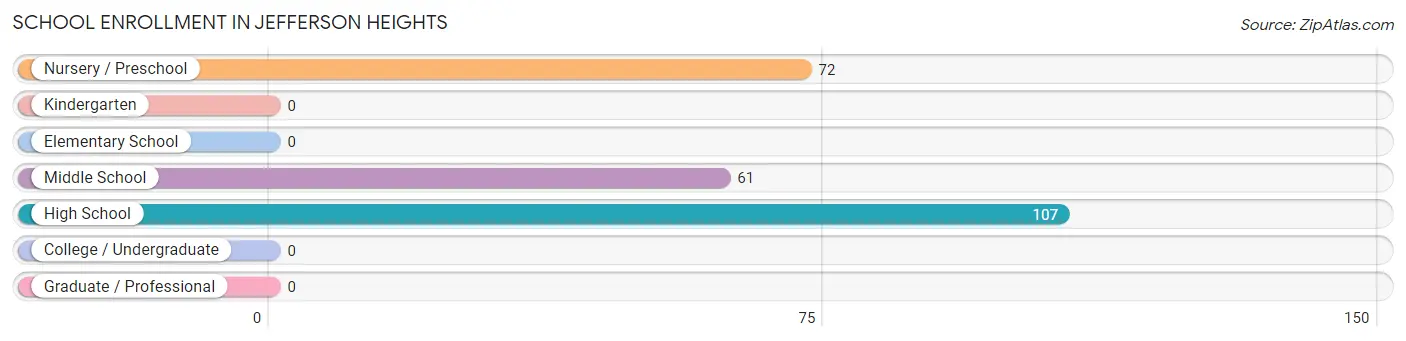
| School Level | # Students | % Students |
| Nursery / Preschool | 72 | 30.0% |
| Kindergarten | 0 | 0.0% |
| Elementary School | 0 | 0.0% |
| Middle School | 61 | 25.4% |
| High School | 107 | 44.6% |
| College / Undergraduate | 0 | 0.0% |
| Graduate / Professional | 0 | 0.0% |
| Total | 240 | 100.0% |
School Enrollment by Age by Funding Source in Jefferson Heights
Out of a total of 240 students who are enrolled in schools in Jefferson Heights, 40 (16.7%) attend a private institution, while the remaining 200 (83.3%) are enrolled in public schools. The age group of 15 to 17 year olds has the highest likelihood of being enrolled in private schools, with 27 (28.7% in the age bracket) enrolled. Conversely, the age group of 3 to 4 year olds has the lowest likelihood of being enrolled in a private school, with 29 (100.0% in the age bracket) attending a public institution.
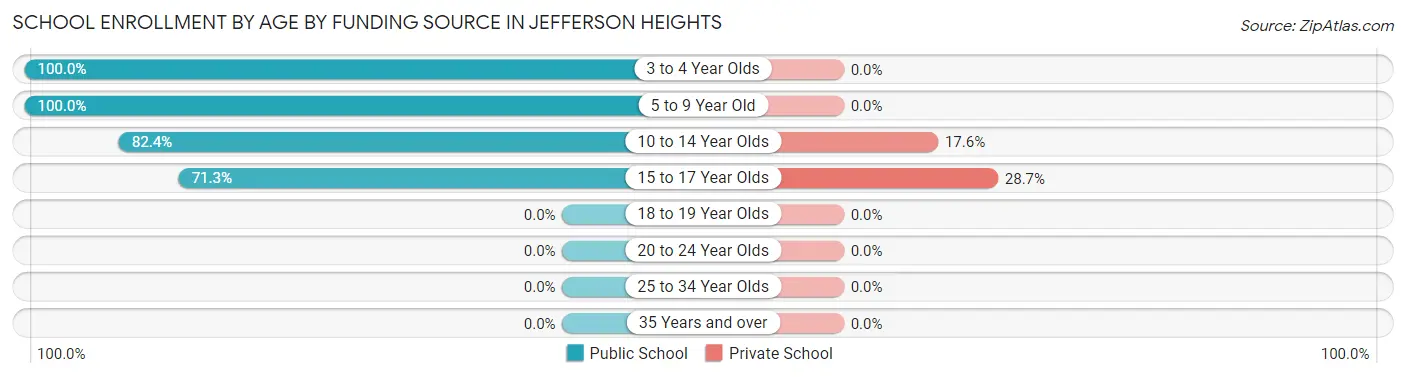
| Age Bracket | Public School | Private School |
| 3 to 4 Year Olds | 29 (100.0%) | 0 (0.0%) |
| 5 to 9 Year Old | 43 (100.0%) | 0 (0.0%) |
| 10 to 14 Year Olds | 61 (82.4%) | 13 (17.6%) |
| 15 to 17 Year Olds | 67 (71.3%) | 27 (28.7%) |
| 18 to 19 Year Olds | 0 (0.0%) | 0 (0.0%) |
| 20 to 24 Year Olds | 0 (0.0%) | 0 (0.0%) |
| 25 to 34 Year Olds | 0 (0.0%) | 0 (0.0%) |
| 35 Years and over | 0 (0.0%) | 0 (0.0%) |
| Total | 200 (83.3%) | 40 (16.7%) |
Educational Attainment by Field of Study in Jefferson Heights
Education (65 | 32.7%), social sciences (35 | 17.6%), visual & performing arts (25 | 12.6%), business (23 | 11.6%), and engineering (20 | 10.1%) are the most common fields of study among 199 individuals in Jefferson Heights who have obtained a bachelor's degree or higher.
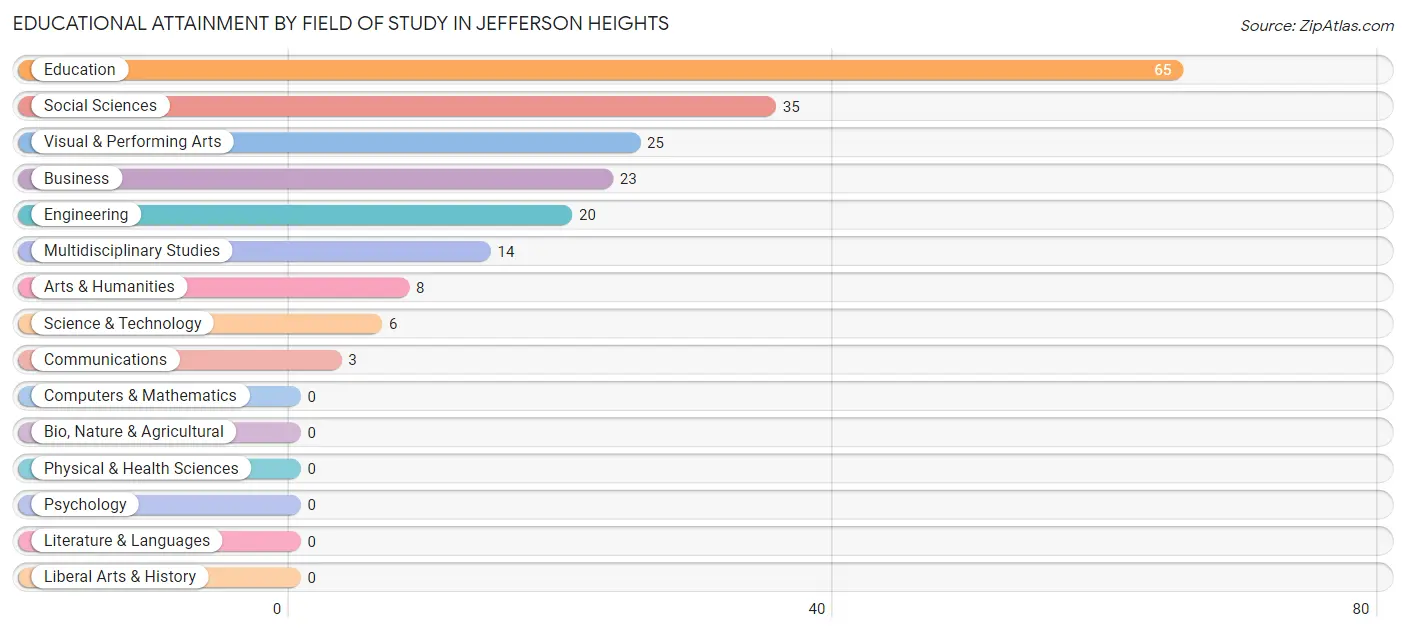
| Field of Study | # Graduates | % Graduates |
| Computers & Mathematics | 0 | 0.0% |
| Bio, Nature & Agricultural | 0 | 0.0% |
| Physical & Health Sciences | 0 | 0.0% |
| Psychology | 0 | 0.0% |
| Social Sciences | 35 | 17.6% |
| Engineering | 20 | 10.1% |
| Multidisciplinary Studies | 14 | 7.0% |
| Science & Technology | 6 | 3.0% |
| Business | 23 | 11.6% |
| Education | 65 | 32.7% |
| Literature & Languages | 0 | 0.0% |
| Liberal Arts & History | 0 | 0.0% |
| Visual & Performing Arts | 25 | 12.6% |
| Communications | 3 | 1.5% |
| Arts & Humanities | 8 | 4.0% |
| Total | 199 | 100.0% |
Transportation & Commute in Jefferson Heights
Vehicle Availability by Sex in Jefferson Heights
The most prevalent vehicle ownership categories in Jefferson Heights are males with 2 vehicles (80, accounting for 45.5%) and females with 2 vehicles (165, making up 23.4%).
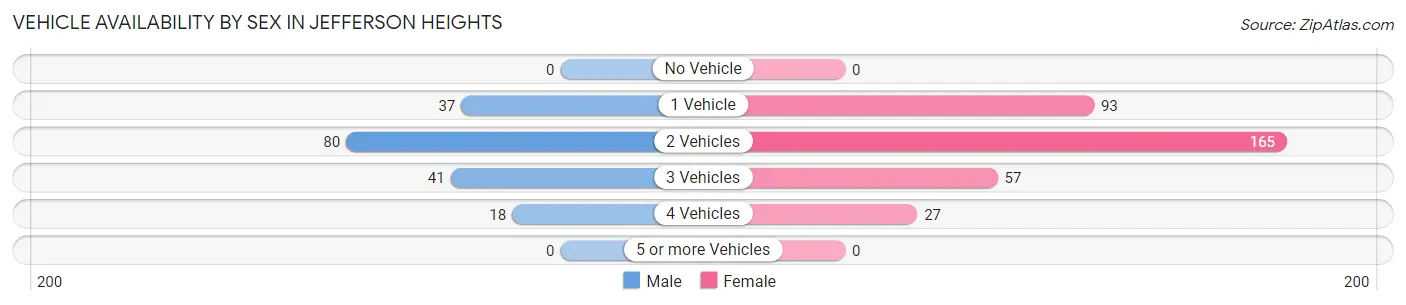
| Vehicles Available | Male | Female |
| No Vehicle | 0 (0.0%) | 0 (0.0%) |
| 1 Vehicle | 37 (21.0%) | 93 (27.2%) |
| 2 Vehicles | 80 (45.5%) | 165 (48.2%) |
| 3 Vehicles | 41 (23.3%) | 57 (16.7%) |
| 4 Vehicles | 18 (10.2%) | 27 (7.9%) |
| 5 or more Vehicles | 0 (0.0%) | 0 (0.0%) |
| Total | 176 (100.0%) | 342 (100.0%) |
Commute Time in Jefferson Heights
The most frequently occuring commute durations in Jefferson Heights are 5 to 9 minutes (103 commuters, 22.0%), 30 to 34 minutes (97 commuters, 20.7%), and 15 to 19 minutes (87 commuters, 18.6%).
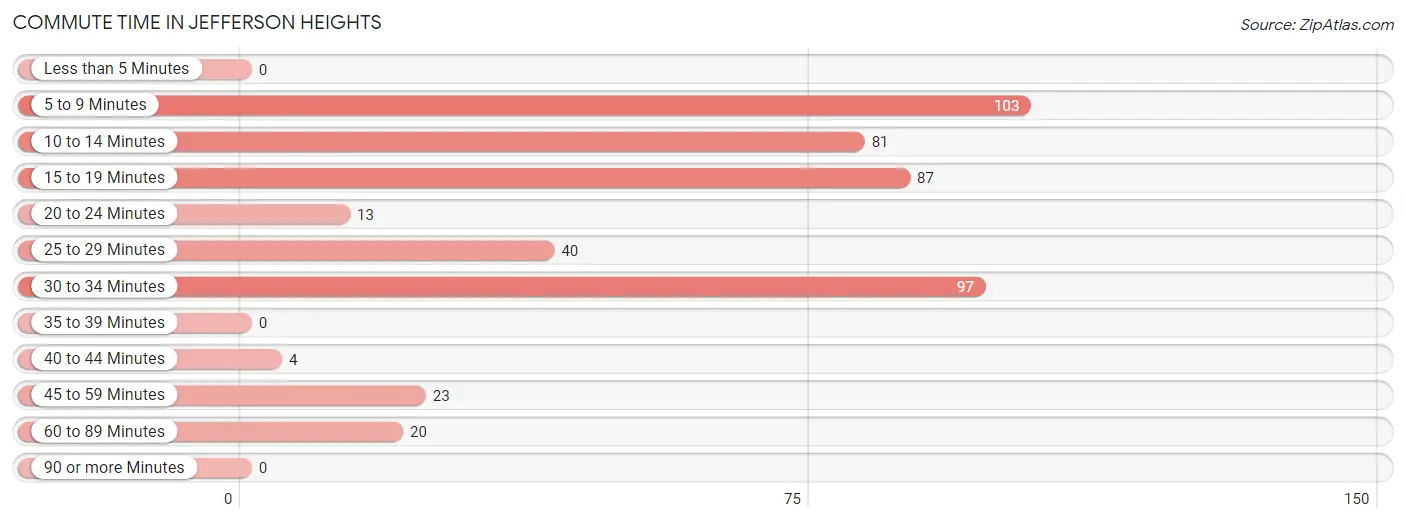
| Commute Time | # Commuters | % Commuters |
| Less than 5 Minutes | 0 | 0.0% |
| 5 to 9 Minutes | 103 | 22.0% |
| 10 to 14 Minutes | 81 | 17.3% |
| 15 to 19 Minutes | 87 | 18.6% |
| 20 to 24 Minutes | 13 | 2.8% |
| 25 to 29 Minutes | 40 | 8.6% |
| 30 to 34 Minutes | 97 | 20.7% |
| 35 to 39 Minutes | 0 | 0.0% |
| 40 to 44 Minutes | 4 | 0.9% |
| 45 to 59 Minutes | 23 | 4.9% |
| 60 to 89 Minutes | 20 | 4.3% |
| 90 or more Minutes | 0 | 0.0% |
Commute Time by Sex in Jefferson Heights
The most common commute times in Jefferson Heights are 30 to 34 minutes (75 commuters, 50.0%) for males and 5 to 9 minutes (103 commuters, 32.4%) for females.
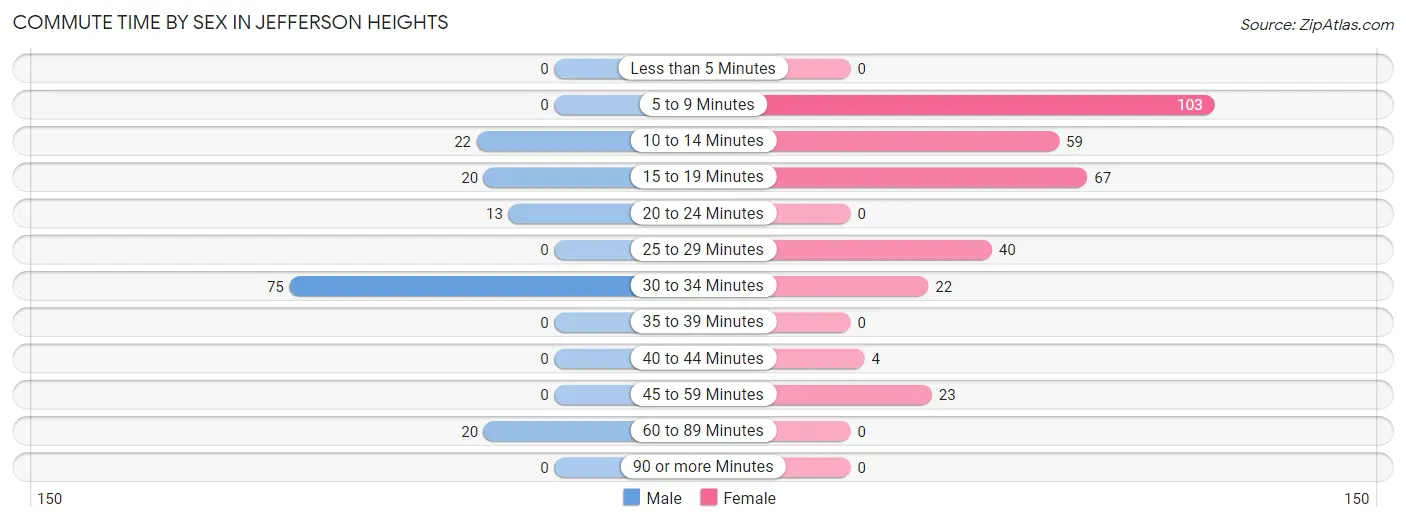
| Commute Time | Male | Female |
| Less than 5 Minutes | 0 (0.0%) | 0 (0.0%) |
| 5 to 9 Minutes | 0 (0.0%) | 103 (32.4%) |
| 10 to 14 Minutes | 22 (14.7%) | 59 (18.5%) |
| 15 to 19 Minutes | 20 (13.3%) | 67 (21.1%) |
| 20 to 24 Minutes | 13 (8.7%) | 0 (0.0%) |
| 25 to 29 Minutes | 0 (0.0%) | 40 (12.6%) |
| 30 to 34 Minutes | 75 (50.0%) | 22 (6.9%) |
| 35 to 39 Minutes | 0 (0.0%) | 0 (0.0%) |
| 40 to 44 Minutes | 0 (0.0%) | 4 (1.3%) |
| 45 to 59 Minutes | 0 (0.0%) | 23 (7.2%) |
| 60 to 89 Minutes | 20 (13.3%) | 0 (0.0%) |
| 90 or more Minutes | 0 (0.0%) | 0 (0.0%) |
Time of Departure to Work by Sex in Jefferson Heights
The most frequent times of departure to work in Jefferson Heights are 6:30 AM to 6:59 AM (56, 37.3%) for males and 7:00 AM to 7:29 AM (169, 53.1%) for females.
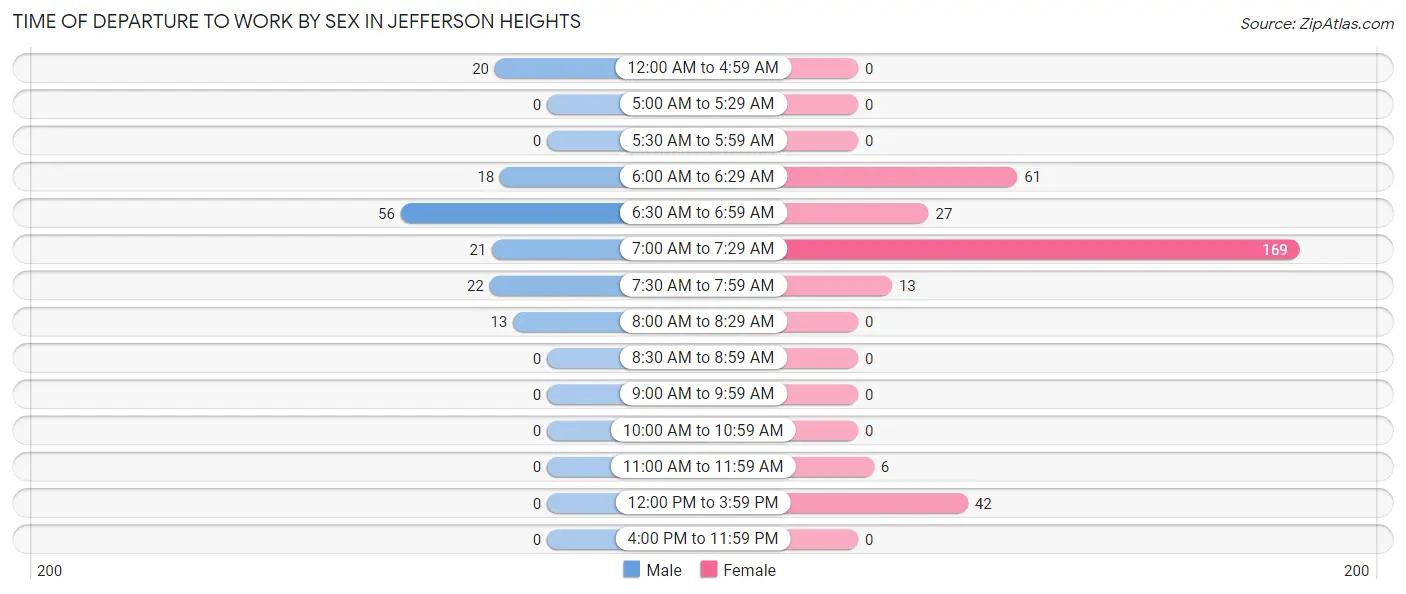
| Time of Departure | Male | Female |
| 12:00 AM to 4:59 AM | 20 (13.3%) | 0 (0.0%) |
| 5:00 AM to 5:29 AM | 0 (0.0%) | 0 (0.0%) |
| 5:30 AM to 5:59 AM | 0 (0.0%) | 0 (0.0%) |
| 6:00 AM to 6:29 AM | 18 (12.0%) | 61 (19.2%) |
| 6:30 AM to 6:59 AM | 56 (37.3%) | 27 (8.5%) |
| 7:00 AM to 7:29 AM | 21 (14.0%) | 169 (53.1%) |
| 7:30 AM to 7:59 AM | 22 (14.7%) | 13 (4.1%) |
| 8:00 AM to 8:29 AM | 13 (8.7%) | 0 (0.0%) |
| 8:30 AM to 8:59 AM | 0 (0.0%) | 0 (0.0%) |
| 9:00 AM to 9:59 AM | 0 (0.0%) | 0 (0.0%) |
| 10:00 AM to 10:59 AM | 0 (0.0%) | 0 (0.0%) |
| 11:00 AM to 11:59 AM | 0 (0.0%) | 6 (1.9%) |
| 12:00 PM to 3:59 PM | 0 (0.0%) | 42 (13.2%) |
| 4:00 PM to 11:59 PM | 0 (0.0%) | 0 (0.0%) |
| Total | 150 (100.0%) | 318 (100.0%) |
Housing Occupancy in Jefferson Heights
Occupancy by Ownership in Jefferson Heights
Of the total 469 dwellings in Jefferson Heights, owner-occupied units account for 270 (57.6%), while renter-occupied units make up 199 (42.4%).
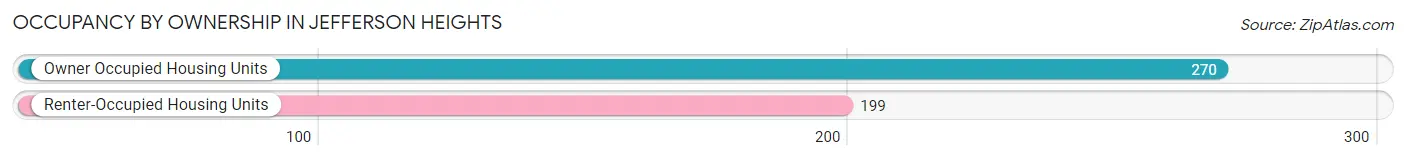
| Occupancy | # Housing Units | % Housing Units |
| Owner Occupied Housing Units | 270 | 57.6% |
| Renter-Occupied Housing Units | 199 | 42.4% |
| Total Occupied Housing Units | 469 | 100.0% |
Occupancy by Household Size in Jefferson Heights
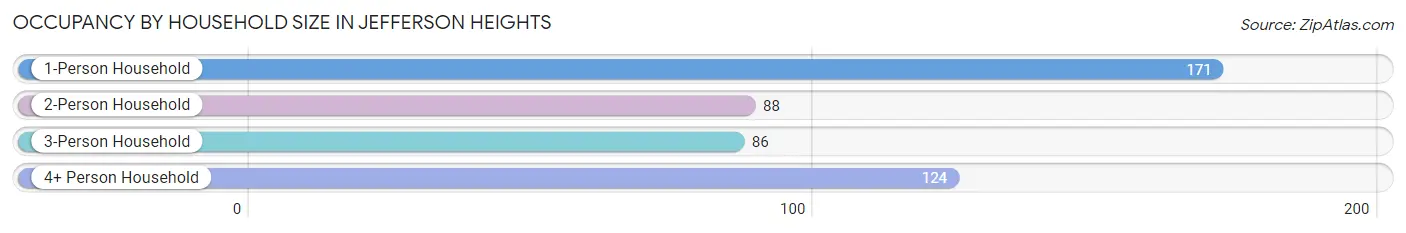
| Household Size | # Housing Units | % Housing Units |
| 1-Person Household | 171 | 36.5% |
| 2-Person Household | 88 | 18.8% |
| 3-Person Household | 86 | 18.3% |
| 4+ Person Household | 124 | 26.4% |
| Total Housing Units | 469 | 100.0% |
Occupancy by Ownership by Household Size in Jefferson Heights
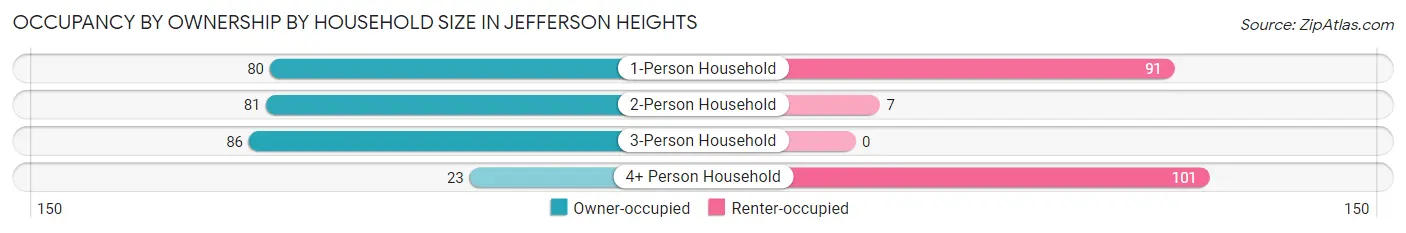
| Household Size | Owner-occupied | Renter-occupied |
| 1-Person Household | 80 (46.8%) | 91 (53.2%) |
| 2-Person Household | 81 (92.0%) | 7 (8.0%) |
| 3-Person Household | 86 (100.0%) | 0 (0.0%) |
| 4+ Person Household | 23 (18.5%) | 101 (81.5%) |
| Total Housing Units | 270 (57.6%) | 199 (42.4%) |
Occupancy by Educational Attainment in Jefferson Heights
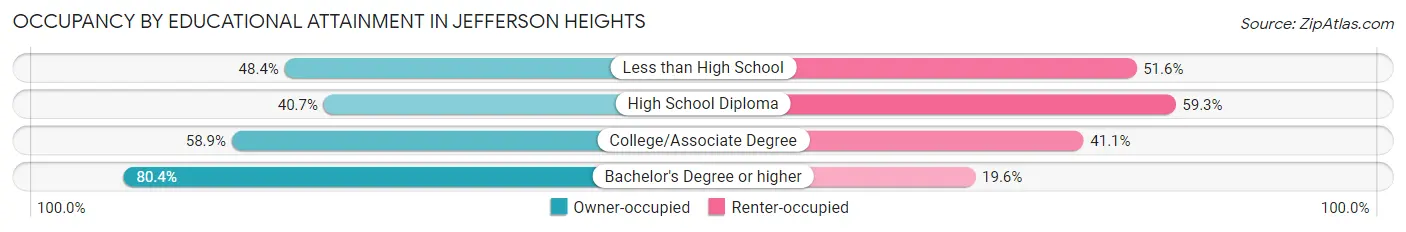
| Household Size | Owner-occupied | Renter-occupied |
| Less than High School | 31 (48.4%) | 33 (51.6%) |
| High School Diploma | 48 (40.7%) | 70 (59.3%) |
| College/Associate Degree | 109 (58.9%) | 76 (41.1%) |
| Bachelor's Degree or higher | 82 (80.4%) | 20 (19.6%) |
Occupancy by Age of Householder in Jefferson Heights
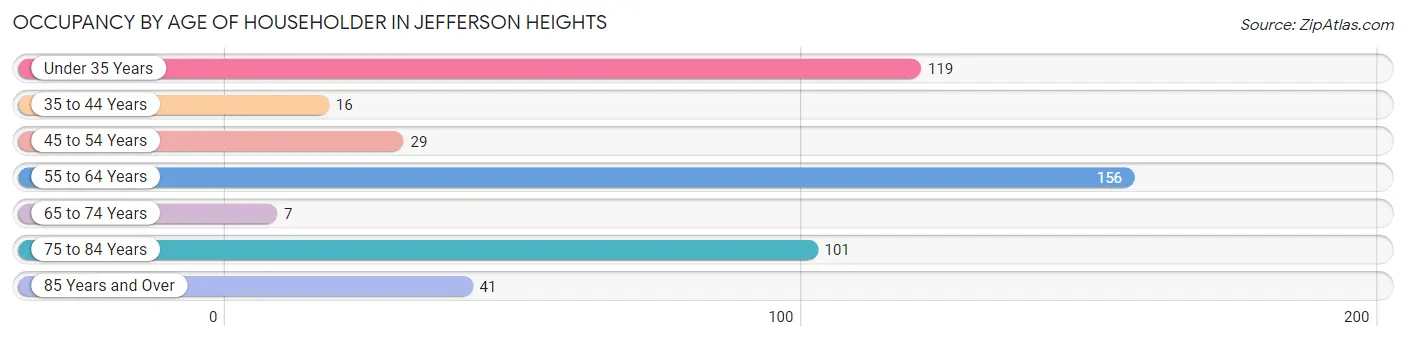
| Age Bracket | # Households | % Households |
| Under 35 Years | 119 | 25.4% |
| 35 to 44 Years | 16 | 3.4% |
| 45 to 54 Years | 29 | 6.2% |
| 55 to 64 Years | 156 | 33.3% |
| 65 to 74 Years | 7 | 1.5% |
| 75 to 84 Years | 101 | 21.5% |
| 85 Years and Over | 41 | 8.7% |
| Total | 469 | 100.0% |
Housing Finances in Jefferson Heights
Median Income by Occupancy in Jefferson Heights
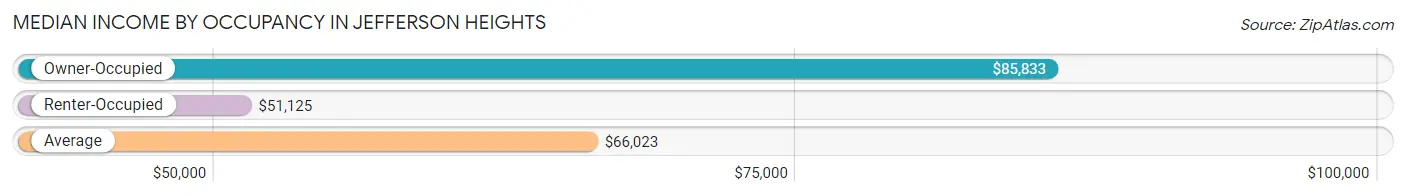
| Occupancy Type | # Households | Median Income |
| Owner-Occupied | 270 (57.6%) | $85,833 |
| Renter-Occupied | 199 (42.4%) | $51,125 |
| Average | 469 (100.0%) | $66,023 |
Occupancy by Householder Income Bracket in Jefferson Heights
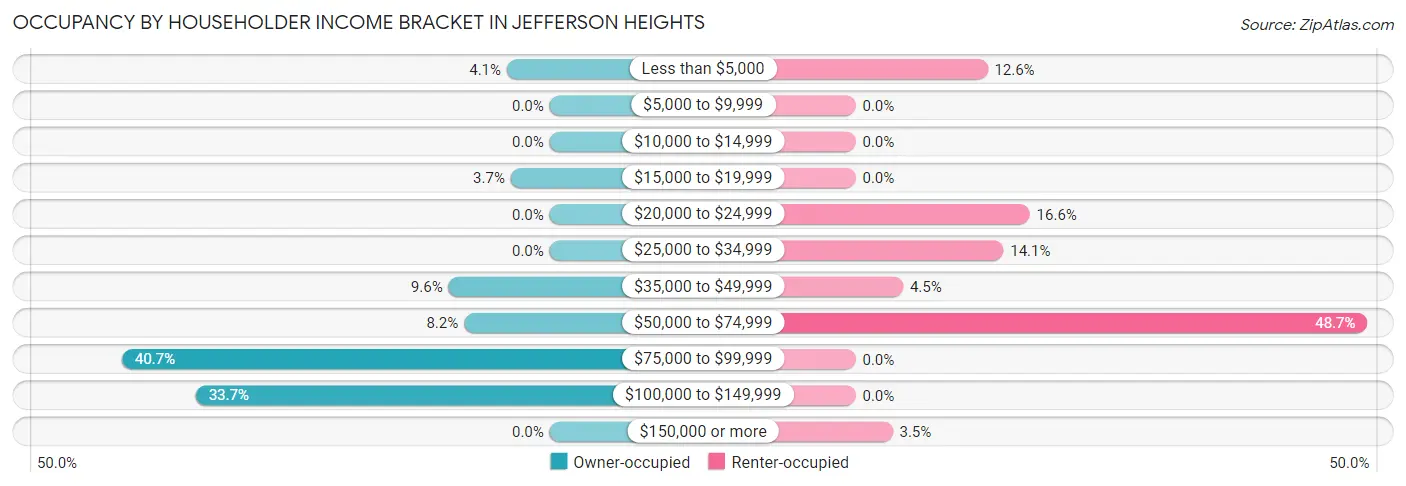
| Income Bracket | Owner-occupied | Renter-occupied |
| Less than $5,000 | 11 (4.1%) | 25 (12.6%) |
| $5,000 to $9,999 | 0 (0.0%) | 0 (0.0%) |
| $10,000 to $14,999 | 0 (0.0%) | 0 (0.0%) |
| $15,000 to $19,999 | 10 (3.7%) | 0 (0.0%) |
| $20,000 to $24,999 | 0 (0.0%) | 33 (16.6%) |
| $25,000 to $34,999 | 0 (0.0%) | 28 (14.1%) |
| $35,000 to $49,999 | 26 (9.6%) | 9 (4.5%) |
| $50,000 to $74,999 | 22 (8.2%) | 97 (48.7%) |
| $75,000 to $99,999 | 110 (40.7%) | 0 (0.0%) |
| $100,000 to $149,999 | 91 (33.7%) | 0 (0.0%) |
| $150,000 or more | 0 (0.0%) | 7 (3.5%) |
| Total | 270 (100.0%) | 199 (100.0%) |
Monthly Housing Cost Tiers in Jefferson Heights
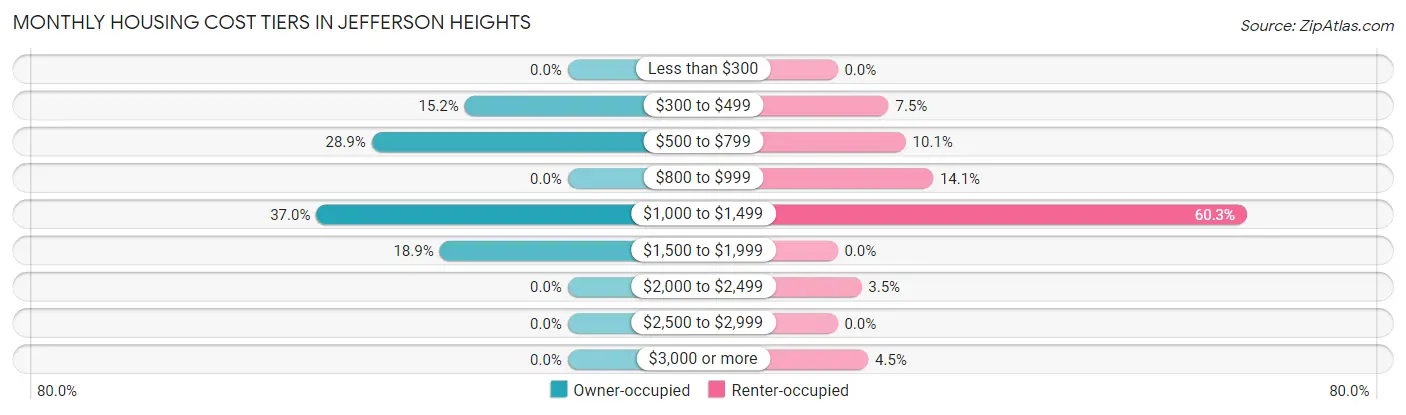
| Monthly Cost | Owner-occupied | Renter-occupied |
| Less than $300 | 0 (0.0%) | 0 (0.0%) |
| $300 to $499 | 41 (15.2%) | 15 (7.5%) |
| $500 to $799 | 78 (28.9%) | 20 (10.1%) |
| $800 to $999 | 0 (0.0%) | 28 (14.1%) |
| $1,000 to $1,499 | 100 (37.0%) | 120 (60.3%) |
| $1,500 to $1,999 | 51 (18.9%) | 0 (0.0%) |
| $2,000 to $2,499 | 0 (0.0%) | 7 (3.5%) |
| $2,500 to $2,999 | 0 (0.0%) | 0 (0.0%) |
| $3,000 or more | 0 (0.0%) | 9 (4.5%) |
| Total | 270 (100.0%) | 199 (100.0%) |
Physical Housing Characteristics in Jefferson Heights
Housing Structures in Jefferson Heights
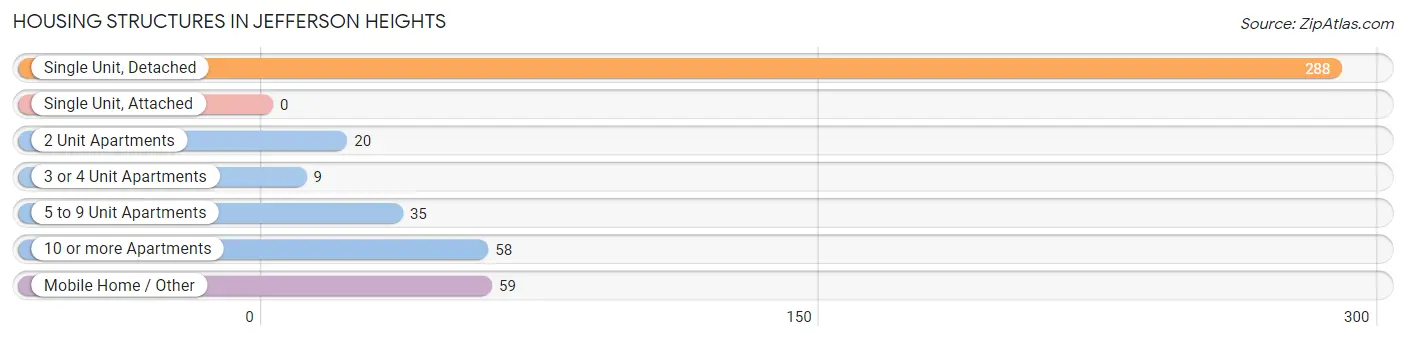
| Structure Type | # Housing Units | % Housing Units |
| Single Unit, Detached | 288 | 61.4% |
| Single Unit, Attached | 0 | 0.0% |
| 2 Unit Apartments | 20 | 4.3% |
| 3 or 4 Unit Apartments | 9 | 1.9% |
| 5 to 9 Unit Apartments | 35 | 7.5% |
| 10 or more Apartments | 58 | 12.4% |
| Mobile Home / Other | 59 | 12.6% |
| Total | 469 | 100.0% |
Housing Structures by Occupancy in Jefferson Heights
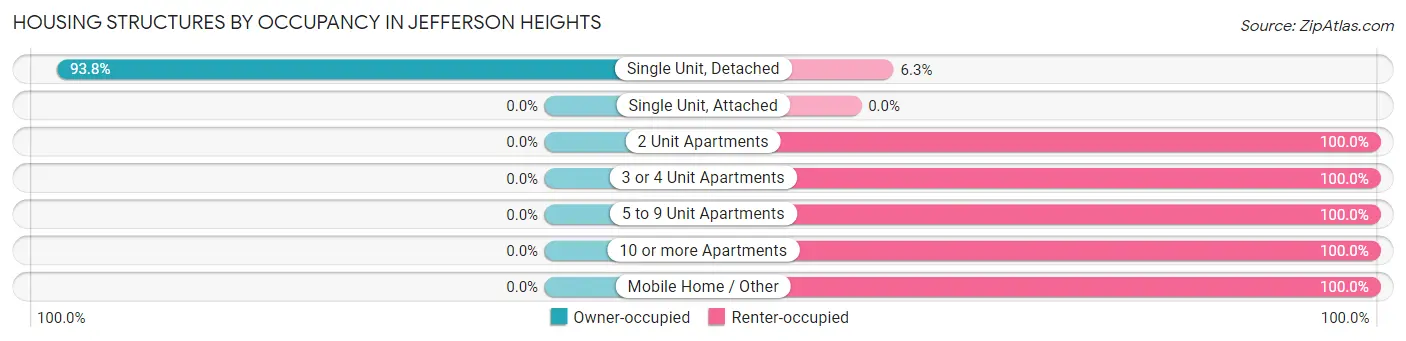
| Structure Type | Owner-occupied | Renter-occupied |
| Single Unit, Detached | 270 (93.8%) | 18 (6.2%) |
| Single Unit, Attached | 0 (0.0%) | 0 (0.0%) |
| 2 Unit Apartments | 0 (0.0%) | 20 (100.0%) |
| 3 or 4 Unit Apartments | 0 (0.0%) | 9 (100.0%) |
| 5 to 9 Unit Apartments | 0 (0.0%) | 35 (100.0%) |
| 10 or more Apartments | 0 (0.0%) | 58 (100.0%) |
| Mobile Home / Other | 0 (0.0%) | 59 (100.0%) |
| Total | 270 (57.6%) | 199 (42.4%) |
Housing Structures by Number of Rooms in Jefferson Heights
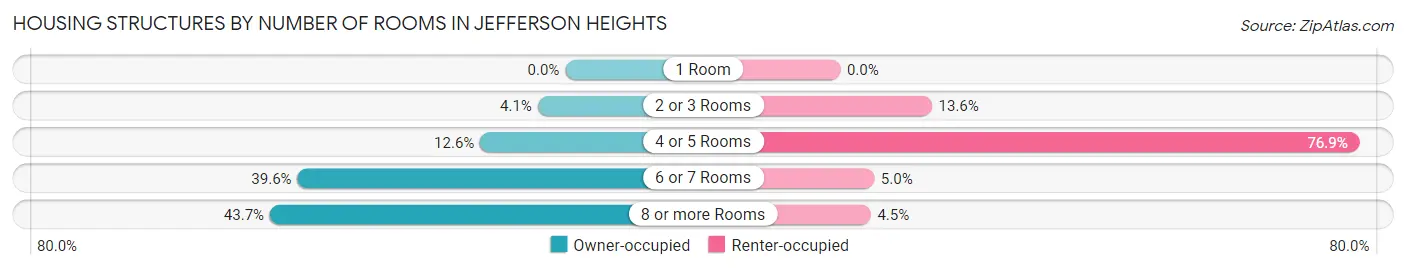
| Number of Rooms | Owner-occupied | Renter-occupied |
| 1 Room | 0 (0.0%) | 0 (0.0%) |
| 2 or 3 Rooms | 11 (4.1%) | 27 (13.6%) |
| 4 or 5 Rooms | 34 (12.6%) | 153 (76.9%) |
| 6 or 7 Rooms | 107 (39.6%) | 10 (5.0%) |
| 8 or more Rooms | 118 (43.7%) | 9 (4.5%) |
| Total | 270 (100.0%) | 199 (100.0%) |
Housing Structure by Heating Type in Jefferson Heights
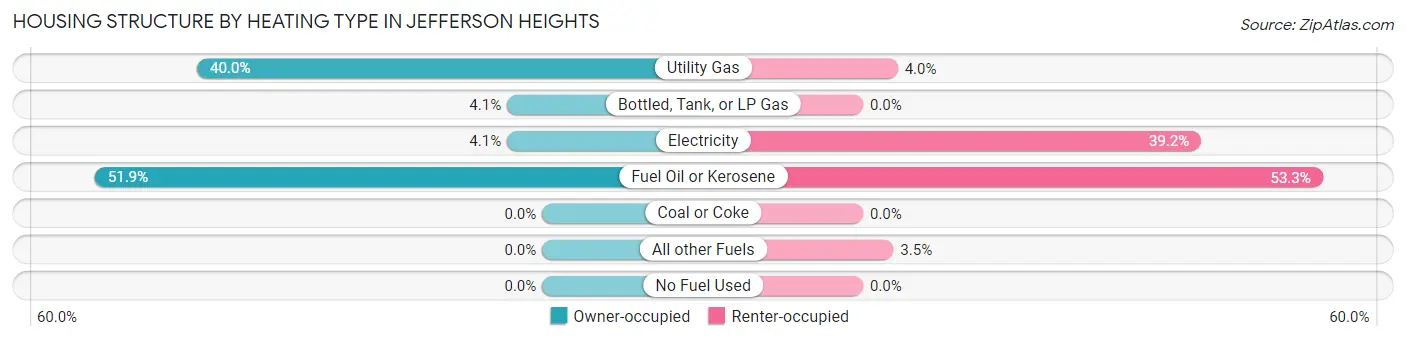
| Heating Type | Owner-occupied | Renter-occupied |
| Utility Gas | 108 (40.0%) | 8 (4.0%) |
| Bottled, Tank, or LP Gas | 11 (4.1%) | 0 (0.0%) |
| Electricity | 11 (4.1%) | 78 (39.2%) |
| Fuel Oil or Kerosene | 140 (51.8%) | 106 (53.3%) |
| Coal or Coke | 0 (0.0%) | 0 (0.0%) |
| All other Fuels | 0 (0.0%) | 7 (3.5%) |
| No Fuel Used | 0 (0.0%) | 0 (0.0%) |
| Total | 270 (100.0%) | 199 (100.0%) |
Household Vehicle Usage in Jefferson Heights
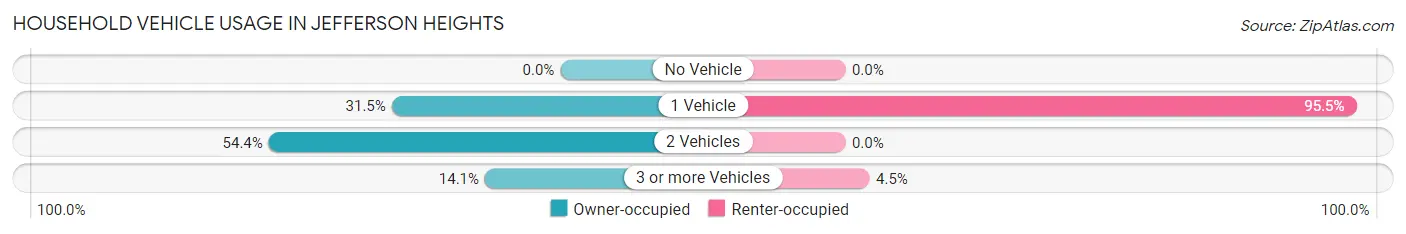
| Vehicles per Household | Owner-occupied | Renter-occupied |
| No Vehicle | 0 (0.0%) | 0 (0.0%) |
| 1 Vehicle | 85 (31.5%) | 190 (95.5%) |
| 2 Vehicles | 147 (54.4%) | 0 (0.0%) |
| 3 or more Vehicles | 38 (14.1%) | 9 (4.5%) |
| Total | 270 (100.0%) | 199 (100.0%) |
Real Estate & Mortgages in Jefferson Heights
Real Estate and Mortgage Overview in Jefferson Heights
| Characteristic | Without Mortgage | With Mortgage |
| Housing Units | 134 | 136 |
| Median Property Value | $218,200 | $0 |
| Median Household Income | $86,250 | $0 |
| Monthly Housing Costs | $590 | $0 |
| Real Estate Taxes | $4,091 | $20 |
Property Value by Mortgage Status in Jefferson Heights
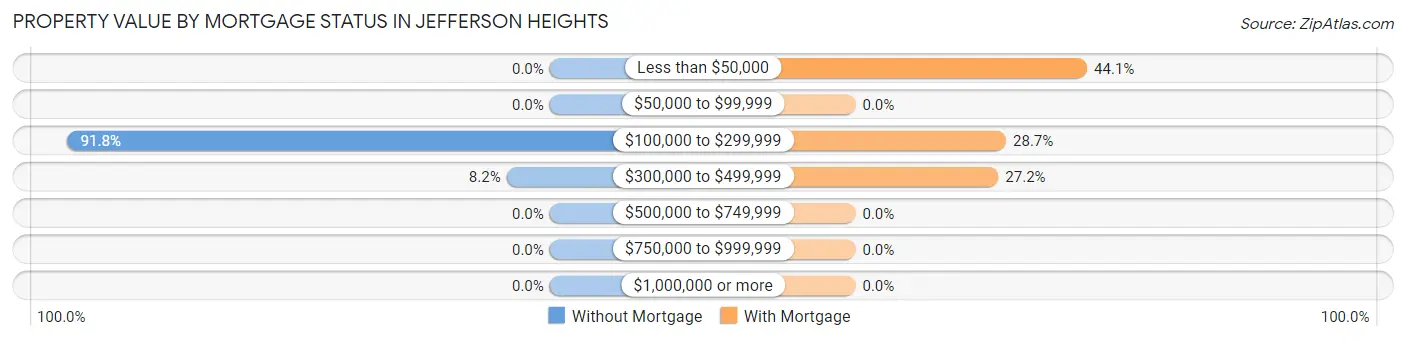
| Property Value | Without Mortgage | With Mortgage |
| Less than $50,000 | 0 (0.0%) | 60 (44.1%) |
| $50,000 to $99,999 | 0 (0.0%) | 0 (0.0%) |
| $100,000 to $299,999 | 123 (91.8%) | 39 (28.7%) |
| $300,000 to $499,999 | 11 (8.2%) | 37 (27.2%) |
| $500,000 to $749,999 | 0 (0.0%) | 0 (0.0%) |
| $750,000 to $999,999 | 0 (0.0%) | 0 (0.0%) |
| $1,000,000 or more | 0 (0.0%) | 0 (0.0%) |
| Total | 134 (100.0%) | 136 (100.0%) |
Household Income by Mortgage Status in Jefferson Heights
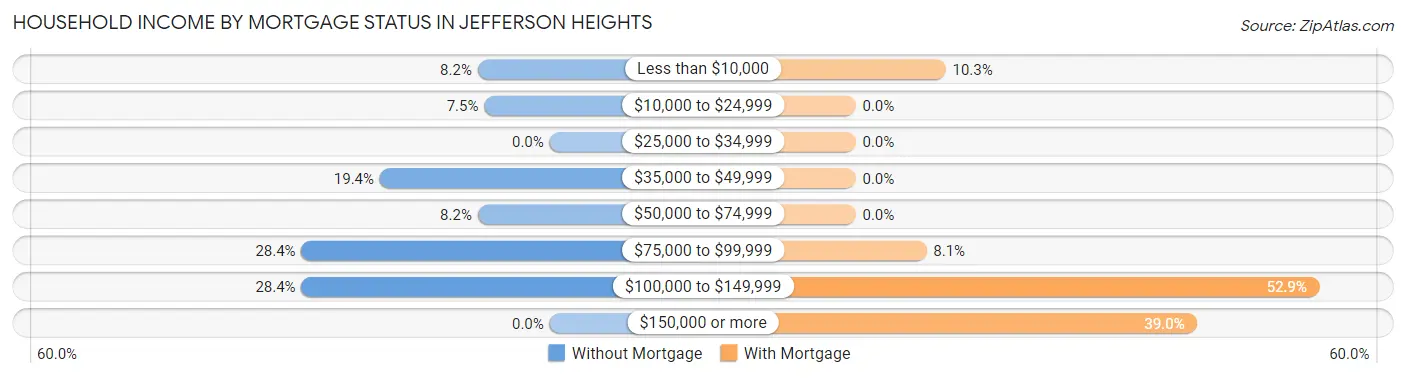
| Household Income | Without Mortgage | With Mortgage |
| Less than $10,000 | 11 (8.2%) | 14 (10.3%) |
| $10,000 to $24,999 | 10 (7.5%) | 0 (0.0%) |
| $25,000 to $34,999 | 0 (0.0%) | 0 (0.0%) |
| $35,000 to $49,999 | 26 (19.4%) | 0 (0.0%) |
| $50,000 to $74,999 | 11 (8.2%) | 0 (0.0%) |
| $75,000 to $99,999 | 38 (28.4%) | 11 (8.1%) |
| $100,000 to $149,999 | 38 (28.4%) | 72 (52.9%) |
| $150,000 or more | 0 (0.0%) | 53 (39.0%) |
| Total | 134 (100.0%) | 136 (100.0%) |
Property Value to Household Income Ratio in Jefferson Heights
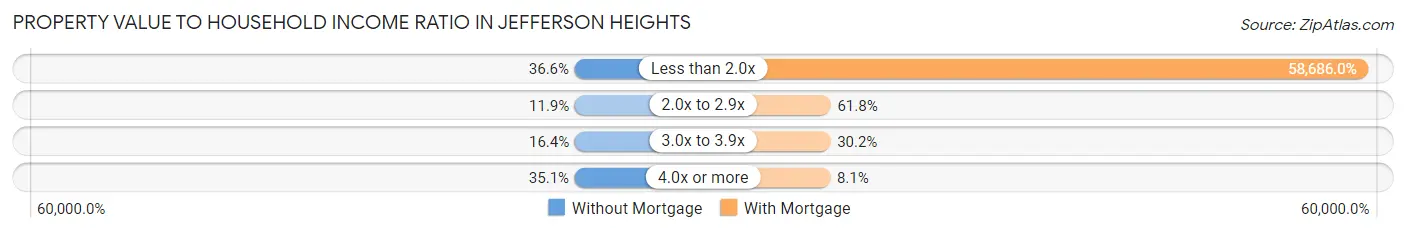
| Value-to-Income Ratio | Without Mortgage | With Mortgage |
| Less than 2.0x | 49 (36.6%) | 79,813 (58,686.0%) |
| 2.0x to 2.9x | 16 (11.9%) | 84 (61.8%) |
| 3.0x to 3.9x | 22 (16.4%) | 41 (30.1%) |
| 4.0x or more | 47 (35.1%) | 11 (8.1%) |
| Total | 134 (100.0%) | 136 (100.0%) |
Real Estate Taxes by Mortgage Status in Jefferson Heights
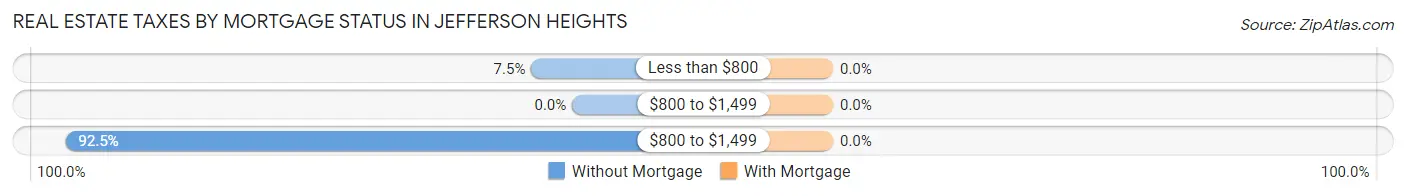
| Property Taxes | Without Mortgage | With Mortgage |
| Less than $800 | 10 (7.5%) | 0 (0.0%) |
| $800 to $1,499 | 0 (0.0%) | 0 (0.0%) |
| $800 to $1,499 | 124 (92.5%) | 0 (0.0%) |
| Total | 134 (100.0%) | 136 (100.0%) |
Health & Disability in Jefferson Heights
Health Insurance Coverage by Age in Jefferson Heights
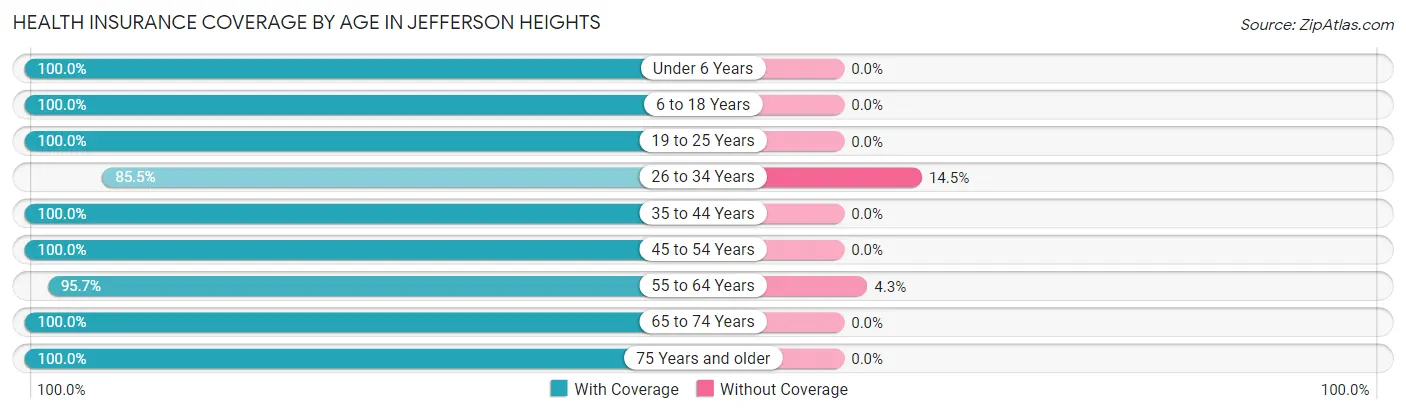
| Age Bracket | With Coverage | Without Coverage |
| Under 6 Years | 239 (100.0%) | 0 (0.0%) |
| 6 to 18 Years | 155 (100.0%) | 0 (0.0%) |
| 19 to 25 Years | 61 (100.0%) | 0 (0.0%) |
| 26 to 34 Years | 118 (85.5%) | 20 (14.5%) |
| 35 to 44 Years | 30 (100.0%) | 0 (0.0%) |
| 45 to 54 Years | 150 (100.0%) | 0 (0.0%) |
| 55 to 64 Years | 222 (95.7%) | 10 (4.3%) |
| 65 to 74 Years | 35 (100.0%) | 0 (0.0%) |
| 75 Years and older | 149 (100.0%) | 0 (0.0%) |
| Total | 1,159 (97.5%) | 30 (2.5%) |
Health Insurance Coverage by Citizenship Status in Jefferson Heights
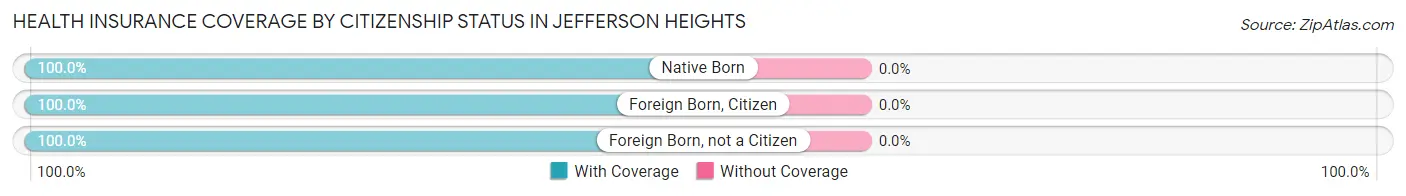
| Citizenship Status | With Coverage | Without Coverage |
| Native Born | 239 (100.0%) | 0 (0.0%) |
| Foreign Born, Citizen | 155 (100.0%) | 0 (0.0%) |
| Foreign Born, not a Citizen | 61 (100.0%) | 0 (0.0%) |
Health Insurance Coverage by Household Income in Jefferson Heights
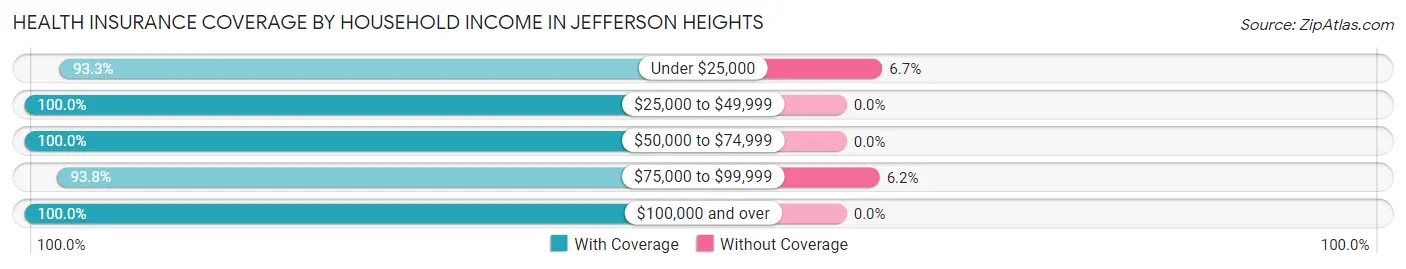
| Household Income | With Coverage | Without Coverage |
| Under $25,000 | 140 (93.3%) | 10 (6.7%) |
| $25,000 to $49,999 | 127 (100.0%) | 0 (0.0%) |
| $50,000 to $74,999 | 318 (100.0%) | 0 (0.0%) |
| $75,000 to $99,999 | 304 (93.8%) | 20 (6.2%) |
| $100,000 and over | 268 (100.0%) | 0 (0.0%) |
Public vs Private Health Insurance Coverage by Age in Jefferson Heights
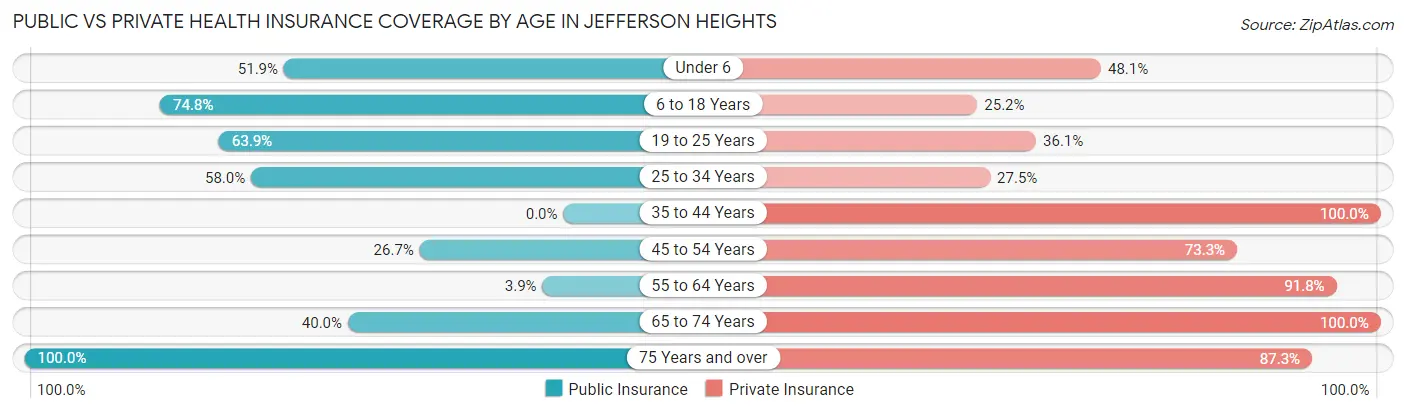
| Age Bracket | Public Insurance | Private Insurance |
| Under 6 | 124 (51.9%) | 115 (48.1%) |
| 6 to 18 Years | 116 (74.8%) | 39 (25.2%) |
| 19 to 25 Years | 39 (63.9%) | 22 (36.1%) |
| 25 to 34 Years | 80 (58.0%) | 38 (27.5%) |
| 35 to 44 Years | 0 (0.0%) | 30 (100.0%) |
| 45 to 54 Years | 40 (26.7%) | 110 (73.3%) |
| 55 to 64 Years | 9 (3.9%) | 213 (91.8%) |
| 65 to 74 Years | 14 (40.0%) | 35 (100.0%) |
| 75 Years and over | 149 (100.0%) | 130 (87.3%) |
| Total | 571 (48.0%) | 732 (61.6%) |
Disability Status by Sex by Age in Jefferson Heights
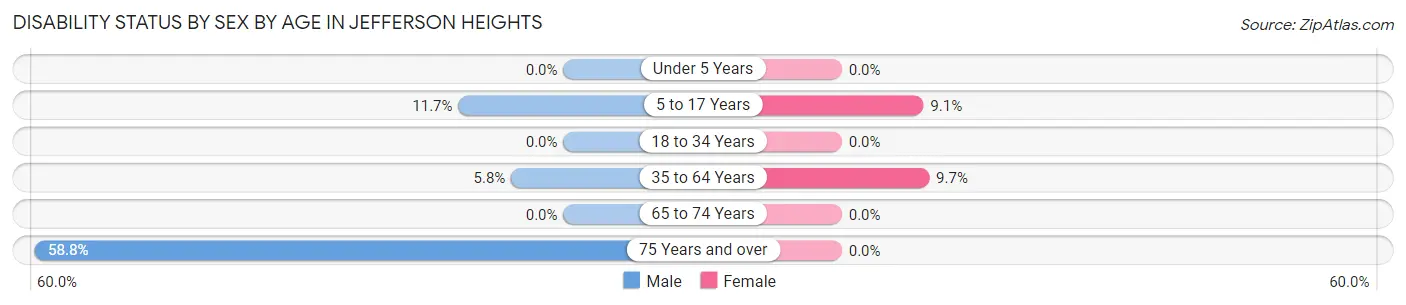
| Age Bracket | Male | Female |
| Under 5 Years | 0 (0.0%) | 0 (0.0%) |
| 5 to 17 Years | 9 (11.7%) | 11 (9.1%) |
| 18 to 34 Years | 0 (0.0%) | 0 (0.0%) |
| 35 to 64 Years | 9 (5.8%) | 25 (9.7%) |
| 65 to 74 Years | 0 (0.0%) | 0 (0.0%) |
| 75 Years and over | 40 (58.8%) | 0 (0.0%) |
Disability Class by Sex by Age in Jefferson Heights
Disability Class: Hearing Difficulty
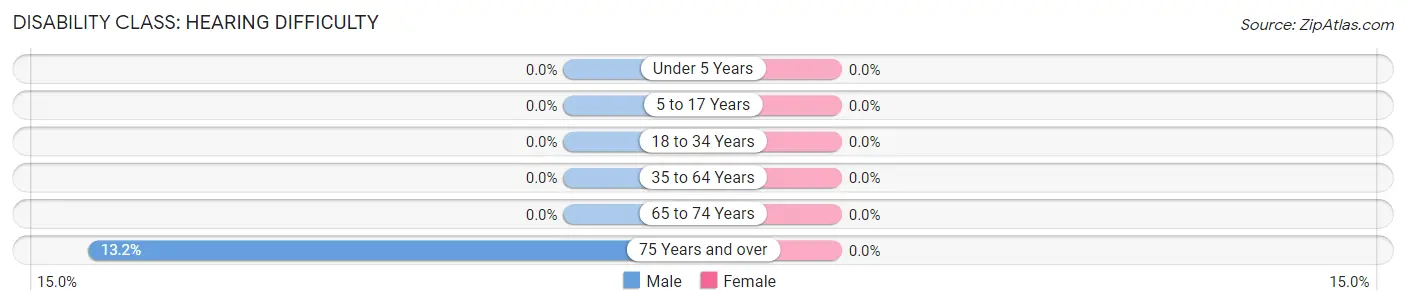
| Age Bracket | Male | Female |
| Under 5 Years | 0 (0.0%) | 0 (0.0%) |
| 5 to 17 Years | 0 (0.0%) | 0 (0.0%) |
| 18 to 34 Years | 0 (0.0%) | 0 (0.0%) |
| 35 to 64 Years | 0 (0.0%) | 0 (0.0%) |
| 65 to 74 Years | 0 (0.0%) | 0 (0.0%) |
| 75 Years and over | 9 (13.2%) | 0 (0.0%) |
Disability Class: Vision Difficulty
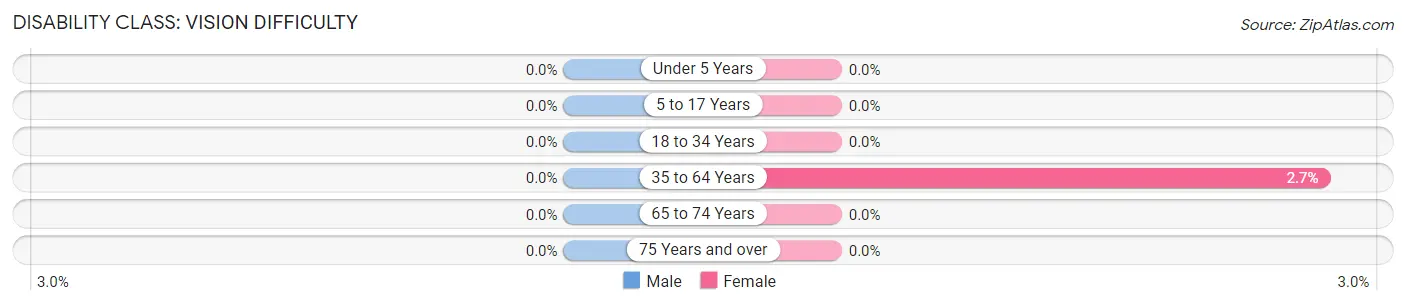
| Age Bracket | Male | Female |
| Under 5 Years | 0 (0.0%) | 0 (0.0%) |
| 5 to 17 Years | 0 (0.0%) | 0 (0.0%) |
| 18 to 34 Years | 0 (0.0%) | 0 (0.0%) |
| 35 to 64 Years | 0 (0.0%) | 7 (2.7%) |
| 65 to 74 Years | 0 (0.0%) | 0 (0.0%) |
| 75 Years and over | 0 (0.0%) | 0 (0.0%) |
Disability Class: Cognitive Difficulty
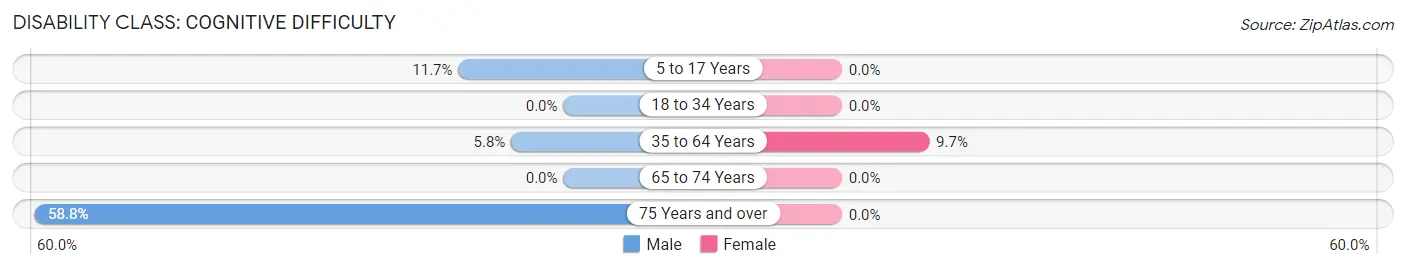
| Age Bracket | Male | Female |
| 5 to 17 Years | 9 (11.7%) | 0 (0.0%) |
| 18 to 34 Years | 0 (0.0%) | 0 (0.0%) |
| 35 to 64 Years | 9 (5.8%) | 25 (9.7%) |
| 65 to 74 Years | 0 (0.0%) | 0 (0.0%) |
| 75 Years and over | 40 (58.8%) | 0 (0.0%) |
Disability Class: Ambulatory Difficulty
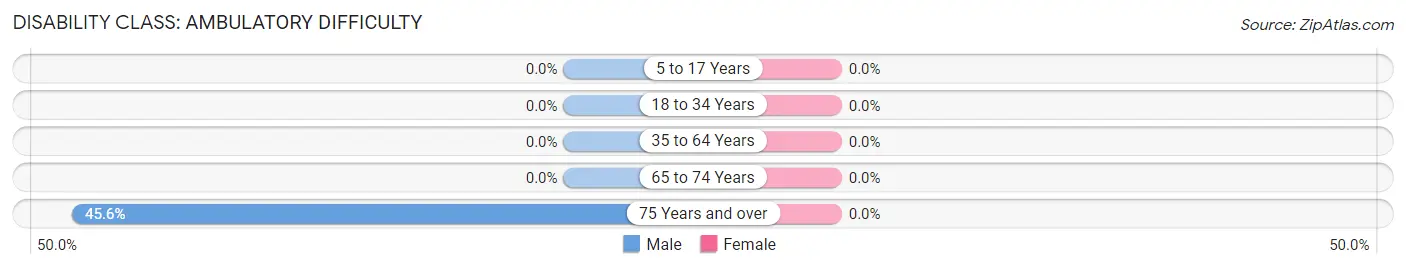
| Age Bracket | Male | Female |
| 5 to 17 Years | 0 (0.0%) | 0 (0.0%) |
| 18 to 34 Years | 0 (0.0%) | 0 (0.0%) |
| 35 to 64 Years | 0 (0.0%) | 0 (0.0%) |
| 65 to 74 Years | 0 (0.0%) | 0 (0.0%) |
| 75 Years and over | 31 (45.6%) | 0 (0.0%) |
Disability Class: Self-Care Difficulty
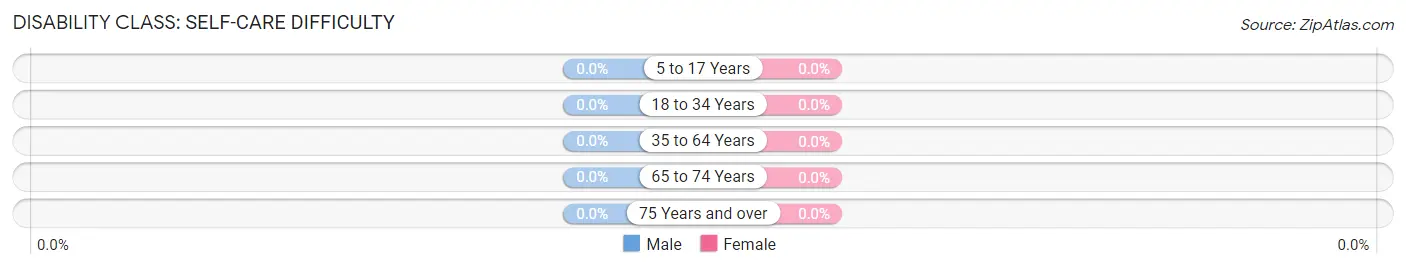
| Age Bracket | Male | Female |
| 5 to 17 Years | 0 (0.0%) | 0 (0.0%) |
| 18 to 34 Years | 0 (0.0%) | 0 (0.0%) |
| 35 to 64 Years | 0 (0.0%) | 0 (0.0%) |
| 65 to 74 Years | 0 (0.0%) | 0 (0.0%) |
| 75 Years and over | 0 (0.0%) | 0 (0.0%) |
Technology Access in Jefferson Heights
Computing Device Access in Jefferson Heights
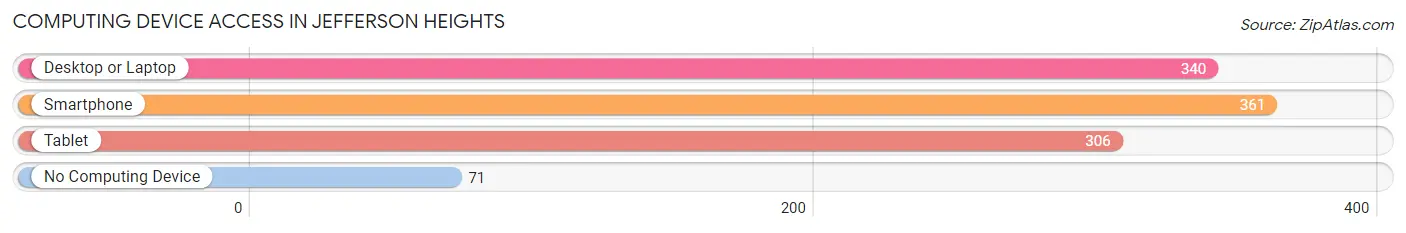
| Device Type | # Households | % Households |
| Desktop or Laptop | 340 | 72.5% |
| Smartphone | 361 | 77.0% |
| Tablet | 306 | 65.2% |
| No Computing Device | 71 | 15.1% |
| Total | 469 | 100.0% |
Internet Access in Jefferson Heights
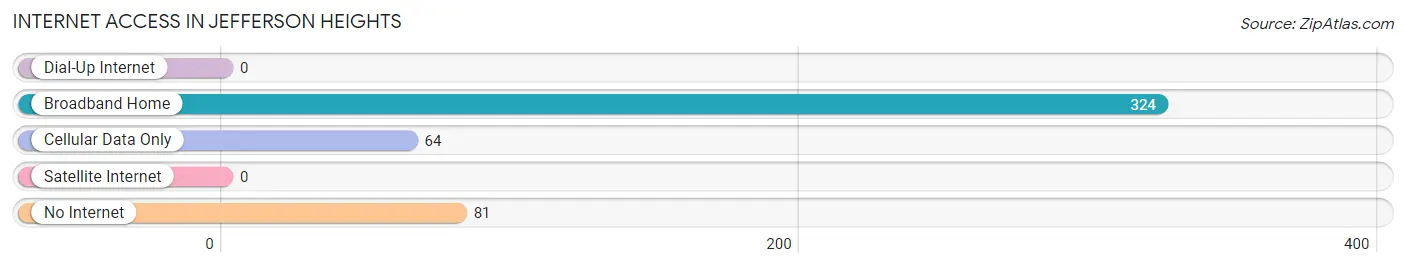
| Internet Type | # Households | % Households |
| Dial-Up Internet | 0 | 0.0% |
| Broadband Home | 324 | 69.1% |
| Cellular Data Only | 64 | 13.7% |
| Satellite Internet | 0 | 0.0% |
| No Internet | 81 | 17.3% |
| Total | 469 | 100.0% |
Jefferson Heights Summary
Jefferson Heights is a neighborhood in the northern part of the New York City borough of Manhattan. It is bounded by the Harlem River to the north, 155th Street to the south, Edgecombe Avenue to the east, and Amsterdam Avenue to the west. The neighborhood is part of Manhattan Community District 10, and its ZIP Code is 10032.
History
Jefferson Heights was originally part of the village of Harlem, which was established in 1658. The area was known as "Jefferson Heights" by the late 19th century, and was annexed to New York City in 1873. The neighborhood was largely rural until the early 20th century, when it began to be developed as a residential area. By the 1920s, the area was largely built up with apartment buildings and rowhouses.
Geography
Jefferson Heights is located in the northern part of Manhattan, bounded by the Harlem River to the north, 155th Street to the south, Edgecombe Avenue to the east, and Amsterdam Avenue to the west. The neighborhood is part of Manhattan Community District 10.
Economy
Jefferson Heights is a primarily residential neighborhood, with few businesses or commercial establishments. The area is home to a number of small businesses, including restaurants, cafes, and convenience stores.
Demographics
As of the 2010 United States Census, there were 11,845 people living in Jefferson Heights. The racial makeup of the neighborhood was 57.2% Black or African American, 28.2% White, 8.2% Hispanic or Latino, 4.2% Asian, and 2.2% other races. The median household income was $37,945, and the median rent was $1,095.
Conclusion
Jefferson Heights is a neighborhood in the northern part of Manhattan, New York City. It is bounded by the Harlem River to the north, 155th Street to the south, Edgecombe Avenue to the east, and Amsterdam Avenue to the west. The neighborhood is primarily residential, with few businesses or commercial establishments. As of the 2010 United States Census, the population of Jefferson Heights was 11,845, and the median household income was $37,945.
Common Questions
What is Per Capita Income in Jefferson Heights?
Per Capita income in Jefferson Heights is $23,819.
What is the Median Family Income in Jefferson Heights?
Median Family Income in Jefferson Heights is $79,250.
What is the Median Household income in Jefferson Heights?
Median Household Income in Jefferson Heights is $66,023.
What is Income or Wage Gap in Jefferson Heights?
Income or Wage Gap in Jefferson Heights is 12.3%.
Women in Jefferson Heights earn 87.7 cents for every dollar earned by a man.
What is Inequality or Gini Index in Jefferson Heights?
Inequality or Gini Index in Jefferson Heights is 0.32.
What is the Total Population of Jefferson Heights?
Total Population of Jefferson Heights is 1,435.
What is the Total Male Population of Jefferson Heights?
Total Male Population of Jefferson Heights is 506.
What is the Total Female Population of Jefferson Heights?
Total Female Population of Jefferson Heights is 929.
What is the Ratio of Males per 100 Females in Jefferson Heights?
There are 54.47 Males per 100 Females in Jefferson Heights.
What is the Ratio of Females per 100 Males in Jefferson Heights?
There are 183.60 Females per 100 Males in Jefferson Heights.
What is the Median Population Age in Jefferson Heights?
Median Population Age in Jefferson Heights is 50.1 Years.
What is the Average Family Size in Jefferson Heights
Average Family Size in Jefferson Heights is 3.4 People.
What is the Average Household Size in Jefferson Heights
Average Household Size in Jefferson Heights is 2.5 People.
How Large is the Labor Force in Jefferson Heights?
There are 528 People in the Labor Forcein in Jefferson Heights.
What is the Percentage of People in the Labor Force in Jefferson Heights?
50.0% of People are in the Labor Force in Jefferson Heights.
What is the Unemployment Rate in Jefferson Heights?
Unemployment Rate in Jefferson Heights is 1.9%.