Vails Gate, NY Map & Demographics
Vails Gate Map
Vails Gate Overview
$38,966
PER CAPITA INCOME
$96,111
AVG FAMILY INCOME
$66,438
AVG HOUSEHOLD INCOME
3.3%
WAGE / INCOME GAP [ % ]
96.7¢/ $1
WAGE / INCOME GAP [ $ ]
$5,638
FAMILY INCOME DEFICIT
0.38
INEQUALITY / GINI INDEX
2,881
TOTAL POPULATION
1,478
MALE POPULATION
1,403
FEMALE POPULATION
105.35
MALES / 100 FEMALES
94.93
FEMALES / 100 MALES
39.2
MEDIAN AGE
3.3
AVG FAMILY SIZE
2.2
AVG HOUSEHOLD SIZE
1,573
LABOR FORCE [ PEOPLE ]
64.5%
PERCENT IN LABOR FORCE
4.2%
UNEMPLOYMENT RATE
Vails Gate Area Codes
Income in Vails Gate
Income Overview in Vails Gate
Per Capita Income in Vails Gate is $38,966, while median incomes of families and households are $96,111 and $66,438 respectively.
| Characteristic | Number | Measure |
| Per Capita Income | 2,881 | $38,966 |
| Median Family Income | 622 | $96,111 |
| Mean Family Income | 622 | $100,247 |
| Median Household Income | 1,300 | $66,438 |
| Mean Household Income | 1,300 | $86,549 |
| Income Deficit | 622 | $5,638 |
| Wage / Income Gap (%) | 2,881 | 3.29% |
| Wage / Income Gap ($) | 2,881 | 96.71¢ per $1 |
| Gini / Inequality Index | 2,881 | 0.38 |
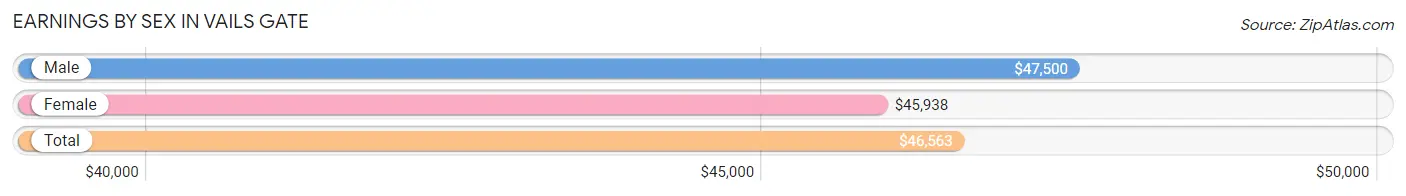
Earnings by Sex in Vails Gate
Average Earnings in Vails Gate are $46,563, $47,500 for men and $45,938 for women, a difference of 3.3%.
| Sex | Number | Average Earnings |
| Male | 796 (50.0%) | $47,500 |
| Female | 795 (50.0%) | $45,938 |
| Total | 1,591 (100.0%) | $46,563 |
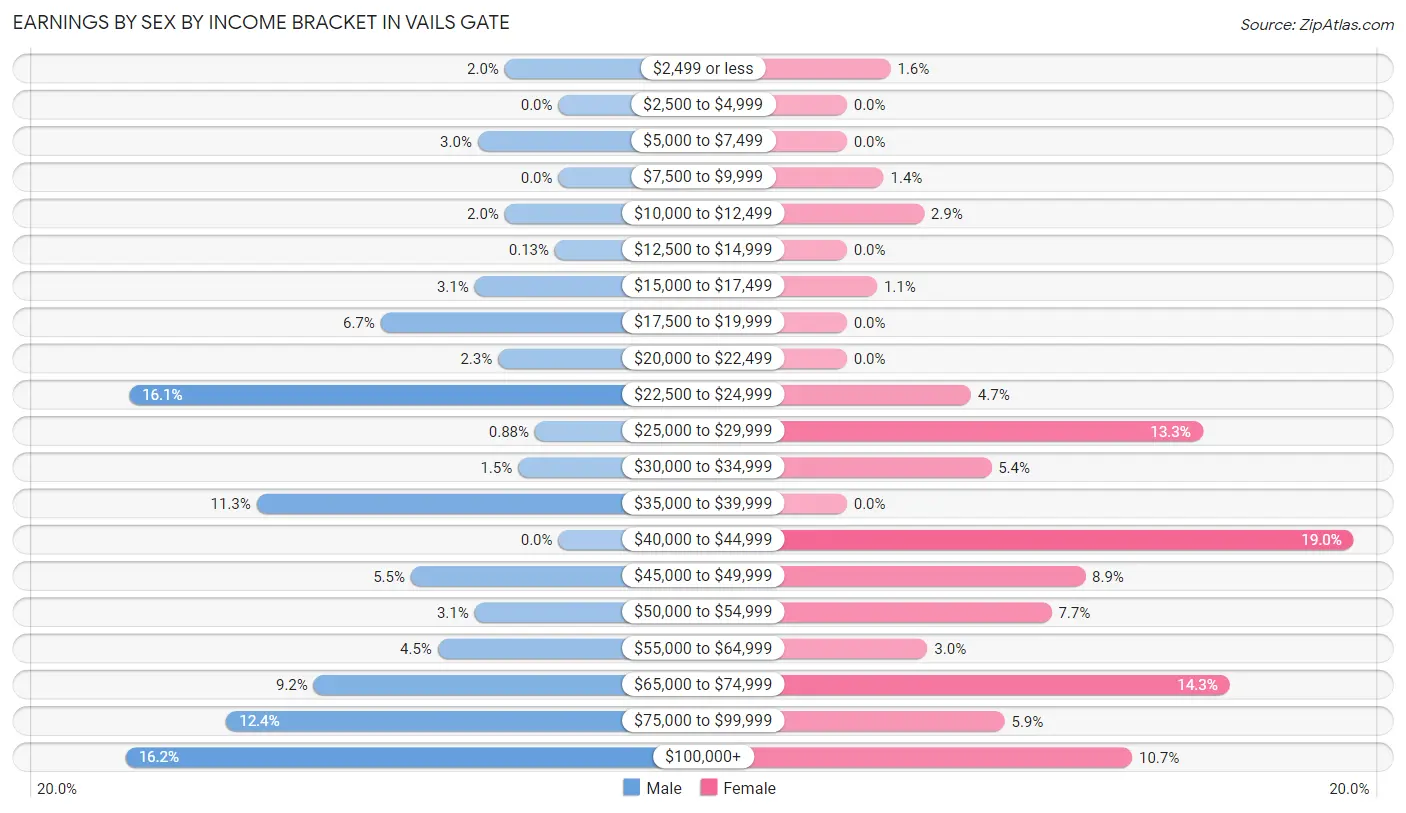
Earnings by Sex by Income Bracket in Vails Gate
The most common earnings brackets in Vails Gate are $100,000+ for men (129 | 16.2%) and $40,000 to $44,999 for women (151 | 19.0%).
| Income | Male | Female |
| $2,499 or less | 16 (2.0%) | 13 (1.6%) |
| $2,500 to $4,999 | 0 (0.0%) | 0 (0.0%) |
| $5,000 to $7,499 | 24 (3.0%) | 0 (0.0%) |
| $7,500 to $9,999 | 0 (0.0%) | 11 (1.4%) |
| $10,000 to $12,499 | 16 (2.0%) | 23 (2.9%) |
| $12,500 to $14,999 | 1 (0.1%) | 0 (0.0%) |
| $15,000 to $17,499 | 25 (3.1%) | 9 (1.1%) |
| $17,500 to $19,999 | 53 (6.7%) | 0 (0.0%) |
| $20,000 to $22,499 | 18 (2.3%) | 0 (0.0%) |
| $22,500 to $24,999 | 128 (16.1%) | 37 (4.6%) |
| $25,000 to $29,999 | 7 (0.9%) | 106 (13.3%) |
| $30,000 to $34,999 | 12 (1.5%) | 43 (5.4%) |
| $35,000 to $39,999 | 90 (11.3%) | 0 (0.0%) |
| $40,000 to $44,999 | 0 (0.0%) | 151 (19.0%) |
| $45,000 to $49,999 | 44 (5.5%) | 71 (8.9%) |
| $50,000 to $54,999 | 25 (3.1%) | 61 (7.7%) |
| $55,000 to $64,999 | 36 (4.5%) | 24 (3.0%) |
| $65,000 to $74,999 | 73 (9.2%) | 114 (14.3%) |
| $75,000 to $99,999 | 99 (12.4%) | 47 (5.9%) |
| $100,000+ | 129 (16.2%) | 85 (10.7%) |
| Total | 796 (100.0%) | 795 (100.0%) |
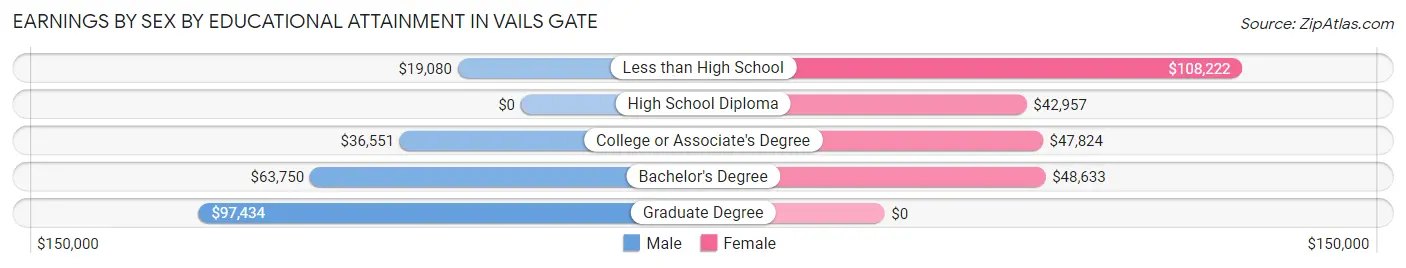
Earnings by Sex by Educational Attainment in Vails Gate
Average earnings in Vails Gate are $37,250 for men and $48,432 for women, a difference of 23.1%. Men with an educational attainment of graduate degree enjoy the highest average annual earnings of $97,434, while those with less than high school education earn the least with $19,080. Women with an educational attainment of less than high school earn the most with the average annual earnings of $108,222, while those with high school diploma education have the smallest earnings of $42,957.
| Educational Attainment | Male Income | Female Income |
| Less than High School | $19,080 | $108,222 |
| High School Diploma | - | - |
| College or Associate's Degree | $36,551 | $47,824 |
| Bachelor's Degree | $63,750 | $48,633 |
| Graduate Degree | $97,434 | $0 |
| Total | $37,250 | $48,432 |
Family Income in Vails Gate
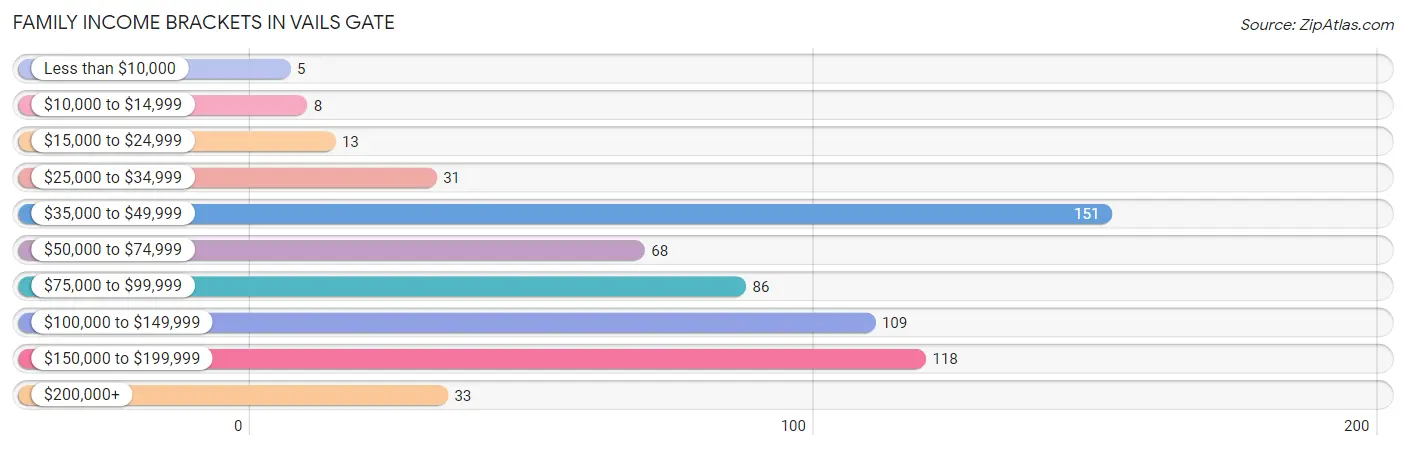
Family Income Brackets in Vails Gate
According to the Vails Gate family income data, there are 151 families falling into the $35,000 to $49,999 income range, which is the most common income bracket and makes up 24.3% of all families. Conversely, the less than $10,000 income bracket is the least frequent group with only 5 families (0.8%) belonging to this category.
| Income Bracket | # Families | % Families |
| Less than $10,000 | 5 | 0.8% |
| $10,000 to $14,999 | 8 | 1.3% |
| $15,000 to $24,999 | 13 | 2.1% |
| $25,000 to $34,999 | 31 | 5.0% |
| $35,000 to $49,999 | 151 | 24.3% |
| $50,000 to $74,999 | 68 | 10.9% |
| $75,000 to $99,999 | 86 | 13.8% |
| $100,000 to $149,999 | 109 | 17.5% |
| $150,000 to $199,999 | 118 | 19.0% |
| $200,000+ | 33 | 5.3% |
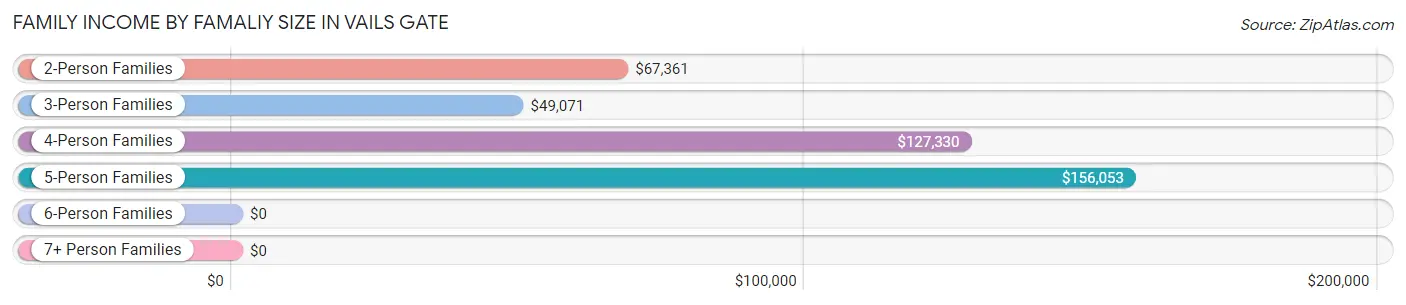
Family Income by Famaliy Size in Vails Gate
5-person families (70 | 11.3%) account for the highest median family income in Vails Gate with $156,053 per family, while 2-person families (170 | 27.3%) have the highest median income of $33,680 per family member.
| Income Bracket | # Families | Median Income |
| 2-Person Families | 170 (27.3%) | $67,361 |
| 3-Person Families | 228 (36.7%) | $49,071 |
| 4-Person Families | 101 (16.2%) | $127,330 |
| 5-Person Families | 70 (11.3%) | $156,053 |
| 6-Person Families | 53 (8.5%) | $0 |
| 7+ Person Families | 0 (0.0%) | $0 |
| Total | 622 (100.0%) | $96,111 |
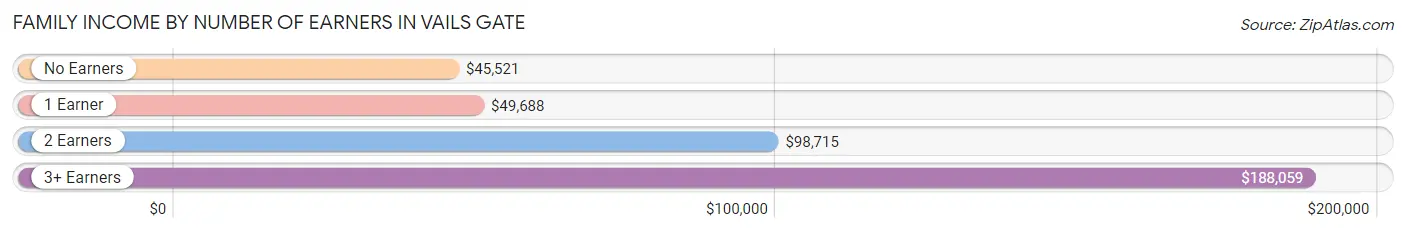
Family Income by Number of Earners in Vails Gate
The median family income in Vails Gate is $96,111, with families comprising 3+ earners (59) having the highest median family income of $188,059, while families with no earners (81) have the lowest median family income of $45,521, accounting for 9.5% and 13.0% of families, respectively.
| Number of Earners | # Families | Median Income |
| No Earners | 81 (13.0%) | $45,521 |
| 1 Earner | 141 (22.7%) | $49,688 |
| 2 Earners | 341 (54.8%) | $98,715 |
| 3+ Earners | 59 (9.5%) | $188,059 |
| Total | 622 (100.0%) | $96,111 |
Household Income in Vails Gate
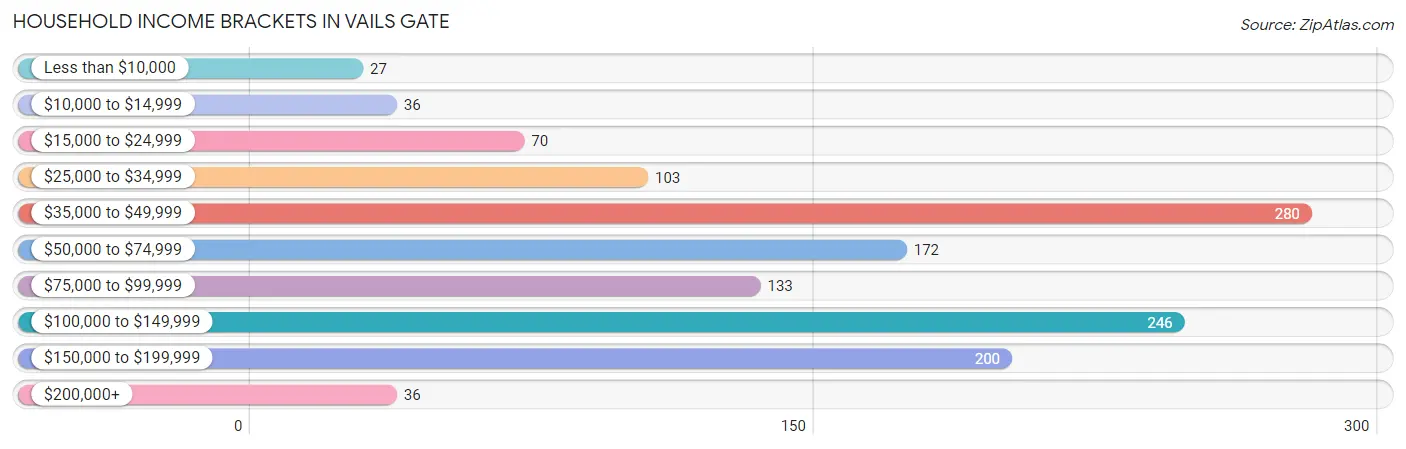
Household Income Brackets in Vails Gate
With 280 households falling in the category, the $35,000 to $49,999 income range is the most frequent in Vails Gate, accounting for 21.5% of all households. In contrast, only 27 households (2.1%) fall into the less than $10,000 income bracket, making it the least populous group.
| Income Bracket | # Households | % Households |
| Less than $10,000 | 27 | 2.1% |
| $10,000 to $14,999 | 36 | 2.8% |
| $15,000 to $24,999 | 70 | 5.4% |
| $25,000 to $34,999 | 103 | 7.9% |
| $35,000 to $49,999 | 280 | 21.5% |
| $50,000 to $74,999 | 172 | 13.2% |
| $75,000 to $99,999 | 133 | 10.2% |
| $100,000 to $149,999 | 246 | 18.9% |
| $150,000 to $199,999 | 200 | 15.4% |
| $200,000+ | 36 | 2.8% |
Household Income by Householder Age in Vails Gate
The median household income in Vails Gate is $66,438, with the highest median household income of $101,094 found in the 25 to 44 years age bracket for the primary householder. A total of 435 households (33.5%) fall into this category. Meanwhile, the 15 to 24 years age bracket for the primary householder has the lowest median household income of $0, with 47 households (3.6%) in this group.
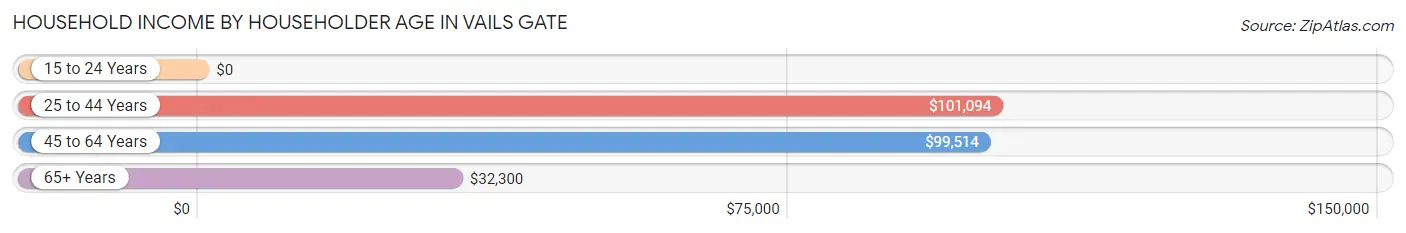
| Income Bracket | # Households | Median Income |
| 15 to 24 Years | 47 (3.6%) | $0 |
| 25 to 44 Years | 435 (33.5%) | $101,094 |
| 45 to 64 Years | 486 (37.4%) | $99,514 |
| 65+ Years | 332 (25.5%) | $32,300 |
| Total | 1,300 (100.0%) | $66,438 |
Poverty in Vails Gate
Income Below Poverty by Sex and Age in Vails Gate
With 6.5% poverty level for males and 4.9% for females among the residents of Vails Gate, 55 to 64 year old males and under 5 year old females are the most vulnerable to poverty, with 41 males (27.3%) and 6 females (19.4%) in their respective age groups living below the poverty level.
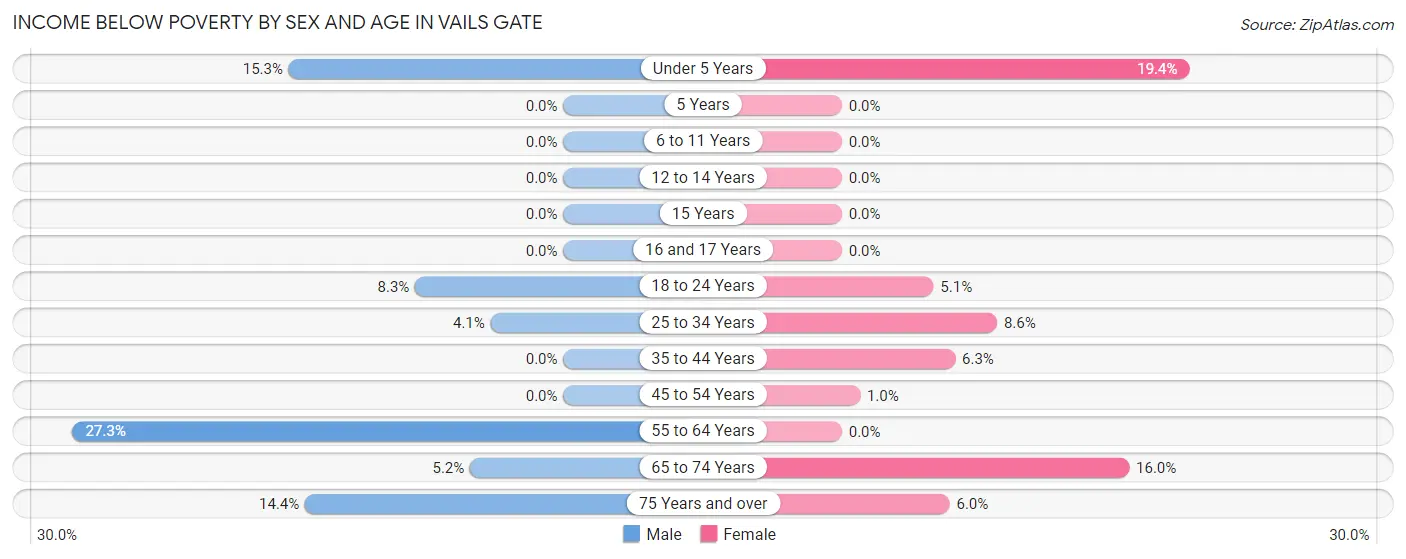
| Age Bracket | Male | Female |
| Under 5 Years | 13 (15.3%) | 6 (19.4%) |
| 5 Years | 0 (0.0%) | 0 (0.0%) |
| 6 to 11 Years | 0 (0.0%) | 0 (0.0%) |
| 12 to 14 Years | 0 (0.0%) | 0 (0.0%) |
| 15 Years | 0 (0.0%) | 0 (0.0%) |
| 16 and 17 Years | 0 (0.0%) | 0 (0.0%) |
| 18 to 24 Years | 8 (8.3%) | 5 (5.1%) |
| 25 to 34 Years | 9 (4.1%) | 21 (8.6%) |
| 35 to 44 Years | 0 (0.0%) | 13 (6.3%) |
| 45 to 54 Years | 0 (0.0%) | 2 (1.0%) |
| 55 to 64 Years | 41 (27.3%) | 0 (0.0%) |
| 65 to 74 Years | 4 (5.2%) | 12 (16.0%) |
| 75 Years and over | 21 (14.4%) | 9 (6.0%) |
| Total | 96 (6.5%) | 68 (4.9%) |
Income Above Poverty by Sex and Age in Vails Gate
According to the poverty statistics in Vails Gate, males aged 5 years and females aged 6 to 11 years are the age groups that are most secure financially, with 100.0% of males and 100.0% of females in these age groups living above the poverty line.
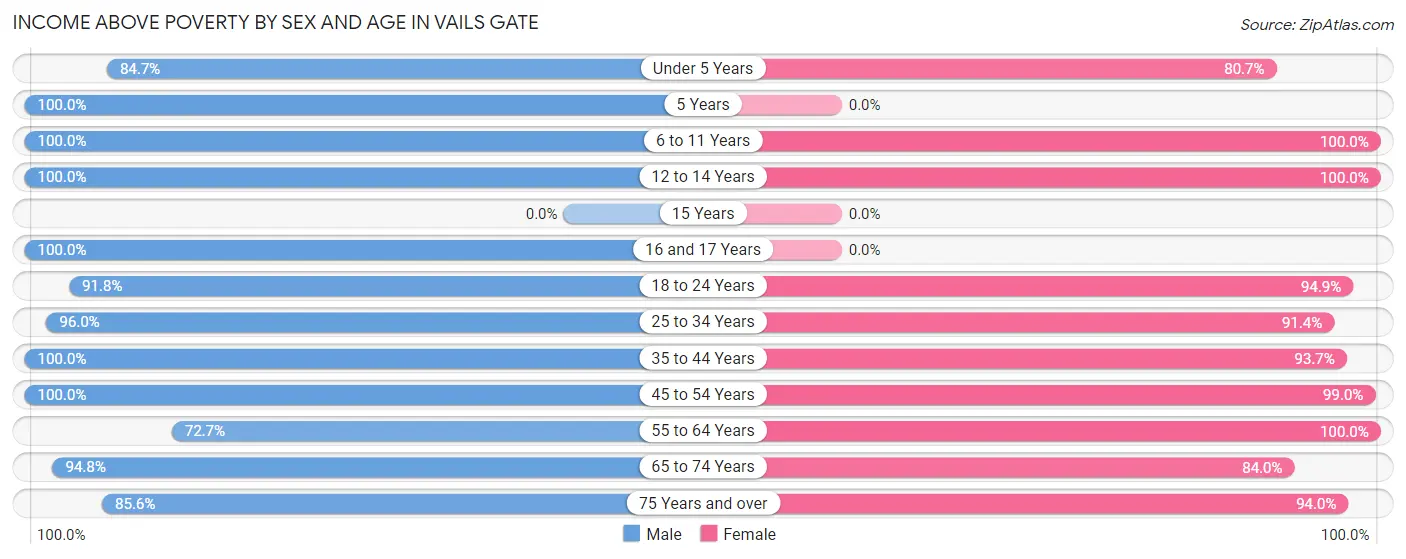
| Age Bracket | Male | Female |
| Under 5 Years | 72 (84.7%) | 25 (80.6%) |
| 5 Years | 60 (100.0%) | 0 (0.0%) |
| 6 to 11 Years | 27 (100.0%) | 98 (100.0%) |
| 12 to 14 Years | 59 (100.0%) | 82 (100.0%) |
| 15 Years | 0 (0.0%) | 0 (0.0%) |
| 16 and 17 Years | 134 (100.0%) | 0 (0.0%) |
| 18 to 24 Years | 89 (91.7%) | 93 (94.9%) |
| 25 to 34 Years | 213 (96.0%) | 222 (91.4%) |
| 35 to 44 Years | 269 (100.0%) | 193 (93.7%) |
| 45 to 54 Years | 152 (100.0%) | 196 (99.0%) |
| 55 to 64 Years | 109 (72.7%) | 222 (100.0%) |
| 65 to 74 Years | 73 (94.8%) | 63 (84.0%) |
| 75 Years and over | 125 (85.6%) | 141 (94.0%) |
| Total | 1,382 (93.5%) | 1,335 (95.2%) |
Income Below Poverty Among Married-Couple Families in Vails Gate
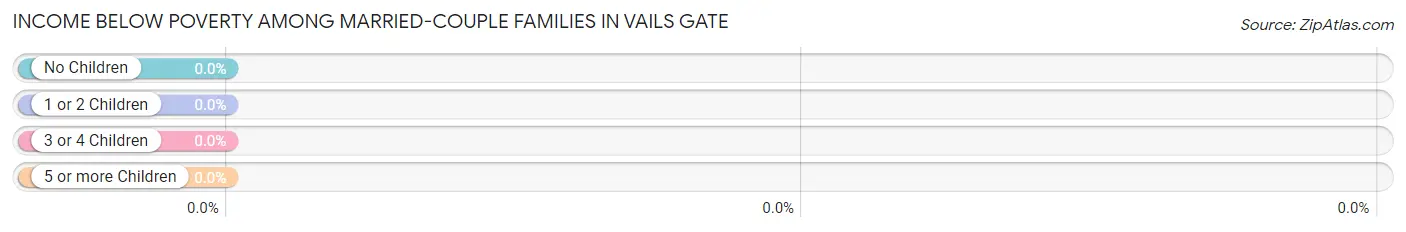
| Children | Above Poverty | Below Poverty |
| No Children | 205 (100.0%) | 0 (0.0%) |
| 1 or 2 Children | 128 (100.0%) | 0 (0.0%) |
| 3 or 4 Children | 80 (100.0%) | 0 (0.0%) |
| 5 or more Children | 0 (0.0%) | 0 (0.0%) |
| Total | 413 (100.0%) | 0 (0.0%) |
Income Below Poverty Among Single-Parent Households in Vails Gate
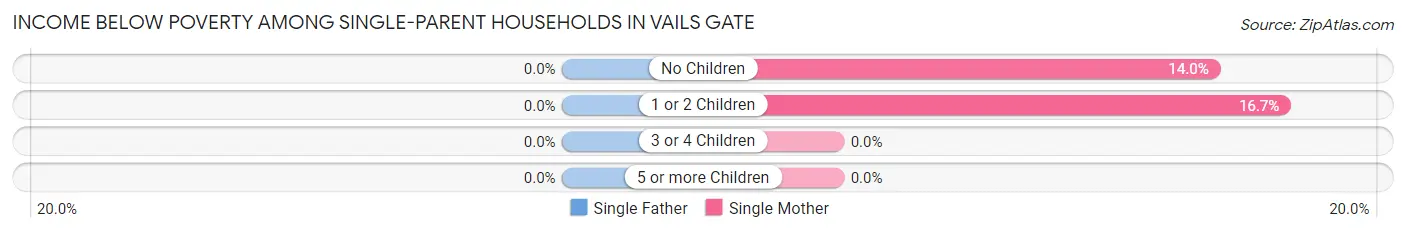
| Children | Single Father | Single Mother |
| No Children | 0 (0.0%) | 8 (14.0%) |
| 1 or 2 Children | 0 (0.0%) | 18 (16.7%) |
| 3 or 4 Children | 0 (0.0%) | 0 (0.0%) |
| 5 or more Children | 0 (0.0%) | 0 (0.0%) |
| Total | 0 (0.0%) | 26 (15.8%) |
Income Below Poverty Among Married-Couple vs Single-Parent Households in Vails Gate
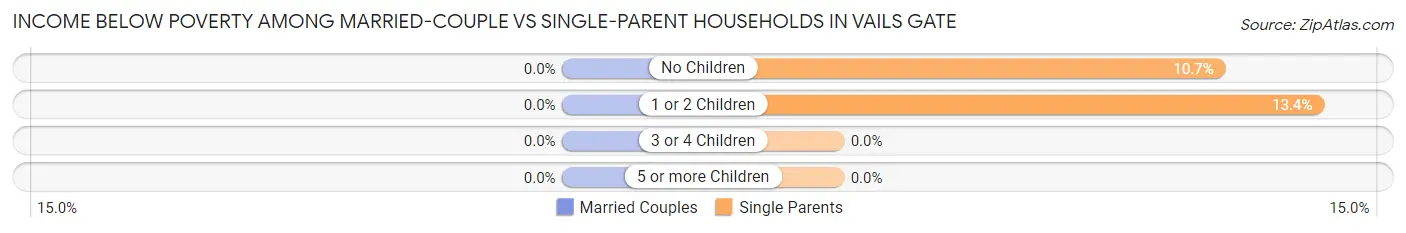
| Children | Married-Couple Families | Single-Parent Households |
| No Children | 0 (0.0%) | 8 (10.7%) |
| 1 or 2 Children | 0 (0.0%) | 18 (13.4%) |
| 3 or 4 Children | 0 (0.0%) | 0 (0.0%) |
| 5 or more Children | 0 (0.0%) | 0 (0.0%) |
| Total | 0 (0.0%) | 26 (12.4%) |
Race in Vails Gate
The most populous races in Vails Gate are White / Caucasian (1,263 | 43.8%), Black / African American (959 | 33.3%), and Hispanic or Latino (871 | 30.2%).
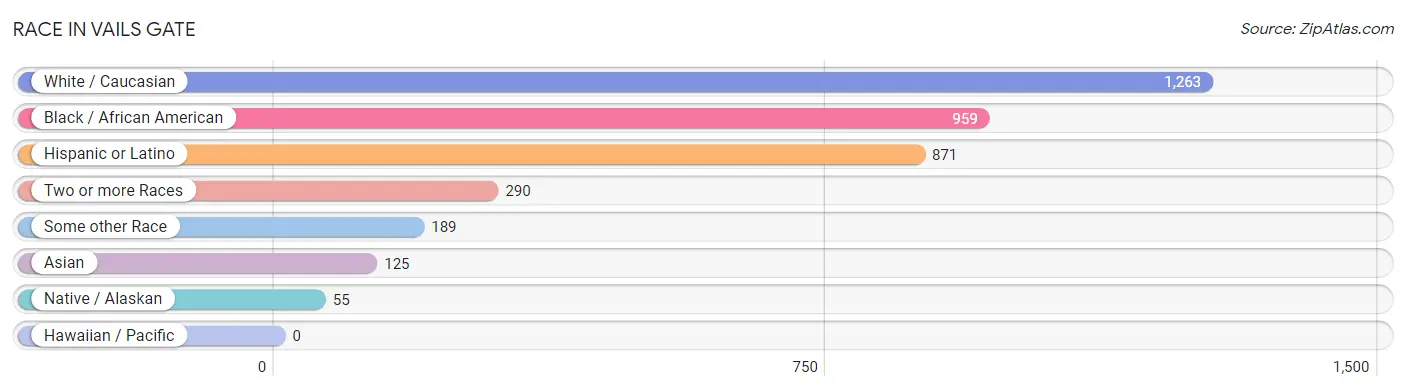
| Race | # Population | % Population |
| Asian | 125 | 4.3% |
| Black / African American | 959 | 33.3% |
| Hawaiian / Pacific | 0 | 0.0% |
| Hispanic or Latino | 871 | 30.2% |
| Native / Alaskan | 55 | 1.9% |
| White / Caucasian | 1,263 | 43.8% |
| Two or more Races | 290 | 10.1% |
| Some other Race | 189 | 6.6% |
| Total | 2,881 | 100.0% |
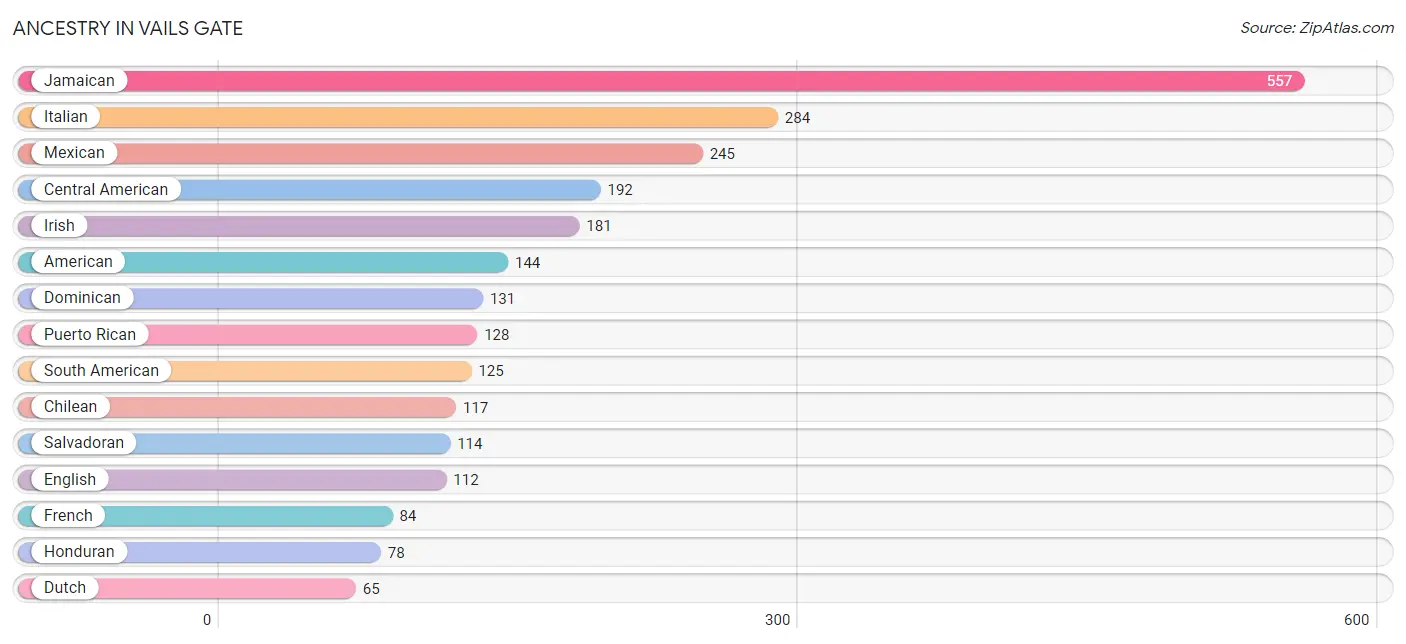
Ancestry in Vails Gate
The most populous ancestries reported in Vails Gate are Jamaican (557 | 19.3%), Italian (284 | 9.9%), Mexican (245 | 8.5%), Central American (192 | 6.7%), and Irish (181 | 6.3%), together accounting for 50.6% of all Vails Gate residents.
| Ancestry | # Population | % Population |
| American | 144 | 5.0% |
| Arab | 32 | 1.1% |
| Basque | 8 | 0.3% |
| Bhutanese | 20 | 0.7% |
| Blackfeet | 10 | 0.4% |
| Central American | 192 | 6.7% |
| Chilean | 117 | 4.1% |
| Colombian | 8 | 0.3% |
| Czech | 40 | 1.4% |
| Czechoslovakian | 13 | 0.4% |
| Dominican | 131 | 4.5% |
| Dutch | 65 | 2.3% |
| Egyptian | 12 | 0.4% |
| English | 112 | 3.9% |
| European | 3 | 0.1% |
| French | 84 | 2.9% |
| French Canadian | 9 | 0.3% |
| German | 31 | 1.1% |
| Haitian | 49 | 1.7% |
| Honduran | 78 | 2.7% |
| Hungarian | 50 | 1.7% |
| Indian (Asian) | 33 | 1.1% |
| Irish | 181 | 6.3% |
| Italian | 284 | 9.9% |
| Jamaican | 557 | 19.3% |
| Korean | 8 | 0.3% |
| Laotian | 1 | 0.0% |
| Latvian | 5 | 0.2% |
| Lithuanian | 13 | 0.4% |
| Mexican | 245 | 8.5% |
| Mexican American Indian | 55 | 1.9% |
| Moroccan | 13 | 0.4% |
| Norwegian | 24 | 0.8% |
| Palestinian | 7 | 0.2% |
| Polish | 35 | 1.2% |
| Puerto Rican | 128 | 4.4% |
| Salvadoran | 114 | 4.0% |
| Slovak | 25 | 0.9% |
| South American | 125 | 4.3% |
| South American Indian | 8 | 0.3% |
| Swedish | 5 | 0.2% |
| Ukrainian | 14 | 0.5% |
| Vietnamese | 53 | 1.8% | View All 43 Rows |
Immigrants in Vails Gate
The most numerous immigrant groups reported in Vails Gate came from Latin America (806 | 28.0%), Caribbean (459 | 15.9%), Jamaica (318 | 11.0%), Central America (313 | 10.9%), and Mexico (121 | 4.2%), together accounting for 70.0% of all Vails Gate residents.
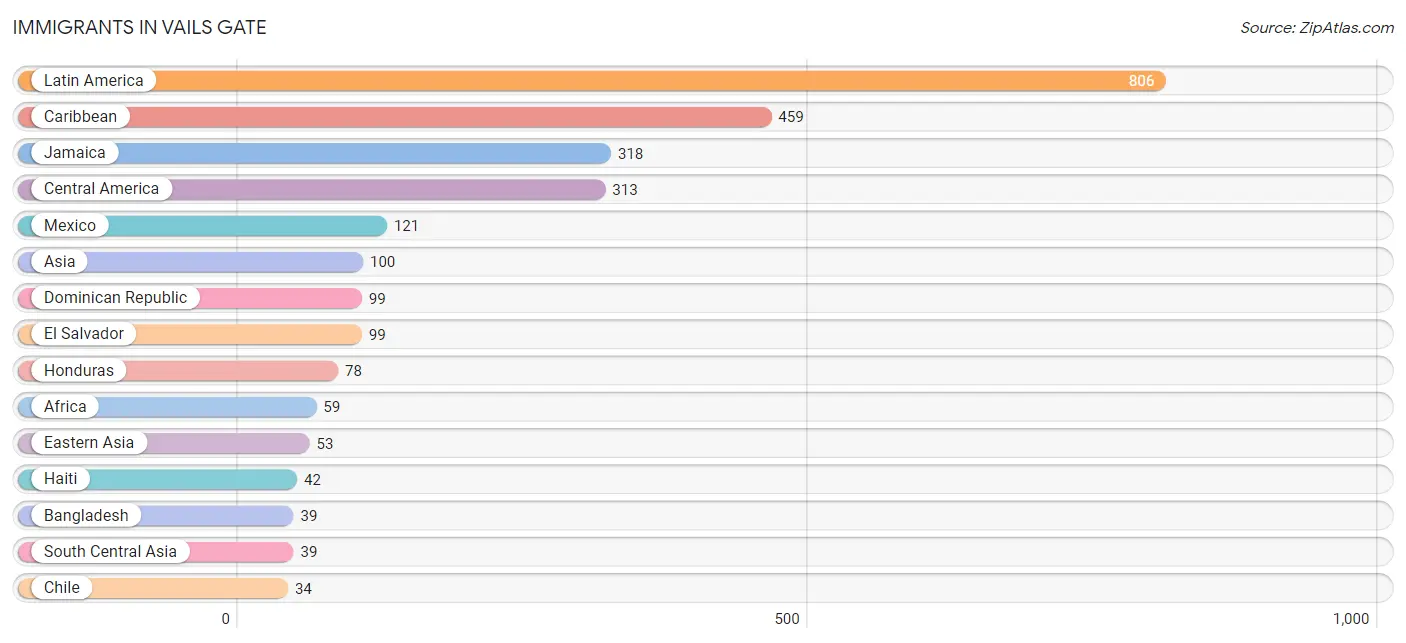
| Immigration Origin | # Population | % Population |
| Africa | 59 | 2.1% |
| Asia | 100 | 3.5% |
| Austria | 10 | 0.4% |
| Bangladesh | 39 | 1.3% |
| Belize | 15 | 0.5% |
| Caribbean | 459 | 15.9% |
| Central America | 313 | 10.9% |
| Chile | 34 | 1.2% |
| China | 33 | 1.1% |
| Dominican Republic | 99 | 3.4% |
| Eastern Africa | 34 | 1.2% |
| Eastern Asia | 53 | 1.8% |
| Egypt | 12 | 0.4% |
| El Salvador | 99 | 3.4% |
| Europe | 10 | 0.4% |
| Haiti | 42 | 1.5% |
| Honduras | 78 | 2.7% |
| Hong Kong | 26 | 0.9% |
| Jamaica | 318 | 11.0% |
| Japan | 20 | 0.7% |
| Latin America | 806 | 28.0% |
| Mexico | 121 | 4.2% |
| Morocco | 13 | 0.4% |
| Northern Africa | 25 | 0.9% |
| Philippines | 8 | 0.3% |
| South America | 34 | 1.2% |
| South Central Asia | 39 | 1.3% |
| South Eastern Asia | 8 | 0.3% |
| Western Europe | 10 | 0.4% | View All 29 Rows |
Sex and Age in Vails Gate
Sex and Age in Vails Gate
The most populous age groups in Vails Gate are 25 to 29 Years (202 | 13.7%) for men and 45 to 49 Years (184 | 13.1%) for women.
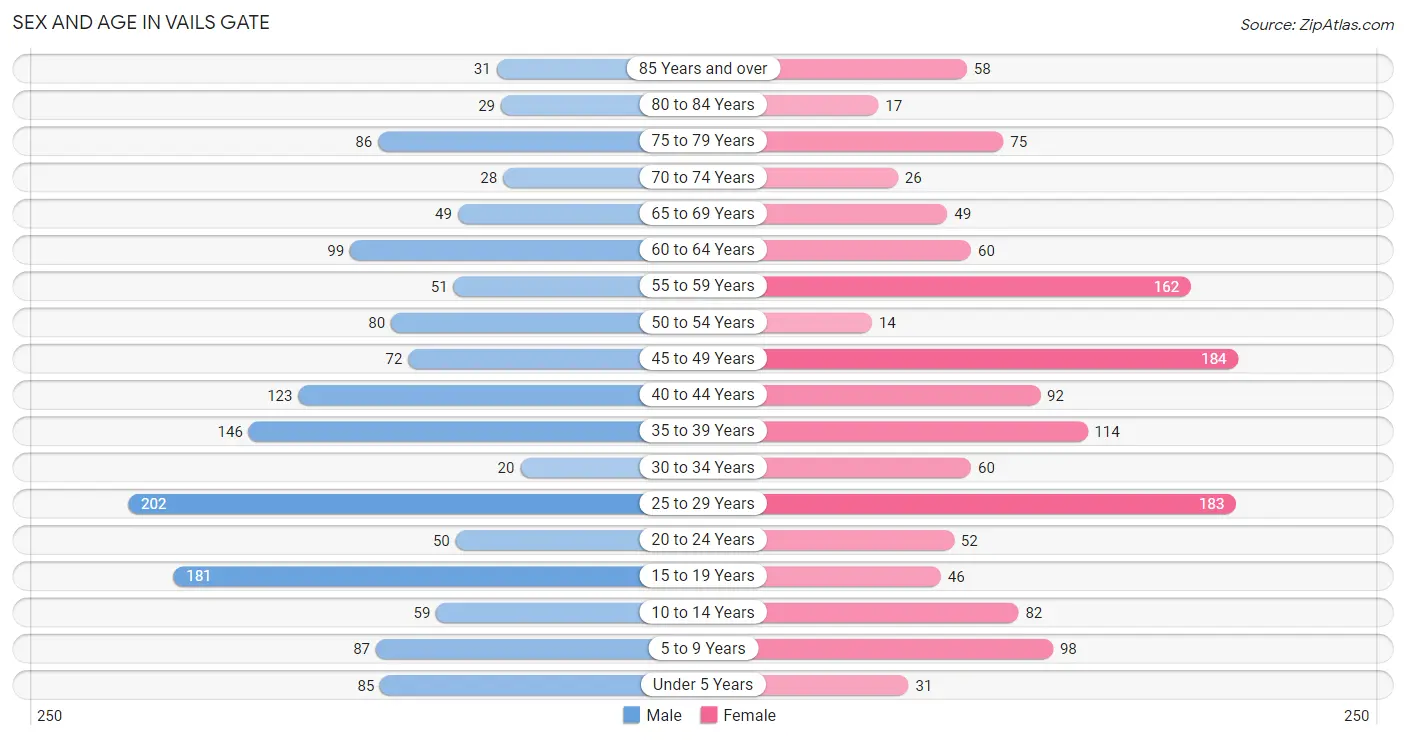
| Age Bracket | Male | Female |
| Under 5 Years | 85 (5.8%) | 31 (2.2%) |
| 5 to 9 Years | 87 (5.9%) | 98 (7.0%) |
| 10 to 14 Years | 59 (4.0%) | 82 (5.8%) |
| 15 to 19 Years | 181 (12.2%) | 46 (3.3%) |
| 20 to 24 Years | 50 (3.4%) | 52 (3.7%) |
| 25 to 29 Years | 202 (13.7%) | 183 (13.0%) |
| 30 to 34 Years | 20 (1.3%) | 60 (4.3%) |
| 35 to 39 Years | 146 (9.9%) | 114 (8.1%) |
| 40 to 44 Years | 123 (8.3%) | 92 (6.6%) |
| 45 to 49 Years | 72 (4.9%) | 184 (13.1%) |
| 50 to 54 Years | 80 (5.4%) | 14 (1.0%) |
| 55 to 59 Years | 51 (3.5%) | 162 (11.6%) |
| 60 to 64 Years | 99 (6.7%) | 60 (4.3%) |
| 65 to 69 Years | 49 (3.3%) | 49 (3.5%) |
| 70 to 74 Years | 28 (1.9%) | 26 (1.8%) |
| 75 to 79 Years | 86 (5.8%) | 75 (5.3%) |
| 80 to 84 Years | 29 (2.0%) | 17 (1.2%) |
| 85 Years and over | 31 (2.1%) | 58 (4.1%) |
| Total | 1,478 (100.0%) | 1,403 (100.0%) |
Families and Households in Vails Gate
Median Family Size in Vails Gate
The median family size in Vails Gate is 3.30 persons per family, with married-couple families (413 | 66.4%) accounting for the largest median family size of 3.66 persons per family. On the other hand, single male/father families (44 | 7.1%) represent the smallest median family size with 1.93 persons per family.
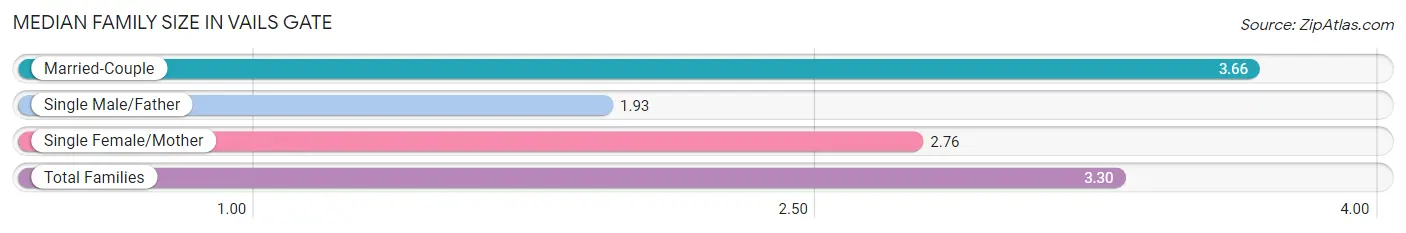
| Family Type | # Families | Family Size |
| Married-Couple | 413 (66.4%) | 3.66 |
| Single Male/Father | 44 (7.1%) | 1.93 |
| Single Female/Mother | 165 (26.5%) | 2.76 |
| Total Families | 622 (100.0%) | 3.30 |
Median Household Size in Vails Gate
The median household size in Vails Gate is 2.21 persons per household, with married-couple households (413 | 31.8%) accounting for the largest median household size of 3.66 persons per household. non-family households (678 | 52.1%) represent the smallest median household size with 1.10 persons per household.
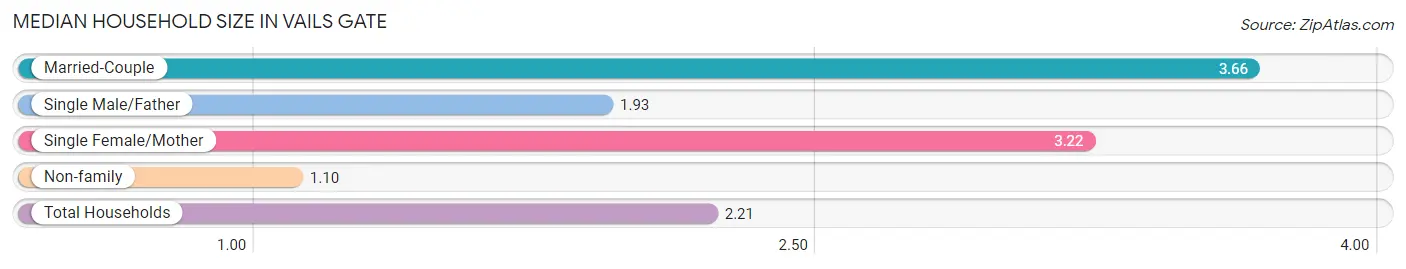
| Household Type | # Households | Household Size |
| Married-Couple | 413 (31.8%) | 3.66 |
| Single Male/Father | 44 (3.4%) | 1.93 |
| Single Female/Mother | 165 (12.7%) | 3.22 |
| Non-family | 678 (52.1%) | 1.10 |
| Total Households | 1,300 (100.0%) | 2.21 |
Household Size by Marriage Status in Vails Gate
Out of a total of 1,300 households in Vails Gate, 622 (47.8%) are family households, while 678 (52.1%) are nonfamily households. The most numerous type of family households are 4-person households, comprising 175, and the most common type of nonfamily households are 1-person households, comprising 627.
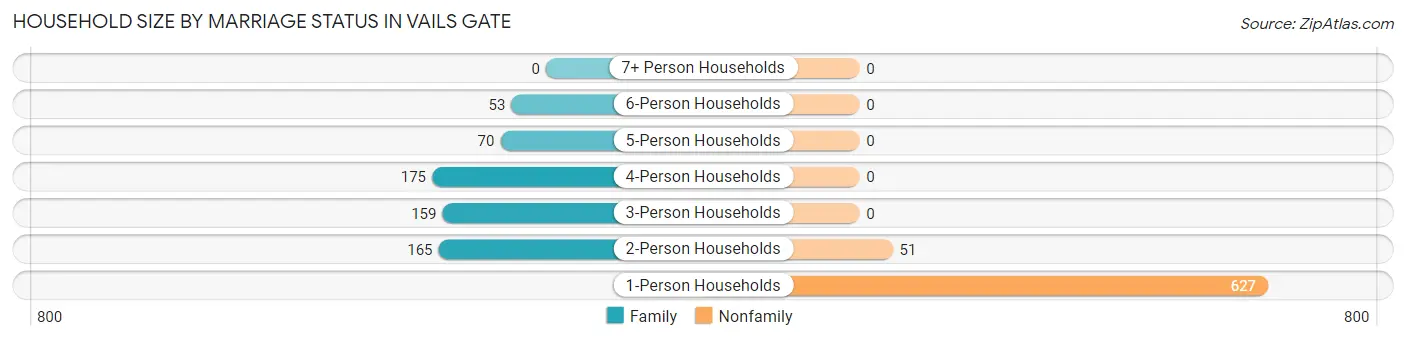
| Household Size | Family Households | Nonfamily Households |
| 1-Person Households | - | 627 (48.2%) |
| 2-Person Households | 165 (12.7%) | 51 (3.9%) |
| 3-Person Households | 159 (12.2%) | 0 (0.0%) |
| 4-Person Households | 175 (13.5%) | 0 (0.0%) |
| 5-Person Households | 70 (5.4%) | 0 (0.0%) |
| 6-Person Households | 53 (4.1%) | 0 (0.0%) |
| 7+ Person Households | 0 (0.0%) | 0 (0.0%) |
| Total | 622 (47.8%) | 678 (52.1%) |
Female Fertility in Vails Gate
Fertility by Age in Vails Gate
Average fertility rate in Vails Gate is 73.0 births per 1,000 women. Women in the age bracket of 35 to 50 years have the highest fertility rate with 136.0 births per 1,000 women. Women in the age bracket of 35 to 50 years acount for 100.0% of all women with births.
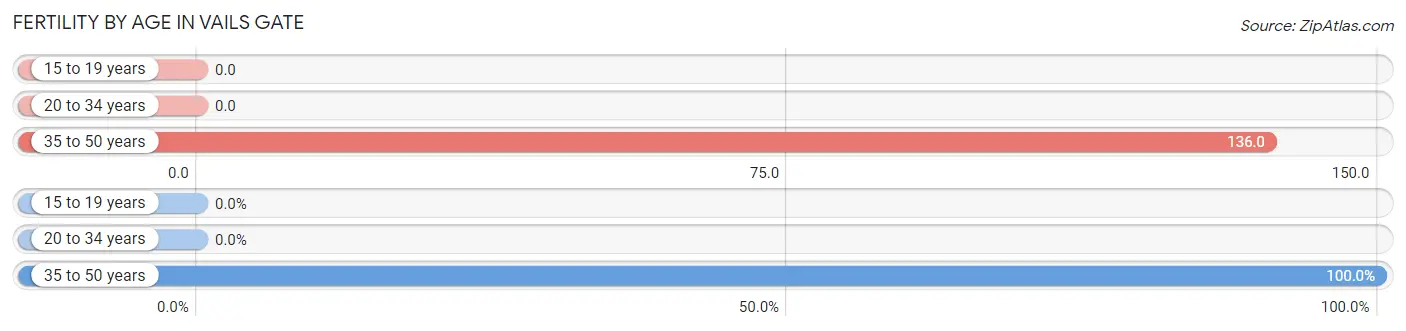
| Age Bracket | Women with Births | Births / 1,000 Women |
| 15 to 19 years | 0 (0.0%) | 0.0 |
| 20 to 34 years | 0 (0.0%) | 0.0 |
| 35 to 50 years | 53 (100.0%) | 136.0 |
| Total | 53 (100.0%) | 73.0 |
Fertility by Age by Marriage Status in Vails Gate
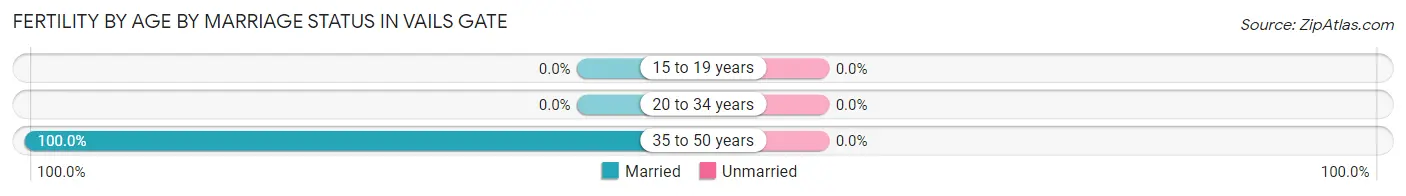
| Age Bracket | Married | Unmarried |
| 15 to 19 years | 0 (0.0%) | 0 (0.0%) |
| 20 to 34 years | 0 (0.0%) | 0 (0.0%) |
| 35 to 50 years | 53 (100.0%) | 0 (0.0%) |
| Total | 53 (100.0%) | 0 (0.0%) |
Fertility by Education in Vails Gate
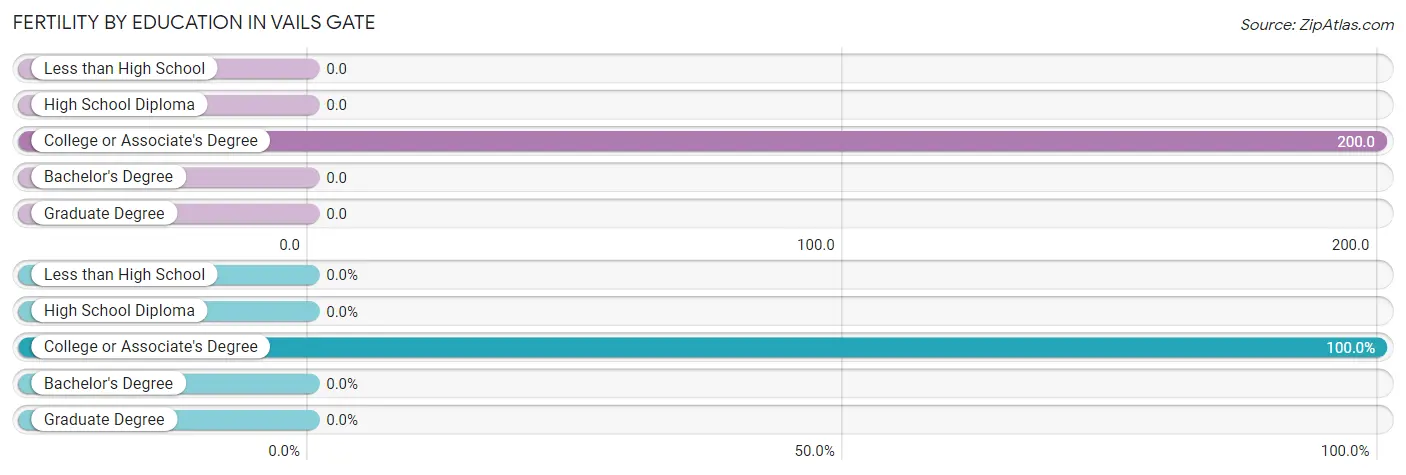
| Educational Attainment | Women with Births | Births / 1,000 Women |
| Less than High School | 0 (0.0%) | 0.0 |
| High School Diploma | 0 (0.0%) | 0.0 |
| College or Associate's Degree | 53 (100.0%) | 200.0 |
| Bachelor's Degree | 0 (0.0%) | 0.0 |
| Graduate Degree | 0 (0.0%) | 0.0 |
| Total | 53 (100.0%) | 73.0 |
Fertility by Education by Marriage Status in Vails Gate
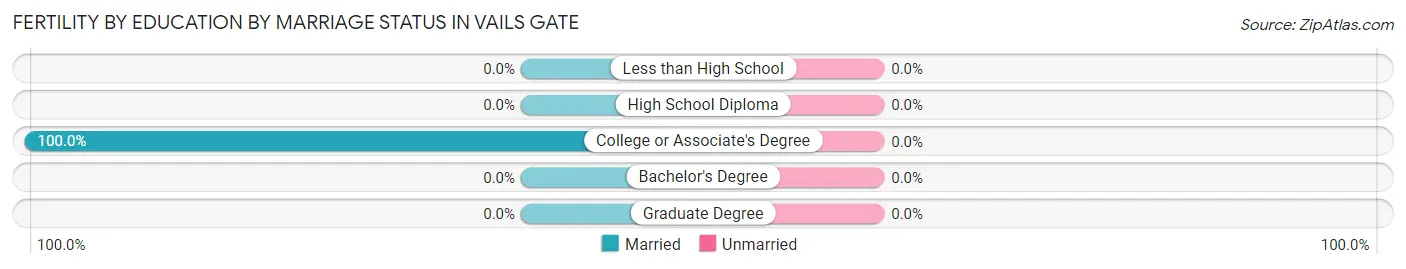
| Educational Attainment | Married | Unmarried |
| Less than High School | 0 (0.0%) | 0 (0.0%) |
| High School Diploma | 0 (0.0%) | 0 (0.0%) |
| College or Associate's Degree | 53 (100.0%) | 0 (0.0%) |
| Bachelor's Degree | 0 (0.0%) | 0 (0.0%) |
| Graduate Degree | 0 (0.0%) | 0 (0.0%) |
| Total | 53 (100.0%) | 0 (0.0%) |
Employment Characteristics in Vails Gate
Employment by Class of Employer in Vails Gate
Among the 1,452 employed individuals in Vails Gate, private company employees (765 | 52.7%), not-for-profit organizations (280 | 19.3%), and federal government employees (186 | 12.8%) make up the most common classes of employment.
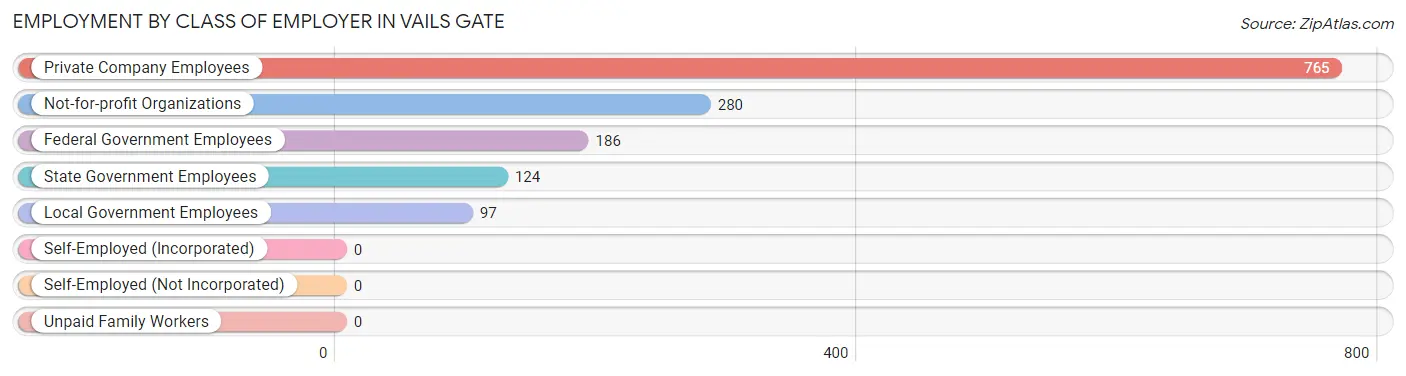
| Employer Class | # Employees | % Employees |
| Private Company Employees | 765 | 52.7% |
| Self-Employed (Incorporated) | 0 | 0.0% |
| Self-Employed (Not Incorporated) | 0 | 0.0% |
| Not-for-profit Organizations | 280 | 19.3% |
| Local Government Employees | 97 | 6.7% |
| State Government Employees | 124 | 8.5% |
| Federal Government Employees | 186 | 12.8% |
| Unpaid Family Workers | 0 | 0.0% |
| Total | 1,452 | 100.0% |
Employment Status by Age in Vails Gate
According to the labor force statistics for Vails Gate, out of the total population over 16 years of age (2,439), 64.5% or 1,573 individuals are in the labor force, with 4.2% or 66 of them unemployed. The age group with the highest labor force participation rate is 25 to 29 years, with 100.0% or 385 individuals in the labor force. Within the labor force, the 60 to 64 years age range has the highest percentage of unemployed individuals, with 18.8% or 18 of them being unemployed.
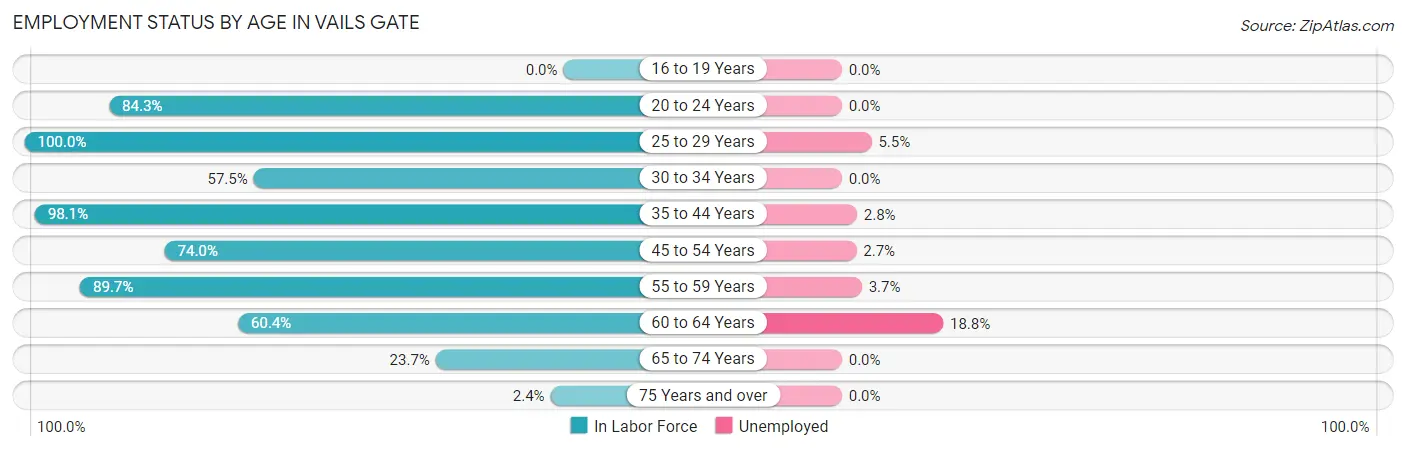
| Age Bracket | In Labor Force | Unemployed |
| 16 to 19 Years | 0 (0.0%) | 0 (0.0%) |
| 20 to 24 Years | 86 (84.3%) | 0 (0.0%) |
| 25 to 29 Years | 385 (100.0%) | 21 (5.5%) |
| 30 to 34 Years | 46 (57.5%) | 0 (0.0%) |
| 35 to 44 Years | 466 (98.1%) | 13 (2.8%) |
| 45 to 54 Years | 259 (74.0%) | 7 (2.7%) |
| 55 to 59 Years | 191 (89.7%) | 7 (3.7%) |
| 60 to 64 Years | 96 (60.4%) | 18 (18.8%) |
| 65 to 74 Years | 36 (23.7%) | 0 (0.0%) |
| 75 Years and over | 7 (2.4%) | 0 (0.0%) |
| Total | 1,573 (64.5%) | 66 (4.2%) |
Employment Status by Educational Attainment in Vails Gate
According to labor force statistics for Vails Gate, 86.8% of individuals (1,443) out of the total population between 25 and 64 years of age (1,662) are in the labor force, with 4.6% or 66 of them being unemployed. The group with the highest labor force participation rate are those with the educational attainment of less than high school, with 100.0% or 118 individuals in the labor force. Within the labor force, individuals with college / associate degree education have the highest percentage of unemployment, with 7.4% or 39 of them being unemployed.
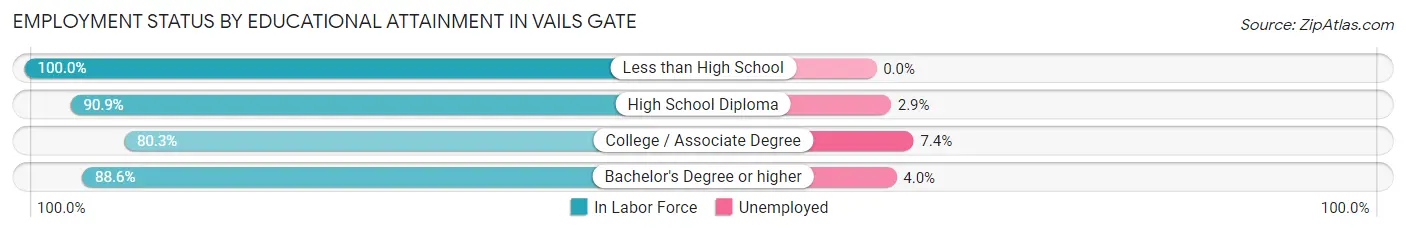
| Educational Attainment | In Labor Force | Unemployed |
| Less than High School | 118 (100.0%) | 0 (0.0%) |
| High School Diploma | 447 (90.9%) | 14 (2.9%) |
| College / Associate Degree | 527 (80.3%) | 49 (7.4%) |
| Bachelor's Degree or higher | 351 (88.6%) | 16 (4.0%) |
| Total | 1,443 (86.8%) | 76 (4.6%) |
Employment Occupations by Sex in Vails Gate
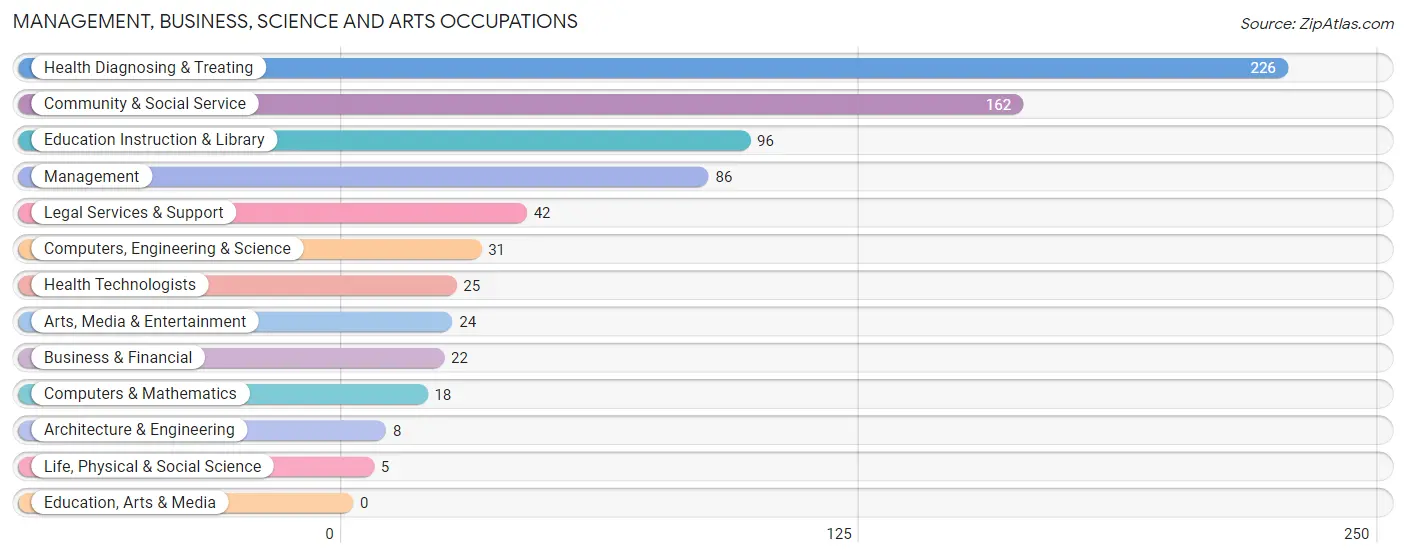
Management, Business, Science and Arts Occupations
The most common Management, Business, Science and Arts occupations in Vails Gate are Health Diagnosing & Treating (226 | 15.0%), Community & Social Service (162 | 10.8%), Education Instruction & Library (96 | 6.4%), Management (86 | 5.7%), and Legal Services & Support (42 | 2.8%).
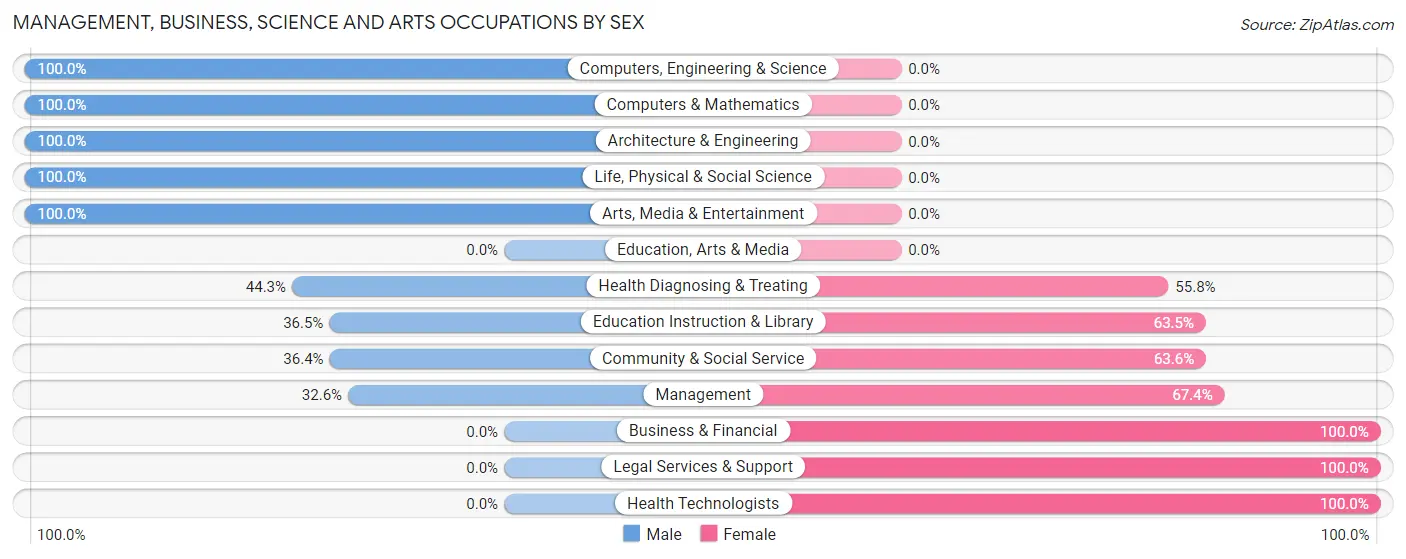
Management, Business, Science and Arts Occupations by Sex
Within the Management, Business, Science and Arts occupations in Vails Gate, the most male-oriented occupations are Computers, Engineering & Science (100.0%), Computers & Mathematics (100.0%), and Architecture & Engineering (100.0%), while the most female-oriented occupations are Business & Financial (100.0%), Legal Services & Support (100.0%), and Health Technologists (100.0%).
| Occupation | Male | Female |
| Management | 28 (32.6%) | 58 (67.4%) |
| Business & Financial | 0 (0.0%) | 22 (100.0%) |
| Computers, Engineering & Science | 31 (100.0%) | 0 (0.0%) |
| Computers & Mathematics | 18 (100.0%) | 0 (0.0%) |
| Architecture & Engineering | 8 (100.0%) | 0 (0.0%) |
| Life, Physical & Social Science | 5 (100.0%) | 0 (0.0%) |
| Community & Social Service | 59 (36.4%) | 103 (63.6%) |
| Education, Arts & Media | 0 (0.0%) | 0 (0.0%) |
| Legal Services & Support | 0 (0.0%) | 42 (100.0%) |
| Education Instruction & Library | 35 (36.5%) | 61 (63.5%) |
| Arts, Media & Entertainment | 24 (100.0%) | 0 (0.0%) |
| Health Diagnosing & Treating | 100 (44.3%) | 126 (55.7%) |
| Health Technologists | 0 (0.0%) | 25 (100.0%) |
| Total (Category) | 218 (41.4%) | 309 (58.6%) |
| Total (Overall) | 778 (51.7%) | 728 (48.3%) |
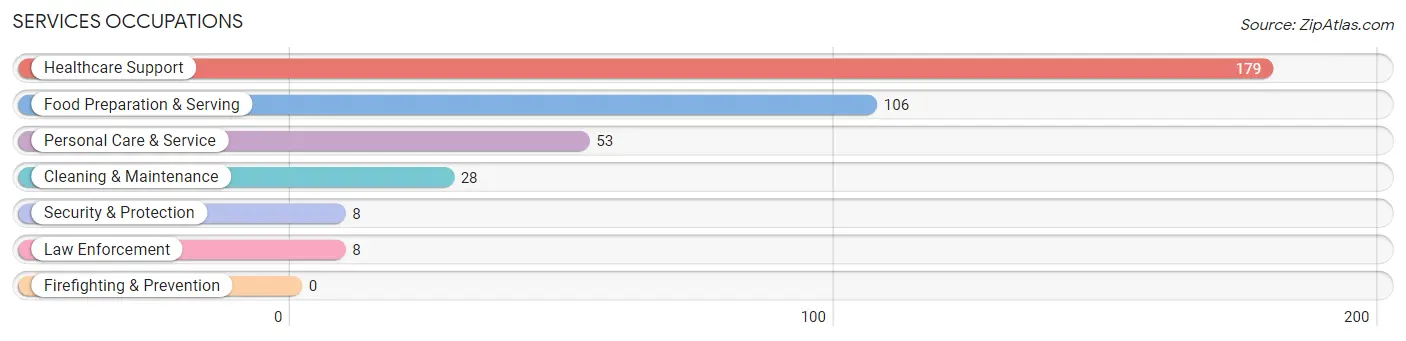
Services Occupations
The most common Services occupations in Vails Gate are Healthcare Support (179 | 11.9%), Food Preparation & Serving (106 | 7.0%), Personal Care & Service (53 | 3.5%), Cleaning & Maintenance (28 | 1.9%), and Security & Protection (8 | 0.5%).
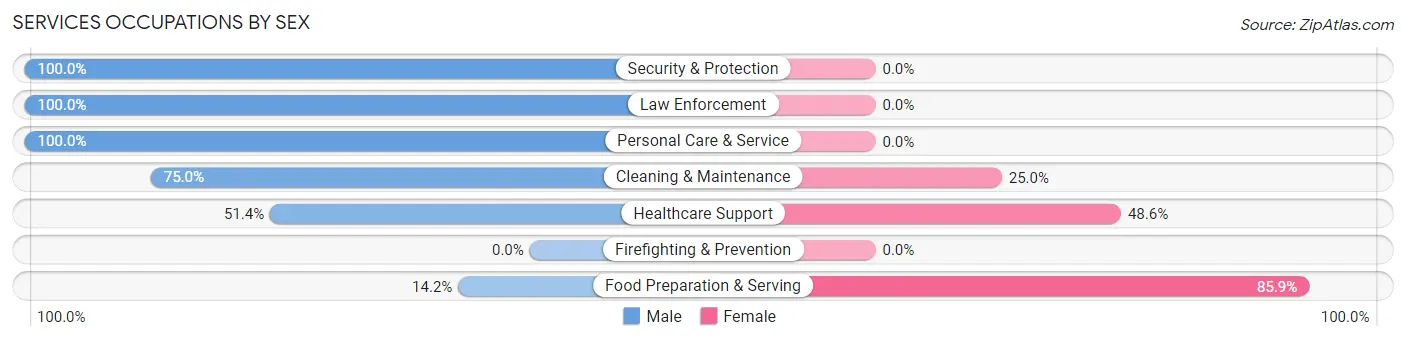
Services Occupations by Sex
Within the Services occupations in Vails Gate, the most male-oriented occupations are Security & Protection (100.0%), Law Enforcement (100.0%), and Personal Care & Service (100.0%), while the most female-oriented occupations are Food Preparation & Serving (85.9%), Healthcare Support (48.6%), and Cleaning & Maintenance (25.0%).
| Occupation | Male | Female |
| Healthcare Support | 92 (51.4%) | 87 (48.6%) |
| Security & Protection | 8 (100.0%) | 0 (0.0%) |
| Firefighting & Prevention | 0 (0.0%) | 0 (0.0%) |
| Law Enforcement | 8 (100.0%) | 0 (0.0%) |
| Food Preparation & Serving | 15 (14.1%) | 91 (85.9%) |
| Cleaning & Maintenance | 21 (75.0%) | 7 (25.0%) |
| Personal Care & Service | 53 (100.0%) | 0 (0.0%) |
| Total (Category) | 189 (50.5%) | 185 (49.5%) |
| Total (Overall) | 778 (51.7%) | 728 (48.3%) |
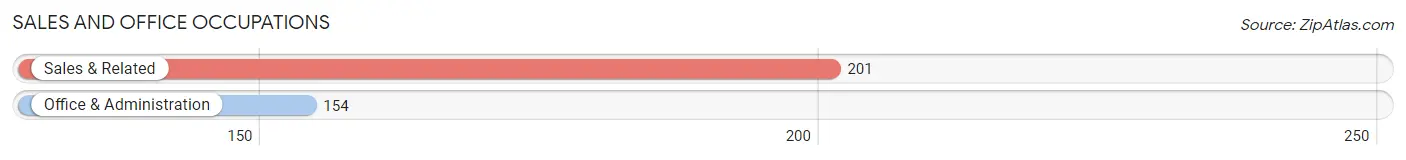
Sales and Office Occupations
The most common Sales and Office occupations in Vails Gate are Sales & Related (201 | 13.4%), and Office & Administration (154 | 10.2%).
Sales and Office Occupations by Sex
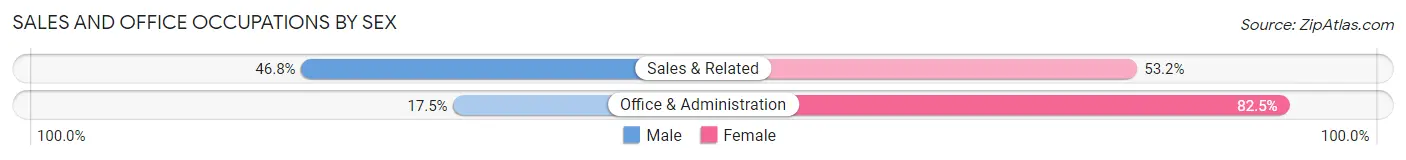
| Occupation | Male | Female |
| Sales & Related | 94 (46.8%) | 107 (53.2%) |
| Office & Administration | 27 (17.5%) | 127 (82.5%) |
| Total (Category) | 121 (34.1%) | 234 (65.9%) |
| Total (Overall) | 778 (51.7%) | 728 (48.3%) |
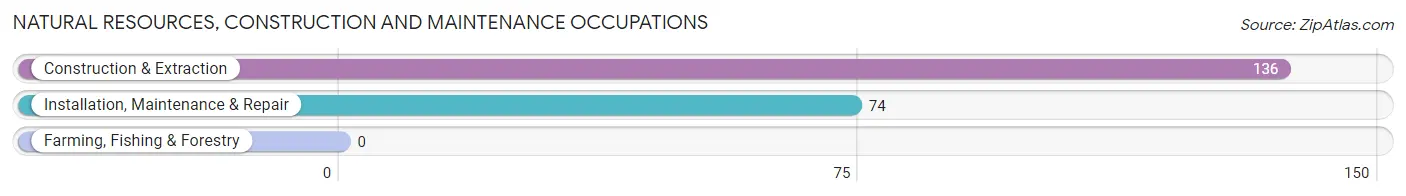
Natural Resources, Construction and Maintenance Occupations
The most common Natural Resources, Construction and Maintenance occupations in Vails Gate are Construction & Extraction (136 | 9.0%), and Installation, Maintenance & Repair (74 | 4.9%).
Natural Resources, Construction and Maintenance Occupations by Sex
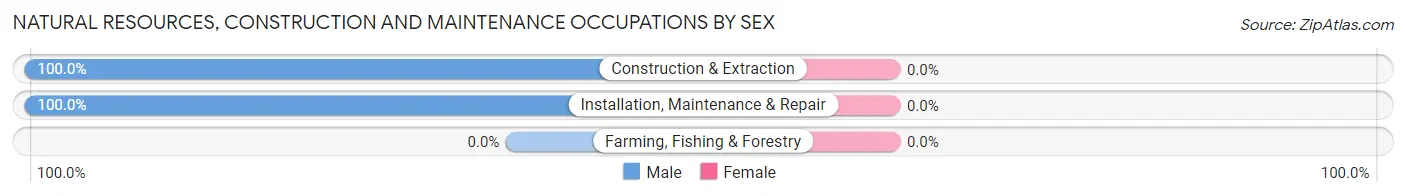
| Occupation | Male | Female |
| Farming, Fishing & Forestry | 0 (0.0%) | 0 (0.0%) |
| Construction & Extraction | 136 (100.0%) | 0 (0.0%) |
| Installation, Maintenance & Repair | 74 (100.0%) | 0 (0.0%) |
| Total (Category) | 210 (100.0%) | 0 (0.0%) |
| Total (Overall) | 778 (51.7%) | 728 (48.3%) |
Production, Transportation and Moving Occupations
The most common Production, Transportation and Moving occupations in Vails Gate are Transportation (39 | 2.6%), and Material Moving (1 | 0.1%).
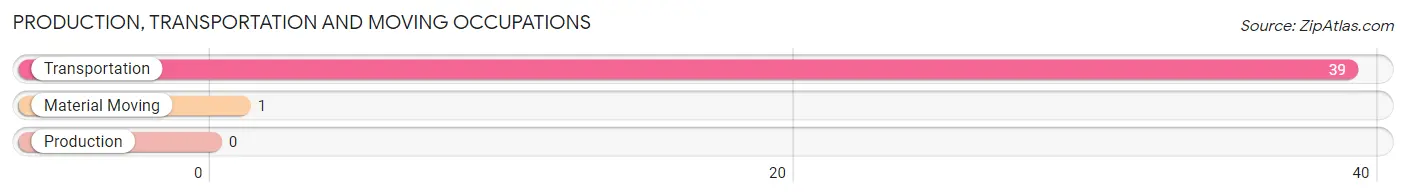
Production, Transportation and Moving Occupations by Sex
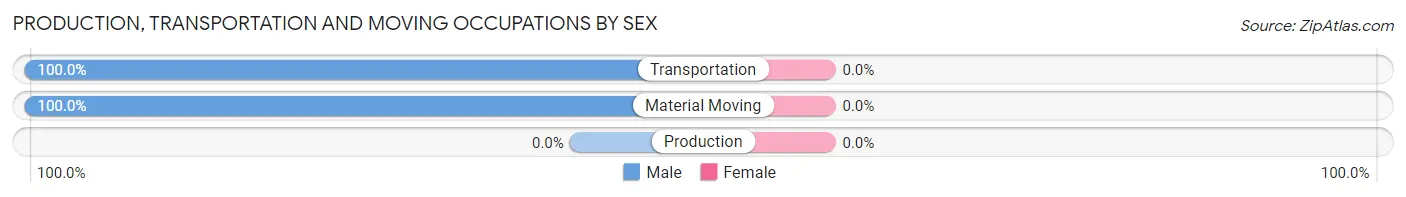
| Occupation | Male | Female |
| Production | 0 (0.0%) | 0 (0.0%) |
| Transportation | 39 (100.0%) | 0 (0.0%) |
| Material Moving | 1 (100.0%) | 0 (0.0%) |
| Total (Category) | 40 (100.0%) | 0 (0.0%) |
| Total (Overall) | 778 (51.7%) | 728 (48.3%) |
Employment Industries by Sex in Vails Gate
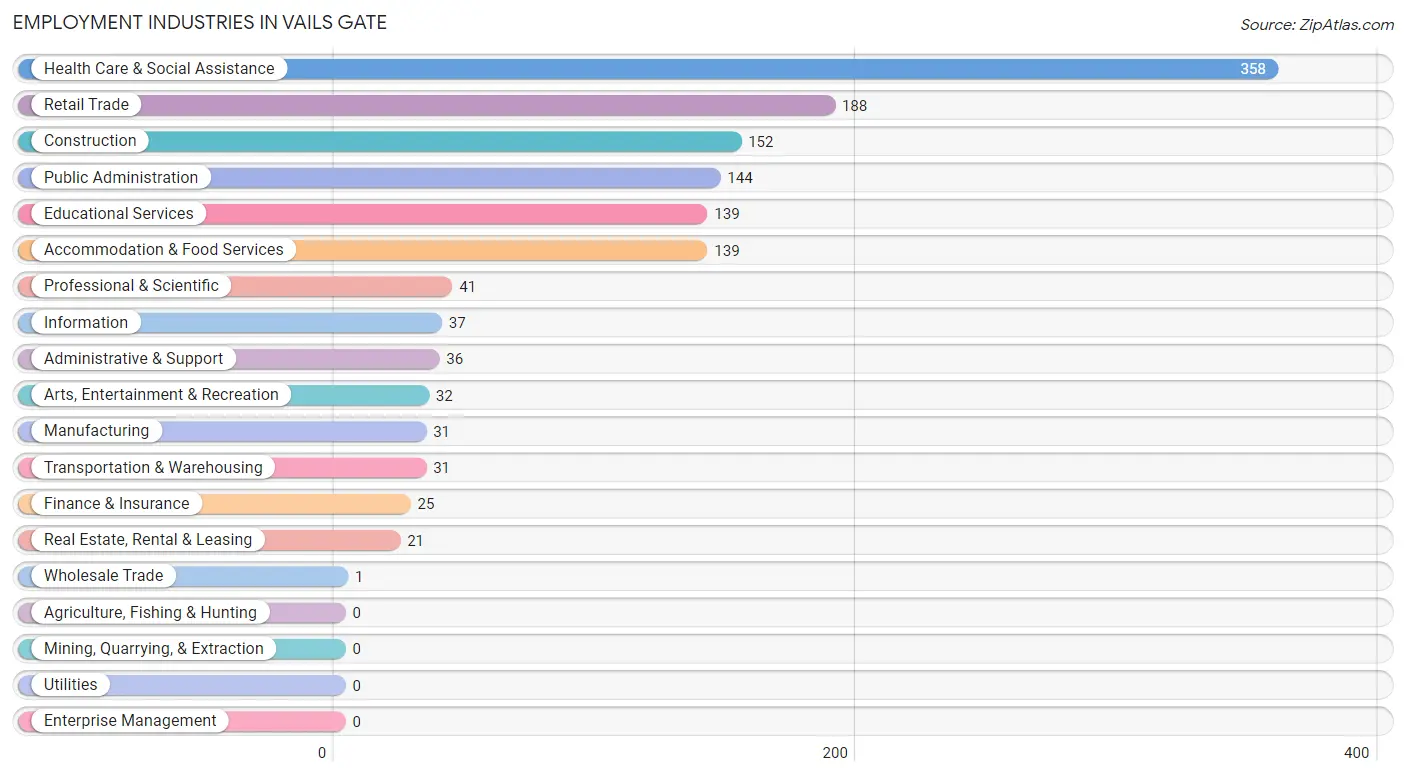
Employment Industries in Vails Gate
The major employment industries in Vails Gate include Health Care & Social Assistance (358 | 23.8%), Retail Trade (188 | 12.5%), Construction (152 | 10.1%), Public Administration (144 | 9.6%), and Educational Services (139 | 9.2%).
Employment Industries by Sex in Vails Gate
The Vails Gate industries that see more men than women are Manufacturing (100.0%), Wholesale Trade (100.0%), and Transportation & Warehousing (100.0%), whereas the industries that tend to have a higher number of women are Professional & Scientific (100.0%), Arts, Entertainment & Recreation (100.0%), and Accommodation & Food Services (80.6%).
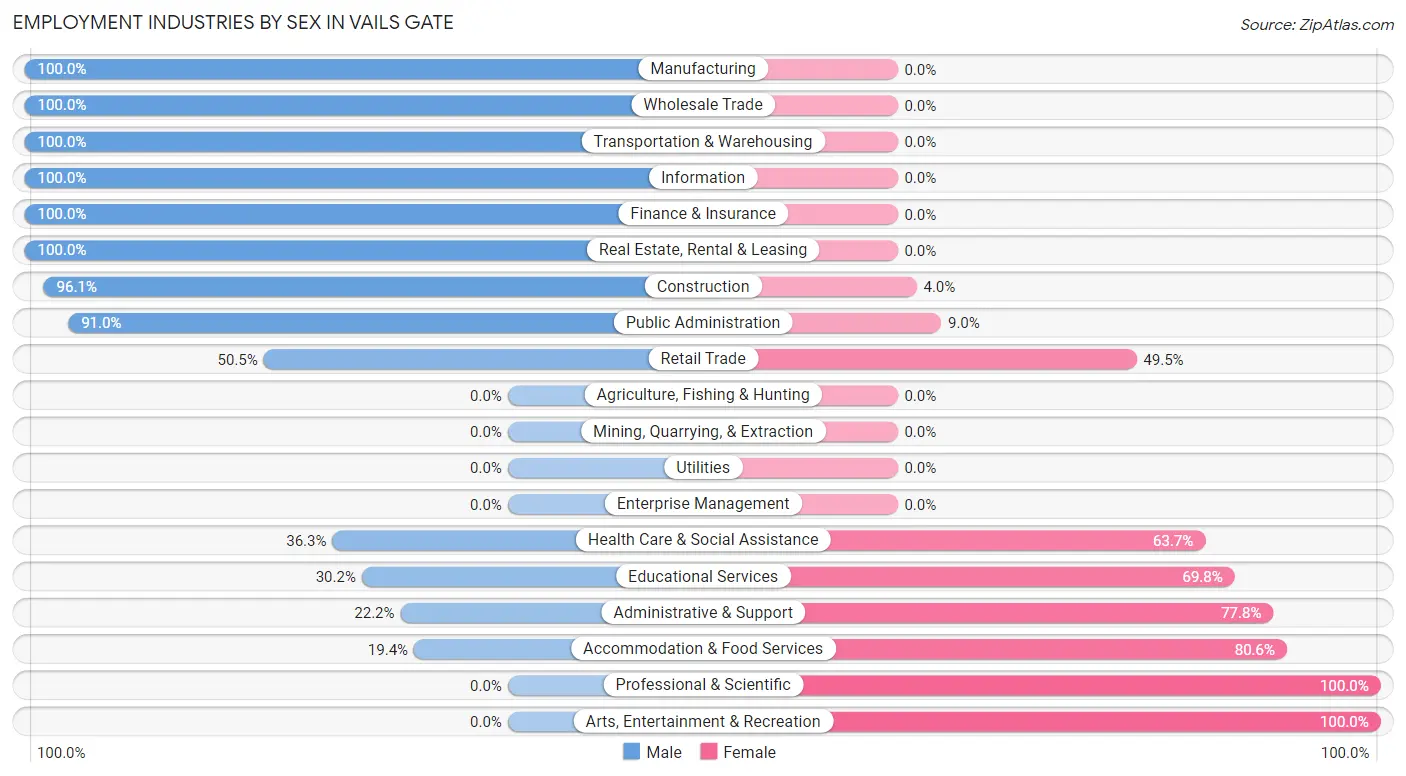
| Industry | Male | Female |
| Agriculture, Fishing & Hunting | 0 (0.0%) | 0 (0.0%) |
| Mining, Quarrying, & Extraction | 0 (0.0%) | 0 (0.0%) |
| Construction | 146 (96.1%) | 6 (4.0%) |
| Manufacturing | 31 (100.0%) | 0 (0.0%) |
| Wholesale Trade | 1 (100.0%) | 0 (0.0%) |
| Retail Trade | 95 (50.5%) | 93 (49.5%) |
| Transportation & Warehousing | 31 (100.0%) | 0 (0.0%) |
| Utilities | 0 (0.0%) | 0 (0.0%) |
| Information | 37 (100.0%) | 0 (0.0%) |
| Finance & Insurance | 25 (100.0%) | 0 (0.0%) |
| Real Estate, Rental & Leasing | 21 (100.0%) | 0 (0.0%) |
| Professional & Scientific | 0 (0.0%) | 41 (100.0%) |
| Enterprise Management | 0 (0.0%) | 0 (0.0%) |
| Administrative & Support | 8 (22.2%) | 28 (77.8%) |
| Educational Services | 42 (30.2%) | 97 (69.8%) |
| Health Care & Social Assistance | 130 (36.3%) | 228 (63.7%) |
| Arts, Entertainment & Recreation | 0 (0.0%) | 32 (100.0%) |
| Accommodation & Food Services | 27 (19.4%) | 112 (80.6%) |
| Public Administration | 131 (91.0%) | 13 (9.0%) |
| Total | 778 (51.7%) | 728 (48.3%) |
Education in Vails Gate
School Enrollment in Vails Gate
The most common levels of schooling among the 622 students in Vails Gate are college / undergraduate (178 | 28.6%), high school (172 | 27.7%), and middle school (142 | 22.8%).
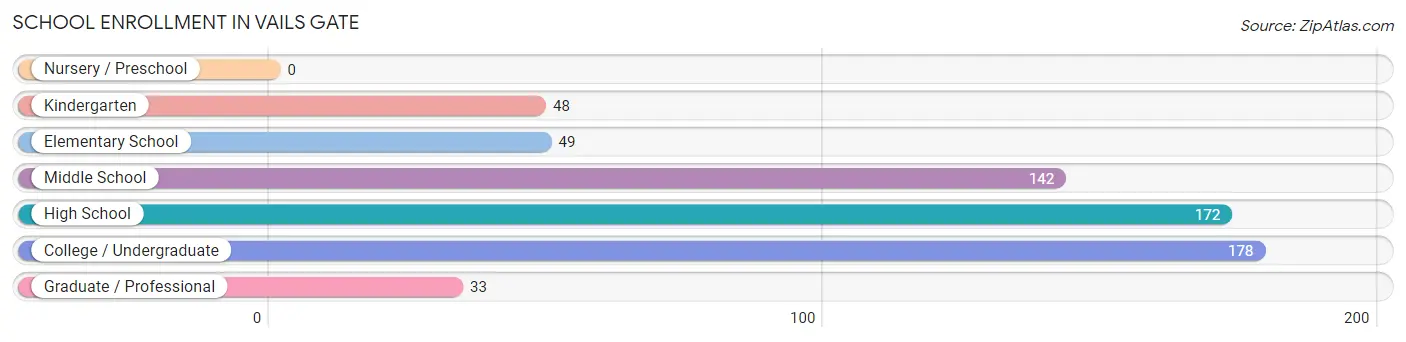
| School Level | # Students | % Students |
| Nursery / Preschool | 0 | 0.0% |
| Kindergarten | 48 | 7.7% |
| Elementary School | 49 | 7.9% |
| Middle School | 142 | 22.8% |
| High School | 172 | 27.7% |
| College / Undergraduate | 178 | 28.6% |
| Graduate / Professional | 33 | 5.3% |
| Total | 622 | 100.0% |
School Enrollment by Age by Funding Source in Vails Gate
Out of a total of 622 students who are enrolled in schools in Vails Gate, 89 (14.3%) attend a private institution, while the remaining 533 (85.7%) are enrolled in public schools. The age group of 15 to 17 year olds has the highest likelihood of being enrolled in private schools, with 65 (48.5% in the age bracket) enrolled. Conversely, the age group of 5 to 9 year old has the lowest likelihood of being enrolled in a private school, with 149 (100.0% in the age bracket) attending a public institution.
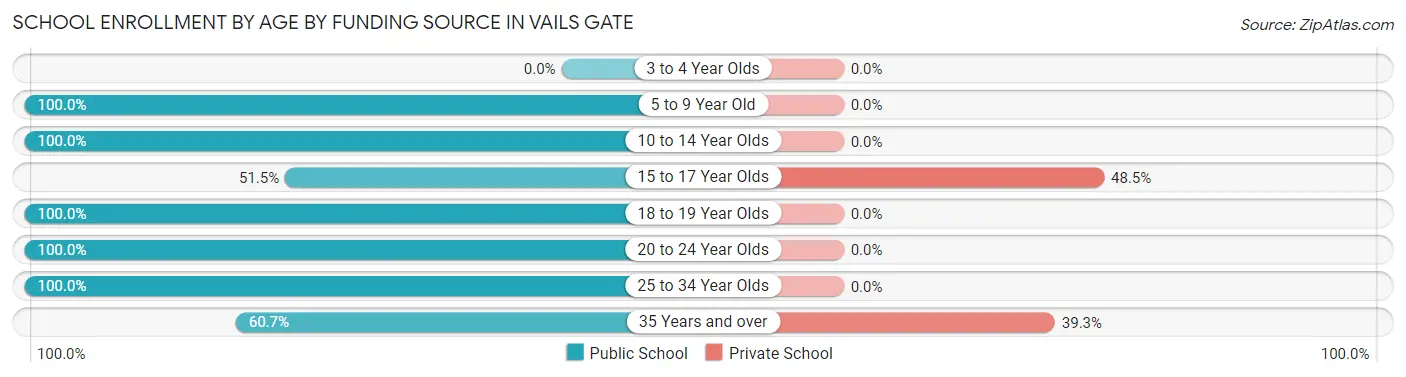
| Age Bracket | Public School | Private School |
| 3 to 4 Year Olds | 0 (0.0%) | 0 (0.0%) |
| 5 to 9 Year Old | 149 (100.0%) | 0 (0.0%) |
| 10 to 14 Year Olds | 141 (100.0%) | 0 (0.0%) |
| 15 to 17 Year Olds | 69 (51.5%) | 65 (48.5%) |
| 18 to 19 Year Olds | 93 (100.0%) | 0 (0.0%) |
| 20 to 24 Year Olds | 11 (100.0%) | 0 (0.0%) |
| 25 to 34 Year Olds | 33 (100.0%) | 0 (0.0%) |
| 35 Years and over | 37 (60.7%) | 24 (39.3%) |
| Total | 533 (85.7%) | 89 (14.3%) |
Educational Attainment by Field of Study in Vails Gate
Business (118 | 22.1%), arts & humanities (76 | 14.2%), social sciences (59 | 11.1%), science & technology (51 | 9.6%), and communications (42 | 7.9%) are the most common fields of study among 534 individuals in Vails Gate who have obtained a bachelor's degree or higher.
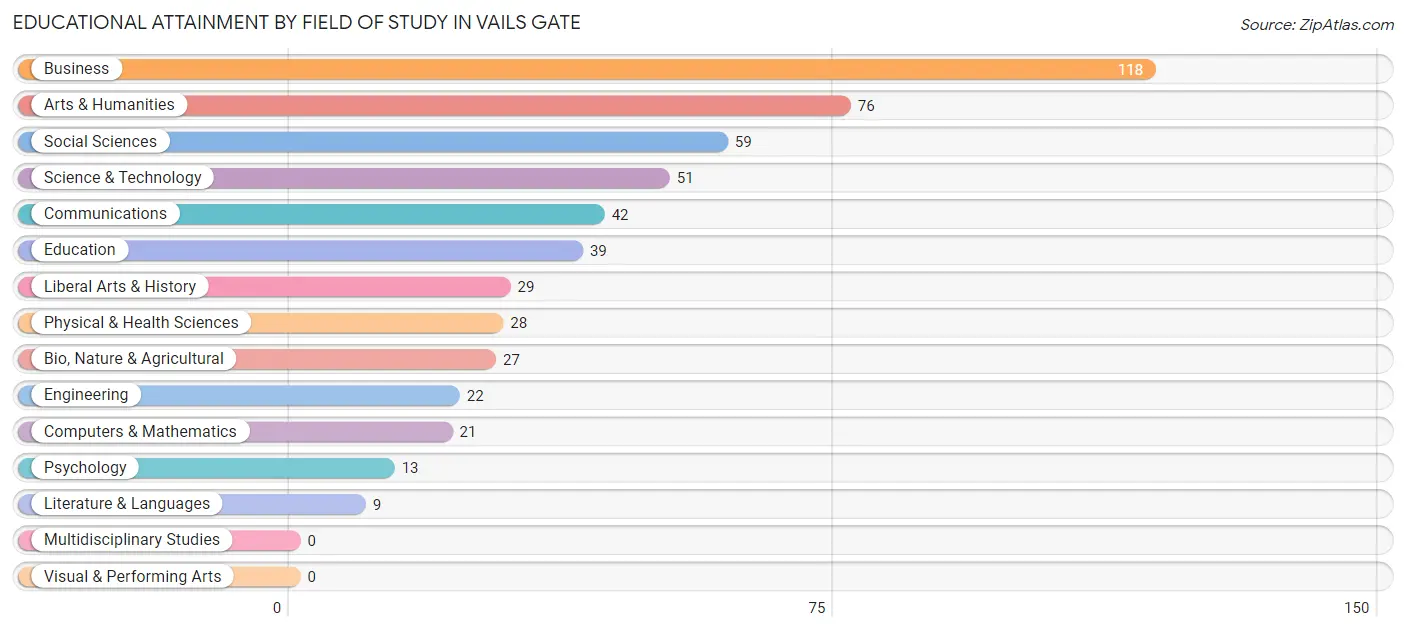
| Field of Study | # Graduates | % Graduates |
| Computers & Mathematics | 21 | 3.9% |
| Bio, Nature & Agricultural | 27 | 5.1% |
| Physical & Health Sciences | 28 | 5.2% |
| Psychology | 13 | 2.4% |
| Social Sciences | 59 | 11.1% |
| Engineering | 22 | 4.1% |
| Multidisciplinary Studies | 0 | 0.0% |
| Science & Technology | 51 | 9.6% |
| Business | 118 | 22.1% |
| Education | 39 | 7.3% |
| Literature & Languages | 9 | 1.7% |
| Liberal Arts & History | 29 | 5.4% |
| Visual & Performing Arts | 0 | 0.0% |
| Communications | 42 | 7.9% |
| Arts & Humanities | 76 | 14.2% |
| Total | 534 | 100.0% |
Transportation & Commute in Vails Gate
Vehicle Availability by Sex in Vails Gate
The most prevalent vehicle ownership categories in Vails Gate are males with 1 vehicle (267, accounting for 36.5%) and females with 1 vehicle (151, making up 37.0%).
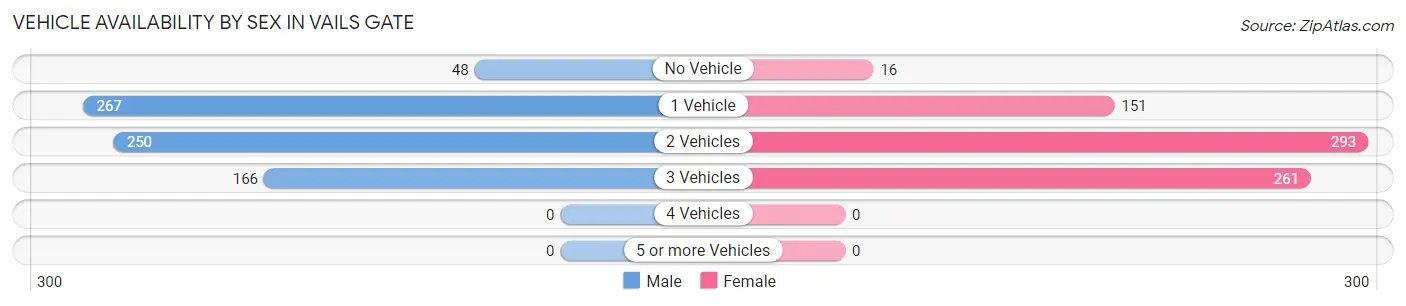
| Vehicles Available | Male | Female |
| No Vehicle | 48 (6.6%) | 16 (2.2%) |
| 1 Vehicle | 267 (36.5%) | 151 (20.9%) |
| 2 Vehicles | 250 (34.2%) | 293 (40.6%) |
| 3 Vehicles | 166 (22.7%) | 261 (36.2%) |
| 4 Vehicles | 0 (0.0%) | 0 (0.0%) |
| 5 or more Vehicles | 0 (0.0%) | 0 (0.0%) |
| Total | 731 (100.0%) | 721 (100.0%) |
Commute Time in Vails Gate
The most frequently occuring commute durations in Vails Gate are 20 to 24 minutes (277 commuters, 19.9%), 45 to 59 minutes (214 commuters, 15.4%), and 60 to 89 minutes (194 commuters, 13.9%).
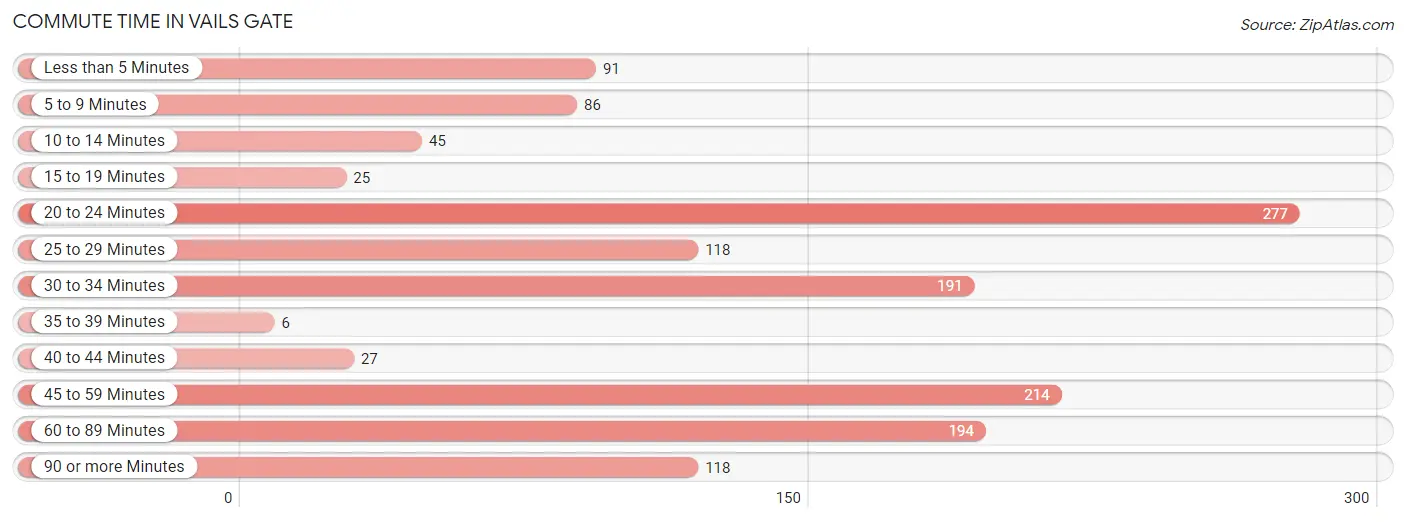
| Commute Time | # Commuters | % Commuters |
| Less than 5 Minutes | 91 | 6.5% |
| 5 to 9 Minutes | 86 | 6.2% |
| 10 to 14 Minutes | 45 | 3.2% |
| 15 to 19 Minutes | 25 | 1.8% |
| 20 to 24 Minutes | 277 | 19.9% |
| 25 to 29 Minutes | 118 | 8.5% |
| 30 to 34 Minutes | 191 | 13.7% |
| 35 to 39 Minutes | 6 | 0.4% |
| 40 to 44 Minutes | 27 | 1.9% |
| 45 to 59 Minutes | 214 | 15.4% |
| 60 to 89 Minutes | 194 | 13.9% |
| 90 or more Minutes | 118 | 8.5% |
Commute Time by Sex in Vails Gate
The most common commute times in Vails Gate are 20 to 24 minutes (123 commuters, 16.8%) for males and 20 to 24 minutes (154 commuters, 23.3%) for females.
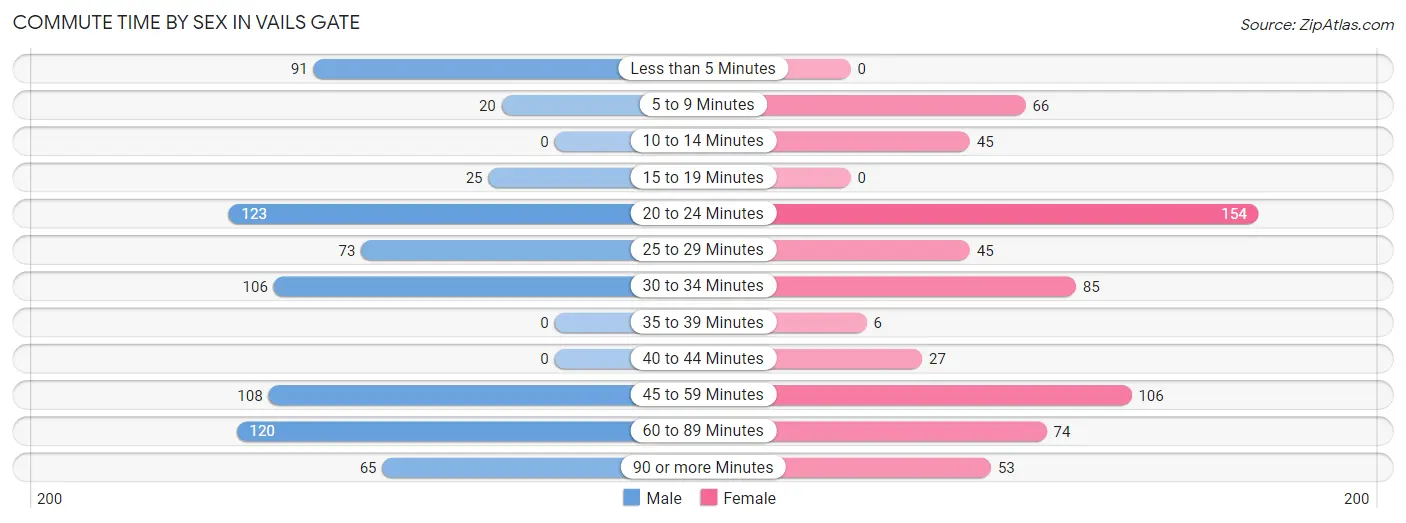
| Commute Time | Male | Female |
| Less than 5 Minutes | 91 (12.4%) | 0 (0.0%) |
| 5 to 9 Minutes | 20 (2.7%) | 66 (10.0%) |
| 10 to 14 Minutes | 0 (0.0%) | 45 (6.8%) |
| 15 to 19 Minutes | 25 (3.4%) | 0 (0.0%) |
| 20 to 24 Minutes | 123 (16.8%) | 154 (23.3%) |
| 25 to 29 Minutes | 73 (10.0%) | 45 (6.8%) |
| 30 to 34 Minutes | 106 (14.5%) | 85 (12.9%) |
| 35 to 39 Minutes | 0 (0.0%) | 6 (0.9%) |
| 40 to 44 Minutes | 0 (0.0%) | 27 (4.1%) |
| 45 to 59 Minutes | 108 (14.8%) | 106 (16.0%) |
| 60 to 89 Minutes | 120 (16.4%) | 74 (11.2%) |
| 90 or more Minutes | 65 (8.9%) | 53 (8.0%) |
Time of Departure to Work by Sex in Vails Gate
The most frequent times of departure to work in Vails Gate are 6:30 AM to 6:59 AM (114, 15.6%) for males and 7:30 AM to 7:59 AM (180, 27.2%) for females.
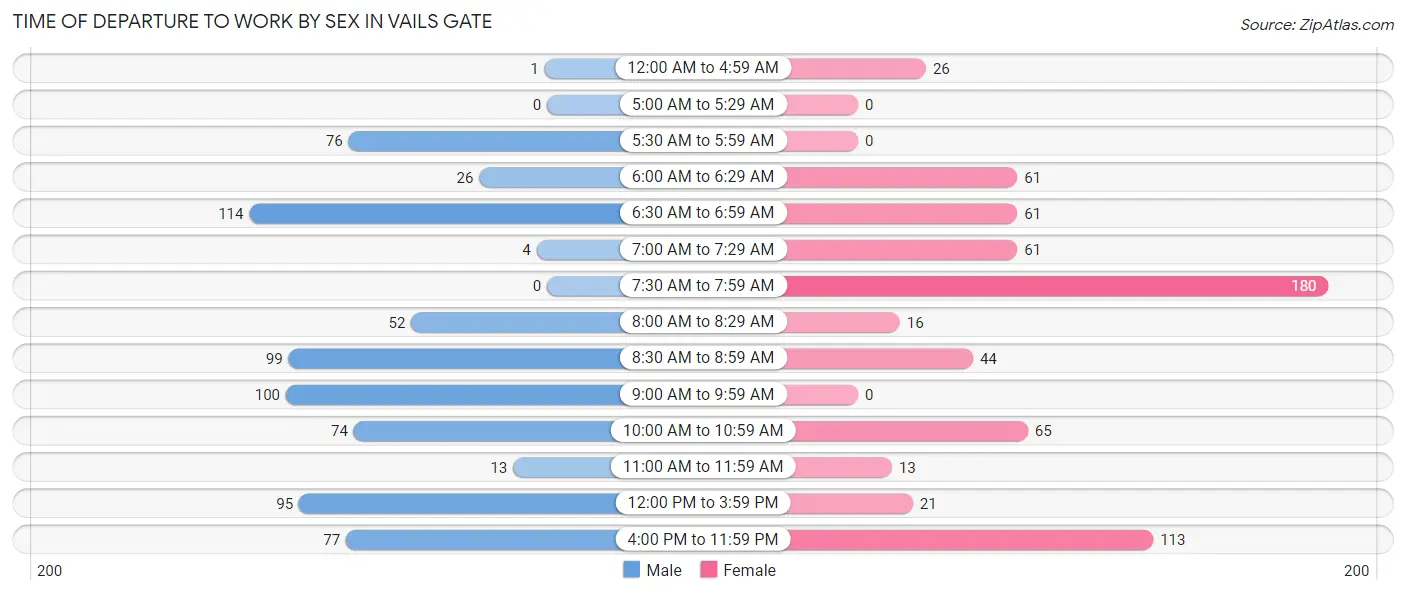
| Time of Departure | Male | Female |
| 12:00 AM to 4:59 AM | 1 (0.1%) | 26 (3.9%) |
| 5:00 AM to 5:29 AM | 0 (0.0%) | 0 (0.0%) |
| 5:30 AM to 5:59 AM | 76 (10.4%) | 0 (0.0%) |
| 6:00 AM to 6:29 AM | 26 (3.6%) | 61 (9.2%) |
| 6:30 AM to 6:59 AM | 114 (15.6%) | 61 (9.2%) |
| 7:00 AM to 7:29 AM | 4 (0.5%) | 61 (9.2%) |
| 7:30 AM to 7:59 AM | 0 (0.0%) | 180 (27.2%) |
| 8:00 AM to 8:29 AM | 52 (7.1%) | 16 (2.4%) |
| 8:30 AM to 8:59 AM | 99 (13.5%) | 44 (6.7%) |
| 9:00 AM to 9:59 AM | 100 (13.7%) | 0 (0.0%) |
| 10:00 AM to 10:59 AM | 74 (10.1%) | 65 (9.8%) |
| 11:00 AM to 11:59 AM | 13 (1.8%) | 13 (2.0%) |
| 12:00 PM to 3:59 PM | 95 (13.0%) | 21 (3.2%) |
| 4:00 PM to 11:59 PM | 77 (10.5%) | 113 (17.1%) |
| Total | 731 (100.0%) | 661 (100.0%) |
Housing Occupancy in Vails Gate
Occupancy by Ownership in Vails Gate
Of the total 1,300 dwellings in Vails Gate, owner-occupied units account for 684 (52.6%), while renter-occupied units make up 616 (47.4%).
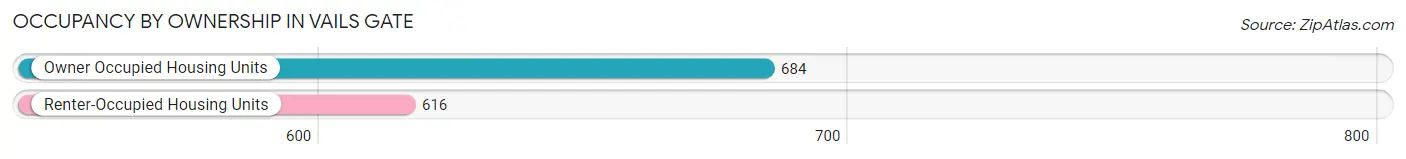
| Occupancy | # Housing Units | % Housing Units |
| Owner Occupied Housing Units | 684 | 52.6% |
| Renter-Occupied Housing Units | 616 | 47.4% |
| Total Occupied Housing Units | 1,300 | 100.0% |
Occupancy by Household Size in Vails Gate
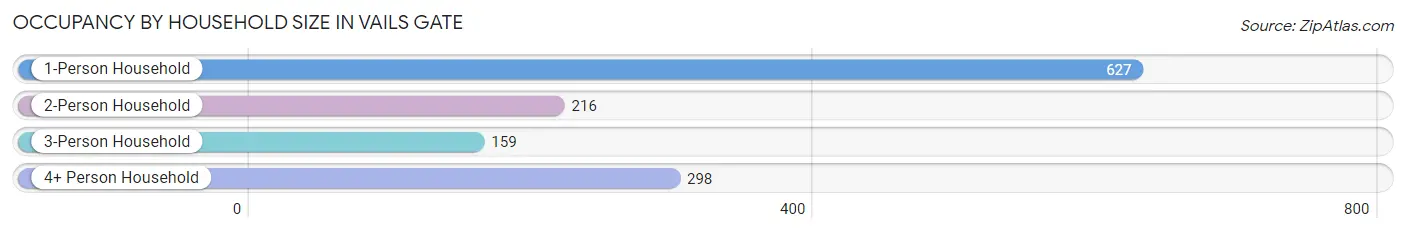
| Household Size | # Housing Units | % Housing Units |
| 1-Person Household | 627 | 48.2% |
| 2-Person Household | 216 | 16.6% |
| 3-Person Household | 159 | 12.2% |
| 4+ Person Household | 298 | 22.9% |
| Total Housing Units | 1,300 | 100.0% |
Occupancy by Ownership by Household Size in Vails Gate
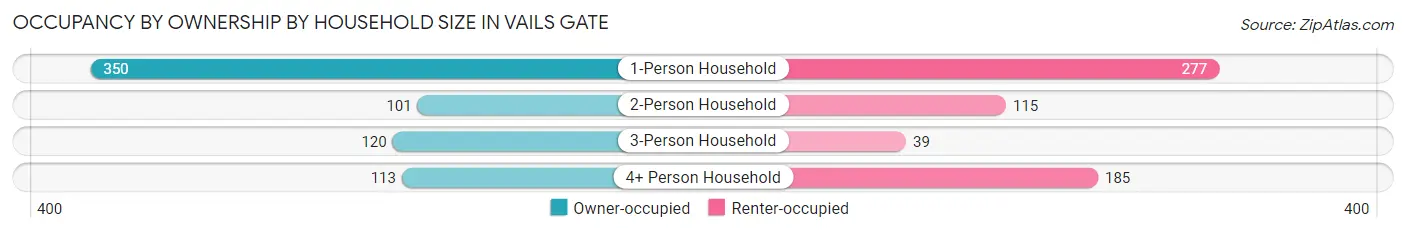
| Household Size | Owner-occupied | Renter-occupied |
| 1-Person Household | 350 (55.8%) | 277 (44.2%) |
| 2-Person Household | 101 (46.8%) | 115 (53.2%) |
| 3-Person Household | 120 (75.5%) | 39 (24.5%) |
| 4+ Person Household | 113 (37.9%) | 185 (62.1%) |
| Total Housing Units | 684 (52.6%) | 616 (47.4%) |
Occupancy by Educational Attainment in Vails Gate
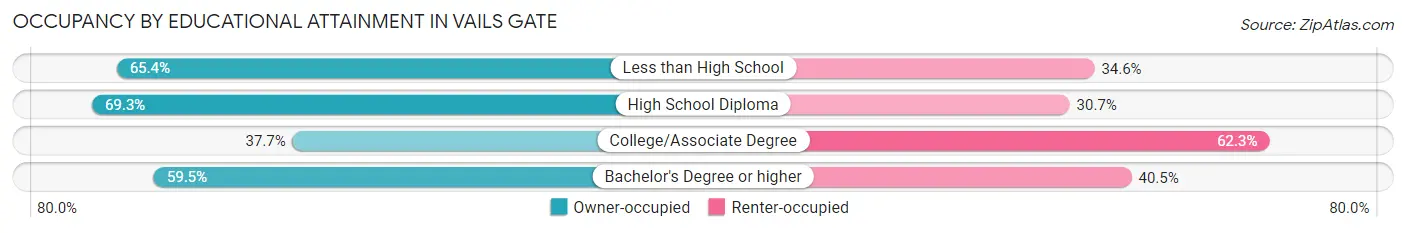
| Household Size | Owner-occupied | Renter-occupied |
| Less than High School | 51 (65.4%) | 27 (34.6%) |
| High School Diploma | 192 (69.3%) | 85 (30.7%) |
| College/Associate Degree | 209 (37.7%) | 346 (62.3%) |
| Bachelor's Degree or higher | 232 (59.5%) | 158 (40.5%) |
Occupancy by Age of Householder in Vails Gate
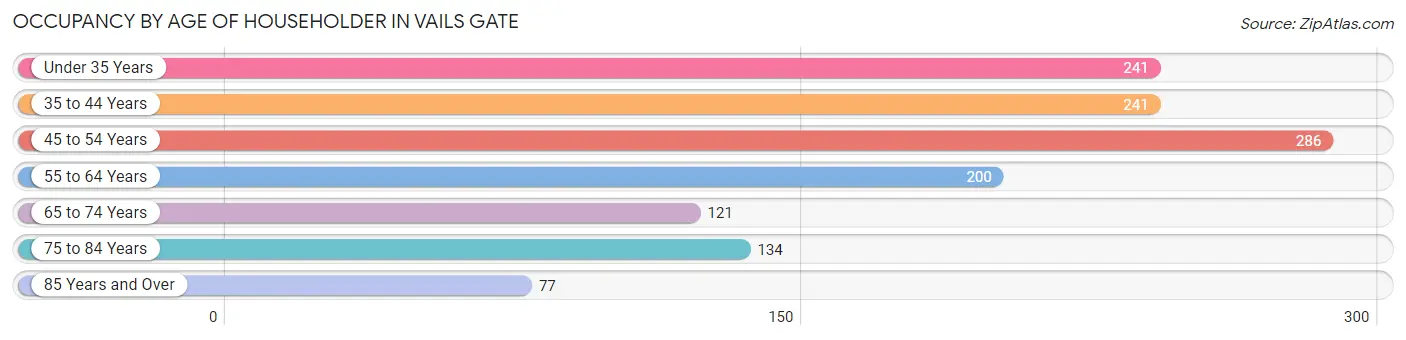
| Age Bracket | # Households | % Households |
| Under 35 Years | 241 | 18.5% |
| 35 to 44 Years | 241 | 18.5% |
| 45 to 54 Years | 286 | 22.0% |
| 55 to 64 Years | 200 | 15.4% |
| 65 to 74 Years | 121 | 9.3% |
| 75 to 84 Years | 134 | 10.3% |
| 85 Years and Over | 77 | 5.9% |
| Total | 1,300 | 100.0% |
Housing Finances in Vails Gate
Median Income by Occupancy in Vails Gate
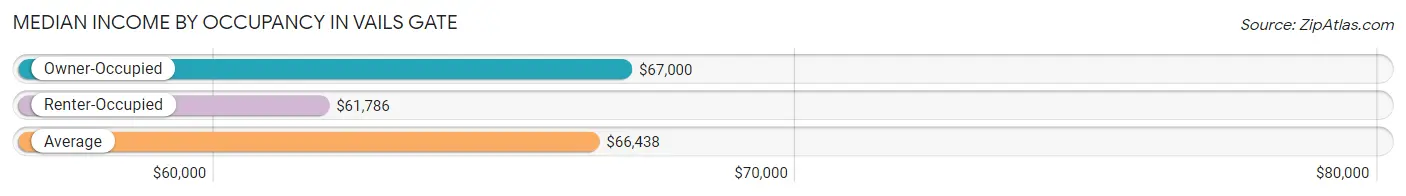
| Occupancy Type | # Households | Median Income |
| Owner-Occupied | 684 (52.6%) | $67,000 |
| Renter-Occupied | 616 (47.4%) | $61,786 |
| Average | 1,300 (100.0%) | $66,438 |
Occupancy by Householder Income Bracket in Vails Gate
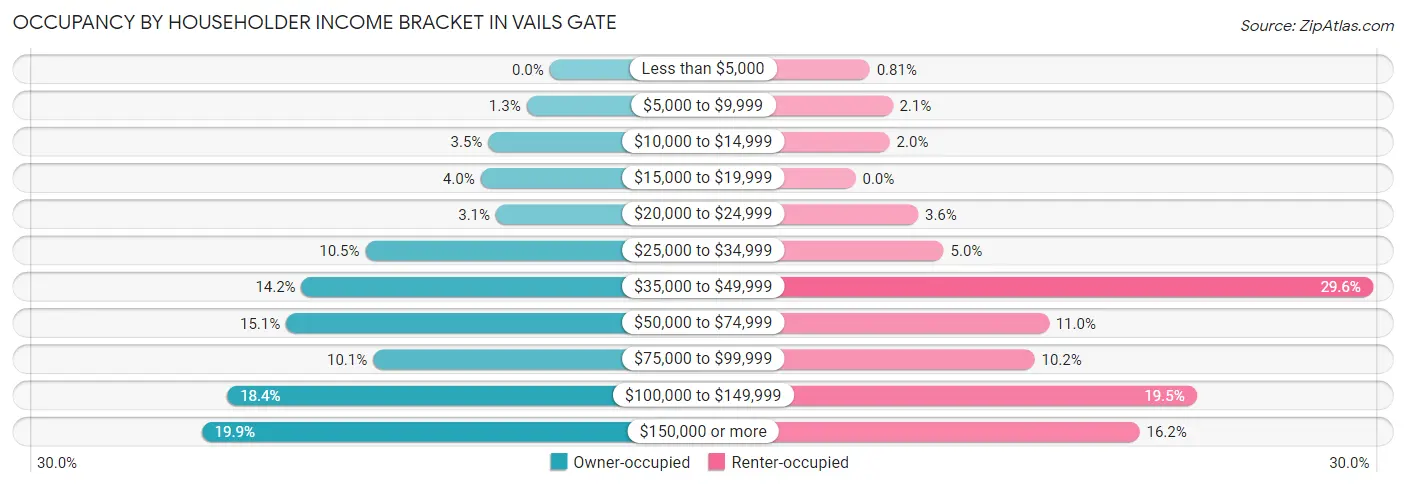
| Income Bracket | Owner-occupied | Renter-occupied |
| Less than $5,000 | 0 (0.0%) | 5 (0.8%) |
| $5,000 to $9,999 | 9 (1.3%) | 13 (2.1%) |
| $10,000 to $14,999 | 24 (3.5%) | 12 (1.9%) |
| $15,000 to $19,999 | 27 (4.0%) | 0 (0.0%) |
| $20,000 to $24,999 | 21 (3.1%) | 22 (3.6%) |
| $25,000 to $34,999 | 72 (10.5%) | 31 (5.0%) |
| $35,000 to $49,999 | 97 (14.2%) | 182 (29.5%) |
| $50,000 to $74,999 | 103 (15.1%) | 68 (11.0%) |
| $75,000 to $99,999 | 69 (10.1%) | 63 (10.2%) |
| $100,000 to $149,999 | 126 (18.4%) | 120 (19.5%) |
| $150,000 or more | 136 (19.9%) | 100 (16.2%) |
| Total | 684 (100.0%) | 616 (100.0%) |
Monthly Housing Cost Tiers in Vails Gate
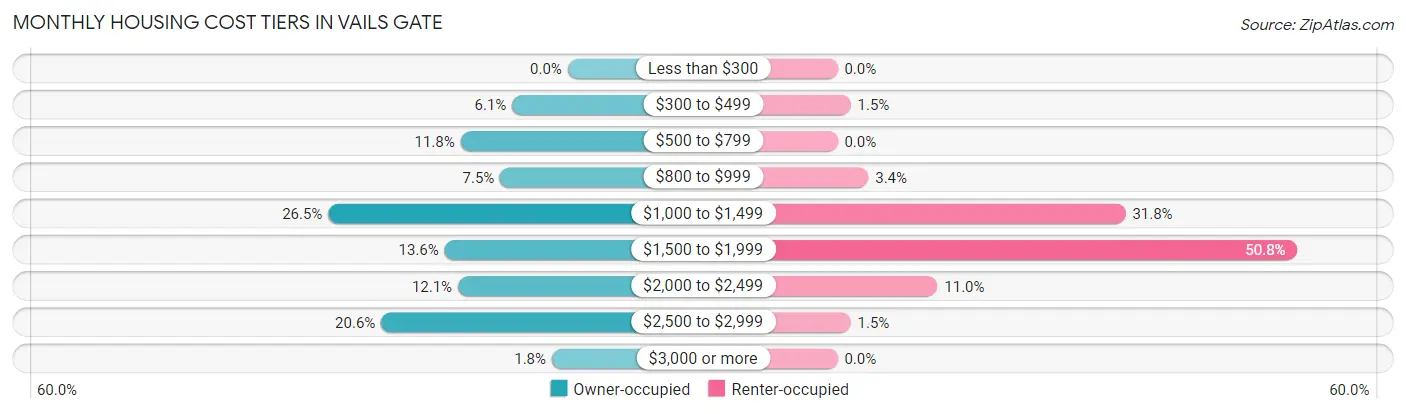
| Monthly Cost | Owner-occupied | Renter-occupied |
| Less than $300 | 0 (0.0%) | 0 (0.0%) |
| $300 to $499 | 42 (6.1%) | 9 (1.5%) |
| $500 to $799 | 81 (11.8%) | 0 (0.0%) |
| $800 to $999 | 51 (7.5%) | 21 (3.4%) |
| $1,000 to $1,499 | 181 (26.5%) | 196 (31.8%) |
| $1,500 to $1,999 | 93 (13.6%) | 313 (50.8%) |
| $2,000 to $2,499 | 83 (12.1%) | 68 (11.0%) |
| $2,500 to $2,999 | 141 (20.6%) | 9 (1.5%) |
| $3,000 or more | 12 (1.8%) | 0 (0.0%) |
| Total | 684 (100.0%) | 616 (100.0%) |
Physical Housing Characteristics in Vails Gate
Housing Structures in Vails Gate
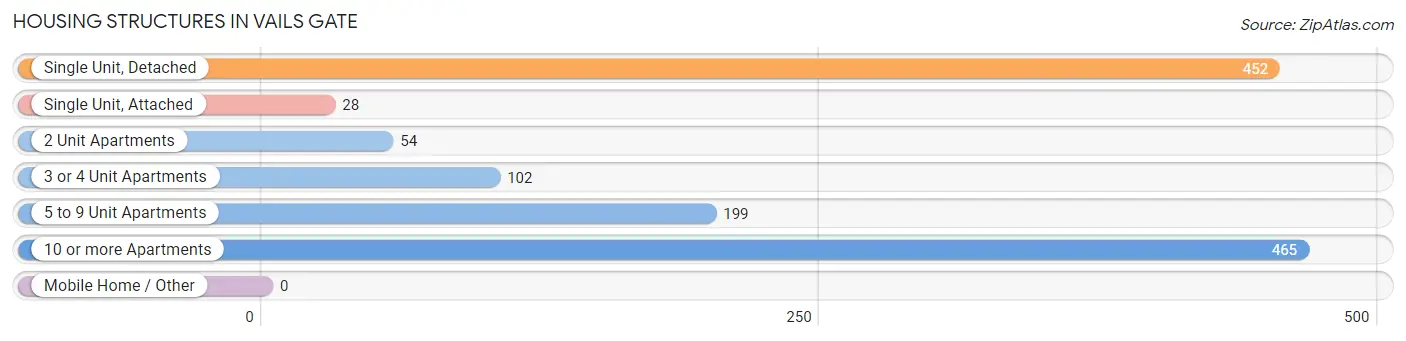
| Structure Type | # Housing Units | % Housing Units |
| Single Unit, Detached | 452 | 34.8% |
| Single Unit, Attached | 28 | 2.1% |
| 2 Unit Apartments | 54 | 4.2% |
| 3 or 4 Unit Apartments | 102 | 7.9% |
| 5 to 9 Unit Apartments | 199 | 15.3% |
| 10 or more Apartments | 465 | 35.8% |
| Mobile Home / Other | 0 | 0.0% |
| Total | 1,300 | 100.0% |
Housing Structures by Occupancy in Vails Gate
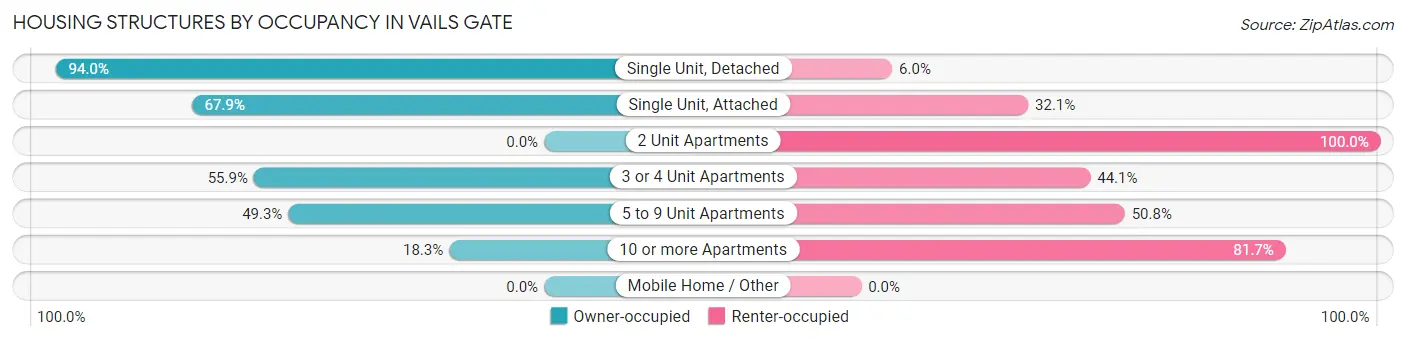
| Structure Type | Owner-occupied | Renter-occupied |
| Single Unit, Detached | 425 (94.0%) | 27 (6.0%) |
| Single Unit, Attached | 19 (67.9%) | 9 (32.1%) |
| 2 Unit Apartments | 0 (0.0%) | 54 (100.0%) |
| 3 or 4 Unit Apartments | 57 (55.9%) | 45 (44.1%) |
| 5 to 9 Unit Apartments | 98 (49.2%) | 101 (50.7%) |
| 10 or more Apartments | 85 (18.3%) | 380 (81.7%) |
| Mobile Home / Other | 0 (0.0%) | 0 (0.0%) |
| Total | 684 (52.6%) | 616 (47.4%) |
Housing Structures by Number of Rooms in Vails Gate
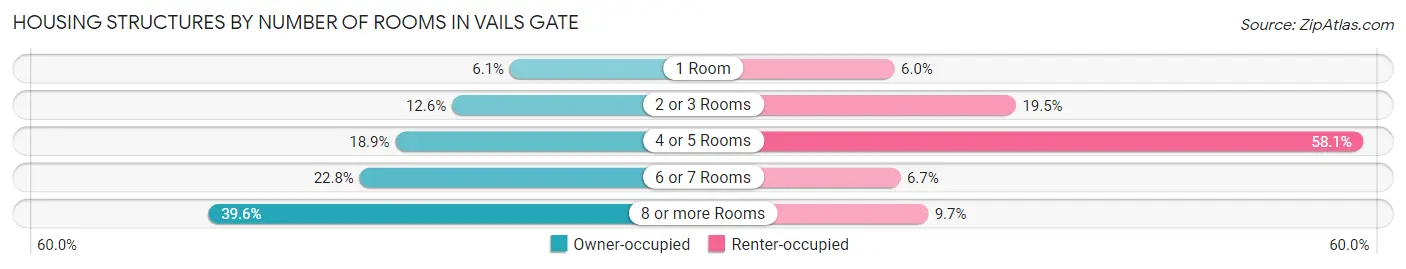
| Number of Rooms | Owner-occupied | Renter-occupied |
| 1 Room | 42 (6.1%) | 37 (6.0%) |
| 2 or 3 Rooms | 86 (12.6%) | 120 (19.5%) |
| 4 or 5 Rooms | 129 (18.9%) | 358 (58.1%) |
| 6 or 7 Rooms | 156 (22.8%) | 41 (6.7%) |
| 8 or more Rooms | 271 (39.6%) | 60 (9.7%) |
| Total | 684 (100.0%) | 616 (100.0%) |
Housing Structure by Heating Type in Vails Gate
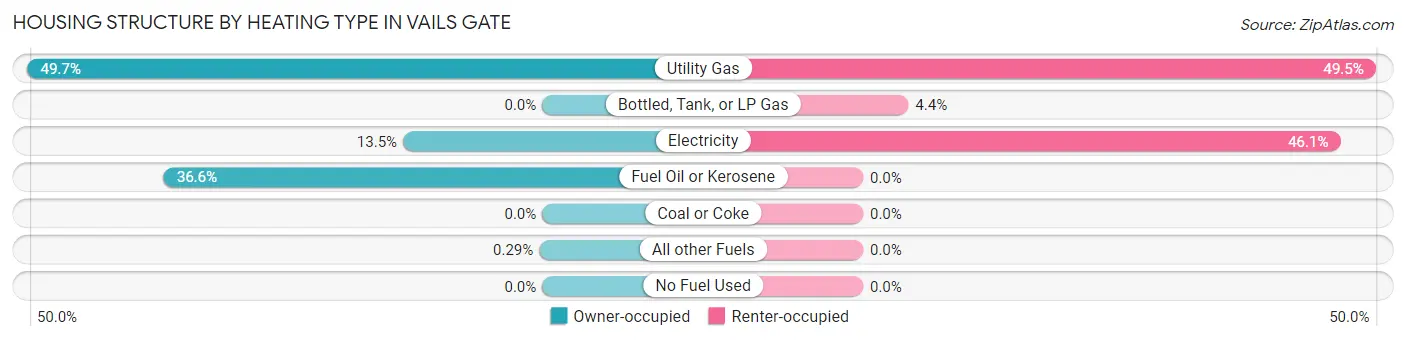
| Heating Type | Owner-occupied | Renter-occupied |
| Utility Gas | 340 (49.7%) | 305 (49.5%) |
| Bottled, Tank, or LP Gas | 0 (0.0%) | 27 (4.4%) |
| Electricity | 92 (13.5%) | 284 (46.1%) |
| Fuel Oil or Kerosene | 250 (36.5%) | 0 (0.0%) |
| Coal or Coke | 0 (0.0%) | 0 (0.0%) |
| All other Fuels | 2 (0.3%) | 0 (0.0%) |
| No Fuel Used | 0 (0.0%) | 0 (0.0%) |
| Total | 684 (100.0%) | 616 (100.0%) |
Household Vehicle Usage in Vails Gate
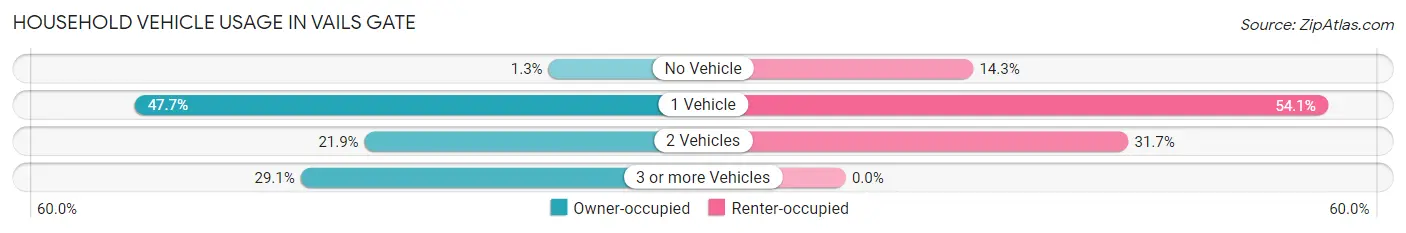
| Vehicles per Household | Owner-occupied | Renter-occupied |
| No Vehicle | 9 (1.3%) | 88 (14.3%) |
| 1 Vehicle | 326 (47.7%) | 333 (54.1%) |
| 2 Vehicles | 150 (21.9%) | 195 (31.7%) |
| 3 or more Vehicles | 199 (29.1%) | 0 (0.0%) |
| Total | 684 (100.0%) | 616 (100.0%) |
Real Estate & Mortgages in Vails Gate
Real Estate and Mortgage Overview in Vails Gate
| Characteristic | Without Mortgage | With Mortgage |
| Housing Units | 295 | 389 |
| Median Property Value | $204,800 | $326,500 |
| Median Household Income | $105,529 | $65 |
| Monthly Housing Costs | $913 | $12 |
| Real Estate Taxes | $4,875 | $6 |
Property Value by Mortgage Status in Vails Gate
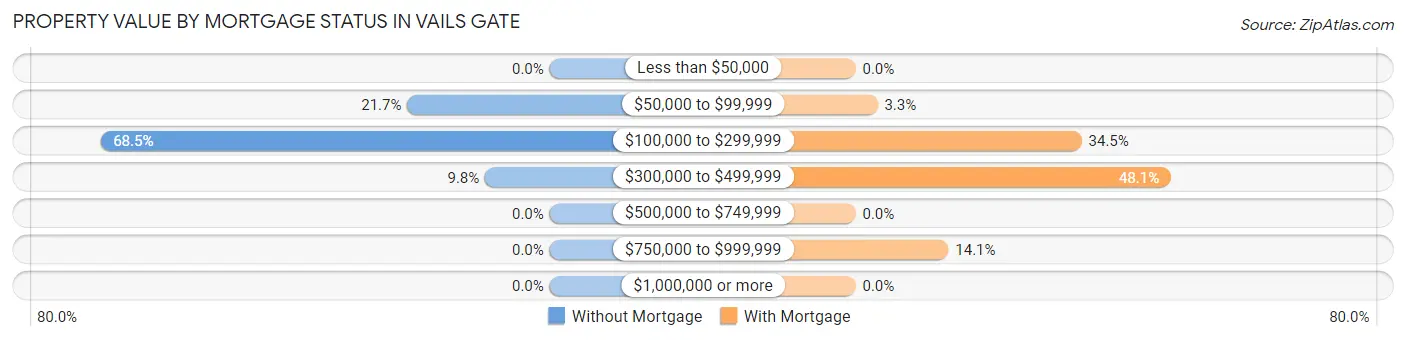
| Property Value | Without Mortgage | With Mortgage |
| Less than $50,000 | 0 (0.0%) | 0 (0.0%) |
| $50,000 to $99,999 | 64 (21.7%) | 13 (3.3%) |
| $100,000 to $299,999 | 202 (68.5%) | 134 (34.4%) |
| $300,000 to $499,999 | 29 (9.8%) | 187 (48.1%) |
| $500,000 to $749,999 | 0 (0.0%) | 0 (0.0%) |
| $750,000 to $999,999 | 0 (0.0%) | 55 (14.1%) |
| $1,000,000 or more | 0 (0.0%) | 0 (0.0%) |
| Total | 295 (100.0%) | 389 (100.0%) |
Household Income by Mortgage Status in Vails Gate
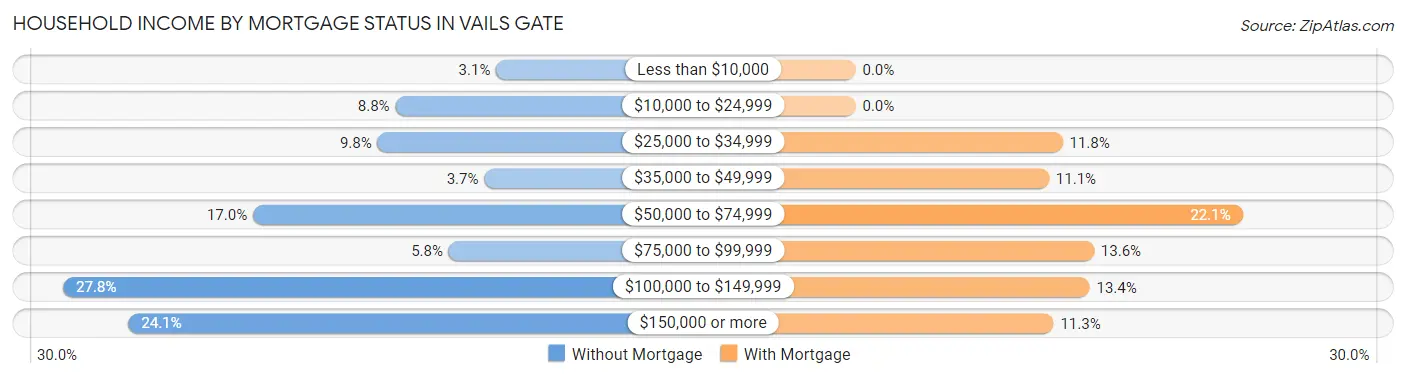
| Household Income | Without Mortgage | With Mortgage |
| Less than $10,000 | 9 (3.0%) | 0 (0.0%) |
| $10,000 to $24,999 | 26 (8.8%) | 0 (0.0%) |
| $25,000 to $34,999 | 29 (9.8%) | 46 (11.8%) |
| $35,000 to $49,999 | 11 (3.7%) | 43 (11.1%) |
| $50,000 to $74,999 | 50 (17.0%) | 86 (22.1%) |
| $75,000 to $99,999 | 17 (5.8%) | 53 (13.6%) |
| $100,000 to $149,999 | 82 (27.8%) | 52 (13.4%) |
| $150,000 or more | 71 (24.1%) | 44 (11.3%) |
| Total | 295 (100.0%) | 389 (100.0%) |
Property Value to Household Income Ratio in Vails Gate
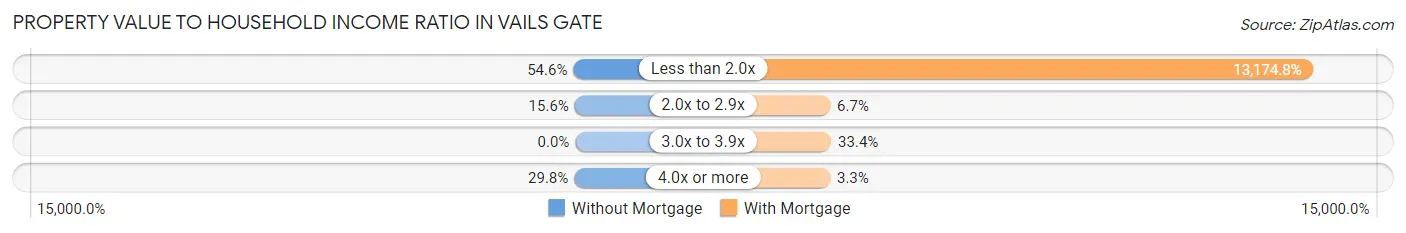
| Value-to-Income Ratio | Without Mortgage | With Mortgage |
| Less than 2.0x | 161 (54.6%) | 51,250 (13,174.8%) |
| 2.0x to 2.9x | 46 (15.6%) | 26 (6.7%) |
| 3.0x to 3.9x | 0 (0.0%) | 130 (33.4%) |
| 4.0x or more | 88 (29.8%) | 13 (3.3%) |
| Total | 295 (100.0%) | 389 (100.0%) |
Real Estate Taxes by Mortgage Status in Vails Gate
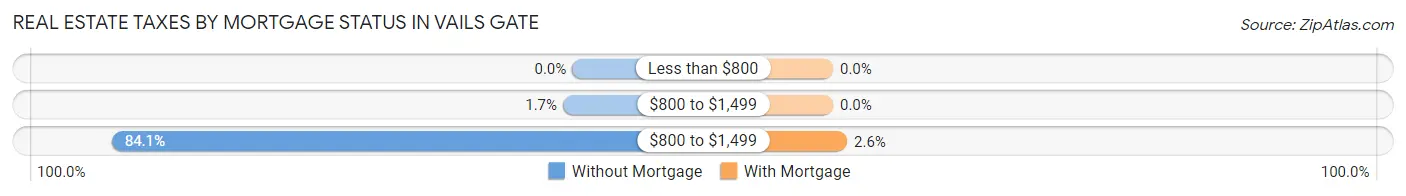
| Property Taxes | Without Mortgage | With Mortgage |
| Less than $800 | 0 (0.0%) | 0 (0.0%) |
| $800 to $1,499 | 5 (1.7%) | 0 (0.0%) |
| $800 to $1,499 | 248 (84.1%) | 10 (2.6%) |
| Total | 295 (100.0%) | 389 (100.0%) |
Health & Disability in Vails Gate
Health Insurance Coverage by Age in Vails Gate
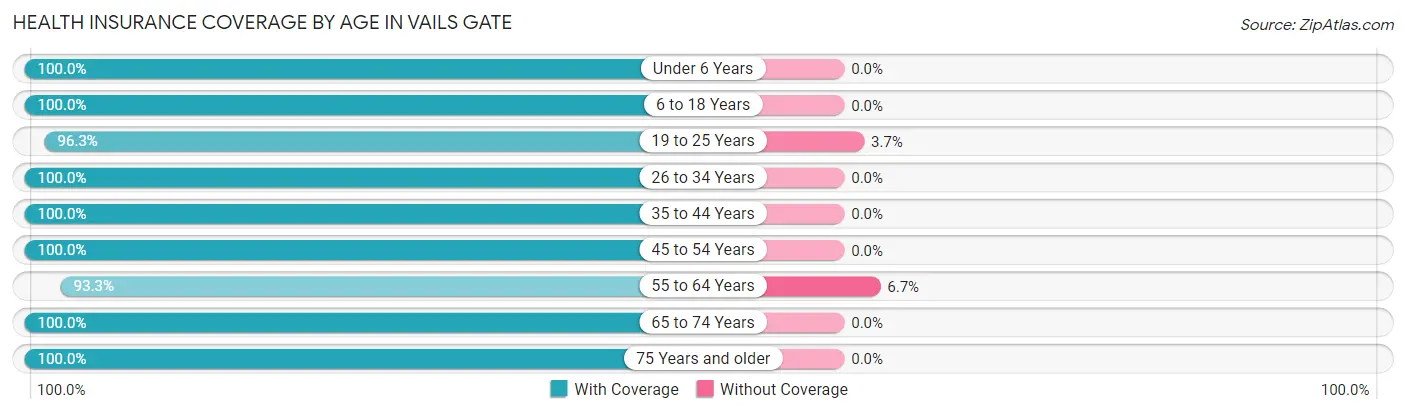
| Age Bracket | With Coverage | Without Coverage |
| Under 6 Years | 176 (100.0%) | 0 (0.0%) |
| 6 to 18 Years | 446 (100.0%) | 0 (0.0%) |
| 19 to 25 Years | 208 (96.3%) | 8 (3.7%) |
| 26 to 34 Years | 398 (100.0%) | 0 (0.0%) |
| 35 to 44 Years | 475 (100.0%) | 0 (0.0%) |
| 45 to 54 Years | 350 (100.0%) | 0 (0.0%) |
| 55 to 64 Years | 347 (93.3%) | 25 (6.7%) |
| 65 to 74 Years | 152 (100.0%) | 0 (0.0%) |
| 75 Years and older | 296 (100.0%) | 0 (0.0%) |
| Total | 2,848 (98.9%) | 33 (1.1%) |
Health Insurance Coverage by Citizenship Status in Vails Gate
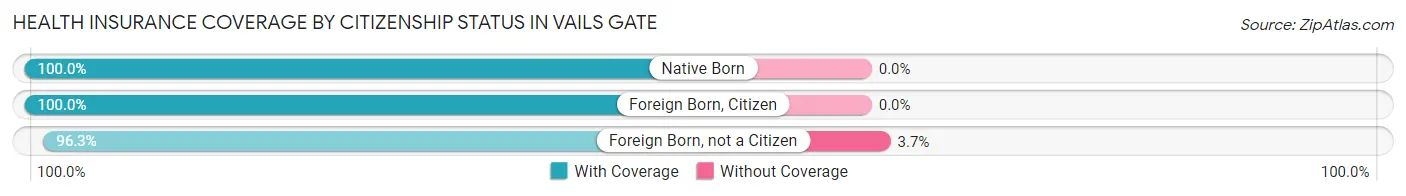
| Citizenship Status | With Coverage | Without Coverage |
| Native Born | 176 (100.0%) | 0 (0.0%) |
| Foreign Born, Citizen | 446 (100.0%) | 0 (0.0%) |
| Foreign Born, not a Citizen | 208 (96.3%) | 8 (3.7%) |
Health Insurance Coverage by Household Income in Vails Gate
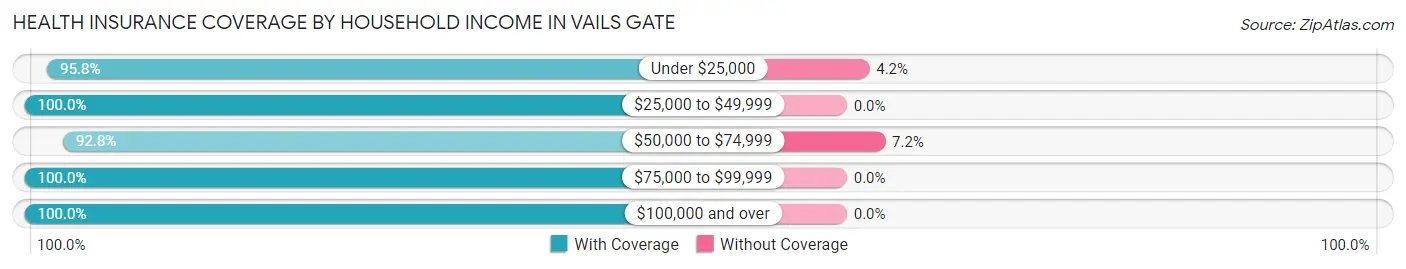
| Household Income | With Coverage | Without Coverage |
| Under $25,000 | 182 (95.8%) | 8 (4.2%) |
| $25,000 to $49,999 | 653 (100.0%) | 0 (0.0%) |
| $50,000 to $74,999 | 323 (92.8%) | 25 (7.2%) |
| $75,000 to $99,999 | 326 (100.0%) | 0 (0.0%) |
| $100,000 and over | 1,353 (100.0%) | 0 (0.0%) |
Public vs Private Health Insurance Coverage by Age in Vails Gate
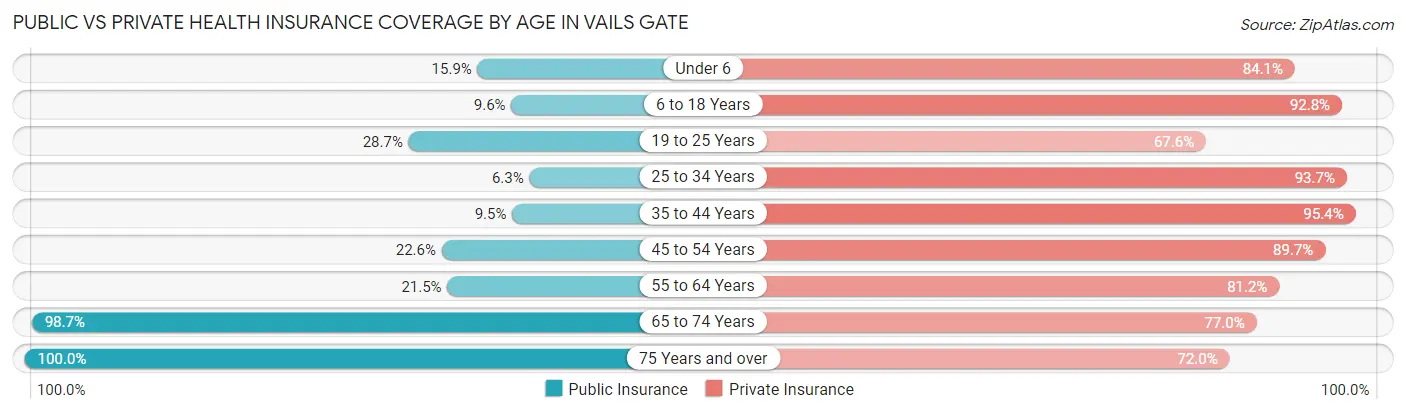
| Age Bracket | Public Insurance | Private Insurance |
| Under 6 | 28 (15.9%) | 148 (84.1%) |
| 6 to 18 Years | 43 (9.6%) | 414 (92.8%) |
| 19 to 25 Years | 62 (28.7%) | 146 (67.6%) |
| 25 to 34 Years | 25 (6.3%) | 373 (93.7%) |
| 35 to 44 Years | 45 (9.5%) | 453 (95.4%) |
| 45 to 54 Years | 79 (22.6%) | 314 (89.7%) |
| 55 to 64 Years | 80 (21.5%) | 302 (81.2%) |
| 65 to 74 Years | 150 (98.7%) | 117 (77.0%) |
| 75 Years and over | 296 (100.0%) | 213 (72.0%) |
| Total | 808 (28.1%) | 2,480 (86.1%) |
Disability Status by Sex by Age in Vails Gate
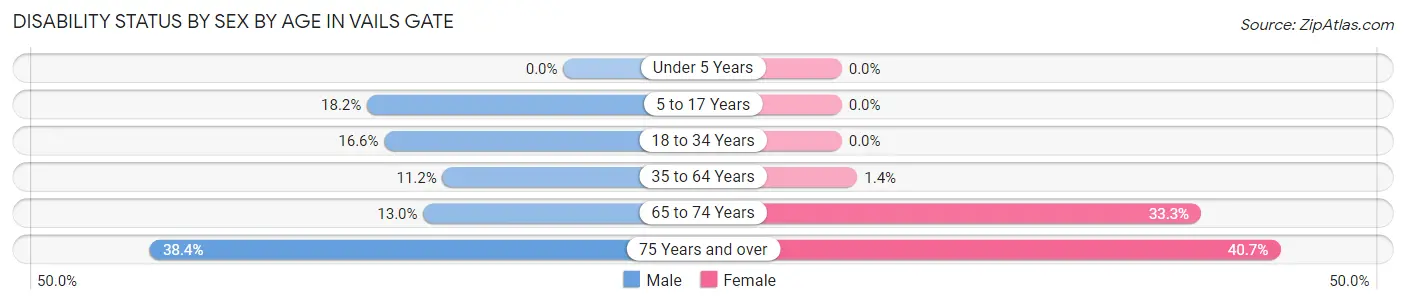
| Age Bracket | Male | Female |
| Under 5 Years | 0 (0.0%) | 0 (0.0%) |
| 5 to 17 Years | 51 (18.2%) | 0 (0.0%) |
| 18 to 34 Years | 53 (16.6%) | 0 (0.0%) |
| 35 to 64 Years | 64 (11.2%) | 9 (1.4%) |
| 65 to 74 Years | 10 (13.0%) | 25 (33.3%) |
| 75 Years and over | 56 (38.4%) | 61 (40.7%) |
Disability Class by Sex by Age in Vails Gate
Disability Class: Hearing Difficulty
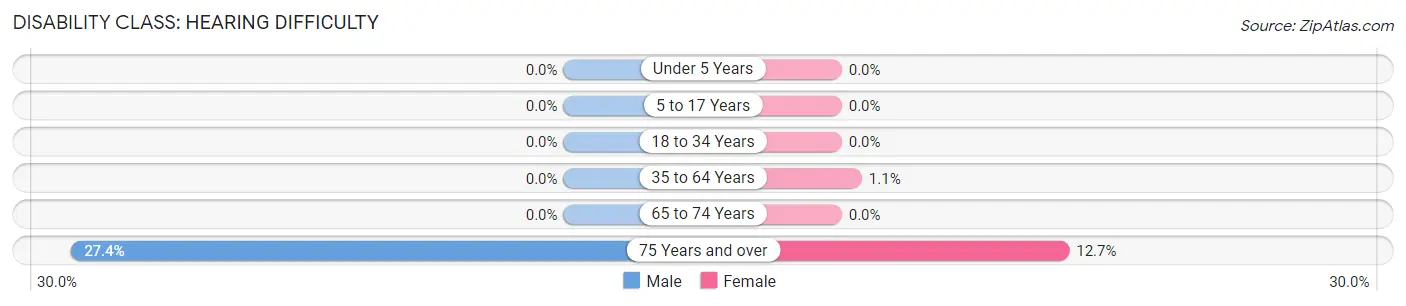
| Age Bracket | Male | Female |
| Under 5 Years | 0 (0.0%) | 0 (0.0%) |
| 5 to 17 Years | 0 (0.0%) | 0 (0.0%) |
| 18 to 34 Years | 0 (0.0%) | 0 (0.0%) |
| 35 to 64 Years | 0 (0.0%) | 7 (1.1%) |
| 65 to 74 Years | 0 (0.0%) | 0 (0.0%) |
| 75 Years and over | 40 (27.4%) | 19 (12.7%) |
Disability Class: Vision Difficulty
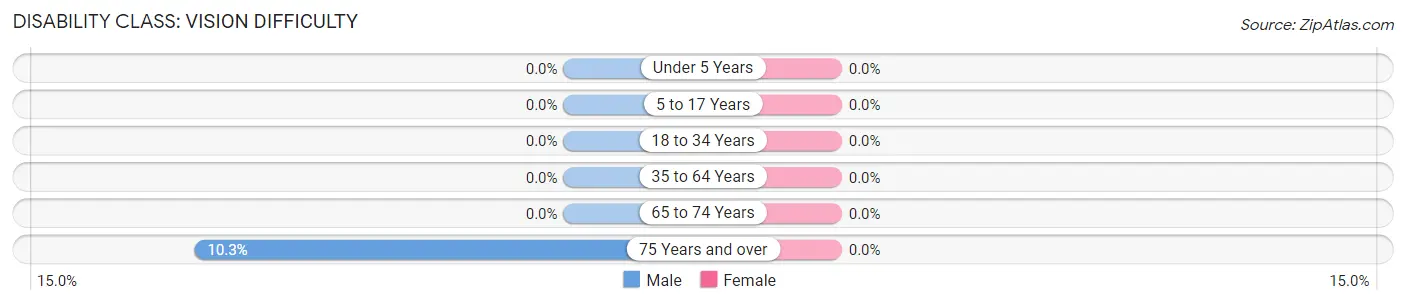
| Age Bracket | Male | Female |
| Under 5 Years | 0 (0.0%) | 0 (0.0%) |
| 5 to 17 Years | 0 (0.0%) | 0 (0.0%) |
| 18 to 34 Years | 0 (0.0%) | 0 (0.0%) |
| 35 to 64 Years | 0 (0.0%) | 0 (0.0%) |
| 65 to 74 Years | 0 (0.0%) | 0 (0.0%) |
| 75 Years and over | 15 (10.3%) | 0 (0.0%) |
Disability Class: Cognitive Difficulty
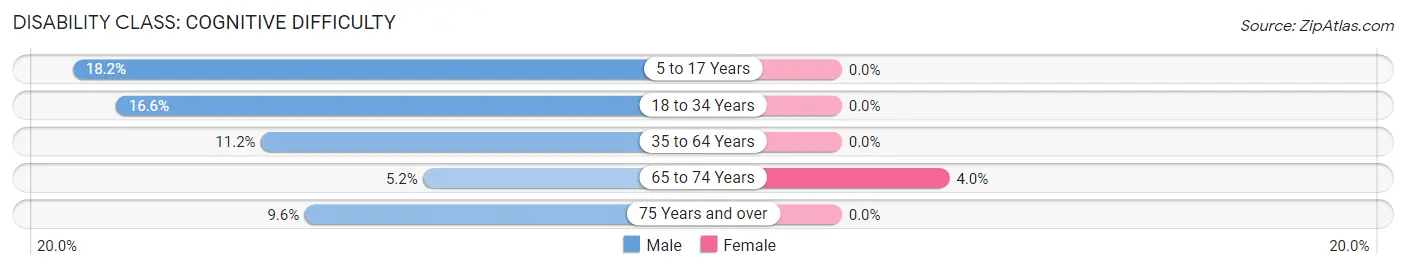
| Age Bracket | Male | Female |
| 5 to 17 Years | 51 (18.2%) | 0 (0.0%) |
| 18 to 34 Years | 53 (16.6%) | 0 (0.0%) |
| 35 to 64 Years | 64 (11.2%) | 0 (0.0%) |
| 65 to 74 Years | 4 (5.2%) | 3 (4.0%) |
| 75 Years and over | 14 (9.6%) | 0 (0.0%) |
Disability Class: Ambulatory Difficulty
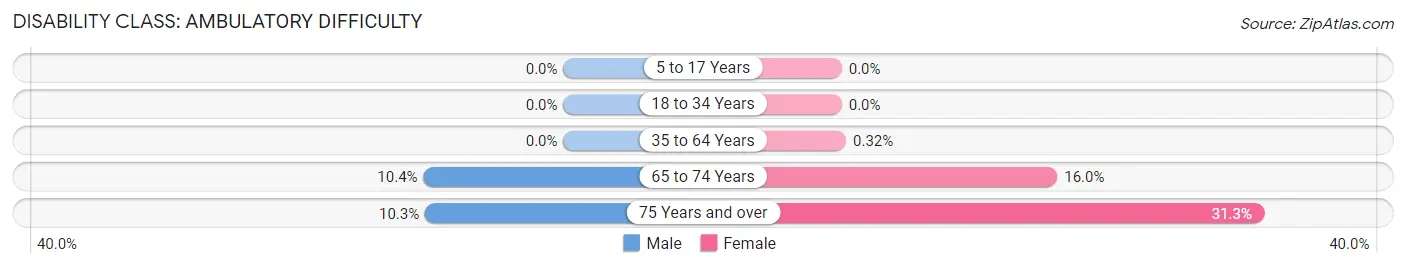
| Age Bracket | Male | Female |
| 5 to 17 Years | 0 (0.0%) | 0 (0.0%) |
| 18 to 34 Years | 0 (0.0%) | 0 (0.0%) |
| 35 to 64 Years | 0 (0.0%) | 2 (0.3%) |
| 65 to 74 Years | 8 (10.4%) | 12 (16.0%) |
| 75 Years and over | 15 (10.3%) | 47 (31.3%) |
Disability Class: Self-Care Difficulty
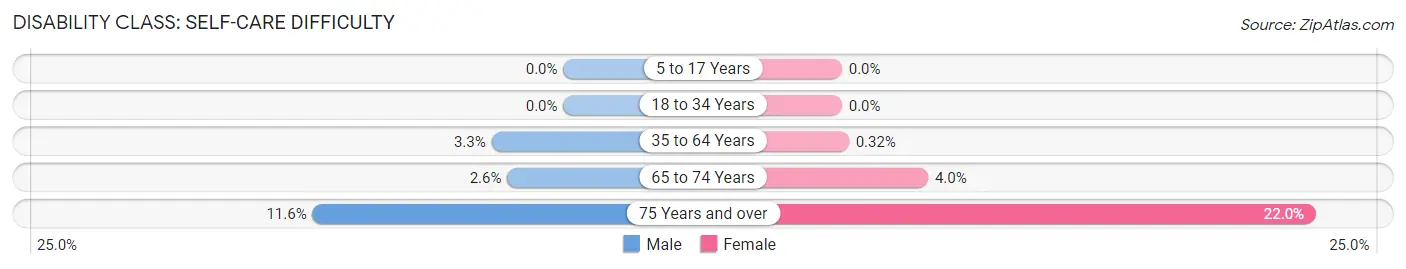
| Age Bracket | Male | Female |
| 5 to 17 Years | 0 (0.0%) | 0 (0.0%) |
| 18 to 34 Years | 0 (0.0%) | 0 (0.0%) |
| 35 to 64 Years | 19 (3.3%) | 2 (0.3%) |
| 65 to 74 Years | 2 (2.6%) | 3 (4.0%) |
| 75 Years and over | 17 (11.6%) | 33 (22.0%) |
Technology Access in Vails Gate
Computing Device Access in Vails Gate
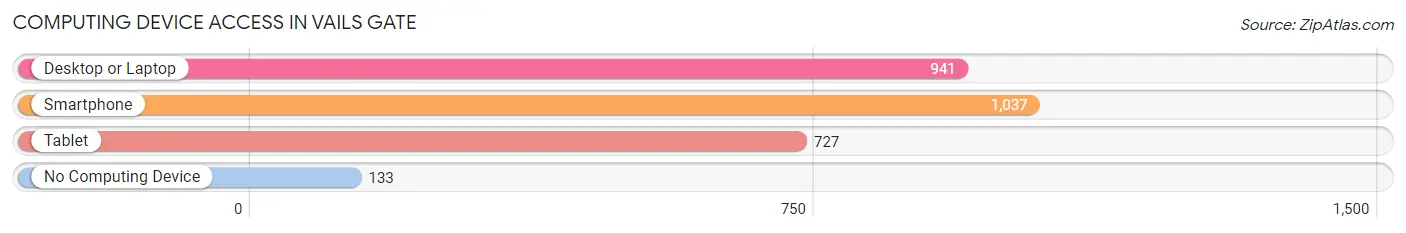
| Device Type | # Households | % Households |
| Desktop or Laptop | 941 | 72.4% |
| Smartphone | 1,037 | 79.8% |
| Tablet | 727 | 55.9% |
| No Computing Device | 133 | 10.2% |
| Total | 1,300 | 100.0% |
Internet Access in Vails Gate
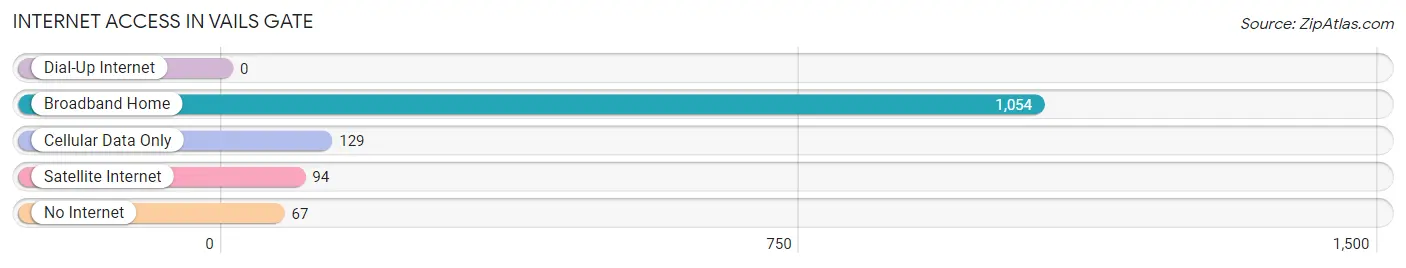
| Internet Type | # Households | % Households |
| Dial-Up Internet | 0 | 0.0% |
| Broadband Home | 1,054 | 81.1% |
| Cellular Data Only | 129 | 9.9% |
| Satellite Internet | 94 | 7.2% |
| No Internet | 67 | 5.1% |
| Total | 1,300 | 100.0% |
Vails Gate Summary
Vails Gate is a hamlet located in the Town of New Windsor in Orange County, New York. It is situated in the Hudson Valley region of the state, approximately 60 miles north of New York City. The hamlet is bordered by the Town of Newburgh to the east, the Town of Cornwall to the south, and the Town of New Windsor to the west.
History
The hamlet of Vails Gate was first settled in the late 1700s by the Vail family, who were among the first settlers in the area. The hamlet was originally known as Vail’s Gate, named after the family. The hamlet was officially incorporated in 1845.
In the late 1800s, the hamlet was a popular summer resort destination for wealthy New Yorkers. The area was known for its natural beauty and its proximity to the Hudson River.
In the early 1900s, the hamlet began to experience a period of growth and development. The hamlet was home to several factories, including a paper mill, a brickyard, and a tannery. The hamlet also had a post office, a bank, and several stores.
Geography
Vails Gate is located in the Hudson Valley region of New York State. The hamlet is situated in the Town of New Windsor, approximately 60 miles north of New York City. The hamlet is bordered by the Town of Newburgh to the east, the Town of Cornwall to the south, and the Town of New Windsor to the west.
The hamlet is located in a rural area, with rolling hills and forests. The hamlet is situated on the banks of the Moodna Creek, which flows into the Hudson River. The hamlet is also located near the Newburgh-Beacon Bridge, which connects the hamlet to the City of Newburgh.
Economy
The economy of Vails Gate is largely based on agriculture and tourism. The hamlet is home to several farms, which produce a variety of fruits and vegetables. The hamlet is also home to several wineries, which produce a variety of wines.
The hamlet is also a popular tourist destination. The hamlet is home to several historic sites, including the Vails Gate Historic District, which is listed on the National Register of Historic Places. The hamlet is also home to several parks and recreational areas, including the Moodna Creek Park and the Vails Gate Nature Preserve.
Demographics
As of the 2010 census, the population of Vails Gate was 2,845. The population is largely white (90.2%), with small percentages of African American (3.2%), Asian (2.2%), and Hispanic (2.2%) residents. The median household income is $60,938, and the median home value is $232,400.
Conclusion
Vails Gate is a hamlet located in the Town of New Windsor in Orange County, New York. The hamlet is situated in the Hudson Valley region of the state, approximately 60 miles north of New York City. The hamlet was first settled in the late 1700s by the Vail family, and was officially incorporated in 1845. The economy of Vails Gate is largely based on agriculture and tourism. As of the 2010 census, the population of Vails Gate was 2,845. The population is largely white, with small percentages of African American, Asian, and Hispanic residents. The median household income is $60,938, and the median home value is $232,400.
Common Questions
What is Per Capita Income in Vails Gate?
Per Capita income in Vails Gate is $38,966.
What is the Median Family Income in Vails Gate?
Median Family Income in Vails Gate is $96,111.
What is the Median Household income in Vails Gate?
Median Household Income in Vails Gate is $66,438.
What is Income or Wage Gap in Vails Gate?
Income or Wage Gap in Vails Gate is 3.3%.
Women in Vails Gate earn 96.7 cents for every dollar earned by a man.
What is Family Income Deficit in Vails Gate?
Family Income Deficit in Vails Gate is $5,638.
Families that are below poverty line in Vails Gate earn $5,638 less on average than the poverty threshold level.
What is Inequality or Gini Index in Vails Gate?
Inequality or Gini Index in Vails Gate is 0.38.
What is the Total Population of Vails Gate?
Total Population of Vails Gate is 2,881.
What is the Total Male Population of Vails Gate?
Total Male Population of Vails Gate is 1,478.
What is the Total Female Population of Vails Gate?
Total Female Population of Vails Gate is 1,403.
What is the Ratio of Males per 100 Females in Vails Gate?
There are 105.35 Males per 100 Females in Vails Gate.
What is the Ratio of Females per 100 Males in Vails Gate?
There are 94.93 Females per 100 Males in Vails Gate.
What is the Median Population Age in Vails Gate?
Median Population Age in Vails Gate is 39.2 Years.
What is the Average Family Size in Vails Gate
Average Family Size in Vails Gate is 3.3 People.
What is the Average Household Size in Vails Gate
Average Household Size in Vails Gate is 2.2 People.
How Large is the Labor Force in Vails Gate?
There are 1,573 People in the Labor Forcein in Vails Gate.
What is the Percentage of People in the Labor Force in Vails Gate?
64.5% of People are in the Labor Force in Vails Gate.
What is the Unemployment Rate in Vails Gate?
Unemployment Rate in Vails Gate is 4.2%.