Mount Ivy, NY Map & Demographics
Mount Ivy Map
Mount Ivy Overview
$47,610
PER CAPITA INCOME
$106,875
AVG FAMILY INCOME
$79,756
AVG HOUSEHOLD INCOME
21.3%
WAGE / INCOME GAP [ % ]
78.7¢/ $1
WAGE / INCOME GAP [ $ ]
0.49
INEQUALITY / GINI INDEX
7,730
TOTAL POPULATION
3,866
MALE POPULATION
3,864
FEMALE POPULATION
100.05
MALES / 100 FEMALES
99.95
FEMALES / 100 MALES
40.2
MEDIAN AGE
3.2
AVG FAMILY SIZE
2.5
AVG HOUSEHOLD SIZE
4,098
LABOR FORCE [ PEOPLE ]
67.1%
PERCENT IN LABOR FORCE
6.9%
UNEMPLOYMENT RATE
Income in Mount Ivy
Income Overview in Mount Ivy
Per Capita Income in Mount Ivy is $47,610, while median incomes of families and households are $106,875 and $79,756 respectively.
| Characteristic | Number | Measure |
| Per Capita Income | 7,730 | $47,610 |
| Median Family Income | 2,018 | $106,875 |
| Mean Family Income | 2,018 | $143,049 |
| Median Household Income | 3,140 | $79,756 |
| Mean Household Income | 3,140 | $112,305 |
| Income Deficit | 2,018 | $0 |
| Wage / Income Gap (%) | 7,730 | 21.31% |
| Wage / Income Gap ($) | 7,730 | 78.69¢ per $1 |
| Gini / Inequality Index | 7,730 | 0.49 |
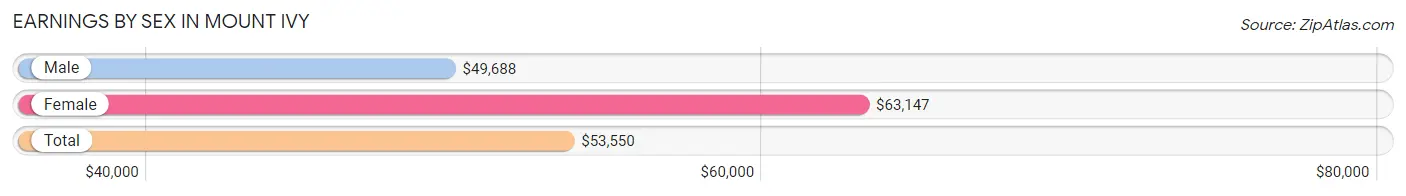
Earnings by Sex in Mount Ivy
Average Earnings in Mount Ivy are $53,550, $49,688 for men and $63,147 for women, a difference of 21.3%.
| Sex | Number | Average Earnings |
| Male | 2,447 (56.6%) | $49,688 |
| Female | 1,873 (43.4%) | $63,147 |
| Total | 4,320 (100.0%) | $53,550 |
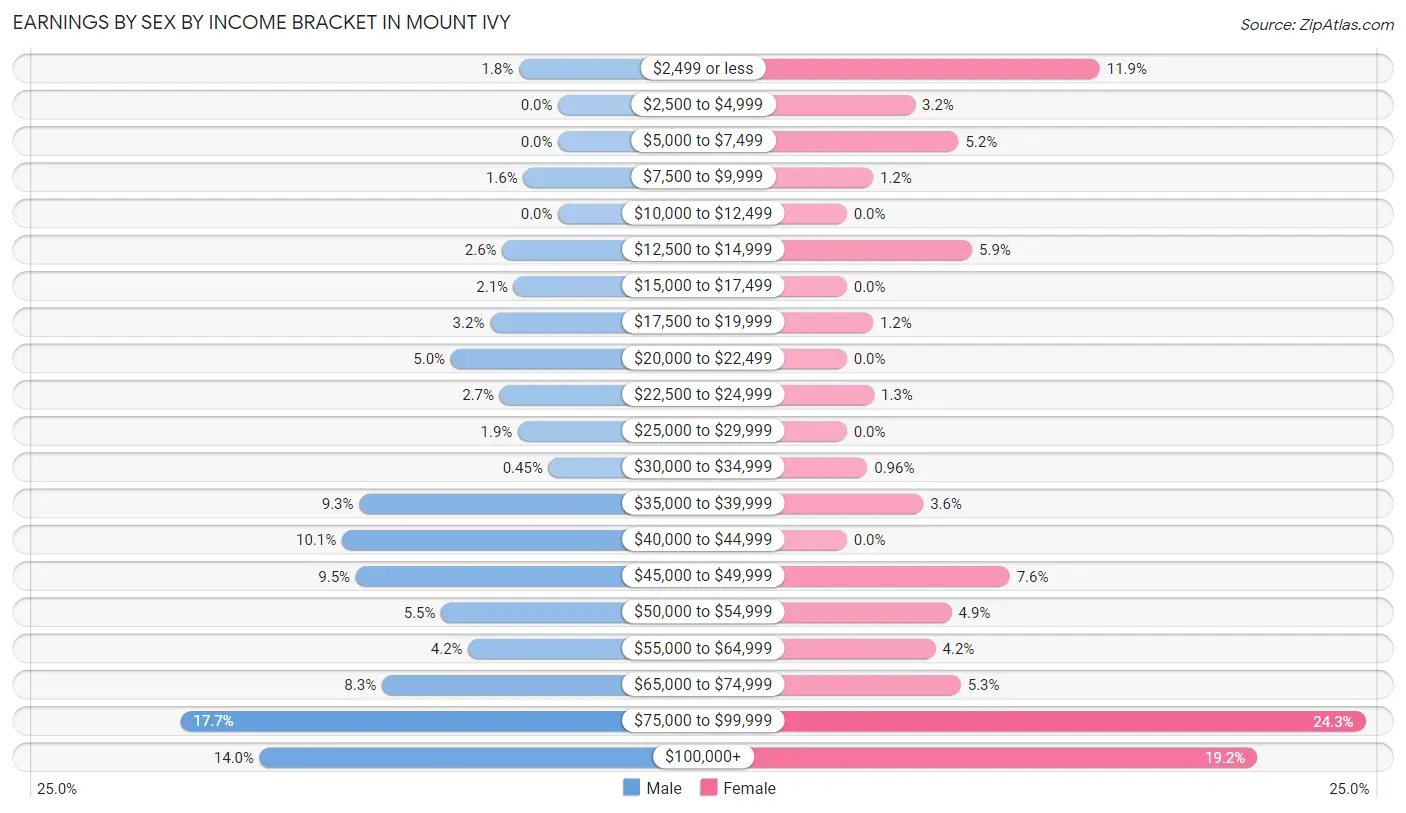
Earnings by Sex by Income Bracket in Mount Ivy
The most common earnings brackets in Mount Ivy are $75,000 to $99,999 for men (433 | 17.7%) and $75,000 to $99,999 for women (455 | 24.3%).
| Income | Male | Female |
| $2,499 or less | 45 (1.8%) | 222 (11.8%) |
| $2,500 to $4,999 | 0 (0.0%) | 60 (3.2%) |
| $5,000 to $7,499 | 0 (0.0%) | 98 (5.2%) |
| $7,500 to $9,999 | 40 (1.6%) | 23 (1.2%) |
| $10,000 to $12,499 | 0 (0.0%) | 0 (0.0%) |
| $12,500 to $14,999 | 64 (2.6%) | 110 (5.9%) |
| $15,000 to $17,499 | 51 (2.1%) | 0 (0.0%) |
| $17,500 to $19,999 | 78 (3.2%) | 23 (1.2%) |
| $20,000 to $22,499 | 123 (5.0%) | 0 (0.0%) |
| $22,500 to $24,999 | 67 (2.7%) | 24 (1.3%) |
| $25,000 to $29,999 | 46 (1.9%) | 0 (0.0%) |
| $30,000 to $34,999 | 11 (0.4%) | 18 (1.0%) |
| $35,000 to $39,999 | 228 (9.3%) | 67 (3.6%) |
| $40,000 to $44,999 | 248 (10.1%) | 0 (0.0%) |
| $45,000 to $49,999 | 232 (9.5%) | 143 (7.6%) |
| $50,000 to $54,999 | 134 (5.5%) | 92 (4.9%) |
| $55,000 to $64,999 | 103 (4.2%) | 78 (4.2%) |
| $65,000 to $74,999 | 202 (8.3%) | 100 (5.3%) |
| $75,000 to $99,999 | 433 (17.7%) | 455 (24.3%) |
| $100,000+ | 342 (14.0%) | 360 (19.2%) |
| Total | 2,447 (100.0%) | 1,873 (100.0%) |
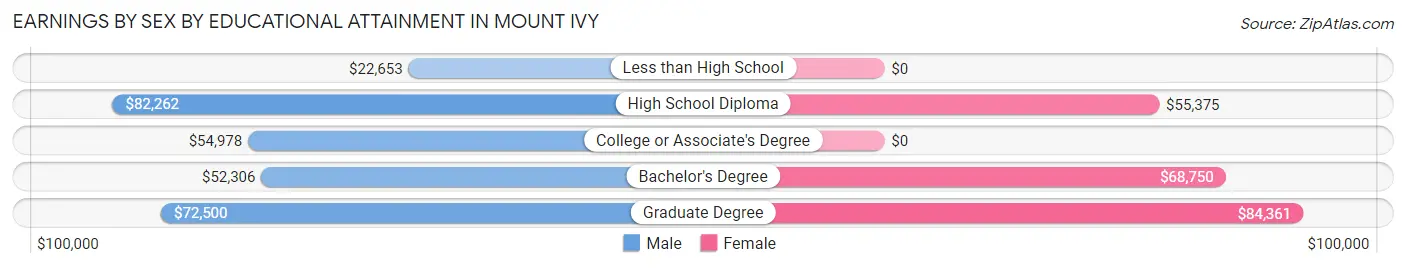
Earnings by Sex by Educational Attainment in Mount Ivy
Average earnings in Mount Ivy are $55,969 for men and $65,114 for women, a difference of 14.0%. Men with an educational attainment of high school diploma enjoy the highest average annual earnings of $82,262, while those with less than high school education earn the least with $22,653. Women with an educational attainment of graduate degree earn the most with the average annual earnings of $84,361, while those with high school diploma education have the smallest earnings of $55,375.
| Educational Attainment | Male Income | Female Income |
| Less than High School | $22,653 | $0 |
| High School Diploma | $82,262 | $55,375 |
| College or Associate's Degree | $54,978 | $0 |
| Bachelor's Degree | $52,306 | $68,750 |
| Graduate Degree | $72,500 | $84,361 |
| Total | $55,969 | $65,114 |
Family Income in Mount Ivy
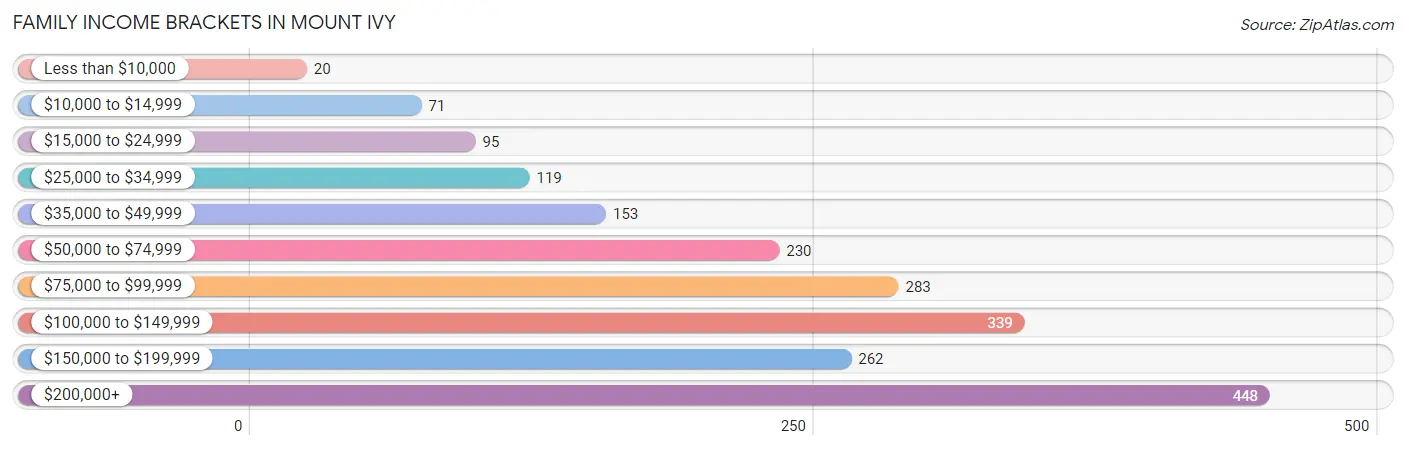
Family Income Brackets in Mount Ivy
According to the Mount Ivy family income data, there are 448 families falling into the $200,000+ income range, which is the most common income bracket and makes up 22.2% of all families. Conversely, the less than $10,000 income bracket is the least frequent group with only 20 families (1.0%) belonging to this category.
| Income Bracket | # Families | % Families |
| Less than $10,000 | 20 | 1.0% |
| $10,000 to $14,999 | 71 | 3.5% |
| $15,000 to $24,999 | 95 | 4.7% |
| $25,000 to $34,999 | 119 | 5.9% |
| $35,000 to $49,999 | 153 | 7.6% |
| $50,000 to $74,999 | 230 | 11.4% |
| $75,000 to $99,999 | 283 | 14.0% |
| $100,000 to $149,999 | 339 | 16.8% |
| $150,000 to $199,999 | 262 | 13.0% |
| $200,000+ | 448 | 22.2% |
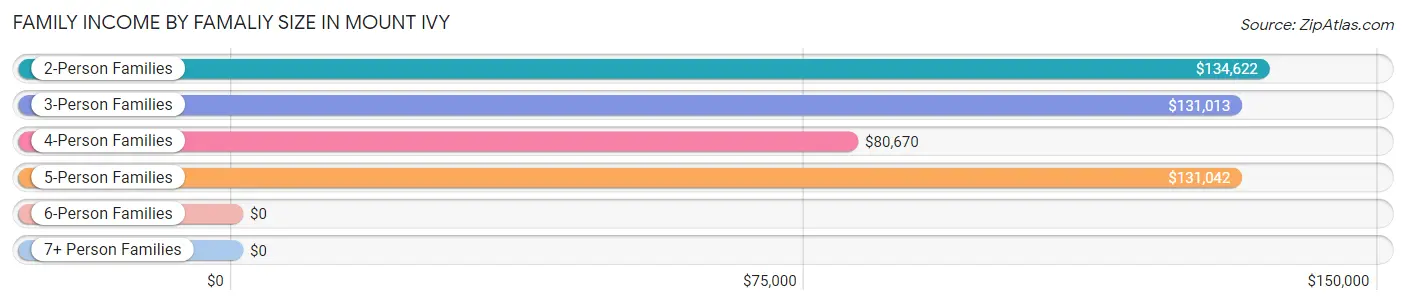
Family Income by Famaliy Size in Mount Ivy
2-person families (791 | 39.2%) account for the highest median family income in Mount Ivy with $134,622 per family, while 2-person families (791 | 39.2%) have the highest median income of $67,311 per family member.
| Income Bracket | # Families | Median Income |
| 2-Person Families | 791 (39.2%) | $134,622 |
| 3-Person Families | 427 (21.2%) | $131,013 |
| 4-Person Families | 695 (34.4%) | $80,670 |
| 5-Person Families | 70 (3.5%) | $131,042 |
| 6-Person Families | 35 (1.7%) | $0 |
| 7+ Person Families | 0 (0.0%) | $0 |
| Total | 2,018 (100.0%) | $106,875 |
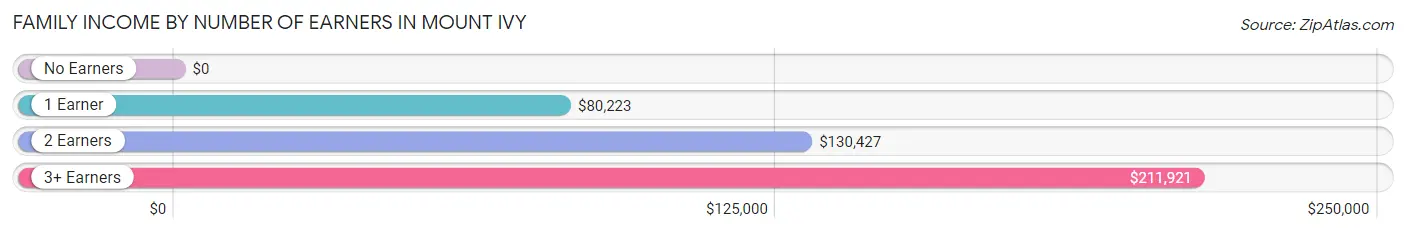
Family Income by Number of Earners in Mount Ivy
| Number of Earners | # Families | Median Income |
| No Earners | 232 (11.5%) | $0 |
| 1 Earner | 651 (32.3%) | $80,223 |
| 2 Earners | 884 (43.8%) | $130,427 |
| 3+ Earners | 251 (12.4%) | $211,921 |
| Total | 2,018 (100.0%) | $106,875 |
Household Income in Mount Ivy
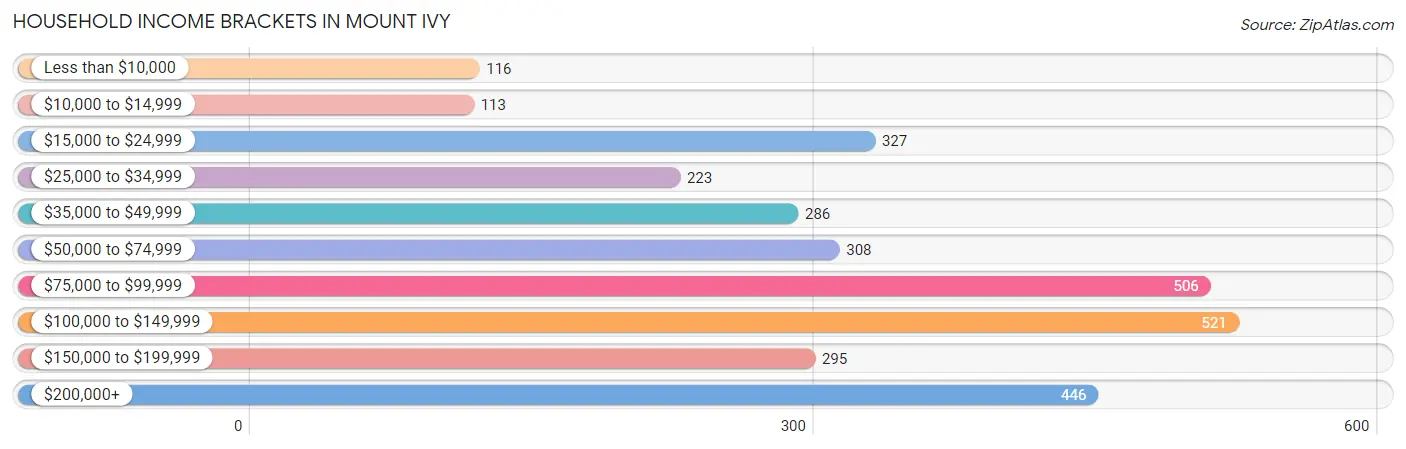
Household Income Brackets in Mount Ivy
With 521 households falling in the category, the $100,000 to $149,999 income range is the most frequent in Mount Ivy, accounting for 16.6% of all households. In contrast, only 113 households (3.6%) fall into the $10,000 to $14,999 income bracket, making it the least populous group.
| Income Bracket | # Households | % Households |
| Less than $10,000 | 116 | 3.7% |
| $10,000 to $14,999 | 113 | 3.6% |
| $15,000 to $24,999 | 327 | 10.4% |
| $25,000 to $34,999 | 223 | 7.1% |
| $35,000 to $49,999 | 286 | 9.1% |
| $50,000 to $74,999 | 308 | 9.8% |
| $75,000 to $99,999 | 506 | 16.1% |
| $100,000 to $149,999 | 521 | 16.6% |
| $150,000 to $199,999 | 295 | 9.4% |
| $200,000+ | 446 | 14.2% |
Household Income by Householder Age in Mount Ivy
The median household income in Mount Ivy is $79,756, with the highest median household income of $96,196 found in the 25 to 44 years age bracket for the primary householder. A total of 875 households (27.9%) fall into this category. Meanwhile, the 15 to 24 years age bracket for the primary householder has the lowest median household income of $0, with 94 households (3.0%) in this group.
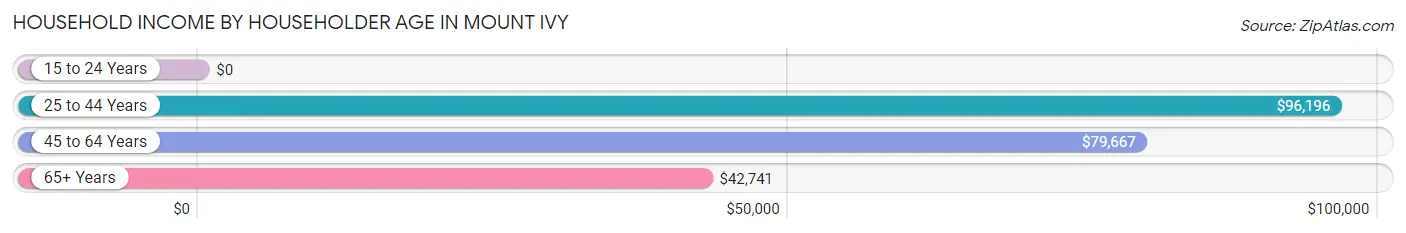
| Income Bracket | # Households | Median Income |
| 15 to 24 Years | 94 (3.0%) | $0 |
| 25 to 44 Years | 875 (27.9%) | $96,196 |
| 45 to 64 Years | 1,396 (44.5%) | $79,667 |
| 65+ Years | 775 (24.7%) | $42,741 |
| Total | 3,140 (100.0%) | $79,756 |
Poverty in Mount Ivy
Income Below Poverty by Sex and Age in Mount Ivy
With 11.2% poverty level for males and 10.7% for females among the residents of Mount Ivy, 65 to 74 year old males and 18 to 24 year old females are the most vulnerable to poverty, with 92 males (31.7%) and 94 females (67.1%) in their respective age groups living below the poverty level.
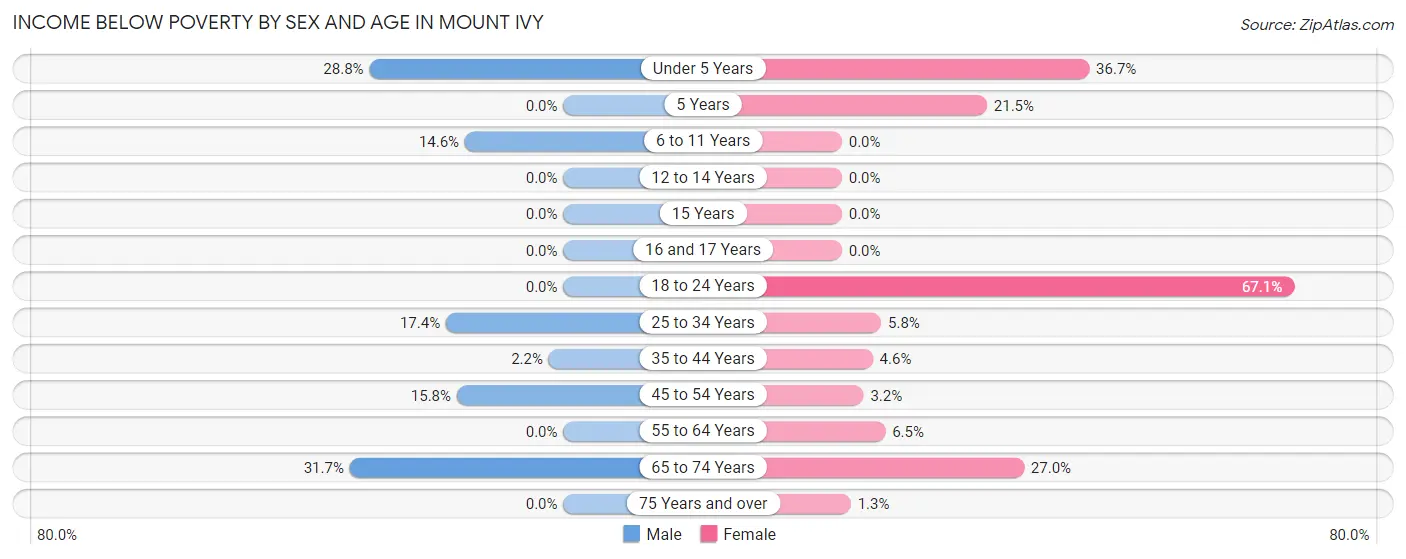
| Age Bracket | Male | Female |
| Under 5 Years | 110 (28.8%) | 108 (36.7%) |
| 5 Years | 0 (0.0%) | 14 (21.5%) |
| 6 to 11 Years | 26 (14.6%) | 0 (0.0%) |
| 12 to 14 Years | 0 (0.0%) | 0 (0.0%) |
| 15 Years | 0 (0.0%) | 0 (0.0%) |
| 16 and 17 Years | 0 (0.0%) | 0 (0.0%) |
| 18 to 24 Years | 0 (0.0%) | 94 (67.1%) |
| 25 to 34 Years | 76 (17.4%) | 42 (5.8%) |
| 35 to 44 Years | 13 (2.2%) | 21 (4.6%) |
| 45 to 54 Years | 117 (15.8%) | 12 (3.2%) |
| 55 to 64 Years | 0 (0.0%) | 44 (6.5%) |
| 65 to 74 Years | 92 (31.7%) | 73 (27.0%) |
| 75 Years and over | 0 (0.0%) | 5 (1.3%) |
| Total | 434 (11.2%) | 413 (10.7%) |
Income Above Poverty by Sex and Age in Mount Ivy
According to the poverty statistics in Mount Ivy, males aged 5 years and females aged 6 to 11 years are the age groups that are most secure financially, with 100.0% of males and 100.0% of females in these age groups living above the poverty line.
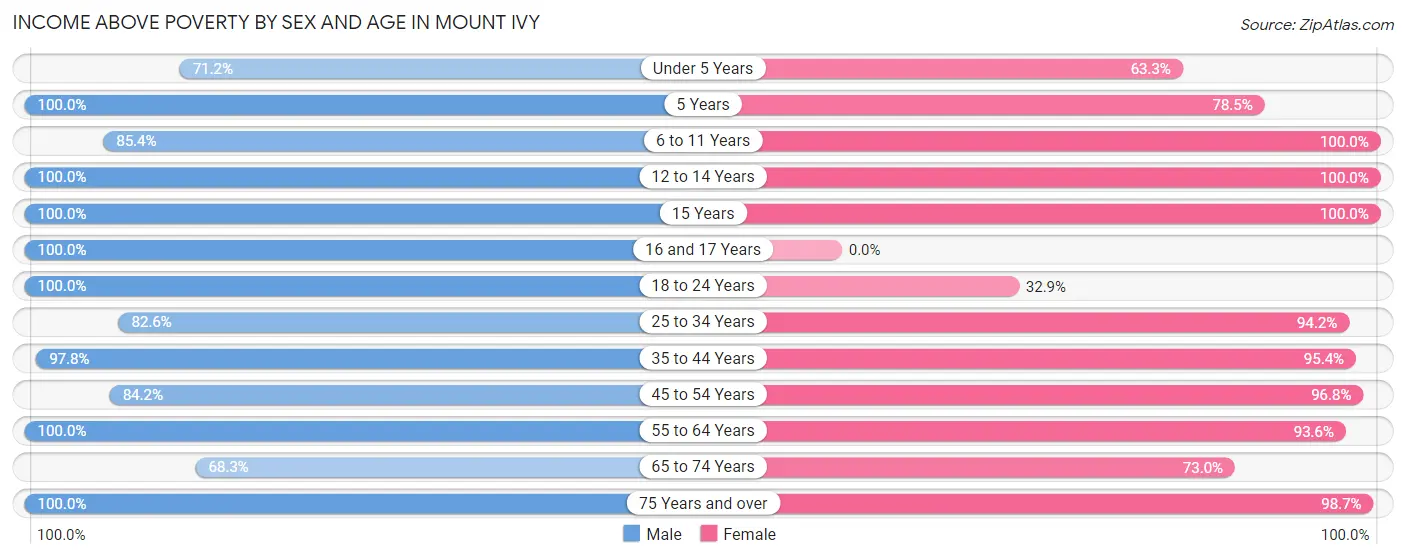
| Age Bracket | Male | Female |
| Under 5 Years | 272 (71.2%) | 186 (63.3%) |
| 5 Years | 40 (100.0%) | 51 (78.5%) |
| 6 to 11 Years | 152 (85.4%) | 167 (100.0%) |
| 12 to 14 Years | 128 (100.0%) | 243 (100.0%) |
| 15 Years | 52 (100.0%) | 73 (100.0%) |
| 16 and 17 Years | 80 (100.0%) | 0 (0.0%) |
| 18 to 24 Years | 280 (100.0%) | 46 (32.9%) |
| 25 to 34 Years | 360 (82.6%) | 679 (94.2%) |
| 35 to 44 Years | 589 (97.8%) | 438 (95.4%) |
| 45 to 54 Years | 623 (84.2%) | 361 (96.8%) |
| 55 to 64 Years | 412 (100.0%) | 638 (93.5%) |
| 65 to 74 Years | 198 (68.3%) | 197 (73.0%) |
| 75 Years and over | 246 (100.0%) | 372 (98.7%) |
| Total | 3,432 (88.8%) | 3,451 (89.3%) |
Income Below Poverty Among Married-Couple Families in Mount Ivy
The poverty statistics for married-couple families in Mount Ivy show that 11.3% or 164 of the total 1,457 families live below the poverty line. Families with 1 or 2 children have the highest poverty rate of 12.9%, comprising of 94 families. On the other hand, families with 3 or 4 children have the lowest poverty rate of 0.0%, which includes 0 families.
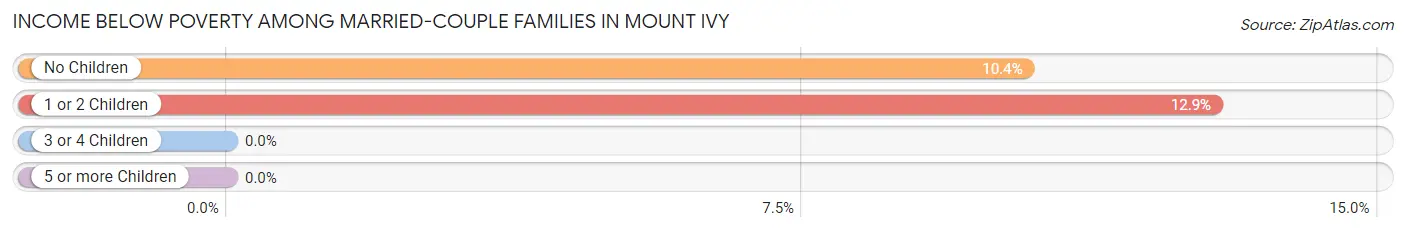
| Children | Above Poverty | Below Poverty |
| No Children | 603 (89.6%) | 70 (10.4%) |
| 1 or 2 Children | 637 (87.1%) | 94 (12.9%) |
| 3 or 4 Children | 53 (100.0%) | 0 (0.0%) |
| 5 or more Children | 0 (0.0%) | 0 (0.0%) |
| Total | 1,293 (88.7%) | 164 (11.3%) |
Income Below Poverty Among Single-Parent Households in Mount Ivy
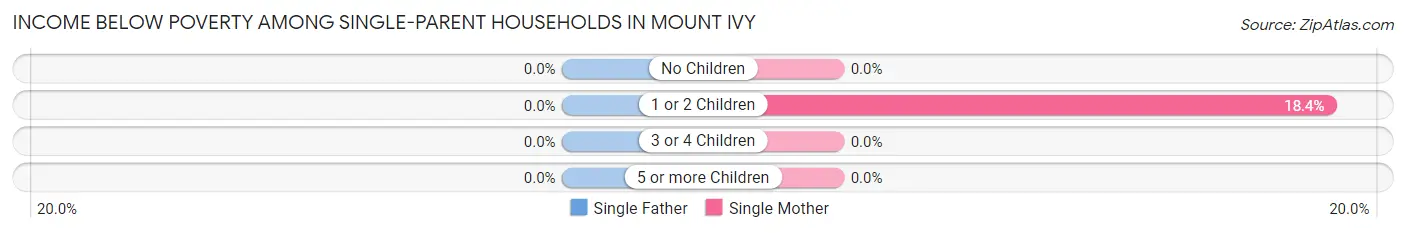
| Children | Single Father | Single Mother |
| No Children | 0 (0.0%) | 0 (0.0%) |
| 1 or 2 Children | 0 (0.0%) | 20 (18.3%) |
| 3 or 4 Children | 0 (0.0%) | 0 (0.0%) |
| 5 or more Children | 0 (0.0%) | 0 (0.0%) |
| Total | 0 (0.0%) | 20 (6.0%) |
Income Below Poverty Among Married-Couple vs Single-Parent Households in Mount Ivy
The poverty data for Mount Ivy shows that 164 of the married-couple family households (11.3%) and 20 of the single-parent households (3.6%) are living below the poverty level. Within the married-couple family households, those with 1 or 2 children have the highest poverty rate, with 94 households (12.9%) falling below the poverty line. Among the single-parent households, those with 1 or 2 children have the highest poverty rate, with 20 household (6.6%) living below poverty.
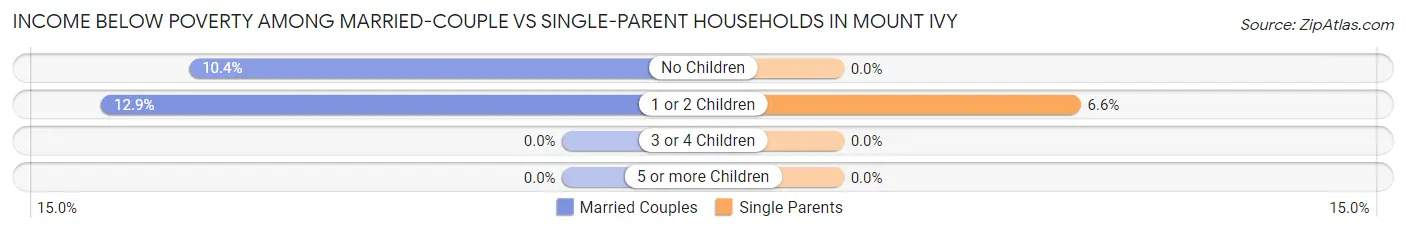
| Children | Married-Couple Families | Single-Parent Households |
| No Children | 70 (10.4%) | 0 (0.0%) |
| 1 or 2 Children | 94 (12.9%) | 20 (6.6%) |
| 3 or 4 Children | 0 (0.0%) | 0 (0.0%) |
| 5 or more Children | 0 (0.0%) | 0 (0.0%) |
| Total | 164 (11.3%) | 20 (3.6%) |
Race in Mount Ivy
The most populous races in Mount Ivy are White / Caucasian (3,980 | 51.5%), Hispanic or Latino (2,611 | 33.8%), and Some other Race (1,602 | 20.7%).
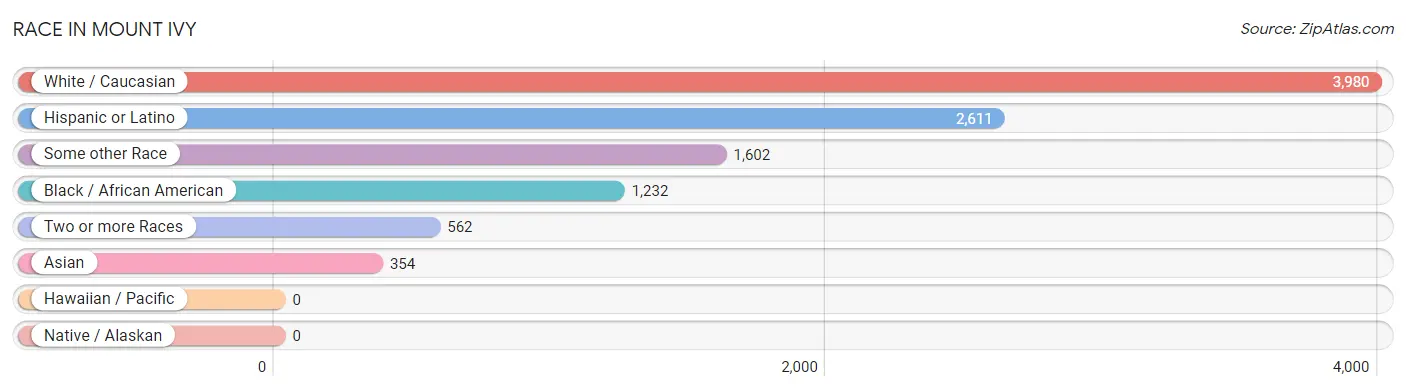
| Race | # Population | % Population |
| Asian | 354 | 4.6% |
| Black / African American | 1,232 | 15.9% |
| Hawaiian / Pacific | 0 | 0.0% |
| Hispanic or Latino | 2,611 | 33.8% |
| Native / Alaskan | 0 | 0.0% |
| White / Caucasian | 3,980 | 51.5% |
| Two or more Races | 562 | 7.3% |
| Some other Race | 1,602 | 20.7% |
| Total | 7,730 | 100.0% |
Ancestry in Mount Ivy
The most populous ancestries reported in Mount Ivy are Puerto Rican (1,025 | 13.3%), Italian (767 | 9.9%), Irish (671 | 8.7%), Central American (555 | 7.2%), and South American (493 | 6.4%), together accounting for 45.4% of all Mount Ivy residents.
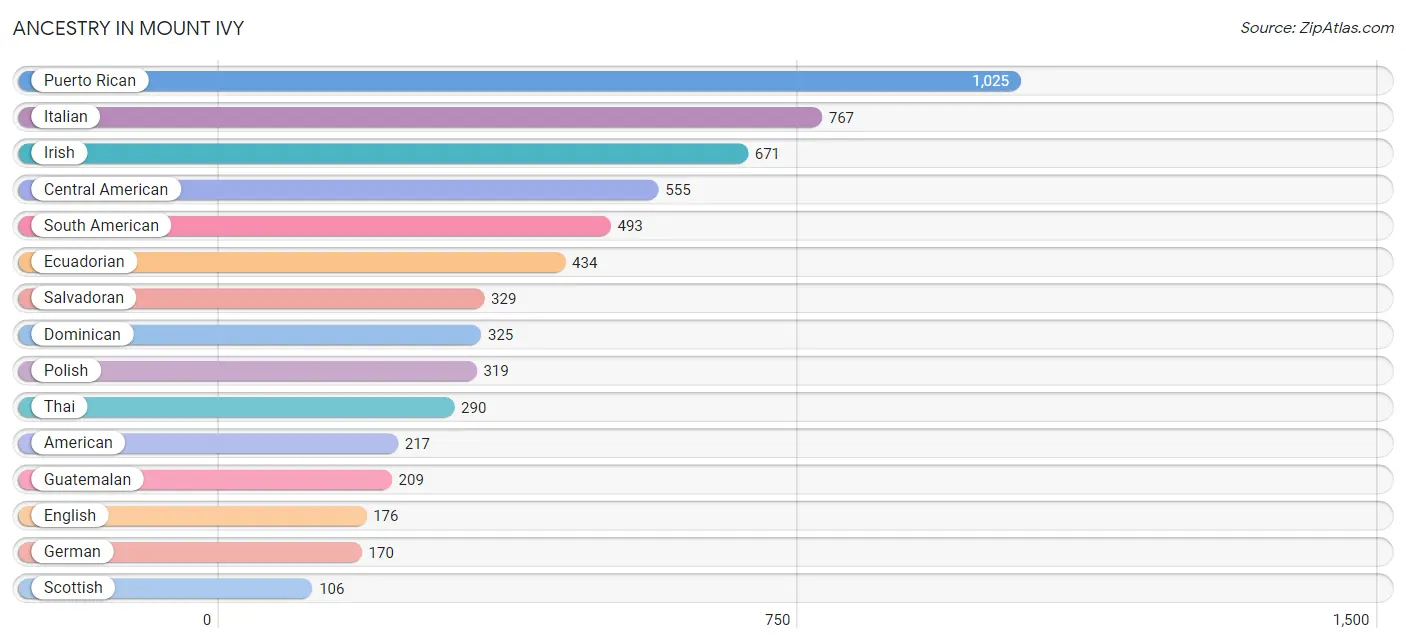
| Ancestry | # Population | % Population |
| Afghan | 51 | 0.7% |
| Albanian | 20 | 0.3% |
| American | 217 | 2.8% |
| Arab | 49 | 0.6% |
| Austrian | 7 | 0.1% |
| Bhutanese | 47 | 0.6% |
| British | 19 | 0.3% |
| Burmese | 98 | 1.3% |
| Central American | 555 | 7.2% |
| Colombian | 59 | 0.8% |
| Croatian | 2 | 0.0% |
| Dominican | 325 | 4.2% |
| Eastern European | 30 | 0.4% |
| Ecuadorian | 434 | 5.6% |
| English | 176 | 2.3% |
| European | 61 | 0.8% |
| German | 170 | 2.2% |
| Guatemalan | 209 | 2.7% |
| Guyanese | 42 | 0.5% |
| Haitian | 98 | 1.3% |
| Honduran | 17 | 0.2% |
| Hungarian | 65 | 0.8% |
| Indian (Asian) | 57 | 0.7% |
| Iraqi | 49 | 0.6% |
| Irish | 671 | 8.7% |
| Italian | 767 | 9.9% |
| Jamaican | 39 | 0.5% |
| Korean | 46 | 0.6% |
| Lebanese | 49 | 0.6% |
| Mexican | 29 | 0.4% |
| Nigerian | 80 | 1.0% |
| Polish | 319 | 4.1% |
| Puerto Rican | 1,025 | 13.3% |
| Romanian | 20 | 0.3% |
| Russian | 89 | 1.1% |
| Salvadoran | 329 | 4.3% |
| Scottish | 106 | 1.4% |
| South American | 493 | 6.4% |
| Subsaharan African | 80 | 1.0% |
| Thai | 290 | 3.7% |
| Ukrainian | 37 | 0.5% | View All 41 Rows |
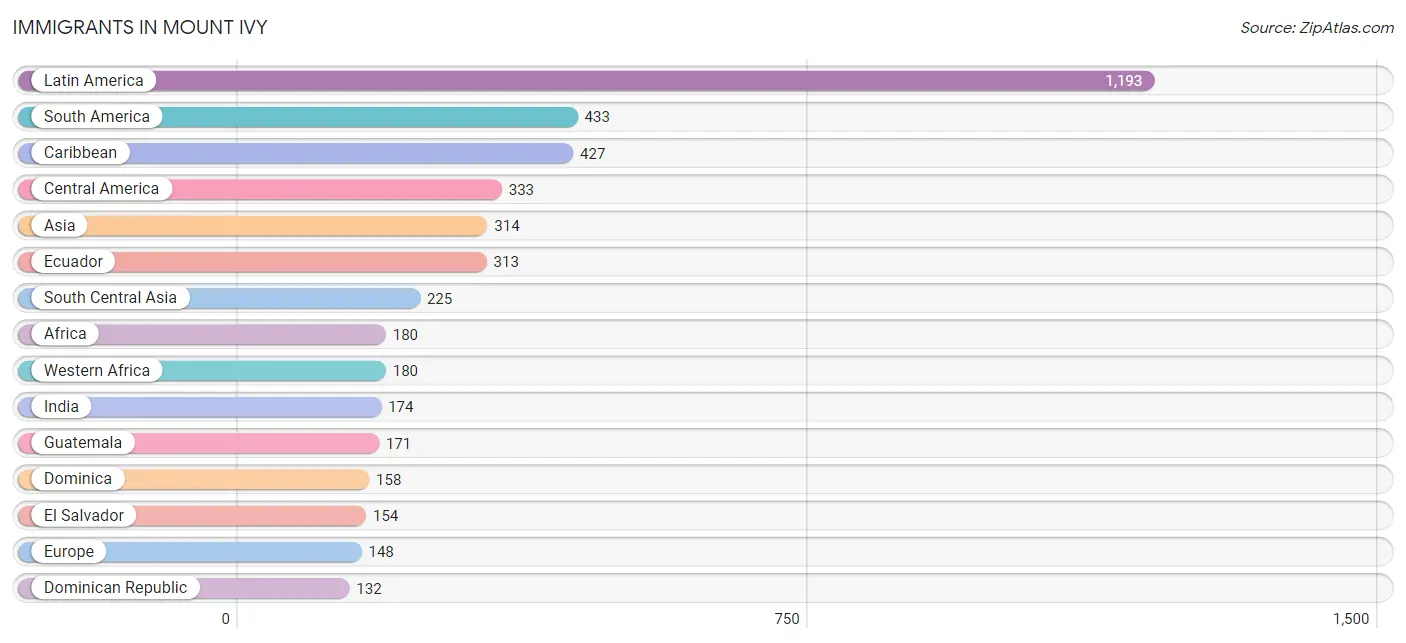
Immigrants in Mount Ivy
The most numerous immigrant groups reported in Mount Ivy came from Latin America (1,193 | 15.4%), South America (433 | 5.6%), Caribbean (427 | 5.5%), Central America (333 | 4.3%), and Asia (314 | 4.1%), together accounting for 34.9% of all Mount Ivy residents.
| Immigration Origin | # Population | % Population |
| Afghanistan | 51 | 0.7% |
| Africa | 180 | 2.3% |
| Albania | 42 | 0.5% |
| Asia | 314 | 4.1% |
| Canada | 17 | 0.2% |
| Caribbean | 427 | 5.5% |
| Central America | 333 | 4.3% |
| Chile | 78 | 1.0% |
| Dominica | 158 | 2.0% |
| Dominican Republic | 132 | 1.7% |
| Eastern Europe | 119 | 1.5% |
| Ecuador | 313 | 4.1% |
| El Salvador | 154 | 2.0% |
| England | 16 | 0.2% |
| Europe | 148 | 1.9% |
| Ghana | 71 | 0.9% |
| Guatemala | 171 | 2.2% |
| Guyana | 42 | 0.5% |
| Haiti | 98 | 1.3% |
| Honduras | 8 | 0.1% |
| India | 174 | 2.2% |
| Iraq | 49 | 0.6% |
| Ireland | 13 | 0.2% |
| Israel | 21 | 0.3% |
| Jamaica | 39 | 0.5% |
| Latin America | 1,193 | 15.4% |
| Nigeria | 109 | 1.4% |
| Northern Europe | 29 | 0.4% |
| Poland | 77 | 1.0% |
| Saudi Arabia | 19 | 0.3% |
| South America | 433 | 5.6% |
| South Central Asia | 225 | 2.9% |
| Western Africa | 180 | 2.3% |
| Western Asia | 89 | 1.1% | View All 34 Rows |
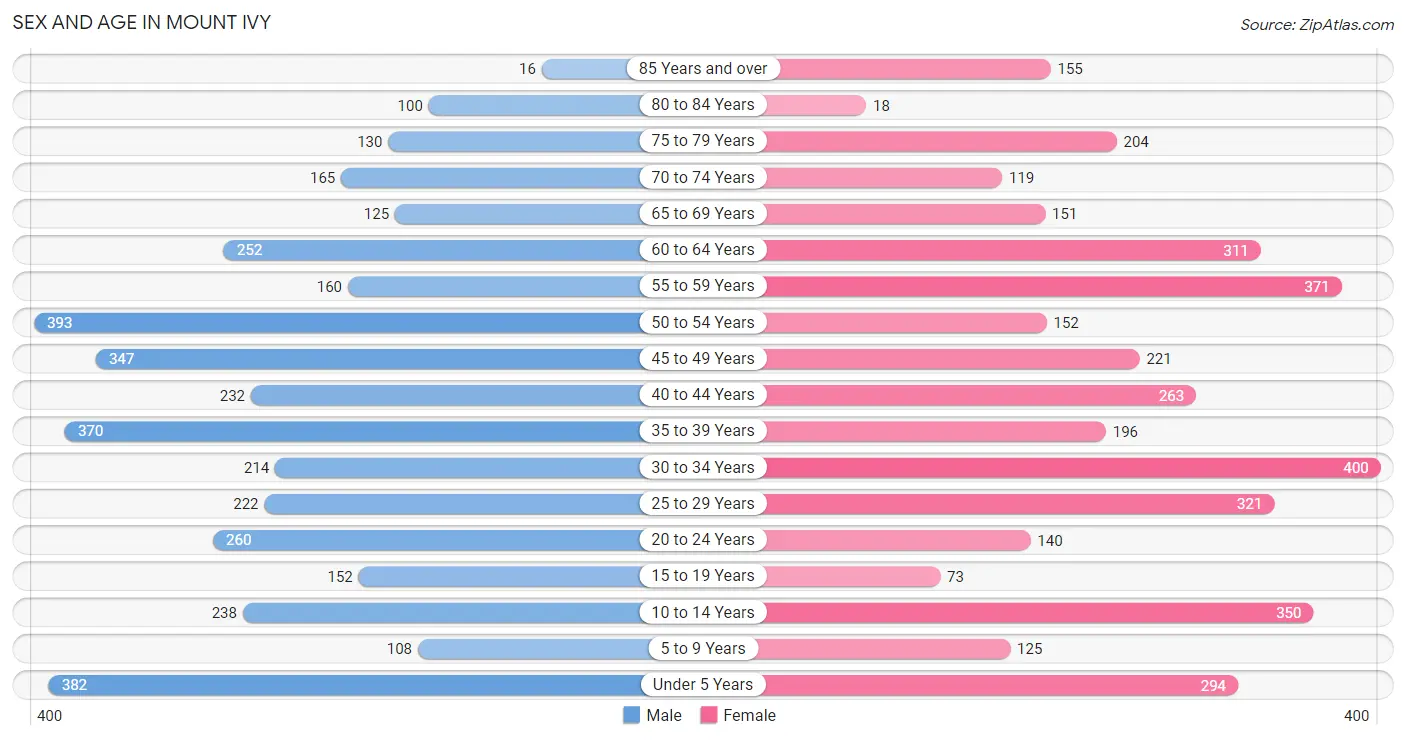
Sex and Age in Mount Ivy
Sex and Age in Mount Ivy
The most populous age groups in Mount Ivy are 50 to 54 Years (393 | 10.2%) for men and 30 to 34 Years (400 | 10.3%) for women.
| Age Bracket | Male | Female |
| Under 5 Years | 382 (9.9%) | 294 (7.6%) |
| 5 to 9 Years | 108 (2.8%) | 125 (3.2%) |
| 10 to 14 Years | 238 (6.2%) | 350 (9.1%) |
| 15 to 19 Years | 152 (3.9%) | 73 (1.9%) |
| 20 to 24 Years | 260 (6.7%) | 140 (3.6%) |
| 25 to 29 Years | 222 (5.7%) | 321 (8.3%) |
| 30 to 34 Years | 214 (5.5%) | 400 (10.3%) |
| 35 to 39 Years | 370 (9.6%) | 196 (5.1%) |
| 40 to 44 Years | 232 (6.0%) | 263 (6.8%) |
| 45 to 49 Years | 347 (9.0%) | 221 (5.7%) |
| 50 to 54 Years | 393 (10.2%) | 152 (3.9%) |
| 55 to 59 Years | 160 (4.1%) | 371 (9.6%) |
| 60 to 64 Years | 252 (6.5%) | 311 (8.1%) |
| 65 to 69 Years | 125 (3.2%) | 151 (3.9%) |
| 70 to 74 Years | 165 (4.3%) | 119 (3.1%) |
| 75 to 79 Years | 130 (3.4%) | 204 (5.3%) |
| 80 to 84 Years | 100 (2.6%) | 18 (0.5%) |
| 85 Years and over | 16 (0.4%) | 155 (4.0%) |
| Total | 3,866 (100.0%) | 3,864 (100.0%) |
Families and Households in Mount Ivy
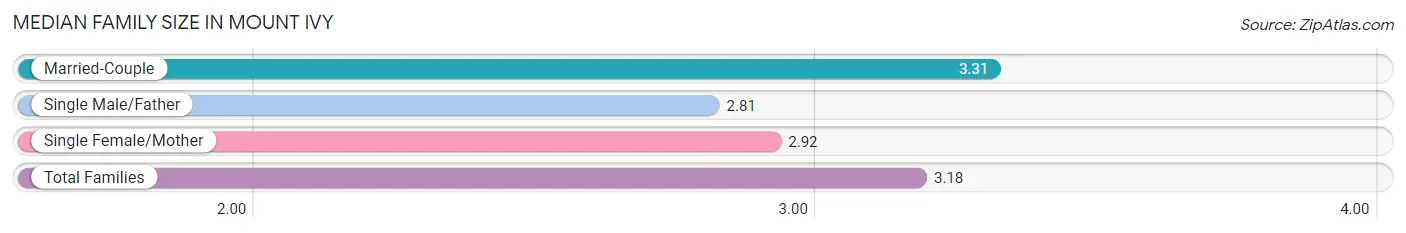
Median Family Size in Mount Ivy
The median family size in Mount Ivy is 3.18 persons per family, with married-couple families (1,457 | 72.2%) accounting for the largest median family size of 3.31 persons per family. On the other hand, single male/father families (227 | 11.3%) represent the smallest median family size with 2.81 persons per family.
| Family Type | # Families | Family Size |
| Married-Couple | 1,457 (72.2%) | 3.31 |
| Single Male/Father | 227 (11.3%) | 2.81 |
| Single Female/Mother | 334 (16.6%) | 2.92 |
| Total Families | 2,018 (100.0%) | 3.18 |
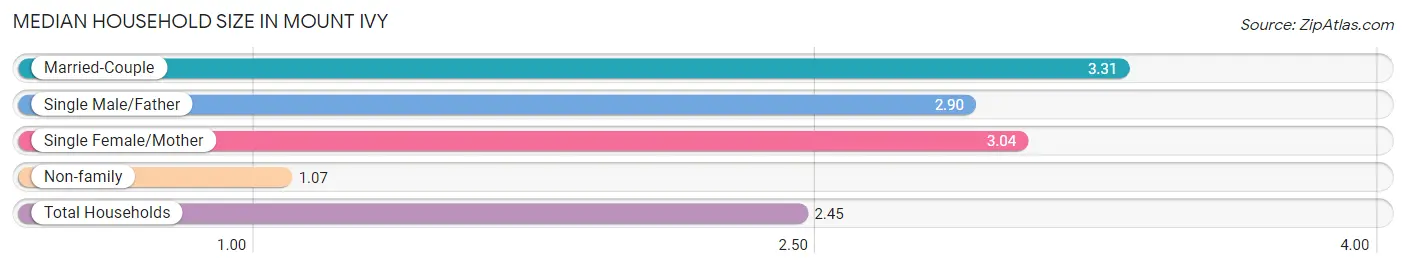
Median Household Size in Mount Ivy
The median household size in Mount Ivy is 2.45 persons per household, with married-couple households (1,457 | 46.4%) accounting for the largest median household size of 3.31 persons per household. non-family households (1,122 | 35.7%) represent the smallest median household size with 1.07 persons per household.
| Household Type | # Households | Household Size |
| Married-Couple | 1,457 (46.4%) | 3.31 |
| Single Male/Father | 227 (7.2%) | 2.90 |
| Single Female/Mother | 334 (10.6%) | 3.04 |
| Non-family | 1,122 (35.7%) | 1.07 |
| Total Households | 3,140 (100.0%) | 2.45 |
Household Size by Marriage Status in Mount Ivy
Out of a total of 3,140 households in Mount Ivy, 2,018 (64.3%) are family households, while 1,122 (35.7%) are nonfamily households. The most numerous type of family households are 2-person households, comprising 787, and the most common type of nonfamily households are 1-person households, comprising 1,043.
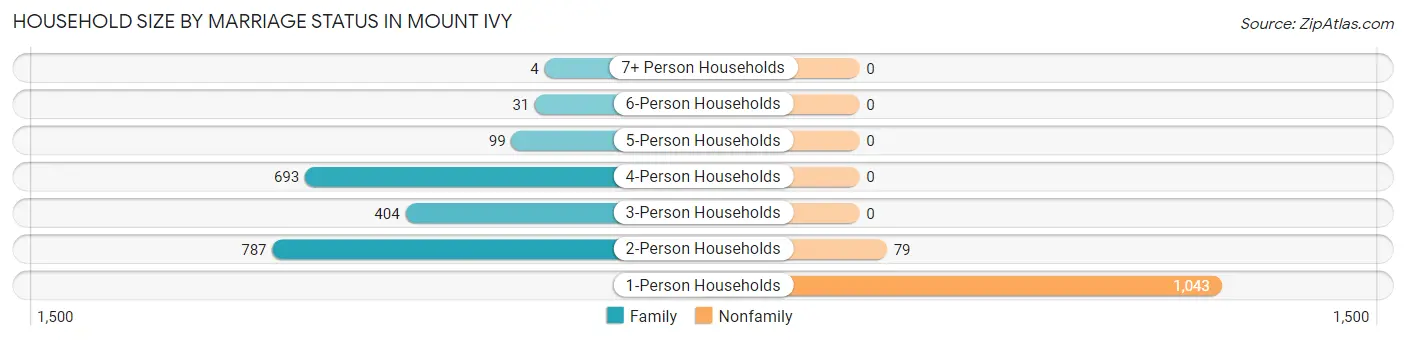
| Household Size | Family Households | Nonfamily Households |
| 1-Person Households | - | 1,043 (33.2%) |
| 2-Person Households | 787 (25.1%) | 79 (2.5%) |
| 3-Person Households | 404 (12.9%) | 0 (0.0%) |
| 4-Person Households | 693 (22.1%) | 0 (0.0%) |
| 5-Person Households | 99 (3.2%) | 0 (0.0%) |
| 6-Person Households | 31 (1.0%) | 0 (0.0%) |
| 7+ Person Households | 4 (0.1%) | 0 (0.0%) |
| Total | 2,018 (64.3%) | 1,122 (35.7%) |
Female Fertility in Mount Ivy
Fertility by Age in Mount Ivy
Average fertility rate in Mount Ivy is 31.0 births per 1,000 women. Women in the age bracket of 35 to 50 years have the highest fertility rate with 69.0 births per 1,000 women. Women in the age bracket of 35 to 50 years acount for 100.0% of all women with births.
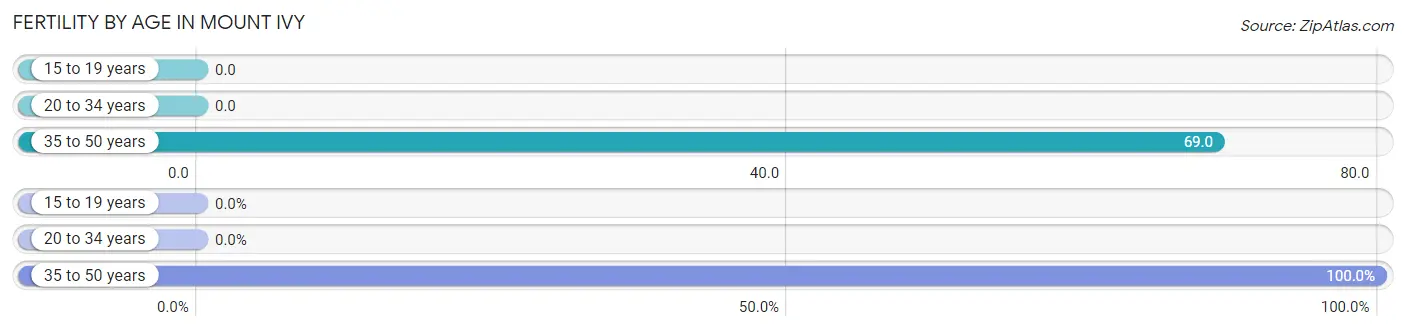
| Age Bracket | Women with Births | Births / 1,000 Women |
| 15 to 19 years | 0 (0.0%) | 0.0 |
| 20 to 34 years | 0 (0.0%) | 0.0 |
| 35 to 50 years | 53 (100.0%) | 69.0 |
| Total | 53 (100.0%) | 31.0 |
Fertility by Age by Marriage Status in Mount Ivy
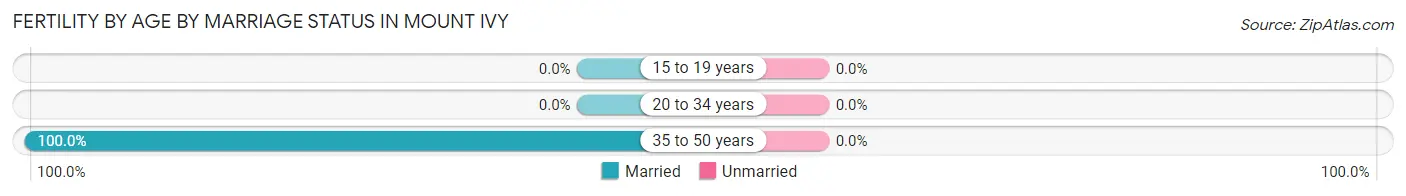
| Age Bracket | Married | Unmarried |
| 15 to 19 years | 0 (0.0%) | 0 (0.0%) |
| 20 to 34 years | 0 (0.0%) | 0 (0.0%) |
| 35 to 50 years | 53 (100.0%) | 0 (0.0%) |
| Total | 53 (100.0%) | 0 (0.0%) |
Fertility by Education in Mount Ivy
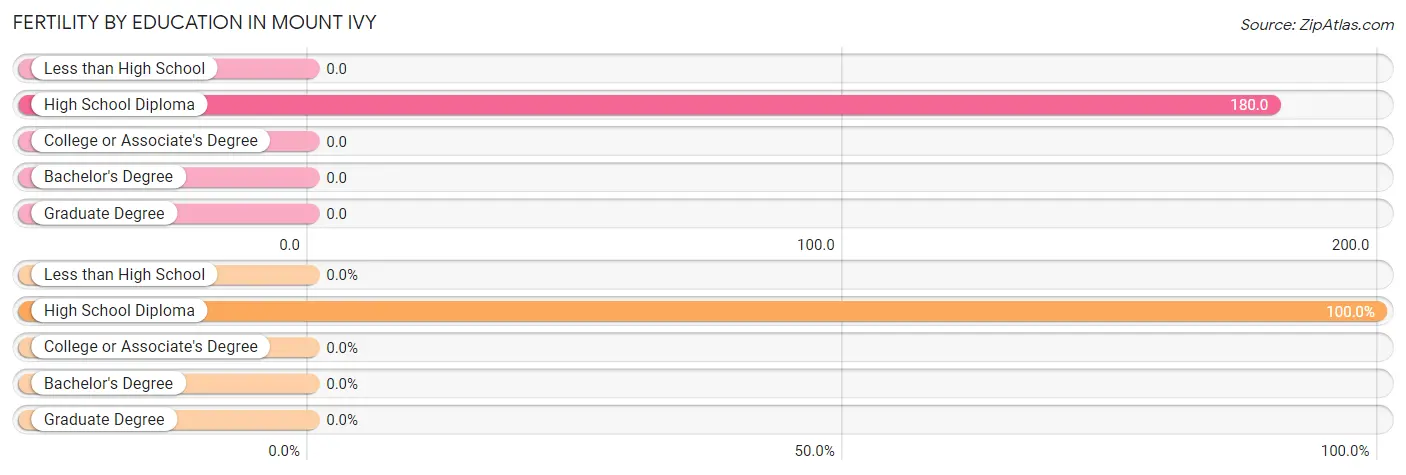
| Educational Attainment | Women with Births | Births / 1,000 Women |
| Less than High School | 0 (0.0%) | 0.0 |
| High School Diploma | 53 (100.0%) | 180.0 |
| College or Associate's Degree | 0 (0.0%) | 0.0 |
| Bachelor's Degree | 0 (0.0%) | 0.0 |
| Graduate Degree | 0 (0.0%) | 0.0 |
| Total | 53 (100.0%) | 31.0 |
Fertility by Education by Marriage Status in Mount Ivy
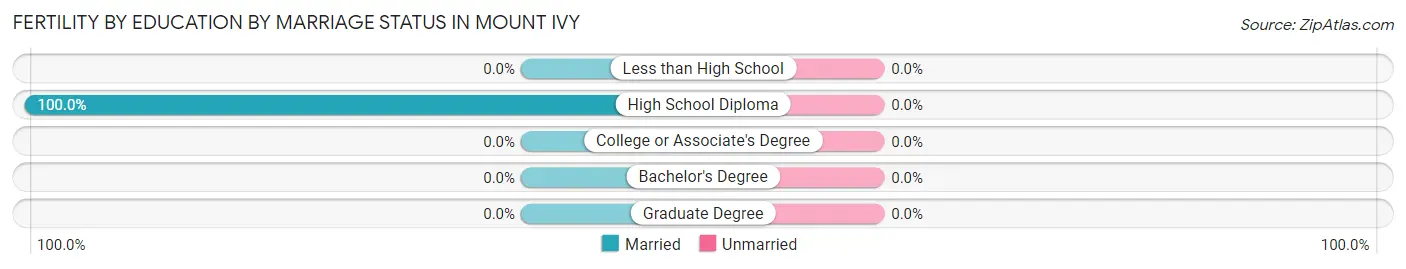
| Educational Attainment | Married | Unmarried |
| Less than High School | 0 (0.0%) | 0 (0.0%) |
| High School Diploma | 53 (100.0%) | 0 (0.0%) |
| College or Associate's Degree | 0 (0.0%) | 0 (0.0%) |
| Bachelor's Degree | 0 (0.0%) | 0 (0.0%) |
| Graduate Degree | 0 (0.0%) | 0 (0.0%) |
| Total | 53 (100.0%) | 0 (0.0%) |
Employment Characteristics in Mount Ivy
Employment by Class of Employer in Mount Ivy
Among the 3,712 employed individuals in Mount Ivy, private company employees (2,155 | 58.1%), not-for-profit organizations (767 | 20.7%), and local government employees (388 | 10.4%) make up the most common classes of employment.
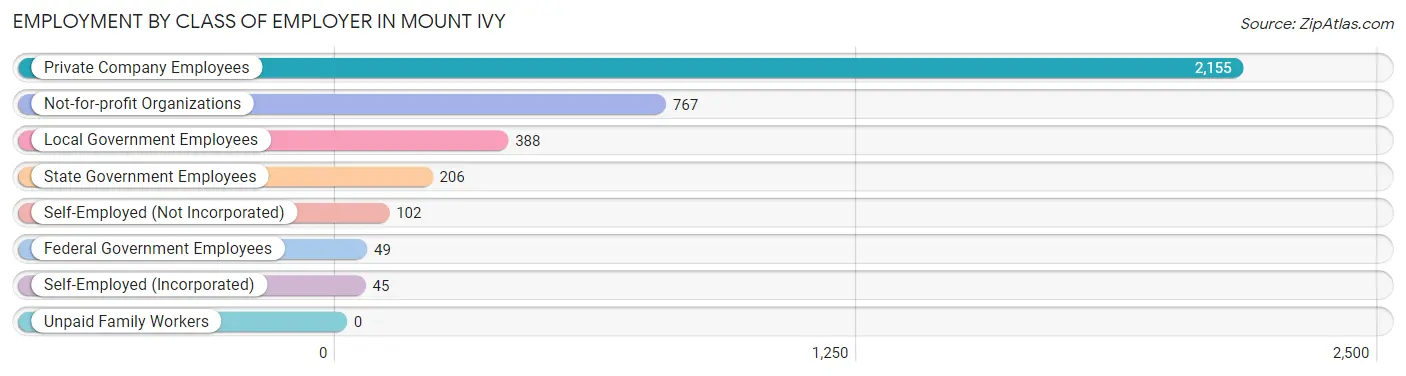
| Employer Class | # Employees | % Employees |
| Private Company Employees | 2,155 | 58.1% |
| Self-Employed (Incorporated) | 45 | 1.2% |
| Self-Employed (Not Incorporated) | 102 | 2.8% |
| Not-for-profit Organizations | 767 | 20.7% |
| Local Government Employees | 388 | 10.4% |
| State Government Employees | 206 | 5.6% |
| Federal Government Employees | 49 | 1.3% |
| Unpaid Family Workers | 0 | 0.0% |
| Total | 3,712 | 100.0% |
Employment Status by Age in Mount Ivy
According to the labor force statistics for Mount Ivy, out of the total population over 16 years of age (6,108), 67.1% or 4,098 individuals are in the labor force, with 6.9% or 283 of them unemployed. The age group with the highest labor force participation rate is 25 to 29 years, with 100.0% or 543 individuals in the labor force. Within the labor force, the 20 to 24 years age range has the highest percentage of unemployed individuals, with 19.6% or 51 of them being unemployed.
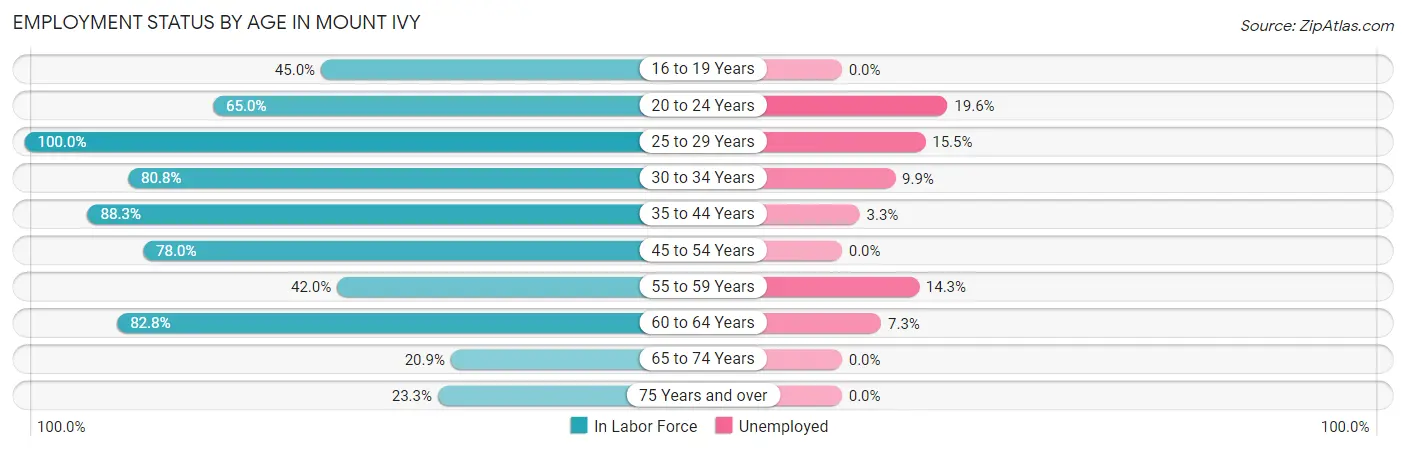
| Age Bracket | In Labor Force | Unemployed |
| 16 to 19 Years | 45 (45.0%) | 0 (0.0%) |
| 20 to 24 Years | 260 (65.0%) | 51 (19.6%) |
| 25 to 29 Years | 543 (100.0%) | 84 (15.5%) |
| 30 to 34 Years | 496 (80.8%) | 49 (9.9%) |
| 35 to 44 Years | 937 (88.3%) | 31 (3.3%) |
| 45 to 54 Years | 868 (78.0%) | 0 (0.0%) |
| 55 to 59 Years | 223 (42.0%) | 32 (14.3%) |
| 60 to 64 Years | 466 (82.8%) | 34 (7.3%) |
| 65 to 74 Years | 117 (20.9%) | 0 (0.0%) |
| 75 Years and over | 145 (23.3%) | 0 (0.0%) |
| Total | 4,098 (67.1%) | 283 (6.9%) |
Employment Status by Educational Attainment in Mount Ivy
According to labor force statistics for Mount Ivy, 79.8% of individuals (3,531) out of the total population between 25 and 64 years of age (4,425) are in the labor force, with 6.5% or 230 of them being unemployed. The group with the highest labor force participation rate are those with the educational attainment of bachelor's degree or higher, with 91.6% or 1,798 individuals in the labor force. Within the labor force, individuals with less than high school education have the highest percentage of unemployment, with 11.2% or 31 of them being unemployed.
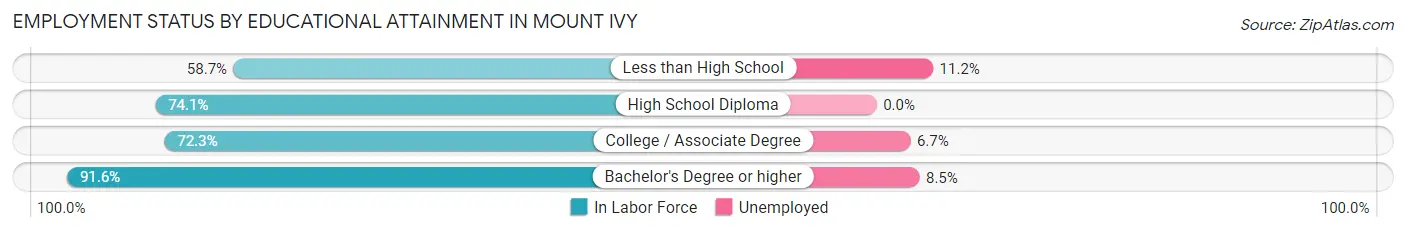
| Educational Attainment | In Labor Force | Unemployed |
| Less than High School | 277 (58.7%) | 53 (11.2%) |
| High School Diploma | 767 (74.1%) | 0 (0.0%) |
| College / Associate Degree | 690 (72.3%) | 64 (6.7%) |
| Bachelor's Degree or higher | 1,798 (91.6%) | 167 (8.5%) |
| Total | 3,531 (79.8%) | 288 (6.5%) |
Employment Occupations by Sex in Mount Ivy
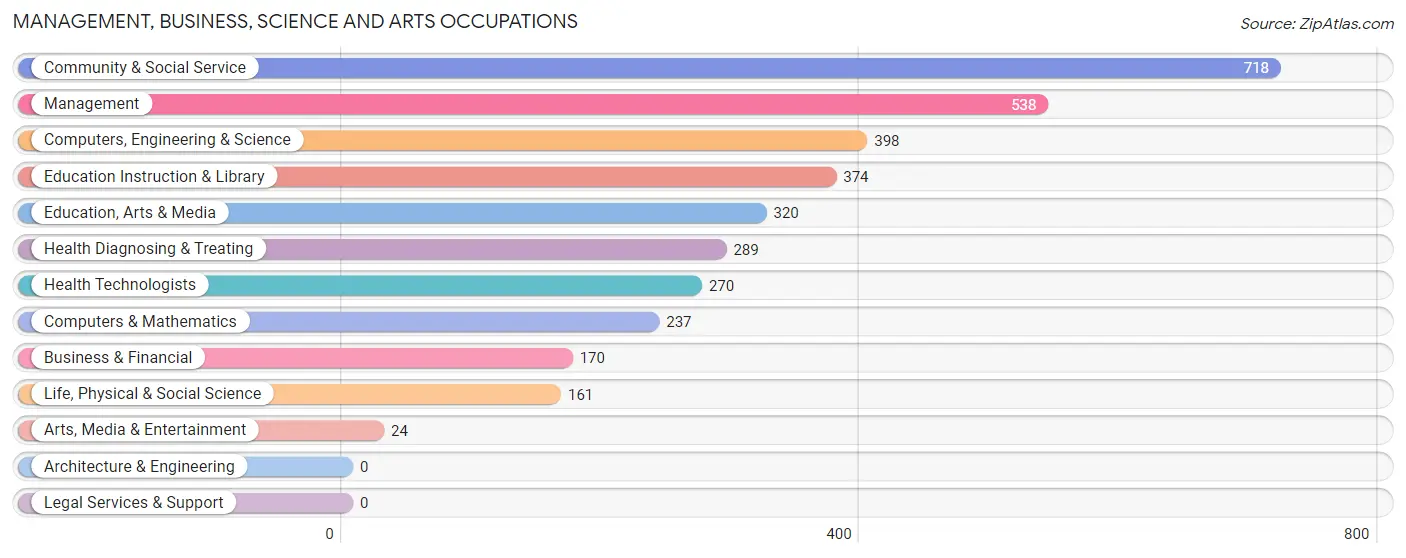
Management, Business, Science and Arts Occupations
The most common Management, Business, Science and Arts occupations in Mount Ivy are Community & Social Service (718 | 18.8%), Management (538 | 14.1%), Computers, Engineering & Science (398 | 10.4%), Education Instruction & Library (374 | 9.8%), and Education, Arts & Media (320 | 8.4%).
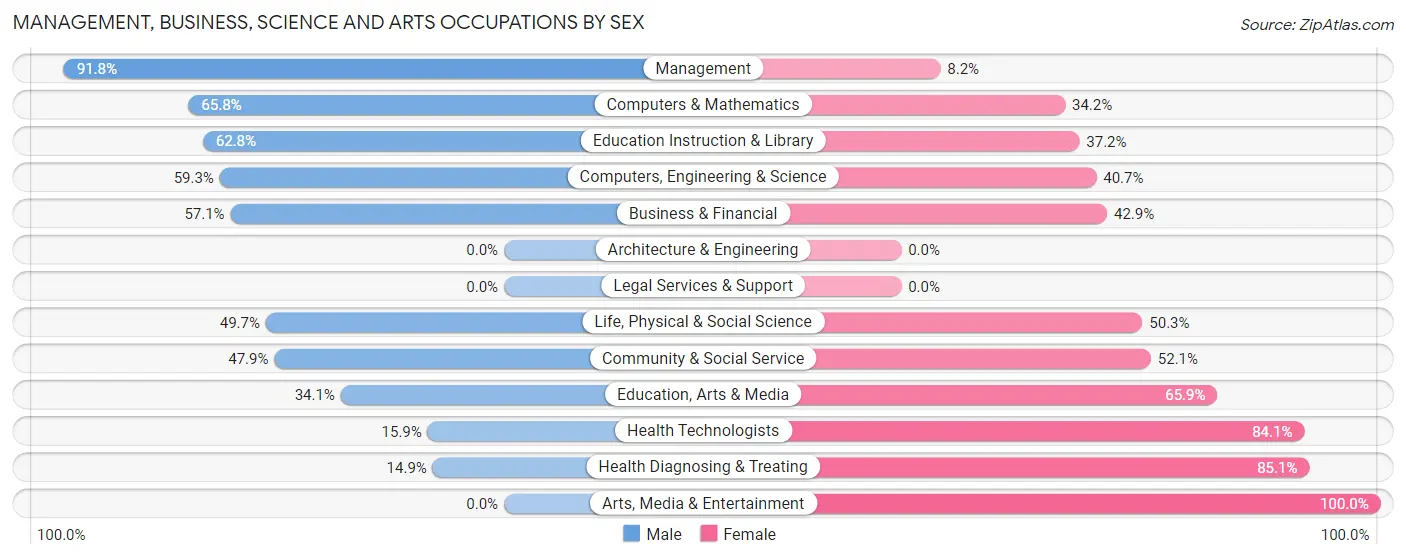
Management, Business, Science and Arts Occupations by Sex
Within the Management, Business, Science and Arts occupations in Mount Ivy, the most male-oriented occupations are Management (91.8%), Computers & Mathematics (65.8%), and Education Instruction & Library (62.8%), while the most female-oriented occupations are Arts, Media & Entertainment (100.0%), Health Diagnosing & Treating (85.1%), and Health Technologists (84.1%).
| Occupation | Male | Female |
| Management | 494 (91.8%) | 44 (8.2%) |
| Business & Financial | 97 (57.1%) | 73 (42.9%) |
| Computers, Engineering & Science | 236 (59.3%) | 162 (40.7%) |
| Computers & Mathematics | 156 (65.8%) | 81 (34.2%) |
| Architecture & Engineering | 0 (0.0%) | 0 (0.0%) |
| Life, Physical & Social Science | 80 (49.7%) | 81 (50.3%) |
| Community & Social Service | 344 (47.9%) | 374 (52.1%) |
| Education, Arts & Media | 109 (34.1%) | 211 (65.9%) |
| Legal Services & Support | 0 (0.0%) | 0 (0.0%) |
| Education Instruction & Library | 235 (62.8%) | 139 (37.2%) |
| Arts, Media & Entertainment | 0 (0.0%) | 24 (100.0%) |
| Health Diagnosing & Treating | 43 (14.9%) | 246 (85.1%) |
| Health Technologists | 43 (15.9%) | 227 (84.1%) |
| Total (Category) | 1,214 (57.5%) | 899 (42.5%) |
| Total (Overall) | 2,254 (59.0%) | 1,565 (41.0%) |
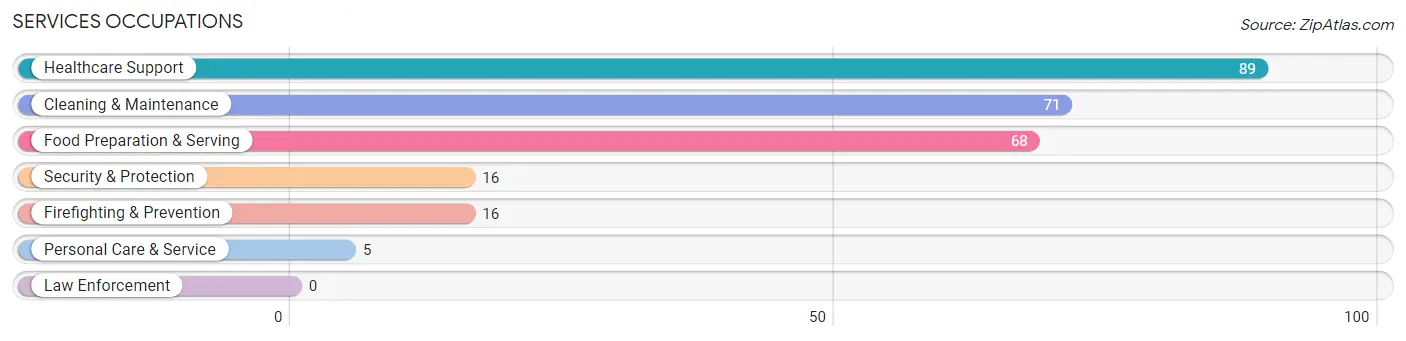
Services Occupations
The most common Services occupations in Mount Ivy are Healthcare Support (89 | 2.3%), Cleaning & Maintenance (71 | 1.9%), Food Preparation & Serving (68 | 1.8%), Security & Protection (16 | 0.4%), and Firefighting & Prevention (16 | 0.4%).
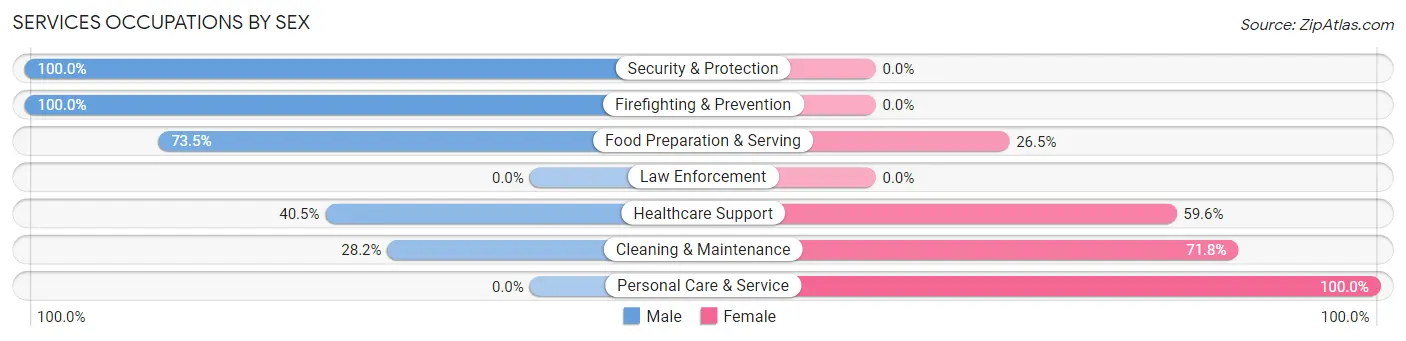
Services Occupations by Sex
Within the Services occupations in Mount Ivy, the most male-oriented occupations are Security & Protection (100.0%), Firefighting & Prevention (100.0%), and Food Preparation & Serving (73.5%), while the most female-oriented occupations are Personal Care & Service (100.0%), Cleaning & Maintenance (71.8%), and Healthcare Support (59.6%).
| Occupation | Male | Female |
| Healthcare Support | 36 (40.5%) | 53 (59.6%) |
| Security & Protection | 16 (100.0%) | 0 (0.0%) |
| Firefighting & Prevention | 16 (100.0%) | 0 (0.0%) |
| Law Enforcement | 0 (0.0%) | 0 (0.0%) |
| Food Preparation & Serving | 50 (73.5%) | 18 (26.5%) |
| Cleaning & Maintenance | 20 (28.2%) | 51 (71.8%) |
| Personal Care & Service | 0 (0.0%) | 5 (100.0%) |
| Total (Category) | 122 (49.0%) | 127 (51.0%) |
| Total (Overall) | 2,254 (59.0%) | 1,565 (41.0%) |
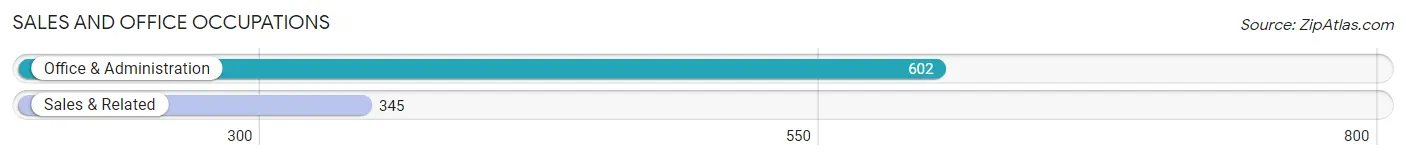
Sales and Office Occupations
The most common Sales and Office occupations in Mount Ivy are Office & Administration (602 | 15.8%), and Sales & Related (345 | 9.0%).
Sales and Office Occupations by Sex
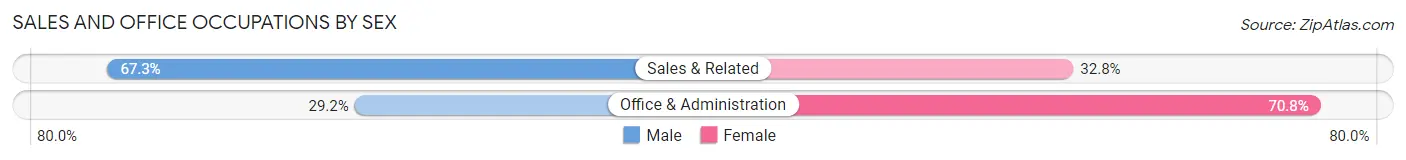
| Occupation | Male | Female |
| Sales & Related | 232 (67.2%) | 113 (32.8%) |
| Office & Administration | 176 (29.2%) | 426 (70.8%) |
| Total (Category) | 408 (43.1%) | 539 (56.9%) |
| Total (Overall) | 2,254 (59.0%) | 1,565 (41.0%) |
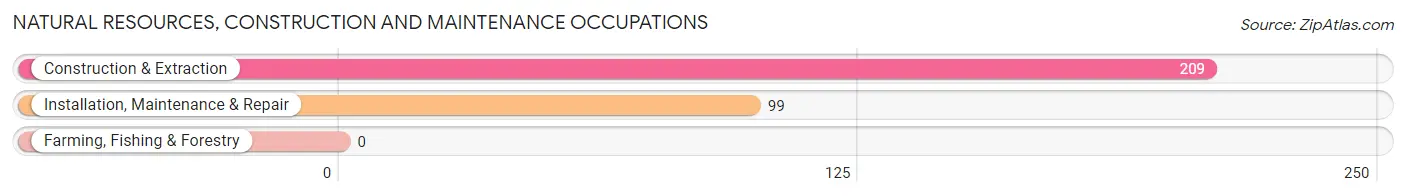
Natural Resources, Construction and Maintenance Occupations
The most common Natural Resources, Construction and Maintenance occupations in Mount Ivy are Construction & Extraction (209 | 5.5%), and Installation, Maintenance & Repair (99 | 2.6%).
Natural Resources, Construction and Maintenance Occupations by Sex
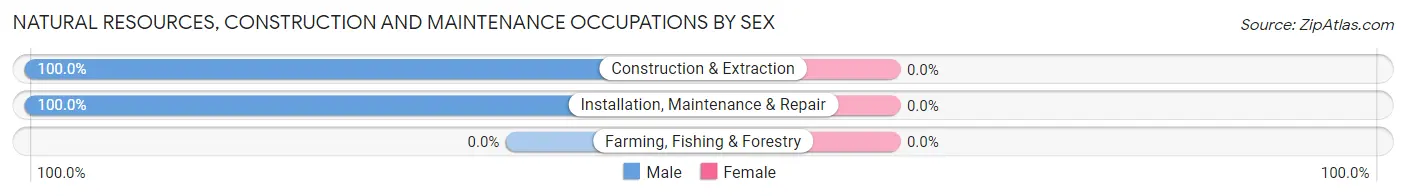
| Occupation | Male | Female |
| Farming, Fishing & Forestry | 0 (0.0%) | 0 (0.0%) |
| Construction & Extraction | 209 (100.0%) | 0 (0.0%) |
| Installation, Maintenance & Repair | 99 (100.0%) | 0 (0.0%) |
| Total (Category) | 308 (100.0%) | 0 (0.0%) |
| Total (Overall) | 2,254 (59.0%) | 1,565 (41.0%) |
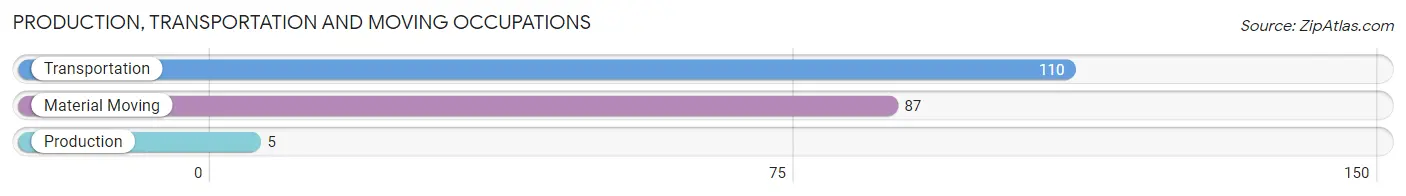
Production, Transportation and Moving Occupations
The most common Production, Transportation and Moving occupations in Mount Ivy are Transportation (110 | 2.9%), Material Moving (87 | 2.3%), and Production (5 | 0.1%).
Production, Transportation and Moving Occupations by Sex
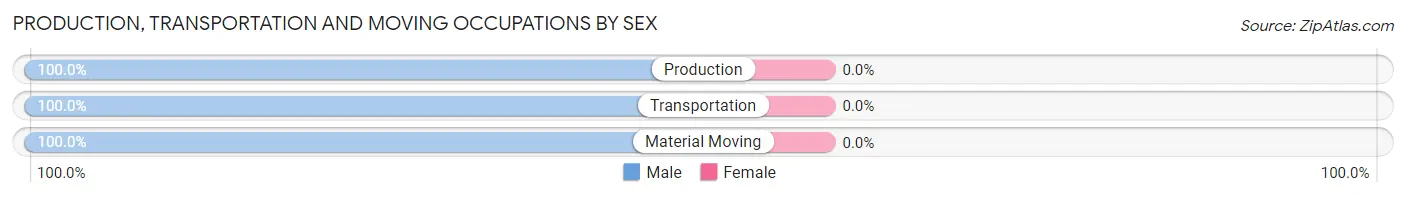
| Occupation | Male | Female |
| Production | 5 (100.0%) | 0 (0.0%) |
| Transportation | 110 (100.0%) | 0 (0.0%) |
| Material Moving | 87 (100.0%) | 0 (0.0%) |
| Total (Category) | 202 (100.0%) | 0 (0.0%) |
| Total (Overall) | 2,254 (59.0%) | 1,565 (41.0%) |
Employment Industries by Sex in Mount Ivy
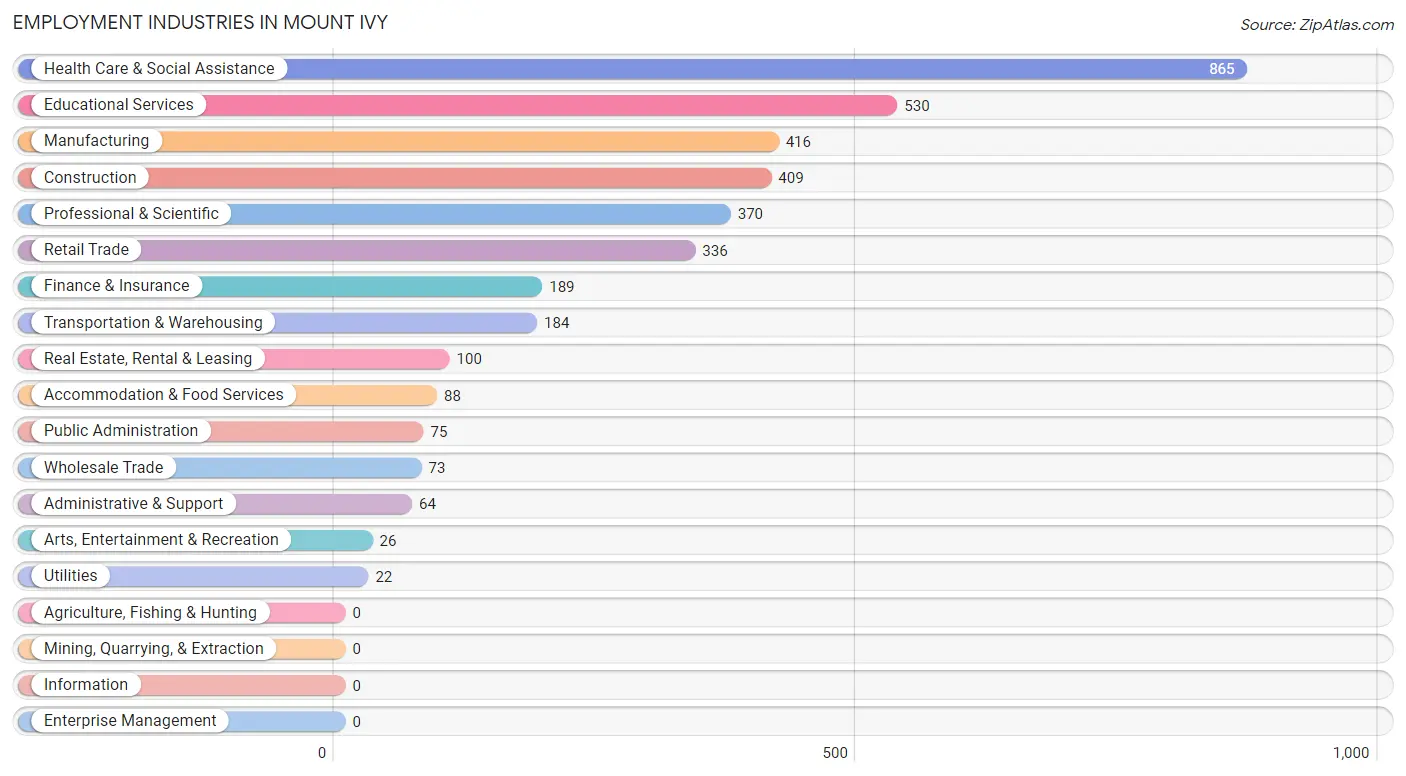
Employment Industries in Mount Ivy
The major employment industries in Mount Ivy include Health Care & Social Assistance (865 | 22.7%), Educational Services (530 | 13.9%), Manufacturing (416 | 10.9%), Construction (409 | 10.7%), and Professional & Scientific (370 | 9.7%).
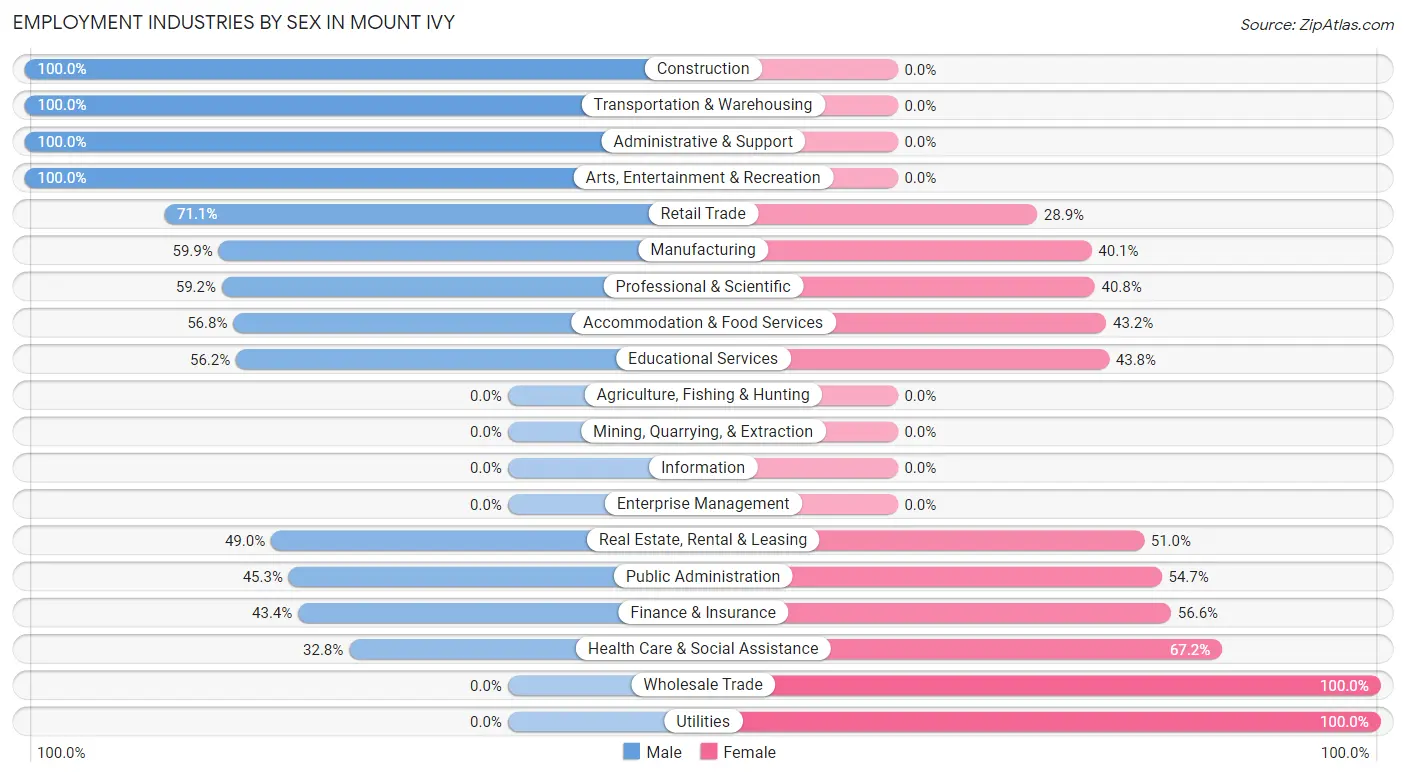
Employment Industries by Sex in Mount Ivy
The Mount Ivy industries that see more men than women are Construction (100.0%), Transportation & Warehousing (100.0%), and Administrative & Support (100.0%), whereas the industries that tend to have a higher number of women are Wholesale Trade (100.0%), Utilities (100.0%), and Health Care & Social Assistance (67.2%).
| Industry | Male | Female |
| Agriculture, Fishing & Hunting | 0 (0.0%) | 0 (0.0%) |
| Mining, Quarrying, & Extraction | 0 (0.0%) | 0 (0.0%) |
| Construction | 409 (100.0%) | 0 (0.0%) |
| Manufacturing | 249 (59.9%) | 167 (40.1%) |
| Wholesale Trade | 0 (0.0%) | 73 (100.0%) |
| Retail Trade | 239 (71.1%) | 97 (28.9%) |
| Transportation & Warehousing | 184 (100.0%) | 0 (0.0%) |
| Utilities | 0 (0.0%) | 22 (100.0%) |
| Information | 0 (0.0%) | 0 (0.0%) |
| Finance & Insurance | 82 (43.4%) | 107 (56.6%) |
| Real Estate, Rental & Leasing | 49 (49.0%) | 51 (51.0%) |
| Professional & Scientific | 219 (59.2%) | 151 (40.8%) |
| Enterprise Management | 0 (0.0%) | 0 (0.0%) |
| Administrative & Support | 64 (100.0%) | 0 (0.0%) |
| Educational Services | 298 (56.2%) | 232 (43.8%) |
| Health Care & Social Assistance | 284 (32.8%) | 581 (67.2%) |
| Arts, Entertainment & Recreation | 26 (100.0%) | 0 (0.0%) |
| Accommodation & Food Services | 50 (56.8%) | 38 (43.2%) |
| Public Administration | 34 (45.3%) | 41 (54.7%) |
| Total | 2,254 (59.0%) | 1,565 (41.0%) |
Education in Mount Ivy
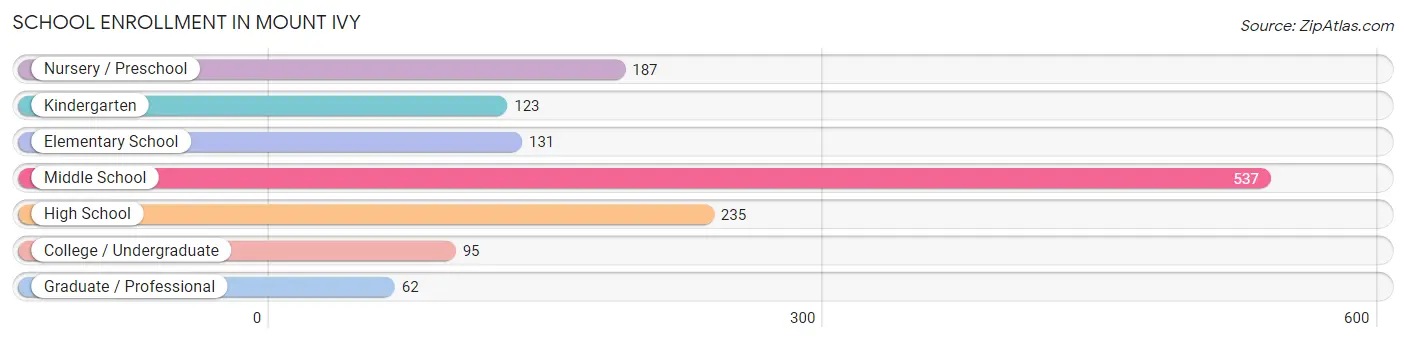
School Enrollment in Mount Ivy
The most common levels of schooling among the 1,370 students in Mount Ivy are middle school (537 | 39.2%), high school (235 | 17.2%), and nursery / preschool (187 | 13.7%).
| School Level | # Students | % Students |
| Nursery / Preschool | 187 | 13.7% |
| Kindergarten | 123 | 9.0% |
| Elementary School | 131 | 9.6% |
| Middle School | 537 | 39.2% |
| High School | 235 | 17.2% |
| College / Undergraduate | 95 | 6.9% |
| Graduate / Professional | 62 | 4.5% |
| Total | 1,370 | 100.0% |
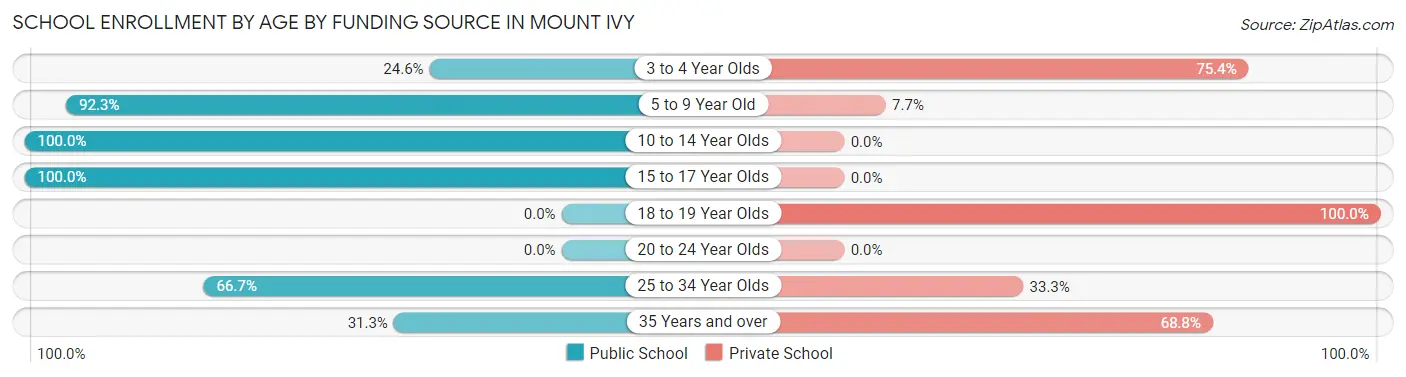
School Enrollment by Age by Funding Source in Mount Ivy
Out of a total of 1,370 students who are enrolled in schools in Mount Ivy, 253 (18.5%) attend a private institution, while the remaining 1,117 (81.5%) are enrolled in public schools. The age group of 18 to 19 year olds has the highest likelihood of being enrolled in private schools, with 20 (100.0% in the age bracket) enrolled. Conversely, the age group of 10 to 14 year olds has the lowest likelihood of being enrolled in a private school, with 588 (100.0% in the age bracket) attending a public institution.
| Age Bracket | Public School | Private School |
| 3 to 4 Year Olds | 46 (24.6%) | 141 (75.4%) |
| 5 to 9 Year Old | 215 (92.3%) | 18 (7.7%) |
| 10 to 14 Year Olds | 588 (100.0%) | 0 (0.0%) |
| 15 to 17 Year Olds | 205 (100.0%) | 0 (0.0%) |
| 18 to 19 Year Olds | 0 (0.0%) | 20 (100.0%) |
| 20 to 24 Year Olds | 0 (0.0%) | 0 (0.0%) |
| 25 to 34 Year Olds | 38 (66.7%) | 19 (33.3%) |
| 35 Years and over | 25 (31.2%) | 55 (68.8%) |
| Total | 1,117 (81.5%) | 253 (18.5%) |
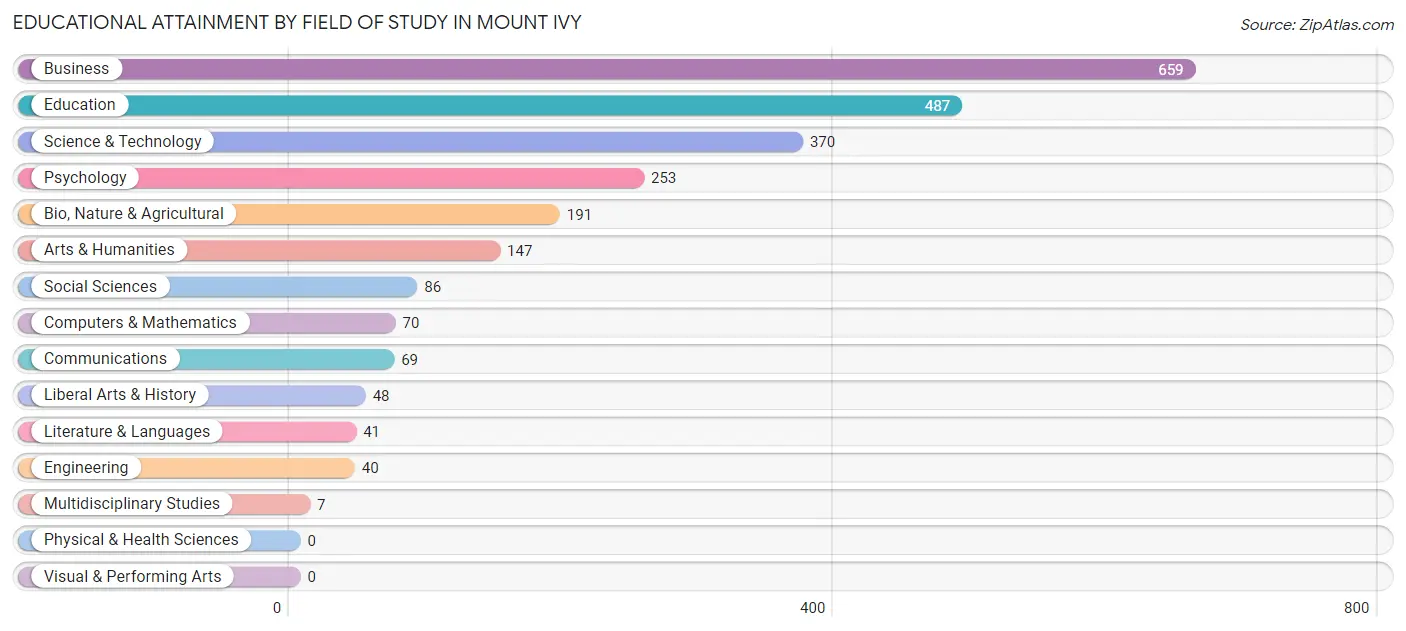
Educational Attainment by Field of Study in Mount Ivy
Business (659 | 26.7%), education (487 | 19.7%), science & technology (370 | 15.0%), psychology (253 | 10.2%), and bio, nature & agricultural (191 | 7.7%) are the most common fields of study among 2,468 individuals in Mount Ivy who have obtained a bachelor's degree or higher.
| Field of Study | # Graduates | % Graduates |
| Computers & Mathematics | 70 | 2.8% |
| Bio, Nature & Agricultural | 191 | 7.7% |
| Physical & Health Sciences | 0 | 0.0% |
| Psychology | 253 | 10.2% |
| Social Sciences | 86 | 3.5% |
| Engineering | 40 | 1.6% |
| Multidisciplinary Studies | 7 | 0.3% |
| Science & Technology | 370 | 15.0% |
| Business | 659 | 26.7% |
| Education | 487 | 19.7% |
| Literature & Languages | 41 | 1.7% |
| Liberal Arts & History | 48 | 1.9% |
| Visual & Performing Arts | 0 | 0.0% |
| Communications | 69 | 2.8% |
| Arts & Humanities | 147 | 6.0% |
| Total | 2,468 | 100.0% |
Transportation & Commute in Mount Ivy
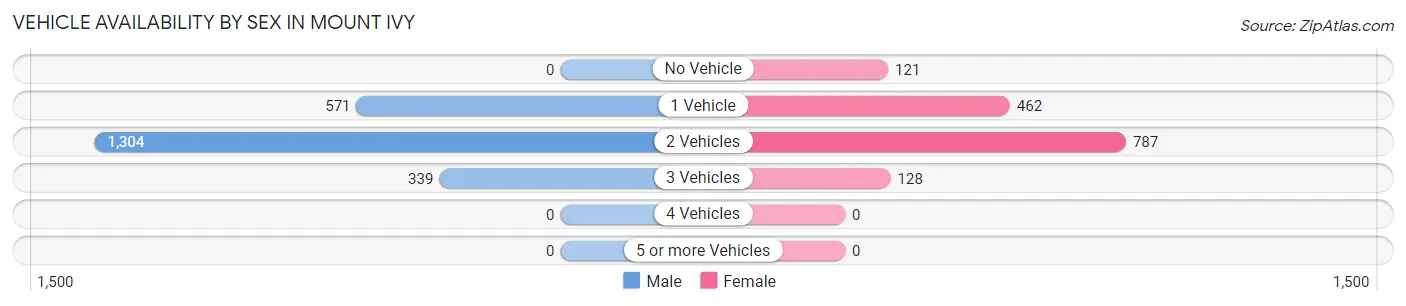
Vehicle Availability by Sex in Mount Ivy
The most prevalent vehicle ownership categories in Mount Ivy are males with 2 vehicles (1,304, accounting for 58.9%) and females with 2 vehicles (787, making up 87.1%).
| Vehicles Available | Male | Female |
| No Vehicle | 0 (0.0%) | 121 (8.1%) |
| 1 Vehicle | 571 (25.8%) | 462 (30.8%) |
| 2 Vehicles | 1,304 (58.9%) | 787 (52.5%) |
| 3 Vehicles | 339 (15.3%) | 128 (8.5%) |
| 4 Vehicles | 0 (0.0%) | 0 (0.0%) |
| 5 or more Vehicles | 0 (0.0%) | 0 (0.0%) |
| Total | 2,214 (100.0%) | 1,498 (100.0%) |
Commute Time in Mount Ivy
The most frequently occuring commute durations in Mount Ivy are 30 to 34 minutes (640 commuters, 19.3%), 20 to 24 minutes (588 commuters, 17.7%), and 25 to 29 minutes (412 commuters, 12.4%).
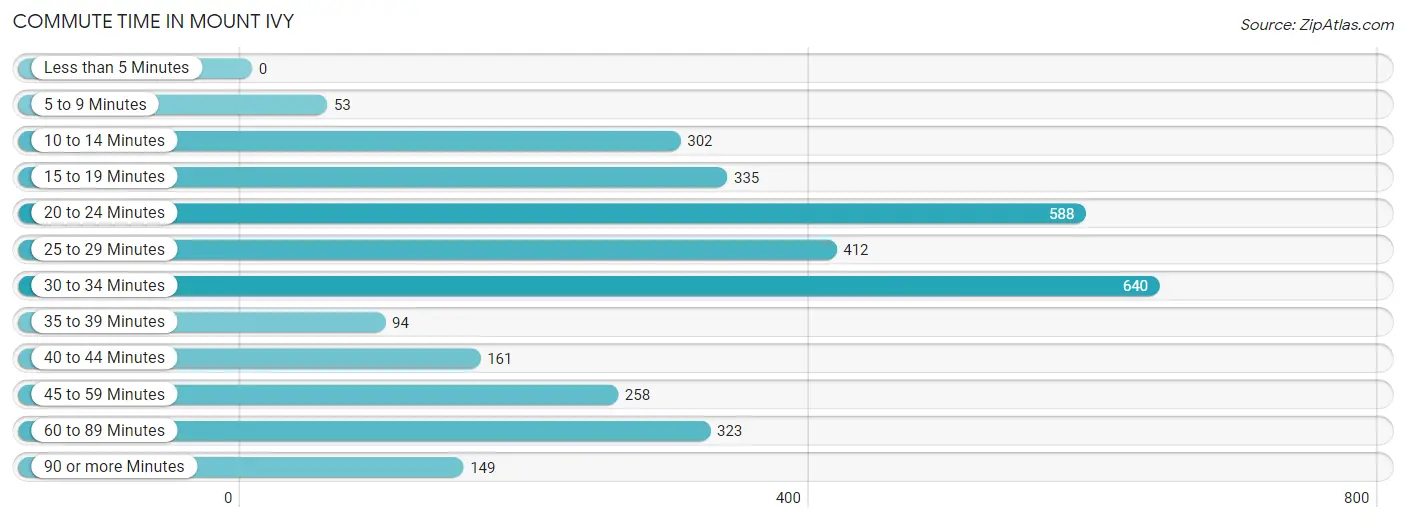
| Commute Time | # Commuters | % Commuters |
| Less than 5 Minutes | 0 | 0.0% |
| 5 to 9 Minutes | 53 | 1.6% |
| 10 to 14 Minutes | 302 | 9.1% |
| 15 to 19 Minutes | 335 | 10.1% |
| 20 to 24 Minutes | 588 | 17.7% |
| 25 to 29 Minutes | 412 | 12.4% |
| 30 to 34 Minutes | 640 | 19.3% |
| 35 to 39 Minutes | 94 | 2.8% |
| 40 to 44 Minutes | 161 | 4.9% |
| 45 to 59 Minutes | 258 | 7.8% |
| 60 to 89 Minutes | 323 | 9.7% |
| 90 or more Minutes | 149 | 4.5% |
Commute Time by Sex in Mount Ivy
The most common commute times in Mount Ivy are 20 to 24 minutes (438 commuters, 20.4%) for males and 15 to 19 minutes (267 commuters, 22.8%) for females.
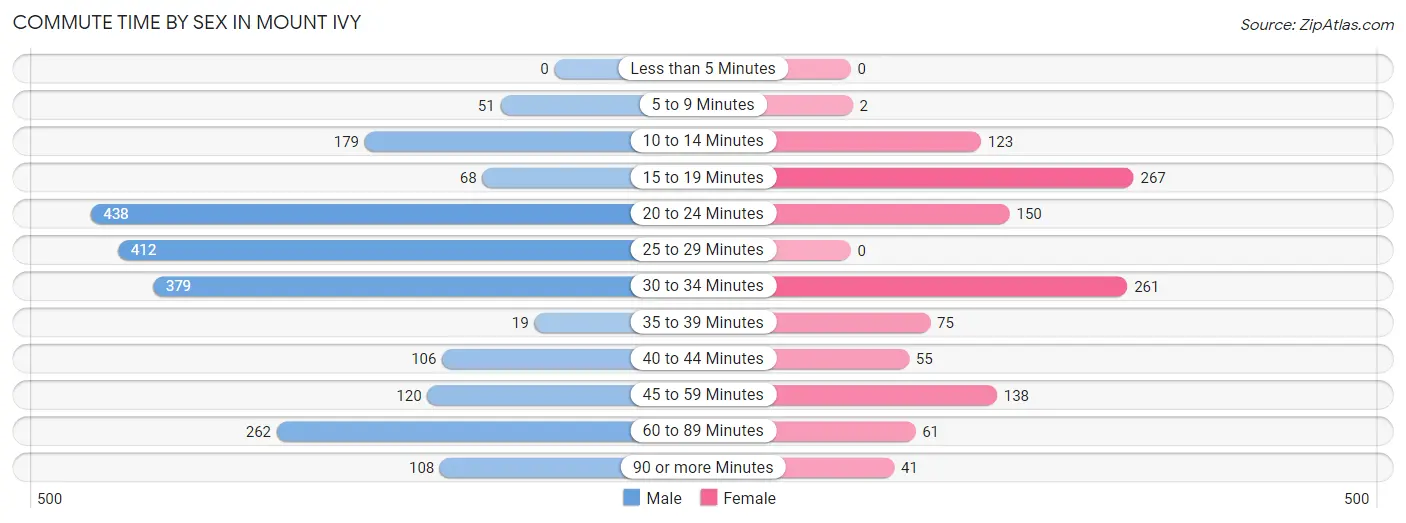
| Commute Time | Male | Female |
| Less than 5 Minutes | 0 (0.0%) | 0 (0.0%) |
| 5 to 9 Minutes | 51 (2.4%) | 2 (0.2%) |
| 10 to 14 Minutes | 179 (8.4%) | 123 (10.5%) |
| 15 to 19 Minutes | 68 (3.2%) | 267 (22.8%) |
| 20 to 24 Minutes | 438 (20.4%) | 150 (12.8%) |
| 25 to 29 Minutes | 412 (19.2%) | 0 (0.0%) |
| 30 to 34 Minutes | 379 (17.7%) | 261 (22.3%) |
| 35 to 39 Minutes | 19 (0.9%) | 75 (6.4%) |
| 40 to 44 Minutes | 106 (5.0%) | 55 (4.7%) |
| 45 to 59 Minutes | 120 (5.6%) | 138 (11.8%) |
| 60 to 89 Minutes | 262 (12.2%) | 61 (5.2%) |
| 90 or more Minutes | 108 (5.0%) | 41 (3.5%) |
Time of Departure to Work by Sex in Mount Ivy
The most frequent times of departure to work in Mount Ivy are 6:30 AM to 6:59 AM (368, 17.2%) for males and 7:00 AM to 7:29 AM (238, 20.3%) for females.
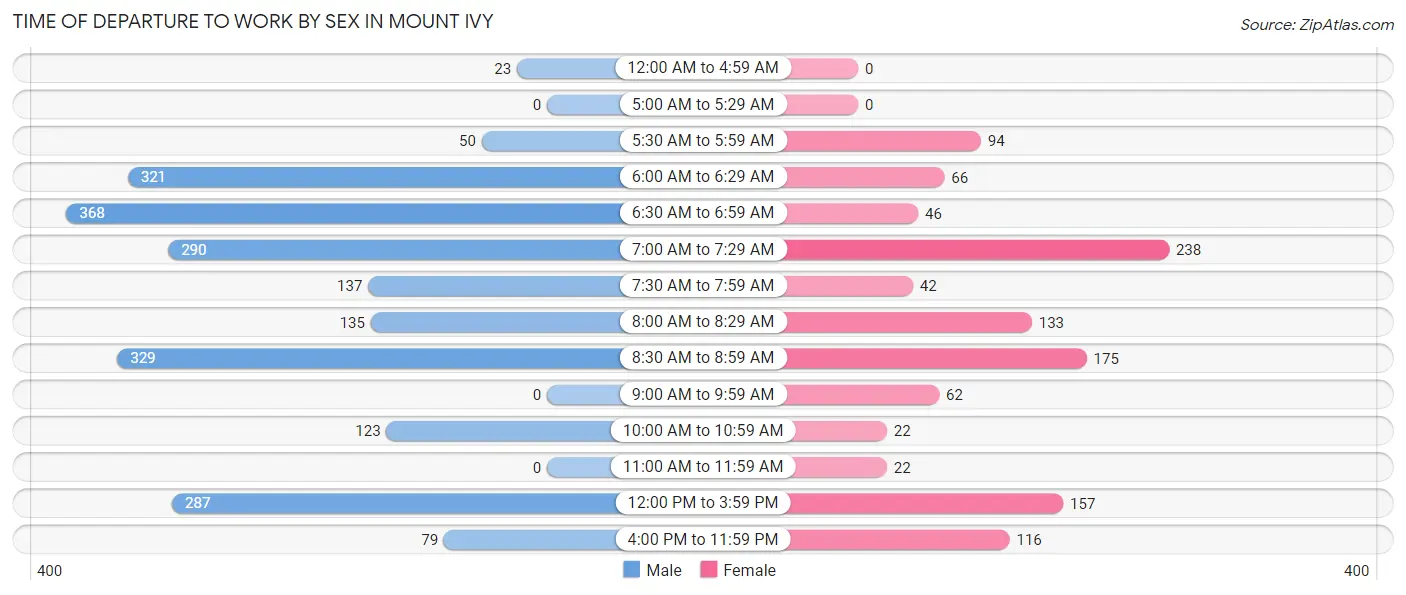
| Time of Departure | Male | Female |
| 12:00 AM to 4:59 AM | 23 (1.1%) | 0 (0.0%) |
| 5:00 AM to 5:29 AM | 0 (0.0%) | 0 (0.0%) |
| 5:30 AM to 5:59 AM | 50 (2.3%) | 94 (8.0%) |
| 6:00 AM to 6:29 AM | 321 (15.0%) | 66 (5.6%) |
| 6:30 AM to 6:59 AM | 368 (17.2%) | 46 (3.9%) |
| 7:00 AM to 7:29 AM | 290 (13.5%) | 238 (20.3%) |
| 7:30 AM to 7:59 AM | 137 (6.4%) | 42 (3.6%) |
| 8:00 AM to 8:29 AM | 135 (6.3%) | 133 (11.3%) |
| 8:30 AM to 8:59 AM | 329 (15.4%) | 175 (14.9%) |
| 9:00 AM to 9:59 AM | 0 (0.0%) | 62 (5.3%) |
| 10:00 AM to 10:59 AM | 123 (5.7%) | 22 (1.9%) |
| 11:00 AM to 11:59 AM | 0 (0.0%) | 22 (1.9%) |
| 12:00 PM to 3:59 PM | 287 (13.4%) | 157 (13.4%) |
| 4:00 PM to 11:59 PM | 79 (3.7%) | 116 (9.9%) |
| Total | 2,142 (100.0%) | 1,173 (100.0%) |
Housing Occupancy in Mount Ivy
Occupancy by Ownership in Mount Ivy
Of the total 3,140 dwellings in Mount Ivy, owner-occupied units account for 2,008 (63.9%), while renter-occupied units make up 1,132 (36.0%).
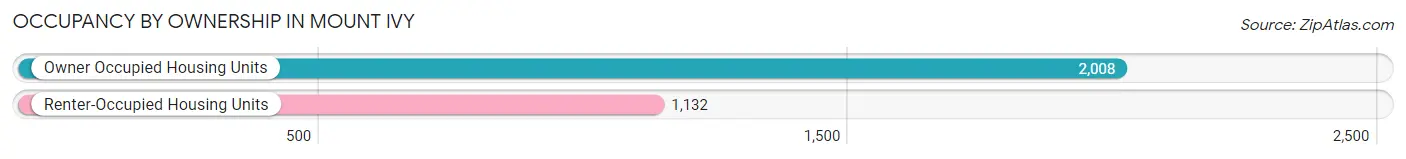
| Occupancy | # Housing Units | % Housing Units |
| Owner Occupied Housing Units | 2,008 | 63.9% |
| Renter-Occupied Housing Units | 1,132 | 36.0% |
| Total Occupied Housing Units | 3,140 | 100.0% |
Occupancy by Household Size in Mount Ivy
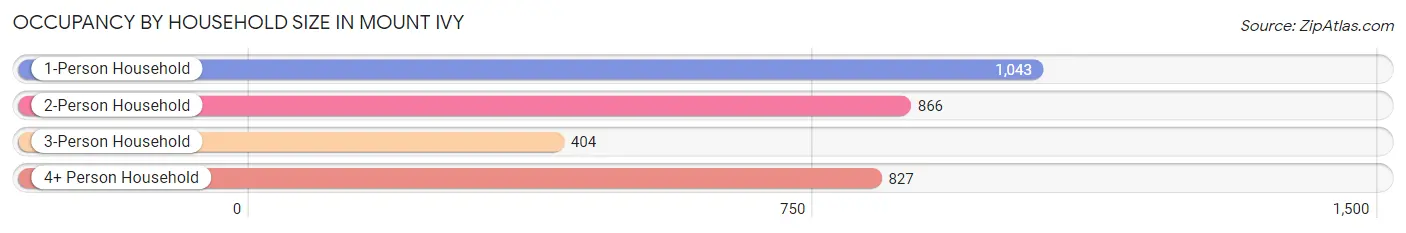
| Household Size | # Housing Units | % Housing Units |
| 1-Person Household | 1,043 | 33.2% |
| 2-Person Household | 866 | 27.6% |
| 3-Person Household | 404 | 12.9% |
| 4+ Person Household | 827 | 26.3% |
| Total Housing Units | 3,140 | 100.0% |
Occupancy by Ownership by Household Size in Mount Ivy
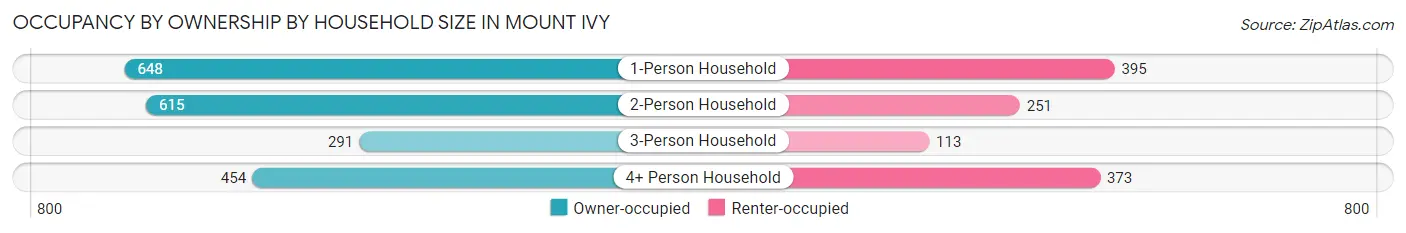
| Household Size | Owner-occupied | Renter-occupied |
| 1-Person Household | 648 (62.1%) | 395 (37.9%) |
| 2-Person Household | 615 (71.0%) | 251 (29.0%) |
| 3-Person Household | 291 (72.0%) | 113 (28.0%) |
| 4+ Person Household | 454 (54.9%) | 373 (45.1%) |
| Total Housing Units | 2,008 (63.9%) | 1,132 (36.0%) |
Occupancy by Educational Attainment in Mount Ivy
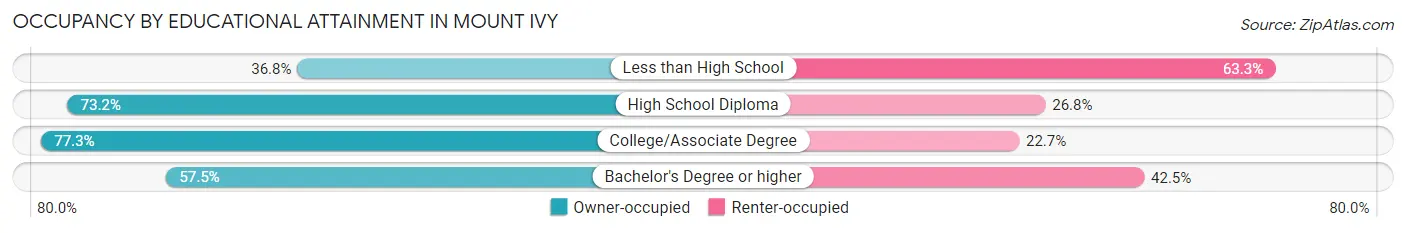
| Household Size | Owner-occupied | Renter-occupied |
| Less than High School | 86 (36.7%) | 148 (63.2%) |
| High School Diploma | 698 (73.2%) | 256 (26.8%) |
| College/Associate Degree | 396 (77.3%) | 116 (22.7%) |
| Bachelor's Degree or higher | 828 (57.5%) | 612 (42.5%) |
Occupancy by Age of Householder in Mount Ivy
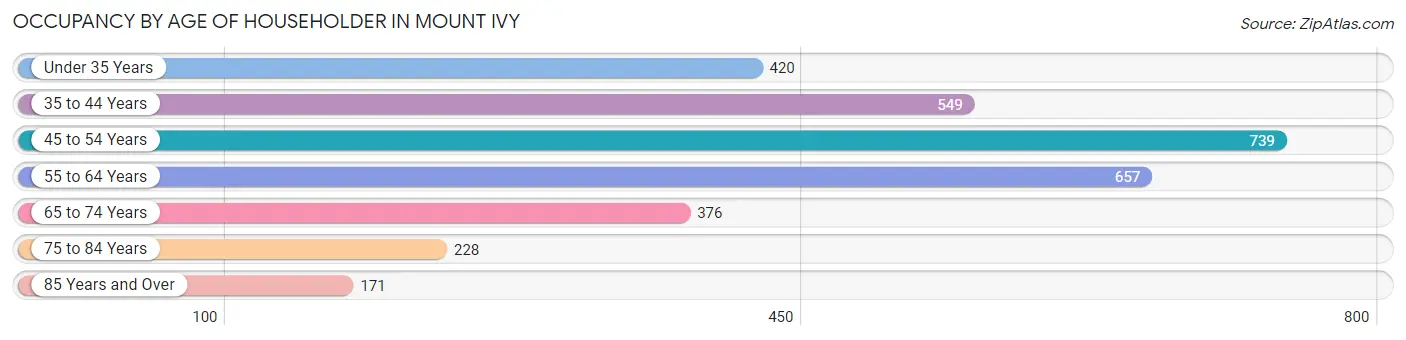
| Age Bracket | # Households | % Households |
| Under 35 Years | 420 | 13.4% |
| 35 to 44 Years | 549 | 17.5% |
| 45 to 54 Years | 739 | 23.5% |
| 55 to 64 Years | 657 | 20.9% |
| 65 to 74 Years | 376 | 12.0% |
| 75 to 84 Years | 228 | 7.3% |
| 85 Years and Over | 171 | 5.4% |
| Total | 3,140 | 100.0% |
Housing Finances in Mount Ivy
Median Income by Occupancy in Mount Ivy
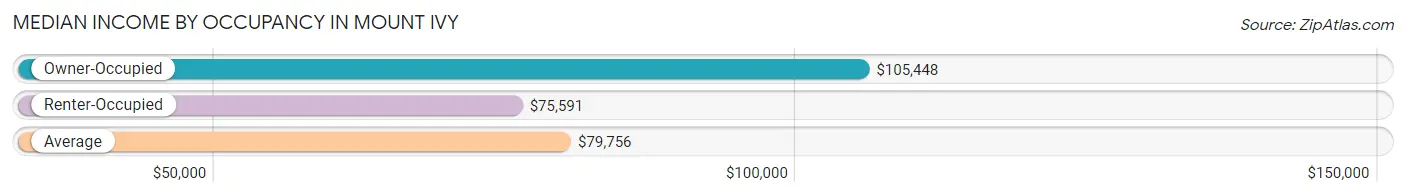
| Occupancy Type | # Households | Median Income |
| Owner-Occupied | 2,008 (63.9%) | $105,448 |
| Renter-Occupied | 1,132 (36.0%) | $75,591 |
| Average | 3,140 (100.0%) | $79,756 |
Occupancy by Householder Income Bracket in Mount Ivy
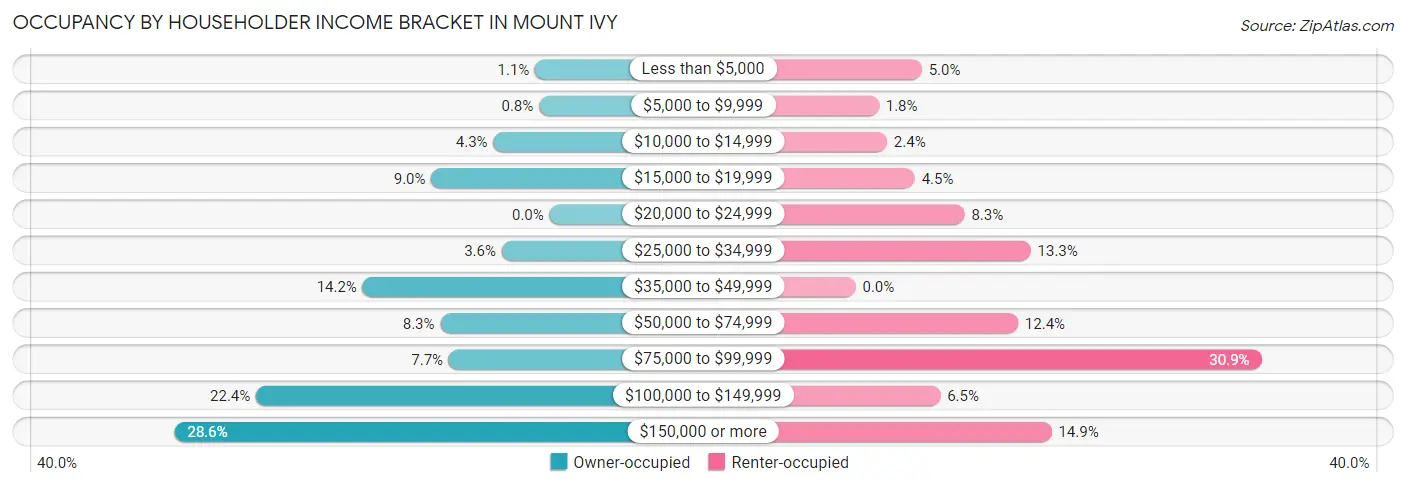
| Income Bracket | Owner-occupied | Renter-occupied |
| Less than $5,000 | 22 (1.1%) | 57 (5.0%) |
| $5,000 to $9,999 | 16 (0.8%) | 20 (1.8%) |
| $10,000 to $14,999 | 86 (4.3%) | 27 (2.4%) |
| $15,000 to $19,999 | 181 (9.0%) | 51 (4.5%) |
| $20,000 to $24,999 | 0 (0.0%) | 94 (8.3%) |
| $25,000 to $34,999 | 73 (3.6%) | 151 (13.3%) |
| $35,000 to $49,999 | 286 (14.2%) | 0 (0.0%) |
| $50,000 to $74,999 | 167 (8.3%) | 140 (12.4%) |
| $75,000 to $99,999 | 154 (7.7%) | 350 (30.9%) |
| $100,000 to $149,999 | 449 (22.4%) | 73 (6.5%) |
| $150,000 or more | 574 (28.6%) | 169 (14.9%) |
| Total | 2,008 (100.0%) | 1,132 (100.0%) |
Monthly Housing Cost Tiers in Mount Ivy
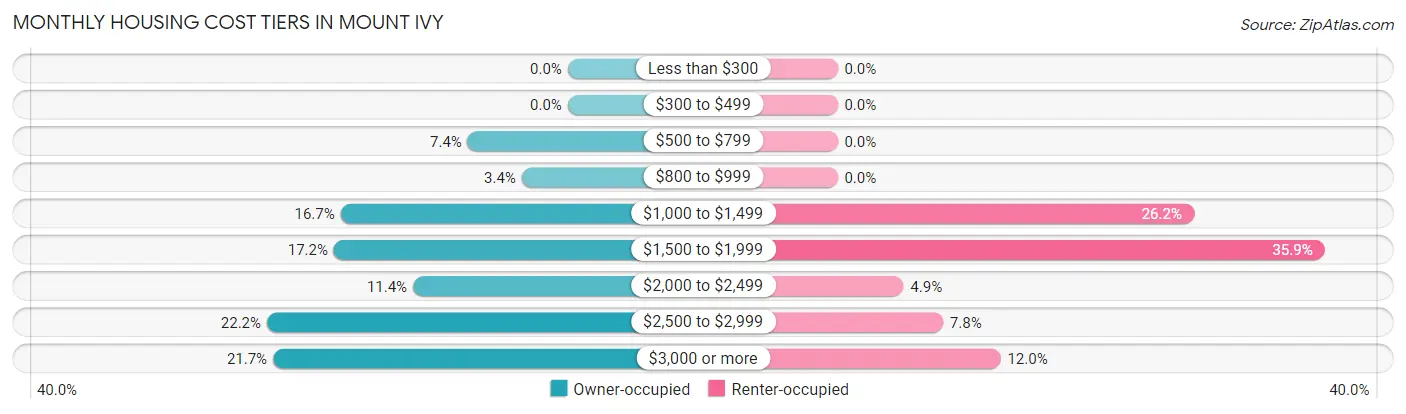
| Monthly Cost | Owner-occupied | Renter-occupied |
| Less than $300 | 0 (0.0%) | 0 (0.0%) |
| $300 to $499 | 0 (0.0%) | 0 (0.0%) |
| $500 to $799 | 148 (7.4%) | 0 (0.0%) |
| $800 to $999 | 68 (3.4%) | 0 (0.0%) |
| $1,000 to $1,499 | 336 (16.7%) | 297 (26.2%) |
| $1,500 to $1,999 | 346 (17.2%) | 406 (35.9%) |
| $2,000 to $2,499 | 229 (11.4%) | 55 (4.9%) |
| $2,500 to $2,999 | 445 (22.2%) | 88 (7.8%) |
| $3,000 or more | 436 (21.7%) | 136 (12.0%) |
| Total | 2,008 (100.0%) | 1,132 (100.0%) |
Physical Housing Characteristics in Mount Ivy
Housing Structures in Mount Ivy
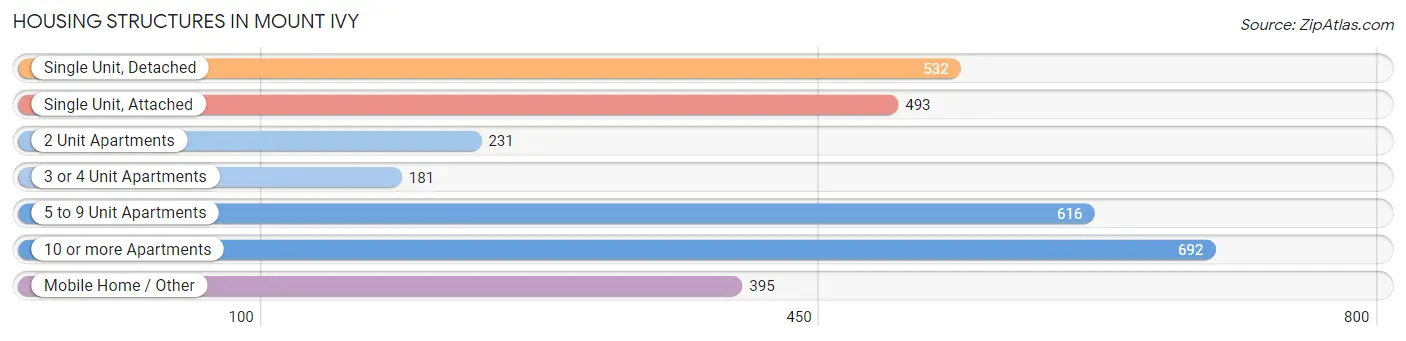
| Structure Type | # Housing Units | % Housing Units |
| Single Unit, Detached | 532 | 16.9% |
| Single Unit, Attached | 493 | 15.7% |
| 2 Unit Apartments | 231 | 7.4% |
| 3 or 4 Unit Apartments | 181 | 5.8% |
| 5 to 9 Unit Apartments | 616 | 19.6% |
| 10 or more Apartments | 692 | 22.0% |
| Mobile Home / Other | 395 | 12.6% |
| Total | 3,140 | 100.0% |
Housing Structures by Occupancy in Mount Ivy
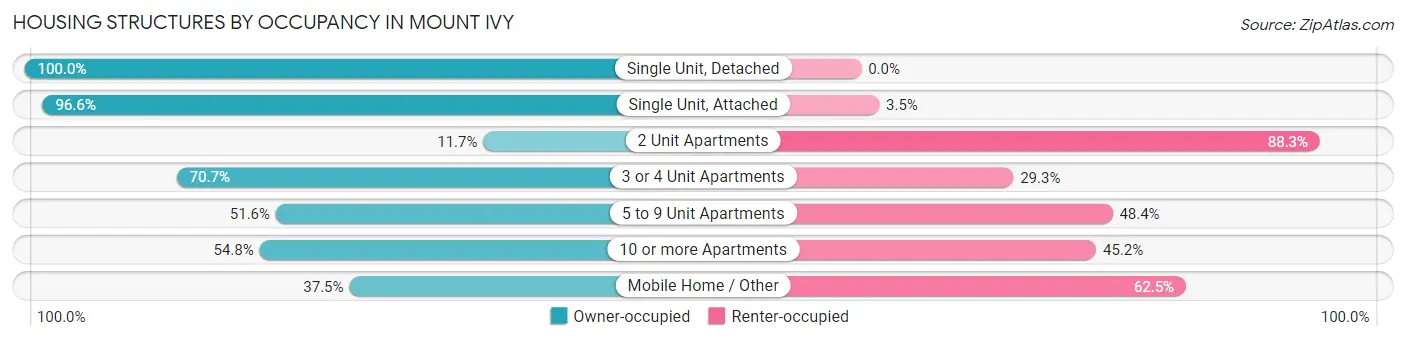
| Structure Type | Owner-occupied | Renter-occupied |
| Single Unit, Detached | 532 (100.0%) | 0 (0.0%) |
| Single Unit, Attached | 476 (96.6%) | 17 (3.5%) |
| 2 Unit Apartments | 27 (11.7%) | 204 (88.3%) |
| 3 or 4 Unit Apartments | 128 (70.7%) | 53 (29.3%) |
| 5 to 9 Unit Apartments | 318 (51.6%) | 298 (48.4%) |
| 10 or more Apartments | 379 (54.8%) | 313 (45.2%) |
| Mobile Home / Other | 148 (37.5%) | 247 (62.5%) |
| Total | 2,008 (63.9%) | 1,132 (36.0%) |
Housing Structures by Number of Rooms in Mount Ivy
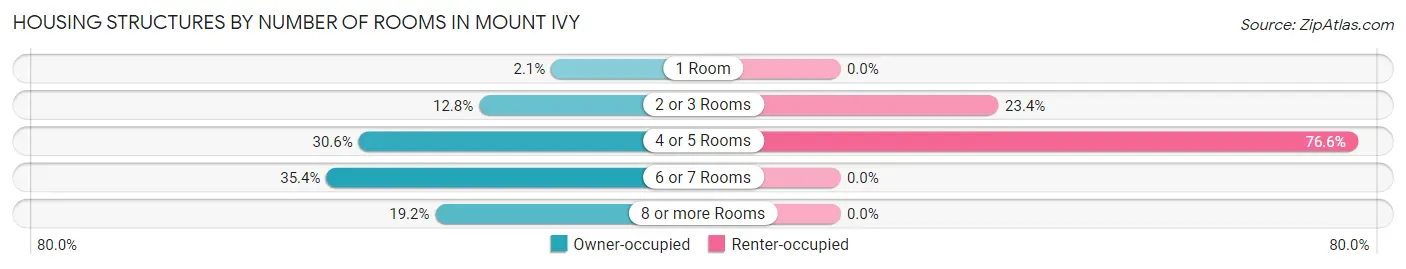
| Number of Rooms | Owner-occupied | Renter-occupied |
| 1 Room | 42 (2.1%) | 0 (0.0%) |
| 2 or 3 Rooms | 256 (12.8%) | 265 (23.4%) |
| 4 or 5 Rooms | 614 (30.6%) | 867 (76.6%) |
| 6 or 7 Rooms | 710 (35.4%) | 0 (0.0%) |
| 8 or more Rooms | 386 (19.2%) | 0 (0.0%) |
| Total | 2,008 (100.0%) | 1,132 (100.0%) |
Housing Structure by Heating Type in Mount Ivy
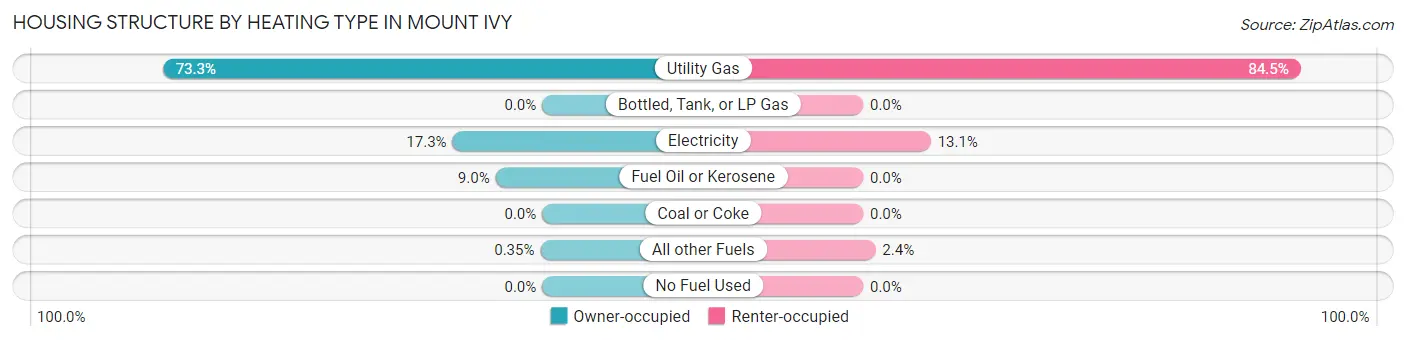
| Heating Type | Owner-occupied | Renter-occupied |
| Utility Gas | 1,472 (73.3%) | 957 (84.5%) |
| Bottled, Tank, or LP Gas | 0 (0.0%) | 0 (0.0%) |
| Electricity | 348 (17.3%) | 148 (13.1%) |
| Fuel Oil or Kerosene | 181 (9.0%) | 0 (0.0%) |
| Coal or Coke | 0 (0.0%) | 0 (0.0%) |
| All other Fuels | 7 (0.4%) | 27 (2.4%) |
| No Fuel Used | 0 (0.0%) | 0 (0.0%) |
| Total | 2,008 (100.0%) | 1,132 (100.0%) |
Household Vehicle Usage in Mount Ivy
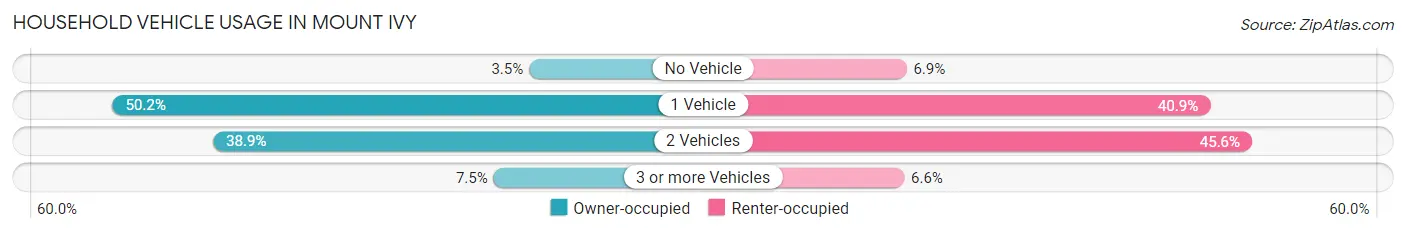
| Vehicles per Household | Owner-occupied | Renter-occupied |
| No Vehicle | 70 (3.5%) | 78 (6.9%) |
| 1 Vehicle | 1,007 (50.1%) | 463 (40.9%) |
| 2 Vehicles | 781 (38.9%) | 516 (45.6%) |
| 3 or more Vehicles | 150 (7.5%) | 75 (6.6%) |
| Total | 2,008 (100.0%) | 1,132 (100.0%) |
Real Estate & Mortgages in Mount Ivy
Real Estate and Mortgage Overview in Mount Ivy
| Characteristic | Without Mortgage | With Mortgage |
| Housing Units | 769 | 1,239 |
| Median Property Value | $230,800 | $287,300 |
| Median Household Income | $47,904 | $496 |
| Monthly Housing Costs | $1,285 | $426 |
| Real Estate Taxes | $8,253 | $49 |
Property Value by Mortgage Status in Mount Ivy
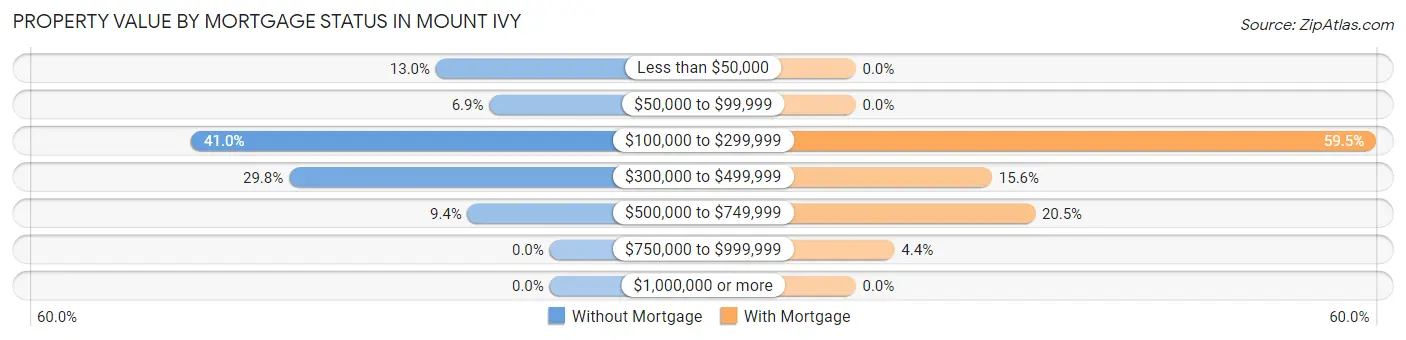
| Property Value | Without Mortgage | With Mortgage |
| Less than $50,000 | 100 (13.0%) | 0 (0.0%) |
| $50,000 to $99,999 | 53 (6.9%) | 0 (0.0%) |
| $100,000 to $299,999 | 315 (41.0%) | 737 (59.5%) |
| $300,000 to $499,999 | 229 (29.8%) | 193 (15.6%) |
| $500,000 to $749,999 | 72 (9.4%) | 254 (20.5%) |
| $750,000 to $999,999 | 0 (0.0%) | 55 (4.4%) |
| $1,000,000 or more | 0 (0.0%) | 0 (0.0%) |
| Total | 769 (100.0%) | 1,239 (100.0%) |
Household Income by Mortgage Status in Mount Ivy
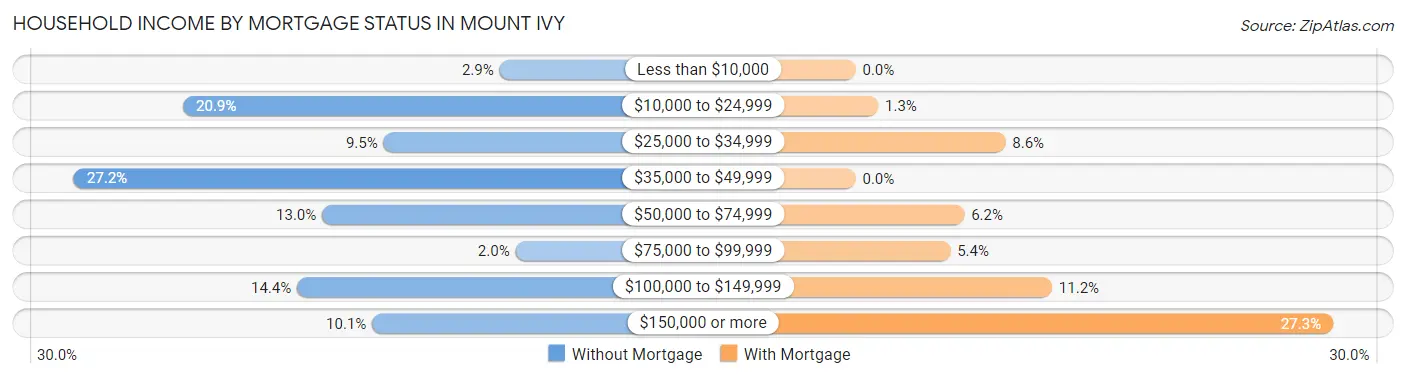
| Household Income | Without Mortgage | With Mortgage |
| Less than $10,000 | 22 (2.9%) | 0 (0.0%) |
| $10,000 to $24,999 | 161 (20.9%) | 16 (1.3%) |
| $25,000 to $34,999 | 73 (9.5%) | 106 (8.6%) |
| $35,000 to $49,999 | 209 (27.2%) | 0 (0.0%) |
| $50,000 to $74,999 | 100 (13.0%) | 77 (6.2%) |
| $75,000 to $99,999 | 15 (1.9%) | 67 (5.4%) |
| $100,000 to $149,999 | 111 (14.4%) | 139 (11.2%) |
| $150,000 or more | 78 (10.1%) | 338 (27.3%) |
| Total | 769 (100.0%) | 1,239 (100.0%) |
Property Value to Household Income Ratio in Mount Ivy
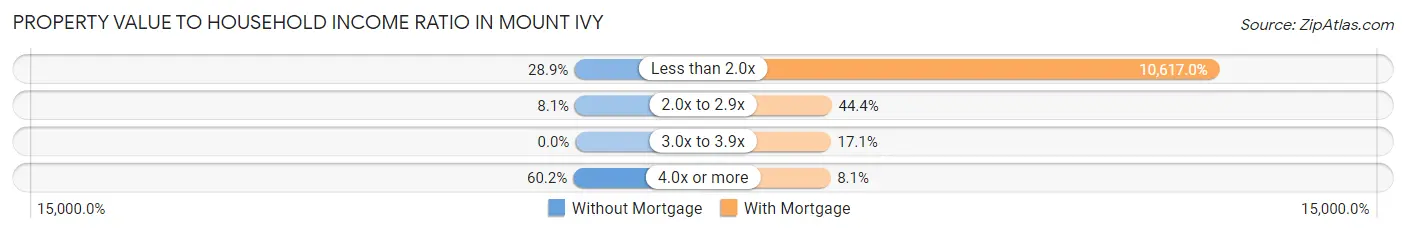
| Value-to-Income Ratio | Without Mortgage | With Mortgage |
| Less than 2.0x | 222 (28.9%) | 131,545 (10,617.0%) |
| 2.0x to 2.9x | 62 (8.1%) | 550 (44.4%) |
| 3.0x to 3.9x | 0 (0.0%) | 212 (17.1%) |
| 4.0x or more | 463 (60.2%) | 100 (8.1%) |
| Total | 769 (100.0%) | 1,239 (100.0%) |
Real Estate Taxes by Mortgage Status in Mount Ivy
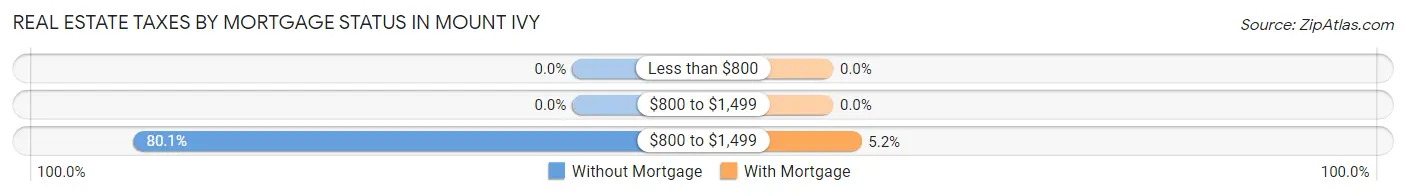
| Property Taxes | Without Mortgage | With Mortgage |
| Less than $800 | 0 (0.0%) | 0 (0.0%) |
| $800 to $1,499 | 0 (0.0%) | 0 (0.0%) |
| $800 to $1,499 | 616 (80.1%) | 64 (5.2%) |
| Total | 769 (100.0%) | 1,239 (100.0%) |
Health & Disability in Mount Ivy
Health Insurance Coverage by Age in Mount Ivy
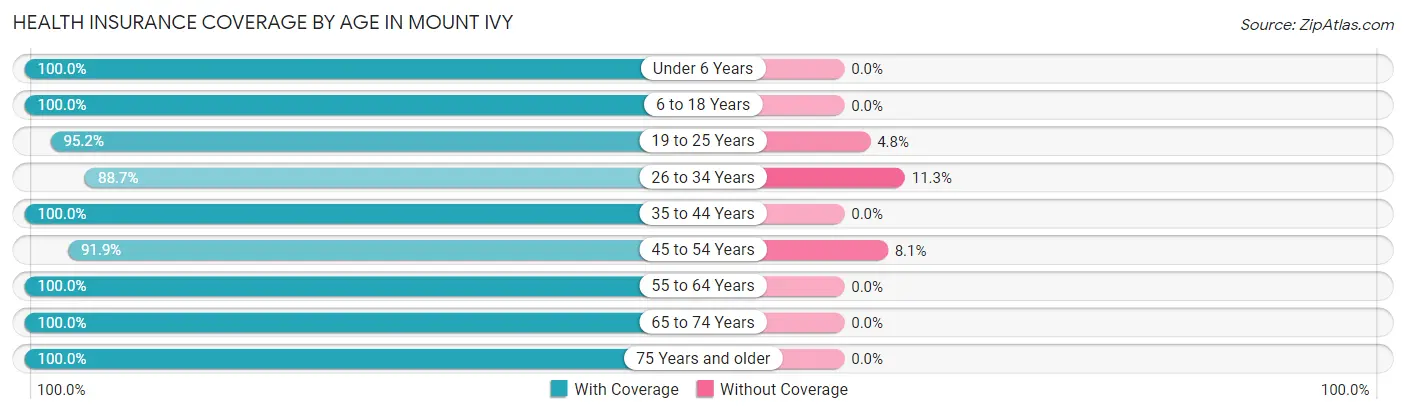
| Age Bracket | With Coverage | Without Coverage |
| Under 6 Years | 781 (100.0%) | 0 (0.0%) |
| 6 to 18 Years | 941 (100.0%) | 0 (0.0%) |
| 19 to 25 Years | 453 (95.2%) | 23 (4.8%) |
| 26 to 34 Years | 959 (88.7%) | 122 (11.3%) |
| 35 to 44 Years | 1,061 (100.0%) | 0 (0.0%) |
| 45 to 54 Years | 1,023 (91.9%) | 90 (8.1%) |
| 55 to 64 Years | 1,094 (100.0%) | 0 (0.0%) |
| 65 to 74 Years | 560 (100.0%) | 0 (0.0%) |
| 75 Years and older | 623 (100.0%) | 0 (0.0%) |
| Total | 7,495 (97.0%) | 235 (3.0%) |
Health Insurance Coverage by Citizenship Status in Mount Ivy
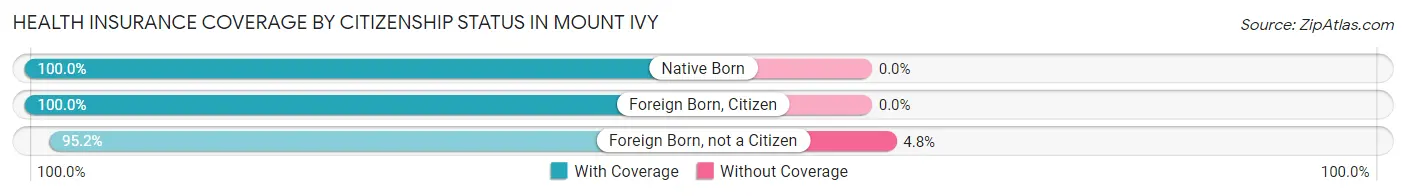
| Citizenship Status | With Coverage | Without Coverage |
| Native Born | 781 (100.0%) | 0 (0.0%) |
| Foreign Born, Citizen | 941 (100.0%) | 0 (0.0%) |
| Foreign Born, not a Citizen | 453 (95.2%) | 23 (4.8%) |
Health Insurance Coverage by Household Income in Mount Ivy
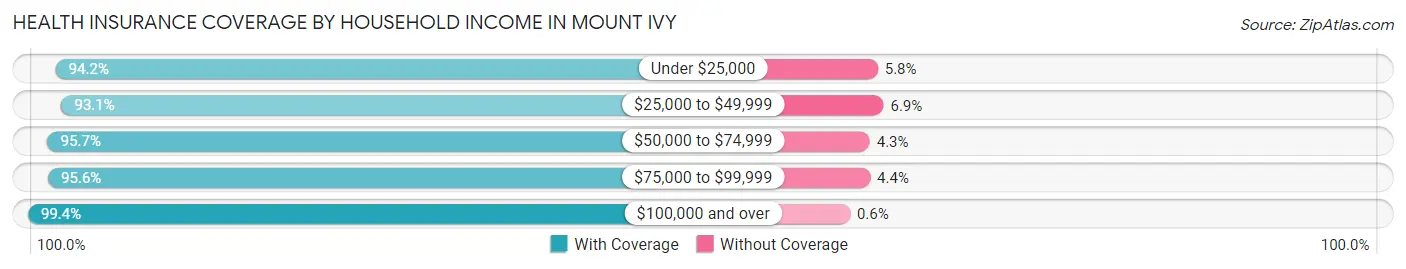
| Household Income | With Coverage | Without Coverage |
| Under $25,000 | 926 (94.2%) | 57 (5.8%) |
| $25,000 to $49,999 | 1,055 (93.1%) | 78 (6.9%) |
| $50,000 to $74,999 | 733 (95.7%) | 33 (4.3%) |
| $75,000 to $99,999 | 961 (95.6%) | 44 (4.4%) |
| $100,000 and over | 3,783 (99.4%) | 23 (0.6%) |
Public vs Private Health Insurance Coverage by Age in Mount Ivy
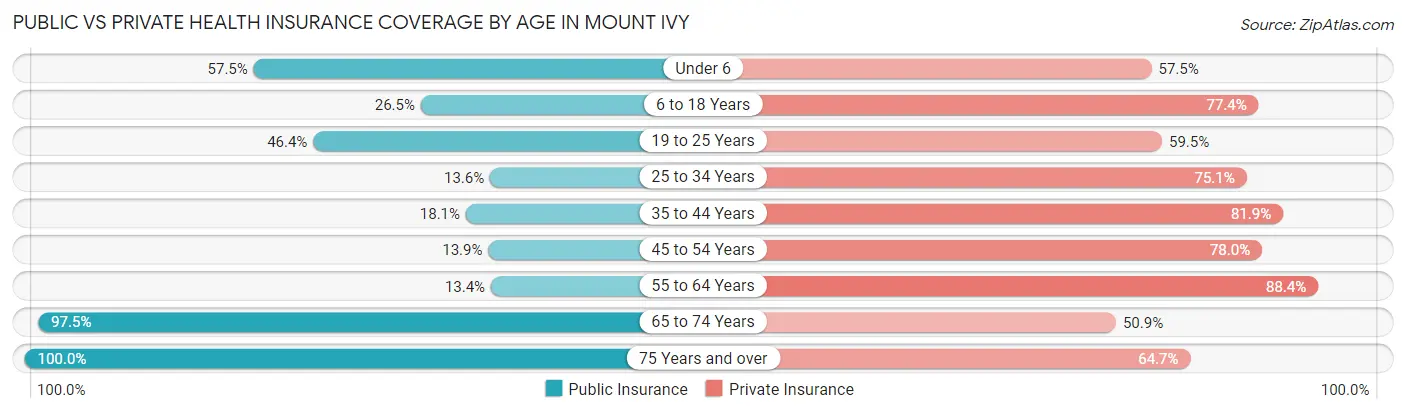
| Age Bracket | Public Insurance | Private Insurance |
| Under 6 | 449 (57.5%) | 449 (57.5%) |
| 6 to 18 Years | 249 (26.5%) | 728 (77.4%) |
| 19 to 25 Years | 221 (46.4%) | 283 (59.5%) |
| 25 to 34 Years | 147 (13.6%) | 812 (75.1%) |
| 35 to 44 Years | 192 (18.1%) | 869 (81.9%) |
| 45 to 54 Years | 155 (13.9%) | 868 (78.0%) |
| 55 to 64 Years | 147 (13.4%) | 967 (88.4%) |
| 65 to 74 Years | 546 (97.5%) | 285 (50.9%) |
| 75 Years and over | 623 (100.0%) | 403 (64.7%) |
| Total | 2,729 (35.3%) | 5,664 (73.3%) |
Disability Status by Sex by Age in Mount Ivy
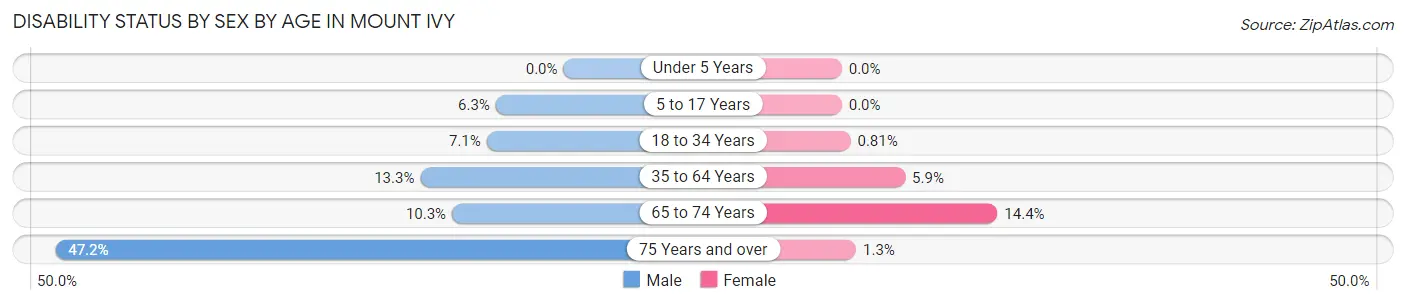
| Age Bracket | Male | Female |
| Under 5 Years | 0 (0.0%) | 0 (0.0%) |
| 5 to 17 Years | 30 (6.3%) | 0 (0.0%) |
| 18 to 34 Years | 51 (7.1%) | 7 (0.8%) |
| 35 to 64 Years | 233 (13.3%) | 89 (5.9%) |
| 65 to 74 Years | 30 (10.3%) | 39 (14.4%) |
| 75 Years and over | 116 (47.1%) | 5 (1.3%) |
Disability Class by Sex by Age in Mount Ivy
Disability Class: Hearing Difficulty
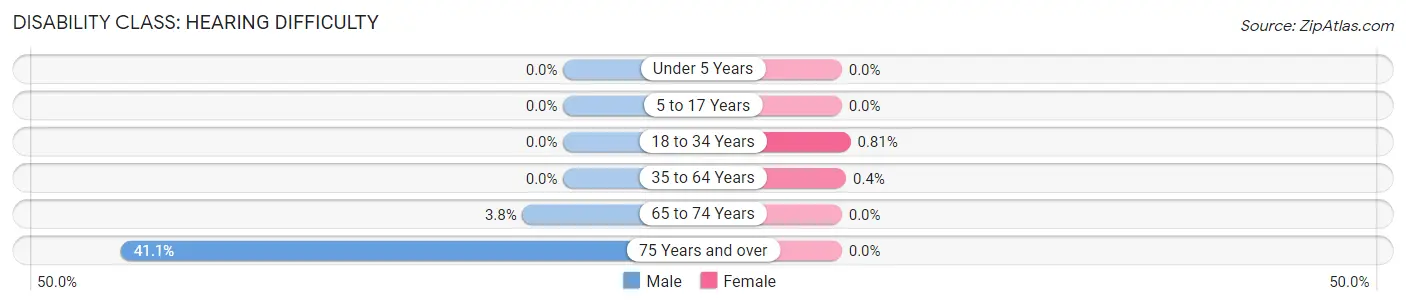
| Age Bracket | Male | Female |
| Under 5 Years | 0 (0.0%) | 0 (0.0%) |
| 5 to 17 Years | 0 (0.0%) | 0 (0.0%) |
| 18 to 34 Years | 0 (0.0%) | 7 (0.8%) |
| 35 to 64 Years | 0 (0.0%) | 6 (0.4%) |
| 65 to 74 Years | 11 (3.8%) | 0 (0.0%) |
| 75 Years and over | 101 (41.1%) | 0 (0.0%) |
Disability Class: Vision Difficulty
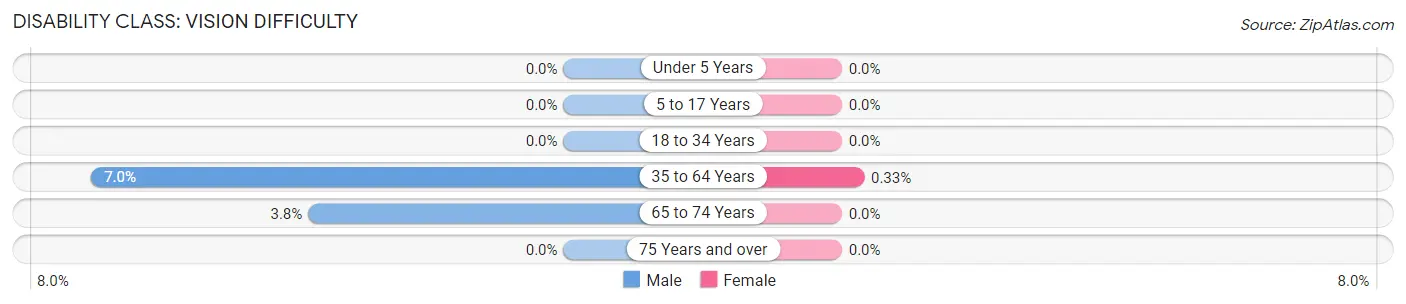
| Age Bracket | Male | Female |
| Under 5 Years | 0 (0.0%) | 0 (0.0%) |
| 5 to 17 Years | 0 (0.0%) | 0 (0.0%) |
| 18 to 34 Years | 0 (0.0%) | 0 (0.0%) |
| 35 to 64 Years | 123 (7.0%) | 5 (0.3%) |
| 65 to 74 Years | 11 (3.8%) | 0 (0.0%) |
| 75 Years and over | 0 (0.0%) | 0 (0.0%) |
Disability Class: Cognitive Difficulty
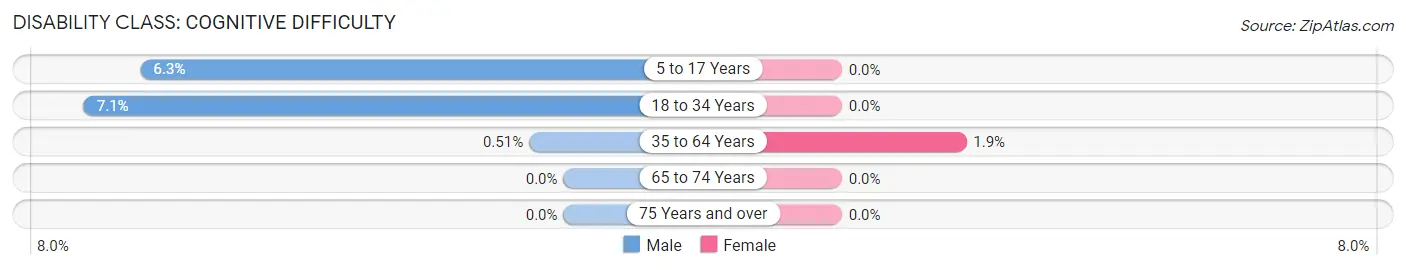
| Age Bracket | Male | Female |
| 5 to 17 Years | 30 (6.3%) | 0 (0.0%) |
| 18 to 34 Years | 51 (7.1%) | 0 (0.0%) |
| 35 to 64 Years | 9 (0.5%) | 28 (1.8%) |
| 65 to 74 Years | 0 (0.0%) | 0 (0.0%) |
| 75 Years and over | 0 (0.0%) | 0 (0.0%) |
Disability Class: Ambulatory Difficulty
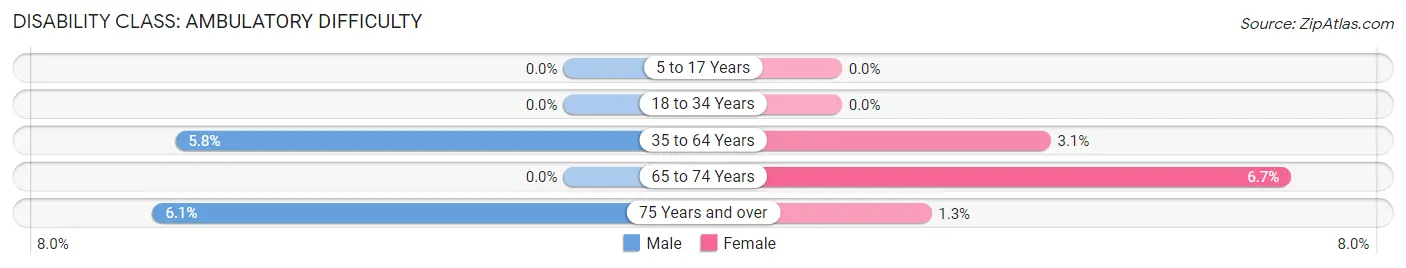
| Age Bracket | Male | Female |
| 5 to 17 Years | 0 (0.0%) | 0 (0.0%) |
| 18 to 34 Years | 0 (0.0%) | 0 (0.0%) |
| 35 to 64 Years | 101 (5.8%) | 47 (3.1%) |
| 65 to 74 Years | 0 (0.0%) | 18 (6.7%) |
| 75 Years and over | 15 (6.1%) | 5 (1.3%) |
Disability Class: Self-Care Difficulty
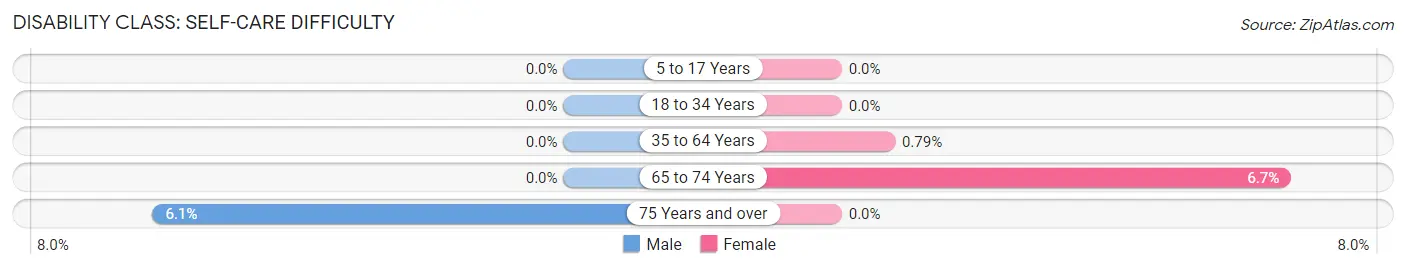
| Age Bracket | Male | Female |
| 5 to 17 Years | 0 (0.0%) | 0 (0.0%) |
| 18 to 34 Years | 0 (0.0%) | 0 (0.0%) |
| 35 to 64 Years | 0 (0.0%) | 12 (0.8%) |
| 65 to 74 Years | 0 (0.0%) | 18 (6.7%) |
| 75 Years and over | 15 (6.1%) | 0 (0.0%) |
Technology Access in Mount Ivy
Computing Device Access in Mount Ivy
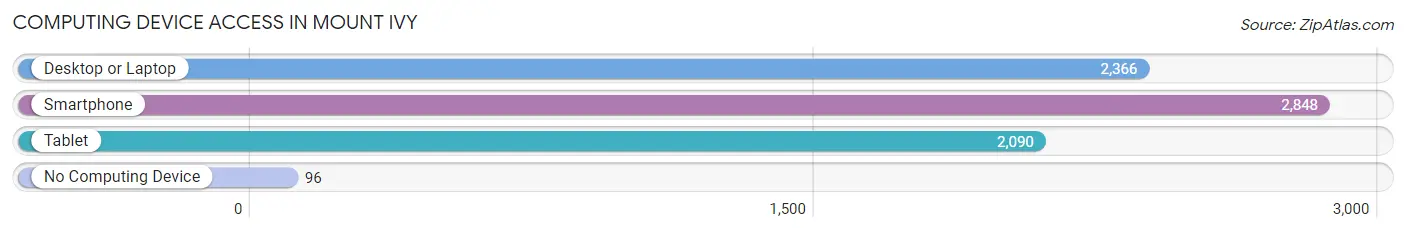
| Device Type | # Households | % Households |
| Desktop or Laptop | 2,366 | 75.3% |
| Smartphone | 2,848 | 90.7% |
| Tablet | 2,090 | 66.6% |
| No Computing Device | 96 | 3.1% |
| Total | 3,140 | 100.0% |
Internet Access in Mount Ivy
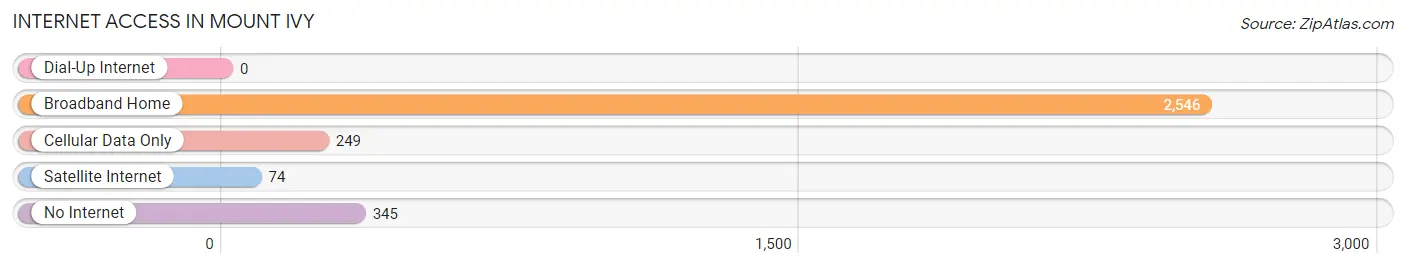
| Internet Type | # Households | % Households |
| Dial-Up Internet | 0 | 0.0% |
| Broadband Home | 2,546 | 81.1% |
| Cellular Data Only | 249 | 7.9% |
| Satellite Internet | 74 | 2.4% |
| No Internet | 345 | 11.0% |
| Total | 3,140 | 100.0% |
Mount Ivy Summary
Ivy, New York is a small hamlet located in the town of Philipstown in Putnam County, New York. It is situated on the east bank of the Hudson River, about 50 miles north of New York City. The hamlet is named after the Ivy River, which flows through the area.
History
The area that is now Ivy was originally inhabited by the Wappinger Indians. The first European settlers arrived in the area in the late 17th century. The hamlet was first known as “Ivytown” and was part of the Philipstown Patent, which was granted to Philip Philipse in 1697. The hamlet was officially incorporated in 1845.
In the 19th century, Ivy was a popular summer resort for wealthy New Yorkers. The hamlet was home to several grand hotels, including the Ivy House, which was built in 1845 and was the largest hotel in the area. The hotel was destroyed by fire in 1891.
In the early 20th century, Ivy became a popular destination for artists and writers. The hamlet was home to several writers, including Edna St. Vincent Millay, who wrote her first book of poetry, “Renascence”, while living in Ivy.
Geography
Ivy is located in the Hudson Valley region of New York. The hamlet is situated on the east bank of the Hudson River, about 50 miles north of New York City. The hamlet is bordered by the towns of Philipstown to the north, Putnam Valley to the east, and Fishkill to the south.
The terrain of Ivy is mostly hilly and wooded. The hamlet is home to several parks, including the Ivy River Park, which offers hiking trails, picnic areas, and a playground.
Economy
The economy of Ivy is largely based on tourism. The hamlet is home to several bed and breakfasts, as well as several restaurants and shops. The hamlet is also home to several wineries, including the Millbrook Winery, which produces award-winning wines.
Demographics
As of the 2010 census, the population of Ivy was 1,845. The median age of the population was 44.7 years. The median household income was $68,750. The racial makeup of the hamlet was 94.2% White, 1.2% African American, 0.3% Native American, 1.2% Asian, and 2.1% from other races.
Ivy is a small hamlet with a rich history and a vibrant economy. The hamlet is home to several parks, wineries, and bed and breakfasts, making it a popular destination for tourists. The hamlet is also home to a diverse population, with a median age of 44.7 years and a median household income of $68,750.
Common Questions
What is Per Capita Income in Mount Ivy?
Per Capita income in Mount Ivy is $47,610.
What is the Median Family Income in Mount Ivy?
Median Family Income in Mount Ivy is $106,875.
What is the Median Household income in Mount Ivy?
Median Household Income in Mount Ivy is $79,756.
What is Income or Wage Gap in Mount Ivy?
Income or Wage Gap in Mount Ivy is 21.3%.
Women in Mount Ivy earn 78.7 cents for every dollar earned by a man.
What is Inequality or Gini Index in Mount Ivy?
Inequality or Gini Index in Mount Ivy is 0.49.
What is the Total Population of Mount Ivy?
Total Population of Mount Ivy is 7,730.
What is the Total Male Population of Mount Ivy?
Total Male Population of Mount Ivy is 3,866.
What is the Total Female Population of Mount Ivy?
Total Female Population of Mount Ivy is 3,864.
What is the Ratio of Males per 100 Females in Mount Ivy?
There are 100.05 Males per 100 Females in Mount Ivy.
What is the Ratio of Females per 100 Males in Mount Ivy?
There are 99.95 Females per 100 Males in Mount Ivy.
What is the Median Population Age in Mount Ivy?
Median Population Age in Mount Ivy is 40.2 Years.
What is the Average Family Size in Mount Ivy
Average Family Size in Mount Ivy is 3.2 People.
What is the Average Household Size in Mount Ivy
Average Household Size in Mount Ivy is 2.5 People.
How Large is the Labor Force in Mount Ivy?
There are 4,098 People in the Labor Forcein in Mount Ivy.
What is the Percentage of People in the Labor Force in Mount Ivy?
67.1% of People are in the Labor Force in Mount Ivy.
What is the Unemployment Rate in Mount Ivy?
Unemployment Rate in Mount Ivy is 6.9%.