Baywood, NY Map & Demographics
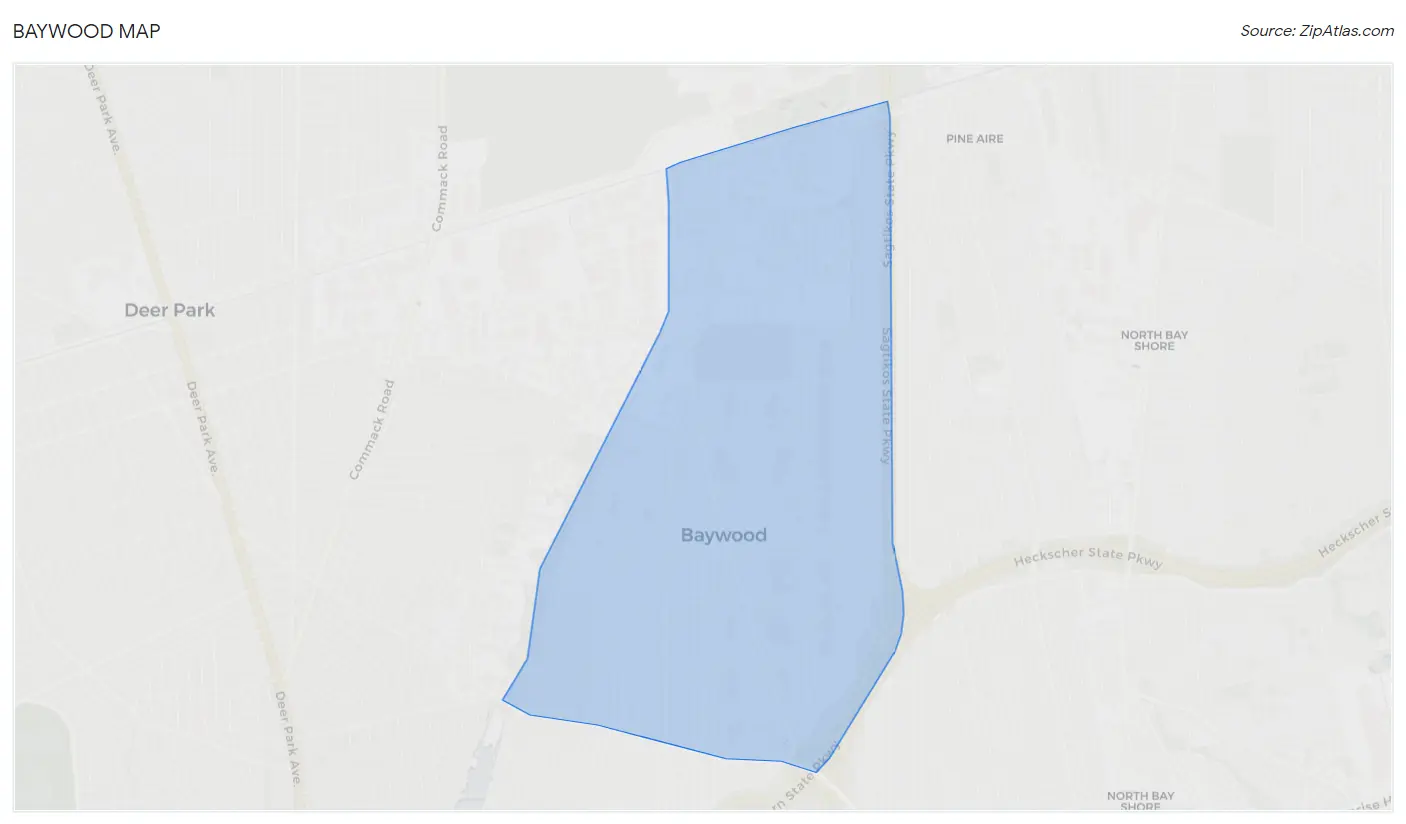
Baywood Map
Baywood Overview
$40,009
PER CAPITA INCOME
$118,750
AVG FAMILY INCOME
$115,592
AVG HOUSEHOLD INCOME
19.7%
WAGE / INCOME GAP [ % ]
80.3¢/ $1
WAGE / INCOME GAP [ $ ]
0.39
INEQUALITY / GINI INDEX
7,185
TOTAL POPULATION
3,803
MALE POPULATION
3,382
FEMALE POPULATION
112.45
MALES / 100 FEMALES
88.93
FEMALES / 100 MALES
40.0
MEDIAN AGE
4.0
AVG FAMILY SIZE
3.6
AVG HOUSEHOLD SIZE
4,046
LABOR FORCE [ PEOPLE ]
68.6%
PERCENT IN LABOR FORCE
6.3%
UNEMPLOYMENT RATE
Income in Baywood
Income Overview in Baywood
Per Capita Income in Baywood is $40,009, while median incomes of families and households are $118,750 and $115,592 respectively.
| Characteristic | Number | Measure |
| Per Capita Income | 7,185 | $40,009 |
| Median Family Income | 1,462 | $118,750 |
| Mean Family Income | 1,462 | $148,079 |
| Median Household Income | 1,963 | $115,592 |
| Mean Household Income | 1,963 | $135,546 |
| Income Deficit | 1,462 | $0 |
| Wage / Income Gap (%) | 7,185 | 19.65% |
| Wage / Income Gap ($) | 7,185 | 80.35¢ per $1 |
| Gini / Inequality Index | 7,185 | 0.39 |
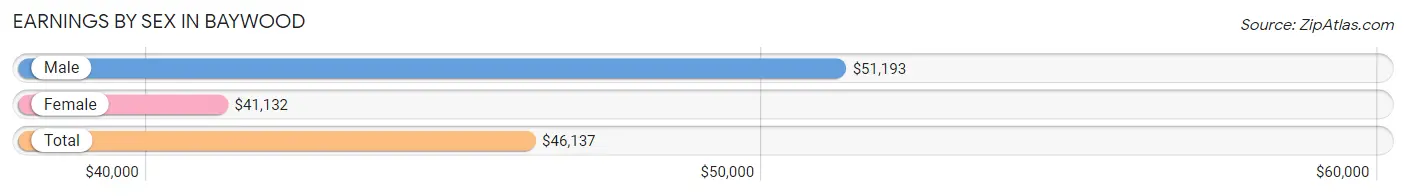
Earnings by Sex in Baywood
Average Earnings in Baywood are $46,137, $51,193 for men and $41,132 for women, a difference of 19.7%.
| Sex | Number | Average Earnings |
| Male | 2,120 (52.6%) | $51,193 |
| Female | 1,911 (47.4%) | $41,132 |
| Total | 4,031 (100.0%) | $46,137 |
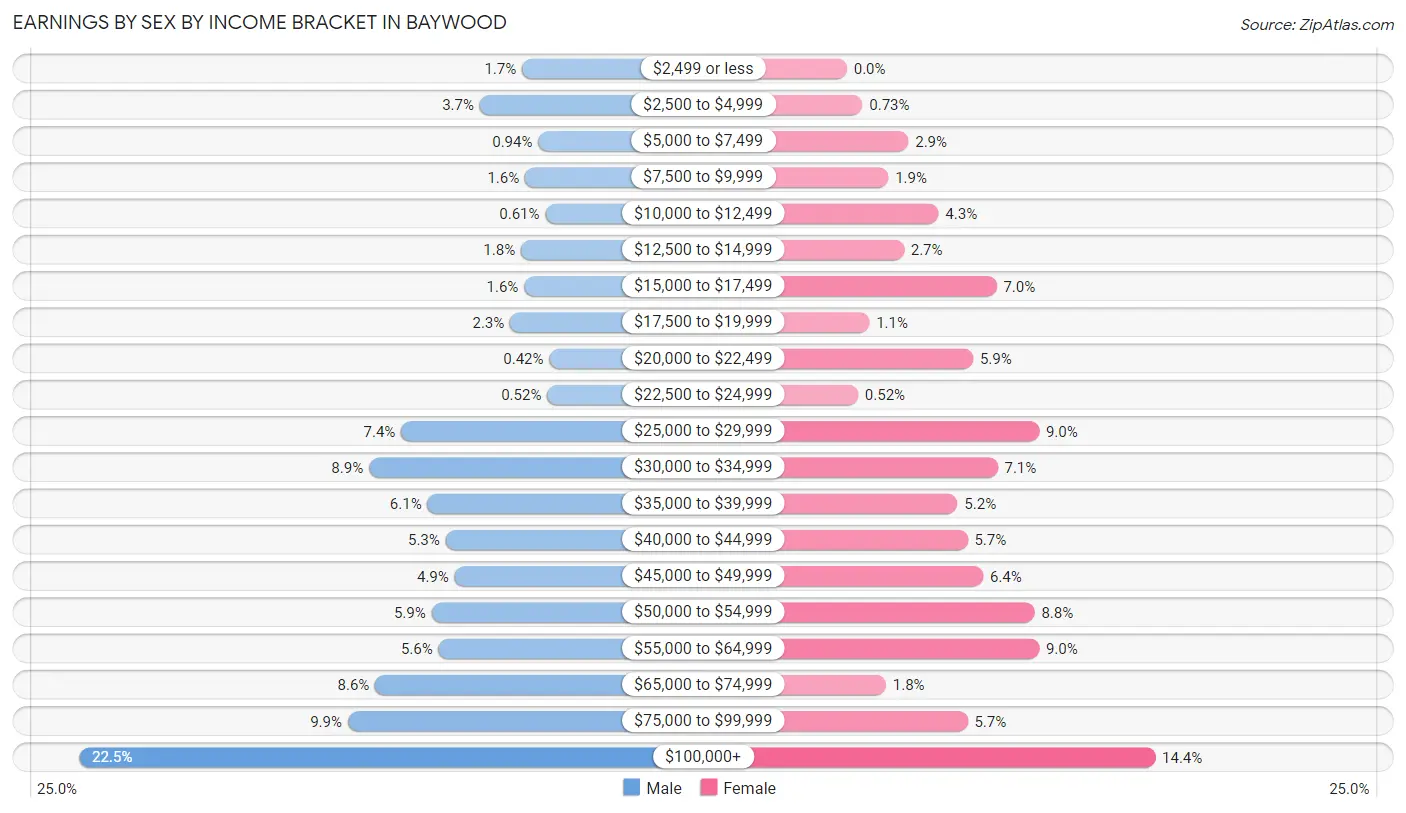
Earnings by Sex by Income Bracket in Baywood
The most common earnings brackets in Baywood are $100,000+ for men (476 | 22.5%) and $100,000+ for women (276 | 14.4%).
| Income | Male | Female |
| $2,499 or less | 36 (1.7%) | 0 (0.0%) |
| $2,500 to $4,999 | 78 (3.7%) | 14 (0.7%) |
| $5,000 to $7,499 | 20 (0.9%) | 55 (2.9%) |
| $7,500 to $9,999 | 33 (1.6%) | 37 (1.9%) |
| $10,000 to $12,499 | 13 (0.6%) | 82 (4.3%) |
| $12,500 to $14,999 | 37 (1.8%) | 51 (2.7%) |
| $15,000 to $17,499 | 34 (1.6%) | 134 (7.0%) |
| $17,500 to $19,999 | 48 (2.3%) | 20 (1.1%) |
| $20,000 to $22,499 | 9 (0.4%) | 113 (5.9%) |
| $22,500 to $24,999 | 11 (0.5%) | 10 (0.5%) |
| $25,000 to $29,999 | 156 (7.4%) | 172 (9.0%) |
| $30,000 to $34,999 | 188 (8.9%) | 135 (7.1%) |
| $35,000 to $39,999 | 130 (6.1%) | 99 (5.2%) |
| $40,000 to $44,999 | 112 (5.3%) | 108 (5.7%) |
| $45,000 to $49,999 | 103 (4.9%) | 122 (6.4%) |
| $50,000 to $54,999 | 126 (5.9%) | 168 (8.8%) |
| $55,000 to $64,999 | 119 (5.6%) | 172 (9.0%) |
| $65,000 to $74,999 | 182 (8.6%) | 35 (1.8%) |
| $75,000 to $99,999 | 209 (9.9%) | 108 (5.7%) |
| $100,000+ | 476 (22.5%) | 276 (14.4%) |
| Total | 2,120 (100.0%) | 1,911 (100.0%) |
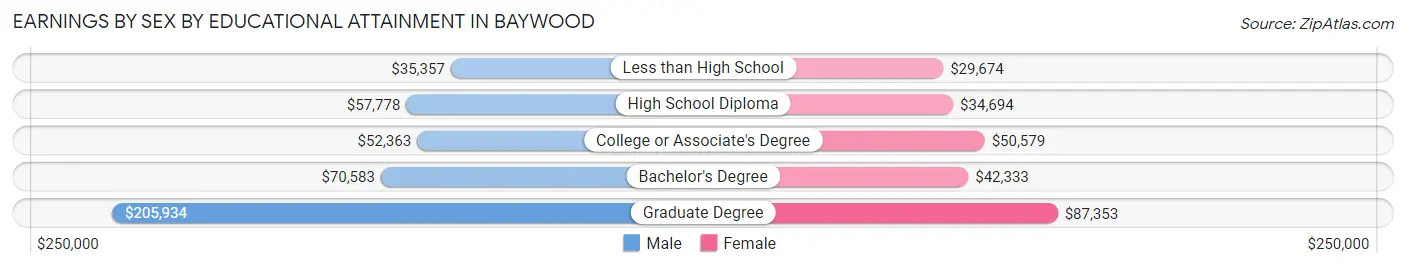
Earnings by Sex by Educational Attainment in Baywood
Average earnings in Baywood are $58,117 for men and $45,755 for women, a difference of 21.3%. Men with an educational attainment of graduate degree enjoy the highest average annual earnings of $205,934, while those with less than high school education earn the least with $35,357. Women with an educational attainment of graduate degree earn the most with the average annual earnings of $87,353, while those with less than high school education have the smallest earnings of $29,674.
| Educational Attainment | Male Income | Female Income |
| Less than High School | $35,357 | $29,674 |
| High School Diploma | $57,778 | $34,694 |
| College or Associate's Degree | $52,363 | $50,579 |
| Bachelor's Degree | $70,583 | $42,333 |
| Graduate Degree | $205,934 | $87,353 |
| Total | $58,117 | $45,755 |
Family Income in Baywood
Family Income Brackets in Baywood
According to the Baywood family income data, there are 354 families falling into the $200,000+ income range, which is the most common income bracket and makes up 24.2% of all families. Conversely, the $10,000 to $14,999 income bracket is the least frequent group with only 4 families (0.3%) belonging to this category.
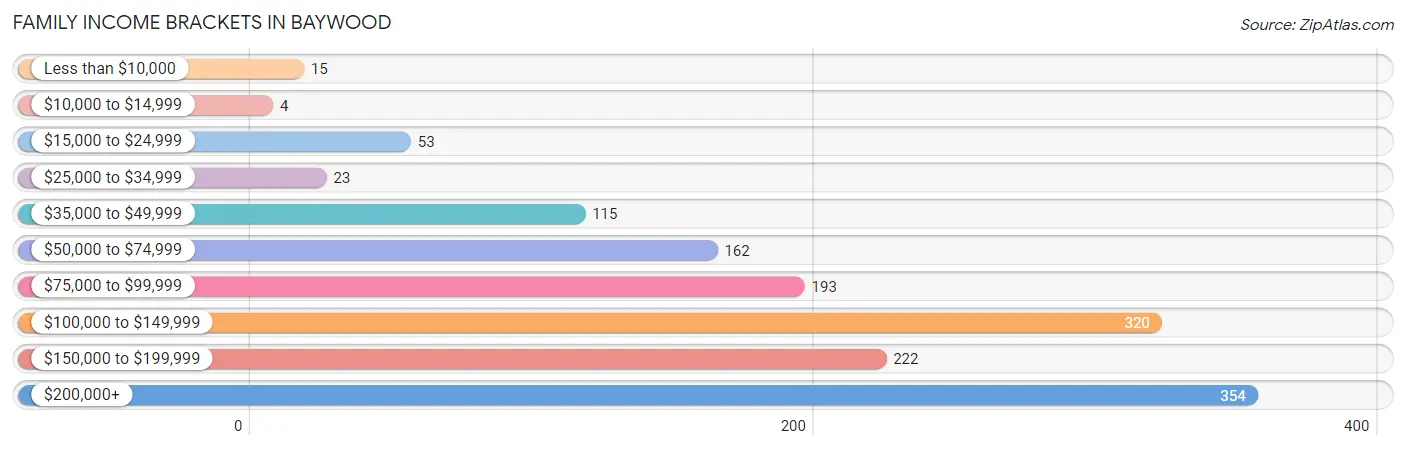
| Income Bracket | # Families | % Families |
| Less than $10,000 | 15 | 1.0% |
| $10,000 to $14,999 | 4 | 0.3% |
| $15,000 to $24,999 | 53 | 3.6% |
| $25,000 to $34,999 | 23 | 1.6% |
| $35,000 to $49,999 | 115 | 7.9% |
| $50,000 to $74,999 | 162 | 11.1% |
| $75,000 to $99,999 | 193 | 13.2% |
| $100,000 to $149,999 | 320 | 21.9% |
| $150,000 to $199,999 | 222 | 15.2% |
| $200,000+ | 354 | 24.2% |
Family Income by Famaliy Size in Baywood
6-person families (168 | 11.5%) account for the highest median family income in Baywood with $216,538 per family, while 3-person families (395 | 27.0%) have the highest median income of $47,741 per family member.
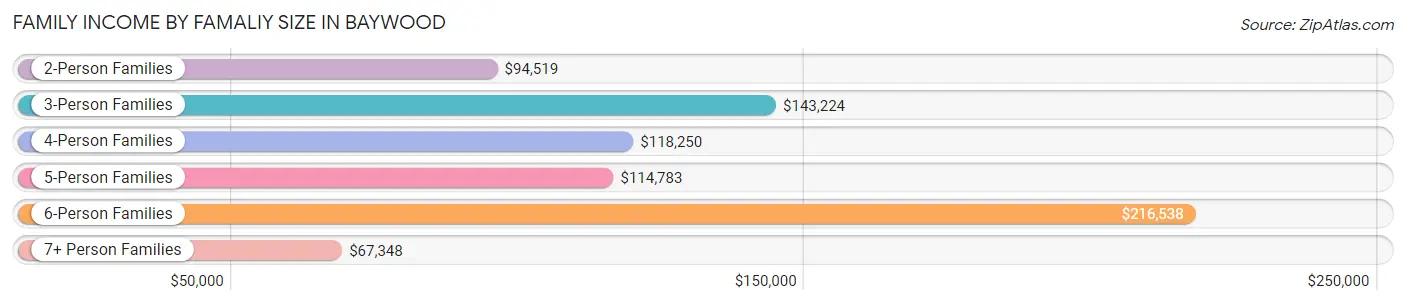
| Income Bracket | # Families | Median Income |
| 2-Person Families | 365 (25.0%) | $94,519 |
| 3-Person Families | 395 (27.0%) | $143,224 |
| 4-Person Families | 300 (20.5%) | $118,250 |
| 5-Person Families | 172 (11.8%) | $114,783 |
| 6-Person Families | 168 (11.5%) | $216,538 |
| 7+ Person Families | 62 (4.2%) | $67,348 |
| Total | 1,462 (100.0%) | $118,750 |
Family Income by Number of Earners in Baywood
The median family income in Baywood is $118,750, with families comprising 3+ earners (427) having the highest median family income of $173,618, while families with no earners (120) have the lowest median family income of $47,917, accounting for 29.2% and 8.2% of families, respectively.
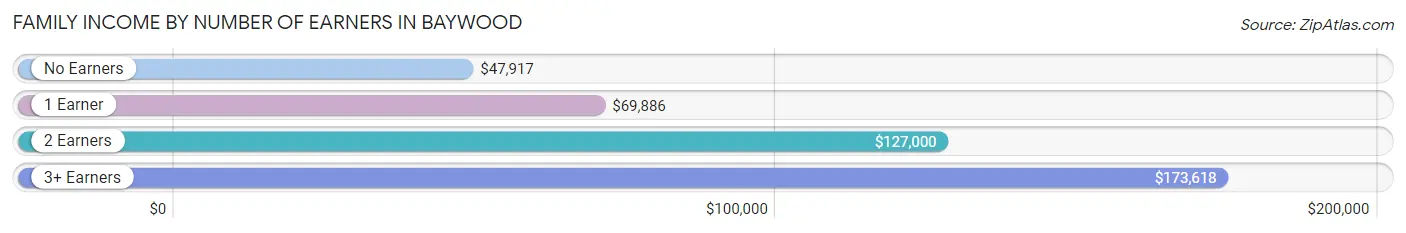
| Number of Earners | # Families | Median Income |
| No Earners | 120 (8.2%) | $47,917 |
| 1 Earner | 299 (20.4%) | $69,886 |
| 2 Earners | 616 (42.1%) | $127,000 |
| 3+ Earners | 427 (29.2%) | $173,618 |
| Total | 1,462 (100.0%) | $118,750 |
Household Income in Baywood
Household Income Brackets in Baywood
With 408 households falling in the category, the $200,000+ income range is the most frequent in Baywood, accounting for 20.8% of all households. In contrast, only 29 households (1.5%) fall into the $10,000 to $14,999 income bracket, making it the least populous group.
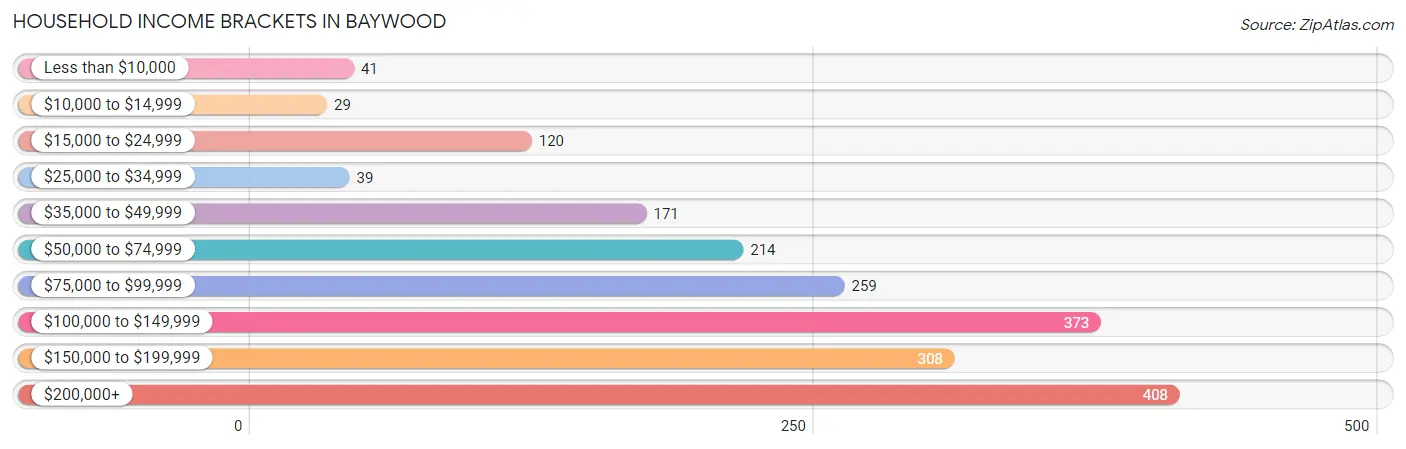
| Income Bracket | # Households | % Households |
| Less than $10,000 | 41 | 2.1% |
| $10,000 to $14,999 | 29 | 1.5% |
| $15,000 to $24,999 | 120 | 6.1% |
| $25,000 to $34,999 | 39 | 2.0% |
| $35,000 to $49,999 | 171 | 8.7% |
| $50,000 to $74,999 | 214 | 10.9% |
| $75,000 to $99,999 | 259 | 13.2% |
| $100,000 to $149,999 | 373 | 19.0% |
| $150,000 to $199,999 | 308 | 15.7% |
| $200,000+ | 408 | 20.8% |
Household Income by Householder Age in Baywood
The median household income in Baywood is $115,592, with the highest median household income of $127,361 found in the 45 to 64 years age bracket for the primary householder. A total of 1,019 households (51.9%) fall into this category. Meanwhile, the 15 to 24 years age bracket for the primary householder has the lowest median household income of $0, with 20 households (1.0%) in this group.
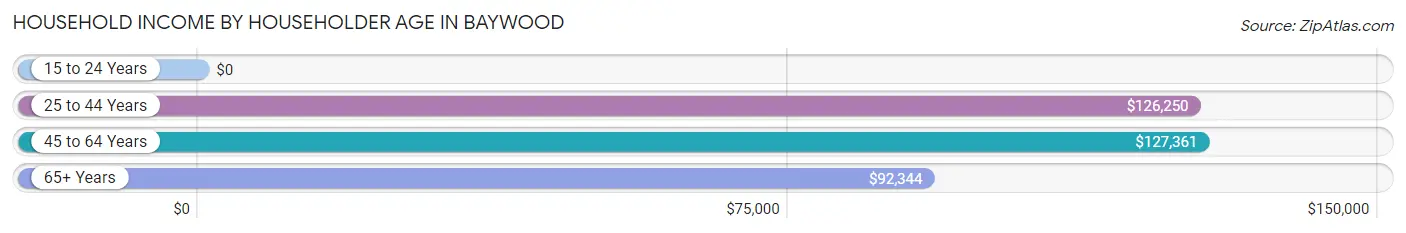
| Income Bracket | # Households | Median Income |
| 15 to 24 Years | 20 (1.0%) | $0 |
| 25 to 44 Years | 420 (21.4%) | $126,250 |
| 45 to 64 Years | 1,019 (51.9%) | $127,361 |
| 65+ Years | 504 (25.7%) | $92,344 |
| Total | 1,963 (100.0%) | $115,592 |
Poverty in Baywood
Income Below Poverty by Sex and Age in Baywood
With 10.2% poverty level for males and 7.4% for females among the residents of Baywood, 35 to 44 year old males and under 5 year old females are the most vulnerable to poverty, with 109 males (21.5%) and 27 females (16.4%) in their respective age groups living below the poverty level.
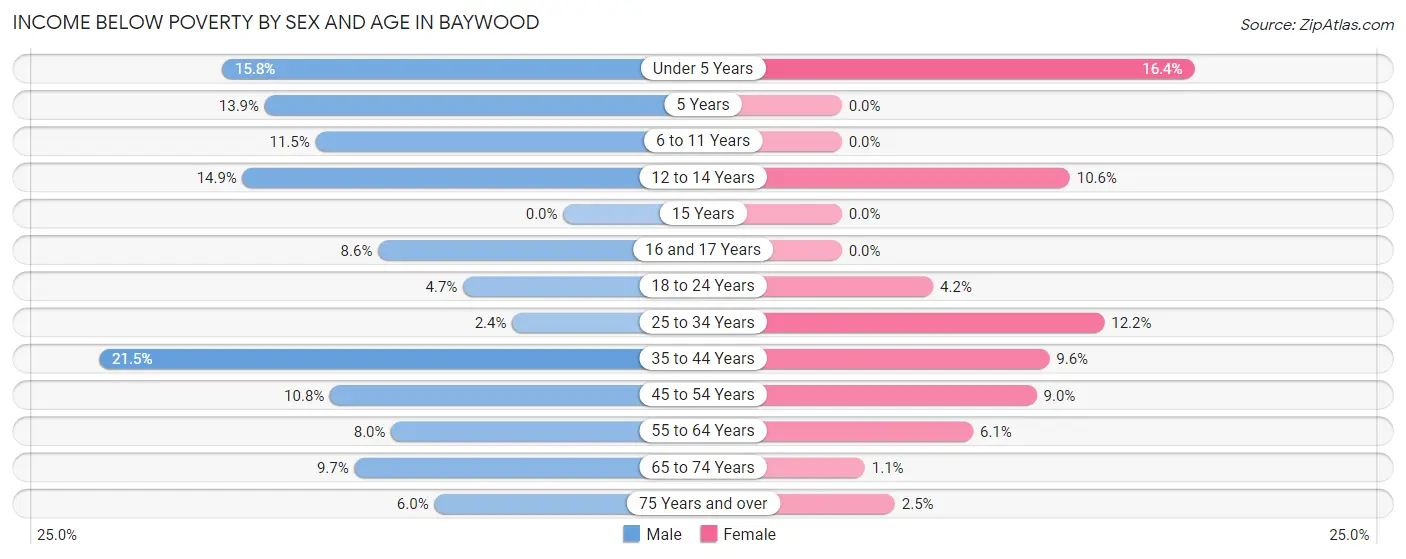
| Age Bracket | Male | Female |
| Under 5 Years | 32 (15.8%) | 27 (16.4%) |
| 5 Years | 9 (13.9%) | 0 (0.0%) |
| 6 to 11 Years | 33 (11.5%) | 0 (0.0%) |
| 12 to 14 Years | 18 (14.9%) | 11 (10.6%) |
| 15 Years | 0 (0.0%) | 0 (0.0%) |
| 16 and 17 Years | 11 (8.6%) | 0 (0.0%) |
| 18 to 24 Years | 20 (4.6%) | 12 (4.2%) |
| 25 to 34 Years | 11 (2.4%) | 61 (12.2%) |
| 35 to 44 Years | 109 (21.5%) | 47 (9.6%) |
| 45 to 54 Years | 67 (10.8%) | 46 (9.0%) |
| 55 to 64 Years | 41 (8.0%) | 33 (6.1%) |
| 65 to 74 Years | 25 (9.7%) | 3 (1.1%) |
| 75 Years and over | 11 (6.0%) | 3 (2.5%) |
| Total | 387 (10.2%) | 243 (7.4%) |
Income Above Poverty by Sex and Age in Baywood
According to the poverty statistics in Baywood, males aged 15 years and females aged 5 years are the age groups that are most secure financially, with 100.0% of males and 100.0% of females in these age groups living above the poverty line.
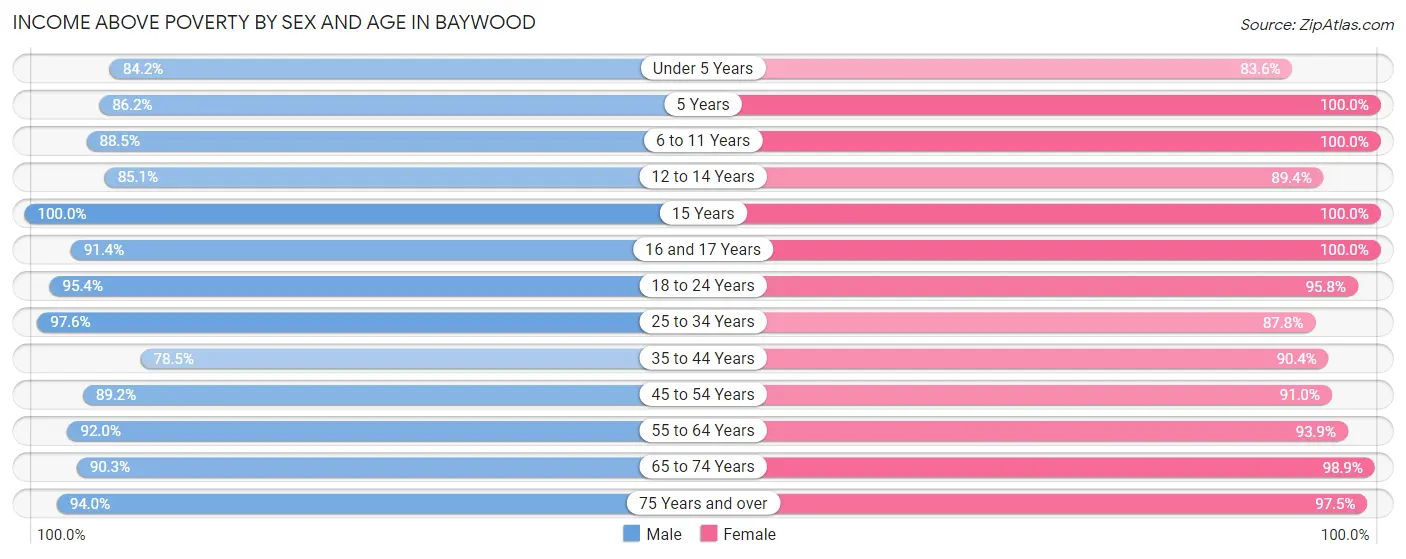
| Age Bracket | Male | Female |
| Under 5 Years | 170 (84.2%) | 138 (83.6%) |
| 5 Years | 56 (86.2%) | 4 (100.0%) |
| 6 to 11 Years | 254 (88.5%) | 187 (100.0%) |
| 12 to 14 Years | 103 (85.1%) | 93 (89.4%) |
| 15 Years | 7 (100.0%) | 39 (100.0%) |
| 16 and 17 Years | 117 (91.4%) | 64 (100.0%) |
| 18 to 24 Years | 410 (95.4%) | 271 (95.8%) |
| 25 to 34 Years | 454 (97.6%) | 440 (87.8%) |
| 35 to 44 Years | 397 (78.5%) | 441 (90.4%) |
| 45 to 54 Years | 552 (89.2%) | 463 (91.0%) |
| 55 to 64 Years | 473 (92.0%) | 509 (93.9%) |
| 65 to 74 Years | 233 (90.3%) | 278 (98.9%) |
| 75 Years and over | 173 (94.0%) | 119 (97.5%) |
| Total | 3,399 (89.8%) | 3,046 (92.6%) |
Income Below Poverty Among Married-Couple Families in Baywood
The poverty statistics for married-couple families in Baywood show that 4.6% or 49 of the total 1,066 families live below the poverty line. Families with 3 or 4 children have the highest poverty rate of 25.6%, comprising of 11 families. On the other hand, families with 5 or more children have the lowest poverty rate of 0.0%, which includes 0 families.
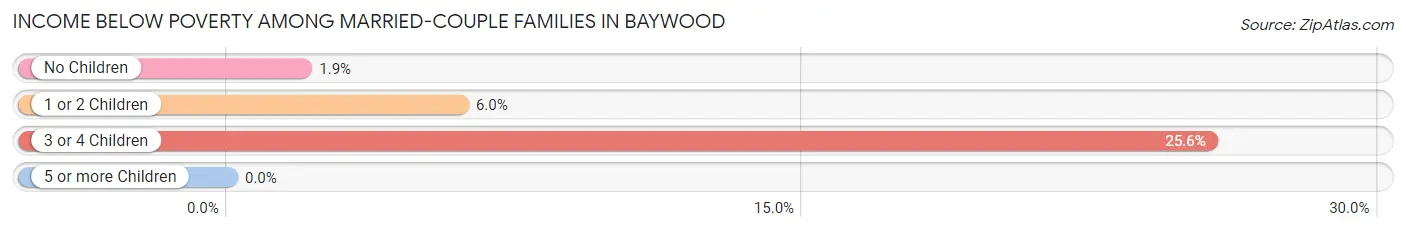
| Children | Above Poverty | Below Poverty |
| No Children | 556 (98.1%) | 11 (1.9%) |
| 1 or 2 Children | 421 (94.0%) | 27 (6.0%) |
| 3 or 4 Children | 32 (74.4%) | 11 (25.6%) |
| 5 or more Children | 8 (100.0%) | 0 (0.0%) |
| Total | 1,017 (95.4%) | 49 (4.6%) |
Income Below Poverty Among Single-Parent Households in Baywood
According to the poverty data in Baywood, 12.0% or 20 single-father households and 1.3% or 3 single-mother households are living below the poverty line. Among single-father households, those with 1 or 2 children have the highest poverty rate, with 20 households (22.7%) experiencing poverty. Likewise, among single-mother households, those with no children have the highest poverty rate, with 3 households (2.3%) falling below the poverty line.
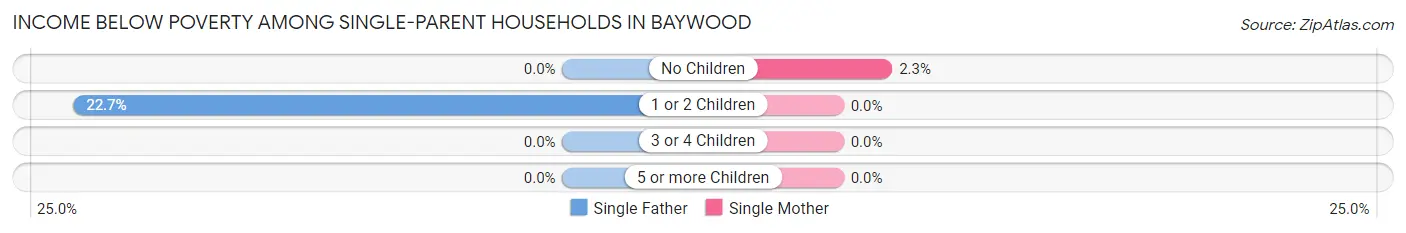
| Children | Single Father | Single Mother |
| No Children | 0 (0.0%) | 3 (2.3%) |
| 1 or 2 Children | 20 (22.7%) | 0 (0.0%) |
| 3 or 4 Children | 0 (0.0%) | 0 (0.0%) |
| 5 or more Children | 0 (0.0%) | 0 (0.0%) |
| Total | 20 (12.0%) | 3 (1.3%) |
Income Below Poverty Among Married-Couple vs Single-Parent Households in Baywood
The poverty data for Baywood shows that 49 of the married-couple family households (4.6%) and 23 of the single-parent households (5.8%) are living below the poverty level. Within the married-couple family households, those with 3 or 4 children have the highest poverty rate, with 11 households (25.6%) falling below the poverty line. Among the single-parent households, those with 1 or 2 children have the highest poverty rate, with 20 household (11.1%) living below poverty.
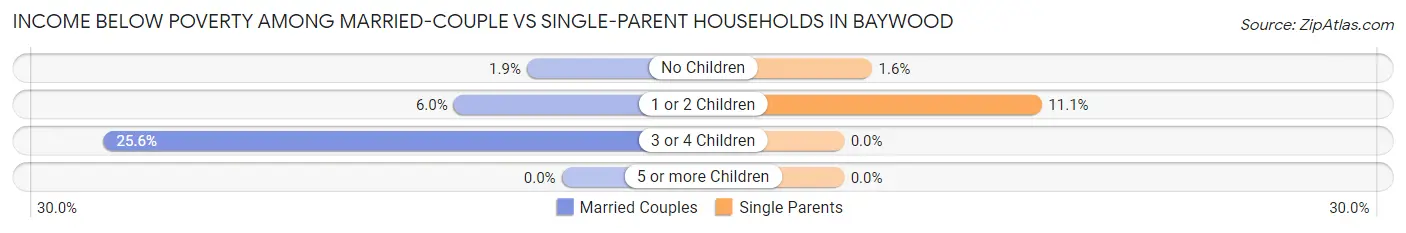
| Children | Married-Couple Families | Single-Parent Households |
| No Children | 11 (1.9%) | 3 (1.6%) |
| 1 or 2 Children | 27 (6.0%) | 20 (11.1%) |
| 3 or 4 Children | 11 (25.6%) | 0 (0.0%) |
| 5 or more Children | 0 (0.0%) | 0 (0.0%) |
| Total | 49 (4.6%) | 23 (5.8%) |
Race in Baywood
The most populous races in Baywood are White / Caucasian (4,230 | 58.9%), Hispanic or Latino (3,193 | 44.4%), and Two or more Races (960 | 13.4%).
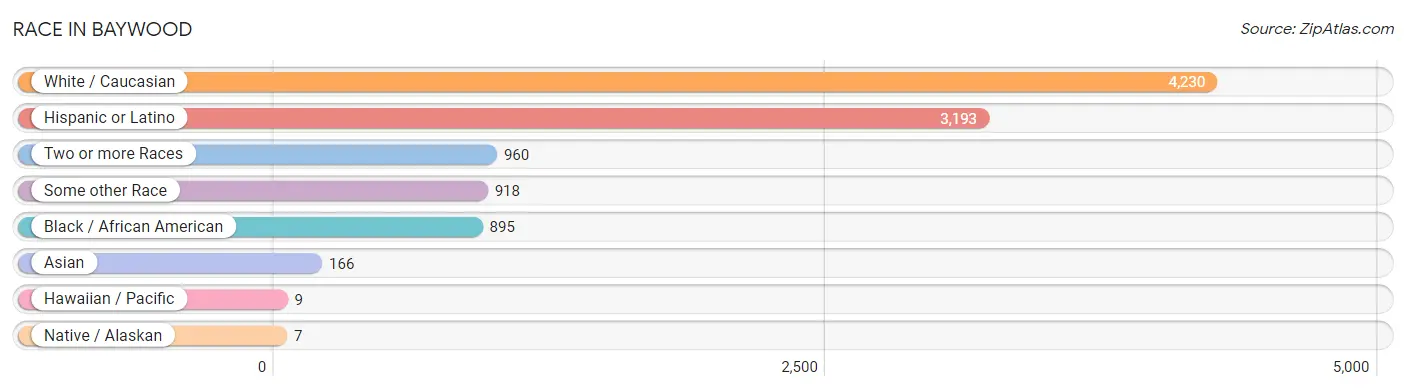
| Race | # Population | % Population |
| Asian | 166 | 2.3% |
| Black / African American | 895 | 12.5% |
| Hawaiian / Pacific | 9 | 0.1% |
| Hispanic or Latino | 3,193 | 44.4% |
| Native / Alaskan | 7 | 0.1% |
| White / Caucasian | 4,230 | 58.9% |
| Two or more Races | 960 | 13.4% |
| Some other Race | 918 | 12.8% |
| Total | 7,185 | 100.0% |
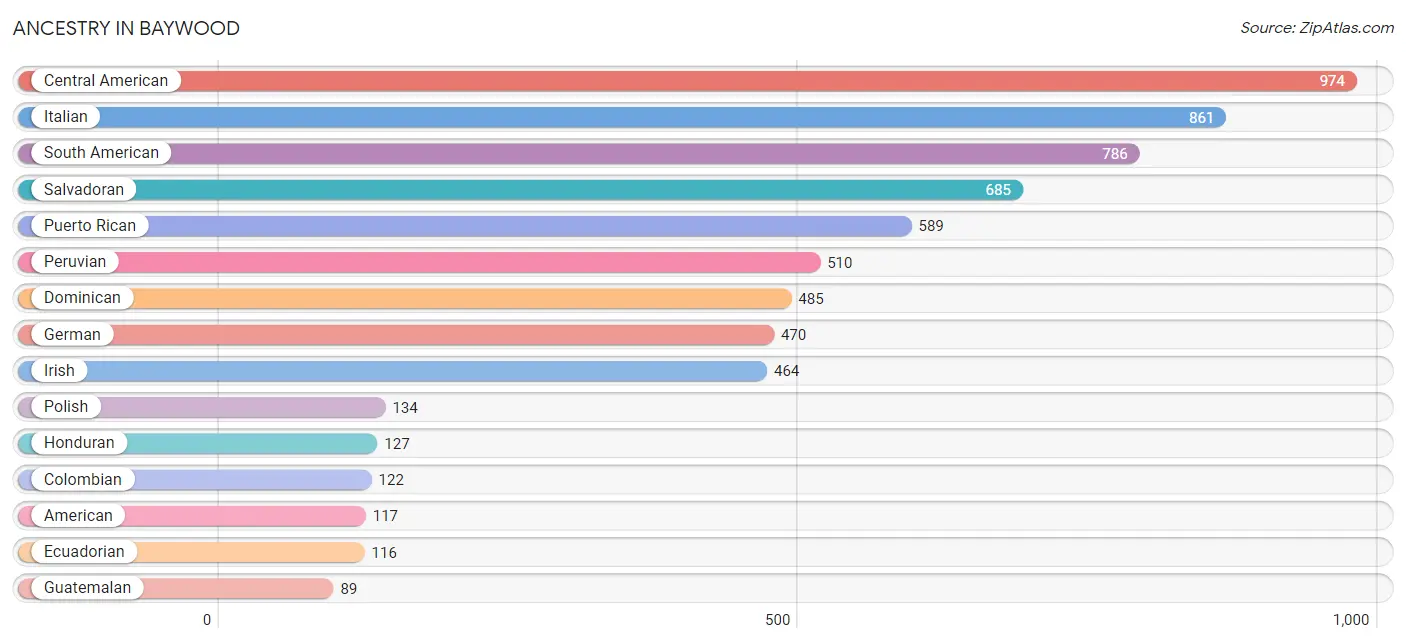
Ancestry in Baywood
The most populous ancestries reported in Baywood are Central American (974 | 13.6%), Italian (861 | 12.0%), South American (786 | 10.9%), Salvadoran (685 | 9.5%), and Puerto Rican (589 | 8.2%), together accounting for 54.2% of all Baywood residents.
| Ancestry | # Population | % Population |
| American | 117 | 1.6% |
| Arab | 17 | 0.2% |
| Austrian | 53 | 0.7% |
| Barbadian | 17 | 0.2% |
| Belgian | 7 | 0.1% |
| Bhutanese | 14 | 0.2% |
| British West Indian | 21 | 0.3% |
| Burmese | 23 | 0.3% |
| Central American | 974 | 13.6% |
| Central American Indian | 7 | 0.1% |
| Cherokee | 22 | 0.3% |
| Chilean | 31 | 0.4% |
| Colombian | 122 | 1.7% |
| Costa Rican | 55 | 0.8% |
| Cuban | 9 | 0.1% |
| Danish | 5 | 0.1% |
| Dominican | 485 | 6.8% |
| Dutch | 13 | 0.2% |
| Ecuadorian | 116 | 1.6% |
| English | 69 | 1.0% |
| European | 29 | 0.4% |
| French | 33 | 0.5% |
| French Canadian | 11 | 0.2% |
| German | 470 | 6.5% |
| Ghanaian | 46 | 0.6% |
| Greek | 18 | 0.3% |
| Guamanian / Chamorro | 9 | 0.1% |
| Guatemalan | 89 | 1.2% |
| Guyanese | 14 | 0.2% |
| Haitian | 35 | 0.5% |
| Honduran | 127 | 1.8% |
| Hungarian | 4 | 0.1% |
| Indian (Asian) | 30 | 0.4% |
| Irish | 464 | 6.5% |
| Iroquois | 3 | 0.0% |
| Italian | 861 | 12.0% |
| Jamaican | 47 | 0.6% |
| Korean | 16 | 0.2% |
| Lithuanian | 29 | 0.4% |
| Mexican | 64 | 0.9% |
| Nicaraguan | 18 | 0.3% |
| Nigerian | 41 | 0.6% |
| Norwegian | 36 | 0.5% |
| Peruvian | 510 | 7.1% |
| Polish | 134 | 1.9% |
| Puerto Rican | 589 | 8.2% |
| Russian | 54 | 0.7% |
| Salvadoran | 685 | 9.5% |
| Scotch-Irish | 7 | 0.1% |
| Slovak | 16 | 0.2% |
| South American | 786 | 10.9% |
| Spaniard | 87 | 1.2% |
| Spanish | 28 | 0.4% |
| Spanish American | 28 | 0.4% |
| Subsaharan African | 87 | 1.2% |
| Swedish | 22 | 0.3% |
| Thai | 14 | 0.2% |
| Turkish | 45 | 0.6% |
| Ukrainian | 42 | 0.6% |
| Venezuelan | 7 | 0.1% |
| Vietnamese | 19 | 0.3% |
| West Indian | 38 | 0.5% | View All 62 Rows |
Immigrants in Baywood
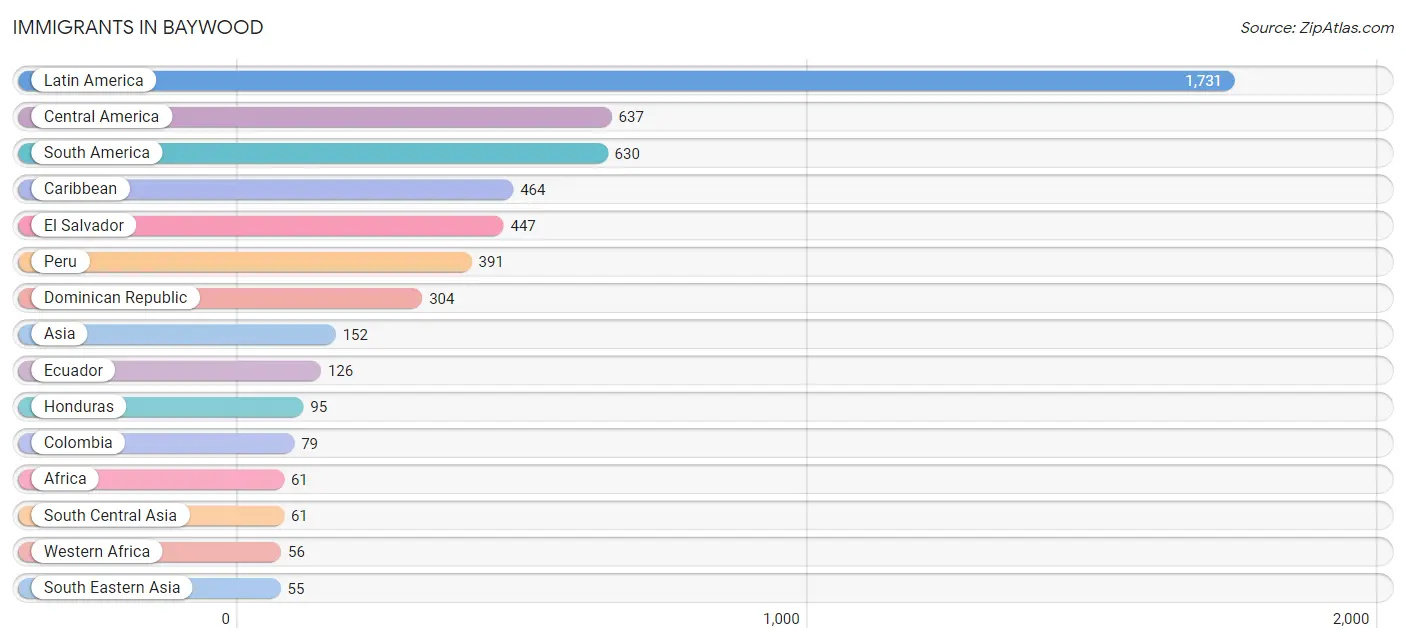
The most numerous immigrant groups reported in Baywood came from Latin America (1,731 | 24.1%), Central America (637 | 8.9%), South America (630 | 8.8%), Caribbean (464 | 6.5%), and El Salvador (447 | 6.2%), together accounting for 54.4% of all Baywood residents.
| Immigration Origin | # Population | % Population |
| Africa | 61 | 0.9% |
| Asia | 152 | 2.1% |
| Bangladesh | 33 | 0.5% |
| Canada | 4 | 0.1% |
| Caribbean | 464 | 6.5% |
| Central America | 637 | 8.9% |
| Chile | 31 | 0.4% |
| Colombia | 79 | 1.1% |
| Costa Rica | 27 | 0.4% |
| Dominican Republic | 304 | 4.2% |
| Eastern Europe | 18 | 0.3% |
| Ecuador | 126 | 1.8% |
| El Salvador | 447 | 6.2% |
| Europe | 23 | 0.3% |
| Ghana | 35 | 0.5% |
| Guatemala | 48 | 0.7% |
| Guyana | 3 | 0.0% |
| Haiti | 48 | 0.7% |
| Honduras | 95 | 1.3% |
| India | 4 | 0.1% |
| Indonesia | 46 | 0.6% |
| Italy | 5 | 0.1% |
| Jamaica | 43 | 0.6% |
| Jordan | 10 | 0.1% |
| Latin America | 1,731 | 24.1% |
| Mexico | 20 | 0.3% |
| Nigeria | 21 | 0.3% |
| Pakistan | 24 | 0.3% |
| Peru | 391 | 5.4% |
| Philippines | 9 | 0.1% |
| Poland | 8 | 0.1% |
| South Africa | 5 | 0.1% |
| South America | 630 | 8.8% |
| South Central Asia | 61 | 0.9% |
| South Eastern Asia | 55 | 0.8% |
| Southern Europe | 5 | 0.1% |
| St. Vincent and the Grenadines | 28 | 0.4% |
| Trinidad and Tobago | 17 | 0.2% |
| Turkey | 26 | 0.4% |
| Ukraine | 10 | 0.1% |
| West Indies | 24 | 0.3% |
| Western Africa | 56 | 0.8% |
| Western Asia | 36 | 0.5% | View All 43 Rows |
Sex and Age in Baywood
Sex and Age in Baywood
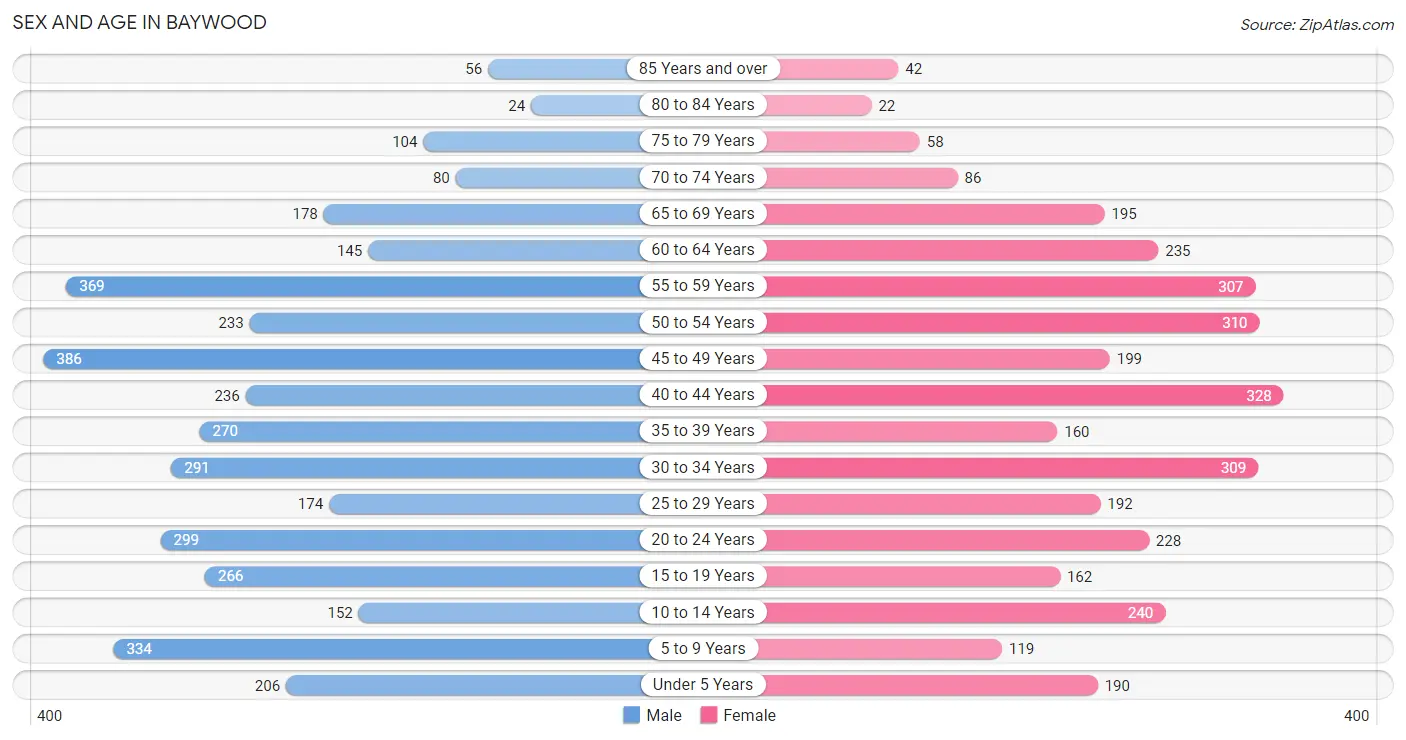
The most populous age groups in Baywood are 45 to 49 Years (386 | 10.2%) for men and 40 to 44 Years (328 | 9.7%) for women.
| Age Bracket | Male | Female |
| Under 5 Years | 206 (5.4%) | 190 (5.6%) |
| 5 to 9 Years | 334 (8.8%) | 119 (3.5%) |
| 10 to 14 Years | 152 (4.0%) | 240 (7.1%) |
| 15 to 19 Years | 266 (7.0%) | 162 (4.8%) |
| 20 to 24 Years | 299 (7.9%) | 228 (6.7%) |
| 25 to 29 Years | 174 (4.6%) | 192 (5.7%) |
| 30 to 34 Years | 291 (7.6%) | 309 (9.1%) |
| 35 to 39 Years | 270 (7.1%) | 160 (4.7%) |
| 40 to 44 Years | 236 (6.2%) | 328 (9.7%) |
| 45 to 49 Years | 386 (10.2%) | 199 (5.9%) |
| 50 to 54 Years | 233 (6.1%) | 310 (9.2%) |
| 55 to 59 Years | 369 (9.7%) | 307 (9.1%) |
| 60 to 64 Years | 145 (3.8%) | 235 (7.0%) |
| 65 to 69 Years | 178 (4.7%) | 195 (5.8%) |
| 70 to 74 Years | 80 (2.1%) | 86 (2.5%) |
| 75 to 79 Years | 104 (2.7%) | 58 (1.7%) |
| 80 to 84 Years | 24 (0.6%) | 22 (0.6%) |
| 85 Years and over | 56 (1.5%) | 42 (1.2%) |
| Total | 3,803 (100.0%) | 3,382 (100.0%) |
Families and Households in Baywood
Median Family Size in Baywood
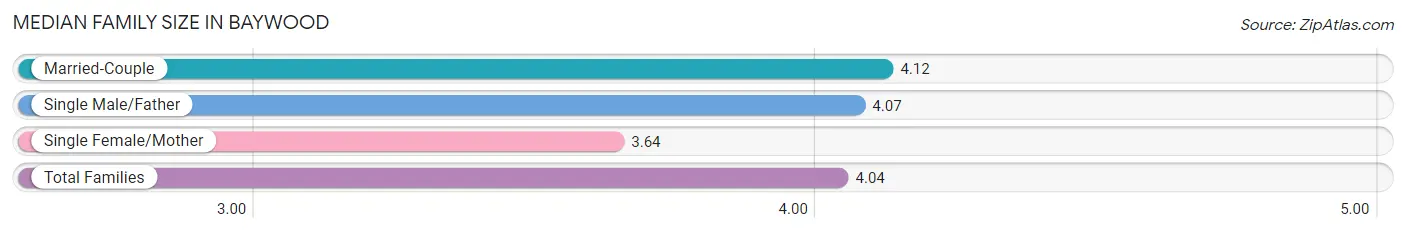
The median family size in Baywood is 4.04 persons per family, with married-couple families (1,066 | 72.9%) accounting for the largest median family size of 4.12 persons per family. On the other hand, single female/mother families (230 | 15.7%) represent the smallest median family size with 3.64 persons per family.
| Family Type | # Families | Family Size |
| Married-Couple | 1,066 (72.9%) | 4.12 |
| Single Male/Father | 166 (11.4%) | 4.07 |
| Single Female/Mother | 230 (15.7%) | 3.64 |
| Total Families | 1,462 (100.0%) | 4.04 |
Median Household Size in Baywood
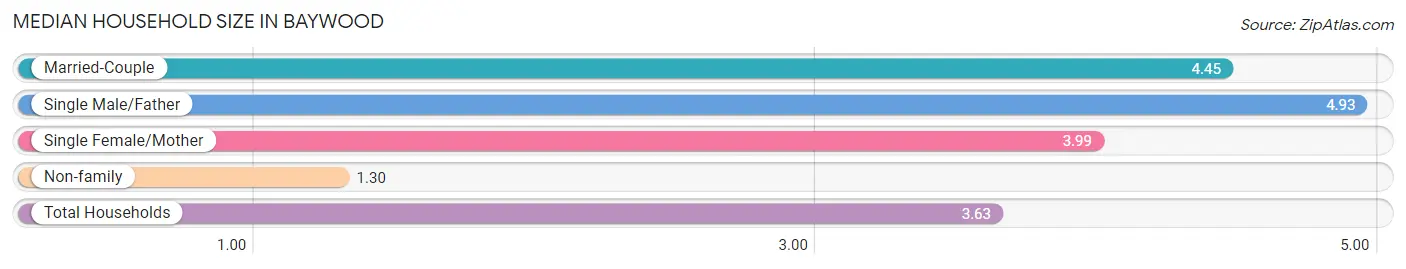
The median household size in Baywood is 3.63 persons per household, with single male/father households (166 | 8.5%) accounting for the largest median household size of 4.93 persons per household. non-family households (501 | 25.5%) represent the smallest median household size with 1.30 persons per household.
| Household Type | # Households | Household Size |
| Married-Couple | 1,066 (54.3%) | 4.45 |
| Single Male/Father | 166 (8.5%) | 4.93 |
| Single Female/Mother | 230 (11.7%) | 3.99 |
| Non-family | 501 (25.5%) | 1.30 |
| Total Households | 1,963 (100.0%) | 3.63 |
Household Size by Marriage Status in Baywood
Out of a total of 1,963 households in Baywood, 1,462 (74.5%) are family households, while 501 (25.5%) are nonfamily households. The most numerous type of family households are 2-person households, comprising 359, and the most common type of nonfamily households are 1-person households, comprising 397.
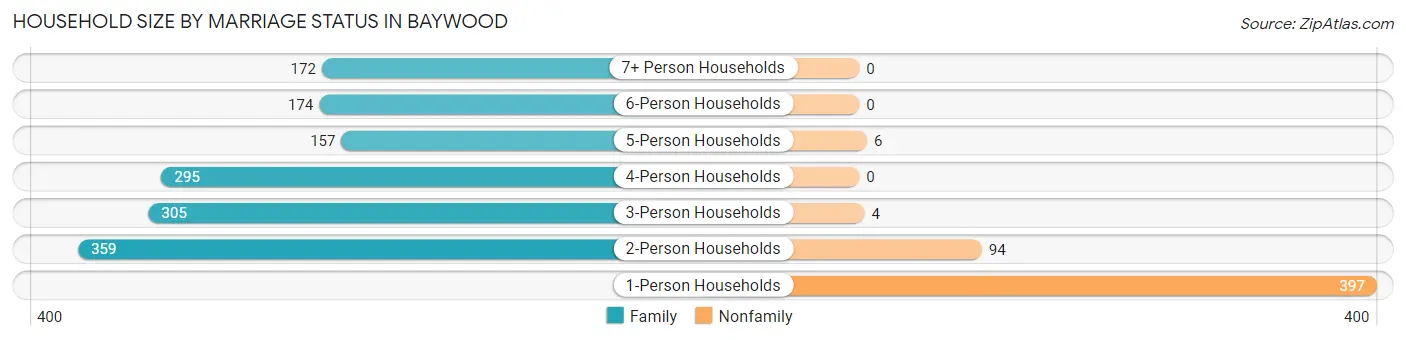
| Household Size | Family Households | Nonfamily Households |
| 1-Person Households | - | 397 (20.2%) |
| 2-Person Households | 359 (18.3%) | 94 (4.8%) |
| 3-Person Households | 305 (15.5%) | 4 (0.2%) |
| 4-Person Households | 295 (15.0%) | 0 (0.0%) |
| 5-Person Households | 157 (8.0%) | 6 (0.3%) |
| 6-Person Households | 174 (8.9%) | 0 (0.0%) |
| 7+ Person Households | 172 (8.8%) | 0 (0.0%) |
| Total | 1,462 (74.5%) | 501 (25.5%) |
Female Fertility in Baywood
Fertility by Age in Baywood
Average fertility rate in Baywood is 105.0 births per 1,000 women. Women in the age bracket of 20 to 34 years have the highest fertility rate with 147.0 births per 1,000 women. Women in the age bracket of 20 to 34 years acount for 61.1% of all women with births.
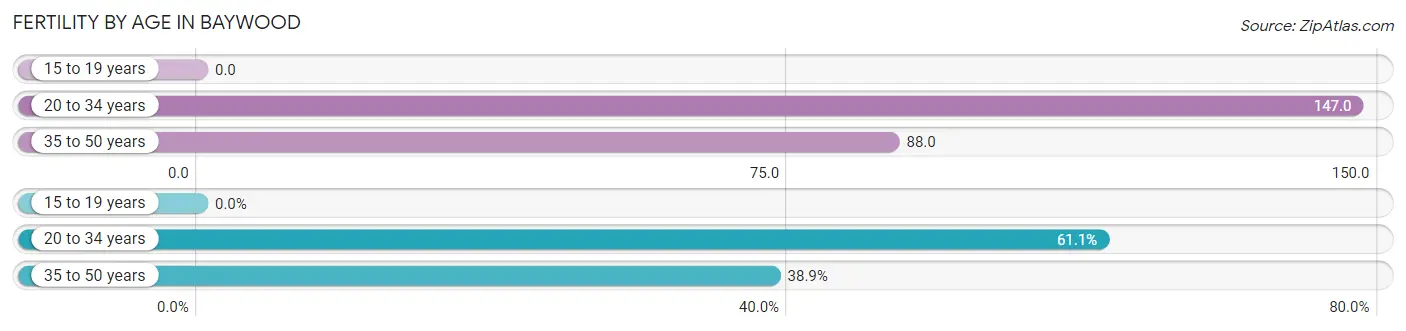
| Age Bracket | Women with Births | Births / 1,000 Women |
| 15 to 19 years | 0 (0.0%) | 0.0 |
| 20 to 34 years | 107 (61.1%) | 147.0 |
| 35 to 50 years | 68 (38.9%) | 88.0 |
| Total | 175 (100.0%) | 105.0 |
Fertility by Age by Marriage Status in Baywood
30.9% of women with births (175) in Baywood are married. The highest percentage of unmarried women with births falls into 20 to 34 years age bracket with 79.4% of them unmarried at the time of birth, while the lowest percentage of unmarried women with births belong to 35 to 50 years age bracket with 52.9% of them unmarried.
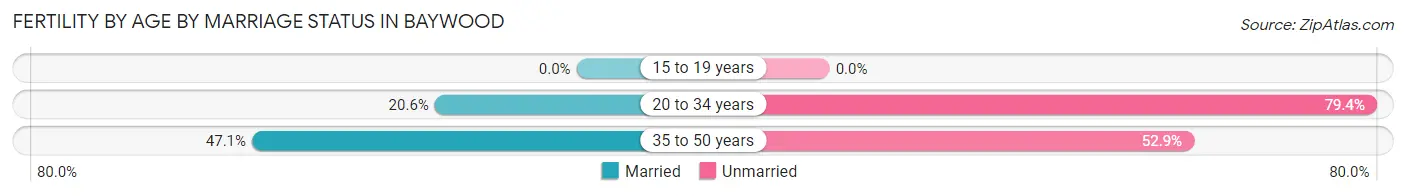
| Age Bracket | Married | Unmarried |
| 15 to 19 years | 0 (0.0%) | 0 (0.0%) |
| 20 to 34 years | 22 (20.6%) | 85 (79.4%) |
| 35 to 50 years | 32 (47.1%) | 36 (52.9%) |
| Total | 54 (30.9%) | 121 (69.1%) |
Fertility by Education in Baywood
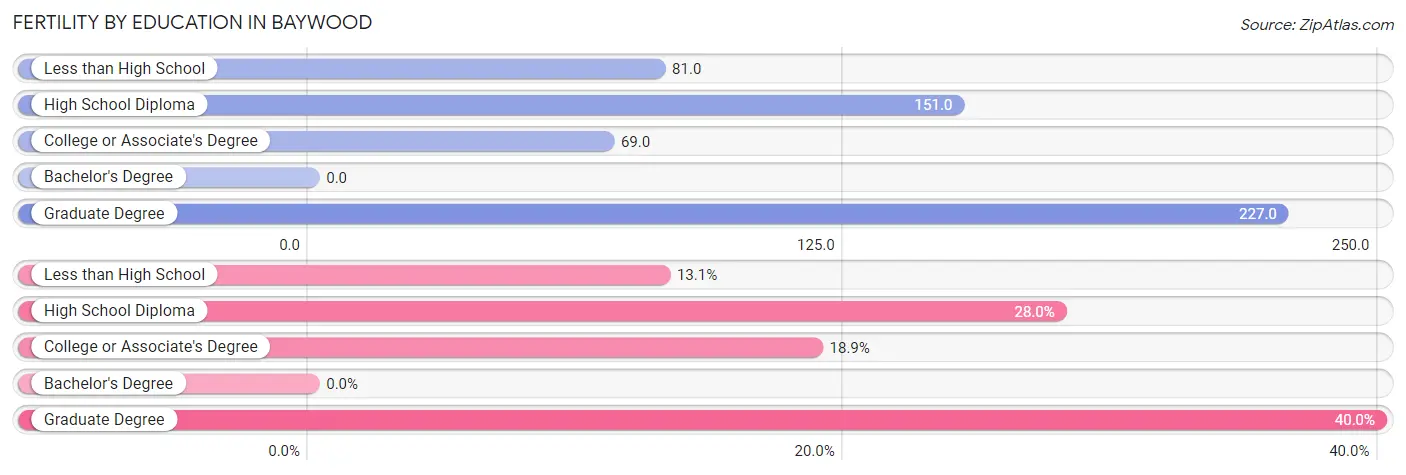
| Educational Attainment | Women with Births | Births / 1,000 Women |
| Less than High School | 23 (13.1%) | 81.0 |
| High School Diploma | 49 (28.0%) | 151.0 |
| College or Associate's Degree | 33 (18.9%) | 69.0 |
| Bachelor's Degree | 0 (0.0%) | 0.0 |
| Graduate Degree | 70 (40.0%) | 227.0 |
| Total | 175 (100.0%) | 105.0 |
Fertility by Education by Marriage Status in Baywood
69.1% of women with births in Baywood are unmarried. Women with the educational attainment of less than high school are most likely to be married with 100.0% of them married at childbirth, while women with the educational attainment of graduate degree are least likely to be married with 87.1% of them unmarried at childbirth.
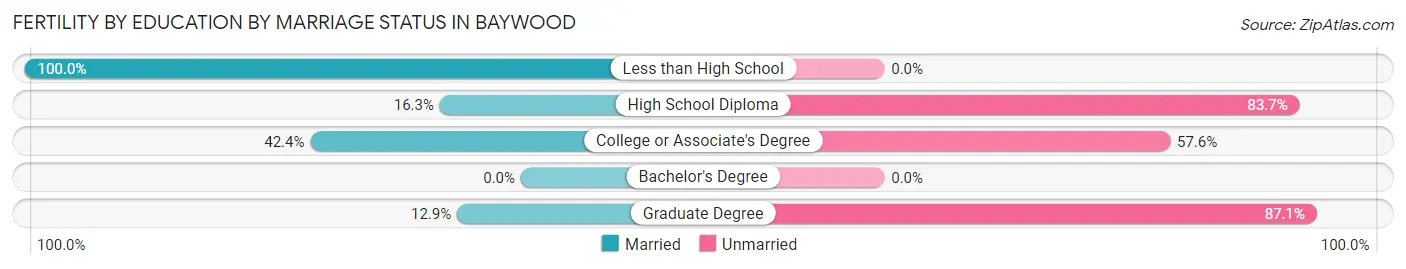
| Educational Attainment | Married | Unmarried |
| Less than High School | 23 (100.0%) | 0 (0.0%) |
| High School Diploma | 8 (16.3%) | 41 (83.7%) |
| College or Associate's Degree | 14 (42.4%) | 19 (57.6%) |
| Bachelor's Degree | 0 (0.0%) | 0 (0.0%) |
| Graduate Degree | 9 (12.9%) | 61 (87.1%) |
| Total | 54 (30.9%) | 121 (69.1%) |
Employment Characteristics in Baywood
Employment by Class of Employer in Baywood
Among the 3,606 employed individuals in Baywood, private company employees (2,467 | 68.4%), not-for-profit organizations (433 | 12.0%), and local government employees (339 | 9.4%) make up the most common classes of employment.
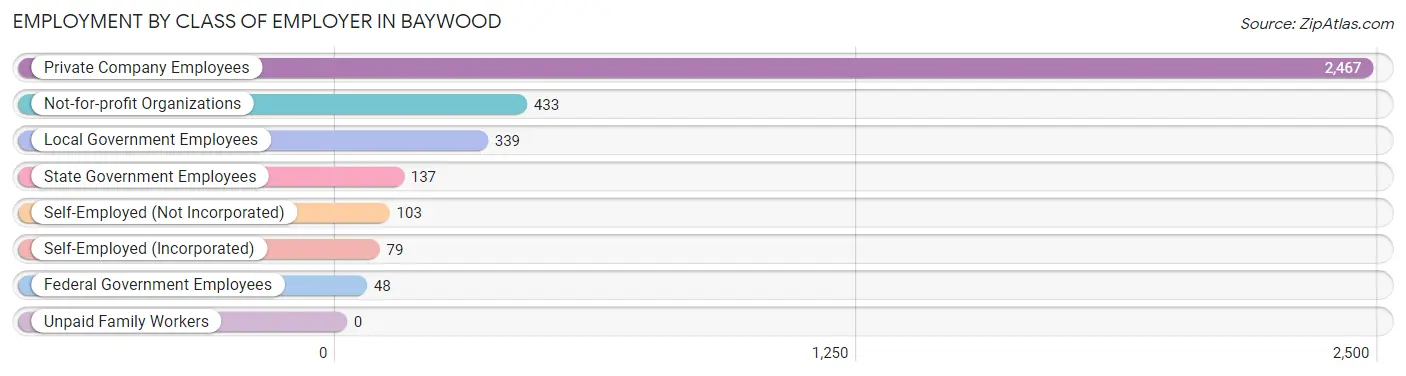
| Employer Class | # Employees | % Employees |
| Private Company Employees | 2,467 | 68.4% |
| Self-Employed (Incorporated) | 79 | 2.2% |
| Self-Employed (Not Incorporated) | 103 | 2.9% |
| Not-for-profit Organizations | 433 | 12.0% |
| Local Government Employees | 339 | 9.4% |
| State Government Employees | 137 | 3.8% |
| Federal Government Employees | 48 | 1.3% |
| Unpaid Family Workers | 0 | 0.0% |
| Total | 3,606 | 100.0% |
Employment Status by Age in Baywood
According to the labor force statistics for Baywood, out of the total population over 16 years of age (5,898), 68.6% or 4,046 individuals are in the labor force, with 6.3% or 255 of them unemployed. The age group with the highest labor force participation rate is 45 to 54 years, with 87.9% or 992 individuals in the labor force. Within the labor force, the 20 to 24 years age range has the highest percentage of unemployed individuals, with 13.4% or 60 of them being unemployed.
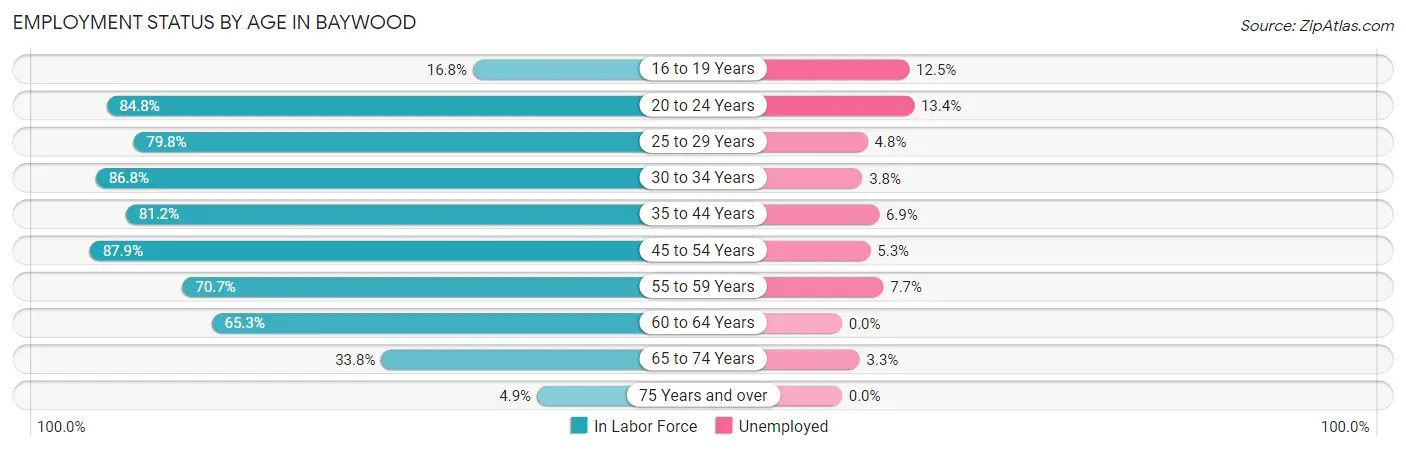
| Age Bracket | In Labor Force | Unemployed |
| 16 to 19 Years | 64 (16.8%) | 8 (12.5%) |
| 20 to 24 Years | 447 (84.8%) | 60 (13.4%) |
| 25 to 29 Years | 292 (79.8%) | 14 (4.8%) |
| 30 to 34 Years | 521 (86.8%) | 20 (3.8%) |
| 35 to 44 Years | 807 (81.2%) | 56 (6.9%) |
| 45 to 54 Years | 992 (87.9%) | 53 (5.3%) |
| 55 to 59 Years | 478 (70.7%) | 37 (7.7%) |
| 60 to 64 Years | 248 (65.3%) | 0 (0.0%) |
| 65 to 74 Years | 182 (33.8%) | 6 (3.3%) |
| 75 Years and over | 15 (4.9%) | 0 (0.0%) |
| Total | 4,046 (68.6%) | 255 (6.3%) |
Employment Status by Educational Attainment in Baywood
According to labor force statistics for Baywood, 80.6% of individuals (3,340) out of the total population between 25 and 64 years of age (4,144) are in the labor force, with 5.4% or 180 of them being unemployed. The group with the highest labor force participation rate are those with the educational attainment of college / associate degree, with 88.1% or 1,210 individuals in the labor force. Within the labor force, individuals with high school diploma education have the highest percentage of unemployment, with 7.0% or 62 of them being unemployed.
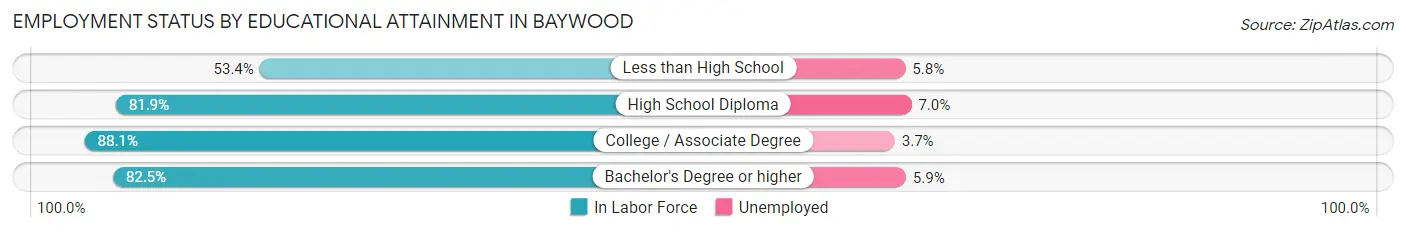
| Educational Attainment | In Labor Force | Unemployed |
| Less than High School | 278 (53.4%) | 30 (5.8%) |
| High School Diploma | 884 (81.9%) | 76 (7.0%) |
| College / Associate Degree | 1,210 (88.1%) | 51 (3.7%) |
| Bachelor's Degree or higher | 965 (82.5%) | 69 (5.9%) |
| Total | 3,340 (80.6%) | 224 (5.4%) |
Employment Occupations by Sex in Baywood
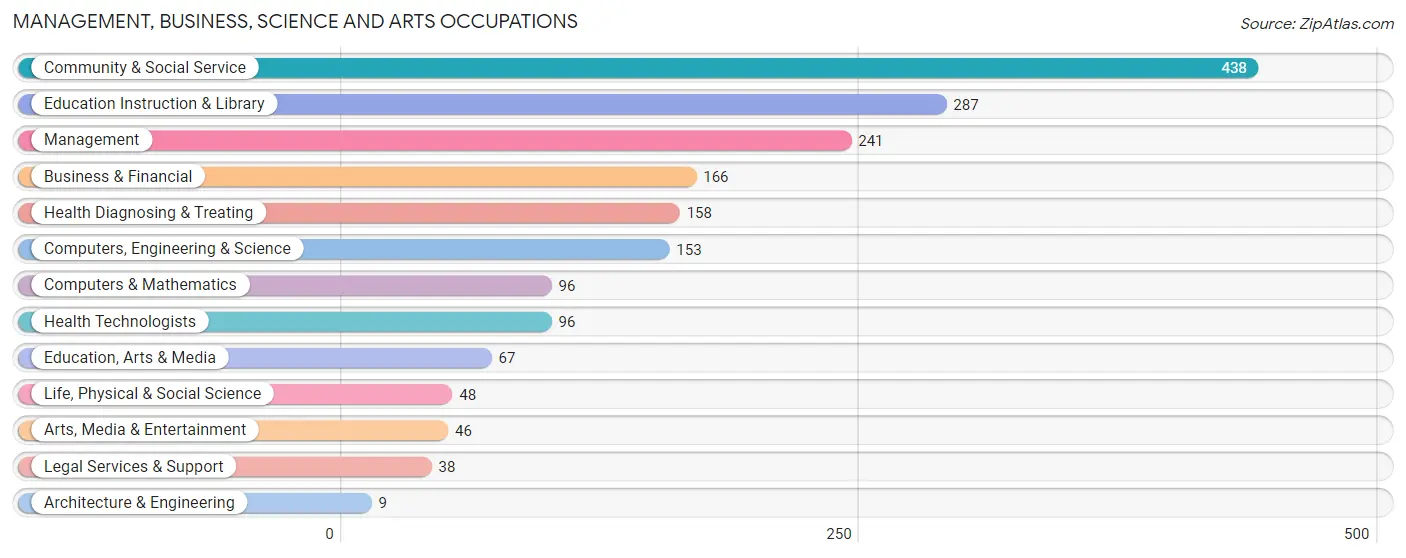
Management, Business, Science and Arts Occupations
The most common Management, Business, Science and Arts occupations in Baywood are Community & Social Service (438 | 11.6%), Education Instruction & Library (287 | 7.6%), Management (241 | 6.4%), Business & Financial (166 | 4.4%), and Health Diagnosing & Treating (158 | 4.2%).
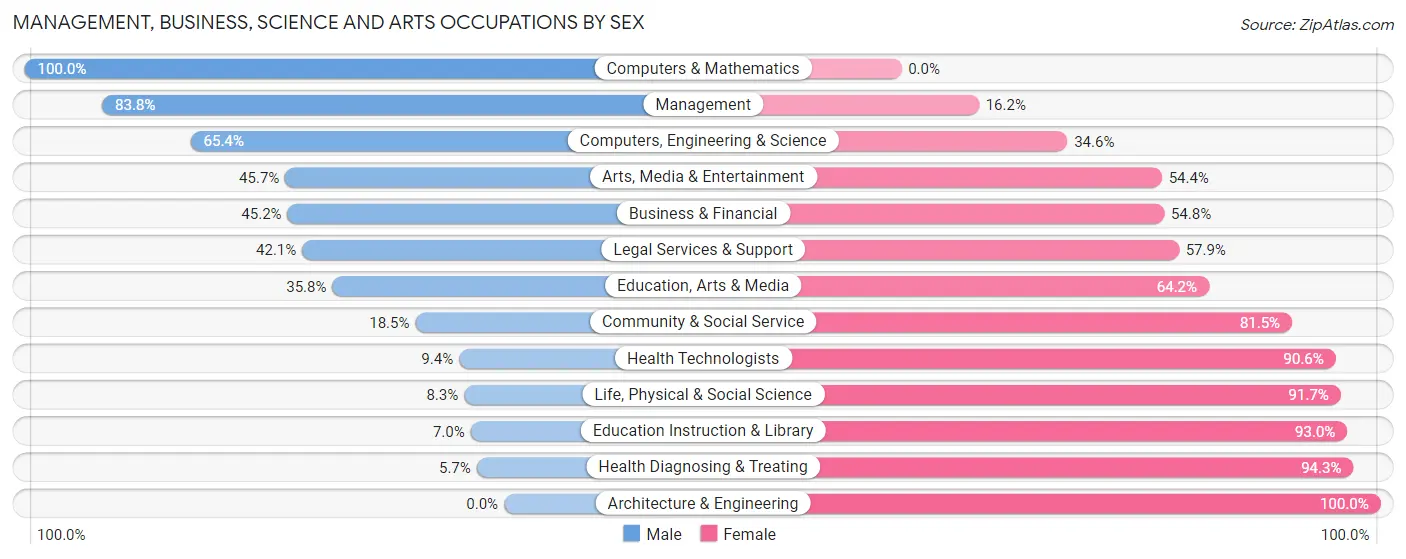
Management, Business, Science and Arts Occupations by Sex
Within the Management, Business, Science and Arts occupations in Baywood, the most male-oriented occupations are Computers & Mathematics (100.0%), Management (83.8%), and Computers, Engineering & Science (65.4%), while the most female-oriented occupations are Architecture & Engineering (100.0%), Health Diagnosing & Treating (94.3%), and Education Instruction & Library (93.0%).
| Occupation | Male | Female |
| Management | 202 (83.8%) | 39 (16.2%) |
| Business & Financial | 75 (45.2%) | 91 (54.8%) |
| Computers, Engineering & Science | 100 (65.4%) | 53 (34.6%) |
| Computers & Mathematics | 96 (100.0%) | 0 (0.0%) |
| Architecture & Engineering | 0 (0.0%) | 9 (100.0%) |
| Life, Physical & Social Science | 4 (8.3%) | 44 (91.7%) |
| Community & Social Service | 81 (18.5%) | 357 (81.5%) |
| Education, Arts & Media | 24 (35.8%) | 43 (64.2%) |
| Legal Services & Support | 16 (42.1%) | 22 (57.9%) |
| Education Instruction & Library | 20 (7.0%) | 267 (93.0%) |
| Arts, Media & Entertainment | 21 (45.7%) | 25 (54.3%) |
| Health Diagnosing & Treating | 9 (5.7%) | 149 (94.3%) |
| Health Technologists | 9 (9.4%) | 87 (90.6%) |
| Total (Category) | 467 (40.4%) | 689 (59.6%) |
| Total (Overall) | 2,010 (53.0%) | 1,782 (47.0%) |
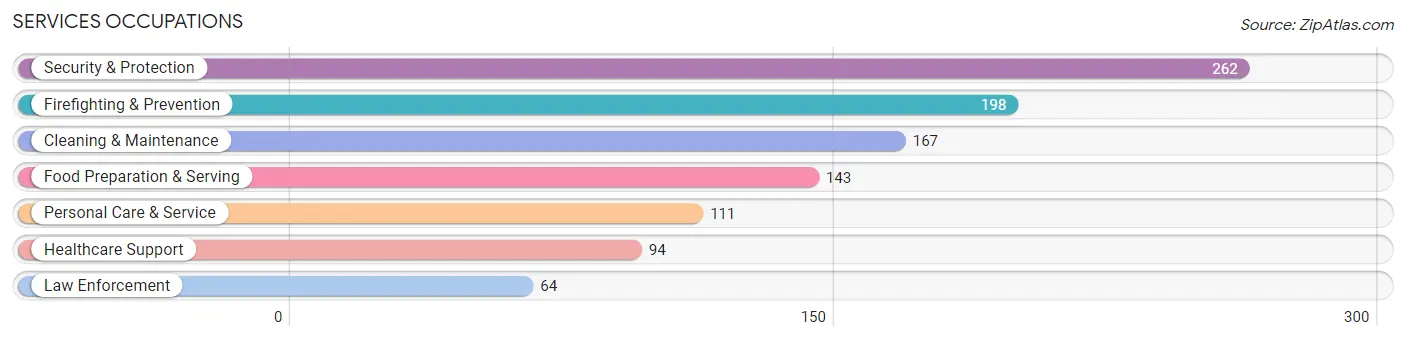
Services Occupations
The most common Services occupations in Baywood are Security & Protection (262 | 6.9%), Firefighting & Prevention (198 | 5.2%), Cleaning & Maintenance (167 | 4.4%), Food Preparation & Serving (143 | 3.8%), and Personal Care & Service (111 | 2.9%).
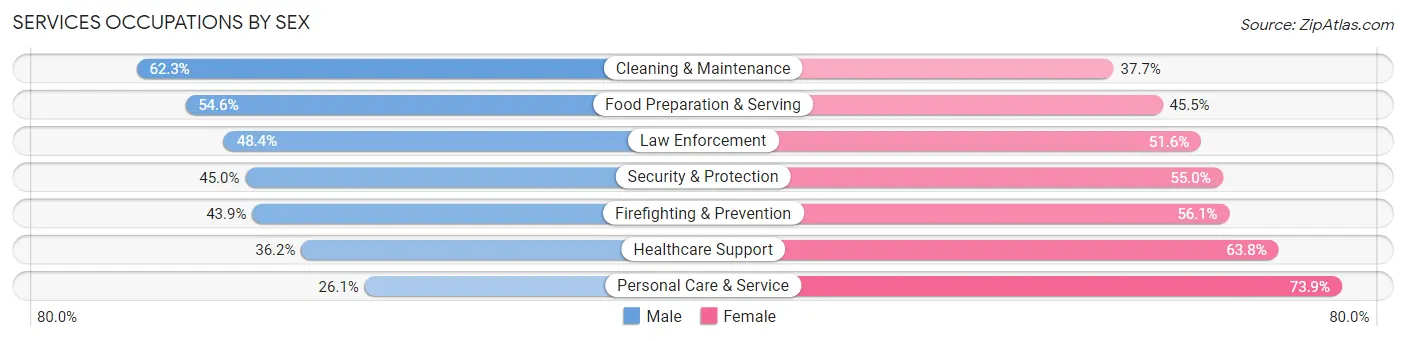
Services Occupations by Sex
Within the Services occupations in Baywood, the most male-oriented occupations are Cleaning & Maintenance (62.3%), Food Preparation & Serving (54.5%), and Law Enforcement (48.4%), while the most female-oriented occupations are Personal Care & Service (73.9%), Healthcare Support (63.8%), and Firefighting & Prevention (56.1%).
| Occupation | Male | Female |
| Healthcare Support | 34 (36.2%) | 60 (63.8%) |
| Security & Protection | 118 (45.0%) | 144 (55.0%) |
| Firefighting & Prevention | 87 (43.9%) | 111 (56.1%) |
| Law Enforcement | 31 (48.4%) | 33 (51.6%) |
| Food Preparation & Serving | 78 (54.5%) | 65 (45.5%) |
| Cleaning & Maintenance | 104 (62.3%) | 63 (37.7%) |
| Personal Care & Service | 29 (26.1%) | 82 (73.9%) |
| Total (Category) | 363 (46.7%) | 414 (53.3%) |
| Total (Overall) | 2,010 (53.0%) | 1,782 (47.0%) |
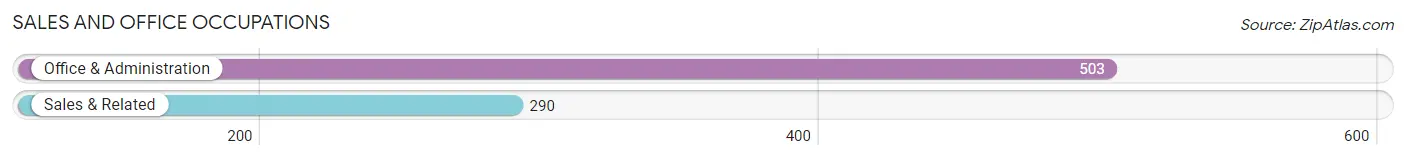
Sales and Office Occupations
The most common Sales and Office occupations in Baywood are Office & Administration (503 | 13.3%), and Sales & Related (290 | 7.6%).
Sales and Office Occupations by Sex
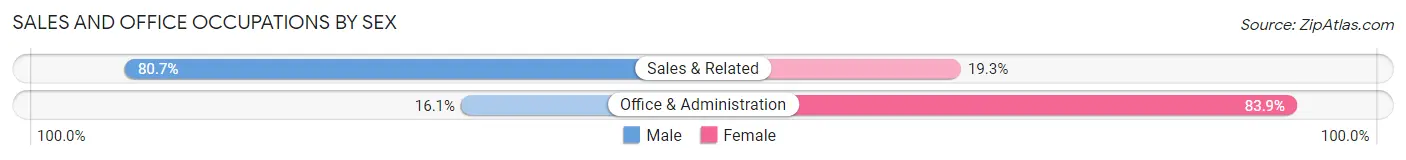
| Occupation | Male | Female |
| Sales & Related | 234 (80.7%) | 56 (19.3%) |
| Office & Administration | 81 (16.1%) | 422 (83.9%) |
| Total (Category) | 315 (39.7%) | 478 (60.3%) |
| Total (Overall) | 2,010 (53.0%) | 1,782 (47.0%) |
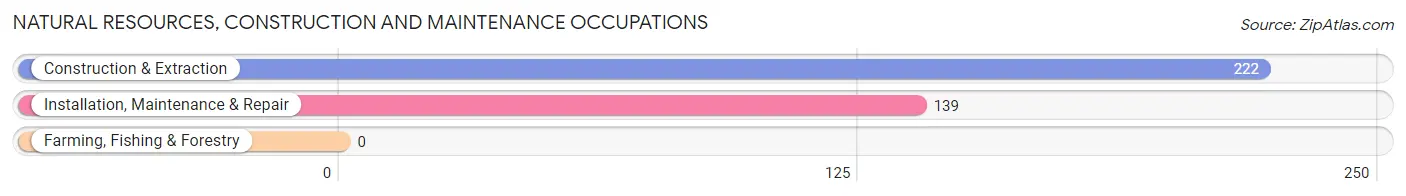
Natural Resources, Construction and Maintenance Occupations
The most common Natural Resources, Construction and Maintenance occupations in Baywood are Construction & Extraction (222 | 5.9%), and Installation, Maintenance & Repair (139 | 3.7%).
Natural Resources, Construction and Maintenance Occupations by Sex
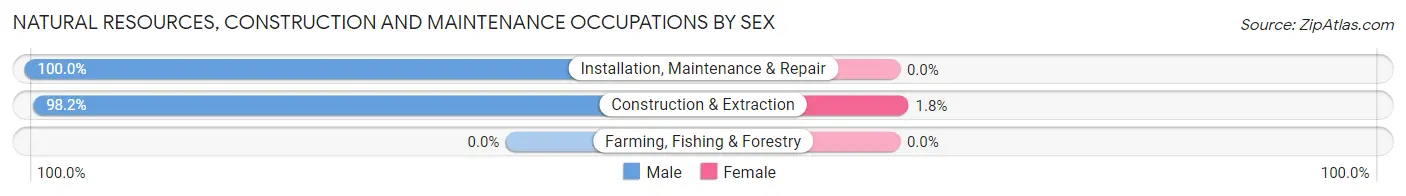
| Occupation | Male | Female |
| Farming, Fishing & Forestry | 0 (0.0%) | 0 (0.0%) |
| Construction & Extraction | 218 (98.2%) | 4 (1.8%) |
| Installation, Maintenance & Repair | 139 (100.0%) | 0 (0.0%) |
| Total (Category) | 357 (98.9%) | 4 (1.1%) |
| Total (Overall) | 2,010 (53.0%) | 1,782 (47.0%) |
Production, Transportation and Moving Occupations
The most common Production, Transportation and Moving occupations in Baywood are Transportation (265 | 7.0%), Production (254 | 6.7%), and Material Moving (186 | 4.9%).
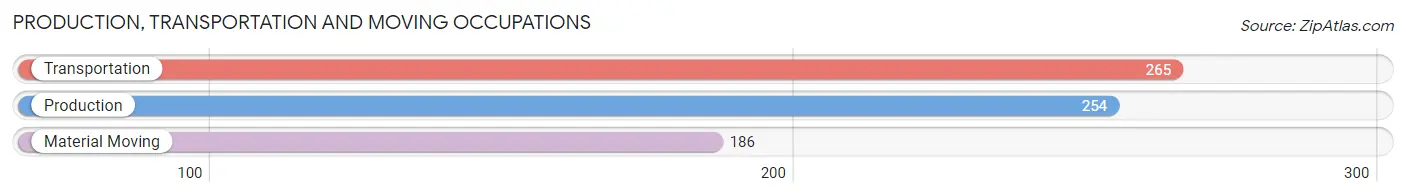
Production, Transportation and Moving Occupations by Sex
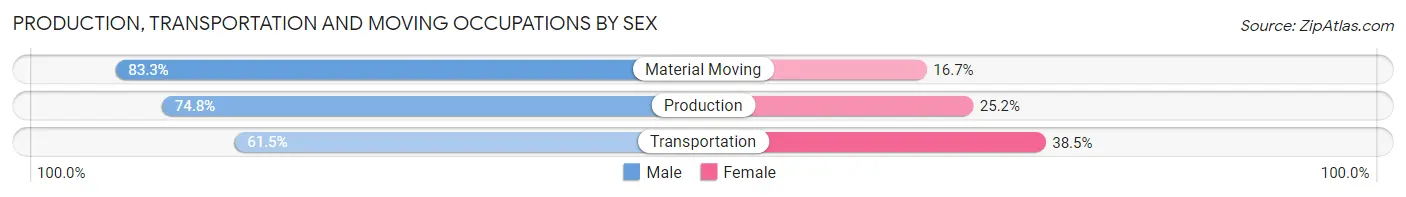
| Occupation | Male | Female |
| Production | 190 (74.8%) | 64 (25.2%) |
| Transportation | 163 (61.5%) | 102 (38.5%) |
| Material Moving | 155 (83.3%) | 31 (16.7%) |
| Total (Category) | 508 (72.1%) | 197 (27.9%) |
| Total (Overall) | 2,010 (53.0%) | 1,782 (47.0%) |
Employment Industries by Sex in Baywood
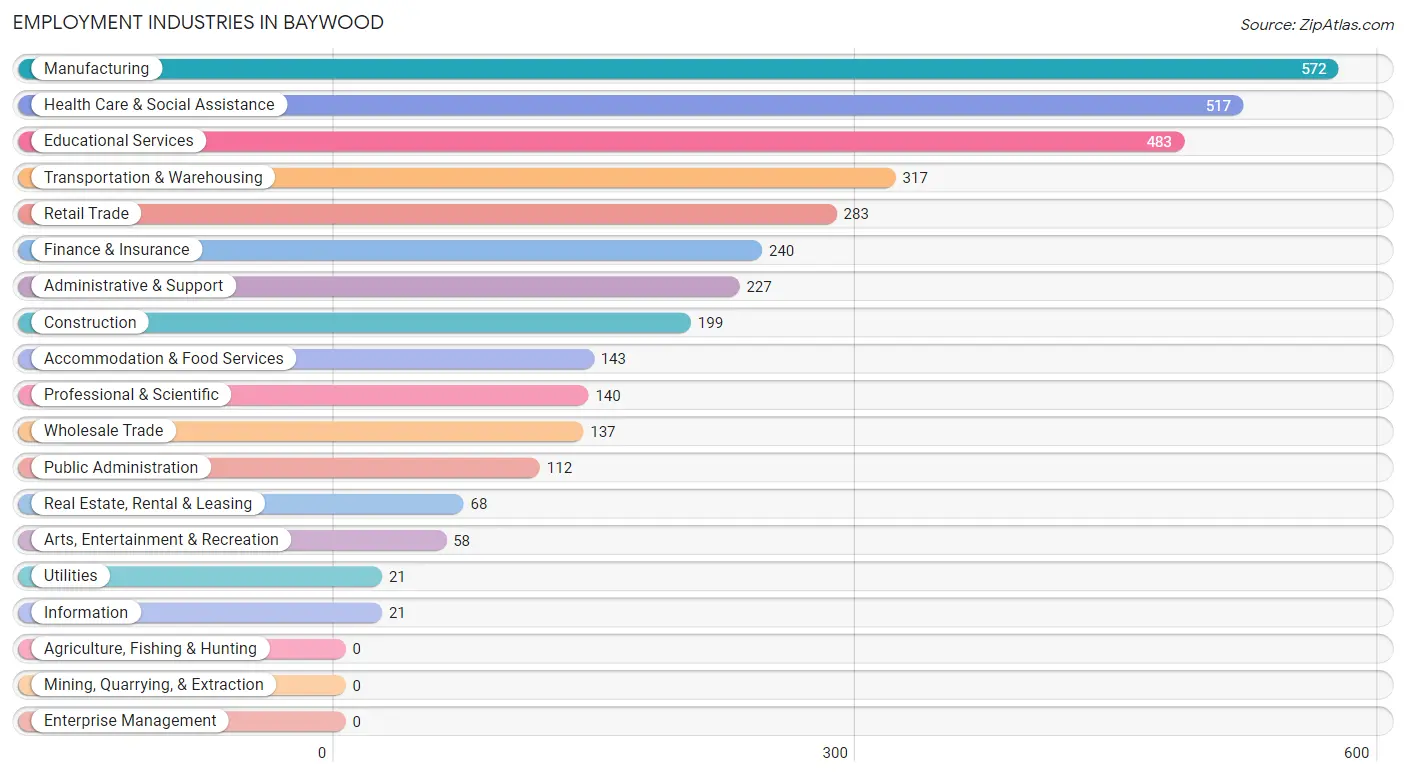
Employment Industries in Baywood
The major employment industries in Baywood include Manufacturing (572 | 15.1%), Health Care & Social Assistance (517 | 13.6%), Educational Services (483 | 12.7%), Transportation & Warehousing (317 | 8.4%), and Retail Trade (283 | 7.5%).
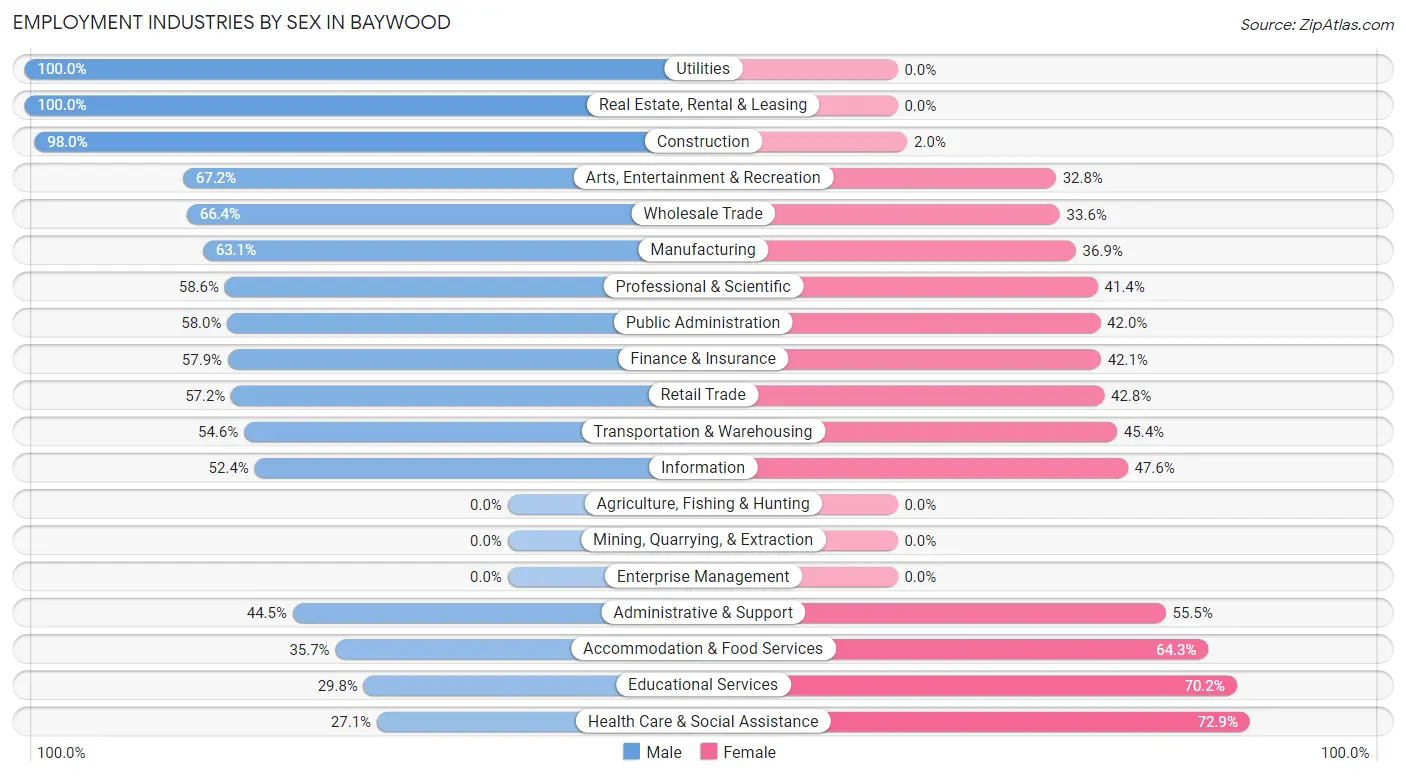
Employment Industries by Sex in Baywood
The Baywood industries that see more men than women are Utilities (100.0%), Real Estate, Rental & Leasing (100.0%), and Construction (98.0%), whereas the industries that tend to have a higher number of women are Health Care & Social Assistance (72.9%), Educational Services (70.2%), and Accommodation & Food Services (64.3%).
| Industry | Male | Female |
| Agriculture, Fishing & Hunting | 0 (0.0%) | 0 (0.0%) |
| Mining, Quarrying, & Extraction | 0 (0.0%) | 0 (0.0%) |
| Construction | 195 (98.0%) | 4 (2.0%) |
| Manufacturing | 361 (63.1%) | 211 (36.9%) |
| Wholesale Trade | 91 (66.4%) | 46 (33.6%) |
| Retail Trade | 162 (57.2%) | 121 (42.8%) |
| Transportation & Warehousing | 173 (54.6%) | 144 (45.4%) |
| Utilities | 21 (100.0%) | 0 (0.0%) |
| Information | 11 (52.4%) | 10 (47.6%) |
| Finance & Insurance | 139 (57.9%) | 101 (42.1%) |
| Real Estate, Rental & Leasing | 68 (100.0%) | 0 (0.0%) |
| Professional & Scientific | 82 (58.6%) | 58 (41.4%) |
| Enterprise Management | 0 (0.0%) | 0 (0.0%) |
| Administrative & Support | 101 (44.5%) | 126 (55.5%) |
| Educational Services | 144 (29.8%) | 339 (70.2%) |
| Health Care & Social Assistance | 140 (27.1%) | 377 (72.9%) |
| Arts, Entertainment & Recreation | 39 (67.2%) | 19 (32.8%) |
| Accommodation & Food Services | 51 (35.7%) | 92 (64.3%) |
| Public Administration | 65 (58.0%) | 47 (42.0%) |
| Total | 2,010 (53.0%) | 1,782 (47.0%) |
Education in Baywood
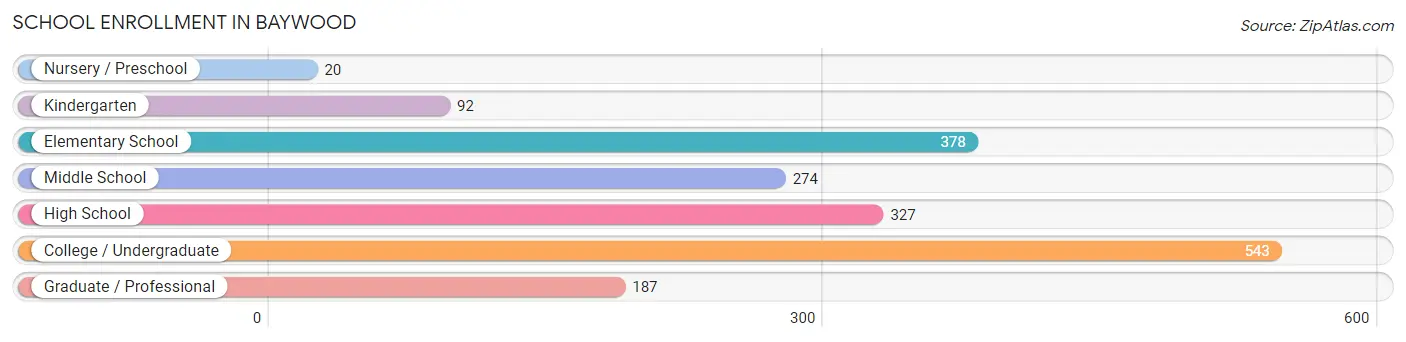
School Enrollment in Baywood
The most common levels of schooling among the 1,821 students in Baywood are college / undergraduate (543 | 29.8%), elementary school (378 | 20.8%), and high school (327 | 18.0%).
| School Level | # Students | % Students |
| Nursery / Preschool | 20 | 1.1% |
| Kindergarten | 92 | 5.1% |
| Elementary School | 378 | 20.8% |
| Middle School | 274 | 15.0% |
| High School | 327 | 18.0% |
| College / Undergraduate | 543 | 29.8% |
| Graduate / Professional | 187 | 10.3% |
| Total | 1,821 | 100.0% |
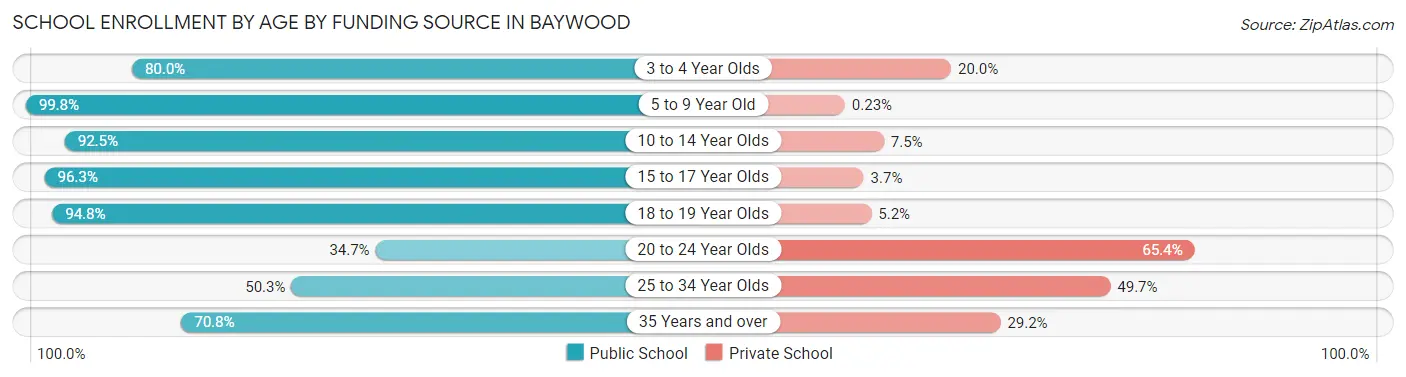
School Enrollment by Age by Funding Source in Baywood
Out of a total of 1,821 students who are enrolled in schools in Baywood, 373 (20.5%) attend a private institution, while the remaining 1,448 (79.5%) are enrolled in public schools. The age group of 20 to 24 year olds has the highest likelihood of being enrolled in private schools, with 215 (65.3% in the age bracket) enrolled. Conversely, the age group of 5 to 9 year old has the lowest likelihood of being enrolled in a private school, with 434 (99.8% in the age bracket) attending a public institution.
| Age Bracket | Public School | Private School |
| 3 to 4 Year Olds | 16 (80.0%) | 4 (20.0%) |
| 5 to 9 Year Old | 434 (99.8%) | 1 (0.2%) |
| 10 to 14 Year Olds | 346 (92.5%) | 28 (7.5%) |
| 15 to 17 Year Olds | 233 (96.3%) | 9 (3.7%) |
| 18 to 19 Year Olds | 147 (94.8%) | 8 (5.2%) |
| 20 to 24 Year Olds | 114 (34.6%) | 215 (65.3%) |
| 25 to 34 Year Olds | 77 (50.3%) | 76 (49.7%) |
| 35 Years and over | 80 (70.8%) | 33 (29.2%) |
| Total | 1,448 (79.5%) | 373 (20.5%) |
Educational Attainment by Field of Study in Baywood
Business (348 | 26.7%), engineering (169 | 13.0%), social sciences (104 | 8.0%), literature & languages (93 | 7.1%), and arts & humanities (84 | 6.5%) are the most common fields of study among 1,302 individuals in Baywood who have obtained a bachelor's degree or higher.
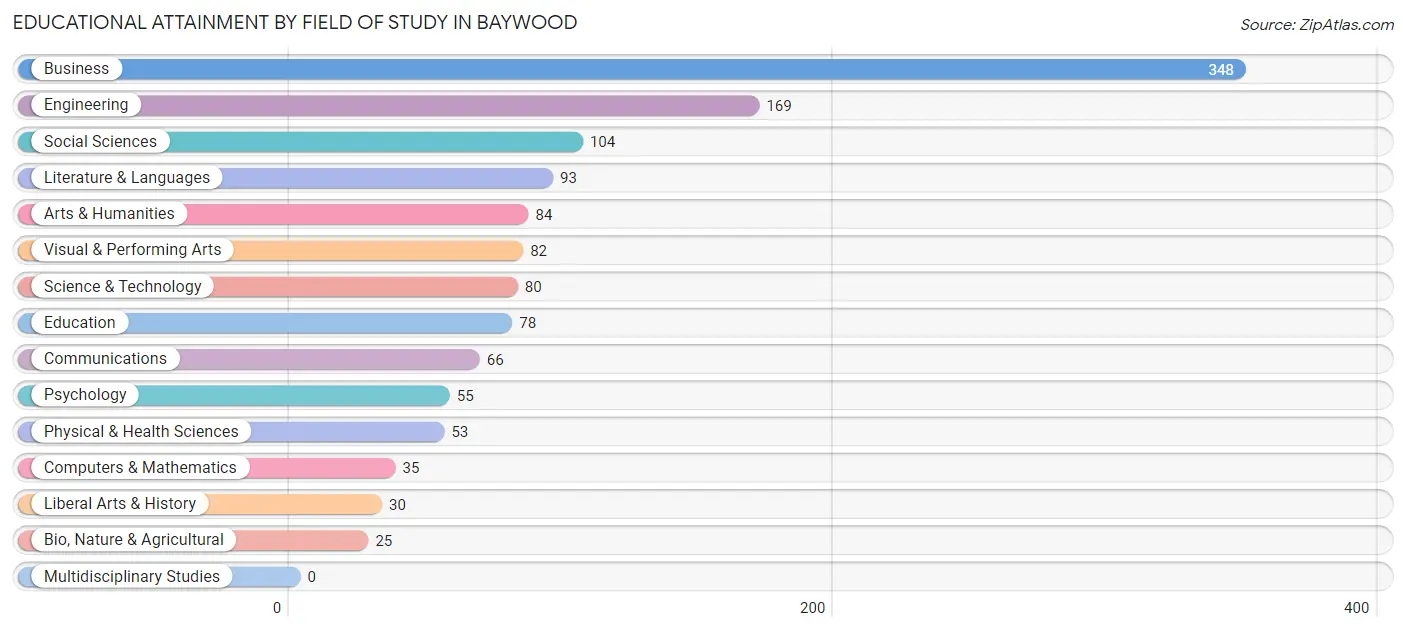
| Field of Study | # Graduates | % Graduates |
| Computers & Mathematics | 35 | 2.7% |
| Bio, Nature & Agricultural | 25 | 1.9% |
| Physical & Health Sciences | 53 | 4.1% |
| Psychology | 55 | 4.2% |
| Social Sciences | 104 | 8.0% |
| Engineering | 169 | 13.0% |
| Multidisciplinary Studies | 0 | 0.0% |
| Science & Technology | 80 | 6.1% |
| Business | 348 | 26.7% |
| Education | 78 | 6.0% |
| Literature & Languages | 93 | 7.1% |
| Liberal Arts & History | 30 | 2.3% |
| Visual & Performing Arts | 82 | 6.3% |
| Communications | 66 | 5.1% |
| Arts & Humanities | 84 | 6.5% |
| Total | 1,302 | 100.0% |
Transportation & Commute in Baywood
Vehicle Availability by Sex in Baywood
The most prevalent vehicle ownership categories in Baywood are males with 2 vehicles (635, accounting for 32.6%) and females with 2 vehicles (401, making up 38.3%).
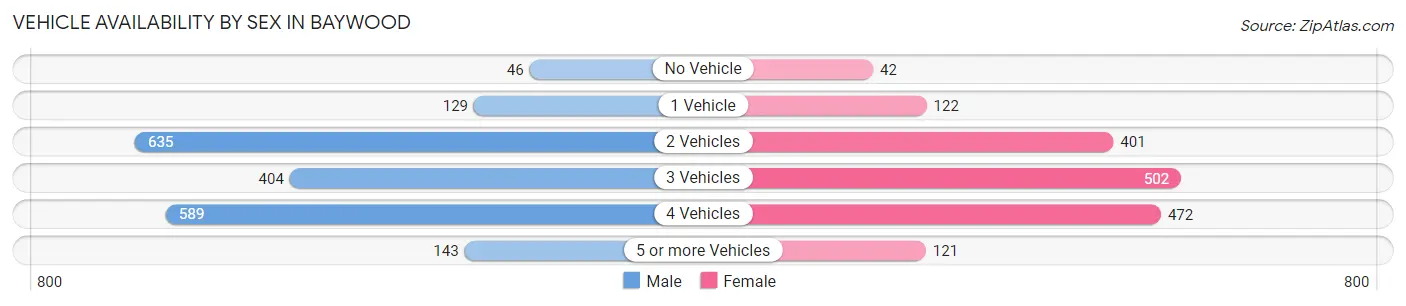
| Vehicles Available | Male | Female |
| No Vehicle | 46 (2.4%) | 42 (2.5%) |
| 1 Vehicle | 129 (6.6%) | 122 (7.3%) |
| 2 Vehicles | 635 (32.6%) | 401 (24.2%) |
| 3 Vehicles | 404 (20.8%) | 502 (30.2%) |
| 4 Vehicles | 589 (30.3%) | 472 (28.4%) |
| 5 or more Vehicles | 143 (7.3%) | 121 (7.3%) |
| Total | 1,946 (100.0%) | 1,660 (100.0%) |
Commute Time in Baywood
The most frequently occuring commute durations in Baywood are 15 to 19 minutes (602 commuters, 17.6%), 30 to 34 minutes (548 commuters, 16.0%), and 20 to 24 minutes (546 commuters, 15.9%).
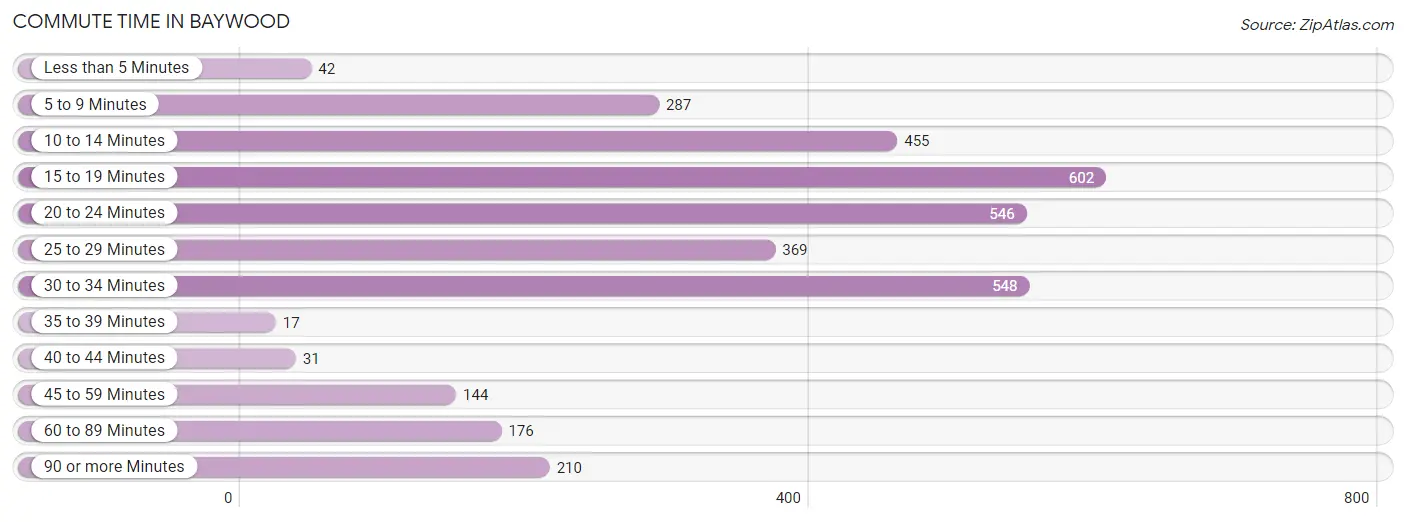
| Commute Time | # Commuters | % Commuters |
| Less than 5 Minutes | 42 | 1.2% |
| 5 to 9 Minutes | 287 | 8.4% |
| 10 to 14 Minutes | 455 | 13.3% |
| 15 to 19 Minutes | 602 | 17.6% |
| 20 to 24 Minutes | 546 | 15.9% |
| 25 to 29 Minutes | 369 | 10.8% |
| 30 to 34 Minutes | 548 | 16.0% |
| 35 to 39 Minutes | 17 | 0.5% |
| 40 to 44 Minutes | 31 | 0.9% |
| 45 to 59 Minutes | 144 | 4.2% |
| 60 to 89 Minutes | 176 | 5.1% |
| 90 or more Minutes | 210 | 6.1% |
Commute Time by Sex in Baywood
The most common commute times in Baywood are 15 to 19 minutes (313 commuters, 16.4%) for males and 30 to 34 minutes (313 commuters, 20.6%) for females.
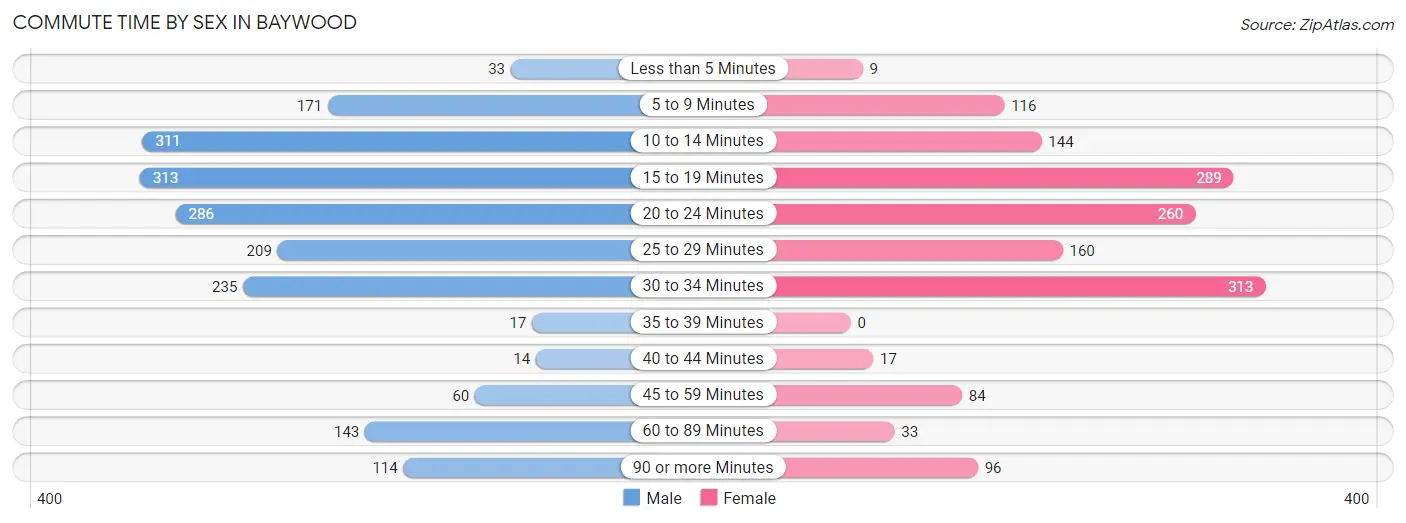
| Commute Time | Male | Female |
| Less than 5 Minutes | 33 (1.7%) | 9 (0.6%) |
| 5 to 9 Minutes | 171 (9.0%) | 116 (7.6%) |
| 10 to 14 Minutes | 311 (16.3%) | 144 (9.5%) |
| 15 to 19 Minutes | 313 (16.4%) | 289 (19.0%) |
| 20 to 24 Minutes | 286 (15.0%) | 260 (17.1%) |
| 25 to 29 Minutes | 209 (11.0%) | 160 (10.5%) |
| 30 to 34 Minutes | 235 (12.3%) | 313 (20.6%) |
| 35 to 39 Minutes | 17 (0.9%) | 0 (0.0%) |
| 40 to 44 Minutes | 14 (0.7%) | 17 (1.1%) |
| 45 to 59 Minutes | 60 (3.2%) | 84 (5.5%) |
| 60 to 89 Minutes | 143 (7.5%) | 33 (2.2%) |
| 90 or more Minutes | 114 (6.0%) | 96 (6.3%) |
Time of Departure to Work by Sex in Baywood
The most frequent times of departure to work in Baywood are 7:00 AM to 7:29 AM (379, 19.9%) for males and 8:00 AM to 8:29 AM (259, 17.0%) for females.
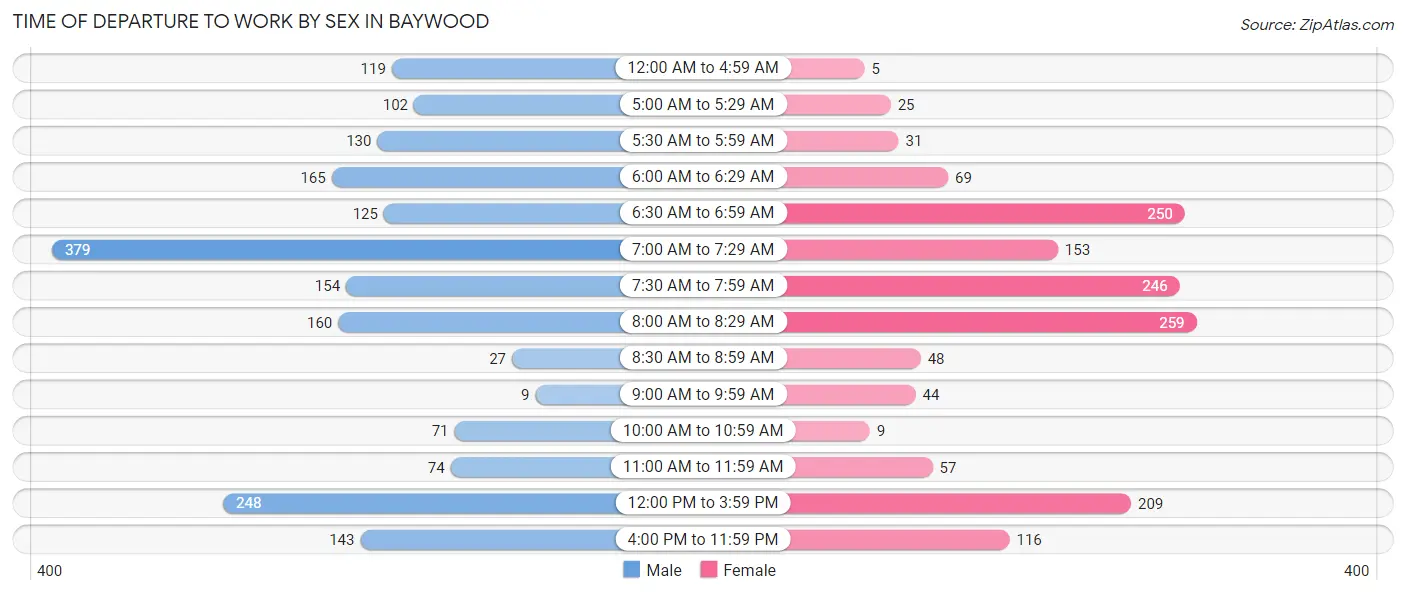
| Time of Departure | Male | Female |
| 12:00 AM to 4:59 AM | 119 (6.2%) | 5 (0.3%) |
| 5:00 AM to 5:29 AM | 102 (5.3%) | 25 (1.6%) |
| 5:30 AM to 5:59 AM | 130 (6.8%) | 31 (2.0%) |
| 6:00 AM to 6:29 AM | 165 (8.7%) | 69 (4.5%) |
| 6:30 AM to 6:59 AM | 125 (6.6%) | 250 (16.4%) |
| 7:00 AM to 7:29 AM | 379 (19.9%) | 153 (10.1%) |
| 7:30 AM to 7:59 AM | 154 (8.1%) | 246 (16.2%) |
| 8:00 AM to 8:29 AM | 160 (8.4%) | 259 (17.0%) |
| 8:30 AM to 8:59 AM | 27 (1.4%) | 48 (3.2%) |
| 9:00 AM to 9:59 AM | 9 (0.5%) | 44 (2.9%) |
| 10:00 AM to 10:59 AM | 71 (3.7%) | 9 (0.6%) |
| 11:00 AM to 11:59 AM | 74 (3.9%) | 57 (3.7%) |
| 12:00 PM to 3:59 PM | 248 (13.0%) | 209 (13.7%) |
| 4:00 PM to 11:59 PM | 143 (7.5%) | 116 (7.6%) |
| Total | 1,906 (100.0%) | 1,521 (100.0%) |
Housing Occupancy in Baywood
Occupancy by Ownership in Baywood
Of the total 1,963 dwellings in Baywood, owner-occupied units account for 1,720 (87.6%), while renter-occupied units make up 243 (12.4%).
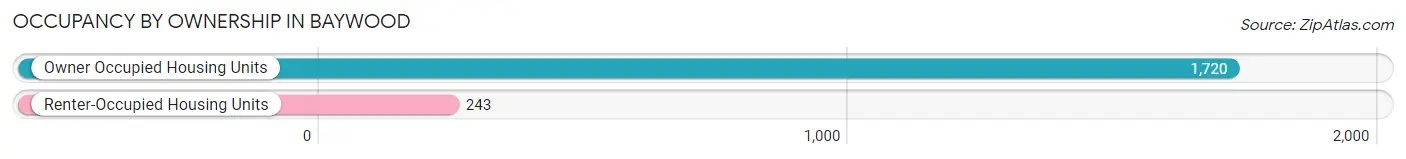
| Occupancy | # Housing Units | % Housing Units |
| Owner Occupied Housing Units | 1,720 | 87.6% |
| Renter-Occupied Housing Units | 243 | 12.4% |
| Total Occupied Housing Units | 1,963 | 100.0% |
Occupancy by Household Size in Baywood
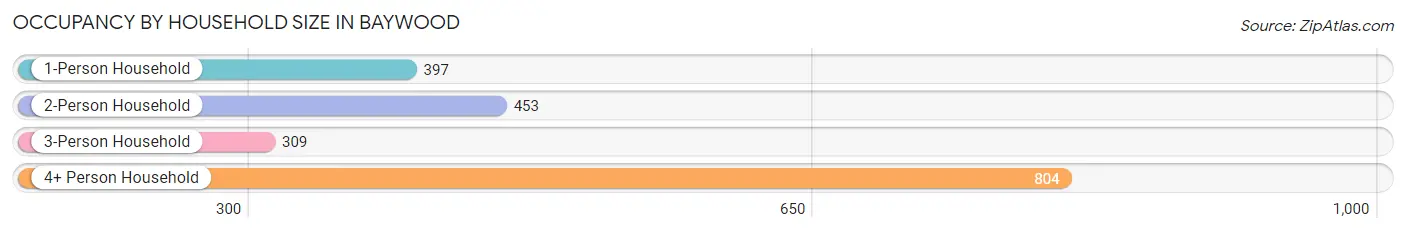
| Household Size | # Housing Units | % Housing Units |
| 1-Person Household | 397 | 20.2% |
| 2-Person Household | 453 | 23.1% |
| 3-Person Household | 309 | 15.7% |
| 4+ Person Household | 804 | 41.0% |
| Total Housing Units | 1,963 | 100.0% |
Occupancy by Ownership by Household Size in Baywood
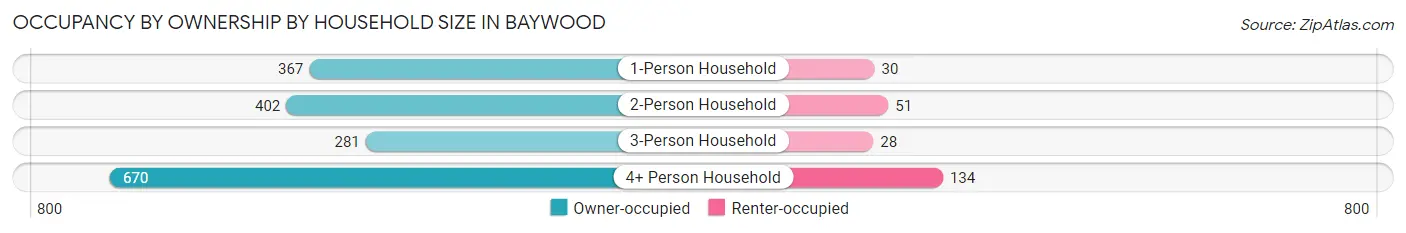
| Household Size | Owner-occupied | Renter-occupied |
| 1-Person Household | 367 (92.4%) | 30 (7.6%) |
| 2-Person Household | 402 (88.7%) | 51 (11.3%) |
| 3-Person Household | 281 (90.9%) | 28 (9.1%) |
| 4+ Person Household | 670 (83.3%) | 134 (16.7%) |
| Total Housing Units | 1,720 (87.6%) | 243 (12.4%) |
Occupancy by Educational Attainment in Baywood
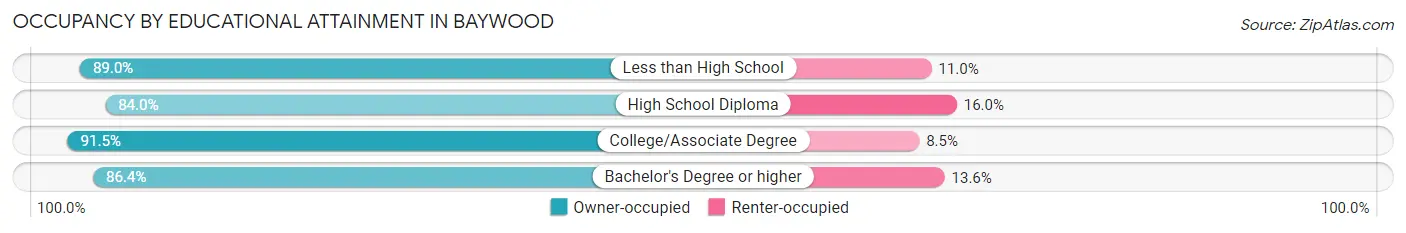
| Household Size | Owner-occupied | Renter-occupied |
| Less than High School | 146 (89.0%) | 18 (11.0%) |
| High School Diploma | 520 (84.0%) | 99 (16.0%) |
| College/Associate Degree | 621 (91.5%) | 58 (8.5%) |
| Bachelor's Degree or higher | 433 (86.4%) | 68 (13.6%) |
Occupancy by Age of Householder in Baywood
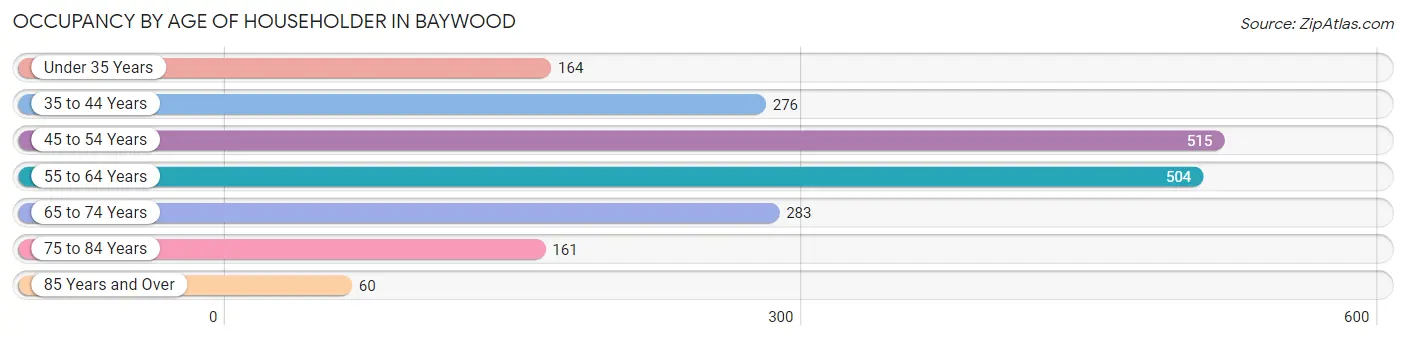
| Age Bracket | # Households | % Households |
| Under 35 Years | 164 | 8.4% |
| 35 to 44 Years | 276 | 14.1% |
| 45 to 54 Years | 515 | 26.2% |
| 55 to 64 Years | 504 | 25.7% |
| 65 to 74 Years | 283 | 14.4% |
| 75 to 84 Years | 161 | 8.2% |
| 85 Years and Over | 60 | 3.1% |
| Total | 1,963 | 100.0% |
Housing Finances in Baywood
Median Income by Occupancy in Baywood
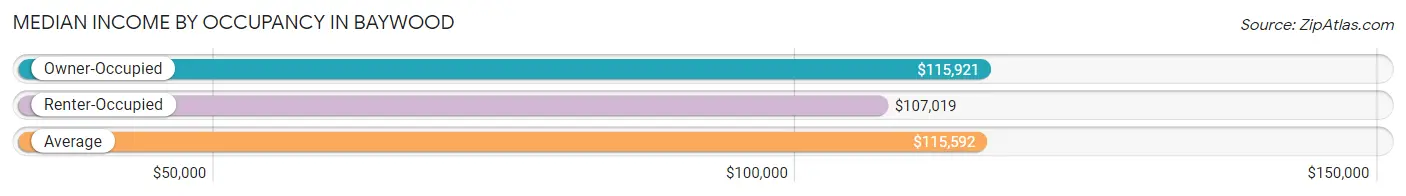
| Occupancy Type | # Households | Median Income |
| Owner-Occupied | 1,720 (87.6%) | $115,921 |
| Renter-Occupied | 243 (12.4%) | $107,019 |
| Average | 1,963 (100.0%) | $115,592 |
Occupancy by Householder Income Bracket in Baywood
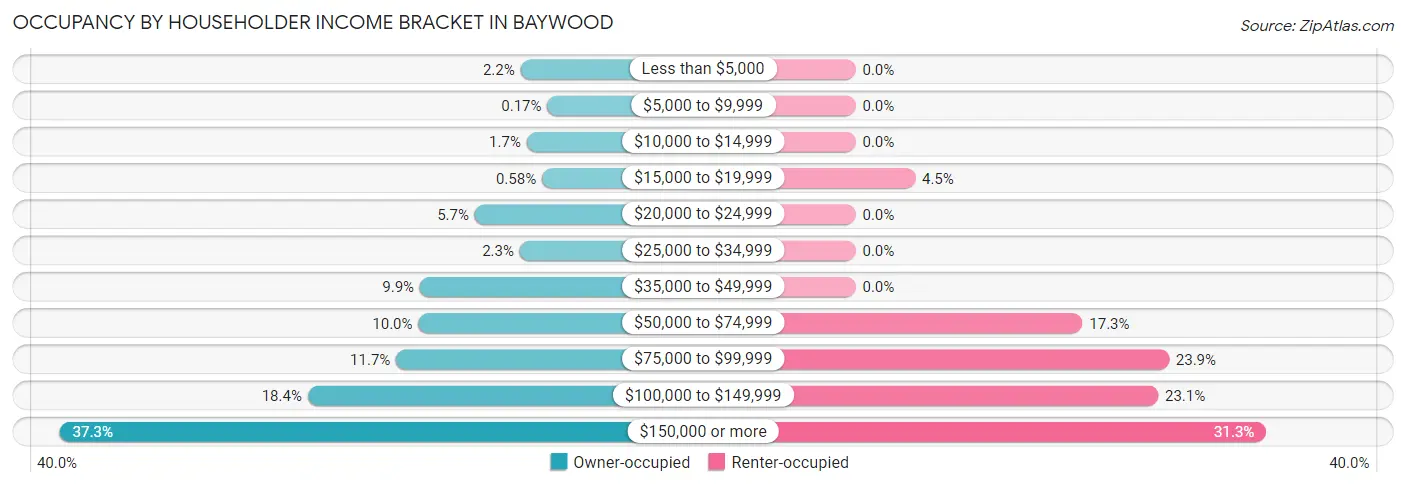
| Income Bracket | Owner-occupied | Renter-occupied |
| Less than $5,000 | 38 (2.2%) | 0 (0.0%) |
| $5,000 to $9,999 | 3 (0.2%) | 0 (0.0%) |
| $10,000 to $14,999 | 30 (1.7%) | 0 (0.0%) |
| $15,000 to $19,999 | 10 (0.6%) | 11 (4.5%) |
| $20,000 to $24,999 | 98 (5.7%) | 0 (0.0%) |
| $25,000 to $34,999 | 39 (2.3%) | 0 (0.0%) |
| $35,000 to $49,999 | 170 (9.9%) | 0 (0.0%) |
| $50,000 to $74,999 | 172 (10.0%) | 42 (17.3%) |
| $75,000 to $99,999 | 201 (11.7%) | 58 (23.9%) |
| $100,000 to $149,999 | 317 (18.4%) | 56 (23.1%) |
| $150,000 or more | 642 (37.3%) | 76 (31.3%) |
| Total | 1,720 (100.0%) | 243 (100.0%) |
Monthly Housing Cost Tiers in Baywood
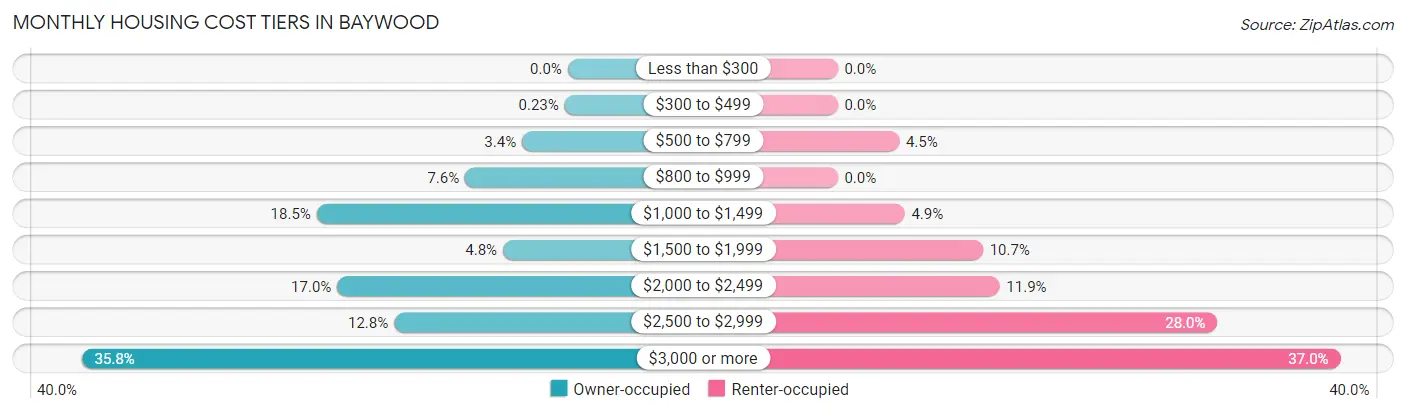
| Monthly Cost | Owner-occupied | Renter-occupied |
| Less than $300 | 0 (0.0%) | 0 (0.0%) |
| $300 to $499 | 4 (0.2%) | 0 (0.0%) |
| $500 to $799 | 58 (3.4%) | 11 (4.5%) |
| $800 to $999 | 130 (7.6%) | 0 (0.0%) |
| $1,000 to $1,499 | 318 (18.5%) | 12 (4.9%) |
| $1,500 to $1,999 | 82 (4.8%) | 26 (10.7%) |
| $2,000 to $2,499 | 292 (17.0%) | 29 (11.9%) |
| $2,500 to $2,999 | 220 (12.8%) | 68 (28.0%) |
| $3,000 or more | 616 (35.8%) | 90 (37.0%) |
| Total | 1,720 (100.0%) | 243 (100.0%) |
Physical Housing Characteristics in Baywood
Housing Structures in Baywood
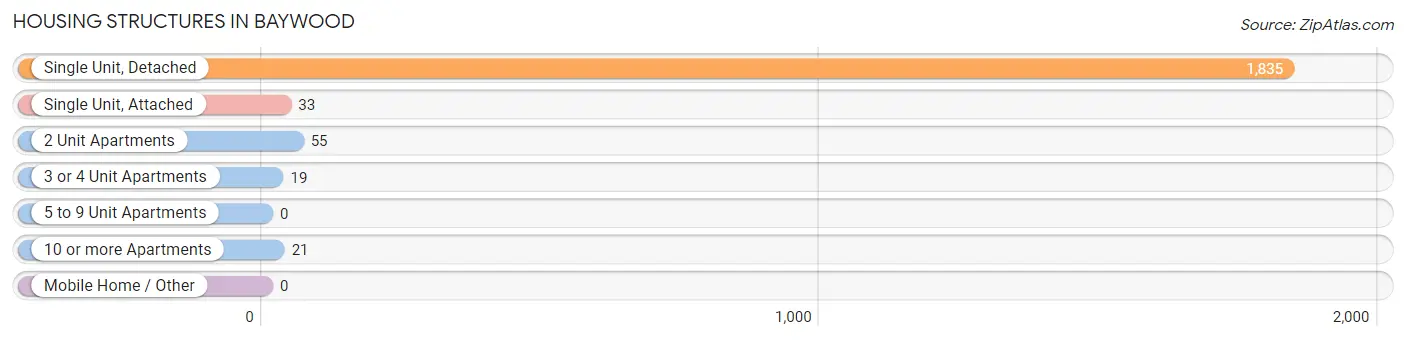
| Structure Type | # Housing Units | % Housing Units |
| Single Unit, Detached | 1,835 | 93.5% |
| Single Unit, Attached | 33 | 1.7% |
| 2 Unit Apartments | 55 | 2.8% |
| 3 or 4 Unit Apartments | 19 | 1.0% |
| 5 to 9 Unit Apartments | 0 | 0.0% |
| 10 or more Apartments | 21 | 1.1% |
| Mobile Home / Other | 0 | 0.0% |
| Total | 1,963 | 100.0% |
Housing Structures by Occupancy in Baywood
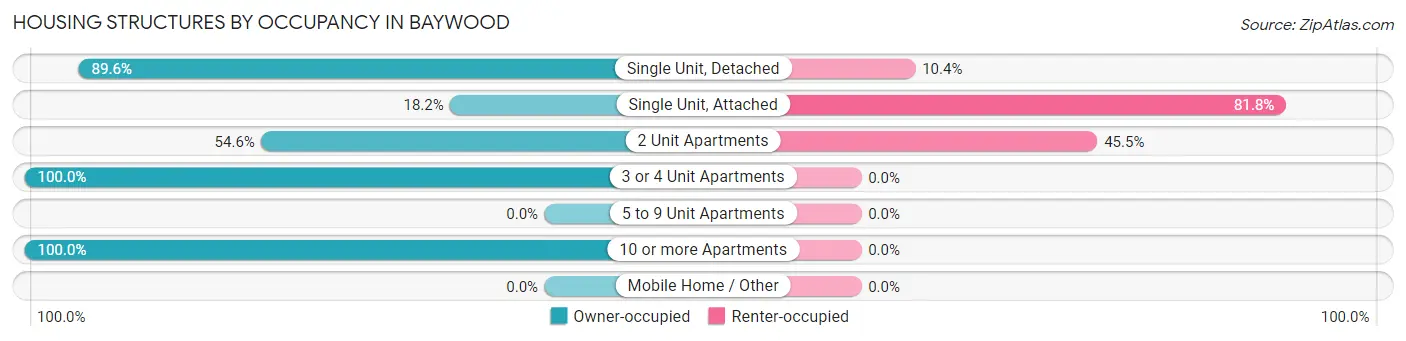
| Structure Type | Owner-occupied | Renter-occupied |
| Single Unit, Detached | 1,644 (89.6%) | 191 (10.4%) |
| Single Unit, Attached | 6 (18.2%) | 27 (81.8%) |
| 2 Unit Apartments | 30 (54.5%) | 25 (45.5%) |
| 3 or 4 Unit Apartments | 19 (100.0%) | 0 (0.0%) |
| 5 to 9 Unit Apartments | 0 (0.0%) | 0 (0.0%) |
| 10 or more Apartments | 21 (100.0%) | 0 (0.0%) |
| Mobile Home / Other | 0 (0.0%) | 0 (0.0%) |
| Total | 1,720 (87.6%) | 243 (12.4%) |
Housing Structures by Number of Rooms in Baywood
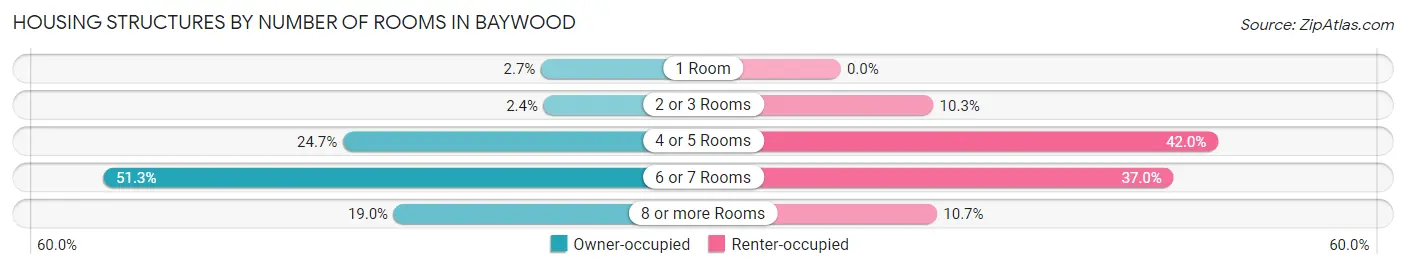
| Number of Rooms | Owner-occupied | Renter-occupied |
| 1 Room | 46 (2.7%) | 0 (0.0%) |
| 2 or 3 Rooms | 41 (2.4%) | 25 (10.3%) |
| 4 or 5 Rooms | 424 (24.6%) | 102 (42.0%) |
| 6 or 7 Rooms | 882 (51.3%) | 90 (37.0%) |
| 8 or more Rooms | 327 (19.0%) | 26 (10.7%) |
| Total | 1,720 (100.0%) | 243 (100.0%) |
Housing Structure by Heating Type in Baywood
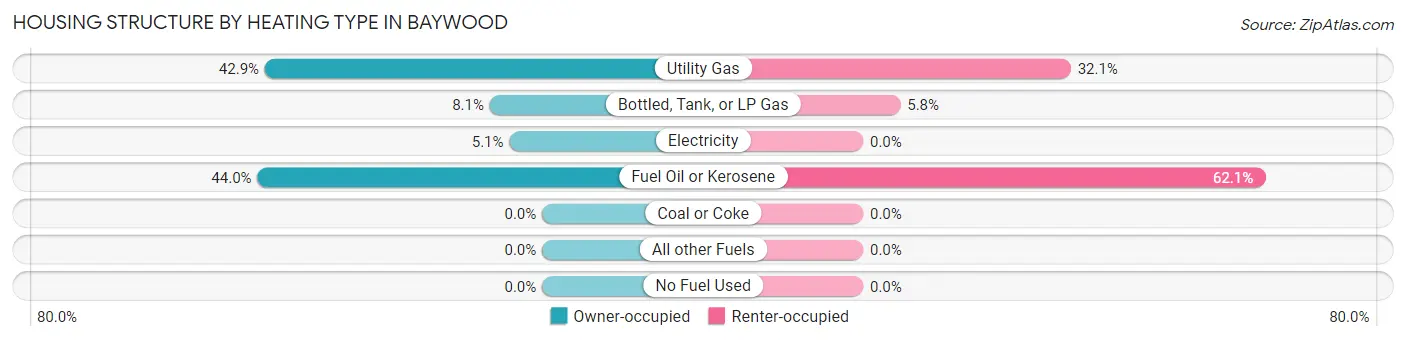
| Heating Type | Owner-occupied | Renter-occupied |
| Utility Gas | 737 (42.8%) | 78 (32.1%) |
| Bottled, Tank, or LP Gas | 139 (8.1%) | 14 (5.8%) |
| Electricity | 87 (5.1%) | 0 (0.0%) |
| Fuel Oil or Kerosene | 757 (44.0%) | 151 (62.1%) |
| Coal or Coke | 0 (0.0%) | 0 (0.0%) |
| All other Fuels | 0 (0.0%) | 0 (0.0%) |
| No Fuel Used | 0 (0.0%) | 0 (0.0%) |
| Total | 1,720 (100.0%) | 243 (100.0%) |
Household Vehicle Usage in Baywood
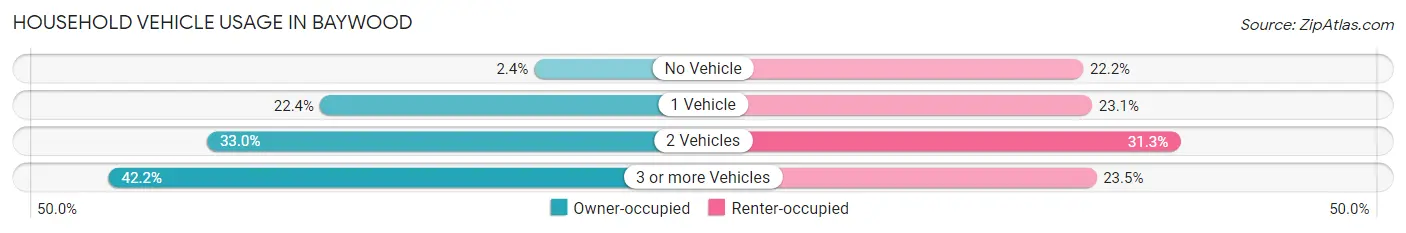
| Vehicles per Household | Owner-occupied | Renter-occupied |
| No Vehicle | 42 (2.4%) | 54 (22.2%) |
| 1 Vehicle | 386 (22.4%) | 56 (23.1%) |
| 2 Vehicles | 567 (33.0%) | 76 (31.3%) |
| 3 or more Vehicles | 725 (42.1%) | 57 (23.5%) |
| Total | 1,720 (100.0%) | 243 (100.0%) |
Real Estate & Mortgages in Baywood
Real Estate and Mortgage Overview in Baywood
| Characteristic | Without Mortgage | With Mortgage |
| Housing Units | 497 | 1,223 |
| Median Property Value | $349,100 | $383,100 |
| Median Household Income | $90,592 | $504 |
| Monthly Housing Costs | $1,062 | $607 |
| Real Estate Taxes | $7,129 | $0 |
Property Value by Mortgage Status in Baywood
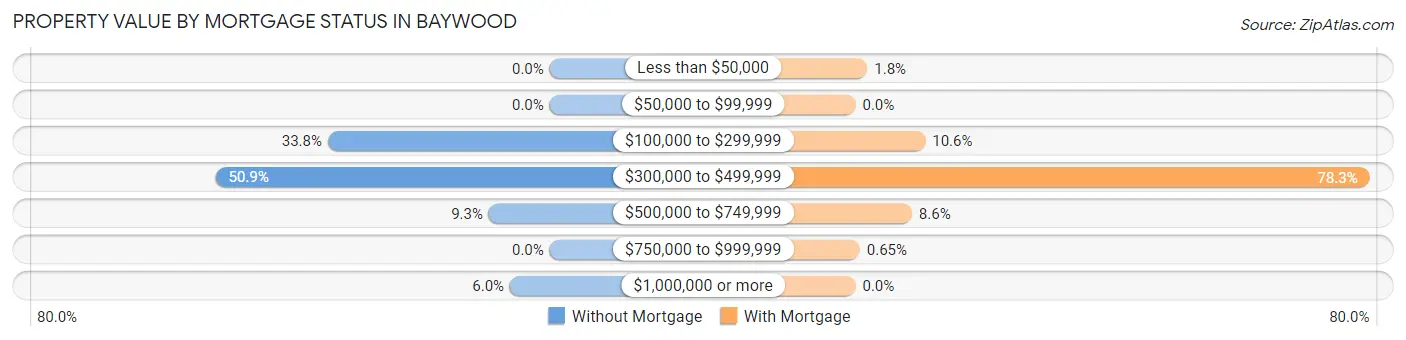
| Property Value | Without Mortgage | With Mortgage |
| Less than $50,000 | 0 (0.0%) | 22 (1.8%) |
| $50,000 to $99,999 | 0 (0.0%) | 0 (0.0%) |
| $100,000 to $299,999 | 168 (33.8%) | 130 (10.6%) |
| $300,000 to $499,999 | 253 (50.9%) | 958 (78.3%) |
| $500,000 to $749,999 | 46 (9.3%) | 105 (8.6%) |
| $750,000 to $999,999 | 0 (0.0%) | 8 (0.6%) |
| $1,000,000 or more | 30 (6.0%) | 0 (0.0%) |
| Total | 497 (100.0%) | 1,223 (100.0%) |
Household Income by Mortgage Status in Baywood
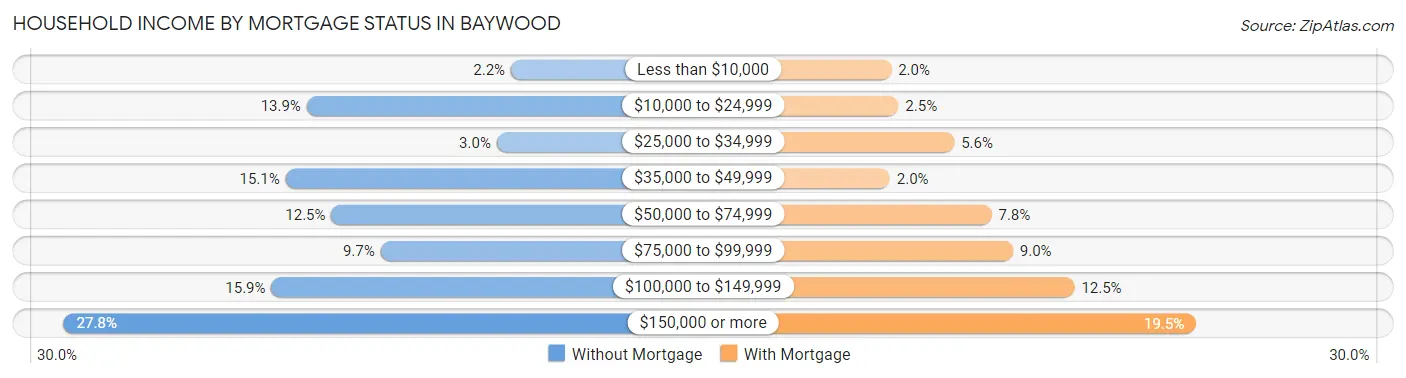
| Household Income | Without Mortgage | With Mortgage |
| Less than $10,000 | 11 (2.2%) | 25 (2.0%) |
| $10,000 to $24,999 | 69 (13.9%) | 30 (2.5%) |
| $25,000 to $34,999 | 15 (3.0%) | 69 (5.6%) |
| $35,000 to $49,999 | 75 (15.1%) | 24 (2.0%) |
| $50,000 to $74,999 | 62 (12.5%) | 95 (7.8%) |
| $75,000 to $99,999 | 48 (9.7%) | 110 (9.0%) |
| $100,000 to $149,999 | 79 (15.9%) | 153 (12.5%) |
| $150,000 or more | 138 (27.8%) | 238 (19.5%) |
| Total | 497 (100.0%) | 1,223 (100.0%) |
Property Value to Household Income Ratio in Baywood
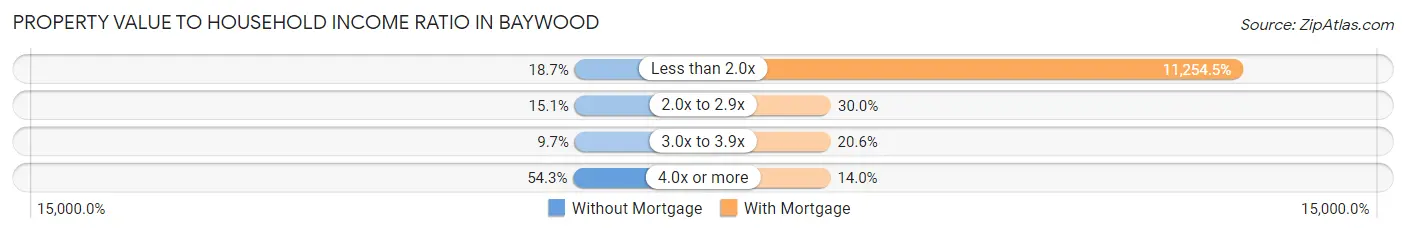
| Value-to-Income Ratio | Without Mortgage | With Mortgage |
| Less than 2.0x | 93 (18.7%) | 137,642 (11,254.5%) |
| 2.0x to 2.9x | 75 (15.1%) | 367 (30.0%) |
| 3.0x to 3.9x | 48 (9.7%) | 252 (20.6%) |
| 4.0x or more | 270 (54.3%) | 171 (14.0%) |
| Total | 497 (100.0%) | 1,223 (100.0%) |
Real Estate Taxes by Mortgage Status in Baywood
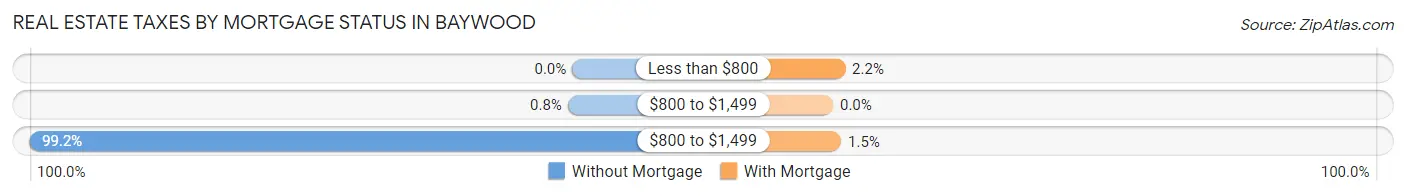
| Property Taxes | Without Mortgage | With Mortgage |
| Less than $800 | 0 (0.0%) | 27 (2.2%) |
| $800 to $1,499 | 4 (0.8%) | 0 (0.0%) |
| $800 to $1,499 | 493 (99.2%) | 18 (1.5%) |
| Total | 497 (100.0%) | 1,223 (100.0%) |
Health & Disability in Baywood
Health Insurance Coverage by Age in Baywood
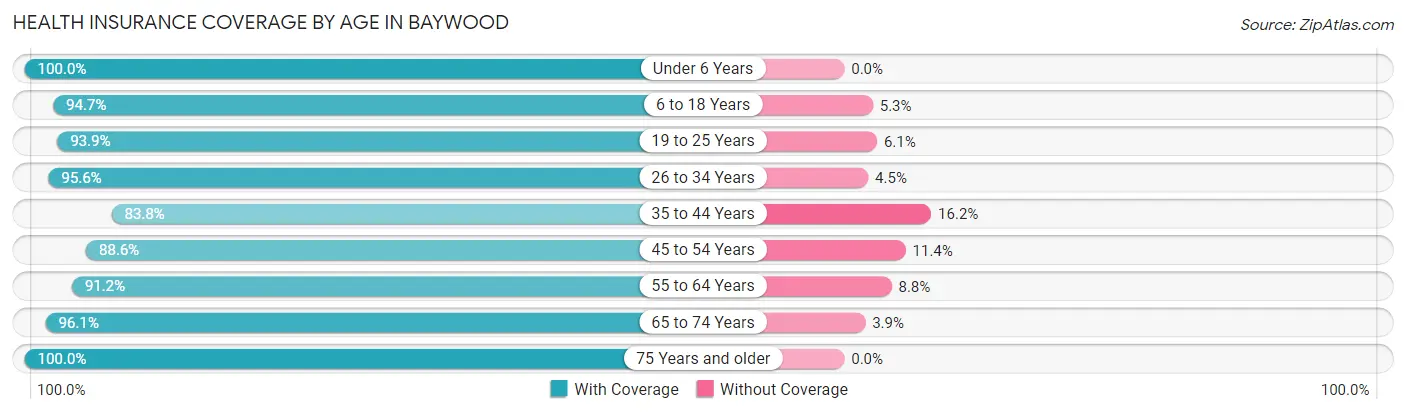
| Age Bracket | With Coverage | Without Coverage |
| Under 6 Years | 471 (100.0%) | 0 (0.0%) |
| 6 to 18 Years | 1,087 (94.7%) | 61 (5.3%) |
| 19 to 25 Years | 663 (93.9%) | 43 (6.1%) |
| 26 to 34 Years | 794 (95.6%) | 37 (4.4%) |
| 35 to 44 Years | 833 (83.8%) | 161 (16.2%) |
| 45 to 54 Years | 999 (88.6%) | 129 (11.4%) |
| 55 to 64 Years | 963 (91.2%) | 93 (8.8%) |
| 65 to 74 Years | 518 (96.1%) | 21 (3.9%) |
| 75 Years and older | 306 (100.0%) | 0 (0.0%) |
| Total | 6,634 (92.4%) | 545 (7.6%) |
Health Insurance Coverage by Citizenship Status in Baywood
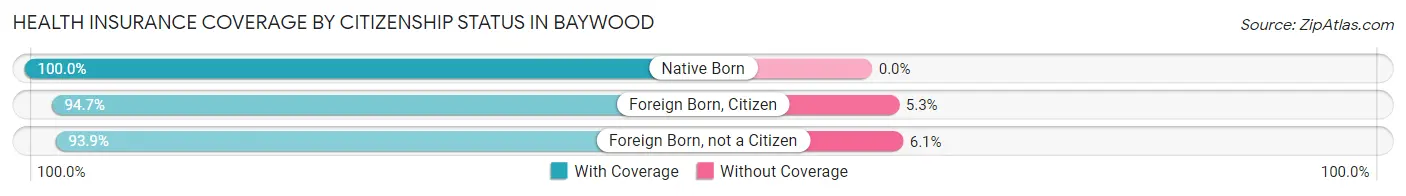
| Citizenship Status | With Coverage | Without Coverage |
| Native Born | 471 (100.0%) | 0 (0.0%) |
| Foreign Born, Citizen | 1,087 (94.7%) | 61 (5.3%) |
| Foreign Born, not a Citizen | 663 (93.9%) | 43 (6.1%) |
Health Insurance Coverage by Household Income in Baywood
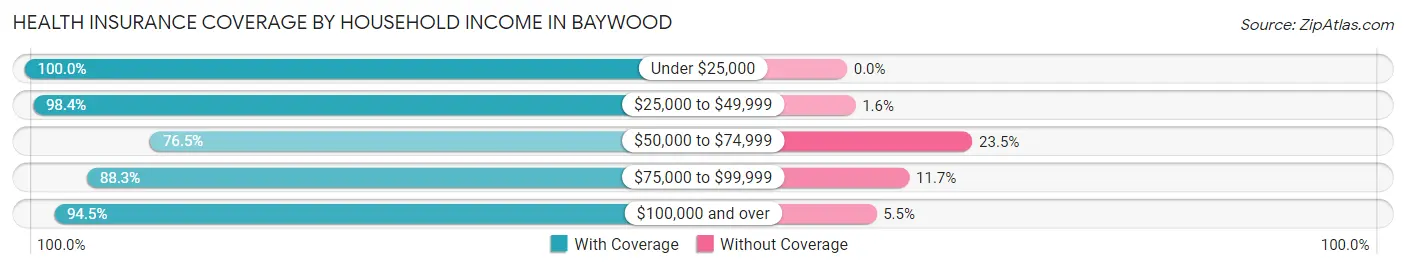
| Household Income | With Coverage | Without Coverage |
| Under $25,000 | 382 (100.0%) | 0 (0.0%) |
| $25,000 to $49,999 | 501 (98.4%) | 8 (1.6%) |
| $50,000 to $74,999 | 635 (76.5%) | 195 (23.5%) |
| $75,000 to $99,999 | 636 (88.3%) | 84 (11.7%) |
| $100,000 and over | 4,426 (94.5%) | 258 (5.5%) |
Public vs Private Health Insurance Coverage by Age in Baywood
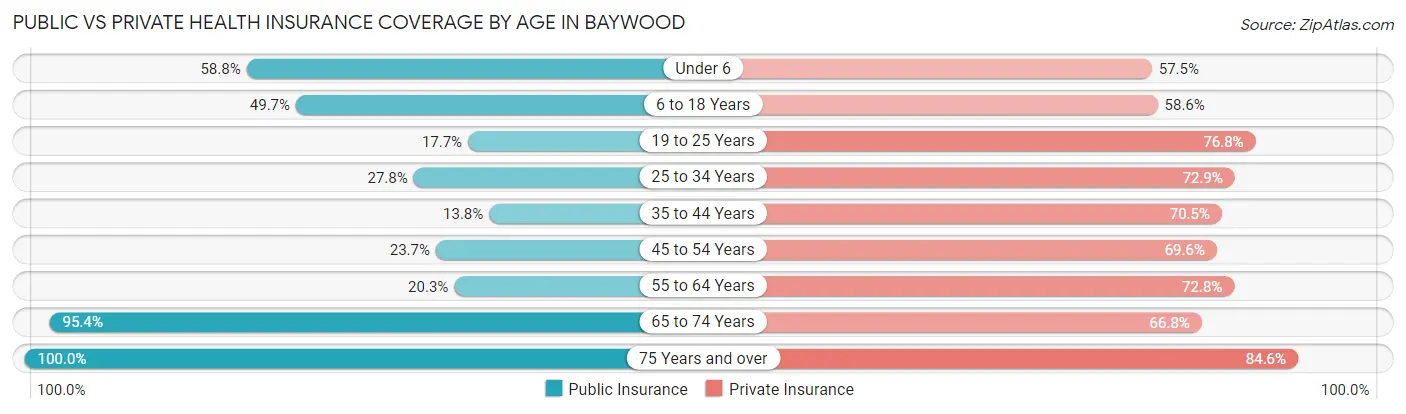
| Age Bracket | Public Insurance | Private Insurance |
| Under 6 | 277 (58.8%) | 271 (57.5%) |
| 6 to 18 Years | 570 (49.6%) | 673 (58.6%) |
| 19 to 25 Years | 125 (17.7%) | 542 (76.8%) |
| 25 to 34 Years | 231 (27.8%) | 606 (72.9%) |
| 35 to 44 Years | 137 (13.8%) | 701 (70.5%) |
| 45 to 54 Years | 267 (23.7%) | 785 (69.6%) |
| 55 to 64 Years | 214 (20.3%) | 769 (72.8%) |
| 65 to 74 Years | 514 (95.4%) | 360 (66.8%) |
| 75 Years and over | 306 (100.0%) | 259 (84.6%) |
| Total | 2,641 (36.8%) | 4,966 (69.2%) |
Disability Status by Sex by Age in Baywood
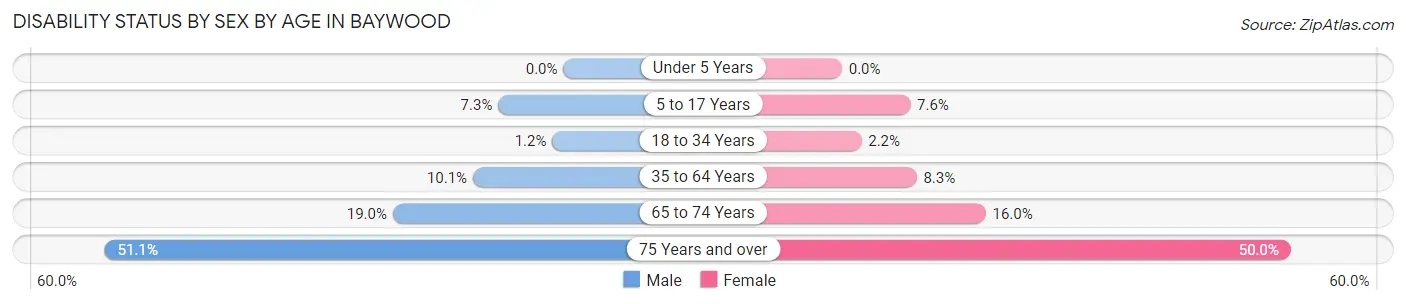
| Age Bracket | Male | Female |
| Under 5 Years | 0 (0.0%) | 0 (0.0%) |
| 5 to 17 Years | 45 (7.2%) | 35 (7.6%) |
| 18 to 34 Years | 11 (1.2%) | 17 (2.2%) |
| 35 to 64 Years | 165 (10.1%) | 128 (8.3%) |
| 65 to 74 Years | 49 (19.0%) | 45 (16.0%) |
| 75 Years and over | 94 (51.1%) | 61 (50.0%) |
Disability Class by Sex by Age in Baywood
Disability Class: Hearing Difficulty
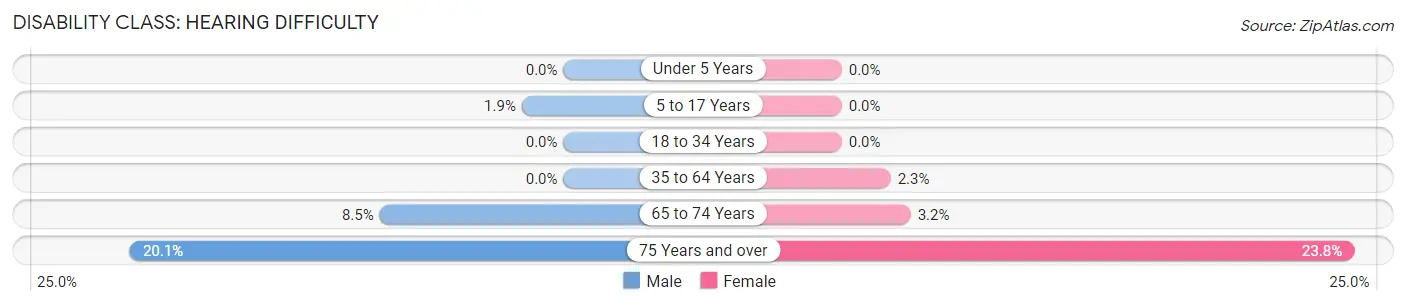
| Age Bracket | Male | Female |
| Under 5 Years | 0 (0.0%) | 0 (0.0%) |
| 5 to 17 Years | 12 (1.9%) | 0 (0.0%) |
| 18 to 34 Years | 0 (0.0%) | 0 (0.0%) |
| 35 to 64 Years | 0 (0.0%) | 35 (2.3%) |
| 65 to 74 Years | 22 (8.5%) | 9 (3.2%) |
| 75 Years and over | 37 (20.1%) | 29 (23.8%) |
Disability Class: Vision Difficulty
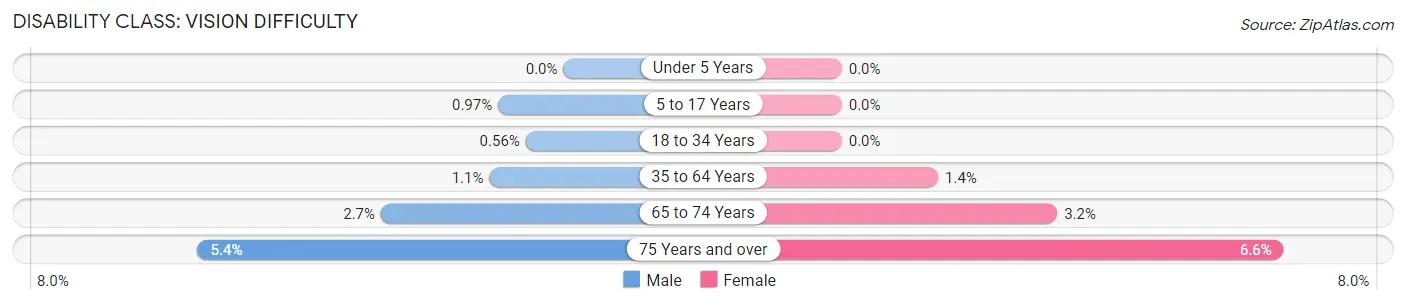
| Age Bracket | Male | Female |
| Under 5 Years | 0 (0.0%) | 0 (0.0%) |
| 5 to 17 Years | 6 (1.0%) | 0 (0.0%) |
| 18 to 34 Years | 5 (0.6%) | 0 (0.0%) |
| 35 to 64 Years | 18 (1.1%) | 22 (1.4%) |
| 65 to 74 Years | 7 (2.7%) | 9 (3.2%) |
| 75 Years and over | 10 (5.4%) | 8 (6.6%) |
Disability Class: Cognitive Difficulty
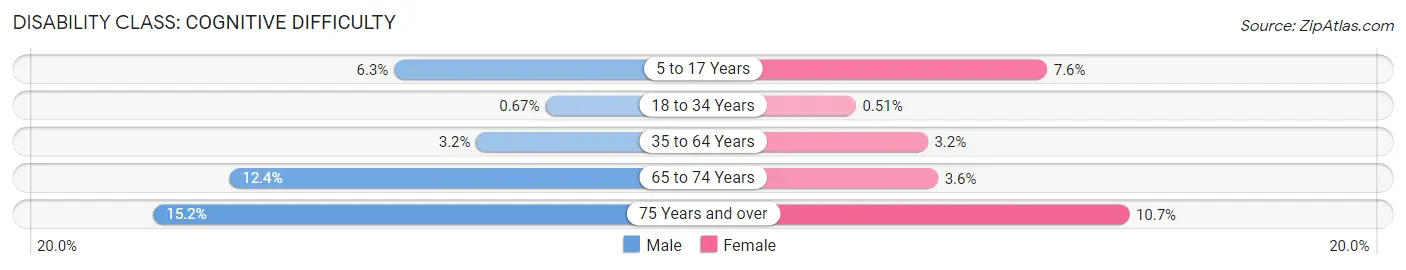
| Age Bracket | Male | Female |
| 5 to 17 Years | 39 (6.3%) | 35 (7.6%) |
| 18 to 34 Years | 6 (0.7%) | 4 (0.5%) |
| 35 to 64 Years | 53 (3.2%) | 49 (3.2%) |
| 65 to 74 Years | 32 (12.4%) | 10 (3.6%) |
| 75 Years and over | 28 (15.2%) | 13 (10.7%) |
Disability Class: Ambulatory Difficulty
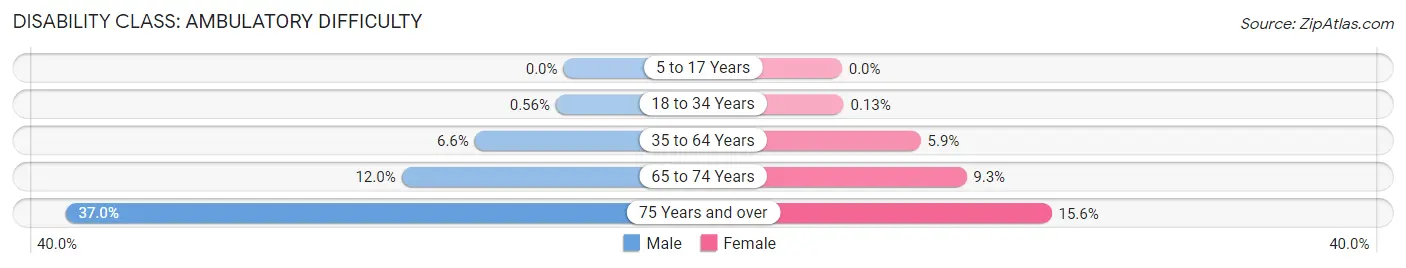
| Age Bracket | Male | Female |
| 5 to 17 Years | 0 (0.0%) | 0 (0.0%) |
| 18 to 34 Years | 5 (0.6%) | 1 (0.1%) |
| 35 to 64 Years | 108 (6.6%) | 90 (5.9%) |
| 65 to 74 Years | 31 (12.0%) | 26 (9.2%) |
| 75 Years and over | 68 (37.0%) | 19 (15.6%) |
Disability Class: Self-Care Difficulty
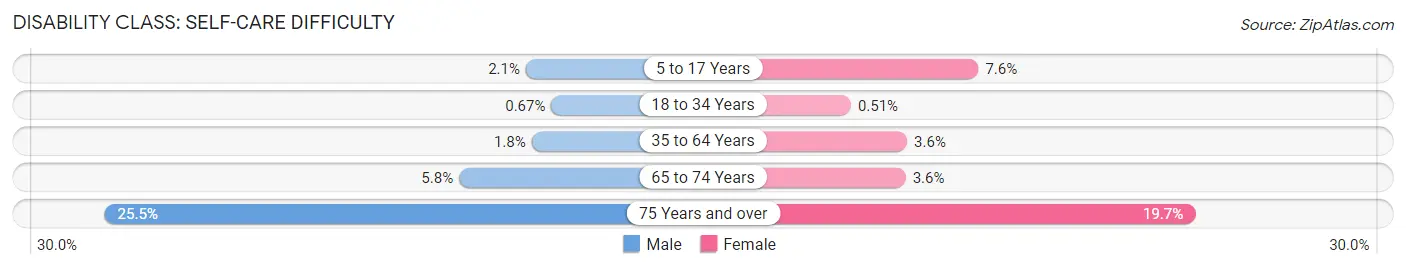
| Age Bracket | Male | Female |
| 5 to 17 Years | 13 (2.1%) | 35 (7.6%) |
| 18 to 34 Years | 6 (0.7%) | 4 (0.5%) |
| 35 to 64 Years | 29 (1.8%) | 56 (3.6%) |
| 65 to 74 Years | 15 (5.8%) | 10 (3.6%) |
| 75 Years and over | 47 (25.5%) | 24 (19.7%) |
Technology Access in Baywood
Computing Device Access in Baywood
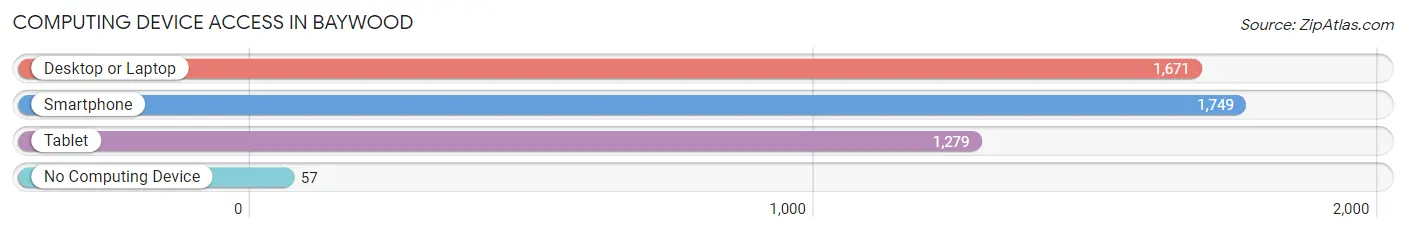
| Device Type | # Households | % Households |
| Desktop or Laptop | 1,671 | 85.1% |
| Smartphone | 1,749 | 89.1% |
| Tablet | 1,279 | 65.2% |
| No Computing Device | 57 | 2.9% |
| Total | 1,963 | 100.0% |
Internet Access in Baywood
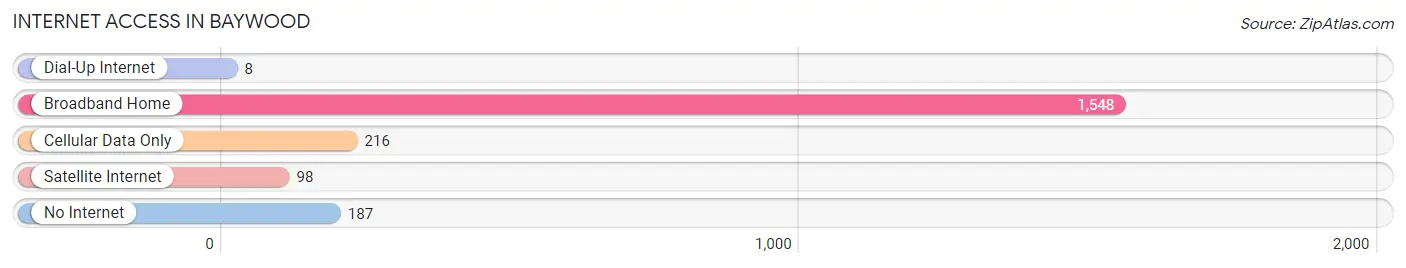
| Internet Type | # Households | % Households |
| Dial-Up Internet | 8 | 0.4% |
| Broadband Home | 1,548 | 78.9% |
| Cellular Data Only | 216 | 11.0% |
| Satellite Internet | 98 | 5.0% |
| No Internet | 187 | 9.5% |
| Total | 1,963 | 100.0% |
Baywood Summary
Baywood is a hamlet located in the Town of Islip in Suffolk County, New York. It is situated on the south shore of Long Island, approximately 50 miles east of New York City. The hamlet is bordered by the Great South Bay to the south, the hamlet of Islip to the west, and the hamlet of Oakdale to the east.
History
The area that is now Baywood was originally inhabited by the Secatogue Native American tribe. The first European settlers arrived in the area in the late 1600s, and the hamlet was officially established in 1790. The hamlet was originally known as “West Islip”, but was later renamed “Baywood” in 1872.
The hamlet was primarily a farming community until the early 1900s, when it began to develop into a summer resort town. The area was popular with wealthy New Yorkers, who built large summer homes along the waterfront. The hamlet also became a popular destination for fishing and boating.
In the 1950s, Baywood began to develop into a residential community. The hamlet experienced a population boom in the 1960s and 1970s, as many people moved to the area from New York City.
Geography
Baywood is located on the south shore of Long Island, approximately 50 miles east of New York City. The hamlet is bordered by the Great South Bay to the south, the hamlet of Islip to the west, and the hamlet of Oakdale to the east.
The hamlet is situated on a peninsula, with the Great South Bay to the south and the Connetquot River to the north. The hamlet is home to several parks and beaches, including Baywood Beach, Baywood Park, and Baywood Point State Park.
Economy
The economy of Baywood is largely based on tourism and retail. The hamlet is home to several restaurants, bars, and shops, as well as a marina and a golf course. The hamlet is also home to several corporate offices, including those of the Long Island Power Authority and the Long Island Rail Road.
Demographics
As of the 2010 census, the population of Baywood was 8,945. The median household income was $90,945, and the median home value was $521,000. The population is largely white (86.3%), with smaller percentages of African American (4.3%), Asian (4.2%), and Hispanic (3.2%) residents.
Conclusion
Baywood is a hamlet located in the Town of Islip in Suffolk County, New York. It is situated on the south shore of Long Island, approximately 50 miles east of New York City. The hamlet was originally inhabited by the Secatogue Native American tribe, and was later established in 1790. The hamlet was primarily a farming community until the early 1900s, when it began to develop into a summer resort town. In the 1950s, Baywood began to develop into a residential community, and experienced a population boom in the 1960s and 1970s. The economy of Baywood is largely based on tourism and retail, and the population is largely white.
Common Questions
What is Per Capita Income in Baywood?
Per Capita income in Baywood is $40,009.
What is the Median Family Income in Baywood?
Median Family Income in Baywood is $118,750.
What is the Median Household income in Baywood?
Median Household Income in Baywood is $115,592.
What is Income or Wage Gap in Baywood?
Income or Wage Gap in Baywood is 19.7%.
Women in Baywood earn 80.3 cents for every dollar earned by a man.
What is Inequality or Gini Index in Baywood?
Inequality or Gini Index in Baywood is 0.39.
What is the Total Population of Baywood?
Total Population of Baywood is 7,185.
What is the Total Male Population of Baywood?
Total Male Population of Baywood is 3,803.
What is the Total Female Population of Baywood?
Total Female Population of Baywood is 3,382.
What is the Ratio of Males per 100 Females in Baywood?
There are 112.45 Males per 100 Females in Baywood.
What is the Ratio of Females per 100 Males in Baywood?
There are 88.93 Females per 100 Males in Baywood.
What is the Median Population Age in Baywood?
Median Population Age in Baywood is 40.0 Years.
What is the Average Family Size in Baywood
Average Family Size in Baywood is 4.0 People.
What is the Average Household Size in Baywood
Average Household Size in Baywood is 3.6 People.
How Large is the Labor Force in Baywood?
There are 4,046 People in the Labor Forcein in Baywood.
What is the Percentage of People in the Labor Force in Baywood?
68.6% of People are in the Labor Force in Baywood.
What is the Unemployment Rate in Baywood?
Unemployment Rate in Baywood is 6.3%.